Embed Size (px)
Citation preview
ISSN 2411-9571 (Print) ISSN 2411-4073 (online)
European Journal of Economics and Business Studies
September-December 2017 Volume 3, Issue 3
168
Evaluating the Financial Performance Through ‘Consumer Centric Decision’ Approach in Pharmaceutical Companies of Bangladesh: a Business Planning Perspective
Md Mostafizur Rahman
PhD student, Department of Sociology, Macquarie University, NSW, Australia
Mahmud Uz Zaman
Assistant Professor, Urban and Rural Planning Discipline, Khulna University, Khulna, Bangladesh
Sabiha Afroz Pritha
Chairman, Social Development and Communication Organization (SDCO), Khulna, Bangladesh
Abstract
Pharmaceuticals agglomerations consistently use their brand image and versatile product portfolios to consolidate their position in the financial sector, which is evident in their continuous profit making and expansion in market share. This paper explores the short-term and long-term investment attractiveness through ‘consumer centric decision’ approach in two selected pharmaceutical companies, Renata Limited and Orion Pharma Limited, of Bangladesh over the last three years’ period. This research adopts a systematic approach which primarily addresses the various concerns of investors to illustrate the decision-making process of the existing and future investors. Using primarily domestic transaction data, this study explores how the leading pharmaceuticals companies of Bangladesh effectively use the wide array of drug portfolios mix with appropriate branding techniques to increase their financial profit and market share simultaneously. Both SWOT analysis and Porters Five Forces Model explore the business analysis of Renata Limited in compare to Orion Pharma Limited that provides a conclusion regarding investors’ decision to invest in Renata Limited. Considering the financial analysis, Renata’s financial liquidity is not very satisfactory and could have been improved further if management is prudent on financial strategy settings. Findings of the business analysis indicate that Renata Limited would be a good investment choice for existing and prospective shareholders based on its opportunities for long term and short term growth and further expansion in developing the market. The results suggest that even lower liquidity coupled with higher interest borrowings can be balanced by posing positive picture to the public shareholders by returning the positive dividend to them.
Keywords: Financial performance, ‘Consumer Centric Decision’ approach, Business Planning
Introduction
The healthcare environment of today’s world needs effective management through integrating both the service providers and service receivers (Herist et al., 2011). In recent time, business research has contributed improvements in users’ decision making ability through comprehensive investigation and examination of various components which has enabled the users to ‘explain and predict’ the reasons behind and the outcomes of an investment decision (Hair et al., 2011). As a matter of fact, that still the basis of financial analysis commonly depends on the analysis of financial information provided by companies and analysis of that information both for stakeholders and companies (McGowan et al., 2015). Notably, financial statements of an organization reveal its financial performance, and carry out analysis and evaluation of business and financial performances that significantly assist the organization’s decision-making process, in particular, the financial investment plan (Koen & Oberholster, 1999); therefore, the regular evaluation of financial performance is necessary for sustaining the business plan. Because wrong investment choice can lead to losses, and in order to avoid those losses, it is absolutely necessary to make a well-informed decision.
ISSN 2411-9571 (Print) ISSN 2411-4073 (online)
European Journal of Economics and Business Studies
September-December 2017 Volume 3, Issue 3
169
Commonly, business is a process that encompasses from analyzing stakeholder to identify potential risk to the business (Sutton & Selznick, 1958). More critically, a business plan does not merely talk about by performing day-to-day operations, but also how closely the different stakeholders intertwined to the business plan process (Reider, 2008; Osterwalder & Pigneur, 2010; Harmon, 2014). Moreover, a business plan is a written blueprint of step-by-step activity with all endogenous and exogenous factors involving starting a new venture. It also integrates different stakeholders such as management, investors, and clients on the different levels (Patrick & Suzanne, 1993; Steiner, 1997; Bradford et al., 2008; Pinson, 2014). Furthermore, business plan corresponds to different stakeholders ranging from management, marketing, and financial viewpoint. It can be an initiating tool for a startup or can be used in an already running business to stimulate and progress further (Pinson, 2014; Quinlan et al., 2015). More importantly, the timeline is one of the key issues, which is commonly 3-5 years in a business plan, because both investors and managers always tend to seek profit maximization with minimum financial risk (Eric et al., 1993; Pinson, 2014).
Several other types of research related to decision making through business planning also strongly support the necessity of having an effective business plan, prior to starting new ventures (Delmar & Shane, 2003; Greene & Hopp, 2017). Sahlman (2010) illustrated four key interdependent factors crucial to every new venture: the people, the opportunity, the context and the risk and reward. However, the process itself widely varies depending on the scale of the business company as well level of detail (hierarchically positioned sub-companies). For instance, small companies do not require to perform portfolio analysis, whereas may require extensive competitor analysis to consolidate market position. Nowadays, managers undisputedly using the business plan as a tool for collecting information and disseminating to its shareholders to make a rational decision, and many companies use the business plan and consistently revise to perform better (Wrona et al., 2014).
Consumer-centric decision approach emphasizes the outcomes of business actions holistically in term of environmental, personal and economic well-being of the consumers (Sheth et al., 2010). The application of consumer-centric approach is relatively new in business. However, there is a growing demand to accepting it to accommodate consumers into decision-making process (Payne & Frow, 2005). Advent of information technology with cheap smart devices, business institutions are pushing themselves to connect their consumers through networks to make prudent marketing decisions (Sheth & Mittal, 2004). It is estimated that, by 2020, there will be 20.8 billion connected devices globally, where 63 percent (12.8 billions) of total devices will be used at consumer level (Gartner, 2017). As more consumers, able to access smart devices with internet, business entities are fully focused on forging their business plan combining technology with consumer at center of their business (Hendricks, 2014).
This paper examines the investor’s viewpoint to facilitating investor’s decision making of shareholding in pharmaceutical industries in Bangladesh. More specifically, the research explores the financial performance of a high rated pharmaceutical company over three years’ period and compare the performance of that company with another pharmaceutical company to analyze the financial performance. This paper also analyzes the attractiveness of that selected pharmaceutical company in both short-term and long-term investments to investors. Based on the findings of the financial performance of that selected company, this research evaluates the competitive environment and possible future success of that high rated company through business analysis in order to offer ‘consumer centric decision’ approach for sustaining business activities in pharmaceutical sectors of Bangladesh.
As investors are concerned with a company’s present performance and prospective stability, which is influenced by its specific surroundings (Worthington & Britton, 2006), therefore, this paper encompasses both the financial analysis and the business analysis of the two selected pharmaceutical companies namely Renata Pharmaceuticals Limited, which is termed here as Renata Limited (RL) and Orion Pharma Limited (OPL) of Bangladesh. In examining the business and financial performance of those two selected pharmaceutical companies of Bangladesh, this paper considers three financial years, in particular from 2012 to 2014 to generate comparative scenarios for investment (see Appendix A for selecting the annual report of 2014 instead of the latest ones). In this study, Renata Limited is considered as the prime interest, and to contrast with that primarily interested company, Orion Pharma Limited is selected that also illustrates the detailed evaluation of financial performance. With this research, the authors seek to explore the links between financial analysis and its interpretation with decision making and future business development plan. The overarching question posed in this research is: What financial and business issues are affecting present and prospective profitability and long-term investment attractiveness of Renata Limited to investors through applying ‘consumer centric decision’ approach?
Profiles of Research Sites: Renata Limited (RL) and Orion Pharma Limited (OPL)
ISSN 2411-9571 (Print) ISSN 2411-4073 (online)
European Journal of Economics and Business Studies
September-December 2017 Volume 3, Issue 3
170
In the early 70s, Pfizer Laboratories (Bangladesh) Limited started its operation in Bangladesh as a manufacturer of pharmaceutical products. The company was listed in Dhaka Stock Exchange in 1979 and was renamed as Renata Limited in 1993 after the transfer of ownership by Pfizer Corporation, USA (RL, 2015). At present, the company is ranked as one of the top ten leading pharmaceutical manufacturers in Bangladesh in terms of both market share and revenue. It employs approximately 5002 employees (RL, 2015). Renata Limited has approximately 300 generic pharmaceutical products and about 95 animal therapeutics and nutrition products (RL, 2015; Pharma Mirror, 2013).
On the other hand, Orion Pharma Limited, which is previously known as Orion Laboratories Limited, is a company of Orion Group, incorporated in 1965 as a Private Limited Company (OPL, 2015). The name of the company has changed as Orion Pharma Limited after the conversion into Public Limited Company in 2010 (OPL, 2016). The company has reached a portfolio consisting of 115 brands and 250 presentations of various formulations (OPL, 2015). It has been awarded the ISO-9001: 2000 certificate in January 2003 for serving its valued customers with the excellent quality products, and the company has established itself as a provider of branded generic pharmaceuticals among the doctor’s community, healthcare professional as well as the patients (OPL, 2016; OPL, 2015).
At present, around 300 pharmaceuticals companies are operating in Bangladesh, and among those 300 pharmaceuticals companies, the top ten pharmaceuticals companies are holding around 68.1% market share. Being the fourth largest market shareholder, Renata is a significant competitor and contributor in the pharmaceutical industry (RL, 2016; EBL Securities Ltd, 2015). The research is grounded in Renata Limited because it holds 5.1% market share of the pharmaceutical industry. On top of that, Renata Limited has one of the highest sales growth rates in the country’s pharmaceuticals industry, and for the past four years, the company has been besting growth rate of the industry by certain significant margin (EBL Securities Ltd, 2015).
Framework of Research
For conducting the financial analysis of a company or for the comparison of a number of companies, the figures must as far as possible be truly comparable (Vause, 2005). Apart from data availability, data accessibility is another the common challenges related to this type of studies. Again, the collection of information and analysis of information both are crucial in financial analysis because “when in doubt do it yourself” approach can produce misleading meaning of the companies. Considering the prevailing complexities both the data collection and data analysis, the authors have collected and used only those materials that are generated from reliable sources with high accuracy. This paper adopts a systematic approach which primarily addresses the various concerns of investors to illustrate the decision-making process of the existing and
ISSN 2411-9571 (Print) ISSN 2411-4073 (online)
European Journal of Economics and Business Studies
September-December 2017 Volume 3, Issue 3
171
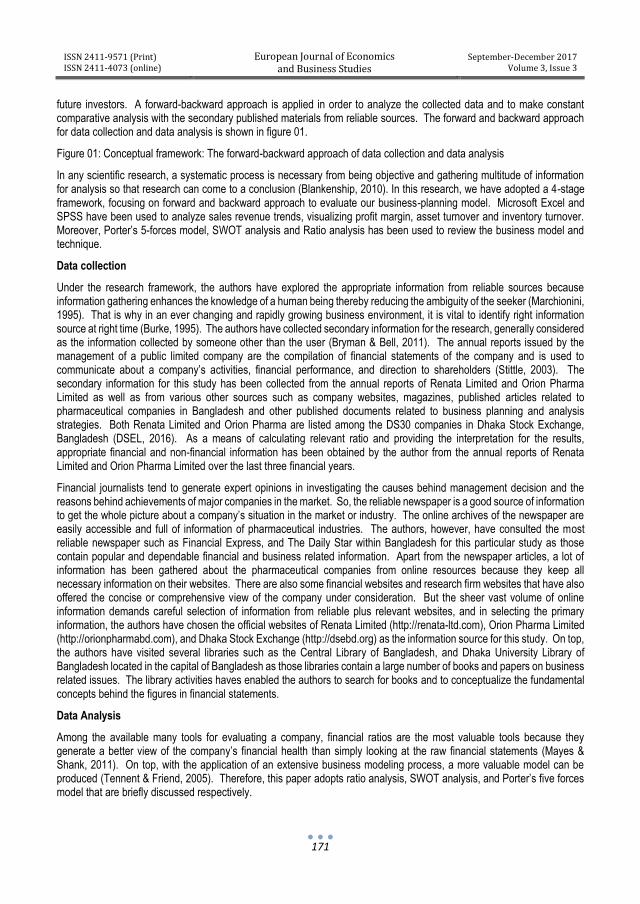
future investors. A forward-backward approach is applied in order to analyze the collected data and to make constant comparative analysis with the secondary published materials from reliable sources. The forward and backward approach for data collection and data analysis is shown in figure 01.
Figure 01: Conceptual framework: The forward-backward approach of data collection and data analysis
In any scientific research, a systematic process is necessary from being objective and gathering multitude of information for analysis so that research can come to a conclusion (Blankenship, 2010). In this research, we have adopted a 4-stage framework, focusing on forward and backward approach to evaluate our business-planning model. Microsoft Excel and SPSS have been used to analyze sales revenue trends, visualizing profit margin, asset turnover and inventory turnover. Moreover, Porter’s 5-forces model, SWOT analysis and Ratio analysis has been used to review the business model and technique.
Data collection
Under the research framework, the authors have explored the appropriate information from reliable sources because information gathering enhances the knowledge of a human being thereby reducing the ambiguity of the seeker (Marchionini, 1995). That is why in an ever changing and rapidly growing business environment, it is vital to identify right information source at right time (Burke, 1995). The authors have collected secondary information for the research, generally considered as the information collected by someone other than the user (Bryman & Bell, 2011). The annual reports issued by the management of a public limited company are the compilation of financial statements of the company and is used to communicate about a company’s activities, financial performance, and direction to shareholders (Stittle, 2003). The secondary information for this study has been collected from the annual reports of Renata Limited and Orion Pharma Limited as well as from various other sources such as company websites, magazines, published articles related to pharmaceutical companies in Bangladesh and other published documents related to business planning and analysis strategies. Both Renata Limited and Orion Pharma are listed among the DS30 companies in Dhaka Stock Exchange, Bangladesh (DSEL, 2016). As a means of calculating relevant ratio and providing the interpretation for the results, appropriate financial and non-financial information has been obtained by the author from the annual reports of Renata Limited and Orion Pharma Limited over the last three financial years.
Financial journalists tend to generate expert opinions in investigating the causes behind management decision and the reasons behind achievements of major companies in the market. So, the reliable newspaper is a good source of information to get the whole picture about a company’s situation in the market or industry. The online archives of the newspaper are easily accessible and full of information of pharmaceutical industries. The authors, however, have consulted the most reliable newspaper such as Financial Express, and The Daily Star within Bangladesh for this particular study as those contain popular and dependable financial and business related information. Apart from the newspaper articles, a lot of information has been gathered about the pharmaceutical companies from online resources because they keep all necessary information on their websites. There are also some financial websites and research firm websites that have also offered the concise or comprehensive view of the company under consideration. But the sheer vast volume of online information demands careful selection of information from reliable plus relevant websites, and in selecting the primary information, the authors have chosen the official websites of Renata Limited (http://renata-ltd.com), Orion Pharma Limited (http://orionpharmabd.com), and Dhaka Stock Exchange (http://dsebd.org) as the information source for this study. On top, the authors have visited several libraries such as the Central Library of Bangladesh, and Dhaka University Library of Bangladesh located in the capital of Bangladesh as those libraries contain a large number of books and papers on business related issues. The library activities haves enabled the authors to search for books and to conceptualize the fundamental concepts behind the figures in financial statements.
Data Analysis
Among the available many tools for evaluating a company, financial ratios are the most valuable tools because they generate a better view of the company’s financial health than simply looking at the raw financial statements (Mayes & Shank, 2011). On top, with the application of an extensive business modeling process, a more valuable model can be produced (Tennent & Friend, 2005). Therefore, this paper adopts ratio analysis, SWOT analysis, and Porter’s five forces model that are briefly discussed respectively.
ISSN 2411-9571 (Print) ISSN 2411-4073 (online)
European Journal of Economics and Business Studies
September-December 2017 Volume 3, Issue 3
172
According to Paramasivan and Subramaniam (2009), ratio analysis is the key assessor of a firm’s financial performance. Financial ratios uncover vital information about a firm that might not have been visible through examination of a firm’s financial statements. Ratio analysis helps to determine company’s financial position in the industry through ‘standardized comparison’ (Ehrhardt & Brigham, 2011). Accounting ratios illustrate ‘mathematical relationship’ amongst two financial figures that have ‘meaningful relationship’ with one another. The authors have calculated the following ratios to accurately analyze and correctly interpret financial results to meet various concerns of investors: i) Profitability Ratios; ii) Liquidity Ratios; iii) Market Ratios; iv) Efficiency Ratios. This paper accepts that the ratio analysis can be tricky since some ratios tend to appear satisfactory but in reality, careful assessment of particular factors will show a completely new picture. Also, multidivisional companies operate in various industries that make it difficult to set a standard of comparison and as ratio analysis requires standardized comparison it is more suitable for the comparatively small firm (Weston & Brigham, 1979).
SWOT analysis involves the analysis of a company’s strength, weakness, opportunities, and threat. This tool also analyzes of its internal and external parameters at the same time. The model includes the analysis of positive and negative factors present within and outside the company (Böhm, 2008). With the SWOT analysis, this paper highlights the perspective of investors that tend to forecast company’s future performance and the perspective of management that is an essential part of strategic business planning. As the SWOT analysis is used in any industry as a future trend detector, the authors used the SWOT analysis for both financial evaluation and business planning. This paper accepts that translating strength and weaknesses into opportunity and threat are not as straightforward as it looks in the model. Also, the model is ambiguous in terms that a factor can be doubly classified as strength and weakness or as opportunity and threat at the same time (Henry, 2011).
Porter’s five forces model helps firm’s managers with analysis of ‘competitive forces’ within the industry settings to pinpoint opportunities as well as threats (Hill & Jones, 2013). ‘One key determinant of profitability is the extent of competition, actual or potential’ (Johnson et al., 2014, p.41). Commonly, in case a company faces the great number of competitors, its profit is likely to rapidly erode. So, for long-term survival of the company with such problems caused by external factors need to be identified properly. As per Porter (1979), there are five forces that affect a company from the outside namely threat of new entrant, bargaining power of consumers, bargaining power of suppliers, the threat of substitute product or service, and the industry rivalry for position among current competitors. This paper considers all these five aspects while analyzing the business planning of the pharmaceutical companies of Bangladesh. This paper accepts that the model of competitive forces only discusses the forces that are negative in nature, but the model fails to identify the existence of such organizations which assist in the success of various incumbent organizations like supplementary organization (Johnson et al., 2014). Also, in this model, an industry is counted as a whole, but an industry can be easily broken down into various layers, and each of these layers can be separately viewed in order to identify the presence of these forces in that individual segment. While analyzing the business performance, in particular, the competitive environment analysis in business planning, the authors considered the above-mentioned limitations to generate reliable and meaningful interpretation in results.
Research Limitations and Ethical Issues
Due to today’s highly competitive business environment, management authorities of the company do not circulate all kind of information among shareholders, and therefore, information asymmetry occurs between management and shareholders (Boyes, 2012). Therefore, the authors have faced some limitations in accessing and analyzing the information based on secondary published materials, mostly the free ones. Both companies have extended the accounting period for 2015 to cover the first 6 months of 2016, and they have not published their annual reports of 2015 until 1 October 2016. Therefore, the latest annual reports are not available for the author to use. That’s why this research is grounded on the latest published annual reports such as December 2014. This means the used data is more historic than the authors would have liked. On top, this study uses secondary sources of information that are appropriate for that particular time period and industry context, but continuous change in business settings may have caused the information to become outdated. Also, publishing the financial reports are mostly a yearly event by management; the report provides information of previous 12 months, but shareholders are far more interested in knowing up to date information, and this is one of the limitations of the conclusions the authors tend to bring in this research.
The key ethical issue is objectively analyzing and evaluating the information, and by doing so the authors intend to reach a clear conclusion. Also, the authors need to illustrate the results obtained from the study of the published materials. Therefore, the authors have included certain relevant business models and financial ratios for making a constant
ISSN 2411-9571 (Print) ISSN 2411-4073 (online)
European Journal of Economics and Business Studies
September-December 2017 Volume 3, Issue 3
173
comparison with the published materials. The authors have collected information from online sources and have accessed several companies’ websites that primarily explains the interests of the companies.
Results and Discussions of Findings of Research
The authors have illustrated the outcomes of the financial and business analysis that offer an opportunity of computing figures and interpreting, comparing and analyzing the underlying causes of either good or bad performance of Renata Limited (RL) and compare the performance with competitor namely Orion Pharma Limited (OPL) (see Appendix B: Appendix of Financial Statements for analysis and calculation in MS Excel).
Financial Analysis
Sales Revenue
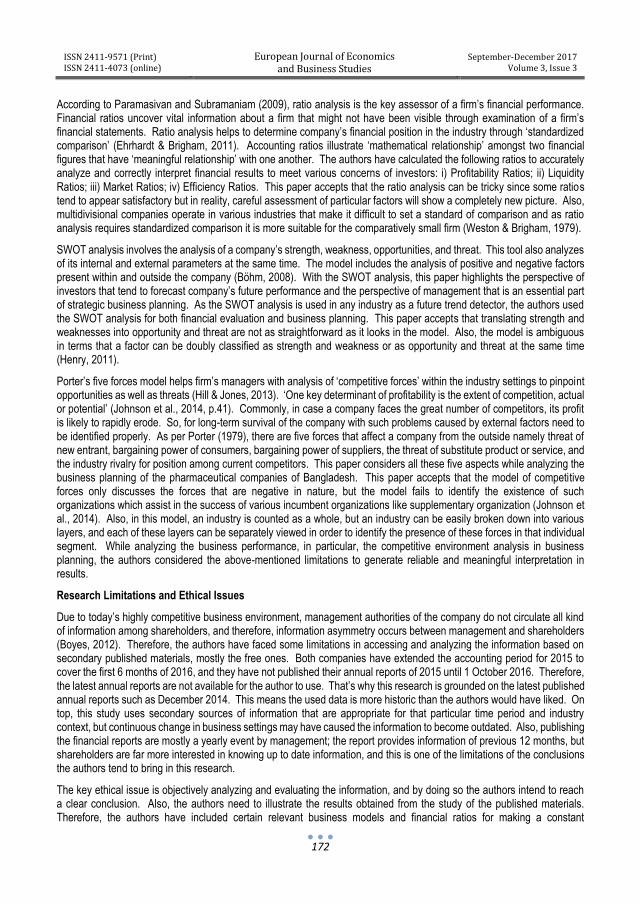
Sales revenue represents the income generated over a specified time period from selling goods and rendering services (BPP Learning Media, 2009). Renata’s performance over the 3-year period has been underpinned by very strong growth reflected through 44.69% increase in sales revenue since 2012. The key reason for this excellent performance, culminating in a year on year increase of 26.75% in just one year between 20013 and 2014, was largely due to concerted efforts on brand building to position itself in the right segment of the market (RL, 2015; RL, 2014; RL, 2013; Appendix of Financial Statements). In 2014, there were severe political unstable situation in Bangladesh due to uncertainties regarding the parliamentary election in January 2014. It started in late 2013 and continued in the first quarter of 2014, though Renata Limited experienced developments in that situation. For example, Renata Limited has initiated new product development in pharmaceuticals as well as in animal health, expansion of foreign market and local sales, better performance of subsidiaries (RL, 2015).
Figure 02: Trends of Sales Revenue
Source: RL, 2015; RL 2014; RL 2013; OPL, 2015; OPL, 2014; OPL, 2013; Appendix of Financial Statements
The revenue of Orion Pharma Limited has increased slightly in 2014. The revenue was 1.71 billion in 2012 decreased by 4.00% and stood at 1.64 billion in 2013. Revenue growth started rising in 2014 as well and stood for 1.65 billion, an increase of 0.72% over 2013 (OPL, 2015; OPL, 2014; OPL, 2013; Appendix of Financial Statements). Primary reason for lower sales growth was the political unrest in Bangladesh that seriously hampered the supply chain system (OPL, 2015). However, after having an adverse revenue growth rate in 2013, Orion Pharma was quite successful in 2014 in initiating their new market strategy. This year Orion Pharma achieved significant growth in export sales and has launched 11 different therapeutic medicines as part of their key objective to diversify portfolio. It is highly expected that more revenue will be generated and the revenue growth will be keep rising in the future as a result of these initiates (OPL, 2015). Having achieved more than double the industry average, the year 2014 was an astonishing year for Renata as their growth was 26.1% against Orion Pharma’s sales growth of 0.72% and industry average of 11.37% (EBL Securities Ltd, 2015). Renata has positioned itself as a key player both in terms of revenue with a market share of 5.1% (EBL Securities Ltd, 2015).
7.678.76
11.10
1.71 1.64 1.65
0.00
2.00
4.00
6.00
8.00
10.00
12.00
2012 2013 2014
BD
T i
n B
illio
n
Sales Revenue (BDT in Billion)
Renata Ltd. Orion Pharma Ltd.
ISSN 2411-9571 (Print) ISSN 2411-4073 (online)
European Journal of Economics and Business Studies
September-December 2017 Volume 3, Issue 3
174
Operating Profit Margin
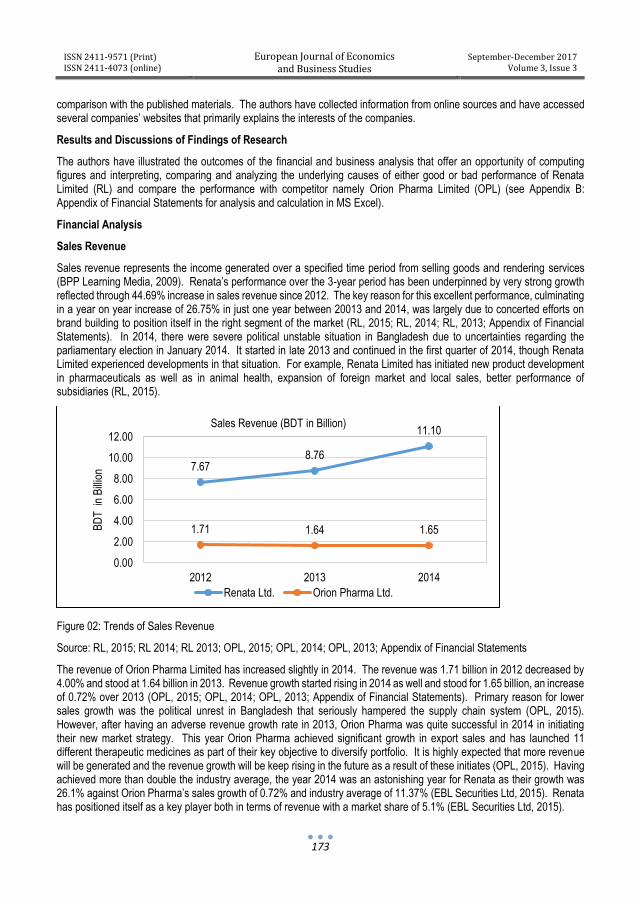
In 2014, the cost of goods sold has increased by 25.53% from 2013, which is lower than the sales revenue growth 26.75%. As a result, the gross profit margin has been improved to 51.21% in 2014 from 50.71% in 2013 (RL, 2015; RL, 2014; RL, 2013; Appendix of Financial Statements). The operating profit margin has not been increased in line with the gross profit margin because the brand-deepening efforts and marketing strategies of Renata Limited followed by the increment of 37.56% since 2013 in administrative, selling and distribution expenses, which is much higher than the revenue growth (RL, 2015; RL, 2014; RL, 2013; Appendix of Financial Statements). To improve the operational efficiency, the company has made several capital investments to upgrade existing production facilities and relocate some existing unit to new sites (RL, 2015).
Figure 03: Operating Profit Margin
Source: RL, 2015; RL 2014; RL 2013; OPL, 2015; OPL, 2014; OPL, 2013; Appendix of Financial Statements
The operating profit margin of Orion has also been declined since 2012. In 2012, operating profit margin was 22.05% and then stood at 20.32% in 2014. From the workings on ratios, Gross profit margin has been declined since 2012 and stood at 55.97% in 2014 compared to 57.95% in 2012 (OPL, 2015; OPL, 2014; OPL, 2013; Appendix of Financial Statements). As the gross profit margin was declining, that also was affecting operating profit margin (Appendix of Financial Statements). However, this year Orion Pharma has expanded the overall production capacity and actual production from 2013 to maintain sustainable growth and increase profitability (OPL, 2015).
Operating profit margin of both Renata Ltd. and Orion Pharma Ltd. have declined from 2012 to 2014. The causes of the declining trend of operating profit margin are also linked with the increased political instability, increased inflation, and higher cost for raw material (RL, 2015; OPL, 2015). However, Renata Limited has much better operating profit margin than Orion Pharma Limited.
Return On Equity (ROE)
The overall ROE of Renata was good over the past years though it has declined from 2012 to 2014. The reason of maintaining overall good ROE is higher revenue growth that helped to increase the net profit over the period up to 1.7 billion in 2014, an increase of 41.66% from 2012. But, the total shareholder’s equity of Renata has also increased substantially since 2012 and stood at 7.75 billion in 2014, that was 52% increment since 2012 (RL, 2015; RL, 2014; RL, 2013, Appendix of Financial Statements).
Table 01: Return On Equity (ROE) per Year of Renata Limited and Orion Pharma Limited
Name of the Company Return On Equity (%) per Year
2012 2013 2014
Renata Limited 24.41 22.08 22.07
Orion Pharma Limited 3.23 2.83 3.14
28.17 27.51 26.05
22.05 20.32 20.32
-
5.00
10.00
15.00
20.00
25.00
30.00
2012 2013 2014
Operating Profit Margin (%)
Renata Ltd.
Orion PharmaLtd.
ISSN 2411-9571 (Print) ISSN 2411-4073 (online)
European Journal of Economics and Business Studies
September-December 2017 Volume 3, Issue 3
175
Source: RL, 2015; RL 2014; RL 2013; OPL, 2015; OPL, 2014; OPL, 2013; Appendix of Financial Statements
In 2013, the ROE of Orion decreased as the total shareholders’ equity increased by 20% as the number of issued, subscribed and paid-up shares increased. But the net profit increased by only 5.07%. In 2014, ROE showed better result as it increased to 3.14%. The reason was the increase in net profit against total shareholders’ equity. Orion’s net profit was BDT 0.35 billion in 2012 that increased to 0.41 billion in 2014 contributed to better ROE (OPL, 2015; OPL, 2014; OPL, 2013, Appendix of Financial Statements).
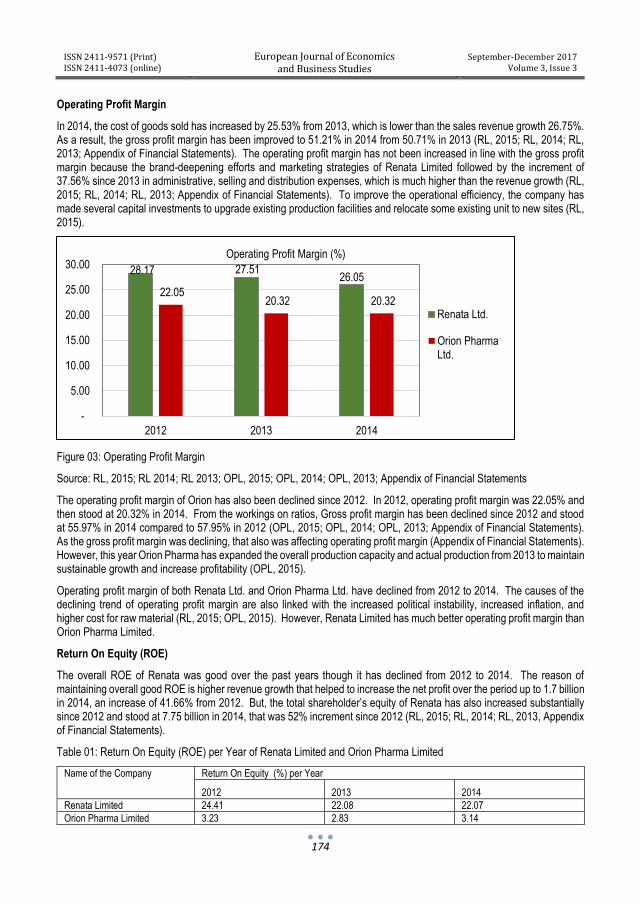
Asset Turnover Ratio
Figure 04: Asset Turnover
Source: RL, 2015; RL 2014; RL 2013; OPL, 2015; OPL, 2014; OPL, 2013; Appendix of Financial Statements
The asset turnover ratio of Renata shows better performance. There was sudden drop in asset turnover ratio from 2012 to 2013 but gradually the company had managed to uplift that ratio in 2014 due to the management efficiency on deploying total assets and achieving higher revenue growth (RL, 2015; RL 2014; RL 2013; Appendix of Financial Statements). The asset turnover ratio of Orion follows a declining trend. The reason is revenue is not growing in line with the total assets (OPL, 2015; OPL, 2014; OPL, 2013, Appendix of Financial Statements). In 2014, Renata’s asset turnover was .77 whereas Orion held 0.10 that indicates Renata has better revenue generation power than Orion.
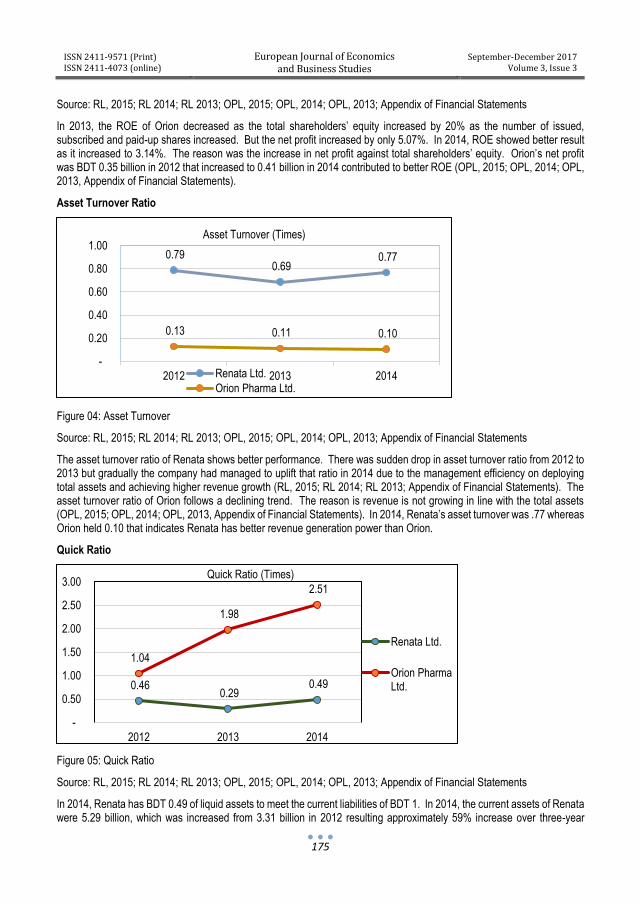
Quick Ratio
Figure 05: Quick Ratio
Source: RL, 2015; RL 2014; RL 2013; OPL, 2015; OPL, 2014; OPL, 2013; Appendix of Financial Statements
In 2014, Renata has BDT 0.49 of liquid assets to meet the current liabilities of BDT 1. In 2014, the current assets of Renata were 5.29 billion, which was increased from 3.31 billion in 2012 resulting approximately 59% increase over three-year
0.79 0.69
0.77
0.13 0.11 0.10
-
0.20
0.40
0.60
0.80
1.00
2012 2013 2014
Asset Turnover (Times)
Renata Ltd.
Orion Pharma Ltd.
0.46 0.29
0.49
1.04
1.98
2.51
-
0.50
1.00
1.50
2.00
2.50
3.00
2012 2013 2014
Quick Ratio (Times)
Renata Ltd.
Orion PharmaLtd.
ISSN 2411-9571 (Print) ISSN 2411-4073 (online)
European Journal of Economics and Business Studies
September-December 2017 Volume 3, Issue 3
176
period (RL, 2015; RL, 2014; RL, 2013; Appendix of Financial Statements). But, the current liability increased significantly since 2012 and it stood at 5.21 billion in 2014 compared to 2.87 billion in 2012 resulting almost 81% increase due to the short-term bank loan and overdraft increment of 83% over that period (RL, 2015; RL, 2014; RL, 2013; Appendix of Financial Statements). The reason of the poor quick ratio of Renata is the continuing increase of current liabilities against the current assets.
Orion had very high quick ratio in compared to Renata. Since 2012 total current assets of Orion has increased by almost 126% and stood at 5.97 billion in 2014. In contrast, the total current liabilities have increased less than 1% since 2012 and have stood 2.26 billion in 2014 (OPL, 2015; OPL, 2014; OPL, 2013; Appendix of Financial Statements). Therefore, Orion Pharma holds better liquidity position than Renata.
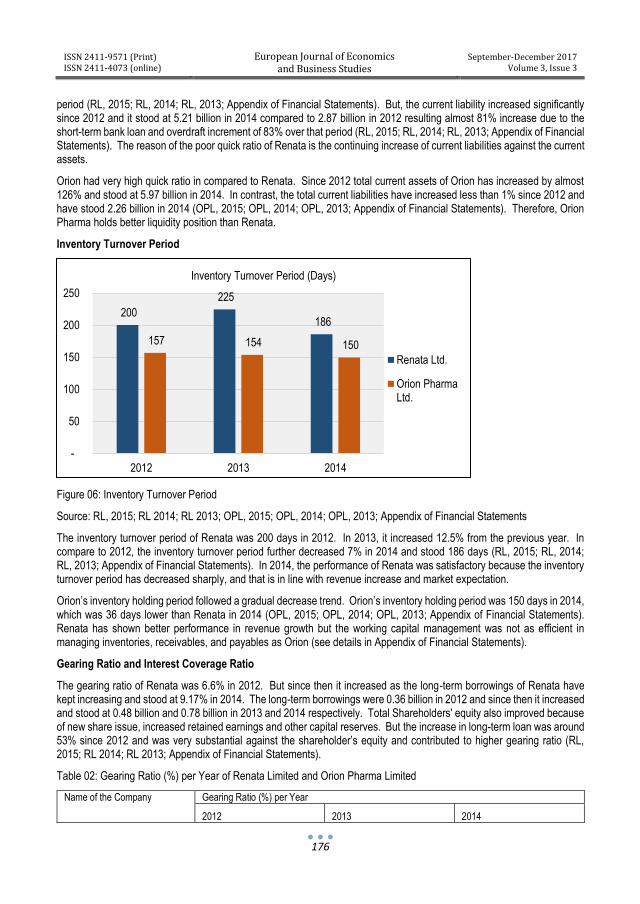
Inventory Turnover Period
Figure 06: Inventory Turnover Period
Source: RL, 2015; RL 2014; RL 2013; OPL, 2015; OPL, 2014; OPL, 2013; Appendix of Financial Statements
The inventory turnover period of Renata was 200 days in 2012. In 2013, it increased 12.5% from the previous year. In compare to 2012, the inventory turnover period further decreased 7% in 2014 and stood 186 days (RL, 2015; RL, 2014; RL, 2013; Appendix of Financial Statements). In 2014, the performance of Renata was satisfactory because the inventory turnover period has decreased sharply, and that is in line with revenue increase and market expectation.
Orion’s inventory holding period followed a gradual decrease trend. Orion’s inventory holding period was 150 days in 2014, which was 36 days lower than Renata in 2014 (OPL, 2015; OPL, 2014; OPL, 2013; Appendix of Financial Statements). Renata has shown better performance in revenue growth but the working capital management was not as efficient in managing inventories, receivables, and payables as Orion (see details in Appendix of Financial Statements).
Gearing Ratio and Interest Coverage Ratio
The gearing ratio of Renata was 6.6% in 2012. But since then it increased as the long-term borrowings of Renata have kept increasing and stood at 9.17% in 2014. The long-term borrowings were 0.36 billion in 2012 and since then it increased and stood at 0.48 billion and 0.78 billion in 2013 and 2014 respectively. Total Shareholders' equity also improved because of new share issue, increased retained earnings and other capital reserves. But the increase in long-term loan was around 53% since 2012 and was very substantial against the shareholder’s equity and contributed to higher gearing ratio (RL, 2015; RL 2014; RL 2013; Appendix of Financial Statements).
Table 02: Gearing Ratio (%) per Year of Renata Limited and Orion Pharma Limited
Name of the Company Gearing Ratio (%) per Year
2012 2013 2014
200
225
186
157 154 150
-
50
100
150
200
250
2012 2013 2014
Inventory Turnover Period (Days)
Renata Ltd.
Orion PharmaLtd.
ISSN 2411-9571 (Print) ISSN 2411-4073 (online)
European Journal of Economics and Business Studies
September-December 2017 Volume 3, Issue 3
177
Renata Limited 6.60 7.05 9.17
Orion Pharma Limited - - 1.76
Source: RL, 2015; RL 2014; RL 2013; OPL, 2015; OPL, 2014; OPL, 2013; Appendix of Financial Statements (FS)
Though the gearing ratio of Renata Limited has been inclining over the period, the interest coverage ratio has been also improved during that period with an average 4.03 times in 2014. Both the long-term and short-term borrowings of Renata increased considerably since 2012. The company charged 463 million as interest in 2014 resulting reduction in profit and Earnings Per Share (EPS) (RL, 2015; RL 2014; RL 2013; Appendix of Financial Statements). The increase in interest coverage ratio indicates that Renata has made profitable capital investments through using its debt and equity financing.
Orion’s gearing ratio stood at 1.76% in 2014 compare to Renata’s 9.17%. Orion had no long-term debt in 2012 and 2013, and only 0.23 billion in 2014. However, interest cover of Orion was almost similar to Renata because of high short-term loan i.e. stood at 1.40 billion in 2014 (OPL, 2015; OPL, 2014; OPL, 2013; Appendix of Financial Statements).
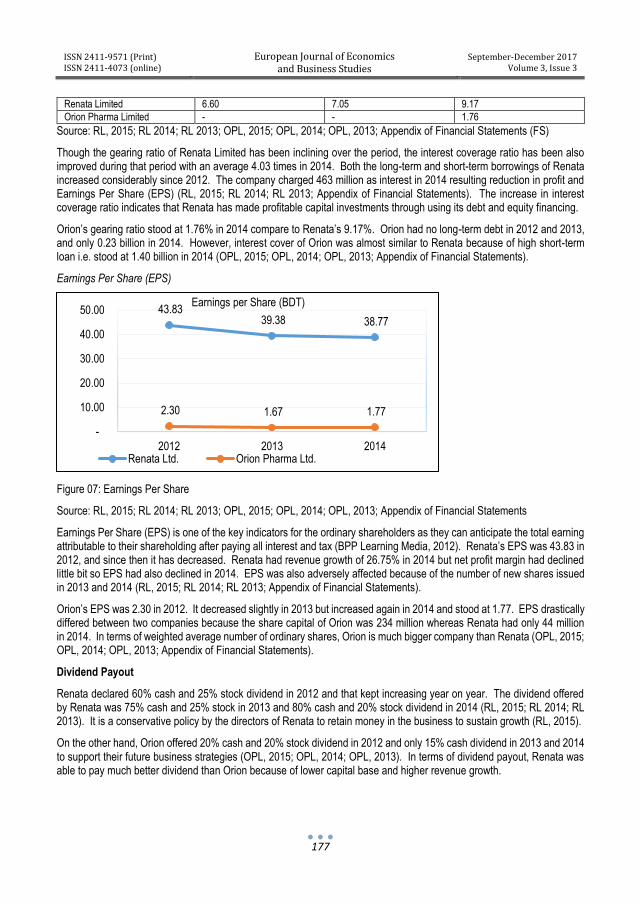
Earnings Per Share (EPS)
Figure 07: Earnings Per Share
Source: RL, 2015; RL 2014; RL 2013; OPL, 2015; OPL, 2014; OPL, 2013; Appendix of Financial Statements
Earnings Per Share (EPS) is one of the key indicators for the ordinary shareholders as they can anticipate the total earning attributable to their shareholding after paying all interest and tax (BPP Learning Media, 2012). Renata’s EPS was 43.83 in 2012, and since then it has decreased. Renata had revenue growth of 26.75% in 2014 but net profit margin had declined little bit so EPS had also declined in 2014. EPS was also adversely affected because of the number of new shares issued in 2013 and 2014 (RL, 2015; RL 2014; RL 2013; Appendix of Financial Statements).
Orion’s EPS was 2.30 in 2012. It decreased slightly in 2013 but increased again in 2014 and stood at 1.77. EPS drastically differed between two companies because the share capital of Orion was 234 million whereas Renata had only 44 million in 2014. In terms of weighted average number of ordinary shares, Orion is much bigger company than Renata (OPL, 2015; OPL, 2014; OPL, 2013; Appendix of Financial Statements).
Dividend Payout
Renata declared 60% cash and 25% stock dividend in 2012 and that kept increasing year on year. The dividend offered by Renata was 75% cash and 25% stock in 2013 and 80% cash and 20% stock dividend in 2014 (RL, 2015; RL 2014; RL 2013). It is a conservative policy by the directors of Renata to retain money in the business to sustain growth (RL, 2015).
On the other hand, Orion offered 20% cash and 20% stock dividend in 2012 and only 15% cash dividend in 2013 and 2014 to support their future business strategies (OPL, 2015; OPL, 2014; OPL, 2013). In terms of dividend payout, Renata was able to pay much better dividend than Orion because of lower capital base and higher revenue growth.
43.83 39.38 38.77
2.30 1.67 1.77
-
10.00
20.00
30.00
40.00
50.00
2012 2013 2014
Earnings per Share (BDT)
Renata Ltd. Orion Pharma Ltd.
ISSN 2411-9571 (Print) ISSN 2411-4073 (online)
European Journal of Economics and Business Studies
September-December 2017 Volume 3, Issue 3
178
Analysis of Statement of Cash Flow
Cash flow statement identifies the activities whether cash is generated (inflows) or cash is used (outflows). This is an important tool for financial analysis because by analyzing the cash flow statement, the shareholders can understand how the company is generating or using its cash through operating, investing and financing activities (BPP Learning Media, 2009). Renata had generated positive cash flows from operating activities in the last three years. The operating cash flows have increased in 2014 as collection form customers increased from 10 billion to 12 billion over one year (RL, 2015; RL 2014; RL 2013).
Orion’s cash generation from operating activities was positive as well since 2012. In 2014, cash generation from operating activities was positive 0.37 billion that was 0.19 billion in 2013 and 0.32 billion in 2012. In 2014, the operating cash have increased as cash receipts from customers have also increased and payments for operating expenses have decreased (OPL, 2015; OPL, 2014; OPL, 2013).
Both Renata and Orion had positive year-end cash balance in 2014. Though Renata generated more cash from operating activities and had better cash flow position up to investment activities but Orion had higher year-end cash balance due to the better opening cash balance of 2014.
SWOT Analysis
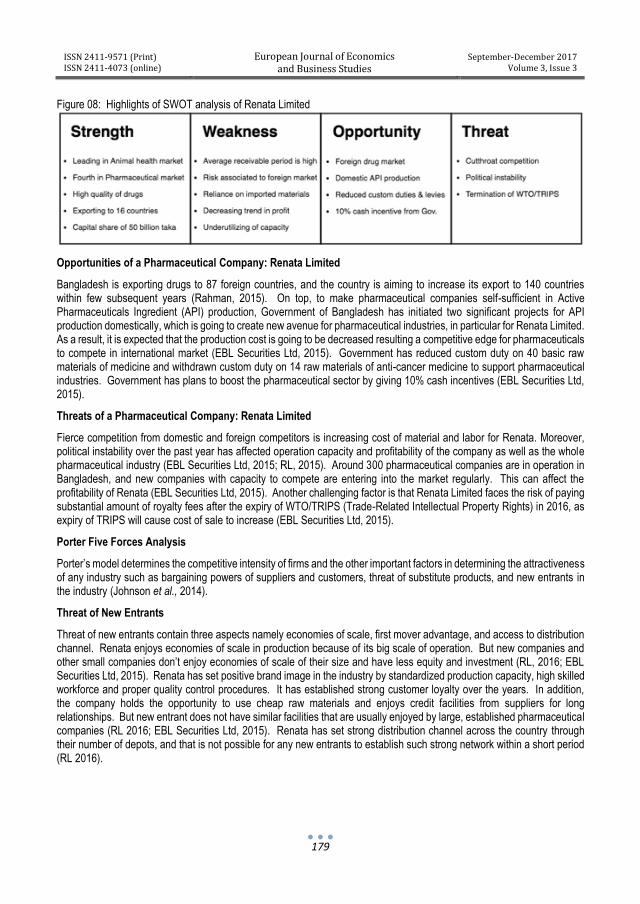
Strengths of a Pharmaceutical Company: Renata Limited
Renata limited is currently holding the forth position in pharmaceuticals industry and leading the animal health product market (RL, 2016). Renata is committed to producing and delivering high quality drugs that has led it to establish permanently as an innovative generic brand name in the industry (RL, 2015). Renata is operating eight manufacturing facilities in three manufacturing sites and nineteen depots throughout the country for distribution (RL, 2016). It has an impressive portfolio consisting of varieties of top class pharmaceuticals products in six molecules out of ten molecules of the industry (RL, 2015). In terms of sustaining the growth rate, Renata is expanding their production capacity through adequate capital expenditure using their internally generated fund and debt capital (RL, 2015). The current growth rate of Renata is far more than the sector average recorded in 2014. The company has been listed for share trading in Dhaka Stock Exchange (DSE) since 1979 with share capital of approximate 50 billion (RL, 2015). Renata has been able to capture the attention of foreign market, followed by its export to 16 countries in 2014 and make 60 filings including 28 Asian Common Technical Documents (ACTD) (RL, 2015). Renata is continuously targeting to reduce the dependency on debt capital reflected through the repayment of 100 corers corporate bond (RL, 2015).
Weaknesses of a Pharmaceutical Company: Renata Limited
Renata is exposed to credit risk in relation to their receivables. The average receivable period of Renata Limited is quite high over the past three years that indicates to inefficient working capital management because it takes longer time to convert the receivable into cash (RL, 2015; RL 2014; RL 2013; Appendix of Financial Statements). Renata faces diversification risks as the company enters into a new foreign market. Also, a large amount of raw materials used in production, machineries and equipment are imported from foreign countries; therefore, Renata is vulnerable to fluctuation of currency as a matter of fact because of currency fluctuation risk involved (RL, 2015). The operating profit margin and net profit margin of Renata has declined since 2012. This reflects that the cost is increasing more quickly than the revenue generation (RL, 2015; RL 2014; RL 2013; Appendix of Financial Statements). A major product group namely ‘Sterile dry fill (injectable) / Vials’ of Renata is utilizing only 71.34% of actual capacity. If the company does not increase its production capacity of this group, total revenue from this group do not go up as substantially (RL, 2015).
ISSN 2411-9571 (Print) ISSN 2411-4073 (online)
European Journal of Economics and Business Studies
September-December 2017 Volume 3, Issue 3
179
Figure 08: Highlights of SWOT analysis of Renata Limited
Opportunities of a Pharmaceutical Company: Renata Limited
Bangladesh is exporting drugs to 87 foreign countries, and the country is aiming to increase its export to 140 countries within few subsequent years (Rahman, 2015). On top, to make pharmaceutical companies self-sufficient in Active Pharmaceuticals Ingredient (API) production, Government of Bangladesh has initiated two significant projects for API production domestically, which is going to create new avenue for pharmaceutical industries, in particular for Renata Limited. As a result, it is expected that the production cost is going to be decreased resulting a competitive edge for pharmaceuticals to compete in international market (EBL Securities Ltd, 2015). Government has reduced custom duty on 40 basic raw materials of medicine and withdrawn custom duty on 14 raw materials of anti-cancer medicine to support pharmaceutical industries. Government has plans to boost the pharmaceutical sector by giving 10% cash incentives (EBL Securities Ltd, 2015).
Threats of a Pharmaceutical Company: Renata Limited
Fierce competition from domestic and foreign competitors is increasing cost of material and labor for Renata. Moreover, political instability over the past year has affected operation capacity and profitability of the company as well as the whole pharmaceutical industry (EBL Securities Ltd, 2015; RL, 2015). Around 300 pharmaceutical companies are in operation in Bangladesh, and new companies with capacity to compete are entering into the market regularly. This can affect the profitability of Renata (EBL Securities Ltd, 2015). Another challenging factor is that Renata Limited faces the risk of paying substantial amount of royalty fees after the expiry of WTO/TRIPS (Trade-Related Intellectual Property Rights) in 2016, as expiry of TRIPS will cause cost of sale to increase (EBL Securities Ltd, 2015).
Porter Five Forces Analysis
Porter’s model determines the competitive intensity of firms and the other important factors in determining the attractiveness of any industry such as bargaining powers of suppliers and customers, threat of substitute products, and new entrants in the industry (Johnson et al., 2014).
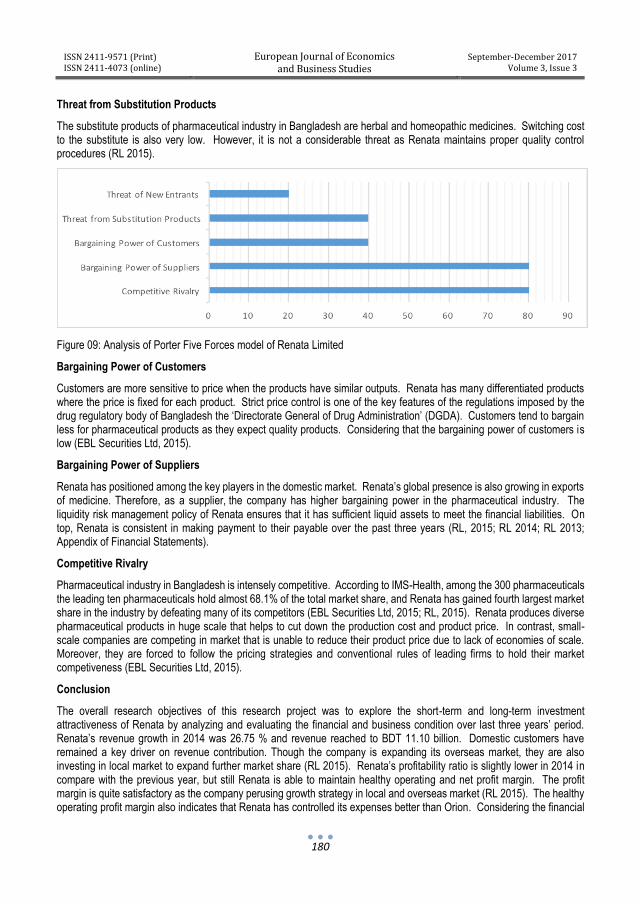
Threat of New Entrants
Threat of new entrants contain three aspects namely economies of scale, first mover advantage, and access to distribution channel. Renata enjoys economies of scale in production because of its big scale of operation. But new companies and other small companies don’t enjoy economies of scale of their size and have less equity and investment (RL, 2016; EBL Securities Ltd, 2015). Renata has set positive brand image in the industry by standardized production capacity, high skilled workforce and proper quality control procedures. It has established strong customer loyalty over the years. In addition, the company holds the opportunity to use cheap raw materials and enjoys credit facilities from suppliers for long relationships. But new entrant does not have similar facilities that are usually enjoyed by large, established pharmaceutical companies (RL 2016; EBL Securities Ltd, 2015). Renata has set strong distribution channel across the country through their number of depots, and that is not possible for any new entrants to establish such strong network within a short period (RL 2016).
ISSN 2411-9571 (Print) ISSN 2411-4073 (online)
European Journal of Economics and Business Studies
September-December 2017 Volume 3, Issue 3
180
Threat from Substitution Products
The substitute products of pharmaceutical industry in Bangladesh are herbal and homeopathic medicines. Switching cost to the substitute is also very low. However, it is not a considerable threat as Renata maintains proper quality control procedures (RL 2015).
Figure 09: Analysis of Porter Five Forces model of Renata Limited
Bargaining Power of Customers
Customers are more sensitive to price when the products have similar outputs. Renata has many differentiated products where the price is fixed for each product. Strict price control is one of the key features of the regulations imposed by the drug regulatory body of Bangladesh the ‘Directorate General of Drug Administration’ (DGDA). Customers tend to bargain less for pharmaceutical products as they expect quality products. Considering that the bargaining power of customers is low (EBL Securities Ltd, 2015).
Bargaining Power of Suppliers
Renata has positioned among the key players in the domestic market. Renata’s global presence is also growing in exports of medicine. Therefore, as a supplier, the company has higher bargaining power in the pharmaceutical industry. The liquidity risk management policy of Renata ensures that it has sufficient liquid assets to meet the financial liabilities. On top, Renata is consistent in making payment to their payable over the past three years (RL, 2015; RL 2014; RL 2013; Appendix of Financial Statements).
Competitive Rivalry
Pharmaceutical industry in Bangladesh is intensely competitive. According to IMS-Health, among the 300 pharmaceuticals the leading ten pharmaceuticals hold almost 68.1% of the total market share, and Renata has gained fourth largest market share in the industry by defeating many of its competitors (EBL Securities Ltd, 2015; RL, 2015). Renata produces diverse pharmaceutical products in huge scale that helps to cut down the production cost and product price. In contrast, small-scale companies are competing in market that is unable to reduce their product price due to lack of economies of scale. Moreover, they are forced to follow the pricing strategies and conventional rules of leading firms to hold their market competiveness (EBL Securities Ltd, 2015).
Conclusion
The overall research objectives of this research project was to explore the short-term and long-term investment attractiveness of Renata by analyzing and evaluating the financial and business condition over last three years’ period. Renata’s revenue growth in 2014 was 26.75 % and revenue reached to BDT 11.10 billion. Domestic customers have remained a key driver on revenue contribution. Though the company is expanding its overseas market, they are also investing in local market to expand further market share (RL 2015). Renata’s profitability ratio is slightly lower in 2014 in compare with the previous year, but still Renata is able to maintain healthy operating and net profit margin. The profit margin is quite satisfactory as the company perusing growth strategy in local and overseas market (RL 2015). The healthy operating profit margin also indicates that Renata has controlled its expenses better than Orion. Considering the financial
ISSN 2411-9571 (Print) ISSN 2411-4073 (online)
European Journal of Economics and Business Studies
September-December 2017 Volume 3, Issue 3
181
analysis, Renata’s liquidity is not very satisfactory and could have been improved further if management is prudent on financial strategy settings. The overall ROE of the two companies clearly shows that Renata is in a much better position than Orion to make return using its equity capital. Last three years of financial statement analysis indicates that to continue the operation and develop the market, Renata is heavily depended in short term and long term debt (RL, 2015; RL 2014; RL 2013; Appendix of Financial Statements). Because of high borrowings, Renata has to bear higher interest payment, and both liquidity and cash flows are more likely to affect negatively in future. The analysis of efficiency and stability ratios has shown very positive results. The company has seemed utilized their assets very efficiently in terms of revenue generation. Renata has also maintained positive investors’ ratio by keeping positive EPS and Dividend (RL, 2015; RL 2014; RL 2013; Appendix of Financial Statements). The business analysis has resulted in an overall positive picture, which indicates Renata’s prospective future growth and supportive competitive environment. Findings of business analysis indicates that Renata would be a good investment choice for existing and prospective shareholders based on its opportunities for long term and short term growth, further expansion in developing market, strong business strategy and brand image. The important thing needs to consider is the market diversification and its associated risks by the management because any failure on strategies would affect liquidity, solvency and cash flows.
References
[1] Blankenship, D. C. (2010). Applied research and evaluation methods in recreation. Leeds: Human Kinetics. [2] Böhm, A. (2008). SWOT analysis. Norderstedt: GRIN Verlag. [3] Boyes, W. J. (2012). Managerial economics: markets and the firm. Mason, OH: South-Western Cengage
Learning. [4] BPP Learning Media. (2009) ACCA Paper F7: Financial Reporting (International). London: BPP Learning Media. [5] BPP Learning Media. (2012) ACCA Paper F9: Financial Management. London: BPP Learning Media. [6] Bradford, R. W., Duncan, P., & Tarcy, B. (2008). Simplified strategic planning: A no-nonsense guide for busy
people who want results fast. Worcester: Chandler House Press. [7] Bryman, A., & Bell, E. (2015). Business research methods. Oxford: Oxford University Press. [8] Burke, M. (1995). Sources of UK business information. Management Decision, 33(5), 33-43. [9] Delmar, F., & Shane, S. (2003). Does business planning facilitate the development of new ventures? Strategic
Management Journal, 24(12), 1165-1185. [10] DSEL. (2016). Dhaka Stock Exchange Limited. Retrieved from http://www.dsebd.org/dse30_share.php [11] EBL Securities Limited. (2015). Pharmaceuticals sector overview. Dhaka: EBL Securities. [12] Ehrhardt, M. C., & Brigham, E. F. (2011). Financial management: theory and practice. Mason, OH: South-
Western College Pub. [13] Eric, S. S., Brian, R. F., & Jay, M. B., (1993). The ernst & young business plan guide. New York, NY: John Wiley
and Sons. [14] Gartner Inc. (2017). Press Release. Retrieved from http://www.gartner.com/newsroom/id/3598917 [15] Greene, F. J., & Hopp, C. (2017). Are formal planners more likely to achieve new venture viability? A
counterfactual model and analysis. Strategic Entrepreneurship Journal, 11(1), 36-60. [16] Hair, J. F., Celsi, M. W., & Money, A. H. (2011). Essentials of business research methods. London: M.E. Sharpe. [17] Harmon, P. (2014). Business process change: A business process management guide for managers and
process professionals. Amsterdam: Elsevier. [18] Hendricks, D. (2014, August 6). Mobile use and the new customer experience. Forbes, Retrieved from
https://www.forbes.com/sites/drewhendricks/2014/08/06/mobile-use-and-the-new-customer-experience/#4c5c03c36061
[19] Henry, A. E. (2011). Understanding strategic management. Oxford: Oxford University Press. [20] Herist, K. N., Rollins, B. L., & Perri, M. (2011). Financial analysis in pharmacy practice. London: Pharmaceutical
Press. [21] Hill, C., & Jones, G. R. (2013). Strategic management theory: An integrated approach. Mason, OH: South-
Western College Pub. [22] Johnson, G., Whittington, R., Scholes, K., Angwin, D., Regnér, P., & Pyle, S. (2014). Exploring strategy: text
and cases. Harlow: Pearson Education Limited. [23] Koen, M., & Oberholster, J. (1999). Analysis and interpretation of financial statements. Cape Town: Juta
Academic.
ISSN 2411-9571 (Print) ISSN 2411-4073 (online)
European Journal of Economics and Business Studies
September-December 2017 Volume 3, Issue 3
182
[24] Lanka Bangla Finance Limited. (2016). Orion Pharma Limited: Change of financial year. Retrieved from http://lankabd.com/dse/stock-market/news/ORIONPHARM-Change-of-Financial-year?storyId=41033
[25] Lanka Bangla Finance Limited. (2016). Renata Limited: Change of financial year. Retrieved from http://lankabd.com/dse/stock-market/news/RENATA-Change-of-Financial-year?storyId=41207
[26] Marchionini, G. (1995). Information seeking in electronic environments. Cambridge: Cambridge University Press.
[27] Mayes, T. R., & Shank, T. M. (2011). Financial analysis with microsoft excel. Mason, OH: South-Western Cengage Learning.
[28] McGowan, C. B., Gardner, J. C., & Moeller, S. E. (2015). The Fundamentals of financial statement analysis as applied to the coca-cola company. New York, NY: Business Expert Press.
[29] OPL. (2013). 2013 Annual report of Orion Pharma Limited. Retrieved from http://www.orionpharmabd.com/investor/annualreport
[30] OPL. (2014). 2014 Annual report of Orion Pharma Limited. Retrieved from http://www.orionpharmabd.com/investor/annualreport
[31] OPL. (2015). 2015 Annual report of Orion Pharma Limited. Retrieved from http://www.orionpharmabd.com/investor/annualreport
[32] OPL. (2016). Investor of Orion Pharma Limited. Retrieved from http://www.orionpharmabd.com/investor/corporatebrief
[33] Osterwalder, A., & Pigneur, Y. (2010). Business model generation: A handbook for visionaries, game changers, and challengers. Hoboken, NJ: John Wiley and Sons.
[34] Paramasivan, C., & Subramanian, T. (2009). Financial management. New Delhi: New Age International Limited. [35] Patrick, J. B., & Suzanne, R. (1993). Successful strategic planning: A guide for nonprofit agencies and
organizations. Newbury Park: Sage Publications. [36] Payne, A., & Frow, P. (2005). A strategic framework for customer relationship management. Journal of
Marketing, 69(4), 167-176. [37] Pharma Mirror. (2013). Leading Online Pharma Magazine. Retrieved from
http://www.pharmamirror.com/knowledge-base/company-profile/renata-limited-bangladesh [38] Pinson, L. (2014). Anatomy of a business plan: The step-by-step guide to building your business and securing
your companys future. Tustin, CA: Out of Your Mind ... and Into the Marketplace. [39] Porter, M. E. (1979). How competitive forces shape strategy, Harvard Business Review, 57(2), 137-145. [40] Quinlan, C., Babin, B., Carr, J., Griffin, M., & Zikmund, W. G. (2015). Business research methods. Hampshire:
Cengage Learning EMEA. [41] Rahman, W. (2015, November 10). Bangladesh pharma industry in the days ahead. The Financial Express,
Retrieved from http://www.thefinancialexpress-bd.com/2015/07/30/102008 [42] Reider, R. (2008). Effective operations and controls for the small privately held business. Hoboken, NJ: John
Wiley and Sons. [43] RL. (2013). 2012 Annual report of Renata Limited. Retrieved from http://renata-ltd.com/news-media/annual-
report-archive [44] RL. (2014). 2013 Annual report of Renata Limited. Retrieved from http://renata-ltd.com/news-media/annual-
report-archive [45] RL. (2015). 2014 Annual report of Renata Limited. Retrieved from http://renata-ltd.com/news-media/annual-
report-archive [46] RL. (2016). About us of Renata Limited. Retrieved from http://renata-ltd.com/about-us [47] Sahlman, W., A. (2010). How to write a great business plan. Boston, MA: Harvard Business Press. [48] Sheth, J. N., & Mittal, B. (2004). Customer behavior: a managerial perspective. Mason, OH: Thomson/South-
Western. [49] Sheth, J. N., Sethia, N. K., & Srinivas, S. (2010). Mindful consumption: A customer-centric approach to
sustainability. Journal of the Academy of Marketing Science, 39(1), 21-39. [50] Steiner, G. A. (1997). Strategic planning: What every manager must know. New York, NY: Simon and Schuster. [51] Stittle, J. (2003). Annual reports: delivering your corporate message to stakeholders. Aldershot: Gower
Publishing Limited.
ISSN 2411-9571 (Print) ISSN 2411-4073 (online)
European Journal of Economics and Business Studies
September-December 2017 Volume 3, Issue 3
183
[52] Sutton, F. X., & Selznick, P. (1958). Leadership in administration: A sociological interpretation. American Sociological Review, 23(1), 98.
[53] Tennent, J., & Friend, G. (2005). Guide to business modelling. London: Profile Books Ltd. [54] Vause, B. (2005). Guide to analysing companies. London: Profile Books Ltd. [55] Weston, J., & Brigham, E. (1979). Essentials of managerial finance. Hinsdale, IL: Dryden Press. [56] Worthington, I., & Britton, C. (2006). The business environment. Harlow: Financial Times Prentice Hall. [57] Wrona, K., Belobokov, D., & Braun, D. R. (2014). Planning 4.0: Mobilizing potential in the planning process.
Stern Stewart & Co. Retrieved from http://www.sternstewart.com/files/ssco_studie_58_planung_en_02.pdf
ISSN 2411-9571 (Print) ISSN 2411-4073 (online)
European Journal of Economics and Business Studies
September-December 2017 Volume 3, Issue 3
184
Environment Impact of Ex-Industrial Areas in Laç and Rubik and the Possibilities for Their Functional Transformation- a Comparative Analysis
Xhilda Dedaj MSc
., University of Tirana
Prof. as. Dr. Sonila Papathimiu
University of Tirana
Abstract
Industrial areas in Albania have had an important role for many years during the communist regime, but their industrial function declined after the 1990s. This study focuses on the industrial areas of Laç and Rubik, two small towns in Albania. The closing of some industrial activities in these towns has increased environmental pollution and health issues of their inhabitants due to the release of toxic substances in the territory. There were chosen these two towns to compare because: First, they are near each other and are part of the same District of Lezha; Second, they both are two ex-industrial towns which were created by the establishment of the industry, former Chemical and Metallurgical Combine in Laç and former Copper Plant in Rubik; third, in both towns the industry has caused environmental pollution in their vicinity, but mostly on the waters of Mat river; fourth, after the year 1990, when the industry that created them has stopped functioning, they have good possibilities to develop religious tourism. In both towns are two important and much-visited churches: the Church of St. Ndout, Laç and the Church of Shelbuemi in Rubik. Another reason is the lack of studies for the ex-industrial areas in Albania, especially for Laç and Rubik. The main aim of this study is to identify and assess the levels of pollution caused by ex-industrial building (actually not functioning) on land, air, water, and human health and to find the best way for their effective reuse and functional transformation.
Keywords: ex-industrial areas, environmental pollution, reuse, functional transformation
Introduction
Kurbini and Mirdita Municipality are part of Lezha District (Map 1). Kurbini Municipality has four administrative units where Laçi is the main town (Map 2), and Mirdita Municipality has six administrative units with main town Rrëshen (Map 3). The territory of Kurbini extends into two physiographic regions: in the Central Mountainous region and Western Lowland, and it has a very favorable position related to the main roads in Albania and the capital city. Also, the geographical position of Mirdita is very strategic and advantageous for its development. In both directions, the Great and Small Fan River valleys connect the Western Lowland with Kukës and the tectonic fracture Mallë Lurë-Urakë connects the Black Drin River with the hollow of Mati.
This paper analyses the industrial development of Laçi and Rubik during the communist regime (1945-1990) and after it (1990 and actually). Some of the advantages of these towns for the development of the industry during the communist regime were:
Firstly: Laçi is near to two important ports, port of Durrës which is the largest and most important in Albania and port of Shëngjin a smaller one, but important for the import-export activity. During communist regime and actually, most of the machinery, industrial equipment, raw and finished materials are imported/exported through these two ports and port of Vlora, which is a little farther to these towns.
Secondly: Both Rubiku and Laçi town were very close to the raw material sources (copper) found mainly in the northeastern part of the country, which supplied the Copper Plant in Rubik and the Pyrometallurgy Plant within the Chemical and Metallurgical Combine in Laç.