Embed Size (px)
Citation preview
RESEARCH ARTICLE
Evaluating the effects of upstream lakes and wetlandson lake phosphorus concentrations using a spatially-explicitmodel
Tao Zhang • Patricia A. Soranno •
Kendra Spence Cheruvelil • Daniel B. Kramer •
Mary Tate Bremigan • Arika Ligmann-Zielinska
Received: 2 March 2011 / Accepted: 21 May 2012 / Published online: 6 June 2012
� Springer Science+Business Media B.V. 2012
Abstract Lake phosphorus concentrations are
strongly influenced by the surrounding landscape that
generates phosphorus loads and water inflow to lakes,
and the physical characteristics of the lake that
determine the fate of these inputs. In addition, the
presence, connectivity, and configuration of upstream
lakes and wetlands likely affect downstream lake
phosphorus concentrations. These freshwater land-
scape features have only sometimes been incorporated
into phosphorus loading models, perhaps because of
the need for spatially-explicit approaches that account
for their location and hydrologic configuration. In this
paper, we developed a lake phosphorus concentration
model that includes three modules to estimate phos-
phorus loading, water inflow, and phosphorus reten-
tion, respectively. In modeling phosphorus loading and
water inflow, we used a spatially-explicit approach to
address their export at sources and their attenuation
along flow-paths. We used 161 headwater lakes for
model calibration and 28 headwater lakes for model
validation. Using the calibrated model, we examined
the effects of upstream lakes and wetlands on down-
stream lake phosphorus concentrations. To examine
the effects of upstream lakes, we compared the output
of the calibrated model for three additional datasets
(208 lakes in total) that contained increasing area of
upstream lakes. To examine the effect of upstream
wetlands, we used the calibrated model to compare
flow-path cell series that contained wetlands and those
that did not. In addition, we simulated catchments in
which all wetlands were converted to forest and
recalculated downstream lake phosphorus concentra-
tions. We found that upstream lakes decreased the
phosphorus concentrations in downstream lakes; and,
counter-intuitively, we found that wetlands increased
phosphorus concentrations in most downstream lakes.
The latter result was due to the fact that although
wetlands reduced phosphorus loads to downstream
lakes, they also reduced water inflow to downstream
lakes and thus increased the phosphorus concentration
T. Zhang (&)
Department of Biology, University of Florida,
220 Bartram Hall, P.O. Box 118525, Gainesville,
FL 32611, USA
e-mail: [email protected]
P. A. Soranno � M. T. Bremigan
Department of Fisheries and Wildlife, Michigan State
University, 13 Natural Resources Building, East Lansing,
MI 48824, USA
K. S. Cheruvelil
Department of Fisheries and Wildlife, Lyman Briggs
College, Michigan State University, 35 East Holmes Hall,
East Lansing, MI 48825, USA
D. B. Kramer
Department of Fisheries and Wildlife, James Madison
College, Michigan State University, 370 North Case Hall,
East Lansing, MI 48824, USA
A. Ligmann-Zielinska
Department of Geography, Environmental Science and
Policy Program, Michigan State University, 130
Geography Building, East Lansing, MI 48824, USA
123
Landscape Ecol (2012) 27:1015–1030
DOI 10.1007/s10980-012-9762-z
of inflows to lakes. Our results suggest that when
modeling lake phosphorus concentrations, freshwater
features of the landscape and their spatial arrangement
should be taken into account.
Keywords Lake phosphorus concentration �Spatially-explicit modeling �Wetland �Upstream lake �Flow-path � Distance-attenuation effect
Introduction
Nutrient concentrations in freshwater ecosystems are
strongly influenced by two categories of factors: the
surrounding landscape that generates nutrient and
water inflow, and the physical characteristics of the
water body that determine the fate of these inputs. For
lakes, the latter factor has been effectively incorpo-
rated into empirical models that predict lake nutrient
concentrations as a function of water depth, hydraulic
residence times, and nutrient loads (Vollenweider
1976; Reckhow and Chapra 1983). However, for
lakes, the effect of the surrounding landscape on
nutrient and water inflow has been less effectively
modeled, in part because of the large amount of spatial
complexity that influences nutrient and water transport
to them. This spatial complexity results in several
challenges in modeling landscape effects on lake
nutrient concentrations. First, incorporating greater
spatial complexity in models requires large amounts of
calibration data, which often are not available, as has
been recognized in several reviews of the topic (e.g.,
Grayson et al. 1992; Breuer et al. 2008). Second,
choosing which of the many land-based catchment
features, such as soils, topography, and land use/land
cover (LULC) types, to include in a spatially-explicit
manner is often not clear. Third, a challenge that has
received far less attention is the need to account for the
composition and spatial configuration of the freshwa-
ter landscape, such as the presence of upstream lakes
and wetlands and the hydrologic connections among
them (Soranno et al. 2010). It is notable that
researchers modeling nutrient flow to waterbodies
have incorporated spatial complexity of the land-
based elements of the landscape much more than they
have incorporated the presence or spatial configura-
tion of connected, with a few exceptions (e.g.,
Marcarelli and Wurtsbaugh 2007; Goodman et al.
2010; Powers et al. 2012).
There is much evidence to suggest that upstream
waterbodies play an important role when modeling
nutrient transport from catchments to lakes. For
example, wetlands can be important sinks for nutrients
originating from agricultural and urban lands and they
may play a significant role in improving water quality
of downstream aquatic ecosystems (Baker 1992;
Zedler and Kercher 2005; Verhoeven et al. 2006).
However, the evidences for the specific effects of
wetlands on lake phosphorus concentration, in partic-
ular, are equivocal. For example, studies have shown
wetland cover to be positively related to downstream
waterbody phosphorus concentrations in some settings
(Devito et al. 2000; Fergus et al. 2011), but negatively
related to downstream waterbody phosphorus concen-
trations in other settings (Detenbeck et al. 1993; Fergus
et al. 2011). In addition, for upstream lakes, we would
expect them to be negatively related to downstream
lake nutrient concentrations because of sedimentation
and uptake within lakes that typically results in lower
outflow phosphorus concentrations compared to inflow
phosphorus concentrations (Ahlgren et al. 1988;
Malmaeus et al. 2006; Bryhn and Hakanson 2007;
Brett and Benjamin 2008). The fact that most detailed
studies of nutrient transport from land to lakes are
conducted on headwater lakes (i.e., lakes without
upstream lakes and few connected wetlands) shows
that the important role of connected waterbodies has
been recognized, but avoided due to the complexity of
modeling such connections. Therefore, studies are
needed that quantify the effects of both upstream lakes
and wetlands on downstream lakes so that phos-
phorus concentrations in larger catchments containing
upstream waterbodies can be better estimated.
Related to the above issues is the overall consider-
ation of the trade-offs between complexity and simplic-
ity in models. In response to these trade-offs, a wide
range of models with different levels of spatial
complexity have been developed, from non-spatial
empirical regression models to complex physically-
based and spatially-explicit models. Non-spatial
regression modeling uses simple landscape metrics as
predictors of nutrient loading to, or concentrations of,
waterbodies (e.g., Jones et al. 2001; Prepas et al. 2001;
Brett et al. 2005). These landscape metrics attempt to
capture relevant aspects of spatial pattern related to
nutrient transport. For modeling lake nutrients, such
indices can be divided into ones that characterize
landscape composition (e.g., percent agricultural land in
1016 Landscape Ecol (2012) 27:1015–1030
123
a lake catchment), or ones that characterize landscape
configuration (e.g., contagion index of a lake catchment)
(Gemesi et al. 2011). This approach can be used to
explore and test the possible linkages between landscape
characteristics and nutrient dynamics and allows one to
easily include a large number of lakes because minimal
input data are needed. However, simple landscape
metrics may not capture the complexity of nutrient flow
from land to water. This fact makes it difficult to infer
the underlying hydrological processes that the models
are intended to represent.
At the other end of the complexity spectrum are
physically-based and spatially-explicit models that have
spatially-distributed variables and parameters. This
approach has become widely used to estimate nutrient
loading, as reviewed by Grayson et al. (1992), Bouraoui
(1994), Borah and Bera (2003, 2004), and Breuer et al.
(2008). These models are very useful for understanding
nutrient and water transport and they help improve fine-
scale management practices (Borah and Bera 2004).
However, some practical difficulties prevent these
complex spatially-explicit models from being widely
and successfully used to estimate lake phosphorus con-
centrations. First, these models often require detailed
measurements of hydrology and nutrients that are not
typically available for most streams and lakes. Second,
some complex spatially-explicit models are computa-
tionally intensive. Applying them in heterogeneous and
large catchments can be extremely time-consuming.
Third, the spatio-temporal scales adopted in many
spatially-explicit models are not suitable for many
questions related to nutrient transport. For example,
some models use an hourly or daily time step, which is
too fine of a scale to examine processes that occur across
large catchments, while other models aggregate a
catchment into hydrological response units that are too
coarse to examine many questions related to spatial
heterogeneity of nutrient and water flow. Finally, because
many of these complex models have large numbers of
parameters, they tend to over-fit the calibration data and
may not have good predictive power for other catchments
(Grayson et al. 1992; Sivapalan 2003). In sum, both the
simple landscape metrics models and the most complex
spatially-explicit models have limitations for modeling
lake phosphorus. It is not clear from the literature what
level of spatial detail is needed to address the landscape
heterogeneity of catchments and the complexity of
hydrological processes for modeling phosphorus con-
centration in lakes.
Our two objectives in this study were to: (1) develop
a spatially-explicit lake phosphorus concentration
model that is intermediate in complexity, requires only
publically available data as inputs, and is not compu-
tation-prohibitive when applied to a large number of
lake catchments; and (2) examine the effects of
upstream lakes and wetlands on modeled downstream
lake phosphorus concentrations. For Objective 1, we
developed a model (called the flow-path attenuation
model) that has three modules that estimate phosphorus
loading, water inflow, and phosphorus retention. For the
phosphorus loading and water inflow modules, we used
a spatially-explicit approach that modeled the export of
phosphorus and water at sources and their attenuation
along flow-paths. For the phosphorus retention module,
we used the Vollenweider model to estimate lake
phosphorus concentration change from lake’s inflow.
For Objective 2, we examined the effects of upstream
lakes on downstream lake phosphorus concentrations
by comparing the outputs of the calibrated model from
three additional datasets that contained increasing area
of upstream lakes. In this step, we predicted that for
lakes within increasing area of upstream lakes, the
phosphorus concentrations would be increasingly over-
estimated, suggesting trapping effects of upstream lakes
on downstream lake phosphorus concentrations. We
also examined the effects of upstream wetlands on
downstream lake phosphorus concentrations at two
scales. First, we compared the transport of phosphorus
and water between flow-path cell series that contained
wetlands and those that did not. Second, at the
catchment scale, we simulated a landscape in which
all wetland cells were converted to forest cells and
calculated downstream lake phosphorus concentra-
tions. Unlike upstream lakes, for which we had clear
expectations of their effects on downstream lake
phosphorus concentrations, we expected that upstream
wetlands would have complex effects on the phospho-
rus concentration of downstream lakes that would be
difficult to predict in advance.
Methods
Study region and lake data
We studied 397 lakes that are distributed throughout
the state of Michigan (Fig. 1). Most lakes in Michigan
have been shaped by glaciers and glacial meltwater.
Landscape Ecol (2012) 27:1015–1030 1017
123
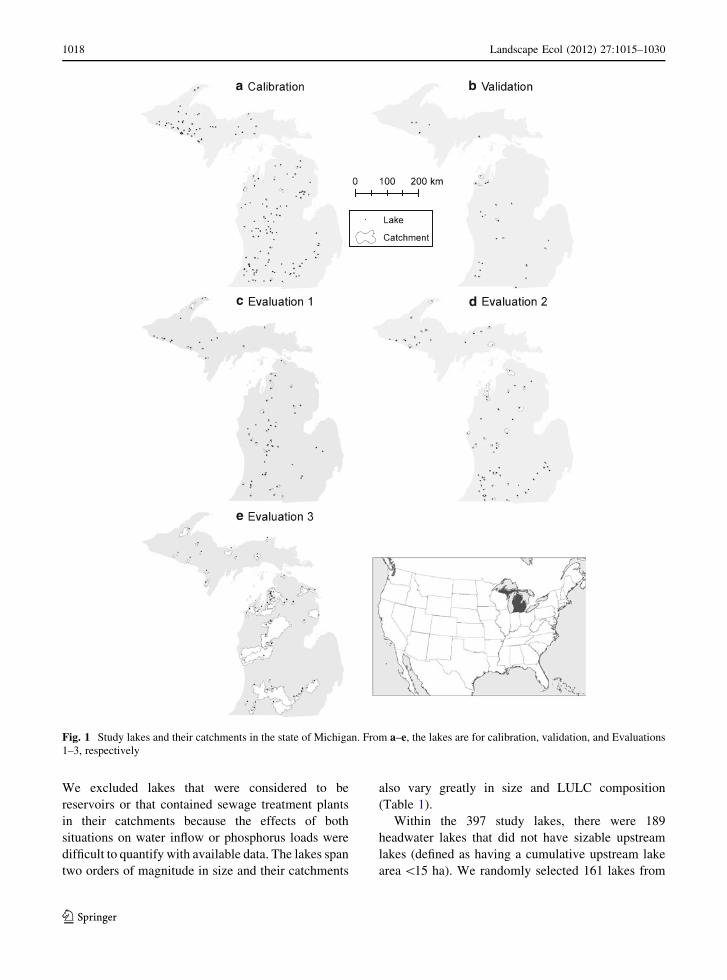
We excluded lakes that were considered to be
reservoirs or that contained sewage treatment plants
in their catchments because the effects of both
situations on water inflow or phosphorus loads were
difficult to quantify with available data. The lakes span
two orders of magnitude in size and their catchments
also vary greatly in size and LULC composition
(Table 1).
Within the 397 study lakes, there were 189
headwater lakes that did not have sizable upstream
lakes (defined as having a cumulative upstream lake
area \15 ha). We randomly selected 161 lakes from
a
c
e
d
b
Fig. 1 Study lakes and their catchments in the state of Michigan. From a–e, the lakes are for calibration, validation, and Evaluations
1–3, respectively
1018 Landscape Ecol (2012) 27:1015–1030
123
these headwater lakes to calibrate our model, and we
used the other 28 lakes to validate the model (Fig. 1a,
b; Objective 1). We divided the remaining 208 lakes
into three datasets for evaluating the effects of
upstream lakes on modeled downstream phosphorus
concentrations (see below; Objective 2).
We used lake phosphorus concentration data,
specifically that sampled during spring turnover when
lake water is well mixed, collected by the USGS from
2001 to 2008 through the Lake Water Quality
Assessment monitoring program (Fuller and Minner-
ick 2008). Our subset of data represents sampling
during April (81 %) as well as late March and early
May (19 %).
Landscape and climate data
We delineated lake catchments for each of the 397
lakes using 1:24,000 stream data and 30 m flow
direction grid data as input of the Hydrology Tools in
ESRI ArcGIS 9.3. The stream data were from the
USGS National Hydrography Dataset (NHD) and the
flow direction grid data were from the USGS NHDPlus
dataset. The flow direction data were a hydrologic
derivative product of HydroDEM, which is a modified
digital elevation model produced using drainage
enforcement techniques (e.g., stream burning and
DEM filling techniques) on the National Elevation
Dataset and the National Hydrography Dataset (refer to
ftp://ftp.horizon-systems.com/NHDPlus/documentation/
NHDPLUS_UserGuide.pdf for more details about the
data processing of NHDPlus dataset). The catchment of a
lake includes all of the grids that drain into the lake or its
upstream lakes and streams. Hereafter, the final recipient
lake of a catchment is called the ‘‘focal lake’’ and the other
lakes in its catchment are called ‘‘upstream lakes’’.
We obtained 2007 LULC data from the USDA
Cropland Data Layer (CDL) for the state of Michigan
(http://www.nass.usda.gov/research/Cropland/SARS1a.
htm). We aggregated the CDL data into six LULC types:
pasture, row crop, forest, urban, wetland (which includes
both wetlands and small lakes), and focal lakes. We
aggregated LULC types to minimize the number of
parameters that were fit in the calibration step and
because rare LULC types could not be fit to the data. To
calculate the annual precipitation in each lake catchment,
we summed the monthly precipitation for the 12 months
prior to the lake phosphorus concentration sampling. The
monthly precipitation data were from the Parameter-
elevation Regressions on Independent Slopes Model
(PRISM) datasets (http://www.prism.oregonstate.edu/
products/). The spatial resolution of the precipitation
data is approximately 4 km, which is much coarser than
the other geographic data included in our model, but
matches the characteristics of smooth spatial variation
for annual precipitation.
Model approach
The complexity level of our flow-path attenuation
model falls between the simple multivariable regres-
sion models and the process-based models. The model
is spatially explicit but does not contain detailed
physical processes. Our flow-path attenuation model
contains three modules: phosphorus loading to lakes,
water inflow to lakes, and lake phosphorus retention.
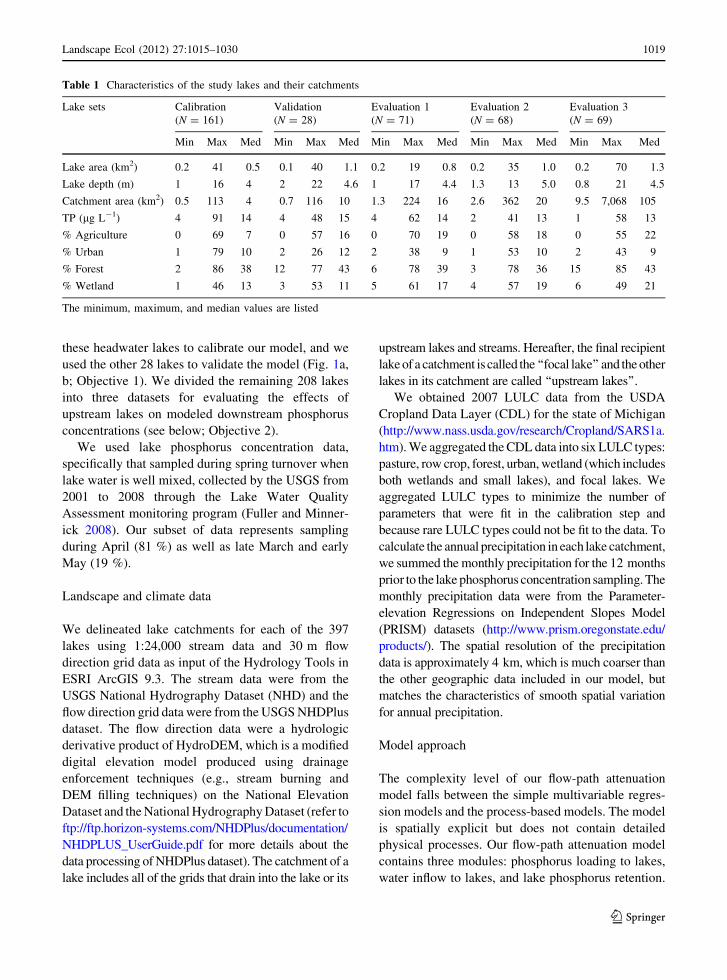
Table 1 Characteristics of the study lakes and their catchments
Lake sets Calibration
(N = 161)
Validation
(N = 28)
Evaluation 1
(N = 71)
Evaluation 2
(N = 68)
Evaluation 3
(N = 69)
Min Max Med Min Max Med Min Max Med Min Max Med Min Max Med
Lake area (km2) 0.2 41 0.5 0.1 40 1.1 0.2 19 0.8 0.2 35 1.0 0.2 70 1.3
Lake depth (m) 1 16 4 2 22 4.6 1 17 4.4 1.3 13 5.0 0.8 21 4.5
Catchment area (km2) 0.5 113 4 0.7 116 10 1.3 224 16 2.6 362 20 9.5 7,068 105
TP (lg L-1) 4 91 14 4 48 15 4 62 14 2 41 13 1 58 13
% Agriculture 0 69 7 0 57 16 0 70 19 0 58 18 0 55 22
% Urban 1 79 10 2 26 12 2 38 9 1 53 10 2 43 9
% Forest 2 86 38 12 77 43 6 78 39 3 78 36 15 85 43
% Wetland 1 46 13 3 53 11 5 61 17 4 57 19 6 49 21
The minimum, maximum, and median values are listed
Landscape Ecol (2012) 27:1015–1030 1019
123
Phosphorus loading is defined as the amount of
phosphorus transported from land to a lake in a year.
Water inflow is the volume of incoming water to a lake
in a year. These two modules were used to calculate
the inflow phosphorus concentrations. Finally, we
calculated lake phosphorus concentrations using the
inflow phosphorus concentration and the third module,
the lake phosphorus retention module.
The phosphorus load module adopts the basic
concept of an export coefficient model. An export
coefficient is an estimate of the mass of a pollutant
exported from a unit area of a particular LULC type in
a year. Unlike the traditional export coefficient model
that ignores spatial heterogeneities of other factors that
govern nutrient export and delivery processes, our
module takes into consideration two important spa-
tially-explicit factors: precipitation and nutrient atten-
uation. For the source cells, we included annual
precipitation, which is positively correlated with
nutrient export from a source area (Vanni et al.
2001; Wang and Choi 2005). For the grid cells along
flow-paths, we used delivery ratios to quantify the
attenuation effects on the nutrient flowing through
these cells. Delivery ratio of a grid cell is the fraction
of nutrient that is not trapped in that grid cell. We
distinguished terrestrial cells from wetland cells to
address their different delivery effects on phosphorus.
Thus, the effective phosphorus load from a source cell
to a lake is the product of the exported phosphorus at
the source cell and the cumulative delivery ratio of the
cells in its flow-path:
l ¼ p � E � r1 � r2 � �� ¼ p � E � R ð1Þ
where l is the effective phosphorus load from a source
cell (kg year-1); p is the normalized annual precipi-
tation factor of that source cell (normalized by the
average precipitation of the study area); E is its
phosphorus export coefficient (kg year-1); and R is
the cumulative delivery ratio of phosphorus, or the
product of delivery ratios (ri) of the cells along the
flow-path. Here, although different terrestrial or
wetland cell types may differ in their effectiveness at
trapping phosphorus (Detenbeck et al. 1993; Abu-
Zreig et al. 2003; Diebel et al. 2009), we did not further
distinguish them into subtypes because our sample
size was too small to do so and we did not have good
information on wetland types.
The total phosphorus load to a lake (L) is:
L ¼X6
j¼1
Xnj
i¼1
pij � Ej � Rij ð2Þ
where j refers to the LULC type and nj is the number of
grid cells of j type in the catchment. Besides the five
LULC types in the catchment, the focal lake is
regarded as a special LULC type with the cumulative
delivery ratio (R) of one because the direct phosphorus
load to a lake cell (e.g., the atmospheric load and
internal load) contributes entirely to the load.
The module of water inflow to lakes is similar in
concept to the module of phosphorus loads to lakes.
Water yield from a source grid cell is not only affected
by its LULC type but also is proportional to its annual
precipitation. Water will decrease as passing through a
grid cell, and the fraction of delivered water is
different between terrestrial and wetland cells. Thus,
the annual water inflow to a lake (Q, in m3 year-1) is:
Q ¼ Acell �X6
j¼1
Xnj
i¼1
Pij � wj � Sij ð3Þ
where Acell is the area of a grid cell (m2); P is the
annual precipitation depth at each cell (m year-1); w is
a factor that compensates for other anthropogenic or
natural water losses or gains (e.g., evapotranspiration,
irrigation, groundwater discharges/recharges); and S is
the cumulative delivery ratio of water along the flow-
path. With L and Q, phosphorus concentration of
inflow (l L-1) is given by:
TPin ¼L
Q� 106 ð4Þ
where 106 is the coefficient for unit conversion.
Equation (3) is a coarse model for estimating water
yield from the landscape, especially in the Great Lakes
region where hydrological routing and base flow are
broadly affected by glacial geology and groundwater
characteristics (Winter 1999; Neff et al. 2005).
However, simulating water flow in a more accurate
way for nearly 400 ungauged catchments that span the
state of Michigan requires introducing many addi-
tional parameters and unavailable data. We developed
this simpler model to keep the parameters few enough
to make calibration feasible with our sample size.
For the lake phosphorus retention module, we
tested several models and adopted the widely-used
Vollenweider model (Vollenweider 1976) because it
had the best performance as measured by R2 (Zhang,
1020 Landscape Ecol (2012) 27:1015–1030
123
unpublished data). The Vollenweider model can be
rewritten as (Brett and Benjamin 2008):
TP ¼ TPin
1þ rsð5Þ
where TP is the lake phosphorus concentration (lg L-1);
r is the first-order rate coefficient for phosphorus loss
from the lake (year-1); and s is the mean hydraulic
residence time (year), which is given by:
s ¼ Vlake
Q¼ Alake � Dlake
Qð6Þ
where Vlake, Alake, and Dlake are the lake volume (m3),
lake area (m2), and lake mean depth (m), respectively.
Model calibration and validation
To calibrate the model, we used a simulated annealing
optimization method (Kirkpatrick et al. 1983) to
determine the parameter estimates that minimized the
root of mean squared error (RMSE) between observed
and predicted lake phosphorus concentrations. We
then applied the calibrated model in the validation
dataset and evaluated the predictive performance of the
calibrated model. We quantified several metrics to
evaluate the calibration and validation results. For
calibration, the three metrics were Nash-Sutcliffe
model Efficiency coefficient (NSE), R2, and RMSE.
For validation, the four metrics were NSE, R2, RMSE,
and the percent bias (PBIAS). NSE indicates how well
the plot of predicted versus observed data fits the 1:1
line and PBIAS measures the average tendency of the
simulated data to be larger or smaller than their
observed counterparts (Moriasi et al. 2007).
Assessing the effects of upstream lakes
and wetlands on lake phosphorus concentrations
For our second objective, we divided the 208 lakes that
had upstream lakes in their catchments into three
datasets with increasing amounts of upstream lake
area as measured by two metrics: (1) total upstream
lake area (Aup in ha) and (2) the lake areal ratio,
defined as the ratio between the upstream lakes and the
focal lake (Aup/Afocal, unitless). Including lake areal
ratio in this criterion is consistent with using the lake
influence index (Snelder and Biggs 2002) to estimate
the effect of upstream lakes on controlling down-
stream flow and sediment regimes. The definition of
these three datasets is in Table 2 and the locations of
these lakes and their catchments are shown in Fig. 1c–e.
For convenience, we hereafter call the three datasets
Evaluations 1–3. We quantified the performance of the
flow-path attenuation model for these three evaluation
datasets to study the effect of increasing upstream lake
prevalence on predicting lake phosphorus concentra-
tions. We compared their PBIAS values to determine
whether increasing amounts of upstream lakes result
in increased bias in the model’s prediction.
We evaluated the effects of catchment wetlands on
focal lake phosphorus concentrations at two scales.
First, at the scale of the flow-path cell-series, we
compared the change of phosphorus load and concen-
tration between a cell-series with only terrestrial
LULC types and a cell-series that starts with terrestrial
cells and ends with wetland cells. Then, at the scale of
the catchment, we reran the flow-path attenuation
model using the calibration lake dataset but with a
simulated landscape within which all existing wet-
lands were converted to terrestrial land (i.e., forest
land) and compared the differences in predicted
phosphorus loading to the focal lakes between the
two scenarios.
Results
Spatially-explicit phosphorus concentration model
The calibration and validation results implied that
our spatially-explicit flow-path attenuation model
Table 2 Definition of the datasets used to evaluate the effect of upstream lakes
Name N Definition
Evaluation 1 71 ðAup\60 haÞ \ ðAup=Afocal\0:5ÞEvaluation 2 68 ðAup\200 haÞ \ ðAup=Afocal\2Þ � Evaluation1
Evaluation 3 69 ðAup [ 200 haÞ [ ðAup=Afocal [ 2Þ
Aup means the total upstream lake area and Afocal means the area of focal lake. N is the number of lakes in each dataset
Landscape Ecol (2012) 27:1015–1030 1021
123
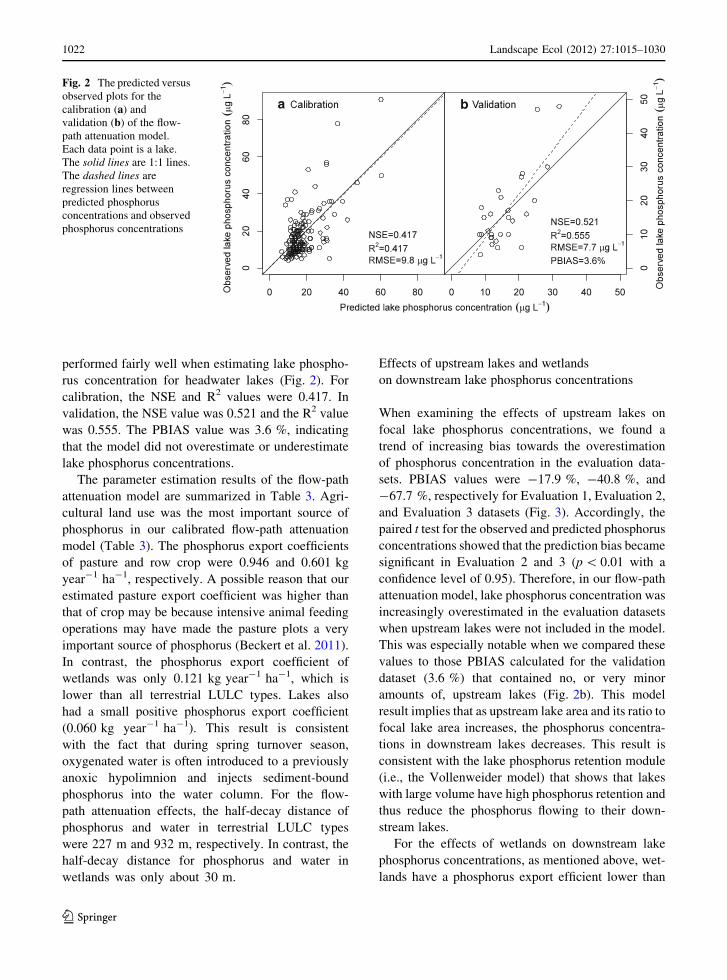
performed fairly well when estimating lake phospho-
rus concentration for headwater lakes (Fig. 2). For
calibration, the NSE and R2 values were 0.417. In
validation, the NSE value was 0.521 and the R2 value
was 0.555. The PBIAS value was 3.6 %, indicating
that the model did not overestimate or underestimate
lake phosphorus concentrations.
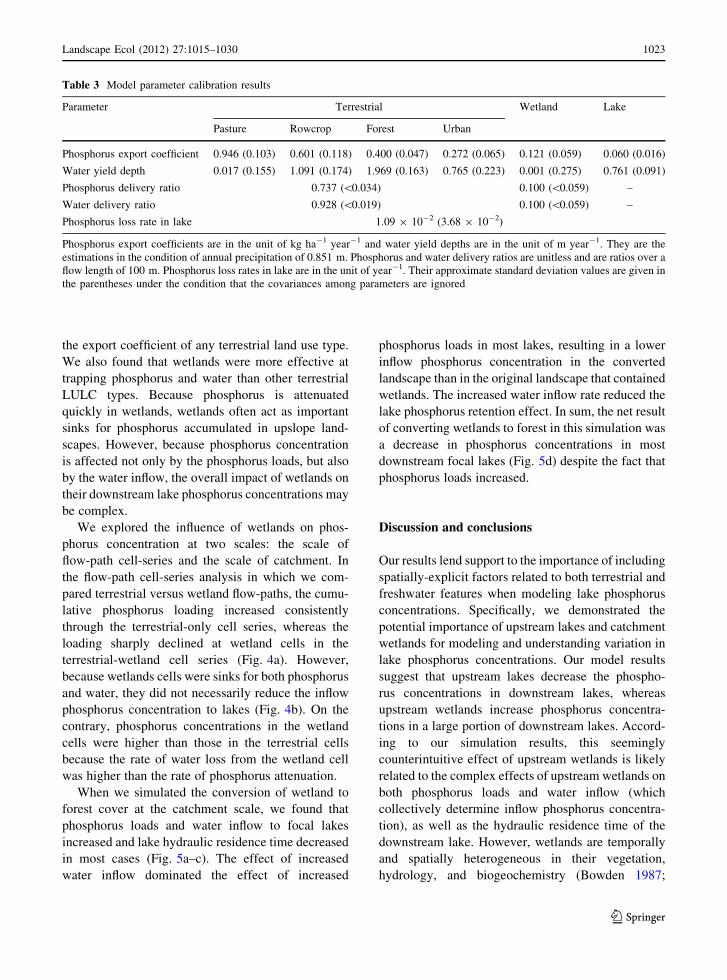
The parameter estimation results of the flow-path
attenuation model are summarized in Table 3. Agri-
cultural land use was the most important source of
phosphorus in our calibrated flow-path attenuation
model (Table 3). The phosphorus export coefficients
of pasture and row crop were 0.946 and 0.601 kg
year-1 ha-1, respectively. A possible reason that our
estimated pasture export coefficient was higher than
that of crop may be because intensive animal feeding
operations may have made the pasture plots a very
important source of phosphorus (Beckert et al. 2011).
In contrast, the phosphorus export coefficient of
wetlands was only 0.121 kg year-1 ha-1, which is
lower than all terrestrial LULC types. Lakes also
had a small positive phosphorus export coefficient
(0.060 kg year-1 ha-1). This result is consistent
with the fact that during spring turnover season,
oxygenated water is often introduced to a previously
anoxic hypolimnion and injects sediment-bound
phosphorus into the water column. For the flow-
path attenuation effects, the half-decay distance of
phosphorus and water in terrestrial LULC types
were 227 m and 932 m, respectively. In contrast, the
half-decay distance for phosphorus and water in
wetlands was only about 30 m.
Effects of upstream lakes and wetlands
on downstream lake phosphorus concentrations
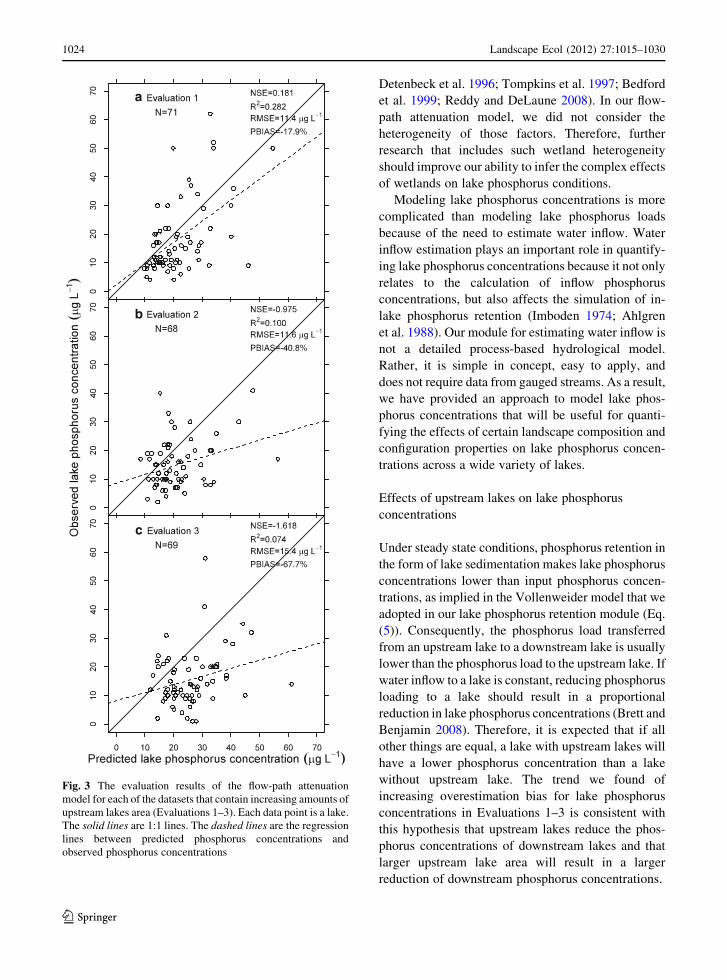
When examining the effects of upstream lakes on
focal lake phosphorus concentrations, we found a
trend of increasing bias towards the overestimation
of phosphorus concentration in the evaluation data-
sets. PBIAS values were -17.9 %, -40.8 %, and
-67.7 %, respectively for Evaluation 1, Evaluation 2,
and Evaluation 3 datasets (Fig. 3). Accordingly, the
paired t test for the observed and predicted phosphorus
concentrations showed that the prediction bias became
significant in Evaluation 2 and 3 (p \ 0.01 with a
confidence level of 0.95). Therefore, in our flow-path
attenuation model, lake phosphorus concentration was
increasingly overestimated in the evaluation datasets
when upstream lakes were not included in the model.
This was especially notable when we compared these
values to those PBIAS calculated for the validation
dataset (3.6 %) that contained no, or very minor
amounts of, upstream lakes (Fig. 2b). This model
result implies that as upstream lake area and its ratio to
focal lake area increases, the phosphorus concentra-
tions in downstream lakes decreases. This result is
consistent with the lake phosphorus retention module
(i.e., the Vollenweider model) that shows that lakes
with large volume have high phosphorus retention and
thus reduce the phosphorus flowing to their down-
stream lakes.
For the effects of wetlands on downstream lake
phosphorus concentrations, as mentioned above, wet-
lands have a phosphorus export efficient lower than
a b
Fig. 2 The predicted versus
observed plots for the
calibration (a) and
validation (b) of the flow-
path attenuation model.
Each data point is a lake.
The solid lines are 1:1 lines.
The dashed lines are
regression lines between
predicted phosphorus
concentrations and observed
phosphorus concentrations
1022 Landscape Ecol (2012) 27:1015–1030
123
the export coefficient of any terrestrial land use type.
We also found that wetlands were more effective at
trapping phosphorus and water than other terrestrial
LULC types. Because phosphorus is attenuated
quickly in wetlands, wetlands often act as important
sinks for phosphorus accumulated in upslope land-
scapes. However, because phosphorus concentration
is affected not only by the phosphorus loads, but also
by the water inflow, the overall impact of wetlands on
their downstream lake phosphorus concentrations may
be complex.
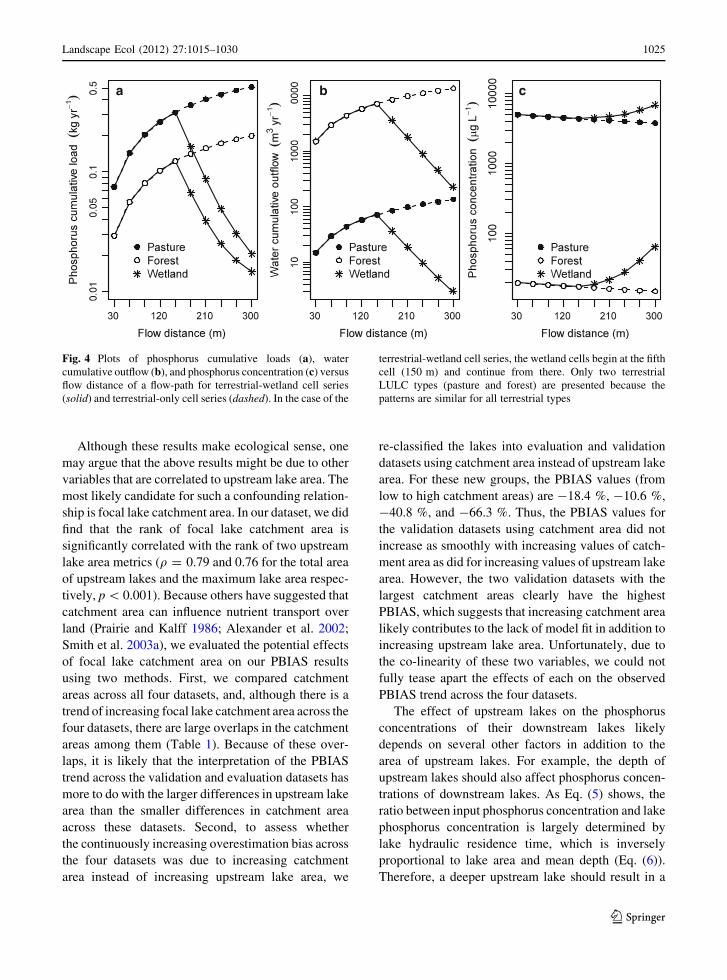
We explored the influence of wetlands on phos-
phorus concentration at two scales: the scale of
flow-path cell-series and the scale of catchment. In
the flow-path cell-series analysis in which we com-
pared terrestrial versus wetland flow-paths, the cumu-
lative phosphorus loading increased consistently
through the terrestrial-only cell series, whereas the
loading sharply declined at wetland cells in the
terrestrial-wetland cell series (Fig. 4a). However,
because wetlands cells were sinks for both phosphorus
and water, they did not necessarily reduce the inflow
phosphorus concentration to lakes (Fig. 4b). On the
contrary, phosphorus concentrations in the wetland
cells were higher than those in the terrestrial cells
because the rate of water loss from the wetland cell
was higher than the rate of phosphorus attenuation.
When we simulated the conversion of wetland to
forest cover at the catchment scale, we found that
phosphorus loads and water inflow to focal lakes
increased and lake hydraulic residence time decreased
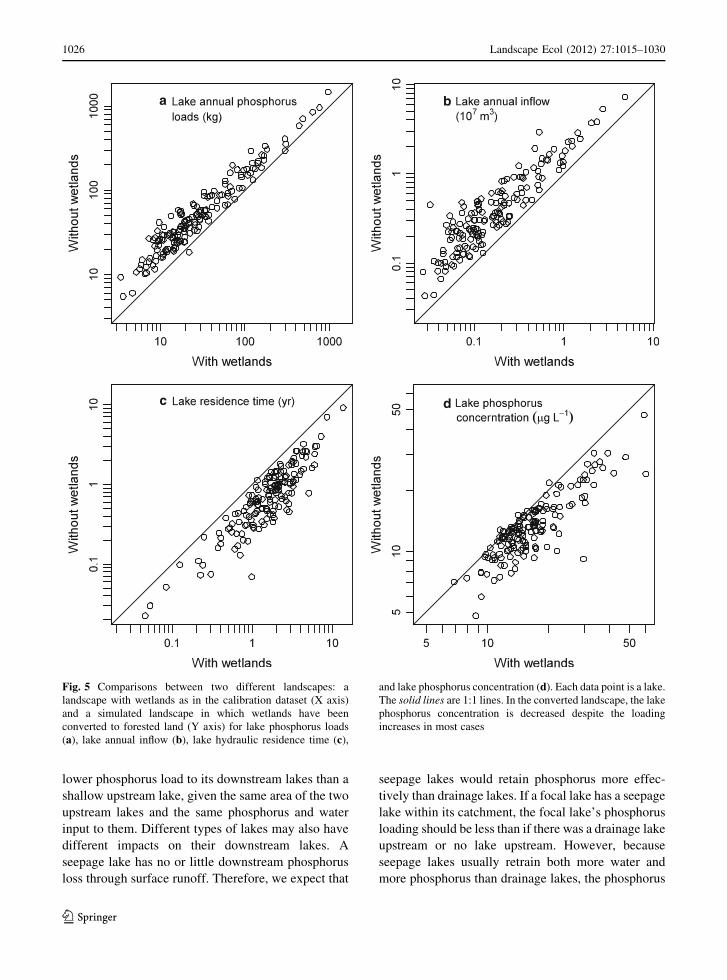
in most cases (Fig. 5a–c). The effect of increased
water inflow dominated the effect of increased
phosphorus loads in most lakes, resulting in a lower
inflow phosphorus concentration in the converted
landscape than in the original landscape that contained
wetlands. The increased water inflow rate reduced the
lake phosphorus retention effect. In sum, the net result
of converting wetlands to forest in this simulation was
a decrease in phosphorus concentrations in most
downstream focal lakes (Fig. 5d) despite the fact that
phosphorus loads increased.
Discussion and conclusions
Our results lend support to the importance of including
spatially-explicit factors related to both terrestrial and
freshwater features when modeling lake phosphorus
concentrations. Specifically, we demonstrated the
potential importance of upstream lakes and catchment
wetlands for modeling and understanding variation in
lake phosphorus concentrations. Our model results
suggest that upstream lakes decrease the phospho-
rus concentrations in downstream lakes, whereas
upstream wetlands increase phosphorus concentra-
tions in a large portion of downstream lakes. Accord-
ing to our simulation results, this seemingly
counterintuitive effect of upstream wetlands is likely
related to the complex effects of upstream wetlands on
both phosphorus loads and water inflow (which
collectively determine inflow phosphorus concentra-
tion), as well as the hydraulic residence time of the
downstream lake. However, wetlands are temporally
and spatially heterogeneous in their vegetation,
hydrology, and biogeochemistry (Bowden 1987;
Table 3 Model parameter calibration results
Parameter Terrestrial Wetland Lake
Pasture Rowcrop Forest Urban
Phosphorus export coefficient 0.946 (0.103) 0.601 (0.118) 0.400 (0.047) 0.272 (0.065) 0.121 (0.059) 0.060 (0.016)
Water yield depth 0.017 (0.155) 1.091 (0.174) 1.969 (0.163) 0.765 (0.223) 0.001 (0.275) 0.761 (0.091)
Phosphorus delivery ratio 0.737 (\0.034) 0.100 (\0.059) –
Water delivery ratio 0.928 (\0.019) 0.100 (\0.059) –
Phosphorus loss rate in lake 1.09 9 10-2 (3.68 9 10-2)
Phosphorus export coefficients are in the unit of kg ha-1 year-1 and water yield depths are in the unit of m year-1. They are the
estimations in the condition of annual precipitation of 0.851 m. Phosphorus and water delivery ratios are unitless and are ratios over a
flow length of 100 m. Phosphorus loss rates in lake are in the unit of year-1. Their approximate standard deviation values are given in
the parentheses under the condition that the covariances among parameters are ignored
Landscape Ecol (2012) 27:1015–1030 1023
123
Detenbeck et al. 1996; Tompkins et al. 1997; Bedford
et al. 1999; Reddy and DeLaune 2008). In our flow-
path attenuation model, we did not consider the
heterogeneity of those factors. Therefore, further
research that includes such wetland heterogeneity
should improve our ability to infer the complex effects
of wetlands on lake phosphorus conditions.
Modeling lake phosphorus concentrations is more
complicated than modeling lake phosphorus loads
because of the need to estimate water inflow. Water
inflow estimation plays an important role in quantify-
ing lake phosphorus concentrations because it not only
relates to the calculation of inflow phosphorus
concentrations, but also affects the simulation of in-
lake phosphorus retention (Imboden 1974; Ahlgren
et al. 1988). Our module for estimating water inflow is
not a detailed process-based hydrological model.
Rather, it is simple in concept, easy to apply, and
does not require data from gauged streams. As a result,
we have provided an approach to model lake phos-
phorus concentrations that will be useful for quanti-
fying the effects of certain landscape composition and
configuration properties on lake phosphorus concen-
trations across a wide variety of lakes.
Effects of upstream lakes on lake phosphorus
concentrations
Under steady state conditions, phosphorus retention in
the form of lake sedimentation makes lake phosphorus
concentrations lower than input phosphorus concen-
trations, as implied in the Vollenweider model that we
adopted in our lake phosphorus retention module (Eq.
(5)). Consequently, the phosphorus load transferred
from an upstream lake to a downstream lake is usually
lower than the phosphorus load to the upstream lake. If
water inflow to a lake is constant, reducing phosphorus
loading to a lake should result in a proportional
reduction in lake phosphorus concentrations (Brett and
Benjamin 2008). Therefore, it is expected that if all
other things are equal, a lake with upstream lakes will
have a lower phosphorus concentration than a lake
without upstream lake. The trend we found of
increasing overestimation bias for lake phosphorus
concentrations in Evaluations 1–3 is consistent with
this hypothesis that upstream lakes reduce the phos-
phorus concentrations of downstream lakes and that
larger upstream lake area will result in a larger
reduction of downstream phosphorus concentrations.
a
b
c
Fig. 3 The evaluation results of the flow-path attenuation
model for each of the datasets that contain increasing amounts of
upstream lakes area (Evaluations 1–3). Each data point is a lake.
The solid lines are 1:1 lines. The dashed lines are the regression
lines between predicted phosphorus concentrations and
observed phosphorus concentrations
1024 Landscape Ecol (2012) 27:1015–1030
123
Although these results make ecological sense, one
may argue that the above results might be due to other
variables that are correlated to upstream lake area. The
most likely candidate for such a confounding relation-
ship is focal lake catchment area. In our dataset, we did
find that the rank of focal lake catchment area is
significantly correlated with the rank of two upstream
lake area metrics (q = 0.79 and 0.76 for the total area
of upstream lakes and the maximum lake area respec-
tively, p \ 0.001). Because others have suggested that
catchment area can influence nutrient transport over
land (Prairie and Kalff 1986; Alexander et al. 2002;
Smith et al. 2003a), we evaluated the potential effects
of focal lake catchment area on our PBIAS results
using two methods. First, we compared catchment
areas across all four datasets, and, although there is a
trend of increasing focal lake catchment area across the
four datasets, there are large overlaps in the catchment
areas among them (Table 1). Because of these over-
laps, it is likely that the interpretation of the PBIAS
trend across the validation and evaluation datasets has
more to do with the larger differences in upstream lake
area than the smaller differences in catchment area
across these datasets. Second, to assess whether
the continuously increasing overestimation bias across
the four datasets was due to increasing catchment
area instead of increasing upstream lake area, we
re-classified the lakes into evaluation and validation
datasets using catchment area instead of upstream lake
area. For these new groups, the PBIAS values (from
low to high catchment areas) are -18.4 %, -10.6 %,
-40.8 %, and -66.3 %. Thus, the PBIAS values for
the validation datasets using catchment area did not
increase as smoothly with increasing values of catch-
ment area as did for increasing values of upstream lake
area. However, the two validation datasets with the
largest catchment areas clearly have the highest
PBIAS, which suggests that increasing catchment area
likely contributes to the lack of model fit in addition to
increasing upstream lake area. Unfortunately, due to
the co-linearity of these two variables, we could not
fully tease apart the effects of each on the observed
PBIAS trend across the four datasets.
The effect of upstream lakes on the phosphorus
concentrations of their downstream lakes likely
depends on several other factors in addition to the
area of upstream lakes. For example, the depth of
upstream lakes should also affect phosphorus concen-
trations of downstream lakes. As Eq. (5) shows, the
ratio between input phosphorus concentration and lake
phosphorus concentration is largely determined by
lake hydraulic residence time, which is inversely
proportional to lake area and mean depth (Eq. (6)).
Therefore, a deeper upstream lake should result in a
a b c
Fig. 4 Plots of phosphorus cumulative loads (a), water
cumulative outflow (b), and phosphorus concentration (c) versus
flow distance of a flow-path for terrestrial-wetland cell series
(solid) and terrestrial-only cell series (dashed). In the case of the
terrestrial-wetland cell series, the wetland cells begin at the fifth
cell (150 m) and continue from there. Only two terrestrial
LULC types (pasture and forest) are presented because the
patterns are similar for all terrestrial types
Landscape Ecol (2012) 27:1015–1030 1025
123
lower phosphorus load to its downstream lakes than a
shallow upstream lake, given the same area of the two
upstream lakes and the same phosphorus and water
input to them. Different types of lakes may also have
different impacts on their downstream lakes. A
seepage lake has no or little downstream phosphorus
loss through surface runoff. Therefore, we expect that
seepage lakes would retain phosphorus more effec-
tively than drainage lakes. If a focal lake has a seepage
lake within its catchment, the focal lake’s phosphorus
loading should be less than if there was a drainage lake
upstream or no lake upstream. However, because
seepage lakes usually retrain both more water and
more phosphorus than drainage lakes, the phosphorus
a b
dc
Fig. 5 Comparisons between two different landscapes: a
landscape with wetlands as in the calibration dataset (X axis)
and a simulated landscape in which wetlands have been
converted to forested land (Y axis) for lake phosphorus loads
(a), lake annual inflow (b), lake hydraulic residence time (c),
and lake phosphorus concentration (d). Each data point is a lake.
The solid lines are 1:1 lines. In the converted landscape, the lake
phosphorus concentration is decreased despite the loading
increases in most cases
1026 Landscape Ecol (2012) 27:1015–1030
123
concentration of the focal lake with a seepage lake in
its catchment would not necessarily be lower than the
same focal lake with a drainage lake upstream.
Effects of upstream wetlands on lake phosphorus
concentrations
In our modeling scenario, wetlands had a complex role
in altering lake phosphorus concentrations. The sim-
ulation results of our flow-path attenuation model
imply that wetlands have three main effects on lake
phosphorus concentrations. First, wetlands can retain a
large amount of phosphorus from their inflow water
(Fig. 5a), as reviewed by Johnston (1991), Reddy et al.
(1999), and Fisher and Acreman (2004). Second,
wetlands can retain a large amount of their inflowing
water (Fig. 5b), which also has been demonstrated
with field studies quantifying water yield from wet-
lands. For example, studies have found that during
spring, wetlands may yield less runoff than upland
cover types because of their large hydraulic storage
capacity, extensive evapotranspiration of plants, or
other factors (Taylor and Pierson 1985; Devito 1997;
Tompkins et al. 1997; Smerdon et al. 2007). Third,
because of wetlands’ effects of reducing water inflow
to downstream lakes, upstream wetlands can increase
the hydraulic residence time in downstream lakes
(Fig. 5c) and thus result in more phosphorus being
retained in lakes. Among these three effects, the
effects of retaining phosphorus in wetlands and
increasing the residence time in downstream lakes
tend to reduce lake phosphorus concentration, whereas
the mechanism of retaining water in wetlands tends to
increase the lake phosphorus concentration.
Whether the overall effect of wetlands is to increase
or decrease lake phosphorus concentration depends on
the relative magnitude of the above three effects under
the specific landscape setting of the lake catchment.
Our flow-path attenuation model suggests that at the
scale of a flow-path cell-series, the water reduction
effect of wetland cells should exceed their phosphorus
retention effect and thus predicts that the presence of
wetland cells will result in higher phosphorus con-
centration at the end of the flow-path (Fig. 4b). Similar
patterns have been found in field studies of wetlands
(e.g., Kadlec and Bevis 1990; White and Bayley
2001). In our model, this effect of wetlands makes the
phosphorus concentrations lower for most lakes in the
simulated landscape with wetlands converted to
forested land (Fig. 5d). However, in that simulation,
there were a few lakes whose predicted phosphorus
concentrations were higher than those in the uncon-
verted landscape (Fig. 5d). The increased hydraulic
residence time mentioned above may have offset the
increase of phosphorus concentration in the wet-
land-related flow-paths in these cases. The specific
landscape composition and configuration of the
catchments may be another factor mediating wetland
effects on downstream lake phosphorus concentra-
tions. For example, Woltemade (2000) found that the
performance of constructed wetlands that receive crop
field drainage water varied considerably with the
wetland size relative to the drainage area and the
wetland location in the focal lake catchment. In
addition, Prepas et al. (2001) found that in wetland-
dominated catchments, lake phosphorus concentration
was positively correlated with percent wetland cover
in the catchment whereas in upland-dominated catch-
ments there was no such relationship between percent
wetland cover and lake phosphorus concentrations.
The complex effects of wetlands described above
may help explain two paradoxes that exist in the
literature. The first is the varied response of phospho-
rus concentrations within wetlands. High phosphorus
concentrations usually have been found to decline
within constructed treatment wetlands along the flow
direction, but increased phosphorus concentrations
have also been observed in some wetlands and in some
seasons or for some phosphorus forms (e.g., Kadlec
and Bevis 1990; White and Bayley 2001; Ontkean
et al. 2003; Reinhardt et al. 2005). This inconsistency
may be due to differences in inflow phosphorus
concentrations between constructed treatment wet-
lands and natural headwater wetlands. When inflow
phosphorus concentration of a wetland is very high, it
is likely that the wetland’s effect on phosphorus
retention exceeds its effect on consuming water and
thus makes the phosphorus concentration lower at the
outlet of wetland. It is also possible that other factors
such as internal loading may contribute to the increase
of phosphorus concentration in some wetlands.
Second, although wetlands often remove phospho-
rus, the percent wetland in the catchment and lake
phosphorus concentrations are sometimes paradoxi-
cally positively correlated (e.g., Detenbeck et al. 1993;
Devito et al. 2000; Prepas et al. 2001; Zedler 2003;
Verhoeven et al. 2006; Fergus et al.. 2011). In this
study, we also observed a positive correlation between
Landscape Ecol (2012) 27:1015–1030 1027
123
percent wetland and lake phosphorus concentrations
(Zhang, unpublished data). This paradox may be
partly explained by incorporating the effect of water
retention in wetlands. Although wetlands are impor-
tant phosphorus sinks and reduce a large amount of
phosphorus loading for their downstream lakes, our
results imply that their net effect on downstream lake
phosphorus concentrations is more complex due to
their effects on water flow as well. Understanding the
implications of wetlands on downstream lake phos-
phorus concentration requires detailed landscape and
hydrological information about the catchments of
individual wetland units (Tompkins et al. 1997).
Advantages and limitations of our modeling
approach
Although our model results and simulations have
shown some complex effects of upstream lakes and
wetlands on downstream lake phosphorus concentra-
tions, the true effects of these freshwater systems are
much more complex than described above. Our
simulation approaches are highly-simplified and do
not model the actual processes occurring in these
complex ecosystems. For example, we adopted coarse
LULC types to ensure the feasibility of calibration
with our limited sample size. For the same reason, we
did not distinguish among different wetland types
which may have different hydrological and biochem-
ical functions in nutrient loading. We assumed that
phosphorus export and water yield were both linearly
correlated with precipitation. In addition, we were not
able to include a wide range of factors that could
potentially affect the production and transportation of
phosphorus and water, such as catchment slope, soil,
vegetation, livestock, geology, and groundwater char-
acteristics. The lake phosphorus retention module
(Vollenweider model) was also a highly-simplified
model that does not consider many specific factors in
lake phosphorus dynamics (such as wind, temperature,
and lake profile). All of these limitations affect the
performance of our models and contribute to the
moderate predicative power we attained. Finally,
because there are no measurement of phosphorus
loads and lake inflow, we had to simultaneously fit the
three modules (phosphorus loading to lakes, water
inflow to lakes, and lake phosphorus retention). Thus,
there was no chance to evaluate the performance of the
modules individually.
Despite the limitations mentioned above, our flow-
path attenuation model can be used to provide insights
into the spatially-explicit modeling of nonpoint source
pollution to lakes. This model is located at an
intermediate level of complexity between simple
regression models and complex process-based models,
and we show that the effects of upstream lakes and
wetlands are fairly complex but potentially predict-
able, and should be studied further. When exploring
the relationship between catchment LULC character-
istics and nutrient loading in waterbodies, such models
may prove to be useful prior to engaging in exhaustive,
process-based modeling (Baker et al. 2006).
Empirical modeling has been found to be a useful
method to study the roles of landscape composition
and configuration patterns in nonpoint source nutrient
loading (e.g., Johnson et al. 2001; Jones et al. 2001;
Smith et al. 2003b; Weller et al. 2003; Cifaldi et al.
2004; Soranno et al. 2008; Gemesi et al. 2011; Fergus
et al. 2011). However, consideration of more theoret-
ical simulation-type models such as ours has the
potential to serve as another way to study the
importance of spatial configuration and composition
on ecosystem processes such as nutrient dynamics
(e.g., Levine 1992; Hunsaker and Levine 1995;
Soranno et al. 1996; Weller et al. 1998; Giasson
et al. 2002; Canham et al. 2004; Gergel 2005; Zhang
2011). These studies on landscape-scale nutrient
dynamics have shed light on the possibility of
exploring and testing the relationships among specific
landscape metrics and nutrient loading through sim-
ulations of simple theoretical models. Coupling the
two approaches should further our understanding
about these relationships. On one hand, patterns
observed in model simulation results can facilitate
the design of new landscape metrics that can be
applied broadly. On the other hand, the landscape
metrics that have been identified to govern nutrient
loading in an empirical study can be further verified in
models such as ours by comparing their roles on
nutrient loading in different simulated scenarios.
Acknowledgments Financial support for this work was
provided by the Center for Water Sciences at Michigan State
University (MSU). We thank Katie Droscha for assembling the
lake nutrient and LULC datasets, and C. Emi Fergus for help
with the literature related to wetland effects and comments on
earlier drafts. Thanks to Sarah AcMoody, Justin Booth, and
Dave Lusch at MSU’s Remote Sensing and GIS Outreach and
Research Services for consultation and creation of some of the
1028 Landscape Ecol (2012) 27:1015–1030
123
databases used in this study as well as for catchment delineations
and LULC summaries. We also thank the anonymous reviewers
for their valuable comments and suggestions.
References
Abu-Zreig M, Rudra RP, Whiteley HR, Lalonde MN, Kaushik
NK (2003) Phosphorus removal in vegetated filter strips.
J Environ Qual 32:613–619
Ahlgren I, Frisk T, Kamp-Nielsen L (1988) Empirical and theo-
retical models of phosphorus loading, retention and con-
centration vs. lake trophic state. Hydrobiologia 170:285–303
Alexander RB, Elliott AH, Shankar U, McBride GB (2002)
Estimating the sources and transport of nutrients in the
Waikato River Basin, New Zealand. Water Resour Res
38:1268. doi:10.1029/2001WR000878
Baker LA (1992) Introduction to nonpoint source pollution in the
United States and propects for wetland use. Ecol Eng 1:1–26
Baker ME, Weller DE, Jordan TE (2006) Improved methods for
quantifying potential nutrient interception by riparian
buffers. Landscape Ecol 21:1327–1345
Beckert KA, Fisher TR, O’Neil JM, Jesien RV (2011) Charac-
terization and comparison of stream nutrients, land use, and
loading patterns in Maryland coastal bay watersheds.
Water Air Soil Pollut 221:255–273
Bedford BL, Walbridge MR, Aldous A (1999) Patterns in
nutrient availability and plant diversity of temperate North
American wetlands. Ecology 80:2151–2169
Borah DK, Bera M (2003) Watershed-scale hydrologic and
nonpoint-source pollution models: review of mathematical
bases. Trans ASAE 46:1553–1566
Borah DK, Bera M (2004) Watershed-scale hydrologic and
nonpoint-source pollution models: review of applications.
Trans ASAE 47:789–803
Bouraoui F (1994) Development of a continuous, physically-
based, distributed parameter, nonpoint source model. Vir-
ginia Polytechnic Institute and State University, Dissertation
Bowden WB (1987) The biogeochemistry of nitrogen in fresh-
water wetlands. Biogeochemistry 4:313–348
Brett MT, Benjamin MM (2008) A review and reassessment of
lake phosphorus retention and the nutrient loading concept.
Freshw Biol 53:194–211
Brett MT, Arhonditsis GB, Mueller SE, Hartley DM, Frodge JD,
Funke DE (2005) Non-point-source impacts on stream
nutrient concentrations along a forest to urban gradient.
Environ Manage 35:330–342
Breuer L, Vache KB, Julich S, Frede H-G (2008) Current con-
cepts in nitrogen dynamics for mesoscale catchments.
Hydrol Sci J 53:1059–1074
Bryhn AC, Hakanson L (2007) A comparison of predictive
phosphorus load-concentration models for lakes. Ecosys-
tems 10:1084–1099
Canham CD, Pace ML, Papaik MJ, Primack AGB, Roy KM,
Maranger RJ, Curran RP, Spada DM (2004) A spatially-
explicit watershed-scale analysis of dissolved organic
carbon in Adirondack lakes. Ecol Appl 14:839–854
Cifaldi RL, Allan JD, Duh JD, Brown DG (2004) Spatial pat-
terns in land cover of exurbanizing watersheds in south-
eastern Michigan. Landsc Urban Plan 66:107–123
Detenbeck NE, Johnston CA, Niemi GJ (1993) Wetland effects
on lake water quality in the Minneapolis/St. Paul metro-
politan area. Landscape Ecol 8:39–61
Detenbeck NE, Taylor DL, Lima A, Hagley C (1996) Temporal
and spatial variability in water quality of wetlands in the
Minneapolis/St. Paul, MN metropolitan area: implications
for monitoring strategies and designs. Environ Monit Assess
40:11–40
Devito KJ (1997) Flow reversals in peatlands influenced by
local groundwater systems. Hydrol Process 11:103–110
Devito KJ, Creed IF, Rothwell RL, Prepas EE (2000) Landscape
controls on phosphorus loading to boreal lakes: implica-
tions for the potential impacts of forest harvesting. Can J
Fish Aquat Sci 57:1977–1984
Diebel MW, Maxted JT, Robertson DM, Han S, Vander Zanden
MJ (2009) Landscape planning for agricultural nonpoint
source pollution reduction III: assessing phosphorus and
sediment reduction potential. Environ Manage 43:69–83
Fergus CE, Soranno PA, Spence Cheruvelil K, Bremigan MT
(2011) Multiscale landscape and wetland drivers of lake total
phosphorus and color. Limnol Oceanogr 56: 2127–2146
Fisher J, Acreman MC (2004) Wetland nutrient removal: a
review of the evidence. Hydrol Earth Syst Sci 8:673–685
Fuller LM, Minnerick RJ (2008) State and regional water quality
characteristics and trophic conditions of MI’s inland lakes,
2001–2005. Scientific Investigations Report 2008–5188,
U.S. Geological Survey
Gemesi Z, Downing JA, Cruse RM, Anderson PF (2011) Effects
of watershed configuration and composition on down-
stream lake water quality. J Environ Qual 40:517–527
Gergel SE (2005) Spatial and non-spatial factors: when do they
affect landscape indicators of watershed loading? Land-
scape Ecol 20:177–189
Giasson E, Bryant RB, DeGloria SD (2002) GIS-based spatial
indices for identification of potential phosphorous export at
watershed scale. J Soil Water Conserv 57:373–381
Goodman KJ, Baker MA, Wurtsbaugh WA (2010) Mountain
lakes increase organic matter decomposition rates in
streams. J N Am Benthol Soc 29:521–529
Grayson RB, Moore ID, McMahon TA (1992) Physically based
hydrologic modeling: 2. Is the concept realistic? Water
Resour Res 26:2659–2666
Hunsaker CT, Levine DA (1995) Hierarchical approaches to the
study of water quality in rivers. Bioscience 45:193–203
Imboden DM (1974) Phosphorus model of lake eutrophication.
Limnol Oceanogr 19:297–304
Johnson GD, Myers WL, Patil GP (2001) Predictability of sur-
face water pollution loading in Pennsylvania using water-
shed-based landscape measurements. J Am Water Resour
Assoc 37:821–835
Johnston CA (1991) Sediment and nutrient retention by fresh-
water wetlands: effects on surface water quality. Crit Rev
Environ Sci Technol 21:491–565
Jones KB, Neale AC, Nash MS, Van Remortel RD, Wickham
JD, Riitters KH, O’Neill RV (2001) Predicting nutrient and
sediment loadings to streams from landscape metrics: a
multiple watershed study from the United States Mid-
Atlantic Region. Landscape Ecol 16:301–312
Kadlec RH, Bevis FB (1990) Wetlands and wastewater: Kin-
ross, Michigan. Wetlands 10:77–92
Landscape Ecol (2012) 27:1015–1030 1029
123
Kirkpatrick S, Gelatt CD Jr, Vecchi MP (1983) Optimization by
simulated annealing. Science 220:671–680
Levine DA (1992) A geographic information system approach
to modeling nutrient and sediment transport. Indiana Uni-
versity, Bloomington, Indiana, PhD dissertation
Malmaeus JM, Blenckner T, Markensten H, Persson I (2006)
Lake phosphorus dynamics and climate warming: a
mechanistic model approach. Ecol Model 190:1–14
Marcarelli AM, Wurtsbaugh WA (2007) Effects of upstream
lakes and nutrient limitation on periphytic biomass and
nitrogen fixation in oligotrophic, subalpine streams.
Freshw Biol 52:2211–2225
Moriasi DN, Arnold JG, Van Liew MW, Bingner RL, Harmel
RD, Veith TL (2007) Model evaluation guidelines for
systematic quantification of accuracy in watershed simu-
lations. Trans ASABE 50:885–900
Neff BP, Day SM, Piggott AR, Fuller LM (2005) Base flow in
the Great Lakes Basin. Scientific Investigations Report
2005–5217, U.S. Geological Survey
Ontkean GR, Chanasyk DS, Riemersma S, Bennett DR, Brunen
JM (2003) Enhanced prairie wetland effects on surface
water quality in Crowfoot Creek, Alberta. Water Qual Res
J Can 38:335–359
Powers SM, Johnson RA, Stanley EH (2012) Nutrient retention
and the problem of hydrologic disconnection in streams
and wetlands. Ecosystems. doi:10.1007/s10021-012-9520-8
Prairie YT, Kalff J (1986) Effect of catchment size on phos-
phorus export. Water Resour Bull 22:465–470
Prepas EE, Planas D, Gibson JJ, Vitt DH, Prowse TD, Dinsmore
WP, Halsey LA, McEachern PM, Paquet S, Scrimgeour
GJ, Tonn WM, Paszkowski CA, Wolfstein K (2001)
Landscape variables influencing nutrients and phyto-
plankton communities in Boreal Plain lakes of northern
Alberta: a comparison of wetland- and upland-dominated
catchments. Can J Fish Aquat Sci 58:1286–1299
Reckhow KH, Chapra SC (1983) Engineering approaches for
lake management, volume 1: data analysis and empirical
modeling. Butterworth Publisher, Boston
Reddy KR, DeLaune RD (2008) Biogeochemistry of wetlands:
science and applications, chapter 3: biogeochemical char-
acteristics. CRC Press, Boca Raton, pp 27–65
Reddy KR, Kadlec RH, Flaig E, Gale PM (1999) Phosphorus
retention in streams and wetlands: a review. Crit Rev
Environ Sci Technol 29:83–146
Reinhardt M, Gachter R, Wehrli B, Muller B (2005) Phosphorus
retention in small constructed wetlands treating agricul-
tural drainage water. J Environ Qual 34:1251–1259
Sivapalan M (2003) Prediction in ungauged basins: a grand
challenge for theoretical hydrology. Hydrol Process 17:
3163–3170
Smerdon BD, Mendoza CA, Devito KJ (2007) Simulations of
fully coupled lake-groundwater exchange in a subhumid
climate with an integrated hydrologic model. Water Resour
Res 43:W01416. doi:10.1029/2006WR005137
Smith RA, Alexander RB, Schwarz GE (2003a) Natural back-
ground concentrations of nutrients in streams and rivers of
the conterminous United States. Environ Sci Technol 37:
3039–3047
Smith SV, Swaney DP, Talaue-Mcmanus L, Bartley JD, Sand-
hei PT, McLaughlin CJ, Dupra VC, Crossland CJ, Bud-
demeier RW, Maxwell BA, Wulff F (2003b) Humans,
hydrology, and the distribution of inorganic nutrient
loading to the ocean. Bioscience 53:235–245
Snelder TH, Biggs BJF (2002) Multiscale river environment
classification for water resources management. J Am Water
Resour Assoc 38:1225–1239
Soranno PA, Hubler SL, Carpenter SR, Lathrop RC (1996)
Phosphorus loads to surface waters: a simple model to
account for spatial pattern of land use. Ecol Appl 6:865–878
Soranno PA, Spence Cheruvelil K, Stevenson RJ, Rollins SL,
Holden SW, Heaton S, Torng EK (2008) A framework for
developing ecosystem-specific nutrient criteria: integrating
biological thresholds with predictive modeling. Limnol
Oceanogr 53:773–787
Soranno PA, Spence Cheruvelil K, Webster KE, Bremigan MT,
Wagner T, Stow CA (2010) Using landscape limnology to
classify freshwater ecosystems for multi-ecosystem man-
agement and conservation. Bioscience 60:440–454
Taylor CH, Pierson DC (1985) The effect of a small wetland on
runoff response during spring snowmelt. Atmos Ocean
23:137–154
Tompkins TM, Whipps WW, Manor LJ, Wiley MJ, Radcliffe
CW, Majewski DM (1997) Wetland effects on hydrological
and water quality characteristics of a mid-Michigan river
system. In: Trettin CC, Jurgensen MF, Grigal DF, Gale MR,
Jeglum JK (eds) Northern forested wetlands: ecology and
management. CRC Press, Boca Raton, pp 273–285
Vanni MJ, Renwick WH, Headworth JL, Auch JD, Schaus MH
(2001) Dissolved and particulate nutrient flux from three
adjacent agricultural watersheds: a five-year study. Bio-
geochemistry 54:85–114
Verhoeven JTA, Arheimer B, Yin C, Hefting MM (2006)
Regional and global concerns over wetlands and water
quality. Trends Ecol Evol 21:96–103
Vollenweider RA (1976) Advances in defining critical loading
levels for phosphorus in lake eutrophication. Memorie
dell’Istituto Italiano di Idrobiologia 33:53–83
Wang Y, Choi W (2005) Long-term impacts of land-use change
on non-point source pollutant loads for the St. Louis
metropolitan area, USA. Environ Manage 35:194–205
Weller DE, Jordan TE, Correll DL (1998) Heuristic models for
material discharge from landscapes with riparian buffers.
Ecol Appl 8:1156–1169
Weller DE, Jordan TE, Correll DL, Liu Z (2003) Effects of land-
use change on nutrient discharges from the Patuxent River
Watershed. Estuaries 26:244–266
White JS, Bayley SE (2001) Nutrient retention in a northern prairie
marsh (Frank Lake, Alberta) receiving municipal and agro-
industrial wasterwater. Water Air Soil Pollut 126:63–81
Winter TC (1999) Relation of streams, lakes, and wetlands to
groundwater flow systems. Hydrogeol J 7:28–45
Woltemade CJ (2000) Ability of restored wetlands to reduce
nitrogen and phosphorus concentrations in agricultural
drainage water. J Soil Water Conserv 55:303–309
Zedler JB (2003) Wetlands at your service: reducing impacts of
agriculture at the watershed scale. Front Ecol Environ 1:65–72
Zedler JB, Kercher S (2005) Wetland resources: status, trends,
ecosystem services, and restorability. Ann Rev Environ
Resour 30:39–74
Zhang T (2011) Distance-decay patterns of nutrient loading at
watershed scale: regression modeling with a special spatialaggregation strategy. J Hydrol 402:239–249
1030 Landscape Ecol (2012) 27:1015–1030
123