Embed Size (px)
Citation preview
Evaluating the Agilent 4200 TapeStation System for High Throughput Sequencing Quality Control
Application Note
AuthorsElisa Viering, Laura-Jane Behl, Stefan Pinkert, and Stephan WolfDKFZ Genomics and Proteomics Core Facility, High Throughput Sequencing UnitHeidelberg, Germany
Nucleic Acid Analysis
AbstractThis Application Note demonstrates the data compatibility for the Agilent DNA and RNA ScreenTape assays using the Agilent 4200 TapeStation system and the Agilent 2200 TapeStation system. Data from both systems are highly reproducible and user-independent. In comparison to the 2200 TapeStation system, the 4200 TapeStation system further reduces hands-on-time, allowing the analysis of 96 samples without manual intervention, an important requirement for high throughput users such as the Genomics and Proteomics Core Facility of the German Cancer Research Center (DKFZ).
2
ExperimentalMaterialsTwo lymphoblastoid cell line derived genomic DNA (gDNA) samples NA12891 (gDNA sample A) and NA12878 (gDNA sample B) were obtained from the Coriell Institute (Camden, NJ, USA). DNA libraries (DNA samples A to D) were prepared from human gDNA. Ambion Human Liver Total RNA was purchased from ThermoFisher Scientifi c, Inc. (Waltham, MA, USA). The Agilent 2200 TapeStation system (G2965AA), Agilent 4200 TapeStation system (G2991AA), Agilent Genomic DNA ScreenTape (5067-5365), Agilent Genomic DNA Reagents (5067-5366), Agilent D1000 ScreenTape (5067-5582), Agilent D1000 Reagents (5067-5583), Agilent High Sensitivity D1000 ScreenTape (5067-5584), Agilent High Sensitivity D1000 Reagents (5067-5585), Agilent RNA ScreenTape (5067-5576), Agilent RNA ScreenTape Sample Buffer (5067-5577), Agilent RNA ScreenTape Ladder (5067-5578) High Sensitivity RNA ScreenTape (5067-5579), High Sensitivity RNA Sample Buffer (5067-5580), and High Sensitivity RNA ScreenTape Ladder (5067-5581) were obtained from Agilent Technologies (Waldbronn, Germany).
SamplesFour DNA libraries were prepared using the Illumina TruSeq Nano protocol with 100 ng input material and the shearing protocol for 350 bp. The gDNA, DNA libraries, and total RNA samples were diluted as indicated.
DNA and RNA analysisAnalysis of gDNA, DNA libraries, and RNA was performed according to the appropriate ScreenTape Quick Guide1-10 for the 2200 and 4200 TapeStation systems.
The integrity of the DNA and RNA samples is verifi ed with an Agilent 2200 TapeStation system. The 2200 TapeStation system provides DNA and RNA analysis in a 96-well plate format, which can be combined with a liquid handling system for sample preparation. Another advantage of the 2200 TapeStation system is that each sample is analyzed in a discrete gel lane, so that contamination of a single sample does not affect subsequent samples. However, the tips and the ScreenTape device need to be exchanged after 16 samples, requiring manual intervention every 15 to 20 minutes.
The Agilent 4200 TapeStation system is designed to reduce hands-on-time, analyzing 96 samples without manual intervention, providing a major benefi t for laboratories focused on high sample throughput.
This Application Note evaluates the performance of the Agilent 4200 TapeStation system in comparison with the existing 2200 TapeStation system using the four major assays in QC during the library preparation workfl ow:
• Agilent Genomic DNA assay
• Agilent D1000 assay
• Agilent High Sensitivity D1000 assay
• Agilent RNA ScreenTape assay
In addition, reproducibility between repeated runs and different users was investigated.
IntroductionThe German Cancer Research Center (DKFZ) is the largest biomedical research institution in Germany. The High Throughput Sequencing Unit of the DKFZ Genomics and Proteomics Core Facility provides sequencing services to national and international cancer genome projects for multiple applications such as whole genome or targeted resequencing. To ensure the experimental success of sequencing experiments, quality control (QC) of DNA or RNA samples at various stages of the Next Generation Sequencing (NGS) workfl ow is mandatory. The facility is working in a high throughput environment running 10,000 to 16,000 sequencing reactions per year from various biological sources. The sequencing core facility subjects the received DNA or RNA samples to an incoming QC, prepares the libraries including additional QC steps, and performs the sequencing, followed by the fi nal data QC.
The quantifi cation of DNA or RNA samples at the sequencing core facility is currently performed using the Qubit assay based on fl uorescence detection with a microplate reader capable of analyzing 96 samples at once. Data are then automatically transferred into a data management system for analysis.
3
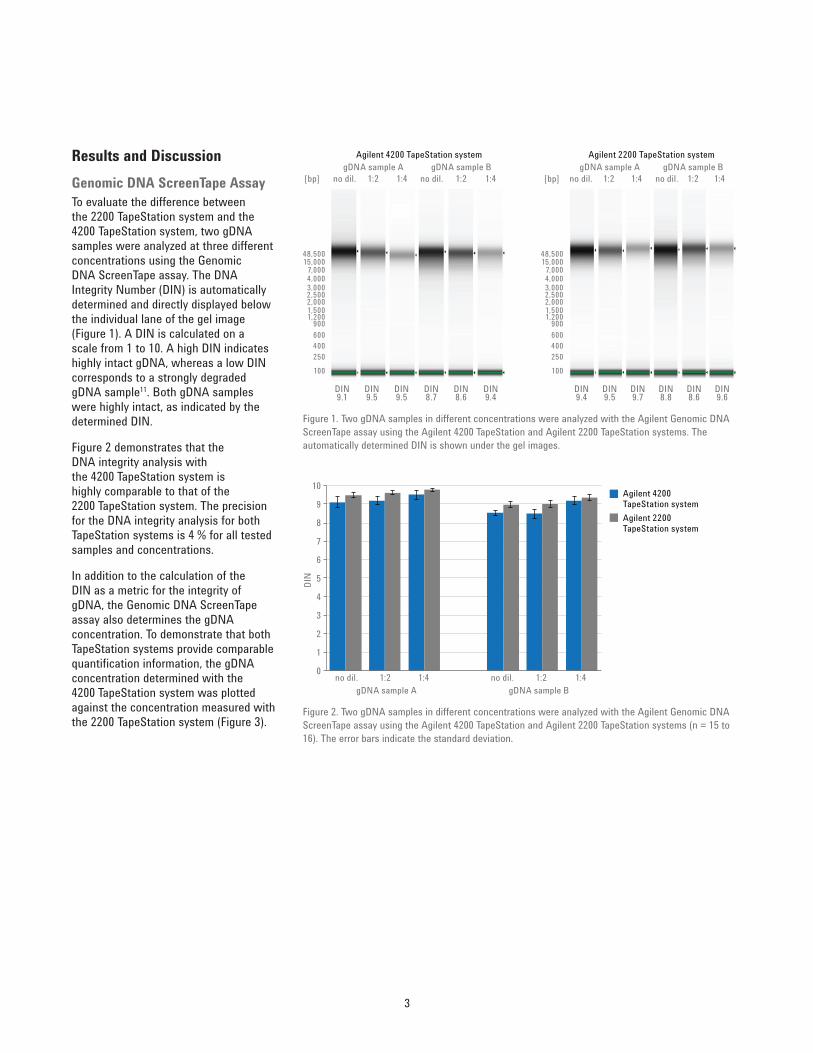
Results and DiscussionGenomic DNA ScreenTape AssayTo evaluate the difference between the 2200 TapeStation system and the 4200 TapeStation system, two gDNA samples were analyzed at three different concentrations using the Genomic DNA ScreenTape assay. The DNA Integrity Number (DIN) is automatically determined and directly displayed below the individual lane of the gel image (Figure 1). A DIN is calculated on a scale from 1 to 10. A high DIN indicates highly intact gDNA, whereas a low DIN corresponds to a strongly degraded gDNA sample11. Both gDNA samples were highly intact, as indicated by the determined DIN.
Figure 2 demonstrates that the DNA integrity analysis with the 4200 TapeStation system is highly comparable to that of the 2200 TapeStation system. The precision for the DNA integrity analysis for both TapeStation systems is 4 % for all tested samples and concentrations.
In addition to the calculation of the DIN as a metric for the integrity of gDNA, the Genomic DNA ScreenTape assay also determines the gDNA concentration. To demonstrate that both TapeStation systems provide comparable quantifi cation information, the gDNA concentration determined with the 4200 TapeStation system was plotted against the concentration measured with the 2200 TapeStation system (Figure 3).
Figure 1. Two gDNA samples in different concentrations were analyzed with the Agilent Genomic DNA ScreenTape assay using the Agilent 4200 TapeStation and Agilent 2200 TapeStation systems. The automatically determined DIN is shown under the gel images.
no dil.
DIN9.1
DIN9.5
DIN9.5
DIN8.7
DIN8.6
DIN9.4
DIN9.4
DIN9.5
DIN9.7
DIN8.8
DIN8.6
DIN9.6
1:2[bp]
48,50015,000
7,0004,0003,0002,5002,0001,5001,200
900600400250100
48,50015,000
7,0004,0003,0002,5002,0001,5001,200
900600400250100
[bp]1:4 no dil. 1:2 1:4
Agilent 4200 TapeStation system Agilent 2200 TapeStation systemgDNA sample A gDNA sample B
no dil. 1:2 1:4 no dil. 1:2 1:4gDNA sample A gDNA sample B
Figure 2. Two gDNA samples in different concentrations were analyzed with the Agilent Genomic DNA ScreenTape assay using the Agilent 4200 TapeStation and Agilent 2200 TapeStation systems (n = 15 to 16). The error bars indicate the standard deviation.
0
1
2
3
4
5
6
7
8
9
10
no dil. 1:2 1:4 no dil. 1:2 1:4
DIN
Agilent 4200 TapeStation systemAgilent 2200 TapeStation system
gDNA sample A gDNA sample B
4
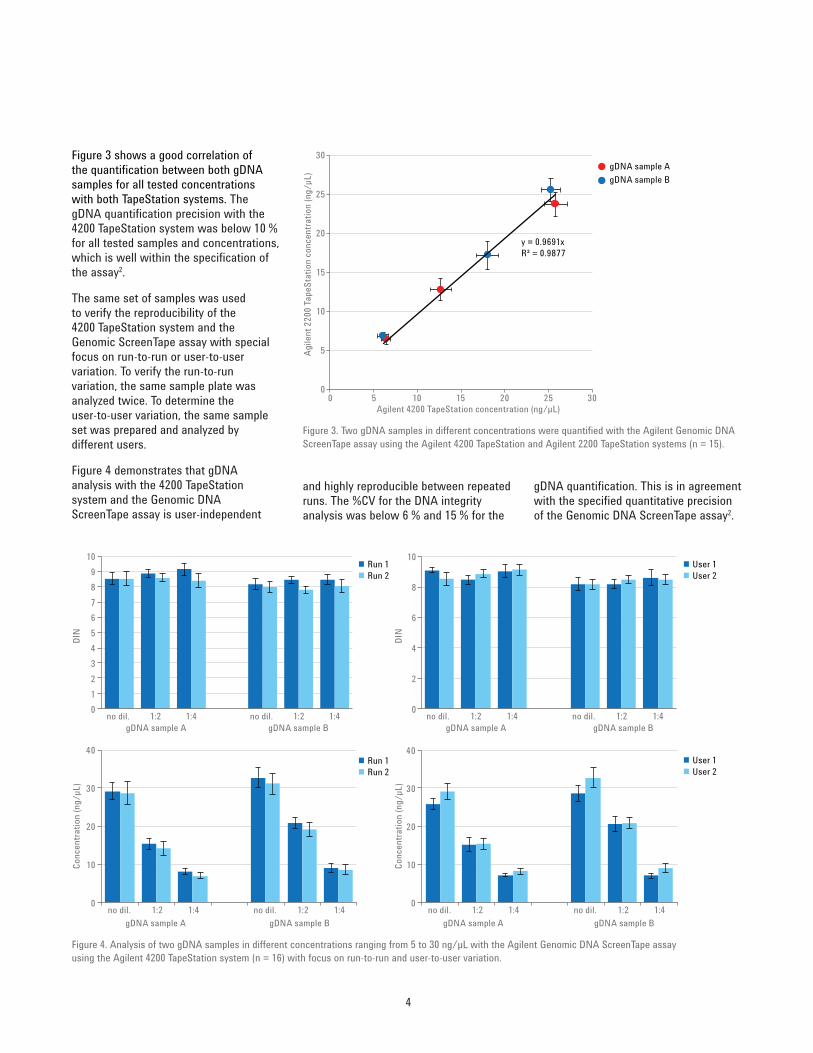
Figure 3 shows a good correlation of the quantifi cation between both gDNA samples for all tested concentrations with both TapeStation systems. The gDNA quantifi cation precision with the 4200 TapeStation system was below 10 % for all tested samples and concentrations, which is well within the specifi cation of the assay2.
The same set of samples was used to verify the reproducibility of the 4200 TapeStation system and the Genomic ScreenTape assay with special focus on run-to-run or user-to-user variation. To verify the run-to-run variation, the same sample plate was analyzed twice. To determine the user-to-user variation, the same sample set was prepared and analyzed by different users.
Figure 4 demonstrates that gDNA analysis with the 4200 TapeStation system and the Genomic DNA ScreenTape assay is user-independent
y = 0.9691xR² = 0.9877
0
5
10
15
20
25
30
0 5 10 15 20 25 30
Agile
nt 2
200 T
apeS
tatio
n co
ncen
tratio
n (n
g/µL
)
Agilent 4200 TapeStation concentration (ng/µL)
gDNA sample AgDNA sample B
Figure 3. Two gDNA samples in different concentrations were quantifi ed with the Agilent Genomic DNA ScreenTape assay using the Agilent 4200 TapeStation and Agilent 2200 TapeStation systems (n = 15).
Figure 4. Analysis of two gDNA samples in different concentrations ranging from 5 to 30 ng/µL with the Agilent Genomic DNA ScreenTape assay using the Agilent 4200 TapeStation system (n = 16) with focus on run-to-run and user-to-user variation.
0
2
4
6
8
10
no dil. 1:2 1:4 no dil. 1:2 1:4
DIN
gDNA sample A gDNA sample B
0123456789
10
no dil. 1:2 1:4 no dil. 1:2 1:4
DIN
gDNA sample A gDNA sample B
0
10
20
30
40
no dil. 1:2 1:4 no dil. 1:2 1:4gDNA sample A gDNA sample B
0
10
20
30
40
no dil. 1:2 1:4 no dil. 1:2 1:4
Conc
entra
tion
(ng/
µL)
Conc
entra
tion
(ng/
µL)
Run 1Run 2
User 1User 2
User 1User 2
Run 1Run 2
gDNA sample A gDNA sample B
and highly reproducible between repeated runs. The %CV for the DNA integrity analysis was below 6 % and 15 % for the
gDNA quantifi cation. This is in agreement with the specifi ed quantitative precision of the Genomic DNA ScreenTape assay2.
5
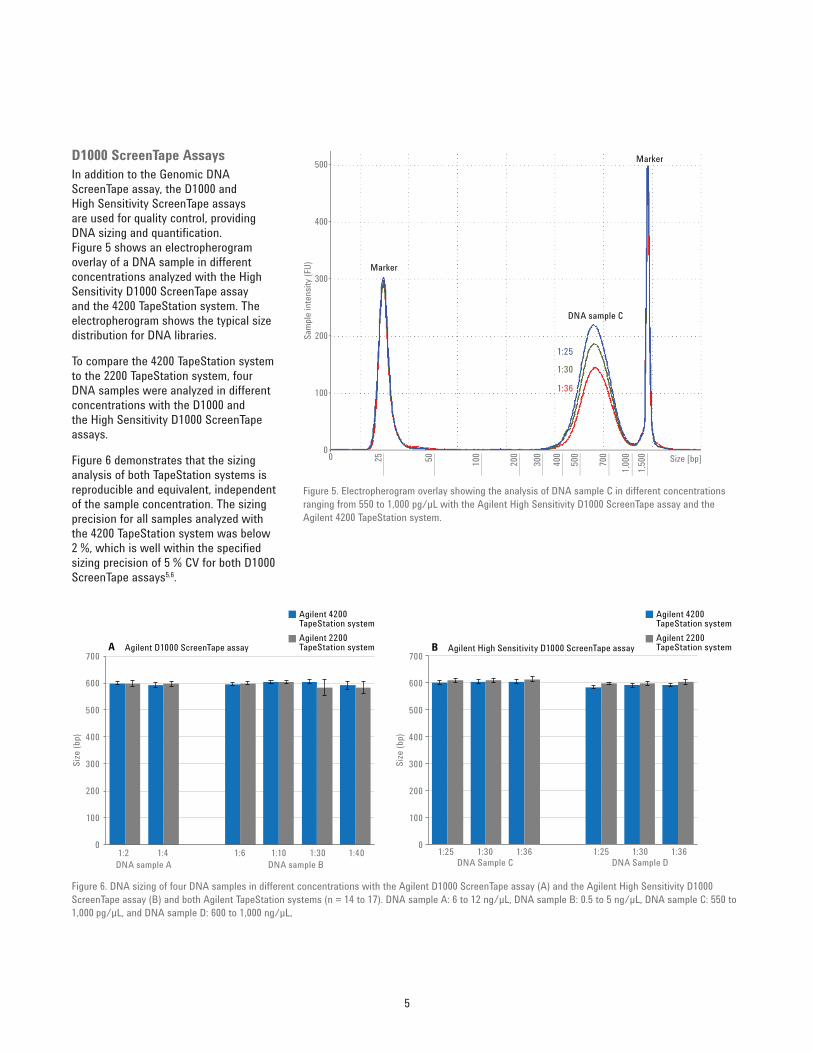
D1000 ScreenTape AssaysIn addition to the Genomic DNA ScreenTape assay, the D1000 and High Sensitivity ScreenTape assays are used for quality control, providing DNA sizing and quantifi cation. Figure 5 shows an electropherogram overlay of a DNA sample in different concentrations analyzed with the High Sensitivity D1000 ScreenTape assay and the 4200 TapeStation system. The electropherogram shows the typical size distribution for DNA libraries.
To compare the 4200 TapeStation system to the 2200 TapeStation system, four DNA samples were analyzed in different concentrations with the D1000 and the High Sensitivity D1000 ScreenTape assays.
Figure 6 demonstrates that the sizing analysis of both TapeStation systems is reproducible and equivalent, independent of the sample concentration. The sizing precision for all samples analyzed with the 4200 TapeStation system was below 2 %, which is well within the specifi ed sizing precision of 5 % CV for both D1000 ScreenTape assays5,6.
Figure 5. Electropherogram overlay showing the analysis of DNA sample C in different concentrations ranging from 550 to 1,000 pg/µL with the Agilent High Sensitivity D1000 ScreenTape assay and the Agilent 4200 TapeStation system.
Marker
Marker
DNA sample C
1:25
1:30
1:36
00
10025 50 100
200
300
400
500
700
1,000
1,500
200
300
400
500
Sam
ple in
tens
ity (F
U)
Size [bp]
Agilent D1000 ScreenTape assay
0
100
200
300
400
500
600
700
1:2 1:4 1:6 1:10 1:30 1:40
Size
(bp)
Agilent 4200 TapeStation systemAgilent 2200 TapeStation system
Agilent 4200 TapeStation systemAgilent 2200 TapeStation system
DNA sample A DNA sample B
Agilent High Sensitivity D1000 ScreenTape assayBA
0
100
200
300
400
500
600
700
1:25 1:30 1:36 1:25 1:30 1:36
Size
(bp)
DNA Sample C DNA Sample D
Figure 6. DNA sizing of four DNA samples in different concentrations with the Agilent D1000 ScreenTape assay (A) and the Agilent High Sensitivity D1000 ScreenTape assay (B) and both Agilent TapeStation systems (n = 14 to 17). DNA sample A: 6 to 12 ng/µL, DNA sample B: 0.5 to 5 ng/µL, DNA sample C: 550 to 1,000 pg/µL, and DNA sample D: 600 to 1,000 ng/µL,
6
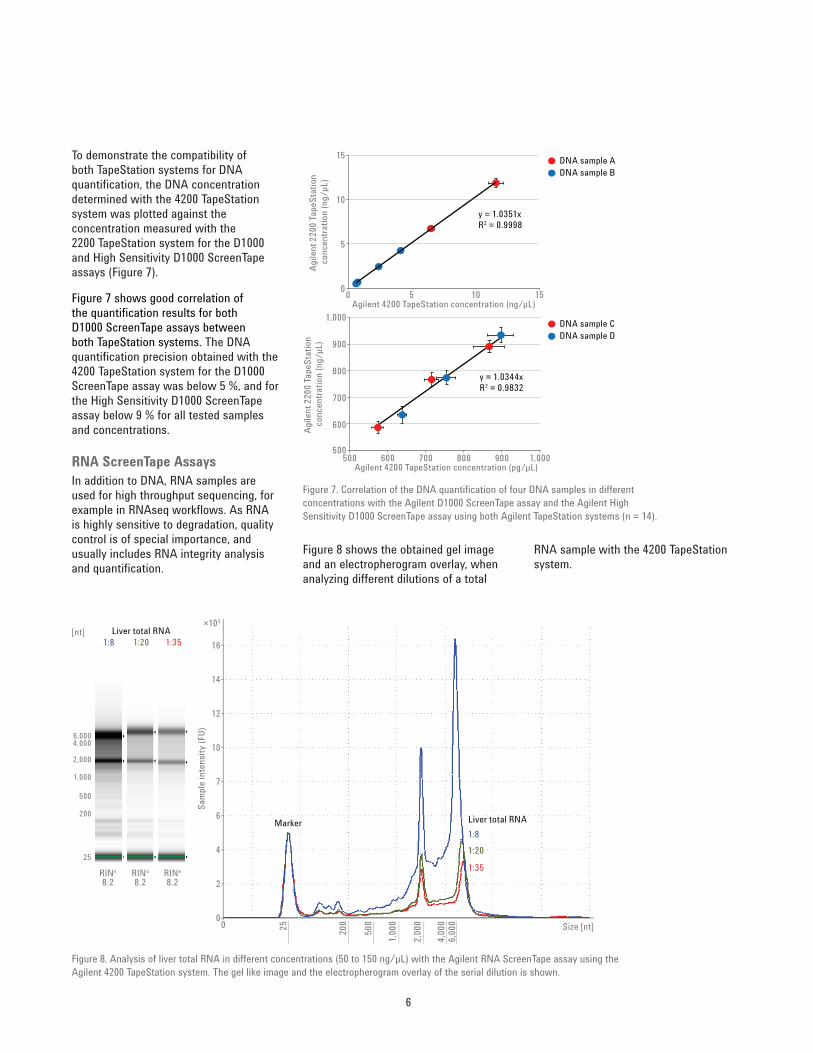
To demonstrate the compatibility of both TapeStation systems for DNA quantifi cation, the DNA concentration determined with the 4200 TapeStation system was plotted against the concentration measured with the 2200 TapeStation system for the D1000 and High Sensitivity D1000 ScreenTape assays (Figure 7).
Figure 7 shows good correlation of the quantifi cation results for both D1000 ScreenTape assays between both TapeStation systems. The DNA quantifi cation precision obtained with the 4200 TapeStation system for the D1000 ScreenTape assay was below 5 %, and for the High Sensitivity D1000 ScreenTape assay below 9 % for all tested samples and concentrations.
RNA ScreenTape AssaysIn addition to DNA, RNA samples are used for high throughput sequencing, for example in RNAseq workfl ows. As RNA is highly sensitive to degradation, quality control is of special importance, and usually includes RNA integrity analysis and quantifi cation.
y = 1.0351xR2 = 0.9998
0
5
10
15
0 5 10 15
Agile
nt 2
200 T
apeS
tatio
n co
ncen
tratio
n (n
g/µL
)
Agilent 4200 TapeStation concentration (ng/µL)
DNA sample ADNA sample B
DNA sample CDNA sample D
y = 1.0344xR2 = 0.9832
500
600
500
Agile
nt 2
200 T
apeS
tatio
n co
ncen
tratio
n (n
g/µL
)
Agilent 4200 TapeStation concentration (pg/µL)600 700 800 900 1,000
700
800
900
1,000
Figure 7. Correlation of the DNA quantifi cation of four DNA samples in different concentrations with the Agilent D1000 ScreenTape assay and the Agilent High Sensitivity D1000 ScreenTape assay using both Agilent TapeStation systems (n = 14).
1:8 1:20 1:35
Marker Liver total RNA
Liver total RNA
RINe
8.2RINe
8.2RINe
8.2
1:81:20
1:35
00
2
4
6
7
10
12
14
16
×103
25 200
500
1,000
Sam
ple
inte
nsity
(FU)
Size [nt]
[nt]
6,0004,000
2,000
1,000
500
200
25
2,00
0
4,00
06,
000
Figure 8. Analysis of liver total RNA in different concentrations (50 to 150 ng/µL) with the Agilent RNA ScreenTape assay using the Agilent 4200 TapeStation system. The gel like image and the electropherogram overlay of the serial dilution is shown.
Figure 8 shows the obtained gel image and an electropherogram overlay, when analyzing different dilutions of a total
RNA sample with the 4200 TapeStation system.
7
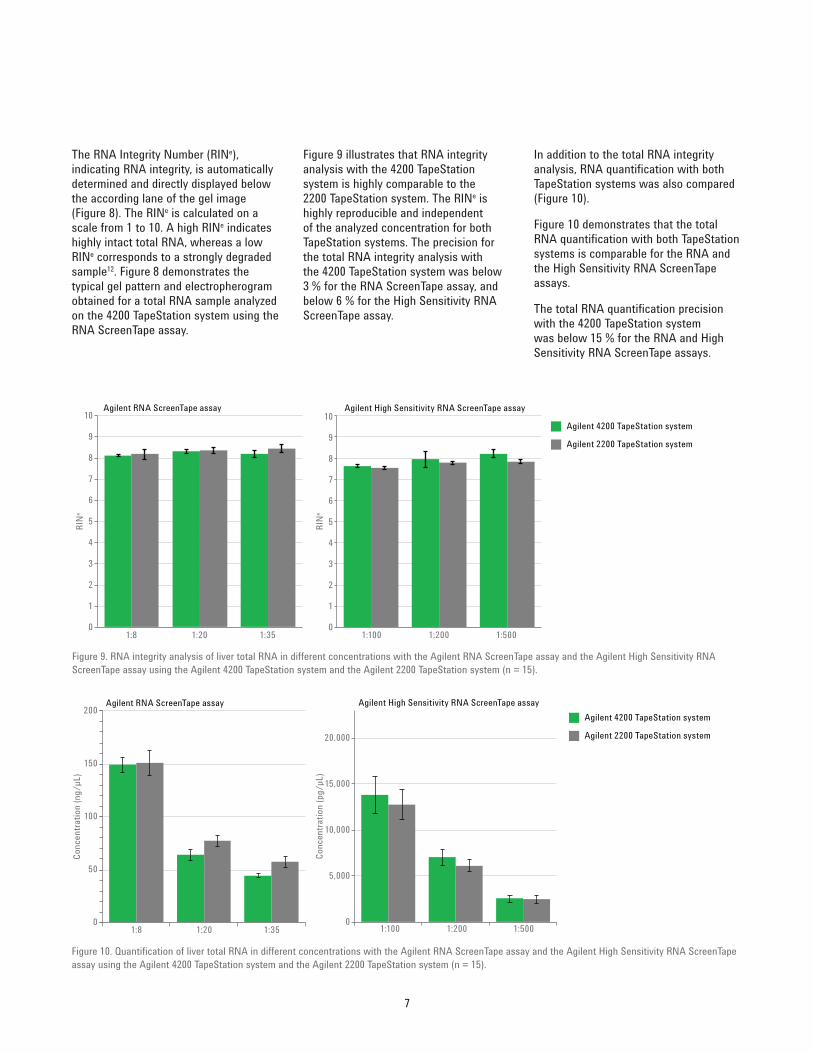
In addition to the total RNA integrity analysis, RNA quantifi cation with both TapeStation systems was also compared (Figure 10).
Figure 10 demonstrates that the total RNA quantifi cation with both TapeStation systems is comparable for the RNA and the High Sensitivity RNA ScreenTape assays.
The total RNA quantifi cation precision with the 4200 TapeStation system was below 15 % for the RNA and High Sensitivity RNA ScreenTape assays.
Figure 9 illustrates that RNA integrity analysis with the 4200 TapeStation system is highly comparable to the 2200 TapeStation system. The RINe is highly reproducible and independent of the analyzed concentration for both TapeStation systems. The precision for the total RNA integrity analysis with the 4200 TapeStation system was below 3 % for the RNA ScreenTape assay, and below 6 % for the High Sensitivity RNA ScreenTape assay.
The RNA Integrity Number (RINe), indicating RNA integrity, is automatically determined and directly displayed below the according lane of the gel image (Figure 8). The RINe is calculated on a scale from 1 to 10. A high RINe indicates highly intact total RNA, whereas a low RINe corresponds to a strongly degraded sample12. Figure 8 demonstrates the typical gel pattern and electropherogram obtained for a total RNA sample analyzed on the 4200 TapeStation system using the RNA ScreenTape assay.
Figure 9. RNA integrity analysis of liver total RNA in different concentrations with the Agilent RNA ScreenTape assay and the Agilent High Sensitivity RNA ScreenTape assay using the Agilent 4200 TapeStation system and the Agilent 2200 TapeStation system (n = 15).
0
1
2
3
4
5
6
7
8
9
10
1:8 1:20 1:35
RINe
RINe
Agilent 4200 TapeStation system
Agilent 2200 TapeStation system
0
1
2
3
4
5
6
7
8
9
10
1:100 1:200 1:500
Agilent RNA ScreenTape assay Agilent High Sensitivity RNA ScreenTape assay
Figure 10. Quantifi cation of liver total RNA in different concentrations with the Agilent RNA ScreenTape assay and the Agilent High Sensitivity RNA ScreenTape assay using the Agilent 4200 TapeStation system and the Agilent 2200 TapeStation system (n = 15).
Agilent 4200 TapeStation system
Agilent 2200 TapeStation system
0
5,000
10,000
15,000
20,000
1:100 1:200 1:500
Conc
entra
tion
(pg/
µL)
0
50
100
150
200
1:8 1:20 1:35
Conc
entra
tion
(ng/
µL)
Agilent RNA ScreenTape assay Agilent High Sensitivity RNA ScreenTape assay
www.agilent.com/genomics/tapestation
For Research Use Only. Not for use in diagnostic procedures.
This information is subject to change without notice.
© Agilent Technologies, Inc., 2016Published in the USA, June 1, 20165991-6892EN
ConclusionThis Application Note demonstrates that the data obtained with the Agilent Genomic DNA assay, Agilent D1000 assay, Agilent High Sensitivity D1000 assay, or Agilent RNA ScreenTape assays using the Agilent 4200 TapeStation system or the Agilent 2200 TapeStation system is directly c omparable, highly reproducible, and user-independent. In comparison to the 2200 TapeStation system, the 4200 TapeStation system further reduces hands-on-time, allowing the analysis of 96 samples without manual intervention. This is a primary requirement in a high throughput environment.
References1. Agilent Genomic DNA
ScreenTape System Quick Guide, Agilent Technologies, publication number G2964-90040 Rev. D, 2015.
2. Agilent Genomic DNA ScreenTape System Quick Guide for 4200 TapeStation System, Agilent Technologies, publication number G2991-90040, 2015.
3. D1000 ScreenTape System Quick Guide, Agilent Technologies, publication number G2964-90032 Rev. D, 2015.
4. High Sensitivity D1000 ScreenTape System Quick Guide, Agilent Technologies, publication number G2964-90131 Rev. D, 2015.
5. D1000 ScreenTape Assay Quick Guide for 4200 TapeStation System, Agilent Technologies, publication number G2991-90030, 2015.
6. High Sensitivity D1000 ScreenTape Assay Quick Guide for 4200 TapeStation System, Agilent Technologies, publication number G2991-90130, 2015.
7. Agilent RNA ScreenTape System Quick Guide, Agilent Technologies, publication number G2964-90022 Rev. D, 2014.
8. Agilent High Sensitivity RNA ScreenTape System Quick Guide, Agilent Technologies, publication number G2964-90121 Rev. D, 2014.
9. Agilent RNA ScreenTape Assay Quick Guide for 4200 TapeStation System, Agilent Technologies, publication number G2991-90020 Rev. B, 2015.
10. Agilent High Sensitivity RNA ScreenTape Assay Quick Guide for 4200 TapeStation System, Agilent Technologies, publication number G2991-90120 Rev. B, 2015.
11. DNA Integrity Number (DIN) with the Agilent 2200 TapeStation System and the Agilent Genomic DNA ScreenTape Assay, Agilent Technologies, publication number 5991-5258EN, 2015.
12. RNA quality control using the Agilent 2200 TapeStation system – Assessment of the RINe quality metric, Agilent Technologies, publication number 5991-0023EN, 2012.