Embed Size (px)
Citation preview
Evaluating Students’ Ability To Integrate Written and Visual Communication Catherine M. Lockwood & Philip J. Gersmehl Technical Report Series No. 15 ♦ 1996 Lillian Bridwell-Bowles, Series Editor

Evaluating Students’ Ability To Integrate Written and Visual Communication Catherine M. Lockwood & Philip J. Gersmehl Technical Report Series No. 15 ♦ 1996 Lillian Bridwell-Bowles, Series Editor Holly Littlefield, Editor
THE CENTER FOR INTERDISCIPLINARY STUDIES OF WRITING UNIVERSITY OF MINNESOTA
227 LIND HALL 207 CHURCH STREET S.E. MINNEAPOLIS, MN 55455
Director: Lillian Bridwell-Bowles, Professor, English Assistant to the Director: Amy De Boer Research Assistants: Reshmi Dutt, Christina Glendenning, Holly Littlefield,
Robert Peterson Policy Board: LisaAlbrecht, Associate Professor, General College; Chris
Anson, Beach, Professor, College of Education and Human Development; Robert L. Brown, Associate Professor, English; Terence Collins, Professor, General College; Ann Hill Duin, Associate Professor, Rhetoric; Toni McNaron, Professor, English; Carol Miller, Associate Professor, American Studies; Robert Scott, Professor, Speech Communication; Billie Wahlstrom, Professor, Rhetoric; Constance Walker, Associate Professor, Curriculum and Instruction.
Copyright © 1996 by The Board of Regents, University of Minnesota
All Rights Reserved
ISBN: 1-881221-29-6
The University of Minnesota is committed to the policy that all personnel shall have equal access to its programs, facilities, and employment without regard to race, color, creed, religion, national origin, sex, age, marital status, disability, public assistance status, veteran status, or sexual orientation.
Preface
As communication becomes more and more technologically advanced, “visual
literacy” -the ability to create graphics and visuals and integrate them with text, becomes
increasingly important. Anyone who has surfed the Net or designed a World Wide Web
page has seen examples of sites that either fail to understand this link or make dynamic
use of it. “Evaluating Students’ Abilities to Integrate Written and Visual
Communication” explores ways to teach students these crucial skills through improved
class assignments. In addition to the main purpose of the study, Gersmehl and
Lockwood’s results will also be useful to faculty members who teach large sections with
teaching assistants. Communication about assignments among the teaching team and
between the team and students is critical in order to insure effective teaching.
Research such as this, together with ongoing Center projects, should result in
improved undergraduate writing, the Center’s primary goal. Along with colloquia,
conferences, publications, and other outreach activities, the Center annually funds
research projects by University of Minnesota faculty who study any of the following
topics:
• characteristics of writing across the University’s curriculum;
• status reports on students’ writing ability and the University;
• the connections between writing and learning in all fields;
• the characteristics of writing beyond the academy;
• the effects of ethnicity, race, class, and gender on writing; and
• curricular reform through writing-intensive instruction.
We are pleased to present this technical report as part of the ongoing discussion about
textual and visual literacy. One of the goals of all Center publications is to encourage
conversations about writing; we invite you to contact the Center about this publication or
other Center publications and activities.
Lillian Bridwell-Bowles, Series Editor Holly Littlefield, Editor
June 1996
Forward
Lack of geographic knowledge and skills has been and continues to be a major
concern of educators at all levels, especially within the last five years. Educators
recognize the need for improved geographic skills among students within the United
States. Several states now require a formal geography course in order to meet high school
graduation requirements. The Minnesota State University System and the University of
Minnesota, as of Fall 1994, require completion of at least one year of high school
geography for entering freshman. A set of national guidelines (Geography for Life) has
been designed for use by teachers, curriculum developers, parents, and business and
policy leaders. These standards were developed through a consensus process by
geographers, with funding from the US Department of Education and the National
Endowment for the Humanities supervised by the National Council for Geographic
Education (NCGE) and completed in 1994-95. Other national and international
geographic educational projects also are being developed. ARGUS (Activities and
Readings in the Geography of the United States), a National Science Foundation (NSF)
funded project supervised by the Association of American Geographers (AAG), is a
multi-disciplinary interactive series of lessons and readings. The intent is to exchange
ARGUS Activities for similar materials from colleagues in Russia and Japan.
Acknowledgements
We appreciate the cooperation of winter and spring Quarters 1993 teaching
assistants: Linda McCarthy, Udeshtra Pillay, Sheila Franco, Deborah Martin, and Stephen
Smela. Margaret Rassmussen, departmental secretary, administered the funds. Carol A.
Gersmehl’s, Thematic maps: Visualizing Patterns (1989), prepared for the Tennessee
Geographic Alliance, was the key source for mapping techniques and data
transformation.
INTRODUCTION
A goal of educators is to improve students’ ability to read and write. We also
expect students to be able to deal with numbers and mathematics. In addition,
geographers expand these expectations to include the ability to excel in graphic
interpretation. Graphics are a powerful means of expressing ideas that text alone may not
adequately convey. Graphics, in the context of geography, are more than simple
illustrations. Geography combines written text with graphic text to explain spatial
relationships. An effective way to portray spatial data is with maps (a graphic language
with its own conventional symbols, grammatical rules, and syntactic overtones).
The ability to use graphics, like the ability to write, is a skill that is essential to
geography and applicable to many disciplines. If information cannot be effectively
expressed, it is useless. Geographic distributions lack interpretive value if not expressed
graphically. This report is a summary of methods and results for developing criteria to
assess students’ ability to integrate written and visual communications, and for creating
guidelines to help teaching assistants with this evaluation in an introductory level
geography course (US & Canada, 3101).
The course is usually offered each quarter, alternating between two highly
qualified professors, Philip Gersmehl and John Fraser Hart. This study, however, is
limited to those classes taught by Professor Philip Gersmehl. Evaluation is for winter and
spring quarters 1993, but comparisons are made to classes from the previous four years
(1989-1993). Professor John Fraser Hart’s classes are used only to show total enrollment
(see Appendix A: Course Statistics, Table 1a). Geography 3101 is a general distribution
2 Lockwood and Gersmehl
course, which also meets the University of Minnesota’s cultural pluralism requirement.
Because Geography of the United States and Canada usually has a large student
enrollment and limited teaching assistant support, techniques that quickly and adequately
assess student performance are necessary.
A secondary and surprising result of this project is the realization of the importance
for clarity of instructions. We assumed that our instructions would be clear and concise
and that students would have little difficulty understanding the instructions, especially
since we were adapting previously used instructions and guidelines. The necessity of
providing precise, clear directions almost overshadowed the importance of our results.
While we devoted some energy to producing guidelines, course objectives, and grading
criteria for teaching assistants, our initial policy was to allow teaching assistants to adopt
course grading guidelines to their perspective teaching styles, while maintaining course
objectives. We discovered that teaching assistants needed specific directions for grading
procedures, student assessment, and coping with each other.
Project Goals and Objectives
Our primary goal is to design and test several alternative methods of providing
instructions to students. Because students’ learning strategies for perceiving and
processing information differ, our focus is on three sensory modes of learning:
touch/feelings or practical application; sight/visual or use of graphics for instruction; and
hearing/listening or verbal instruction. Each of these learner strategies requires a different
form of instruction. Our efforts will be directed toward equally addressing these learning
Evaluating Students’ Ability to Integrate Written and Visual Communications 3
styles and developing a set of instructions that actively integrates learning style with
project objectives.
Our project has two research components to accomplish these tasks. The first is to
determine ways to present instructions so that students clearly understand how to
incorporate spatial ideas and graphical methods into their written arguments. To achieve
this goal, our focus is on three objectives:
• development of a set of criteria that will help us to assess student ability to
integrate written and graphic material for effective communication;
• testing of the clarity of project instructions (written, verbal, and visual) so that
students adequately complete assignments;
• assessment of the applicability of written assignments and students’ success at
integrating text and cartographic interpretation.
The second component is to determine and measure the degree to which students can
integrate written and graphic text. We want students to be able to communicate ideas
about the positions and relationship of things in three-dimensional space. To achieve this
goal, we redesigned project instructions and developed evaluation forms. Our intent is
that students, given a specific set of instructions, should be able to
• understand a vocabulary of graphic terms,
• support graphic analysis through written text,
• effectively communicate ideas by integrating text and cartographic
interpretations.
4 Lockwood and Gersmehl
Learning to interpret maps is similar to learning a language, one with its own set of
conventional symbols, grammatical rules, and syntactic overtones. We expect students to
develop a graphic vocabulary and a set of skills for use in other courses or applied fields of
study. We also expect students to gain alternate perspectives on writing techniques (i.e.,
integration of graphic text with written text).
Teaching assistants have various levels of experience with geography content,
instruction, and methods. Because teaching assistants are instrumental in the learning
process, especially within the context of a large class, an ancillary goal was to develop
grading criteria and guidelines to help Teaching Assistants with their grading and evaluation
of students. By providing guidelines to aid teaching assistants in evaluating student
performance and by improving instructions to students (and providing timely feedback on
their efforts), our intent was to raise the standards of writing and communication, even in a
large class. Therefore, given a set of guidelines and project grading criteria, we expected that
teaching assistants would be able to measure student work, content knowledge, and ability to
apply concepts, and that they would be able to evaluate students’ ability to integrate graphic
text with written text.
COURSE COMPOSITION
Course Description
Geography is a spatial science. Geographers look at why features, places, or people
are in one place and not in another place, and why there are similarities between features,
places, or people. The main objective of Geography 3101 is to introduce students to the
diversity of people and places throughout the United States and Canada. Three concurrent
Evaluating Students’ Ability to Integrate Written and Visual Communications 5
themes that are interwoven within lectures, projects, and short exercises accomplish this
objective through
• images—visual impressions of place,
• analysis—explanation of what is where (concept-based science),
• interpretation—using acquired knowledge and skills to solve problems and
draw conclusions.
Currently, this course requires three projects, each of which includes three to five
pages of text and at least an equal number of maps or graphs. The projects integrate
writing skills with graphic techniques, such as map design (construction, measurement,
scale change), topic selection, choice of appropriate data, and data manipulation.
We use existing projects but modify the instructions to address the three concurrent
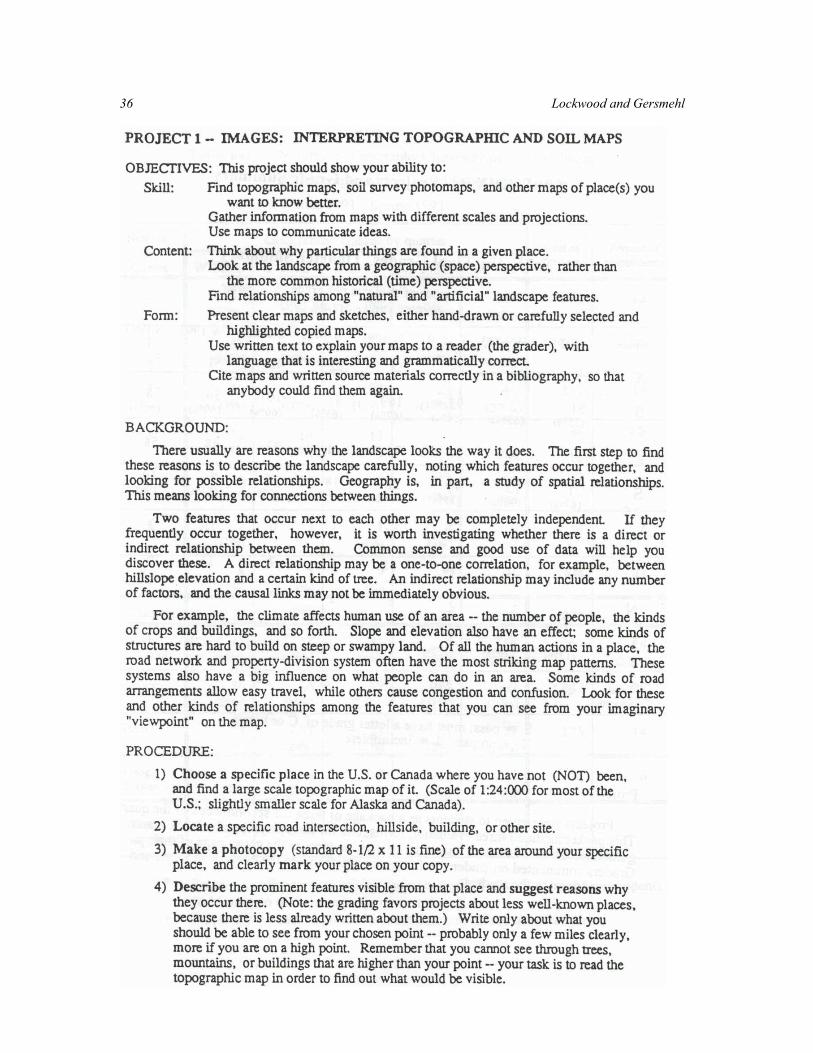
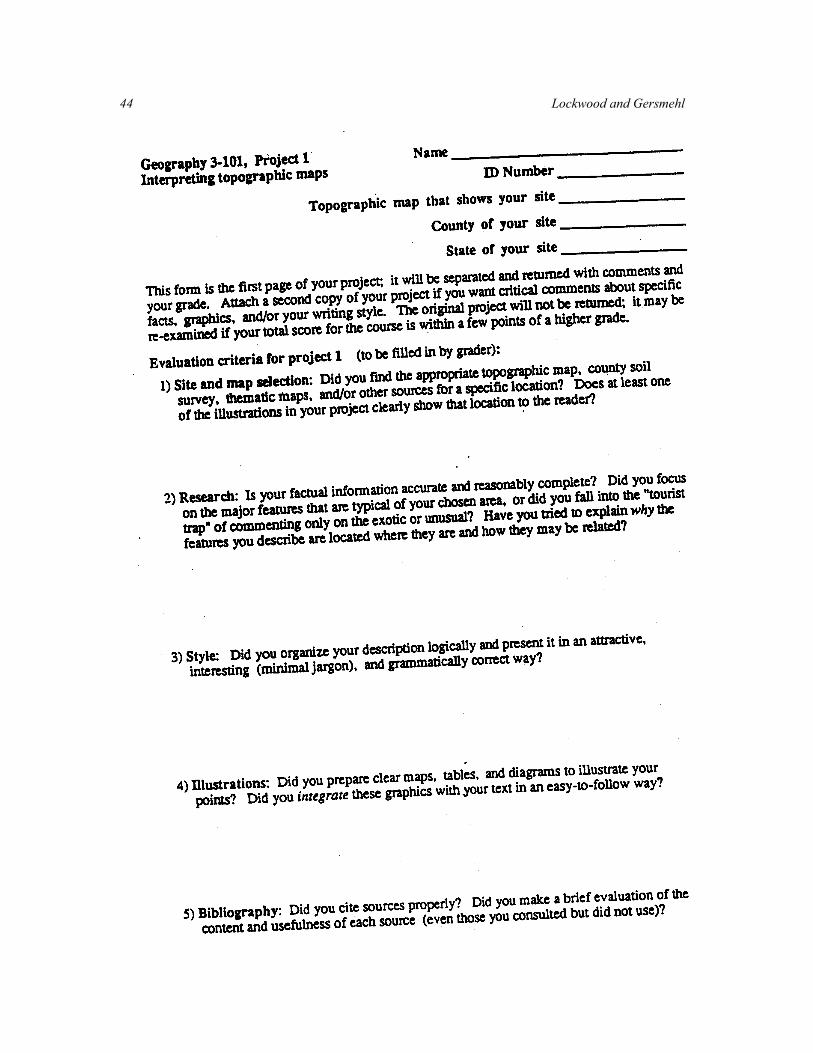
themes and three major learning styles. Project 1, Images: Interpreting Topographic and
Soil Maps, describes an area. Students explore reasons why a landscape looks the way it
does. They describe the landscape, noting which features occur together, looking for
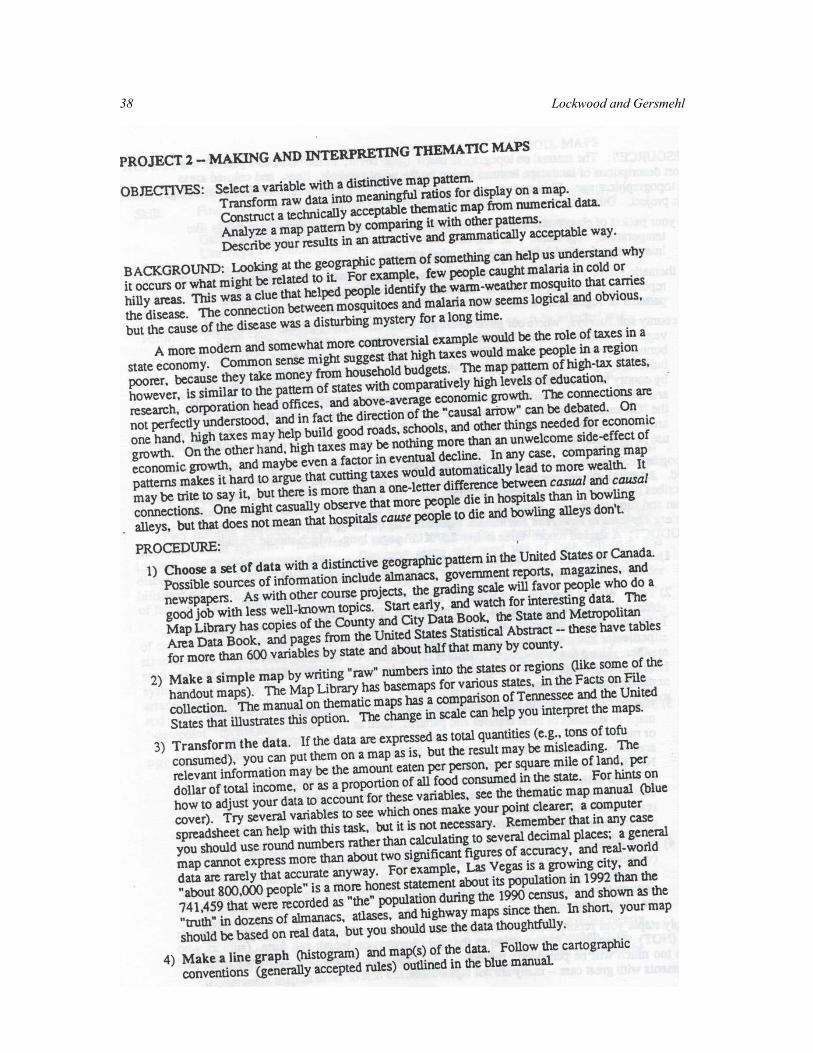
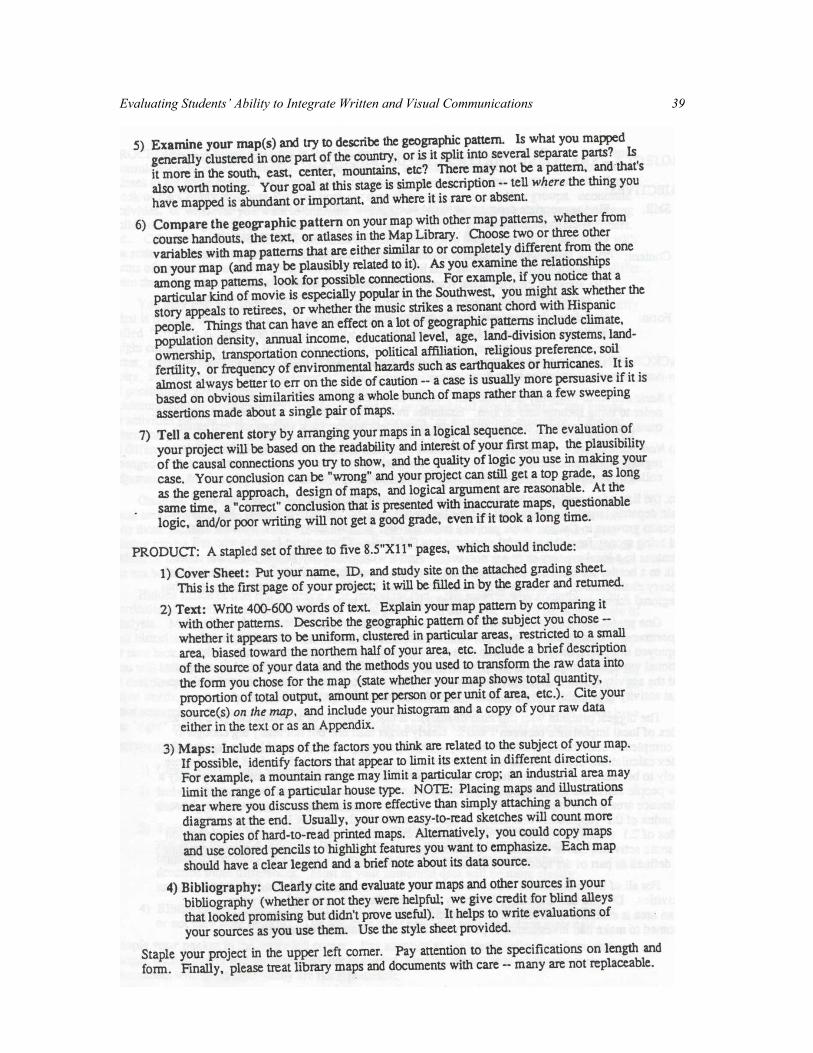
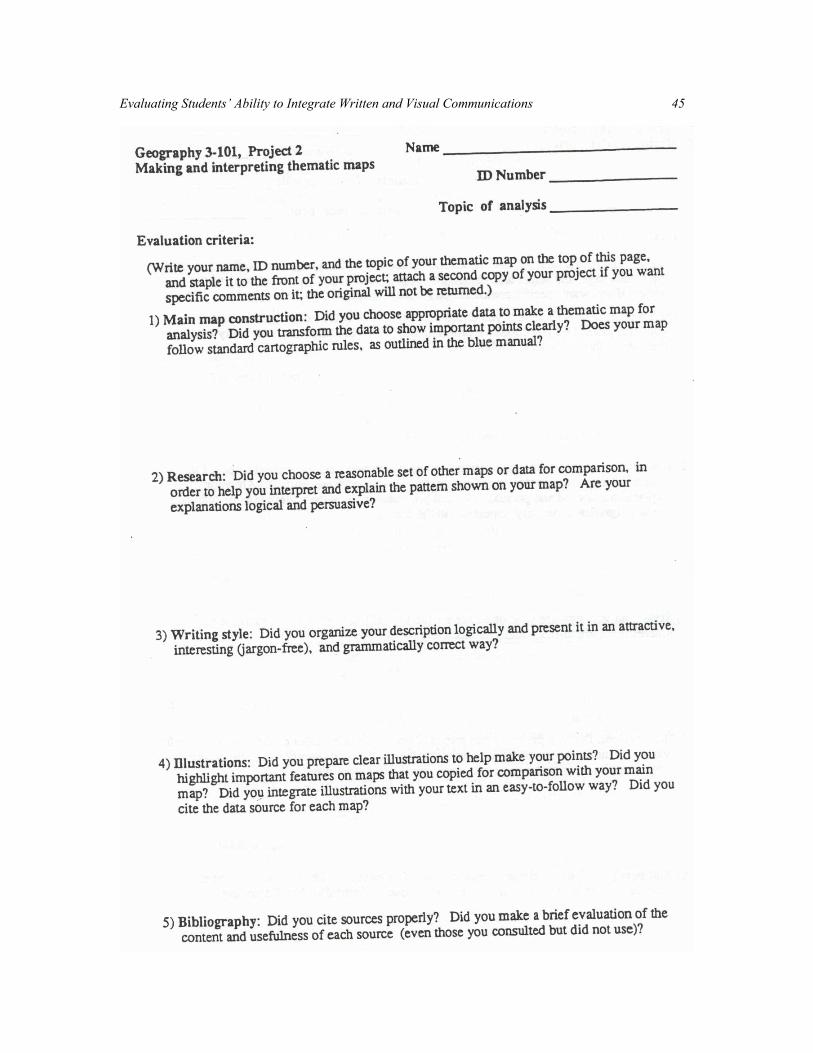
possible relationships. Project 2, Making and Interpreting Thematic Maps, explains
relationships. Students look at the geographic pattern of something to understand its
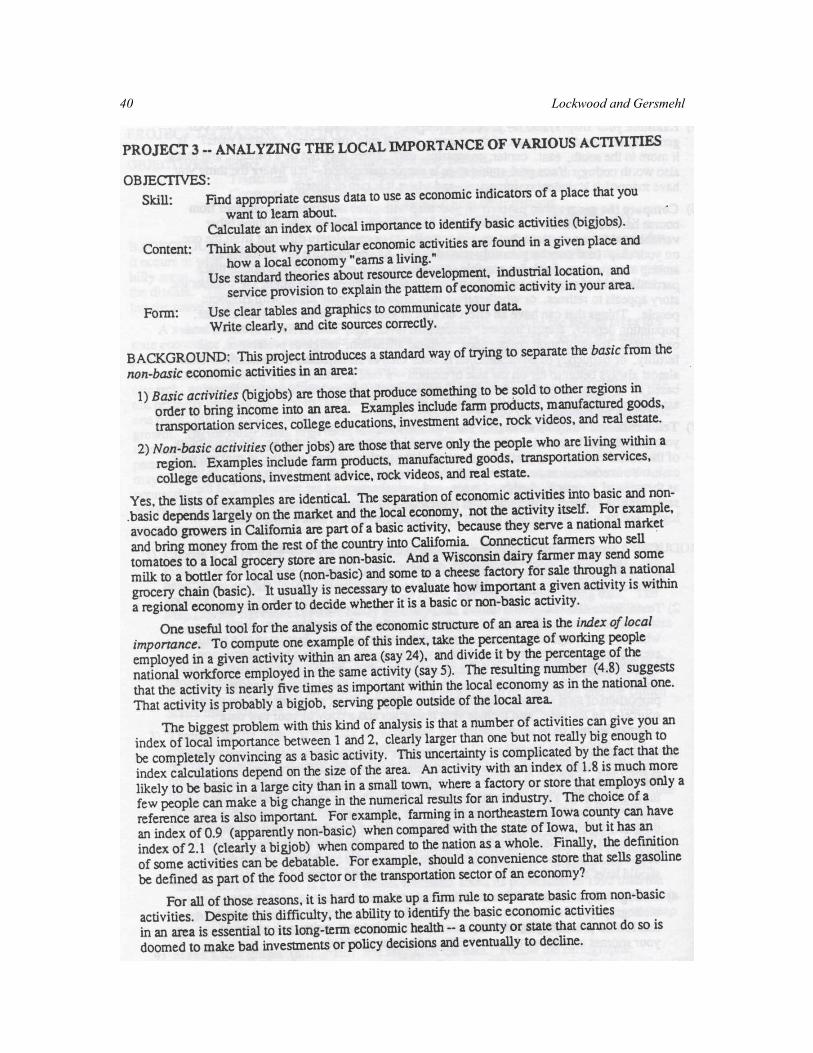
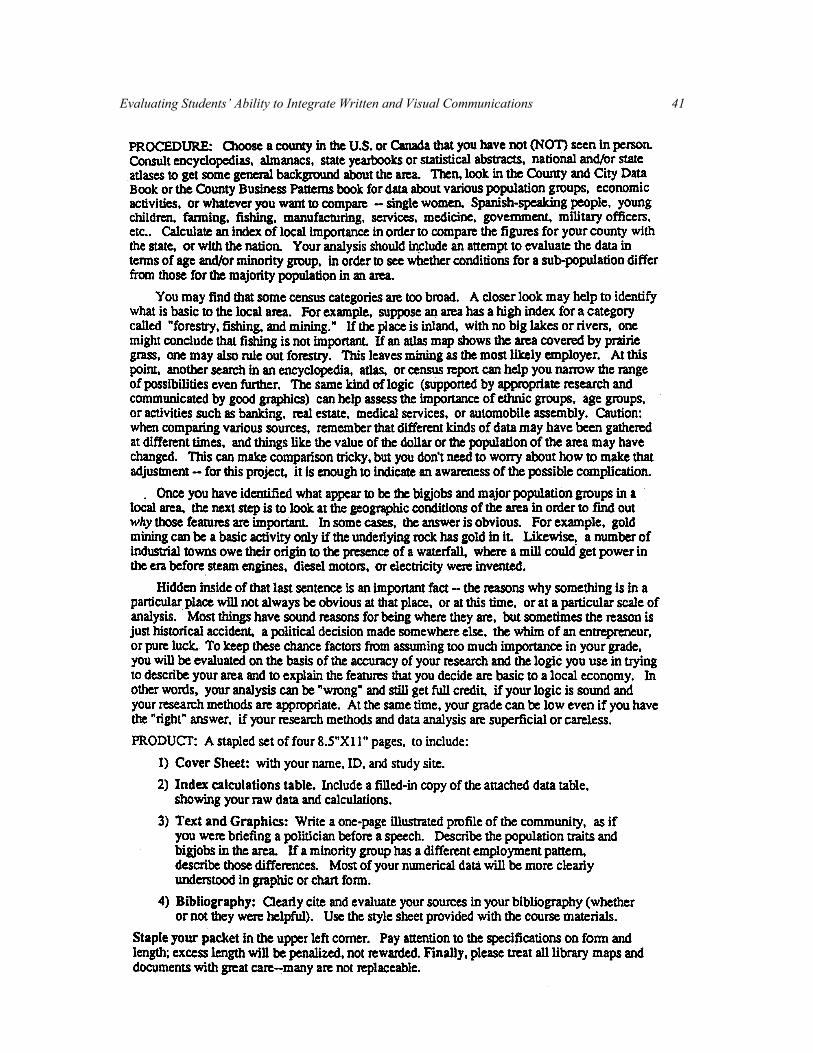
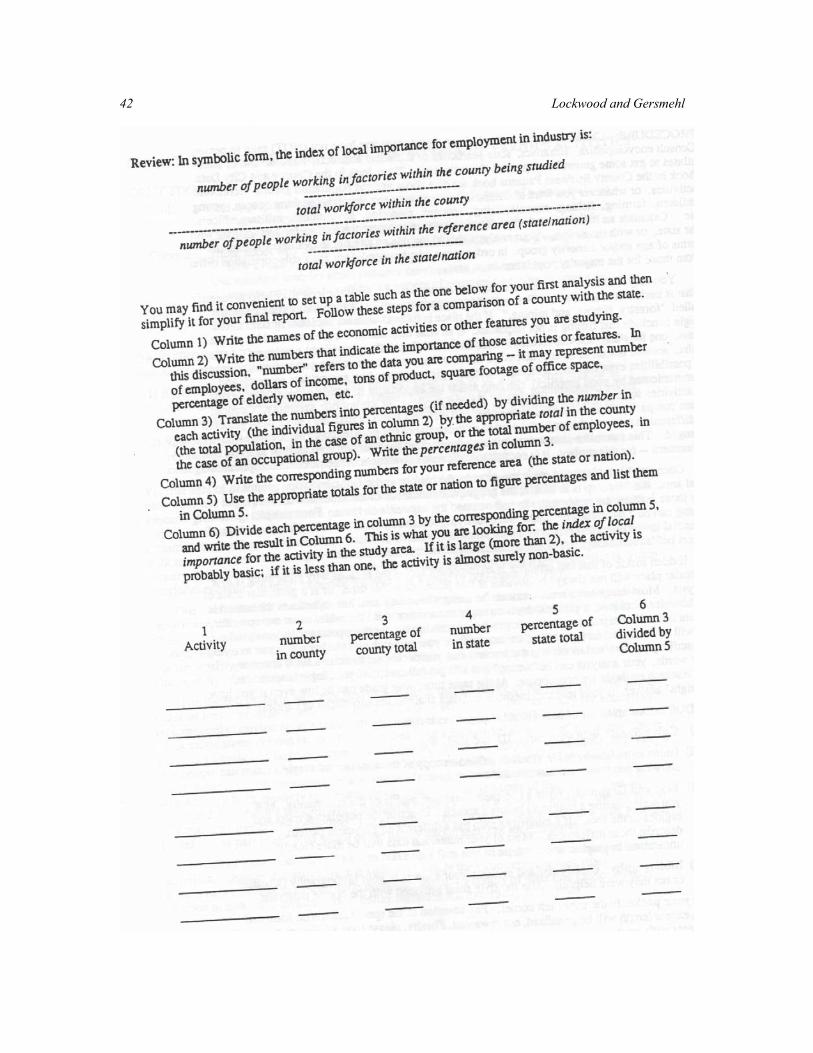
distribution. Project 3, Analyzing the Local Importance of Various Activities, investigates
the economic structure of an area by determining basic and non-basic activities. (See
Appendix B for a detailed description of the three projects.)
Many students have had no previous course in geography and are unfamiliar with its
terminology or how to integrate written text with maps. When students enter this class,
they think “textually”; most of them can put words on paper, but they are not necessarily
6 Lockwood and Gersmehl
able to incorporate spatial ideas or graphical methods of communication into their
arguments. The course projects are intended to develop an ability to read, analyze, and
then explain map patterns through clear, concise written language. Several less intense
exercises using maps and analytical skills also are assigned throughout the quarter. These
self-contained exercises (background information, technique instructions, maps,
application assignment, and answer sheets) are selected ARGUS Activities chosen to
supplement a particular topic or theme not already emphasized in the three projects.
Course Dynamics
An introductory questionnaire (similar to previous quarters) was given to students the
first day of class Winter and Spring Quarters 1993. Students were asked to give specific
information about themselves including class level, major, age, and sex, and to mark
courses previously taken (Appendix A, Course Statistics). This information helped with
evaluating student learning objectives and possible effectiveness of teaching strategies.
The average number of students in Geography of the United States and Canada is
between 175 and 250. The majority of students (60%) are between the ages of 18 and 21;
less than 10% are over the age of thirty (Appendix A, Table 4a). Approximately two-
thirds of the enrollments are juniors or seniors, which is consistent with an upper division
course (Appendix A, Table 5a). Because students are trying to finish general distribution
requirements and to complete requirements for spring graduation, spring quarter usually
has higher enrollment. Although this is an upper division course, Geography 3101 is an
introductory level geography course. Few students are geography majors (less than 10%
per quarter). Before taking Geography 3101, most students have taken fewer than two
Evaluating Students’ Ability to Integrate Written and Visual Communications 7
formal geography courses, either in high school or college, whereas almost every student
has some background in English grammar and technical or creative writing. This most
likely is a reflection of English as a core subject at all levels of education and the
emphasis placed on acquiring written communication skills (Appendix A, Table 6a).
Teaching Assistants
Teaching assistants have various levels of experience with geography content,
instruction, and methods. Because teaching assistants strongly influence the learning
process, an ancillary goal was to develop grading criteria and guidelines to help teaching
assistants with their grading and evaluation of students. By providing guidelines to the
TAs and by improving instructions to students, our intent was to raise the standards of
writing and communication, even in a large class.
Geography of the United States and Canada usually has an enrollment of between
175-250 students (Appendix A, Table 1a). Depending upon enrollment, Geography 3101
usually has between three and five teaching assistants (TAs) with course responsibilities
either divided equally among the TAs or specific areas of interest selected by the TAs.
For example, Winter Quarter TAs chose to grade one project and one short exercise each.
Spring Quarter TAs divided the class into three equal alphabetical sections, with each TA
grading one third of the class for every project and exercise. Both Winter and Spring
Quarter TAs divided general course responsibilities into three areas: classroom (daily
handouts and audio visual equipment); grades (summing and recording); and map library
(tours and supplemental topographic maps series that corresponds to each lecture). TAs
then selected one area for which they were responsible.
8 Lockwood and Gersmehl
Teaching assistants are essential to a course with large enrollments, especially one
that requires competency in graphic and writing skills. One element of the projects is to
promote proficiency in mapping techniques and excellence in writing. Students are
encouraged to combine these two learned skills into an integrated, synthesized method
for effective analysis of spatial data. Teaching Assistants spend 10 to 15 hours per week
with open office hours in the Map Library, where they help students gather data, analyze
it, and package their results. TAs spend their remaining 5 to10 hours carefully reading
and providing detailed written responses to student assignments and the essay portion of
mid-quarter and final tests.
Grading of almost eighteen hundred projects, exercises, and tests is a daunting task,
even when divided among three and four TAs. We believe it is extremely important to
elicit cooperation of the Teaching Assistants. So TAs received copies of the Professor’s
TA course expectations and requirements, projects, texts, and all materials that are
necessary for them to guide students through assignments and the course. We gave the
TAs a summary of the grant that included goals, objectives and potential results. We
developed a set of grading guidelines, point distributions, summaries of projects, and
helpful hints for helping students (Appendix D, Supplemental Materials). The main
purpose of these materials was to aid Teaching Assistants with grading and evaluation of
students’ work. The materials were effective in most cases, but some difficulties arose
because of communication problems between teaching assistants, which required
retesting of several elements during Spring Quarter 1993.
METHODOLOGY
Evaluating Students’ Ability to Integrate Written and Visual Communications 9
Research Design
Criteria for assessing writing skills of students were developed and implemented
Winter Quarter 1993, with some retesting of specific elements during spring quarter
1993.
Several alternative instructions for student projects were prepared and tested winter
quarter 1993. These course projects are intended to help students develop an
understanding of graphic text, along with the ability to read, analyze, and finally explain
map patterns through clear, concise written language.
Our first objective was to develop instructions that were compatible with three
specific learning styles: auditory, visual, and writing. Based upon class composition and
performance of previous classes, we used existing projects but modified the instructions
to address these learning styles (Appendix B, Projects). The first project included two
pages of instructions and no formal explanation of the assignment. Several lectures
provided examples and references about project elements. The second project had a two-
page handout and a supplemental poster exhibit. This display showed how to calculate
and adjust data sets, design maps, use color, and integrate graphics with written text. The
third project included two pages of written instructions plus a thirty-minute formal
classroom explanation. By adjusting instruction format we could determine which single
or combined form of instructions was most effective.
We compared current class project grades with previous class project grades. Our
intent was to use the same grading procedures, in order to measure the effectiveness of
our instructions on student improvement. We developed forms to assess student
10 Lockwood and Gersmehl
performance in five specific areas: research, writing style, selection and description of
analytical tools, integration of maps and other graphic texts, and bibliographic skills.
Because of class size, we developed and tested a set of criteria and standards for uniform
grading by teaching assistants. Based on clarification problems that arose from Winter
Quarter 1993, we modified these criteria for Spring Quarter 1993.
Besides three projects, a set of short two-hour exercises was assigned. These
exercises are from ARGUS (Activities and Readings for the Geography of United States),
a National Science Foundation project. Written, self-explanatory, step-by-step procedures
allow students to complete the exercises at their own rate.
Data Source
Before beginning research in Winter Quarter 1993, we compiled some preliminary
data: previous enrollment figures, class composition, and student performance on projects
and exams. The Appendices are detailed collection of course materials, statistics, and TA
project evaluations and student course evaluations.
A questionnaire given the first day of class in Winter Quarter requested information
on age, sex, class, level, and number and type of prior geography and writing courses.
The results and tabulations of this questionnaire along with previous classes are
Appendix A, Class Statistics. Student course assessment and project evaluations are
Appendix C, Mid-Quarter Evaluations.
Teaching Assistants were a valuable source for additional evaluation of student
progress and effectiveness of our instructions. Guidelines and grading criteria based on
collective TA experiences and past student performance were given to TAs. The
Evaluating Students’ Ability to Integrate Written and Visual Communications 11
guidelines also included project and activity objectives, student learning outcome,
evaluation key, and hints for helping students. TAs were to keep track of repeat questions
and overall problems students were experiencing with projects and exercises. The TAs
provided positive feedback, both strengths and weaknesses, for improving assignments.
Examples of related TA course materials are Appendix D.
Project grades and TA evaluations of student projects were the primary sources for
this research. Previous averages serve as a base line for evaluating if our changes result in
improved student performance.
Evaluation of Student Projects
Projects from previous quarters were graded using a standardized 15 point system,
evenly distributed between five assessment areas. Employing the same system kept
current student performance comparable with previous student performance. TAs used a
standardized grading form, with five specific areas of evaluation, to grade student
projects (Appendix B). The TAs were given latitude in point distribution within each
category, but not for changing points of each category. Three exercises, worth five points
each, were also evaluated, but to a lesser degree than the projects. These exercises are
evaluated within the context of the current course and not with previous classes.
Problems
Two problems arose during this research. The first problem involved the Teaching
Assistants. We expected TAs to need guidance with the materials. We did not expect the
struggle between TAs with distribution of work assignments and grading duties. These
issues occasionally arise with large classes and three or more teaching assistants. Given
12 Lockwood and Gersmehl
the variation in grading, questions of students, and questions by TAs for clarification of
materials, it appears that the TAs either did not thoroughly read the supplemental
materials provided to them or were not familiar with the projects and exercises.
The second problem was modification of grading criteria and point distribution used
to evaluate student performance for Project 1 by the grading TA, but without similar
adjustments to the evaluation form that the students were using as a guideline. Rather
than equal point distribution, points were reallocated for the five evaluation areas: Site
and Map Selection, 2 points; Research, 5 points; Style, 3 points; Illustrations, 3 points;
Bibliography, 2 points. Criterion for choice and selection of other maps under
Illustrations was modified. The purpose of this section was to evaluate students’ ability to
choose appropriate sources and supporting material. Illustrations were for actual map
construction following guidelines in topographic manual and text and integrating them
into the written text. Changing point distribution altered the research design and was
detrimental in two ways. First, changing the evaluation criteria negates having a base line
from which to measure student performance. Second, students were given a copy of the
TA grading evaluation form, with stated criteria and expectations for each project
segment. These criteria were designed to elicit specific responses from the students and to
allow the students a structured guideline for inclusion of correct materials in each five
grading areas. Changing the criteria without changing the evaluation form resulted in a
conflict between actual student performance, evaluation by TA, and intended learning
response of the project.
Modifications
Evaluating Students’ Ability to Integrate Written and Visual Communications 13
Changing point distribution did result in some minor difficulties comparing current
projects (1993) with previous projects (1989-1992). To adjust for altering point
distribution and in fairness to the students, we applied the revised grading procedure of
Project 1 to Projects 2 and 3. We compared these three projects with each other rather
than with the previous four years’ projects. We retested Project 1 and 2 Spring Quarter,
using the revised point distribution, to verify results. Other changes Spring Quarter were
increasing project value from 15 to 20 points, with 4 points for each evaluation section
and assigning a fourth ARGUS Activity in place of a third project. Both Project 3 and
ARGUS Activity “I”, Boom Towns: Index of Local Importance, cover similar economic
principles applied from a geographic perspective. For Spring Quarter, we modified
supplemental materials to reflect TA concerns and to clarify TA grading responsibilities.
Spring Quarter TAs chose to divide grading equally with each TA grading a third of the
class, which created some problems with grading consistency. Spring TAs also assumed
more individual responsibilities.
DATA ANALYSIS AND INTERPRETATION
Our analysis is based on project grades, TA project evaluations, and student mid-
quarter evaluations for Winter Quarter, with minimal analysis based on Spring Quarter
data. The projects measure course content and ability to apply concepts within a
geographic context. Appendix B contains project instructions and evaluation forms.
The three projects require an equal amount of effort while developing progressive
skills. The first project is introductory. Students become familiar with descriptive
geography by identifying features and their relative distributions, interpreting this
14 Lockwood and Gersmehl
descriptive information, and ultimately expressing it in visual and written form.
Therefore we believe that Project 1 is a good measure of written instructions. Project 2
builds on Project 1’s ideas, but with more depth. Students gather data, transform raw
numbers into understandable units for mapping, map the data, and then interpret the map
patterns. Because this project is most taxing on students’ ability to interpret written and
graphic information and to produce a coherent report, we designed a visual display to
help students with understanding project instructions and objectives. In Project 3 students
use comparative statistics in a geographic context to apply economic ideas. Because
statistics can be confusing, we believed a verbal explanation would help clarify theories.
Written Instructions—Project 1
Project 1, Images: Interpreting Topographic and Soil Map, received the most
comments by TAs and seemed to cause the most stress for students. This was partly due
to communication difficulties with the grading TA and inconsistencies in TA responses to
student questions about project expectations and requirements. Some student frustration
resulted from a lack of formal explanation. Visual examples for all projects also were
shown during lectures, but the lectures did not try to provide a fully redundant treatment
of what was available in written form.
Students chose appropriate SITES and MAPS, but were weak in explaining site
selection and proving their suppositions. The grading TA commented that although a few
students provided “excellent additional/supplemental materials, not too many students
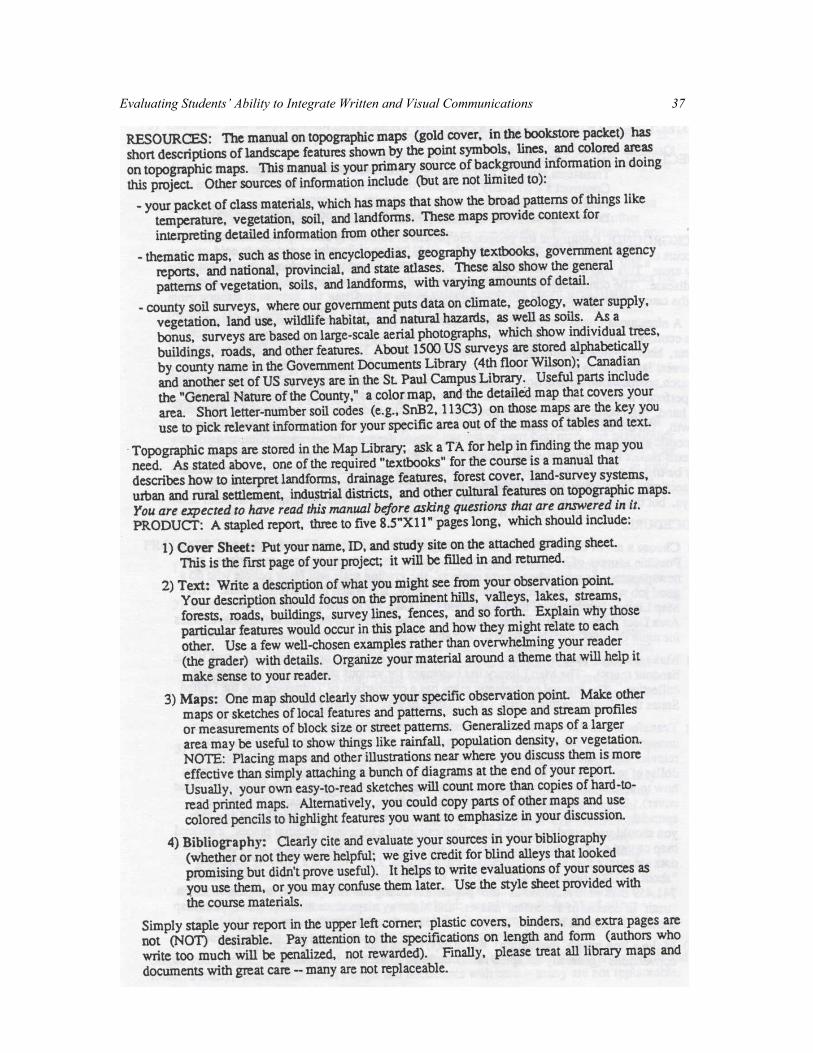
supplied such illustrative materials.” While the necessity for supplemental maps is stated
in Project 1’s OBJECTIVES and repeated in SOURCES and PRODUCT, some confusion
Evaluating Students’ Ability to Integrate Written and Visual Communications 15
may have occurred because PROCEDURE, Section 3 suggests that only the study area
requires a map. PRODUCT, Section 3, however, clearly states “Maps,” plural. Many
students did not effectively integrate supplementary materials into their text. This
suggests that students may not have read the supplemental manual on topographic maps
or received additional help from the TAs.
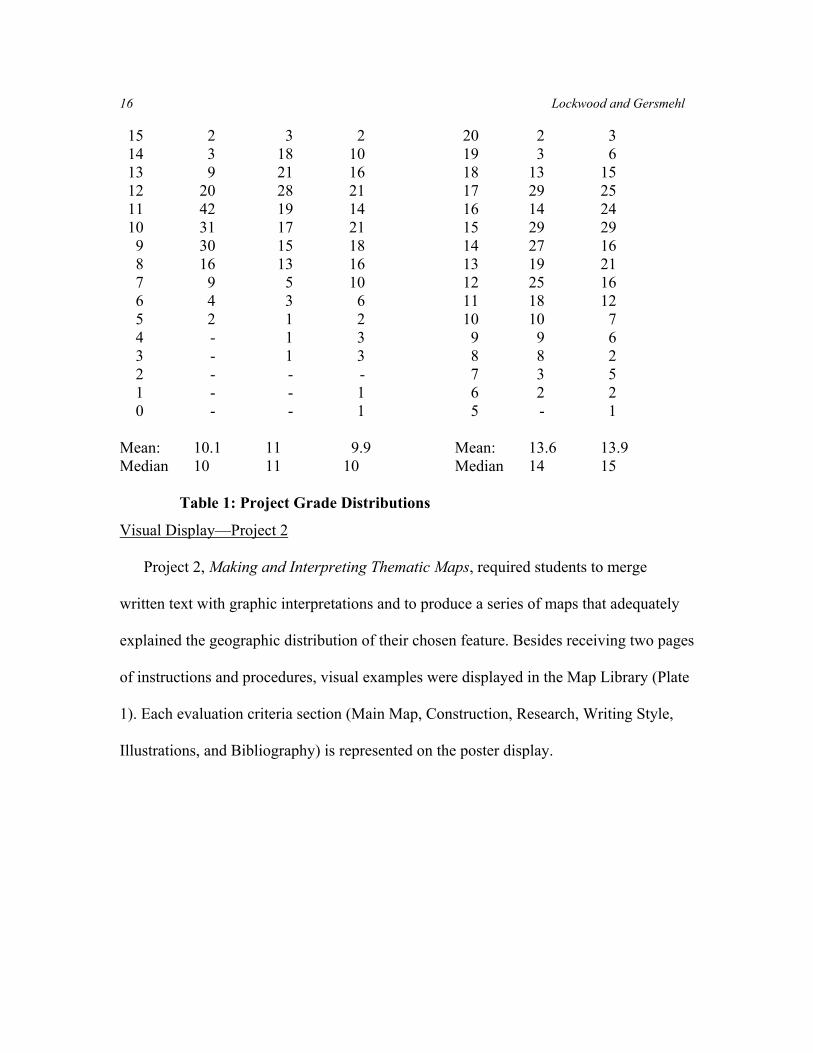
The scores on this exercise were lower than previous years, and lower than the
projects graded by the other two TAs (Table 4). Areas of ambiguous instructions were
modified Spring Quarter, which helped students with understanding what was expected
of them and helped the TAs when providing assistance to students. Despite minimal
problems with instructions and lower grades for Project 1, three-fourths of the class
scored well on all projects. The general assessment by the TAs for Project 1 was that “for
the most part, instructions and guidelines were clear.” Although students thought that
Project 1 was “relevant, but difficult,” more than half of the class commented that they
enjoyed Project 1 because it was “fun” and “interesting.”
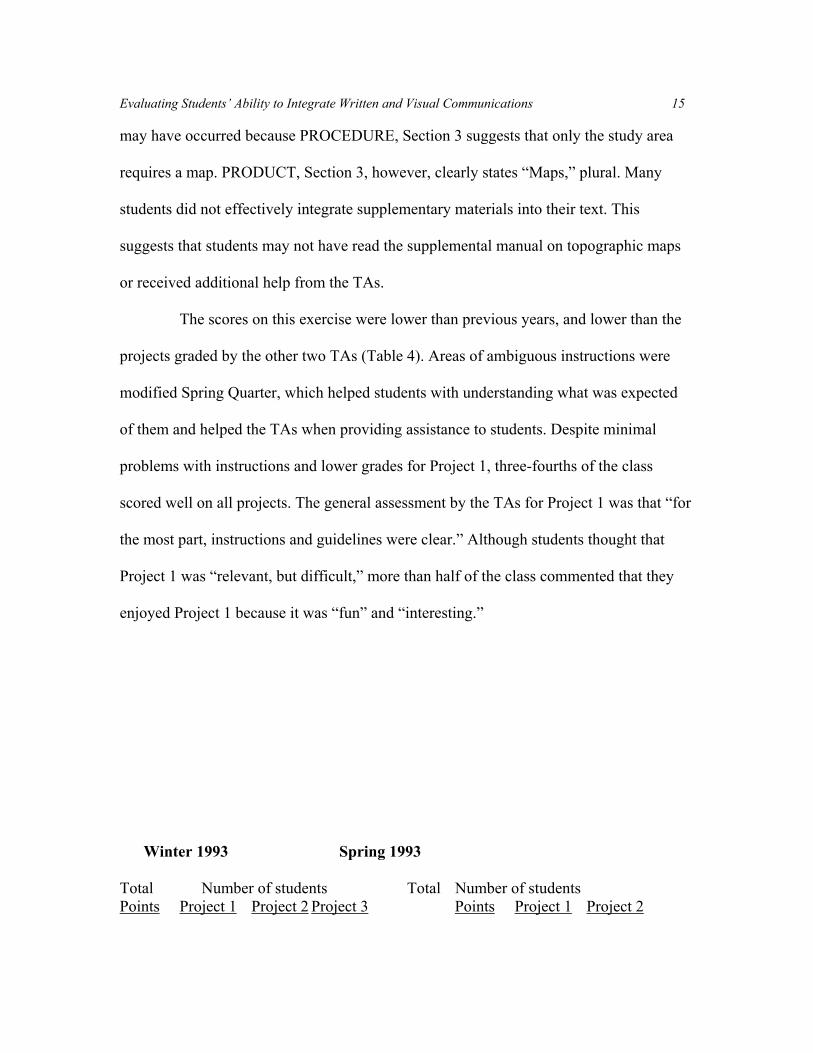
Winter 1993 Spring 1993
Total Number of students Total Number of students Points Project 1 Project 2 Project 3 Points Project 1 Project 2
16 Lockwood and Gersmehl
15 2 3 2 20 2 3 14 3 18 10 19 3 6 13 9 21 16 18 13 15 12 20 28 21 17 29 25 11 42 19 14 16 14 24 10 31 17 21 15 29 29 9 30 15 18 14 27 16 8 16 13 16 13 19 21 7 9 5 10 12 25 16 6 4 3 6 11 18 12 5 2 1 2 10 10 7 4 - 1 3 9 9 6 3 - 1 3 8 8 2 2 - - - 7 3 5 1 - - 1 6 2 2 0 - - 1 5 - 1 Mean: 10.1 11 9.9 Mean: 13.6 13.9 Median 10 11 10 Median 14 15 Table 1: Project Grade Distributions
Visual Display—Project 2
Project 2, Making and Interpreting Thematic Maps, required students to merge
written text with graphic interpretations and to produce a series of maps that adequately
explained the geographic distribution of their chosen feature. Besides receiving two pages
of instructions and procedures, visual examples were displayed in the Map Library (Plate
1). Each evaluation criteria section (Main Map, Construction, Research, Writing Style,
Illustrations, and Bibliography) is represented on the poster display.
Evaluating Students’ Ability to Integrate Written and Visual Communications 17
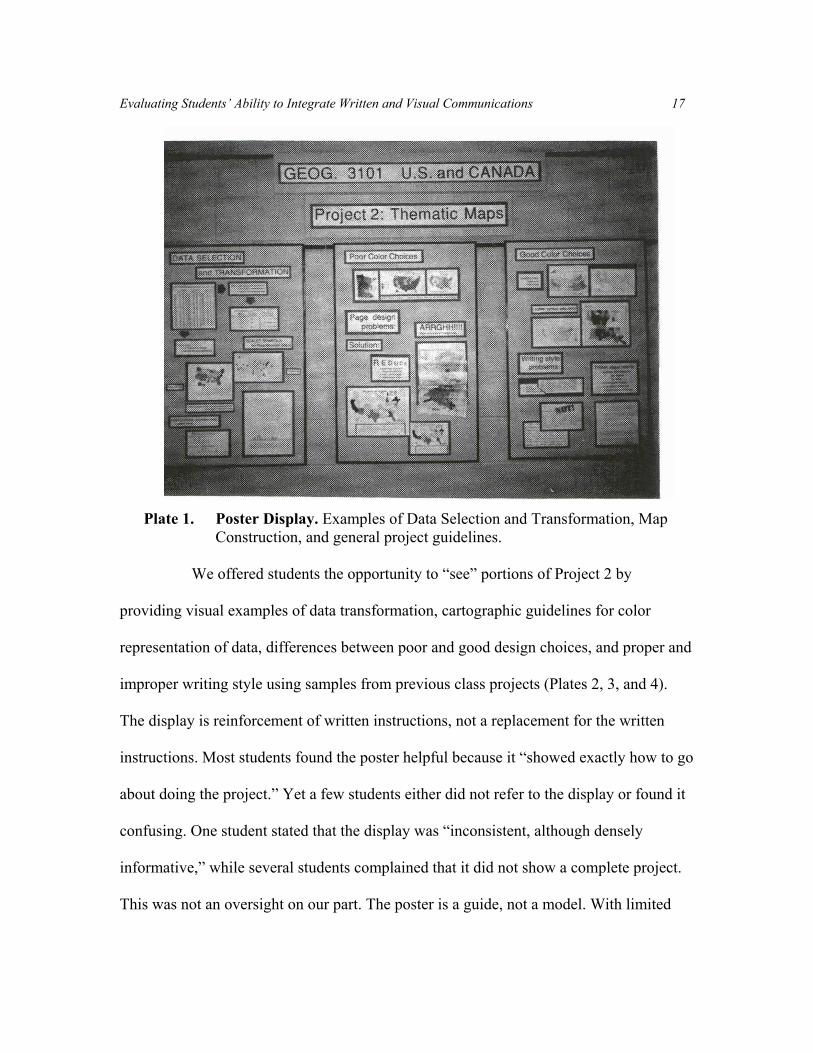
Plate 1. Poster Display. Examples of Data Selection and Transformation, Map
Construction, and general project guidelines.
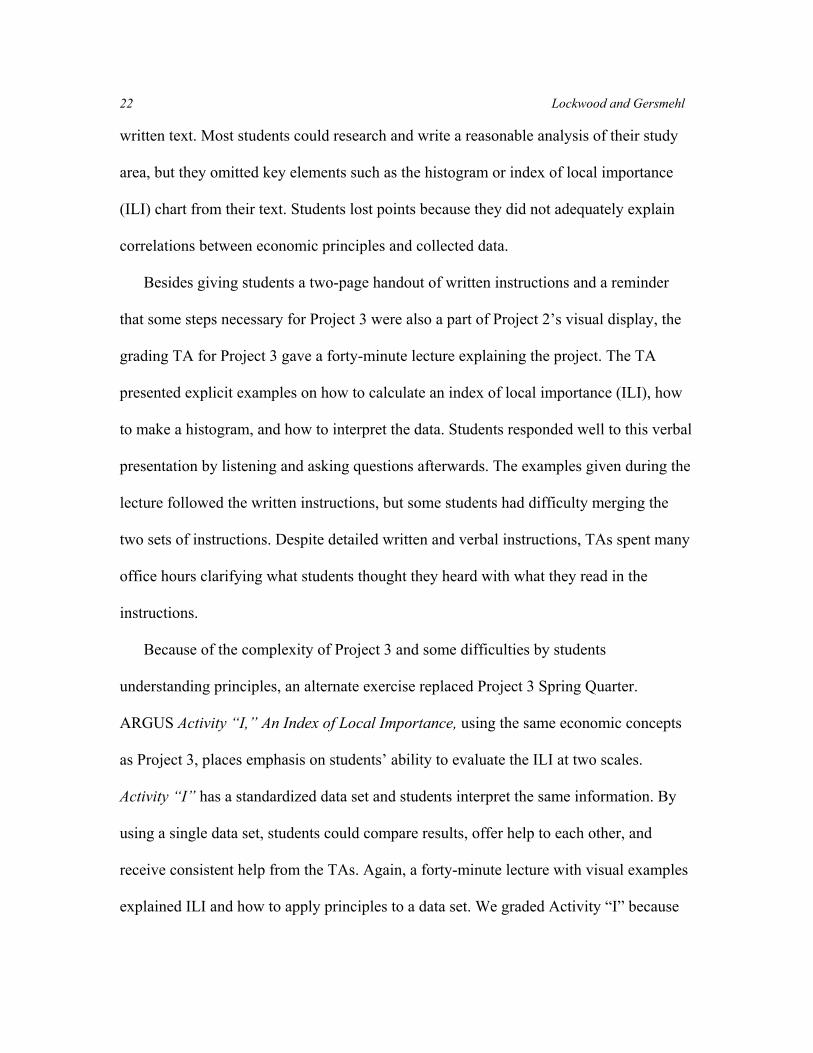
We offered students the opportunity to “see” portions of Project 2 by
providing visual examples of data transformation, cartographic guidelines for color
representation of data, differences between poor and good design choices, and proper and
improper writing style using samples from previous class projects (Plates 2, 3, and 4).
The display is reinforcement of written instructions, not a replacement for the written
instructions. Most students found the poster helpful because it “showed exactly how to go
about doing the project.” Yet a few students either did not refer to the display or found it
confusing. One student stated that the display was “inconsistent, although densely
informative,” while several students complained that it did not show a complete project.
This was not an oversight on our part. The poster is a guide, not a model. With limited
18 Lockwood and Gersmehl
space, we wanted to highlight problem areas along with corrections and proper
procedures. Projects from previous quarters were available in the map library for review
by students. Although a consensus on Midquarter evaluations was that Project 2 was
“better than Project 1,” there were areas of frustration. Students lost sight of the specific
items listed on the two pages of instructions. Like Project 1, Project 2’s PRODUCT lists
point-by-point elements for inclusion in the student’s report. Two sections on the grading
evaluation form asks students if they included the appropriate materials or conducted the
necessary research. In addition, the display walks students through procedures for
compiling a synthesized report using a flow chart format. The final step is a bullet
list of “deliverables.”
Evaluating Students’ Ability to Integrate Written and Visual Communications 19
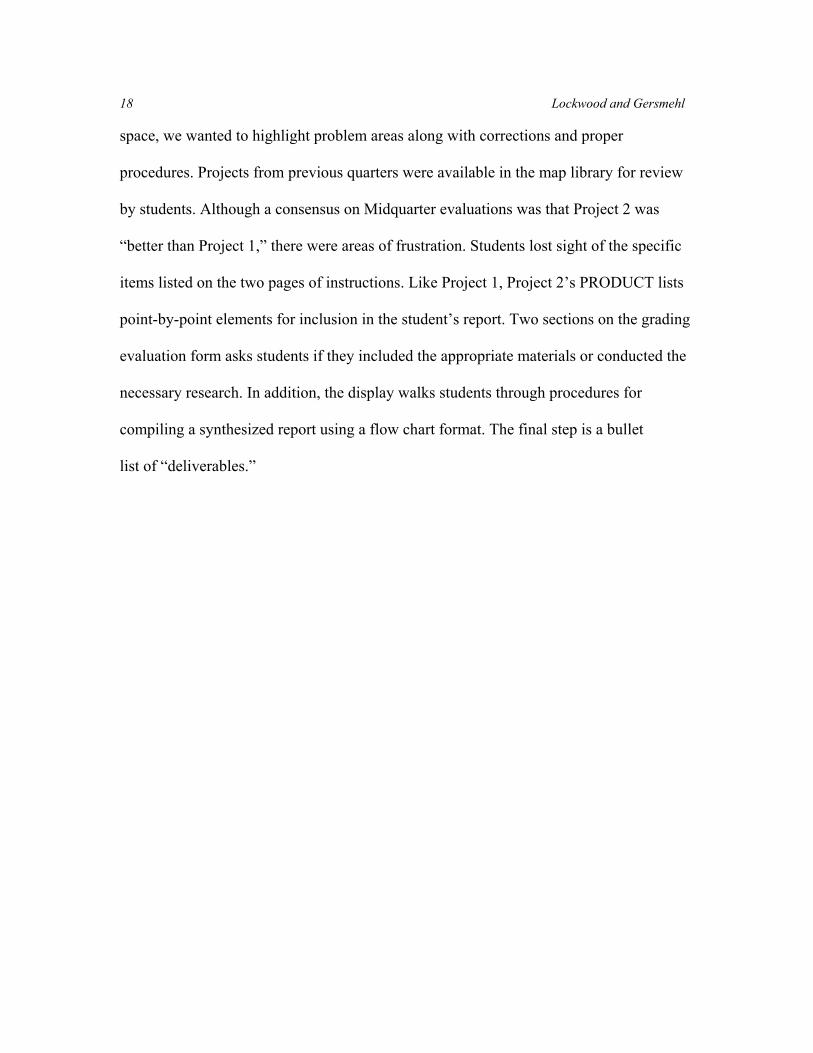
Plate 2. Data Selection and Transformation
Students’ general reaction to Project 2 was positive. Most students improved their
grade from Project 1 to Project 2, but some who improved also lost points for Project 3
(Table 5). This could be a result of several factors. First, the display helped clarify
instructions and improve student performance. One student wrote on her midquarter
evaluation that she “would not have understood how to do the project without it,” while
another student wrote “the project 2 display was the most helpful thing the TAs did for
20 Lockwood and Gersmehl
me.” Second, students were familiar with the thematic text or sought assistance from
TAs. And third, students liked thematic mapping.
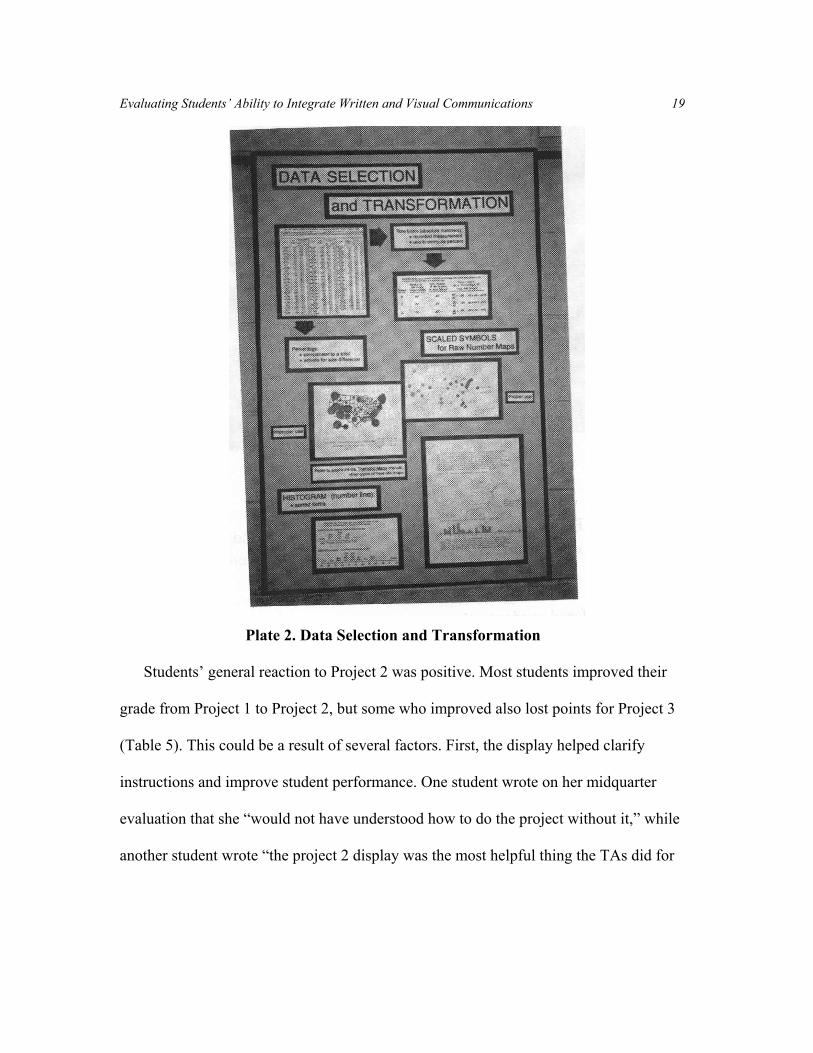
Plate 3: Good Choices. Examples of page design and writing style problems.
Winter 1993
Spring 1993
Project 1 to Project
2
Project 2 to Project
3
Project 1 to Project
2 Improved
45 %
32 %
47 %
Decreased
40 %
50 %
43 %
Same
15 %
18 %
11 %
Evaluating Students’ Ability to Integrate Written and Visual Communications 21
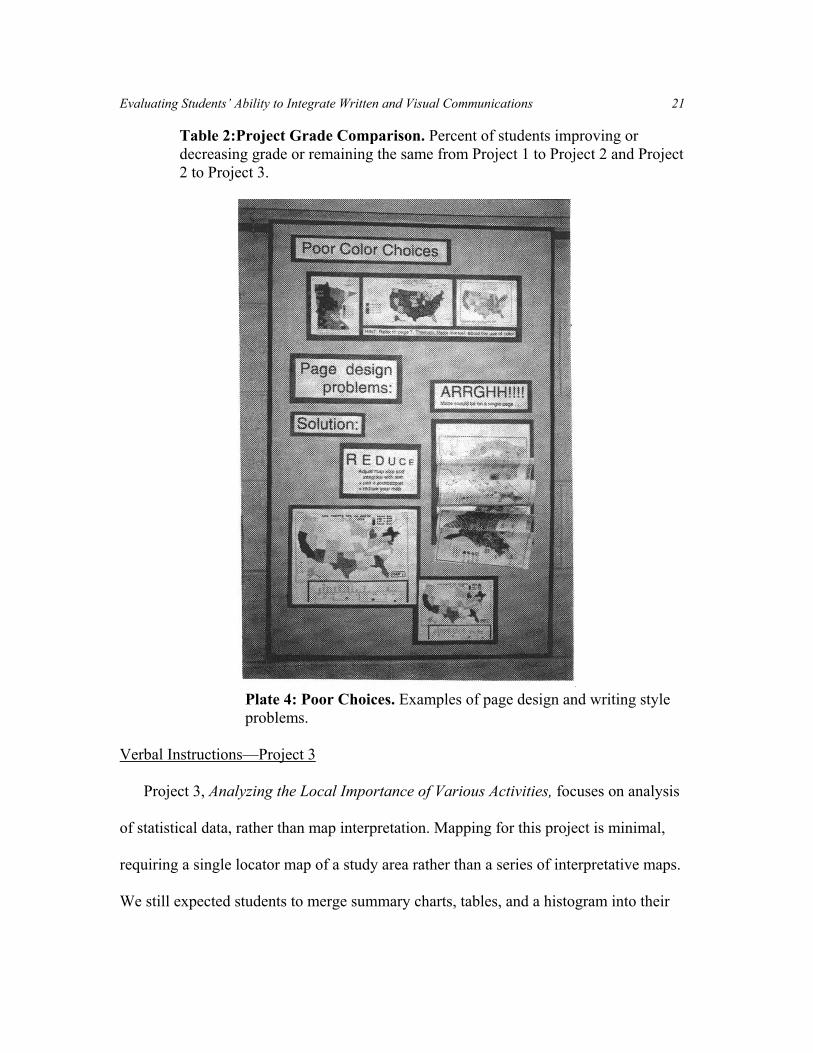
Table 2:Project Grade Comparison. Percent of students improving or decreasing grade or remaining the same from Project 1 to Project 2 and Project 2 to Project 3.
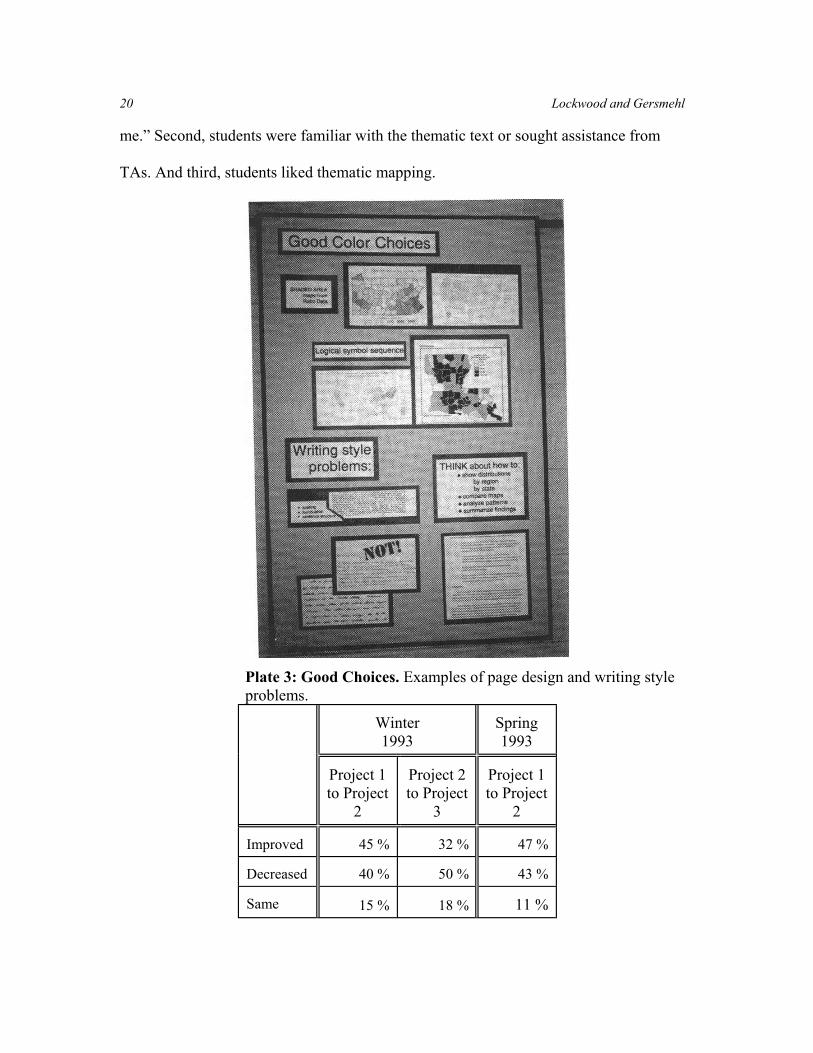
Plate 4: Poor Choices. Examples of page design and writing style problems.
Verbal Instructions—Project 3
Project 3, Analyzing the Local Importance of Various Activities, focuses on analysis
of statistical data, rather than map interpretation. Mapping for this project is minimal,
requiring a single locator map of a study area rather than a series of interpretative maps.
We still expected students to merge summary charts, tables, and a histogram into their
22 Lockwood and Gersmehl
written text. Most students could research and write a reasonable analysis of their study
area, but they omitted key elements such as the histogram or index of local importance
(ILI) chart from their text. Students lost points because they did not adequately explain
correlations between economic principles and collected data.
Besides giving students a two-page handout of written instructions and a reminder
that some steps necessary for Project 3 were also a part of Project 2’s visual display, the
grading TA for Project 3 gave a forty-minute lecture explaining the project. The TA
presented explicit examples on how to calculate an index of local importance (ILI), how
to make a histogram, and how to interpret the data. Students responded well to this verbal
presentation by listening and asking questions afterwards. The examples given during the
lecture followed the written instructions, but some students had difficulty merging the
two sets of instructions. Despite detailed written and verbal instructions, TAs spent many
office hours clarifying what students thought they heard with what they read in the
instructions.
Because of the complexity of Project 3 and some difficulties by students
understanding principles, an alternate exercise replaced Project 3 Spring Quarter.
ARGUS Activity “I,” An Index of Local Importance, using the same economic concepts
as Project 3, places emphasis on students’ ability to evaluate the ILI at two scales.
Activity “I” has a standardized data set and students interpret the same information. By
using a single data set, students could compare results, offer help to each other, and
receive consistent help from the TAs. Again, a forty-minute lecture with visual examples
explained ILI and how to apply principles to a data set. We graded Activity “I” because
Evaluating Students’ Ability to Integrate Written and Visual Communications 23
this is the first exposure of the exercise to students. By our grading an untested exercise,
we could assess problems, strengths, and weaknesses, and if necessary, adjust grades.
Although the TAs did not grade Activity “I,” they were familiar with its format and
flagged difficulties encountered by students. Inaccurate calculations of given percentages
and ILI’s in the data set caused some problems with students’ calculations. These errors
were corrected. The TAs commented that several students were unclear that an average
ILI is a value of “one.” Activity “I” is a seven-page exercise with five pages devoted to
ILI concepts and procedures. Detailed activity instructions and examples, reinforced with
visual examples during lecture, covered the concept that “one” is an average. Comments
such as this suggest that students skipped to the calculations without carefully reading the
instructions. Also, while students were present during lecture, some students were not
listening. Project 3 and Activity “I” probably could use a visual display showing
procedure, calculations, and data interpretation.
Comments
All project instructions and evaluation forms included an explicit statement that style
and grammar would be evaluated. Despite that warning, many students lost points
because of poor grammar (writing style, expression, spelling, punctuation, tense). The
introductory questionnaires show that almost all students enter Geography 3101 with
some English background. Yet, poor grammar suggests that students do not transfer those
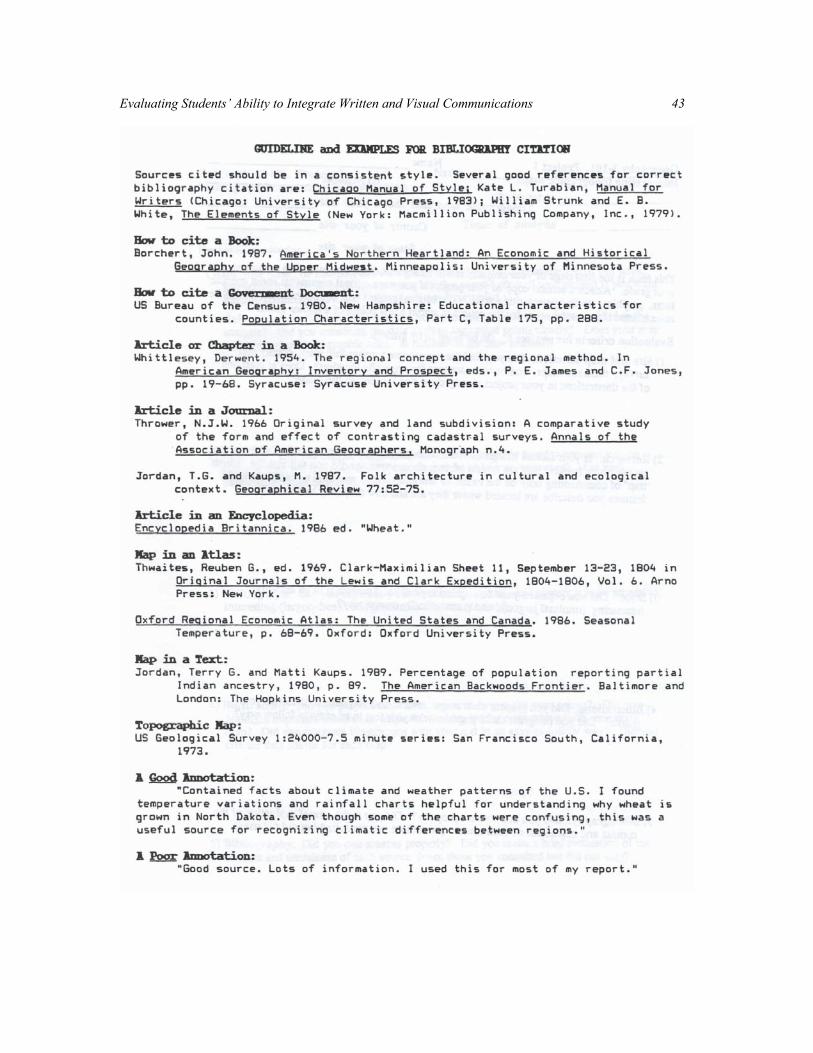
writing skills to other courses. Poorly constructed bibliographies, which were minimal
and without annotation, are another area of concern; it appears that students have little
experience in documenting sources. We included a bibliography guideline with projects
24 Lockwood and Gersmehl
and recommended that TAs tell students during office hours about grammar and
bibliography errors.
Students tended to underestimate the time necessary to complete these projects. On
the average, projects take between 15 and 20 hours for research, writing, illustration
drafting, and editing of work. The instructions do not include a section on time allocation,
but we made an oral announcement to alert students that a project could take between 10
and 20 hours.
Students believed point allocation was minimal for their efforts. Projects, while time-
consuming, are important measures of a student’s ability to process, analyze, synthesize,
and then present a series of information in geographic context. The three projects and
three ARGUS activities are equal to 30% of the course grade. We agree that individual
projects should have more point value, but the cumulative project and activity points
should remain at 30% of the course grade. In essence, points are an absolute measure of
student performance. Interestingly, there was little difference in student performance
levels between winter and spring Project grades (and overall course grades), despite
changes in point allocation (Appendix B).
Students were displeased about the grading procedures by the TAs for all projects.
Several explicitly commented that the TA grading criteria were different from what was
explained. Students complained about inconsistencies in TA responses to their questions
about project expectations and requirements: “It’s a bad idea to ask a question to a TA
that’s not the grader.” The purpose of TA guidelines was to prevent this type of
confusion. Graders also received several complaints about their comments on student
Evaluating Students’ Ability to Integrate Written and Visual Communications 25
evaluation forms. Some of these grievances were justified due to the graders’
inexperience with working with students and poor penmanship. Many graders’
comments, though thorough in evaluating student assignments, were illegible, hence,
students were frustrated with the graders’ comments.
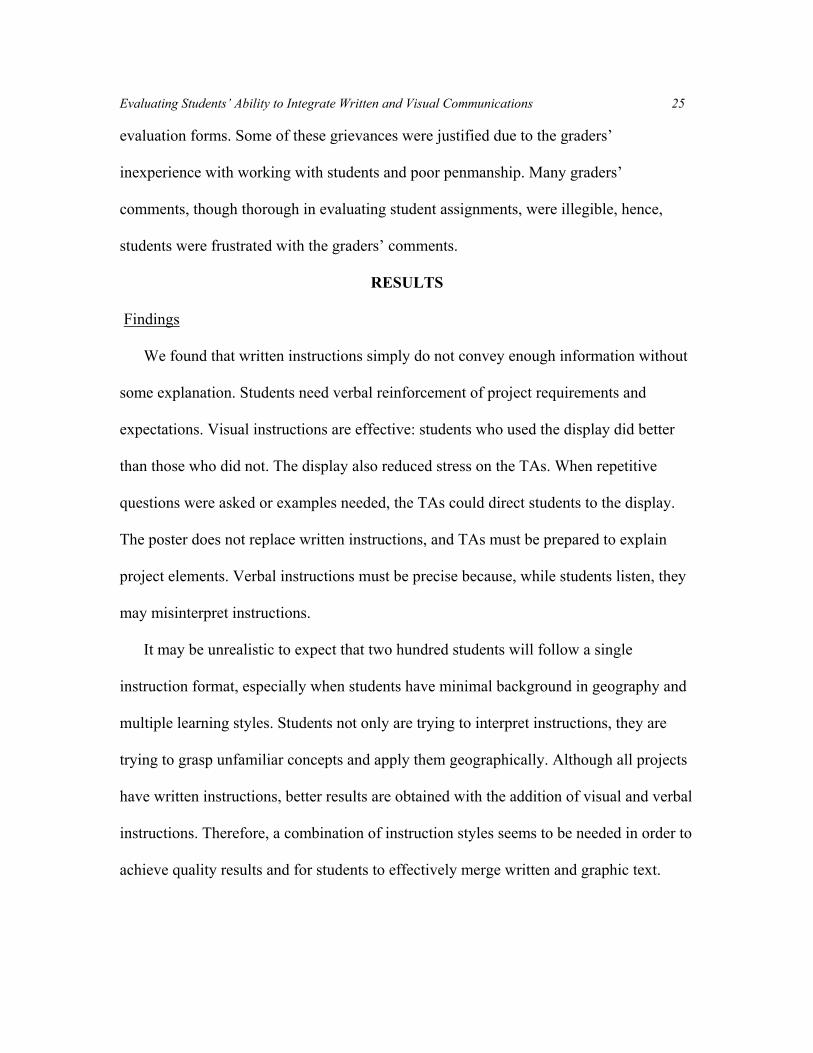
RESULTS
Findings
We found that written instructions simply do not convey enough information without
some explanation. Students need verbal reinforcement of project requirements and
expectations. Visual instructions are effective: students who used the display did better
than those who did not. The display also reduced stress on the TAs. When repetitive
questions were asked or examples needed, the TAs could direct students to the display.
The poster does not replace written instructions, and TAs must be prepared to explain
project elements. Verbal instructions must be precise because, while students listen, they
may misinterpret instructions.
It may be unrealistic to expect that two hundred students will follow a single
instruction format, especially when students have minimal background in geography and
multiple learning styles. Students not only are trying to interpret instructions, they are
trying to grasp unfamiliar concepts and apply them geographically. Although all projects
have written instructions, better results are obtained with the addition of visual and verbal
instructions. Therefore, a combination of instruction styles seems to be needed in order to
achieve quality results and for students to effectively merge written and graphic text.
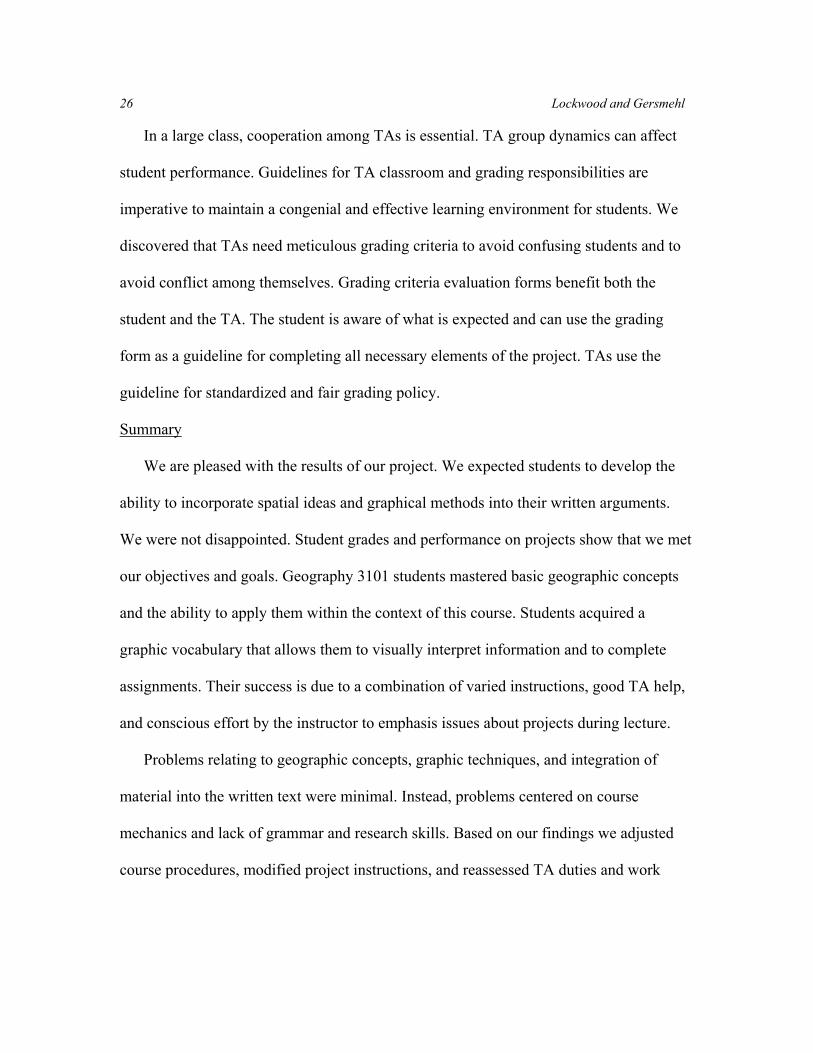
26 Lockwood and Gersmehl
In a large class, cooperation among TAs is essential. TA group dynamics can affect
student performance. Guidelines for TA classroom and grading responsibilities are
imperative to maintain a congenial and effective learning environment for students. We
discovered that TAs need meticulous grading criteria to avoid confusing students and to
avoid conflict among themselves. Grading criteria evaluation forms benefit both the
student and the TA. The student is aware of what is expected and can use the grading
form as a guideline for completing all necessary elements of the project. TAs use the
guideline for standardized and fair grading policy.
Summary
We are pleased with the results of our project. We expected students to develop the
ability to incorporate spatial ideas and graphical methods into their written arguments.
We were not disappointed. Student grades and performance on projects show that we met
our objectives and goals. Geography 3101 students mastered basic geographic concepts
and the ability to apply them within the context of this course. Students acquired a
graphic vocabulary that allows them to visually interpret information and to complete
assignments. Their success is due to a combination of varied instructions, good TA help,
and conscious effort by the instructor to emphasis issues about projects during lecture.
Problems relating to geographic concepts, graphic techniques, and integration of
material into the written text were minimal. Instead, problems centered on course
mechanics and lack of grammar and research skills. Based on our findings we adjusted
course procedures, modified project instructions, and reassessed TA duties and work
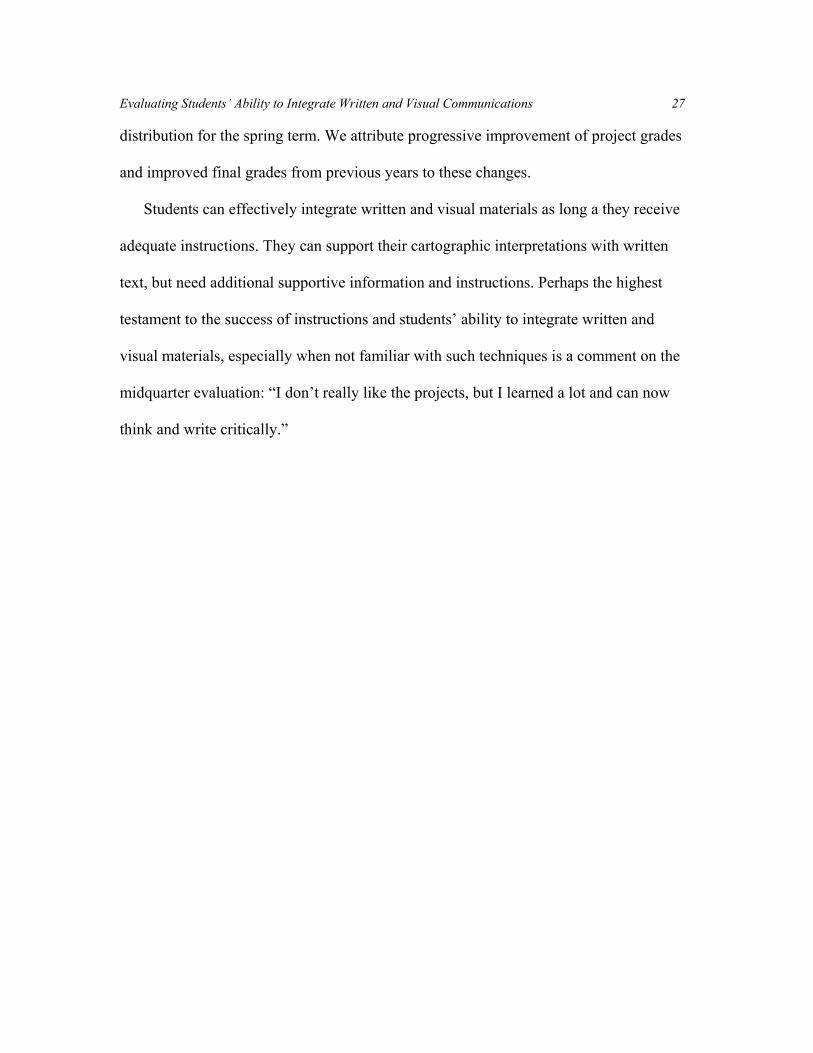
Evaluating Students’ Ability to Integrate Written and Visual Communications 27
distribution for the spring term. We attribute progressive improvement of project grades
and improved final grades from previous years to these changes.
Students can effectively integrate written and visual materials as long a they receive
adequate instructions. They can support their cartographic interpretations with written
text, but need additional supportive information and instructions. Perhaps the highest
testament to the success of instructions and students’ ability to integrate written and
visual materials, especially when not familiar with such techniques is a comment on the
midquarter evaluation: “I don’t really like the projects, but I learned a lot and can now
think and write critically.”
28 Lockwood and Gersmehl
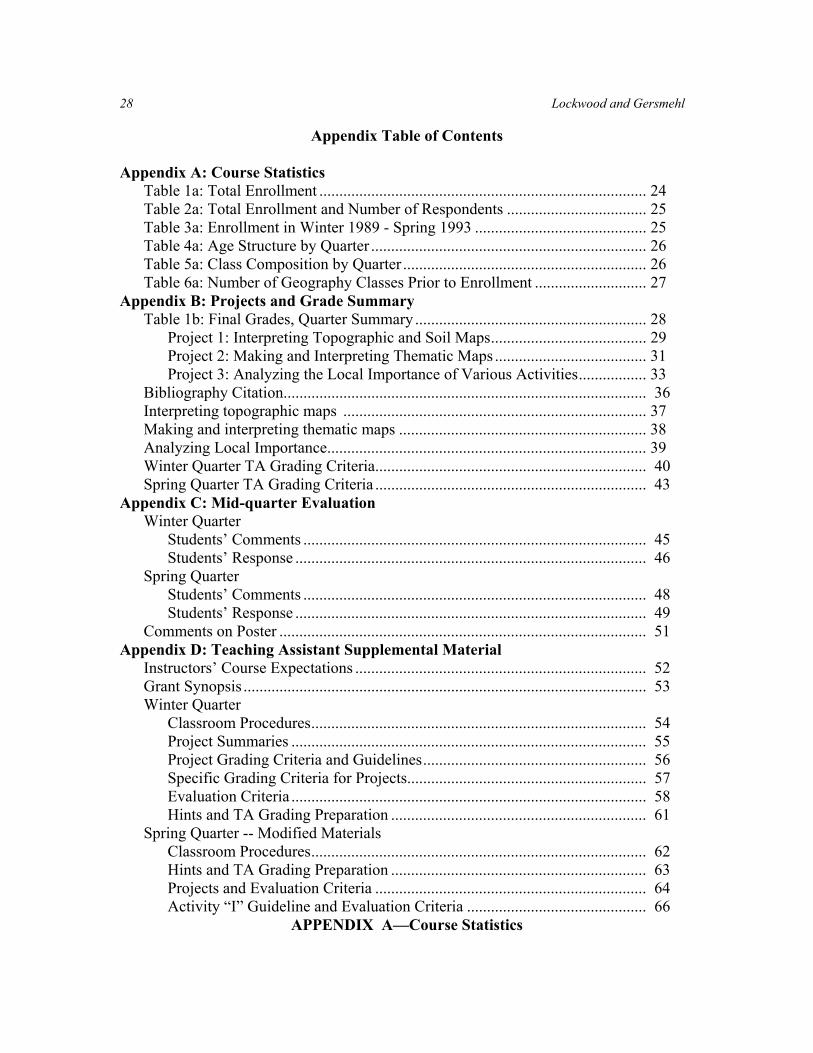
Appendix Table of Contents
Appendix A: Course Statistics Table 1a: Total Enrollment .................................................................................. 24 Table 2a: Total Enrollment and Number of Respondents ................................... 25 Table 3a: Enrollment in Winter 1989 - Spring 1993 ........................................... 25 Table 4a: Age Structure by Quarter ..................................................................... 26 Table 5a: Class Composition by Quarter ............................................................. 26 Table 6a: Number of Geography Classes Prior to Enrollment ............................ 27
Appendix B: Projects and Grade Summary Table 1b: Final Grades, Quarter Summary .......................................................... 28 Project 1: Interpreting Topographic and Soil Maps....................................... 29 Project 2: Making and Interpreting Thematic Maps ...................................... 31 Project 3: Analyzing the Local Importance of Various Activities................. 33 Bibliography Citation........................................................................................... 36 Interpreting topographic maps ............................................................................ 37 Making and interpreting thematic maps .............................................................. 38 Analyzing Local Importance................................................................................ 39 Winter Quarter TA Grading Criteria.................................................................... 40 Spring Quarter TA Grading Criteria .................................................................... 43
Appendix C: Mid-quarter Evaluation Winter Quarter
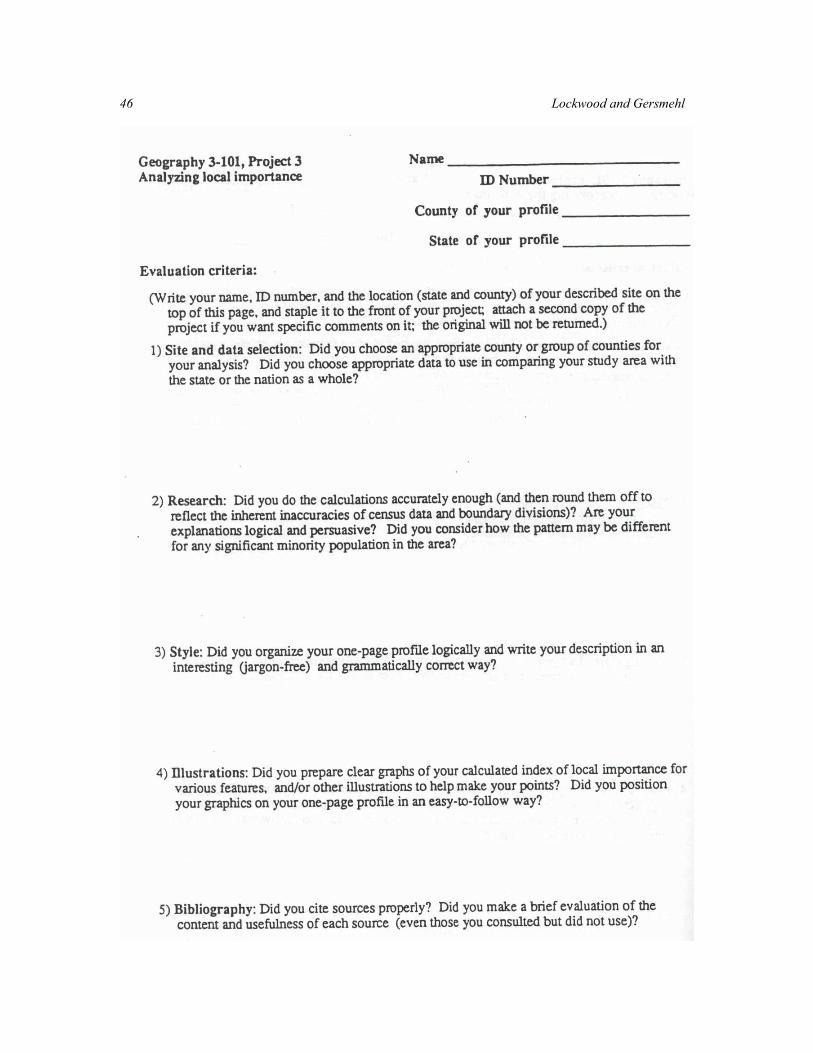
Students’ Comments ...................................................................................... 45 Students’ Response ........................................................................................ 46
Spring Quarter Students’ Comments ...................................................................................... 48 Students’ Response ........................................................................................ 49
Comments on Poster ............................................................................................ 51 Appendix D: Teaching Assistant Supplemental Material
Instructors’ Course Expectations ......................................................................... 52 Grant Synopsis ..................................................................................................... 53 Winter Quarter
Classroom Procedures.................................................................................... 54 Project Summaries ......................................................................................... 55 Project Grading Criteria and Guidelines........................................................ 56 Specific Grading Criteria for Projects............................................................ 57 Evaluation Criteria ......................................................................................... 58 Hints and TA Grading Preparation ................................................................ 61
Spring Quarter -- Modified Materials Classroom Procedures.................................................................................... 62 Hints and TA Grading Preparation ................................................................ 63 Projects and Evaluation Criteria .................................................................... 64 Activity “I” Guideline and Evaluation Criteria ............................................. 66
APPENDIX A—Course Statistics
Evaluating Students’ Ability to Integrate Written and Visual Communications 29
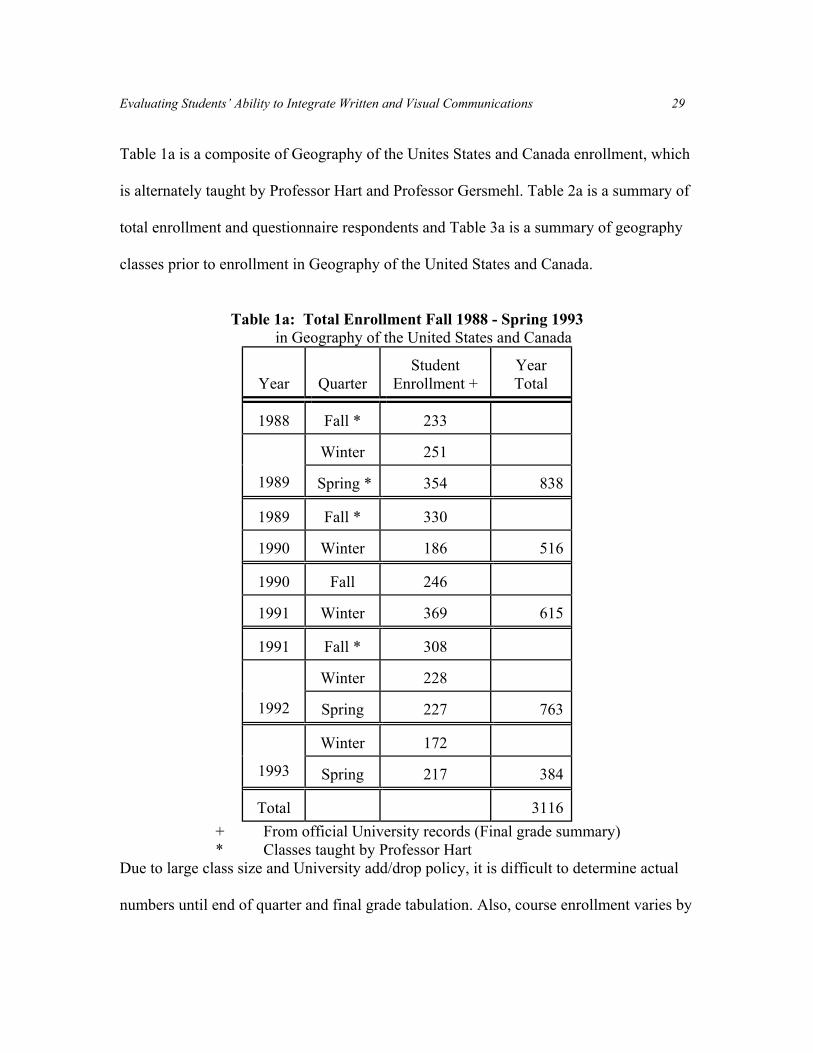
Table 1a is a composite of Geography of the Unites States and Canada enrollment, which
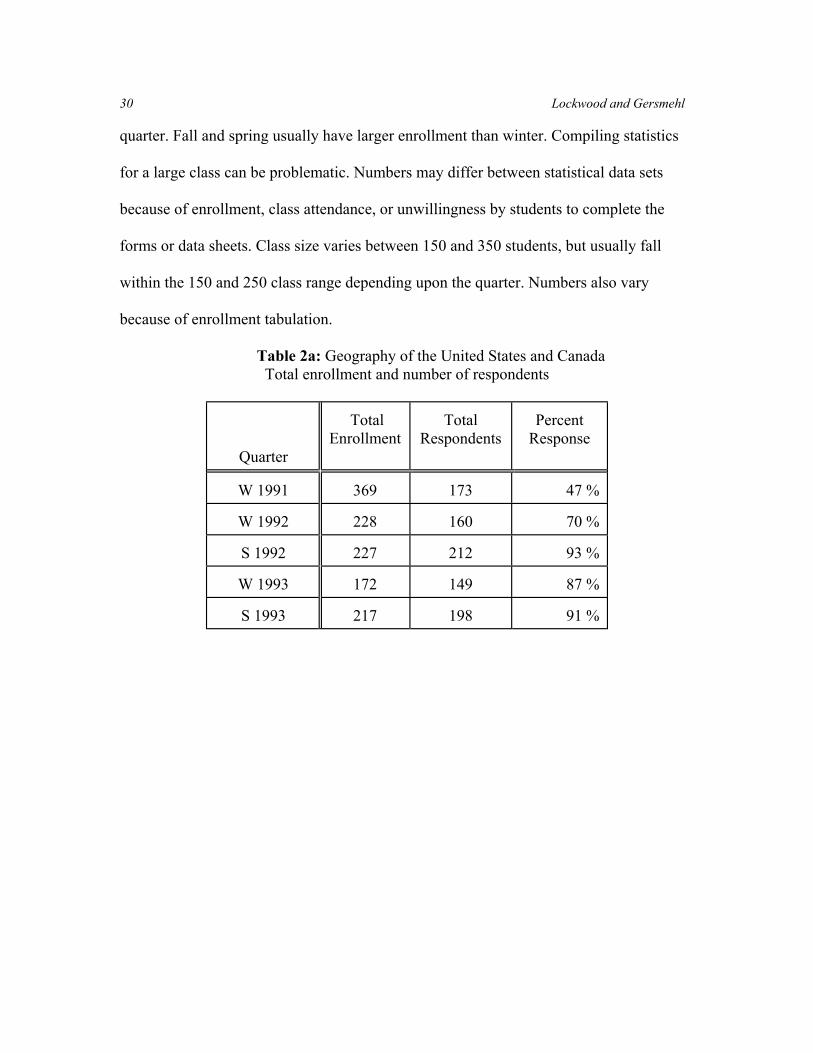
is alternately taught by Professor Hart and Professor Gersmehl. Table 2a is a summary of
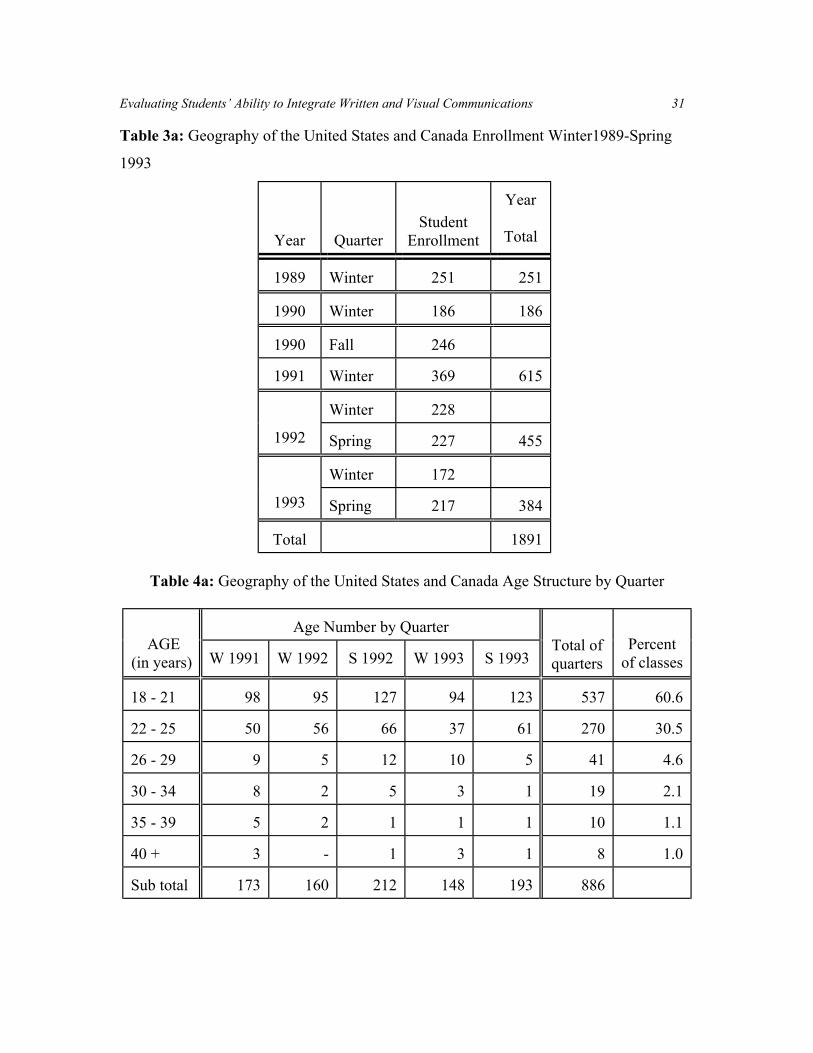
total enrollment and questionnaire respondents and Table 3a is a summary of geography
classes prior to enrollment in Geography of the United States and Canada.
Table 1a: Total Enrollment Fall 1988 - Spring 1993
in Geography of the United States and Canada
Year
Quarter
Student
Enrollment +
Year Total
1988
Fall *
233
Winter
251
1989
Spring *
354
838
1989
Fall *
330
1990
Winter
186
516
1990
Fall
246
1991
Winter
369
615
1991
Fall *
308
Winter
228
1992
Spring
227
763
Winter
172
1993
Spring
217
384
Total
3116
+ From official University records (Final grade summary) * Classes taught by Professor Hart
Due to large class size and University add/drop policy, it is difficult to determine actual
numbers until end of quarter and final grade tabulation. Also, course enrollment varies by
30 Lockwood and Gersmehl
quarter. Fall and spring usually have larger enrollment than winter. Compiling statistics
for a large class can be problematic. Numbers may differ between statistical data sets
because of enrollment, class attendance, or unwillingness by students to complete the
forms or data sheets. Class size varies between 150 and 350 students, but usually fall
within the 150 and 250 class range depending upon the quarter. Numbers also vary
because of enrollment tabulation.
Table 2a: Geography of the United States and Canada Total enrollment and number of respondents
Quarter
Total
Enrollment
Total
Respondents
Percent
Response
W 1991
369
173
47 %
W 1992
228
160
70 %
S 1992
227
212
93 %
W 1993
172
149
87 %
S 1993
217
198
91 %
Evaluating Students’ Ability to Integrate Written and Visual Communications 31
Table 3a: Geography of the United States and Canada Enrollment Winter1989-Spring
1993
Year
Quarter
Student Enrollment
Year
Total
1989
Winter
251
251
1990
Winter
186
186
1990
Fall
246
1991
Winter
369
615
Winter
228
1992
Spring
227
455
Winter
172
1993
Spring
217
384
Total
1891
Table 4a: Geography of the United States and Canada Age Structure by Quarter
Age Number by Quarter AGE
(in years) W 1991
W 1992
S 1992
W 1993
S 1993
Total of quarters
Percent
of classes 18 - 21
98
95
127
94
123
537
60.6
22 - 25
50
56
66
37
61
270
30.5
26 - 29
9
5
12
10
5
41
4.6
30 - 34
8
2
5
3
1
19
2.1
35 - 39
5
2
1
1
1
10
1.1
40 +
3
-
1
3
1
8
1.0
Sub total
173
160
212
148
193
886
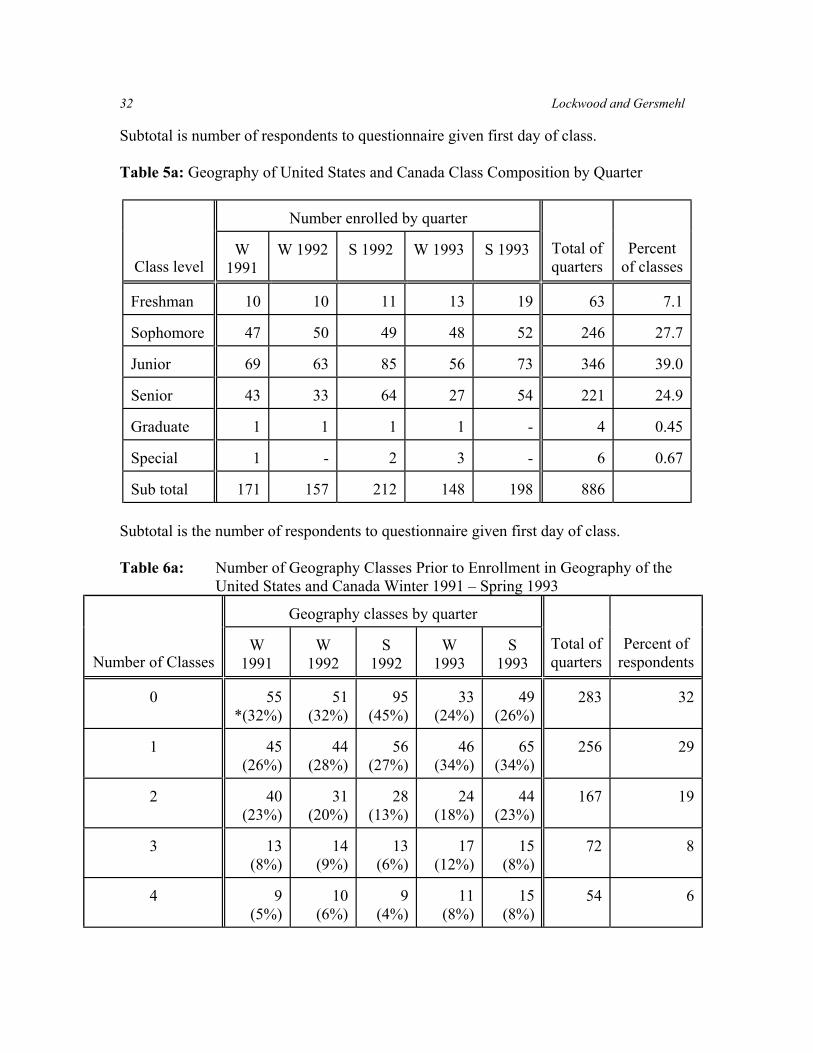
32 Lockwood and Gersmehl
Subtotal is number of respondents to questionnaire given first day of class. Table 5a: Geography of United States and Canada Class Composition by Quarter
Number enrolled by quarter
Class level
W
1991
W 1992
S 1992
W 1993
S 1993
Total of quarters
Percent
of classes Freshman
10
10
11
13
19
63
7.1
Sophomore
47
50
49
48
52
246
27.7
Junior
69
63
85
56
73
346
39.0
Senior
43
33
64
27
54
221
24.9
Graduate
1
1
1
1
-
4
0.45
Special
1
-
2
3
-
6
0.67
Sub total
171
157
212
148
198
886
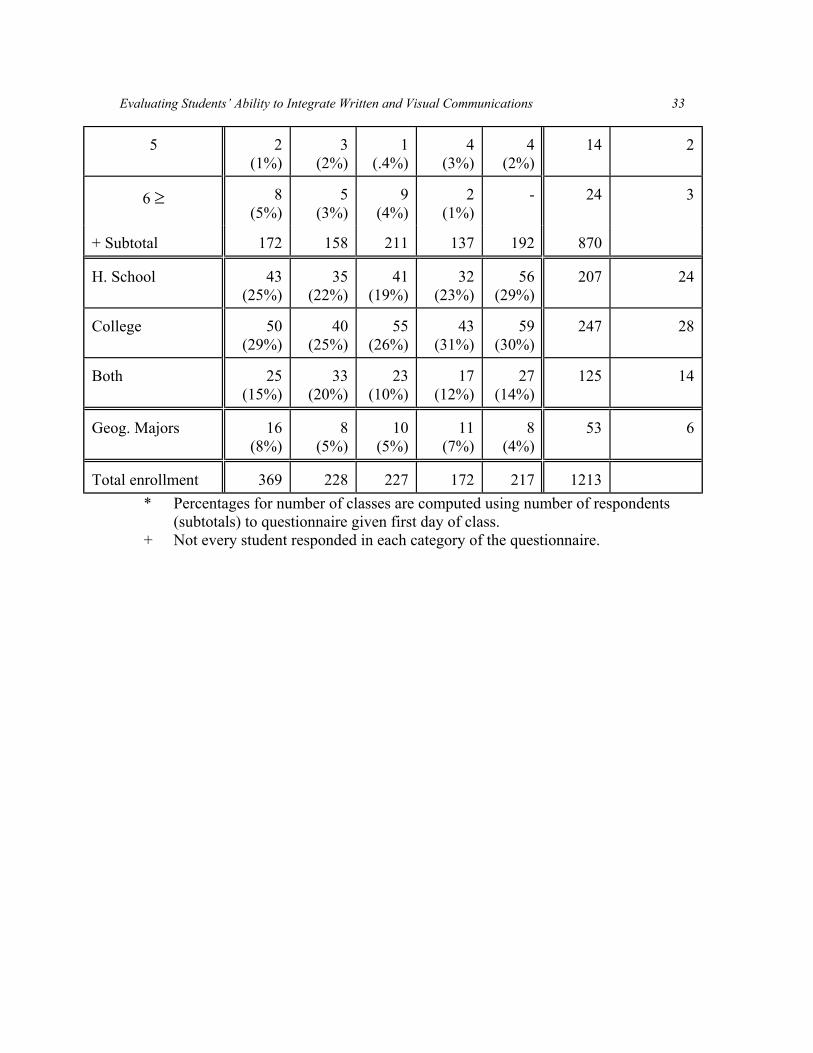
Subtotal is the number of respondents to questionnaire given first day of class. Table 6a: Number of Geography Classes Prior to Enrollment in Geography of the
United States and Canada Winter 1991 – Spring 1993
Geography classes by quarter
Number of Classes
W
1991
W
1992
S
1992
W
1993
S
1993
Total of quarters
Percent of
respondents
0
55 *(32%)
51
(32%)
95
(45%)
33
(24%)
49
(26%)
283
32
1
45
(26%)
44
(28%)
56
(27%)
46
(34%)
65
(34%)
256
29
2
40
(23%)
31
(20%)
28
(13%)
24
(18%)
44
(23%)
167
19
3
13
(8%)
14
(9%)
13
(6%)
17
(12%)
15
(8%)
72
8
4
9
(5%)
10
(6%)
9
(4%)
11
(8%)
15
(8%)
54
6
Evaluating Students’ Ability to Integrate Written and Visual Communications 33
5
2
(1%)
3
(2%)
1
(.4%)
4
(3%)
4
(2%)
14
2
6 ≥
8
(5%)
5
(3%)
9
(4%)
2
(1%)
-
24
3
+ Subtotal
172
158
211
137
192
870
H. School
43
(25%)
35
(22%)
41
(19%)
32
(23%)
56
(29%)
207
24
College
50
(29%)
40
(25%)
55
(26%)
43
(31%)
59
(30%)
247
28
Both
25
(15%)
33
(20%)
23
(10%)
17
(12%)
27
(14%)
125
14
Geog. Majors
16
(8%)
8
(5%)
10
(5%)
11
(7%)
8
(4%)
53
6
Total enrollment
369
228
227
172
217
1213
* Percentages for number of classes are computed using number of respondents (subtotals) to questionnaire given first day of class.
+ Not every student responded in each category of the questionnaire.
34 Lockwood and Gersmehl
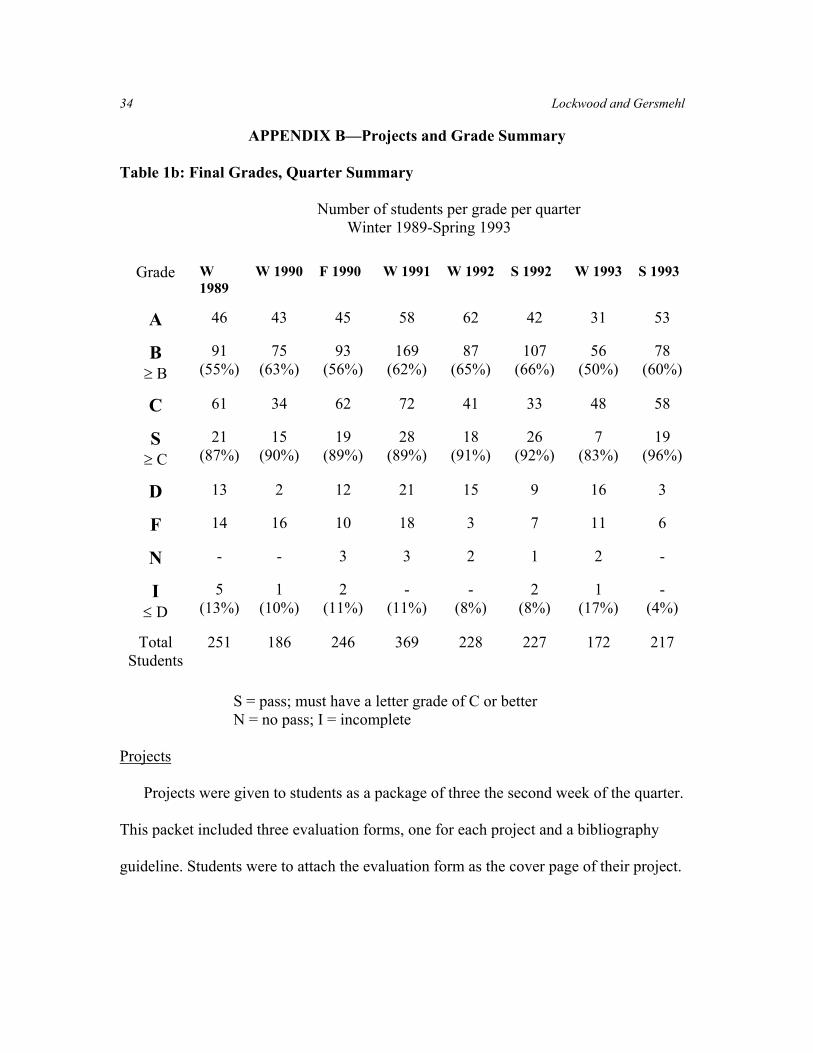
APPENDIX B—Projects and Grade Summary Table 1b: Final Grades, Quarter Summary
Number of students per grade per quarter
Winter 1989-Spring 1993
Grade W 1989
W 1990
F 1990
W 1991
W 1992
S 1992
W 1993
S 1993
A
46
43
45
58
62
42
31
53
B
≥ B
91
(55%)
75
(63%)
93
(56%)
169
(62%)
87
(65%)
107
(66%)
56
(50%)
78
(60%)
C
61
34
62
72
41
33
48
58
S ≥ C
21
(87%)
15
(90%)
19
(89%)
28
(89%)
18
(91%)
26
(92%)
7
(83%)
19
(96%)
D
13
2
12
21
15
9
16
3
F
14
16
10
18
3
7
11
6
N
-
-
3
3
2
1
2
-
I ≤ D
5
(13%)
1
(10%)
2
(11%)
-
(11%)
-
(8%)
2
(8%)
1
(17%)
-
(4%)
Total Students
251
186
246
369
228
227
172
217
S = pass; must have a letter grade of C or better N = no pass; I = incomplete
Projects
Projects were given to students as a package of three the second week of the quarter.
This packet included three evaluation forms, one for each project and a bibliography
guideline. Students were to attach the evaluation form as the cover page of their project.

Evaluating Students’ Ability to Integrate Written and Visual Communications 35
Graders commented on student performance, photocopied the evaluation forms and
returned them to the students.
36 Lockwood and Gersmehl
Evaluating Students’ Ability to Integrate Written and Visual Communications 37
38 Lockwood and Gersmehl
Evaluating Students’ Ability to Integrate Written and Visual Communications 39
40 Lockwood and Gersmehl
Evaluating Students’ Ability to Integrate Written and Visual Communications 41
42 Lockwood and Gersmehl
Evaluating Students’ Ability to Integrate Written and Visual Communications 43
44 Lockwood and Gersmehl
Evaluating Students’ Ability to Integrate Written and Visual Communications 45
46 Lockwood and Gersmehl
Evaluating Students’ Ability to Integrate Written and Visual Communications 47
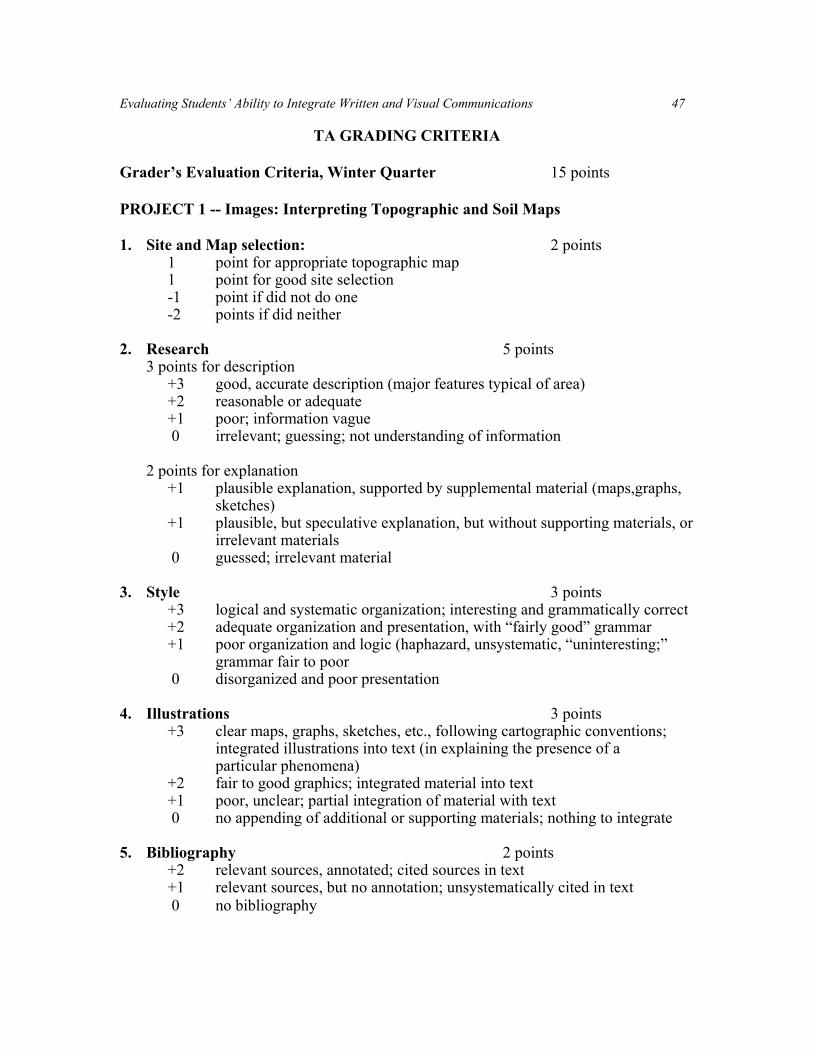
TA GRADING CRITERIA Grader’s Evaluation Criteria, Winter Quarter 15 points PROJECT 1 -- Images: Interpreting Topographic and Soil Maps 1. Site and Map selection: 2 points
1 point for appropriate topographic map 1 point for good site selection -1 point if did not do one -2 points if did neither
2. Research 5 points
3 points for description +3 good, accurate description (major features typical of area) +2 reasonable or adequate +1 poor; information vague 0 irrelevant; guessing; not understanding of information
2 points for explanation
+1 plausible explanation, supported by supplemental material (maps,graphs, sketches)
+1 plausible, but speculative explanation, but without supporting materials, or irrelevant materials 0 guessed; irrelevant material
3. Style 3 points
+3 logical and systematic organization; interesting and grammatically correct +2 adequate organization and presentation, with “fairly good” grammar +1 poor organization and logic (haphazard, unsystematic, “uninteresting;” grammar fair to poor 0 disorganized and poor presentation
4. Illustrations 3 points
+3 clear maps, graphs, sketches, etc., following cartographic conventions; integrated illustrations into text (in explaining the presence of a
particular phenomena) +2 fair to good graphics; integrated material into text +1 poor, unclear; partial integration of material with text 0 no appending of additional or supporting materials; nothing to integrate
5. Bibliography 2 points
+2 relevant sources, annotated; cited sources in text +1 relevant sources, but no annotation; unsystematically cited in text 0 no bibliography
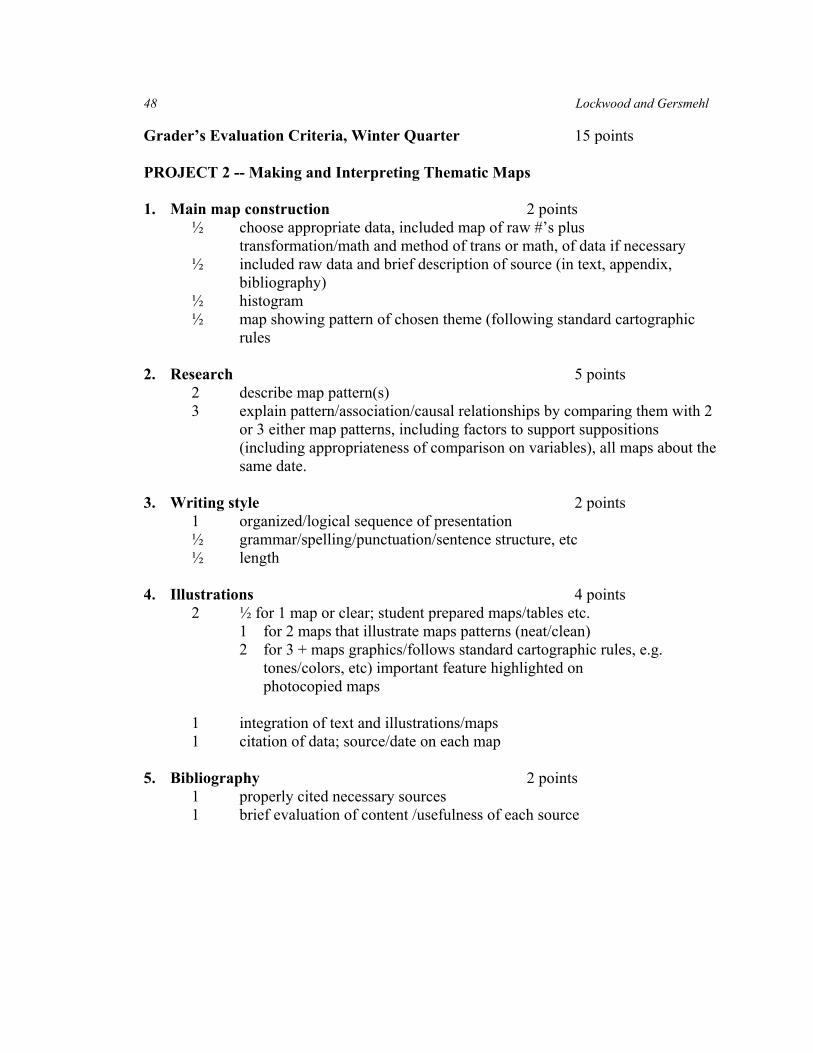
48 Lockwood and Gersmehl
Grader’s Evaluation Criteria, Winter Quarter 15 points PROJECT 2 -- Making and Interpreting Thematic Maps 1. Main map construction 2 points
½ choose appropriate data, included map of raw #’s plus transformation/math and method of trans or math, of data if necessary
½ included raw data and brief description of source (in text, appendix, bibliography)
½ histogram ½ map showing pattern of chosen theme (following standard cartographic
rules 2. Research 5 points
2 describe map pattern(s) 3 explain pattern/association/causal relationships by comparing them with 2
or 3 either map patterns, including factors to support suppositions (including appropriateness of comparison on variables), all maps about the same date.
3. Writing style 2 points
1 organized/logical sequence of presentation ½ grammar/spelling/punctuation/sentence structure, etc ½ length
4. Illustrations 4 points
2 ½ for 1 map or clear; student prepared maps/tables etc. 1 for 2 maps that illustrate maps patterns (neat/clean) 2 for 3 + maps graphics/follows standard cartographic rules, e.g. tones/colors, etc) important feature highlighted on
photocopied maps
1 integration of text and illustrations/maps 1 citation of data; source/date on each map
5. Bibliography 2 points
1 properly cited necessary sources 1 brief evaluation of content /usefulness of each source
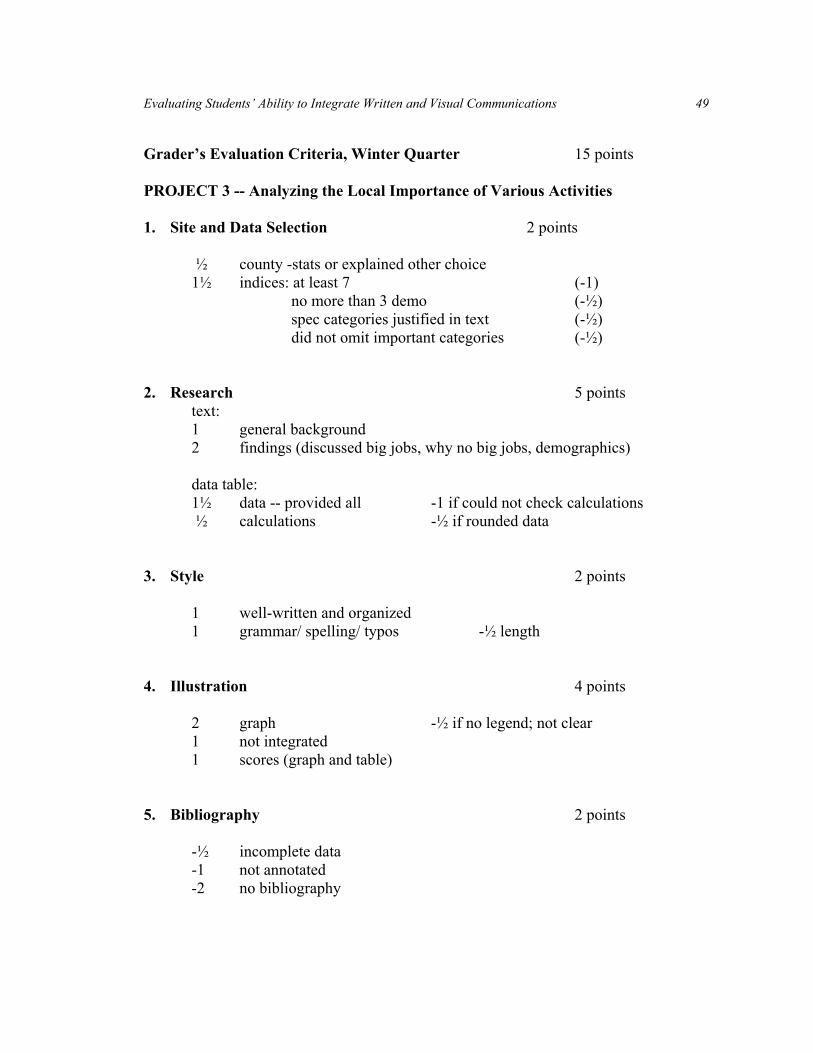
Evaluating Students’ Ability to Integrate Written and Visual Communications 49
Grader’s Evaluation Criteria, Winter Quarter 15 points PROJECT 3 -- Analyzing the Local Importance of Various Activities 1. Site and Data Selection 2 points
½ county -stats or explained other choice 1½ indices: at least 7 (-1)
no more than 3 demo (-½) spec categories justified in text (-½) did not omit important categories (-½) 2. Research 5 points
text: 1 general background 2 findings (discussed big jobs, why no big jobs, demographics)
data table: 1½ data -- provided all -1 if could not check calculations ½ calculations -½ if rounded data
3. Style 2 points
1 well-written and organized 1 grammar/ spelling/ typos -½ length
4. Illustration 4 points
2 graph -½ if no legend; not clear 1 not integrated 1 scores (graph and table)
5. Bibliography 2 points
-½ incomplete data -1 not annotated -2 no bibliography
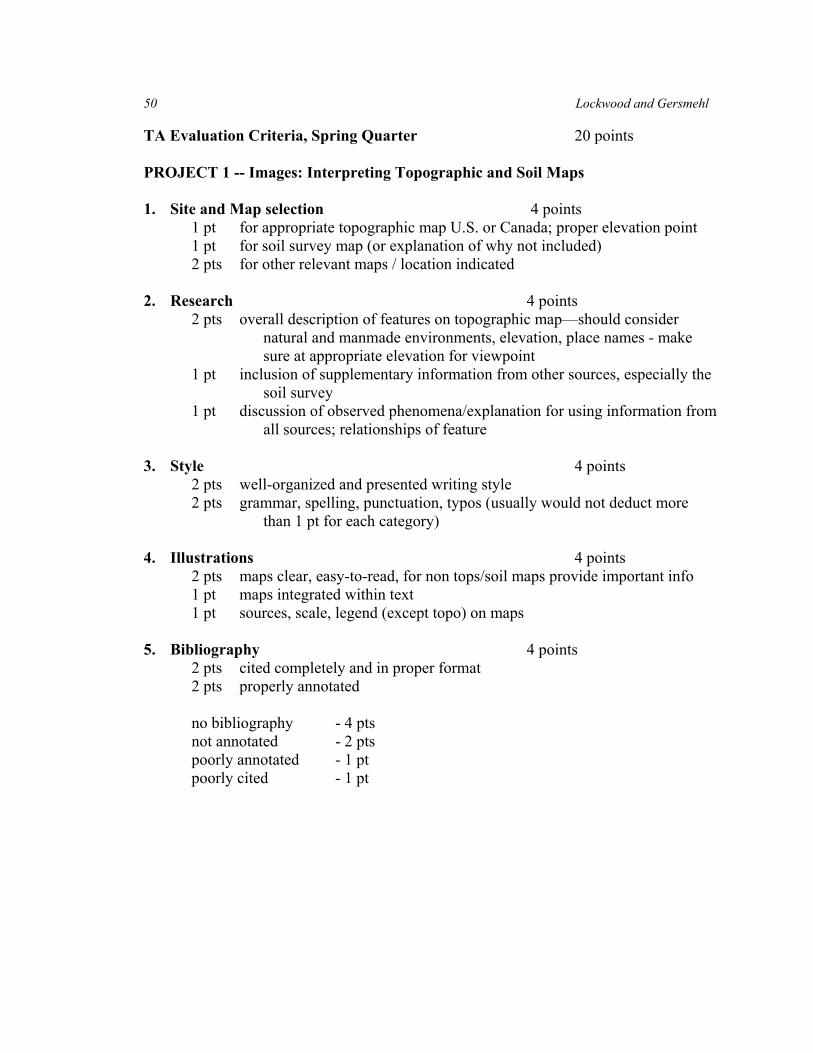
50 Lockwood and Gersmehl
TA Evaluation Criteria, Spring Quarter 20 points PROJECT 1 -- Images: Interpreting Topographic and Soil Maps 1. Site and Map selection 4 points
1 pt for appropriate topographic map U.S. or Canada; proper elevation point 1 pt for soil survey map (or explanation of why not included) 2 pts for other relevant maps / location indicated
2. Research 4 points 2 pts overall description of features on topographic map—should consider
natural and manmade environments, elevation, place names - make sure at appropriate elevation for viewpoint
1 pt inclusion of supplementary information from other sources, especially the soil survey
1 pt discussion of observed phenomena/explanation for using information from all sources; relationships of feature
3. Style 4 points
2 pts well-organized and presented writing style 2 pts grammar, spelling, punctuation, typos (usually would not deduct more
than 1 pt for each category) 4. Illustrations 4 points
2 pts maps clear, easy-to-read, for non tops/soil maps provide important info 1 pt maps integrated within text 1 pt sources, scale, legend (except topo) on maps
5. Bibliography 4 points
2 pts cited completely and in proper format 2 pts properly annotated
no bibliography - 4 pts not annotated - 2 pts poorly annotated - 1 pt poorly cited - 1 pt
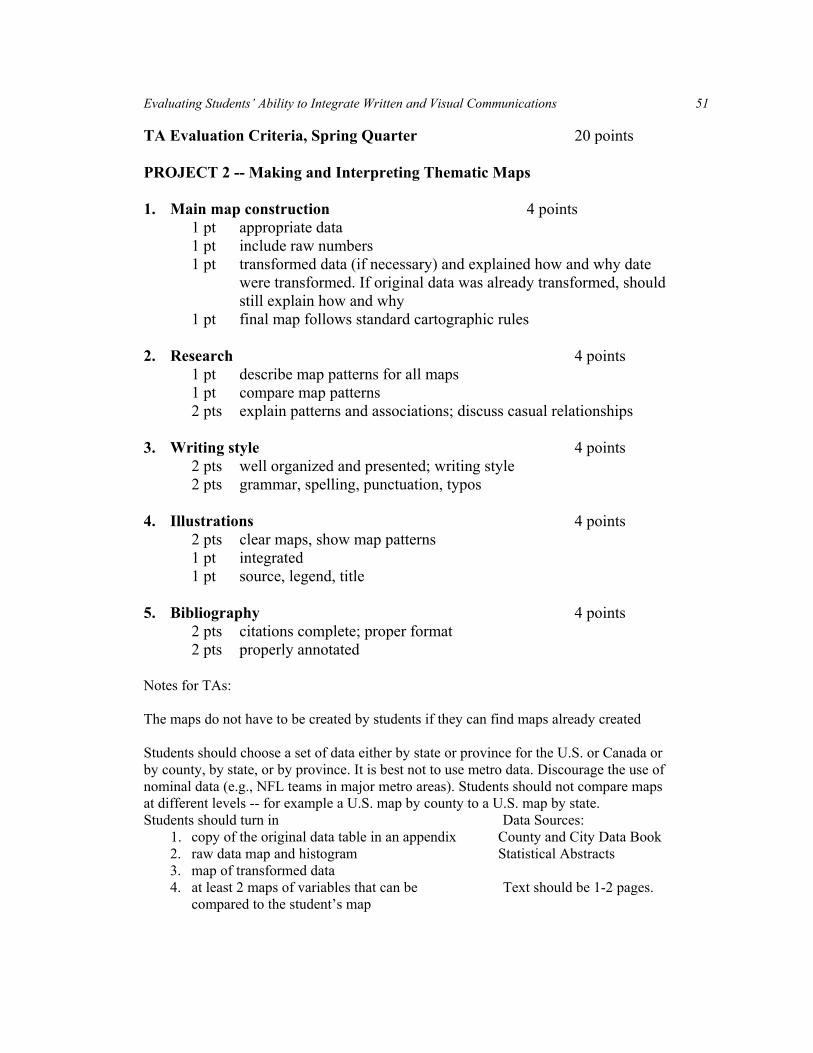
Evaluating Students’ Ability to Integrate Written and Visual Communications 51
TA Evaluation Criteria, Spring Quarter 20 points PROJECT 2 -- Making and Interpreting Thematic Maps 1. Main map construction 4 points
1 pt appropriate data 1 pt include raw numbers 1 pt transformed data (if necessary) and explained how and why date were transformed. If original data was already transformed, should still explain how and why 1 pt final map follows standard cartographic rules
2. Research 4 points
1 pt describe map patterns for all maps 1 pt compare map patterns 2 pts explain patterns and associations; discuss casual relationships
3. Writing style 4 points
2 pts well organized and presented; writing style 2 pts grammar, spelling, punctuation, typos
4. Illustrations 4 points
2 pts clear maps, show map patterns 1 pt integrated 1 pt source, legend, title
5. Bibliography 4 points
2 pts citations complete; proper format 2 pts properly annotated
Notes for TAs: The maps do not have to be created by students if they can find maps already created
Students should choose a set of data either by state or province for the U.S. or Canada or by county, by state, or by province. It is best not to use metro data. Discourage the use of nominal data (e.g., NFL teams in major metro areas). Students should not compare maps at different levels -- for example a U.S. map by county to a U.S. map by state. Students should turn in Data Sources:
1. copy of the original data table in an appendix County and City Data Book 2. raw data map and histogram Statistical Abstracts 3. map of transformed data 4. at least 2 maps of variables that can be Text should be 1-2 pages.
compared to the student’s map
52 Lockwood and Gersmehl
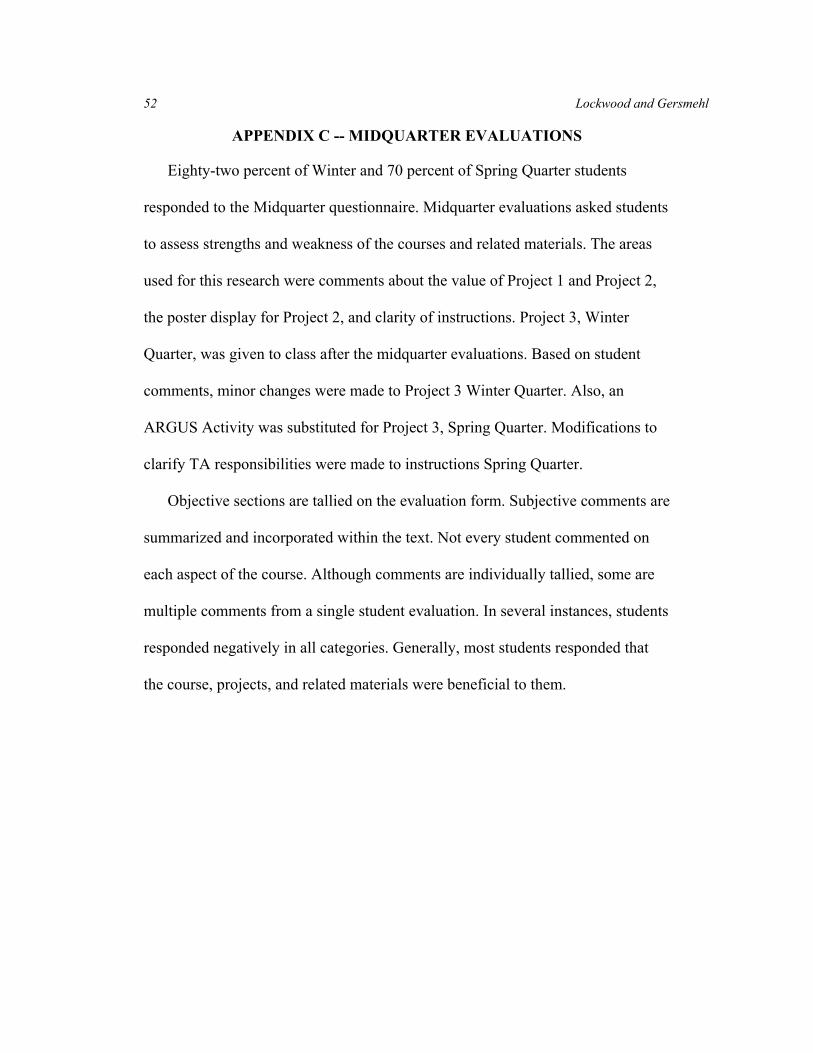
APPENDIX C -- MIDQUARTER EVALUATIONS Eighty-two percent of Winter and 70 percent of Spring Quarter students
responded to the Midquarter questionnaire. Midquarter evaluations asked students
to assess strengths and weakness of the courses and related materials. The areas
used for this research were comments about the value of Project 1 and Project 2,
the poster display for Project 2, and clarity of instructions. Project 3, Winter
Quarter, was given to class after the midquarter evaluations. Based on student
comments, minor changes were made to Project 3 Winter Quarter. Also, an
ARGUS Activity was substituted for Project 3, Spring Quarter. Modifications to
clarify TA responsibilities were made to instructions Spring Quarter.
Objective sections are tallied on the evaluation form. Subjective comments are
summarized and incorporated within the text. Not every student commented on
each aspect of the course. Although comments are individually tallied, some are
multiple comments from a single student evaluation. In several instances, students
responded negatively in all categories. Generally, most students responded that
the course, projects, and related materials were beneficial to them.
Evaluating Students’ Ability to Integrate Written and Visual Communications 53
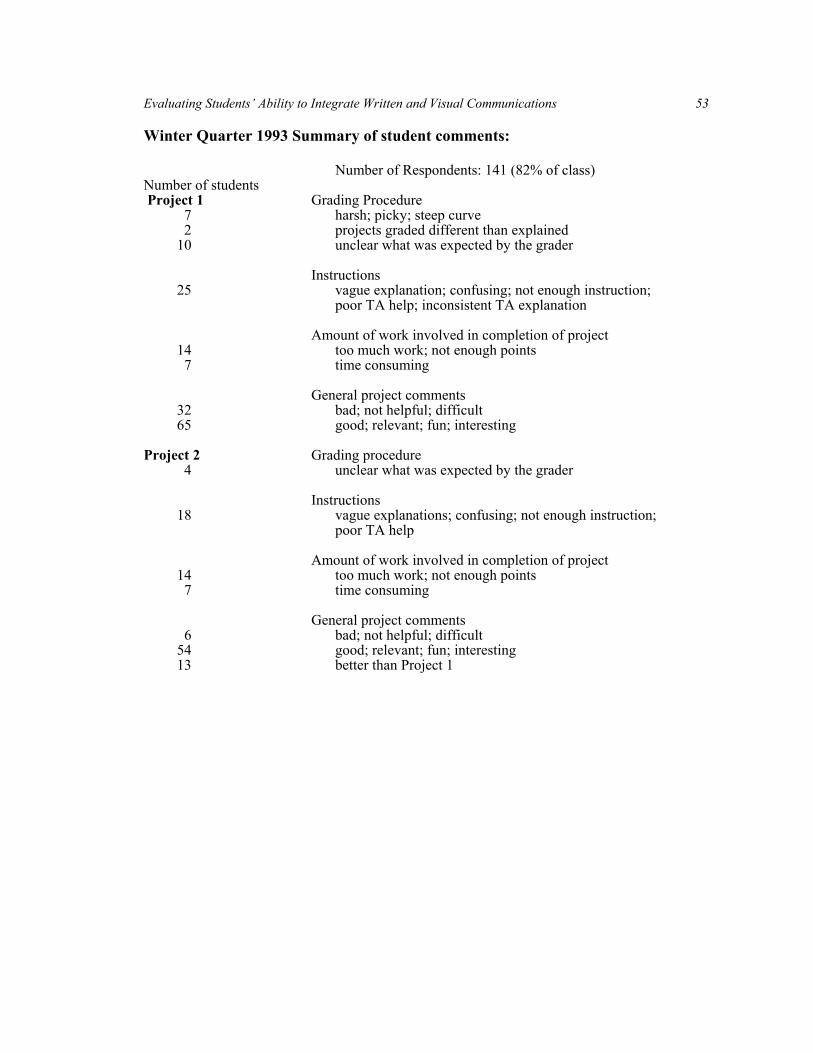
Winter Quarter 1993 Summary of student comments:
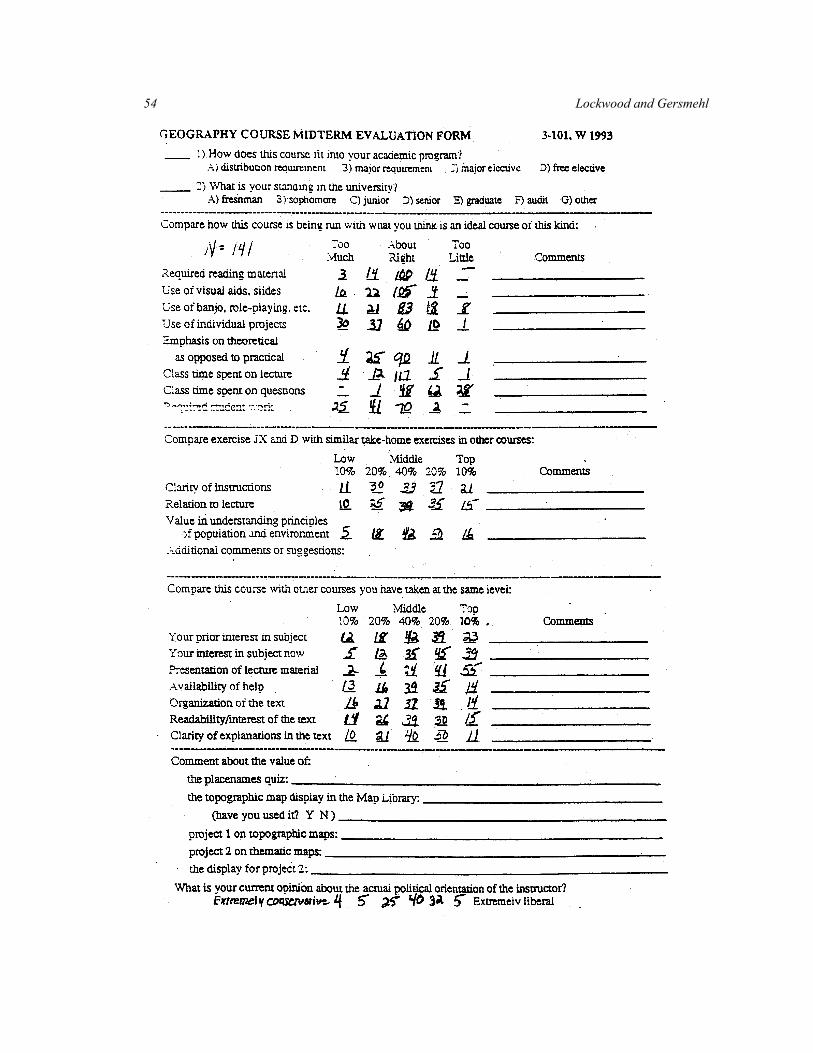
Number of Respondents: 141 (82% of class) Number of students Project 1 Grading Procedure 7 harsh; picky; steep curve 2 projects graded different than explained 10 unclear what was expected by the grader Instructions 25 vague explanation; confusing; not enough instruction;
poor TA help; inconsistent TA explanation Amount of work involved in completion of project 14 too much work; not enough points 7 time consuming General project comments 32 bad; not helpful; difficult 65 good; relevant; fun; interesting Project 2 Grading procedure 4 unclear what was expected by the grader Instructions 18 vague explanations; confusing; not enough instruction;
poor TA help Amount of work involved in completion of project 14 too much work; not enough points 7 time consuming General project comments 6 bad; not helpful; difficult 54 good; relevant; fun; interesting 13 better than Project 1
54 Lockwood and Gersmehl
Evaluating Students’ Ability to Integrate Written and Visual Communications 55
56 Lockwood and Gersmehl
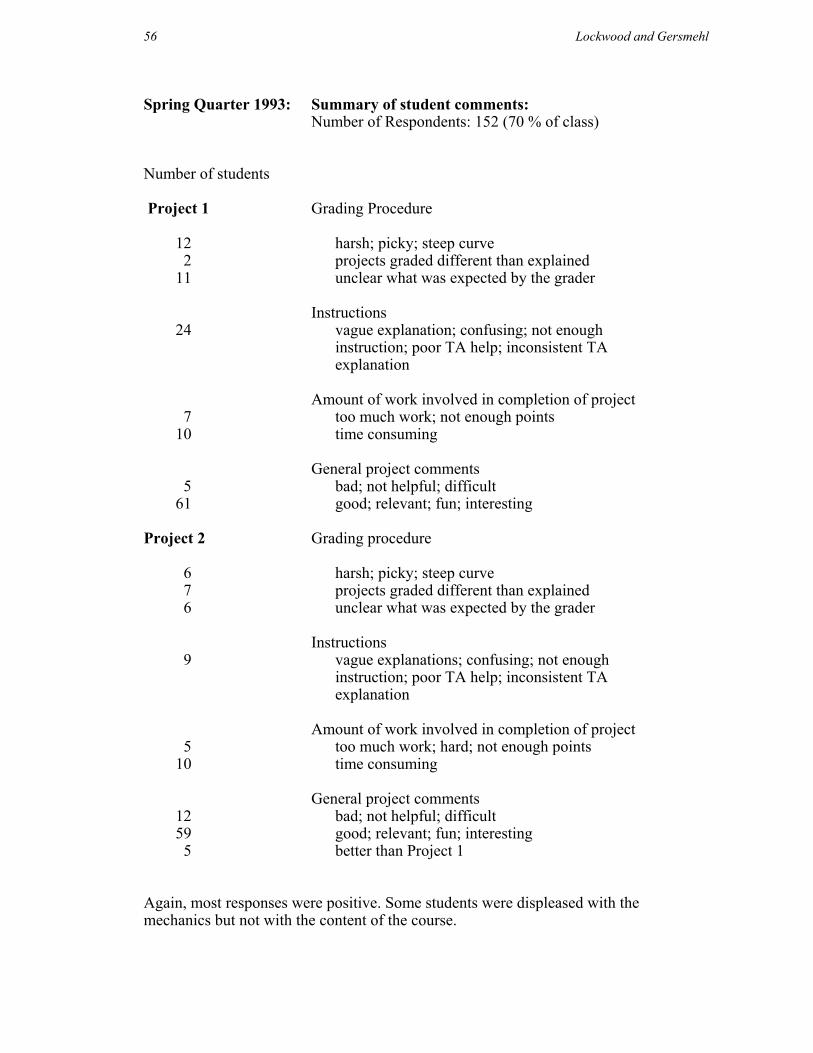
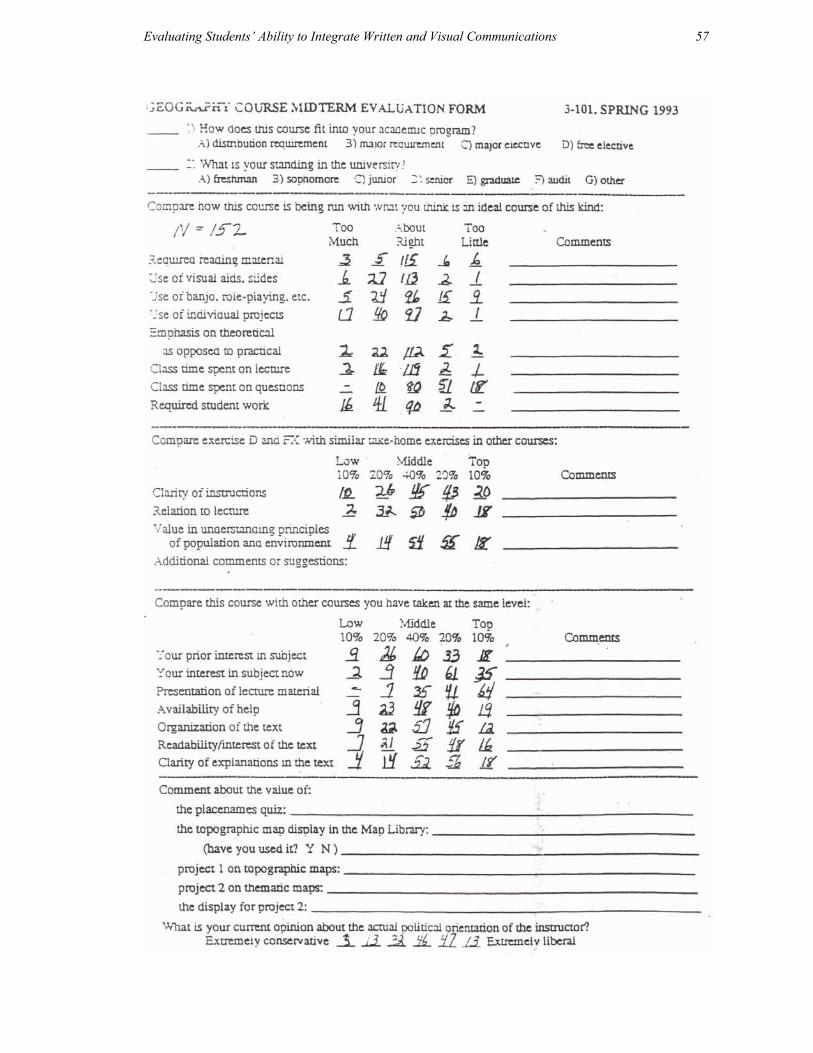
Spring Quarter 1993: Summary of student comments: Number of Respondents: 152 (70 % of class) Number of students Project 1 Grading Procedure 12 harsh; picky; steep curve 2 projects graded different than explained 11 unclear what was expected by the grader Instructions 24 vague explanation; confusing; not enough
instruction; poor TA help; inconsistent TA explanation
Amount of work involved in completion of project 7 too much work; not enough points 10 time consuming General project comments 5 bad; not helpful; difficult 61 good; relevant; fun; interesting Project 2 Grading procedure 6 harsh; picky; steep curve 7 projects graded different than explained 6 unclear what was expected by the grader Instructions 9 vague explanations; confusing; not enough
instruction; poor TA help; inconsistent TA explanation
Amount of work involved in completion of project 5 too much work; hard; not enough points 10 time consuming General project comments 12 bad; not helpful; difficult 59 good; relevant; fun; interesting 5 better than Project 1 Again, most responses were positive. Some students were displeased with the mechanics but not with the content of the course.
Evaluating Students’ Ability to Integrate Written and Visual Communications 57
58 Lockwood and Gersmehl
Evaluating Students’ Ability to Integrate Written and Visual Communications 59
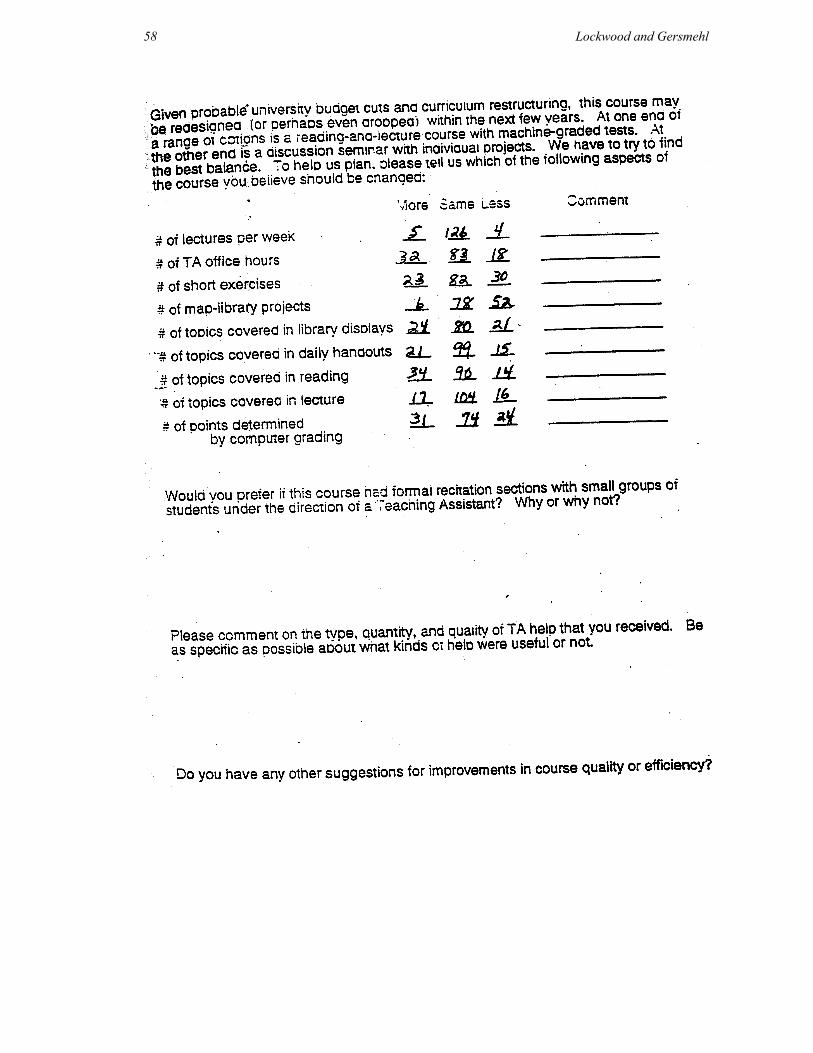
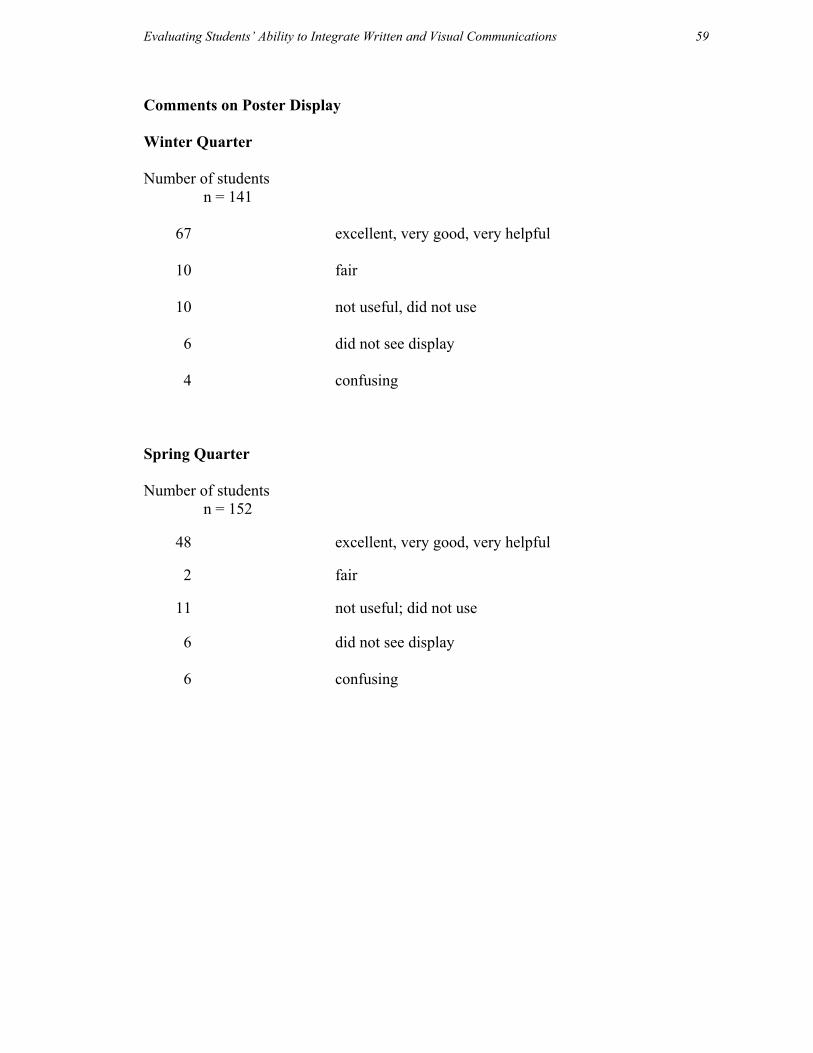
Comments on Poster Display Winter Quarter Number of students n = 141 67 excellent, very good, very helpful 10 fair 10 not useful, did not use 6 did not see display 4 confusing Spring Quarter Number of students n = 152 48 excellent, very good, very helpful 2 fair 11 not useful; did not use 6 did not see display 6 confusing
60 Lockwood and Gersmehl
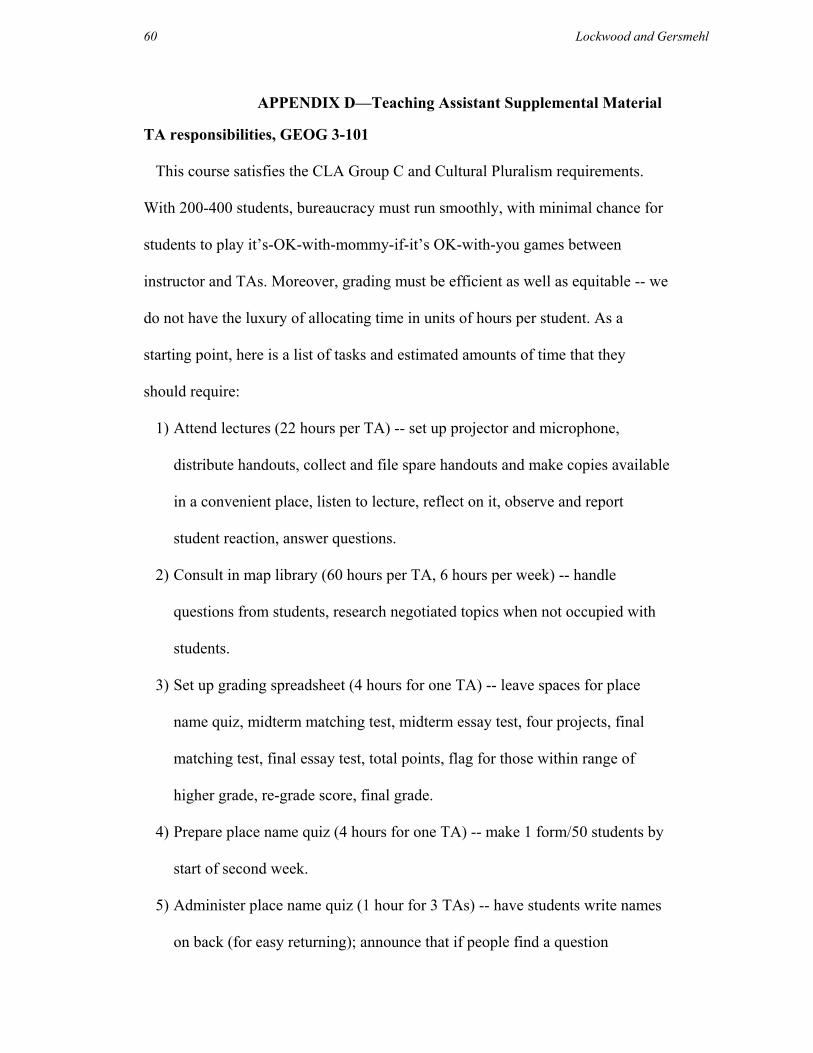
APPENDIX D—Teaching Assistant Supplemental Material TA responsibilities, GEOG 3-101
This course satisfies the CLA Group C and Cultural Pluralism requirements.
With 200-400 students, bureaucracy must run smoothly, with minimal chance for
students to play it’s-OK-with-mommy-if-it’s OK-with-you games between
instructor and TAs. Moreover, grading must be efficient as well as equitable -- we
do not have the luxury of allocating time in units of hours per student. As a
starting point, here is a list of tasks and estimated amounts of time that they
should require:
1) Attend lectures (22 hours per TA) -- set up projector and microphone,
distribute handouts, collect and file spare handouts and make copies available
in a convenient place, listen to lecture, reflect on it, observe and report
student reaction, answer questions.
2) Consult in map library (60 hours per TA, 6 hours per week) -- handle
questions from students, research negotiated topics when not occupied with
students.
3) Set up grading spreadsheet (4 hours for one TA) -- leave spaces for place
name quiz, midterm matching test, midterm essay test, four projects, final
matching test, final essay test, total points, flag for those within range of
higher grade, re-grade score, final grade.
4) Prepare place name quiz (4 hours for one TA) -- make 1 form/50 students by
start of second week.
5) Administer place name quiz (1 hour for 3 TAs) -- have students write names
on back (for easy returning); announce that if people find a question
Evaluating Students’ Ability to Integrate Written and Visual Communications 61
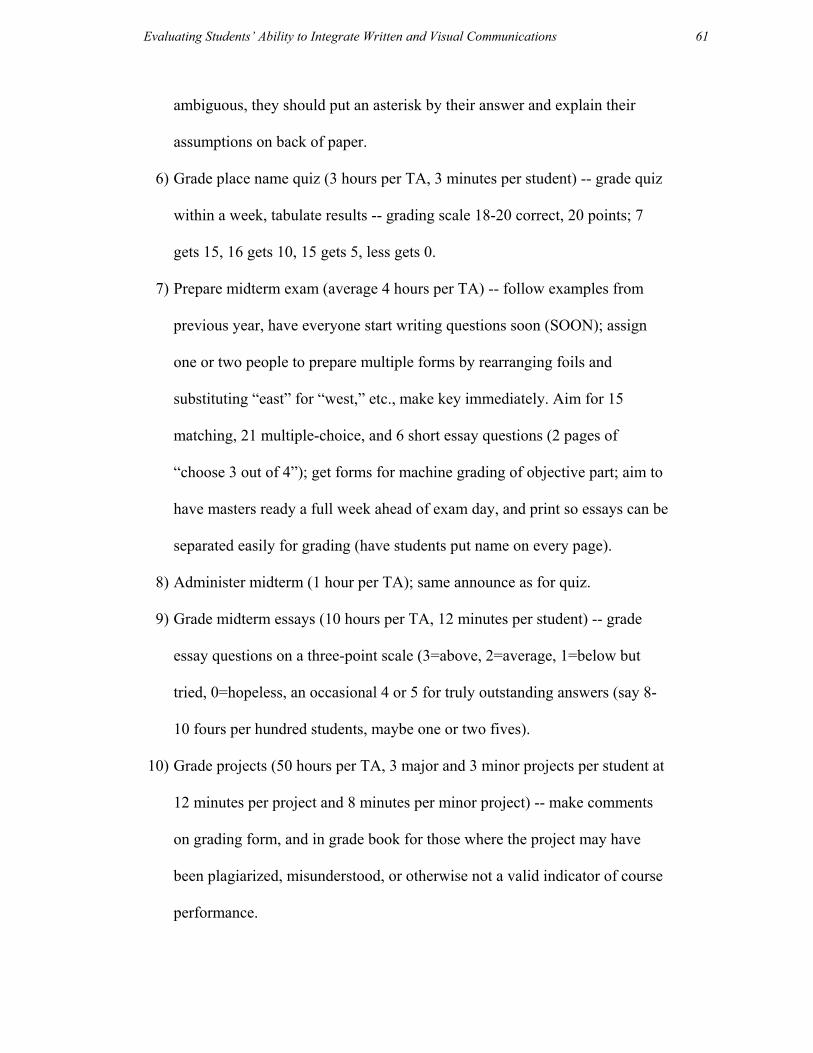
ambiguous, they should put an asterisk by their answer and explain their
assumptions on back of paper.
6) Grade place name quiz (3 hours per TA, 3 minutes per student) -- grade quiz
within a week, tabulate results -- grading scale 18-20 correct, 20 points; 7
gets 15, 16 gets 10, 15 gets 5, less gets 0.
7) Prepare midterm exam (average 4 hours per TA) -- follow examples from
previous year, have everyone start writing questions soon (SOON); assign
one or two people to prepare multiple forms by rearranging foils and
substituting “east” for “west,” etc., make key immediately. Aim for 15
matching, 21 multiple-choice, and 6 short essay questions (2 pages of
“choose 3 out of 4”); get forms for machine grading of objective part; aim to
have masters ready a full week ahead of exam day, and print so essays can be
separated easily for grading (have students put name on every page).
8) Administer midterm (1 hour per TA); same announce as for quiz.
9) Grade midterm essays (10 hours per TA, 12 minutes per student) -- grade
essay questions on a three-point scale (3=above, 2=average, 1=below but
tried, 0=hopeless, an occasional 4 or 5 for truly outstanding answers (say 8-
10 fours per hundred students, maybe one or two fives).
10) Grade projects (50 hours per TA, 3 major and 3 minor projects per student at
12 minutes per project and 8 minutes per minor project) -- make comments
on grading form, and in grade book for those where the project may have
been plagiarized, misunderstood, or otherwise not a valid indicator of course
performance.
62 Lockwood and Gersmehl
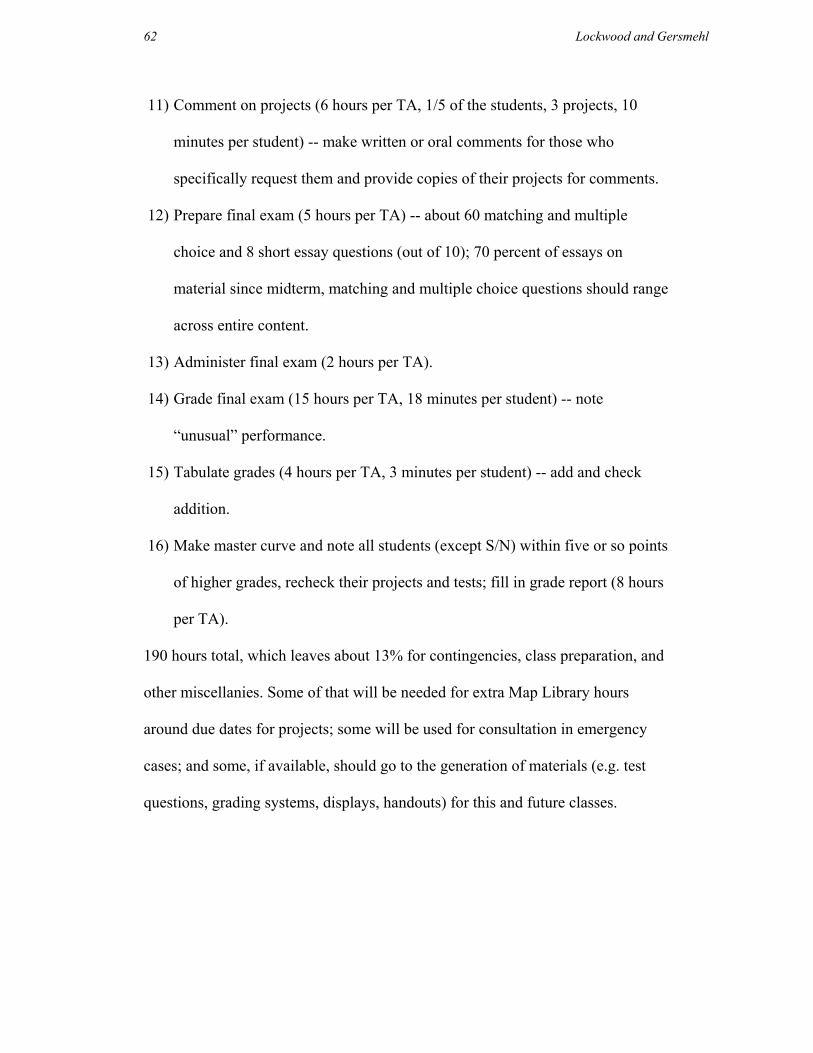
11) Comment on projects (6 hours per TA, 1/5 of the students, 3 projects, 10
minutes per student) -- make written or oral comments for those who
specifically request them and provide copies of their projects for comments.
12) Prepare final exam (5 hours per TA) -- about 60 matching and multiple
choice and 8 short essay questions (out of 10); 70 percent of essays on
material since midterm, matching and multiple choice questions should range
across entire content.
13) Administer final exam (2 hours per TA).
14) Grade final exam (15 hours per TA, 18 minutes per student) -- note
“unusual” performance.
15) Tabulate grades (4 hours per TA, 3 minutes per student) -- add and check
addition.
16) Make master curve and note all students (except S/N) within five or so points
of higher grades, recheck their projects and tests; fill in grade report (8 hours
per TA).
190 hours total, which leaves about 13% for contingencies, class preparation, and
other miscellanies. Some of that will be needed for extra Map Library hours
around due dates for projects; some will be used for consultation in emergency
cases; and some, if available, should go to the generation of materials (e.g. test
questions, grading systems, displays, handouts) for this and future classes.
Evaluating Students’ Ability to Integrate Written and Visual Communications 53
EVALUATING STUDENTS’ ABILITY TO INTEGRATE WRITTEN AND
VISUAL COMMUNICATION
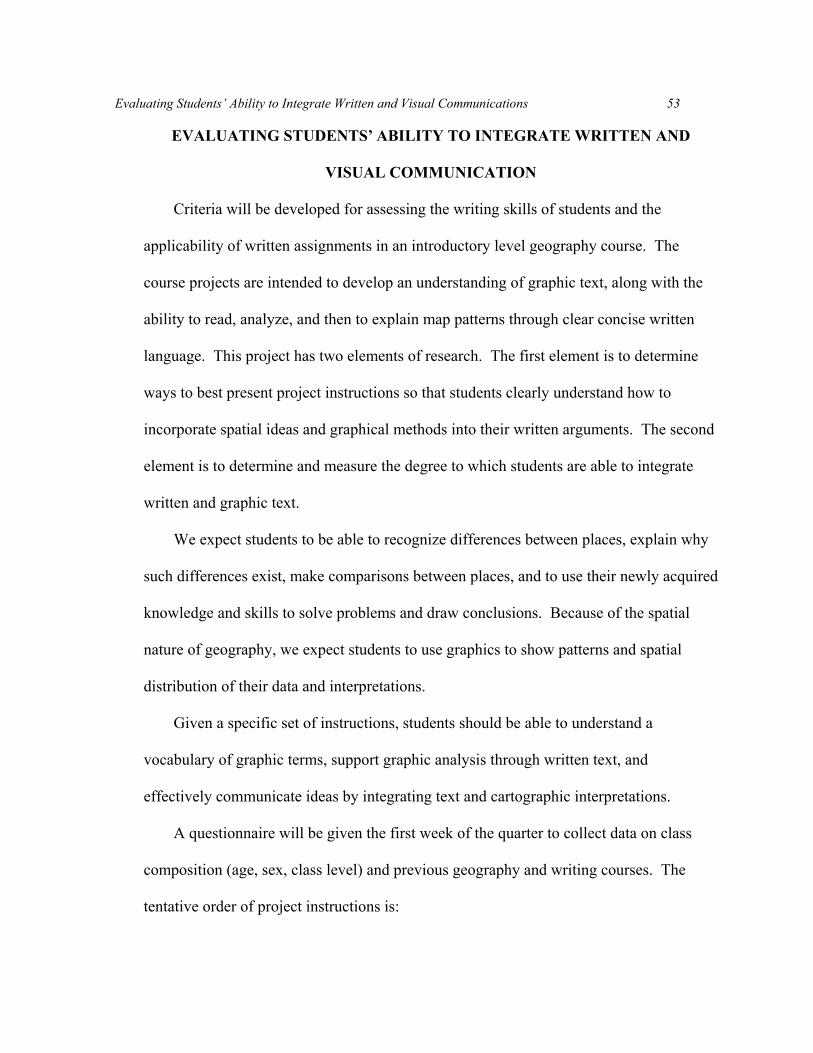
Criteria will be developed for assessing the writing skills of students and the
applicability of written assignments in an introductory level geography course. The
course projects are intended to develop an understanding of graphic text, along with the
ability to read, analyze, and then to explain map patterns through clear concise written
language. This project has two elements of research. The first element is to determine
ways to best present project instructions so that students clearly understand how to
incorporate spatial ideas and graphical methods into their written arguments. The second
element is to determine and measure the degree to which students are able to integrate
written and graphic text.
We expect students to be able to recognize differences between places, explain why
such differences exist, make comparisons between places, and to use their newly acquired
knowledge and skills to solve problems and draw conclusions. Because of the spatial
nature of geography, we expect students to use graphics to show patterns and spatial
distribution of their data and interpretations.
Given a specific set of instructions, students should be able to understand a
vocabulary of graphic terms, support graphic analysis through written text, and
effectively communicate ideas by integrating text and cartographic interpretations.
A questionnaire will be given the first week of the quarter to collect data on class
composition (age, sex, class level) and previous geography and writing courses. The
tentative order of project instructions is:
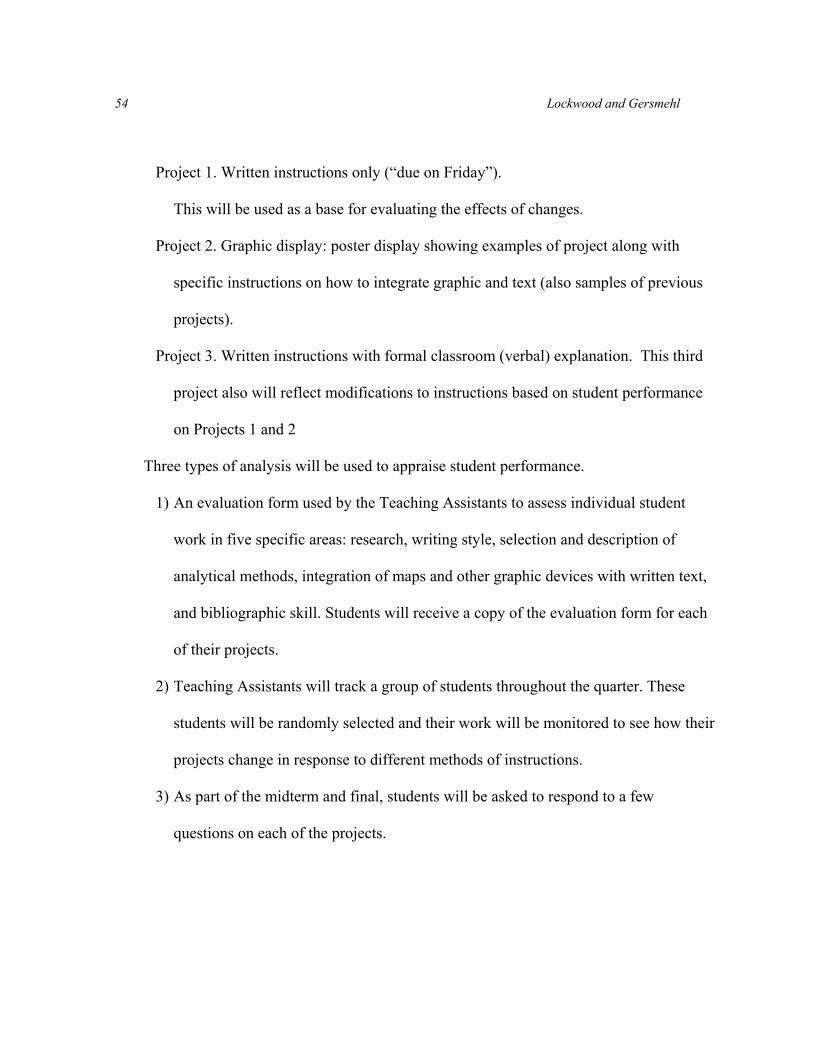
54 Lockwood and Gersmehl
Project 1. Written instructions only (“due on Friday”).
This will be used as a base for evaluating the effects of changes.
Project 2. Graphic display: poster display showing examples of project along with
specific instructions on how to integrate graphic and text (also samples of previous
projects).
Project 3. Written instructions with formal classroom (verbal) explanation. This third
project also will reflect modifications to instructions based on student performance
on Projects 1 and 2
Three types of analysis will be used to appraise student performance.
1) An evaluation form used by the Teaching Assistants to assess individual student
work in five specific areas: research, writing style, selection and description of
analytical methods, integration of maps and other graphic devices with written text,
and bibliographic skill. Students will receive a copy of the evaluation form for each
of their projects.
2) Teaching Assistants will track a group of students throughout the quarter. These
students will be randomly selected and their work will be monitored to see how their
projects change in response to different methods of instructions.
3) As part of the midterm and final, students will be asked to respond to a few
questions on each of the projects.
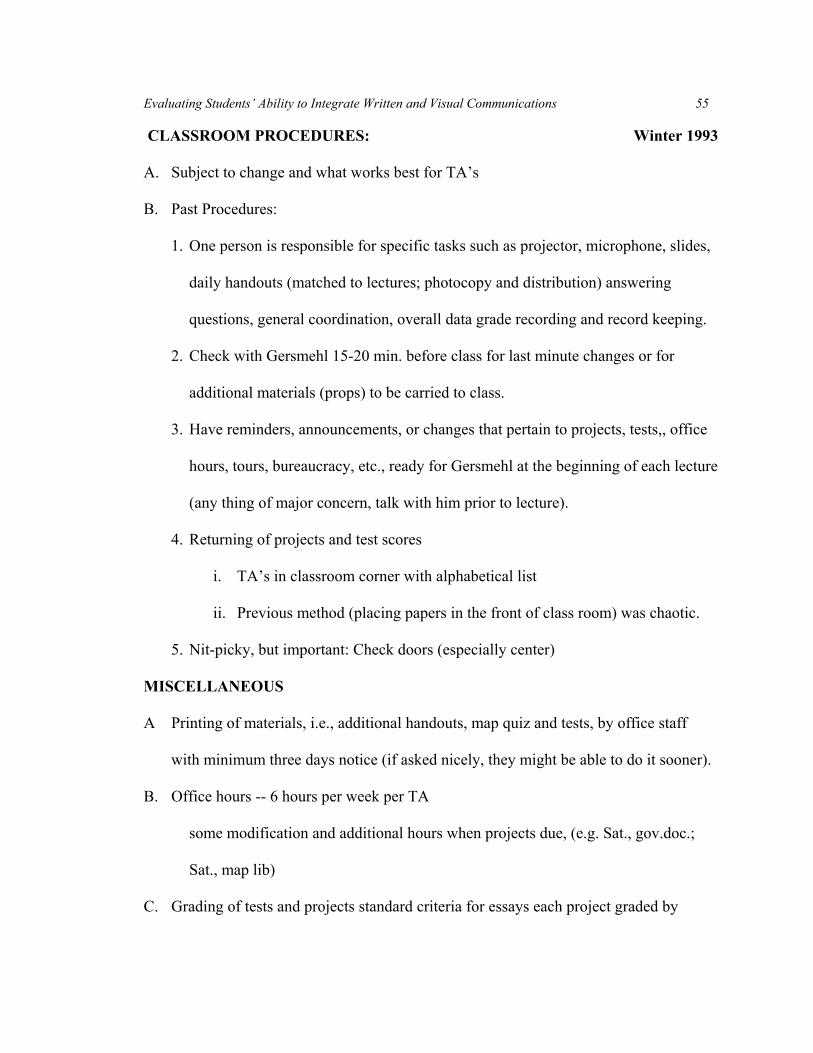
Evaluating Students’ Ability to Integrate Written and Visual Communications 55
CLASSROOM PROCEDURES: Winter 1993
A. Subject to change and what works best for TA’s
B. Past Procedures:
1. One person is responsible for specific tasks such as projector, microphone, slides,
daily handouts (matched to lectures; photocopy and distribution) answering
questions, general coordination, overall data grade recording and record keeping.
2. Check with Gersmehl 15-20 min. before class for last minute changes or for
additional materials (props) to be carried to class.
3. Have reminders, announcements, or changes that pertain to projects, tests,, office
hours, tours, bureaucracy, etc., ready for Gersmehl at the beginning of each lecture
(any thing of major concern, talk with him prior to lecture).
4. Returning of projects and test scores
i. TA’s in classroom corner with alphabetical list
ii. Previous method (placing papers in the front of class room) was chaotic.
5. Nit-picky, but important: Check doors (especially center)
MISCELLANEOUS
A Printing of materials, i.e., additional handouts, map quiz and tests, by office staff
with minimum three days notice (if asked nicely, they might be able to do it sooner).
B. Office hours -- 6 hours per week per TA
some modification and additional hours when projects due, (e.g. Sat., gov.doc.;
Sat., map lib)
C. Grading of tests and projects standard criteria for essays each project graded by
56 Lockwood and Gersmehl
single TA.
D. Prepare lecture / explanation of a project, either for presentation in class or in ad hoc
sessions.
F. Possible extra help or ad hoc session(s) for further project help / explanation (maybe
one or two additional hours--scheduled a day or two after formal explanation or after
project has been handed out).
G. Set out annotated topographic map series that corresponds to lectures.
H. Keep a record of specific problems, gains, questions of a tracked group of students;
keep a record of their progress following provided guideline.
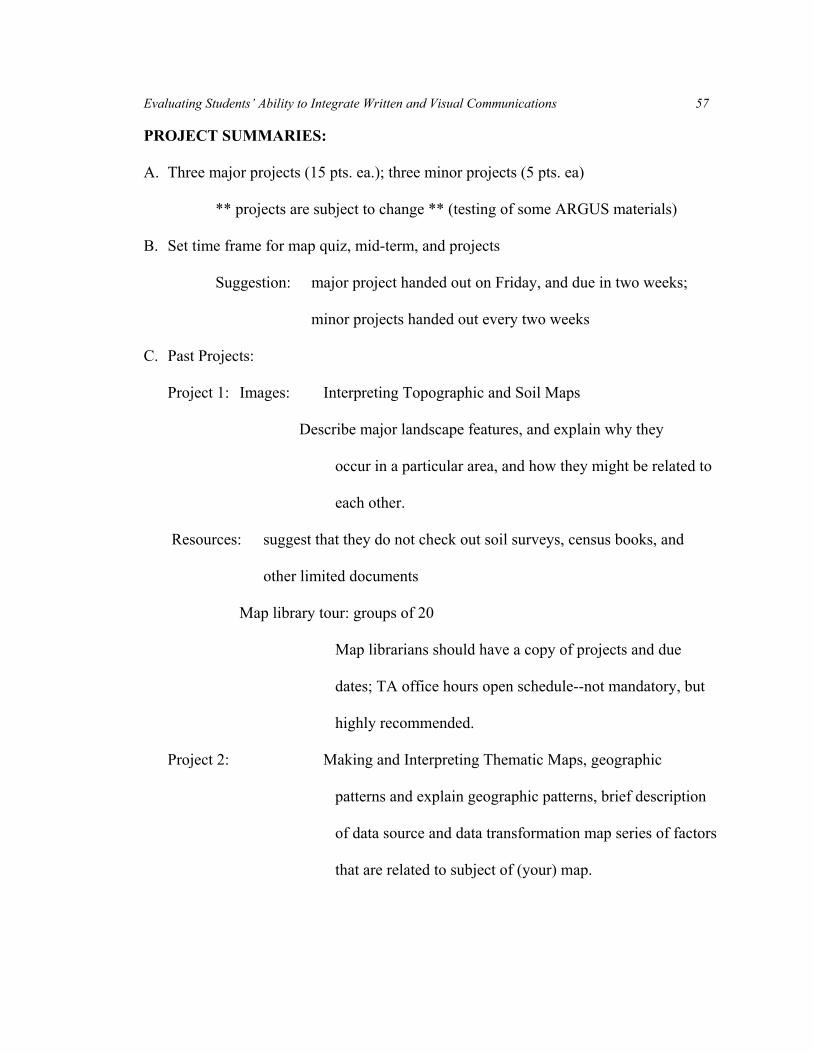
Evaluating Students’ Ability to Integrate Written and Visual Communications 57
PROJECT SUMMARIES:
A. Three major projects (15 pts. ea.); three minor projects (5 pts. ea)
** projects are subject to change ** (testing of some ARGUS materials)
B. Set time frame for map quiz, mid-term, and projects
Suggestion: major project handed out on Friday, and due in two weeks;
minor projects handed out every two weeks
C. Past Projects:
Project 1: Images: Interpreting Topographic and Soil Maps
Describe major landscape features, and explain why they
occur in a particular area, and how they might be related to
each other.
Resources: suggest that they do not check out soil surveys, census books, and
other limited documents
Map library tour: groups of 20
Map librarians should have a copy of projects and due
dates; TA office hours open schedule--not mandatory, but
highly recommended.
Project 2: Making and Interpreting Thematic Maps, geographic
patterns and explain geographic patterns, brief description
of data source and data transformation map series of factors
that are related to subject of (your) map.
58 Lockwood and Gersmehl
Project 3: Analyzing the Local Importance of Various Activities
(LQ), distinguish between basic/non-basic economic activity,
describe how people in a specific area make a living,
compare with general pattern: county to state, or state to
nation.
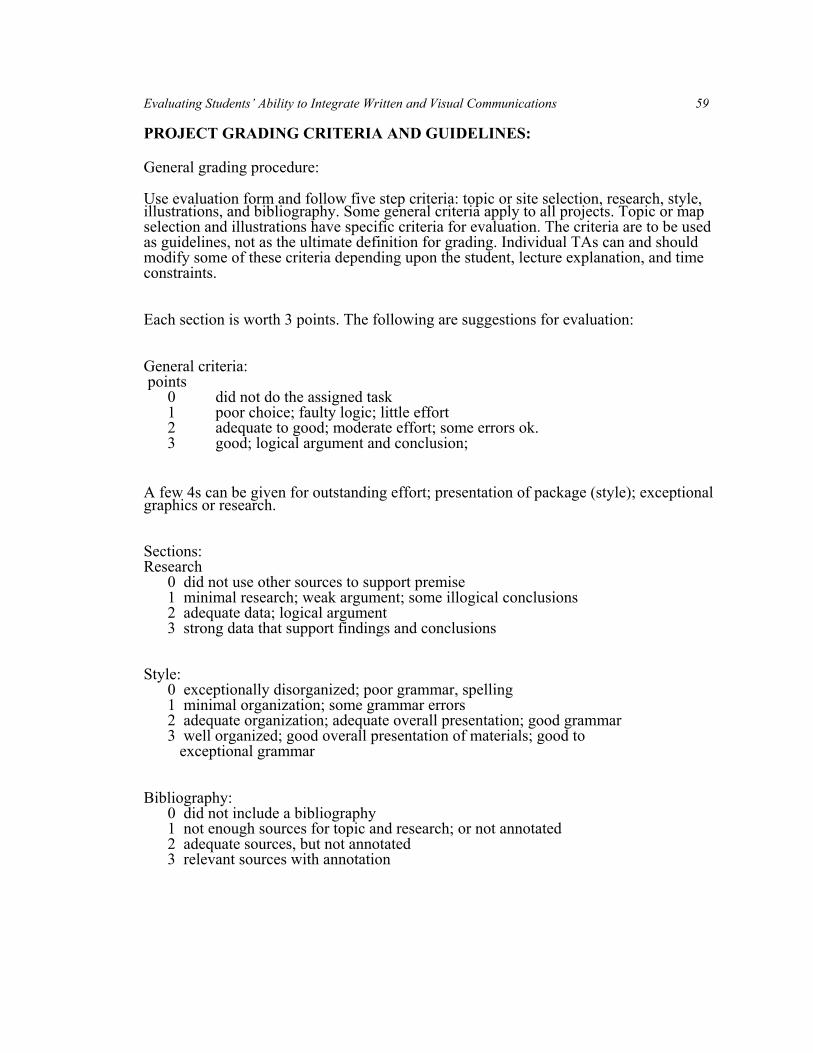
Evaluating Students’ Ability to Integrate Written and Visual Communications 59
PROJECT GRADING CRITERIA AND GUIDELINES:
General grading procedure:
Use evaluation form and follow five step criteria: topic or site selection, research, style, illustrations, and bibliography. Some general criteria apply to all projects. Topic or map selection and illustrations have specific criteria for evaluation. The criteria are to be used as guidelines, not as the ultimate definition for grading. Individual TAs can and should modify some of these criteria depending upon the student, lecture explanation, and time constraints.
Each section is worth 3 points. The following are suggestions for evaluation:
General criteria: points
0 did not do the assigned task 1 poor choice; faulty logic; little effort 2 adequate to good; moderate effort; some errors ok. 3 good; logical argument and conclusion;
A few 4s can be given for outstanding effort; presentation of package (style); exceptional graphics or research. Sections: Research
0 did not use other sources to support premise 1 minimal research; weak argument; some illogical conclusions 2 adequate data; logical argument 3 strong data that support findings and conclusions
Style:
0 exceptionally disorganized; poor grammar, spelling 1 minimal organization; some grammar errors 2 adequate organization; adequate overall presentation; good grammar 3 well organized; good overall presentation of materials; good to
exceptional grammar
Bibliography:
0 did not include a bibliography 1 not enough sources for topic and research; or not annotated 2 adequate sources, but not annotated 3 relevant sources with annotation
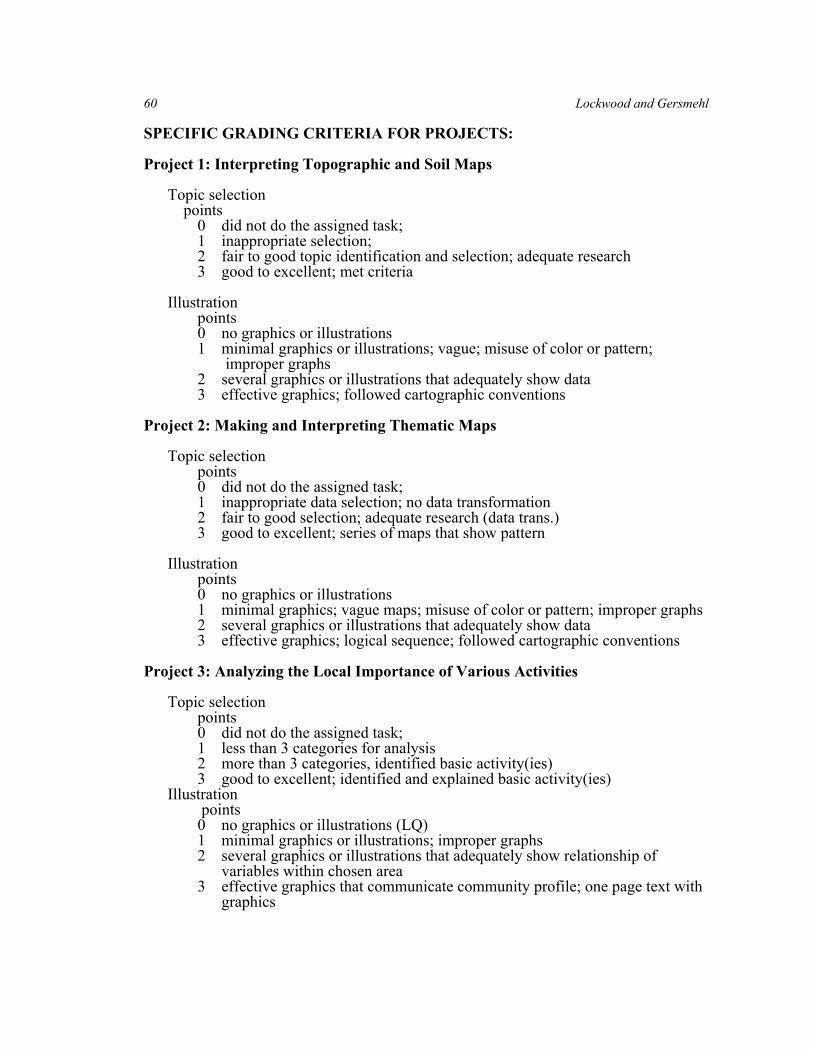
60 Lockwood and Gersmehl
SPECIFIC GRADING CRITERIA FOR PROJECTS: Project 1: Interpreting Topographic and Soil Maps
Topic selection
points 0 did not do the assigned task; 1 inappropriate selection; 2 fair to good topic identification and selection; adequate research 3 good to excellent; met criteria
Illustration
points 0 no graphics or illustrations 1 minimal graphics or illustrations; vague; misuse of color or pattern;
improper graphs 2 several graphics or illustrations that adequately show data 3 effective graphics; followed cartographic conventions
Project 2: Making and Interpreting Thematic Maps
Topic selection
points 0 did not do the assigned task; 1 inappropriate data selection; no data transformation 2 fair to good selection; adequate research (data trans.) 3 good to excellent; series of maps that show pattern
Illustration
points 0 no graphics or illustrations 1 minimal graphics; vague maps; misuse of color or pattern; improper graphs 2 several graphics or illustrations that adequately show data 3 effective graphics; logical sequence; followed cartographic conventions
Project 3: Analyzing the Local Importance of Various Activities
Topic selection
points 0 did not do the assigned task; 1 less than 3 categories for analysis 2 more than 3 categories, identified basic activity(ies) 3 good to excellent; identified and explained basic activity(ies)
Illustration points
0 no graphics or illustrations (LQ) 1 minimal graphics or illustrations; improper graphs 2 several graphics or illustrations that adequately show relationship of
variables within chosen area 3 effective graphics that communicate community profile; one page text with
graphics
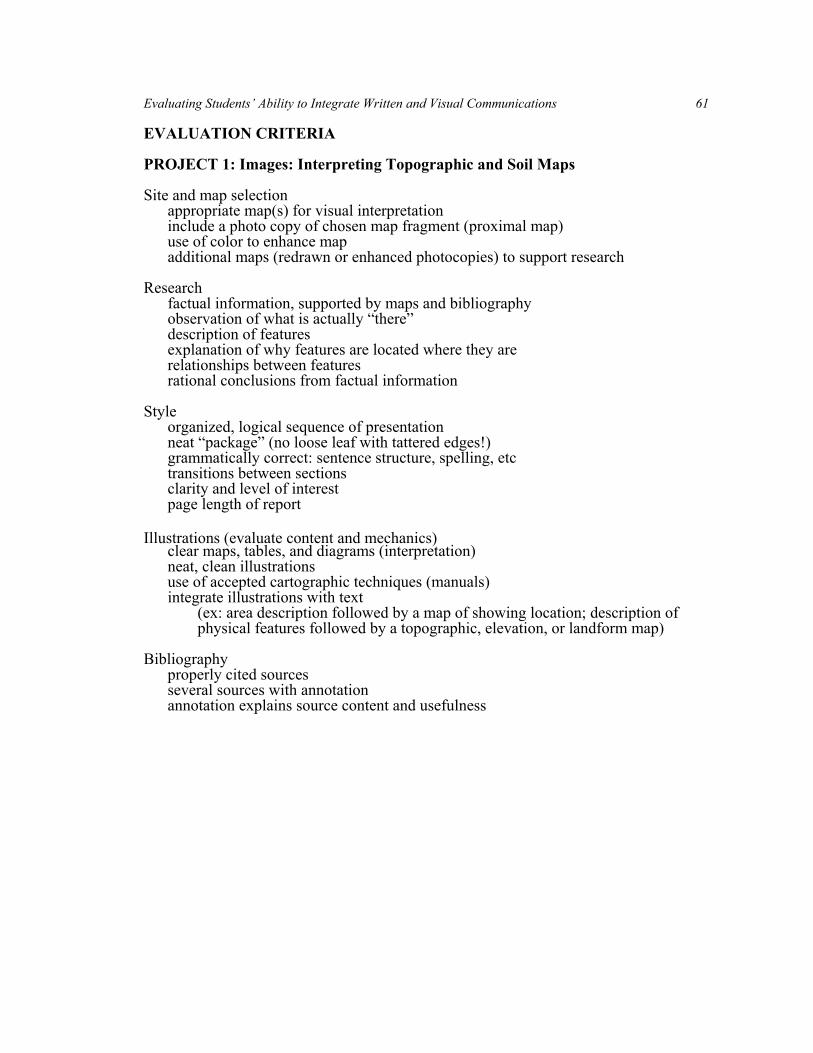
Evaluating Students’ Ability to Integrate Written and Visual Communications 61
EVALUATION CRITERIA PROJECT 1: Images: Interpreting Topographic and Soil Maps Site and map selection
appropriate map(s) for visual interpretation include a photo copy of chosen map fragment (proximal map) use of color to enhance map additional maps (redrawn or enhanced photocopies) to support research
Research
factual information, supported by maps and bibliography observation of what is actually “there” description of features explanation of why features are located where they are relationships between features rational conclusions from factual information
Style
organized, logical sequence of presentation neat “package” (no loose leaf with tattered edges!) grammatically correct: sentence structure, spelling, etc transitions between sections clarity and level of interest page length of report
Illustrations (evaluate content and mechanics) clear maps, tables, and diagrams (interpretation) neat, clean illustrations use of accepted cartographic techniques (manuals) integrate illustrations with text
(ex: area description followed by a map of showing location; description of physical features followed by a topographic, elevation, or landform map)
Bibliography
properly cited sources several sources with annotation annotation explains source content and usefulness
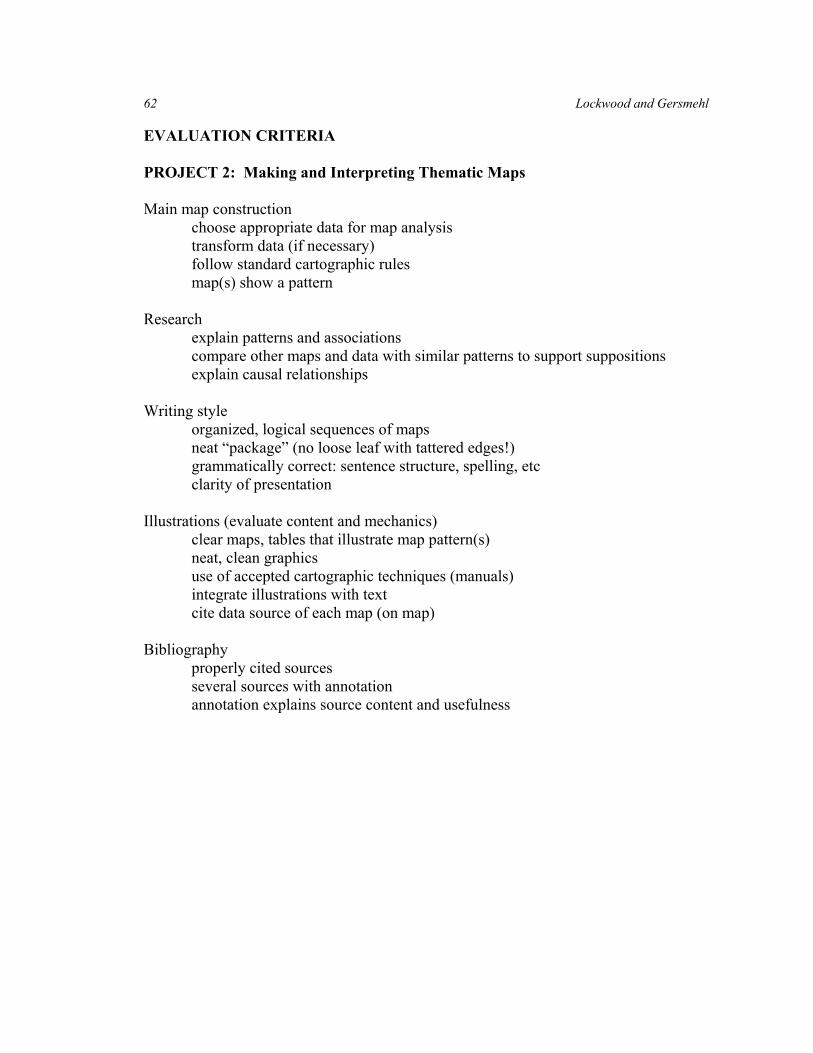
62 Lockwood and Gersmehl
EVALUATION CRITERIA PROJECT 2: Making and Interpreting Thematic Maps Main map construction
choose appropriate data for map analysis transform data (if necessary) follow standard cartographic rules map(s) show a pattern
Research
explain patterns and associations compare other maps and data with similar patterns to support suppositions explain causal relationships
Writing style
organized, logical sequences of maps neat “package” (no loose leaf with tattered edges!) grammatically correct: sentence structure, spelling, etc clarity of presentation
Illustrations (evaluate content and mechanics)
clear maps, tables that illustrate map pattern(s) neat, clean graphics use of accepted cartographic techniques (manuals) integrate illustrations with text cite data source of each map (on map)
Bibliography
properly cited sources several sources with annotation annotation explains source content and usefulness
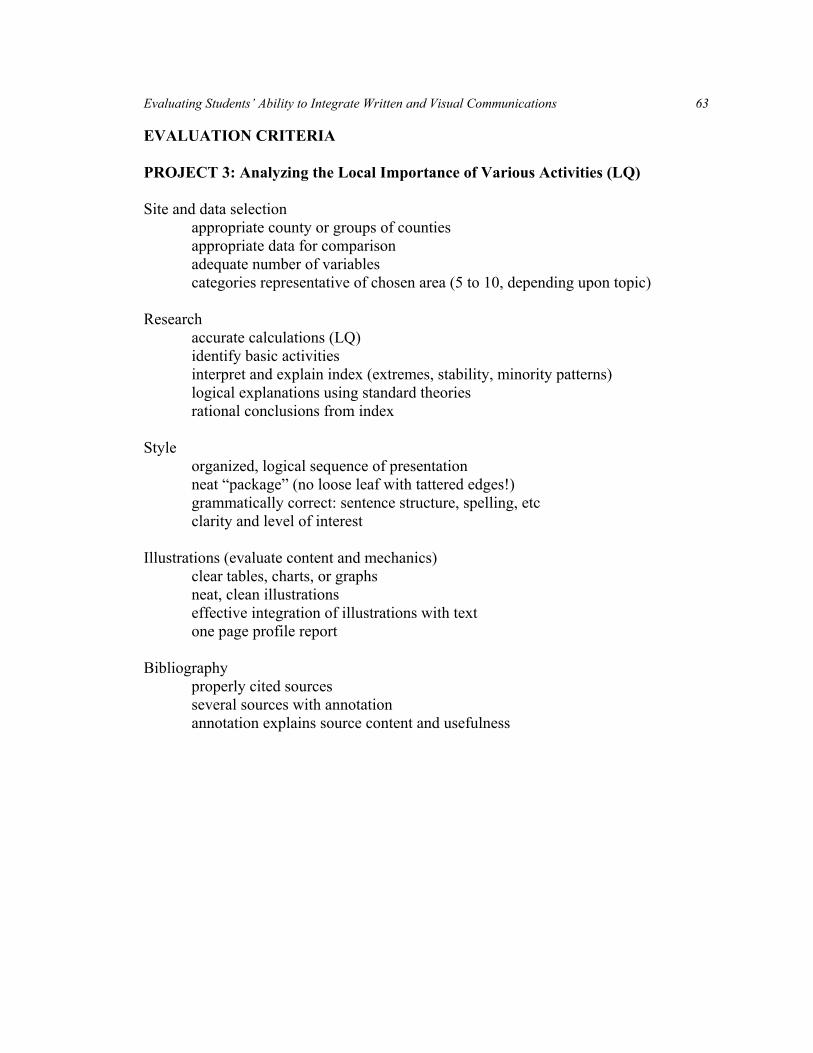
Evaluating Students’ Ability to Integrate Written and Visual Communications 63
EVALUATION CRITERIA PROJECT 3: Analyzing the Local Importance of Various Activities (LQ) Site and data selection
appropriate county or groups of counties appropriate data for comparison adequate number of variables categories representative of chosen area (5 to 10, depending upon topic)
Research
accurate calculations (LQ) identify basic activities interpret and explain index (extremes, stability, minority patterns) logical explanations using standard theories rational conclusions from index
Style
organized, logical sequence of presentation neat “package” (no loose leaf with tattered edges!) grammatically correct: sentence structure, spelling, etc clarity and level of interest
Illustrations (evaluate content and mechanics)
clear tables, charts, or graphs neat, clean illustrations effective integration of illustrations with text one page profile report
Bibliography
properly cited sources several sources with annotation annotation explains source content and usefulness
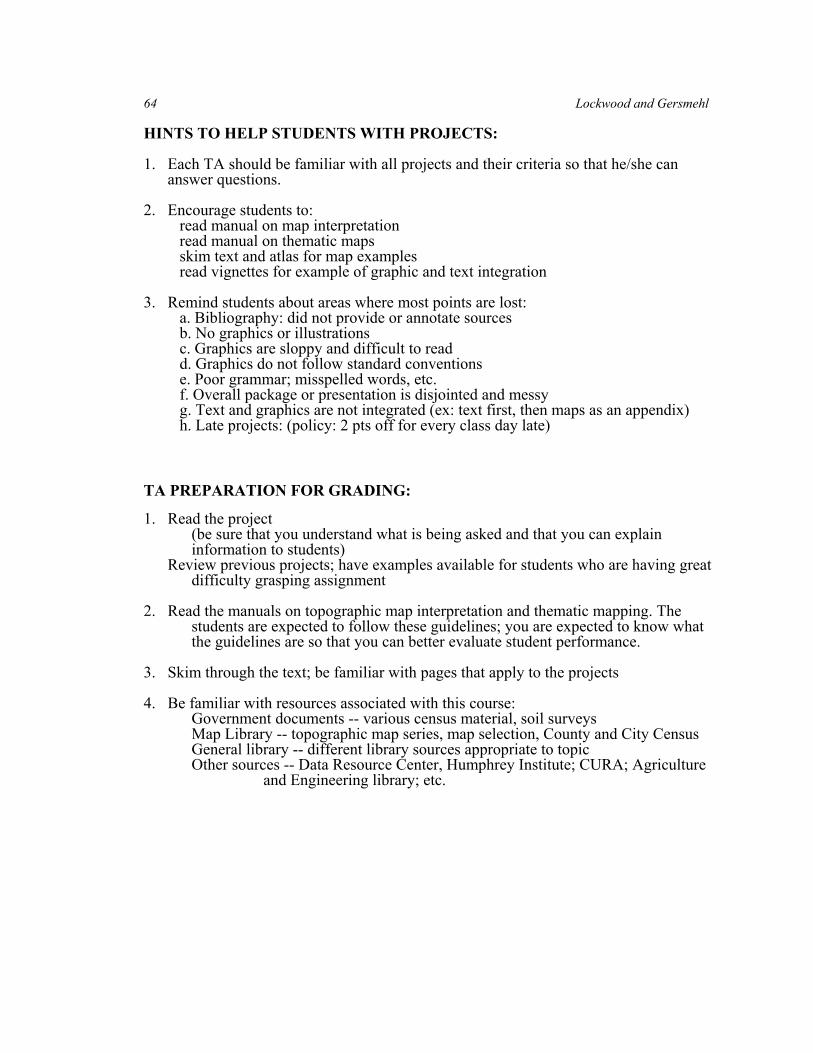
64 Lockwood and Gersmehl
HINTS TO HELP STUDENTS WITH PROJECTS: 1. Each TA should be familiar with all projects and their criteria so that he/she can
answer questions. 2. Encourage students to:
read manual on map interpretation read manual on thematic maps skim text and atlas for map examples read vignettes for example of graphic and text integration
3. Remind students about areas where most points are lost:
a. Bibliography: did not provide or annotate sources b. No graphics or illustrations c. Graphics are sloppy and difficult to read d. Graphics do not follow standard conventions e. Poor grammar; misspelled words, etc. f. Overall package or presentation is disjointed and messy g. Text and graphics are not integrated (ex: text first, then maps as an appendix) h. Late projects: (policy: 2 pts off for every class day late)
TA PREPARATION FOR GRADING: 1. Read the project
(be sure that you understand what is being asked and that you can explain information to students)
Review previous projects; have examples available for students who are having great difficulty grasping assignment
2. Read the manuals on topographic map interpretation and thematic mapping. The
students are expected to follow these guidelines; you are expected to know what the guidelines are so that you can better evaluate student performance.
3. Skim through the text; be familiar with pages that apply to the projects 4. Be familiar with resources associated with this course:
Government documents -- various census material, soil surveys Map Library -- topographic map series, map selection, County and City Census General library -- different library sources appropriate to topic Other sources -- Data Resource Center, Humphrey Institute; CURA; Agriculture
and Engineering library; etc.
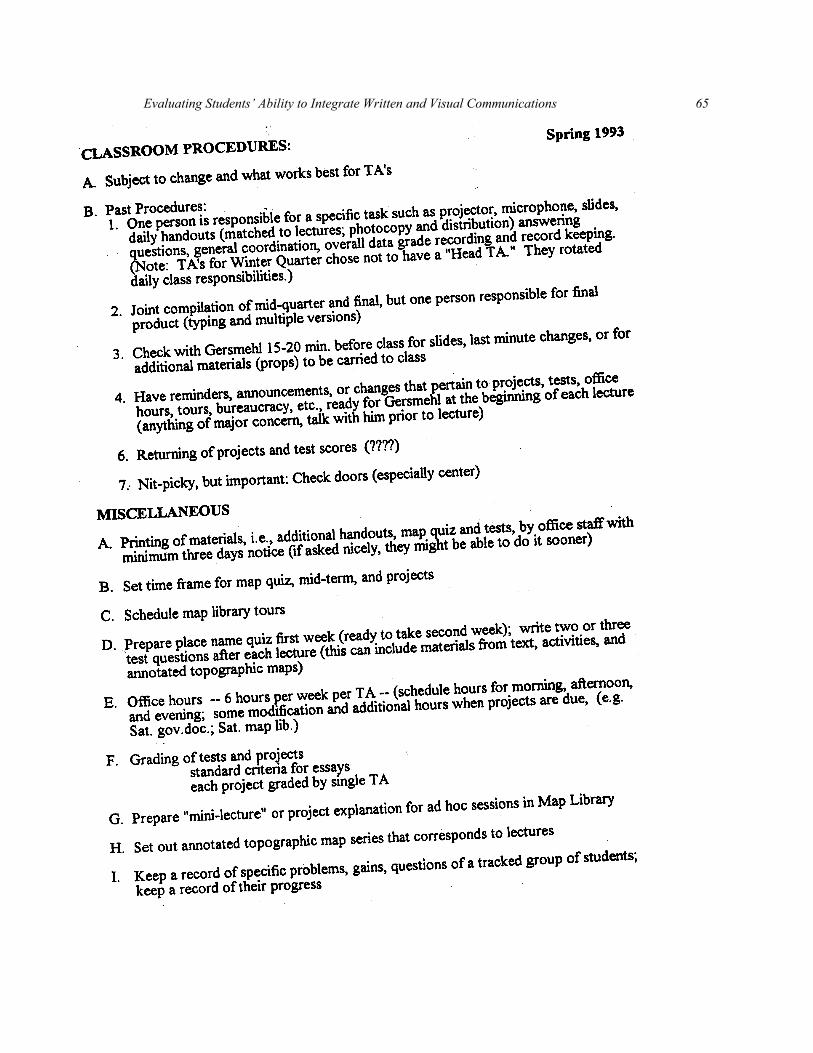
Evaluating Students’ Ability to Integrate Written and Visual Communications 65
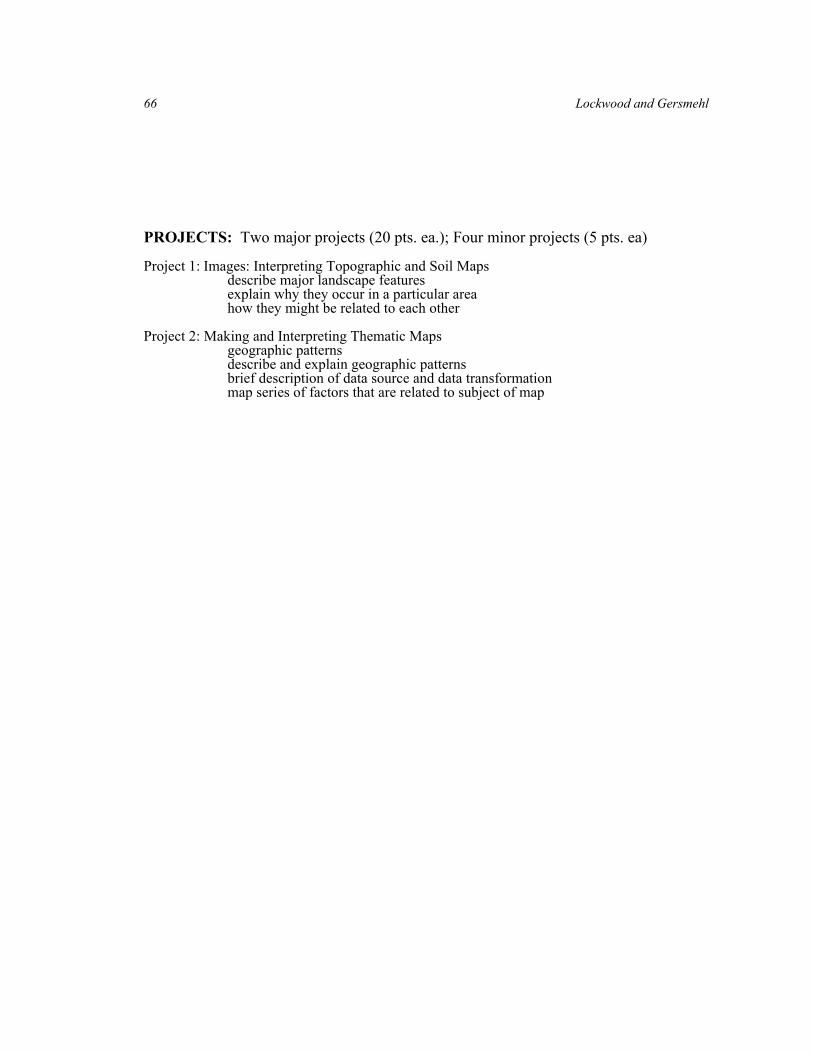
66 Lockwood and Gersmehl
PROJECTS: Two major projects (20 pts. ea.); Four minor projects (5 pts. ea) Project 1: Images: Interpreting Topographic and Soil Maps
describe major landscape features explain why they occur in a particular area how they might be related to each other
Project 2: Making and Interpreting Thematic Maps
geographic patterns describe and explain geographic patterns brief description of data source and data transformation map series of factors that are related to subject of map
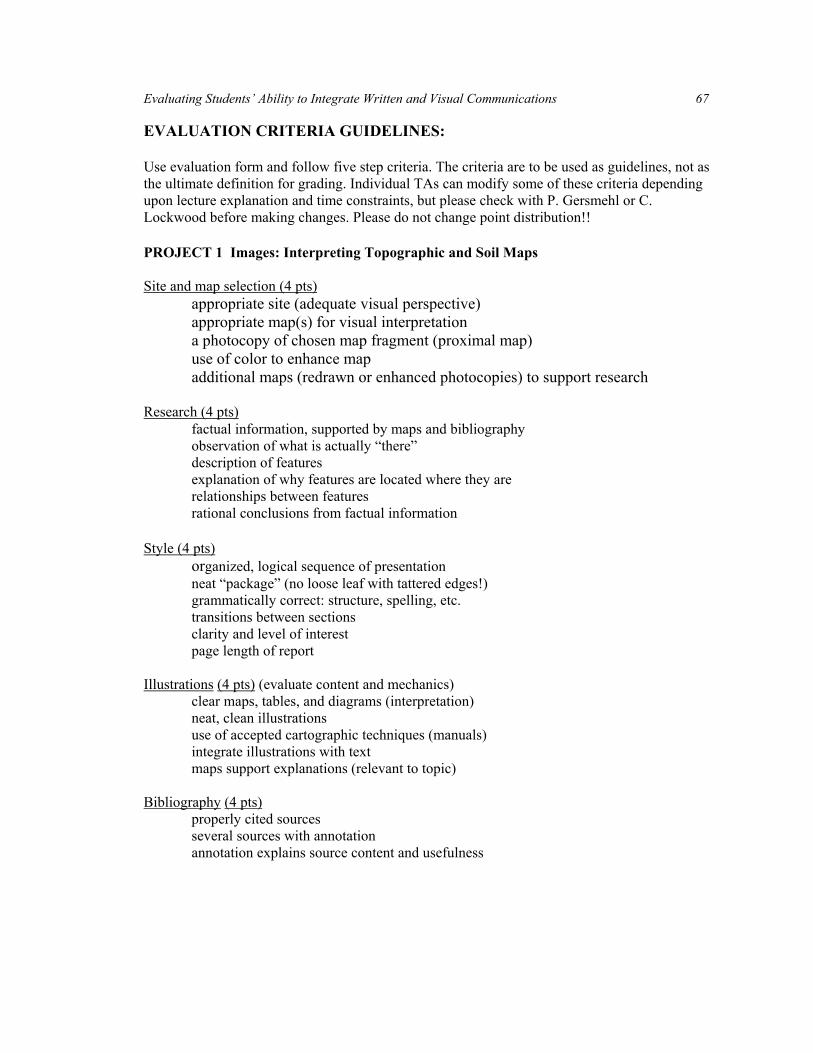
Evaluating Students’ Ability to Integrate Written and Visual Communications 67 EVALUATION CRITERIA GUIDELINES: Use evaluation form and follow five step criteria. The criteria are to be used as guidelines, not as the ultimate definition for grading. Individual TAs can modify some of these criteria depending upon lecture explanation and time constraints, but please check with P. Gersmehl or C. Lockwood before making changes. Please do not change point distribution!! PROJECT 1 Images: Interpreting Topographic and Soil Maps Site and map selection (4 pts)
appropriate site (adequate visual perspective) appropriate map(s) for visual interpretation a photocopy of chosen map fragment (proximal map) use of color to enhance map additional maps (redrawn or enhanced photocopies) to support research
Research (4 pts) factual information, supported by maps and bibliography observation of what is actually “there” description of features explanation of why features are located where they are relationships between features rational conclusions from factual information
Style (4 pts)
organized, logical sequence of presentation neat “package” (no loose leaf with tattered edges!) grammatically correct: structure, spelling, etc. transitions between sections clarity and level of interest page length of report
Illustrations (4 pts) (evaluate content and mechanics)
clear maps, tables, and diagrams (interpretation) neat, clean illustrations use of accepted cartographic techniques (manuals) integrate illustrations with text maps support explanations (relevant to topic)
Bibliography (4 pts)
properly cited sources several sources with annotation annotation explains source content and usefulness
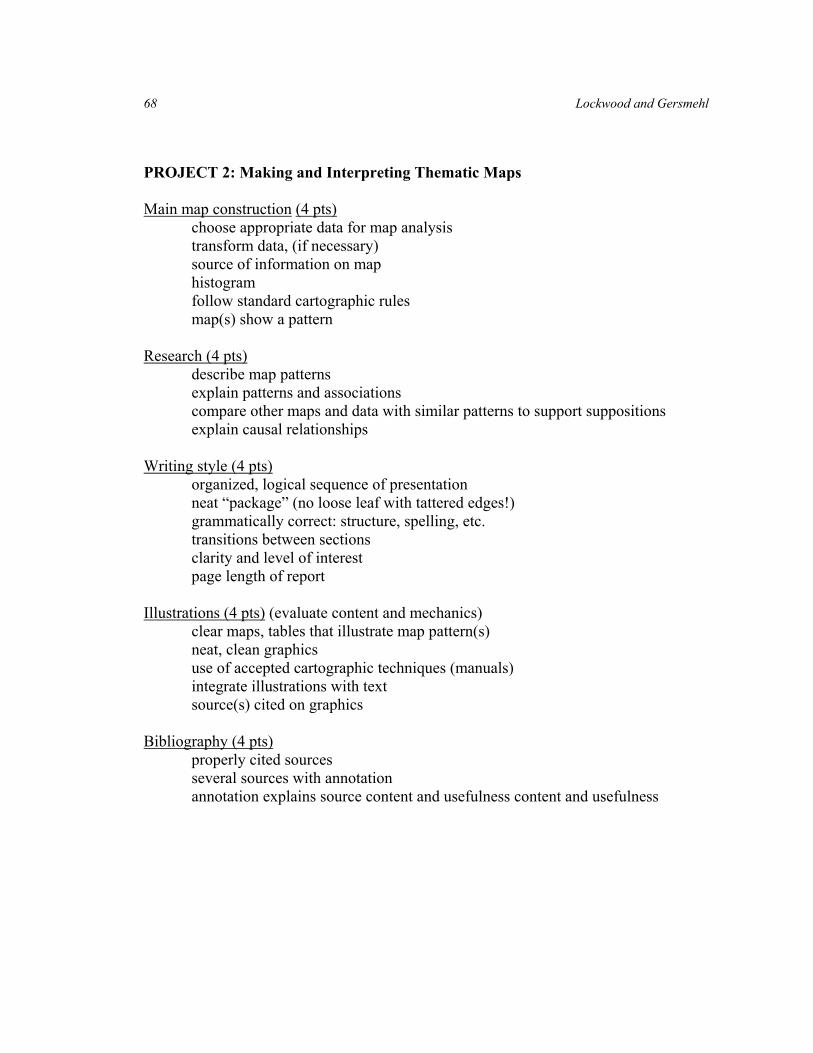
68 Lockwood and Gersmehl PROJECT 2: Making and Interpreting Thematic Maps Main map construction (4 pts)
choose appropriate data for map analysis transform data, (if necessary) source of information on map histogram follow standard cartographic rules map(s) show a pattern
Research (4 pts)
describe map patterns explain patterns and associations compare other maps and data with similar patterns to support suppositions explain causal relationships
Writing style (4 pts)
organized, logical sequence of presentation neat “package” (no loose leaf with tattered edges!) grammatically correct: structure, spelling, etc. transitions between sections clarity and level of interest page length of report
Illustrations (4 pts) (evaluate content and mechanics)
clear maps, tables that illustrate map pattern(s) neat, clean graphics use of accepted cartographic techniques (manuals) integrate illustrations with text source(s) cited on graphics
Bibliography (4 pts)
properly cited sources several sources with annotation annotation explains source content and usefulness content and usefulness
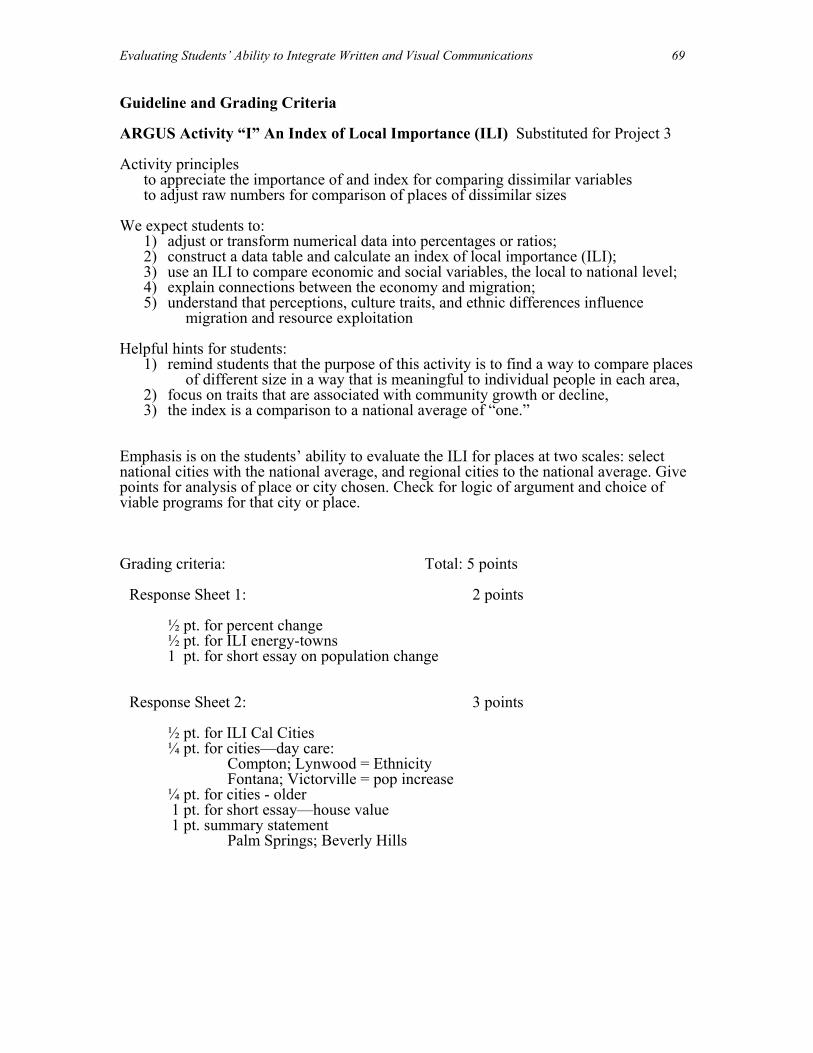
Evaluating Students’ Ability to Integrate Written and Visual Communications 69
Guideline and Grading Criteria ARGUS Activity “I” An Index of Local Importance (ILI) Substituted for Project 3 Activity principles
to appreciate the importance of and index for comparing dissimilar variables to adjust raw numbers for comparison of places of dissimilar sizes
We expect students to:
1) adjust or transform numerical data into percentages or ratios; 2) construct a data table and calculate an index of local importance (ILI); 3) use an ILI to compare economic and social variables, the local to national level; 4) explain connections between the economy and migration; 5) understand that perceptions, culture traits, and ethnic differences influence
migration and resource exploitation Helpful hints for students:
1) remind students that the purpose of this activity is to find a way to compare places of different size in a way that is meaningful to individual people in each area,
2) focus on traits that are associated with community growth or decline, 3) the index is a comparison to a national average of “one.”
Emphasis is on the students’ ability to evaluate the ILI for places at two scales: select national cities with the national average, and regional cities to the national average. Give points for analysis of place or city chosen. Check for logic of argument and choice of viable programs for that city or place. Grading criteria: Total: 5 points
Response Sheet 1: 2 points
½ pt. for percent change ½ pt. for ILI energy-towns 1 pt. for short essay on population change
Response Sheet 2: 3 points
½ pt. for ILI Cal Cities ¼ pt. for cities—day care:
Compton; Lynwood = Ethnicity Fontana; Victorville = pop increase
¼ pt. for cities - older 1 pt. for short essay—house value 1 pt. summary statement
Palm Springs; Beverly Hills