Embed Size (px)
Citation preview
lable at ScienceDirect
Journal of Rock Mechanics and Geotechnical Engineering xxx (xxxx) xxx
Contents lists avai
Journal of Rock Mechanics andGeotechnical Engineeringjournal homepage: www.jrmge.cn
Full Length Article
Evaluating rock mass disturbance within open-pit excavations usingseismic methods: A case study from the Hinkley Point C nuclear powerstation
Antony Butcher a,*, Anna L. Stork a, James P. Verdon a, J-Michael Kendall a,b, Katrin Plenkers c,Finlay Booth d, Marcus Bonehame, Adrian Koe f
a School of Earth Sciences, University of Bristol, Wills Memorial Building, Queen’s Road, Bristol, BS8 1RJ, UKbDepartment of Earth Sciences, University of Oxford, South Parks Road, Oxford, OX1 3AN, UKcGesellschaft für Materialprüfung und Geophysik (GMuG), Bad Nauheim, 61231, GermanydMott MacDonald, 10 Temple Back, Bristol, BS1 6FL, UKeAtkins, The Hub, 500 Park Avenue, Aztec West, Bristol, BS32 4RZ, UKfAtkins, The Axis, 10 Holliday Street, Birmingham, B1 1TF, UK
a r t i c l e i n f o
Article history:Received 27 July 2020Received in revised form21 October 2020Accepted 28 December 2020Available online xxx
Keywords:Rock mass strengthRock disturbanceSeismic tomographyPiezoelectric surveysPicoseismicityAcoustic emissions
* Corresponding author.E-mail address: [email protected] (A. BPeer review under responsibility of Institute of R
nese Academy of Sciences.
Please cite this article as: Butcher A et al., Evfrom the Hinkley Point C nuclear powej.jrmge.2020.12.001
https://doi.org/10.1016/j.jrmge.2020.12.0011674-7755 � 2021 Institute of Rock and Soil MechanicNC-ND license (http://creativecommons.org/licenses/b
a b s t r a c t
Understanding rock strength is essential when undertaking major excavation projects, as accurate as-sessments ensure both safe and cost-effective engineered slopes. Balancing the cost-safety trade-offbecomes more imperative during the construction of critical infrastructure such as nuclear power sta-tions, where key components are built within relatively deep excavations. Designing these engineeredslopes is reliant on rock strength models, which are generally parameterised using estimates of rockproperties (e.g. unconfined compressive strength, rock disturbance) measured prior to the commence-ment of works. However, the physical process of excavation weakens the remaining rock mass. Therefore,the model also requires an adjustment for the anticipated rock disturbance. In practice, this parameter isdifficult to quantify and as a result it is often poorly constrained. This can have a significant impact on thefinal design and cost of excavation. We present results from passive and active seismic surveys, whichimage the extent and degree of disturbance within recently excavated slopes at the construction site ofHinkley Point C nuclear power station. Results from active seismic surveys indicate that the disturbanceis primarily confined to 0.5 m from the excavated face. In conjunction, passive monitoring is used todetected seismic events corresponding to fracturing on the cm-scale and event locations are in agree-ment with 0.5 m of disturbance into the rock face. This suggests rock disturbance at this site is relativelylow and occurred during and immediately after the excavation. A ratio of seismic velocities recordedbefore and after excavations are used to determine the disturbance parameter required for the HoekeBrown rock failure criterion, and we assess that rock disturbance is low with the magnitude of thedisturbance diminishing more quickly than expected into the excavated slope. Seismic methods providea low-cost and quick method to assess excavation related rock mass disturbance, which can lead to costreductions in large excavation projects.� 2021 Institute of Rock and Soil Mechanics, Chinese Academy of Sciences. Production and hosting byElsevier B.V. This is an open access article under the CC BY-NC-ND license (http://creativecommons.org/
licenses/by-nc-nd/4.0/).
1. Introduction
Quantifying rock strength, and the impact of excavation-induced damage, is essential when undertaking major infrastruc-ture projects. Accurate assessments are necessary for safe and cost-
utcher).ock and Soil Mechanics, Chi-
aluating rock mass disturbanr station, Journal of Rock
s, Chinese Academy of Sciences. Pry-nc-nd/4.0/).
effective engineered slopes. Slope stability is a top priority duringthe construction of critical infrastructure such as nuclear powerstations, where key components are built in relatively deep exca-vations. Determining stress conditions at which a slope will fail,and the amount of rock engineering required to prevent failure, istherefore integral in the design.
The design of these engineered slopes is reliant on rock strengthmodels, which are generally parameterised using estimates of rockproperties (e.g. unconfined compressive strength (UCS)) measured
ce within open-pit excavations using seismic methods: A case studyMechanics and Geotechnical Engineering, https://doi.org/10.1016/
oduction and hosting by Elsevier B.V. This is an open access article under the CC BY-
A. Butcher et al. / Journal of Rock Mechanics and Geotechnical Engineering xxx (xxxx) xxx2
prior to the commencement of works. However, the physical pro-cess of excavation weakens the remaining rock mass through theopening and creation of fractures leading to a reduction in rockstrength. Compensating for this disturbance is a crucial componentof slope stability assessments. As this disturbance occurs within therock mass, its severity and extent into the slope are difficult toquantify and often poorly constrained. The resulting uncertaintyhas a significant impact on the final excavation design, whichtypically will be over-engineered to ensure an appropriate marginof safety. Here we show how seismic monitoring can provide a non-intrusive method to assess rock damage due to excavation.
The pre-eminent model used for assessing rock mass strength isthe HoekeBrown failure criterion, which was originally developedfor underground excavations in hard rock (Hoek and Brown, 1980).Following its adoption by the geotechnical industry, it becamebroadly recognised that, when applied to excavated slopes, thecalculated rock mass strengths are overestimated. Consequently,Hoek et al. (2002) presented a major re-examination of the entireHoekeBrown criterion, which included a new disturbance param-eter D, which corrects for a reduction in rock strength caused byexcavation damage and stress release. For the majority of rockengineering projects, the level and extent of disturbance are basedon visual inspection following Hoek et al. (2002). This qualitativeapproach is reliant on engineering judgement, informed byreviewing excavation methods and the in situ stress regime.
The volume of the rock mass damaged or altered by mechanicalexcavation and subsequent stress release due tomaterial unloadingis often referred to as the disturbance or excavation damage zone(EDZ). Rock disturbance causes the creation, dilation and move-ment of discontinuities, cracks or fractures in a rock mass (Cai et al.,2004) and the large number of factors that influence the degree ofdisturbancemake it difficult to precisely quantity the factorD. Hoeket al. (2002) proposed a set of guidelines based on their experienceand published back-analyses of damaged rock, however, these aresubjective and contain little detail as to how the values were esti-mated. In this paper, we use non-destructive geophysical methodsto directly measure the extent and degree of disturbance caused byexcavation, using a combination of active seismic surveys andpassive seismic monitoring. We demonstrate this approach onslopes created during the construction of the Hinkley Point C (HPC)nuclear power station in the southwest of England.
1.1. Excavation effects and rock mass strength
Rock disturbance is described as a reduction in rock massstrength associated with the creation of new discontinuities (cracksand fractures), and dilation/movement of existing discontinuities.Within newly excavated rock slopes, this disturbance is caused bythe process of excavation and subsequent stress release. The degreeof excavation damage is affected by several factors, including thenear-field stress history, rock type, excavation method, andconfining pressure (Read, 2004), with the process of fracture cre-ation and stress release relatively transient in nature (Lu et al.,2012).
The HoekeBrown criterion (Hoek and Brown, 2019) has beenwidely adopted within the geotechnical community. This methodwas employed to assess slope stability at HPC. Unlike the linearMohr-Coulomb failure criterion, HoekeBrown criterion follows anonlinear parabolic form which empirically relates the geologicalconditions to the rock mass strength based on triaxial test data.Originally developed for the design of underground excavations inhard rock (Hoek and Brown, 1980), the criterion has undergoneseveral revisions to make it applicable to general geotechnical ap-plications. This has resulted in the introduction of new parameters,namely rock disturbance (D) and the geological strength index
Please cite this article as: Butcher A et al., Evaluating rock mass disturbanfrom the Hinkley Point C nuclear power station, Journal of Rockj.jrmge.2020.12.001
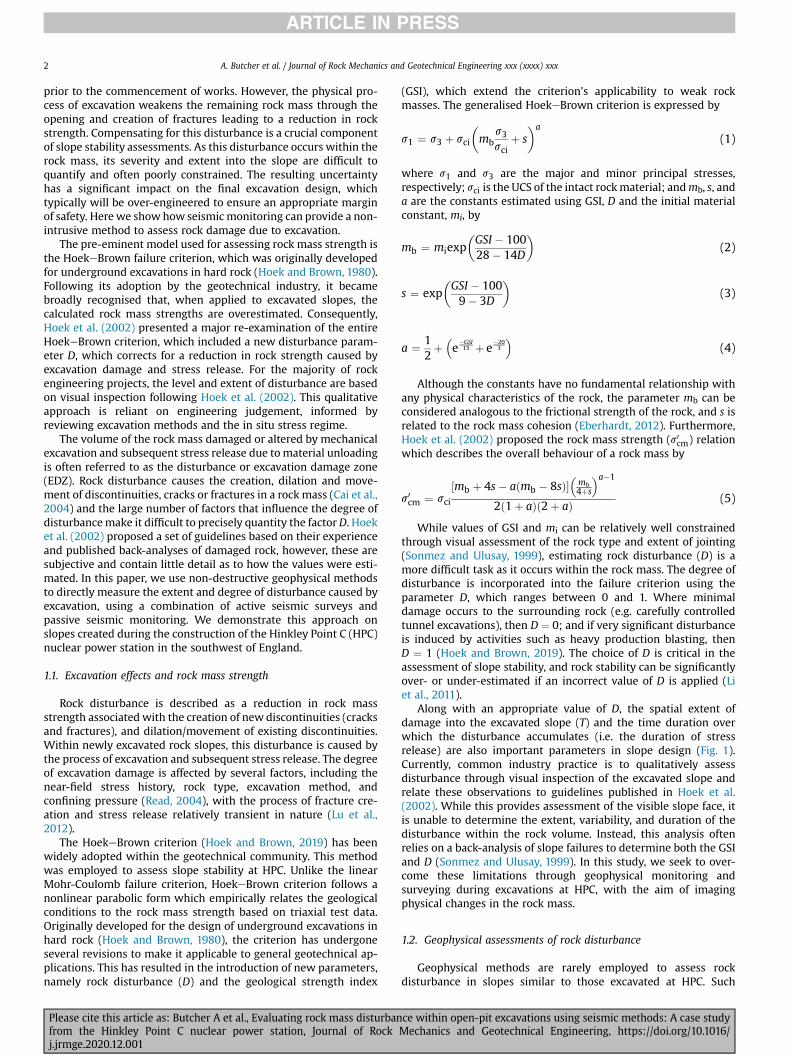
(GSI), which extend the criterion’s applicability to weak rockmasses. The generalised HoekeBrown criterion is expressed by
s1 ¼ s3 þ sci
�mb
s3sci
þ s�a
(1)
where s1 and s3 are the major and minor principal stresses,respectively; sci is the UCS of the intact rockmaterial; andmb, s, anda are the constants estimated using GSI, D and the initial materialconstant, mi, by
mb ¼ miexp�GSI � 10028� 14D
�(2)
s ¼ exp�GSI � 1009� 3D
�(3)
a ¼ 12þ�e
�GSI15 þ e
�203
�(4)
Although the constants have no fundamental relationship withany physical characteristics of the rock, the parameter mb can beconsidered analogous to the frictional strength of the rock, and s isrelated to the rock mass cohesion (Eberhardt, 2012). Furthermore,Hoek et al. (2002) proposed the rock mass strength (s0cm) relationwhich describes the overall behaviour of a rock mass by
s0cm ¼ sci
½mb þ 4s� aðmb � 8sÞ��
mb4þs
�a�1
2ð1þ aÞð2þ aÞ (5)
While values of GSI and mi can be relatively well constrainedthrough visual assessment of the rock type and extent of jointing(Sonmez and Ulusay, 1999), estimating rock disturbance (D) is amore difficult task as it occurs within the rock mass. The degree ofdisturbance is incorporated into the failure criterion using theparameter D, which ranges between 0 and 1. Where minimaldamage occurs to the surrounding rock (e.g. carefully controlledtunnel excavations), then D ¼ 0; and if very significant disturbanceis induced by activities such as heavy production blasting, thenD ¼ 1 (Hoek and Brown, 2019). The choice of D is critical in theassessment of slope stability, and rock stability can be significantlyover- or under-estimated if an incorrect value of D is applied (Liet al., 2011).
Along with an appropriate value of D, the spatial extent ofdamage into the excavated slope (T) and the time duration overwhich the disturbance accumulates (i.e. the duration of stressrelease) are also important parameters in slope design (Fig. 1).Currently, common industry practice is to qualitatively assessdisturbance through visual inspection of the excavated slope andrelate these observations to guidelines published in Hoek et al.(2002). While this provides assessment of the visible slope face, itis unable to determine the extent, variability, and duration of thedisturbance within the rock volume. Instead, this analysis oftenrelies on a back-analysis of slope failures to determine both the GSIand D (Sonmez and Ulusay, 1999). In this study, we seek to over-come these limitations through geophysical monitoring andsurveying during excavations at HPC, with the aim of imagingphysical changes in the rock mass.
1.2. Geophysical assessments of rock disturbance
Geophysical methods are rarely employed to assess rockdisturbance in slopes similar to those excavated at HPC. Such
ce within open-pit excavations using seismic methods: A case studyMechanics and Geotechnical Engineering, https://doi.org/10.1016/
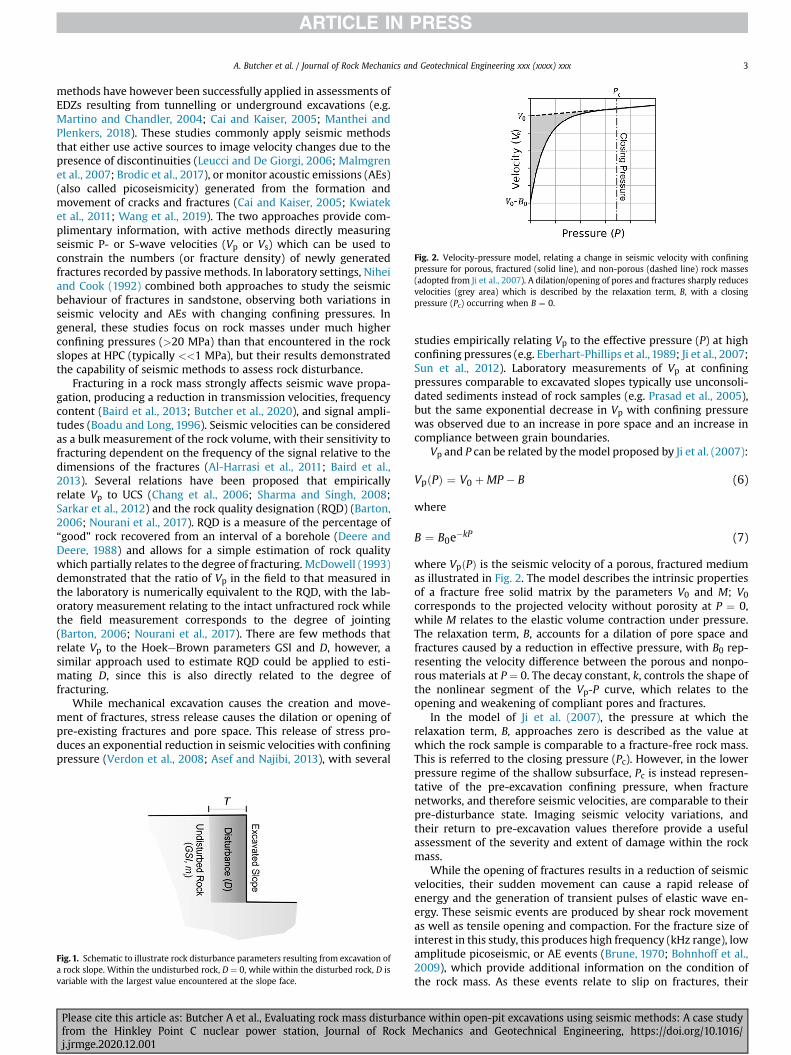
Fig. 2. Velocity-pressure model, relating a change in seismic velocity with confiningpressure for porous, fractured (solid line), and non-porous (dashed line) rock masses(adopted from Ji et al., 2007). A dilation/opening of pores and fractures sharply reducesvelocities (grey area) which is described by the relaxation term, B, with a closingpressure (Pc) occurring when B ¼ 0.
A. Butcher et al. / Journal of Rock Mechanics and Geotechnical Engineering xxx (xxxx) xxx 3
methods have however been successfully applied in assessments ofEDZs resulting from tunnelling or underground excavations (e.g.Martino and Chandler, 2004; Cai and Kaiser, 2005; Manthei andPlenkers, 2018). These studies commonly apply seismic methodsthat either use active sources to image velocity changes due to thepresence of discontinuities (Leucci and De Giorgi, 2006; Malmgrenet al., 2007; Brodic et al., 2017), or monitor acoustic emissions (AEs)(also called picoseismicity) generated from the formation andmovement of cracks and fractures (Cai and Kaiser, 2005; Kwiateket al., 2011; Wang et al., 2019). The two approaches provide com-plimentary information, with active methods directly measuringseismic P- or S-wave velocities (Vp or Vs) which can be used toconstrain the numbers (or fracture density) of newly generatedfractures recorded by passive methods. In laboratory settings, Niheiand Cook (1992) combined both approaches to study the seismicbehaviour of fractures in sandstone, observing both variations inseismic velocity and AEs with changing confining pressures. Ingeneral, these studies focus on rock masses under much higherconfining pressures (>20 MPa) than that encountered in the rockslopes at HPC (typically <<1 MPa), but their results demonstratedthe capability of seismic methods to assess rock disturbance.
Fracturing in a rock mass strongly affects seismic wave propa-gation, producing a reduction in transmission velocities, frequencycontent (Baird et al., 2013; Butcher et al., 2020), and signal ampli-tudes (Boadu and Long, 1996). Seismic velocities can be consideredas a bulk measurement of the rock volume, with their sensitivity tofracturing dependent on the frequency of the signal relative to thedimensions of the fractures (Al-Harrasi et al., 2011; Baird et al.,2013). Several relations have been proposed that empiricallyrelate Vp to UCS (Chang et al., 2006; Sharma and Singh, 2008;Sarkar et al., 2012) and the rock quality designation (RQD) (Barton,2006; Nourani et al., 2017). RQD is a measure of the percentage of“good” rock recovered from an interval of a borehole (Deere andDeere, 1988) and allows for a simple estimation of rock qualitywhich partially relates to the degree of fracturing. McDowell (1993)demonstrated that the ratio of Vp in the field to that measured inthe laboratory is numerically equivalent to the RQD, with the lab-oratory measurement relating to the intact unfractured rock whilethe field measurement corresponds to the degree of jointing(Barton, 2006; Nourani et al., 2017). There are few methods thatrelate Vp to the HoekeBrown parameters GSI and D, however, asimilar approach used to estimate RQD could be applied to esti-mating D, since this is also directly related to the degree offracturing.
While mechanical excavation causes the creation and move-ment of fractures, stress release causes the dilation or opening ofpre-existing fractures and pore space. This release of stress pro-duces an exponential reduction in seismic velocities with confiningpressure (Verdon et al., 2008; Asef and Najibi, 2013), with several
Fig. 1. Schematic to illustrate rock disturbance parameters resulting from excavation ofa rock slope. Within the undisturbed rock, D ¼ 0, while within the disturbed rock, D isvariable with the largest value encountered at the slope face.
Please cite this article as: Butcher A et al., Evaluating rock mass disturbanfrom the Hinkley Point C nuclear power station, Journal of Rockj.jrmge.2020.12.001
studies empirically relating Vp to the effective pressure (P) at highconfining pressures (e.g. Eberhart-Phillips et al., 1989; Ji et al., 2007;Sun et al., 2012). Laboratory measurements of Vp at confiningpressures comparable to excavated slopes typically use unconsoli-dated sediments instead of rock samples (e.g. Prasad et al., 2005),but the same exponential decrease in Vp with confining pressurewas observed due to an increase in pore space and an increase incompliance between grain boundaries.
Vp and P can be related by themodel proposed by Ji et al. (2007):
VpðPÞ ¼ V0 þMP � B (6)
where
B ¼ B0e�kP (7)
where VpðPÞ is the seismic velocity of a porous, fractured mediumas illustrated in Fig. 2. The model describes the intrinsic propertiesof a fracture free solid matrix by the parameters V0 and M; V0corresponds to the projected velocity without porosity at P ¼ 0,while M relates to the elastic volume contraction under pressure.The relaxation term, B, accounts for a dilation of pore space andfractures caused by a reduction in effective pressure, with B0 rep-resenting the velocity difference between the porous and nonpo-rous materials at P ¼ 0. The decay constant, k, controls the shape ofthe nonlinear segment of the Vp-P curve, which relates to theopening and weakening of compliant pores and fractures.
In the model of Ji et al. (2007), the pressure at which therelaxation term, B, approaches zero is described as the value atwhich the rock sample is comparable to a fracture-free rock mass.This is referred to the closing pressure (Pc). However, in the lowerpressure regime of the shallow subsurface, Pc is instead represen-tative of the pre-excavation confining pressure, when fracturenetworks, and therefore seismic velocities, are comparable to theirpre-disturbance state. Imaging seismic velocity variations, andtheir return to pre-excavation values therefore provide a usefulassessment of the severity and extent of damage within the rockmass.
While the opening of fractures results in a reduction of seismicvelocities, their sudden movement can cause a rapid release ofenergy and the generation of transient pulses of elastic wave en-ergy. These seismic events are produced by shear rock movementas well as tensile opening and compaction. For the fracture size ofinterest in this study, this produces high frequency (kHz range), lowamplitude picoseismic, or AE events (Brune, 1970; Bohnhoff et al.,2009), which provide additional information on the condition ofthe rock mass. As these events relate to slip on fractures, their
ce within open-pit excavations using seismic methods: A case studyMechanics and Geotechnical Engineering, https://doi.org/10.1016/
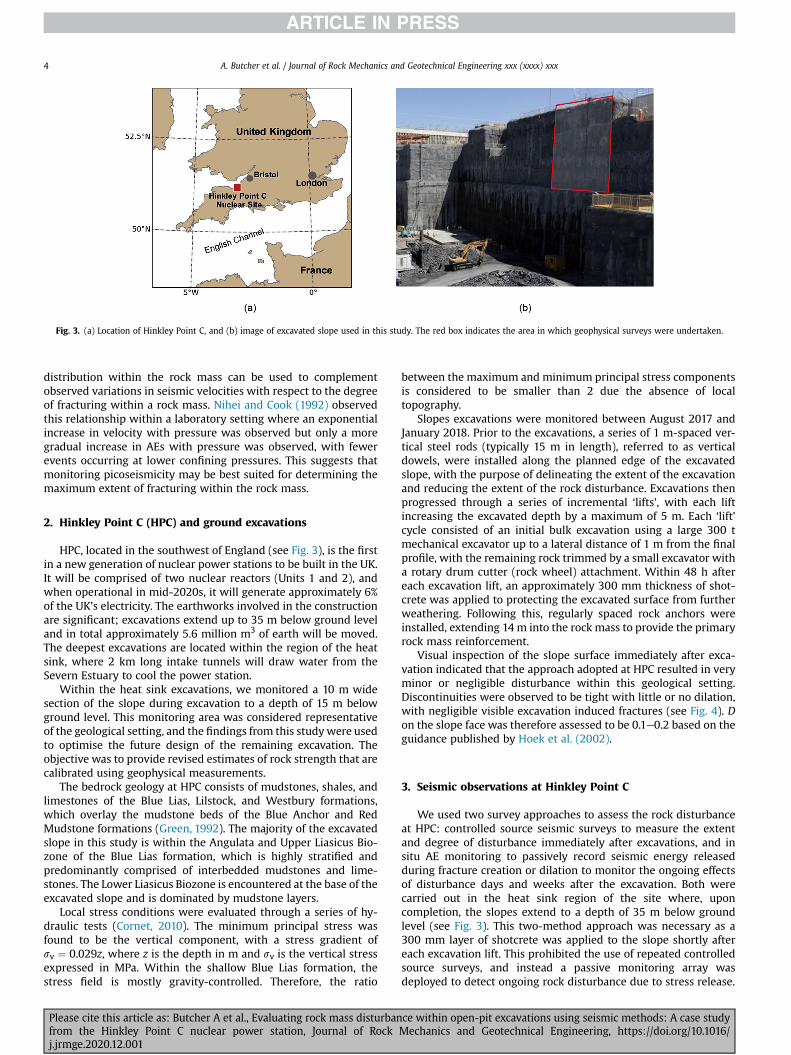
Fig. 3. (a) Location of Hinkley Point C, and (b) image of excavated slope used in this study. The red box indicates the area in which geophysical surveys were undertaken.
A. Butcher et al. / Journal of Rock Mechanics and Geotechnical Engineering xxx (xxxx) xxx4
distribution within the rock mass can be used to complementobserved variations in seismic velocities with respect to the degreeof fracturing within a rock mass. Nihei and Cook (1992) observedthis relationship within a laboratory setting where an exponentialincrease in velocity with pressure was observed but only a moregradual increase in AEs with pressure was observed, with fewerevents occurring at lower confining pressures. This suggests thatmonitoring picoseismicity may be best suited for determining themaximum extent of fracturing within the rock mass.
2. Hinkley Point C (HPC) and ground excavations
HPC, located in the southwest of England (see Fig. 3), is the firstin a new generation of nuclear power stations to be built in the UK.It will be comprised of two nuclear reactors (Units 1 and 2), andwhen operational in mid-2020s, it will generate approximately 6%of the UK’s electricity. The earthworks involved in the constructionare significant; excavations extend up to 35 m below ground leveland in total approximately 5.6 million m3 of earth will be moved.The deepest excavations are located within the region of the heatsink, where 2 km long intake tunnels will draw water from theSevern Estuary to cool the power station.
Within the heat sink excavations, we monitored a 10 m widesection of the slope during excavation to a depth of 15 m belowground level. This monitoring area was considered representativeof the geological setting, and the findings from this studywere usedto optimise the future design of the remaining excavation. Theobjective was to provide revised estimates of rock strength that arecalibrated using geophysical measurements.
The bedrock geology at HPC consists of mudstones, shales, andlimestones of the Blue Lias, Lilstock, and Westbury formations,which overlay the mudstone beds of the Blue Anchor and RedMudstone formations (Green, 1992). The majority of the excavatedslope in this study is within the Angulata and Upper Liasicus Bio-zone of the Blue Lias formation, which is highly stratified andpredominantly comprised of interbedded mudstones and lime-stones. The Lower Liasicus Biozone is encountered at the base of theexcavated slope and is dominated by mudstone layers.
Local stress conditions were evaluated through a series of hy-draulic tests (Cornet, 2010). The minimum principal stress wasfound to be the vertical component, with a stress gradient ofsv ¼ 0.029z, where z is the depth in m and sv is the vertical stressexpressed in MPa. Within the shallow Blue Lias formation, thestress field is mostly gravity-controlled. Therefore, the ratio
Please cite this article as: Butcher A et al., Evaluating rock mass disturbanfrom the Hinkley Point C nuclear power station, Journal of Rockj.jrmge.2020.12.001
between the maximum and minimum principal stress componentsis considered to be smaller than 2 due the absence of localtopography.
Slopes excavations were monitored between August 2017 andJanuary 2018. Prior to the excavations, a series of 1 m-spaced ver-tical steel rods (typically 15 m in length), referred to as verticaldowels, were installed along the planned edge of the excavatedslope, with the purpose of delineating the extent of the excavationand reducing the extent of the rock disturbance. Excavations thenprogressed through a series of incremental ‘lifts’, with each liftincreasing the excavated depth by a maximum of 5 m. Each ‘lift’cycle consisted of an initial bulk excavation using a large 300 tmechanical excavator up to a lateral distance of 1 m from the finalprofile, with the remaining rock trimmed by a small excavator witha rotary drum cutter (rock wheel) attachment. Within 48 h aftereach excavation lift, an approximately 300 mm thickness of shot-crete was applied to protecting the excavated surface from furtherweathering. Following this, regularly spaced rock anchors wereinstalled, extending 14 m into the rock mass to provide the primaryrock mass reinforcement.
Visual inspection of the slope surface immediately after exca-vation indicated that the approach adopted at HPC resulted in veryminor or negligible disturbance within this geological setting.Discontinuities were observed to be tight with little or no dilation,with negligible visible excavation induced fractures (see Fig. 4). Don the slope face was therefore assessed to be 0.1e0.2 based on theguidance published by Hoek et al. (2002).
3. Seismic observations at Hinkley Point C
We used two survey approaches to assess the rock disturbanceat HPC: controlled source seismic surveys to measure the extentand degree of disturbance immediately after excavations, and insitu AE monitoring to passively record seismic energy releasedduring fracture creation or dilation to monitor the ongoing effectsof disturbance days and weeks after the excavation. Both werecarried out in the heat sink region of the site where, uponcompletion, the slopes extend to a depth of 35 m below groundlevel (see Fig. 3). This two-method approach was necessary as a300 mm layer of shotcrete was applied to the slope shortly aftereach excavation lift. This prohibited the use of repeated controlledsource surveys, and instead a passive monitoring array wasdeployed to detect ongoing rock disturbance due to stress release.
ce within open-pit excavations using seismic methods: A case studyMechanics and Geotechnical Engineering, https://doi.org/10.1016/
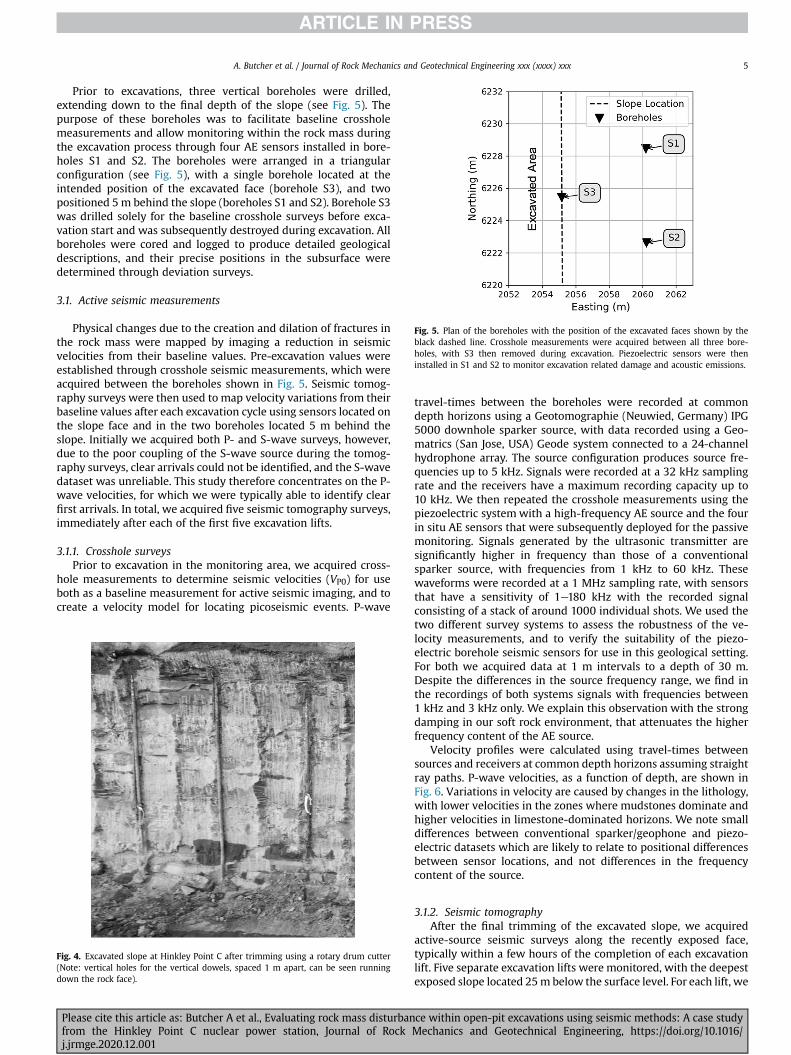
Fig. 5. Plan of the boreholes with the position of the excavated faces shown by theblack dashed line. Crosshole measurements were acquired between all three bore-holes, with S3 then removed during excavation. Piezoelectric sensors were theninstalled in S1 and S2 to monitor excavation related damage and acoustic emissions.
A. Butcher et al. / Journal of Rock Mechanics and Geotechnical Engineering xxx (xxxx) xxx 5
Prior to excavations, three vertical boreholes were drilled,extending down to the final depth of the slope (see Fig. 5). Thepurpose of these boreholes was to facilitate baseline crossholemeasurements and allow monitoring within the rock mass duringthe excavation process through four AE sensors installed in bore-holes S1 and S2. The boreholes were arranged in a triangularconfiguration (see Fig. 5), with a single borehole located at theintended position of the excavated face (borehole S3), and twopositioned 5m behind the slope (boreholes S1 and S2). Borehole S3was drilled solely for the baseline crosshole surveys before exca-vation start and was subsequently destroyed during excavation. Allboreholes were cored and logged to produce detailed geologicaldescriptions, and their precise positions in the subsurface weredetermined through deviation surveys.
3.1. Active seismic measurements
Physical changes due to the creation and dilation of fractures inthe rock mass were mapped by imaging a reduction in seismicvelocities from their baseline values. Pre-excavation values wereestablished through crosshole seismic measurements, which wereacquired between the boreholes shown in Fig. 5. Seismic tomog-raphy surveys were then used to map velocity variations from theirbaseline values after each excavation cycle using sensors located onthe slope face and in the two boreholes located 5 m behind theslope. Initially we acquired both P- and S-wave surveys, however,due to the poor coupling of the S-wave source during the tomog-raphy surveys, clear arrivals could not be identified, and the S-wavedataset was unreliable. This study therefore concentrates on the P-wave velocities, for which we were typically able to identify clearfirst arrivals. In total, we acquired five seismic tomography surveys,immediately after each of the first five excavation lifts.
3.1.1. Crosshole surveysPrior to excavation in the monitoring area, we acquired cross-
hole measurements to determine seismic velocities (VP0) for useboth as a baseline measurement for active seismic imaging, and tocreate a velocity model for locating picoseismic events. P-wave
Fig. 4. Excavated slope at Hinkley Point C after trimming using a rotary drum cutter(Note: vertical holes for the vertical dowels, spaced 1 m apart, can be seen runningdown the rock face).
Please cite this article as: Butcher A et al., Evaluating rock mass disturbanfrom the Hinkley Point C nuclear power station, Journal of Rockj.jrmge.2020.12.001
travel-times between the boreholes were recorded at commondepth horizons using a Geotomographie (Neuwied, Germany) IPG5000 downhole sparker source, with data recorded using a Geo-matrics (San Jose, USA) Geode system connected to a 24-channelhydrophone array. The source configuration produces source fre-quencies up to 5 kHz. Signals were recorded at a 32 kHz samplingrate and the receivers have a maximum recording capacity up to10 kHz. We then repeated the crosshole measurements using thepiezoelectric system with a high-frequency AE source and the fourin situ AE sensors that were subsequently deployed for the passivemonitoring. Signals generated by the ultrasonic transmitter aresignificantly higher in frequency than those of a conventionalsparker source, with frequencies from 1 kHz to 60 kHz. Thesewaveforms were recorded at a 1 MHz sampling rate, with sensorsthat have a sensitivity of 1e180 kHz with the recorded signalconsisting of a stack of around 1000 individual shots. We used thetwo different survey systems to assess the robustness of the ve-locity measurements, and to verify the suitability of the piezo-electric borehole seismic sensors for use in this geological setting.For both we acquired data at 1 m intervals to a depth of 30 m.Despite the differences in the source frequency range, we find inthe recordings of both systems signals with frequencies between1 kHz and 3 kHz only. We explain this observation with the strongdamping in our soft rock environment, that attenuates the higherfrequency content of the AE source.
Velocity profiles were calculated using travel-times betweensources and receivers at common depth horizons assuming straightray paths. P-wave velocities, as a function of depth, are shown inFig. 6. Variations in velocity are caused by changes in the lithology,with lower velocities in the zones where mudstones dominate andhigher velocities in limestone-dominated horizons. We note smalldifferences between conventional sparker/geophone and piezo-electric datasets which are likely to relate to positional differencesbetween sensor locations, and not differences in the frequencycontent of the source.
3.1.2. Seismic tomographyAfter the final trimming of the excavated slope, we acquired
active-source seismic surveys along the recently exposed face,typically within a few hours of the completion of each excavationlift. Five separate excavation lifts were monitored, with the deepestexposed slope located 25m below the surface level. For each lift, we
ce within open-pit excavations using seismic methods: A case studyMechanics and Geotechnical Engineering, https://doi.org/10.1016/
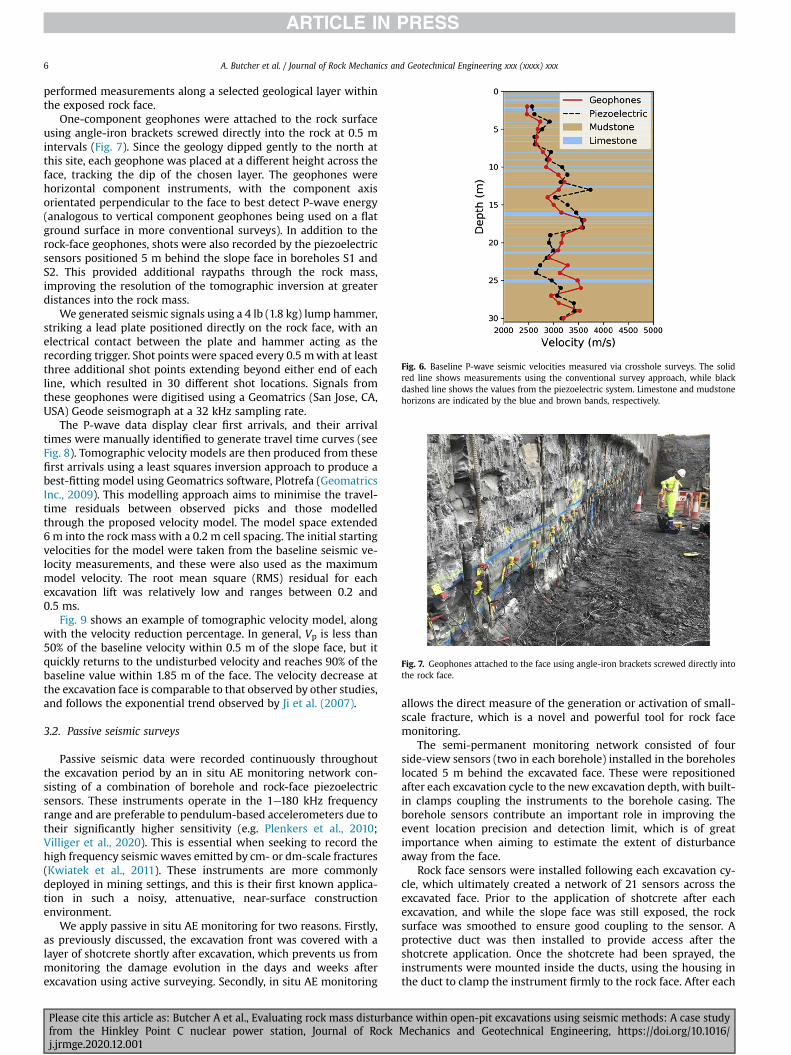
Fig. 6. Baseline P-wave seismic velocities measured via crosshole surveys. The solidred line shows measurements using the conventional survey approach, while blackdashed line shows the values from the piezoelectric system. Limestone and mudstonehorizons are indicated by the blue and brown bands, respectively.
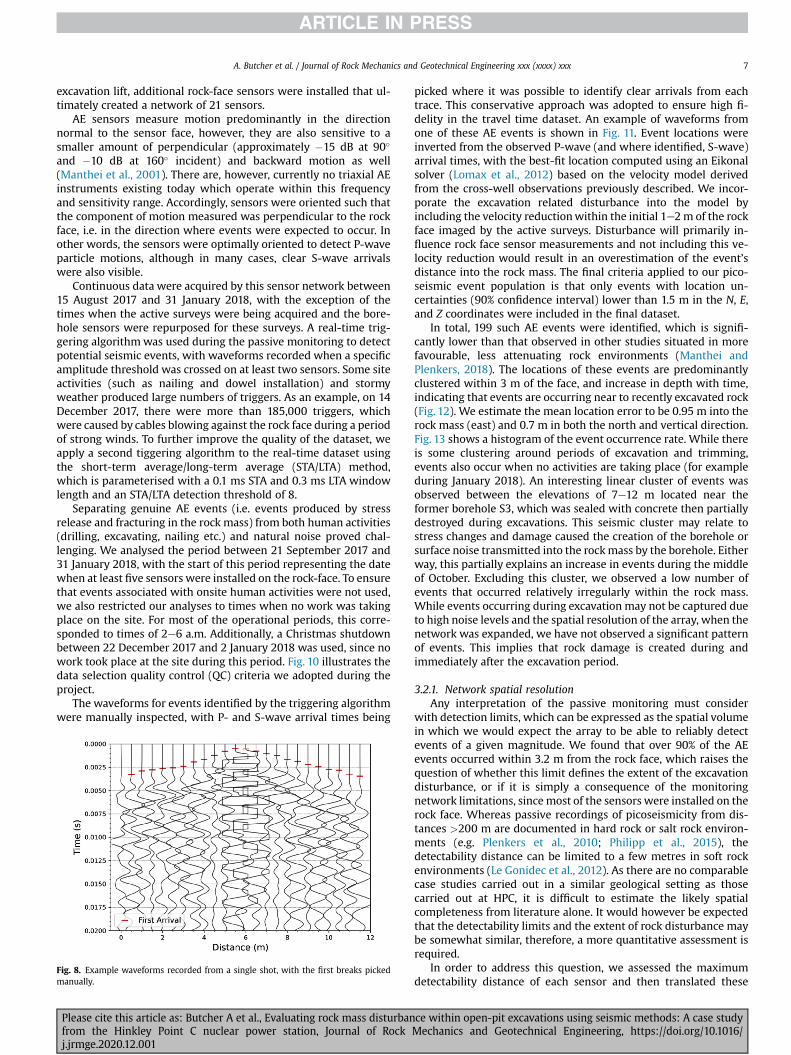
Fig. 7. Geophones attached to the face using angle-iron brackets screwed directly intothe rock face.
A. Butcher et al. / Journal of Rock Mechanics and Geotechnical Engineering xxx (xxxx) xxx6
performed measurements along a selected geological layer withinthe exposed rock face.
One-component geophones were attached to the rock surfaceusing angle-iron brackets screwed directly into the rock at 0.5 mintervals (Fig. 7). Since the geology dipped gently to the north atthis site, each geophone was placed at a different height across theface, tracking the dip of the chosen layer. The geophones werehorizontal component instruments, with the component axisorientated perpendicular to the face to best detect P-wave energy(analogous to vertical component geophones being used on a flatground surface in more conventional surveys). In addition to therock-face geophones, shots were also recorded by the piezoelectricsensors positioned 5 m behind the slope face in boreholes S1 andS2. This provided additional raypaths through the rock mass,improving the resolution of the tomographic inversion at greaterdistances into the rock mass.
We generated seismic signals using a 4 lb (1.8 kg) lump hammer,striking a lead plate positioned directly on the rock face, with anelectrical contact between the plate and hammer acting as therecording trigger. Shot points were spaced every 0.5 mwith at leastthree additional shot points extending beyond either end of eachline, which resulted in 30 different shot locations. Signals fromthese geophones were digitised using a Geomatrics (San Jose, CA,USA) Geode seismograph at a 32 kHz sampling rate.
The P-wave data display clear first arrivals, and their arrivaltimes were manually identified to generate travel time curves (seeFig. 8). Tomographic velocity models are then produced from thesefirst arrivals using a least squares inversion approach to produce abest-fitting model using Geomatrics software, Plotrefa (GeomatricsInc., 2009). This modelling approach aims to minimise the travel-time residuals between observed picks and those modelledthrough the proposed velocity model. The model space extended6 m into the rock mass with a 0.2 m cell spacing. The initial startingvelocities for the model were taken from the baseline seismic ve-locity measurements, and these were also used as the maximummodel velocity. The root mean square (RMS) residual for eachexcavation lift was relatively low and ranges between 0.2 and0.5 ms.
Fig. 9 shows an example of tomographic velocity model, alongwith the velocity reduction percentage. In general, Vp is less than50% of the baseline velocity within 0.5 m of the slope face, but itquickly returns to the undisturbed velocity and reaches 90% of thebaseline value within 1.85 m of the face. The velocity decrease atthe excavation face is comparable to that observed by other studies,and follows the exponential trend observed by Ji et al. (2007).
3.2. Passive seismic surveys
Passive seismic data were recorded continuously throughoutthe excavation period by an in situ AE monitoring network con-sisting of a combination of borehole and rock-face piezoelectricsensors. These instruments operate in the 1e180 kHz frequencyrange and are preferable to pendulum-based accelerometers due totheir significantly higher sensitivity (e.g. Plenkers et al., 2010;Villiger et al., 2020). This is essential when seeking to record thehigh frequency seismic waves emitted by cm- or dm-scale fractures(Kwiatek et al., 2011). These instruments are more commonlydeployed in mining settings, and this is their first known applica-tion in such a noisy, attenuative, near-surface constructionenvironment.
We apply passive in situ AE monitoring for two reasons. Firstly,as previously discussed, the excavation front was covered with alayer of shotcrete shortly after excavation, which prevents us frommonitoring the damage evolution in the days and weeks afterexcavation using active surveying. Secondly, in situ AE monitoring
Please cite this article as: Butcher A et al., Evaluating rock mass disturbanfrom the Hinkley Point C nuclear power station, Journal of Rockj.jrmge.2020.12.001
allows the direct measure of the generation or activation of small-scale fracture, which is a novel and powerful tool for rock facemonitoring.
The semi-permanent monitoring network consisted of fourside-view sensors (two in each borehole) installed in the boreholeslocated 5 m behind the excavated face. These were repositionedafter each excavation cycle to the new excavation depth, with built-in clamps coupling the instruments to the borehole casing. Theborehole sensors contribute an important role in improving theevent location precision and detection limit, which is of greatimportance when aiming to estimate the extent of disturbanceaway from the face.
Rock face sensors were installed following each excavation cy-cle, which ultimately created a network of 21 sensors across theexcavated face. Prior to the application of shotcrete after eachexcavation, and while the slope face was still exposed, the rocksurface was smoothed to ensure good coupling to the sensor. Aprotective duct was then installed to provide access after theshotcrete application. Once the shotcrete had been sprayed, theinstruments were mounted inside the ducts, using the housing inthe duct to clamp the instrument firmly to the rock face. After each
ce within open-pit excavations using seismic methods: A case studyMechanics and Geotechnical Engineering, https://doi.org/10.1016/
A. Butcher et al. / Journal of Rock Mechanics and Geotechnical Engineering xxx (xxxx) xxx 7
excavation lift, additional rock-face sensors were installed that ul-timately created a network of 21 sensors.
AE sensors measure motion predominantly in the directionnormal to the sensor face, however, they are also sensitive to asmaller amount of perpendicular (approximately �15 dB at 90�
and �10 dB at 160� incident) and backward motion as well(Manthei et al., 2001). There are, however, currently no triaxial AEinstruments existing today which operate within this frequencyand sensitivity range. Accordingly, sensors were oriented such thatthe component of motion measured was perpendicular to the rockface, i.e. in the direction where events were expected to occur. Inother words, the sensors were optimally oriented to detect P-waveparticle motions, although in many cases, clear S-wave arrivalswere also visible.
Continuous data were acquired by this sensor network between15 August 2017 and 31 January 2018, with the exception of thetimes when the active surveys were being acquired and the bore-hole sensors were repurposed for these surveys. A real-time trig-gering algorithmwas used during the passive monitoring to detectpotential seismic events, with waveforms recorded when a specificamplitude threshold was crossed on at least two sensors. Some siteactivities (such as nailing and dowel installation) and stormyweather produced large numbers of triggers. As an example, on 14December 2017, there were more than 185,000 triggers, whichwere caused by cables blowing against the rock face during a periodof strong winds. To further improve the quality of the dataset, weapply a second tiggering algorithm to the real-time dataset usingthe short-term average/long-term average (STA/LTA) method,which is parameterised with a 0.1 ms STA and 0.3 ms LTA windowlength and an STA/LTA detection threshold of 8.
Separating genuine AE events (i.e. events produced by stressrelease and fracturing in the rock mass) from both human activities(drilling, excavating, nailing etc.) and natural noise proved chal-lenging. We analysed the period between 21 September 2017 and31 January 2018, with the start of this period representing the datewhen at least five sensors were installed on the rock-face. To ensurethat events associated with onsite human activities were not used,we also restricted our analyses to times when no work was takingplace on the site. For most of the operational periods, this corre-sponded to times of 2e6 a.m. Additionally, a Christmas shutdownbetween 22 December 2017 and 2 January 2018 was used, since nowork took place at the site during this period. Fig. 10 illustrates thedata selection quality control (QC) criteria we adopted during theproject.
The waveforms for events identified by the triggering algorithmwere manually inspected, with P- and S-wave arrival times being
Fig. 8. Example waveforms recorded from a single shot, with the first breaks pickedmanually.
Please cite this article as: Butcher A et al., Evaluating rock mass disturbanfrom the Hinkley Point C nuclear power station, Journal of Rockj.jrmge.2020.12.001
picked where it was possible to identify clear arrivals from eachtrace. This conservative approach was adopted to ensure high fi-delity in the travel time dataset. An example of waveforms fromone of these AE events is shown in Fig. 11. Event locations wereinverted from the observed P-wave (and where identified, S-wave)arrival times, with the best-fit location computed using an Eikonalsolver (Lomax et al., 2012) based on the velocity model derivedfrom the cross-well observations previously described. We incor-porate the excavation related disturbance into the model byincluding the velocity reductionwithin the initial 1e2m of the rockface imaged by the active surveys. Disturbance will primarily in-fluence rock face sensor measurements and not including this ve-locity reduction would result in an overestimation of the event’sdistance into the rock mass. The final criteria applied to our pico-seismic event population is that only events with location un-certainties (90% confidence interval) lower than 1.5 m in the N, E,and Z coordinates were included in the final dataset.
In total, 199 such AE events were identified, which is signifi-cantly lower than that observed in other studies situated in morefavourable, less attenuating rock environments (Manthei andPlenkers, 2018). The locations of these events are predominantlyclustered within 3 m of the face, and increase in depth with time,indicating that events are occurring near to recently excavated rock(Fig. 12). We estimate the mean location error to be 0.95 m into therock mass (east) and 0.7 m in both the north and vertical direction.Fig. 13 shows a histogram of the event occurrence rate. While thereis some clustering around periods of excavation and trimming,events also occur when no activities are taking place (for exampleduring January 2018). An interesting linear cluster of events wasobserved between the elevations of 7e12 m located near theformer borehole S3, which was sealed with concrete then partiallydestroyed during excavations. This seismic cluster may relate tostress changes and damage caused the creation of the borehole orsurface noise transmitted into the rockmass by the borehole. Eitherway, this partially explains an increase in events during the middleof October. Excluding this cluster, we observed a low number ofevents that occurred relatively irregularly within the rock mass.While events occurring during excavation may not be captured dueto high noise levels and the spatial resolution of the array, when thenetwork was expanded, we have not observed a significant patternof events. This implies that rock damage is created during andimmediately after the excavation period.
3.2.1. Network spatial resolutionAny interpretation of the passive monitoring must consider
with detection limits, which can be expressed as the spatial volumein which we would expect the array to be able to reliably detectevents of a given magnitude. We found that over 90% of the AEevents occurred within 3.2 m from the rock face, which raises thequestion of whether this limit defines the extent of the excavationdisturbance, or if it is simply a consequence of the monitoringnetwork limitations, sincemost of the sensors were installed on therock face. Whereas passive recordings of picoseismicity from dis-tances >200 m are documented in hard rock or salt rock environ-ments (e.g. Plenkers et al., 2010; Philipp et al., 2015), thedetectability distance can be limited to a few metres in soft rockenvironments (Le Gonidec et al., 2012). As there are no comparablecase studies carried out in a similar geological setting as thosecarried out at HPC, it is difficult to estimate the likely spatialcompleteness from literature alone. It would however be expectedthat the detectability limits and the extent of rock disturbance maybe somewhat similar, therefore, a more quantitative assessment isrequired.
In order to address this question, we assessed the maximumdetectability distance of each sensor and then translated these
ce within open-pit excavations using seismic methods: A case studyMechanics and Geotechnical Engineering, https://doi.org/10.1016/
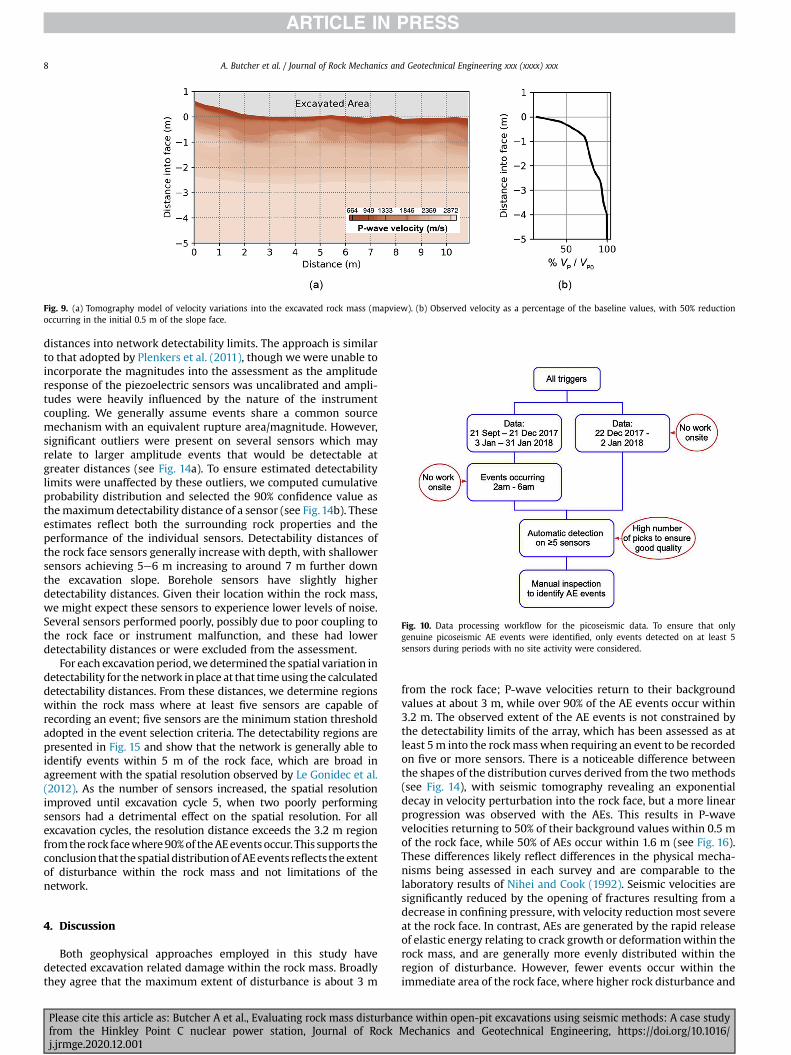
Fig. 9. (a) Tomography model of velocity variations into the excavated rock mass (mapview). (b) Observed velocity as a percentage of the baseline values, with 50% reductionoccurring in the initial 0.5 m of the slope face.
Fig. 10. Data processing workflow for the picoseismic data. To ensure that onlygenuine picoseismic AE events were identified, only events detected on at least 5sensors during periods with no site activity were considered.
A. Butcher et al. / Journal of Rock Mechanics and Geotechnical Engineering xxx (xxxx) xxx8
distances into network detectability limits. The approach is similarto that adopted by Plenkers et al. (2011), though wewere unable toincorporate the magnitudes into the assessment as the amplituderesponse of the piezoelectric sensors was uncalibrated and ampli-tudes were heavily influenced by the nature of the instrumentcoupling. We generally assume events share a common sourcemechanism with an equivalent rupture area/magnitude. However,significant outliers were present on several sensors which mayrelate to larger amplitude events that would be detectable atgreater distances (see Fig. 14a). To ensure estimated detectabilitylimits were unaffected by these outliers, we computed cumulativeprobability distribution and selected the 90% confidence value asthemaximumdetectability distance of a sensor (see Fig.14b). Theseestimates reflect both the surrounding rock properties and theperformance of the individual sensors. Detectability distances ofthe rock face sensors generally increase with depth, with shallowersensors achieving 5e6 m increasing to around 7 m further downthe excavation slope. Borehole sensors have slightly higherdetectability distances. Given their location within the rock mass,we might expect these sensors to experience lower levels of noise.Several sensors performed poorly, possibly due to poor coupling tothe rock face or instrument malfunction, and these had lowerdetectability distances or were excluded from the assessment.
For each excavationperiod,we determined the spatial variation indetectability for the network inplace at that timeusing the calculateddetectability distances. From these distances, we determine regionswithin the rock mass where at least five sensors are capable ofrecording an event; five sensors are the minimum station thresholdadopted in the event selection criteria. The detectability regions arepresented in Fig. 15 and show that the network is generally able toidentify events within 5 m of the rock face, which are broad inagreement with the spatial resolution observed by Le Gonidec et al.(2012). As the number of sensors increased, the spatial resolutionimproved until excavation cycle 5, when two poorly performingsensors had a detrimental effect on the spatial resolution. For allexcavation cycles, the resolution distance exceeds the 3.2 m regionfromthe rock facewhere90%of theAEeventsoccur. This supports theconclusion that the spatial distributionofAEevents reflects theextentof disturbance within the rock mass and not limitations of thenetwork.
4. Discussion
Both geophysical approaches employed in this study havedetected excavation related damage within the rock mass. Broadlythey agree that the maximum extent of disturbance is about 3 m
Please cite this article as: Butcher A et al., Evaluating rock mass disturbanfrom the Hinkley Point C nuclear power station, Journal of Rockj.jrmge.2020.12.001
from the rock face; P-wave velocities return to their backgroundvalues at about 3 m, while over 90% of the AE events occur within3.2 m. The observed extent of the AE events is not constrained bythe detectability limits of the array, which has been assessed as atleast 5m into the rockmass when requiring an event to be recordedon five or more sensors. There is a noticeable difference betweenthe shapes of the distribution curves derived from the twomethods(see Fig. 14), with seismic tomography revealing an exponentialdecay in velocity perturbation into the rock face, but a more linearprogression was observed with the AEs. This results in P-wavevelocities returning to 50% of their background values within 0.5 mof the rock face, while 50% of AEs occur within 1.6 m (see Fig. 16).These differences likely reflect differences in the physical mecha-nisms being assessed in each survey and are comparable to thelaboratory results of Nihei and Cook (1992). Seismic velocities aresignificantly reduced by the opening of fractures resulting from adecrease in confining pressure, with velocity reduction most severeat the rock face. In contrast, AEs are generated by the rapid releaseof elastic energy relating to crack growth or deformationwithin therock mass, and are generally more evenly distributed within theregion of disturbance. However, fewer events occur within theimmediate area of the rock face, where higher rock disturbance and
ce within open-pit excavations using seismic methods: A case studyMechanics and Geotechnical Engineering, https://doi.org/10.1016/
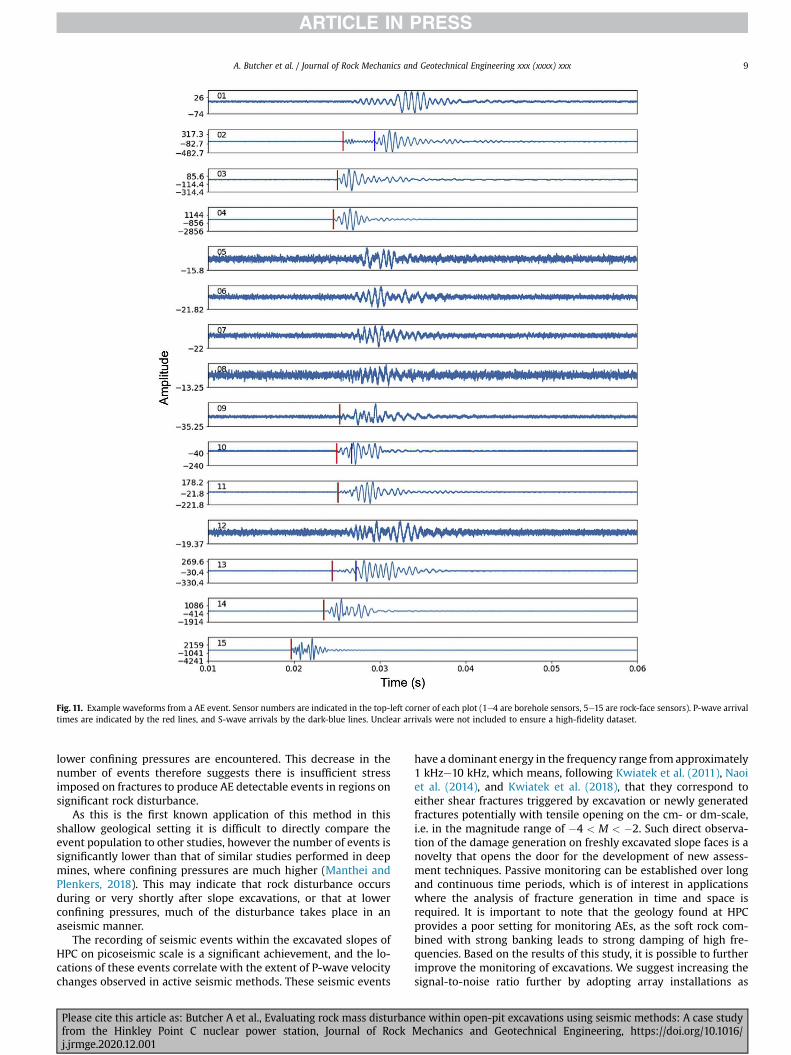
Fig. 11. Example waveforms from a AE event. Sensor numbers are indicated in the top-left corner of each plot (1e4 are borehole sensors, 5e15 are rock-face sensors). P-wave arrivaltimes are indicated by the red lines, and S-wave arrivals by the dark-blue lines. Unclear arrivals were not included to ensure a high-fidelity dataset.
A. Butcher et al. / Journal of Rock Mechanics and Geotechnical Engineering xxx (xxxx) xxx 9
lower confining pressures are encountered. This decrease in thenumber of events therefore suggests there is insufficient stressimposed on fractures to produce AE detectable events in regions onsignificant rock disturbance.
As this is the first known application of this method in thisshallow geological setting it is difficult to directly compare theevent population to other studies, however the number of events issignificantly lower than that of similar studies performed in deepmines, where confining pressures are much higher (Manthei andPlenkers, 2018). This may indicate that rock disturbance occursduring or very shortly after slope excavations, or that at lowerconfining pressures, much of the disturbance takes place in anaseismic manner.
The recording of seismic events within the excavated slopes ofHPC on picoseismic scale is a significant achievement, and the lo-cations of these events correlate with the extent of P-wave velocitychanges observed in active seismic methods. These seismic events
Please cite this article as: Butcher A et al., Evaluating rock mass disturbanfrom the Hinkley Point C nuclear power station, Journal of Rockj.jrmge.2020.12.001
have a dominant energy in the frequency range from approximately1 kHze10 kHz, which means, following Kwiatek et al. (2011), Naoiet al. (2014), and Kwiatek et al. (2018), that they correspond toeither shear fractures triggered by excavation or newly generatedfractures potentially with tensile opening on the cm- or dm-scale,i.e. in the magnitude range of �4 < M < �2. Such direct observa-tion of the damage generation on freshly excavated slope faces is anovelty that opens the door for the development of new assess-ment techniques. Passive monitoring can be established over longand continuous time periods, which is of interest in applicationswhere the analysis of fracture generation in time and space isrequired. It is important to note that the geology found at HPCprovides a poor setting for monitoring AEs, as the soft rock com-bined with strong banking leads to strong damping of high fre-quencies. Based on the results of this study, it is possible to furtherimprove the monitoring of excavations. We suggest increasing thesignal-to-noise ratio further by adopting array installations as
ce within open-pit excavations using seismic methods: A case studyMechanics and Geotechnical Engineering, https://doi.org/10.1016/
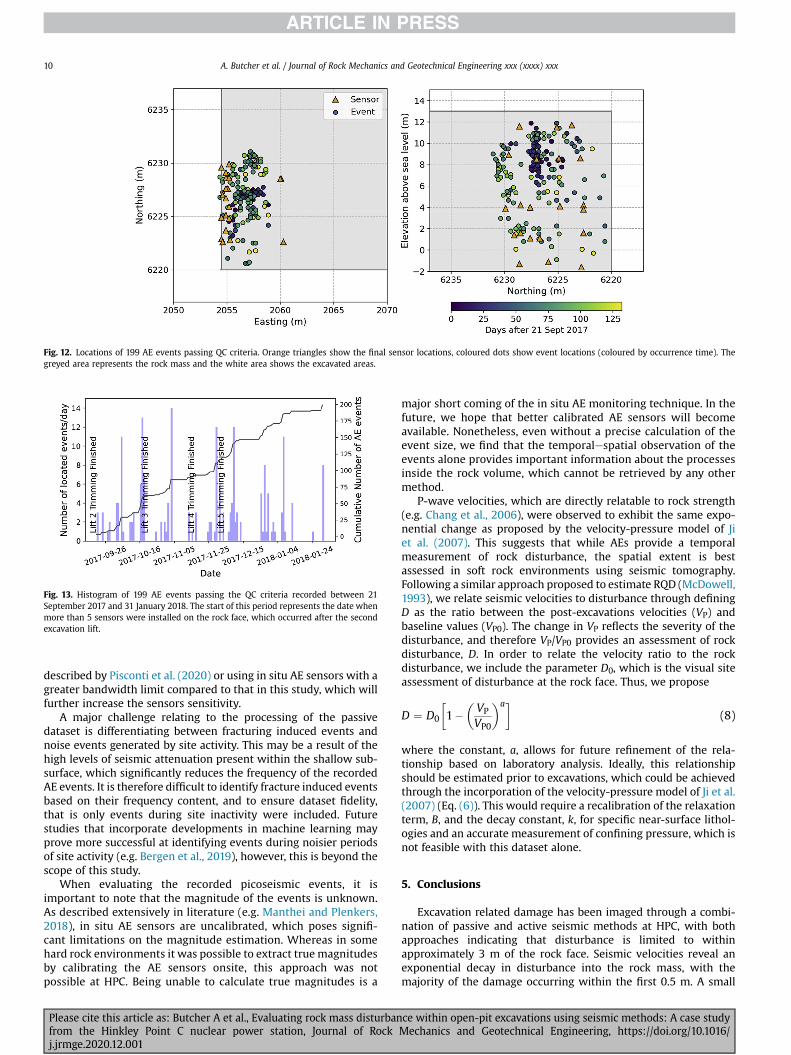
Fig. 12. Locations of 199 AE events passing QC criteria. Orange triangles show the final sensor locations, coloured dots show event locations (coloured by occurrence time). Thegreyed area represents the rock mass and the white area shows the excavated areas.
Fig. 13. Histogram of 199 AE events passing the QC criteria recorded between 21September 2017 and 31 January 2018. The start of this period represents the date whenmore than 5 sensors were installed on the rock face, which occurred after the secondexcavation lift.
A. Butcher et al. / Journal of Rock Mechanics and Geotechnical Engineering xxx (xxxx) xxx10
described by Pisconti et al. (2020) or using in situ AE sensors with agreater bandwidth limit compared to that in this study, which willfurther increase the sensors sensitivity.
A major challenge relating to the processing of the passivedataset is differentiating between fracturing induced events andnoise events generated by site activity. This may be a result of thehigh levels of seismic attenuation present within the shallow sub-surface, which significantly reduces the frequency of the recordedAE events. It is therefore difficult to identify fracture induced eventsbased on their frequency content, and to ensure dataset fidelity,that is only events during site inactivity were included. Futurestudies that incorporate developments in machine learning mayprove more successful at identifying events during noisier periodsof site activity (e.g. Bergen et al., 2019), however, this is beyond thescope of this study.
When evaluating the recorded picoseismic events, it isimportant to note that the magnitude of the events is unknown.As described extensively in literature (e.g. Manthei and Plenkers,2018), in situ AE sensors are uncalibrated, which poses signifi-cant limitations on the magnitude estimation. Whereas in somehard rock environments it was possible to extract true magnitudesby calibrating the AE sensors onsite, this approach was notpossible at HPC. Being unable to calculate true magnitudes is a
Please cite this article as: Butcher A et al., Evaluating rock mass disturbanfrom the Hinkley Point C nuclear power station, Journal of Rockj.jrmge.2020.12.001
major short coming of the in situ AE monitoring technique. In thefuture, we hope that better calibrated AE sensors will becomeavailable. Nonetheless, even without a precise calculation of theevent size, we find that the temporalespatial observation of theevents alone provides important information about the processesinside the rock volume, which cannot be retrieved by any othermethod.
P-wave velocities, which are directly relatable to rock strength(e.g. Chang et al., 2006), were observed to exhibit the same expo-nential change as proposed by the velocity-pressure model of Jiet al. (2007). This suggests that while AEs provide a temporalmeasurement of rock disturbance, the spatial extent is bestassessed in soft rock environments using seismic tomography.Following a similar approach proposed to estimate RQD (McDowell,1993), we relate seismic velocities to disturbance through definingD as the ratio between the post-excavations velocities (VP) andbaseline values (VP0). The change in VP reflects the severity of thedisturbance, and therefore VP/VP0 provides an assessment of rockdisturbance, D. In order to relate the velocity ratio to the rockdisturbance, we include the parameter D0, which is the visual siteassessment of disturbance at the rock face. Thus, we propose
D ¼ D0
�1�
�VP
VP0
�a�(8)
where the constant, a, allows for future refinement of the rela-tionship based on laboratory analysis. Ideally, this relationshipshould be estimated prior to excavations, which could be achievedthrough the incorporation of the velocity-pressure model of Ji et al.(2007) (Eq. (6)). This would require a recalibration of the relaxationterm, B, and the decay constant, k, for specific near-surface lithol-ogies and an accurate measurement of confining pressure, which isnot feasible with this dataset alone.
5. Conclusions
Excavation related damage has been imaged through a combi-nation of passive and active seismic methods at HPC, with bothapproaches indicating that disturbance is limited to withinapproximately 3 m of the rock face. Seismic velocities reveal anexponential decay in disturbance into the rock mass, with themajority of the damage occurring within the first 0.5 m. A small
ce within open-pit excavations using seismic methods: A case studyMechanics and Geotechnical Engineering, https://doi.org/10.1016/
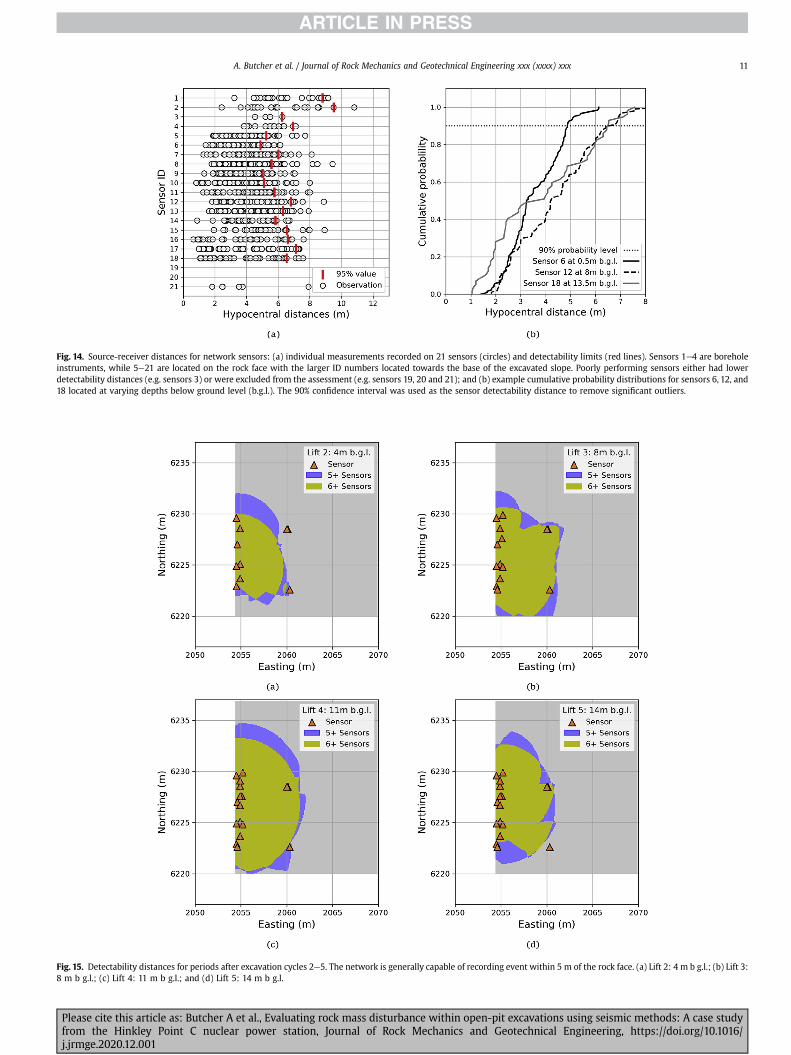
Fig. 15. Detectability distances for periods after excavation cycles 2e5. The network is generally capable of recording event within 5 m of the rock face. (a) Lift 2: 4 m b g.l.; (b) Lift 3:8 m b g.l.; (c) Lift 4: 11 m b g.l.; and (d) Lift 5: 14 m b g.l.
Fig. 14. Source-receiver distances for network sensors: (a) individual measurements recorded on 21 sensors (circles) and detectability limits (red lines). Sensors 1e4 are boreholeinstruments, while 5e21 are located on the rock face with the larger ID numbers located towards the base of the excavated slope. Poorly performing sensors either had lowerdetectability distances (e.g. sensors 3) or were excluded from the assessment (e.g. sensors 19, 20 and 21); and (b) example cumulative probability distributions for sensors 6, 12, and18 located at varying depths below ground level (b.g.l.). The 90% confidence interval was used as the sensor detectability distance to remove significant outliers.
A. Butcher et al. / Journal of Rock Mechanics and Geotechnical Engineering xxx (xxxx) xxx 11
Please cite this article as: Butcher A et al., Evaluating rock mass disturbance within open-pit excavations using seismic methods: A case studyfrom the Hinkley Point C nuclear power station, Journal of Rock Mechanics and Geotechnical Engineering, https://doi.org/10.1016/j.jrmge.2020.12.001
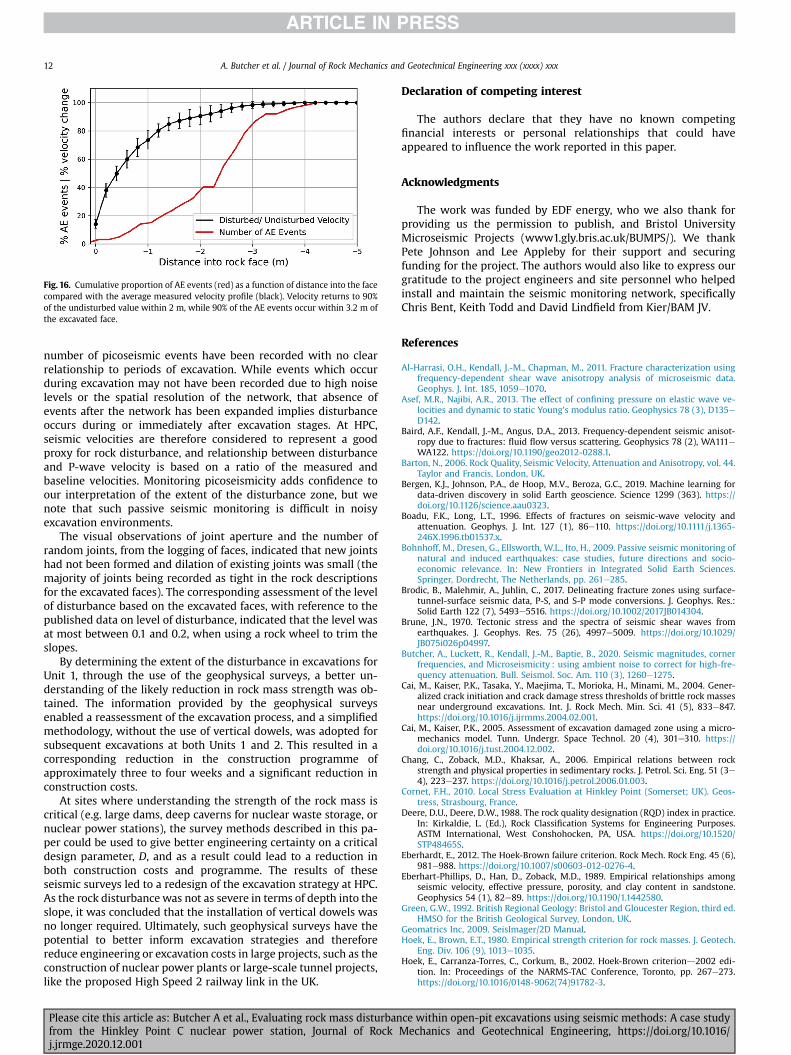
Fig. 16. Cumulative proportion of AE events (red) as a function of distance into the facecompared with the average measured velocity profile (black). Velocity returns to 90%of the undisturbed value within 2 m, while 90% of the AE events occur within 3.2 m ofthe excavated face.
A. Butcher et al. / Journal of Rock Mechanics and Geotechnical Engineering xxx (xxxx) xxx12
number of picoseismic events have been recorded with no clearrelationship to periods of excavation. While events which occurduring excavation may not have been recorded due to high noiselevels or the spatial resolution of the network, that absence ofevents after the network has been expanded implies disturbanceoccurs during or immediately after excavation stages. At HPC,seismic velocities are therefore considered to represent a goodproxy for rock disturbance, and relationship between disturbanceand P-wave velocity is based on a ratio of the measured andbaseline velocities. Monitoring picoseismicity adds confidence toour interpretation of the extent of the disturbance zone, but wenote that such passive seismic monitoring is difficult in noisyexcavation environments.
The visual observations of joint aperture and the number ofrandom joints, from the logging of faces, indicated that new jointshad not been formed and dilation of existing joints was small (themajority of joints being recorded as tight in the rock descriptionsfor the excavated faces). The corresponding assessment of the levelof disturbance based on the excavated faces, with reference to thepublished data on level of disturbance, indicated that the level wasat most between 0.1 and 0.2, when using a rock wheel to trim theslopes.
By determining the extent of the disturbance in excavations forUnit 1, through the use of the geophysical surveys, a better un-derstanding of the likely reduction in rock mass strength was ob-tained. The information provided by the geophysical surveysenabled a reassessment of the excavation process, and a simplifiedmethodology, without the use of vertical dowels, was adopted forsubsequent excavations at both Units 1 and 2. This resulted in acorresponding reduction in the construction programme ofapproximately three to four weeks and a significant reduction inconstruction costs.
At sites where understanding the strength of the rock mass iscritical (e.g. large dams, deep caverns for nuclear waste storage, ornuclear power stations), the survey methods described in this pa-per could be used to give better engineering certainty on a criticaldesign parameter, D, and as a result could lead to a reduction inboth construction costs and programme. The results of theseseismic surveys led to a redesign of the excavation strategy at HPC.As the rock disturbance was not as severe in terms of depth into theslope, it was concluded that the installation of vertical dowels wasno longer required. Ultimately, such geophysical surveys have thepotential to better inform excavation strategies and thereforereduce engineering or excavation costs in large projects, such as theconstruction of nuclear power plants or large-scale tunnel projects,like the proposed High Speed 2 railway link in the UK.
Please cite this article as: Butcher A et al., Evaluating rock mass disturbanfrom the Hinkley Point C nuclear power station, Journal of Rockj.jrmge.2020.12.001
Declaration of competing interest
The authors declare that they have no known competingfinancial interests or personal relationships that could haveappeared to influence the work reported in this paper.
Acknowledgments
The work was funded by EDF energy, who we also thank forproviding us the permission to publish, and Bristol UniversityMicroseismic Projects (www1.gly.bris.ac.uk/BUMPS/). We thankPete Johnson and Lee Appleby for their support and securingfunding for the project. The authors would also like to express ourgratitude to the project engineers and site personnel who helpedinstall and maintain the seismic monitoring network, specificallyChris Bent, Keith Todd and David Lindfield from Kier/BAM JV.
References
Al-Harrasi, O.H., Kendall, J.-M., Chapman, M., 2011. Fracture characterization usingfrequency-dependent shear wave anisotropy analysis of microseismic data.Geophys. J. Int. 185, 1059e1070.
Asef, M.R., Najibi, A.R., 2013. The effect of confining pressure on elastic wave ve-locities and dynamic to static Young’s modulus ratio. Geophysics 78 (3), D135eD142.
Baird, A.F., Kendall, J.-M., Angus, D.A., 2013. Frequency-dependent seismic anisot-ropy due to fractures: fluid flow versus scattering. Geophysics 78 (2), WA111eWA122. https://doi.org/10.1190/geo2012-0288.1.
Barton, N., 2006. Rock Quality, Seismic Velocity, Attenuation and Anisotropy, vol. 44.Taylor and Francis, London, UK.
Bergen, K.J., Johnson, P.A., de Hoop, M.V., Beroza, G.C., 2019. Machine learning fordata-driven discovery in solid Earth geoscience. Science 1299 (363). https://doi.org/10.1126/science.aau0323.
Boadu, F.K., Long, L.T., 1996. Effects of fractures on seismic-wave velocity andattenuation. Geophys. J. Int. 127 (1), 86e110. https://doi.org/10.1111/j.1365-246X.1996.tb01537.x.
Bohnhoff, M., Dresen, G., Ellsworth, W.L., Ito, H., 2009. Passive seismic monitoring ofnatural and induced earthquakes: case studies, future directions and socio-economic relevance. In: New Frontiers in Integrated Solid Earth Sciences.Springer, Dordrecht, The Netherlands, pp. 261e285.
Brodic, B., Malehmir, A., Juhlin, C., 2017. Delineating fracture zones using surface-tunnel-surface seismic data, P-S, and S-P mode conversions. J. Geophys. Res.:Solid Earth 122 (7), 5493e5516. https://doi.org/10.1002/2017JB014304.
Brune, J.N., 1970. Tectonic stress and the spectra of seismic shear waves fromearthquakes. J. Geophys. Res. 75 (26), 4997e5009. https://doi.org/10.1029/JB075i026p04997.
Butcher, A., Luckett, R., Kendall, J.-M., Baptie, B., 2020. Seismic magnitudes, cornerfrequencies, and Microseismicity : using ambient noise to correct for high-fre-quency attenuation. Bull. Seismol. Soc. Am. 110 (3), 1260e1275.
Cai, M., Kaiser, P.K., Tasaka, Y., Maejima, T., Morioka, H., Minami, M., 2004. Gener-alized crack initiation and crack damage stress thresholds of brittle rock massesnear underground excavations. Int. J. Rock Mech. Min. Sci. 41 (5), 833e847.https://doi.org/10.1016/j.ijrmms.2004.02.001.
Cai, M., Kaiser, P.K., 2005. Assessment of excavation damaged zone using a micro-mechanics model. Tunn. Undergr. Space Technol. 20 (4), 301e310. https://doi.org/10.1016/j.tust.2004.12.002.
Chang, C., Zoback, M.D., Khaksar, A., 2006. Empirical relations between rockstrength and physical properties in sedimentary rocks. J. Petrol. Sci. Eng. 51 (3e4), 223e237. https://doi.org/10.1016/j.petrol.2006.01.003.
Cornet, F.H., 2010. Local Stress Evaluation at Hinkley Point (Somerset; UK). Geos-tress, Strasbourg, France.
Deere, D.U., Deere, D.W., 1988. The rock quality designation (RQD) index in practice.In: Kirkaldie, L. (Ed.), Rock Classification Systems for Engineering Purposes.ASTM International, West Conshohocken, PA, USA. https://doi.org/10.1520/STP48465S.
Eberhardt, E., 2012. The Hoek-Brown failure criterion. Rock Mech. Rock Eng. 45 (6),981e988. https://doi.org/10.1007/s00603-012-0276-4.
Eberhart-Phillips, D., Han, D., Zoback, M.D., 1989. Empirical relationships amongseismic velocity, effective pressure, porosity, and clay content in sandstone.Geophysics 54 (1), 82e89. https://doi.org/10.1190/1.1442580.
Green, G.W., 1992. British Regional Geology: Bristol and Gloucester Region, third ed.HMSO for the British Geological Survey, London, UK.
Geomatrics Inc, 2009. SeisImager/2D Manual.Hoek, E., Brown, E.T., 1980. Empirical strength criterion for rock masses. J. Geotech.
Eng. Div. 106 (9), 1013e1035.Hoek, E., Carranza-Torres, C., Corkum, B., 2002. Hoek-Brown criteriond2002 edi-
tion. In: Proceedings of the NARMS-TAC Conference, Toronto, pp. 267e273.https://doi.org/10.1016/0148-9062(74)91782-3.
ce within open-pit excavations using seismic methods: A case studyMechanics and Geotechnical Engineering, https://doi.org/10.1016/

A. Butcher et al. / Journal of Rock Mechanics and Geotechnical Engineering xxx (xxxx) xxx 13
Hoek, E., Brown, E.T., 2019. The Hoek-Brown failure criterion and GSId2018 edition.J. Rock. Mech. Geotech. Eng. 11 (3), 445e463. https://doi.org/10.1016/j.jrmge.2018.08.001.
Ji, S., Wang, Q., Marcotte, D., Salisbury, M.H., Xu, Z., 2007. P wave velocities,anisotropy and hysteresis in ultrahigh-pressure metamorphic rocks as a func-tion of confining pressure. J. Geophys. Res.: Solid Earth 112 (9), 1e24. https://doi.org/10.1029/2006JB004867.
Kwiatek, G., Plenkers, K., Dresen, G., Jaguars group, 2011. Source parameters ofpicoseismicity recorded at Mponeng deep gold mine, South Africa: implicationsfor scaling relations. Bull. Seismol. Soc. Am. 101 (6), 2592e2608. https://doi.org/10.1785/0120110094.
Kwiatek, G., Martínez-Garzón, P., Plenkers, K., Leonhardt, M., Zang, A., vonSpecht, S., Dresen, D., Bohnhoff, M., 2018. Insights into complex subdecimeterfracturing process occurring during a water injection experiment in Äspö HardRock Laboratory, Sweden. J. Geophys. Res.: Solid Earth 123. https://doi.org/10.1029/2017JB014715.
Le Gonidec, Y., Schubnel, A., Wassermann, J., Gibert, D., Nussbaum, C., Kergosien, B.,Sarout, J., Maineult, A., Guéguen, Y., 2012. Field-scale acoustic investigation of adamaged anisotropic shale during a gallery excavation. Int. J. Rock Mech. Min.Sci. 51, 136e148. https://doi.org/10.1016/j.ijrmms.2012.01.018.
Leucci, G., De Giorgi, L., 2006. Experimental studies on the effects of fracture on theP and S wave velocity propagation in sedimentary rock (“Calcarenite del Sale-nto”). Eng. Geol. 84 (3e4), 130e142. https://doi.org/10.1016/j.enggeo.2005.12.004.
Li, A.J., Merifield, R.S., Lyamin, A.V., 2011. Effect of rock mass disturbance on thestability of rock slopes using the Hoek-Brown failure criterion. Comput. Geo-tech. 38 (4), 546e558. https://doi.org/10.1016/j.compgeo.2011.03.003.
Lomax, A., Satriano, C., Vassallo, M., 2012. Automatic picker developments andoptimization: FilterPickerda robust, broadband picker for real-time seismicmonitoring and earthquake early warning. Seismol Res. Lett. 83 (3), 531e540.https://doi.org/10.1785/gssrl.83.3.531.
Lu, W., Yang, J., Yan, P., Chen, M., Zhou, C., Luo, Y., Jin, L., 2012. Dynamic response ofrock mass induced by the transient release of in-situ stress. Int. J. Rock Mech.Min. Sci. 53, 129e141. https://doi.org/10.1016/j.ijrmms.2012.05.001.
Malmgren, L., Saiang, D., Töyrä, J., Bodare, A., 2007. The excavation disturbed zone(EDZ) at Kiirunavaara mine, Sweden-by seismic measurements. J. Appl. Geo-phys. 61 (1), 1e15.
Manthei, G., Eisenblatter, J., Dahm, T., 2001. Moment tensor evaluation of acousticemission sources insalt rock. Construct. Build. Mater. 15 (5e6), 297e309.
Manthei, G., Plenkers, K., 2018. Review on in situ acoustic emission monitoring inthe context of structural health monitoring in mines. Appl. Sci. 8 (9), 1595.https://doi.org/10.3390/app8091595.
Martino, J.B., Chandler, N.A., 2004. Excavation-induced damage studies at the un-derground research laboratory. Int. J. Rock Mech. Min. Sci. 41, 1413e1426.https://doi.org/10.1016/j.ijrmms.2004.09.010.
McDowell, P.W., 1993. Seismic investigation for rock engineering. In: Hudson, J.A.(Ed.), Rock Testing and Site Characterization: Principles, Practice and Projects.Pergamon Press, Oxford, UK, pp. 619e634. https://doi.org/10.1016/B978-0-08-042066-0.50031-8.
Naoi, M., Nakatani, M., Horiuchi, S., Yabe, Y., Philipp, J., Kgarume, T., Morema, G.,Khambule, S., Masakale, T., Ribeiro, L., et al., 2014. Frequencyemagnitude dis-tribution of �3.7 � M W � 1 mining-induced earthquakes around a miningfront and b value invariance with post-blast time. Pure Appl. Geophys. 171,2665e2684. https://doi.org/10.1007/s00024-013-0721-7.
Nihei, K.T., Cook, N.G.W., 1992. Seismic behavior of fractures under normalcompression. In: Proceedings of the 33th US Symposium on Rock Mechanics(USRMS). American Rock Mechanics Association, pp. 989e998.
Nourani, M.H., Moghadder, M.T., Safari, M., 2017. Classification and assessment ofrock mass parameters in Choghart iron mine using P-wave velocity. J. Rock.Mech. Geotech. Eng. 9 (2), 318e328. https://doi.org/10.1016/j.jrmge.2016.11.006.
Please cite this article as: Butcher A et al., Evaluating rock mass disturbanfrom the Hinkley Point C nuclear power station, Journal of Rockj.jrmge.2020.12.001
Philipp, J., Plenkers, K., Gärtner, G., Teichmann, L., 2015. On the potential of In-SituAcoustic Emission (AE) technology for the monitoring of dynamic processes insalt mines. In: Lance, R., Mellegard, K., Hansen, F. (Eds.), Proceedings of theMechanical Behavior of Salt VIII, pp. 89e98.
Pisconti, A., Plenkers, K., Philipp, J., Thomas, C., 2020. Array seismology applied toacoustic emissions recorded in the Asse II salt mine. Geophys. J. Int. 220, 59e70.
Plenkers, K., Kwiatek, G., Nakatani, M., Dresen, G., 2010. Observation of seismicevents with frequencies f > 25 kHz at Mponeng deep gold mine, South Africa.Seismol Res. Lett. 81, 467e479.
Plenkers, K., Schorlemmer, D., Kwiatek, G., Jaguars group, 2011. On the probability ofdetecting picoseismicity. Bull. Seismol. Soc. Am. 101 (6), 2579e2591.
Prasad, M., Zimmer, M.A., Berge, P.A., Bonner, B.P., 2005. Laboratory measurementsof velocity and attenuation in sediments. In: Butler, D. (Ed.), Near-SurfaceGeophysics. Society of Exploration Geophysicists, pp. 491e502.
Read, R.S., 2004. 20 years of excavation response studies at AECL’s UndergroundResearch Laboratory. Int. J. Rock Mech. Min. Sci. 41 (8 SPEC.ISS.), 1251e1275.
Sarkar, K., Vishal, V., Singh, T.N., 2012. An empirical correlation of index geo-mechanical parameters with the compressional wave velocity. Geotech. Geol.Eng. 30 (2), 469e479. https://doi.org/10.1007/s10706-011-9481-2.
Sharma, P.K., Singh, T.N., 2008. A correlation between P-wave velocity, impactstrength index, slake durability index and uniaxial compressive strength. Bull.Eng. Geol. Environ. 67, 17e22.
Sonmez, H., Ulusay, R., 1999. Modifications to the geological strength index (GSI)and their applicability to stability of slopes. Int. J. Rock Mech. Min. Sci. 36 (6),743e760. https://doi.org/10.1016/S0148-9062(99)00043-1.
Sun, S., Ji, S., Wang, Q., Salisbury, M., Kern, H., 2012. P-wave velocity differencesbetween surface-derived and core samples from the Sulu ultrahigh-pressureterrane: implications for in situ velocities at great depths. Geology 40 (7), 651e654. https://doi.org/10.1130/G33045.1.
Verdon, J.P., Angus, D.A., Kendall, J.M., Hall, S.A., 2008. The effect of microstructureand nonlinear stress on anisotropic seismic velocities. Geophysics 73 (4).
Villiger, L., Gischig, V.S., Doetsch, J., Krietsch, H., Dutler, N.O., Jalali, M., Valley, B.,Selvadurai, P.A., Mignan, A., Plenkers, K., et al., 2020. Influence of reservoirgeology on seismic response during decameter scale hydraulic stimulations incrystalline rock. Solid Earth 11, 627e655. https://doi.org/10.5194/se-11-627-2020.
Wang, Z., Li, X., Shang, X., 2019. Distribution characteristics of mining-inducedseismicity revealed by 3-D ray-tracing relocation and the FCM clusteringmethod. Rock Mech. Rock Eng. 52 (1), 183e197. https://doi.org/10.1007/s00603-018-1585-z.
Dr. Antony Butcher is a Senior Research Associate at theUniversity of Bristol, UK, and a geophysical consultant. Hisresearch interests are in engineering geophysics, with aparticular focus on near-surface seismic applications andmicroseismics. He received a BSc (2001) in Mathematicswith Management, then an MSc (2004) in ExplorationGeophysics from Leeds University before joining TerraDatUK Ltd., where he was engaged in a broad range of engi-neering and environmental geophysics projects. In 2010he joined the UK Ministry of Defence (MoD), where heworked primarily on the risk management of unexplodedordnance, and in 2012 was awarded Chartered Scientiststatus through the Geological Society of London. He leftthe MoD in 2014 to begin a PhD at Bristol University, dur-
ce within open-pit excMechanics and Geote
ing which time he also co-founded Outer Limits Geosciences LLP. In 2018, he wasawarded a PhD degree for his research on microseismology, and he is currently theUK’s manager for an international Carbon Capture and Storage research project.
avations using seismic methods: A case studychnical Engineering, https://doi.org/10.1016/


![Telecommunication Products - Trendtek jointing pits.pdf · [01] UG2006 - P6 Pit UG2007 - P7 Pit UG2008 - P8 Pit UG2900 - P9 Pit UG2001 - P1 Pit UG2002 - P2 Pit UG2003 - P3 Pit UG2004](https://img.pdfslide.us/doc/110x75/5a7969077f8b9ab9308d3433/telecommunication-products-jointing-pitspdf01-ug2006-p6-pit-ug2007-p7-pit.jpg)