Embed Size (px)
Citation preview
ORIGINAL ARTICLE
Evaluating remediation alternatives for mine drainage,Little Cottonwood Creek, Utah, USA
Briant A. Kimball Æ Robert L. Runkel
Received: 4 February 2009 / Accepted: 6 July 2009 / Published online: 7 August 2009
� US Government 2009
Abstract The vast occurrence of mine drainage world-
wide, documented in descriptive studies, presents a stag-
gering challenge for remediation. Any tool that can move
beyond descriptive study and helps to evaluate options for
remediation in a way that maximizes improvements to the
water quality of streams and minimizes cost of remediation
could save valuable resources and time. A reactive solute
transport model, calibrated from two detailed mass-loading
studies in Little Cottonwood Creek (LCC), Utah, provides
a tool to evaluate remediation options. Metal loading to
LCC is dominated by discharge from two mine drainage
tunnels. Discharge from an upstream tunnel has been
treated by a fen to reduce metal loading. Discharge from
the downstream tunnel (WDT) can be controlled because
of a bulkhead that creates a mine pool. Simulations of
remedial options for three compliance locations suggest
that the water-quality standards for Cu and Zn at upstream
and downstream compliance locations are met using vari-
ous combinations of fen treatment and WDT regulation,
but the complete compliance at the middle compliance
location requires the highest level of fen treatment and the
greatest regulation of WDT discharge. Reactive transport
modeling is an useful tool for the evaluation of remedial
alternatives in complex natural systems, where multiple
hydrologic and geochemical processes determine metal
fate.
Keywords Mine drainage � Remediation �Transport modeling � Water-quality standards � TMDL
Introduction
In recent years, some mine drainage problems have been
addressed by groups of stakeholders that bring together mine
and property owners, environmental groups, and concerned
citizens with Federal, State, and local agencies. Concerns
about discharge of metal-rich water from historical mine
drainage tunnels to Little Cottonwood Creek (LCC), near
Salt Lake City, Utah, have been addressed by such a
stakeholder group. Under the direction of the Utah Division
of Water Quality, a total maximum daily load (TMDL) study
was conducted to evaluate loads for dissolved zinc (Zn) and
to define the extent of treatment that would be necessary to
achieve instream water-quality standards (Shepherd Miller
2002). The study indicated that achieving the standards
would be expensive, much beyond the resources of the
stakeholder group, and so a study was proposed to use
reactive solute transport modeling to test combinations of
treatments that could provide the least costly alternative.
Reactive solute transport modeling has been combined
with field experiments to evaluate remediation options in
other settings. Runkel and Kimball (2002), for example,
simulated the potential effects of an active treatment sys-
tem located in the headwaters of Mineral Creek, Colorado.
Simulation results for two hypothetical treatment plans
indicated a decrease in dissolved concentration for most
metals in response to remediation. Results for dissolved
lead, in contrast, indicated the potential for remedial
Electronic supplementary material The online version of thisarticle (doi:10.1007/s12665-009-0240-0) contains supplementarymaterial, which is available to authorized users.
B. A. Kimball (&)
U.S. Geological Survey, 2329 W Orton Circle,
Salt Lake City, UT 84119-2047, USA
e-mail: [email protected]
R. L. Runkel
Denver Federal Center, U.S. Geological Survey,
MS 415, PO Box 25046, Lakewood, CO 80225, USA
123
Environ Earth Sci (2010) 60:1021–1036
DOI 10.1007/s12665-009-0240-0
actions to adversely affect water quality, as the second
remediation plan resulted in a concentration increase. This
non-intuitive result occurs because of a decrease in iron
colloids, an important sorbent for dissolved lead. Ball et al.
(2004) evaluated numerous remedial options for the Sum-
mitville mine site located in south-central Colorado. Study
results are being used by the State of Colorado to redesign
and/or replace an existing treatment system at the mine
site. Walton-Day et al. (2007) simulated the decrease in
zinc load at the mouth of Cement Creek, Colorado, that
would result from hypothetical combinations of remedia-
tion on Federal lands in the catchment. Through a process
of calibrating simulations of a mine-impacted stream and
then eliminating those sources that can be attributed to
mining, Runkel and Kimball (2007) have used modeling to
estimate pre-mining concentrations of metals for Red
Mountain Creek, Colorado. The general approach of
combining field experiments with reactive solute transport
modeling is discussed by Kimball et al. (2003).
The present work combines field experiments that were
designed to evaluate potential remedial options with sim-
ulation modeling to predict resulting water quality from
various combinations of ‘‘treatment.’’ Results of this study
are highly relevant to the TMDL process that is occurring
for LCC, but have a wider application because this
approach could be implemented in many areas affected by
mine drainage to evaluate remediation options that could
save money.
Methods
Study area and experimental setting
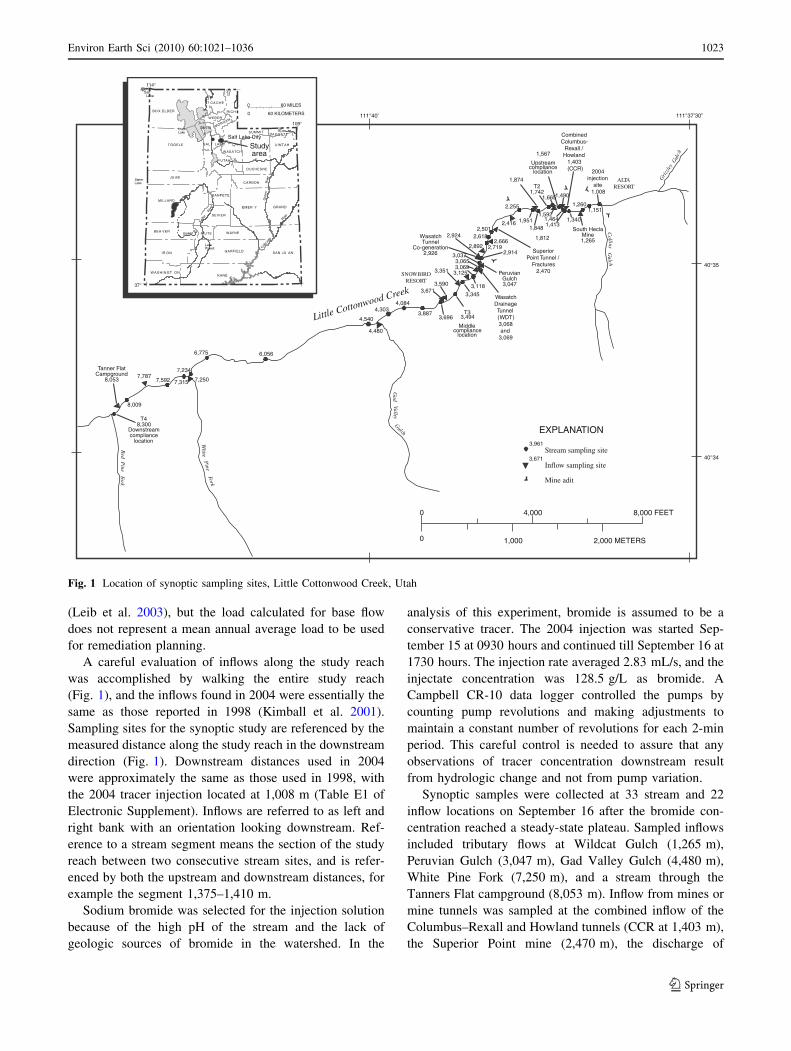
Little Cottonwood Creek begins at about 3,400 m in the
Wasatch Mountains and descends more than 2,000 m in the
study reach, resulting in a cascading stream with many
pools and riffles. The study reach extends from the LCC
headwaters near the town of Alta Utah, to the U.S. Geo-
logical Survey (USGS) stream gage near Tanners Flat (gage
number 10167450, Table E1 of Electronic Supplement).
Major sources of metal loading to LCC were identified as
part of a mass-loading study in 1998 (Gerner et al. 2001;
Kimball et al. 2001). The principal sources were two mine
drainage tunnels that discharge directly into LCC. The
Wasatch Drainage Tunnel (WDT, Fig. 1) was the principal
source of loading for many metals, particularly for Zn. The
WDT combines the drainage from many mines and dis-
charges to the stream in at least three places. The most
upstream discharge, when the mine pool behind the bulk-
head is deeper than 91 m, is through fractures and a small
tunnel, the Superior Point mine (2,470 m; Fig. 1; Douglas
Evans, Salt Lake County Water conservancy District,
personal communication 1999). A second inflow at 2,926 m
discharges WDT water that is used to cool the electrical
generation turbine at Snowbird Ski Resort. Finally, a con-
trollable portion of the WDT discharge enters the stream in
two pipes at 3,068 and 3,069 m. The combined Howland–
Columbus–Rexall (CCR, Fig. 1) discharge was the greatest
source for loading of Cu and the second greatest source for
Zn. During the 1998 study, the discharge from the CCR was
being treated by a fen system (Jensen and Karimi 2001).
Seasonal variability of metal loading was investigated by
sampling downstream from the principal metal loading
inflows in 2001. These samples included discharge, and
both dissolved (10,000 Da-filtered) and colloidal metal
concentrations to calculate the seasonal loads of metals.
To quantify changes in the distribution and magnitude of
metal loads to LCC, the USGS conducted a mass-loading
study in 2004 for comparison to the 1998 study. The study
reach in 2004 was mostly the same as in the 1998 study,
however, in 2004 two intentional changes were made to
affect the metal loading to LCC. First, the CCR discharge
was not being treated by the fen, and second, the drainage
from the WDT was intentionally increased to test the
maximum loading it could contribute. By draining the pool
behind the bulkhead below 91 m, the discharge from the
Superior Point mine (2,470 m) was eliminated. This 2004
field experiment provided important test conditions for the
modeling study by defining two variables that might be
considered for less expensive remediation. The first vari-
able is the passive treatment of the fen, and the second is
the controllable discharge from the WDT. Combinations of
fen treatment and seasonal variation of WDT discharge
might meet TMDL requirements.
Tracer injection and synoptic sampling
A mass-loading approach combines various methods. Data
collection for the analysis is based on field methods of
tracer dilution (Kilpatrick and Cobb 1985) and synoptic
sampling (Bencala and McKnight 1987; Kimball et al.
1994). Data analysis is based on methods of calculating
loads to obtain detailed longitudinal profiles of mass
loading (Kimball et al. 2002, 2004, 2007).
Mass-loading field experiments have frequently been
conducted during late-summer base-flow conditions. This
is to minimize the effects of diel variation during snowmelt
runoff, to maximize the effects of ground-water inflows on
the stream, and the facilitate access to stream and inflow
sampling sites. The base-flow loading pattern most likely
represents those metal loads that contribute to chronic
toxicity, which may be particularly important during late-
summer, early-fall, and winter months (Besser et al. 1999).
The base-flow pattern may prove to be representative of
loading patterns throughout the annual cycle of streamflow
1022 Environ Earth Sci (2010) 60:1021–1036
123
(Leib et al. 2003), but the load calculated for base flow
does not represent a mean annual average load to be used
for remediation planning.
A careful evaluation of inflows along the study reach
was accomplished by walking the entire study reach
(Fig. 1), and the inflows found in 2004 were essentially the
same as those reported in 1998 (Kimball et al. 2001).
Sampling sites for the synoptic study are referenced by the
measured distance along the study reach in the downstream
direction (Fig. 1). Downstream distances used in 2004
were approximately the same as those used in 1998, with
the 2004 tracer injection located at 1,008 m (Table E1 of
Electronic Supplement). Inflows are referred to as left and
right bank with an orientation looking downstream. Ref-
erence to a stream segment means the section of the study
reach between two consecutive stream sites, and is refer-
enced by both the upstream and downstream distances, for
example the segment 1,375–1,410 m.
Sodium bromide was selected for the injection solution
because of the high pH of the stream and the lack of
geologic sources of bromide in the watershed. In the
analysis of this experiment, bromide is assumed to be a
conservative tracer. The 2004 injection was started Sep-
tember 15 at 0930 hours and continued till September 16 at
1730 hours. The injection rate averaged 2.83 mL/s, and the
injectate concentration was 128.5 g/L as bromide. A
Campbell CR-10 data logger controlled the pumps by
counting pump revolutions and making adjustments to
maintain a constant number of revolutions for each 2-min
period. This careful control is needed to assure that any
observations of tracer concentration downstream result
from hydrologic change and not from pump variation.
Synoptic samples were collected at 33 stream and 22
inflow locations on September 16 after the bromide con-
centration reached a steady-state plateau. Sampled inflows
included tributary flows at Wildcat Gulch (1,265 m),
Peruvian Gulch (3,047 m), Gad Valley Gulch (4,480 m),
White Pine Fork (7,250 m), and a stream through the
Tanners Flat campground (8,053 m). Inflow from mines or
mine tunnels was sampled at the combined inflow of the
Columbus–Rexall and Howland tunnels (CCR at 1,403 m),
the Superior Point mine (2,470 m), the discharge of
PeruvianGulch3,047
WasatchTunnel
Co-generation2,926
T48,300
Downstreamcompliance
location
8,009
7,5927,787
South HeclaMine1,265
1,260
1,3401,413
1,490
1,567
Upstreamcompliance
location
T21,742
1,812
1,8481,951
1,874
2,4162,501
2,7192,8922,9143,037
3,118
3,125
3,065
3,345
T33,494
Middlecompliance
location
3,351
3,671
3,6963,887
4,084
4,480
4,540
6,0566,775
7,2507,315
7,234
Stream sampling site
Inflow sampling site
Mine adit
3,671
3,961
0
0 2,000 METERS
8,000 FEET4,000
1,000
40°35’
111°37’30”111°40’
40°34’
Little Cottonwood Creek
Tanner FlatCampground
8,053
Beaver R
GreatSaltLake
Rive
r
Colora
doG
reen
Riv
er
Sevie
r
LakePowell
River
SevierLake
114°42°
37°
109°
W ASHINGT ON
EMER Y GRAND
WAYNE
UINT AH
DUCHESNE
CARBON
WASATCH
UTAH
JU AB
T OOELE SAL T LAKE
WEBER
DAVISSUMMIT
RICH
GARFIELD SAN JU AN
KANE
CA CHE
BO X ELDER
IR ON
BEA VER
MILLARD
SANPETE
SEVIER
PIUTE
0
0 60 KILOMETERS
60 MILES
Studyarea
Salt Lake CityDA GGETT
MORGAN
UtahLake Combined
Columbus-Rexall / Howland
1,403(CCR)
SuperiorPoint Tunnel /
Fractures2,470
WasatchDrainageTunnel(WDT)3,068and
3,069
2004injection
site1,008
Gad Va lley Gulch
White P
ine Fork
Red P
nie Fork
Coll ins G
ulch
Griz
zley
Gul
ch
ALTARESORT
SNOWBIRDRESORT
EXPLANATION
1,151
1,4641,592
1,665
2,255
2,6182,666
2,924
3,069
3,590
4,303
Fig. 1 Location of synoptic sampling sites, Little Cottonwood Creek, Utah
Environ Earth Sci (2010) 60:1021–1036 1023
123
cooling water from the Snowbird resort co-generation plant
(2,926 m), and the WDT discharge (WDT at 3,068 m). The
remaining inflows were mostly various sized springs.
Samples were collected in 1.8-L HPDE bottles usually
by submersing the neck of each bottle into the water near
the thalweg. Where the stream was deep enough and wide
enough, samples were collected by integrating techniques
(Ward and Harr 1990). Samples were transported to a
central processing area where 125-mL aliquots were pre-
pared for cation and anion analyses. Onsite processing
included filtration, pH measurement, and preservation of
samples for iron speciation. Filtration was completed with
in-line disk filters with 0.45-lm membranes. Aliquots for
iron speciation were placed in amber bottles and preserved
with concentrated hydrochloric acid to fix the ferrous/ferric
ratio in filtered samples (To et al. 1998). Ultrafiltration was
completed for four stream sites (1,464, 3,037, 7,315, and
8,300 m) using tangential-flow filtration with 10,000-Da
molecular weight membranes. As in other studies of mine
drainage, this was to evaluate the truly dissolved concen-
trations of metals (Kimball et al. 1992, 1995). Aliquots for
cation analysis were acidified to pH \2.0 with ultrapure
nitric acid. Total recoverable and dissolved cation con-
centrations were determined from unfiltered and filtered
samples, respectively, using inductively coupled argon
plasma-mass spectrometry. Cation concentrations are
reported for Al, As, Ba, Ca, Cd, Co, Cr, Cu, Fe, K, Mg,
Mn, Mo, Na, Ni, Pb, Si, Sr, and Zn. Dissolved anion
concentrations were determined from filtered, unacidified
samples by ion chromatography. Anion concentrations are
reported for Cl, Br, and SO4. Ferrous (FeII) and total dis-
solved iron (FeT) were determined colorimetrically with a
method modified from Brown et al. (1970). Alkalinity (as
calcium carbonate) was determined from filtered, unacidi-
fied samples by titration.
In an effort to reduce study costs, only a subset of the
samples collected in 2004 were subject to the complete
cation and anion analyses described above. For the case of
stream samples, complete cation and anion analyses for
dissolved and total recoverable aliquots were obtained for
17 of the 33 sampled sites. For the case of inflow samples,
complete cation and anion analyses for dissolved aliquots
were obtained for 9 of the 22 sampled sites. Chemical
analyses for the remaining 16 stream and 13 inflow sites
included only pH, anion concentrations (F and SO4), and
zinc concentration (dissolved and total recoverable). With
the exception of zinc, none of the 2004 inflow samples
were analyzed for total recoverable cation concentrations.
Due to the incomplete analysis of the 2004 samples,
additional sources of data are used in the modeling analysis
of remedial options that follows. These additional data
sources include the 1998 study (Gerner et al. 2001; Kimball
et al. 2001) and unpublished data from August 1999.
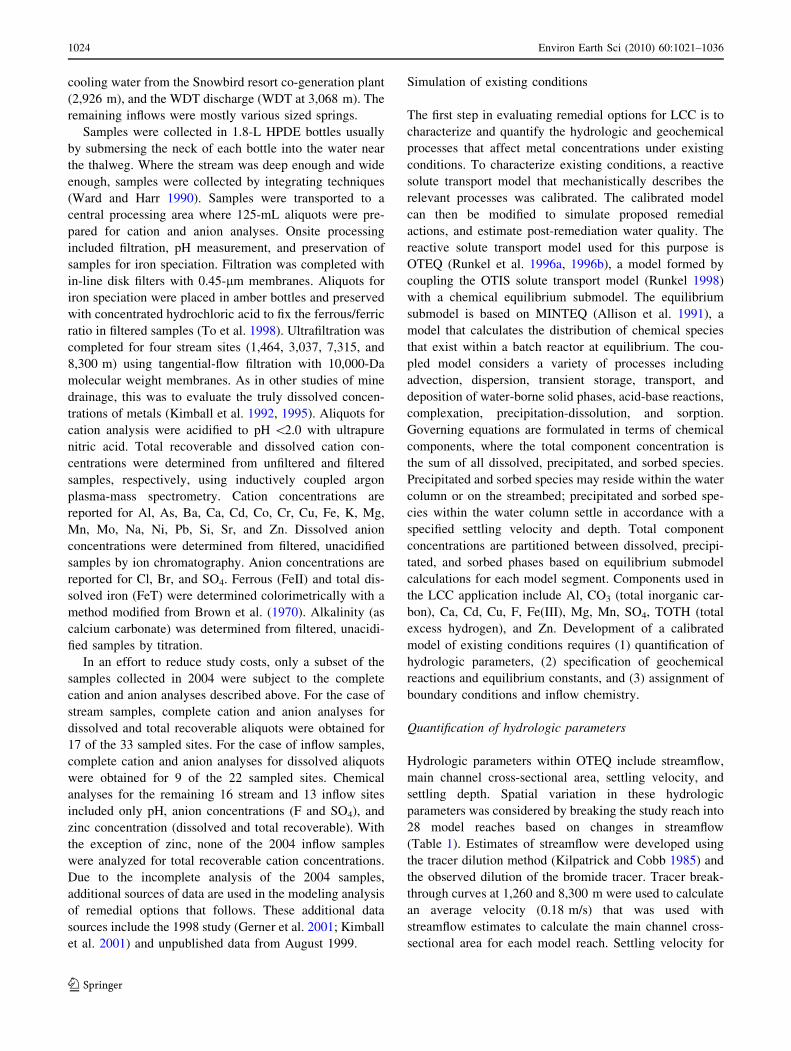
Simulation of existing conditions
The first step in evaluating remedial options for LCC is to
characterize and quantify the hydrologic and geochemical
processes that affect metal concentrations under existing
conditions. To characterize existing conditions, a reactive
solute transport model that mechanistically describes the
relevant processes was calibrated. The calibrated model
can then be modified to simulate proposed remedial
actions, and estimate post-remediation water quality. The
reactive solute transport model used for this purpose is
OTEQ (Runkel et al. 1996a, 1996b), a model formed by
coupling the OTIS solute transport model (Runkel 1998)
with a chemical equilibrium submodel. The equilibrium
submodel is based on MINTEQ (Allison et al. 1991), a
model that calculates the distribution of chemical species
that exist within a batch reactor at equilibrium. The cou-
pled model considers a variety of processes including
advection, dispersion, transient storage, transport, and
deposition of water-borne solid phases, acid-base reactions,
complexation, precipitation-dissolution, and sorption.
Governing equations are formulated in terms of chemical
components, where the total component concentration is
the sum of all dissolved, precipitated, and sorbed species.
Precipitated and sorbed species may reside within the water
column or on the streambed; precipitated and sorbed spe-
cies within the water column settle in accordance with a
specified settling velocity and depth. Total component
concentrations are partitioned between dissolved, precipi-
tated, and sorbed phases based on equilibrium submodel
calculations for each model segment. Components used in
the LCC application include Al, CO3 (total inorganic car-
bon), Ca, Cd, Cu, F, Fe(III), Mg, Mn, SO4, TOTH (total
excess hydrogen), and Zn. Development of a calibrated
model of existing conditions requires (1) quantification of
hydrologic parameters, (2) specification of geochemical
reactions and equilibrium constants, and (3) assignment of
boundary conditions and inflow chemistry.
Quantification of hydrologic parameters
Hydrologic parameters within OTEQ include streamflow,
main channel cross-sectional area, settling velocity, and
settling depth. Spatial variation in these hydrologic
parameters was considered by breaking the study reach into
28 model reaches based on changes in streamflow
(Table 1). Estimates of streamflow were developed using
the tracer dilution method (Kilpatrick and Cobb 1985) and
the observed dilution of the bromide tracer. Tracer break-
through curves at 1,260 and 8,300 m were used to calculate
an average velocity (0.18 m/s) that was used with
streamflow estimates to calculate the main channel cross-
sectional area for each model reach. Settling velocity for
1024 Environ Earth Sci (2010) 60:1021–1036
123
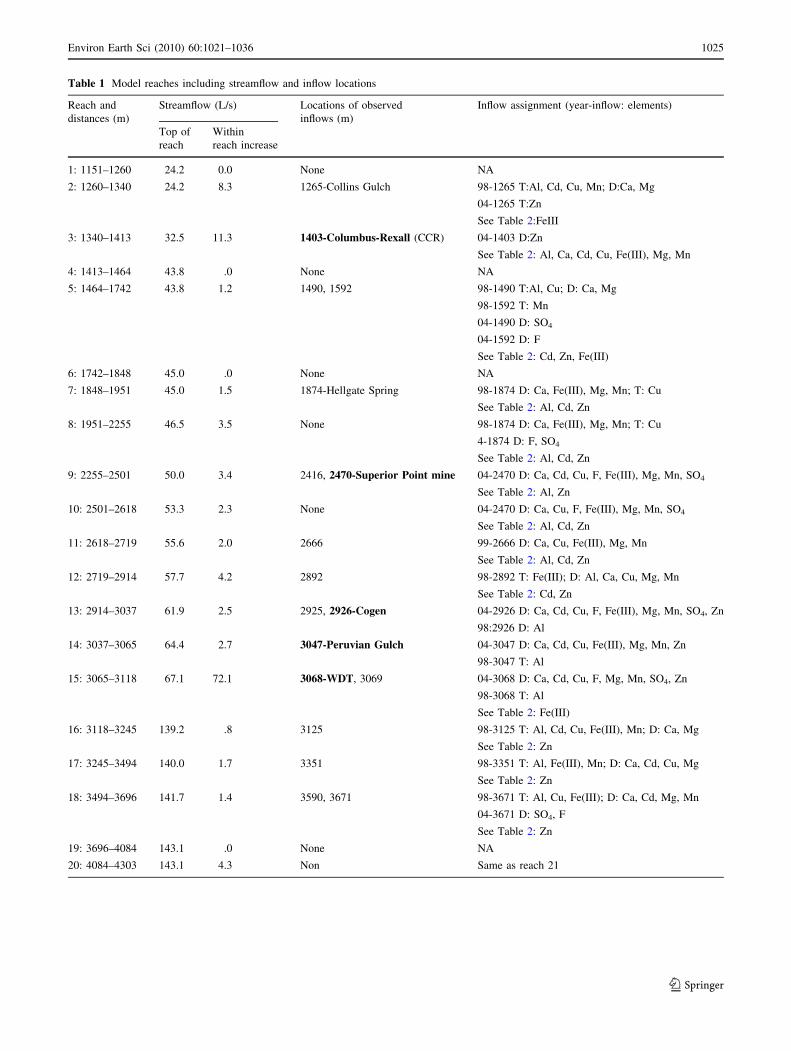
Table 1 Model reaches including streamflow and inflow locations
Reach and
distances (m)
Streamflow (L/s) Locations of observed
inflows (m)
Inflow assignment (year-inflow: elements)
Top of
reach
Within
reach increase
1: 1151–1260 24.2 0.0 None NA
2: 1260–1340 24.2 8.3 1265-Collins Gulch 98-1265 T:Al, Cd, Cu, Mn; D:Ca, Mg
04-1265 T:Zn
See Table 2:FeIII
3: 1340–1413 32.5 11.3 1403-Columbus-Rexall (CCR) 04-1403 D:Zn
See Table 2: Al, Ca, Cd, Cu, Fe(III), Mg, Mn
4: 1413–1464 43.8 .0 None NA
5: 1464–1742 43.8 1.2 1490, 1592 98-1490 T:Al, Cu; D: Ca, Mg
98-1592 T: Mn
04-1490 D: SO4
04-1592 D: F
See Table 2: Cd, Zn, Fe(III)
6: 1742–1848 45.0 .0 None NA
7: 1848–1951 45.0 1.5 1874-Hellgate Spring 98-1874 D: Ca, Fe(III), Mg, Mn; T: Cu
See Table 2: Al, Cd, Zn
8: 1951–2255 46.5 3.5 None 98-1874 D: Ca, Fe(III), Mg, Mn; T: Cu
4-1874 D: F, SO4
See Table 2: Al, Cd, Zn
9: 2255–2501 50.0 3.4 2416, 2470-Superior Point mine 04-2470 D: Ca, Cd, Cu, F, Fe(III), Mg, Mn, SO4
See Table 2: Al, Zn
10: 2501–2618 53.3 2.3 None 04-2470 D: Ca, Cu, F, Fe(III), Mg, Mn, SO4
See Table 2: Al, Cd, Zn
11: 2618–2719 55.6 2.0 2666 99-2666 D: Ca, Cu, Fe(III), Mg, Mn
See Table 2: Al, Cd, Zn
12: 2719–2914 57.7 4.2 2892 98-2892 T: Fe(III); D: Al, Ca, Cu, Mg, Mn
See Table 2: Cd, Zn
13: 2914–3037 61.9 2.5 2925, 2926-Cogen 04-2926 D: Ca, Cd, Cu, F, Fe(III), Mg, Mn, SO4, Zn
98:2926 D: Al
14: 3037–3065 64.4 2.7 3047-Peruvian Gulch 04-3047 D: Ca, Cd, Cu, Fe(III), Mg, Mn, Zn
98-3047 T: Al
15: 3065–3118 67.1 72.1 3068-WDT, 3069 04-3068 D: Ca, Cd, Cu, F, Mg, Mn, SO4, Zn
98-3068 T: Al
See Table 2: Fe(III)
16: 3118–3245 139.2 .8 3125 98-3125 T: Al, Cd, Cu, Fe(III), Mn; D: Ca, Mg
See Table 2: Zn
17: 3245–3494 140.0 1.7 3351 98-3351 T: Al, Fe(III), Mn; D: Ca, Cd, Cu, Mg
See Table 2: Zn
18: 3494–3696 141.7 1.4 3590, 3671 98-3671 T: Al, Cu, Fe(III); D: Ca, Cd, Mg, Mn
04-3671 D: SO4, F
See Table 2: Zn
19: 3696–4084 143.1 .0 None NA
20: 4084–4303 143.1 4.3 Non Same as reach 21
Environ Earth Sci (2010) 60:1021–1036 1025
123
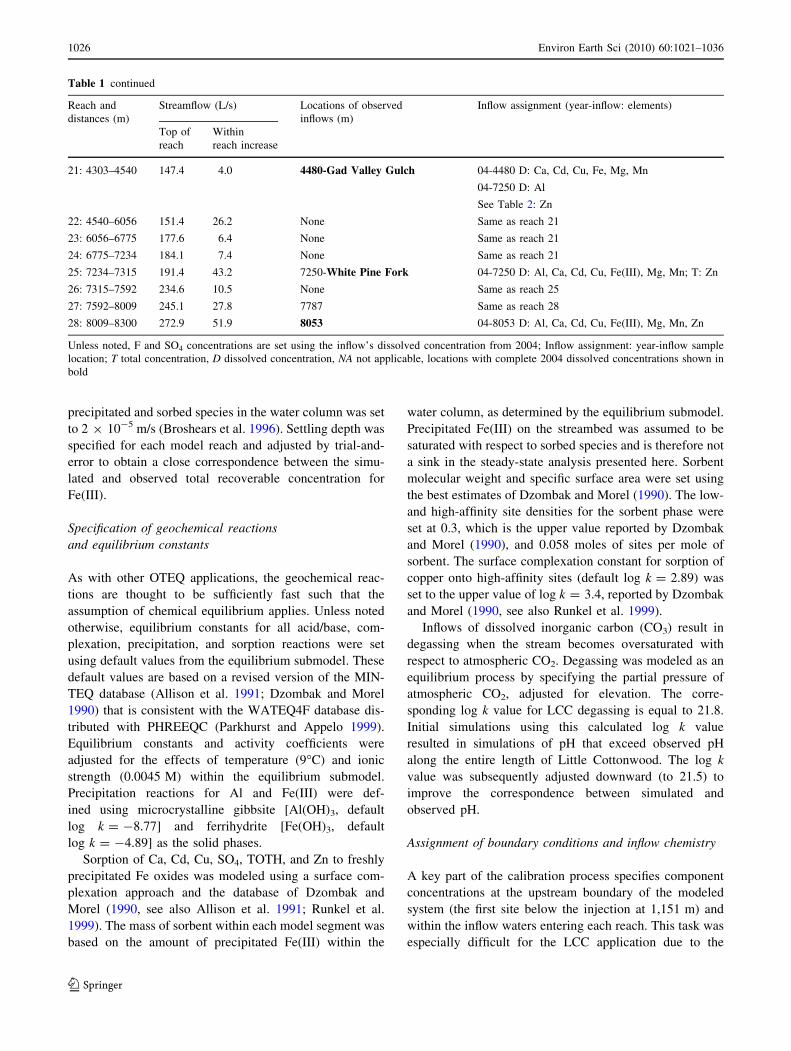
precipitated and sorbed species in the water column was set
to 2 9 10-5 m/s (Broshears et al. 1996). Settling depth was
specified for each model reach and adjusted by trial-and-
error to obtain a close correspondence between the simu-
lated and observed total recoverable concentration for
Fe(III).
Specification of geochemical reactions
and equilibrium constants
As with other OTEQ applications, the geochemical reac-
tions are thought to be sufficiently fast such that the
assumption of chemical equilibrium applies. Unless noted
otherwise, equilibrium constants for all acid/base, com-
plexation, precipitation, and sorption reactions were set
using default values from the equilibrium submodel. These
default values are based on a revised version of the MIN-
TEQ database (Allison et al. 1991; Dzombak and Morel
1990) that is consistent with the WATEQ4F database dis-
tributed with PHREEQC (Parkhurst and Appelo 1999).
Equilibrium constants and activity coefficients were
adjusted for the effects of temperature (9�C) and ionic
strength (0.0045 M) within the equilibrium submodel.
Precipitation reactions for Al and Fe(III) were def-
ined using microcrystalline gibbsite [Al(OH)3, default
log k = -8.77] and ferrihydrite [Fe(OH)3, default
log k = -4.89] as the solid phases.
Sorption of Ca, Cd, Cu, SO4, TOTH, and Zn to freshly
precipitated Fe oxides was modeled using a surface com-
plexation approach and the database of Dzombak and
Morel (1990, see also Allison et al. 1991; Runkel et al.
1999). The mass of sorbent within each model segment was
based on the amount of precipitated Fe(III) within the
water column, as determined by the equilibrium submodel.
Precipitated Fe(III) on the streambed was assumed to be
saturated with respect to sorbed species and is therefore not
a sink in the steady-state analysis presented here. Sorbent
molecular weight and specific surface area were set using
the best estimates of Dzombak and Morel (1990). The low-
and high-affinity site densities for the sorbent phase were
set at 0.3, which is the upper value reported by Dzombak
and Morel (1990), and 0.058 moles of sites per mole of
sorbent. The surface complexation constant for sorption of
copper onto high-affinity sites (default log k = 2.89) was
set to the upper value of log k = 3.4, reported by Dzombak
and Morel (1990, see also Runkel et al. 1999).
Inflows of dissolved inorganic carbon (CO3) result in
degassing when the stream becomes oversaturated with
respect to atmospheric CO2. Degassing was modeled as an
equilibrium process by specifying the partial pressure of
atmospheric CO2, adjusted for elevation. The corre-
sponding log k value for LCC degassing is equal to 21.8.
Initial simulations using this calculated log k value
resulted in simulations of pH that exceed observed pH
along the entire length of Little Cottonwood. The log k
value was subsequently adjusted downward (to 21.5) to
improve the correspondence between simulated and
observed pH.
Assignment of boundary conditions and inflow chemistry
A key part of the calibration process specifies component
concentrations at the upstream boundary of the modeled
system (the first site below the injection at 1,151 m) and
within the inflow waters entering each reach. This task was
especially difficult for the LCC application due to the
Table 1 continued
Reach and
distances (m)
Streamflow (L/s) Locations of observed
inflows (m)
Inflow assignment (year-inflow: elements)
Top of
reach
Within
reach increase
21: 4303–4540 147.4 4.0 4480-Gad Valley Gulch 04-4480 D: Ca, Cd, Cu, Fe, Mg, Mn
04-7250 D: Al
See Table 2: Zn
22: 4540–6056 151.4 26.2 None Same as reach 21
23: 6056–6775 177.6 6.4 None Same as reach 21
24: 6775–7234 184.1 7.4 None Same as reach 21
25: 7234–7315 191.4 43.2 7250-White Pine Fork 04-7250 D: Al, Ca, Cd, Cu, Fe(III), Mg, Mn; T: Zn
26: 7315–7592 234.6 10.5 None Same as reach 25
27: 7592–8009 245.1 27.8 7787 Same as reach 28
28: 8009–8300 272.9 51.9 8053 04-8053 D: Al, Ca, Cd, Cu, Fe(III), Mg, Mn, Zn
Unless noted, F and SO4 concentrations are set using the inflow’s dissolved concentration from 2004; Inflow assignment: year-inflow sample
location; T total concentration, D dissolved concentration, NA not applicable, locations with complete 2004 dissolved concentrations shown in
bold
1026 Environ Earth Sci (2010) 60:1021–1036
123
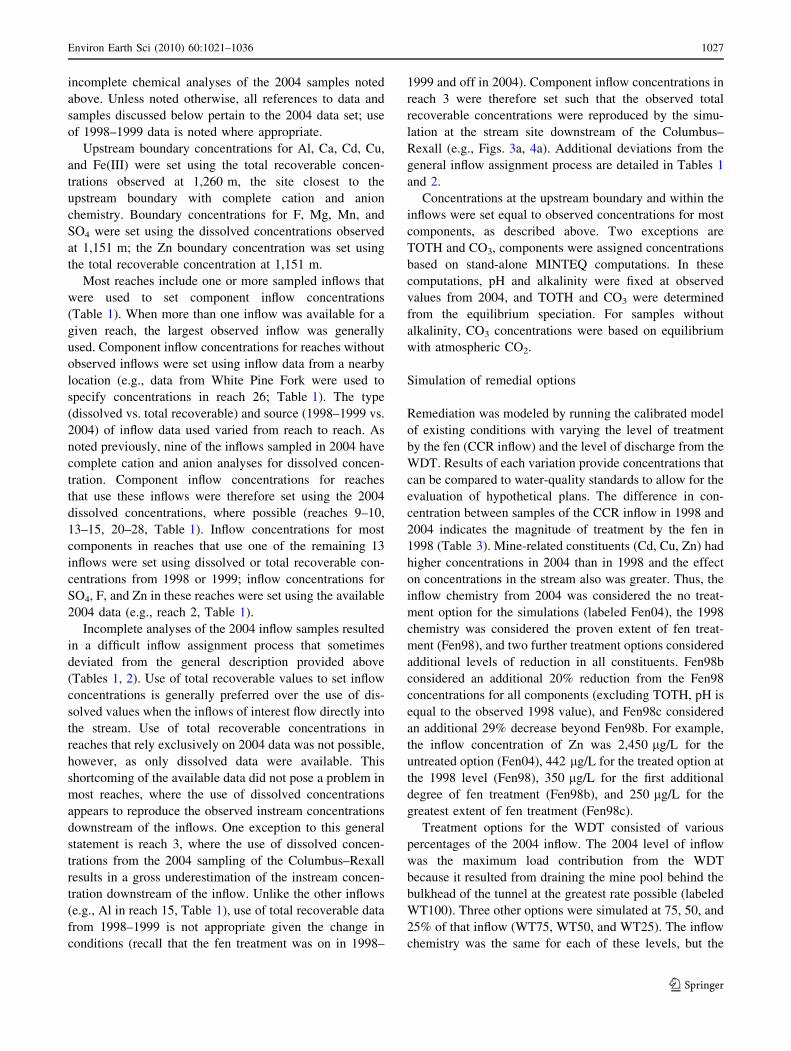
incomplete chemical analyses of the 2004 samples noted
above. Unless noted otherwise, all references to data and
samples discussed below pertain to the 2004 data set; use
of 1998–1999 data is noted where appropriate.
Upstream boundary concentrations for Al, Ca, Cd, Cu,
and Fe(III) were set using the total recoverable concen-
trations observed at 1,260 m, the site closest to the
upstream boundary with complete cation and anion
chemistry. Boundary concentrations for F, Mg, Mn, and
SO4 were set using the dissolved concentrations observed
at 1,151 m; the Zn boundary concentration was set using
the total recoverable concentration at 1,151 m.
Most reaches include one or more sampled inflows that
were used to set component inflow concentrations
(Table 1). When more than one inflow was available for a
given reach, the largest observed inflow was generally
used. Component inflow concentrations for reaches without
observed inflows were set using inflow data from a nearby
location (e.g., data from White Pine Fork were used to
specify concentrations in reach 26; Table 1). The type
(dissolved vs. total recoverable) and source (1998–1999 vs.
2004) of inflow data used varied from reach to reach. As
noted previously, nine of the inflows sampled in 2004 have
complete cation and anion analyses for dissolved concen-
tration. Component inflow concentrations for reaches
that use these inflows were therefore set using the 2004
dissolved concentrations, where possible (reaches 9–10,
13–15, 20–28, Table 1). Inflow concentrations for most
components in reaches that use one of the remaining 13
inflows were set using dissolved or total recoverable con-
centrations from 1998 or 1999; inflow concentrations for
SO4, F, and Zn in these reaches were set using the available
2004 data (e.g., reach 2, Table 1).
Incomplete analyses of the 2004 inflow samples resulted
in a difficult inflow assignment process that sometimes
deviated from the general description provided above
(Tables 1, 2). Use of total recoverable values to set inflow
concentrations is generally preferred over the use of dis-
solved values when the inflows of interest flow directly into
the stream. Use of total recoverable concentrations in
reaches that rely exclusively on 2004 data was not possible,
however, as only dissolved data were available. This
shortcoming of the available data did not pose a problem in
most reaches, where the use of dissolved concentrations
appears to reproduce the observed instream concentrations
downstream of the inflows. One exception to this general
statement is reach 3, where the use of dissolved concen-
trations from the 2004 sampling of the Columbus–Rexall
results in a gross underestimation of the instream concen-
tration downstream of the inflow. Unlike the other inflows
(e.g., Al in reach 15, Table 1), use of total recoverable data
from 1998–1999 is not appropriate given the change in
conditions (recall that the fen treatment was on in 1998–
1999 and off in 2004). Component inflow concentrations in
reach 3 were therefore set such that the observed total
recoverable concentrations were reproduced by the simu-
lation at the stream site downstream of the Columbus–
Rexall (e.g., Figs. 3a, 4a). Additional deviations from the
general inflow assignment process are detailed in Tables 1
and 2.
Concentrations at the upstream boundary and within the
inflows were set equal to observed concentrations for most
components, as described above. Two exceptions are
TOTH and CO3, components were assigned concentrations
based on stand-alone MINTEQ computations. In these
computations, pH and alkalinity were fixed at observed
values from 2004, and TOTH and CO3 were determined
from the equilibrium speciation. For samples without
alkalinity, CO3 concentrations were based on equilibrium
with atmospheric CO2.
Simulation of remedial options
Remediation was modeled by running the calibrated model
of existing conditions with varying the level of treatment
by the fen (CCR inflow) and the level of discharge from the
WDT. Results of each variation provide concentrations that
can be compared to water-quality standards to allow for the
evaluation of hypothetical plans. The difference in con-
centration between samples of the CCR inflow in 1998 and
2004 indicates the magnitude of treatment by the fen in
1998 (Table 3). Mine-related constituents (Cd, Cu, Zn) had
higher concentrations in 2004 than in 1998 and the effect
on concentrations in the stream also was greater. Thus, the
inflow chemistry from 2004 was considered the no treat-
ment option for the simulations (labeled Fen04), the 1998
chemistry was considered the proven extent of fen treat-
ment (Fen98), and two further treatment options considered
additional levels of reduction in all constituents. Fen98b
considered an additional 20% reduction from the Fen98
concentrations for all components (excluding TOTH, pH is
equal to the observed 1998 value), and Fen98c considered
an additional 29% decrease beyond Fen98b. For example,
the inflow concentration of Zn was 2,450 lg/L for the
untreated option (Fen04), 442 lg/L for the treated option at
the 1998 level (Fen98), 350 lg/L for the first additional
degree of fen treatment (Fen98b), and 250 lg/L for the
greatest extent of fen treatment (Fen98c).
Treatment options for the WDT consisted of various
percentages of the 2004 inflow. The 2004 level of inflow
was the maximum load contribution from the WDT
because it resulted from draining the mine pool behind the
bulkhead of the tunnel at the greatest rate possible (labeled
WT100). Three other options were simulated at 75, 50, and
25% of that inflow (WT75, WT50, and WT25). The inflow
chemistry was the same for each of these levels, but the
Environ Earth Sci (2010) 60:1021–1036 1027
123
discharge was decreased to simulate a smaller load for each
option. These levels of loading could represent a decrease
in the operational release from the tunnel or else a dilution
of the inflow by snowmelt runoff.
Sixteen combinations of the CCR and WDT options
were simulated. Each combination was simulated with and
without the effects of settling, and the reported results
represent the worst case for each simulation (settling vs. no
settling). Modeling results are reported as a percent ex-
ceedence value in the form:
Percent exceedence ¼ 100Cm � Cs
Cs
� �; ð1Þ
where Cm is the modeled concentration, in mg/L, and Cs is
the concentration of the instream standard for the given
hardness from the model, in mg/L.
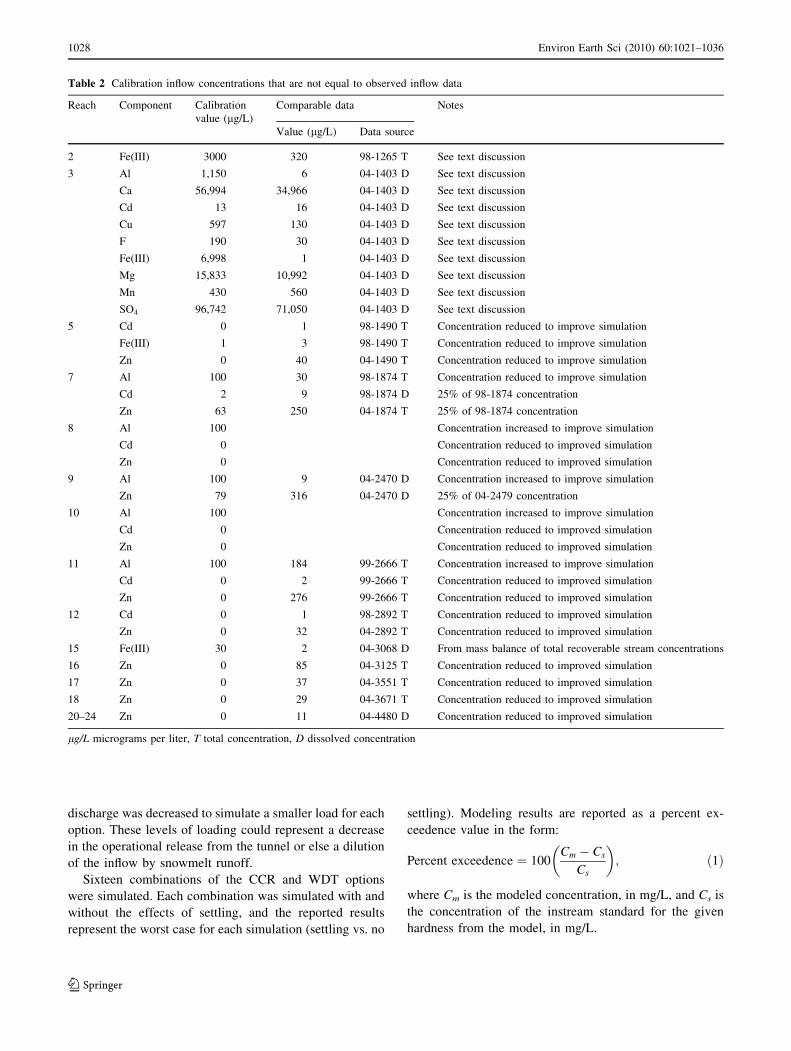
Table 2 Calibration inflow concentrations that are not equal to observed inflow data
Reach Component Calibration
value (lg/L)
Comparable data Notes
Value (lg/L) Data source
2 Fe(III) 3000 320 98-1265 T See text discussion
3 Al 1,150 6 04-1403 D See text discussion
Ca 56,994 34,966 04-1403 D See text discussion
Cd 13 16 04-1403 D See text discussion
Cu 597 130 04-1403 D See text discussion
F 190 30 04-1403 D See text discussion
Fe(III) 6,998 1 04-1403 D See text discussion
Mg 15,833 10,992 04-1403 D See text discussion
Mn 430 560 04-1403 D See text discussion
SO4 96,742 71,050 04-1403 D See text discussion
5 Cd 0 1 98-1490 T Concentration reduced to improve simulation
Fe(III) 1 3 98-1490 T Concentration reduced to improve simulation
Zn 0 40 04-1490 T Concentration reduced to improve simulation
7 Al 100 30 98-1874 T Concentration reduced to improve simulation
Cd 2 9 98-1874 D 25% of 98-1874 concentration
Zn 63 250 04-1874 T 25% of 98-1874 concentration
8 Al 100 Concentration increased to improve simulation
Cd 0 Concentration reduced to improved simulation
Zn 0 Concentration reduced to improved simulation
9 Al 100 9 04-2470 D Concentration increased to improve simulation
Zn 79 316 04-2470 D 25% of 04-2479 concentration
10 Al 100 Concentration increased to improve simulation
Cd 0 Concentration reduced to improved simulation
Zn 0 Concentration reduced to improved simulation
11 Al 100 184 99-2666 T Concentration increased to improve simulation
Cd 0 2 99-2666 T Concentration reduced to improved simulation
Zn 0 276 99-2666 T Concentration reduced to improved simulation
12 Cd 0 1 98-2892 T Concentration reduced to improved simulation
Zn 0 32 04-2892 T Concentration reduced to improved simulation
15 Fe(III) 30 2 04-3068 D From mass balance of total recoverable stream concentrations
16 Zn 0 85 04-3125 T Concentration reduced to improved simulation
17 Zn 0 37 04-3551 T Concentration reduced to improved simulation
18 Zn 0 29 04-3671 T Concentration reduced to improved simulation
20–24 Zn 0 11 04-4480 D Concentration reduced to improved simulation
lg/L micrograms per liter, T total concentration, D dissolved concentration
1028 Environ Earth Sci (2010) 60:1021–1036
123
Acute and chronic water-quality standards come from
the Utah Department of Administrative Services (2005). A
positive value for the percent exceedence indicates that the
water-quality standard is not met by the simulation, and a
negative value indicates the standard is met.
Results and discussion
Low-flow water quality, 1998 and 2004
Characterization of instream solute concentrations indi-
cates particular geochemical processes that should be
simulated by the calibrated model. Results of chemical
characterization for synoptic samples from the 2004 study
are listed in the Electronic Supplement (Tables E2, E3)
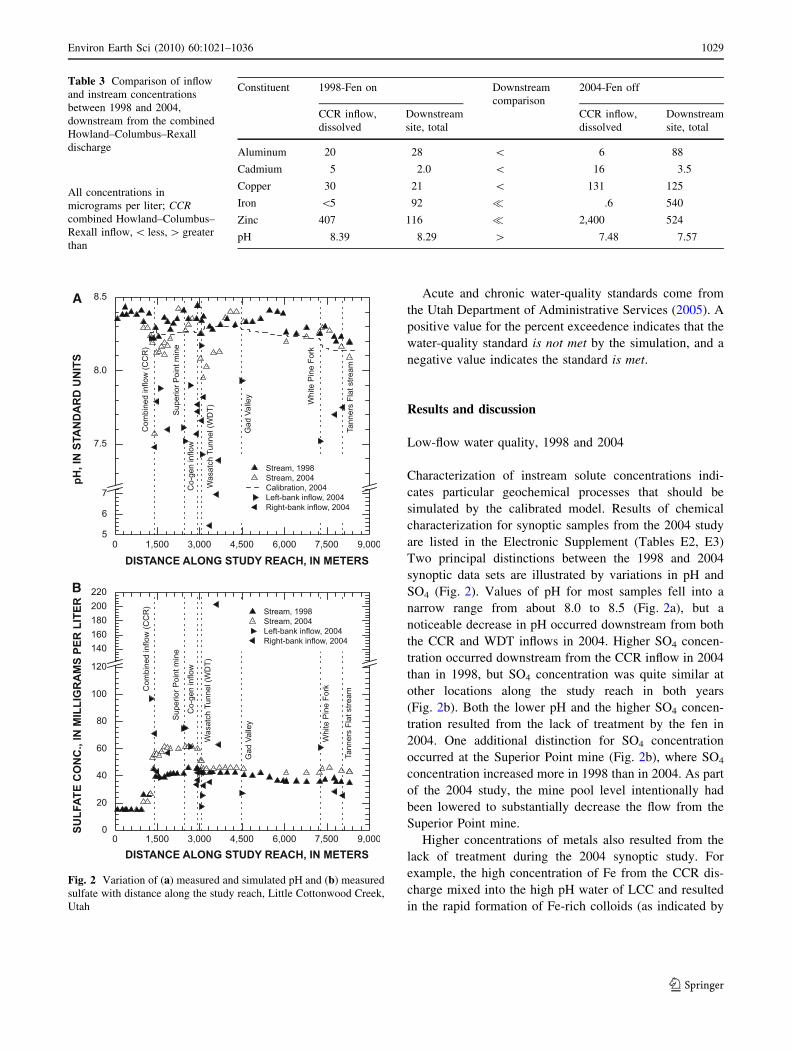
Two principal distinctions between the 1998 and 2004
synoptic data sets are illustrated by variations in pH and
SO4 (Fig. 2). Values of pH for most samples fell into a
narrow range from about 8.0 to 8.5 (Fig. 2a), but a
noticeable decrease in pH occurred downstream from both
the CCR and WDT inflows in 2004. Higher SO4 concen-
tration occurred downstream from the CCR inflow in 2004
than in 1998, but SO4 concentration was quite similar at
other locations along the study reach in both years
(Fig. 2b). Both the lower pH and the higher SO4 concen-
tration resulted from the lack of treatment by the fen in
2004. One additional distinction for SO4 concentration
occurred at the Superior Point mine (Fig. 2b), where SO4
concentration increased more in 1998 than in 2004. As part
of the 2004 study, the mine pool level intentionally had
been lowered to substantially decrease the flow from the
Superior Point mine.
Higher concentrations of metals also resulted from the
lack of treatment during the 2004 synoptic study. For
example, the high concentration of Fe from the CCR dis-
charge mixed into the high pH water of LCC and resulted
in the rapid formation of Fe-rich colloids (as indicated by
Table 3 Comparison of inflow
and instream concentrations
between 1998 and 2004,
downstream from the combined
Howland–Columbus–Rexall
discharge
All concentrations in
micrograms per liter; CCRcombined Howland–Columbus–
Rexall inflow, \ less, [ greater
than
Constituent 1998-Fen on Downstream
comparison
2004-Fen off
CCR inflow,
dissolved
Downstream
site, total
CCR inflow,
dissolved
Downstream
site, total
Aluminum 20 28 \ 6 88
Cadmium 5 2.0 \ 16 3.5
Copper 30 21 \ 131 125
Iron \5 92 � .6 540
Zinc 407 116 � 2,400 524
pH 8.39 8.29 [ 7.48 7.57
A
B
Fig. 2 Variation of (a) measured and simulated pH and (b) measured
sulfate with distance along the study reach, Little Cottonwood Creek,
Utah
Environ Earth Sci (2010) 60:1021–1036 1029
123
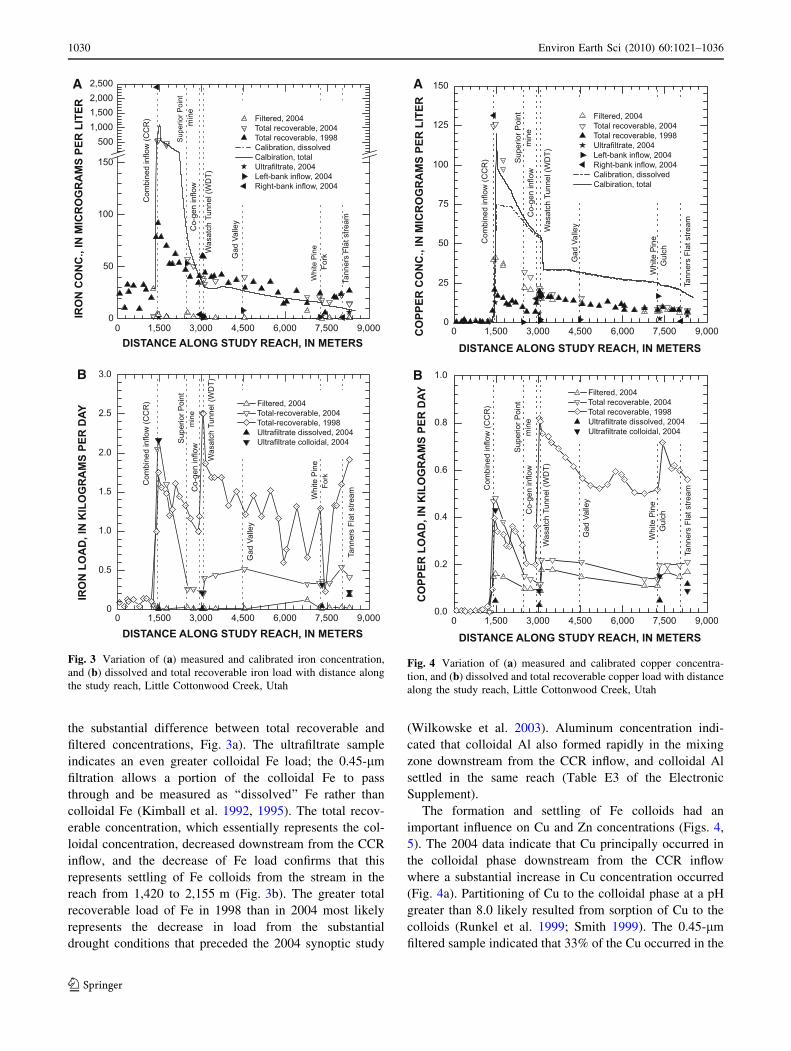
the substantial difference between total recoverable and
filtered concentrations, Fig. 3a). The ultrafiltrate sample
indicates an even greater colloidal Fe load; the 0.45-lm
filtration allows a portion of the colloidal Fe to pass
through and be measured as ‘‘dissolved’’ Fe rather than
colloidal Fe (Kimball et al. 1992, 1995). The total recov-
erable concentration, which essentially represents the col-
loidal concentration, decreased downstream from the CCR
inflow, and the decrease of Fe load confirms that this
represents settling of Fe colloids from the stream in the
reach from 1,420 to 2,155 m (Fig. 3b). The greater total
recoverable load of Fe in 1998 than in 2004 most likely
represents the decrease in load from the substantial
drought conditions that preceded the 2004 synoptic study
(Wilkowske et al. 2003). Aluminum concentration indi-
cated that colloidal Al also formed rapidly in the mixing
zone downstream from the CCR inflow, and colloidal Al
settled in the same reach (Table E3 of the Electronic
Supplement).
The formation and settling of Fe colloids had an
important influence on Cu and Zn concentrations (Figs. 4,
5). The 2004 data indicate that Cu principally occurred in
the colloidal phase downstream from the CCR inflow
where a substantial increase in Cu concentration occurred
(Fig. 4a). Partitioning of Cu to the colloidal phase at a pH
greater than 8.0 likely resulted from sorption of Cu to the
colloids (Runkel et al. 1999; Smith 1999). The 0.45-lm
filtered sample indicated that 33% of the Cu occurred in the
A
B
Fig. 3 Variation of (a) measured and calibrated iron concentration,
and (b) dissolved and total recoverable iron load with distance along
the study reach, Little Cottonwood Creek, Utah
A
B
Fig. 4 Variation of (a) measured and calibrated copper concentra-
tion, and (b) dissolved and total recoverable copper load with distance
along the study reach, Little Cottonwood Creek, Utah
1030 Environ Earth Sci (2010) 60:1021–1036
123
colloidal phase, but the ultrafiltrate sample indicated that
90% of the Cu was in the colloidal phase. Copper load
followed the same pattern as Fe load, suggesting that the
colloidal Fe settling strongly affected the fate of Cu
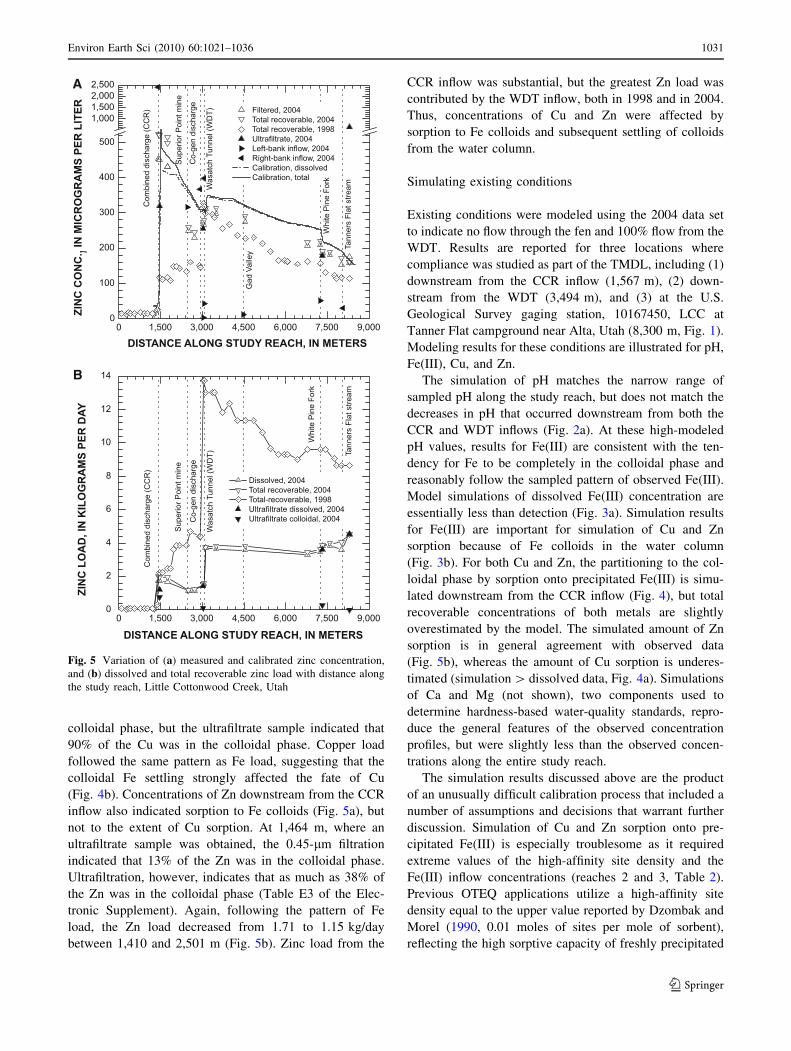
(Fig. 4b). Concentrations of Zn downstream from the CCR
inflow also indicated sorption to Fe colloids (Fig. 5a), but
not to the extent of Cu sorption. At 1,464 m, where an
ultrafiltrate sample was obtained, the 0.45-lm filtration
indicated that 13% of the Zn was in the colloidal phase.
Ultrafiltration, however, indicates that as much as 38% of
the Zn was in the colloidal phase (Table E3 of the Elec-
tronic Supplement). Again, following the pattern of Fe
load, the Zn load decreased from 1.71 to 1.15 kg/day
between 1,410 and 2,501 m (Fig. 5b). Zinc load from the
CCR inflow was substantial, but the greatest Zn load was
contributed by the WDT inflow, both in 1998 and in 2004.
Thus, concentrations of Cu and Zn were affected by
sorption to Fe colloids and subsequent settling of colloids
from the water column.
Simulating existing conditions
Existing conditions were modeled using the 2004 data set
to indicate no flow through the fen and 100% flow from the
WDT. Results are reported for three locations where
compliance was studied as part of the TMDL, including (1)
downstream from the CCR inflow (1,567 m), (2) down-
stream from the WDT (3,494 m), and (3) at the U.S.
Geological Survey gaging station, 10167450, LCC at
Tanner Flat campground near Alta, Utah (8,300 m, Fig. 1).
Modeling results for these conditions are illustrated for pH,
Fe(III), Cu, and Zn.
The simulation of pH matches the narrow range of
sampled pH along the study reach, but does not match the
decreases in pH that occurred downstream from both the
CCR and WDT inflows (Fig. 2a). At these high-modeled
pH values, results for Fe(III) are consistent with the ten-
dency for Fe to be completely in the colloidal phase and
reasonably follow the sampled pattern of observed Fe(III).
Model simulations of dissolved Fe(III) concentration are
essentially less than detection (Fig. 3a). Simulation results
for Fe(III) are important for simulation of Cu and Zn
sorption because of Fe colloids in the water column
(Fig. 3b). For both Cu and Zn, the partitioning to the col-
loidal phase by sorption onto precipitated Fe(III) is simu-
lated downstream from the CCR inflow (Fig. 4), but total
recoverable concentrations of both metals are slightly
overestimated by the model. The simulated amount of Zn
sorption is in general agreement with observed data
(Fig. 5b), whereas the amount of Cu sorption is underes-
timated (simulation [ dissolved data, Fig. 4a). Simulations
of Ca and Mg (not shown), two components used to
determine hardness-based water-quality standards, repro-
duce the general features of the observed concentration
profiles, but were slightly less than the observed concen-
trations along the entire study reach.
The simulation results discussed above are the product
of an unusually difficult calibration process that included a
number of assumptions and decisions that warrant further
discussion. Simulation of Cu and Zn sorption onto pre-
cipitated Fe(III) is especially troublesome as it required
extreme values of the high-affinity site density and the
Fe(III) inflow concentrations (reaches 2 and 3, Table 2).
Previous OTEQ applications utilize a high-affinity site
density equal to the upper value reported by Dzombak and
Morel (1990, 0.01 moles of sites per mole of sorbent),
reflecting the high sorptive capacity of freshly precipitated
A
B
Fig. 5 Variation of (a) measured and calibrated zinc concentration,
and (b) dissolved and total recoverable zinc load with distance along
the study reach, Little Cottonwood Creek, Utah
Environ Earth Sci (2010) 60:1021–1036 1031
123
Fe oxides (Runkel et al. 1999; Runkel and Kimball 2002).
The present application uses a site density that is nearly six
times this upper value, well beyond the realistic range for
sorption onto Fe(III) precipitates. This result may be
explained in part by the fact that simulation results are
based on sorption onto Fe(III) precipitates, whereas the
observed data may result from the presence of additional
sorbents, such as Al precipitates (Anderson and Benjamin
1990) and biofilms (Toner et al. 2005). Although sorption
onto these additional sorbents is not explicitly modeled,
specification of extreme site densities and Fe(III) inflow
concentrations represents an ad hoc way of accounting for
their effect.
A related issue is the specification of settling depths for
the precipitated and sorbed species. The specified depth
upstream of the WDT ranged from 1 to 10 cm, whereas
settling depth downstream of the WDT ranged from 80 to
100 cm. Although the LCC is generally shallow upstream
of WDT, the specified settling depths are less than
observed water depth. This discrepancy may be a result of
stream hydrodynamics such as hyporheic flow, which may
strain colloids from the water column as water passes
through porous areas of the streambed. Settling depths
downstream of the WDT, in contrast, generally exceed
observed depth. This discrepancy may result from the fact
that streamflow more than doubles as the WDT inflow
enters Little Cottonwood. The increase in flow is accom-
panied by higher stream velocities that may act to keep
colloidal materials in suspension, such that the effective
settling depth exceeds the actual water depth.
Although the difficult calibration process may be
explained partially by unmodeled processes (e.g., strain-
ing, additional sorbents), several aspects of the 2004 field
effort also contribute to the problem. The lack of total
recoverable data for the inflow samples collected in 2004
is especially notable, as total recoverable concentrations
(rather than dissolved) represent an inflow’s contribution
to the stream when the incoming water flows directly to
the stream. Observed metal concentrations downstream of
inflows are the net result of both inflow and reaction. As
such, the availability of total recoverable inflow data
represents an important constraint on the modeling that
allows for the separation of the inflow loading and geo-
chemical reactions. This constraint is sorely lacking
inflows such as CCR (reach 3, Table 2), where consid-
erable loading and reaction take place. A related issue is
the lack of complete cation and anion data for both total
recoverable and dissolved concentration for many of the
inflows (see inflow locations that are not in bold,
Table 1). As a result, inflow concentrations for the cor-
responding reaches were set based on 1998–1999 data,
under the assumption that comparable inflow loading
occurred in 2004 (Table 2).
Simulation of remedial options
The unusually difficult calibration step discussed above
suggests considerable uncertainty that must be addressed
when modeling the effects of potential remedial options.
One way of considering this uncertainty is to ‘‘error on the
conservative side’’, by producing simulations which
underestimate the removal of metals and/or water hardness.
Simulated Cu and Zn concentrations from the calibration,
for example, underestimate removal (simulated concen-
trations exceed observed concentrations, Figs. 4, 5). As a
result, simulations of remedial options are also likely to
underestimate removal, leading to the selection of more
stringent remedial actions. Similarly, simulated values of
water hardness (Ca and Mg) underestimate hardness,
resulting in lower hardness-based water-quality standards.
More stringent remedial actions will therefore be needed to
meet the standards.
In addition to erring on the conservative side during
model calibration, three aspects of the remediation simu-
lations are used to counteract model uncertainty. First, each
of the remediation combinations is modeled with and
without the effects of settling. Simulation results presented
below utilize the worst case (highest dissolved concentra-
tion) when calculating the percent exceedence (Equa-
tion 1). Second, all component concentrations in the CCR
inflow are reduced by an identical percentage for remedi-
ation options Fen98b and Fen98c. These reductions for Ca
and Mg result in lower water hardness downstream, and
lower hardness-based standards. Third, a given remediation
combination is only deemed ‘‘compliant’’ if the simulated
concentration is at least 10% below the corresponding
water-quality standard (i.e., the percent exceedence is
-10% or less). This third aspect provides an important
‘‘margin of safety’’ by eliminating the consideration of
remedial options that result in concentrations that are very
close to the standards. With this background, the results of
simulations for all the combinations of remediation options
are evaluated with respect to the compliance locations.
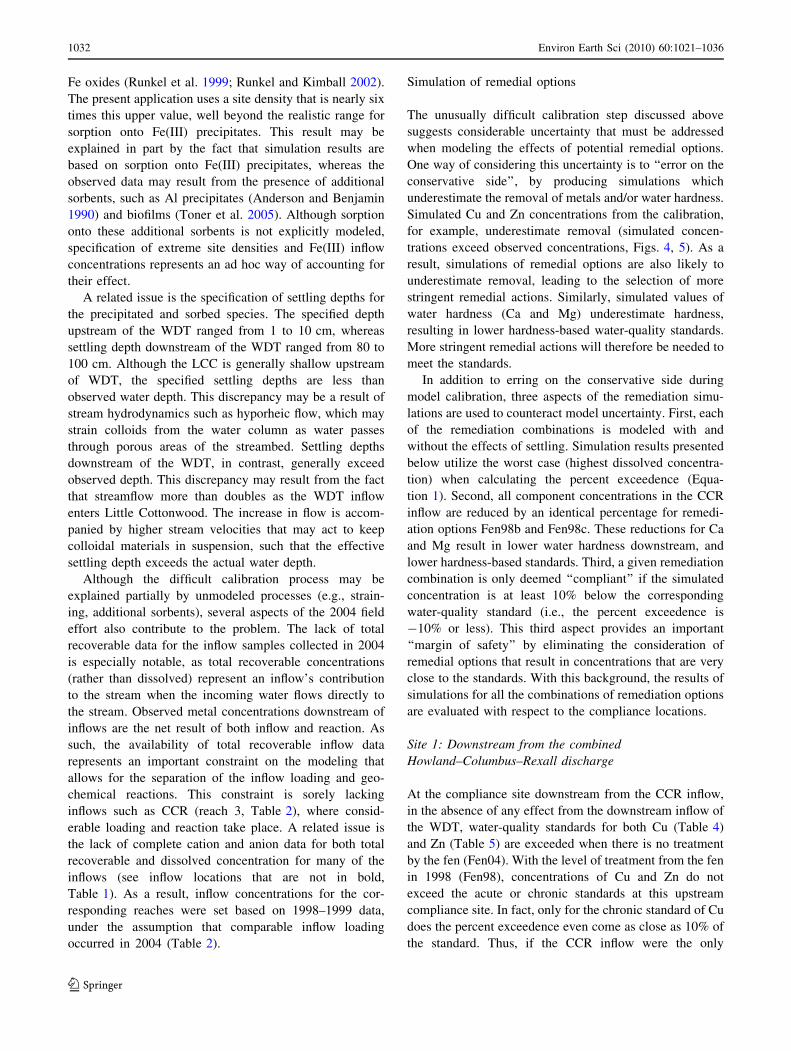
Site 1: Downstream from the combined
Howland–Columbus–Rexall discharge
At the compliance site downstream from the CCR inflow,
in the absence of any effect from the downstream inflow of
the WDT, water-quality standards for both Cu (Table 4)
and Zn (Table 5) are exceeded when there is no treatment
by the fen (Fen04). With the level of treatment from the fen
in 1998 (Fen98), concentrations of Cu and Zn do not
exceed the acute or chronic standards at this upstream
compliance site. In fact, only for the chronic standard of Cu
does the percent exceedence even come as close as 10% of
the standard. Thus, if the CCR inflow were the only
1032 Environ Earth Sci (2010) 60:1021–1036
123
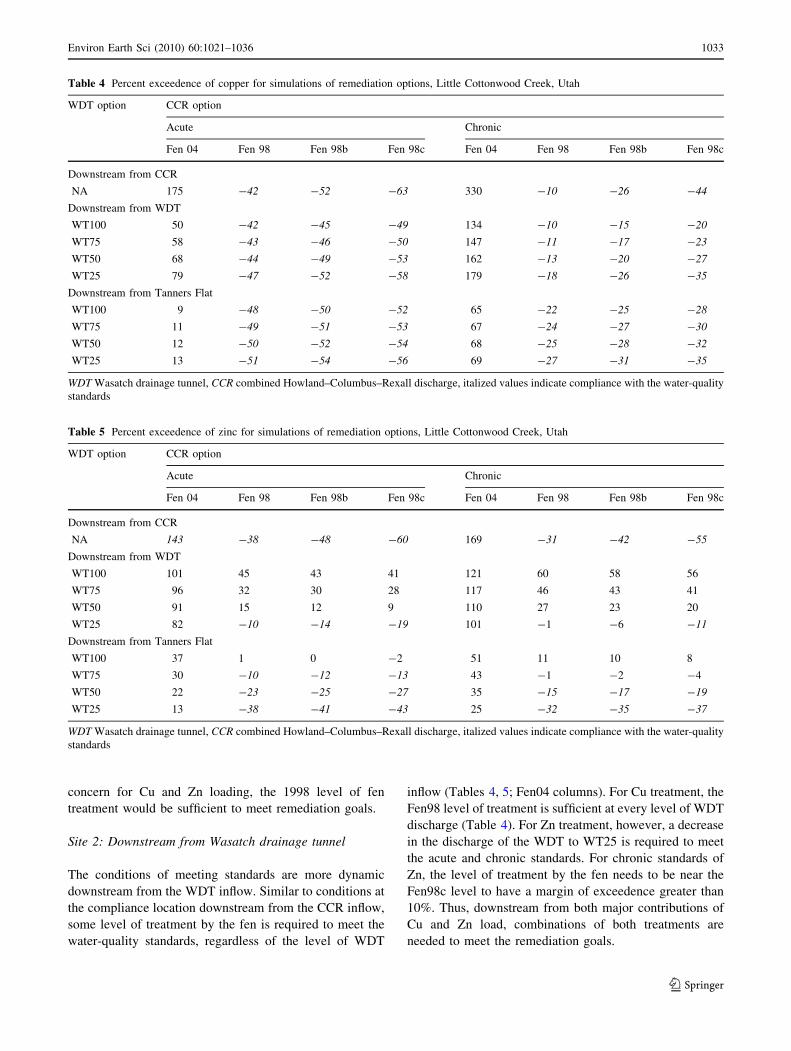
concern for Cu and Zn loading, the 1998 level of fen
treatment would be sufficient to meet remediation goals.
Site 2: Downstream from Wasatch drainage tunnel
The conditions of meeting standards are more dynamic
downstream from the WDT inflow. Similar to conditions at
the compliance location downstream from the CCR inflow,
some level of treatment by the fen is required to meet the
water-quality standards, regardless of the level of WDT
inflow (Tables 4, 5; Fen04 columns). For Cu treatment, the
Fen98 level of treatment is sufficient at every level of WDT
discharge (Table 4). For Zn treatment, however, a decrease
in the discharge of the WDT to WT25 is required to meet
the acute and chronic standards. For chronic standards of
Zn, the level of treatment by the fen needs to be near the
Fen98c level to have a margin of exceedence greater than
10%. Thus, downstream from both major contributions of
Cu and Zn load, combinations of both treatments are
needed to meet the remediation goals.
Table 4 Percent exceedence of copper for simulations of remediation options, Little Cottonwood Creek, Utah
WDT option CCR option
Acute Chronic
Fen 04 Fen 98 Fen 98b Fen 98c Fen 04 Fen 98 Fen 98b Fen 98c
Downstream from CCR
NA 175 -42 -52 -63 330 -10 -26 -44
Downstream from WDT
WT100 50 -42 -45 -49 134 -10 -15 -20
WT75 58 -43 -46 -50 147 -11 -17 -23
WT50 68 -44 -49 -53 162 -13 -20 -27
WT25 79 -47 -52 -58 179 -18 -26 -35
Downstream from Tanners Flat
WT100 9 -48 -50 -52 65 -22 -25 -28
WT75 11 -49 -51 -53 67 -24 -27 -30
WT50 12 -50 -52 -54 68 -25 -28 -32
WT25 13 -51 -54 -56 69 -27 -31 -35
WDT Wasatch drainage tunnel, CCR combined Howland–Columbus–Rexall discharge, italized values indicate compliance with the water-quality
standards
Table 5 Percent exceedence of zinc for simulations of remediation options, Little Cottonwood Creek, Utah
WDT option CCR option
Acute Chronic
Fen 04 Fen 98 Fen 98b Fen 98c Fen 04 Fen 98 Fen 98b Fen 98c
Downstream from CCR
NA 143 -38 -48 -60 169 -31 -42 -55
Downstream from WDT
WT100 101 45 43 41 121 60 58 56
WT75 96 32 30 28 117 46 43 41
WT50 91 15 12 9 110 27 23 20
WT25 82 -10 -14 -19 101 -1 -6 -11
Downstream from Tanners Flat
WT100 37 1 0 -2 51 11 10 8
WT75 30 -10 -12 -13 43 -1 -2 -4
WT50 22 -23 -25 -27 35 -15 -17 -19
WT25 13 -38 -41 -43 25 -32 -35 -37
WDT Wasatch drainage tunnel, CCR combined Howland–Columbus–Rexall discharge, italized values indicate compliance with the water-quality
standards
Environ Earth Sci (2010) 60:1021–1036 1033
123
Site 3: Downstream from Tanners Flat
At the end of the study reach, the concentrations of both Cu
and Zn were lower, both as a result of chemical reactions
and of dilution from inflows that had low metal concen-
trations. The only inflows that contribute to the Cu and Zn
loads are White Pine Fork (mostly for Cu, Fig. 4a), and the
stream draining Tanners Flat campground (mostly for Zn,
Fig. 5a). These contributions, however, were not sufficient
to cause an increase that exceeded the standards. With the
WDT at 75% discharge (WT75), the percent exceedence
for the chronic Zn standard had no margin of safety, and at
the WT100 level, the chronic standard was exceeded. The
level at WT50 was required to meet the chronic Zn stan-
dard and to have a margin of safety.
Reactive transport modeling
Evaluation of remedial options for LCC has several
implications for reactive transport modeling of metals in
surface waters. Previous efforts to model sorption have
primarily focused on low-pH environments where colloidal
iron is the primary sorbent (Ball et al. 2004; Runkel et al.
1999; Runkel and Kimball 2002, 2007). The present
application, in contrast, involves a circum-neutral stream in
which significant quantities of both Fe and Al colloids are
present. Given the difficulties in modeling Cu and Zn
sorption described herein, development of modeling tech-
niques that consider multiple sorbent phases may be war-
ranted (Anderson and Benjamin 1990).
Modeling of circum-neutral waters also introduces a
need to consider CO2 degassing, an important process
affecting instream pH. Degassing in the LCC was initially
modeled as an equilibrium process, using a log k value
calculated from the elevation-corrected partial pressure of
CO2. This initial modeling produced a simulated pH that
was in excess of observed pH, a discrepancy that can be
attributed to the equilibrium approach used within OTEQ.
Under the equilibrium approach, degassing occurs instan-
taneously whenever the water column is oversaturated with
respect to the specified partial pressure of CO2. This
approach is inconsistent with theoretical and empirical
studies that have shown degassing to be a kinetic process
that is limited by transfer across the air/water interface
(Choi et al. 2000). The present application mimics this
kinetic limitation by utilizing a log k value that is lower
than the log k value associated with the atmospheric partial
pressure. Although this change in the log k value results in
a simulation that reproduces the general features of the
observed pH profile, the observed decrease in pH below the
key inflows (CCR and WDT) is not reproduced (Fig. 2).
Efforts to more accurately simulate pH in circum-neutral
waters may therefore require changes in model structure,
such as the addition of kinetic degassing terms to the
transport equations for CO3 and TOTH.
Conclusions
Field-scale experiments provide the means to evaluate
remediation options as they are combined with reactive
solute transport modeling. In this paper, field data from
LCC, Utah, are used to calibrate a reactive solute transport
model that considers the hydrologic and geochemical
processes affecting metals. The calibrated model is sub-
sequently used to consider various remediation options that
are designed to lower Cu and Zn concentrations in the
creek, with the goal of meeting water-quality standards at
three key monitoring locations. Potential remediation
options include treatment of CCR water by a fen, and
regulation of discharge from the WDT. Study results have
specific implications for LCC, and some general implica-
tions for data collection and reactive transport modeling, as
summarized below.
Simulation results presented herein suggest that the
choice of remedial options will be largely driven by the
water-quality standards for dissolved Zn, rather than dis-
solved Cu (if a remedial option meets the Zn standard, it will
also meet the Cu standard). Results of model calibration
suggest very little instream removal of Zn under existing,
low-flow conditions, such that remedial efforts should focus
on reduction at the source. Simulations of remedial options
suggest that although regulation of discharge from the WDT
results in lower Cu and Zn concentrations, some treatment of
the CCR inflow by the fen will be required to meet appli-
cable water-quality standards. Simulation results also sug-
gest that water-quality standards in the upper and lower
sections of the study reach (sites 1 and 3) may be met using
various combinations of fen treatment and WDT regulation,
but that complete compliance in the middle section (site 2)
will require the highest level of fen treatment and the largest
regulation of WDT discharge (Fen98c and WT25; see
chronic standard for Zn, Table 5).
Interpretation of the model results presented here must
be conducted in light of model and system uncertainty.
Considerable model uncertainty in the LCC application is
likely given the unusually difficult calibration process.
Much of this uncertainty arises due to the incomplete
analysis of the 2004 samples, a measure taken to reduce
project costs. This application thus serves to illustrate the
trade off between available resources and uncertainty, a
trade off that should be considered when conducting future
investigations. The effects of model uncertainty are miti-
gated herein by introducing a margin of safety and by
erring on the conservative side during calibration and
simulation of remedial options. In addition to the effects of
1034 Environ Earth Sci (2010) 60:1021–1036
123
model uncertainty, decision makers should consider the
effects of system uncertainty while evaluating treatment
options. Specific concerns include the variability in source
chemistry, and variability in treatment effectiveness (e.g.,
long-term effectiveness of the fen), two issues that are
outside the scope of the present study.
Reactive transport modeling is a useful tool for the
evaluation of remedial alternatives in complex natural
systems, where multiple hydrologic and geochemical pro-
cesses determine metal fate. Future efforts should recog-
nize the effects of uncertainty and the implications for data
collection and analysis. Model development efforts may
also be needed to more accurately simulate the processes of
sorption and degassing.
Acknowledgments This work was done in cooperation with Salt
Lake County Engineering Division and with support from the U.S.
Geological Survey Toxic Substances Hydrology Program. The man-
uscript benefited from helpful reviews by Pierre Glynn and Terry
Kenney of the U.S. Geological Survey.
References
Allison JD, Brown DS, Novo-Gradac KJ (1991) MINTEQA2, a
geochemical assessment data base and test cases for environ-
mental systems: version 3.0 user’s manual. U.S. EPA, Athens
Anderson PR, Benjamin MM (1990) Modeling adsorption in alumi-
num-iron binary oxide suspensions. Environ Sci Technol
24:1586–1592. doi:10.1021/es00080a020
Ball JW, Runkel RL, Nordstrom DK (2004) Evaluating remedial
alternatives for the Alamosa River and Wightman Fork, near the
Summitville Mine, Colorado. In: Zannetti P (ed) Environmental
sciences and environmental computing. The EnviroComp
Institute,
Bencala KE, McKnight DM (1987) Identifying in-stream variability:
sampling iron in an acidic stream. In: Averett RC, McKnight
DM (eds) Chemical quality of water and the hydrologic cycle.
Lewis Publishers, Inc., Chelsea, MI, pp 255–269
Besser JM, Allert AL, Hardesty DK, May TW, Leib KJ (1999)
Seasonal variation in toxicity of streams affected by acid mine
drainage. In: 20th Annual Meeting, Philadelphia, Penn., Novem-
ber 14–19, 1999. Society of Environmental Toxicity and
Chemistry (SETAC), pp 285
Broshears RE, Runkel RL, Kimball BA, Bencala KE, McKnight DM
(1996) Reactive solute transport in an acidic stream: experimen-
tal pH increase and simulation of controls on pH, aluminum,
and iron. Environ Sci Technol 30:3016–3024. doi:10.1021/
es960055u
Brown E, Skougstad MW, Fishman MJ (1970) Methods for collection
and analysis of water samples for dissolved minerals and gases.
U.S. Geological Survey Techniques of Water-Resources Inves-
tigation Book 5, Chapter A1
Choi J, Harvey JW, Conklin M (2000) Characterizing multiple
timescales of stream and storage zone interaction that affect
solute fate and transport in streams. Water Resour Res 36:1511–
1518. doi:10.1029/2000WR900051
Dzombak DA, Morel FMM (1990) Surface complexation modeling:
hydrous ferric oxide. Wiley, New York
Gerner LJ, Rossi FJ, Kimball BA (2001) Selected hydrologic data for
Little Cottonwood Creek, Salt Lake County, Utah, September
1998. U.S. Geological Survey Open-File Report 01-38
Jensen SF, Karimi R (2001) Rocky mountain headwaters mine waste
initiative, Alta Wetlands Fen Pilot Project, Interim Report V,
2001 Monitoring Season. Salt Lake County Engineering Divi-
sion, Salt Lake City
Kilpatrick FA, Cobb ED (1985) Measurement of discharge using
tracers. U.S. Geological Survey Techniques of Water-Resources
Investigations Book 3, Chapter A16
Kimball BA, McKnight DM, Wetherbee GA, Harnish RA (1992)
Mechanisms of iron photoreduction in a metal-rich, acidic
stream (St Kevin, Gulch, Colorado, U.S.A.). Chem Geol 96:227–
239. doi:10.1016/0009-2541(92)90130-W
Kimball BA, Broshears RE, Bencala KE, McKnight DM (1994)
Coupling of hydrologic transport and chemical reactions in a
stream affected by acid mine drainage. Environ Sci Technol
28:2065–2073. doi:10.1021/es00061a014
Kimball BA, Callender E, Axtmann EV (1995) Effects of colloids on
metal transport in a river receiving acid mine drainage, upper
Arkansas River, Colorado. USA Appl Geochem 10:285–306.
doi:10.1016/0883-2927(95)00011-8
Kimball BA, Bencala KE, Runkel RL (2000) Quantifying effects of
metal loading from mine drainage. In: Fifth International
Conference on Acid Rock Drainage, May 13–15, 2000, Denver,
Colo. Society for Mining, Metallurgy, and Exploration, Inc.,
Englewood, Colo., pp 1381–1389
Kimball BA, Runkel RL, Gerner LJ (2001) Quantification of mine-
drainage inflows to Little Cottonwood Creek, Utah, using a
tracer-injection and synoptic-sampling study. Environ Geol
40:1390–1404. doi:10.1007/s002540100320
Kimball BA, Runkel RL, Walton-Day K, Bencala KE (2002)
Assessment of metal loads in watersheds affected by acid mine
drainage by using tracer injection and synoptic sampling:
Cement Creek, Colorado, USA. Appl Geochem 17:1183–1207.
doi:10.1016/S0883-2927(02)00017-3
Kimball BA, Runkel RL, Walton-Day K (2003) Use of field-scale
experiments and reactive solute-transport modelling to evaluate
remediation alternatives in streams affected by acid mine
drainage. In: Jambor JL, Blowes DW, Ritchie AIM (eds)
Environmental aspects of mine wastes. Mineralogical Associa-
tion of Canada, British Columbia, pp 261–282
Kimball, BA, Johnson, KK, Runkel, RL, Steiger, JI (2004) Quanti-
fication of metal loading to Silver Creek through the Silver
Maple Claims area, Park City, Utah, May 2002. U.S. Geological
Survey Water-Resources Investigations Report 03-4296
Kimball BA, Walton-Day K, Runkel RL (2007) Quantification of
metal loading by tracer injection and synoptic sampling, 1996–
2000. In: Church SE, von Guerard PB, and Finger SE (eds)
Integrated investigations of environmental effects of historical
mining in the Animas River watershed, San Juan County,
Colorado. U.S. Geological Survey, chap E9, pp 417–495
Leib KJ, Mast MA, Wright WG (2003) Using water-quality profiles to
characterize seasonal water quality and loading in the upper
Animas River Basin, Southwestern Colorado. U.S. Geological
Survey Water-Resources Investigations Report 02-4230
Miller Shepherd (2002) Total maximum daily load for dissolved zinc
in the Little Cottonwood Creek. Utah Division of Water Quality,
Salt Lake City
Parkhurst DL, Appelo CAJ (1999) User’s guide to PHREEQC
(Version 2)—a computer program for speciation, batch-reaction,
one-dimensional transport, and inverse geochemical calcula-
tions. U.S. Geological Survey Water-Resources Investigation
Report 99-4259
Environ Earth Sci (2010) 60:1021–1036 1035
123
Runkel RL (1998) One-dimensional transport with inflow and storage
(OTIS): a solute transport model for streams and rivers. U.S.
Geological Survey Water-Resources Investigations 98-4018
Runkel RL, Kimball BA (2002) Evaluating remedial alternatives for
an acid mine drainage stream: application of a reactive transport
model. Environ Sci Technol 36:1093–1101. doi:10.1021/
es0109794
Runkel RL, Kimball BA (2007) A simulation-based approach
for estimating premining water quality: red Mountain
Creek, Colorado. Appl Geochem 22:1899–1918. doi:10.1016/
j.apgeochem.2007.03.054
Runkel RL, Bencala KE, Broshears RE, Chapra SC (1996a) Reactive
solute transport in streams 1, Development of an equilibrium-
based model. Water Resour Res 32:409–418. doi:10.1029/
95WR03106
Runkel RL, McKnight DM, Bencala KE, Chapra SC (1996b)
Reactive solute transport in streams 2 Simulation of a pH
modification experiment. Water Resour Res 32:419–430. doi:
10.1029/95WR03107
Runkel RL, Kimball BA, McKnight DM, Bencala KE (1999)
Reactive solute transport in streams: a surface complexation
approach for trace metal sorption. Water Resour Res 35:3829–
3840. doi:10.1029/1999WR900259
Smith KS (1999) Metal sorption on mineral surfaces: an overview
with examples relating to mineral deposits. In: Plumlee G,
Logsdon MJ (eds) The environmental geochemistry of mineral
deposits part A: processes, techniques, and health issues. Society
of Economic Geologists, Littleton, pp 161–182
To TB, Nordstrom DK, Cunningham KM, Ball JW, McCleskey RB
(1998) A new method for the direct determination of dissolved
Fe(III) concentration in acid mine waters. Environ Sci Technol
33:807–813. doi:10.1021/es980684z
Toner B, Manceau A, Marcus MA, Millet DB, Sposito G (2005) Zinc
sorption by a bacterial biofilm. Environ Sci Technol 39:8288–
8294. doi:10.1021/es050528?
Utah Department of Administrative Services (2005) Standards
of quality for waters of the state. Division of Administrative
Rules, http://www.rules.utah.gov/publicat/code/r314/r317-002.
htm. Accessed 7 April 2005
Walton-Day K, Paschke SS, Runkel RL, Kimball BA (2007) Using
the OTIS solute transport model to evaluate remediation
scenarios in Cement Creek and the upper Animas River. In:
Church SE, von Guerard PB, and Finger SE (eds) Integrated
investigations of environmental effects of historical mining in
the Animas River watershed, San Juan County, Colorado. U.S.
Geological Survey, chap E24, pp 973–1028
Ward JR, Harr CA (1990) Methods for collection and processing of
surface-water and bed-material samples for physical and chem-
ical analyses. U.S. Geological Survey Open-File Report 89-140
Wilkowske CD, Allen DV, Phillips JV (2003) Drought conditions in
Utah during 1999–2002: a historical perspective. U.S. Geolog-
ical Survey Fact Sheet 037-03
1036 Environ Earth Sci (2010) 60:1021–1036
123