Embed Size (px)
Citation preview
Evaluating Public DNS Services in the Wake ofIncreasing Centralization of DNS
Trinh Viet Doan, Justus Fries, Vaibhav BajpaiTechnical University of Munich, Germany
[trinhviet.doan | justus.fries | vaibhav.bajpai]@tum.de
Abstract—Recent studies have shown centralization in theDomain Name System (DNS) around public DNS services, whichare hosted on centrally managed infrastructure and advertisehigher reliability, improved security, and faster response times forname resolutions. However, many of the recently emerged publicDNS services have not yet been extensively studied regardingpopularity and performance. In light of this, we use 10.6k RIPEAtlas probes and find that 28.3% of the probes (and the theirhost network by extension) use at least one public DNS service,with Google being the most popular public DNS service amongthese probes. We further quantify the response time benefitsof such public DNS services using ≈2.5k RIPE Atlas probesdeployed in home networks (1k of which are IPv6 capable):Overall, we provision around 12.7M DNS requests based on aset of 23 domains and ten centralized public DNS services bothover IPv4 and IPv6. For comparison, we additionally resolve thesame set of domains using the probes’ local resolvers, which aretypically managed by the ISP and exhibit lower response timesin general. We observe that even though IP and AS paths tolocal resolvers are generally shorter, some public DNS services(e.g., Cloudflare), achieve faster responses over both IPv4 andIPv6. Across all continents, Cloudflare, Google, and OpenDNSexhibit the lowest response times out of all public resolvers forsuccessful DNS measurements. Probes in Europe (EU) and NorthAmerica (NA) experience comparable latencies to public and localresolvers, thereby diminishing claimed latency benefits of publicresolvers. We also observe inflated path lengths to and responsetimes (over both address families) from most public resolvers forprobes in Africa (AF) and South America (SA). Based on ourobservations, we provide recommendations and discuss situationsin which switching to public DNS services may be beneficial.
I. INTRODUCTION
The Domain Name System (DNS) is said to become increas-ingly centralized [1], [2], concentrating around a small numberof public DNS resolver services. These services are typicallyfree of charge and promise increased reliability, faster responsetimes, and higher security. In particular, as early supporters ofthe recently standardized DNS over TLS (DoT) [3], [4], [5],[6] and DNS over HTTPS (DoH) [7], [8] protocols [9], [10],[11], public DNS services such as Google, Cloudflare, Clean-Browsing, and Quad9 are gaining more traction and usage.Nevertheless, the latency differences between such centralizedpublic resolvers and default ISP resolvers have not been exten-sively studied yet. Previous studies (§ II) have investigated theusage and performance of primarily two public DNS services:Google and OpenDNS. These studies found local ISP resolverswere more commonly used and provided better performance in
ISBN 978-3-903176-39-3 c© 2021 IFIP
TABLE IOVERVIEW OF THE PUBLIC DNS SERVICES MEASURED IN THE
EXPERIMENT. ALL RESOLVERS THAT LAUNCHED AFTER 2010 HAVE NOTBEEN EXTENSIVELY STUDIED BEFORE.
Launch IPv4 Address IPv6 Address
2020-05 NextDNS 45.90.28.0 2a07:a8c0::2018-04 Cloudflare DNS 1.1.1.1 2606:4700:4700::11112017-11 Quad9 9.9.9.9 2620:fe::92017-02 CleanBrowsing 185.228.168.168 2a0d:2a00:1::12017-02 Neustar UltraRecursive 156.154.70.1 2610:a1:1018::12015-09 VeriSign Public DNS 64.6.64.6 2620:74:1b::1:12013-11 Yandex DNS 77.88.8.8 2a02:6b8::feed:ff2009-12 Google Public DNS 8.8.8.8 2001:4860:4860::88882006-07 OpenDNS 208.67.222.123 2620:0:ccc::22000-06 OpenNIC 185.121.177.177 2a05:dfc7:5::5353
terms of response times and proximity of the resolved location.Since publication of these studies (more than five years ago), anincreasing number of new public DNS services have emerged(Table I), for which comparable studies are missing.
Due to the evolution of the DNS around such centralizedpublic DNS services in recent years [12], we quantify thepopularity, closeness w.r.t. path lengths, and performance ben-efits regarding terms of response times of public resolvers incomparison to local resolvers (assigned by the ISP) to providea better understanding of these newly launched services. Tothis end, we use the RIPE Atlas platform [13], making useof 2,502 probes to issue and measure DNS lookups toward tencentralized public DNS services, along with lookups using eachprobe’s locally configured default resolvers. We repeat thesemeasurements daily for a set of 23 domains over both IPv4and IPv6 for a period of two weeks (§ III). We further performtraceroute measurements from the probes toward the publicresolvers as well as the publicly routable IP addresses of localresolvers. Our main findings are:
Popularity (§ IV) – We determine the popularity of publicDNS services among all 10.6k connected RIPE Atlas probesand find that 28.3% (3k) of the probes use at least one publicDNS service as their locally configured resolver. Further, 12.9%(1.4k) of the probes only use public resolvers, rather thanresolvers managed by the ISP; in particular, 9.2% (1k) of allprobes exclusively use one single public DNS service as theirdefault resolver. Google provides the most prevalent publicDNS service, used by 78.4% of these 3k probes.
Path Lengths (§ V) – As expected, IP paths to localresolvers of ISPs are shorter (1–12 IP hops) compared to publicresolvers (5–17 IP hops). We see that over IPv4 around 82%
of the local resolvers are located in the AS of the probe, i.e.,the first AS hop, with the number being even higher overIPv6 (93%). In contrast, AS paths to public resolvers involvearound 2–5 ASes over both address families. Google PublicDNS (80–86% samples, 2 AS hops) directly peers with theISP, while Cloudflare and Quad9 (92–94% samples, 3 AS hops)tend to have an additional transit AS in between. We notice thatGoogle edge caches deployed inside the ISP do not (yet) offerDNS services. We also observe that probes in South America(SA) exhibit higher IP and AS path lengths toward all DNSresolvers than any other continent.
Response Times (§ VI) – We find that 75% of all successfulDNS requests are responded to within 40 ms over both addressfamilies. Unlike previous studies, we find that some publicDNS services achieve lower lookup latency compared to localISP resolvers over both address families. Responses from localresolvers are faster for 36–60% of the samples over IPv4and 29–60% over IPv6, respectively. Specifically, probes inall continents besides Europe (EU) and North America (NA)experience worse response times from public resolvers, whichshows overall benefits of local resolvers for substantial latencyimprovements over both address families (26.6 ms over IPv4,51.8 ms over IPv6 on average). We also notice inflated responsetimes to Google Public DNS for probes in Africa (AF), whichindicates fewer points of presence in this continent. Yet, DNSresponse times for probes in AF and SA are significantlyworse over IPv6 than IPv4, indicating the need to strengthenperformance over IPv6 in these regions.
Based on these observations, we discuss (§ VII) recommen-dations, e.g., in which cases switching to public DNS servicescan provide performance benefits, along with limitations of thestudy. The data is publicly available via the RIPE Atlas API;we share the measurement IDs along with the analysis scriptsand Jupyter notebooks to ease reproducibility of our work1.
II. RELATED WORK
One of the first studies to measure performance of publicDNS resolvers is presented by Ager et al. [14] (2010). Theycompare the responsiveness, the deployment, and the answersof local DNS resolvers to two public resolvers, namely GoogleDNS and OpenDNS. Performing active measurements using60 vantage points in 28 different countries and 5 continents,they find that local resolvers managed by the ISPs generallyoutperform public resolvers in terms of response times for themost part. In addition, they find that these centralized resolverslack local information about the requester (unlike the ISP), i.e.,recursive resolution cannot consider location data and, thus,refers clients to suboptimal server locations as a result.
Regarding popularity of public DNS services, Otto et al. [15](2012) show that usage of public DNS grows by 27% annually:Google is used by over 4% of the users, followed by OpenDNSwith slightly over 3% as of 2011. They show that usingpublic DNS services results in significantly different CDNredirections, often leading to degraded HTTP performance. To
1https://github.com/tv-doan/ifip-net-2021-dns
overcome this lack of additional information about the clients,Extended DNS (EDNS)[16] has been introduced, which allowsclients to include an IP address prefix to the DNS request,so that the responses of recursive resolvers can be based onmore informed decisions. Moreover, Callahan et al. [17] (2013)analyze 200M DNS queries passively measured in 90 homes inthe USA with their corresponding 162M DNS responses. Theyfind that Google’s public DNS service is used in slightly over1% of the queries, while 97% of the requests go to the ISP localresolver. Providing an additional view, APNIC Labs [18] (2014)use Javascript code embedded in advertisements to send DNSqueries to a controlled authoritative DNS server. Using thistechnique, they show largely different numbers, as they identify10.5% of the users to leverage Google’s DNS service; theseusers are mostly located in Middle America, Central Africa,the Middle East, and South East Asia.
In recent years, several studies investigate DNS centralizationfrom different points of view. For instance, Allman [19] (2018)analyzes the shared infrastructure w.r.t. Second-Level Domains(SLDs). He finds that Cloudflare and GoDaddy are the DNSproviders with by far the highest numbers of SLDs managed,each accounting for roughly 70k SLDs outsourced to them,in comparison with the remaining providers in the top 10(which amount to 204k SLDs in total). Similarly, Zembruzki etal. [20] (2020) develop dnstracker, an active measurementtool that enables the assessment of the levels of concentrationand shared infrastructure in the DNS. The tool first resolvesa domain via dig to learn about the associated authoritativename server, before it runs traceroute to measure the pathto the authoritative server. In the recorded trace, the Hop-Before-The-Last (HBTL) then indicates the AS and hostingDNS provider. They measure the Alexa Top 1M domains’authoritative name servers with their tool, finding that up to 12kname servers share the same infrastructure, which may result insingle points of failure. Moura et al. [21] (2020) measure DNStraffic at a DNS root server and two Top-Level Domains (TLDs)(.nl and .nz), i.e., the traffic between recursive resolvers andauthoritative servers. In particular, they focus on five cloudand CDN providers, namely Google, Amazon, Microsoft, Face-book, and Cloudflare. They find that the centralization benefitsthe deployment of DNS features such as DNSSEC or QNAMEminimization, along the usage of IPv6, as these big players pushthese features, although the adoption varies between providers.Further, they show that DNS traffic is centralized around thefive providers: For the root server, around 9% of the traffic isreceived from those providers, whereas for the country-codeTLDs, they find more than 30% of the incoming queries tooriginate from the five providers. Overall, these studies showmoderate centralization in the DNS from different perspectives.
The trend of DNS centralization can also be seen outsideof empirical studies. For instance, Mozilla aimed to enableDoH using Cloudflare’s resolver by default for all Firefoxusers, though this proposal received pushback due to lack ofcontrol and privacy for users [22]. In response, Mozilla addedan alternative trusted DoH resolver (NextDNS), starting rollout
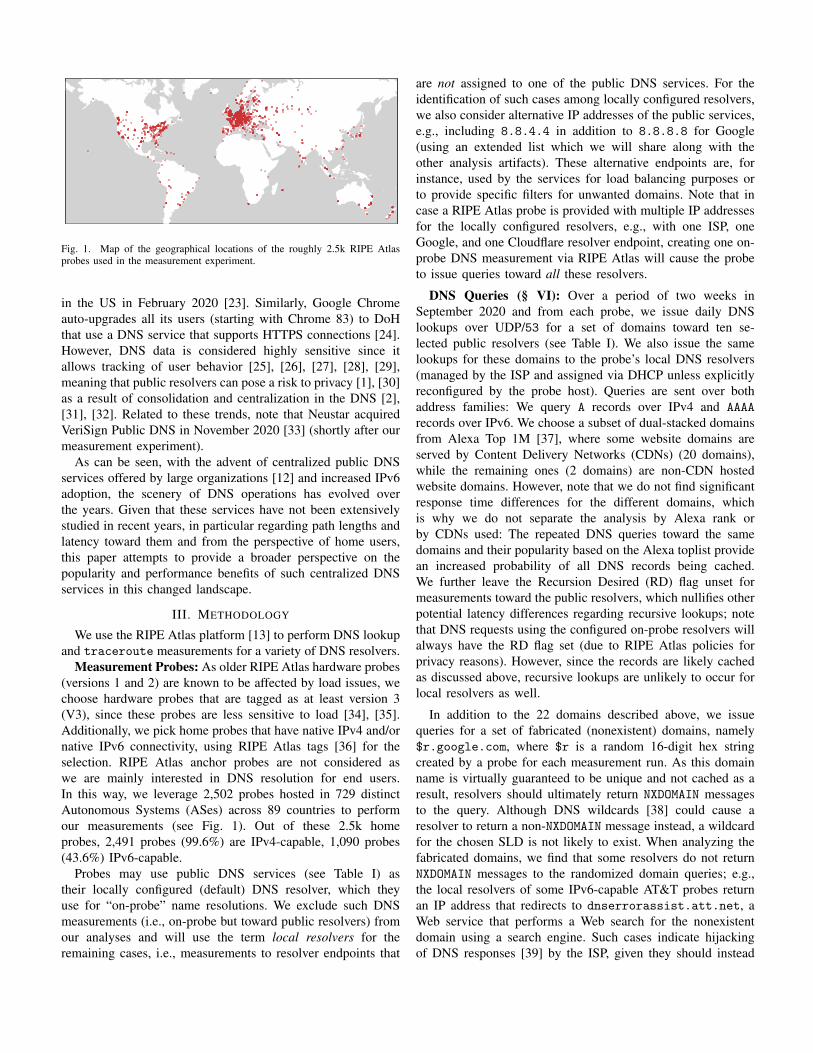
Fig. 1. Map of the geographical locations of the roughly 2.5k RIPE Atlasprobes used in the measurement experiment.
in the US in February 2020 [23]. Similarly, Google Chromeauto-upgrades all its users (starting with Chrome 83) to DoHthat use a DNS service that supports HTTPS connections [24].However, DNS data is considered highly sensitive since itallows tracking of user behavior [25], [26], [27], [28], [29],meaning that public resolvers can pose a risk to privacy [1], [30]as a result of consolidation and centralization in the DNS [2],[31], [32]. Related to these trends, note that Neustar acquiredVeriSign Public DNS in November 2020 [33] (shortly after ourmeasurement experiment).
As can be seen, with the advent of centralized public DNSservices offered by large organizations [12] and increased IPv6adoption, the scenery of DNS operations has evolved overthe years. Given that these services have not been extensivelystudied in recent years, in particular regarding path lengths andlatency toward them and from the perspective of home users,this paper attempts to provide a broader perspective on thepopularity and performance benefits of such centralized DNSservices in this changed landscape.
III. METHODOLOGY
We use the RIPE Atlas platform [13] to perform DNS lookupand traceroute measurements for a variety of DNS resolvers.
Measurement Probes: As older RIPE Atlas hardware probes(versions 1 and 2) are known to be affected by load issues, wechoose hardware probes that are tagged as at least version 3(V3), since these probes are less sensitive to load [34], [35].Additionally, we pick home probes that have native IPv4 and/ornative IPv6 connectivity, using RIPE Atlas tags [36] for theselection. RIPE Atlas anchor probes are not considered aswe are mainly interested in DNS resolution for end users.In this way, we leverage 2,502 probes hosted in 729 distinctAutonomous Systems (ASes) across 89 countries to performour measurements (see Fig. 1). Out of these 2.5k homeprobes, 2,491 probes (99.6%) are IPv4-capable, 1,090 probes(43.6%) IPv6-capable.
Probes may use public DNS services (see Table I) astheir locally configured (default) DNS resolver, which theyuse for “on-probe” name resolutions. We exclude such DNSmeasurements (i.e., on-probe but toward public resolvers) fromour analyses and will use the term local resolvers for theremaining cases, i.e., measurements to resolver endpoints that
are not assigned to one of the public DNS services. For theidentification of such cases among locally configured resolvers,we also consider alternative IP addresses of the public services,e.g., including 8.8.4.4 in addition to 8.8.8.8 for Google(using an extended list which we will share along with theother analysis artifacts). These alternative endpoints are, forinstance, used by the services for load balancing purposes orto provide specific filters for unwanted domains. Note that incase a RIPE Atlas probe is provided with multiple IP addressesfor the locally configured resolvers, e.g., with one ISP, oneGoogle, and one Cloudflare resolver endpoint, creating one on-probe DNS measurement via RIPE Atlas will cause the probeto issue queries toward all these resolvers.
DNS Queries (§ VI): Over a period of two weeks inSeptember 2020 and from each probe, we issue daily DNSlookups over UDP/53 for a set of domains toward ten se-lected public resolvers (see Table I). We also issue the samelookups for these domains to the probe’s local DNS resolvers(managed by the ISP and assigned via DHCP unless explicitlyreconfigured by the probe host). Queries are sent over bothaddress families: We query A records over IPv4 and AAAArecords over IPv6. We choose a subset of dual-stacked domainsfrom Alexa Top 1M [37], where some website domains areserved by Content Delivery Networks (CDNs) (20 domains),while the remaining ones (2 domains) are non-CDN hostedwebsite domains. However, note that we do not find significantresponse time differences for the different domains, whichis why we do not separate the analysis by Alexa rank orby CDNs used: The repeated DNS queries toward the samedomains and their popularity based on the Alexa toplist providean increased probability of all DNS records being cached.We further leave the Recursion Desired (RD) flag unset formeasurements toward the public resolvers, which nullifies otherpotential latency differences regarding recursive lookups; notethat DNS requests using the configured on-probe resolvers willalways have the RD flag set (due to RIPE Atlas policies forprivacy reasons). However, since the records are likely cachedas discussed above, recursive lookups are unlikely to occur forlocal resolvers as well.
In addition to the 22 domains described above, we issuequeries for a set of fabricated (nonexistent) domains, namely$r.google.com, where $r is a random 16-digit hex stringcreated by a probe for each measurement run. As this domainname is virtually guaranteed to be unique and not cached as aresult, resolvers should ultimately return NXDOMAIN messagesto the query. Although DNS wildcards [38] could cause aresolver to return a non-NXDOMAIN message instead, a wildcardfor the chosen SLD is not likely to exist. When analyzing thefabricated domains, we find that some resolvers do not returnNXDOMAIN messages to the randomized domain queries; e.g.,the local resolvers of some IPv6-capable AT&T probes returnan IP address that redirects to dnserrorassist.att.net, aWeb service that performs a Web search for the nonexistentdomain using a search engine. Such cases indicate hijackingof DNS responses [39] by the ISP, given they should instead
return NXDOMAIN for nonexistent and fabricated domains.Overall, we collect data for around 12.7M DNS requests
(14 days × [2,491 (IPv4) + 1,090 (IPv6) probes] × 23domains × at least 11 resolvers) in cooperation with RIPENCC. This results in a set of 506 measurement IDs (2 addressfamilies × 23 domains × 11 target resolvers), with each IDgrouping the recurring measurements for the selected probes.We are aware of methodologies that include DNS records of anauthoritative server controlled by the researchers [40]. However,we value such controlled experiments as separate investigationsand consider them orthogonal to the goal of this paper, givenour experiment is designed to resemble the perspective of endusers that do not necessarily have such control knobs.
Traceroute (§ V): We additionally run one-off ICMPtraceroute measurements toward the resolver endpoints (Ta-ble I). The measurements are performed from each probeover IPv4 and/or IPv6. Since RIPE Atlas does not allowtraceroute measurements toward private IP addresses [41],only local resolvers with public IP addresses can be traced:We determine the addresses of all public local resolvers andadditionally run traceroute toward these endpoints (§ V). Ascentralized public resolvers leverage IP anycast [42], we expectIP paths from the probe to these resolvers to not be inflatedunnecessarily. Thus, inflated path lengths would reveal casesin which centralized public resolvers lack points of presence.
Additional On-Probe Resolutions (§ IV): To estimate thepopularity of centralized public DNS resolvers among RIPEAtlas probes, we additionally take all connected probes (10.6kprobes) into account and issue the domain google.com to beresolved on the probe, i.e., via the locally configured resolvers.The source IP addresses stated in the DNS responses allow us todetermine whether (and how many) public DNS services and/orlocal ISP resolvers are used by the probes for name resolution.Note that repeating the query for each on-probe resolver is notnecessary, since RIPE Atlas probes will automatically query thedomain using all resolvers listed in their DNS configuration.
IV. RIPE ATLAS PROBE RESOLVER BIAS
We begin the analysis by investigating the popularity of cen-tralized public DNS services on the RIPE Atlas measurementplatform. Using on-probe resolutions for all 10,624 connectedprobes, we study how biased on-probe resolutions are towardpublic resolvers. We find that 7,617 probes employ local (i.e.,non-centralized) resolvers exclusively for their DNS lookups(71.7%), while the remaining 3,007 probes use at least onepublic DNS service for on-probe name resolution (28.3%).
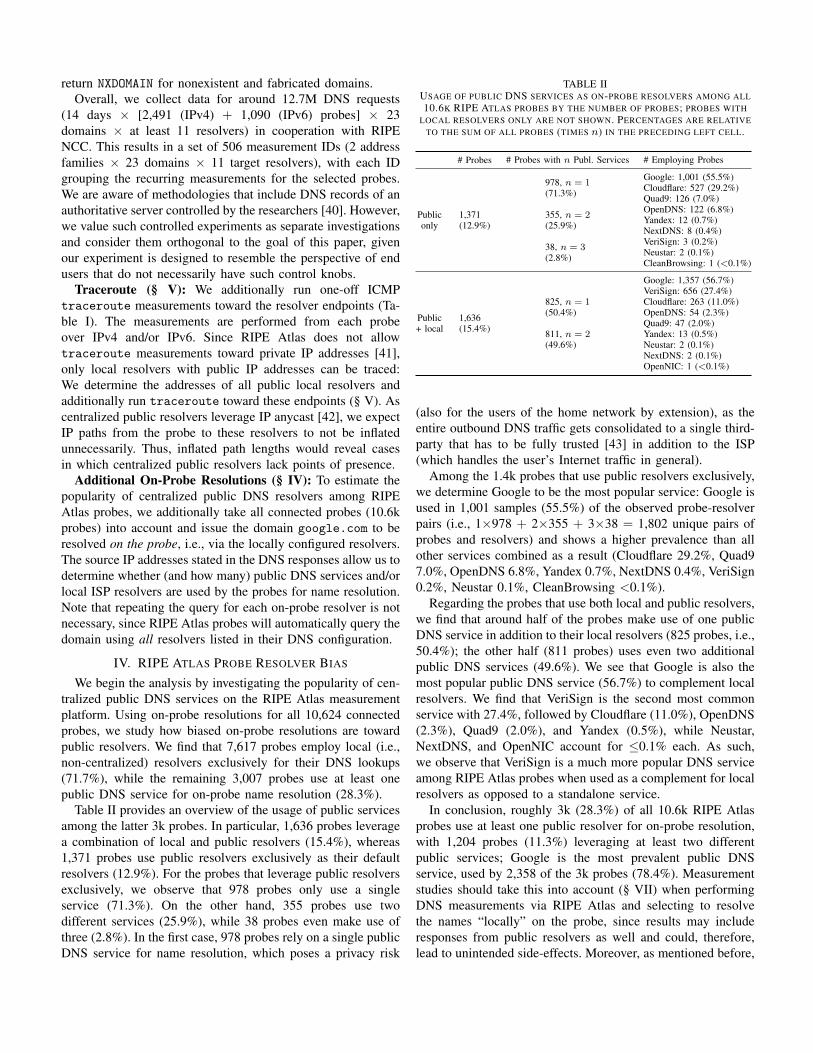
Table II provides an overview of the usage of public servicesamong the latter 3k probes. In particular, 1,636 probes leveragea combination of local and public resolvers (15.4%), whereas1,371 probes use public resolvers exclusively as their defaultresolvers (12.9%). For the probes that leverage public resolversexclusively, we observe that 978 probes only use a singleservice (71.3%). On the other hand, 355 probes use twodifferent services (25.9%), while 38 probes even make use ofthree (2.8%). In the first case, 978 probes rely on a single publicDNS service for name resolution, which poses a privacy risk
TABLE IIUSAGE OF PUBLIC DNS SERVICES AS ON-PROBE RESOLVERS AMONG ALL10.6K RIPE ATLAS PROBES BY THE NUMBER OF PROBES; PROBES WITH
LOCAL RESOLVERS ONLY ARE NOT SHOWN. PERCENTAGES ARE RELATIVETO THE SUM OF ALL PROBES (TIMES n) IN THE PRECEDING LEFT CELL.
# Probes # Probes with n Publ. Services # Employing Probes
Publiconly
1,371(12.9%)
978, n = 1(71.3%)
355, n = 2(25.9%)
38, n = 3(2.8%)
Google: 1,001 (55.5%)Cloudflare: 527 (29.2%)Quad9: 126 (7.0%)OpenDNS: 122 (6.8%)Yandex: 12 (0.7%)NextDNS: 8 (0.4%)VeriSign: 3 (0.2%)Neustar: 2 (0.1%)CleanBrowsing: 1 (<0.1%)
Public+ local
1,636(15.4%)
825, n = 1(50.4%)
811, n = 2(49.6%)
Google: 1,357 (56.7%)VeriSign: 656 (27.4%)Cloudflare: 263 (11.0%)OpenDNS: 54 (2.3%)Quad9: 47 (2.0%)Yandex: 13 (0.5%)Neustar: 2 (0.1%)NextDNS: 2 (0.1%)OpenNIC: 1 (<0.1%)
(also for the users of the home network by extension), as theentire outbound DNS traffic gets consolidated to a single third-party that has to be fully trusted [43] in addition to the ISP(which handles the user’s Internet traffic in general).
Among the 1.4k probes that use public resolvers exclusively,we determine Google to be the most popular service: Google isused in 1,001 samples (55.5%) of the observed probe-resolverpairs (i.e., 1×978 + 2×355 + 3×38 = 1,802 unique pairs ofprobes and resolvers) and shows a higher prevalence than allother services combined as a result (Cloudflare 29.2%, Quad97.0%, OpenDNS 6.8%, Yandex 0.7%, NextDNS 0.4%, VeriSign0.2%, Neustar 0.1%, CleanBrowsing <0.1%).
Regarding the probes that use both local and public resolvers,we find that around half of the probes make use of one publicDNS service in addition to their local resolvers (825 probes, i.e.,50.4%); the other half (811 probes) uses even two additionalpublic DNS services (49.6%). We see that Google is also themost popular public DNS service (56.7%) to complement localresolvers. We find that VeriSign is the second most commonservice with 27.4%, followed by Cloudflare (11.0%), OpenDNS(2.3%), Quad9 (2.0%), and Yandex (0.5%), while Neustar,NextDNS, and OpenNIC account for ≤0.1% each. As such,we observe that VeriSign is a much more popular DNS serviceamong RIPE Atlas probes when used as a complement for localresolvers as opposed to a standalone service.
In conclusion, roughly 3k (28.3%) of all 10.6k RIPE Atlasprobes use at least one public resolver for on-probe resolution,with 1,204 probes (11.3%) leveraging at least two differentpublic services; Google is the most prevalent public DNSservice, used by 2,358 of the 3k probes (78.4%). Measurementstudies should take this into account (§ VII) when performingDNS measurements via RIPE Atlas and selecting to resolvethe names “locally” on the probe, since results may includeresponses from public resolvers as well and could, therefore,lead to unintended side-effects. Moreover, as mentioned before,
Google Chrome users (starting with Google Chrome 83) areauto-upgraded to DoH [24] when using at least one of thepublic DNS services from CleanBrowsing, Cloudflare, Google,NextDNS, OpenDNS, or Quad9 (among others). Our datasetreveals that this upgrade policy would affect at least 2,991(28.2%) of the users hosting RIPE Atlas probes if they usedGoogle Chrome for browsing the Web.
V. PATH LENGTHS
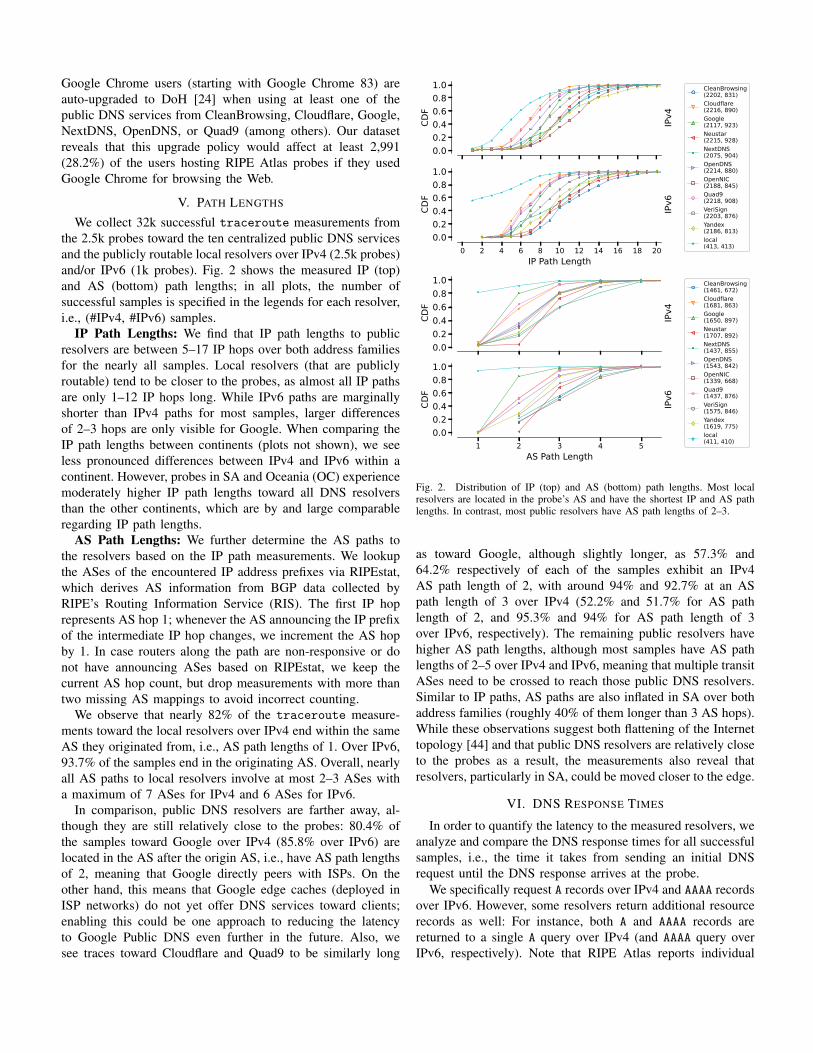
We collect 32k successful traceroute measurements fromthe 2.5k probes toward the ten centralized public DNS servicesand the publicly routable local resolvers over IPv4 (2.5k probes)and/or IPv6 (1k probes). Fig. 2 shows the measured IP (top)and AS (bottom) path lengths; in all plots, the number ofsuccessful samples is specified in the legends for each resolver,i.e., (#IPv4, #IPv6) samples.
IP Path Lengths: We find that IP path lengths to publicresolvers are between 5–17 IP hops over both address familiesfor the nearly all samples. Local resolvers (that are publiclyroutable) tend to be closer to the probes, as almost all IP pathsare only 1–12 IP hops long. While IPv6 paths are marginallyshorter than IPv4 paths for most samples, larger differencesof 2–3 hops are only visible for Google. When comparing theIP path lengths between continents (plots not shown), we seeless pronounced differences between IPv4 and IPv6 within acontinent. However, probes in SA and Oceania (OC) experiencemoderately higher IP path lengths toward all DNS resolversthan the other continents, which are by and large comparableregarding IP path lengths.
AS Path Lengths: We further determine the AS paths tothe resolvers based on the IP path measurements. We lookupthe ASes of the encountered IP address prefixes via RIPEstat,which derives AS information from BGP data collected byRIPE’s Routing Information Service (RIS). The first IP hoprepresents AS hop 1; whenever the AS announcing the IP prefixof the intermediate IP hop changes, we increment the AS hopby 1. In case routers along the path are non-responsive or donot have announcing ASes based on RIPEstat, we keep thecurrent AS hop count, but drop measurements with more thantwo missing AS mappings to avoid incorrect counting.
We observe that nearly 82% of the traceroute measure-ments toward the local resolvers over IPv4 end within the sameAS they originated from, i.e., AS path lengths of 1. Over IPv6,93.7% of the samples end in the originating AS. Overall, nearlyall AS paths to local resolvers involve at most 2–3 ASes witha maximum of 7 ASes for IPv4 and 6 ASes for IPv6.
In comparison, public DNS resolvers are farther away, al-though they are still relatively close to the probes: 80.4% ofthe samples toward Google over IPv4 (85.8% over IPv6) arelocated in the AS after the origin AS, i.e., have AS path lengthsof 2, meaning that Google directly peers with ISPs. On theother hand, this means that Google edge caches (deployed inISP networks) do not yet offer DNS services toward clients;enabling this could be one approach to reducing the latencyto Google Public DNS even further in the future. Also, wesee traces toward Cloudflare and Quad9 to be similarly long
0.00.20.40.60.81.0
CDF
CleanBrowsing(2202, 831)Cloudflare(2216, 890)Google(2117, 923)Neustar(2215, 928)NextDNS(2075, 904)OpenDNS(2214, 880)OpenNIC(2188, 845)Quad9(2218, 908)VeriSign(2203, 876)Yandex(2186, 813)local(413, 413)0 2 4 6 8 10 12 14 16 18 20
IP Path Length
0.00.20.40.60.81.0
CDF
IPv4
IPv6
0.00.20.40.60.81.0
CDF
CleanBrowsing(1461, 672)Cloudflare(1681, 863)Google(1650, 897)Neustar(1707, 892)NextDNS(1437, 855)OpenDNS(1543, 842)OpenNIC(1339, 668)Quad9(1437, 876)VeriSign(1575, 846)Yandex(1619, 775)local(411, 410)1 2 3 4 5
AS Path Length
0.00.20.40.60.81.0
CDF
IPv4
IPv6
Fig. 2. Distribution of IP (top) and AS (bottom) path lengths. Most localresolvers are located in the probe’s AS and have the shortest IP and AS pathlengths. In contrast, most public resolvers have AS path lengths of 2–3.
as toward Google, although slightly longer, as 57.3% and64.2% respectively of each of the samples exhibit an IPv4AS path length of 2, with around 94% and 92.7% at an ASpath length of 3 over IPv4 (52.2% and 51.7% for AS pathlength of 2, and 95.3% and 94% for AS path length of 3over IPv6, respectively). The remaining public resolvers havehigher AS path lengths, although most samples have AS pathlengths of 2–5 over IPv4 and IPv6, meaning that multiple transitASes need to be crossed to reach those public DNS resolvers.Similar to IP paths, AS paths are also inflated in SA over bothaddress families (roughly 40% of them longer than 3 AS hops).While these observations suggest both flattening of the Internettopology [44] and that public DNS resolvers are relatively closeto the probes as a result, the measurements also reveal thatresolvers, particularly in SA, could be moved closer to the edge.
VI. DNS RESPONSE TIMES
In order to quantify the latency to the measured resolvers, weanalyze and compare the DNS response times for all successfulsamples, i.e., the time it takes from sending an initial DNSrequest until the DNS response arrives at the probe.
We specifically request A records over IPv4 and AAAA recordsover IPv6. However, some resolvers return additional resourcerecords as well: For instance, both A and AAAA records arereturned to a single A query over IPv4 (and AAAA query overIPv6, respectively). Note that RIPE Atlas reports individual

0.00.20.40.60.81.0
CDF CleanBrowsing
(263438, 84483)Cloudflare(213549, 61944)Google(320042, 64565)Neustar(5623, 216)NextDNS(363910, 129133)OpenDNS(394895, 55957)OpenNIC(5615, 217)Quad9(116137, 34725)VeriSign(153944, 30622)Yandex(112284, 24782)local(963122, 448202)100 101 102 103
Response Time [ms]
0.00.20.40.60.81.0
CDF
IPv4
IPv6
Fig. 3. Distribution of response times for each resolver. Local resolvers showhigher response times than public resolvers for around 55% of the samplesover IPv4; over IPv6, public resolvers generally respond faster in comparison.
results for each returned record type that were returned tothe same request, including different response times for eachof the record types. We notice that this behavior is exclusiveto measurements that use the configured on-probe resolvers(regardless of whether a local or public resolver is queried).We find that most of these cases with mixed up record typesoriginate from local resolvers (81.4% IPv4, 90.1% IPv6),although Google and Cloudflare also account for 8.7% and7.0% of the samples over IPv4 (4.1% and 4.3% over IPv6,respectively). In rare cases (<1.5%), we also see this for Quad9,OpenDNS, Neustar, Yandex, and NextDNS. When comparingthe response time differences between such responses, around74% of the respective samples over IPv4 exhibit a differenceof at most ±10 ms between the A and AAAA records (64%over IPv6). Hence, response times between A and AAAA recordsrequested over either address family are largely similar in mostcases, which indicates that both A and AAAA records are cachedand that the resolvers likely operate in dual-stack. Thus, wedo not further distinguish between different record types andfocus on differences over IPv4 and IPv6 instead. As mentionedin § III, we exclude on-probe DNS measurements that leveragepublic resolvers in the following and further only includemeasurements with a NOERROR response code and a non-emptyanswer section, which we consider as successful measurements.
Overall Distribution: Over IPv4, the interquartile range(IQR, i.e., 25th–75th percentiles) of the response times acrossall resolvers and probes is [9.5; 36.8] ms, while 90.7% of thequeries are responded to within 100 ms. Over IPv6, the IQRcovers [10.1; 39.9] ms instead; similarly, 86.9% of the responsesare received within 100 ms over IPv6 as well, which suggeststhat both address families show comparable DNS responsetimes overall.
By Resolver and Address Family: We further investigatethe response times of different resolvers as observed by theprobes. Fig. 3 shows the distributions of the response times ofall successful DNS lookups for each resolver over IPv4 andIPv6. Note that while we observe Neustar and OpenNIC to
also exhibit low response times in general, the measurementsare not quite comparable to other resolvers due to the muchlower sample size of successful measurements, caused byhigh numbers of REFUSED responses. Consequently, we do notdiscuss Neustar and OpenNIC in detail in the following.
Generally, we observe Cloudflare, Google, and OpenDNS toachieve the lowest response times out of the public resolvers.NextDNS, Quad9, and CleanBrowsing show relatively similarperformances (slightly behind the previous ones), whereasVeriSign and Yandex exhibit visibly higher response times.
1) IPv4: Over IPv4 (Fig. 3 top), most resolvers exhibit simi-lar response time distributions, although we see some resolversperforming differently than others. For instance, around 40%of the samples for local resolvers have a DNS lookup timeof ≤10 ms, with roughly 83.5% of the samples taking up to100 ms. In comparison, each of the public resolvers respondswithin 10 ms for less than 20% of their successful responsesonly, except for Cloudflare (34.6%) and OpenDNS (25.2%),with Google (19.8%) slightly below 20%. At the 40th percentileof local resolvers, only Cloudflare achieves similar responsetimes with 11.2 ms; for the remaining 60% of the samples, localresolvers perform comparably to or worse than public resolvers.Thus, local resolvers exhibit more varying results in comparisonwith most public resolvers. Further, Yandex performs visiblyworse than any other public resolver (IQR of [40.2; 127.6] ms),however, note that Yandex primarily operates in Russia; this isalso reflected in its inflated path lengths for all non-EU probes.
2) IPv6: The measurements over IPv6 (Fig. 3 bottom) showsimilar distributions and differences between resolvers as overIPv4. Over IPv6, we observe that only around 33.4% of thelocal resolver responses return within 10 ms, although responsetimes of up to 100 ms are still achieved by 83.7% of the samples(83.5% over IPv4). Cloudflare responds to requests in less than40 ms for 93.5% of the cases over IPv6, making it one ofthe fastest public resolvers, followed by Google (90.6%) andOpenDNS (82.7%). Moreover, we observe that response timesfor CleanBrowsing are substantially shifted toward the higherend for around 40% of the samples, which suggests that itsIPv6 performance lags behind in some scenarios.
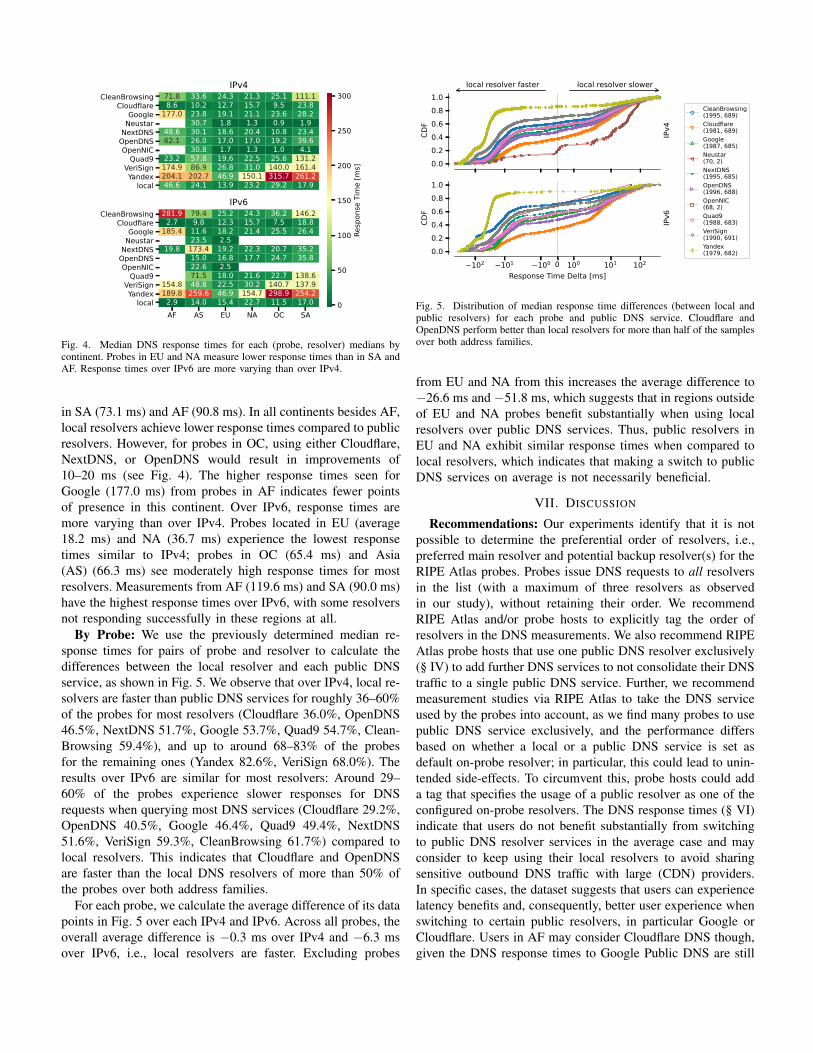
By Continent: Given the previous observations, we digdeeper by also taking regional distribution into account. Fig. 4depicts the median response times w.r.t. median response timesof probe and resolver pairs, aggregated by probe location(continent) for IPv4 (top) and IPv6 (bottom). Blank cellsrepresent areas in which probes could not resolve any domainsuccessfully. Note that the shown response times are medianvalues of the median response times by probe and, thus, notdirectly comparable to Fig. 3. Moreover, recall that the numberof samples for Neustar and OpenNIC are much lower anddistributed differently compared to the other resolvers (seeabove), which explains their unusual values seen in Fig. 4.
Over IPv4, we observe that probes in EU and NA exhibitmuch lower response times (18.4 ms and 29.6 ms on average)compared to other continents (where the averages range from50.6 ms up to 90.8 ms), particularly when compared to probes
CleanBrowsingCloudflare
GoogleNeustarNextDNSOpenDNSOpenNICQuad9
VeriSignYandexlocal
71.8 33.6 24.3 21.3 25.1 111.18.6 10.2 12.7 15.7 9.5 23.8
177.0 23.8 19.1 21.1 23.6 28.230.7 1.8 1.3 0.9 1.9
48.6 30.1 18.6 20.4 10.8 23.462.1 26.0 17.0 17.0 19.2 39.6
30.8 1.7 1.3 1.0 4.123.2 57.8 19.6 22.5 25.6 131.2174.9 86.9 26.8 31.0 140.0 161.4204.1 202.7 46.9 150.1 315.7 261.246.6 24.1 13.9 23.2 29.2 17.9
IPv4
AF AS EU NA OC SA
CleanBrowsingCloudflare
GoogleNeustarNextDNSOpenDNSOpenNICQuad9
VeriSignYandexlocal
281.9 79.4 25.2 24.3 36.2 146.22.7 9.8 12.3 15.7 7.5 18.8
185.4 11.6 18.2 21.4 25.5 26.423.5 2.5
19.8 173.4 19.2 22.3 20.7 35.215.0 16.8 17.7 24.7 35.822.6 2.571.5 18.0 21.6 22.7 138.6
154.8 48.8 22.5 30.2 140.7 137.9189.8 259.6 46.9 154.7 298.9 254.22.9 14.0 15.4 22.7 11.5 17.0
IPv6
0
50
100
150
200
250
300
Respon
se Tim
e [m
s]Fig. 4. Median DNS response times for each (probe, resolver) medians bycontinent. Probes in EU and NA measure lower response times than in SA andAF. Response times over IPv6 are more varying than over IPv4.
in SA (73.1 ms) and AF (90.8 ms). In all continents besides AF,local resolvers achieve lower response times compared to publicresolvers. However, for probes in OC, using either Cloudflare,NextDNS, or OpenDNS would result in improvements of10–20 ms (see Fig. 4). The higher response times seen forGoogle (177.0 ms) from probes in AF indicates fewer pointsof presence in this continent. Over IPv6, response times aremore varying than over IPv4. Probes located in EU (average18.2 ms) and NA (36.7 ms) experience the lowest responsetimes similar to IPv4; probes in OC (65.4 ms) and Asia(AS) (66.3 ms) see moderately high response times for mostresolvers. Measurements from AF (119.6 ms) and SA (90.0 ms)have the highest response times over IPv6, with some resolversnot responding successfully in these regions at all.
By Probe: We use the previously determined median re-sponse times for pairs of probe and resolver to calculate thedifferences between the local resolver and each public DNSservice, as shown in Fig. 5. We observe that over IPv4, local re-solvers are faster than public DNS services for roughly 36–60%of the probes for most resolvers (Cloudflare 36.0%, OpenDNS46.5%, NextDNS 51.7%, Google 53.7%, Quad9 54.7%, Clean-Browsing 59.4%), and up to around 68–83% of the probesfor the remaining ones (Yandex 82.6%, VeriSign 68.0%). Theresults over IPv6 are similar for most resolvers: Around 29–60% of the probes experience slower responses for DNSrequests when querying most DNS services (Cloudflare 29.2%,OpenDNS 40.5%, Google 46.4%, Quad9 49.4%, NextDNS51.6%, VeriSign 59.3%, CleanBrowsing 61.7%) compared tolocal resolvers. This indicates that Cloudflare and OpenDNSare faster than the local DNS resolvers of more than 50% ofthe probes over both address families.
For each probe, we calculate the average difference of its datapoints in Fig. 5 over each IPv4 and IPv6. Across all probes, theoverall average difference is −0.3 ms over IPv4 and −6.3 msover IPv6, i.e., local resolvers are faster. Excluding probes
0.00.20.40.60.81.0
CDF
local resolver faster local resolver slower
CleanBrowsing(1995, 689)Cloudflare(1981, 689)Google(1987, 685)Neustar(70, 2)NextDNS(1995, 685)OpenDNS(1996, 688)OpenNIC(68, 2)Quad9(1988, 683)VeriSign(1990, 691)Yandex(1979, 682)
−102 −101 −100 0 100 101 102Re−pon−e Time Delt [m−]
0.00.20.40.60.81.0
CDF
IPv4
IPv6
Fig. 5. Distribution of median response time differences (between local andpublic resolvers) for each probe and public DNS service. Cloudflare andOpenDNS perform better than local resolvers for more than half of the samplesover both address families.
from EU and NA from this increases the average difference to−26.6 ms and −51.8 ms, which suggests that in regions outsideof EU and NA probes benefit substantially when using localresolvers over public DNS services. Thus, public resolvers inEU and NA exhibit similar response times when compared tolocal resolvers, which indicates that making a switch to publicDNS services on average is not necessarily beneficial.
VII. DISCUSSION
Recommendations: Our experiments identify that it is notpossible to determine the preferential order of resolvers, i.e.,preferred main resolver and potential backup resolver(s) for theRIPE Atlas probes. Probes issue DNS requests to all resolversin the list (with a maximum of three resolvers as observedin our study), without retaining their order. We recommendRIPE Atlas and/or probe hosts to explicitly tag the order ofresolvers in the DNS measurements. We also recommend RIPEAtlas probe hosts that use one public DNS resolver exclusively(§ IV) to add further DNS services to not consolidate their DNStraffic to a single public DNS service. Further, we recommendmeasurement studies via RIPE Atlas to take the DNS serviceused by the probes into account, as we find many probes to usepublic DNS service exclusively, and the performance differsbased on whether a local or a public DNS service is set asdefault on-probe resolver; in particular, this could lead to unin-tended side-effects. To circumvent this, probe hosts could adda tag that specifies the usage of a public resolver as one of theconfigured on-probe resolvers. The DNS response times (§ VI)indicate that users do not benefit substantially from switchingto public DNS resolver services in the average case and mayconsider to keep using their local resolvers to avoid sharingsensitive outbound DNS traffic with large (CDN) providers.In specific cases, the dataset suggests that users can experiencelatency benefits and, consequently, better user experience whenswitching to certain public resolvers, in particular Google orCloudflare. Users in AF may consider Cloudflare DNS though,given the DNS response times to Google Public DNS are still

higher due to fewer points of presence in this region. However,users should also consider their individual trust relationshipsand tradeoffs between privacy and latency before switching.We find considerably high latencies over IPv6 for users in AFand SA for many resolvers and recommend providers of publicDNS services to strengthen peering in these regions.
Limitations and Future Work: The collected dataset in-herits a geographical bias of RIPE Atlas probe deployment,given the number of probes in some regions are fairly limited.Therefore, note that the measurement results are not necessarilygeneralizable to the whole Internet. In particular, the popularityof public DNS services is biased by the population of RIPEAtlas probe hosts (who typically have networking experience),which means that the prevalence and popularity is likely notfully representative of the general population. Further, the RIPEAtlas API not allowing traceroute measurements towardprivate IP address ranges prevents further distinction and limitsanalyses of local resolvers in this study; note that ICMPtraceroute packets may be treated differently by middleboxesthan the UDP-based DNS traffic as well. ISP resolvers can alsoforward a query to public DNS resolvers, however, character-izing such indirect use [45] is left for future work.
We acknowledge that DNS response times are only one pieceof a transmission sequence: The IP address returned for alookup, which we do not consider in our study, can point aclient to a closer or more distant endpoint, which impacts theoverall latency (see § II). However, as this is not the focusof this study, we plan to consider the quality of responsesregarding server selection as future work, especially in thecontext of anycast regarding both the resolver and the resolvedIP endpoint. Considering we only analyze successful DNSmeasurements in our study, the evaluation of non-successfulresults can additionally reveal regions and resolvers with highfailure rates or cases of DNS filtering and censorship (similar tothe DNS hijacking for NXDOMAIN responses discussed above).We plan to perform and include additional measurementsand analyses to also investigate recursive lookup behavior foruncached records and specific cases with exceptionally low orhigh response times, among other open questions.
VIII. CONCLUSION
Using DNS measurements from the RIPE Atlas platform,we determine the usage of public DNS services and find thataround a quarter (3k) of all 10.6k probes incorporate centralizedpublic DNS services for name resolution by default. We observeGoogle to be by far the most prevalent public DNS serviceconfigured in home networks, as it is configured in 78.4% ofthese probes. We perform a set of measurements toward localresolvers as well as ten centralized public DNS services overboth IPv4 and IPv6 across a two week time period to analyzethe performance of DNS resolvers. In addition, we also runtraceroute measurements toward the resolver endpoints todetermine IP and AS path lengths to the resolvers. We observethat local resolvers are closer to the probes, as expected,although public resolvers are also only either one or two AShops farther away from the probes, which suggests centralized
services moving closer to the edge as a result of Internetflattening. However, some paths in specific regions (mostlySA) are inflated. Generally, centralized public DNS services,in particular Google and Cloudflare, provide lower responsetimes over both address families. Nevertheless, local resolversare similarly fast, diminishing benefits of making a switch tocentralized public DNS services. In regions besides EU andNA, using local resolvers can offer substantial latency benefits(26.6 ms for IPv4 and 51.8 ms for IPv6 on average). In light ofobservations from previous work, we find this result intriguing;a causal reasoning requires further investigation.
Due to recent concerns about consolidation of Internetservices such as DNS, this paper adds to the understand-ing of public DNS services by quantifying their usage andbenefits. While local resolvers still account for the majorityand provide comparable performance to faster public resolvers(at least in EU and NA), this might change in the future:In particular, the increasing adoption of DNS over TLS andDNS over HTTPS [10] (mainly pushed by centralized publicDNS services) contributes to increasing DNS centralization,which poses many questions for future work. To facilitate theexploration of these open questions, we share the measurementIDs and analysis code with the community.
Acknowledgments. We thank Jeslin John (TUM), the RIPEAtlas support staff (RIPE NCC), and the volunteering probehosts for their valuable support regarding our measurementstudy. We also thank the anonymous reviewers and Mike Kosek(TUM) for their insightful feedback and suggestions.
REFERENCES
[1] J. Livingood, M. Antonakakis, B. Sleigh, and A. Winfield, “CentralizedDNS over HTTPS (DoH) Implementation Issues and Risks,” Tech. Rep.,Sep. 2019. [Online]. Available: https://datatracker.ietf.org/doc/html/draft-livingood-doh-implementation-risks-issues-04
[2] G. Huston, “DNS resolver centrality,” Sep. 2019, accessed 2021-Jan-21. [Online]. Available: https://blog.apnic.net/2019/09/23/dns-resolver-centrality/
[3] Z. Hu, L. Zhu, J. S. Heidemann, A. Mankin, D. Wessels, andP. E. Hoffman, “Specification for DNS over Transport LayerSecurity (TLS),” RFC, vol. 7858, 2016. [Online]. Available: https://doi.org/10.17487/RFC7858
[4] S. Dickinson, D. K. Gillmor, and T. Reddy, “Usage Profiles for DNSover TLS and DNS over DTLS,” RFC, vol. 8310, pp. 1–27, 2018.[Online]. Available: https://doi.org/10.17487/RFC8310
[5] R. Houser, Z. Li, C. Cotton, and H. Wang, “An Investigation onInformation Leakage of DNS over TLS,” in Conference on EmergingNetworking Experiments And Technologies. ACM, 2019, pp. 123–137.[Online]. Available: https://doi.org/10.1145/3359989.3365429
[6] T. V. Doan, I. Tsareva, and V. Bajpai, “Measuring DNS over TLS fromthe Edge: Adoption, Reliability, and Response Times,” in Passive andActive Measurement Conference, vol. 12671. Springer, 2021, pp. 192–209. [Online]. Available: https://doi.org/10.1007/978-3-030-72582-2_12
[7] P. E. Hoffman and P. McManus, “DNS queries over HTTPS(doh),” RFC, vol. 8484, pp. 1–21, 2018. [Online]. Available:https://doi.org/10.17487/RFC8484
[8] T. Böttger, F. Cuadrado, G. Antichi, E. L. Fernandes, G. Tyson, I. Castro,and S. Uhlig, “An Empirical Study of the Cost of DNS-over-HTTPS,”in Internet Measurement Conference. ACM, 2019, pp. 15–21. [Online].Available: https://doi.org/10.1145/3355369.3355575
[9] C. Lu, B. Liu, Z. Li, S. Hao, H. Duan, M. Zhang, C. Leng, Y. Liu,Z. Zhang, and J. Wu, “An End-to-End, Large-Scale Measurementof DNS-over-Encryption: How Far Have We Come?” in Internet
Measurement Conference. ACM, 2019, pp. 22–35. [Online]. Available:https://doi.org/10.1145/3355369.3355580
[10] C. T. Deccio and J. Davis, “DNS Privacy in Practice and Preparation,”in Conference on Emerging Networking Experiments And Technologies,2019, pp. 138–143. [Online]. Available: https://doi.org/10.1145/3359989.3365435
[11] A. Hounsel, K. Borgolte, P. Schmitt, J. Holland, and N. Feamster,“Comparing the Effects of DNS, DoT, and DoH on Web Performance,”in The Web Conference. ACM / IW3C2, 2020, pp. 562–572. [Online].Available: https://doi.org/10.1145/3366423.3380139
[12] R. Radu and M. Hausding, “Consolidation in the DNS resolvermarket – how much, how fast, how dangerous?” Journal ofCyber Policy, vol. 5, no. 1, pp. 46–64, 2020. [Online]. Available:https://doi.org/10.1080/23738871.2020.1722191
[13] RIPE NCC, “RIPE Atlas: A Global Internet Measurement Network,” inInternet Protocol Journal (IPJ) ’15, Sep. 2015, http://ipj.dreamhosters.com/wp-content/uploads/2015/10/ipj18.3.pdf.
[14] B. Ager, W. Mühlbauer, G. Smaragdakis, and S. Uhlig, “ComparingDNS Resolvers in the Wild,” in Internet Measurement Conference,M. Allman, Ed. ACM, 2010, pp. 15–21. [Online]. Available:https://doi.org/10.1145/1879141.1879144
[15] J. S. Otto, M. A. Sánchez, J. P. Rula, and F. E. Bustamante,“Content Delivery and the Natural Evolution of DNS: RemoteDNS Trends, Performance Issues and Alternative Solutions,” inInternet Measurement Conference, 2012. [Online]. Available: https://doi.org/10.1145/2398776.2398831
[16] J. Damas, M. Graff, and P. Vixie, “Extension mechanisms for DNS(EDNS(0)),” RFC, vol. 6891, pp. 1–16, 2013. [Online]. Available:https://doi.org/10.17487/RFC6891
[17] T. Callahan, M. Allman, and M. Rabinovich, “On Modern DNS Behaviorand Properties,” Computer Communication Review, vol. 43, no. 3, pp. 7–15, 2013. [Online]. Available: https://doi.org/10.1145/2500098.2500100
[18] G. Huston, “The Resolvers We Use,” Nov. 2014, accessed 2021-Jan-21.[Online]. Available: https://labs.ripe.net/Members/gih/the-resolvers-we-use
[19] M. Allman, “Comments on DNS Robustness,” in Internet MeasurementConference. ACM, 2018, pp. 84–90. [Online]. Available: https://doi.org/10.1145/3278532.3278541
[20] L. Zembruzki, A. S. Jacobs, G. S. Landtreter, L. Z. Granville,and G. C. M. Moura, “dnstracker: Measuring Centralizationof DNS Infrastructure in the Wild,” in Advanced InformationNetworking and Applications, ser. Advances in Intelligent Systemsand Computing, vol. 1151. Springer, 2020, pp. 871–882. [Online].Available: https://doi.org/10.1007/978-3-030-44041-1_76
[21] G. C. M. Moura, S. Castro, W. Hardaker, M. Wullink, and C. Hesselman,“Clouding up the Internet: how centralized is DNS traffic becoming?”in Internet Measurement Conference. ACM, 2020, pp. 42–49. [Online].Available: https://doi.org/10.1145/3419394.3423625
[22] E. Targett, “Firefox Will Default to Cloudflare’s Encrypted DNS-over-HTTPS Service,” Sep. 2019, accessed 2021-Jan-21. [Online]. Available:https://www.cbronline.com/news/firefox-dns-over-https
[23] S. Deckelmann, “Mozilla Blog: Firefox continues push to bring DNSover HTTPS by default for US users,” Feb. 2020, accessed 2021-Jan-21. [Online]. Available: https://blog.mozilla.org/blog/2020/02/25/firefox-continues-push-to-bring-dns-over-https-by-default-for-us-users/
[24] K. Baheux, “Chromium Blog: A safer and more private browsingexperience with Secure DNS,” May 2020, accessed 2021-Jan-21. [Online]. Available: https://blog.chromium.org/2020/05/a-safer-and-more-private-browsing-DoH.html
[25] D. Herrmann, C. Banse, and H. Federrath, “Behavior-based Tracking:Exploiting Characteristic Patterns in DNS Traffic,” Computers &Security, vol. 39, pp. 17–33, 2013. [Online]. Available: https://doi.org/10.1016/j.cose.2013.03.012
[26] M. Kirchler, D. Herrmann, J. Lindemann, and M. Kloft, “TrackedWithout a Trace: Linking Sessions of Users by Unsupervised Learningof Patterns in Their DNS Traffic,” in Workshop on ArtificialIntelligence and Security. ACM, 2016, pp. 23–34. [Online]. Available:https://doi.org/10.1145/2996758.2996770
[27] B. Greschbach, T. Pulls, L. M. Roberts, P. Winter, and N. Feamster,“The Effect of DNS on Tor’s Anonymity,” in Network andDistributed System Security Symposium. The Internet Society,2017. [Online]. Available: https://www.ndss-symposium.org/ndss2017/ndss-2017-programme/e-effect-dns-tors-anonymity/
[28] M. Sun, G. Xu, J. Zhang, and D. W. Kim, “Tracking You throughDNS Traffic: Linking User Sessions by Clustering with DirichletMixture Model,” in Conference on Modelling, Analysis and Simulationof Wireless and Mobile Systems. ACM, 2017, pp. 303–310. [Online].Available: https://doi.org/10.1145/3127540.3127567
[29] A. Klein and B. Pinkas, “DNS Cache-Based User Tracking,”in Network and Distributed System Security Symposium, 2019.[Online]. Available: https://www.ndss-symposium.org/ndss-paper/dns-cache-based-user-tracking/
[30] S. Bortzmeyer, “DNS privacy considerations,” RFC, vol. 7626, pp. 1–17,2015. [Online]. Available: https://doi.org/10.17487/RFC7626
[31] J. Arkko, B. Trammell, M. Nottingham, C. Huitema, M. Thomson,J. Tantsura, and N. ten Oever, “Considerations on Internet Consolidationand the Internet Architecture,” Internet-Draft, Jul. 2019. [Online].Available: https://datatracker.ietf.org/doc/html/draft-arkko-iab-internet-consolidation-02
[32] Internet Society, “Internet Society Global Internet Report: Consolidationin the Internet Economy,” 2019, accessed 2021-Jan-21. [Online].Available: https://future.internetsociety.org/2019/
[33] Neustar, “Neustar Announces Acquisition of Verisign’s PublicDNS Service,” Nov. 2020, accessed 2021-Jan-21. [Online].Available: https://www.home.neustar/about-us/news-room/press-releases/2020/neustar-announces-acquisition-of-verisigns-public-dns-service
[34] V. Bajpai, S. J. Eravuchira, and J. Schönwälder, “Lessons Learned FromUsing the RIPE Atlas Platform for Measurement Research,” ComputerCommunication Review, vol. 45, no. 3, pp. 35–42, 2015. [Online].Available: https://doi.org/10.1145/2805789.2805796
[35] T. Holterbach, C. Pelsser, R. Bush, and L. Vanbever, “QuantifyingInterference between Measurements on the RIPE Atlas Platform,”in Internet Measurement Conference, 2015. [Online]. Available:https://doi.org/10.1145/2815675.2815710
[36] V. Bajpai, S. J. Eravuchira, J. Schönwälder, R. Kisteleki, andE. Aben, “Vantage Point Selection for IPv6 Measurements: Benefits andLimitations of RIPE Atlas Tags,” in Symposium on Integrated Networkand Service Management. IEEE, 2017, pp. 37–44. [Online]. Available:https://doi.org/10.23919/INM.2017.7987262
[37] Q. Scheitle, O. Hohlfeld, J. Gamba, J. Jelten, T. Zimmermann,S. D. Strowes, and N. Vallina-Rodriguez, “A Long Way to the Top:Significance, Structure, and Stability of Internet Top Lists,” in InternetMeasurement Conference, 2018, pp. 478–493. [Online]. Available:https://doi.org/10.1145/3278532.3278574
[38] E. P. Lewis, “The Role of Wildcards in the Domain NameSystem,” RFC, vol. 4592, pp. 1–20, 2006. [Online]. Available:https://doi.org/10.17487/RFC4592
[39] B. Liu, C. Lu, H. Duan, Y. Liu, Z. Li, S. Hao, and M. Yang, “Who IsAnswering My Queries: Understanding and Characterizing Interceptionof the DNS Resolution Path,” in USENIX Security Symposium.USENIX Association, 2018, pp. 1113–1128. [Online]. Available: https://www.usenix.org/conference/usenixsecurity18/presentation/liu-baojun
[40] G. C. M. Moura, J. S. Heidemann, R. de Oliveira Schmidt, andW. Hardaker, “Cache Me If You Can: Effects of DNS Time-to-Live,” inInternet Measurement Conference. ACM, 2019, pp. 101–115. [Online].Available: https://doi.org/10.1145/3355369.3355568
[41] Y. Rekhter, B. G. Moskowitz, D. Karrenberg, G. J. de Groot, andE. Lear, “Address Allocation for Private Internets,” RFC, vol. 1918, pp.1–9, 1996. [Online]. Available: https://doi.org/10.17487/RFC1918
[42] R. de Oliveira Schmidt, J. S. Heidemann, and J. H. Kuipers, “AnycastLatency: How Many Sites Are Enough?” in Passive and ActiveMeasurement Conference, vol. 10176. Springer, 2017, pp. 188–200.[Online]. Available: https://doi.org/10.1007/978-3-319-54328-4_14
[43] D. Atkins and R. Austein, “Threat Analysis of the Domain NameSystem (DNS),” RFC, vol. 3833, pp. 1–16, 2004. [Online]. Available:https://doi.org/10.17487/RFC3833
[44] T. Arnold, J. He, W. Jiang, M. Calder, Í. Cunha, V. Giotsas, andE. Katz-Bassett, “Cloud Provider Connectivity in the Flat Internet,” inInternet Measurement Conference. ACM, 2020, pp. 230–246. [Online].Available: https://doi.org/10.1145/3419394.3423613
[45] G. C. M. Moura, J. S. Heidemann, M. Müller, R. de Oliveira Schmidt,and M. Davids, “When the Dike Breaks: Dissecting DNS DefensesDuring DDoS,” in Internet Measurement Conference. ACM, 2018, pp.8–21. [Online]. Available: https://doi.org/10.1145/3278532.3278534