Embed Size (px)
Citation preview

0
Evaluating populations derived from complex crosses
involving both bread wheat and durum wheat
parentage for partial resistance to crown rot
By
Domenico Deserio
A thesis submitted for the degree of
Master of Agricultural Science
at
The University of Adelaide
Faculty of Sciences
School of Agriculture, Food and Wine
Waite Campus
April 2014
1
Table of Contents
Table of Contents 1
List of Figures 3
List of Tables 4
Abstract 5
Declaration 6
Acknowledgements 7
Glossary of Abbreviations 9
1 Literature Review 11
1.1 Durum wheat 12
1.1.1 Origin and domestication of durum wheat 12
1.1.2 The genetics of durum wheat 13
1.1.3 Physiology and agronomy of durum wheat 15
1.1.4 Production 18
1.2 Fusarium and wheat diseases 18
1.2.1 Fusarium: an overview 19
1.2.2 Life cycle 21
1.2.3 Crown rot 23
1.2.4 Environmental factors 25
1.2.5 Economic aspects 28
1.3 Control of crown rot 29
1.3.1 Agronomic approaches 29
1.3.2 The use of breeding and biotechnology 31
1.4 Molecular approaches to understand crown rot 34
1.4.1 Molecular markers and applications 35
1.4.2 QTL and crown rot: what is known? 38
1.4.3 Towards improving crown rot partial resistance in durum 40

2
1.5 Rationale and significance 41
2 Materials and Methods 43
2.1 Germplasm 44
2.2 Seed multiplication, glasshouse conditions 45
2.3 DNA extraction and SNP assay 46
2.4 Bird-proof enclosure layout and environmental conditions 47
2.5 Inoculum viability and soil infestation 49
2.6 Phenotypic assessment 49
2.7 Infection and viability of Fusarium in the main stem of the plants 50
2.8 Grain yield 51
2.9 Statistical analysis of phenotypic data 51
2.10 Association analysis 51
2.11 SSR marker analysis 52
3 Results 54
3.1 Soil infestation and inoculum viability 55
3.2 Phenotypic assessment of crown rot severity 56
3.3 Yield of the lines under investigation 62
3.4 Infestation and viability of Fusarium infecting the main stem of the plants 64
3.5 Association analysis 67
3.6 SSR marker analysis 70
4. Discussion and conclusion 71
5 References 79

3
List of Figures
Figure 1 Production areas that are typically sown to durum 16
Figure 2 Symptoms of crown rot on durum 24
Figure 3 Typical MAS of a breeding program for disease resistance 34
Figure 4 Pedigree relationship for durum population investigated 45
Figure 5 Bird-proof enclosure layout 48
Figure 6 Crown rot assessment scale 50
Figure 7 Viability of Fusarium in the soil 55
Figure 8 Molecular analysis of Fusarium in the soil 56
Figure 9 Phenotypic assessment of CR severity 60
Figure 10 ‘Yield X CR score’ scatter plots 64
Figure 11 Viability of Fusarium infecting the main stem 65
Figure 12 Molecular analysis of Fusarium isolated infecting the main stem 66
Figure 13 GenomeStudio charts 67

4
List of Tables
Table 1 Example of diseases caused by Fusarium species 20
Table 2 Optimum climate parameters for F. graminearum, F. pseudograminearum
and F. culmorum collected in Australia 26
Table 3 Partially resistant lines identified across all the populations studied 61
Table 4 Yield losses between NI and I treatments 62
Table 5 Association analysis across all the families 69
Table 6 Published QTL for partial resistance to CR 70

5
Abstract
Crown rot in durum, caused by Fusarium pseudograminearum and
Fusarium culmorum, can reduce yields up to 90% in seasons characterised by
limited spring rainfall. To decrease this potential loss, breeding of partially
resistant cultivars could complement agronomic approaches. However, the limited
variation in durum has meant that development of partially resistant lines is still a
major objective to overcome. The aim of this study was to evaluate, through
genotypic and phenotypic-based approaches, durum lines with partial resistance to
crown rot. The germplasm under study consisted of 252 durum lines obtained by
crossing durum parents with partially resistant bread wheat varieties. Phenotypic
assessment of the symptoms, accomplished by visual assessment of the fungal
necrosis of the stems, led to the identification of 120 partially resistant lines.
Genotypic assessment, performed through a SNP array, identified associations
between marker genotype and crown rot severity for the family originating from
the parents EGA Bellaroi 38a and Sumai 3. Moreover, the frequency of QTL for
crown rot partial resistance already published was investigated in the populations
under study through the multiplex ready PCR technique. These findings confirm
that bread wheat varieties can be exploited to reduce crown rot severity in durum.

6
Declaration
The presented thesis does not contain any material already accepted for the award
of any other degree or diploma in any University or tertiary institution. To the best
of my knowledge and belief, this work does not contain material already
published, excepted for everything that is cited.
I give consent to this copy of the thesis when deposited in the University Library,
being available for loan and photocopying, subject to the provisions of the
copyright Act 1968.
The author acknowledges that copyright of the published works contained within
this thesis resides with the copyright holder(s) of those works.
Domenico Deserio
December 2013

7
Acknowledgements
At the end of this challenging journey, I would like to thank my principal
supervisor, Dr Jason A. Able, for his precious advice, practical and moral support.
Moreover, I wish to acknowledge the meticulous and patient supervision of
Professor Diane Mather, who has helped me approaching the genotypic analysis.
I would like to thank also the University of Adelaide, the School of
Agriculture, Food and Wine and the Australian Centre for Plant Functional
Genomics, especially Professor Peter Langridge for the opportunity to study in
Australia. Furthermore, I wish to acknowledge the significant technical support of
the Prof. Mather’s ‘Marker Lab’ staff (Elysia Vassos, Rebecca Fox, Genet
Mekuria, Greg Lott, Shashi Goonetilleke and Kelvin Khoo). Additionally, I would
like to express my gratitude to all the members of the ‘Able Lab’ and to
A/Professor Amanda Able.
The present work has been possible thanks to the help of the seed provider
Dr Gururaj Kadkol (New South Wales Department of Primary Industry), the
advice of A/Professor Hugh Wallwork and staff (South Australian Research and
Development Institute), the suggestions of Professor Eileen Scott and the supply
of biological material by Dr Cassandra Malligan (Leslie Research Centre,
Toowoomba, Queensland).
As a scholarship recipient, my gratitude goes to all the people and
institutions that allowed this experience. Particularly, I thank the Apulia Region
for the scholarship ‘Ritorno al Futuro – Sud Australia’, Dr Nicola Sasanelli for
support, help and welcome to Australia. Moreover, I express my gratitude to Dr
Angelo Visconti and Dr Antonio Moretti (Institute of Science of Food Production,

8
CNR, Bari) for the opportunity and scientific support. Finally, a huge and warm
thank you to Dr Federico Baruzzi, Dr Leonardo Caputo, Dr Maria Morea and (last
but not least!) Dr Laura Quintieri, for their regular support despite the distance
during my time in Australia, and since the very beginning of my scientific
experience which started 10 years ago.
This achievement would not have been possible to reach without the
support that my parents gave me from the other side of the world. I’m also
grateful to my brother and his family, my grandmother, my uncles and cousins,
and all of my friends back home to whom I have felt close to during these years.
Thank you to all my new friends in Australia, all the people that lived with me
during this deep experience, sharing the precious value of friendship far away
from home.
Above all, this is for you, N.

9
Glossary of Abbreviations
Abbreviation Full term
AGRF Australian Genome Research Facility
ANOVA Analysis of variance
ASOs Allele-specific oligonucleotides
AUD Australian Dollars
cDNA Complementary deoxyribonucleic acid
CGIAR Consultative Group for International
Agricultural Research
CIMMYT International Maize and Wheat
Improvement Centre
CR Crown rot
DArT Diversity arrays technology
DNA Deoxyribonucleic acid
EDTA Ethylenediaminetetraacetic acid
EST Expressed sequence tags
FHB Fusarium Head Blight
GxE Genotype by environment
I Inoculated treatment
IARCs International Agricultural Research Centre
ICARDA International Centre for Agricultural
Research in the Dry Areas
LOD Logarithm of odds
LSD Least significant difference
LSO Locus specific oligonucleotide
MAS Marker assisted selection
mRNA messenger ribonucleic acid

10
Abbreviation Full term
MRT Multiplex Ready Technology
NI Not inoculated treatment
PCNB Pentachloronitrobenzene
PCR Polymerase chain reaction
PDA Potato Dextrose Agar
Ph1 Pairing homoeologous 1
QTL Quantitative trait loci
R Correlation coefficient
RCF Rotation centrifugal force
RFLP Restriction fragment length polymorphism
S Susceptible line
SARDI South Australian Research and
Development Institute
SNP Single nucleotide polymorphism
SSR Simple sequence repeat
11
1 LITERATURE REVIEW

12
1.1 Durum wheat
1.1.1 Origin and domestication of durum wheat
Durum wheat evolved in the area of eastern Mediterranean and north-eastern
Africa as a result of a cross between the diploid wheat Triticum monococcum
(genome AA) and an unknown species (genome BB). Although this type of cross
usually leads to sterile and/or diploid progeny, amphiploidy occurred and
tetraploid wheat evolved (Luo et al. 2007; Dvorak et al. 2011). Hexaploidization
also occurred, taking place spontaneously through an alloploid cross between the
tetraploid durum wheat (Triticum turgidum, genome AABB) and the diploid
Aegilops tauschii ssp. strangulata (genome DD) (Dvorak et al. 1998; Luo et al.
2007).
Prior to the domestication of tetraploid wheat, emmer (T. turgidum spp.
dicoccoides) was the most widespread wheat, with records dating back to about
9,600 to 9,000 years ago in the Middle East (Nesbitt and Samuel, 1996; Luo et al.
2007). The precise localisation of the first domestication of the tetraploid wheat,
then the evolution of durum wheat (T. turgidum spp. durum) from emmer wheat,
has been indicated by Nesbitt and Samuel (1996) as the southern Levant and
south-eastern Turkey. Molecular studies have been carried out to discover exactly
which region of the Middle East has been involved in this evolution but the results
have been found to be often discordant. In fact, although Mori et al. (2003)
localised, through DNA analysis, this domestication in the Turkish region Kartal
Dagi, Ozkan et al. (2005) and Luo et al. (2007) suggested that the area of interest
is Karaca Dag.
Successful domestication of durum wheat is principally due to several
characteristics acquired and selected throughout the years, which have made it

13
more suitable than landraces and wild progenitors for harvesting as an agricultural
crop of importance. One of these characteristics is yield improvement due to the
reduction of spike shattering, which in emmer wheat is controlled by genes
located on chromosomes 3A and 3B (brittle rachis loci) (Nalam et al. 2006;
Dubcovsky and Dvorak, 2007). Spike shattering had previously been an important
trait that allowed the easy release of the seed into the environment for the
dissemination of wild wheat (Nalam et al. 2006; Dubcovsky and Dvorak, 2007).
Another advantage acquired by durum wheat through domestication is the loss of
glume hardness, which subsequently made the spike suitable for free-threshing
(Jantasuriyarat et al. 2004; Dubcovsky and Dvorak, 2007). Other characteristics
acquired by durum are the reduction in tiller number, seed dormancy, more erect
plant form and increased seed size (Dubcovsky and Dvorak, 2007). Even though
the domestication of the durum wheat has reduced the biodiversity of the cultivars
(bottleneck effect), the loss of variability of the genomes, especially for
quantitative trait, is compensated by the polyploidy with the abundance of
repetitive elements (Dubcovsky and Dvorak, 2007).
1.1.2 The genetics of durum wheat
Genetically, wheat species are grouped into three categories: diploids with
genome A (2n=2x=14; e.g. T. monococcum), tetraploids with genomes A and B
(2n=4x=28; e.g. T. turgidum) and hexaploid (2n=6x=42; e.g. Triticum aestivum),
constituted by the genomes A, B and D (Chantret et al. 2005). Several phenotypic
characteristics are related to specific genome(s), consequently the different
arrangement of genomes gives distinguishing features to the different species. For
instance, in hexaploid wheat, variation in grain hardness is controlled by the Ha
locus of chromosome 5D, a locus that is absent in diploid and tetraploid species

14
(Turner et al. 1999). These genomic differences occur despite the common
ancestral origin of the genomes.
Polyploidisation of the wheat genome has resulted in the reorganisation of
non-coding DNA, epigenetic changes, DNA methylation rearrangements and
modified gene expression regulation (for example silencing or reducing the
transcription of redundant genes) (Ozkan et al. 2001; Kashkush et al. 2002).
Diploid-like behaviour during meiosis is a result of what is known as the pairing
homoeologous 1 (Ph1) locus, which has been isolated to a region located on the
long arm of chromosome 5B (Griffiths et al. 2006; Al-Kaff et al. 2008). The Ph1
locus tightly regulates chromosome pairing behaviour, and in the absence of this
locus, homoeologous chromosome associations have been shown (for example,
chromosome 1A could potentially pair with either 1B or 1D) (Al-Kaff et al. 2008;
Able et al. 2009). Moreover, Ozkan et al. (2001) declared that, in the preservation
of the diploid-like behaviour, the Ph1 effect has also been enhanced by the
elimination of several genome specific sequences and chromosome specific
sequences. As a consequence, and although the chromosomes in each of these
genomes are similar with respect to gene content and gene order, during meiosis
chromosomes will only pair with their homologue.
Another source of variability among the genomes A, B and D is provided
by the broad presence of retrotransposons that, replicating themselves in other loci
of DNA through mRNA intermediates, have a role in the stabilisation of
mutations that may occur, and in the inactivation of the redundant genes among
the genomes (Kumar and Bennetzen 1999; Gu et al. 2004). The majority of the
retrotransposons occurred after the divergence of the three wheat genomes, as
suggested by the low level of colinearity, and they have provided a useful source

15
for evolutionary study of the three wheat’s genomes through comparison between
orthologous and homologous DNA regions (Anderson et al. 2003).
With potentially two or three copies of each locus, duplication (in the case
of durum wheat) and triplication (in hexaploid wheat) of loci has conferred
significant evolutionary advantages (Kashkush et al. 2002). In fact, the added
genomes made the polyploids more suitable than the diploids to adapt in different
habitats, allowing for broad levels of genetic diversity and heterozygosity, hence
partially compensating the loss of biodiversity of domesticated wheat (Matsuoka
2011; Soltis and Soltis 2000).
To sustain a high level of variability even in the modern cultivar, several
international organisations play an important role in sustaining a high level of
variability in domesticated wheats. A broad network called the Consultative
Group for International Agricultural Research (CGIAR) has been established by
different Agricultural Research Centres (IARCs), such as the International Maize
and Wheat Improvement Centre (CIMMYT) of Mexico and the International
Centre for Agricultural Research in the Dry Areas (ICARDA) of Syria (Reynolds
and Borlaug 2006). These organisations aim to coordinate the agricultural efforts
in the development and spread of new crop varieties (including durum wheat), and
provide ‘storage facilities’ of landraces and wild progenitors of modern crops.
1.1.3 Physiology and agronomy of durum wheat
Production of durum is manly limited to areas which are typically characterised
by a Mediterranean climate (such as Europe, North Africa, Australia), but it is
also tilled in other areas such as North America (Connell et al. 2004). On the
contrary, bread wheat has a greater ability to adapt to different environments,
making this species much more widespread (Matsuoka, 2011). During the

16
Australian growing season, durum requires rainy and mild winters, warm days
and cold nights, fertile soils and dry conditions around the grain filling stage.
Within Australia, climates like these occur in some areas of Queensland, New
South Wales, Victoria, South Australia and Western Australia. However durum is
predominantly grown in New South Wales, Queensland and South Australia (Fig.
1; Connell et al. 2004).
Fig. 1. Production areas that are typically sown to durum. Areas shaded include
South-East Queensland, Northern New South Wales, and South Australia (across to the
border of Victoria) (Source: Australian Wheat Board Ltd).
The life cycle of durum wheat is constituted by a continuity of vegetative,
reproductive and grain filling phases, with the timing of these processes being
tightly related to a genotype by environment (GxE) interaction (Satorre and
Slafer, 1999).
For durum breeding programs yield and yield stability are among the most
important traits that need continual monitoring and improvement. Yield is a very
complex trait and, in durum wheat, it is influenced by the interaction between
environment and several quantitative trait loci (QTL). This has been proved by

17
Maccaferri et al. (2008) by finding 16 different QTL in a population of 249
recombinant inbred lines grown in 16 Mediterranean environments differing in
thermal requirements and water availability conditions. Of the 16 QTL identified,
14 were discovered in the same environment, while the remainder were found in
different combinations in three or more environments. This variability makes
breeding for yield per se very time consuming and complex.
The durum grain is typically large, golden and hard, the hardest of all
wheat species (Connell et al. 2004). This characteristic is due to the hardness of
the endosperm that, during milling, allows for the production of the semolina,
used to make spaghetti, pasta and couscous. In contrast the bread wheat
endosperm breaks down during milling and results in ordinary flour (Connell et
al. 2004). In durum wheat, grain quality attributes such as protein content,
moisture, gluten strength and seed weight (typically measured as thousand grain
weight) are correlated with the firmness, springiness and stability of the pasta and
other products (Troccoli et al. 2000; Sharma et al. 2002; Gianibelli et al. 2005).
To enhance yield and quality of durum wheat, appropriate agronomic
management is required, particularly with respect to soil nutrition and nitrogen
availability for the crop (López-Bellido et al. 2006). The ability of durum wheat to
take up nitrogen is related to the genotype and to the timing of nitrogen
application (Limaux et al. 1999). This timing has been further emphasised by
Lopez-Bellido et al. (2006), who reported that the period between tillering and the
formation of the first node is the most suitable for nitrogen application.

18
1.1.4 Production
Durum holds a minor but important position in the global wheat market, and
consequently is exported and processed among numerous countries. In the seasons
from 2009-10 to 2012-13 (data for 2013 is a forecast), an average of 36.9 million
tonnes per year of durum was produced, which was approximately 5.5% of the
world’s wheat production (Ponzielli 2013). During these seasons, the main
producers of durum were the European Union (23% of world production) and
North America (18.2%); while Australia produced approximately 1.4% (Ponzielli
2013). Although the amount of durum produced in Australia is comparatively
low, it has been recognised as high quality and is exported to several countries
including Italy (Troccoli et al. 2000; Connell et al. 2004).
1.2 Fusarium and wheat diseases
Of the many fungi that can cause plant disease, those belonging to the genus
Fusarium have been reported to infect 81 of the 101 most economically important
plant species, including wheat (Leslie and Summerell 2006). Fusarium diseases,
such as Fusarium head blight (FHB) and crown rot (CR), may occur in different
stages of plant growth, depending on the host involved and the fungal species.
While FHB is principally due to Fusarium graminearum, CR is mostly caused by
Fusarium pseudograminearum and Fusarium culmorum (Williams et al. 2002;
Backhouse et al. 2004; Burgess and Bryden, 2012). The incidence of these
diseases has risen in the last few years, partially due to farming practices such as
stubble retention (MacLeod et al. 2008; Moretti and Susca, 2009).
19
1.2.1 Fusarium: an overview
Belonging to the phylum Ascomycota, class Ascomycetes and order Hypocreales,
the genus Fusarium includes several toxigenic and phytopathogenic species that
colonise a wide range of host plants (Burgess and Bryden, 2012). The biodiversity
of the genus Fusarium allows it to colonise different environments, to act as a
pathogen or opportunist agent on different crop types (Table 1; Moretti and Susca,
2009). Among Fusarium species, F. pseudograminearum and F. culmorum are
highly aggressive pathogens and are the causal agent of CR in wheat (Burgess et
al. 2001; Williams et al. 2002; Backhouse et al. 2004). F. graminearum, another
species, results in mycotoxin production, including deoxynivalenol (DON)
(Mudge et al. 2006; Covarelli et al. 2012). The sexual stage of F.
pseudograminearum, Gibberella coronicola, can be important for its life cycle
and pathogenicity. However, this sexual stage rarely occurs in the field, making
clonal reproduction important for F. pseudograminearum (Aoki and O'Donnell
1999; Summerell et al. 2001; Bentley et al. 2008).

20
Table 1. Example of diseases caused by Fusarium species. The biodiversity of
Fusarium species is highlighted by the broad range of diseases that they cause and the
variability of the hosts affected. The symptoms of Fusarium diseases are usually related
to colour anomalies and, in some cases, the production of mycotoxins (readapted from
Burgess and Bryden 2012).
Species Disease Symptoms Mycotoxins in
grain
F. graminearum Head blight of wheat
and barley
Blighted spikelets, pink mouldy
grain
Deoxynivalenol
F. graminearum
Stalk and cob rot of
maize
Rotted stalks and pink mouldy
kernels
Deoxynivalenol
Zearalenone
F. verticilloides
Stalk and cob rot of
maize
Rotted stalk and white mouldy
kernels
Fumonisin group
F. pseudograminearum
Crown rot of wheat and
barley
Browing of stem base, crown
rot, whiteheads
Rarely affect
heads
F. culmorum
Crown rot of wheat and
barley
Browing of stem base, crown
rot, whiteheads
Rarely affect
heads
F. oxysporum f.sp.
cubense
Vascular wilt of banana Wilting, vascular browing,
death
n.a.
F. oxysporum f.sp.
vasinfectum
Vascular wilt of cotton
Wilting, vascular browing,
death
n.a.
F. circinatum
Pitch canker complex of
Pinus species
Cankers exuding resin, dieback,
death
n.a.
F. fujikurol
Bakanae disease of rice
Stem elongation and crown rot
n.a.

21
Fusarium taxonomy has always been complex, with many unsolved issues.
In this respect, F. pseudograminearum was previously considered F.
graminearum group 1 (Aoki and O'Donnell 1999), due to morphological traits
resembling those of F. graminearum which was denoted group 2. Indeed,
Fusarium taxonomy has long been based on morphology: including the features
of the macroconidia (septation and production in the aerial mycelium or in the
sporodochia), microconidia (production in the aerial mycelium) and
chlamydospores (intercalary and with thickened walls) (Leslie and Summerell
2006). Nucleic acid based methods have shown that F. pseudograminearum is a
separate species: with studies on DNA sequences (Aoki and O'Donnell 1999),
molecular markers such as restriction fragment length polymorphisms (RFLP)
(Benyon et al. 2000) and isozymes (Láday et al. 2000) all confirming this. Further
support in this evaluation is provided by the differentiation between the
heterothallic nature of F. pseudograminearum (teleomorph: G. coronicola),
characterised by two mating types (male and female), and the homothallic nature
of F. graminearum, that is self-fertile (teleomorph: Gibberella zeae) (Aoki and
O'Donnell 1999).
1.2.2 Life cycle
The life cycle of the Fusarium species is strictly connected to the mode of
reproduction, since it may lead to different levels of genetic variability of the
species, different aetiology of the CR, and therefore, have a different impact on
infecting crops such as durum wheat. Although the sexual stage for F.
graminearum and F. pseudograminearum have been characterised, no sexual
stage is known in Fusarium culmorum (Miedaner et al. 2008).

22
G. Zeae frequently spreads through the air via its ascospores (sexually
reproduced) that are essential for its pathogenicity, which is contrary to G.
coronicola where production of perithecia (which contains ascospores) in the field
is infrequent (Summerell et al. 2001), thus influencing the dissemination of
Fusarium diseases. This is probably due to the fact that, to produce perithecia, the
heterothallic nature of G. coronicola requires the presence of both the mating
types in the same infected plant (Summerell et al. 2001). While the homothallic
nature of G. Zeae, which contain the male and female structures on the same
individual, enhances the likelihood that sexual reproduction occurs in the field
(Aoki and O'Donnell, 1999). Moreover, the timing of the production of perithecia
and ascospores may affect at what stage of plant growth the disease occurs
(Summerell et al. 2001).
Although sexual reproduction of Fusarium species may improve their
aggressiveness, even macroconidia (spores produced asexually) have an important
role in the spreading of infection in durum wheat crops, especially during the
growing season (Desjardins et al. 2004; Hayden et al. 2005). During the asexual
stage of Fusarium species, the canoe-shaped macroconidia are produced by the
sporodochia and splash-dispersed over a short distance (Burgess and Bryden,
2012). Although the sexual reproduction of G. zeae and G. coronicola is less
frequent than asexual stage, several studies showed that macroconidia are less
frequently detected from the field than ascospores. Trail et al. (2002) traced this
back to the fact that, although ascospores are spread by wind once produced,
macroconidia may be held in the sporodochia.

23
1.2.3 Crown rot
F. pseudograminearum and F. culmorum are the main casual agents responsible
for CR in Australia. Other Fusarium species are involved as secondary pathogens,
including F. acuminatum, F. avenaceum, F. crookwellense and F. equiseti
(Burgess et al. 2001; Williams et al. 2002; Backhouse et al. 2004).
The common aetiology that is shared by FHB and CR has led researchers
to conduct studies in parallel focussing on not just the pathology of the diseases
but also the genetic mechanisms involved in plant resistance (Chakraborty et al.
2006; Li et al. 2010). Both FHB and CR can cause significant (>50%) yield loss
in durum wheat. Although some of the drier environments in which durum wheat
is usually sown will reduce the incidence of FHB, it has been detected in some
areas of North Dakota, Canada and Australia (Clear and Patrick, 2000; Southwell
et al. 2003; Vijayakumar et al. 2005). While FHB can cause substantial yield loss
in durum, it is not widespread in Australia. It has been present, (season dependent)
in limited areas of Queensland and northern New South Wales (Southwell et al.
2003).
Susceptibility to CR is of more concern as all durum varieties (at least
those grown in Australia) are either susceptible or very susceptible to this disease
and it is widespread in Australia (Wildermuth et al. 1997; Burgess et al. 2001;
Backhouse et al. 2004; Wallwork et al. 2004; Miyan et al. 2013). The disease also
occurs in Europe (Rossi et al. 1995; Pettitt and Parry 2001; Pettitt et al. 2003),
North America (Fernandez and Zentner, 2005; Smiley et al. 2005), West Asia,
North Africa (Nicol et al. 2004) and South Africa (Lamprecht et al. 2006). The
amount of inoculum of the CR pathogens, F. pseudograminearum and F.
culmorum, has a central role in the aetiology of the disease (Williams et al. 2002;
Backhouse et al. 2004). CR is more likely to occur in durum wheat if it is sown

24
after other susceptible crops (for example, bread wheat), after long-term grass
pastures, if the previous season’s stubble is retained (CR affected residues can
persist for at least two years), if dry conditions occur in the spring during grain fill
and/or if humid weather persists while the disease develops (MacLeod et al.
2008).
MacLeod et al. (2008) described the phenotypic symptoms of CR as the
colour aberration of the crown and lower stem that assume a honey-brown, dark
brown or even pink discoloration (Fig. 2 c). The presence of whiteheads in the
field has also been linked to CR, particularly when the remainder of the crop is
comparatively green in colour during grain fill. The fungal colonisation of the
stem reduces water and nutrients uptake resulting in poor grain fill (Fig. 2 a;
MacLeod et al. 2008).
a) b) c)
Fig. 2. Symptoms of CR on durum. Fusarium species, through the colonisation of root
and stem, seem to reduce the uptake of water. This has been linked to the presence of
whiteheads prior to crop maturity when the non-infected plants are still green (a). Non-
infected (b) and infected (c) main stems are compared.

25
1.2.4 Environmental factors
As mentioned in section 1.2.3, severity, frequency and likelihood of CR are
related to the environment, rainfall patterns, soil moisture, crop nutrition and the
amount of stubble retention. A large number of studies have supported the theory
that the rainfall and temperature influence the occurrence of Fusarium species.
Backhouse and Burgess (2002) collected data related to the optimal climate
conditions for growth of F. pseudograminearum and F. culmorum, the major CR
agents, and F. graminearum (Table 2), which in some cases has been shown to be
involved in CR aetiology (Akinsanmi et al. 2004). Their data demonstrated that
environmental conditions may affect which pathogen will be involved in CR
occurrence since, among the three Fusarium species cited, there are different
optimum growth conditions (Table 2). In fact, Backhouse and Burgess (2002)
reported that a pattern of high rainfall and low temperatures promotes the
incidence of the fungus F. culmorum, whereas moderate temperatures and rainfall
usually increases the incidence of F. pseudograminearum (Table 2). F.
graminearum has its optimum growth conditions at rainfall patterns and
temperatures higher than both F. pseudograminearum and F. culmorum (Table 2;
Backhouse and Burgess 2002).

26
Table 2. Optimum climate parameters for F. graminearum, F. pseudograminearum
and F. culmorum collected in Australia. The values indicate the ranges of temperature
and rainfall patterns with the means in parentheses (Backhouse and Burgess 2002).
Climate parameter
F. graminearum F. pseudograminearum F. culmorum
Temperature
Average annual (°C) 13.1-(18.2)-21.9 13.6-(17.0)-19.9 13.3-(16.3)-18.7
Min. of coldest month (°C) 0.6–(4.8)–10.9 0.1–(3.2)–6.2 1.3–(3.4)–6.2
Max. of warmest month (°C) 23.9–(29.2)–33.5 26.6–(31.4)–34.8 24.1–(29.8)–31.9
Rainfall
Annual (mm) 343–(941)–1881 243–(510)–828 335–(564)–759
Wettest month (mm) 35–(147)–389 31–(65)–124 35–(76)–103
Driest month (mm) 9–(36)–66 8–(26)–42 12–(25)–35
Moisture is another important consideration that can effect CR severity in
two ways: soil moisture and plant water potential. While wet soils will typically
favour Fusarium growth and the colonisation of the plant by the fungus, dry soils
will invariably reduce Fusarium inoculum (Liddell and Burgess 1988). Liddell
and Burgess (1988) declared that moisture under the saturation level (within an
optimal osmotic potential between -0.3 and -0.7 MPa) allows Fusarium species to
grow in optimal osmotic condition, giving them a competitive advantage over
other microorganisms in the up-take of nutrients. Nevertheless they confirmed that
near the saturation level (within an osmotic potential range between -0.1 and 0.0
MPa), oxygen availability decreases which then promotes the growth of
microaerobic and anaerobic bacteria. Contrary to soil moisture, the availability of
water for the plant is inversely proportional to the likelihood of CR occurrence
(Beddis and Burgess, 1992). This is due to the stress condition of the plant that
plays a major role in the equilibrium between disease and resistance. In fact, as

27
Champeil et al. (2004) and Burgess and Bryden (2012) reported, the severity of
infection of F. culmorum and F. pseudograminearum is higher in drought (or
water-limiting) environments. For instance, if a rainy season occurs, the soil
moisture would be high, promoting the growth of Fusarium species. On the other
hand, if the wet soil provides optimal conditions for the plants, this would
improve the plant vigour, making the symptoms of the disease less severe.
Another environmental factor that may influence incidence of CR is crop
nutrient availability, especially zinc and nitrogen. Khoshgoftarmanesh et al.
(2010) reported that adequate Zn availability can reduce Fusarium CR in bread
wheat and durum wheat through enhancement of the cell membrane’s integrity.
Other nutrients that have been reported to also play a role include nitrogen and
phosphorus. Too much nitrogen during the growing season may lead the plant to
grow too fast vegetatively early in the season which could, in turn, increase its
chances of being more susceptible to CR later in the season if there is a dry spring
with limited rainfall (Kirkegaard et al. 2004).
The development and persistence of CR in the last two decades has been
exacerbated through stubble retention. Fusarium species are able to survive in the
stubble even beyond two years, which then becomes a source of infection across
different seasons (MacLeod et al. 2008). Two important factors contribute to
inoculum load: the biomass of stubble produced and the decomposition rate of the
stubble (Backhouse, 2006). This cross-contamination, common in soilborne
diseases hence defined as ‘polyetic’, results in the incidence of CR to rise across
years until it reaches a plateau (Zadok, 1999; Backhouse, 2006). While the initial
inoculum may be reduced by wet weather conditions through the acceleration of
stubble breakdown (Zadok, 1999; MacLeod et al. 2008), the high influence which
the initial inoculum has on the disease incidence leads CR to be defined as a

28
monocyclic disease (Burgess et al. 1993). In order to reduce the losses related to
CR, the stubble management (for instance ploughing or burning) is considered
important as it has been shown to reduce inoculum through enhanced stubble
breakdown.
1.2.5 Economic aspects
Several reports confirm the direct connection between CR severity and yield loss.
Smiley et al. (2005) estimated that in some areas of the USA, the yield reduction
due to CR in commercial fields of winter and spring wheat has been up to 35%.
They compared these data with those obtained in experiments inoculated with F.
pseudograminearum and it led them to the conclusion that, even if in commercial
fields the yield reduction was less severe than in the inoculated field trials, CR has
a potential to reduce yield by up to 61%. In Australia the situation is analogous,
with losses related to CR in wheat having been estimated to reach as high as AUD
83 million per year, 95% of these due to F. pseudograminearum, 5% to F.
culmorum (Murray and Brennan, 2009). In fact studies carried out in New South
Wales using the individual tiller method have determined yield reduction by up to
89% (Klein et al. 1991). In Australia, the states with the highest frequency of loss
due to CR are Queensland, New South Wales and South Australia (Williams et al.
2002). Daniel and Simpfendorfer (2008) performed trials in New South Wales and
Queensland, sowing durum wheat in soil infected by F. pseudograminearum. The
yield reduction of durum wheat averaged 58%, and reached 90% for the most
susceptible varieties.
The awareness of the economic damage caused by CR has led scientists to
direct their studies from the examination of the aetiology towards working on
understanding the mechanisms of resistance involved.

29
1.3 Control of crown rot
Compared with resistance to other plant diseases such as FHB, resistance to CR is
still not well understood (Li et al. 2010). Li et al. (2010) investigated if FHB-
resistant germplasm of hexaploid wheat may benefit the research based on CR
resistance through understanding whether the same genes are involved. They
assessed the resistance of the same genotypes to FHB and to CR and did not
discover any relationship. In addition, they investigated potential loci that confer
resistance to FHB and CR through QTL analysis and showed that they were
located on different chromosomes.
1.3.1 Agronomic approaches
Agronomic approaches aimed to reduce CR incidence have included crops which
are non-host to CR in rotations for at least two seasons before re-sowing with a
susceptible crop in the same field (Burgess et al. 2001), weed control, reduction of
moisture stress (sowing rates not too high, control of growth, addition of fertiliser
in relation to water availability), improving soil nutrition (especially zinc), sowing
in inter-rows, and stubble management (MacLeod et al. 2008). These practices
have been shown to reduce the incidence of CR and the potential level of
inoculum present, ensuring that the plant is less likely to be stressed.
As infected stubble is the primary source of inoculum (Backhouse, 2006;
MacLeod et al. 2008), agricultural approaches to reduce CR should therefore be
aimed at stubble management from season to season. One method, which involves
ploughing the stubble, may reduce the soil infestation of F. pseudograminearum
and F. culmorum respectively by 33% and 40% (Paulitz et al. 2010). However,
Burgess et al. (1993) have clearly demonstrated that this method of stubble
management does little to reduce the likelihood of CR infection. More effective

30
control measures, such as burning the stubble, have led to moderately successful
results (Dodman and Wildermuth, 1989). Paulitz et al. (2010) reported that
stubble burning reduces the soil infestation of F. pseudograminearum and F.
culmorum by 47% and 30% respectively. However, this practice is not strongly
recommended because it may favour the insurgence of other diseases and may
reduce the quality of the soil (Simpfendorfer et al. 2005).
A more elegant and simple method which is aimed at reducing cross
infection among subsequent crops is to sow the new seeds in the inter-rows, and
this reduced CR severity by up to 61%, 51% and 53%, respectively, in the seasons
2004, 2005 and 2006 in field trials conducted in New South Wales (Rummery et
al. 2007; MacLeod et al. 2008).
Comparing Zn-efficient cultivars with Zn-deficient cultivars, it is clear
there is a reduced level of disease by Fusarium species in Zn-efficient lines
(Grewal et al. 1996). Grewal et al. (1996) also demonstrated a correlation between
Zn availability in soil which has been inoculated with F. pseudograminearum and
the incidence of CR in bread wheat and durum wheat. They found that the more
susceptible varieties expressed disease symptoms 12 days after sowing when the
Zn concentration in the soil was less than 0.05 mg kg-1
, while the less susceptible
cultivars showed less CR incidence in the same experimental conditions even 26
days after sowing. In all the varieties, CR symptoms decreased in the samples
with a Zn concentration in the soil between 0.5 and 2 mg kg-1
. However the plant
grown in soil with a Zn concentration of 2 mg kg-1
showed more vigour than the
others. Grewal et al. (1996) have demonstrated that the Zn reduces CR incidence
through a combination of its fungitoxicity and by having germplasm that displays
early vigour. Other effects related to the application of Zn fertilisers which
improve the plant vigour are the stabilisation of sulfhydryl groups in the

31
membrane proteins (Cakmak, 2000) and the role in the metabolism of
carbohydrates, proteins and hormones (Alloway, 2008).
Beside the application of these chemical methodologies, some research has
focused on the use of biological approaches to reduce CR incidence. These
concern inoculation of the soil with competitive microorganisms which involve
lower expenditures than fertiliser application. Some achievements have been
obtained successfully in laboratories and glasshouses using Burkholderia cepacia
and Trichoderma species as a containment measure of Fusarium soil infestation,
and improved plant vigour (Huang and Wong, 1998; Wong et al. 2002; Vinale et
al. 2008). There are limitations to the application of Burkholderia cepacia, in that
it seems to be related to pulmonary hypertension and cystic fibrosis in humans
(Fauroux et al. 2004), but the utilisation of Trichoderma species seems to be a
valuable agronomic approach (Vinale et al. 2008).
1.3.2 The use of breeding and biotechnology
From a breeding perspective, a useful approach combines the crossing of very
susceptible or susceptible materials with partially resistant lines that have
previously been developed but have not necessarily been successful as varieties in
their own right due to some other limiting factor(s) within their genetic make-up
(for example, reduced yield or susceptibility to a different disease). This approach
is also supported by the fact that, although the pathogenicity among Fusarium
species seems to be potentially different, a partially resistant wheat line usually
shows resistance against more than one species (Liu et al. 2004).
In this thesis the term ‘partially resistant’ is referring to less-susceptible
varieties. Even though the former does not reflect the classical definition of
resistance (a mechanism ‘on-off’), it has been used extensively in several

32
published research articles in this area (Wallwork et al. 2004; Bovill et al. 2006;
Collard et al. 2006; Bovill et al. 2010; Martin et al. 2013).
Many studies have been carried out in order to analyse the segregation of
resistance in populations obtained by crossing two partially resistant parents, or a
partially resistant and susceptible parent even if belonging to different, but still
related, species. Specifically in bread wheat, Collard et al. (2005a) studied
populations derived from the variety 2-49 (agronomically poor but partially
resistant) and the susceptible variety Janz, while Bovill et al. (2010) used two
doubled haploid populations obtained by crossing the parents 2-49 with
W21MMT70 (partially resistant in seedlings), and 2-49 with Sunco, (partially
resistant in adult plants). In the former study, the phenotypic assessment of the CR
disease score in the segregating population was 50.8% while the parents showed a
score of 39.3% (variety 2-49) and 68.1% (variety Janz), demonstrating a clear
improvement in reducing CR susceptibility (based on the susceptible parent).
Analogous achievements have been obtained by Bovill et al. (2010) that analysed
two different double haploid populations across several years. Outcomes from this
research resulted in lines with improved resistance to CR (compared with the
parents W21MMT70, Janz and Sunco).
However, techniques based on phenotypic assessment are time consuming
and not totally reliable due to being influenced by external factors such as the
appearance of other diseases or the occurrence of favourable or unfavourable
weather conditions for CR that lead to overestimating or underestimating its
incidence (Wade et al. 2001; Wallwork et al. 2004). Consequently, pre-breeding
research (Wallwork et al. 2004; Collard et al. 2005a; Bovill et al. 2010) has
shifted towards combining both phenotypic approaches and molecular-based

33
(genomic) approaches to further our understanding of what contributes to
reducing the susceptibility to CR in both bread wheat and durum wheat.
Studies carried out using molecular markers can assist breeders by
providing them with tools to select the most favourable traits without the
unreliability of the phenotypic-based selection (Fig. 3). These studies are aimed to
identify, through the aid of molecular markers, the genetic traits, the quantitative
trait loci (QTL), involved in the resistance and to evaluate their significance. For
instance, Bovill et al. (2010), studying 2-49/W21MMT70 and 2-49/Sunco double
haploid populations, detected 16 QTL: 6 of them were detected in at least one of
the two trials performed in the population 2-49/W21MMT70, and 10 were
detected in at least one of the three trials performed in the population 2-49/Sunco.
Moreover they evaluated the significance regarding these QTL and the additive
effect of their different combination in the segregating population. Such
approaches have been built on the principle that molecular markers tightly linked
to known QTL will segregate together. The importance of having QTL already
mapped, is that breeders may select the most suitable phenotypes through marker
analysis. As defined by Collard et al. (2005b), this methodology is called marker
assisted selection (MAS) and is faster and more reliable than choosing the best
lines using only phenotypic approaches (Fig. 3).

34
Fig. 3. Typical MAS of a breeding program for disease resistance. The susceptible
parent (S) is crossed with the resistant (R). The F1 plant is self-pollinated to produce an F2
population. By using the marker, the most suitable phenotypes are selected (the arrows).
This technique reduces the size of the population by quickly selecting the best phenotypes
(Collard et al. 2005b).
Molecular approaches to understand CR and the related resistance
mechanisms are therefore useful for the breeding programs to fast-track superior
genotypes that can then be potentially deployed as new varieties. Such varieties
could be used in combination with good agronomic practices to further reduce the
incidence of CR.
1.4 Molecular approaches to understand crown rot
Plant responses to biotic and abiotic stresses can be controlled by a single gene or
a complex ‘net’ of several genes. In plant breeding, if a phenotypic trait of interest
is controlled by a single gene it is relatively simple to study its inheritance or to
select for it in a new population with the aim to improve the crop’s quality. On the

35
contrary, if the favourable traits are controlled by more than one gene, their
expression and inheritance are usually more complex.
While some biotic diseases can be controlled by single gene inheritance,
many diseases are polygenically controlled/regulated. Consequently, there has
been considerable interest in extending the scientific community’s knowledge on
molecular markers and their potential to assist with understanding these polygenic
controlled traits (Feuillet and Keller, 2004). Indeed, it has been suggested that
DNA markers (through the process of molecular breeding) will contribute to the
rise of food availability which will assist in sustaining world population growth
(Ortiz, 1998; Kasha, 1999; Collard and Mackill, 2008).
1.4.1 Molecular markers and applications
With the advent of molecular markers, based on the detection of polymorphisms
in the DNA sequence, plant breeding programs worldwide have embraced this
technology (where available) so that they are not constrained by phenotyping
and/or biochemical analysis alone (Winter and Kahl, 1995). In doing so,
molecular marker systems have the capacity to ‘fast-track’ selection decisions in
breeding programs.
Microsatellites markers, or SSRs, are based on short repeat units (up to 6
nucleotides) that explain the polymorphism in the variability of the number of
copies present in the genome (they are not point mutations) and their utility comes
from their abundance (Table 3; Ganal and Roder 2007). While microsatellites are
still commonly used (particularly for plant species such as wheat), the high costs
associated with their application may be not sustainable, especially if significant
analysis needs to be undertaken. Consequently, other marker platforms have been
developed, including Diversity Arrays Technology (DArT), which was first used

36
in rice by Jaccoud et al. (2001). Besides the low cost and high-throughput
capacity of this technology, DArT markers do not need any prior sequence
information and as such can be used for germplasm characterisation, genetic
mapping, gene tagging, marker-assisted selection or the detection of genome
methylation changes (Jaccoud et al. 2001). DArT marker technology has been
used in wheat, through the analysis of the whole genome or for the identification
of specific genes. For instance, Eberhard et al. (2010) based their research on the
use of DArT markers in order to assess an F2 population which was obtained by
crossing durum and bread wheat parents. This study was based on the analysis of
the introgression of the D genome and the segregation of genes within the A and
B genomes. Besides broad analysis approaches, Mohler et al. (2012) conducted
research that focused on identifying the transfer of a resistance gene for powdery
mildew from a cultivated emmer parent.
In the past decade, single nucleotide polymorphisms (SNPs) have been the
marker of choice, are considered third generation PCR-based markers (Rafalski
2002), and they are defined by a substitution of specific nucleotide(s) (Ganal and
Roder 2007). This characteristic makes the SNP the smallest unit of genetic
variation and a source of potentially unlimited polymorphisms (Ganal and Roder
2007). SNPs may be found using PCR techniques, thereby generating new
sequence information, or exploiting databases’ information through in silico
analysis by studying genomic or cDNA sequences (Feuillet and Keller 2004).
Although research on identifying SNPs is extensive in maize (Ching et al. 2002),
barley and soybean (Zhu et al. 2003), Ganal and Roder (2007) reported that there
was a lack of analogous studies in wheat, mostly due to the high expenditure
involved and the difficulties of applying SNP technology to polyploid genomes.
This made SNP analysis of wheat difficult and consequently delayed SSRs being

37
replaced by SNPs as the marker of choice for wheat. To improve this, an
international project was started to develop SNP markers in wheat through in
silico analysis (the Wheat SNP Development Project) (Khlestkina and Salina
2006). However, the success of this approach is limited by the availability of
ESTs (expressed sequence tags). SNP array technology allows for whole genomes
to be potentially analysed depending upon how many polymorphic markers are
identified. In fact, even if each SNP is less informative than a SSR marker in
terms of polymorphic content, the former markers are much more numerous than
the microsatellites and this requires a high-throughput platform to exploit
potential.
Among these, the Illumina GoldenGate assay, combined with the
BeadArray Platform (Oliphant et al. 2002), utilises allele-specific
oligonucleotides (ASOs) which can distinguish between two allelic variants of a
SNP and it can also be applied for SNP genotyping of tetraploid and hexaploid
wheat (Akhunov et al. 2009). While the ASO anneals the SNP locus keeping the
discriminating nucleotide at the 3' end, just downstream a different annealing step
involves another oligonucleotide (locus specific oligonucleotide, LSO) which
contains address sequences called Illumicode (Akhunov et al. 2009). A PCR
extension joins the two oligonucleotides creating a template which includes a
sequence specific for the SNP allelic variant (ASO), and another specific for the
locus (LSO) (Akhunov et al. 2009). During this PCR the ASOs are discriminately
labeled with the fluorescents dyes Cy3 and Cy5. The amplified templates are
ligated to beads through annealing specific oligonucleotides (on the beads), and
the Illumicodes of the LSO. The analysis of the fluorescence emitted by the dyes
gives information on the SNP allelic variant of the samples (Akhunov et al. 2009).

38
1.4.2 QTL and crown rot: what is known?
In order to extend knowledge on QTL and their use, several studies have focused
on the discovery of new QTL, their mapping and their influence on phenotypic
characteristics (Collard et al. 2005a; Bovill et al. 2006; Collard et al. 2006; Bovill
et al. 2010; Martin et al. 2013). QTL mapping is constituted by linkage mapping
and QTL analysis and is based on the principle that the closer the two genes are,
the greater the likelihood they will segregate together during meiosis (Paterson
1996). Linkage mapping is aimed at identifying molecular markers which are
tightly linked to QTL so they can be used as ‘flags’ (or ‘tags’) in a linkage map
(which shows the chromosomal locations and genetic distances between markers)
(Collard et al. 2005b). With a linkage map developed, it is possible to perform
QTL analysis by studying the phenotype of individuals through the genotype of
markers, using them as ‘tags’ for different genotypic groups (Collard et al.
2005b). This enables the position and significance (magnitude) of each QTL that
may be classified as ‘major’ or ‘minor’ (Collard et al. 2005b) or as ‘suggestive’,
‘significant’ and ‘highly significant’ (Lander and Kruglyak, 1995) to be obtained.
The position of a QTL is assumed to be where the likelihood, expressed by the
logarithm of odds (LOD) score or another test statistic, has the maximum peak
that has to be higher than a threshold evaluated by a permutation test (Collard et
al. 2005b).
Bovill et al. (2010) carried out QTL analysis for CR resistance in 2-
49/W21MMT70 and 2-49/Sunco double haploid populations, using the linkage
map established by Collard et al. (2005a). In the segregating population 2-
49/W21MMT70, 6 QTL were found. The QTL QCr.usq-3B.1 was the most
significant, explaining up to 40.5% of the CR resistance. In 2-49/Sunco double
haploid population, 10 QTL were found and the most significant had a magnitude

39
that explained 25% of the phenotypic variance. Among the 16 QTL for CR
resistance found by Bovill et al. (2010) in the populations, 12 of them were
located in the B genome. The high likelihood of the discovery of QTL for CR
resistance in the B genome has also been confirmed by Collard et al. (2005a) who
discovered 6 QTL, 3 of them located on chromosomes 2BS, 4BL and 7BS.
This has led research towards the utilisation and combination of these
known QTL, by developing wheat genotypes that contain as many of these QTL
as possible. Among many strategies applied through several years, the pyramiding
of QTL has been evaluated as one of the most effective (Dekkers and Hospital
2002). For instance the populations studied by Bovill et al. (2010) have been
obtained by setting-up a pyramiding of QTL for CR resistance in 2-
49/W21MMT70 and 2-49/Sunco bread wheat populations. Although with
different levels of resistance among the populations, some lines have shown a
satisfactory resistance to CR. In 2006 the percentage of CR severity was on
average 28% in the variety 2-49, 46.9% in the W21MMT170 and 43% in the
segregating population (where the least susceptible individuals had a CR severity
of 2.2%) (Bovill et al. 2010). Similar results have been collected with regard to
the bread wheat population 2-49/Sunco: in 2004 the CR severity was on average
57.2% in Sunco, 40.3% in 2-49 and 52% in the segregating population (where the
least susceptible individuals had a CR severity of 20.5%) (Bovill et al. 2010). In
this experiment the segregating populations demonstrated an average CR
susceptibility lower than the more susceptible parents W21MMT170 and Sunco,
and some individuals even lower than the line 2-49.
In general, a successful approach to reduce the CR susceptibility in wheat
concerns the use of partially resistant parents in crosses with varieties that provide
good agronomic values. In bread wheat, this approach could be effective because

40
of the presence of several genetic sources of partial resistance to CR have already
been discovered. Further, new QTL may be found by clarifying the susceptibility
of some varieties such as Sumai 3, which is recognised as a source of resistance
against FHB, and may have some partial resistance against CR (Liu and Anderson
2003; Collard et al. 2006; Li et al. 2010; Petrisko et al. 2010).
1.4.3 Towards improving crown rot partial resistance in durum
The large amount of QTL for partial resistance to CR already discovered in the
bread wheat genome has allowed geneticists and breeders to develop novel
hexaploid lines more resistant to CR (Collard et al. 2005a; Bovill et al. 2010). On
the contrary, the absence of QTL for partial resistance to CR in durum wheat has
been a limitation in developing less susceptible (partially resistant) durum lines.
Given the evolutionary relationship between bread wheat and durum
wheat, QTL discovered in bread wheat may be utilised for potentially reducing
CR severity in durum populations by performing crosses between the two species
and selecting the durum progeny which have inherited the resistant traits from the
bread wheat parents. For instance, Ma et al. (2012) evaluated phenotypically the
CR severity in a segregating population obtained by crossing the hexaploid wheat
CSCR6 with the durum variety EGA Bellaroi. The severity score was 10% for the
resistant parent CSCR6 and 70% for the susceptible durum wheat Bellaroi. The
durum progeny demonstrated on average a CR severity score of 56.7%, which is a
moderate reduction when compared with the durum parent Bellaroi. A similar
study has been conducted by Martin et al. (2013) using durum populations that
were obtained by crossing with the partial resistant bread wheat 2-49. Results
from within the populations reported a CR severity score which was reduced
when compared to the durum parent, thus indicating that bread wheat QTL may

41
have segregated in the durum progeny (Martin et al. 2013). Preliminary molecular
analysis carried out in this study led the authors to identify the introgression of
QTL for partial resistance to CR in chromosomes 1A, 1B and 4B derived from 2-
49.
However, the low number of studies aiming to reduce CR severity in
durum has left the development of partial resistant durum lines still an unsolved
issue. Therefore, the present study aimed to assess, phenotypically and
genotypically, the CR susceptibility of six durum wheat populations obtained by
crossing bread wheat varieties 2-49 and Sumai 3, with three different susceptible
durum parents. The phenotypic analysis involved the assessment of CR severity
symptoms of durum lines grown in the field infested by F. pseudograminearum
and F. culmorum, while the genotypic approach utilised SNP array marker
analysis. Moreover CR susceptibility for the bread wheat variety Sumai 3, where
data has not been clearly defined in published literature, has also been
investigated.
1.5 Rationale and significance
Durum is a tetraploid wheat required to produce pasta, spaghetti and couscous and
for which the World mean annual production has been 36.9 million tonnes per
year over the last 4 seasons (Ponzielli 2013). Australia, although averaging just
1.4% of world production, has been recognised as a producer of high-quality
durum wheat (Connell et al., 2004; Troccoli et al., 2000).
However, a disease called CR (caused by the fungi F. pseudograminearum and F.
culmorum) can reduce the yield of durum wheat by up to 90% (Daniel and
Simpfendorfer, 2008). Agronomic and marker-based (biotechnology) approaches
have been applied in order to help alleviate the damage that this disease can cause.

42
Nevertheless, the former does not provide resistance mechanisms and the latter,
largely because of the unreliable phenotypic assessment, needs to be strengthened
through adopting other marker-based approaches that may contribute in
identifying new information to breeding for disease resistance.
The absence of QTL for CR resistance in durum wheat does not permit (at
present) the development of partially resistant lines that completely satisfy the
breeder’s requirements. Moreover, while some studies have been carried out on
segregating populations obtained by crossing the partially resistant variety 2-49
(or other bread wheat) with durum wheat varieties (Ma et al. 2012; Martin et al.
2013), further studies are required in order to screen different pedigrees with the
aim to detect durum lines provided by good agronomic value and partial
resistance to CR. This screening needs to be assisted with molecular analysis
(SNP and SSR markers), and in durum there are not anywhere near as many
published papers when compared to bread wheat.
In the present study we therefore assessed the CR severity of six durum
wheat populations obtained by crossing bread wheat varieties 2-49 and Sumai 3,
with three different susceptible durum parents. These populations were supplied
through the NSW Department of Primary Industries (NSW DPI). The lines from
the field trial were also cross-analysed with SNP and SSR markers to assess the
segregation of bread wheat loci potentially involved in reducing CR severity.
Moreover CR susceptibility for the bread wheat variety Sumai 3, which from
published literature is inconclusive and may/may not be as effective as 2-49, has
also been defined.

43
2 MATERIALS AND METHODS

44
2 Materials and methods
2.1 Germplasm
Two hundred and fifty-two lines of tetraploid wheat were analysed. This
germplasm was provided by the New South Wales Department of Primary
Industries. It consisted of 6 populations, each derived from a different complex
crossing program involving three durum parents (the cultivar EGA Bellaroi and
durum breeding lines designated 950329 and Durum D) and two bread wheat
parents (2-49 and Sumai 3) (Fig. 4). All materials used were F4 single plant
selections from the original cross which was made. These lines had been
phenotypically selected in the field based on less crown rot (CR) severity and
‘plant-type’ (by Dr Steven Simpfendorfer and Dr Gururaj Kadkol, respectively).
The bread wheat parents 2-49 and Sumai 3 (for which seed was provided by
Associate Professor Hugh Wallwork of South Australian Research and
Development Institute SARDI) were also analysed.

45
Fig. 4. Pedigree relationship for durum population investigated. Each population was
generated from a complex cross involving both durum wheat (highlighted in green) and
bread wheat (highlighted in yellow) parents. Progeny were obtained by self-pollinating up
to the F4 generation. For each population the number of lines under study is indicated in
parentheses. Numbers appearing after 950329 (B) represent different selections from the
original crosses.
2.2 Seed multiplication, glasshouse conditions
To obtain enough seed of each individual line for the phenotypic assessment
study, a bulk-up of all seed material was conducted. Four seeds for each line were
sown in a glasshouse located in ‘The Plant Accelerator’ at the Waite Campus
(Adelaide, South Australia), where the temperature ranged from 16°C during the
night to 22°C during the day, with a 16/8h photoperiod. Plants were watered as
required to ensure suitable soil moisture was available.

46
2.3 DNA extraction and SNP assay
DNA was extracted from one plant of each of the 252 lines (F5 generation) using a
phenol/chloroform method readapted from Rogowsky et al. (1991) (Pallotta et al.
2000). The same extraction method was carried out on the parents 2-49, Sumai 3
and EGA Bellaroi 38a (however, the parents 950329 and Durum D were not
provided through our collaborators at NSW DPI). A small piece of fresh leaf
tissue was sampled from each plant three weeks after sowing in the glasshouse,
then ground and diluted in 700 µL of DNA extraction buffer (1% sarkosyl, 100
mM Tris-HCl, 100 mM NaCl, 10 mM EDTA, 2% PolyVinyl-PolyPyrrolidone)
and successively in 700 µL of phenol/chloroform/iso-amyalcohol (25:24:1). The
solution was then transferred to an 8 mL silica matrix tube (Vacuette) and spun
twice at 3220 RCF for 10 min (centrifuge 5810R, Eppendorf); adding 700 µL of
phenol/chloroform/iso-amyalcohol between the 2 x 10 min centrifugations. A total
of 60 µL of sodium acetate 3M (pH 4.8) and 600 µL of isopropanol was then
added to the aqueous phase and the DNA was precipitated by centrifugation at
15871 RCF for 5 minutes (centrifuge 5424, Eppendorf). After decanting the
liquid, 1 mL of 70% ethanol was added to the DNA pellet and the samples were
centrifuged again at 15871 RCF for 5 min. After removing the ethanol the pellet
was resuspended in 60 µL of R40 solution (RNase A (5 mg/mL, SIGMA R6513)
and RNase buffer (5 mM Tris/HCl, 7.5 mM NaCl, pH 7.5), diluted 1:250 in 1X
TE (10 mM Tris-HCl, 1 mM EDTA, pH 8.0)) and stored at 4°C. After adjusting
the DNA concentrations for all the samples to approximately 50 and 60 ng µL-1
(using tris EDTA 10mM for the dilutions), they were sent to Dr Matthew Hayden
of the Victorian Department of Primary Industries for genotyping with a 9K SNP
array (Cavanagh et al. 2013). The genotyping, performed according to the
Illumina protocol (Infinium iSelect SNP genotyping), exploited the instruments
47
BeadStatio, iScan and the 9k Infinum SNP chip
PrivKSU_WheatCons_9k_11497518_A (Cavanagh et al. 2013). The genotype of
the SNPs was called using the software GenomeStudio v2011.1 software
(Illumina®, V2011.1).
2.4 Bird-proof enclosure layout and environmental conditions
Phenotypic assessment of all 252 lines and bread wheat parents was carried out in
a bird-proof enclosure located at the Waite Campus. Soil of this enclosure has
been naturally infested by Fusarium culmorum and Fusarium
pseudograminearum over many years of continuous production of durum on
durum stubble. The level of infestation had been detected in late 2011 by
performing Predicta B tests. This DNA-based test (Ophel-Keller et al. 2008)
provided the base level of F. pseudograminearum and F. culmorum (expressed as
pg of fungal DNA/g of sample).
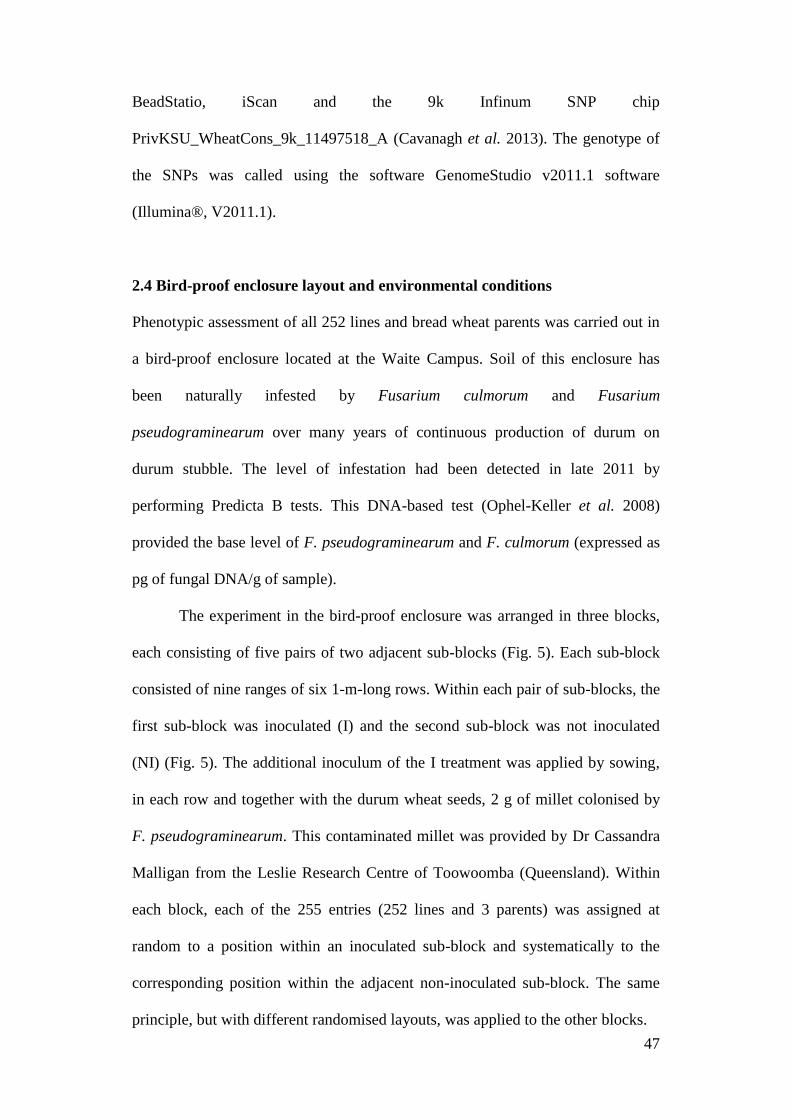
The experiment in the bird-proof enclosure was arranged in three blocks,
each consisting of five pairs of two adjacent sub-blocks (Fig. 5). Each sub-block
consisted of nine ranges of six 1-m-long rows. Within each pair of sub-blocks, the
first sub-block was inoculated (I) and the second sub-block was not inoculated
(NI) (Fig. 5). The additional inoculum of the I treatment was applied by sowing,
in each row and together with the durum wheat seeds, 2 g of millet colonised by
F. pseudograminearum. This contaminated millet was provided by Dr Cassandra
Malligan from the Leslie Research Centre of Toowoomba (Queensland). Within
each block, each of the 255 entries (252 lines and 3 parents) was assigned at
random to a position within an inoculated sub-block and systematically to the
corresponding position within the adjacent non-inoculated sub-block. The same
principle, but with different randomised layouts, was applied to the other blocks.

48
Fig. 5. Bird-proof enclosure layout. (a) The randomised complete block design of the
experiment was composed of three replicated blocks, with each block having 10 sub-
blocks. Two treatments were applied among the sub-blocks: the inoculated (I, red boxes)
and the not inoculated (NI, blue boxes). (b) Each sub-block consisted of 6 rows (1 metre
in length) and 9 ranges. Within the replicates, each entry was sown in one I sub-blocks
and in the adjacent NI sub-blocks.
The experiment in the bird-proof enclosure was conducted during summer
(December 2012 to March 2013). Based on weather reports (Bureau of
Meteorology, 2012; 2013) in this four-month period the total rain pattern was
approximately 54.6 mm (11.6 mm in December, 11.6 mm in January, 11.8 mm in
February and 19.6 mm in March).
Irrigation was also applied to provide sufficient soil moisture for plant
development. However, just prior to head emergence (9 weeks after sowing),
moisture stress was imposed by withdrawing the irrigation in order to allow the
infection to take place more readily than if adequate water was supplied. This was
intended to simulate the conditions that would occur during a dry spring.

49
2.5 Inoculum viability and soil infestation
Fusarium infestation of the soil in the bird-proof enclosure was checked using a
viability assessment of the inoculum and molecular analysis. Three and seven
weeks after sowing, two viability assessments were performed according to the
dilution plate technique methodology developed by Leslie and Summerell (2006).
For each block, 162 soil cores were extracted from inter-rows and pooled in 18
samples (9 from I and 9 from NI sub-blocks). The samples were air-dried in a
laminar flow cabinet for 48 hours and, after being ground to obtain small particles,
they were diluted up to 1:400 in water agar (which has an agar concentration of
0.05%). They were then inoculated onto pentachloronitrobenzene (PCNB) agar
medium which is selective for Fusarium species (Leslie and Summerell 2006).
Cultures were incubated for 5 days at 25°C and colony-forming units (CFU) were
counted. In addition, molecular analysis was performed 11 weeks after sowing by
using the Predicta B test (Ophel-Keller et al. 2008). For each block 270 soil cores
were collected from inter-rows and pooled into 6 samples, 3 from I and 3 from NI
sub-blocks. These samples were processed by the SARDI Root Disease Testing
Service to estimate the level of Fusarium infestation.
2.6 Phenotypic assessment
Crown rot severity was assessed at plant maturity by assigning to each individual
a score related to the main stem browning (Fig. 6; Wallwork et al. 2004). To
obtain main stems for assessment, all plants were pulled from the soil, all tillers
from each plant were removed and each main stem was cut at approximately 7 cm
above the crown. Each main stem was then assessed for the extent and severity of
browning using a scale from 0 (no symptoms) to 5 (severe symptoms).

50
Fig. 6. Crown rot assessment scale. The severity of browning was assessed on the main
stem of each mature plant on a scale of 0 to 5 (Wallwork et al. 2004). This figure
illustrates the rating scale by showing one stem from each point on the scale.
2.7 Infection and viability of Fusarium in the main stem of the plants
Molecular analysis and viability assessment of the Fusarium infecting the plants
were performed on the main stems of 8 samples per block. Within each block, the
lines chosen were the bread wheat parents (2-49 and Sumai 3) one durum wheat
line with a high and one durum wheat line with a low CR score. For each of these,
samples were taken from both the I and NI sub-blocks. The molecular analysis
was performed with the Predicta B test (Ophel-Keller et al. 2008) in 2 g of main
stems for each sample. The viability of Fusarium in the stems was assessed using
the moist incubation method (Burgess et al. 1988). Briefly, after cutting the first
cm of the selected main stems and sterilising their surface, the samples were
plated onto Potato Dextrose Agar (PDA) and incubated at room temperature,
firstly in the dark (24 hours) and then in light conditions (48 hours). Afterwards,

51
the viability of the Fusarium was determined by visual naked-eye observation of
mycelium and microscopic observation of canoe-shaped conidia.
2.8 Grain yield
The plant material harvested from each row was threshed, and the grain was
weighed. Grain yield was calculated as g/m2.
2.9 Statistical analysis of phenotypic data
The data collected were analysed using unbalanced ANOVA and correlation
analysis tests (Genstat 15th
edition). The analysis of variance was performed to
determine the least significant difference (LSD) among the CR scores so that
partially resistant lines (with a CR score significantly lower than the susceptible
parent EGA Bellaroi 38a) could be identified. Moreover, a planned single-degree-
of-freedom ANOVA enabled the comparison between the CR score of the parent
EGA Bellaroi 38a, and the mean of each single family. The correlation analysis
was carried out between CR scores, yield and ‘Fusarium-inoculated’ stems.
2.10 Association analysis
Results from the SNP array analysis were obtained from Dr Matthew Hayden as a
GenomeStudio (Illumina®, V2011.1) file and a set of genotype calls (255 entries
× 8632 markers) that had been automatically generated using a cluster file
(TetraploidClusterFile_v.12) and SNP annotation file (TdDIVers SNP
annotation_2.0) developed specifically for tetraploid wheat. For markers with
ambiguous results, GenomeStudio was used to visually examine the distributions
of R and Theta values and determine the final genotype calls for each entry. For
each polymorphic marker, t-tests (Genstat, 15th
edition) were conducted to

52
examine the association of the marker with CR severity scores across the full set
of 252 lines, and for each of the families of lines in which that marker was
polymorphic.
2.11 SSR marker analysis
The populations under study were also screened with SSR markers that had
previously been reported to be linked with QTL for CR resistance in bread wheat
populations derived from 2-49 (Martin et al. 2013). The analysis was conducted
using the multiplex ready PCR technique (MRT) (Hayden et al. 2008) with
separation of amplicons performed by AGRF (Australian Genome Research
Facility). To prepare the samples, a preliminary PCR was performed. The PCR
mastermix (final volume of 6 µL) contained 1.2 µL of 5x Mpx-Rdy Buffer, 0.03
µL of Immolase DNA polymerase (Bioline), 0.045 µL of dye labelled tagF (VIC
for the markers cfd39, gwm285 and wmc216; FAM for gwm164, gwm11 and
wmc1; NED for wmc120 and gwm376; PET for gwm513 and barc148), 0.045 µL
of dye unlabelled tagR, 3 µL of template DNA and different amounts of selected
SSR primer pairs (0.54 µL of cfd39, 0.075 µL of gwm285, 0.09 µL of wmc216,
0.21 µL of gwm164, 0.21 µL of gwm11, 0.24 µL of wmc1, 0.075 µL of wmc120,
0.48 µL of gwm376, 0.12 µL of gwm513, 0.21 µL of barc148). The Mpx-Rdy
buffer contained 7.5 mM of MgCl2, 1mM of each dNTP and 2.5x of BSA. The
stock solution of 100x of BSA contained 10 mg/mL of bovine serium albumin
factor V, 50 mM NaCl, 5% of glycerol and 0.1 mM of EDTA (pH 8).
The PCR protocol (thermocycler DNA engine tetra 2, MJ Research)
consisted of an initial step of 10 min at 95°C followed by 65 cycles organised in
the following steps: 5 cycles of 30 sec of denaturation at 92°C, 90 sec of
annealing at 50°C and 60 sec of elongation at 72°C; 20 cycles at 92°C for 30 sec,

53
63°C for 90 sec, 72°C for 60 sec; 40 cycles at 92°C for 15 sec, 54°C for 30 sec,
72°C for 60 sec; then a final extension of 10 min at 72°C.
The next step consisted of pooling the PCR products belonging to the same
DNA samples. The samples were then desalted with ultra-filtration filter plates
(AcroPrep 384 UF filter plate, PALL Life Science) and then resuspended with
water. Three µL of each desalted sample was aliquoted into a well in a 96-well
PCR plate, then 8 µL of Hi-Di formamide and 0.04 µL of GeneScan500-LIZ size
standard were added for each sample. The solutions were heated at 90°C for 5 min
then submitted to AGRF for separation of amplicons in an ABI3730 (Applied
Biosystems). The results were analysed with the software GeneMapper v3.7
(Applied Biosystems).
54
3 RESULTS

55
3 Results
3.1 Soil infestation and inoculum viability
In soil samples taken three weeks after sowing, viable Fusarium were detected
(Fig. 7), with a significant difference in the number of CFU/g of soil between the I
and the NI treatments detected only in block 1 (Fig. 7a). Seven weeks after
sowing the level of infestation was consistently higher in the I treatment than in
the NI treatment (Fig. 7b).
Fig. 7. Viability of Fusarium in the soil. Results of the CFU counts performed in
according to the dilution plate technique (Leslie and Summerell 2006) are shown. Two
identical analyses have been accomplished at 3 (a) and 7 weeks (b) after sowing. Means
and standard errors are shown for sets of 18 samples taken from each of the treatments
(NI: black bars; I: grey bars) within each of three blocks of the experiment.
However, the dilution plate technique does not discriminate among the
Fusarium species counted. To determine which Fusarium species involved in CR
infection, the Predicta B tests was also conducted on 6 soil samples taken from
inter-rows. This analysis detected both F. pseudograminearum and F. culmorum
in both the NI and I treatments (Fig. 8). For F. culmorum, the level of inoculum
0.00E+00
5.00E+03
1.00E+04
1.50E+04
2.00E+04
2.50E+04
3.00E+04
Block 1 Block 2 Block 3
CF
U/g
so
il
a)
1.00E+00
5.00E+03
1.00E+04
1.50E+04
2.00E+04
2.50E+04
3.00E+04
Block 1 Block 2 Block 3 b)
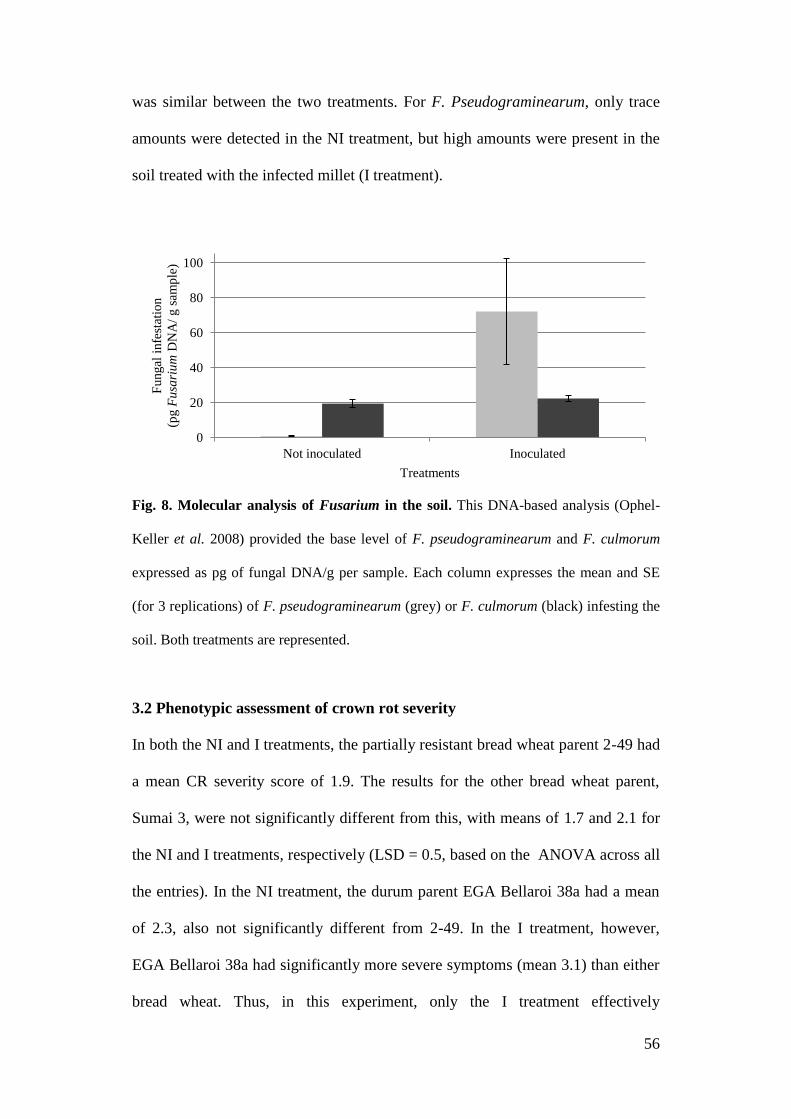
56
was similar between the two treatments. For F. Pseudograminearum, only trace
amounts were detected in the NI treatment, but high amounts were present in the
soil treated with the infected millet (I treatment).
Fig. 8. Molecular analysis of Fusarium in the soil. This DNA-based analysis (Ophel-
Keller et al. 2008) provided the base level of F. pseudograminearum and F. culmorum
expressed as pg of fungal DNA/g per sample. Each column expresses the mean and SE
(for 3 replications) of F. pseudograminearum (grey) or F. culmorum (black) infesting the
soil. Both treatments are represented.
3.2 Phenotypic assessment of crown rot severity
In both the NI and I treatments, the partially resistant bread wheat parent 2-49 had
a mean CR severity score of 1.9. The results for the other bread wheat parent,
Sumai 3, were not significantly different from this, with means of 1.7 and 2.1 for
the NI and I treatments, respectively (LSD = 0.5, based on the ANOVA across all
the entries). In the NI treatment, the durum parent EGA Bellaroi 38a had a mean
of 2.3, also not significantly different from 2-49. In the I treatment, however,
EGA Bellaroi 38a had significantly more severe symptoms (mean 3.1) than either
bread wheat. Thus, in this experiment, only the I treatment effectively
0
20
40
60
80
100
Not inoculated Inoculated
Fungal
infe
stat
ion
(pg F
usa
riu
m D
NA
/ g s
amp
le)
Treatments

57
discriminated between the well-known partial resistance of 2-49 and the
susceptibility of EGA Bellaroi.
For five families out of six, a planned single-degree-of-freedom contrast
indicated that the mean CR severity score of the progeny for the I treatment was
significantly lower (p < 0.001) than that of EGA Bellaroi 38a (Fig. 9). The
exception was the family Bellaroi38a/SumD-8 (p = 0.058).

58
0
10
20
30
40
50
60
0-0
.4
0.5
-0.9
1-1
.4
1.5
-1.9
2-2
.4
2.5
-2.9
3-3
.4
3.5
-3.9
4-4
.4
4.5
-5
Fre
quen
cy (
%)
2-49B 15-3/Bellaroi38a (NI)
2-49
Sumai 3
EGA Bellaroi 38a
0
10
20
30
40
50
60
0-0
.4
0.5
-0.9
1-1
.4
1.5
-1.9
2-2
.4
2.5
-2.9
3-3
.4
3.5
-3.9
4-4
.4
4.5
-5
2-49B 15-3/Bellaroi38a (I)
2-49
Sumai 3
EGA Bellaroi 38a
0
10
20
30
40
50
60
0-0
.4
0.5
-0.9
1-1
.4
1.5
-1.9
2-2
.4
2.5
-2.9
3-3
.4
3.5
-3.9
4-4
.4
4.5
-5
Fre
quen
cy (
%)
Bellaroi38a/2-49B 3-4 (NI)
2-49
Sumai 3
EGA Bellaroi 38a
0
10
20
30
40
50
60
0-0
.4
0.5
-0.9
1-1
.4
1.5
-1.9
2-2
.4
2.5
-2.9
3-3
.4
3.5
-3.9
4-4
.4
4.5
-5
Bellaroi38a/2-49B 3-4 (I)
2-49
Sumai 3
EGA Bellaroi 38a
0
10
20
30
40
50
60
0-0
.4
0.5
-0.9
1-1
.4
1.5
-1.9
2-2
.4
2.5
-2.9
3-3
.4
3.5
-3.9
4-4
.4
4.5
-5
Fre
quen
cy (
%)
Score range
Bellaroi38a/SumD-8 (NI)
2-49
Sumai 3
EGA Bellaroi 38a
0
10
20
30
40
50
60
0-0
.4
0.5
-0.9
1-1
.4
1.5
-1.9
2-2
.4
2.5
-2.9
3-3
.4
3.5
-3.9
4-4
.4
4.5
-5
Score range
Bellaroi38a/SumD-8 (I)
2-49
Sumai 3
EGA Bellaroi 38a
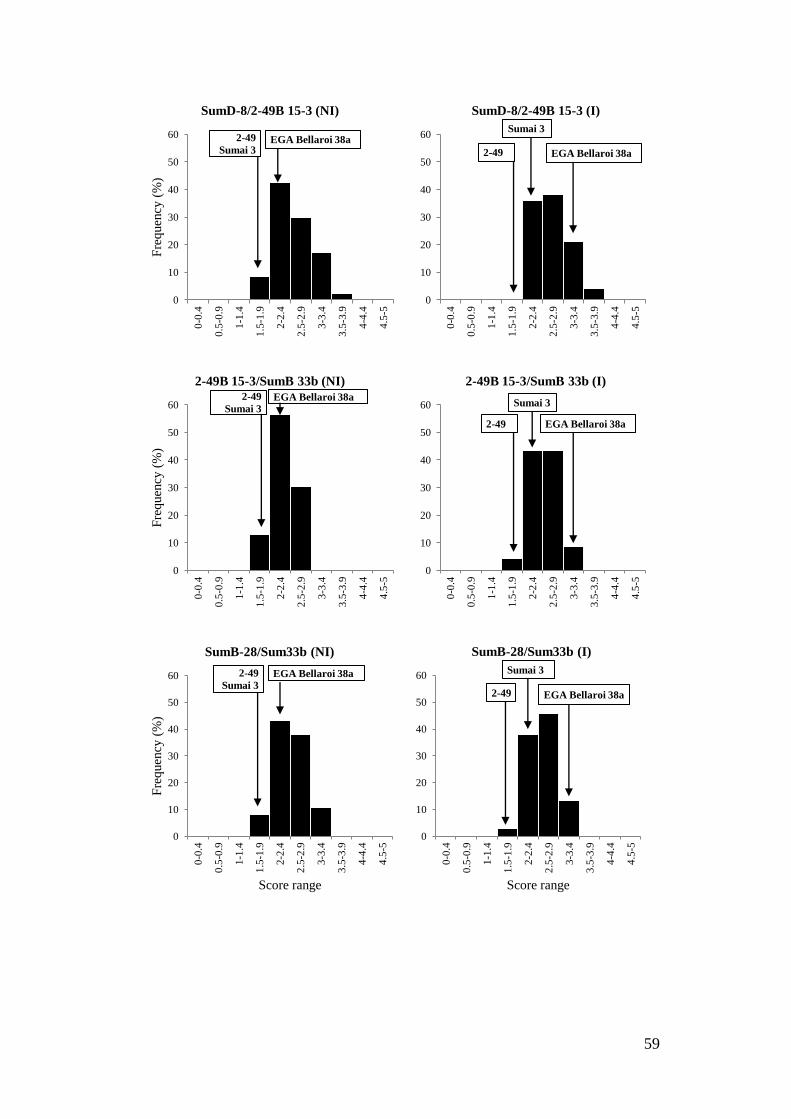
59
0
10
20
30
40
50
60
0-0
.4
0.5
-0.9
1-1
.4
1.5
-1.9
2-2
.4
2.5
-2.9
3-3
.4
3.5
-3.9
4-4
.4
4.5
-5
Fre
quen
cy (
%)
SumD-8/2-49B 15-3 (NI)
2-49
Sumai 3 EGA Bellaroi 38a
0
10
20
30
40
50
60
0-0
.4
0.5
-0.9
1-1
.4
1.5
-1.9
2-2
.4
2.5
-2.9
3-3
.4
3.5
-3.9
4-4
.4
4.5
-5
SumD-8/2-49B 15-3 (I)
2-49
Sumai 3
EGA Bellaroi 38a
0
10
20
30
40
50
60
0-0
.4
0.5
-0.9
1-1
.4
1.5
-1.9
2-2
.4
2.5
-2.9
3-3
.4
3.5
-3.9
4-4
.4
4.5
-5
Fre
quen
cy (
%)
2-49B 15-3/SumB 33b (NI) 2-49
Sumai 3 EGA Bellaroi 38a
0
10
20
30
40
50
60
0-0
.4
0.5
-0.9
1-1
.4
1.5
-1.9
2-2
.4
2.5
-2.9
3-3
.4
3.5
-3.9
4-4
.4
4.5
-5
2-49B 15-3/SumB 33b (I)
2-49
Sumai 3
EGA Bellaroi 38a
0
10
20
30
40
50
60
0-0
.4
0.5
-0.9
1-1
.4
1.5
-1.9
2-2
.4
2.5
-2.9
3-3
.4
3.5
-3.9
4-4
.4
4.5
-5
Fre
quen
cy (
%)
Score range
SumB-28/Sum33b (NI)
2-49
Sumai 3 EGA Bellaroi 38a
0
10
20
30
40
50
60
0-0
.4
0.5
-0.9
1-1
.4
1.5
-1.9
2-2
.4
2.5
-2.9
3-3
.4
3.5
-3.9
4-4
.4
4.5
-5
Score range
SumB-28/Sum33b (I)
2-49
Sumai 3
EGA Bellaroi 38a

60
Fig. 9. Phenotypic assessment of CR severity. The methodology involved assigning a
score from 0 (no symptoms) to 5 (severe symptoms) related to the intensity and extension
of the main stem browning (Wallwork et al. 2004) for each line of each population. The
data are expressed in frequencies (percentage) of the lines’ scores grouped in ranges.
Each pair of charts represents the CR scores of one family for NI and I treatments. The
text boxes indicate which range of CR scores the parents belong to.
In the I treatment, 120 lines (48%) had significantly lower symptoms than
EGA Bellaroi 38a, therefore suggesting that these lines may be consider partially
resistant to CR. Within families, the percentage of partially resistant lines ranged
from 19% in the family Bellaroi38a/SumD-8 to 65% in the family 2-49B 15-
3/SumB 33b (Table 3).

61
Table 3. Partially resistant lines identified across all the populations studied. For
each family, the percentage of lines which were partially resistant to CR are shown. In
parentheses, the number of lines this represents is expressed. Each line has been defined
as partially resistant if its CR score was significantly lower different than the score of
EGA Bellaroi 38a for the I treatment, based on the analysis of variance and the LSD
(least significant difference).
Percentage of partially resistant lines
Family
Size of family
(lines) Treatment I
2-49B 15-3/Bellaroi38a 54 47% (26)
Bellaroi38a/2-49B 3-4 59 54% (32)
Bellaroi38a/SumD-8 32 19% (6)
SumD-8/2-49B 15-3 47 47% (22)
2-49B 15-3/SumB 33b 23 65% (15)
SumB-28/Sum33b 37 51% (19)
All families 252 48% (120)
While EGA Bellaroi 38a and many (59 of 132) of the durum progeny lines
not classified as partially resistant had significantly more severe CR symptoms in
the I treatment than in the NI treatment, there were no significant differences
between the two treatments for the bread wheats 2-49 and Sumai, nor for 112 of
120 (93%) of the durum progeny lines that had been classified as partially
resistant.

62
3.3 Yields of the lines under investigation
Grain yield from the plants under investigation were assessed and in the I
treatment, the highest yielding entry was the parent Sumai 3 with 532 g/m2,
compared to only 264 g/m2 for 2-49, 118 g/m
2 for EGA Bellaroi 38a and 127 g/m
2
for the mean across all entries (LSD = 101 g/m2) (Fig. 10). Compared to the NI
treatment, the yield losses in the I treatment were 5% for Sumai 3, 14% for 2-49,
54% for EGA Bellaroi 38a and 17% considering the mean across all the entries
(Table 4).
Table 4. Yield losses between NI and I treatments. The table shows the yield for NI
and I treatments, expressed in g/m2, referred to the durum parents and the mean across all
the entries. The yield losses between the two treatments shown in the last column are
expressed in percentage.
Treatment NI Treatment I
Yield loss (%)
Sumai 3 560 532
5
2-49 308 264
14
EGA Bellaroi38a 256 118
54
Mean entries 153 127
17
The correlation coefficient (r) between mean CR score and mean yield was -0.44
across all durum lines. Analysing separately the susceptible (S) than the partially
resistant lines, the r highlighted different correlations with values of
-0.45 and -0.24 respectively. Among the families, 2-49B 15-3/Bellaroi38a,
Bellaroi38a/SumD-8 and Bellaroi38a/2-49B 3-4 had the higher negative
correlations.

63
0.0
0.5
1.0
1.5
2.0
2.5
3.0
3.5
0 200 400 600
CR
sco
re
2-49B 15-3/Bellaroi38a
r= -0.61
0.0
0.5
1.0
1.5
2.0
2.5
3.0
3.5
0 200 400 600
Bellaroi38a/2-49B 3-4
r=-0.46
0.0
0.5
1.0
1.5
2.0
2.5
3.0
3.5
0 200 400 600
CR
sco
re
Bellaroi38a/SumD-8
r= -0.48
0.0
0.5
1.0
1.5
2.0
2.5
3.0
3.5
0 200 400 600
SumD-8/2-49B 15-3
r= -0.38
0.0
0.5
1.0
1.5
2.0
2.5
3.0
3.5
0 200 400 600
CR
sco
re
Yield (g/m2)
2-49B 15-3/SumB 33b
r= 0.16
0.0
0.5
1.0
1.5
2.0
2.5
3.0
3.5
0 200 400 600
Yield (g/m2)
SumB-28/Sum33b
r= -0.15

64
Fig. 10. ‘Yield X CR score’ scatter plots. The charts, one for each family, are a visual
representation of CR score and yield for all lines under investigation in the I treatment.
The parents displayed are EGA Bellaroi 38a (■), 2-49 (▲) and Sumai 3 (●). The
correlation coefficients (r), calculated for each family excluding the parents’ data, are
also shown.
Comparing the yield of the treatments NI (mean of 151 g/m2) and I (mean
of 131 g/m2), only 15 lines showed a significant reduction of yield in the samples
subjected to the I treatments.
3.4 Infestation and viability of Fusarium infecting the main stem of the plants
The analysis of the Fusarium isolated from the main stems led to identify
viability, taxonomy, and concentration of the pathogens responsible for the
infection (Fig. 11; Fig. 12). Incubation onto PDA allowed the growth of pink
mycelium (Fig. 11a), as expected for F. pseudograminearum, while the
microscopic observation allowed the identification of canoe-shaped conidia,
typical of F. pseudograminearum and F. culmorum (Fig. 11b). Both of the
observations suggested that viable Fusarium were infecting the main stems of
plant in this study.

65
Fig. 11. Viability of Fusarium infecting the main stem. The viability of Fusarium
infecting the main stems was assessed by using the ‘moist incubation method’ protocol
(Burgess et al. 1988). Eight samples per replicate were chosen from each of the
following: 2-49, Sumai 3, 1 durum line with a low CR score, and 1 durum with a high CR
score. All of these samples were taken from NI and I sub-blocks. Visual (naked-eye)
observations led to the identification of a pink mycelium in PDA culture (a), while the
microscopic observation of the same mycelium led to observing canoe-shaped conidia
(b). The pictures show, as demonstrative example, the susceptible line 174.
After the viability of the isolates was confirmed, molecular analysis was
performed to identify the Fusarium species infecting the main stem (Fig. 12). In
the samples from the NI sub-blocks, the bread wheat parents (2-49 and Sumai 3)
and partially resistant lines showed only low levels of F. culmorum DNA and
little or no F. pseudograminearum DNA. In contrast, high amounts of F.
culmorum DNA were detected in the susceptible lines (Figure 12a). In the I
treatment higher levels of F. pseudograminearum DNA were detected, especially
for the durum lines, with no significant difference between those classified as
partially resistant or susceptible based on symptom severity (Fig. 12b). Moreover,
while the level of F. culmorum remained stable between the two treatments in 2-
49, Sumai 3 and the susceptible samples, it increased in the I treatment of the
partially resistant sample. However a high standard error has been calculated.
a) b)

66
Fig. 12. Molecular analysis of Fusarium isolates infecting the main stem. Graphs
show F. pseudograminearum (light grey bars) and F. culmorum (dark grey bars) infection
of the main stems (expressed in pg of Fusarium DNA/ g of sample) of plants sown in NI
(a) and I (b) sub-blocks. The data are expressed as means (with SE) of the 3 values for 2-
49, Sumai 3, partial resistant lines (PR) and susceptible lines (S). The partial resistant
entries chosen were lines 330 (with CR score of 1.8 for NI treatment and 2 for I, family 2-
49B 15-3/Bellaroi38a), 471 (CR score 2 for NI and 1.9 for I, family Bellaroi38a/2-49B 3-
4) and 486 (CR score 2.3 for NI and 2.1 for I, family Bellaroi38a/2-49B 3-4). The
susceptible lines chosen were lines 174 (with CR score 2.6 for NI and 3.2 for I, family
SumD-8/2-49B 15-3), 359 (CR score 2.4 for NI and 2.7 for I, family Bellaroi38a/SumD-
8) and 508 (CR score of 3 for NI and 3.2 for I, family SumB-28/Sum33b).
0.00E+00
4.00E+05
8.00E+05
1.20E+06
1.60E+06
2.00E+06
Fungal
infe
stat
ion
(pg F
usa
riu
m D
NA
/ g s
amp
le)
a)
0.00E+00
4.00E+05
8.00E+05
1.20E+06
1.60E+06
2.00E+06
Fungal
infe
stat
ion
(p
g F
usa
riu
m D
NA
/ g s
amp
le)
b)

67
3.5 Association analysis
The genotypes of the markers analysed with the 9K SNP array were recorded in
the GenomeStudio file received by Dr Matthew Hayden. For those markers whose
distributions of R and Theta values were ambiguous, the GenomeStudio charts
were visually assessed and the genotypes re-called (Fig. 13).
Fig. 13. GenomeStudio charts. The figure represents two examples of GenomeStudio
charts. The axes represent Norm R and Norm Theta signals. Each chart is divided in three
clusters, each of those represented by a different colour and referred to the three possible
genotypes of a SNP: AA, AB and BB. The numbers below each cluster indicate the
frequency of the entries that are automatically called with that genotype by the software.
In the first example (a) the distribution of the fluorescent signals was clearly indicating
the genotype of each marker, which had been then correctly recorded in the
GenomeStudio file received. The other chart (b) shows an ambiguous result in which the
Norm Theta signals are shifted and GenomeStudio was used to visually examine the
genotypes and re-call them. In this example the entries represented as purple dots,
previously identified as AB genotypes, have been visually re-called AA, and the entries
not called (black dots) have been called AB.
a) b)

68
Among 8634 SNPs on the array, 3122 were scored and 2453 exhibited
polymorphism among the 252 durum progeny lines. The family with the highest
number of polymorphic SNPs (1429) was Bellaroi38a/SumD-8, while 2-49B 15-
3/Bellaroi38a and Bellaroi38a/2-49B 3-4 had only 160 and 301 polymorphic
SNPs respectively. Only two SNPs (wsnp_Ku_c44600_51841068 and
wsnp_JD_rep_c65181_41511534) exhibited significant association with CR
symptom severity (Table 5) across all 252 lines and none exhibited significant
association with CR symptom severity when analysed within individual families.
The SNPs wsnp_Ku_c44600_51841068 and wsnp_JD_rep_c65181_41511534
were polymorphic only in the family Bellaroi38a/SumD-8 (Table 5) and the rare
alleles have been detected in 12 and 10 individuals respectively.

69
Table 5. Association analysis across all the families. The table shows the association between SNPs genotypes and CR severity found analysing all the entries
together. The rare alleles have been detected only in lines belonging to the family Bellaroi38a/SumD-8. No association has been detected when the analysis was
performed on each family separately.
SNP marker
Map position1
Association with
crown rot symptom severity
Mean crown rot severity of genotypic classes
All lines Bellaroi38a/SumD-8 lines
Chromosome cM
p
Additive
effect
% of phenotypic
variation explained
Common
allele
Rare
allele
Common
allele
Rare
allele
wsnp_Ku_c44600_51841068 4A 144.1 <0.001 0.13 9.9 2.6 2.9 2.9 2.9
wsnp_JD_rep_c65181_41511534 7A 84.8 0.006 0.19 21.4 2.6 3.2 2.7 3.2
1 As reported by Cavanagh et al. (2013) on a consensus genetic map for bread wheat

70
3.6 SSR marker analysis
Among the SSR markers that had been reported by Martin et al. (2013) as linked
with QTL for CR resistance (F. pseudograminearum), only those that had been
assessed as high-quality markers for MRT analysis (Hayden et al. 2008) were
used here. Of 10 such markers, six exhibited polymorphism among the 183 lines
from the four families with 2-49 in their pedigrees, and the same six SSRs
exhibited the ‘2-49’ allele in at least some of the lines under investigation with
frequencies being in the range 0.5% and 21.8% (Table 6). There were no cases in
which the mean CR symptom severity of the lines with the same genotype as ‘2-
49’ was significantly different from that of lines with other genotypes.
Table 6. Published QTL for partial resistance to CR. SSR markers associated to
already published QTL found in the lines under study are shown. The table also shows
the chromosomes in which the SSRs have been mapped, the frequency (and in
parenthesis the number) of the lines carrying the ‘2-49’ SSR allele. Two different means
are expressed in the table: for the lines which had the ‘2-49’ genotype and the lines with
genotypes not associated to 2-49 (other genotype).
CR mean
SSR marker Chromosome
Lines with the
‘2-49’genotype
‘2-49’
genotype
Other
genotype(s)
wmc120 1A 6.5%(12) 2.7 2.6
barc148 1A 0.5% (1) 2.5 2.6
wmc216 1B 0.5% (1) 2.3 2.6
wmc1 3B 1% (2) 2.7 2.6
gwm376 3B 8.2%(15) 2.4 2.6
gwm513 4B 21.8%(40) 2.6 2.6

71
4 DISCUSSION AND CONCLUSION

72
4 Discussion and conclusion
This study investigated through phenotypic and genotypic approaches the
susceptibility to CR of 252 lines of durum wheat obtained by crossing bread
wheat varieties with durum parents. Crown rot symptoms were assessed in plants
grown in a field infested by F. culmorum and inoculated with F.
pseudograminearum, and genotypic analysis was performed using SNP and SSR
markers to investigate genotype-phenotype associations for partial resistance to
CR.
Despite some contrary results previously published (Li et al. 2010;
Petrisko et al. 2010), this study demonstrates for the first time that the variety
Sumai 3 has partial resistance to CR and it may be useful as a parent to improve
the partial resistance to CR in durum progenies. This is consistent with what was
reported by Collard et al. (2006), who cited unpublished data of Wildermuth and
colleagues. The different behaviour of Sumai 3 in the experiments of Li et al.
(2010) and Petrisko et al. (2010) may be traced back to the fact that, while the
experiments reported here were conducted in the field, the previous published
papers assessed CR symptoms of plants grown in pots only. Under their
experimental conditions, Sumai 3 had much more severe symptoms than 2-49, but
was not as highly susceptible as some other bread wheat and durum entries. In the
field experiment conducted here, Sumai 3 displayed early vigour, and this may
have contributed it to its partial resistance.
In order to assess which of the entries were partially resistant, just the data
of the I treatment have been considered because, for the NI treatment, there was
no significant difference between the CR scores of the partially resistant 2-49 and
the susceptible EGA Bellaroi 38a. This indicates that the low level of infestation
of the soil for this treatment did not allow to discriminate, for the parents in this
73
instance, between partial resistance and susceptibility. The results of the
phenotypic assessment highlight the enhancement of partial resistance to CR in
the progeny, compared to the durum parent. This improvement is likely to be due
to the use of partially resistant bread wheat as parents, as found in other reports
with different pedigrees being examined (Bovill et al. 2010; Ma et al. 2012;
Martin et al. 2013). In fact, the level of partial resistance detected in the
populations investigated in this study is (on average) greater than in populations
originating from just durum parents and analysed in breeding programs (Jason
Able, pers. comm.).
The ANOVA analysis performed for each family against the score of EGA
Bellaroi 38a, pointed out that the means of the CR score were significantly
reduced in five families out of six. Even if there was the family
Bellaroi38a/SumD-8 for which the mean did not differ from the susceptible
durum parent EGA Bellaroi 38a, six partially resistant lines were detected here.
The high number of partially resistant lines found for the I treatment (48% of the
total number of entries), is probably partly due to the selection against CR that
was imposed during the development of the germplasm by the seed provider.
Comparing the CR severity observed in the NI and I treatment, no significant
difference arose in the majority of the entries, as detected for the parents 2-49 and
Sumai 3. This similarity of scores across the treatments was due to the high
number of partially resistant lines, of which only 7% exhibited a significant
response to the inoculation.
The molecular analysis of the Fusarium species infecting soil led to
consider that asymptomatic infections took part in this experiment; as similarly
reported by Hollaway et al. (2013) who found, in the 20% of their entries, a lack
of association between stem browning and Fusarium infestation of the soil.

74
Likewise, the molecular analysis of the stems, detected in partially resistant lines
levels of F. pseudograminearum similar to those found in plants assessed as
highly susceptible. This indicated that the partial resistance of some entries was
due to mechanisms of tolerance to mycotoxins once the pathogen already infected
the stem, instead of the ability of the plants to resist to the infection of the
pathogen infesting the soil.
The analysis of the yield highlights how CR negatively affects good
yielding varieties like EGA Bellaroi 38a which had the lower yield across the
parents and reduced it from 256 g/m2 (NI treatment) to 118 g/m
2 (I treatment).
Interesting is the outcome for Sumai 3 with a CR severity comparable to 2-49, but
a yield which was significantly higher than all the entries. Comparing the mean of
the yield of all the lines for the I treatment with the mean for the NI treatment, no
significant difference arose (Table 4). This result does not agree with that of
Hollaway et al. (2013) which identified F. pseudograminearum as the pathogen
responsible for more severe yield reduction than F. culmorum. This difference
may be due to the fact that, in this study, even though the number of susceptible
lines was not really high, the CR was severe which resulted in low or null yield.
Consequently, the high variability of yield across the samples resulted in the
average yield for the 2 treatments not being significantly different.
Given that F. culmorum and F. pseudograminearum were both present in
this experiment, the latter especially higher in the I treatment, it is worth
considering which kind of interactions took part in the experiment. Based on yield
loss data, it is not clear whether the two species colonise the stems through a
competitive or mutualistic mechanism. Considering the molecular analysis of
Fusarium colonisation on the stem, the results suggest that the interaction between
the two different species may be different among the different entries. For

75
example, the analysis of Fusarium DNA in the stems of partial resistant lines
highlighted that, even if the infestation of F. culmorum in the soil was the same
for both the treatments, a higher amount of DNA in the stems was detected for the
I treatment than the NI (Fig. 12). This suggests that the presence of F.
pseudograminearum in the I treatment favoured the colonisation of F. culmorum;
acting then synergistically. However these results should be taken carefully
because of the high standard error and the low number of samples analysed, the
latter due to the high cost of the molecular analysis used. The fact that the same
uncertainties arose in the study of Hollaway et al. (2013), suggests that further
studies are required to quantify the different contributions of the two species to the
yield reduction. New experiments could be designed in the field by applying three
different treatments, one for each different block, to the same lines: soil infested
with F. pseudograminearum, soil infested with F. culmorum and soil infested with
both together.
While it was expected that a higher correlation between CR symptoms and
yield would be found for partially resistant lines, surprisingly these had r of -0.24,
while r of -0.45 was obtained for the susceptible lines. These differences may be
due to the different families that contributed to the overall population of lines that
were under study, as yield between these could be expected to vary.
Consequently, when CR was not severe (for partially resistant lines) the
differences in yield between the different families was more evident, leading to
high variability and subsequently a low correlation between CR and yield. On the
contrary, when CR was severe (susceptible lines) the yield reduction made the
correlation between CR score and yield more evident. However, that said, when
analysing the r separately for each family, for some populations there is still no
clear trend between CR severity and yield due to the small size of these.

76
Considering those families with a larger number of individuals (for example the
families 2-49B 15-3/Bellario38a and Bellaroi38a/2-49B 3-4, with 54 and 59
individuals respectively), higher r values were obtained. This may be traced back
to that by analysing plants belonging to the same families, the variability in yield
among the entries is reduced, inverting then the tendency found when analysing
all the families together. Nevertheless, the results concerning the yield should be
analysed carefully because the experiment was designed specifically for CR
symptom analysis with the use of the rows; thus giving a slightly lower reliability
for data concerning the yield.
With analysis conducted within families, no significant associations were
detected between any individual SNP markers and the crown rot severity. With
analysis conducted across all 252 progeny lines, significant associations were
detected for two SNP markers. In both cases, the rarer allele (present in just 10 or
12 lines) was associated with greater symptom severity. In both cases, that allele
was observed only in the Bellaroi38a/SumD-8 family, the family with the highest
mean symptom severity. Accordingly, the significant associations detected for
these two SNP markers simply reflect the overall difference in crown rot severity
between the Bellaroi38a/SumD-8 progeny and the other lines. They are artefacts
of population structure and cannot be considered to reflect true QTL effects.
Considering the high number of partially resistant lines found in this study
and the large number of SNP markers evaluated, it is surprising that differences in
resistance were not found to be associated with any markers. This may be partly
due to the fact that the SNPs included on the array were chosen based on their
ability to distinguish among bread wheat genotypes, whereas here the main
interest was in distinguishing alleles from bread wheat from those present in
durum wheat. A large number of the markers on the array failed to detect any

77
polymorphism among the materials used here. Further, since SNP markers are bi-
allelic they would not have differentiated among all of the parents of the complex
crosses used here. Also the small size of the families may play an important role
in reducing the possibility to find an association between SNP genotype and
partial resistance to CR.
Considering the markers associated with QTL previously identified in 2-49
by Martin et al. (2013), the SSR gwm513 is the most frequently detected in this
study. While this allele clearly differed from the ones detected for EGA Bellaroi
38a and Sumai 3, it is not possible to be certain that it was derived from 2-49 and
not from the parents Durum D and 950329, which were not made available for
marker analysis because of the non-supply of this parental germplasm. Although
no overall difference in CR symptom severity was detected between the 40 lines
with the same allele as 2-49 and the remaining 143 lines which had 2-49 as a
parent, it is worth noting that there was a range in CR score from 2 to 4 among the
40 lines. It could be that the more resistant lines inherited their gwm513 allele
(and the associated resistance allele) from 2-49, while the more susceptible lines
inherited their gwm513 allele from one of the durum parents that was not
genotyped. The same uncertainty was found for the other SSRs analysed, for
which an allele similar to that of 2-49 was observed at low frequencies (ranging
from 0.5% to 8.2%).
In general, the variability of results from crop species when placed under
different environmental conditions and exposed to pathogens, suggests that much
more research is still needed. As the scientific community moves further into
exploring the area of molecular plant breeding, genotypic approaches have the
potential to assist in reducing inconsistent results that can often be found between
phenotypic-based reports. Coupled together, phenotypic and genotypic approaches

78
are crucial in order to minimise the impact of yield loss due to diseases such as
CR. This is particularly important in crops like durum, which is highly susceptible
and less studied than its bread wheat counterpart. Ironically, though, the traits
(such as CR resistance) for which genotypic approaches could be the most
valuable are also those in which genotype-phenotype associations are the most
difficult to discover.
In conclusion, this research provided a phenotypic and a genotypic
evaluation of 252 durum lines that had been developed with the objective of
reducing CR susceptibility by crossing durum wheat with partially resistant bread
wheat. A surprisingly high proportion of the lines were found to have some partial
resistance to CR. The best of these could be further investigated in durum pre-
breeding and breeding programs due to the yield that was obtained. Unfortunately,
none of the molecular markers evaluated here were significantly associated with
differences in CR resistance. While this may be partially due to the limitations of
the materials and markers used here, it is also consistent with the widely held view
that the inheritance of CR resistance is complex, and may involve small-effect
alleles at numerous loci (Bovill et al. 2010). Moreover, this is the first report of
results in the field that demonstrate the bread wheat variety Sumai 3 has partial
resistance to CR.

79
5 References
Able, JA, Crismani, W & Boden, SA 2009, 'Understanding meiosis and the
implications for crop improvement', Functional Plant Biology, vol. 36, pp. 575–
588.
Akhunov, E, Nicolet, C & Dvorak, J 2009, 'Single nucleotide polymorphism
genotyping in polyploid wheat with the Illumina GoldenGate assay', Theoretical
and Applied Genetics, vol. 119, no. 3, pp. 507-517.
Akinsanmi, OA, Mitter, V, Simpfendorfer, S, Backhouse, D & Chakraborty, S
2004, 'Identity and pathogenicity of Fusarium spp. isolated from wheat fields in
Queensland and northern New South Wales', Australian Journal of Agricultural
Research, vol. 55, no. 1, pp. 97-107.
Al-Kaff, N, Knight, E, Bertin, I, Foote, T, Hart, N, Griffiths, S & Moore, G 2008,
'Detailed dissection of the chromosomal region containing the Ph1 locus in wheat
Triticum aestivum: with deletion mutants and expression profiling', Annals of
Botany, vol. 101, no. 6, pp. 863-872.
Alloway, BJ 2008, Zinc in Soils and Crop Nutrition, International Fertilizer
Industry Association and International Zinc Association, second edition, Brussels,
Belgium and Paris, France.
Anderson, OD, Rausch, C, Moullet, O & Lagudah, ES 2003, 'The wheat D-
genome HMW-glutenin locus: BAC sequencing, gene distribution, and
retrotransposon clusters', Functional & Integrative Genomics, vol. 3, no. 1-2, pp.
56-68.
Aoki, T & O'Donnell, K 1999, 'Morphological characterization of Gibberella
coronicola spp. obtained through mating experiments of Fusarium
pseudograminearum', Mycoscience, vol. 40, pp. 443-453.
Australian Wheat Board Ltd, viewed 1 May 2012,
www.awb.com.au/AWBL/Launch/Site/Customers/Content/GrainProducts/Wheat.
Backhouse, D 2006, 'Forecasting the risk of crown rot between successive wheat
crops', Australian Journal of Experimental Agriculture, vol. 46, pp. 1499-1506.

80
Backhouse, D, Abubakar, AA, Burgess, LW, Dennis, JI, Hollaway, GJ,
Wildermuth, GB, Wallwork, H & Henry, FJ 2004, 'Survey of Fusarium species
associated with crown rot of wheat and barley in eastern Australia', Australasian
Plant Pathology, vol. 33, pp. 255-261.
Backhouse, D & Burgess, LW 2002, 'Climatic analysis of the distribution of
Fusarium graminearum, F. pseudograminearum and F. culmorum on cereals in
Australia', Australasian Plant Pathology, vol. 31, no. 4, pp. 321-327.
Beddis, A & Burgess, L 1992, 'The influence of plant water stress on infection
and colonization of wheat seedlings by Fusarium graminearum Group 1',
Phytopathology, vol. 82, no. 1, pp. 78-83.
Bentley, AR, Summerell, BA & Burgess, LW 2008, 'Sexual compatibility in
Fusarium pseudograminearum (Gibberella coronicola)', Mycological Research,
vol. 112, no. 9, pp. 1101-1106.
Benyon, FHL, Burgess, L & Sharp, P 2000, 'Molecular genetic investigations and
reclassification of Fusarium species in sections Fusarium and Roseum',
Mycological Research, vol. 104, no. 10, pp. 1164-1174.
Bovill, WD, Horne, M, Herde, D, Davis, M, Wildermuth, GB & Sutherland, MW
2010, 'Pyramiding QTL increases seedling resistance to crown rot (Fusarium
pseudograminearum) of wheat (Triticum aestivum)', Theoretical and Applied
Genetics, vol. 121, no. 1, pp. 127-136.
Bovill, WD, Ma, W, Ritter, K, Collard, BCY, Davis, M, Wildermuth, GB &
Sutherland, MW 2006, 'Identification of novel QTL for resistance to crown rot in
the doubled haploid wheat population 'W21MMT70' x 'Mendos'', Plant Breeding,
vol. 125, pp. 538-543.
Bureau of Meteorology 2012, viewed 30 September 2013, Daily Weather
Observations. Available at: www.bom.gov.au/climate.
Bureau of Meteorology 2013, viewed 30 September 2013, Daily Weather
Observations. Available at: www.bom.gov.au/climate.
Burgess, LW, Backhouse, D, Summerell, BA, Pattison, AB, Klein, TA, Esdaile,
RJ & Ticehurst, G 1993, 'Long-term effects of stubble management on the
incidence of infection of wheat by Fusarium graminearum Schw. Group 1'.
Australian Journal of Experimental Agriculture, vol. 33, pp 451-456.

81
Burgess, LW, Backhouse, D, Summerell, BA & Swan, L 2001, Crown rot of
wheat. In ‘Fusarium: Paul E. Nelson memorial symposium’.(Eds BA Summerell,
JF Leslie, D Backhouse, WL Bryden, LW Burgess) pp. 271–294, APS Press: St
Paul, MN.
Burgess, LW & Bryden, WL 2012, 'Fusarium: a ubiquitous fungus of global
significance', Microbiology, vol. 22, pp. 22-25.
Burgess, LW, Liddell, CM & Summerell, BA 1988, Laboratory Manual for
Fusarium Research: Incorporating a Key and Descriptions of Common Species
Found in Australia, Second Edn, University of Sydney, Sydney, Australia.
Cakmak, I 2000, 'Tansley Review No. 111. Possible roles of zinc in protecting
plant cells from damage by reactive oxygen species', New Phytologist, vol. 146,
no. 2, pp. 185-205.
Cavanagh, CR, Chao, S, Wangc, S, Huang, BE, Stephen, S, Kiani, S, Forrest, K,
Saintenac, C, Brown-Guedira, GL, Akhunova, A, See, D, Bai, G, Pumphrey, M,
Tomar, L, Wonge, D, Konge, S, Reynoldsk, M, da Silva, ML, Bockelman, H,
Talbert, L, Anderson, JA, Dreisigacker, S, Baenziger, S, Carter, A, Korzun, V,
Morrell, PL, Dubcovsky, J, Morell, MK, Sorrells, ME, Hayden, MJ & Akhunov,
E. 2013, ‘Genome-wide comparative diversity uncovers multiple targets of
selection for improvement in hexaploid wheat landraces and cultivars’, PNAS, vol.
110, no. 20, pp. 8057-8062.
Chakraborty, S, Liu, CJ, Mitter, V, Scott, JB, Akinsanmi, OA, Ali, S, Dill-Macky,
R, Nicol, J, Backhouse, D & Simpfendorfer, S 2006, 'Pathogen population
structure and epidemiology are keys to wheat crown rot and Fusarium head blight
management', Australasian Plant Pathology, vol. 35, pp. 643–655.
Champeil, A, Doré, T & Fourbet, JF 2004, 'Fusarium head blight: epidemiological
origin of the effects of cultural practices on head blight attacks and the production
of mycotoxins by Fusarium in wheat grains', Plant Science, vol. 166, no. 6, pp.
1389-1415.
Chantret, N, Salse, J, Sabot, F, Rahman, S, Bellec, A, Laubin, B, Dubois, I,
Dossat, C, Sourdille, P, Joudrier, P, Gautier, MF, Cattolico, L, Beckert, M,
Aubourg, S, Weissenbach, J, Caboche, M, Bernard, M, Leroy, P & Chalhoub, B
2005, 'Molecular basis of evolutionary events that shaped the hardness locus in
diploid and polyploid wheat species (Triticum and Aegilops)', Plant Cell, vol. 17,
no. 4, pp. 1033-1045.

82
Ching, A, Caldwell, K, Jung, M, Dolan, M, Smith, O, Tingey, S, Morgante, M &
Rafalski, A 2002, 'SNP frequency, haplotype structure and linkage disequilibrium
in elite maize inbred lines', BMC genetics, vol. 3, no. 1, pp. 19-32.
Clear, R & Patrick, S 2000, 'Fusarium head blight pathogens isolated from
Fusarium-damaged kernels of wheat in western Canada, 1993 to 1998', Canadian
Journal of Plant Pathology, vol. 22, no. 1, pp. 51-60.
Collard, BCY, Grams, RA, Bovill, WD, Percy, CD, Jolley, R, Lehmensiek, A,
Wildermuth, G & Sutherland, MW 2005a, 'Development of molecular markers for
crown rot resistance in wheat: mapping of QTLs for seedling resistance in a ‘2-49’
X 'Janz' population', Plant Breeding, vol. 124, pp. 532-537.
Collard, BCY & Mackill DJ 2008, ‘Marker-assisted selection: an approach for
precision plant breeding in the twenty-first century’, The Phiosophical
Transactions of the Royal Society of Biological Siences, vol. 363, pp. 557-572.
Collard, BCY, Jahufer, MZZ, Brouwer, JB & Pang, ECK 2005b, 'An introduction
to markers, quantitative trait loci (QTL) mapping and marker-assisted selection
for crop improvement: The basic concepts', Euphytica, vol. 142, no. 1-2, pp. 169-
196.
Collard, BCY, Jolley, R, Bovill, WD, Grams, RA, Wildermuth, GB & Sutherland,
MW 2006, 'Confirmation of QTL mapping and marker validation for partial
seedling resistance to crown rot in wheat line '2-49'', Australian Journal of
Agricultural Research, vol. 57, no. 9, pp. 967-973.
Connell, P, Lawrance, L & Nelson, R 2004, 'Durum Wheat Australia’s role in
world markets', Australian Commodities, vol. 11, no. 2, pp. 319-324.
Covarelli, L, Beccari, G, Steed, A & Nicholson, P 2012, ‘Colonization of soft
wheat following infection of the stem base by Fusarium culmorum and
translocation of deoxynivalenol to the head’, Plant Pathology, Vol. 61, pp.1121-
1129.
Daniel, R & Simpfendorfer, S 2008, The impact of crown rot on winter cereal
yields, viewed 20 July 2012,
www.grdc.com.au/uploads/documents/GRDC%20update%202008%20crown%20
rot%20impact%20on%20yield.doc.
Dekkers, JCM & Hospital, F 2002, 'The use of molecular genetics in the
improvement of agricultural populations', Nature Review Genetics, vol. 3, p. 23.

83
Desjardins, AE, Brown, DW, Yun, SH, Proctor, RH, Lee, T, Plattner, RD, Lu, SW
& Turgeon, BG 2004, 'Deletion and complementation of the mating type (MAT)
locus of the wheat head blight pathogen Gibberella zeae', Applied and
Environmental Microbiology, vol. 70, no. 4, pp. 2437-2444.
Dodman, R & Wildermuth, G 1989, 'The effect of stubble retention and tillage
practices in wheat and barley on crown rot caused by Fusarium graminearum
Group 1', Plant Protection Quarterly, vol. 4, no. 3, pp 98-99.
Dubcovsky, J & Dvorak, J 2007, 'Genome plasticity a key factor in the success of
polyploid wheat under domestication', Science, vol. 316, no. 5833, pp. 1862-1866.
Dvorak, J, Luo, M-C & Akhunovl, ED 2011, 'N.I. Vavilov's theory of centres of
diversity in the light of current understanding of wheat diversity, domestication
and evolution', Czech Journal of Genetics and Plant Breeding, vol. 47, pp. S20-
S27.
Dvorak, J, Luo, MC, Yang, ZL & Zhang, HB 1998, 'The structure of the Aegilops
tauschii genepool and the evolution of hexaploid wheat', Theoretical and Applied
Genetics, vol. 97, no. 4, pp. 657-670.
Eberhard, FS, Zhang, P, Lehmensiek, A, Hare, RA, Simpfendorfer, S &
Sutherland, MW 2010, ‘Chromosome composition of an F2 Triticum aestivum x
T. turgidum spp. durum cross analysed by DArT markers and MCFISH’ Crop and
Pasture Science, vol. 61, pp. 619-624.
Fauroux, B, Hart, N, Belfar, S, Boulé, M, Tillous-Borde, I, Bonnet, D, Bingen, E
& Clément, A 2004, 'Burkholderia cepacia is associated with pulmonary
hypertension and increased mortality among cystic fibrosis patients', Journal of
Clinical Microbiology, vol. 42, no. 12, pp. 5537-5541.
Fernandez, MR & Zentner, RP 2005, 'The impact of crop rotation and N fertilizer
on common root rot of spring wheat in the brown soil zone of western Canada',
Canadian Journal of Plant Science, pp. 569-575.
Feuillet, C & Keller, B 2004, 'Molecular markers for disease resistance. The
example wheat, biotechnology in agriculture and forestry', vol. 55, Springer-
Verlag, Berlin Heidelberg, vol. 85, no. 3, pp. 353-370.
Ganal, MW & Roder, MS 2007, 'Microsatellite and SNP markers in wheat
breeding', Genomics Assisted Crop Improvement, vol. 2, pp. 1-24.

84
Gianibelli, MC, Sissons, MJ & Batey, IL 2005, 'Effect of Source and Proportion
of Waxy Starches on Pasta Cooking Quality', Cereal Chemistry, vol. 82, no. 3, pp.
321-327.
Grewal, HS, Graham, RD & Rengel, Z 1996, 'Genotypic variation in zinc
efficiency and resistance to crown rot disease (Fusarium graminearum Schw.
Group 1) in wheat', Plant and Soil, vol. 186, pp. 219-226.
Griffiths, S, Sharp, R, Foote, TN, Bertin, I, Wanous, M, Reader, S, Colas, I &
Moore, G 2006, 'Molecular characterization of Ph1 as a major chromosome
pairing locus in polyploid wheat', Nature, vol. 439, pp. 749-752.
Gu, YQ, Coleman-Derr, D, Kong, X & Anderson, OD 2004, 'Rapid genome
evolution revealed by comparative sequence analysis of orthologous regions from
four triticeae genomes', Plant Physiology, vol. 135, no. 1, pp. 459-470.
Hayden, H, Carlier, J & Aitken, E 2005, 'The genetic structure of Australian
populations of Mycosphaerella musicola suggests restricted gene flow at the
continental scale', Phytopathology, vol. 95, no. 5, pp. 489-498.
Hayden, MJ, Nguyen, TM, Waterman, A & Chalmers, KJ 2008 ‘Multiplex-Ready
PCR: A new method for multiplexed SSR and SNP genotyping’, BMC Genomics,
vol. 9, no. 80, pp 1-12.
Hollaway, GJ, Evans, ML, Wallwork, H, Dyson CB & McKay AC 2013, ‘Yield
Loss in Cereals, Caused by Fusarium culmorum and F. pseudograminearum, Is
Related to Fungal DNA in Soil Prior to Planting, Rainfall, and Cereal Type’,
Plant Disease, vol. 97, pp. 977-982.
Huang, Y & Wong, P 1998, 'Effect of Burkholderia (Pseudomonas) cepacia and
soil type on the control of crown rot in wheat', Plant and Soil, vol. 203, no. 1, pp.
103-108.
Jaccoud, D, Peng, K, Feinstein, D & Kilian, A 2001, ‘Diversity Arrays: a solid
state technology for sequence information independent genotyping’, Nucleic Acids
Reearch, vol. 29, no. 4 e25, pp.1-7.
Jantasuriyarat, C, Vales, MI, Watson, CJ & Riera-Lizarazu, O 2004,
'Identification and mapping of genetic loci affecting the free-threshing habit and
spike compactness in wheat ( Triticum aestivum L.)', Theoretical and Applied
Genetics, vol. 108, no. 2, pp. 261-273.
Kasha, KJ 1999, 'Biotechnology and world food supply', Genome, vol. 42, no. 4,
pp. 642-645.

85
Kashkush, K, Feldman, M & Levy, AA 2002, 'Gene loss, silencing and activation
in a newly synthesized wheat allotetraploid', Genetics, vol. 160, pp. 1651-1659.
Khlestkina, EK & Salina, EA 2006, 'SNP markers: Methods of analysis, ways of
development, and comparison on an example of common wheat', Russian Journal
of Genetics, vol. 42, no. 6, pp. 585-594.
Khoshgoftarmanesh, AH, Kabiri, S, Shariatmadari, H, Sharifnabi, B & Schulin, R
2010, 'Zinc nutrition effect on the tolerance of wheat genotypes to Fusarium root-
rot disease in a solution culture experiment', Soil Science and Plant Nutrition, vol.
56, no. 2, pp. 234-243.
Kirkegaard, J, Simpfendorfer, S, Holland, J, Bambach, R, Moore, K & Rebetzke,
G 2004, 'Effect of previous crops on crown rot and yield of durum and bread
wheat in northern NSW', Australian Journal of Agricultural Research, vol. 55, no.
3, pp. 321-334.
Klein, TA, Ellison, FW & Burgess, LW 1991, 'The incidence and spatial patterns
of wheat plants infected by Fusarium graminearum Group 1 (soil borne fungus)
and the effects of crown rot on yield', Australian Journal of Agricultural
Research, vol. 42, pp. 399-407.
Kumar, A & Bennetzen, JL 1999, 'Plant retrotransposons', Annual Review of
Genetics, vol. 33, no. 1, pp. 479-532.
Láday, M, Bagi, F, Mesterhazy, A & Szecsi, A 2000, 'Isozyme evidence for two
groups of Fusarium graminearum', Mycological Research, vol. 104, no. 7, pp.
788-793.
Lamprecht, SC, Marasas, WFO, Hardy, MB & Calitz, FJ 2006, 'Effect of crop
rotation on crown rot and the incidence of Fusarium pseudograminearum in
wheat in the Western Cape, South Africa', Australasian Plant Pathology, vol. 35,
pp. 419-426.
Lander, E & Kruglyak, L 1995, 'Genetic dissection of complex traits: guidelines
for interpreting and reporting linkage results', Nature genetics, vol. 11, p. 241.
Leslie, JF & Summerell, BA 2006, The Fusarium Laboratory Manual, First edn,
Blackwell Publishing Professional, Iowa, USA.
Li, HB, Xie, GQ, Ma, J, Liu, GR, Wen, SM, Ban, T, Chakraborty, S & Liu, CJ
2010, 'Genetic relationships between resistances to Fusarium head blight and
crown rot in bread wheat (Triticum aestivum L.)', Theoretical and Applied
Genetics, vol. 121, no. 5, pp. 941-950.

86
Liddell, CM & Burgess, LW 1988, 'Wax partionated soil columns to study the
influence of soil moisture potential on the infection of wheat by Fusarium
graminearum group 1', The American Phytopathological Society, vol. 2, pp. 185-
189.
Limaux, F, Recous, S, Meynard, J-M & Guckert, A 1999, 'Relationship between
rate of crop growth at date of fertiliser N application and fate of fertiliser N
applied to winter wheat', Plant and Soil, vol. 214, pp. 49-59.
Liu, C, Magner, T, Mitter, V, Ban, T & Chakraborty, S 2004, 'Relationship
between resistance to Fusarium head blight and crown rot in hexaploid wheat'. In
‘4th
International Crop Science Congress’, Brisbane, Queensland, Australia, 26
Sep - 1 Oct 2004.
Liu, S & Anderson, JA 2003, 'Marker assisted evaluation of Fusarium head blight
resistant wheat germplasm', Crop Science, vol. 43, no. 3, pp. 760-766.
López-Bellido, L, López-Bellido, RJ & López-Bellido, FJ 2006, 'Fertilizer
nitrogen efficiency in durum wheat under rainfed mediterranean conditions: effect
of split application', Agronomy Journal, vol. 98, no. 1, p. 55.
Luo, MC, Yang, ZL, You, FM, Kawahara, T, Waines, JG & Dvorak, J 2007, 'The
structure of wild and domesticated emmer wheat populations, gene flow between
them, and the site of emmer domestication', Theoretical and Applied Genetics,
vol. 114, no. 6, pp. 947-959.
Ma, J, Zhang, CY, Liu, YX, Yan, GJ & Liu CJ 2012. ‘Enhancing Fusarium
crown rot resistance of durum wheat by introgressing chromosome segments from
hexaploid wheat’, Euphytica, vol. 186, pp. 67-73.
Maccaferri, M, Sanguineti, MC, Corneti, S, Ortega, JL, Salem, MB, Bort, J,
DeAmbrogio, E, del Moral, LF, Demontis, A, El-Ahmed, A, Maalouf, F,
Machlab, H, Martos, V, Moragues, M, Motawaj, J, Nachit, M, Nserallah, N,
Ouabbou, H, Royo, C, Slama, A & Tuberosa, R 2008, 'Quantitative trait loci for
grain yield and adaptation of durum wheat (Triticum durum Desf.) across a wide
range of water availability', Genetics, vol. 178, no. 1, pp. 489-511.
MacLeod, B, Vanstone, V, Khangura, R, Perth, S & Beard, C 2008, Root disease
under intensive cereal production systems, Bulletin of May 2008, Department of
Agriculture and Food, State of Western Australia.
Martin, A, Simpfendorfer, S, Hare, RA & Sutherland, MW 2013, ‘Introgression of
hexaploid sources of crown rot resistance into durum wheat’ Euphytica, vol. 192,
no. 3, pp. 463-470.

87
Matsuoka, Y 2011, 'Evolution of polyploid triticum wheats under cultivation: the
role of domestication, natural hybridization and allopolyploid speciation in their
diversification', Plant & Cell Physiology, vol. 52, no. 5, pp. 750-764.
Miedaner, T, Cumagun, CJR & Chakraborty, S 2008, 'Population genetics of three
important head blight pathogens Fusarium graminearum, F. pseudograminearum
and F. culmorum', Journal of Phytopathology, vol. 156, pp. 129-139.
Miyan, S, Hüberli, D, Connor, M & MacLeod, B 2013 Management options for
crown rot control in Western Australia, viewed 13 August 2013
researchrepository.murdoch.edu.au/14044/1/Management_options_for_Crown_ro
t_in_Western_Australia.pdf.
Mohler, V, Bauer, C, Schweizer, G, Kempf, H & Hartl, L 2013, ‘Pm50: a new
powdery mildew resistance gene in common wheat derived from cultivated
emmer’, Journal of Applied Genetics, vol. 54, pp. 259-263.
Moretti, A, & Susca, A 2009, ‘Fusarium’ in Dongiou Liu edn, Molecular
Detection of Foodborne Pathogens, pp. 577-592.
Mori, N, Ishi, T, Ishido, T, Hirosawa, S, Watatani, H, Kawahara, T, Nesbitt, M,
Belay, G, Takumi, S, Ogihara, Y & Nakamura, C 2003, ‘Origins of domesticated
emmer and common wheat inferred from chloroplast DNA fingerprinting’,
Instituto Sperimentale per la Cerealicoltura, Rome, Italy Pogna NE, Romano M,
Pogna EA, Galterio G edn, Proceedings of the 10th International Wheat Genetics
Symposium, pp. 25-28.
Mudge, AM, Dill-Macky, R, Dong, Y, Gardiner, DM, White, RG & Manners JM
2006, ‘A role for the mycotoxin deoxynivalenol in stem colonisation during
crown rot disease of wheat caused by Fusarium graminearum and Fusarium
pseudograminearum’, Physiological and Molecular Plant Pathology, vol. 69, pp.
73-85.
Murray, GM & Brennan JP 2009, ‘Estimating disease losses to the Australian
wheat industry’ Australasian Plant Pathology, vol. 38, pp. 558-570.
Nalam, VJ, Vales, MI, Watson, CJ, Kianian, SF & Riera-Lizarazu, O 2006, 'Map-
based analysis of genes affecting the brittle rachis character in tetraploid wheat
(Triticum turgidum L.)', Theoretical and Applied Genetics, vol. 112, no. 2, pp.
373-381.

88
Nesbitt, M, & Samuel, D 1996, ‘From stable crop to extinction? The archaeology
and history of the hulled wheats’, In Hulled wheats, Rome (Italy), Padulosi S,
Hammer K, Heller J, edn, International Plant Genetic Resources Institute, pp. 41-
100.
Nicol, J, Bagci, A, Hekimhan, H, Bolat, N, Braun, H & Trethowan, R 2004,
‘Strategy for the identification and breeding of resistance to dryland root rot
complex for international spring and winter wheat breeding programs’, in 4th
International Crop Science Congress, Brisbane, Queensland, Australia, 26 Sep - 1
Oct 2004 www.cropscience.org.au/icsc2004/poster/3/7/2/1322_nicol.htm.
Oliphant, A, Barker, DL, Stuelpnagel, JR & Chee, MS 2002, ‘BeadArray
Technology: Enabling an Accurate, Cost-Effective Approach to High-Throughput
Genotyping’, BioTechniques, vol. 32, pp. S56-S61.
Ophel-Keller, K, McKay, A, Hartley, D, Herdina, A, & Curran, J 2008,
'Development of a routine DNA-based testing service for soilborne diseases in
Australia', Australasian Plant Pathology, vol. 37, pp. 243-253.
Ortiz, R 1998, 'Critical role of plant biotechnology for the genetic improvement of
food crops: perspectives for the next millennium', Electronic Journal of
Biotechnology, vol. 1, no. 3, pp. 16-17.
Ozkan, H, Brandolini, A, Pozzi, C, Effgen, S, Wunder, J & Salamini, F 2005, 'A
reconsideration of the domestication geography of tetraploid wheats', Theoretical
and Applied Genetics, vol. 110, no. 6, pp. 1052-1060.
Ozkan, H, Levy, AA & Feldman, M 2001, 'Allopolyploidy-Induced Rapid
Genome Evolution in the Wheat (Aegilops–Triticum) Group', The Plant Cell, vol.
13, pp. 1735-1747.
Paterson, AH 1996, 'Making genetic maps', pp. 23-39 , in Genome mapping in
plants (Biotechnology intelligence unit), A.H. Paterson edn, Landes Company,
San Diego, California; Academic Press, Austin, Texas.
Pallotta, MA, Graham, RD, Langridge, P, Sparrow, DHB & Barke, SJ 2000,
‘RFLP mapping of manganese efficiency in barley’, Theoretical and Applied
Genetics, vol. 101, no. 7, pp. 1110-1108.
Paulitz, TC, Schroeder, KL & Schillinger, WF 2010, 'Soilborne pathogens of
cereals in an irrigated cropping system: effects of tillage, residue management,
and crop rotation', Plant Disease, vol. 94, no. 1, pp. 61-68.

89
Petrisko, JE, Knight, N & Sutherland, MW 2010, 'Progress in comparing
Fusarium pseudograminearum infection levels and crown rot symptoms in stem
internodes of cereals', in University of Southern Queensland Centre for Systems
Biology, Toowoomba, 4350 Queensland (ed.), 6th Australasian Soilborne
Diseases Symposium, p. 74.
Pettitt, T, Xu, X & Parry, D 2003, 'Association of Fusarium species in the wheat
stem rot complex', European Journal of Plant Pathology, vol. 109, pp. 769-774.
Pettitt, TR & Parry, DW 2001, 'Effect of temperature on Fusarium foot rot of
wheat’, in Fusarium: Paul E Nelson Memorial Symposium, eds BA Summerell, JF
Leslie, D Backhouse, WL Bryden, LW Burgess pp. 145-160.
Ponzielli, P 2013 24 maggio 2013 - 4th Incontro Internazionale della Filiera
Cereagricola, viewed 1 May 2012, www.romacereali.com/wp-
content/uploads/2013/06/2013-ROMACEREALI_13-06-2013_DOC.pdf.
Rafalski, A 2002, 'Applications of single nucleotide polymorphisms in crop
genetics', Current Opinion in Plant Biology, vol. 5, no. 2, pp. 94-100.
Reynolds, MP & Borlaug, NE 2006, 'Impacts of breeding on international
collaborative wheat improvement', The Journal of Agricultural Science, vol. 144,
no. 1, p. 3.
Rogowsky, PM, Guider, ELY, Langridge, P, Shepherd, KW & Koebner, RMD
1991, 'Isolation and characterization of wheat-rye recombinants involving
chromosome arm 1DS of wheat', Theoretical and Applied Genetics, vol. 82, pp.
537-544.
Rossi, V, Cervi, C, Chiusa, G & Languasco, L 1995, 'Fungi associated with foot
rots on winter wheat in northwest Italy', Journal of Phytopathology, vol. 143, no.
2, pp. 115-119.
Rummery, G, Daniel, R & Simpfendorfer, S 2007, 'Inter-row crown rot
management – the results are in', Southern Australia Focus.
Satorre, EH & Slafer, GA 1999, Wheat: Ecology and physiology of yield
determination, EH Satorre and GA Slafer edn, Binghamton, NY.
Sharma, R, Sissons, MJ, Rathjen, AJ & Jenner, CF 2002, 'The Null-4A Allele at
the Waxy Locus in Durum Wheat affects Pasta Cooking Quality', Journal of
Cereal Science, vol. 35, no. 3, pp. 287-297.

90
Simpfendorfer, S, Verrell, A, Nash, P & Moore, KJ 2005, ‘Crown rot – the
burning issue’, In The 15th Biennial Australasian Plant Pathology Society
Conference, Geelong 26-29 September 2005.
Smiley, RW, Gourlie, JA, Easley, SA, Patterson, LM & Whittaker, RG 2005,
'Crop Damage Estimates for Crown Rot of Wheat and Barley in the Pacific
Northwest', Plant Disease, vol. 89, no. 6, pp. 595-604.
Soltis, PS & Soltis, DE 2000, 'The role of genetic and genomic attributes in the
success of polyploids', PNAS, vol. 97, pp. 7051-7057.
Southwell, RJ, Moore, KJ, Manning, W & Hayman, PT 2003, 'An outbreak of
Fusarium head blight of durum wheat on the Liverpool Plains in northern New
South Wales in 1999', Australasian Plant Pathology, vol. 32, no. 4, pp. 465-471.
Summerell, BA, Burgess, LW, Backhouse, D, Bullock, S & Swan, LJ 2001,
'Natural occurrence of perithecia of Gibberella coronicola on wheat plants with
crown rot in Australia', Australasian Plant Pathology, vol. 30, pp. 353-356.
Trail, F, Haixin, X, Rachel, L & David, G 2002, 'Physiological and environmental
aspects of ascospore discharge in Gibberella zeae (anamorph Fusarium
graminearum)', Mycologia, vol. 94, no. 2, pp. 181-189.
Troccoli, A, Borrelli, GM, De Vita, P, Fares, C & Di Fonzo, N 2000, 'Mini
Review: Durum Wheat Quality: A Multidisciplinary Concept', Journal of Cereal
Science, vol. 32, no. 2, pp. 99-113.
Turner, M, Mukai, Y, Leroy, P, Charef, B, Appels, R & Rahman, S 1999, 'The Ha
locus of wheat: Identification of a polymorphic region for tracing grain hardness
in crosses', Genome, vol. 42, pp. 1242-1250.
Vijayakumar, C, Wolf-Hall, C & Manthey, F 2005, 'Fusarium Infection, DON
Content and Microbial Loads in Durum Wheat from the Northern Plains: 2001-
2004', p. 181 in SM Canty, T Boring, J Wardwell, L Siler & RW Ward eds,
Proceedings of the 2005 National Fusarium Head Blight Forum, Hilton
Milwaukee City Center Milwaukee, Wisconsin, 11-13 December 2005.
Vinale, F, Sivasithamparam, K, Ghisalberti, EL, Marra, R, Woo, SL & Lorito, M
2008, 'Trichoderma–plant–pathogen interactions', Soil Biology and Biochemistry,
vol. 40, no. 1, pp. 1-10.
Wade, MJ, Winther, RG, Agrawal, AF & Goodnight, CJ 2001, 'Alternative
definitions of epistasis: dependence and interaction', Trends in Ecology &
Evolution, vol. 16, no. 9, pp. 498-504.

91
Wallwork, H, Butt, M, Cheong, JPE & Williams, KJ 2004, 'Resistance to crown
rot in wheat identified through an improved method for screening adult plants',
Australasian Plant Pathology, vol. 33, pp. 1-7.
Wildermuth, GB, Thomas, GA, Radford, BJ, McNamara, RB & Kelly, A 1997,
'Crown rot and common root rot in wheat grown under different tillage and
stubble treatments in southern Queensland, Australia', Soil & Tillage Research,
vol. 44, pp. 211-224.
Williams, KJ, Dennis, JI, Smyl, C & Wallwork, H 2002, 'The application of
species-specific assays based on the polymerase chain reaction to analyse
Fusarium crown rot of durum wheat', Australasian Plant Pathology, vol. 31, pp.
119-127.
Winter, P & Kahl, G 1995, 'Molecular marker technologies for plant
improvement', World Journal of Microbiology and Biotechnology, vol. 11, no. 4,
pp. 438-448.
Wong, PTW, Mead, J & Croff, M 2002, 'Effect of temperature, moisture, soil type
and Trichoderma species on the survival of Fusarium pseudograminearum in
wheat straw', Australasian Plant Pathology, vol. 31, no. 3, pp. 253-257.
Zadok, JC 1999, 'Reflections on space, time and diversity', Annual Review of
Phytopathology, vol. 37, pp. 1-17.
Zhu, Y, Song, Q, Hyten, D, Van Tassell, C, Matukumalli, L, Grimm, D, Hyatt, S,
Fickus, E, Young, N & Cregan, P 2003, 'Single-nucleotide polymorphisms in
soybean', Genetics, vol. 163, no. 3, pp. 1123-1134.

![Abbreviations List - classics.oxfordre.com · Oxford Classical Dictionary – Abbreviations List B. Authors and Books Note: [- -] names of authors or works in square brackets indicate](https://img.pdfslide.us/doc/110x75/5e0ae6e1cdb9ab64f51f3b0d/abbreviations-list-oxford-classical-dictionary-a-abbreviations-list-b-authors.jpg)


![Abbreviations List[1]](https://img.pdfslide.us/doc/110x75/577cc4991a28aba71199ddf5/abbreviations-list1.jpg)