Embed Size (px)
Citation preview
KFRI Research Report 156
EVALUATING PLANT DIVERSITY IN DIFFERENT FOREST TYPES
OF KERALA BY LAYING OUT PERMANENT SAMPLE PLOTS
U.M. Chandrashekara A.R.R. Menon K.K.N. Nair N. Sasidharan
K. Swarupanandan
KERALA FOREST RESEARCH INSTITUTE PEECHI, THRISSUR
Octo ber 1998 Pages: 86
CONTENTS
Page File
Abstract i r.156.2
1 Introduction 1 r.156.3
2 Methodology 2 r.156.4
3 Results and Discussion 18 r.156.5
4 Conclusion 71 r.156.6
5 References 73 r.156.7
6 Appendices 76 r.156.8
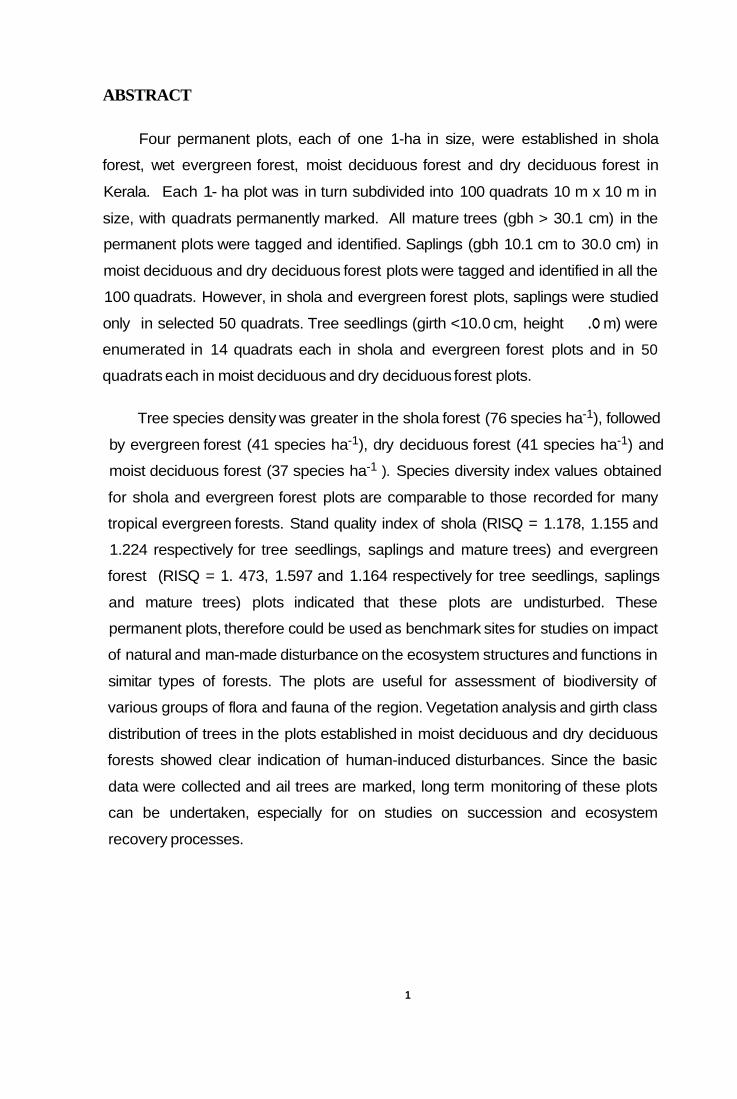
ABSTRACT
Four permanent plots, each of one 1-ha in size, were established in shola
forest, wet evergreen forest, moist deciduous forest and dry deciduous forest in
Kerala. Each 1- ha plot was in turn subdivided into 100 quadrats 10 m x 10 m in
size, with quadrats permanently marked. All mature trees (gbh > 30.1 cm) in the
permanent plots were tagged and identified. Saplings (gbh 10.1 cm to 30.0 cm) in
moist deciduous and dry deciduous forest plots were tagged and identified in all the
100 quadrats. However, in shola and evergreen forest plots, saplings were studied
only in selected 50 quadrats. Tree seedlings (girth <10.0 cm, height <1.O m) were
enumerated in 14 quadrats each in shola and evergreen forest plots and in 50
quadrats each in moist deciduous and dry deciduous forest plots.
Tree species density was greater in the shola forest (76 species ha-1), followed
by evergreen forest (41 species ha-1), dry deciduous forest (41 species ha-1) and
moist deciduous forest (37 species ha-1 ). Species diversity index values obtained
for shola and evergreen forest plots are comparable to those recorded for many
tropical evergreen forests. Stand quality index of shola (RISQ = 1.178, 1.155 and
1.224 respectively for tree seedlings, saplings and mature trees) and evergreen
forest (RISQ = 1. 473, 1.597 and 1.164 respectively for tree seedlings, saplings
and mature trees) plots indicated that these plots are undisturbed. These
permanent plots, therefore could be used as benchmark sites for studies on impact
of natural and man-made disturbance on the ecosystem structures and functions in
simitar types of forests. The plots are useful for assessment of biodiversity of
various groups of flora and fauna of the region. Vegetation analysis and girth class
distribution of trees in the plots established in moist deciduous and dry deciduous
forests showed clear indication of human-induced disturbances. Since the basic
data were collected and ail trees are marked, long term monitoring of these plots
can be undertaken, especially for on studies on succession and ecosystem
recovery processes.
1
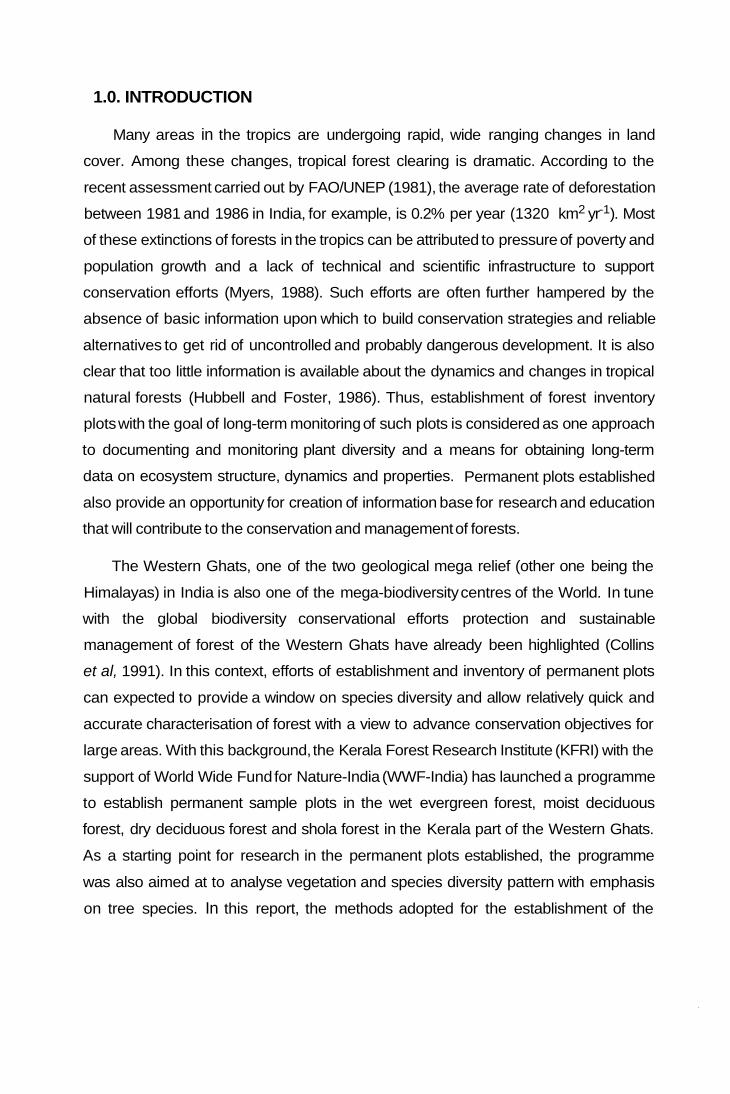
1.0. INTRODUCTION
Many areas in the tropics are undergoing rapid, wide ranging changes in land
cover. Among these changes, tropical forest clearing is dramatic. According to the
recent assessment carried out by FAO/UNEP (1981), the average rate of deforestation
between 1981 and 1986 in India, for example, is 0.2% per year (1320 km2 yr-1). Most
of these extinctions of forests in the tropics can be attributed to pressure of poverty and
population growth and a lack of technical and scientific infrastructure to support
conservation efforts (Myers, 1988). Such efforts are often further hampered by the
absence of basic information upon which to build conservation strategies and reliable
alternatives to get rid of uncontrolled and probably dangerous development. It is also
clear that too little information is available about the dynamics and changes in tropical
natural forests (Hubbell and Foster, 1986). Thus, establishment of forest inventory
plots with the goal of long-term monitoring of such plots is considered as one approach
to documenting and monitoring plant diversity and a means for obtaining long-term
data on ecosystem structure, dynamics and properties. Permanent plots established
also provide an opportunity for creation of information base for research and education
that will contribute to the conservation and management of forests.
The Western Ghats, one of the two geological mega relief (other one being the
Himalayas) in India is also one of the mega-biodiversity centres of the World. In tune
with the global biodiversity conservational efforts protection and sustainable
management of forest of the Western Ghats have already been highlighted (Collins
et al, 1991). In this context, efforts of establishment and inventory of permanent plots
can expected to provide a window on species diversity and allow relatively quick and
accurate characterisation of forest with a view to advance conservation objectives for
large areas. With this background, the Kerala Forest Research Institute (KFRI) with the
support of World Wide Fund for Nature-India (WWF-India) has launched a programme
to establish permanent sample plots in the wet evergreen forest, moist deciduous
forest, dry deciduous forest and shola forest in the Kerala part of the Western Ghats.
As a starting point for research in the permanent plots established, the programme
was also aimed at to analyse vegetation and species diversity pattern with emphasis
on tree species. In this report, the methods adopted for the establishment of the
permanent plots and tree species distribution and diversity patterns are discussed with
a view to draw a programme for long-term monitoring of permanent plots for
biodiversity assessment and understanding the dynamics of the forest stand.
2.0. METHODOLOGY
2.1. Site descriptions
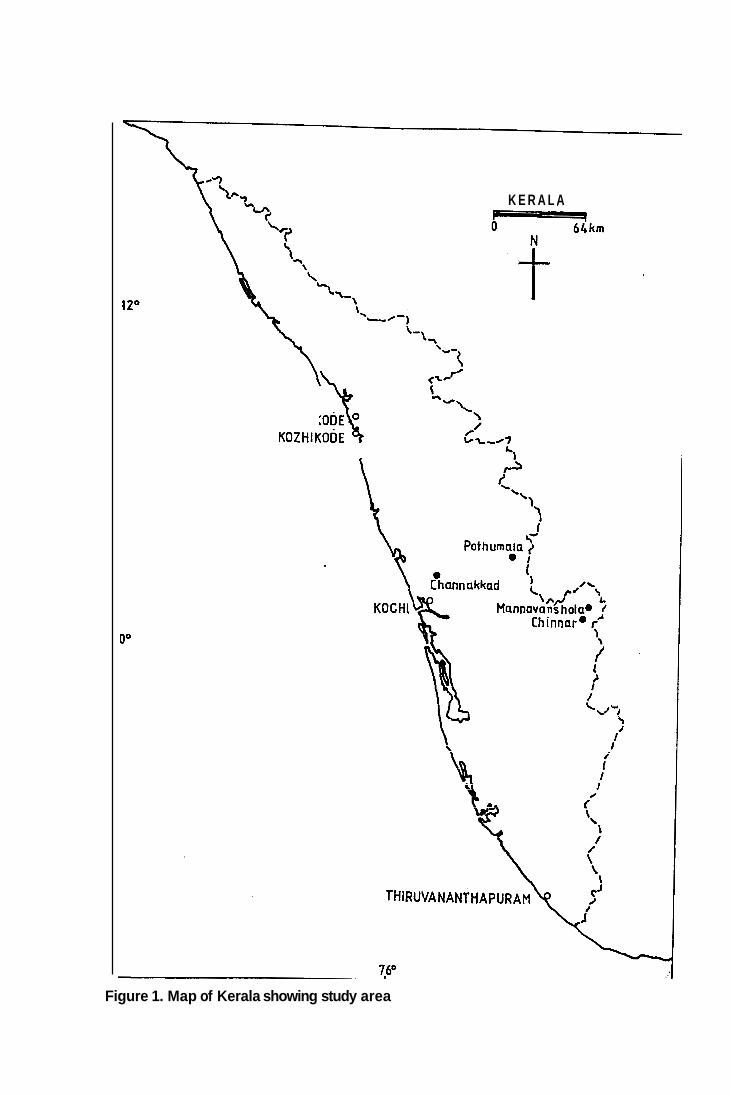
Four sites (Figure l), each one to represent a type of forest namely the tropical
montane forest (shola forest), wet evergreen forest, moist deciduous forest and dry
deciduous forest have been selected. Brief description of the sites follow:
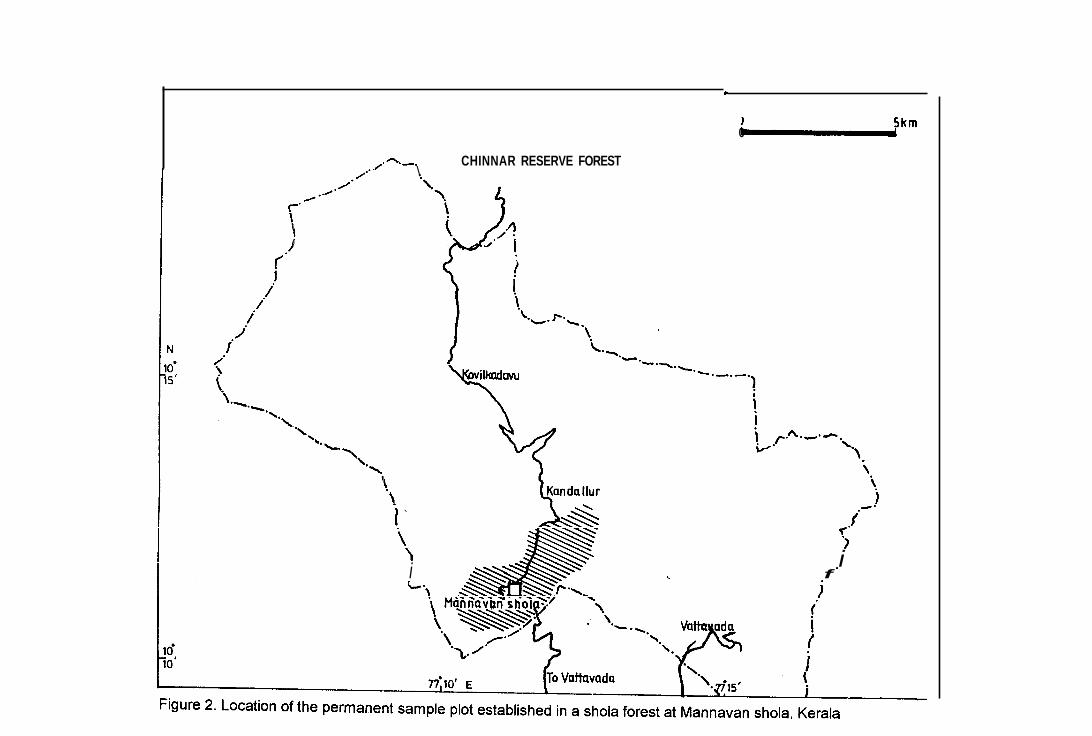
2.1.1. Tropical montane forest (Shola) at Mannavan shola
Mannavan shola is located in the Marayur Forest Range in the Munnar Forest
Division (10 o 10’ - 10 o 12’ 8” N and 77 o 9’ 50” - 77o 12’ 8” E) (Figure 2). This shola
forest is nearly 370 ha in size with an elevation of approximately 1,950 msl. The mean
annual temperature is 20o C; mean annual precipitation is 2000 mm - 3000 mm. The
soil is red, sandy loam, oxysol, acid (pH = 4.2) with 4.6% to 14% organic carbon
content.
The Mannavan shola area is a source of small timber, non-wood forest produce of
near-by colony of the Muthuva tribes. People of the Perumala, Kanthalloor and Puthur
settlements are wholly dependent on Mannavan shola for firewood, timber, and wood
for various agricultural purposes. The firewood demand for the distillation of
lemongrass that is being extensively cultivated in this location is also a threat to the
forest.
2
1 2 O
Do
KOZHIKODE 'e, O
K E R A L A
Figure 1. Map of Kerala showing study area
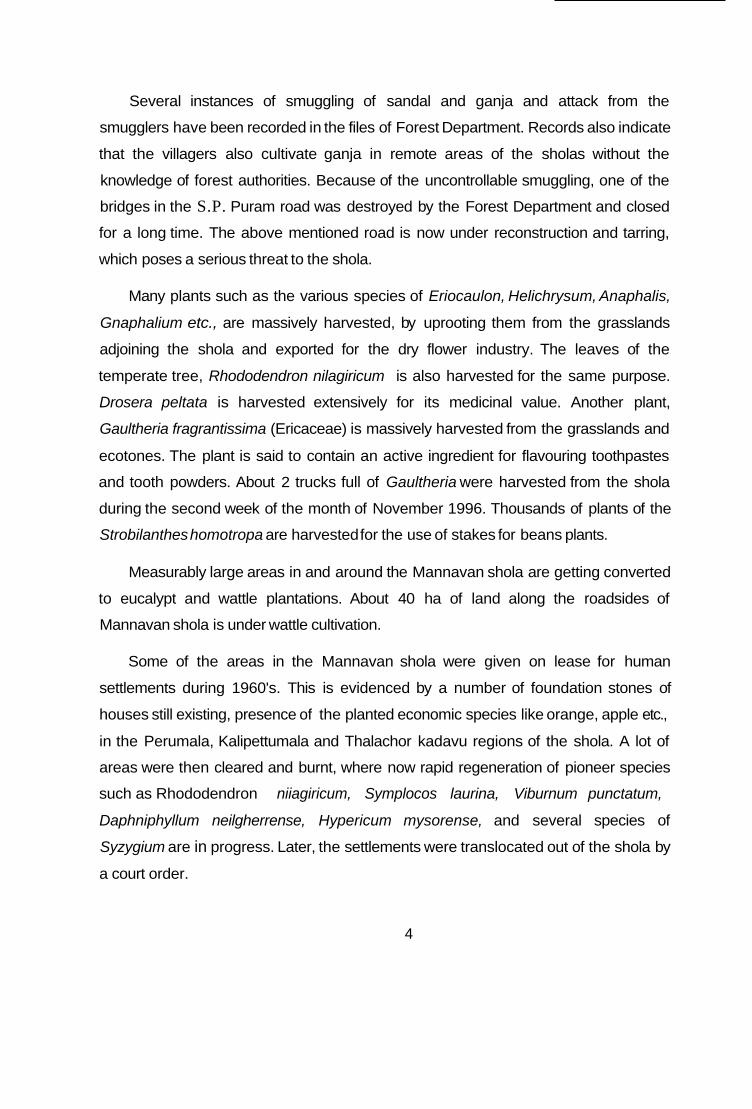
Several instances of smuggling of sandal and ganja and attack from the
smugglers have been recorded in the files of Forest Department. Records also indicate
that the villagers also cultivate ganja in remote areas of the sholas without the
knowledge of forest authorities. Because of the uncontrollable smuggling, one of the
bridges in the S.P. Puram road was destroyed by the Forest Department and closed
for a long time. The above mentioned road is now under reconstruction and tarring,
which poses a serious threat to the shola.
Many plants such as the various species of Eriocaulon, Helichrysum, Anaphalis,
Gnaphalium etc., are massively harvested, by uprooting them from the grasslands
adjoining the shola and exported for the dry flower industry. The leaves of the
temperate tree, Rhododendron nilagiricum is also harvested for the same purpose.
Drosera peltata is harvested extensively for its medicinal value. Another plant,
Gaultheria fragrantissima (Ericaceae) is massively harvested from the grasslands and
ecotones. The plant is said to contain an active ingredient for flavouring toothpastes
and tooth powders. About 2 trucks full of Gaultheria were harvested from the shola
during the second week of the month of November 1996. Thousands of plants of the
Strobilanthes homotropa are harvested for the use of stakes for beans plants.
Measurably large areas in and around the Mannavan shola are getting converted
to eucalypt and wattle plantations. About 40 ha of land along the roadsides of
Mannavan shola is under wattle cultivation.
Some of the areas in the Mannavan shola were given on lease for human
settlements during 1960's. This is evidenced by a number of foundation stones of
houses still existing, presence of the planted economic species like orange, apple etc.,
in the Perumala, Kalipettumala and Thalachor kadavu regions of the shola. A lot of
areas were then cleared and burnt, where now rapid regeneration of pioneer species
such as Rhododendron niiagiricum, Symplocos laurina, Viburnum punctatum,
Daphniphyllum neilgherrense, Hypericum mysorense, and several species of
Syzygium are in progress. Later, the settlements were translocated out of the shola by
a court order.
4
0 -Ikrn /-.-. CHINNAR RESERVE FOREST
\
ilkadovu r". (t$ndallur
4. 1
i r* '1 i
f ' i
i i.
Relatively undisturbed patch of the shola forest is selected for the establishment of
permanent plot.
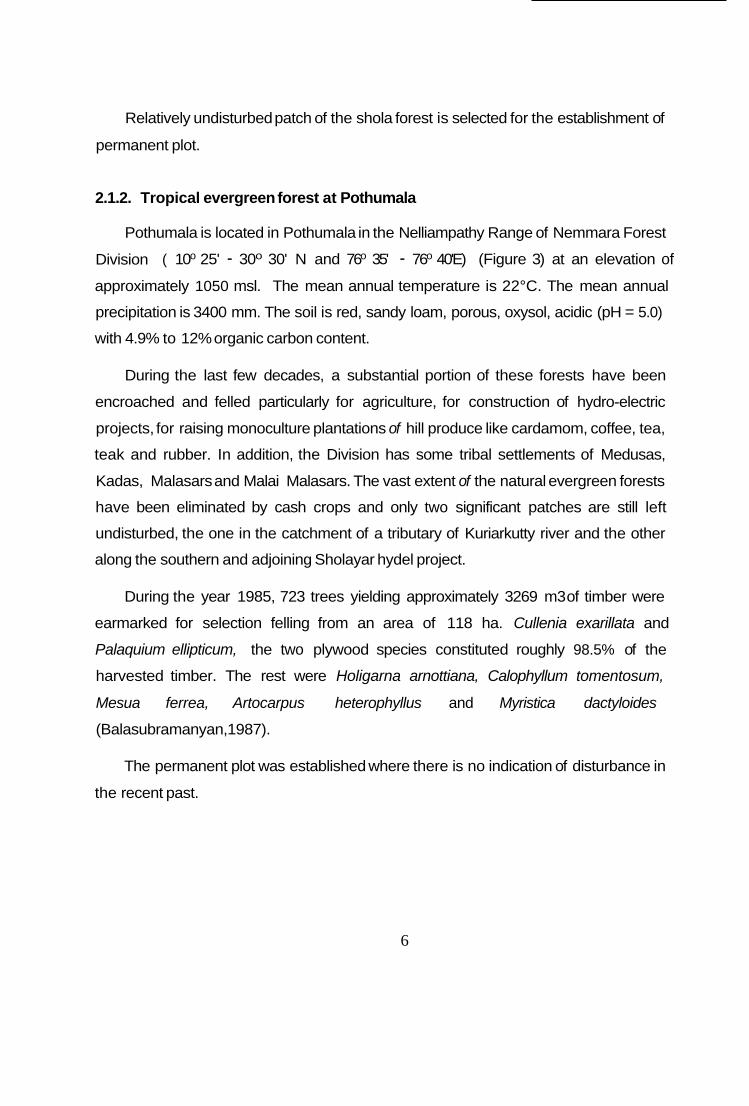
2.1.2. Tropical evergreen forest at Pothumala
Pothumala is located in Pothumala in the Nelliampathy Range of Nemmara Forest
Division ( 10o 25' - 30o 30' N and 76o 35' - 76o 40'E) (Figure 3) at an elevation of
approximately 1050 msl. The mean annual temperature is 22°C. The mean annual
precipitation is 3400 mm. The soil is red, sandy loam, porous, oxysol, acidic (pH = 5.0)
with 4.9% to 12% organic carbon content.
During the last few decades, a substantial portion of these forests have been
encroached and felled particularly for agriculture, for construction of hydro-electric
projects, for raising monoculture plantations of hill produce like cardamom, coffee, tea,
teak and rubber. In addition, the Division has some tribal settlements of Medusas,
Kadas, Malasars and Malai Malasars. The vast extent of the natural evergreen forests
have been eliminated by cash crops and only two significant patches are still left
undisturbed, the one in the catchment of a tributary of Kuriarkutty river and the other
along the southern and adjoining Sholayar hydel project.
During the year 1985, 723 trees yielding approximately 3269 m3 of timber were
earmarked for selection felling from an area of 118 ha. Cullenia exarillata and
Palaquium ellipticum, the two plywood species constituted roughly 98.5% of the
harvested timber. The rest were Holigarna arnottiana, Calophyllum tomentosum,
Mesua ferrea, Artocarpus heterophyllus and Myristica dactyloides
(Balasubramanyan,1987).
The permanent plot was established where there is no indication of disturbance in
the recent past.
6
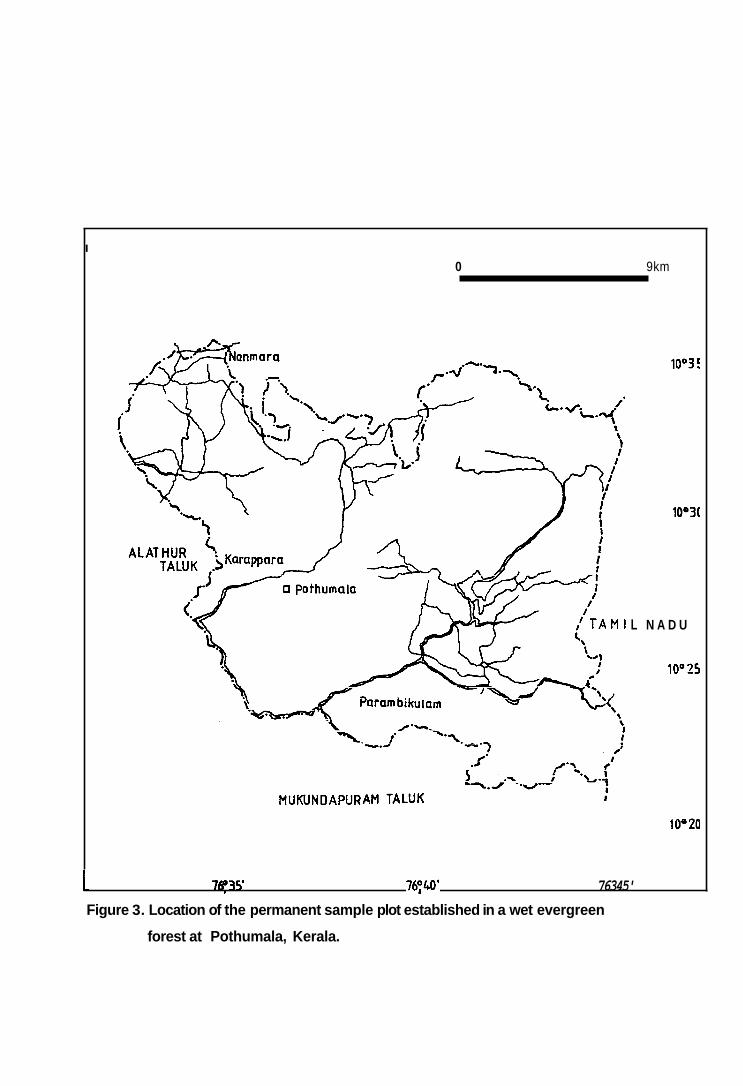
I
0 9km
10°3 f
10°3(
L N A D U
10'25
1 7675' 76:W 76345' Figure 3. Location of the permanent sample plot established in a wet evergreen
forest at Pothumala, Kerala.
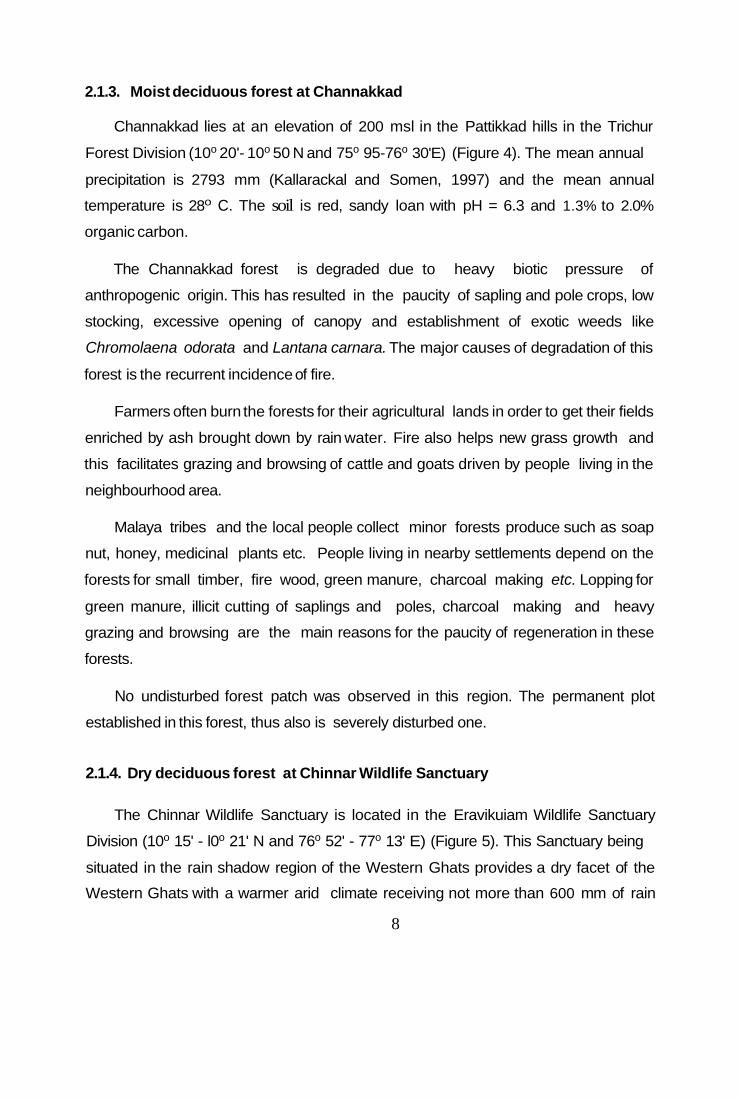
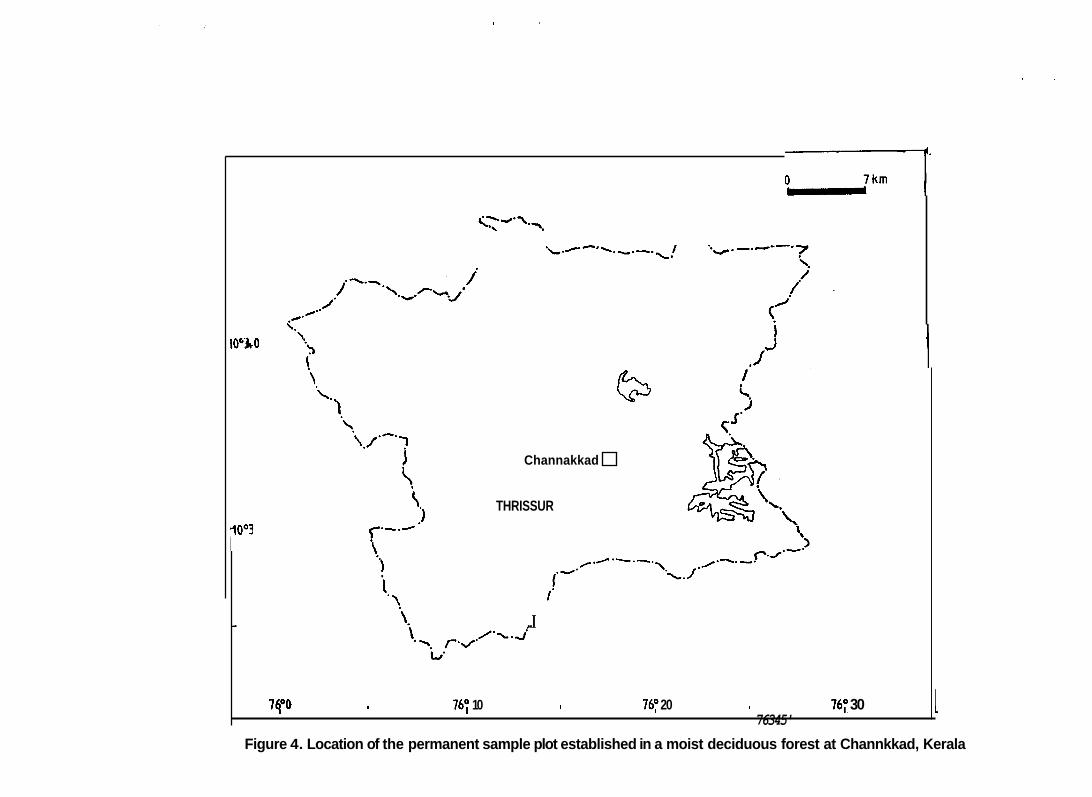
2.1.3. Moist deciduous forest at Channakkad
Channakkad lies at an elevation of 200 msl in the Pattikkad hills in the Trichur
Forest Division (10o 20'- 10o 50 N and 75o 95-76o 30'E) (Figure 4). The mean annual
precipitation is 2793 mm (Kallarackal and Somen, 1997) and the mean annual
temperature is 28o C. The soil is red, sandy loan with pH = 6.3 and 1.3% to 2.0%
organic carbon.
The Channakkad forest is degraded due to heavy biotic pressure of
anthropogenic origin. This has resulted in the paucity of sapling and pole crops, low
stocking, excessive opening of canopy and establishment of exotic weeds like
Chromolaena odorata and Lantana carnara. The major causes of degradation of this
forest is the recurrent incidence of fire.
Farmers often burn the forests for their agricultural lands in order to get their fields
enriched by ash brought down by rain water. Fire also helps new grass growth and
this facilitates grazing and browsing of cattle and goats driven by people living in the
neighbou rhood area.
Malaya tribes and the local people collect minor forests produce such as soap
nut, honey, medicinal plants etc. People living in nearby settlements depend on the
forests for small timber, fire wood, green manure, charcoal making etc. Lopping for
green manure, illicit cutting of saplings and poles, charcoal making and heavy
grazing and browsing are the main reasons for the paucity of regeneration in these
forests.
No undisturbed forest patch was observed in this region. The permanent plot
established in this forest, thus also is severely disturbed one.
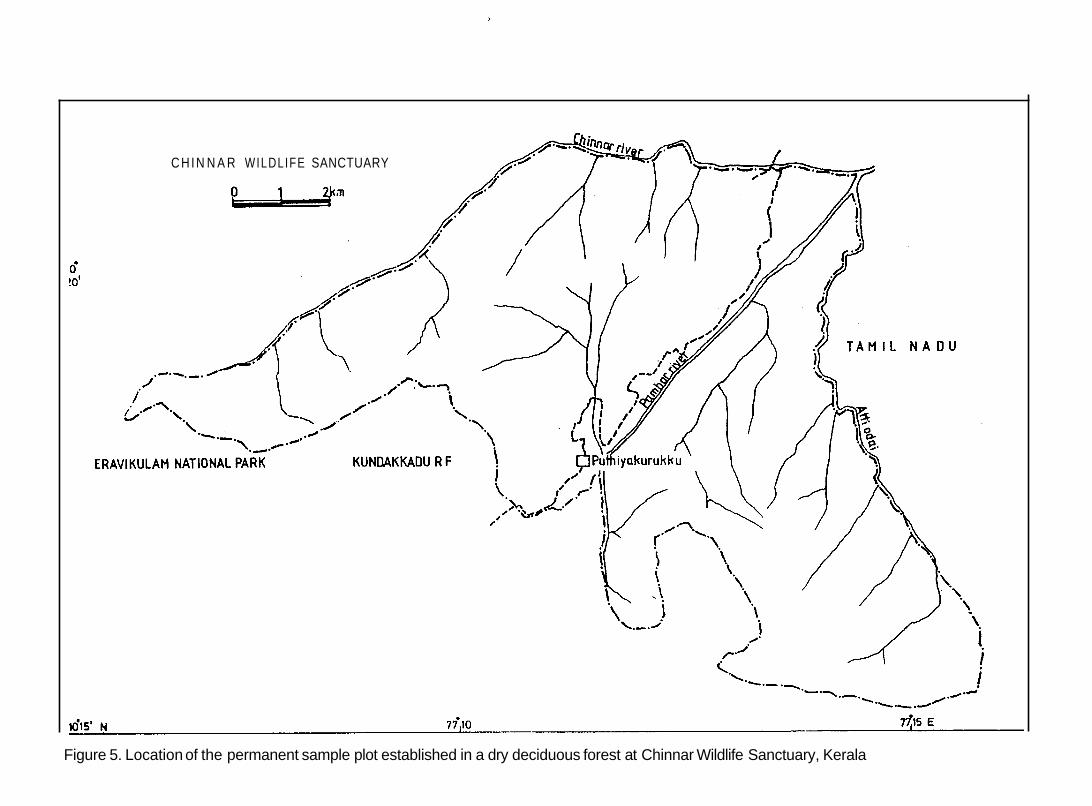
2.1.4. Dry deciduous forest at Chinnar Wildlife Sanctuary
The Chinnar Wildlife Sanctuary is located in the Eravikuiam Wildlife Sanctuary
Division (10o 15' - l0o 21' N and 76o 52' - 77o 13' E) (Figure 5). This Sanctuary being
situated in the rain shadow region of the Western Ghats provides a dry facet of the
Western Ghats with a warmer arid climate receiving not more than 600 mm of rain
8
lO%O
YOo3
Channakkad
THRISSUR
-
7qoo L 76: 10 1 76: 20 I 76: 30
..I
'.
76345' Figure 4. Location of the permanent sample plot established in a moist deciduous forest at Channkkad, Kerala
per year. The mean minimum temperature is 12o C and the mean maximum
temperature is 36o C. Average elevation of the site is 400 msl. The soil is red, sandy
loam, gravelly (12% to 32%), slightly alkaline (pH = 7.3) and with low organic carbon
content (0.76% to 2.1 %).
Before the declaration of Chinnar Wildlife Sanctuary it was known as Chinnar
Reserved Forest. Selection felling operations were carried out in 1979 in some
localities. The area has further degraded by grass invasion and fire and been
reduced to discontinuous thorny thickets and pseudosteppis. The erosion of surface
soil has been a serious threat to fire exposed soil. this is indicated by high gravel
content of the soil in most part of the forest area. Apart from this, anthropogenic
pressures mainly from outside the forest are in the form of road traffic, firewood
collection, grazing, agricultural activities and fire also pose problems. In 1984, the area
has been declared as the Wildlife Sanctuary. According to the sources from the Forest
Department, the declaration of Wildlife Sanctuary and related efforts are giving
promising results in terms of wildlife conservation and ecosystem rehabilitation. They
claim that after the declaration of the area as Sanctuary smuggling, poaching and
incidence of fire, illegal harvesting of natural resources have declined. But, mounting
evidences suggest that introduction of some inappropriate planning and
implementation and an over optimistic drive of planners to enforce a totally different
type of landuse systems, impacts of insecurity in land tenure, local effects of structural
adjustment programmes and people-park conflict are often leading to poor results in
conservation and ecosystems rehabilitation efforts in the Sanctuary (Chandrashekara
and Sankar, 1998).
The area selected for the establishment of permanent plot showed no indication of
human-induced disturbance occurred after the establishment of the Sanctuary.
10
C H I N N A R WILDLIFE SANCTUARY
O z ) c m
d !O'
Figure 5. Location of the permanent sample plot established in a dry deciduous forest at Chinnar Wildlife Sanctuary, Kerala
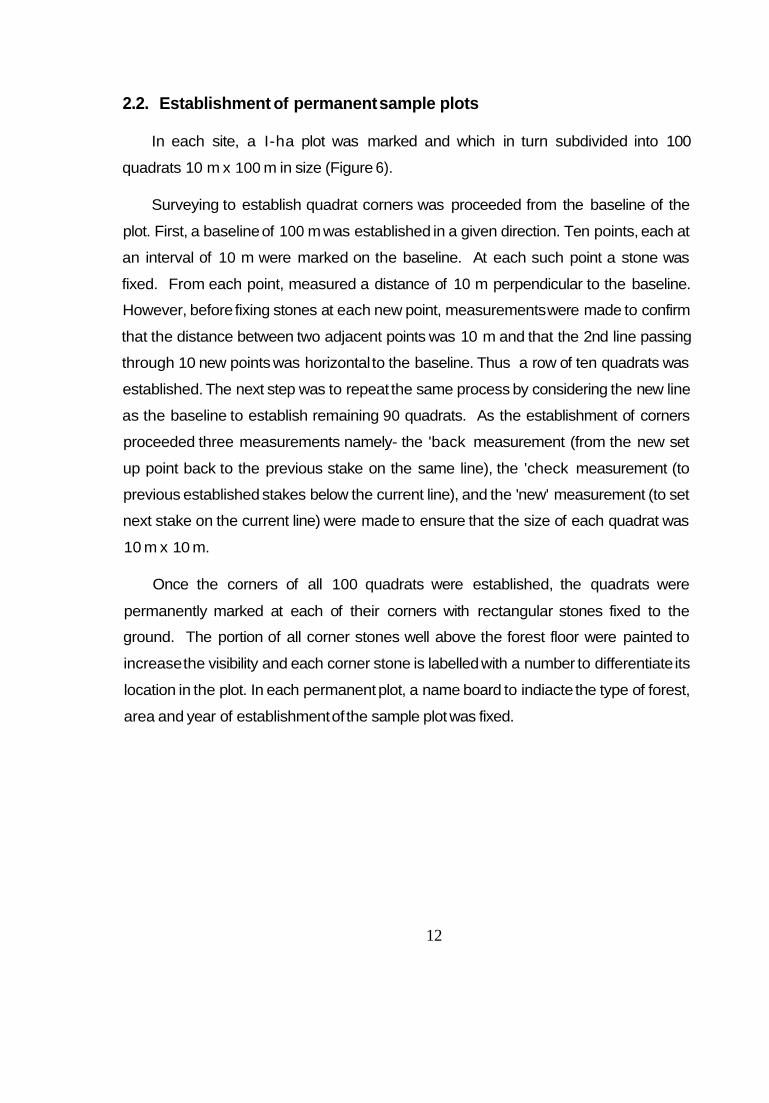
2.2. Establishment of permanent sample plots
In each site, a I-ha plot was marked and which in turn subdivided into 100
quadrats 10 m x 100 m in size (Figure 6).
Surveying to establish quadrat corners was proceeded from the baseline of the
plot. First, a baseline of 100 m was established in a given direction. Ten points, each at
an interval of 10 m were marked on the baseline. At each such point a stone was
fixed. From each point, measured a distance of 10 m perpendicular to the baseline.
However, before fixing stones at each new point, measurements were made to confirm
that the distance between two adjacent points was 10 m and that the 2nd line passing
through 10 new points was horizontal to the baseline. Thus a row of ten quadrats was
established. The next step was to repeat the same process by considering the new line
as the baseline to establish remaining 90 quadrats. As the establishment of corners
proceeded three measurements namely- the 'back measurement (from the new set
up point back to the previous stake on the same line), the 'check measurement (to
previous established stakes below the current line), and the 'new' measurement (to set
next stake on the current line) were made to ensure that the size of each quadrat was
10 m x 10 m.
Once the corners of all 100 quadrats were established, the quadrats were
permanently marked at each of their corners with rectangular stones fixed to the
ground. The portion of all corner stones well above the forest floor were painted to
increase the visibility and each corner stone is labelled with a number to differentiate its
location in the plot. In each permanent plot, a name board to indiacte the type of forest,
area and year of establishment of the sample plot was fixed.
12
2.3. Tree species diversity and regeneration pattern in permanent plots
In the plot established, a rope was tied along the border of each quadrat. In each
permanent plot tree tagging and identification was carried out in three stages. In the
first stage, all trees above 30.1 cm girth at breast height (gbh; measured with tape at
1.37 m from the ground) were considered. They were categorised as mature trees. In
each of 100 quadrats (Figures 6a, 6b, 6c and 6d) mature trees were located and
tagged with the numbered aluminium label facing towards the baseline. Tags were
fixed above 1.37 cm level to avoid interference with gbh measurement. Each tree was
identified and recorded the number allotted to it, and its gbh. For the trees with large
buttresses, girth was measured just above the level of buttress. The line of gbh
measurement was marked with paint. Conditions of all labelled trees were assessed
and categorised them into alive-undamaged and alive-damaged. Causes for damage
were also recorded. These data were collected for reuse in recensuses or following
cataclysmic events.
In the second stage of tree tagging and identification, all trees with gbh ranging
from 10.1 cm to 30.0 cm were considered and they were designated as saplings.
Tagging, gbh measurement, identification and assessment of tree conditions followed
the methods already discussed. However, the number of quadrats to be sampled for
the saplings was determined using species-area curve (Misra, 1968). Thus, while the
saplings in dry deciduous and moist deciduous forest site were monitored in all 100
quadrats (Figures 6c and 6d) those in shola forest and wet evergreen forest were
monitored only in 50 quadrats (Figures 6a and b).
Third stage of tree tagging and identification covered plants less than 10 cm girth
and the height less than Im. This group of tree population was considered as tree
seedlings. In the case of plots established at shola forest and wet evergreen forest,
fourteen sub quadrats of 5 m x 5 m, each one in a 10 m x 10 m quadrat (Figures 6a
and 6b) were marked to tagging, height measurement, labelling and identification of
tree seedlings. On the other hand, in case of moist deciduous and dry deciduous plots,
seedlings were studied in fifty 5 m x 5 m sub-quadrats one each laid out in a 10 m x 10
m quadrat.
13
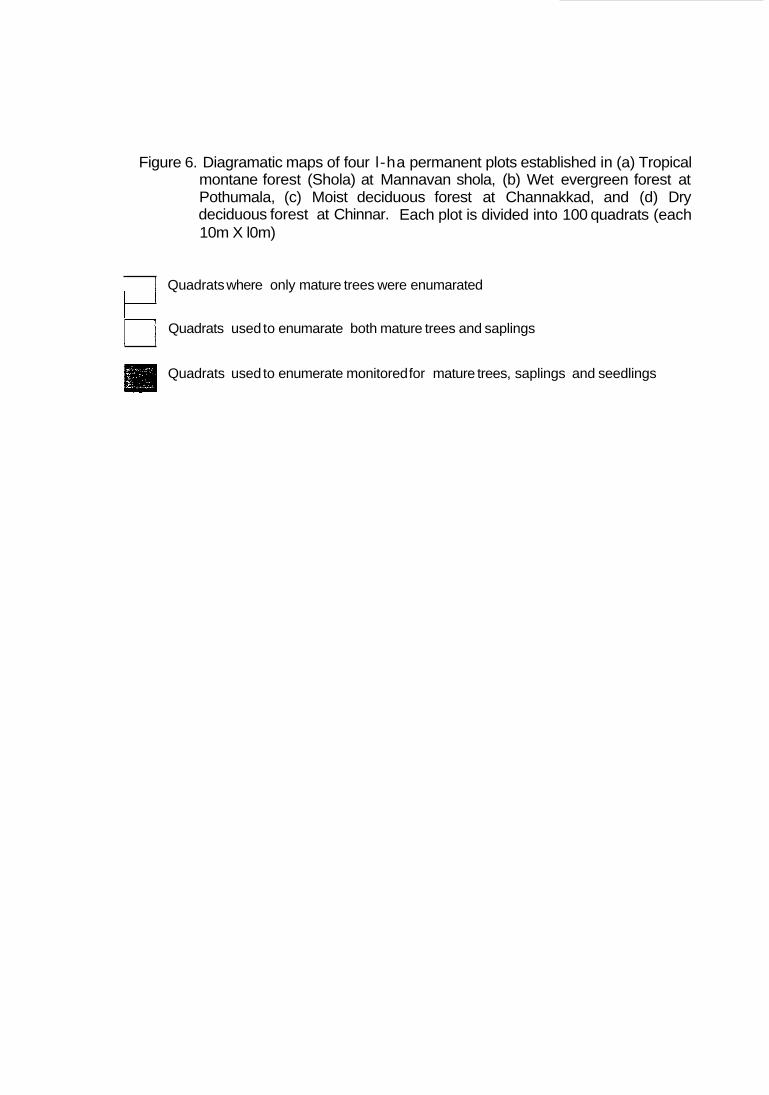
Figure 6. Diagramatic maps of four l-ha permanent plots established in (a) Tropical montane forest (Shola) at Mannavan shola, (b) Wet evergreen forest at Pothumala, (c) Moist deciduous forest at Channakkad, and (d) Dry deciduous forest at Chinnar. Each plot is divided into 100 quadrats (each 10m X l0m)
1 1 Quadrats where only mature trees were enumarated
Quadrats used to enumarate both mature trees and saplings
Quadrats used to enumerate monitored for mature trees, saplings and seedlings
a b
N
C
N
71 S
Most of the trees species were identified in the field while others were identified
and referring the herbaria. The sample herbarium with the samples collected
specimens collected were deposited in the KFRl herbarium.
The total number of stems per hectare was estimated separately for mature trees,
saplings and tree seedlings. Similarly, basal area of all stems of a species in mature
tree and saplings categories was also calculated. In the case seedlings, basal area
was not calculated, as the exact girth of individuals seedlings was not recorded.
Formula used to calculate the relative density, relative frequency and relative
dominance and the importance value index (IVI) are following:
Relative density = total number of individuals of a Species x 100 total number of individuals of all species
Frequency = number of quadrats in which a species found number of quadrats studied
Relative frequency = frequencv of a Riven species X100 sum of frequency of all species
Relative dominance = total basal area of a given species X 100
Importance value Index (IVI) of a species = sum of relative density, relative
dominance and relative frequency
total basal area of all species
However, in the case of seedling population, IVI was calculated as the sum of
relative density and relative frequency. Species diversity was calculated using a
formula given by Margalef (1968) as:
H= - Σ [ (n, / N) log2 (ni/IN )]
where H = Shannon index of species diversity, n,= number of individuals of species i,
N= total number of individuals of all species in the community.
The index of dominance of the community was calculated by Simpson’s index
(Simpson, 1949) as:
C = Σ (ni/N)2
16
where C= index of dominance; n, and N being the same in the Shannon index of
general diversity.
2.4. Determination of stands quality of shola and wet evergreen forests
Considering the life history pattern, shola forest and wet evergreen forest species
can be categorised into primary (shade-tolerant species), late secondary species and
early secondary species (strong light demanders). Based on the available literature
(Gamble, 191 5-1935; Chandrasekharan,l960; Rai, 1979; Rai and Proctor, 1986;
Pascal, 1988; Chandrashekara and Ramakrishnan, 1994), species encountered in
shola forest and evergreen forest sites were categorised into three groups, each group
with a number, its pioneer index of 1 for the group requiring a small gap for
regeneration and 3 for the group of strong light demanders, with a strong canopy
disturbance requirements. The procedure to determine the stand quality
(Chandrashekara, 1998) is followed as:
RlSQ = Σ{(ni /N) x Species pioneer index}
Where, RISQ= Ramakrishnan index of Stand Quality; ni = importance value index of a
species and N= sum of importance value index of all species; Pioneer index is 1 for the
species whose seedlings establish in closed canopy area but need small canopy gaps
to grow up, Pioneer index is 2 for the species whose seedlings establish in small gaps
but need small to medium size gaps to grow up, and Pioneer index is 3 for the species
whose seedlings need larger canopy gaps for both establishment and growth.
The RlSQ of a given site can vary from 1.0 (all stems, group 1 species; forest
stand undisturbed) to 3.0 (all stems strong light -demanding species, group 3; forest
stand is highly disturbed.
17
3.0. RESULTS AND DISCUSSION
3.1. TREE SPECIES DIVERSITY AND STAND STRUCTURE
3.1.1. Mannavan Shola
A description of the vegetation in the Mannavan shola plot is presented in Table
1. Among mature tree population, Hydnocarpus alpina, lsonandra stocksii,
Gomphandra coriacea, Chionanthus ramiflorus and Mastixia arborea are the first five
dominant species. Tree sapling population is dominated by Lasianthus acuminatus
followed by Mastixia arborea, Ardisia rhomboidea, Hydnocarpus alpina, and
Chionanthus ramiflorus. In the case of tree seedling population also Lasianthus
acuminatus is the dominant species followed by Beilschmedia wightii, Chionanthus
ramiflorus, Ardisia rhomboidea and Hydnocarpus alpina. It may be noted here that
species like Lasianthus acuminatus, Ardisia rhomboidea and Chionanthus ramiflorus
showed higher values for IVI in the seedling and sapling population are species of the
understorey with small girth class.
Tables 2, 3 and 4 respectively represent the distribution pattern of mature trees,
saplings and seedlings in different quadrats laid out in the permanent plot. These
Tables will help in recensuses and to know the impact of any cataclysmic event on the
health and survivability of these species. For the easy identification of species in the
plot one to five plants together with their location (quadrat number) and tag number are
given in Appendix 1.
The Mannavan shola forest site is a natural forest without major disturbance where
RlSQ values for tree seedlings, saplings and mature trees were 1.178,1.155 and
1.224 respectively (Table 5). Compared to a shola forest situated at Kurunjalu in
Chikmagalore District in the Western Ghat part of Karnataka where the number of tree
species encountered was 20 (Swamy, 1988), the Mannavan shola plot is richer in
terms of species richness. Stem density recorded in Kurunjalu was 235 and 475 for
saplings and mature trees. Therfore, when compared to the shola forest at Kurunjalu,
the Mannavan shola is richer in terms of stem density also. The species diversity in the
Mannavan shola is quite higher than in Kurunjalu shola (H = 3.612; Swamy, 1988)
because of presence of numerous rare species.
18
Table 1. Density (individuals ha-1) and importance value index (IVI) of mature trees (gbh ≥ 30.1 cm), saplings ( gbh 10.1 cm to 30.0 cm) and seedlings (girth ≤ 10.0 cm and height ≤ 1 m ) in the permanent plot established in a Shola forest at Mannavan shola, Kerala.
I Mature trees I Saplings I Seedlings] Species
-cont'd-
19
Species
20
Mature tree I Saplings Seedlings
Table 1(cont'd). Density (individuals ha-1) and importance value index (IVI) of mature trees (gbh ≥ 30.1 cm), saplings ( gbh 10.1 cm to 30.0 cm) and seedlings (girth ≤ 10.0 cm and height ≤ 1 m ) in the permanent plot established in a Shola forest at Mannavan shola, Kerala.
Table 2. Occurrence of mature trees (gbh > 30.1 cm) of different species in different quadrats (10 m x 10 m ) laid out in the I-ha permanent plot established in the Shola forest at Mannavan shola, Kerala. Values in parentheses are number of individuals in the given quadrat.
Species Quadrat number Acronychia pedunculata
Actinodaphne bourdillonii
53 54 67 73 75
6 13 17 33 49
85 96
(1) (2) (3) (1) (1)
(1 ) (1) (1) (3) (1)
(1) I ( 2) I (1) I ( 2) I ( 1) 91 I 92
88 94 98
50 51 67 (1) (1) ( t )
(1) (1) (1)
81 99 (1) (1) 15 20 25
99 (1) 73 77 (1) (1)
26 34
Aglaia elaeagnoidea
semeca rpifolia Alseodaphne
(1) 1 ( 2) 1 (2) I ( 1) I ( 1) 98 I 100 I
(1) (2)
(1) (1)
(1) (1) (1) (1) (1)
40 73
54 59 60 78 79
2 7 10 13 14
(1) (1) Cinnamomum sp. 1 76
(1) Cinnamomum sp.2 77
(1) Cinnamomum sp.3 66
(1) Cinnamomum 5 10 16 18 28
Clerodendrum viscosum 34 I t \
sulphuratum (1) (1) (1) (1) (1)
(1)
42 (1)
26
Cryptocarya sp. 39 66 (1) (1) 5 17 22 25 34
(2) (1) (2) (1)
a4 (1)
27 28 29 33
(1) (1) I (1) (1) I Cyathea nilgiriensis 28 29 92 93
(1) (3) (1) (3)
Bhesa indica
Canthium dicoccum
Celtis philippensis
(2) (1) 3 21 23 33 35 (1) (1) (1) (1) (1) 7 58 (1) (1) 11 45
Chionanthus ramiflorus
(1) (1)
(1) (1) (5) (2) (1)
(1) (1) (1) (2) (1)
8 9 10 11 13
36 39 45 48 50
61 63 66 67 70
21
(1)
(1) 51
85
(1) (1) (2) (1)
(1) (1) (1) (1) 52 53 55 58
90 91 92 95
Table 2 (cont'd). Occurrence of mature trees (gbh > 30.1 cm) of different species in different quadrats (10 m x 10 m) laid out in the I-ha permanent plot established in the Shola forest at Mannavan shola, Kerala. Values in parentheses are number of individuals in the given quadrat.
Gomphandra coriacea
Hydnocarpus alpina
lsonandm stocksii
-cont'd-
22
Table 2 (cont’d). Occurrence of mature trees (gbh > 30.1 cm) of different species in different quadrats (10 m x 10 m ) laid out in the I-ha permanent plot established in the Shola forest at Mannavan shola, Kerala. Values in parentheses are number of individuals in the given quadrat.
Mastixia arborea
Saprosma foetens
23
Table 3. Occurrence of saplings (gbh 10.1 cm to 30.0 cm} of different species in different quadrats (10m x 10 m ) laid out in the I-ha permanent plot established in the Shola forest at Mannavan shola, Kerala. Values in parentheses are number of individuals in the given quadrat.
Species Acronychia pedunculata
Actinodaphne bourdillonii
Aglaia elaeagnoidea
Ardisia rhomboidea
Beilschmiedia wightii
Chassalia curviflora
Chionanthus ramiflorus
Cinnamomum sp.3
Cinnamomum sulphuratum
Cryptocarya sp.
Cryptocarya lawsonii
Cyathea crinata
Elaeocarpus tuberculatus
Eugenia sp.
Eurya nitida
Glochidion nilgiriense
Gomphandra coriacea
Gomphandra sp.
Hydnocarpus alpina
llex denticulata
Isonandra stocksii
Litsea floribunda
66 I
33
17 26
8 10 * 1 2 (1 1 (2) 34 37 (1) (1) 33 (1) 9 10 (2) (2) 10 28 (1) (1) 8 12 (1) (1) 12 33 (1) (2) 30 (1) 12 (1) 7 63 (1) (1) 12 28 (1) (1) 5 29 (1) (1) 8 15 (2) (1) 1 2 (1 1 (1 1 28 33 (1) (1) 13 29 (1) (1) 11 31 (1 ) (1) 10 (1)
36 69 2 1
63 94 2 3
29 94 (I) (1)
13 28 (2) (1)
1 16 (1) 7 10 (1) (2) 36 66 (2) (2) q-
t
i'" 33 63 (1) (1)
-cont'd-
24
Table 3 (cont’d). Occurrence of saplings (gbh 10.1-30.0 cm) of different species in quadrats (10 rn x 10 m ) laid out in the I-ha permanent plot established in the Shola forest at Mannavan shola. Values in parentheses are number of individuals in the given quadrat.
Species
Lasianthus acuminatus
Litsea sp. 1
Litsea sp.2 ~
Mastixia arborea
Microtropis ramiflora
Neolitsea zeylanica
Persea macrantha
Phoebe lanceolata
Photinia sp.
Polygala arillata
Prunus ceylanica
Psychotria sp.
Rauvolfia densiflora
Saprosma foetens
Schefflera racemosa
Symplocos pendula
Syzygium densiflorurn
Syzygium tamilnadensis
Turpinia nepalensis
Vaccinium leschenaultii
- 1
11
21
34
91
8
28
1
15
29
94
2
9
66
9
8
30
63
63
94
7
66
18
91
94
8
28
100
0 0 0 0 0 0 0 0 (3)
0 0 0 0 0 0 0 0 0 0 0 (1)
0 0 0 0 0 0 0
Quadrat number
(1) (1) (1) (1) 10 (3)
14 23 24 28
~
6
16
27
40
-EL
A Z L (4)
0
- 31 (1)
7 1 8 I 9 I 10 (3) (3) (2) (3)
(3) (3) (1) (3) 17 18 19 20
28 30 31 33 (4) I ( 3) I ( 1) 1 ( 1) 43 I 63 I 66 I 69
(1) (1) (2) (1)
(5) (1) (2) ( 5 ) 23 25 26 28
43 63 66 91 (1) (2) (3) (2)
25
26
Table 4 (cont'd). Occurence of tree seedlings (girfh <10.0 cm, height < 1 m) of different species in different quadrats (5 m x 5 m ) laid out in the I-ha permanent plot established in the Shola forest at Mannavan shola, Kerala. Values in parentheses are number of individuals in the given quadrat.
27
About 10% mature trees, 7% of saplings and 0.3% of seedlings are damaged but
live (Table 5). Location and tag number of these damaged trees are given in Table 6
to facilitate to verify their status in the next census.
The girth class distribution of trees showed a negative exponential pattern. This is
another indication to the undisturbed nature of the forest stand. However, based on the
analysis of patterns of girth distribution of individual species three groups of species
can be recognised (Table 7). Group 1 comprises species with a negative exponential
distribution and capable of attaining large girths. such as Chionanthus ramiflorus,
Hydnocarpus alpina, lsonandra stocksii and Mastixia arborea. Species of group 2
also show a negative exponential girth distribution pattern. They are species of the
understorey with small girth classes such as Lasianthus acuminatus, Ardisia
rhomboidea, Saprosma foetens and Turpinia nepalnsis. The distribution pattern in
group 3 species is characterised by a large number of individuals of medium and small
girth classes. Cryptocarya lawsonii, Phoebe lanceota, Gomphandra coriacia and
Glochidion nilgirense are examples to this group. It may also be noted here that while
18 % species represented in all three phases (seedling, sapling and mature trees)
indicating better recruitment, 30% species do not have representation in seedling
stage showing poor regeneration (Table 5). In Mannavan shola, Lauraceae is the most
dominant family recording about 21% of the total IVI.
28
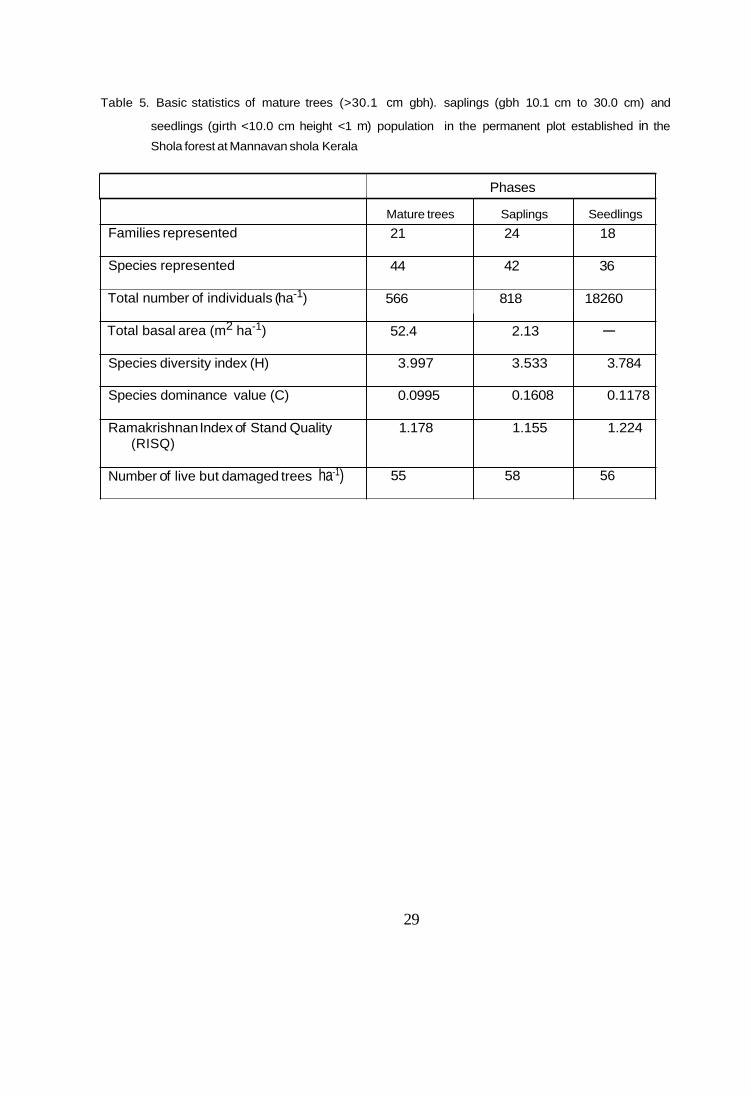
Table 5. Basic statistics of mature trees (>30.1 cm gbh). saplings (gbh 10.1 cm to 30.0 cm) and
seedlings (girth <10.0 cm height <1 m) population in the permanent plot established in the
Shola forest at Mannavan shola Kerala
Families represented
Species represented
Phases
Mature trees Saplings Seedlings
21 24 18
44 42 36
Total number of individuals (ha-1) 566 81 8 18260
Total basal area (m2 ha-1)
Species diversity index (H)
Species dominance value (C)
Ramakrishnan Index of Stand Quality (RISQ)
Number of live but damaged trees ha-1)
29
52.4 2.13 -
3.997 3.533 3.784
0.0995 0.1608 0.1178
1.178 1.155 1.224
55 58 56
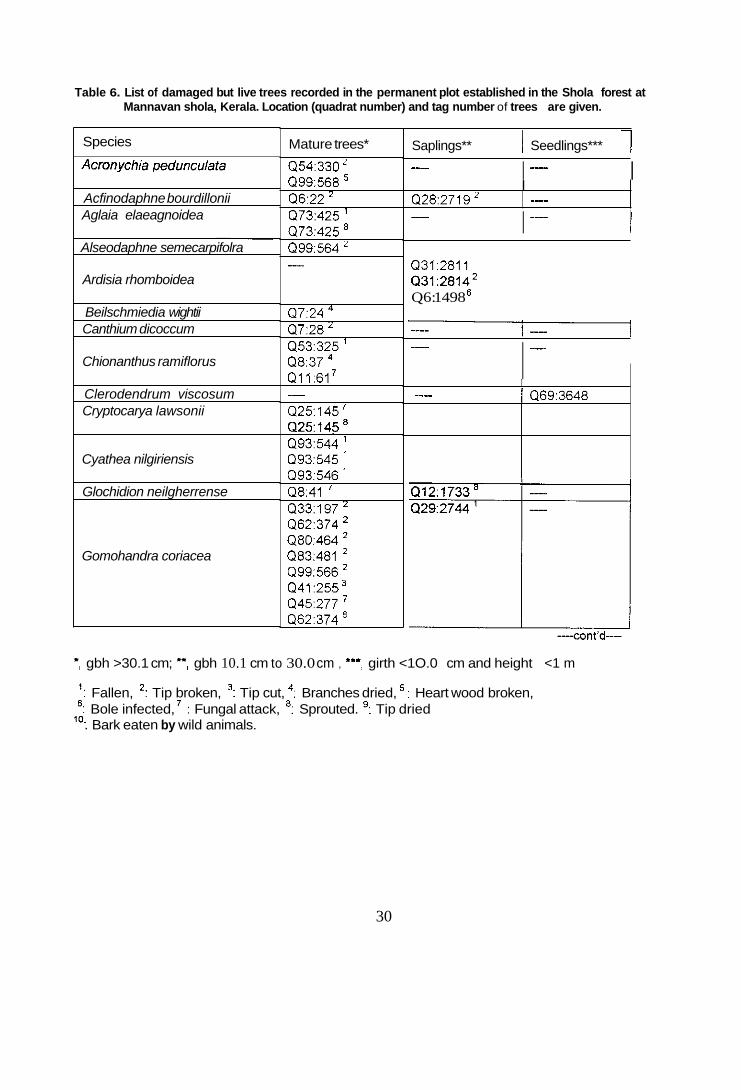
Table 6. List of damaged but live trees recorded in the permanent plot established in the Shola forest at Mannavan shola, Kerala. Location (quadrat number) and tag number of trees are given.
Species
Acfinodaphne bourdillonii Aglaia elaeagnoidea
Alseodaphne semecarpifolra
Ardisia rhomboidea
Beilschmiedia wightii Canthium dicoccum
Chionanthus ramiflorus
Clerodendrum viscosum Cryptocarya lawsonii
Cyathea nilgiriensis
Glochidion neilgherrense
Gomohandra coriacea
Mature trees*
Q54:330 ' Q99:568 Q6:22 ' Q73:425 Q73:425 Q99:564 '
Q7:24 Q7:28 Q53:325 Q8:37 Ql1 :617 __ Q25:145' a25145 Q93:544 Q93:545 ' Q93:546 ' Q8:41 ' Q33:197 * Q62:374 Q80:464 Q83:481 ' Q99:566 Q41:255 Q45:277 ' Q62:374 '
Saplings** 1 Seedlings*** 1 I I - I
Q28:2719'
I I -
Q31:2811 Q31:28142 Q6: 1498 '
I -- __
I 1 Q69:3648
*, gbh >30.1 cm; -, gbh 10.1 cm to 30.0 cm , -, girth <1O.0 cm and height <1 m
': Fallen, ': Tip broken, 3: Tip cut, 4: Branches dried, 5 : Heart wood broken, ': Bole infected, : Fungal attack, Sprouted. ': Tip dried
10. . Bark eaten by wild animals.
30
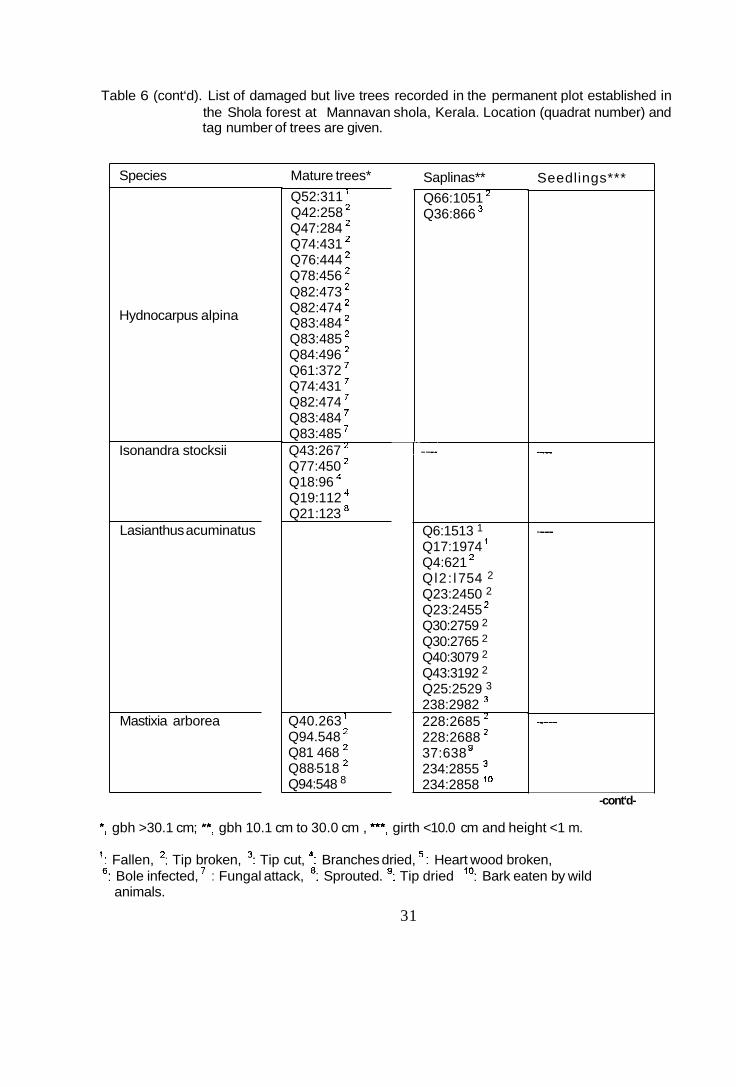
Table 6 (cont‘d). List of damaged but live trees recorded in the permanent plot established in the Shola forest at Mannavan shola, Kerala. Location (quadrat number) and tag number of trees are given.
Species
Hydnocarpus alpina
Isonandra stocksii
Lasianthus acuminatus
Mastixia arborea
Mature trees*Q52:311 ’ Q42:258 Q47:284 ’ Q74:431 ’ Q76:444 ’ Q78:456 Q82:473 Q82:474 Q83:484 Q83:485 ’ Q84:496 Q61:372 Q74:431 Q82:474 Q83:484 Q83:485 Q43:267 Q77:450 Q18:96 Q19:112 Q21 :123 a
Q40.263 ’ Q94.548 Q81 468 ’ Q88-518 Q94:548 8
Saplinas**Q66:1051 Q36:866
Q6:1513 1 Q17:1974 ‘ Q4:621 ’ Ql2: l 754 2
Q23:2450 2
Q23:2455 Q30:2759 2
Q30:2765 2 Q40:3079 2
Q43:3192 2 Q25:2529 3 238:2982 228:2685 228:2688 ’ 37:638 234:2855 234:2858 ’O
Seedlings***
-cont‘d-
*, gbh >30.1 cm; *, gbh 10.1 cm to 30.0 cm , *, girth <10.0 cm and height <1 m.
’: Fallen, 2: Tip broken, 3: Tip cut, 4: Branches dried, 5 : Heart wood broken, ‘: Bole infected, : Fungal attack, ’: Sprouted. ’: Tip dried ‘O: Bark eaten by wild
animals.
31
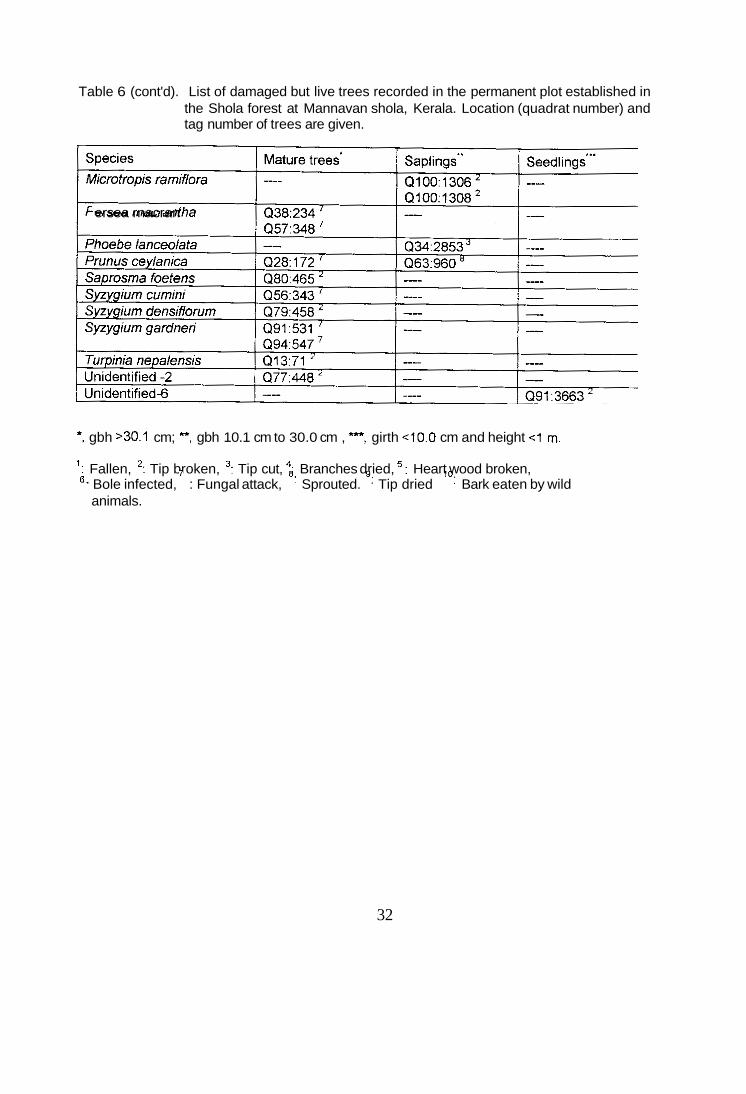
Table 6 (cont'd). List of damaged but live trees recorded in the permanent plot established in the Shola forest at Mannavan shola, Kerala. Location (quadrat number) and tag number of trees are given.
ersea rnacran
*, gbh '30.1 cm; -, gbh 10.1 cm to 30.0 cm , -, girth ~ 1 0 . 0 cm and height <1 m.
': Fallen, *: Tip broken, 3: Tip cut, 4: Branches dried, 5 : Heart wood broken, 5. . Bole infected, ' : Fungal attack, ': Sprouted. ': Tip dried 'O: Bark eaten by wild
animals.
32
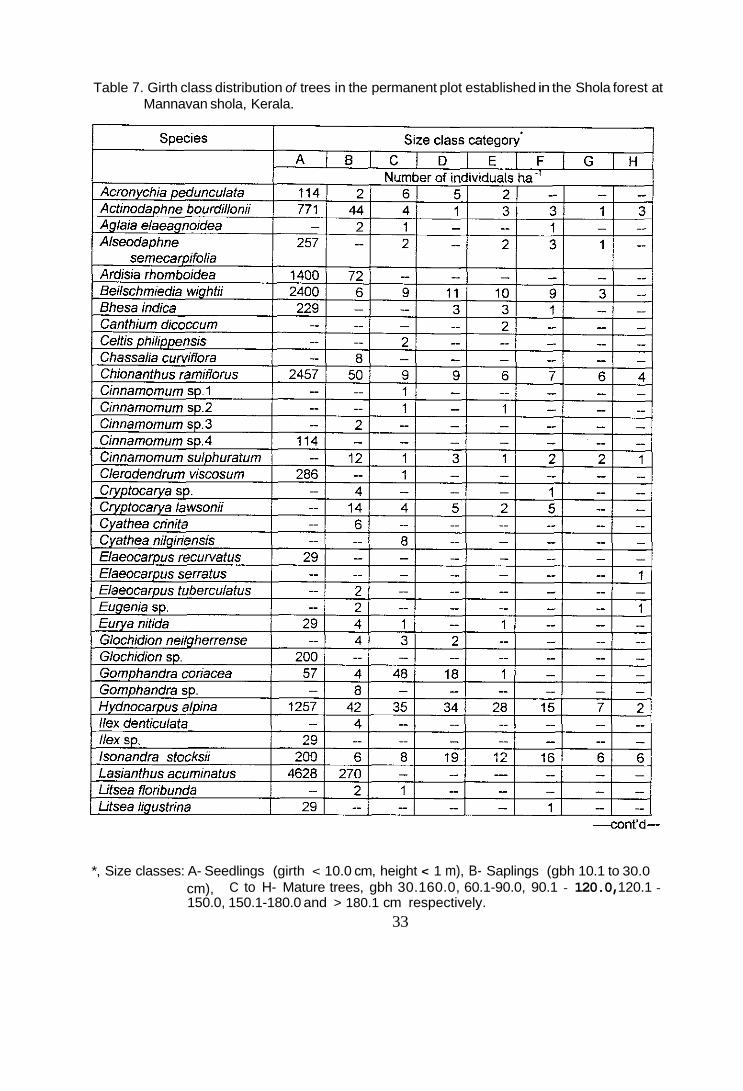
Table 7. Girth class distribution of trees in the permanent plot established in the Shola forest at Mannavan shola, Kerala.
*, Size classes: A- Seedlings (girth < 10.0 cm, height < 1 m), B- Saplings (gbh 10.1 to 30.0 C to H- Mature trees, gbh 30.160.0, 60.1-90.0, 90.1 - 120.0, 120.1 - cm),
150.0, 150.1-180.0 and > 180.1 cm respectively. 33
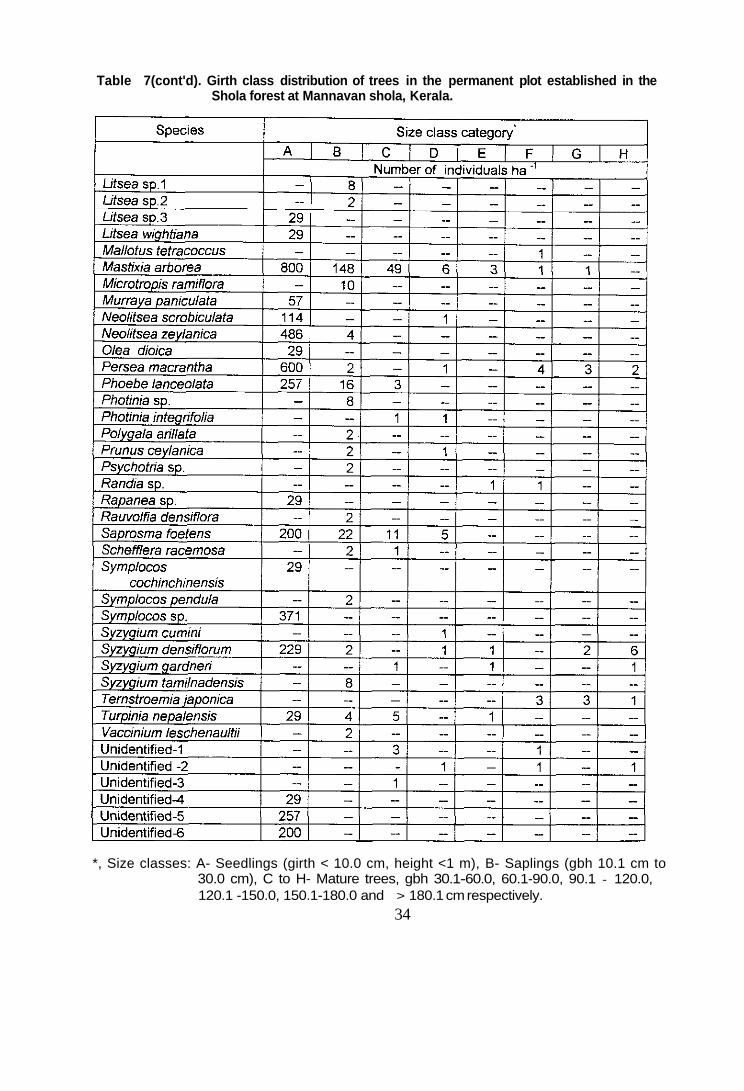
Table 7(cont'd). Girth class distribution of trees in the permanent plot established in the Shola forest at Mannavan shola, Kerala.
*, Size classes: A- Seedlings (girth < 10.0 cm, height <1 m), B- Saplings (gbh 10.1 cm to 30.0 cm), C to H- Mature trees, gbh 30.1-60.0, 60.1-90.0, 90.1 - 120.0, 120.1 -150.0, 150.1-180.0 and > 180.1 cm respectively.
34
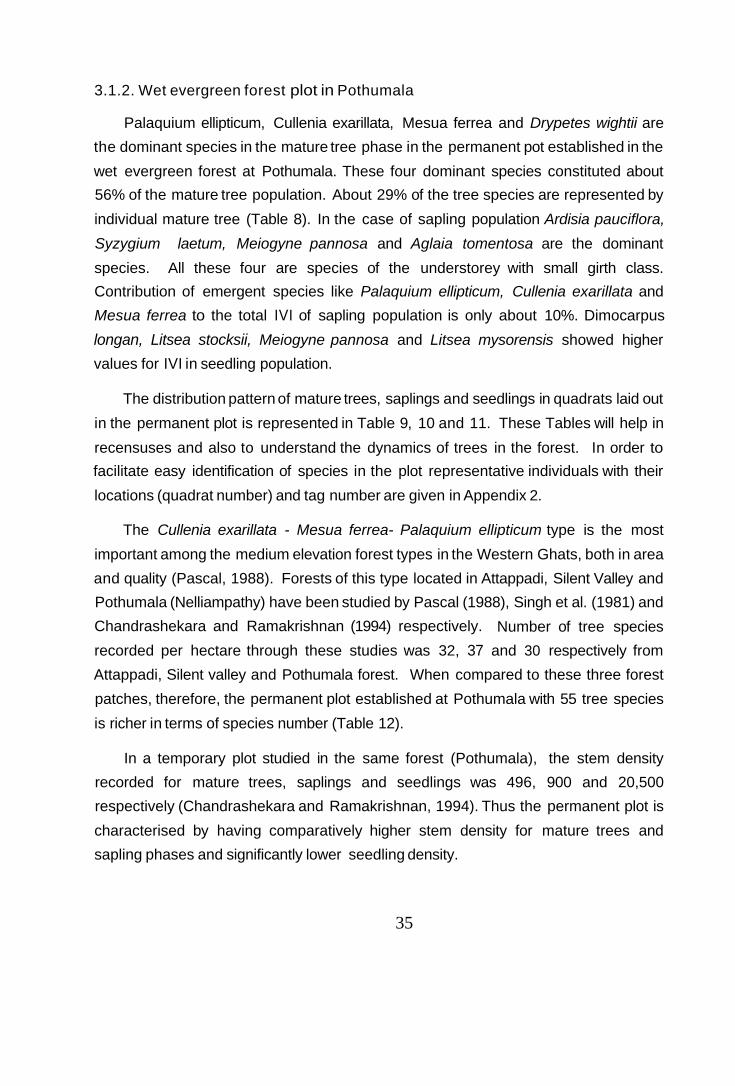
3.1.2. Wet evergreen forest plot in Pothumala
Palaquium ellipticum, Cullenia exarillata, Mesua ferrea and Drypetes wightii are
the dominant species in the mature tree phase in the permanent pot established in the
wet evergreen forest at Pothumala. These four dominant species constituted about 56% of the mature tree population. About 29% of the tree species are represented by
individual mature tree (Table 8). In the case of sapling population Ardisia pauciflora,
Syzygium laetum, Meiogyne pannosa and Aglaia tomentosa are the dominant
species. All these four are species of the understorey with small girth class. Contribution of emergent species like Palaquium ellipticum, Cullenia exarillata and
Mesua ferrea to the total IVI of sapling population is only about 10%. Dimocarpus
longan, Litsea stocksii, Meiogyne pannosa and Litsea mysorensis showed higher
values for IVI in seedling population.
The distribution pattern of mature trees, saplings and seedlings in quadrats laid out
in the permanent plot is represented in Table 9, 10 and 11. These Tables will help in
recensuses and also to understand the dynamics of trees in the forest. In order to facilitate easy identification of species in the plot representative individuals with their
locations (quadrat number) and tag number are given in Appendix 2.
The Cullenia exarillata - Mesua ferrea- Palaquium ellipticum type is the most
important among the medium elevation forest types in the Western Ghats, both in area
and quality (Pascal, 1988). Forests of this type located in Attappadi, Silent Valley and
Pothumala (Nelliampathy) have been studied by Pascal (1988), Singh et al. (1981) and
Chandrashekara and Ramakrishnan (1994) respectively. Number of tree species
recorded per hectare through these studies was 32, 37 and 30 respectively from
Attappadi, Silent valley and Pothumala forest. When compared to these three forest
patches, therefore, the permanent plot established at Pothumala with 55 tree species
is richer in terms of species number (Table 12).
In a temporary plot studied in the same forest (Pothumala), the stem density
recorded for mature trees, saplings and seedlings was 496, 900 and 20,500
respectively (Chandrashekara and Ramakrishnan, 1994). Thus the permanent plot is
characterised by having comparatively higher stem density for mature trees and
sapling phases and significantly lower seedling density.
35
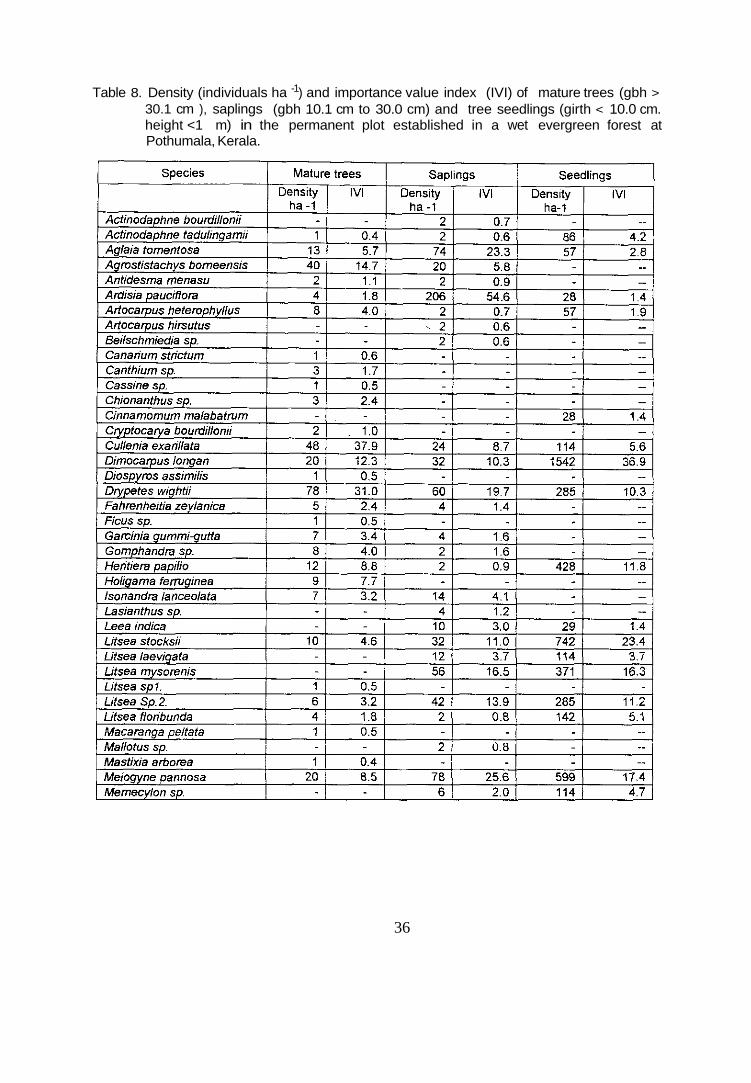
Table 8. Density (individuals ha -1) and importance value index (IVI) of mature trees (gbh > 30.1 cm ), saplings (gbh 10.1 cm to 30.0 cm) and tree seedlings (girth < 10.0 cm. height <1 m) in the permanent plot established in a wet evergreen forest at Pothumala, Kerala.
-cont'd-
36
Table 8 (cont'd). Density (individuals ha -1) and importance value index (IVI) of mature trees (gbh >30.1 cm), saplings (10.1 cm to 30.0 cm) and tree seedlings (girth < 10.0 cm, height <1 m) in the permanent plot established in a wet evergreen forest at Pothumala, Kerala.
37
Table 9. Mature trees (gbh >30.1 cm) distribution in quadrats (10 m x 10 m) laid out in the permanent plot established in a wet evergreen forest at Pothumala. Values in parantheses are number of individuals in the given quadrat
Species Quadrat number and n Actinodaphne I I I
Aglaia tomentosa
Agrostistachys meeboldii
Cullenia exarillata
Dimocarpus longan
(1) (1) (2) (1) (2)
40 55 59 68 74
91 93 94 (1) (1) (1) (1) (1)
(2) (1) (2)
--cont'd--
38
Table 9 (cont'd). Mature trees (gbh >30.1 cm) distribution in quadrats (10 m x 10 m) laid out in the permanent plot established in a wet evergreen forest at Pothumala. Values in parantheses are number of individuals in the given quadrat.
Meiogyne pannosa
39
Table 9 (cont'd). Mature trees (gbh >30.1 cm) distribution in quadrats (10 m x 10 m ) laid out in the permanent plot established in a wet evergreen forest at Pothumala. Values in parantheses are number of individuals in the given quadrat.
40
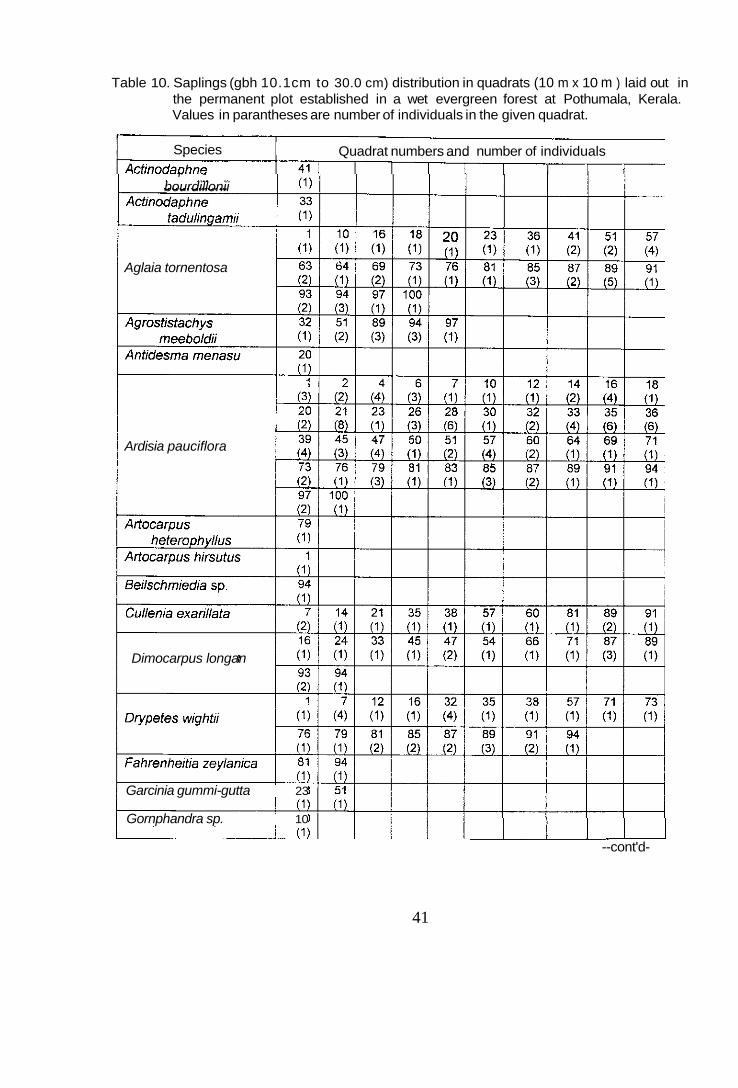
Table 10. Saplings (gbh 10.1cm to 30.0 cm) distribution in quadrats (10 m x 10 m ) laid out in the permanent plot established in a wet evergreen forest at Pothumala, Kerala. Values in parantheses are number of individuals in the given quadrat.
Species Quadrat numbers and number of individuals I I I I
bourdillonii
Aglaia tornentosa
Ardisia pauciflora
Dimocarpus longan
Garcinia gummi-gutta 23
Gornphandra sp. 10 u --cont'd-
41
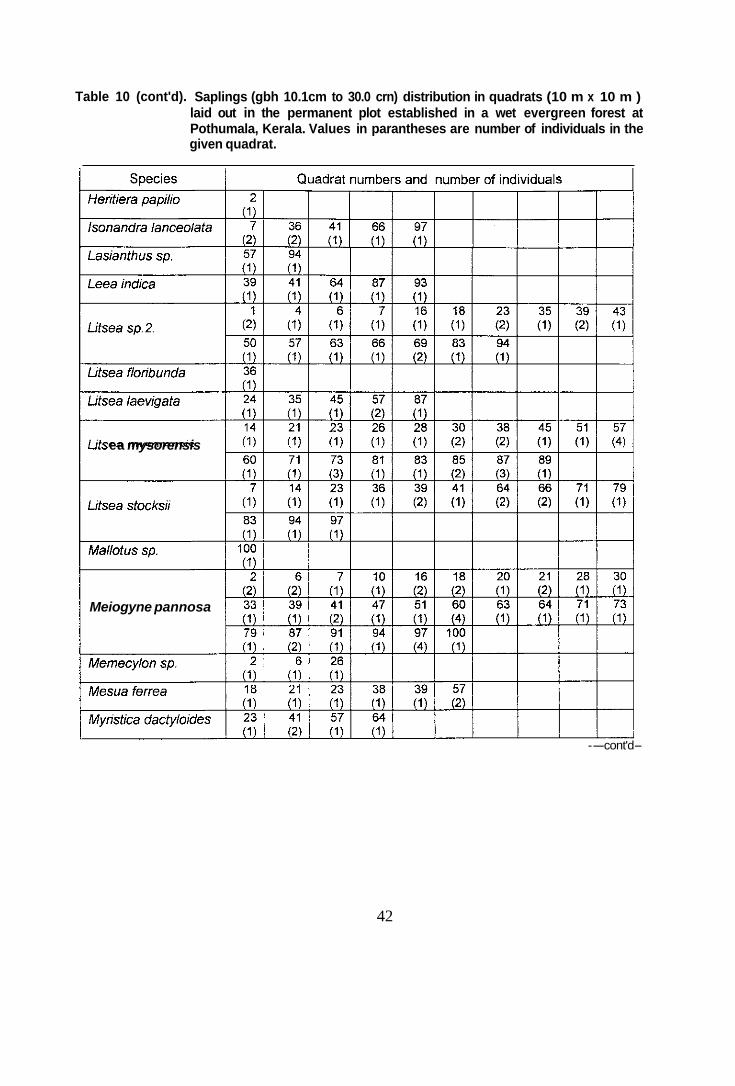
Table 10 (cont'd). Saplings (gbh 10.1cm to 30.0 crn) distribution in quadrats (10 m x 10 m ) laid out in the permanent plot established in a wet evergreen forest at Pothumala, Kerala. Values in parantheses are number of individuals in the given quadrat.
ea mysorensis
Meiogyne pannosa
--cont'd-
42
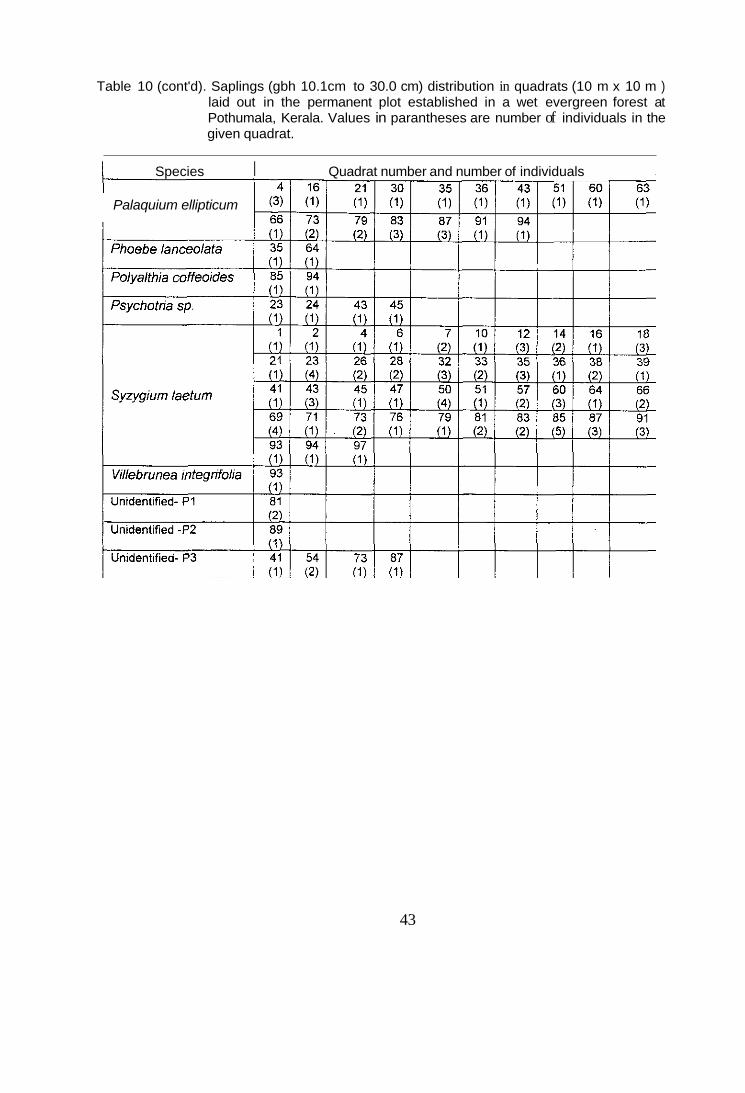
Table 10 (cont'd). Saplings (gbh 10.1cm to 30.0 cm) distribution in quadrats (10 m x 10 m ) laid out in the permanent plot established in a wet evergreen forest at Pothumala, Kerala. Values in parantheses are number of individuals in the given quadrat.
I Species I Quadrat number and number of individuals 1
Palaquium ellipticum
43
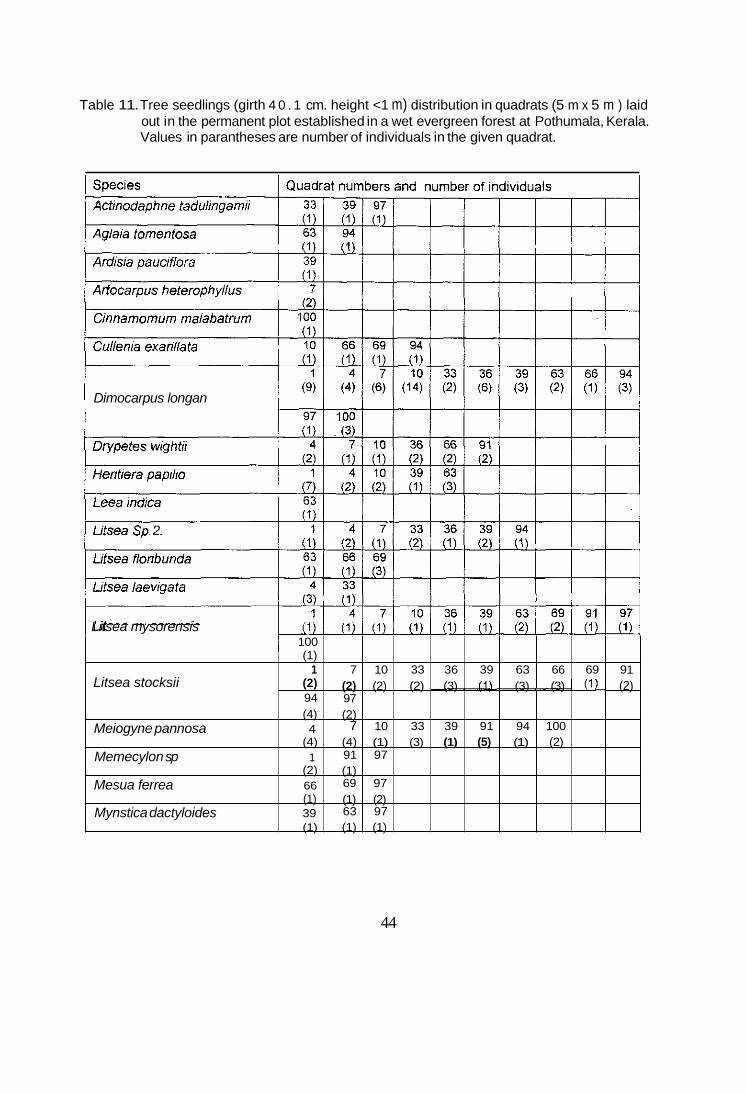
Table 11. Tree seedlings (girth 4 0 . 1 cm. height <1 m) distribution in quadrats (5 m x 5 m ) laid out in the permanent plot established in a wet evergreen forest at Pothumala, Kerala. Values in parantheses are number of individuals in the given quadrat.
1 100 (1)
1 Litsea stocksii
Litsea mysorensis
(2) 94 (4)
Meiogyne pannosa 4 (4)
Memecylon sp 1 (2)
Mesua ferrea
Dimocarpus longan
66 (1)
Mynstica dactyloides 39 (1)
7 10 33 36 39 63 66 69 91 (2) (2) (2) --_- (3) (1) (3) (3) (2)
(2) 7 10 33 39 91 94 100
(4) (1) (3) (1) (5) (1) (2)
(1) (1)
(1) (2)
(1) (1)
97
91 97
69 97
63 97
44
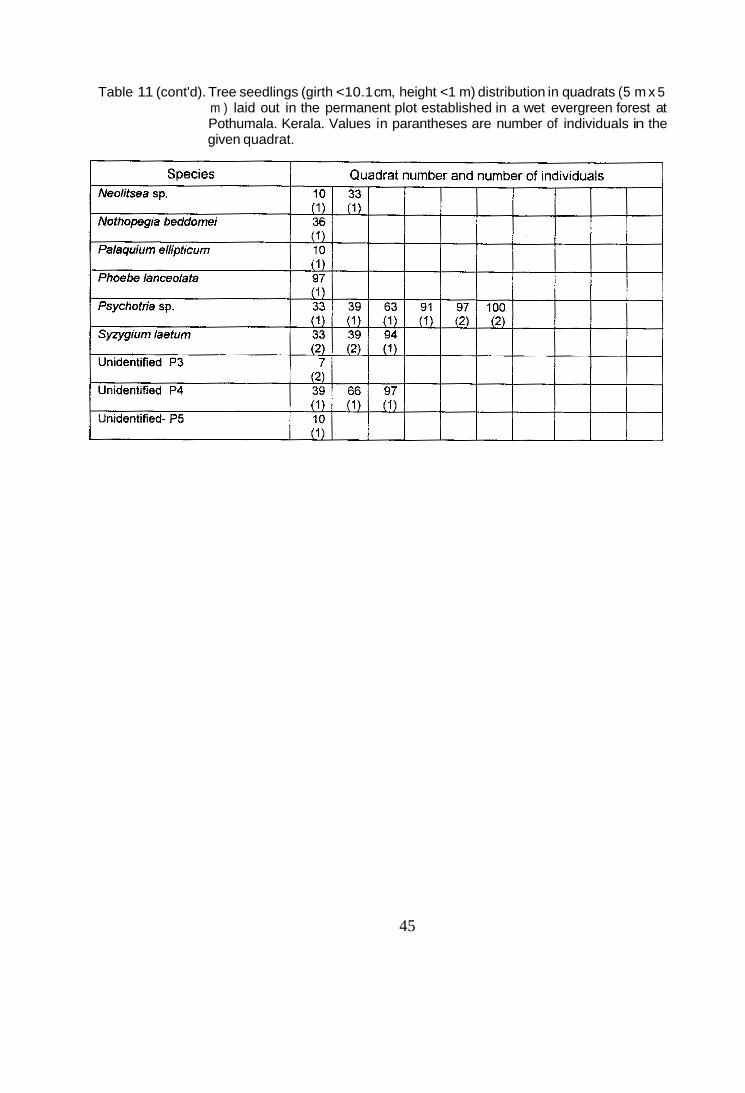
Table 11 (cont'd). Tree seedlings (girth <10.1 cm, height <1 m) distribution in quadrats (5 m x 5 m ) laid out in the permanent plot established in a wet evergreen forest at Pothumala. Kerala. Values in parantheses are number of individuals in the given quadrat.
45
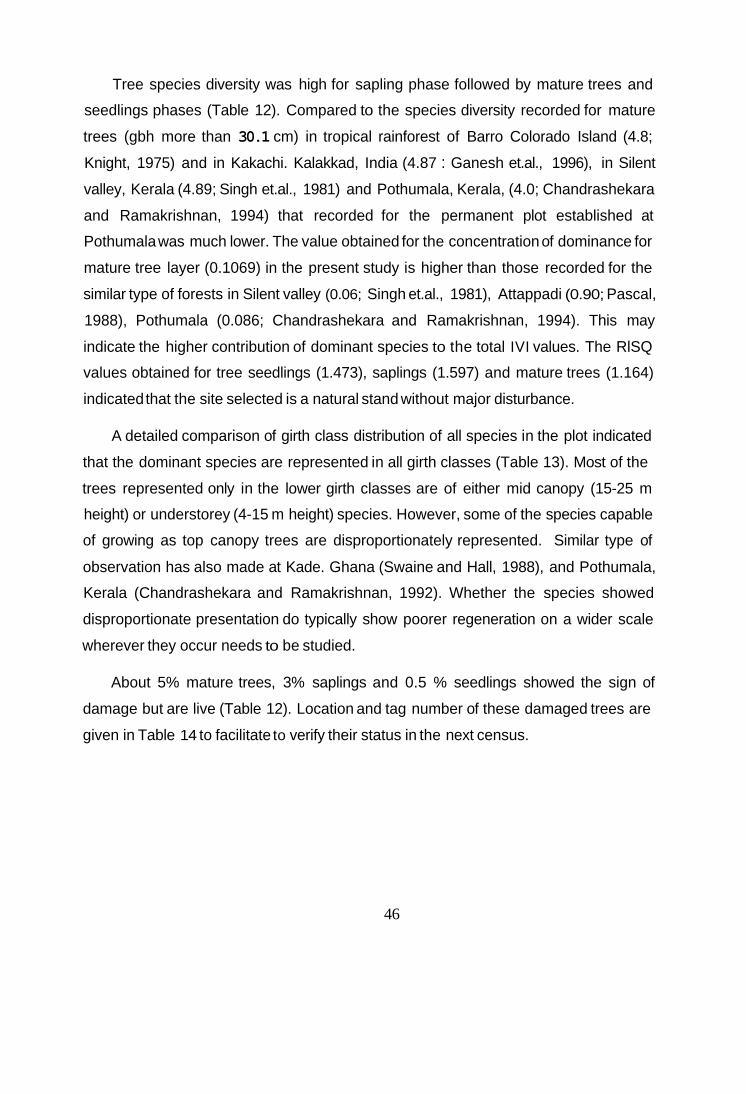
Tree species diversity was high for sapling phase followed by mature trees and
seedlings phases (Table 12). Compared to the species diversity recorded for mature
trees (gbh more than 30.1 cm) in tropical rainforest of Barro Colorado Island (4.8;
Knight, 1975) and in Kakachi. Kalakkad, India (4.87 : Ganesh et.al., 1996), in Silent
valley, Kerala (4.89; Singh et.al., 1981) and Pothumala, Kerala, (4.0; Chandrashekara
and Ramakrishnan, 1994) that recorded for the permanent plot established at
Pothumala was much lower. The value obtained for the concentration of dominance for
mature tree layer (0.1069) in the present study is higher than those recorded for the
similar type of forests in Silent valley (0.06; Singh et.al., 1981), Attappadi (0.90; Pascal,
1988), Pothumala (0.086; Chandrashekara and Ramakrishnan, 1994). This may
indicate the higher contribution of dominant species to the total IVI values. The RlSQ
values obtained for tree seedlings (1.473), saplings (1.597) and mature trees (1.164)
indicated that the site selected is a natural stand without major disturbance.
A detailed comparison of girth class distribution of all species in the plot indicated
that the dominant species are represented in all girth classes (Table 13). Most of the
trees represented only in the lower girth classes are of either mid canopy (15-25 m
height) or understorey (4-15 m height) species. However, some of the species capable
of growing as top canopy trees are disproportionately represented. Similar type of
observation has also made at Kade. Ghana (Swaine and Hall, 1988), and Pothumala,
Kerala (Chandrashekara and Ramakrishnan, 1992). Whether the species showed
disproportionate presentation do typically show poorer regeneration on a wider scale
wherever they occur needs to be studied.
About 5% mature trees, 3% saplings and 0.5 % seedlings showed the sign of
damage but are live (Table 12). Location and tag number of these damaged trees are
given in Table 14 to facilitate to verify their status in the next census.
46
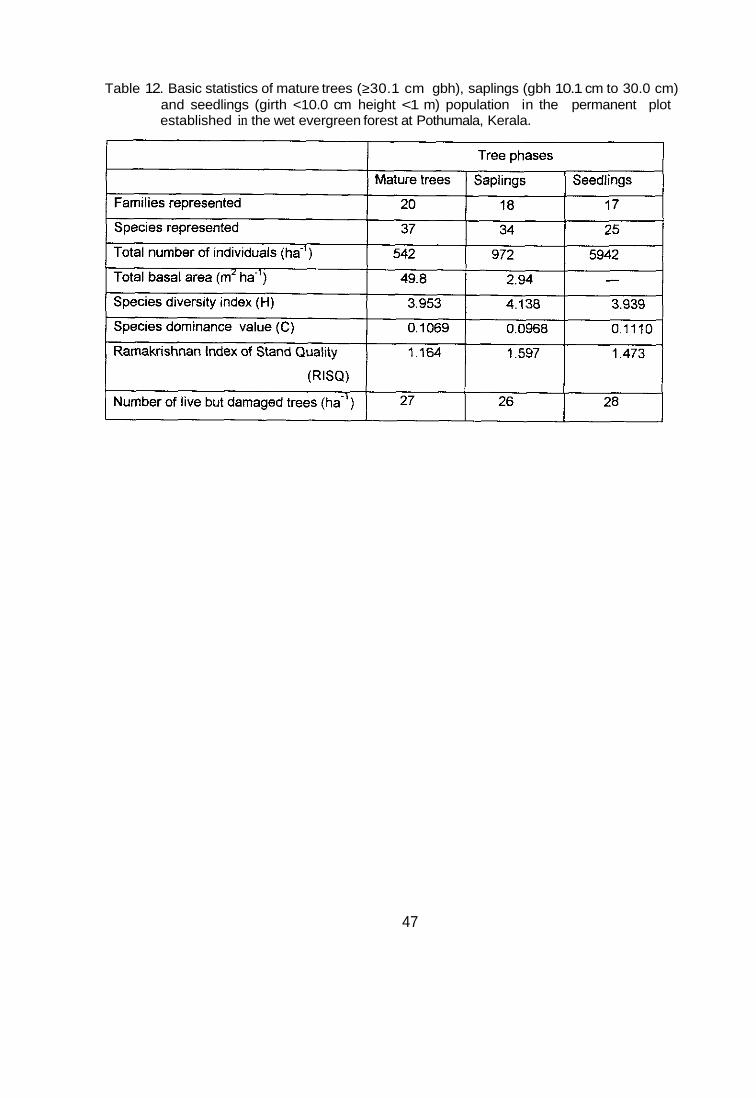
Table 12. Basic statistics of mature trees (≥30.1 cm gbh), saplings (gbh 10.1 cm to 30.0 cm) and seedlings (girth <10.0 cm height <1 m) population in the permanent plot established in the wet evergreen forest at Pothumala, Kerala.
47
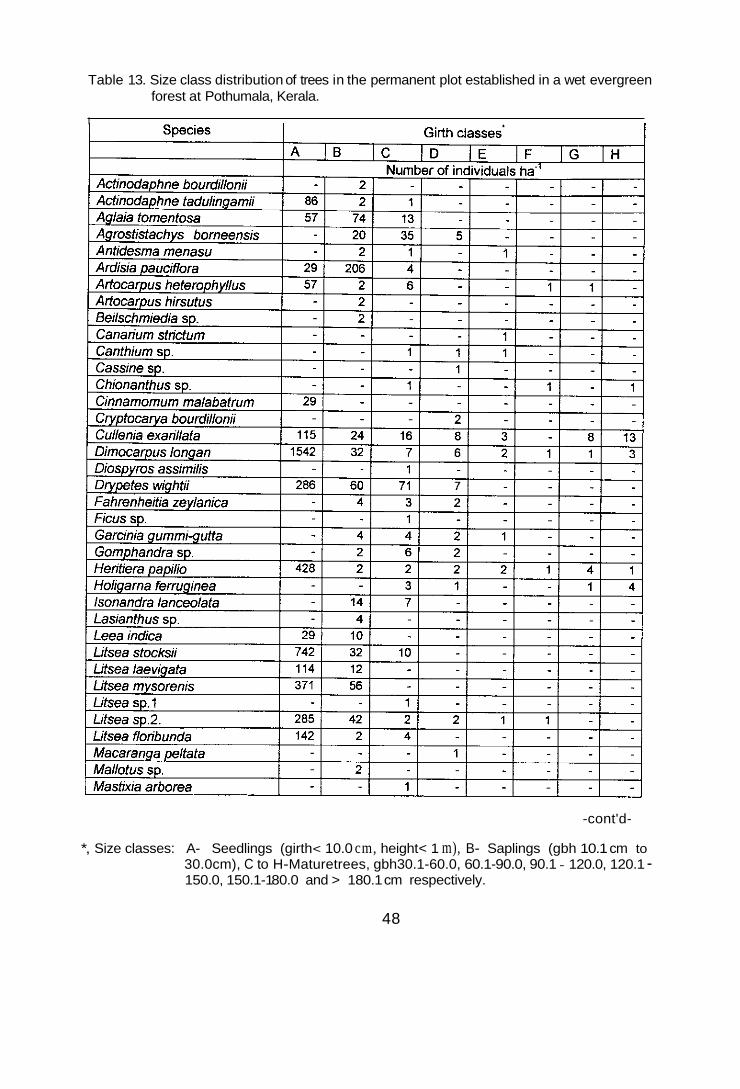
Table 13. Size class distribution of trees in the permanent plot established in a wet evergreen forest at Pothumala, Kerala.
I
-cont'd-
*, Size classes: A- Seedlings (girth < 10.0 cm, height < 1 m), B- Saplings (gbh 10.1 cm to 30.0cm), C to H-Maturetrees, gbh30.1-60.0, 60.1-90.0, 90.1 - 120.0, 120.1 - 150.0, 150.1-1 80.0 and > 180.1 cm respectively.
48
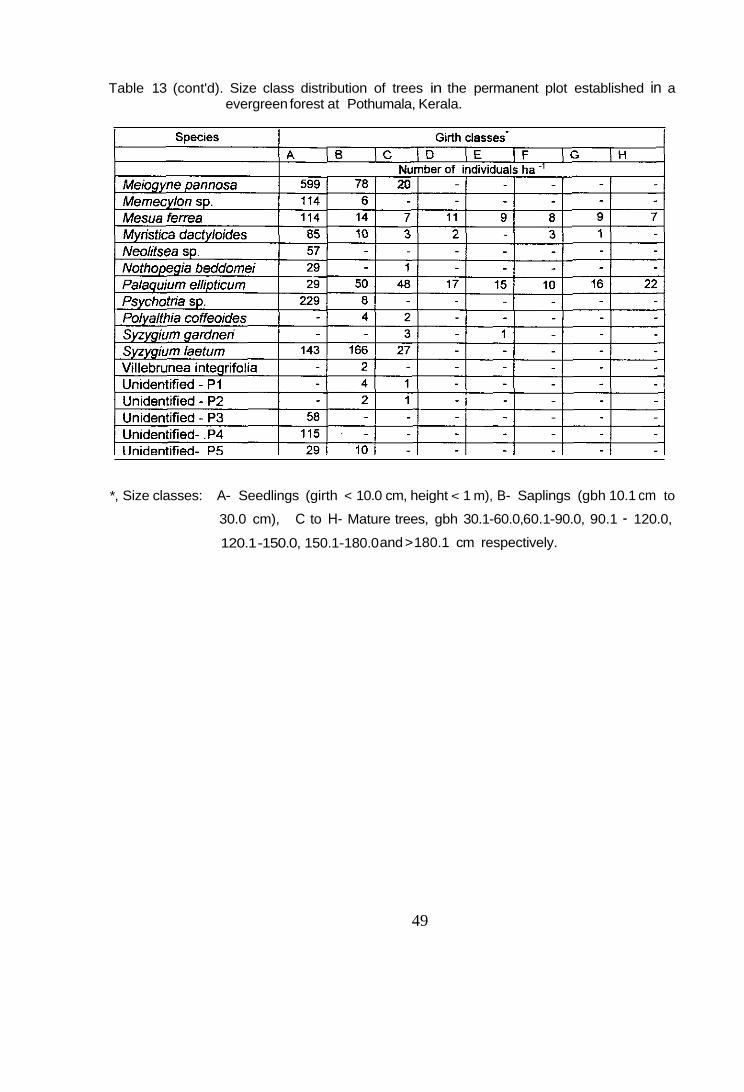
Table 13 (cont'd). Size class distribution of trees in the permanent plot established in a evergreen forest at Pothumala, Kerala.
*, Size classes: A- Seedlings (girth < 10.0 cm, height < 1 m), B- Saplings (gbh 10.1 cm to
30.0 cm), C to H- Mature trees, gbh 30.1 -60.0, 60.1 -90.0, 90.1 - 120.0,
120.1 -150.0, 150.1-180.0 and > 180.1 cm respectively.
49
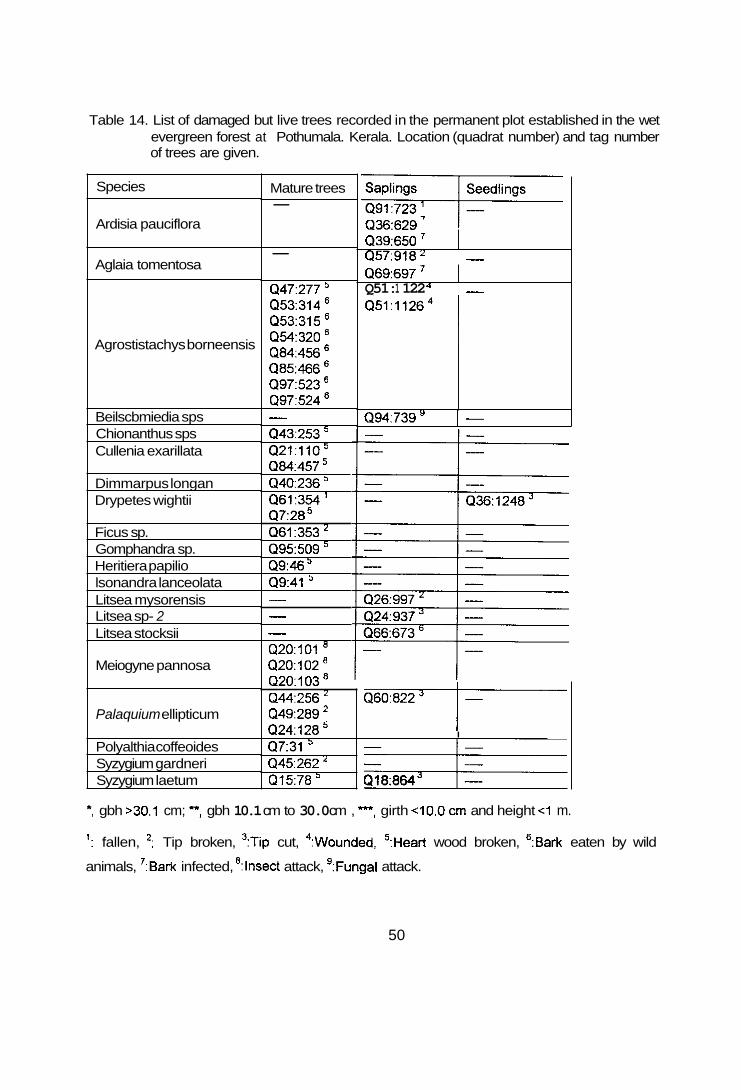
Table 14. List of damaged but live trees recorded in the permanent plot established in the wet evergreen forest at Pothumala. Kerala. Location (quadrat number) and tag number of trees are given.
Q94:739
Species
-
Ardisia pauciflora
Aglaia tomentosa
Agrostistachys borneensis
Beilscbmiedia sps Chionanthus sps Cullenia exarillata
Dimmarpus longan Drypetes wightii
Ficus sp. Gomphandra sp. Heritiera papilio lsonandra lanceolata Litsea mysorensis Litsea sp- 2 Litsea stocksii
Meiogyne pannosa
Palaquium ellipticum
Polyalthia coffeoides Syzygium gardneri Syzygium laetum
Mature trees -
-
Q47:277 ’ Q53:314 Q53:315 Q54:320 ’ Q84:456 Q85:466 Q97:523 ‘ Q97:524
Q43:253 ’ Q21-l1O5 Q84:457 Q40:236 ’ Q61:354 ’ Q7:28 Q61:353 Q95:509 ’ Q9:46 ’ Q9:41 ’
-
- - - Q20:101 Q20:102’ Q20:103’ Q44:256 Q49:289 Q24:128 Q7:31 ’ Q45:262 Q15:78’
Q36:629 Q39:650 Q57:918 - Q69:697 Q51: 1 122 -
Q24:937
Q60:822 1 I
E-J+= Q18:864
*, gbh >30.1 cm; -, gbh 10.1 cm to 30.0 cm , -, girth 40.0 cm and height 4 m.
’: fallen, ‘: Tip broken, 3:Tip cut, 4:Wounded, ?Heart wood broken, ?Bark eaten by wild
animals, 7:Bark infected, *:Insect attack, ’:Fungal attack.
50
3.1.3. Moist deciduous forest plot in Channakkad
In the moist deciduous forest plot, mature tree population is dominated by Xylia
xylocarpa. Grewia tiliifolia, Dillenia pentagyna with 62% contribution to the total number
of trees censused in the plot (Table 15). Miliusa tomentosa, Grewia tiliifolia, Terminalia
paniculata and Stereospermum sp. are dominant among sapling population. In the
case of seedling population, Xylia xylocarpa is dominant followed by Stereospermum
sp. Grewia tiliifolia and Sterculia guttata. Out of 37 tree species recorded only six
species including Grewia tiliifolia and Xylia xylocarpa represented in all three phases
i.e. seedling, saplings and mature phases, while the remaining species represented in
only one or two phases. All trees recorded in the quadrats studied are listed (Tables
16,17 and 18) with quadrat number and number of individuals in a given quadrat to
assist in locating each of them during recensus. Appendix 3 provides quadrat number
and tag number of some representative individuals of each species to help in
identification in the field.
The permanent plot at Channakkad with 98 mature trees ha-1 (Table 19),
represented mainly by deciduous species, is poorer in terms of stem density when
compared to the moist deciduous forest of Devadana, Chikmagalore District in the
Western Ghat region (344 trees ha -1; Swamy. 1988). Girth class analysis of all tree
species in the permanent plot also showed tha? about 83% of species are represented
in one or two phases primarily indicate poor recruitment of individuals from lower girth
class to higher ones (Table 20). Further, trees with gbh >120.1 cm are more than
those of gbh ranging from 30.1-120.0 cm. The poor representation of trees especially
those falling under middle size class may be attributed to illicit felling of such trees by
the forest dwellers and residents of near by areas.
About 5 % mature trees and 4.8 % saplings showed the sign of damage but are
alive (Table 19). Loation and tag number of these damaged trees are given Table 21 to facilitate to verify their status in the next census.
5 1
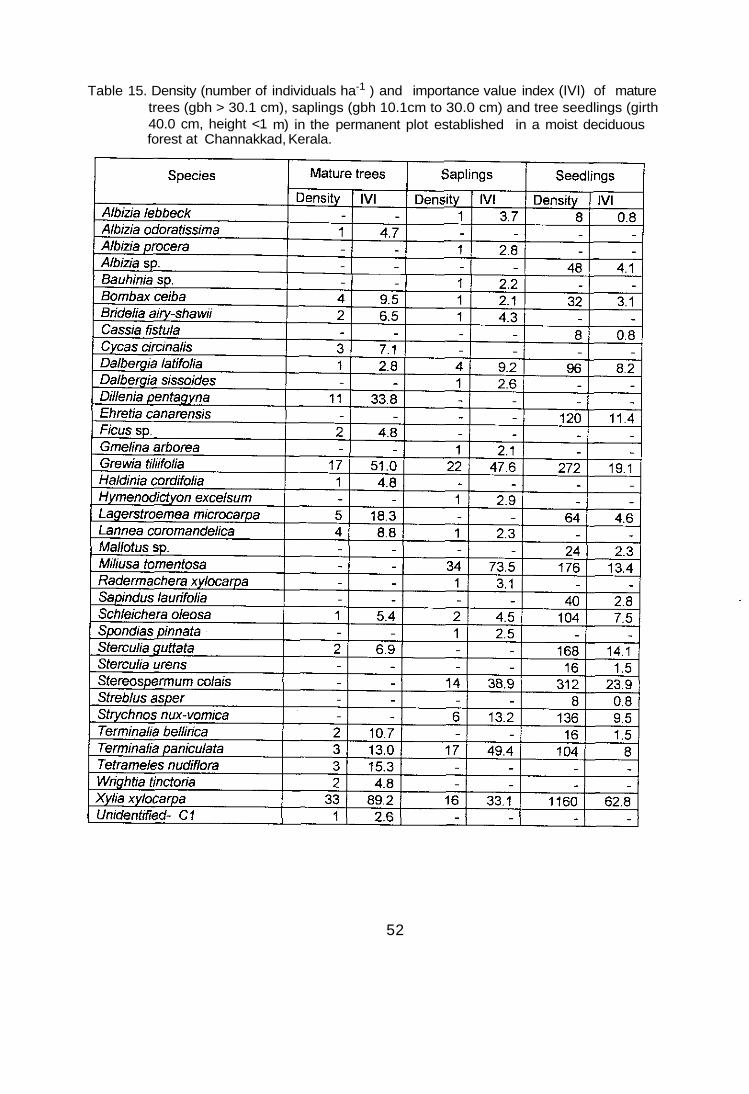
Table 15. Density (number of individuals ha-1 ) and importance value index (IVI) of mature trees (gbh > 30.1 cm), saplings (gbh 10.1cm to 30.0 cm) and tree seedlings (girth 40.0 cm, height <1 m) in the permanent plot established in a moist deciduous forest at Channakkad, Kerala.
52
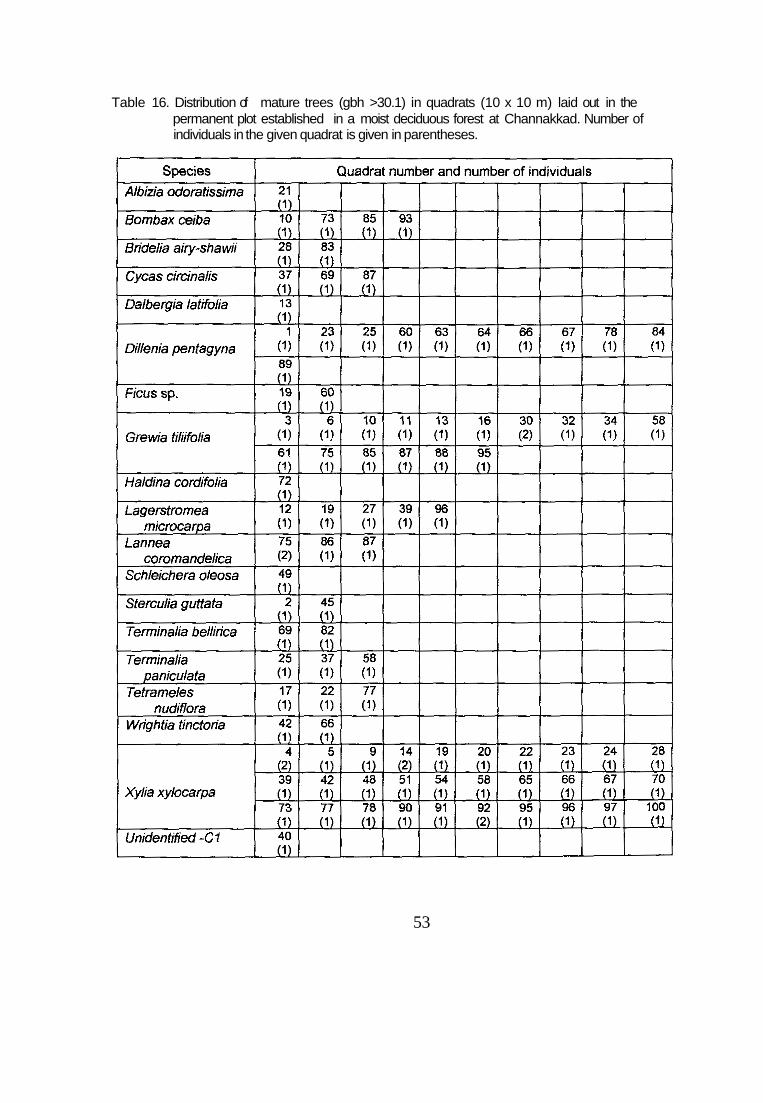
Table 16. Distribution of mature trees (gbh >30.1) in quadrats (10 x 10 m) laid out in the permanent plot established in a moist deciduous forest at Channakkad. Number of individuals in the given quadrat is given in parentheses.
53
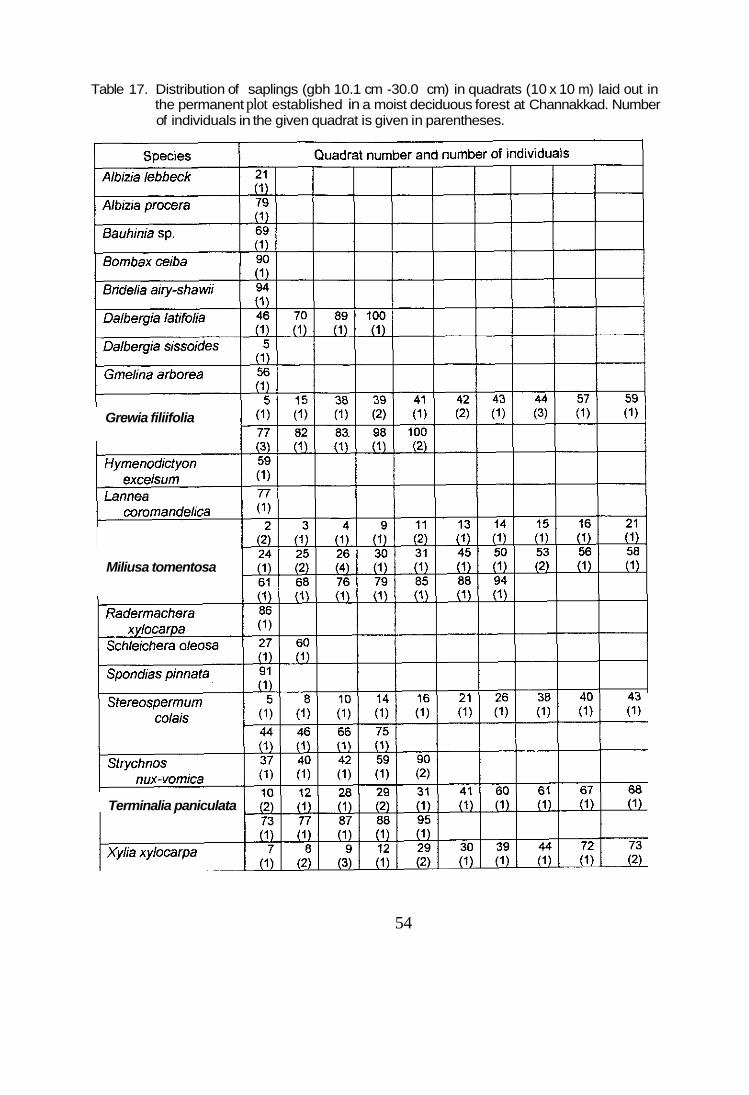
Table 17. Distribution of saplings (gbh 10.1 cm -30.0 cm) in quadrats (10 x 10 m) laid out in the permanent plot established in a moist deciduous forest at Channakkad. Number of individuals in the given quadrat is given in parentheses.
Grewia filiifolia
Miliusa tomentosa
Terminalia paniculata
54
Species Albizia lebbeck
Ehretia canarensis
Grewia tiliifolia
Miliusa tomentosa
Stereospermum colais
---cont'd -
Quadrat number and number of individuals
55
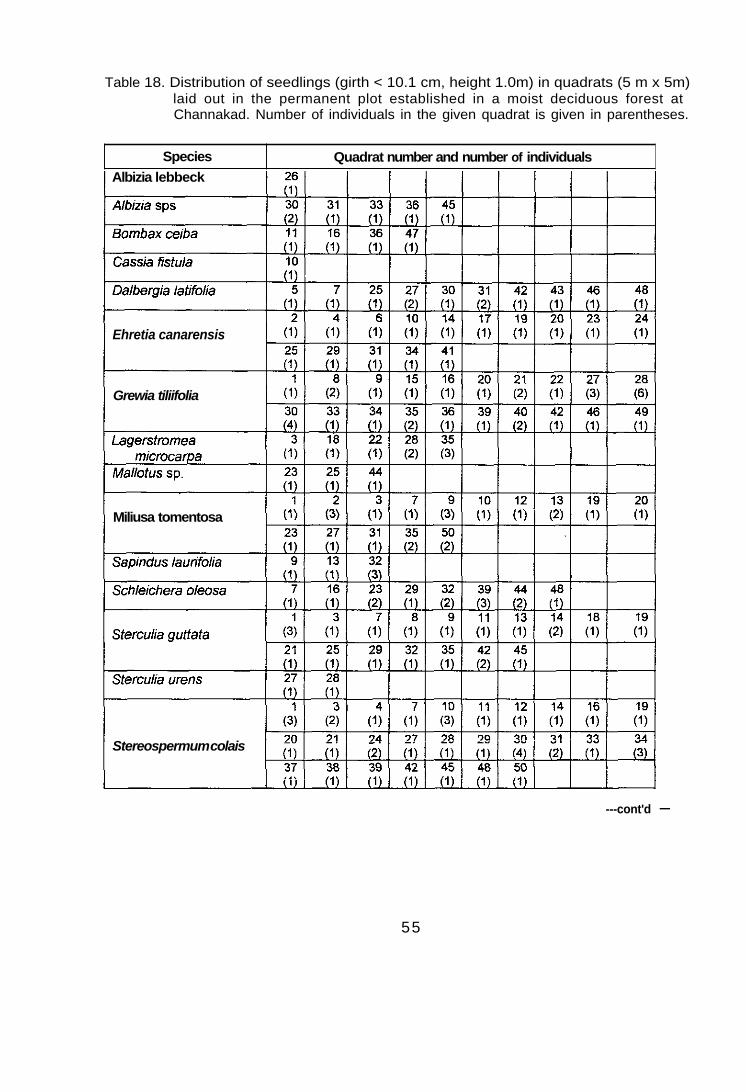
Table 18. Distribution of seedlings (girth < 10.1 cm, height 1.0m) in quadrats (5 m x 5m)laid out in the permanent plot established in a moist deciduous forest atChannakad. Number of individuals in the given quadrat is given in parentheses.
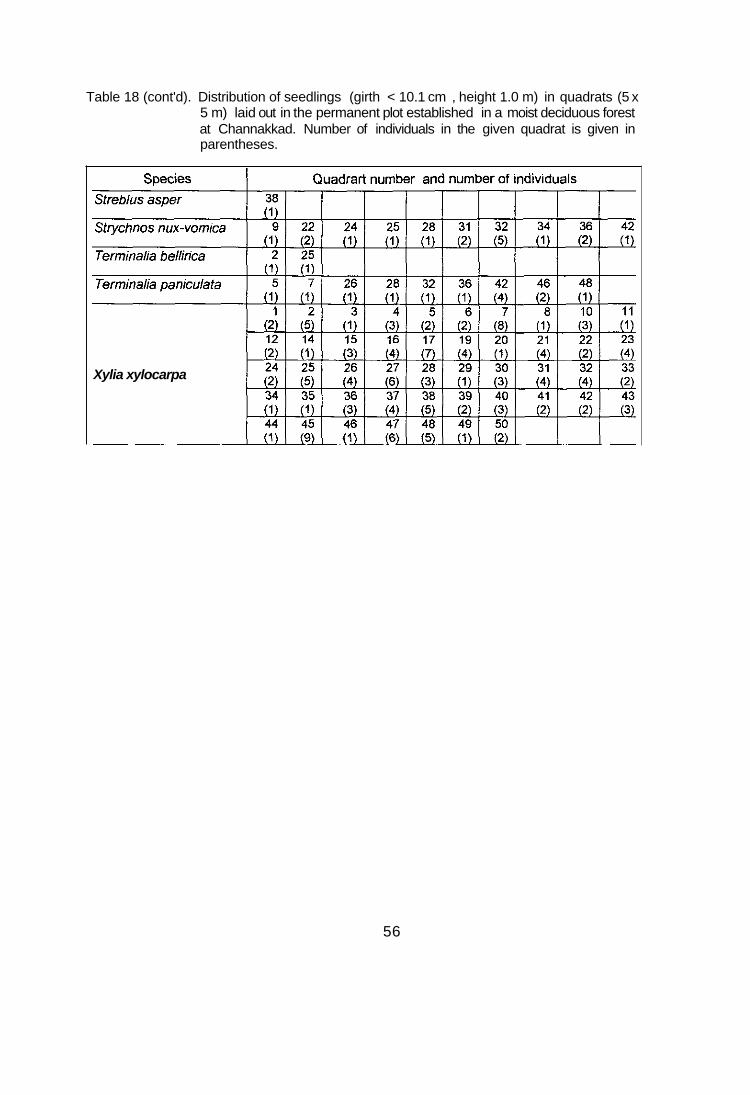
Table 18 (cont'd). Distribution of seedlings (girth < 10.1 cm , height 1.0 m) in quadrats (5 x 5 m) laid out in the permanent plot established in a moist deciduous forest at Channakkad. Number of individuals in the given quadrat is given in parentheses.
Xylia xylocarpa
56
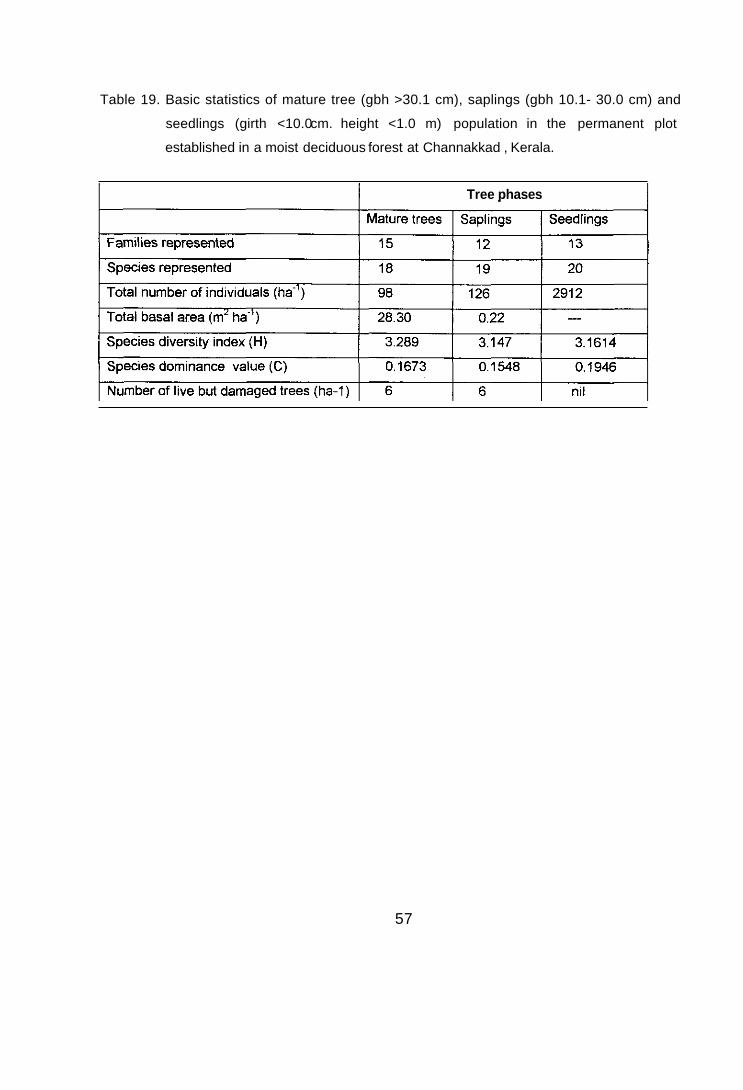
Table 19. Basic statistics of mature tree (gbh >30.1 cm), saplings (gbh 10.1- 30.0 cm) and
seedlings (girth <10.0 cm. height <1.0 m) population in the permanent plot
established in a moist deciduous forest at Channakkad , Kerala.
Tree phases
57
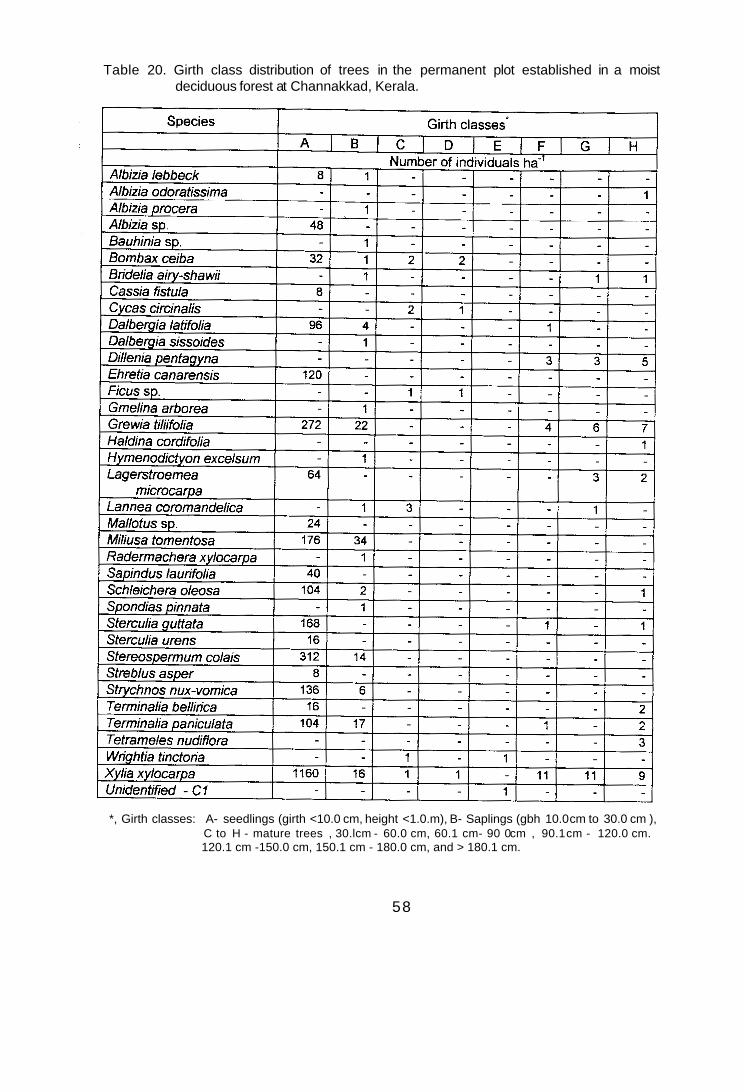
Table 20. Girth class distribution of trees in the permanent plot established in a moist deciduous forest at Channakkad, Kerala.
*, Girth classes: A- seedlings (girth <10.0 cm, height <1.0.m), B- Saplings (gbh 10.0 cm to 30.0 cm ), C to H - mature trees , 30.lcm - 60.0 cm, 60.1 cm- 90 0 cm , 90.1 cm - 120.0 cm. 120.1 cm -150.0 cm, 150.1 cm - 180.0 cm, and > 180.1 cm.
58
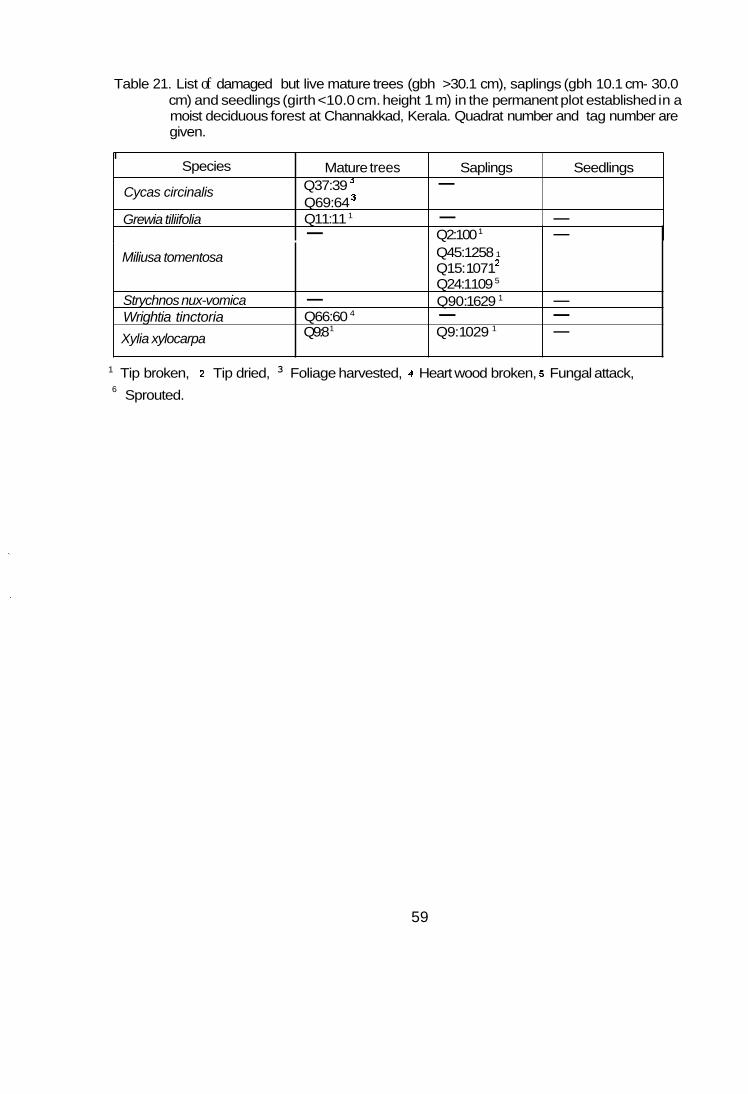
Table 21. List of damaged but live mature trees (gbh >30.1 cm), saplings (gbh 10.1 cm- 30.0 cm) and seedlings (girth <10.0 cm. height 1 m) in the permanent plot established in a moist deciduous forest at Channakkad, Kerala. Quadrat number and tag number are given.
I Species
Cycas circinalis
Grewia tiliifolia
Mature trees Saplings Seedlings Q37:39 ’ - - Q69:64 Q11:11 1 - - - Q2:100 1 -
Miliusa tomentosa
Strychnos nux-vomica Wrightia tinctoria
Xylia xylocarpa
1 Tip broken, Tip dried, 3 Foliage harvested, Heart wood broken, Fungal attack,
Sprouted. 6
Q45:1258 1
Q15: 1 071 Q24:1109 5
- Q90: 1 629 1 - Q66:60 4 - - Q9:8 1 Q9: 1 029 1 - Q9:8 6
59
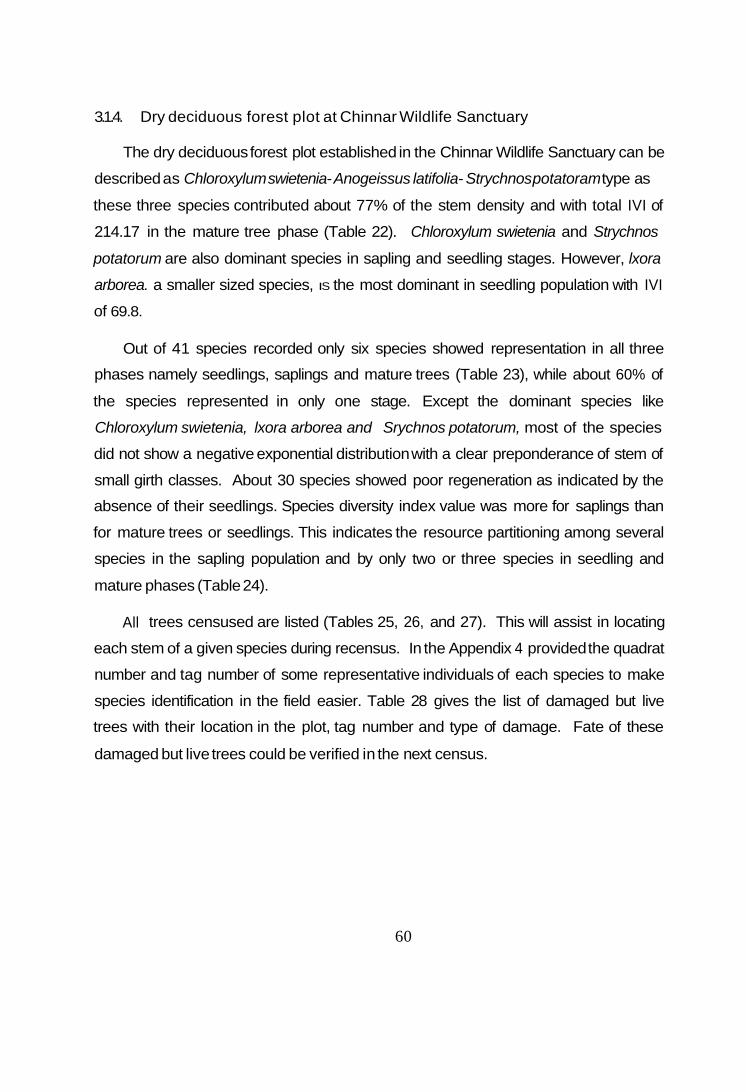
3.1.4. Dry deciduous forest plot at Chinnar Wildlife Sanctuary
The dry deciduous forest plot established in the Chinnar Wildlife Sanctuary can be
described as Chloroxylum swietenia- Anogeissus latifolia- Strychnos potatoram type as
these three species contributed about 77% of the stem density and with total IVI of
214.17 in the mature tree phase (Table 22). Chloroxylum swietenia and Strychnos
potatorum are also dominant species in sapling and seedling stages. However, lxora
arborea. a smaller sized species, IS the most dominant in seedling population with IVI
of 69.8.
Out of 41 species recorded only six species showed representation in all three
phases namely seedlings, saplings and mature trees (Table 23), while about 60% of
the species represented in only one stage. Except the dominant species like
Chloroxylum swietenia, lxora arborea and Srychnos potatorum, most of the species
did not show a negative exponential distribution with a clear preponderance of stem of
small girth classes. About 30 species showed poor regeneration as indicated by the
absence of their seedlings. Species diversity index value was more for saplings than
for mature trees or seedlings. This indicates the resource partitioning among several
species in the sapling population and by only two or three species in seedling and
mature phases (Table 24).
All trees censused are listed (Tables 25, 26, and 27). This will assist in locating
each stem of a given species during recensus. In the Appendix 4 provided the quadrat
number and tag number of some representative individuals of each species to make
species identification in the field easier. Table 28 gives the list of damaged but live
trees with their location in the plot, tag number and type of damage. Fate of these
damaged but live trees could be verified in the next census.
60
Table 22. Density (individuals ha-1 ) and importance value index (IVI) mature trees (gbh> 30.1 cm), saplings (gbh 10.1 cm - 30.0 cm) and seedlings (girth < 10.0 cm, height < lm) in the permanent plot established in a dry deciduous forest at Chinnar Wildlife Sanctuary, Kerala.
61
Table 23. Girth class distribution of trees in the permanent plot established in a dry deciduous forest at Chinnar Wildlife Sanctuary, Kerala
*, Size classes: A- Seedlings (girth 40.0 cm, height <1.0 m ); B- Saplings (gbh 10.1 cm to 30.0 cm); C to H- Mature trees , 30.1- 60.0, 60.1 -90.0, 90.1- 120.0, 120.1-150.0, 150.1- 180.0 and >180.0 cm respectively.
62
Table 24. Basic statistics of mature tree (gbh >30.1 cm), saplings (gbh 10.1- 30.0 cm) and seedlings (girth <10.0 cm, height <1.0 m) population in the permanent plot established in a dry deciduous forest art Chinnar Wildlife Sanctuary, Keraia.
63
Table 25. Mature trees (gbh >30.1 cm) distribution in quadrats (10m x 10 m) laid out in the permanent plot established in a dry deciduous forest at Chinnar Wildlife Sanctuary, Kerala. Values in parentheses are number of individuals.
Anogeissus latifolia
Chloroxylon swietenia
Dalbergia paniculata
-cont'd--
64
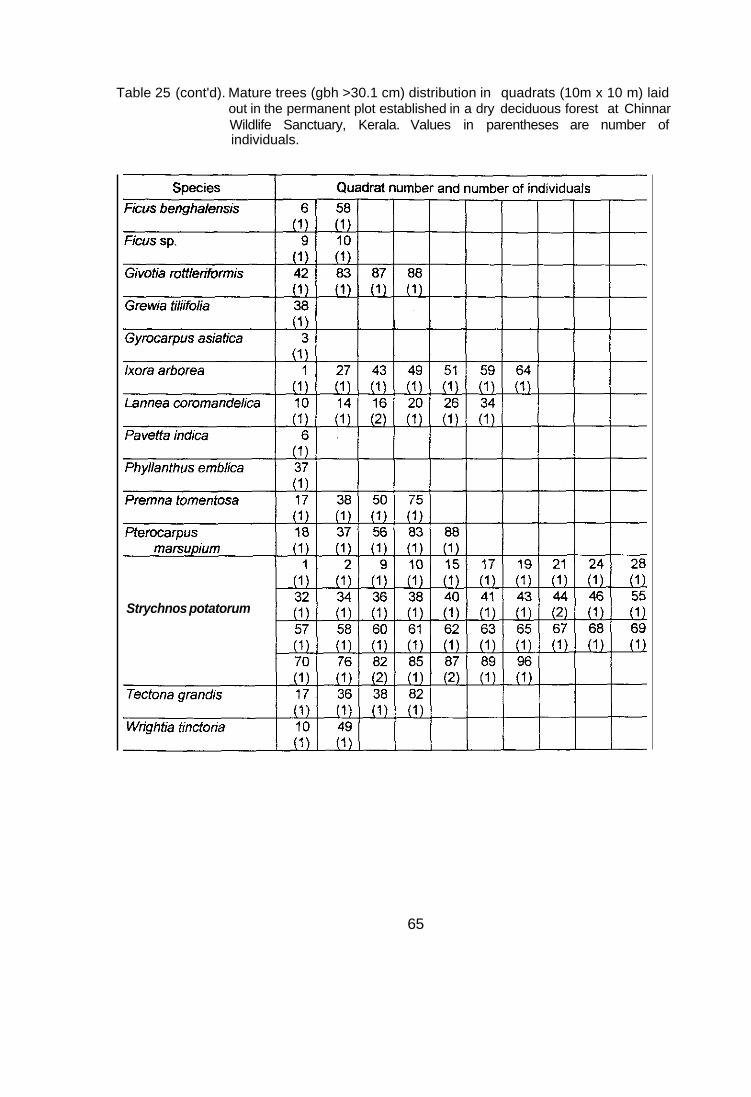
Table 25 (cont'd). Mature trees (gbh >30.1 cm) distribution in quadrats (10m x 10 m) laid out in the permanent plot established in a dry deciduous forest at Chinnar Wildlife Sanctuary, Kerala. Values in parentheses are number of individuals.
Strychnos potatorum
65
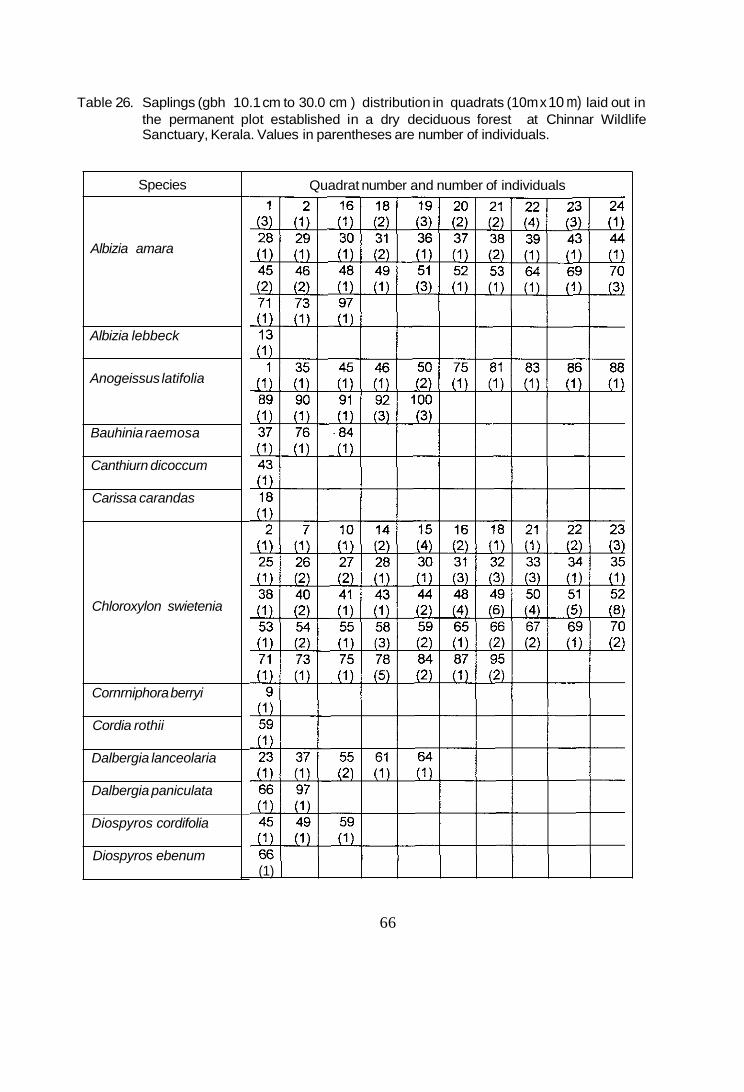
Table 26. Saplings (gbh 10.1 cm to 30.0 cm ) distribution in quadrats (10m x 10 m) laid out in the permanent plot established in a dry deciduous forest at Chinnar Wildlife Sanctuary, Kerala. Values in parentheses are number of individuals.
Species
Albizia amara
Albizia lebbeck
Anogeissus latifolia
Bauhinia raemosa
Canthiurn dicoccum
Carissa carandas
Chloroxylon swietenia
Cornrniphora berryi
Cordia rothii
Dalbergia lanceolaria
Dalbergia paniculata
Diospyros cordifolia
Diospyros ebenum
Quadrat number and number of individuals
(1) I --confd-
66
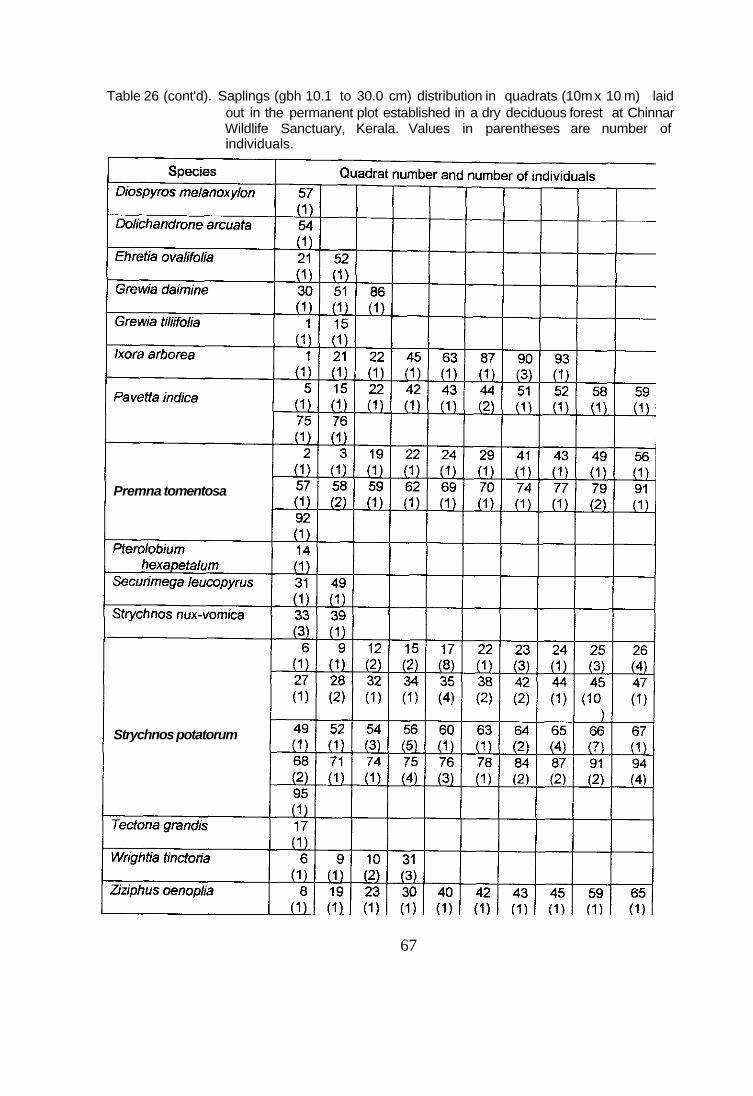
Table 26 (cont'd). Saplings (gbh 10.1 to 30.0 cm) distribution in quadrats (10m x 10 m) laid out in the permanent plot established in a dry deciduous forest at Chinnar Wildlife Sanctuary, Kerala. Values in parentheses are number of individuals.
Premna tomentosa
Strychnos potatorum
67
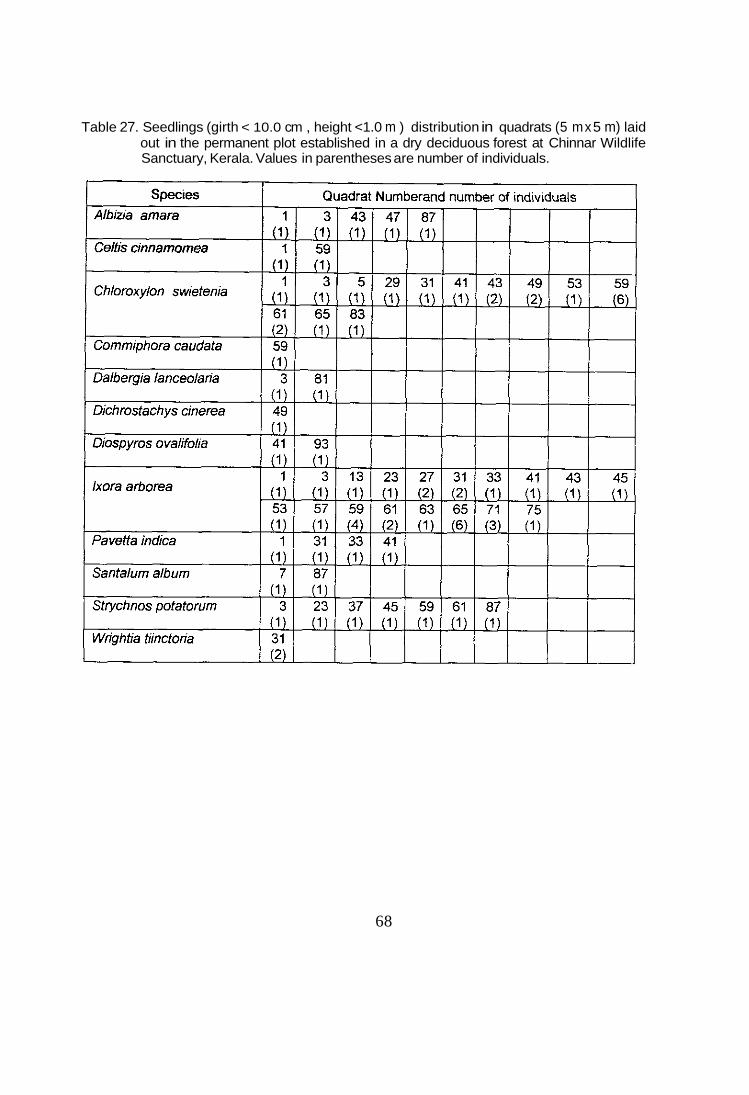
Table 27. Seedlings (girth < 10.0 cm , height <1.0 m ) distribution in quadrats (5 m x 5 m) laid out in the permanent plot established in a dry deciduous forest at Chinnar Wildlife Sanctuary, Kerala. Values in parentheses are number of individuals.
68
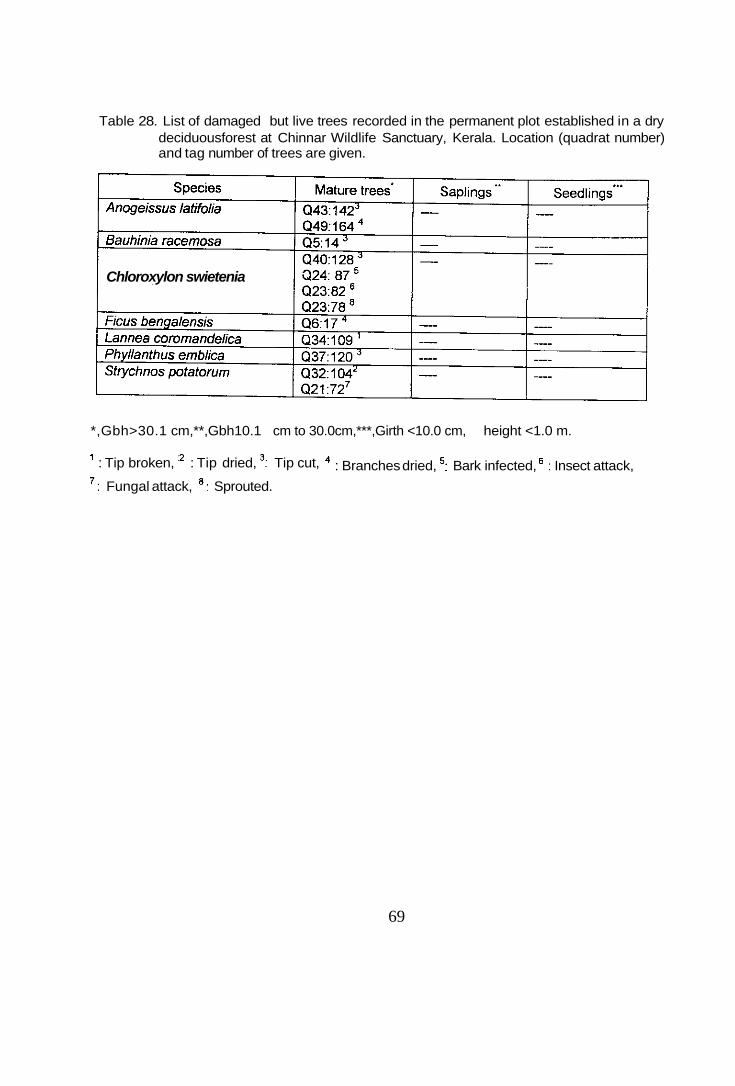
Table 28. List of damaged but live trees recorded in the permanent plot established in a dry deciduousforest at Chinnar Wildlife Sanctuary, Kerala. Location (quadrat number) and tag number of trees are given.
Chloroxylon swietenia
*,Gbh>30.1 cm,**,Gbh10.1 cm to 30.0cm,***,Girth <10.0 cm, height <1.0 m.
' : Tip broken, :' : Tip dried, ': Tip cut,
': Fungal attack, ': Sprouted. : Branches dried, 5: Bark infected, ' : Insect attack,
69
3.2. Comparison of permanent sample plots for vegetation structure and
tree species diversity
In terms of number of tree species per hectare, shola forest has the highest
density (76 species) followed by evergreen forest (41), dry deciduous forest (41) and
moist deciduous forest (37). Even the stem density of mature trees, and seedlings
also showed the same trend. However, sapling density was more in evergreen forest
than in shola forest plot. This could be attributed for two reasons. The first reason is the
dominance of understorey species in the girth class ranging from 10.1 cm to 30.0 cm in
evergreen forest. It may be noticed that late secondary successional species are well
represented in the sapling population in evergreen forest plot. This is an indication of a
natural disturbance occurred in the evergreen forest patch leading to the regeneration
of late secondary species in the recent past. These species are now attained sapling
phase thus contributed to the higher sapling density in the plot. The shola and wet
evergreen forest patches are undisturbed as also indicated by their RlSQ values
(Tables 5 and 12).
The dry deciduous forest plot is not being subjected to the anthropogenic
disturbance after the establishment of the Sanctuary. Yet the poor regeneration of
majority of the species are recorded from the plot. The causes for such a general
failure of regeneration of trees in the plot need to be investigated. It may be mentioned
here that unlike dry deciduous forest, the moist deciduous forest plot showed better
regeneration of trees as noticed by the better representation of majority of species in
the seedling phase. However, in the moist deciduous forest, the recruitment of stems
from lower girth class to higher girth classes was significantly low. This could be
attributed to the anthropogenic disturbance continuously faced by this forest patch.
Among four plots, shola and wet evergreen forest plots are species rich and
comparable to many tropical wet evergreen forests. Lowest species diversity values
recorded for dry deciduous forest is an indication of the dominance of one or two
species in the tree community. Even the number of species endemic to the Western
Ghat region is more in the shola (14 species; see Appendix 1) and in the wet
evergreen forest (13 species; see Appendix 2) plots. Almost all species in the moist
70
deciduous forest and dry deciduous forest plots are widely distributed in the Indian sub-
continent.
As discussed earlier, the permanent plots established in shola and wet evergreen
forests are undisturbed patches. These plots can be used as benchmark plots for
studies on the impact of natural and man-made disturbances on species and
community composition and various ecological functions. These plots also could be
monitored for further inventory of biodiversity covering various groups of plants and
animals. Since the location of trees in the permanent plots is marked, further studies
on these trees could be oriented to cover their phenological, autecological and
dynamic properties.
As moist deciduous forests in the Western Ghats are subjected to intensive
human-induced changes than any other forest types, the plot established at
Channakkad is typical of moist deciduous forest of the region. Long-term monitoring of
the plot would provide an opportunity for understanding the succession pattern in this
forest type. Information on species composition change and ecosystem recovery
process during succession recorded from this plot could be used in attempts of
rehabilitation of moist deciduous forests of the region. One characteristic feature
recorded in the plot established in the dry deciduous forest patch was that the absence
of or poor regeneration of tree species. Therefore, the plot is suitable to monitor the
reasons for the lack of tree species regeneration and to identify strategies to trigger the
regeneration processes.
71
6.0. REFERENCES
Balasubramanyan. K. (1987). Impact of Selection Felling in a Forest Ecosystem in
Kerala. KFRl Research Report No. S3. Kerala Forest Research Institute, Peechi,
Kerala.
Chandrasekaran, C. (1960). Forest Types of Kerala State. Special paper submitted
for diploma in Forestry. New Forest, Dehra Dun, India.
Chandrashekara, U.M. (1998). Ramakrishnan Index of Stand Quality (RISQ): An
indicator for the level of Forest Disturbance. In: Proceedings of the Tenth Kerala
Science Congress (ed. A.D. Damodaran), State Committee on Science,
Technology and Environment, Trivandrum: 398-400.
Chandrashekara, U.M. and Ramakrishnan, PS (1 994). Vegetation and gap
dynamics of a tropical wet evergreen forest in the western Ghats of Kerala, India.
Journal of Tropical Ecology, 10: 337-354.
Chandrashekara. U.M. and Sankar, S. (1 998). Tribals and conservation: Chinnar
Snactuary, India. In: Communities and Conservation: Natural Resource
Management in South and Central Asia, (eds. Ashish Kothari, Neema Pathak,
R.V. Anuradha and Bansuri Taneja), Sage Publications, New Delhi:467-480.
Collins, N.M., Sayer, J.A. and Whitmore, T.C. (1991). The Conservation Atlas of
Tropical Rainforests: Asia and the Pacific. Macmillan, London.
FAO/UNEP (1981). Tropical Forest Resources Assessment Project. Forest
Resources of Tropical Asia. Vol. 3, FAO, Rome.
Gamble, J.S. (1915-1935). Flora of Madras Presidency. 3 volumes. Adalard and Son
Ltd. London,
Ganesh, T., Ganesan. R., Soubadra Devy, M.. Davidar. P. and Bawa, K.S. (1996).
Assessment of plant biodiversity at a mid elevation evergreen forest of
Kalakkad-Mundanthurai Tiger Reserve, Western Ghats, India. Current Science,
71 :379-392.
73
Hubbell. S.P. and Faster, R. (1986). Commonness and rarity in a neotropical forest:
Implications for tropical tree conservation. In: (ed. M.Soule), Conservation
Biology, the Science of Scarcity and Diversity. Sinauer Associates,
Sunderland, Massachusetts: 205-234.
Kallarackal, J. and Somen. C.K. (1997). Weather data of Peechi-1996. Evergreen,
38: 6-7.
Knight, D.H. (1975). A phytosociological analysis of species rich tropical forest on Barro
Colorado Island, Panama. Ecological Monograph, 45:259-284.
Margalef, R. (1968). Perspective in Ecological Theory. University of Chicago Press,
Chicago.
Misra, R. (1968). Ecology Work Book. Oxford and IBH Publications, New Delhi
Myers, N. (1988). Tropical forests and their species: Going, going ... ? In: (ed. E.O.
Wilson) Biodiversity. National Academy Press, Washington, DC: 28-35.
Pascal, J. P. (1988). Wet Evergreen Forests of the Western Ghats of India:
ecology, structure, floristic composition and succession. French Institute
of Pondicherry, Pondicherty, India.
Rai, S.N. (1979). Gap Regeneration in Wet Evergreen Forest of Karnataka.
Karnataka Forest Department Research Paper, KFD-2.
Rai. S.N. and Proctor. J. (1986). Ecological studies on four rainforests in Karnataka,
India. 1. Environment, structure, floristics and biomass. Journal of Ecology,
74:439-454.
Simpson, E.H. (1949). Measurement of diversity. Nature (London), 163:688
74
Singh, J.S., Singh, S.P., Saxena, A.K. and Rawat, Y.S.(1981). The Silent Valley
forest ecosystem and possible impact of proposed hydroelectric
project. Reports on the Silent Valley Study. Ecology Research Circle, Kumaun
University, Nainital.
Swarny, H.R. (1988). Study of Organic Productivity, Nutrient cycling and Small
Watershed Hydrology in Natural Forests and in Monoculture Plantations in
Chikmagalore District, Kamataka. Final Report submitted to Department of
Environment and Forests, Govt. Of India. (Mimeo).
Swaine, M.D. and Hall, JAB. (1988). The mosaic theory of forest regeneration and
the determination of forest composition in Ghana. Journal of Tropical Ecology,
4: 253-269.
75
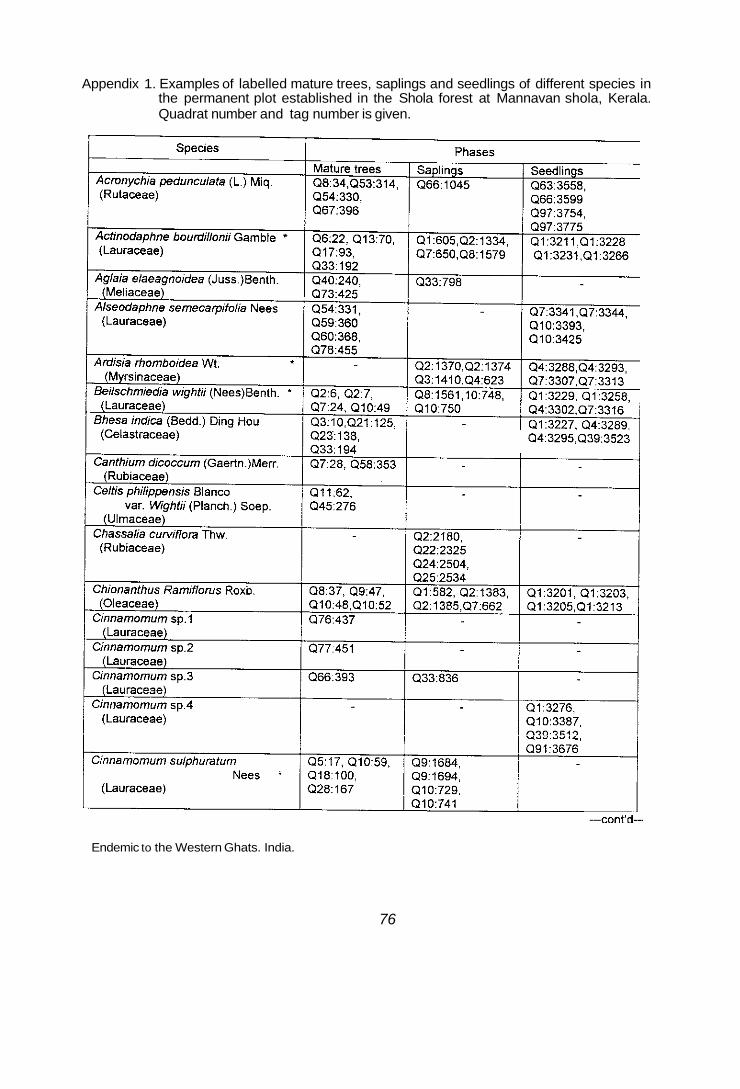
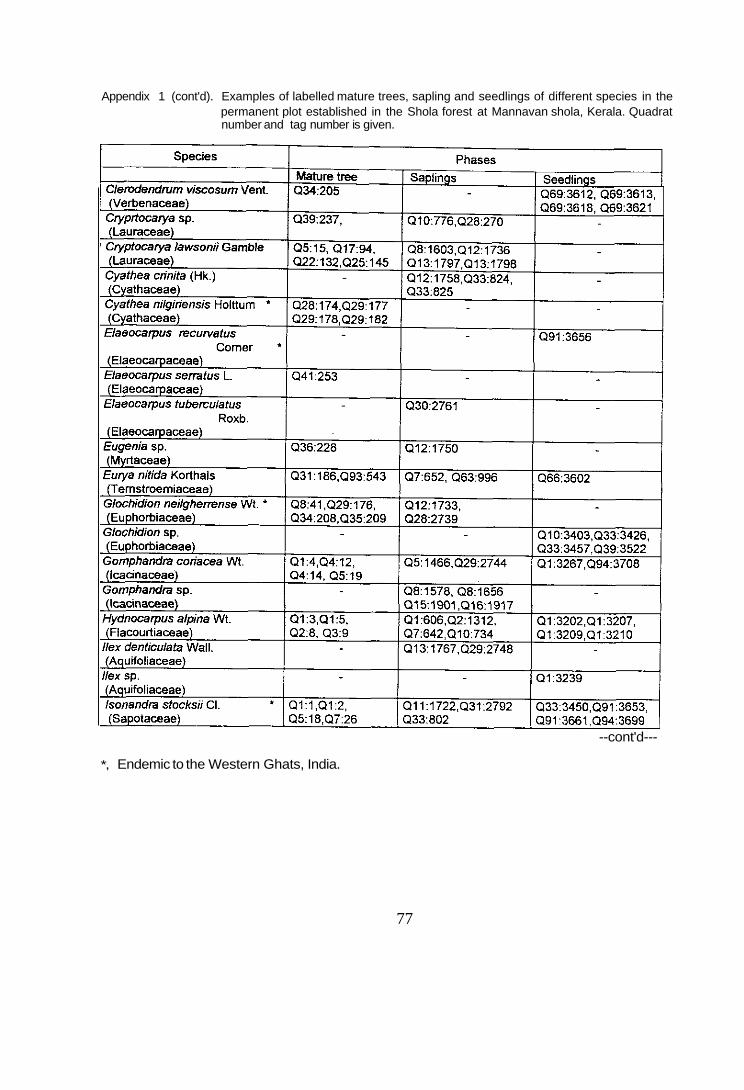
Appendix 1. Examples of labelled mature trees, saplings and seedlings of different species in the permanent plot established in the Shola forest at Mannavan shola, Kerala. Quadrat number and tag number is given.
Q4:3295,Q39:3523
*, Endemic to the Western Ghats. India.
76
Appendix 1 (cont'd). Examples of labelled mature trees, sapling and seedlings of different species in the permanent plot established in the Shola forest at Mannavan shola, Kerala. Quadrat number and tag number is given.
--cont'd---
*, Endemic to the Western Ghats, India.
77
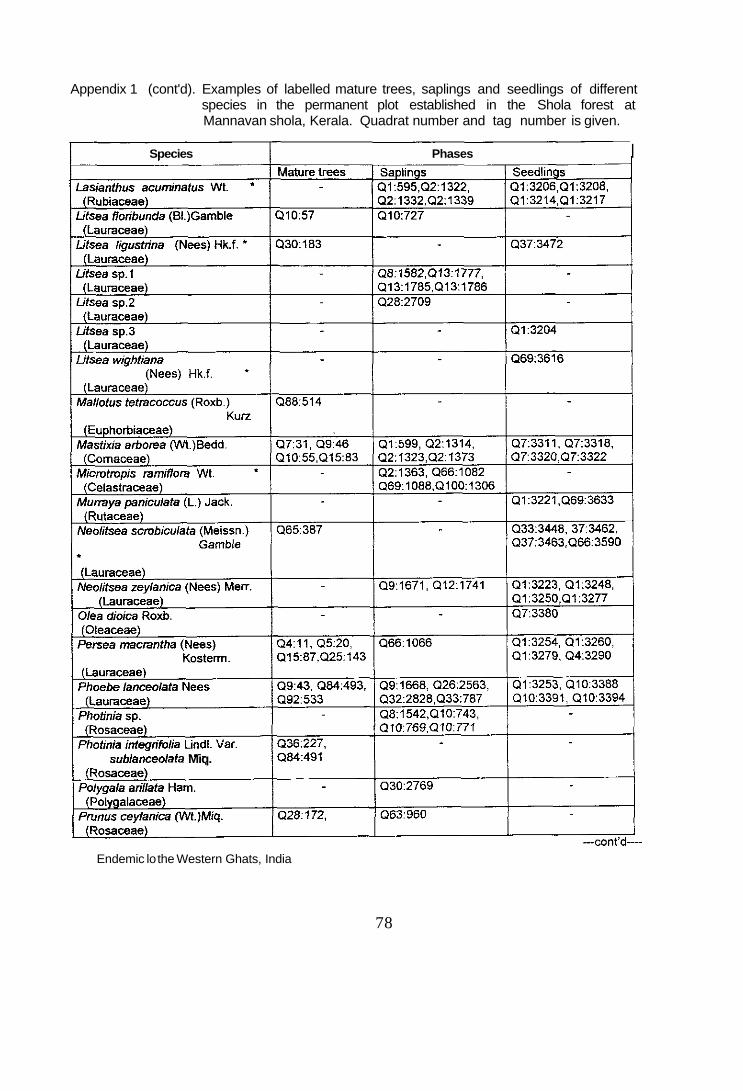
Appendix 1 (cont'd). Examples of labelled mature trees, saplings and seedlings of different species in the permanent plot established in the Shola forest at Mannavan shola, Kerala. Quadrat number and tag number is given.
Species Phases I
Q37:3463,Q66:3590
sublanceolata Miq.
* Endemic lo the Western Ghats, India
78
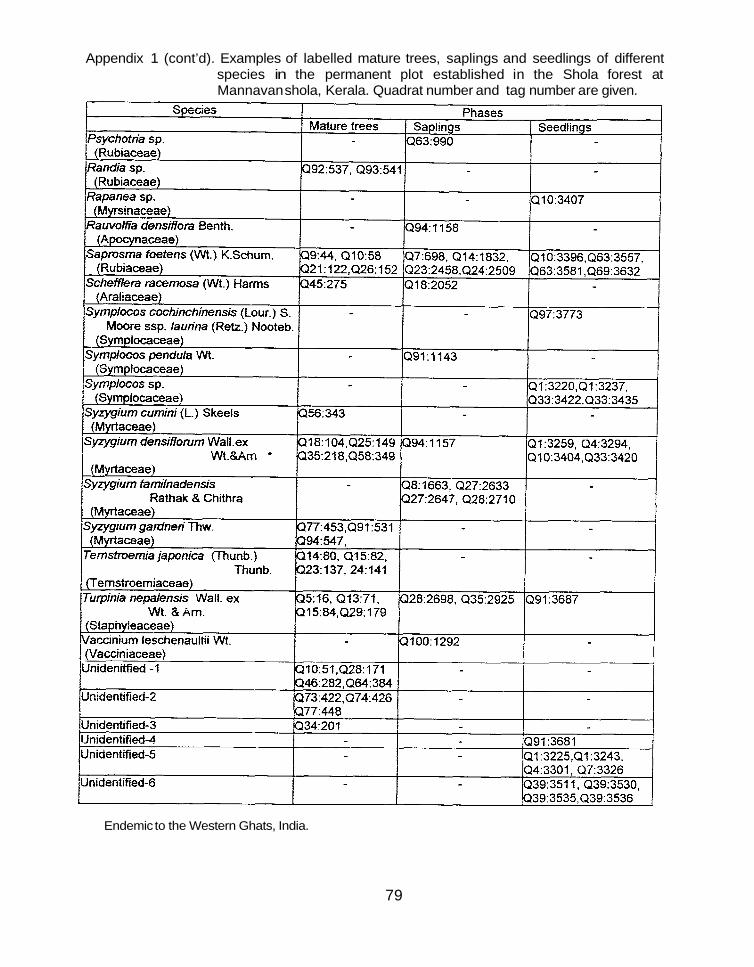
Appendix 1 (cont’d). Examples of labelled mature trees, saplings and seedlings of different species in the permanent plot established in the Shola forest at Mannavan shola, Kerala. Quadrat number and tag number are given.
*, Endemic to the Western Ghats, India.
79
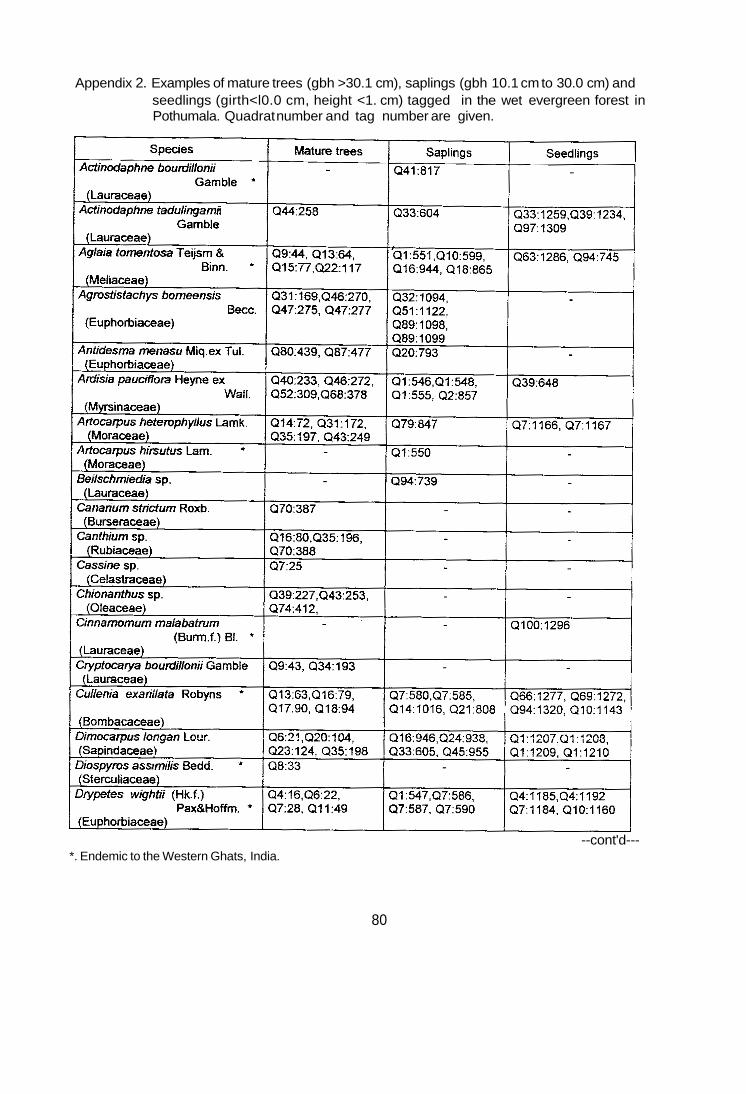
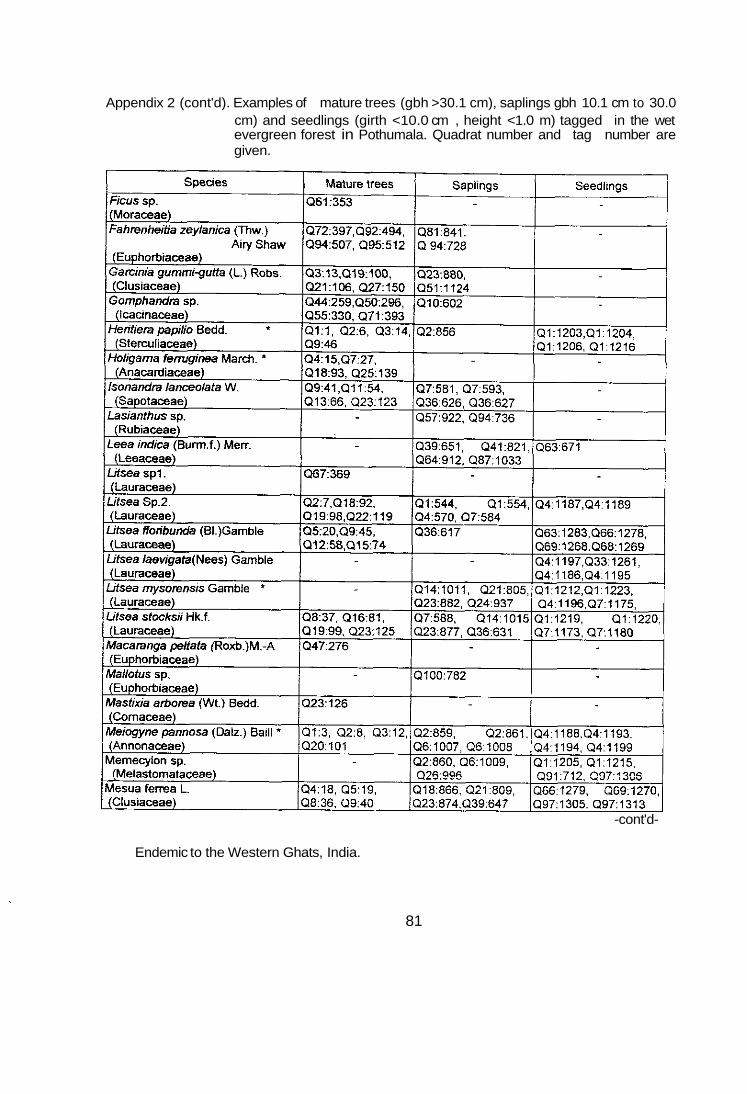
Appendix 2. Examples of mature trees (gbh >30.1 cm), saplings (gbh 10.1 cm to 30.0 cm) and seedlings (girth<l0.0 cm, height <1. cm) tagged in the wet evergreen forest in Pothumala. Quadrat number and tag number are given.
--cont'd--- *. Endemic to the Western Ghats, India.
80
Appendix 2 (cont'd). Examples of mature trees (gbh >30.1 cm), saplings gbh 10.1 cm to 30.0 cm) and seedlings (girth <10.0 cm , height <1.0 m) tagged in the wet evergreen forest in Pothumala. Quadrat number and tag number are given.
-cont'd-
*, Endemic to the Western Ghats, India.
81
Appendix 2 (cont'd). Examples of mature trees (gbh >30.1 cm), saplings(gbh 10.1 cm to 30.0 cm) and seedlings (girth <10.0 cm, height <1.0 m) tagged in the wet evergreen forest in Pothurnala. Quadrat number and tag number are given
Mature trees Q11:52. Q21:108. Q36:207, Q41:238
Q76:426
-
Q1:2, Q2:4, Q2:5,Q2:9
Q74:415
Q7:31, Q81:440
Species Myristica dactyloides Gaertn. (Myristicaceae)
Saplings Seedlings
Q23:881, Q39: 1235,.Q63: 1287 Q 41:819 , Q97:1301 (Q41:320, (Q64 :915
Q36:628
Q10: 1 154,Q33: 1254
Q4:565, Q4:567, Q10:1144 Q4:572, Q16:943
Q35:984,Q64:910 Q97:1310
Q85:966, Q94:727
Nothopegia beddomei Gamble
Neolitsea sp. (Anacardiaceae)
Q23:873. Q24:939.
(Lauraceae) Palaquium ellipticum (Dalz.)
Engl.
Q33:1260. Q39:654, Q91:1331 .Q97:1304
(Sapotaceae)
Phoebe lanceolata Nees
Q45260, Q45:262 Q2:11, Q7:24, Q8:35, Q9:39
(Lauraceae) Polyalthia coffeoides Hk.f. &
Thorns. (Annonaceae)
Psychotria sp. (Rubiaceae)
Q1:549. Q2:855, Q33:1256, Q4:560. Q6:1002 Q33:1263.
Syzygium laetum (Ham.)Gandhi * (Myrtaceae)
Villebrunea integrifolia Gaud.
Unidentified -P5
Q43:897, Q45: 953
Q36:206, Q40:234.
I Q39:1227. Q39:1228 Q93:1057
095:508 369:379 Q89:1108
Q39:1249. Q69:1266, Q66:689, Q97:1302
Q41:814,Q54:102 Q10:1147 6,Q454: 1027,Q73: 1059
*, Endemic to the Western Ghats, India.
82
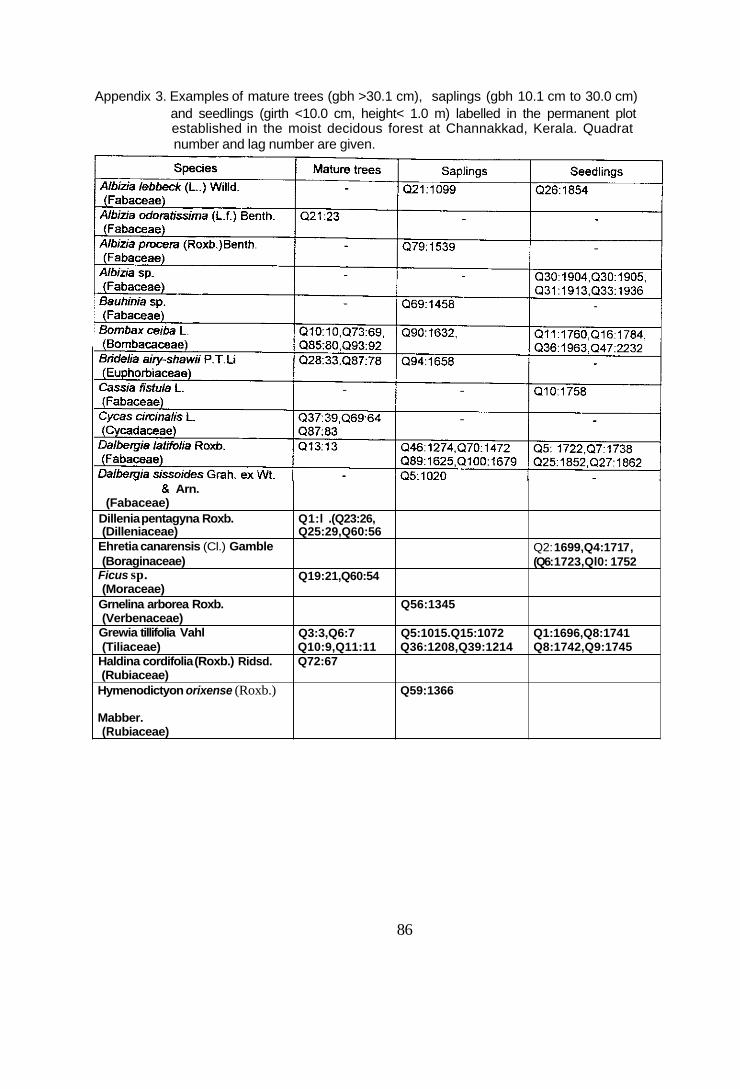
&Arn. (Fabaceae)
Dillenia pentagyna Roxb. (Dilleniaceae)
Ehretia canarensis (Cl.) Gamble (Boraginaceae)
Ficus sp. (Moraceae)
Grnelina arborea Roxb. (Verbenaceae) Grewia tillifolia Vahl (Tiliaceae)
Haldina cordifolia (Roxb.) Ridsd. (Rubiaceae)
Hymenodictyon orixense (Roxb.)
Mabber. (Ru biaceae)
Q1:l .(Q23:26, Q25:29,Q60:56
Q2: 1699,Q4: 171 7, (Q6: 1723,Ql0: 1752
Q19:21 ,Q60:54
Q56:1345
Q3:3,Q6:7 Q5:1015.Q15:1072 Q1:1696,Q8:1741 Q10:9,Q11:11 Q36:1208,Q39:1214 Q8:1742,Q9:1745 Q72:67
Q59: 1366
Appendix 3. Examples of mature trees (gbh >30.1 cm), saplings (gbh 10.1 cm to 30.0 cm) and seedlings (girth <10.0 cm, height< 1.0 m) labelled in the permanent plot established in the moist decidous forest at Channakkad, Kerala. Quadrat number and lag number are given.
86
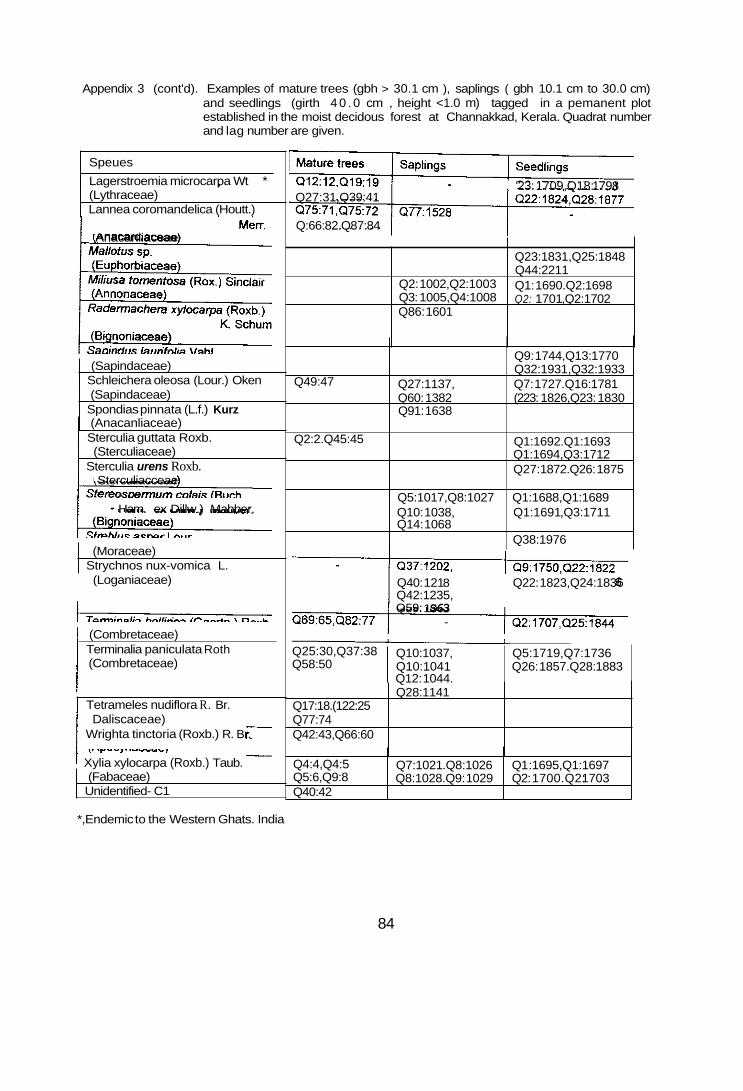
Appendix 3 (cont'd). Examples of mature trees (gbh > 30.1 cm ), saplings ( gbh 10.1 cm to 30.0 cm) and seedlings (girth 4 0 . 0 cm , height <1.0 m) tagged in a pemanent plot established in the moist decidous forest at Channakkad, Kerala. Quadrat number and lag number are given.
Q2: 1002,Q2: 1003 Q3: 1005,Q4:1008 Q86: 1601
Speues Lagerstroemia microcarpa Wt *
Q23:1831 ,Q25:1848 Q44:2211 Q1: 1690.Q2: 1698 Q2: 1701 ,Q2:1702
. (Lythraceae) Lannea coromandelica (Houtt.)
Q49:47
Q2:2.Q45:45
Anacanliaceae
Q9: 1744,Q13: 1770 Q32:1931 ,Q32:1933
Q27:1137, Q7: 1727.Q16: 1781 Q60: 1382 (223: 1826,Q23: 1830 Q91: 1638
Q1:1692.Q1:1693 Q1:1694,Q3:1712 Q27: 1872.Q26: 1875
Q5:1017,Q8:1027 Q1:1688,Q1:1689 Q10: 1038, Q1:1691 ,Q3:1711 Q14: 1068
Q38:1976
(Sapindaceae) Schleichera oleosa (Lour.) Oken
Q25:30,Q37:38 Q58:50
(Sapindaceae) Spondias pinnata (L.f.) Kurz
Q10:1037, Q5:1719,Q7:1736 Q10:1041 Q26: 1857.Q28: 1883 Q12: 1044.
(Anacanliaceae) Sterculia guttata Roxb.
Q4:4,Q4:5 Q5:6,Q9:8 Q40:42
(Sterculiaceae) Sterculia urens Roxb.
Q7:1021 .Q8:1026 Q1 :1695,Q1:1697 Q8:1028.Q9: 1029 Q2: 1700.Q2: 1703
Sterculiacceae
- Ham. ex Dillw.) Mabber.
(Moraceae) Strychnos nux-vomica L. (Loganiaceae) 1 (Combretaceae)
Terminalia paniculata Roth (Combretaceae)
Tetrameles nudiflora R. Br. Daliscaceae)
Wrighta tinctoria (Roxb.) R. Br.
Xylia xylocarpa (Roxb.) Taub. (Fabaceae) Unidentified- C1
'23: 1709,Q18: 1798 Q27:31 ,Q39:41
Q:66:82.Q87:84
Q40: 121 8 Q22: 1823,Q24:1836 Q42:1235, Q59: 1 S63
Q28:1141 Q17:18.(122:25 Q77:74 Q42:43,Q66:60
*,Endemic to the Western Ghats. India
84
Appendix 4. Examples of mature trees (gbh >30.1 cm), saplings (gbh 10.1 cm to 30.0 cm) and seedlings (girth <10.0 cm, height< 1.0 m) labelled in the permanent plot established in a dry deciduous forest at Chinnar Wildlife Sanctuary, Kerala.
Q42:136. Q86:301
*, Endemic to the Western Ghats, India
85
Appendix 4 (cont'd). Examples of mature trees (gbh >30.1 cm), saplings (gbh 10.1 cm to 30.0 cm) and seedlings (girth <10.0 cm, height< 1.0 m) labelled in the permanent plot established in a dry deciduous forest at Chinnar Wildlife Sanctuary: Kerala.
86