Embed Size (px)
Citation preview
Journal of Network and Computer Applications 36 (2013) 870–880
Contents lists available at SciVerse ScienceDirect
Journal of Network and Computer Applications
1084-80
http://d
n Corr
E-m
jon.crow
ramon.m
journal homepage: www.elsevier.com/locate/jnca
Evaluating opportunistic networks in disaster scenarios
Abraham Martın-Campillo a,n, Jon Crowcroft b, Eiko Yoneki b, Ramon Martı a
a Department of Information and Communications Engineering, Universitat Aut�onoma de Barcelona, Bellaterra, Spainb Computer Laboratory, University of Cambridge, Cambridge, UK
a r t i c l e i n f o
Article history:
Received 16 April 2012
Received in revised form
31 October 2012
Accepted 9 November 2012Available online 27 November 2012
Keywords:
Opportunistic networks
Opportunistic forwarding
Performance evaluation
Emergency scenarios
45/$ - see front matter & 2012 Elsevier Ltd. A
x.doi.org/10.1016/j.jnca.2012.11.001
esponding author.
ail addresses: [email protected] (A. M
[email protected] (J. Crowcroft), eiko.yonek
[email protected] (R. Martı).
a b s t r a c t
Forwarding data in scenarios where devices have sporadic connectivity is a challenge. An example
scenario is a disaster area, where forwarding information generated in the incident location, like
victims’ medical data, to a coordination point is critical for quick, accurate and coordinated interven-
tion. New applications are being developed based on mobile devices and wireless opportunistic
networks as a solution to destroyed or overused communication networks. But the performance of
opportunistic routing methods applied to emergency scenarios is unknown today. In this paper, we
compare and contrast the efficiency of the most significant opportunistic routing protocols through
simulations in realistic disaster scenarios in order to show how the different characteristics of an
emergency scenario impact in the behaviour of each one of them.
& 2012 Elsevier Ltd. All rights reserved.
1. Introduction
Recovery from an emergency situation is always a complextask, particularly in mass casualty disasters. In these scenarios, aquick and coordinated response must be given to improve theefficiency of rescue teams and save as many lives as possible.Furthermore, the emergency situation may be ongoing for sometime, hence systems may have to stay usable for extendedperiods.
The need for these systems is real and the last mass casualtyincidents in the recent years have made new applications (Masscasualties, 2009; Geo-pictures, 2010; Hikaru et al., 2011-02-28;Martın-Campillo et al., 2010; Google crisis response; Aschenbrucket al., 2004), designed to satisfy these needs, to appear. Theseapplications ease the work of first responders providing a fastertriage of the victims (medical status acquisition), better coordina-tion, and better communication in situations without networkinfrastructure.
From the communication point of view, in many cases, exist-ing network infrastructure is destroyed by the very nature of thedisaster, or it is overloaded or saturated due to a heavy use. Thisresults in the lack of a network through which transmit and shareinformation generated within the emergency. An usual work-around for the problem is the use of Mobile Ad hoc Networks(MANET). This is the case of IMPROVISA (Improvisa) that proposesto solve this difficulty by distributing antennas in the disaster
ll rights reserved.
artın-Campillo),
[email protected] (E. Yoneki),
area. Although possible, this may not be feasible in large-scaleemergencies. Other authors Martın-Campillo et al. (2010) suggestthe use of a wireless opportunistic network (Conti and Kumar,2010) based on mobile devices carried by emergency personnel toforward the data created and collected in the disaster area to acoordination point.
The use of opportunistic networks is very appropriate foremergency scenarios as they are infrastructure-less; nodes canstore, carry and forward messages; and the routes from the senderand the destination are build dynamically. This makes opportunisticnetworks tolerant to delays and disruptions, and nodes can com-municate each other even if there is not any route connecting them.This is very important because in emergency situations the mostimportant objective is to ensure that the messages and datagenerated in the disaster area reach their destination without anyloss as they contain valuable information for the global coordinationof the emergency response, as well as information about victims.
However, forwarding data in opportunistic scenarios is chal-lenging (Ye et al., 2009; Pelusi et al., 2006). The number ofvictims, the quantity of data generated, or the number of nodes,are characteristics that could notably impact on the performanceof routing protocols. Because of this, deciding which forwardingmethod to use in these scenarios is difficult (Wittie et al., 2009).
The purpose of this research is to characterise the performanceof a set of routing algorithms in realistic disaster scenarios withdifferent characteristics in order to uncover their performanceand therefore their suitability to different scenarios. We havedone this performance analysis carrying out several simulationsusing the mobility model proposed by Aschenbruck et al. (2009),and implemented in U. of Bonn (2009). We have also used theONE simulator (Keranen et al., 2009), a simulation tool specific for
A. Martın-Campillo et al. / Journal of Network and Computer Applications 36 (2013) 870–880 871
opportunistic networks, to simulate the forwarding process basedon the traces generated.
This paper is structured as follows: first, the existing relatedwork in disasters areas focused on mobile devices systems,forwarding mechanisms and node mobility is presented. Subse-quently, the emergency scenario is depicted, followed by a descrip-tion of the tests performed. Next, the results of the simulations areshown, analysed, and discussed. We close the paper with ourconclusions.
2. Related work
In order to convey the nature of the problem of communica-tions in disaster scenarios, in this section we present relatedwork. We include: applications in emergency scenarios using itsown developed network, forwarding protocols in mobile oppor-tunistic networking, and node mobility in disaster areas.
2.1. Applications in emergency scenarios using its own developed
network
Mobile devices (PDAs, smartphones, customised, etc.) arefrequently used in disaster areas by rescue personnel for differentpurposes, including victims triage and tracking. The usual pro-blem in emergency situations is the lack of network infrastruc-tures in which rely the communications on. Following are somesolutions that propose the use of ad hoc networks, MANETs,satellite, mesh networks, DTNs or opportunistic networks.
ARTEMIS (McGrath et al., 2003) system provides automatedremote triage and emergency management information throughthe use of sensors. Triage information is transmitted using agentsthat move through a reliable messaging layer in wireless ad hocnetworks.
The Mobile Agent Electronic Triage Tag System (Martı et al.,2009) creates mobile agents that store and carry triage informa-tion about victims. Mobile agents are able to move through aMANET created by mobile devices without the need of an end-to-end connection from the origin to the destination. Time To Return(TTR) is used for the mobile agent migration decision.
CodeBlue (Lorincz et al., 2004) is a system that uses sensors totriage and track victims and monitor their vital signs. Thetransmission of data is done using wireless sensor networkscreated by the sensors deployed.
TacMedCS, Tactical Medical Coordination System (Williams,2007), is a military system to capture and display real-timecasualty data in the field. In this case, a handheld unit storesthe casualty data and the GPS position and uses satellite (Iridium)communication to send it. IEEE 802.11 mesh communications canalso be established between the different handheld units for theircollaboration.
Haggle Electronic Triage Tag (Haggle-ETT) (Martın-Campilloet al., 2010) is a system that uses Haggle (Nordstrom et al., 2009)and mobile devices to create electronic triage tags (ETTs) andtransmit them using wireless opportunistic communications,without requiring a direct connection with the receiver, orreceivers.
2.2. Forwarding in mobile opportunistic networking
Traditional network paradigms assume an existing end-to-endconnection between the sender and the receiver. These networksdo not accept excessive delays or disruptions, hence whenthis happens the delivery fails. But for some scenarios suchas deep space communications, where nodes are not alwaysin communication range, a type of network that supports
intermittent communications is needed. Delay and disruptionTolerant Networking (DTN) (Farrell et al., 2006) is designed tosupport the disruption of connectivity and/or long delivery delaysand has become popular in environments such as disasters areasor developing countries.
DTNs use the store and forward approach, as well as the store,carry, and forward approach if nodes have the ability to move.Nodes carry messages stored in their memory while movingaround and forward them when they find an opportunity. Onetype of DTNs is opportunistic networking, where contacts areheterogeneous and unpredictable, hence nodes do not knowwhen they will contact with another node or which node it willbe. Routes from the sender to the destination of a message arebuilt dynamically and any possible node can opportunistically beused as next hop if it is more likely to bring the message closer, orfaster, to the final destination. For all these reasons forwardingdata in opportunistic networks is challenging. The differentforwarding mechanisms base these decisions on different typeof information and different strategies. The features of the mostsignificant forwarding algorithms are explained below.
2.2.1. Epidemic forwarding
Epidemic (Vahdat and Becker, 2000) is a well-known forward-ing strategy. It is based on the very simple idea of replicating allthe messages stored in a node to all the nodes that come intocontact with it during its journey. This results in a higherprobability of delivering the message as more nodes have a copyof each message but it can also produce network congestion. Oneof the variations for Epidemic forwarding is Epidemic with ACK.This modification eliminates all the copies of a message in thenetwork when the ACK for this message (generated when it isdelivered to its destination) is received. Nevertheless, the ACKsgenerated also produce additional traffic.
2.2.2. PRoPHET forwarding
PRoPHET forwarding (Probabilistic Routing Protocol usingHistory of Encounters and Transitivity; Lindgren et al., 2004) usesan algorithm based on encounters to indicate how likely is eachnode to deliver a message to a destination in order to makeforwarding decisions. The probabilities stored in a node areexchanged when they meet other nodes. Then, each node updatesits values by increasing the probability for the nodes that havebeen found and by decreasing the probability for the rest. Basedon these values, it is calculated which node is more likely todeliver the message. Finally, messages are only forwarded toanother node if this one has higher delivery probability.
2.2.3. MaxProp forwarding
MaxProp forwarding (Burgess et al., 2006) is based, likePRoPHET, on the use of information about probability of futurecontacts with nodes when deciding if a message has to beforwarded. Unlike PRoPHET, MaxProp uses a priority queue thatis used to discard messages that have little chance of beingdelivered to its destination and to keep those which are morelikely. MaxProp uses a directed graph with weights based onencounters, with a variation of Dijkstra’s algorithm to calculatethe lowest path cost and, therefore, the delivery probability ofeach node. Furthermore, MaxProp has several other mechanismsand policies to increase delivery ratio: message prioritisation,hashed ACK, etc. One of these policies is to prioritise theforwarding of messages with lower hop count (even with lowdelivery likelihood), thus reducing their isolation, expanding theirdissemination, and therefore increasing their chance of reachingthe destination.
A. Martın-Campillo et al. / Journal of Network and Computer Applications 36 (2013) 870–880872
2.2.4. Delegation forwarding
In Delegation forwarding (Erramilli et al., 2008), each node hasan associated value which is created using a metric that repre-sents the quality of the node as relay. The metric used depends onthe scenario where it will be used. Erramilli et al. (2008) proposea generalisation of forwarding methods such as BUBBLE Rap (Huiet al., 2008).
Time To Return (TTR) forwarding: In Martı et al. (2009), arouting protocol designed for disaster scenarios is proposed: TimeTo Return (TTR). Medical personnel in an emergency scenario arecoordinated by a leader, who tells personnel where to go, or inwhich area to work (Martı et al., 2009), and assigns a maximumtime to return to the base for security reasons. Each node has itsown time to return (TTR) and therefore the forwarding protocoltakes advantage of the existence of this value to use it to makeforwarding decisions. If a node contacts another node with alower TTR, it relays all its messages to this node and, if themessages have been successfully received, the sender deletes allmessages relayed in order to have only one copy of themthroughout the network. Hence, TTR is a single message copyforwarding mechanism.
Traditional routing algorithms usually only maintain one copyof the message in the network. When a router forwards a messageto another router, it does not keep a copy of the message. Inopportunistic networks it is the opposite, forwarding methodsusually keep a copy of the message to increase the chances ofdelivering the message or deliver it faster. Nevertheless, there aresome exceptions in opportunistic routing like Time To Return(TTR) forwarding.
2.3. Node mobility in disaster areas
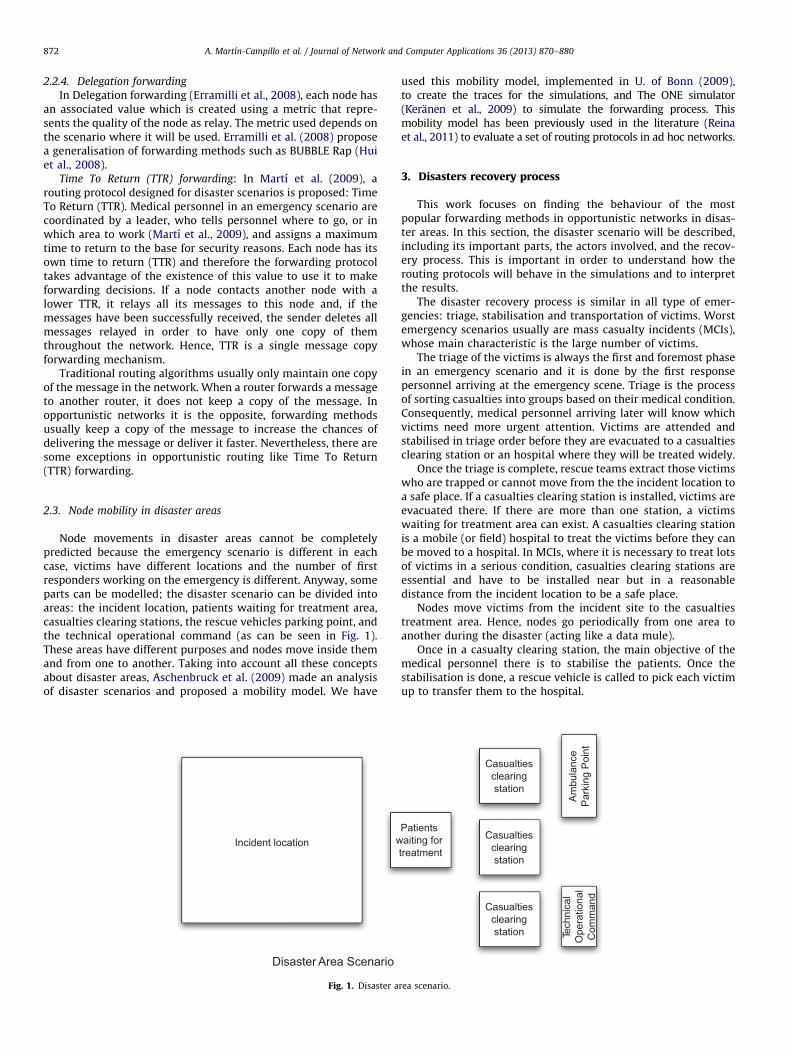
Node movements in disaster areas cannot be completelypredicted because the emergency scenario is different in eachcase, victims have different locations and the number of firstresponders working on the emergency is different. Anyway, someparts can be modelled; the disaster scenario can be divided intoareas: the incident location, patients waiting for treatment area,casualties clearing stations, the rescue vehicles parking point, andthe technical operational command (as can be seen in Fig. 1).These areas have different purposes and nodes move inside themand from one to another. Taking into account all these conceptsabout disaster areas, Aschenbruck et al. (2009) made an analysisof disaster scenarios and proposed a mobility model. We have
Incident location w
Disaster Area Scenario
Fig. 1. Disaster a
used this mobility model, implemented in U. of Bonn (2009),to create the traces for the simulations, and The ONE simulator(Keranen et al., 2009) to simulate the forwarding process. Thismobility model has been previously used in the literature (Reinaet al., 2011) to evaluate a set of routing protocols in ad hoc networks.
3. Disasters recovery process
This work focuses on finding the behaviour of the mostpopular forwarding methods in opportunistic networks in disas-ter areas. In this section, the disaster scenario will be described,including its important parts, the actors involved, and the recov-ery process. This is important in order to understand how therouting protocols will behave in the simulations and to interpretthe results.
The disaster recovery process is similar in all type of emer-gencies: triage, stabilisation and transportation of victims. Worstemergency scenarios usually are mass casualty incidents (MCIs),whose main characteristic is the large number of victims.
The triage of the victims is always the first and foremost phasein an emergency scenario and it is done by the first responsepersonnel arriving at the emergency scene. Triage is the processof sorting casualties into groups based on their medical condition.Consequently, medical personnel arriving later will know whichvictims need more urgent attention. Victims are attended andstabilised in triage order before they are evacuated to a casualtiesclearing station or an hospital where they will be treated widely.
Once the triage is complete, rescue teams extract those victimswho are trapped or cannot move from the the incident location toa safe place. If a casualties clearing station is installed, victims areevacuated there. If there are more than one station, a victimswaiting for treatment area can exist. A casualties clearing stationis a mobile (or field) hospital to treat the victims before they canbe moved to a hospital. In MCIs, where it is necessary to treat lotsof victims in a serious condition, casualties clearing stations areessential and have to be installed near but in a reasonabledistance from the incident location to be a safe place.
Nodes move victims from the incident site to the casualtiestreatment area. Hence, nodes go periodically from one area toanother during the disaster (acting like a data mule).
Once in a casualty clearing station, the main objective of themedical personnel there is to stabilise the patients. Once thestabilisation is done, a rescue vehicle is called to pick each victimup to transfer them to the hospital.
Patients aiting for
treatment
Casualties clearing station
Casualties clearing station
Casualties clearing station
Am
bula
nce
Par
king
Poi
nt
Tech
nica
l O
pera
tiona
l C
omm
and
rea scenario.
A. Martın-Campillo et al. / Journal of Network and Computer Applications 36 (2013) 870–880 873
The technical operational command is where the coordinationteam is, and where all the decisions about actions to be carriedout by rescue and medical teams are taken.
3.1. Communications in the emergency scenario
Traditionally emergency communications were focused onvoice, but advanced communication mechanisms are beingadopted. The low price of Internet enabled mobile devices usingWi-Fi or mobile phone networks have eased this process. But inmost disasters, like hurricanes, terrorist attacks, earthquakes, etc.,these networks become unstable, inaccessible, overused or evendestroyed, and as a consequence, emergency personnel cannotrely on the use of these existing network infrastructures and maydeploy and use their own or look for other solutions.
Some of these solutions may have shortcomings. For example,if the emergency area is large, it is possible that some solutions asMANETs could not work because the impossibility of creating afully connected network. Thus, an attempt to communicate fromone point of the network to another may be unsuccessful as anend-to-end communication path is needed. Another example isthe deployment of repeaters to supply an infrastructure, but thissolution may require a long time to deploy.
Data generated within an emergency scenario are alwaysconsidered critical and cannot be lost. Furthermore, disruptionscan occur because of the emergency itself, therefore disruptiontolerant networks may need to be considered. In these cases, theuse of opportunistic networks (delay and disruption tolerant)may be considered as a solution. But different forwardingmechanisms can be used on top of them, and therefore, producedifferent results. In the next sections of this paper we analyse thebehaviour of the most relevant routing solutions for its use inemergency scenarios.
Having Internet connection is very important for coordinationor information purposes (e.g. with another technical operationalcommand, hospitals, government, etc.). For this reason, it isassumed that some parts of the emergency, for instance casualtiesclearing stations or the technical operational command, havepersistent Internet connectivity even if the network infrastructureis destroyed or unusable, e.g. using satellite connections.
4. Evaluation
Disaster scenarios are unpredictable, its area or the number ofvictims are data that cannot be precisely predicted. Furthermore,emergencies are heterogeneous because each disaster producedhas different numbers of victims (that can be closely related tothe number of messages created), different numbers of peopleworking on the emergency, etc. As the characteristics of a disasterscenario considerably change from one to another, it is veryimportant to carry out simulations that test the performanceimpact of these disaster scenarios characteristics in each forward-ing protocol.
We have selected four of the most relevant opportunisticrouting protocols for emergency scenarios: Epidemic, MaxProp,PRoPHET, and TTR. This evaluation, tests the selected protocolsthrough simulations in a set of emergency scenarios with differ-ent characteristics: different values of number of nodes, numberof messages, and message size, in order to evaluate their impacton the performance.
Results are expressed in charts as delivery ratio, overhead((number of messages relayed–messages delivered)/messagesdelivered), and energy cost per message (number of messagesrelayed/messages created) metrics. We have also included severaltables at the end of the paper with a summary of all the results
from the simulations (average hops, throughput, or deliverydelay).
4.1. Routing protocols
There are plenty of forwarding methods in the literature butwe cannot test all of them, hence we have chosen those that weconsider more relevant for opportunistic networks and, in thisspecial case, for emergency scenarios.
We have chosen three popular routing methods in the litera-ture for doing the simulations, Epidemic, PRoPHET and MaxProp,together with another forwarding method, TTR, that is special fordisaster situations. In the following lines is a brief explanation ofthe motivation why they have been selected:
�
Epidemic: This method has been chosen because of its messagespread. It is a reference for other routing methods. It is alsovery well known for flooding the network because of thereplication of each message to the rest of the nodes. � PRoPHET: It is a probabilistic routing method that aims toimprove Epidemic routing with higher delivery ratio due to theuse of probabilities. This protocol is well known in opportu-nistic networks and it is usually used, as Epidemic, incomparisons.
� MaxProp: It does an estimate delivery likelihood and addssome rules to the decision as to give forwarding preference tolow-hop-count messages, to free up storage of deliveredmessages or to not forward the same message twice to thesame next hope destination. This approach is very importantas it gives a congestion control mechanism to MaxProp, that isa interesting feature to test.
� TTR: This is a routing method specific for disaster areas, basedon the use of the ‘‘Time to Return’’ as a forwarding decision. Incontrast to the other protocols, TTR only keeps one copy of themessage throughout the network: when a message is relayed,it is deleted from the sender. This makes this protocol veryenergy saver but also penalises its delivery ratio.
In the last few years a lot of forwarding protocols based onsocial networks have arisen for opportunistic networks (SimBetDaly and Haahr, 2007; PeopleRank Mtibaa et al., 2010 or BUBBLERap Hui et al., 2011). However, these routing methods cannot beused in emergency scenarios because they use information that isnot available under disaster situations.
4.2. Simulation set-up
We use the Disaster Area mobility model proposed byAschenbruck et al. (2009) implemented in BonnMotion U. ofBonn (2009) to create the traces used for the simulation. Thismobility model defines five main areas in the emergency sce-nario: the incident location, the patients waiting for treatmentarea, the casualties clearing stations, the ambulance parkingpoint, and the technical operational command (Fig. 1).
For the simulation, two zones have been defined: one zone 0(incident location) and one zone 1. Zone 1 is where nodes fromzone 0 go, and can be a patients waiting for treatment area, or acasualties clearing station, or both. We have defined as a destina-tion point for the messages, a node in the entry point of the zone1 as we consider network connection inside this zone. We havenot taken into account other elements in the simulations, as theambulance parking point, because we consider the messagedelivered once it arrives to the zone 1. We also consider in zone1, a satellite, or another type of, network connection that com-municates the disaster area with the exterior, an essential
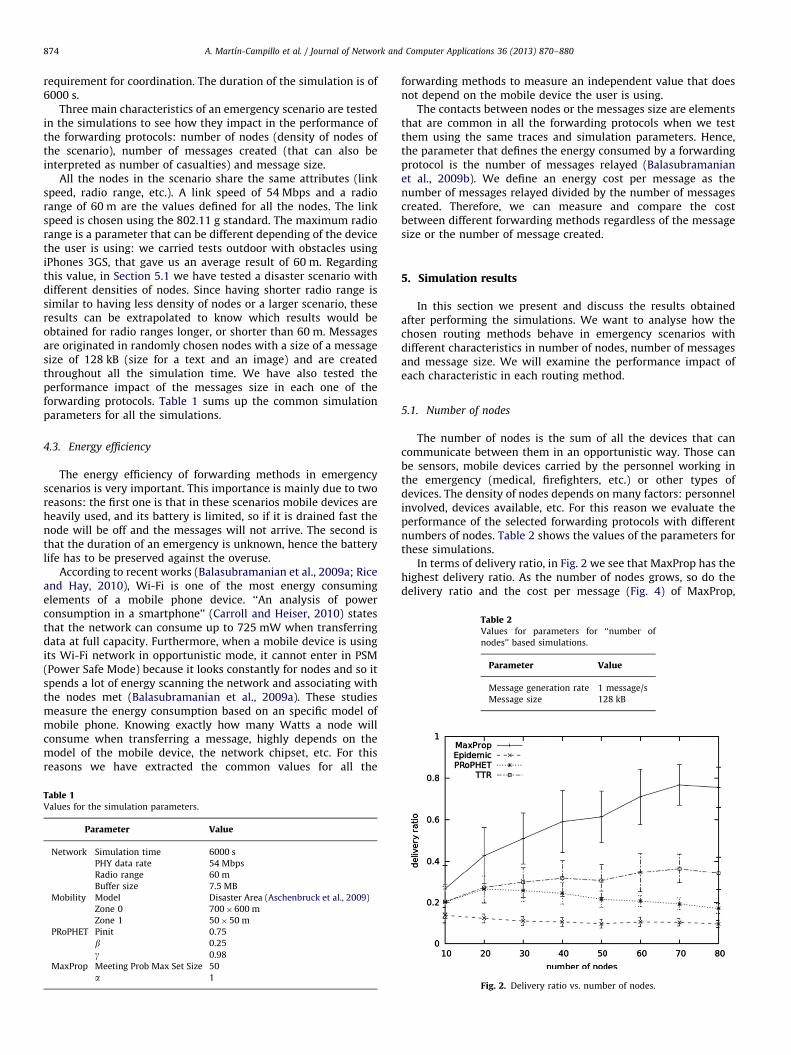
Table 2Values for parameters for ‘‘number of
nodes’’ based simulations.
Parameter Value
Message generation rate 1 message/s
Message size 128 kB
A. Martın-Campillo et al. / Journal of Network and Computer Applications 36 (2013) 870–880874
requirement for coordination. The duration of the simulation is of6000 s.
Three main characteristics of an emergency scenario are testedin the simulations to see how they impact in the performance ofthe forwarding protocols: number of nodes (density of nodes ofthe scenario), number of messages created (that can also beinterpreted as number of casualties) and message size.
All the nodes in the scenario share the same attributes (linkspeed, radio range, etc.). A link speed of 54 Mbps and a radiorange of 60 m are the values defined for all the nodes. The linkspeed is chosen using the 802.11 g standard. The maximum radiorange is a parameter that can be different depending of the devicethe user is using: we carried tests outdoor with obstacles usingiPhones 3GS, that gave us an average result of 60 m. Regardingthis value, in Section 5.1 we have tested a disaster scenario withdifferent densities of nodes. Since having shorter radio range issimilar to having less density of nodes or a larger scenario, theseresults can be extrapolated to know which results would beobtained for radio ranges longer, or shorter than 60 m. Messagesare originated in randomly chosen nodes with a size of a messagesize of 128 kB (size for a text and an image) and are createdthroughout all the simulation time. We have also tested theperformance impact of the messages size in each one of theforwarding protocols. Table 1 sums up the common simulationparameters for all the simulations.
4.3. Energy efficiency
The energy efficiency of forwarding methods in emergencyscenarios is very important. This importance is mainly due to tworeasons: the first one is that in these scenarios mobile devices areheavily used, and its battery is limited, so if it is drained fast thenode will be off and the messages will not arrive. The second isthat the duration of an emergency is unknown, hence the batterylife has to be preserved against the overuse.
According to recent works (Balasubramanian et al., 2009a; Riceand Hay, 2010), Wi-Fi is one of the most energy consumingelements of a mobile phone device. ‘‘An analysis of powerconsumption in a smartphone’’ (Carroll and Heiser, 2010) statesthat the network can consume up to 725 mW when transferringdata at full capacity. Furthermore, when a mobile device is usingits Wi-Fi network in opportunistic mode, it cannot enter in PSM(Power Safe Mode) because it looks constantly for nodes and so itspends a lot of energy scanning the network and associating withthe nodes met (Balasubramanian et al., 2009a). These studiesmeasure the energy consumption based on an specific model ofmobile phone. Knowing exactly how many Watts a node willconsume when transferring a message, highly depends on themodel of the mobile device, the network chipset, etc. For thisreasons we have extracted the common values for all the
Table 1Values for the simulation parameters.
Parameter Value
Network Simulation time 6000 s
PHY data rate 54 Mbps
Radio range 60 m
Buffer size 7.5 MB
Mobility Model Disaster Area (Aschenbruck et al., 2009)
Zone 0 700�600 m
Zone 1 50�50 m
PRoPHET Pinit 0.75
b 0.25
g 0.98
MaxProp Meeting Prob Max Set Size 50
a 1
forwarding methods to measure an independent value that doesnot depend on the mobile device the user is using.
The contacts between nodes or the messages size are elementsthat are common in all the forwarding protocols when we testthem using the same traces and simulation parameters. Hence,the parameter that defines the energy consumed by a forwardingprotocol is the number of messages relayed (Balasubramanianet al., 2009b). We define an energy cost per message as thenumber of messages relayed divided by the number of messagescreated. Therefore, we can measure and compare the costbetween different forwarding methods regardless of the messagesize or the number of message created.
5. Simulation results
In this section we present and discuss the results obtainedafter performing the simulations. We want to analyse how thechosen routing methods behave in emergency scenarios withdifferent characteristics in number of nodes, number of messagesand message size. We will examine the performance impact ofeach characteristic in each routing method.
5.1. Number of nodes
The number of nodes is the sum of all the devices that cancommunicate between them in an opportunistic way. Those canbe sensors, mobile devices carried by the personnel working inthe emergency (medical, firefighters, etc.) or other types ofdevices. The density of nodes depends on many factors: personnelinvolved, devices available, etc. For this reason we evaluate theperformance of the selected forwarding protocols with differentnumbers of nodes. Table 2 shows the values of the parameters forthese simulations.
In terms of delivery ratio, in Fig. 2 we see that MaxProp has thehighest delivery ratio. As the number of nodes grows, so do thedelivery ratio and the cost per message (Fig. 4) of MaxProp,
Fig. 2. Delivery ratio vs. number of nodes.
A. Martın-Campillo et al. / Journal of Network and Computer Applications 36 (2013) 870–880 875
because more message relays are done. Regarding Epidemic andPRoPHET, both have a high energy cost. PRoPHET includesprobabilistic information when deciding whether a messageshould be relayed or not, which improves the delivery ratio ofEpidemic, although adding probabilities to the decision makingworks better for few nodes.
Using Epidemic, buffers become full and nodes are forced todrop the oldest messages to make room for new ones. This canproduce the relay of messages that had previously been relayed tothis node, increasing the overhead (Fig. 3) and the cost (Fig. 4).As we can see in Fig. 2, the delivery ratio of Epidemic is very low.
If we look more deeply in MaxProp results, we will find that itsgood results are due to two main characteristics of this routingmethod. MaxProp deletes those message in the buffer with lowestdelivery likelihood when freeing up space for new messages. Inaddition, it sends messages to other nodes in specific order thattakes into account message hop counts and message deliveryprobabilities based on previous encounters. These two character-istics provide a good congestion control and a better distributionof messages. Therefore, for MaxProp, having more nodes in theemergency scenario means better results.
For TTR, its results in delivery ratio improve those of Epidemicand PRoPHET thanks to the use of the data mules approach inemergency scenarios. Nodes go back and forth to the zone 1 wherethey deliver the messages. TTR takes advantage of that by usingthis information in the forwarding decision and thus forwarding
Fig. 3. Overhead vs. number of nodes.
Fig. 4. Cost per message vs. number of nodes.
the messages only to those nodes that have better chances ofdelivering the message sooner. However, its single-messagepolicy (TTR passes the message, instead of duplicating it, to theneighbour) makes this forwarding protocol lose opportunities torelay messages to better nodes, producing a delivery ratio farbelow MaxProp.
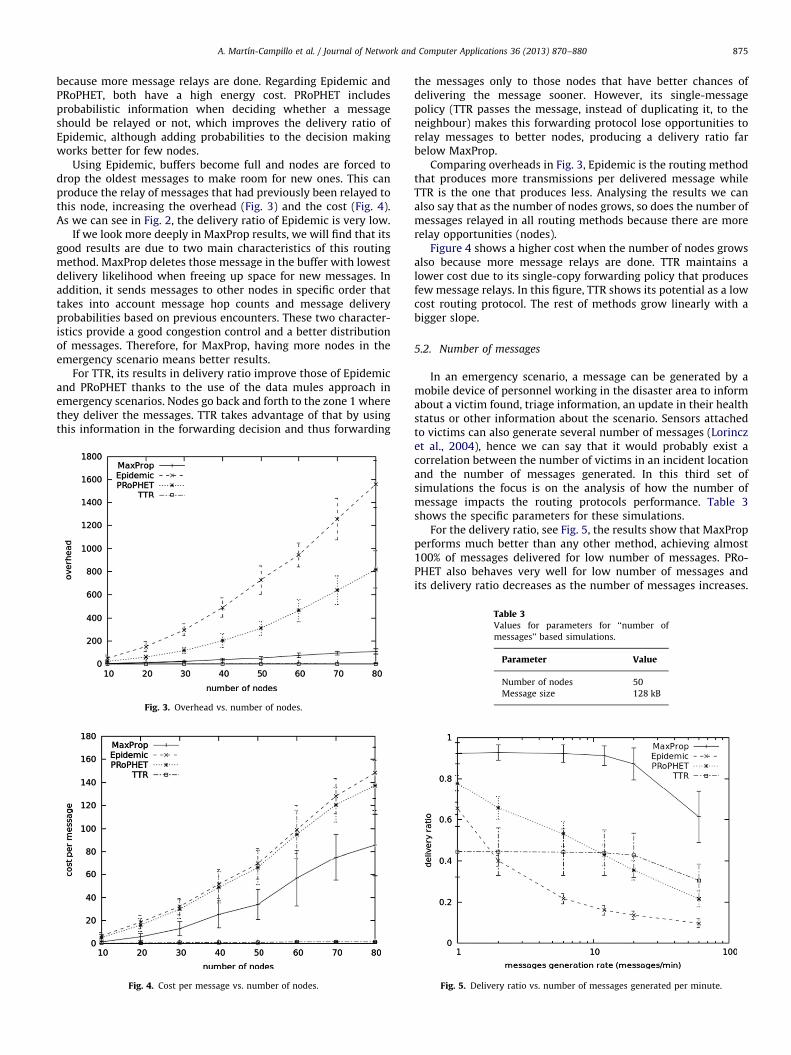
Comparing overheads in Fig. 3, Epidemic is the routing methodthat produces more transmissions per delivered message whileTTR is the one that produces less. Analysing the results we canalso say that as the number of nodes grows, so does the number ofmessages relayed in all routing methods because there are morerelay opportunities (nodes).
Figure 4 shows a higher cost when the number of nodes growsalso because more message relays are done. TTR maintains alower cost due to its single-copy forwarding policy that producesfew message relays. In this figure, TTR shows its potential as a lowcost routing protocol. The rest of methods grow linearly with abigger slope.
5.2. Number of messages
In an emergency scenario, a message can be generated by amobile device of personnel working in the disaster area to informabout a victim found, triage information, an update in their healthstatus or other information about the scenario. Sensors attachedto victims can also generate several number of messages (Lorinczet al., 2004), hence we can say that it would probably exist acorrelation between the number of victims in an incident locationand the number of messages generated. In this third set ofsimulations the focus is on the analysis of how the number ofmessage impacts the routing protocols performance. Table 3shows the specific parameters for these simulations.
For the delivery ratio, see Fig. 5, the results show that MaxPropperforms much better than any other method, achieving almost100% of messages delivered for low number of messages. PRo-PHET also behaves very well for low number of messages andits delivery ratio decreases as the number of messages increases.
Table 3Values for parameters for ‘‘number of
messages’’ based simulations.
Parameter Value
Number of nodes 50
Message size 128 kB
Fig. 5. Delivery ratio vs. number of messages generated per minute.
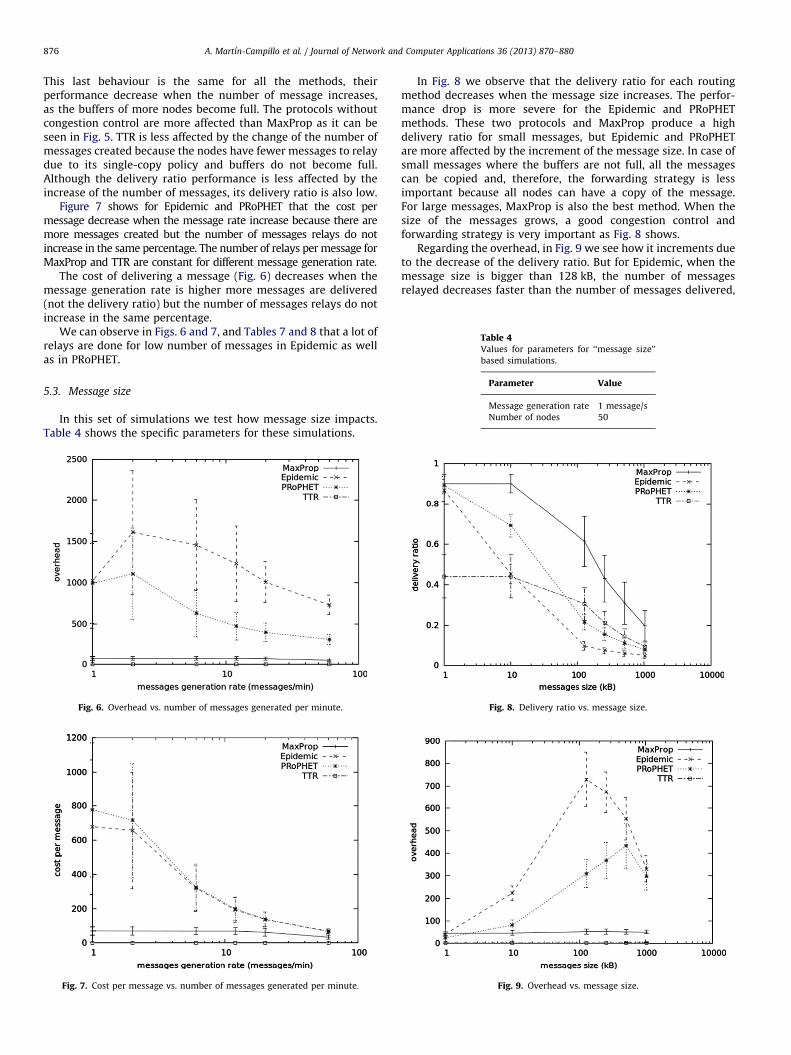
Table 4Values for parameters for ‘‘message size’’
based simulations.
Parameter Value
Message generation rate 1 message/s
Number of nodes 50
A. Martın-Campillo et al. / Journal of Network and Computer Applications 36 (2013) 870–880876
This last behaviour is the same for all the methods, theirperformance decrease when the number of message increases,as the buffers of more nodes become full. The protocols withoutcongestion control are more affected than MaxProp as it can beseen in Fig. 5. TTR is less affected by the change of the number ofmessages created because the nodes have fewer messages to relaydue to its single-copy policy and buffers do not become full.Although the delivery ratio performance is less affected by theincrease of the number of messages, its delivery ratio is also low.
Figure 7 shows for Epidemic and PRoPHET that the cost permessage decrease when the message rate increase because there aremore messages created but the number of messages relays do notincrease in the same percentage. The number of relays per message forMaxProp and TTR are constant for different message generation rate.
The cost of delivering a message (Fig. 6) decreases when themessage generation rate is higher more messages are delivered(not the delivery ratio) but the number of messages relays do notincrease in the same percentage.
We can observe in Figs. 6 and 7, and Tables 7 and 8 that a lot ofrelays are done for low number of messages in Epidemic as wellas in PRoPHET.
5.3. Message size
In this set of simulations we test how message size impacts.Table 4 shows the specific parameters for these simulations.
Fig. 6. Overhead vs. number of messages generated per minute.
Fig. 7. Cost per message vs. number of messages generated per minute.
In Fig. 8 we observe that the delivery ratio for each routingmethod decreases when the message size increases. The perfor-mance drop is more severe for the Epidemic and PRoPHETmethods. These two protocols and MaxProp produce a highdelivery ratio for small messages, but Epidemic and PRoPHETare more affected by the increment of the message size. In case ofsmall messages where the buffers are not full, all the messagescan be copied and, therefore, the forwarding strategy is lessimportant because all nodes can have a copy of the message.For large messages, MaxProp is also the best method. When thesize of the messages grows, a good congestion control andforwarding strategy is very important as Fig. 8 shows.
Regarding the overhead, in Fig. 9 we see how it increments dueto the decrease of the delivery ratio. But for Epidemic, when themessage size is bigger than 128 kB, the number of messagesrelayed decreases faster than the number of messages delivered,
Fig. 8. Delivery ratio vs. message size.
Fig. 9. Overhead vs. message size.
A. Martın-Campillo et al. / Journal of Network and Computer Applications 36 (2013) 870–880 877
causing the decrement of its overhead. As in other charts,MaxProp and TTR are less affected.
In terms of cost per message we see in Fig. 10 the sameproblems mentioned above. In this case, MaxProp also reducesthe cost per message, doing less relays per message. RegardingTTR, it is also affected by the message size, although it only carriesone copy of the message in all the network.
6. Discussion
In this section we want to discuss the results obtained in theprevious section. From these results we can say that MaxProp has avery good performance in terms of delivery ratio for almost allemergency scenarios regardless of its characteristics. It is the methodwith most messages delivered. All other methods are significantlyworse in terms of delivery ratio with a few exceptions.
However, if we consider overhead or cost, then the results aredifferent. In this case, the routing method with best results isalways TTR as it keeps only one copy of the message throughoutthe network and it is designed for emergency scenarios. Thismeans that TTR is the most efficient (less overhead) forwardingmethod and the one that consumes less energy (less cost). Interms of delivery ratio, TTR has better results than Epidemic andPRoPHET in scenarios with high number of messages or bigmessages where these approaches produce network congestion.In scenarios with few or lightweight messages (where buffers canstore a lot of messages), the Epidemic approaches have betterresults than the TTR one.
Fig. 10. Cost per message vs. message size.
Table 5Results summary for 10 and 30 nodes.
Number of nodes 10
Protocol PRoPHET MaxProp Epidemic
Throughput (kBps) 25.71 33.81 17.64
Delivery ratio 0.20 0.26 0.14
Overhead 24.42 4.78 51.19
Cost per message created 5.29 1.55 6.88
Avg hops count 1.49 1.31 3.02
Delivery Delay CDF (60 s) 0.06 0.07 0.05
Delivery Delay CDF (600 s) 0.19 0.22 0.14
Delivery Delay CDF (1800 s) 0.20 0.26 0.15
Delivery Delay CDF (3000 s) 0.20 0.26 0.15
Delivery Delay CDF (4200 s) 0.20 0.27 0.15
Delivery Delay CDF (5400 s) 0.20 0.27 0.15
Taking into account these results, in an emergency scenariowhere we require the fastest delivery method, hence the methodwith highest delivery ratio in a given time, we would chooseMaxProp. However, choosing MaxProp will produce a high powerconsumption and will drain the battery fast. In some cases thebattery will not last until the end of the emergency resulting inloss of messages and nodes. Emergency scenarios with a highdensity of nodes in the incident location or with a lot of messagescreated will cause a high energy cost for MaxProp. If one of thesecases is foreseen, a more energy efficient forwarding methodshould be used. If TTR is used, the battery of the nodes will lastmuch longer. This would have as a consequence a poorer deliveryratio but the node will not be switched off during the emergencythat can cause a delay in the delivery of the messages carried bythat node.
We must remember that all nodes will eventually come backto the coordination point once the emergency will come to anend, hence all messages will be delivered at some point and noone will be lost. Hence, the fastest delivery method is the one thatdelivers more messages while the emergency is ongoing.
The following summarises the key aspects of each of therouting protocols:
MaxProp
þþ
Excellent delivery ratio in almost any situation thanks to itscongestion control protocol and forwarding decisionalgorithm.þ
Satisfactory energy cost performance for low number of nodesor messages.�
Elevated consumption for scenarios with high number ofnodes or small size messages.TTR
þþ
Very good energy cost in all situations thanks to its singlemessage copy policy.þ
Good delivery ratio in scenarios with high number of nodes ornumber of messages.�
Poor delivery ratio in scenarios with small message size or lownumber of messages.ProPHET and Epidemic
þ
Good delivery ratio in scenarios with small size messages or lowmessages generation rate where no congestion is produced.þ
Good cost in scenarios with small size messages. –– Elevated energy cost and overhead except for small sizemessages simulations.
30
TTR PRoPHET MaxProp Epidemic TTR
25.97 32.82 65.18 14.09 38.03
0.20 0.26 0.51 0.11 0.30
0.88 117.48 23.46 295.55 2.06
0.40 29.95 13.00 32.31 0.94
1.40 2.88 2.36 7.21 2.40
0.07 0.06 0.11 0.05 0.08
0.20 0.17 0.37 0.10 0.26
0.21 0.25 0.47 0.12 0.30
0.21 0.26 0.50 0.13 0.30
0.21 0.26 0.51 0.13 0.30
0.21 0.26 0.52 0.13 0.30
A. Martın-Campillo et al. / Journal of Network and Computer Applications 36 (2013) 870–880878
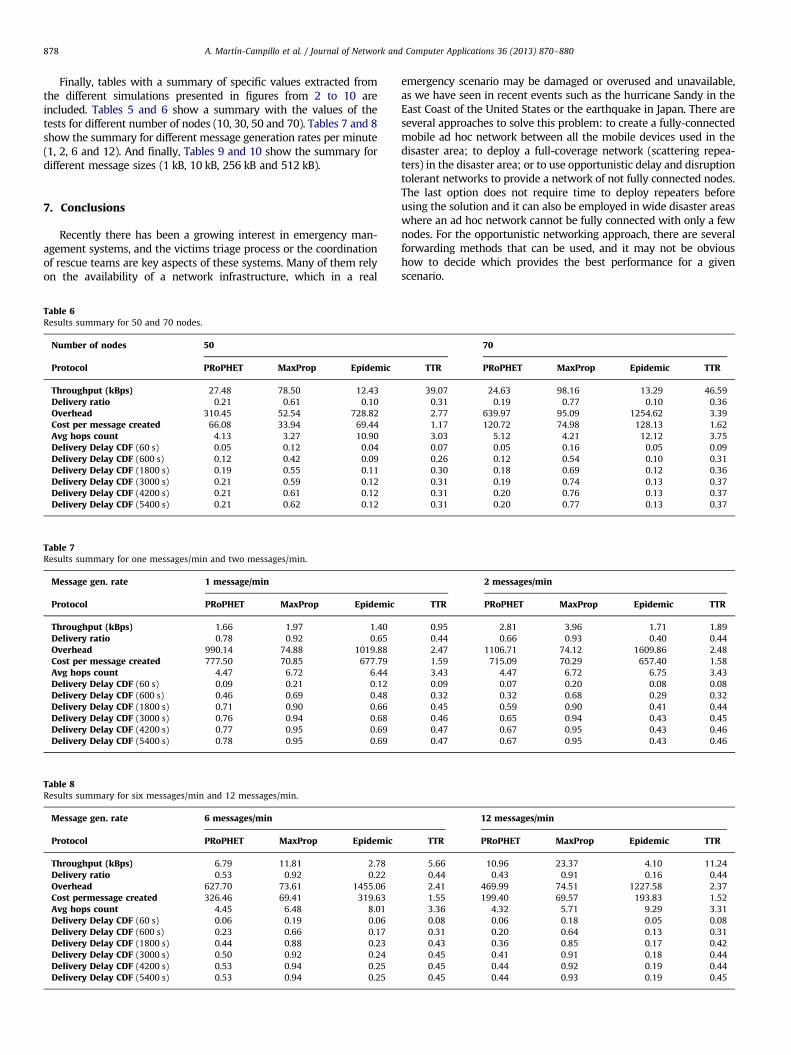
Finally, tables with a summary of specific values extracted fromthe different simulations presented in figures from 2 to 10 areincluded. Tables 5 and 6 show a summary with the values of thetests for different number of nodes (10, 30, 50 and 70). Tables 7 and 8show the summary for different message generation rates per minute(1, 2, 6 and 12). And finally, Tables 9 and 10 show the summary fordifferent message sizes (1 kB, 10 kB, 256 kB and 512 kB).
7. Conclusions
Recently there has been a growing interest in emergency man-agement systems, and the victims triage process or the coordinationof rescue teams are key aspects of these systems. Many of them relyon the availability of a network infrastructure, which in a real
Table 6Results summary for 50 and 70 nodes.
Number of nodes 50
Protocol PRoPHET MaxProp Epidemic
Throughput (kBps) 27.48 78.50 12.43
Delivery ratio 0.21 0.61 0.10
Overhead 310.45 52.54 728.82
Cost per message created 66.08 33.94 69.44
Avg hops count 4.13 3.27 10.90
Delivery Delay CDF (60 s) 0.05 0.12 0.04
Delivery Delay CDF (600 s) 0.12 0.42 0.09
Delivery Delay CDF (1800 s) 0.19 0.55 0.11
Delivery Delay CDF (3000 s) 0.21 0.59 0.12
Delivery Delay CDF (4200 s) 0.21 0.61 0.12
Delivery Delay CDF (5400 s) 0.21 0.62 0.12
Table 7Results summary for one messages/min and two messages/min.
Message gen. rate 1 message/min
Protocol PRoPHET MaxProp Epidemic
Throughput (kBps) 1.66 1.97 1.40
Delivery ratio 0.78 0.92 0.65
Overhead 990.14 74.88 1019.88
Cost per message created 777.50 70.85 677.79
Avg hops count 4.47 6.72 6.44
Delivery Delay CDF (60 s) 0.09 0.21 0.12
Delivery Delay CDF (600 s) 0.46 0.69 0.48
Delivery Delay CDF (1800 s) 0.71 0.90 0.66
Delivery Delay CDF (3000 s) 0.76 0.94 0.68
Delivery Delay CDF (4200 s) 0.77 0.95 0.69
Delivery Delay CDF (5400 s) 0.78 0.95 0.69
Table 8Results summary for six messages/min and 12 messages/min.
Message gen. rate 6 messages/min
Protocol PRoPHET MaxProp Epidemic
Throughput (kBps) 6.79 11.81 2.78
Delivery ratio 0.53 0.92 0.22
Overhead 627.70 73.61 1455.06
Cost permessage created 326.46 69.41 319.63
Avg hops count 4.45 6.48 8.01
Delivery Delay CDF (60 s) 0.06 0.19 0.06
Delivery Delay CDF (600 s) 0.23 0.66 0.17
Delivery Delay CDF (1800 s) 0.44 0.88 0.23
Delivery Delay CDF (3000 s) 0.50 0.92 0.24
Delivery Delay CDF (4200 s) 0.53 0.94 0.25
Delivery Delay CDF (5400 s) 0.53 0.94 0.25
emergency scenario may be damaged or overused and unavailable,as we have seen in recent events such as the hurricane Sandy in theEast Coast of the United States or the earthquake in Japan. There areseveral approaches to solve this problem: to create a fully-connectedmobile ad hoc network between all the mobile devices used in thedisaster area; to deploy a full-coverage network (scattering repea-ters) in the disaster area; or to use opportunistic delay and disruptiontolerant networks to provide a network of not fully connected nodes.The last option does not require time to deploy repeaters beforeusing the solution and it can also be employed in wide disaster areaswhere an ad hoc network cannot be fully connected with only a fewnodes. For the opportunistic networking approach, there are severalforwarding methods that can be used, and it may not be obvioushow to decide which provides the best performance for a givenscenario.
70
TTR PRoPHET MaxProp Epidemic TTR
39.07 24.63 98.16 13.29 46.59
0.31 0.19 0.77 0.10 0.36
2.77 639.97 95.09 1254.62 3.39
1.17 120.72 74.98 128.13 1.62
3.03 5.12 4.21 12.12 3.75
0.07 0.05 0.16 0.05 0.09
0.26 0.12 0.54 0.10 0.31
0.30 0.18 0.69 0.12 0.36
0.31 0.19 0.74 0.13 0.37
0.31 0.20 0.76 0.13 0.37
0.31 0.20 0.77 0.13 0.37
2 messages/min
TTR PRoPHET MaxProp Epidemic TTR
0.95 2.81 3.96 1.71 1.89
0.44 0.66 0.93 0.40 0.44
2.47 1106.71 74.12 1609.86 2.48
1.59 715.09 70.29 657.40 1.58
3.43 4.47 6.72 6.75 3.43
0.09 0.07 0.20 0.08 0.08
0.32 0.32 0.68 0.29 0.32
0.45 0.59 0.90 0.41 0.44
0.46 0.65 0.94 0.43 0.45
0.47 0.67 0.95 0.43 0.46
0.47 0.67 0.95 0.43 0.46
12 messages/min
TTR PRoPHET MaxProp Epidemic TTR
5.66 10.96 23.37 4.10 11.24
0.44 0.43 0.91 0.16 0.44
2.41 469.99 74.51 1227.58 2.37
1.55 199.40 69.57 193.83 1.52
3.36 4.32 5.71 9.29 3.31
0.08 0.06 0.18 0.05 0.08
0.31 0.20 0.64 0.13 0.31
0.43 0.36 0.85 0.17 0.42
0.45 0.41 0.91 0.18 0.44
0.45 0.44 0.92 0.19 0.44
0.45 0.44 0.93 0.19 0.45
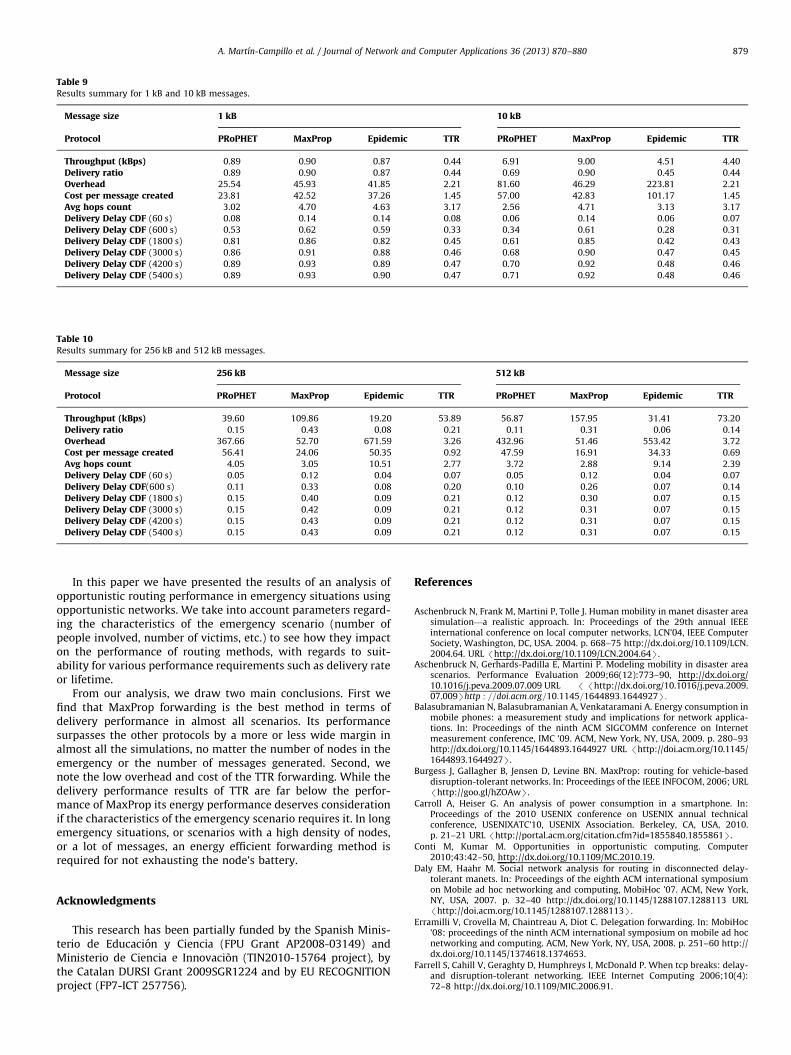
Table 9Results summary for 1 kB and 10 kB messages.
Message size 1 kB 10 kB
Protocol PRoPHET MaxProp Epidemic TTR PRoPHET MaxProp Epidemic TTR
Throughput (kBps) 0.89 0.90 0.87 0.44 6.91 9.00 4.51 4.40
Delivery ratio 0.89 0.90 0.87 0.44 0.69 0.90 0.45 0.44
Overhead 25.54 45.93 41.85 2.21 81.60 46.29 223.81 2.21
Cost per message created 23.81 42.52 37.26 1.45 57.00 42.83 101.17 1.45
Avg hops count 3.02 4.70 4.63 3.17 2.56 4.71 3.13 3.17
Delivery Delay CDF (60 s) 0.08 0.14 0.14 0.08 0.06 0.14 0.06 0.07
Delivery Delay CDF (600 s) 0.53 0.62 0.59 0.33 0.34 0.61 0.28 0.31
Delivery Delay CDF (1800 s) 0.81 0.86 0.82 0.45 0.61 0.85 0.42 0.43
Delivery Delay CDF (3000 s) 0.86 0.91 0.88 0.46 0.68 0.90 0.47 0.45
Delivery Delay CDF (4200 s) 0.89 0.93 0.89 0.47 0.70 0.92 0.48 0.46
Delivery Delay CDF (5400 s) 0.89 0.93 0.90 0.47 0.71 0.92 0.48 0.46
Table 10Results summary for 256 kB and 512 kB messages.
Message size 256 kB 512 kB
Protocol PRoPHET MaxProp Epidemic TTR PRoPHET MaxProp Epidemic TTR
Throughput (kBps) 39.60 109.86 19.20 53.89 56.87 157.95 31.41 73.20
Delivery ratio 0.15 0.43 0.08 0.21 0.11 0.31 0.06 0.14
Overhead 367.66 52.70 671.59 3.26 432.96 51.46 553.42 3.72
Cost per message created 56.41 24.06 50.35 0.92 47.59 16.91 34.33 0.69
Avg hops count 4.05 3.05 10.51 2.77 3.72 2.88 9.14 2.39
Delivery Delay CDF (60 s) 0.05 0.12 0.04 0.07 0.05 0.12 0.04 0.07
Delivery Delay CDF(600 s) 0.11 0.33 0.08 0.20 0.10 0.26 0.07 0.14
Delivery Delay CDF (1800 s) 0.15 0.40 0.09 0.21 0.12 0.30 0.07 0.15
Delivery Delay CDF (3000 s) 0.15 0.42 0.09 0.21 0.12 0.31 0.07 0.15
Delivery Delay CDF (4200 s) 0.15 0.43 0.09 0.21 0.12 0.31 0.07 0.15
Delivery Delay CDF (5400 s) 0.15 0.43 0.09 0.21 0.12 0.31 0.07 0.15
A. Martın-Campillo et al. / Journal of Network and Computer Applications 36 (2013) 870–880 879
In this paper we have presented the results of an analysis ofopportunistic routing performance in emergency situations usingopportunistic networks. We take into account parameters regard-ing the characteristics of the emergency scenario (number ofpeople involved, number of victims, etc.) to see how they impacton the performance of routing methods, with regards to suit-ability for various performance requirements such as delivery rateor lifetime.
From our analysis, we draw two main conclusions. First wefind that MaxProp forwarding is the best method in terms ofdelivery performance in almost all scenarios. Its performancesurpasses the other protocols by a more or less wide margin inalmost all the simulations, no matter the number of nodes in theemergency or the number of messages generated. Second, wenote the low overhead and cost of the TTR forwarding. While thedelivery performance results of TTR are far below the perfor-mance of MaxProp its energy performance deserves considerationif the characteristics of the emergency scenario requires it. In longemergency situations, or scenarios with a high density of nodes,or a lot of messages, an energy efficient forwarding method isrequired for not exhausting the node’s battery.
Acknowledgments
This research has been partially funded by the Spanish Minis-terio de Educacion y Ciencia (FPU Grant AP2008-03149) andMinisterio de Ciencia e Innovaci ~on (TIN2010-15764 project), bythe Catalan DURSI Grant 2009SGR1224 and by EU RECOGNITIONproject (FP7-ICT 257756).
References
Aschenbruck N, Frank M, Martini P, Tolle J. Human mobility in manet disaster areasimulation—a realistic approach. In: Proceedings of the 29th annual IEEEinternational conference on local computer networks, LCN’04, IEEE ComputerSociety, Washington, DC, USA. 2004. p. 668–75 http://dx.doi.org/10.1109/LCN.2004.64. URL /http://dx.doi.org/10.1109/LCN.2004.64S.
Aschenbruck N, Gerhards-Padilla E, Martini P. Modeling mobility in disaster areascenarios. Performance Evaluation 2009;66(12):773–90, http://dx.doi.org/10.1016/j.peva.2009.07.009 URL / /http://dx.doi.org/10.1016/j.peva.2009.07.009Shttp : ==doi:acm:org=10:1145=1644893:1644927S:
Balasubramanian N, Balasubramanian A, Venkataramani A. Energy consumption inmobile phones: a measurement study and implications for network applica-tions. In: Proceedings of the ninth ACM SIGCOMM conference on Internetmeasurement conference, IMC ’09. ACM, New York, NY, USA, 2009. p. 280–93http://dx.doi.org/10.1145/1644893.1644927 URL /http://doi.acm.org/10.1145/1644893.1644927S.
Burgess J, Gallagher B, Jensen D, Levine BN. MaxProp: routing for vehicle-baseddisruption-tolerant networks. In: Proceedings of the IEEE INFOCOM, 2006; URL/http://goo.gl/hZOAwS.
Carroll A, Heiser G. An analysis of power consumption in a smartphone. In:Proceedings of the 2010 USENIX conference on USENIX annual technicalconference, USENIXATC’10, USENIX Association. Berkeley, CA, USA, 2010.p. 21–21 URL /http://portal.acm.org/citation.cfm?id=1855840.1855861S.
Conti M, Kumar M. Opportunities in opportunistic computing. Computer2010;43:42–50, http://dx.doi.org/10.1109/MC.2010.19.
Daly EM, Haahr M. Social network analysis for routing in disconnected delay-tolerant manets. In: Proceedings of the eighth ACM international symposiumon Mobile ad hoc networking and computing, MobiHoc ’07. ACM, New York,NY, USA, 2007. p. 32–40 http://dx.doi.org/10.1145/1288107.1288113 URL/http://doi.acm.org/10.1145/1288107.1288113S.
Erramilli V, Crovella M, Chaintreau A, Diot C. Delegation forwarding. In: MobiHoc’08: proceedings of the ninth ACM international symposium on mobile ad hocnetworking and computing. ACM, New York, NY, USA, 2008. p. 251–60 http://dx.doi.org/10.1145/1374618.1374653.
Farrell S, Cahill V, Geraghty D, Humphreys I, McDonald P. When tcp breaks: delay-and disruption-tolerant networking. IEEE Internet Computing 2006;10(4):72–8 http://dx.doi.org/10.1109/MIC.2006.91.
A. Martın-Campillo et al. / Journal of Network and Computer Applications 36 (2013) 870–880880
/http://www.geopictures.eu/S, Geo-pictures; 2010.Google crisis response. URL /http://www.google.com/crisisresponse/S.Hikaru I, Kenji M, Yoichiro U, Kazuo I, Noriharu M. Study on the evaluation of
applicability of smart phones in a disaster recovery system. In: Proceedings ofthe IEICE general conference, vol. 2; 2011-02-28. p. S61–S62 URL /http://ci.nii.ac.jp/naid/110008577631/en/S.
Hui P, Crowcroft J, Yoneki E. Bubble rap: social-based forwarding in delay tolerantnetworks. In: MobiHoc ’08: proceedings of the ninth ACM internationalsymposium on Mobile ad hoc networking and computing, ACM, New York,NY, USA, 2008. p. 241–50 http://dx.doi.org/10.1145/1374618.1374652.
Hui P, Crowcroft J, Yoneki E. Bubble rap: social-based forwarding in delay-tolerantnetworks. IEEE Transactions on Mobile Computing 2011;10(11):1576–89, http://dx.doi.org/10.1109/TMC.2010.246.
Improvisa—infraestructura minimalista para la provision de servicios en redes ad-hoc (minimalist infrastructure for service provisioning in ad-hoc networks)/http://www.gsi.dit.upm.es/improvisa/english.htmS.
Keranen A, Ott J, Karkkainen T. The one simulator for dtn protocol evaluation. In:Proceedings of the second international conference on simulation tools andtechniques, Simutools ’09, ICST (Institute for Computer Sciences, Social-Informatics and Telecommunications Engineering), ICST, Brussels, Belgium,2009. p. 55:1–55:10 http://dx.doi.org/10.4108/ICST.SIMUTOOLS2009.5674URL /http://dx.doi.org/10.4108/ICST.SIMUTOOLS2009.5674S.
Lindgren A, Doria A, Schelen O. Probabilistic routing in intermittently connectednetworks. In: SAPIR, Lecture Notes in Computer Science, vol. 3126. Springer,2004. p. 239–54 URL /http://www.springerlink.com/content/9xt3904hd05fxmjfS.
Lorincz K, Malan D, Fulford-Jones T, Nawoj A, Clavel A, Shnayder V, et al. Sensornetworks for emergency response: challenges and opportunities. PervasiveComputing, IEEE 2004;3(4):16–23.
Martı R, Robles S, Martın-Campillo A, Cucurull J. Providing early resourceallocation during emergencies: the mobile triage tag. Journal of Network andComputer Applications 2009;32(6):1167–82.
Martın-Campillo A, Crowcroft J, Yoneki E, Martı R, Martınez C. Using haggle tocreate an electronic triage tag. In: The second international workshop on
mobile opportunistic networking—ACM/SIGMOBILE MobiOpp 2010, ACMPress; 2010. p. 167–170.
/http://www.mashproject.com/S, Mass casualties and health care following therelease of toxic chemicals and radioactive material (mash); 2009.
McGrath S, Grigg E, Wendelken S, Blike G, Rosa MD, Fiske A, et al. ARTEMIS: avision for remote triage and emergency management information integration.Dartmouth University; 2003. p. 9.
Mtibaa A, May M, Diot C, Ammar M. Peoplerank: social opportunistic forwarding.In: INFOCOM, 2010 Proceedings IEEE. 2010. p. 1–5 http://dx.doi.org/10.1109/INFCOM.2010.5462261.
Nordstrom E, Gunningberg P, Rohner C. A search-based network architecture formobile devices. Technical report. Uppsala University; 2009.
Pelusi L, Passarella A, Conti M. Opportunistic networking: data forwarding indisconnected mobile ad hoc networks. Communications Magazine, IEEE2006;44(11):134–41, http://dx.doi.org/10.1109/MCOM.2006.248176.
Reina DG, Toral SL, Barrero F, Bessis N, Asimakopoulou E. Evaluation of ad hocnetworks in disaster scenarios. In: Proceedings of the 2011 third internationalconference on intelligent networking and collaborative systems, INCOS ’11.IEEE Computer Society, Washington, DC, USA; 2011. p. 759–64 http://dx.doi.org/10.1109/INCoS.2011.86 URL /http://dx.doi.org/10.1109/INCoS.2011.86S.
Rice A, Hay S. Measuring mobile phone energy consumption for 802.11 wirelessnetworking. Pervasive and Mobile Computing 2010;6(6):593–606, http://dx.doi.org/10.1016/j.pmcj.2010.07.005 special Issue PerCom 2010. URL
/ /http://goo.gl/AjQZHShttp : ==issg:cs:duke:edu=epidemic=epidemic:pdfS:Williams D. Tactical medical coordination system (tacmedcs), Naval Health
Research Center, San Diego, CA. Technical report. Febraury 2004–June 2007;November 2007.
Wittie MP, Harras KA, Almeroth KC, Belding EM. On the implications of routingmetric staleness in delay tolerant networks. Computer and Communications2009;32:1699–709, http://dx.doi.org/10.1016/j.comcom.2009.02.006.
Ye Q, Cheng L, Chuah MC, Davison BD. Performance comparison of differentmulticast routing strategies in disruption tolerant networks. ComputerCommunications 2009;32(16):1731–41, http://dx.doi.org/10.1016/j.comcom.2009.02.007 special issue of computer communications on delay and disrup-tion tolerant networking.

![Opportunistic IoT: Exploring the Harmonious Interaction ...guob.org/research/Opportunistic-IoT-JCNA.pdf · the development of opportunistic networks [3], which uses infrastructure-free,](https://img.pdfslide.us/doc/110x75/5fb9b8e92567ec340653523e/opportunistic-iot-exploring-the-harmonious-interaction-guoborgresearchopportunistic-iot-jcnapdf.jpg)