Embed Size (px)
Citation preview
www.vtpi.org
250-360-1560
Lyndon Henry and Todd Litman 2006-2014
You are welcome and encouraged to copy, distribute, share and excerpt this document and its ideas, provided the author is
given attribution. Please send your corrections, comments and suggestions for improvement.
Evaluating New Start Transit Program Performance
Comparing Rail And Bus 24 April 2014
By Lyndon Henry Austin, Texas
Phone (512) 441-3014 Email: [email protected]
and Todd A. Litman
Victoria Transport Policy Institute
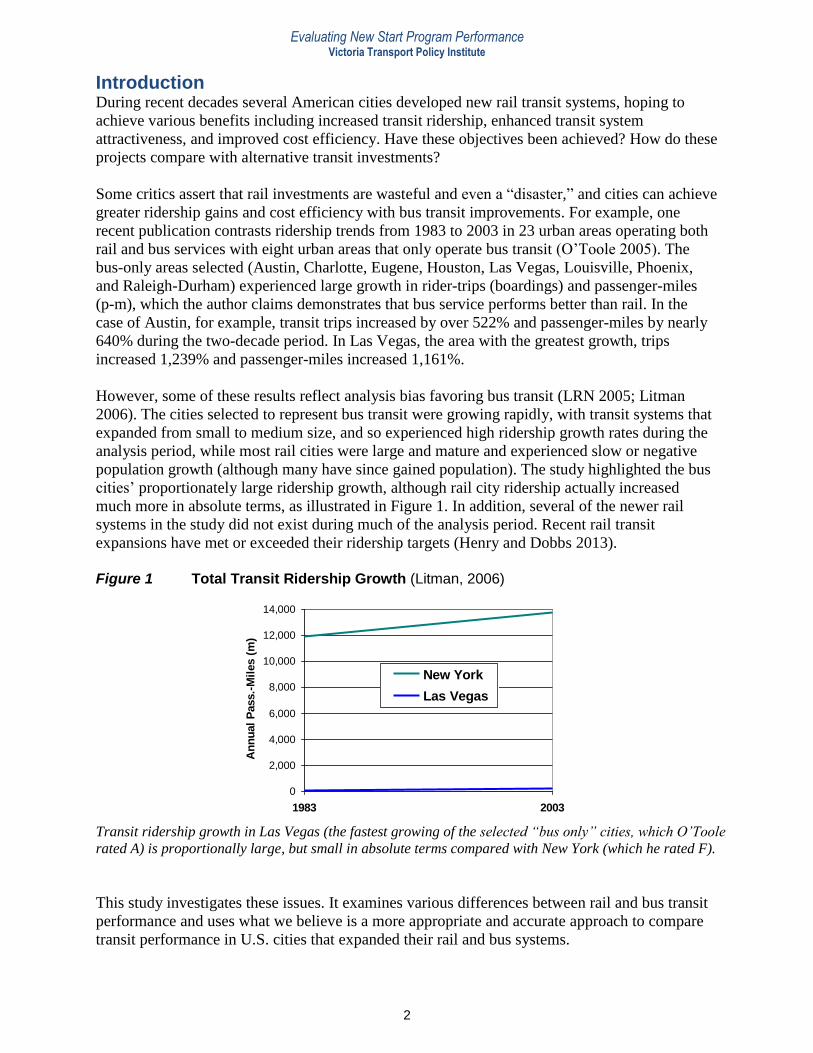
Photos courtesy of David Dobbs
Abstract There is ongoing debate over the relative advantages of rail and bus transit investments. Rail critics assert that cities which expand their bus transit systems exhibit better performance than those that expand rail systems. This study examines those claims. It compares public transport performance in U.S. urban areas that expanded rail transit with urban areas that expanded bus transit from the mid-1990s through 2003, using Federal Transit Administration data. This analysis indicates that cities that expanded their rail systems significantly outperformed cities that only expanded bus systems in terms of transit ridership, passenger-mileage, and operating cost efficiency. This indicates that rail transit investments are often economically justified due to benefits from improved transit performance and increased transit ridership.
Originally presented as
Comparative Performance of Public Transport in The US: New-Start Rail Cities vs. Bus-Only Cities presented at the Joint International Light Rail Conference, April 2006, St. Louis, Missouri,
sponsored by the Transportation Research Board, the International Union of Public Transport, and the American Public Transportation Association
Evaluating New Start Program Performance Victoria Transport Policy Institute
2
Introduction During recent decades several American cities developed new rail transit systems, hoping to
achieve various benefits including increased transit ridership, enhanced transit system
attractiveness, and improved cost efficiency. Have these objectives been achieved? How do these
projects compare with alternative transit investments?
Some critics assert that rail investments are wasteful and even a “disaster,” and cities can achieve
greater ridership gains and cost efficiency with bus transit improvements. For example, one
recent publication contrasts ridership trends from 1983 to 2003 in 23 urban areas operating both
rail and bus services with eight urban areas that only operate bus transit (O’Toole 2005). The
bus-only areas selected (Austin, Charlotte, Eugene, Houston, Las Vegas, Louisville, Phoenix,
and Raleigh-Durham) experienced large growth in rider-trips (boardings) and passenger-miles
(p-m), which the author claims demonstrates that bus service performs better than rail. In the
case of Austin, for example, transit trips increased by over 522% and passenger-miles by nearly
640% during the two-decade period. In Las Vegas, the area with the greatest growth, trips
increased 1,239% and passenger-miles increased 1,161%.
However, some of these results reflect analysis bias favoring bus transit (LRN 2005; Litman
2006). The cities selected to represent bus transit were growing rapidly, with transit systems that
expanded from small to medium size, and so experienced high ridership growth rates during the
analysis period, while most rail cities were large and mature and experienced slow or negative
population growth (although many have since gained population). The study highlighted the bus
cities’ proportionately large ridership growth, although rail city ridership actually increased
much more in absolute terms, as illustrated in Figure 1. In addition, several of the newer rail
systems in the study did not exist during much of the analysis period. Recent rail transit
expansions have met or exceeded their ridership targets (Henry and Dobbs 2013).
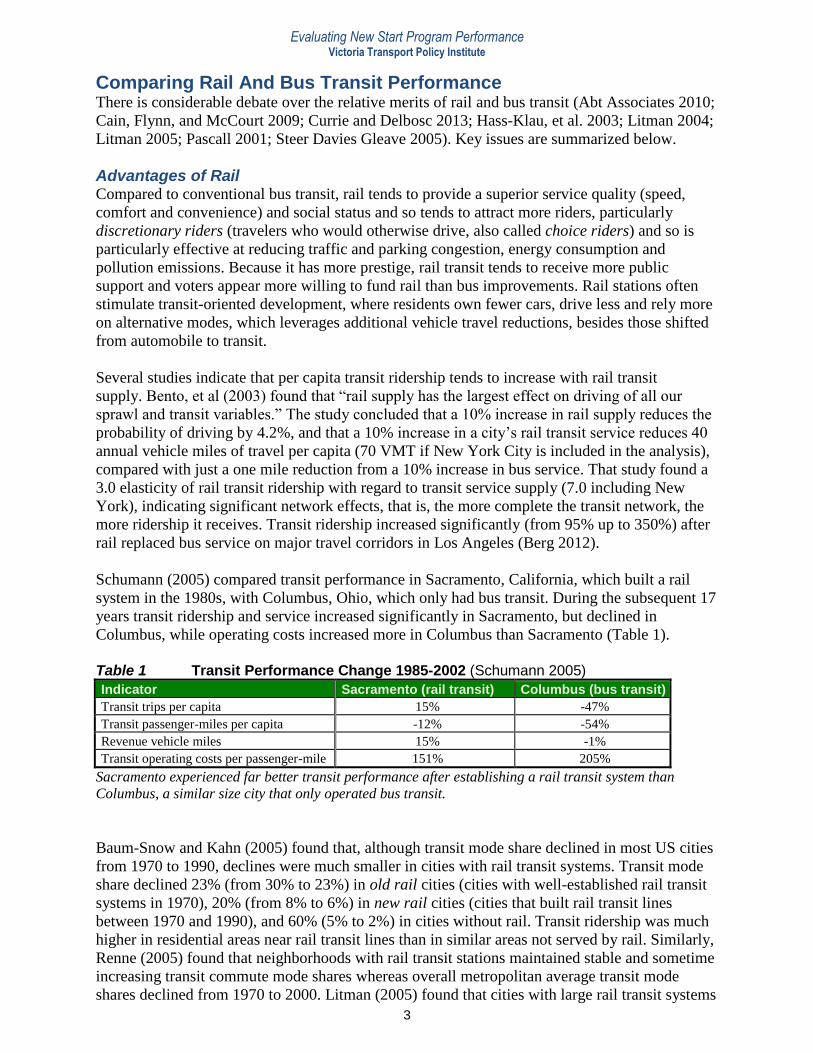
Figure 1 Total Transit Ridership Growth (Litman, 2006)
0
2,000
4,000
6,000
8,000
10,000
12,000
14,000
1983 2003
An
nu
al
Pass.-
Mil
es (
m)
New York
Las Vegas
Transit ridership growth in Las Vegas (the fastest growing of the selected “bus only” cities, which O’Toole
rated A) is proportionally large, but small in absolute terms compared with New York (which he rated F).
This study investigates these issues. It examines various differences between rail and bus transit
performance and uses what we believe is a more appropriate and accurate approach to compare
transit performance in U.S. cities that expanded their rail and bus systems.
Evaluating New Start Program Performance Victoria Transport Policy Institute
3
Comparing Rail And Bus Transit Performance There is considerable debate over the relative merits of rail and bus transit (Abt Associates 2010;
Cain, Flynn, and McCourt 2009; Currie and Delbosc 2013; Hass-Klau, et al. 2003; Litman 2004;
Litman 2005; Pascall 2001; Steer Davies Gleave 2005). Key issues are summarized below.
Advantages of Rail Compared to conventional bus transit, rail tends to provide a superior service quality (speed,
comfort and convenience) and social status and so tends to attract more riders, particularly
discretionary riders (travelers who would otherwise drive, also called choice riders) and so is
particularly effective at reducing traffic and parking congestion, energy consumption and
pollution emissions. Because it has more prestige, rail transit tends to receive more public
support and voters appear more willing to fund rail than bus improvements. Rail stations often
stimulate transit-oriented development, where residents own fewer cars, drive less and rely more
on alternative modes, which leverages additional vehicle travel reductions, besides those shifted
from automobile to transit.
Several studies indicate that per capita transit ridership tends to increase with rail transit
supply. Bento, et al (2003) found that “rail supply has the largest effect on driving of all our
sprawl and transit variables.” The study concluded that a 10% increase in rail supply reduces the
probability of driving by 4.2%, and that a 10% increase in a city’s rail transit service reduces 40
annual vehicle miles of travel per capita (70 VMT if New York City is included in the analysis),
compared with just a one mile reduction from a 10% increase in bus service. That study found a
3.0 elasticity of rail transit ridership with regard to transit service supply (7.0 including New
York), indicating significant network effects, that is, the more complete the transit network, the
more ridership it receives. Transit ridership increased significantly (from 95% up to 350%) after
rail replaced bus service on major travel corridors in Los Angeles (Berg 2012).
Schumann (2005) compared transit performance in Sacramento, California, which built a rail
system in the 1980s, with Columbus, Ohio, which only had bus transit. During the subsequent 17
years transit ridership and service increased significantly in Sacramento, but declined in
Columbus, while operating costs increased more in Columbus than Sacramento (Table 1).
Table 1 Transit Performance Change 1985-2002 (Schumann 2005)
Indicator Sacramento (rail transit) Columbus (bus transit)
Transit trips per capita 15% -47%
Transit passenger-miles per capita -12% -54%
Revenue vehicle miles 15% -1%
Transit operating costs per passenger-mile 151% 205%
Sacramento experienced far better transit performance after establishing a rail transit system than
Columbus, a similar size city that only operated bus transit.
Baum-Snow and Kahn (2005) found that, although transit mode share declined in most US cities
from 1970 to 1990, declines were much smaller in cities with rail transit systems. Transit mode
share declined 23% (from 30% to 23%) in old rail cities (cities with well-established rail transit
systems in 1970), 20% (from 8% to 6%) in new rail cities (cities that built rail transit lines
between 1970 and 1990), and 60% (5% to 2%) in cities without rail. Transit ridership was much
higher in residential areas near rail transit lines than in similar areas not served by rail. Similarly,
Renne (2005) found that neighborhoods with rail transit stations maintained stable and sometime
increasing transit commute mode shares whereas overall metropolitan average transit mode
shares declined from 1970 to 2000. Litman (2005) found that cities with large rail transit systems
Evaluating New Start Program Performance Victoria Transport Policy Institute
4
had 400% higher per capita transit ridership (589 versus 118 annual passenger-miles) and 887%
higher transit commute mode split (13.4% versus 2.7%) than cities with only bus transit service.
Analyzing travel trends indicated by the 2009 American Community Survey, Freemark (2010)
concluded that cities with rail lines experienced larger declines in automobile mode share
between 2000 and 2009 than cities that lack rail.
Freemark (2014) found that, of five cities that established rail transit systems during the 1980s,
only one (San Jose) experienced transit mode share growth between 1980 and 2012, but their
transit mode shares declined far less than 61 otherwise similar metro areas, whose median transit
mode share declined from 3.6% to just 1.7%. He also found that the rail transit investments
encouraged central city development: the median 1980s light rail metro saw its center city’s
share of the urbanized area population decline by just 6% by 2012, compared to more than 10%
for the 45 other regions with populations over 500,000 in 1980.
Demery and Setty (2005) compare transit ridership and financial performance between Portland
(which has a rail transit system) and Seattle (which has bus transit). They found that although per
capita transit ridership was roughly equivalent in the two cities, Seattle spent 13% more ($23
annually per capita) than Portland to achieve the same result. Seattle area taxpayers spent
approximately 25% more in subsidy per linked transit trip than Portland area taxpayers. Part of
this reflects Seattle’s longer travel distances, but the average linked transit trip in Seattle was not
25% longer than in Portland, suggesting that rail transit provides operating cost efficiency gains.
Similar efficiencies were found when comparing Portland’s rail and bus transit services (Demery
2005). Between 1997 and 2001 Portland light rail service intensity (annual vehicle-miles per
directional route-mile) increased 50%, while vehicle utilization (annual revenue vehicle-miles
per annual peak vehicle) increased 38%. Inflation-adjusted unit operating costs fell per vehicle
revenue-hour by 32%, per vehicle revenue-mile by 43%, and per directional route mile by 15%.
These savings reflect the spreading of fixed costs over a larger number of revenue service hours.
This analysis indicates scale economies in rail transit operation. No such economy of scale has
been found for Portland’s bus operations. During the four-year interval between FY 1997 and FY
2001, Portland bus fleet utilization (annual revenue vehicle-miles per annual peak vehicle)
decreased slightly (by 2%), while inflation-adjusted unit operating cost increased by 7-10%.
In a detailed analysis Bruun (2005) found that both Light Rail Transit (LRT) and Bus Rapid
Transit (BRT) typically have lower operating costs per passenger-space-kilometer than regular
buses. For trunk line capacities below about 1,600 spaces-per-hour, BRT tends to be cheapest,
while above 2,000 spaces-per-hour BRT headways become so short that traffic signal priority
becomes ineffective, reducing efficiency and increasing unit costs. The marginal cost of adding
off-peak service is lowest for LRT, higher for BRT, and highest for regular buses.
Advantages of Bus Bus advocates argue that bus service is cheaper and more flexible, and that much of the
preference for rail reflects prejudices rather than real advantages (Hensher 2007; Cain, Flynn,
and McCourt 2009). Bus transit can serve a greater area, and so potentially can attract greater
total ridership than rail, particularly in areas with dispersed destinations.
Some critics argue that rail investments are inequitable on the grounds that they primarily benefit
higher-income people and drain funding from basic bus service used by lower-income, transit-
dependent people. However, since rail funding often substitutes for highway project funding and
voters appear more willing to support new funding for rail than for bus improvements, rail
Evaluating New Start Program Performance Victoria Transport Policy Institute
5
funding often represents an overall increase in transit funding rather than a substitute for bus
funding, and some rail lines carry large numbers of lower-income riders. In addition, over the
long run, by attracting more discretionary transit riders (people who would otherwise drive),
increasing total transit demand, and justifying more transit support programs, rail transit
improvements often lead to increased bus service, improved walking and cycling conditions,
more accessible land use, more commuter financial incentives for transit riders (such as parking
cash out and employer provided transit passes), and overall increases in transportation system
diversity, which benefits physically, economically and socially disadvantaged people.
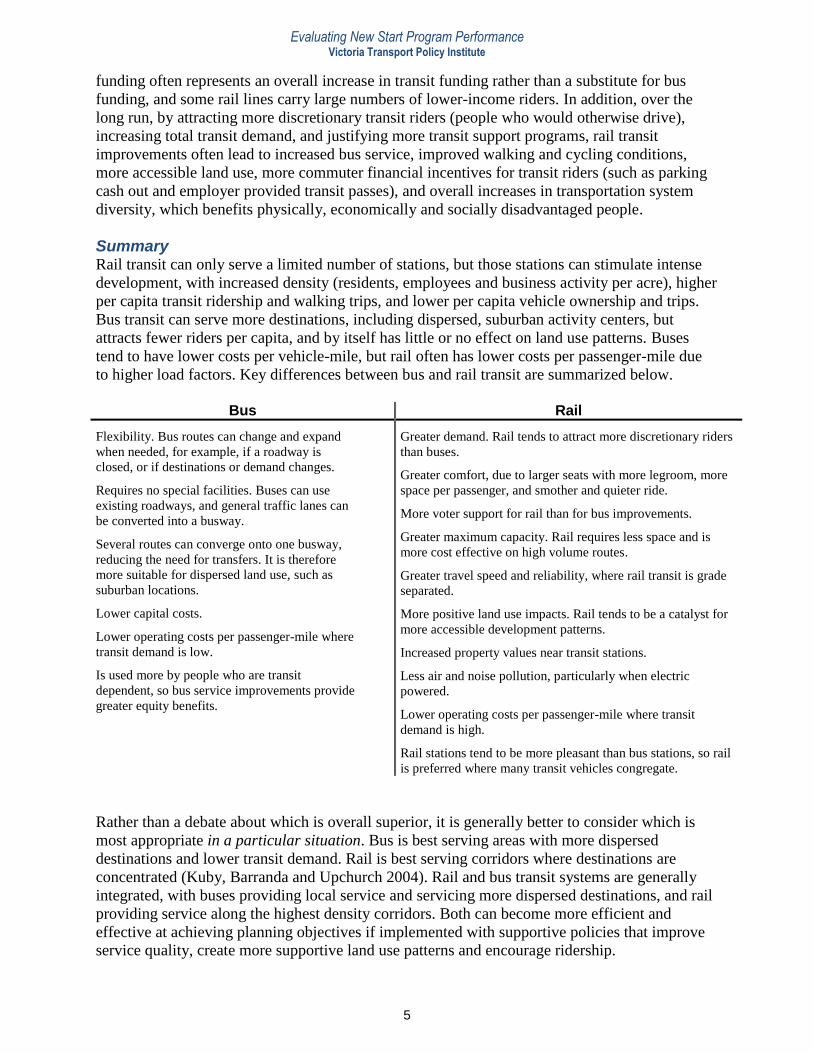
Summary Rail transit can only serve a limited number of stations, but those stations can stimulate intense
development, with increased density (residents, employees and business activity per acre), higher
per capita transit ridership and walking trips, and lower per capita vehicle ownership and trips.
Bus transit can serve more destinations, including dispersed, suburban activity centers, but
attracts fewer riders per capita, and by itself has little or no effect on land use patterns. Buses
tend to have lower costs per vehicle-mile, but rail often has lower costs per passenger-mile due
to higher load factors. Key differences between bus and rail transit are summarized below.
Bus Rail
Flexibility. Bus routes can change and expand
when needed, for example, if a roadway is
closed, or if destinations or demand changes.
Requires no special facilities. Buses can use
existing roadways, and general traffic lanes can
be converted into a busway.
Several routes can converge onto one busway,
reducing the need for transfers. It is therefore
more suitable for dispersed land use, such as
suburban locations.
Lower capital costs.
Lower operating costs per passenger-mile where
transit demand is low.
Is used more by people who are transit
dependent, so bus service improvements provide
greater equity benefits.
Greater demand. Rail tends to attract more discretionary riders
than buses.
Greater comfort, due to larger seats with more legroom, more
space per passenger, and smother and quieter ride.
More voter support for rail than for bus improvements.
Greater maximum capacity. Rail requires less space and is
more cost effective on high volume routes.
Greater travel speed and reliability, where rail transit is grade
separated.
More positive land use impacts. Rail tends to be a catalyst for
more accessible development patterns.
Increased property values near transit stations.
Less air and noise pollution, particularly when electric
powered.
Lower operating costs per passenger-mile where transit
demand is high.
Rail stations tend to be more pleasant than bus stations, so rail
is preferred where many transit vehicles congregate.
Rather than a debate about which is overall superior, it is generally better to consider which is
most appropriate in a particular situation. Bus is best serving areas with more dispersed
destinations and lower transit demand. Rail is best serving corridors where destinations are
concentrated (Kuby, Barranda and Upchurch 2004). Rail and bus transit systems are generally
integrated, with buses providing local service and servicing more dispersed destinations, and rail
providing service along the highest density corridors. Both can become more efficient and
effective at achieving planning objectives if implemented with supportive policies that improve
service quality, create more supportive land use patterns and encourage ridership.
Evaluating New Start Program Performance Victoria Transport Policy Institute
6
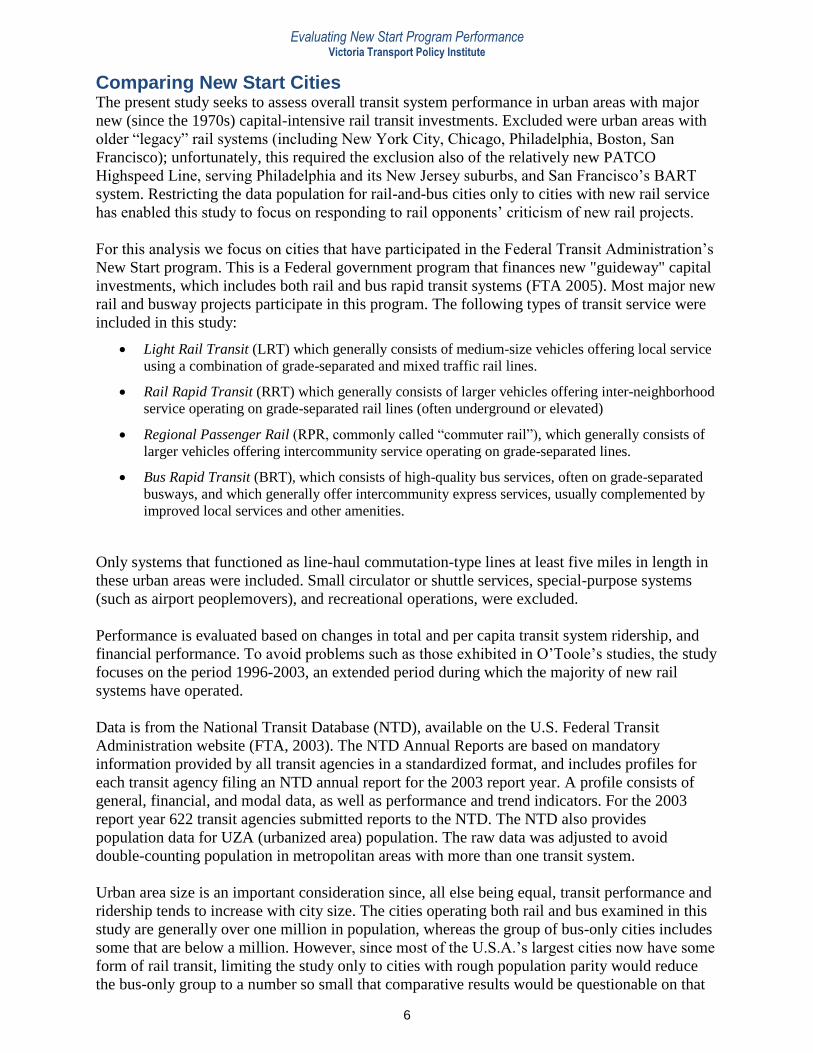
Comparing New Start Cities The present study seeks to assess overall transit system performance in urban areas with major
new (since the 1970s) capital-intensive rail transit investments. Excluded were urban areas with
older “legacy” rail systems (including New York City, Chicago, Philadelphia, Boston, San
Francisco); unfortunately, this required the exclusion also of the relatively new PATCO
Highspeed Line, serving Philadelphia and its New Jersey suburbs, and San Francisco’s BART
system. Restricting the data population for rail-and-bus cities only to cities with new rail service
has enabled this study to focus on responding to rail opponents’ criticism of new rail projects.
For this analysis we focus on cities that have participated in the Federal Transit Administration’s
New Start program. This is a Federal government program that finances new "guideway" capital
investments, which includes both rail and bus rapid transit systems (FTA 2005). Most major new
rail and busway projects participate in this program. The following types of transit service were
included in this study:
Light Rail Transit (LRT) which generally consists of medium-size vehicles offering local service
using a combination of grade-separated and mixed traffic rail lines.
Rail Rapid Transit (RRT) which generally consists of larger vehicles offering inter-neighborhood
service operating on grade-separated rail lines (often underground or elevated)
Regional Passenger Rail (RPR, commonly called “commuter rail”), which generally consists of
larger vehicles offering intercommunity service operating on grade-separated lines.
Bus Rapid Transit (BRT), which consists of high-quality bus services, often on grade-separated
busways, and which generally offer intercommunity express services, usually complemented by
improved local services and other amenities.
Only systems that functioned as line-haul commutation-type lines at least five miles in length in
these urban areas were included. Small circulator or shuttle services, special-purpose systems
(such as airport peoplemovers), and recreational operations, were excluded.
Performance is evaluated based on changes in total and per capita transit system ridership, and
financial performance. To avoid problems such as those exhibited in O’Toole’s studies, the study
focuses on the period 1996-2003, an extended period during which the majority of new rail
systems have operated.
Data is from the National Transit Database (NTD), available on the U.S. Federal Transit
Administration website (FTA, 2003). The NTD Annual Reports are based on mandatory
information provided by all transit agencies in a standardized format, and includes profiles for
each transit agency filing an NTD annual report for the 2003 report year. A profile consists of
general, financial, and modal data, as well as performance and trend indicators. For the 2003
report year 622 transit agencies submitted reports to the NTD. The NTD also provides
population data for UZA (urbanized area) population. The raw data was adjusted to avoid
double-counting population in metropolitan areas with more than one transit system.
Urban area size is an important consideration since, all else being equal, transit performance and
ridership tends to increase with city size. The cities operating both rail and bus examined in this
study are generally over one million in population, whereas the group of bus-only cities includes
some that are below a million. However, since most of the U.S.A.’s largest cities now have some
form of rail transit, limiting the study only to cities with rough population parity would reduce
the bus-only group to a number so small that comparative results would be questionable on that
Evaluating New Start Program Performance Victoria Transport Policy Institute
7
basis. This is offset by the fact that many of the bus-only cities are growing rapidly and so their
transit ridership would probably have grown significantly regardless of what type of transit
service were offered.
In addition, while there are minor performance differences on the basis of size, these seem
generally marginal. For example, Montgomery, the smallest of the bus-only areas in the analysis
with a 2003 UZA population of 196,892, exhibited an average operating expense in that year of
$4.71/trip and $1.14/passenger-mile; in comparison, Columbus, a much larger bus-only city with
a UZA population of 1,133,193, exhibited average expenses of $4.20/trip and $1.11/passenger-
mile. While some weaknesses in any comparison can be expected, these differentials do not seem
sufficient to disqualify the comprehensive analysis of a wide variety of urban areas performed in
the course of this study.
Almost all the new rail systems were in operation over the entire period examined (1996-2003).
Exceptions are Salt Lake City’s TRAX LRT system and Seattle-Tacoma’s Sounder regional
passenger (“commuter”) rail system, both launched in 2000; accordingly, both those urban areas
have been excluded. In some cases, urban areas jointly served by new rail starts (e.g., Los
Angeles-San Bernardino-Riverside and Miami-Ft. Lauderdale) have been combined in this
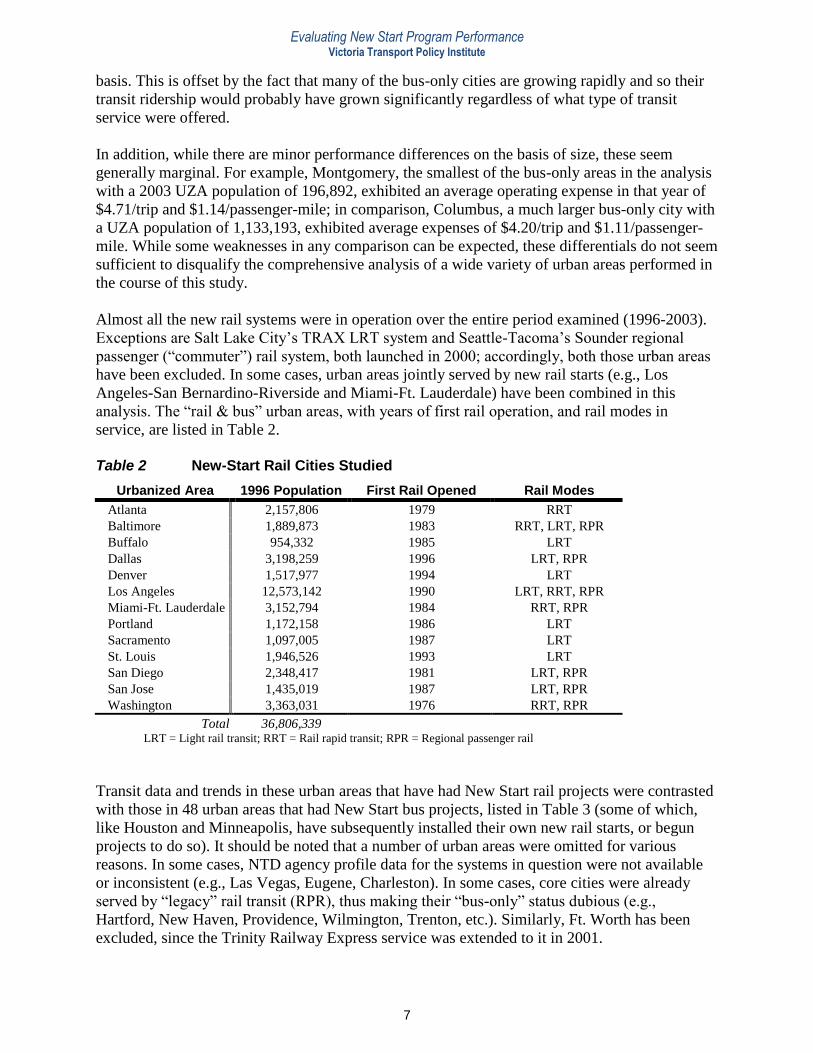
analysis. The “rail & bus” urban areas, with years of first rail operation, and rail modes in
service, are listed in Table 2.
Table 2 New-Start Rail Cities Studied
Urbanized Area 1996 Population First Rail Opened Rail Modes
Atlanta 2,157,806 1979 RRT
Baltimore 1,889,873 1983 RRT, LRT, RPR
Buffalo 954,332 1985 LRT
Dallas 3,198,259 1996 LRT, RPR
Denver 1,517,977 1994 LRT
Los Angeles 12,573,142 1990 LRT, RRT, RPR
Miami-Ft. Lauderdale 3,152,794 1984 RRT, RPR
Portland 1,172,158 1986 LRT
Sacramento 1,097,005 1987 LRT
St. Louis 1,946,526 1993 LRT
San Diego 2,348,417 1981 LRT, RPR
San Jose 1,435,019 1987 LRT, RPR
Washington 3,363,031 1976 RRT, RPR
Total 36,806,339 LRT = Light rail transit; RRT = Rail rapid transit; RPR = Regional passenger rail
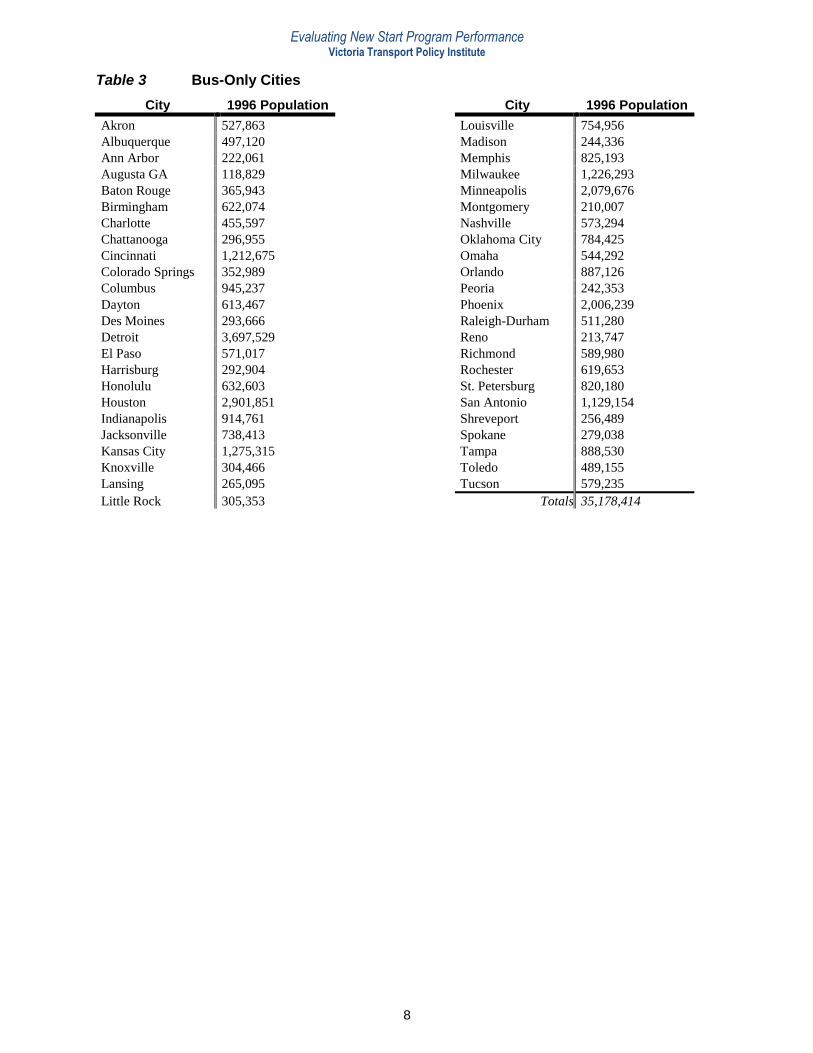
Transit data and trends in these urban areas that have had New Start rail projects were contrasted
with those in 48 urban areas that had New Start bus projects, listed in Table 3 (some of which,
like Houston and Minneapolis, have subsequently installed their own new rail starts, or begun
projects to do so). It should be noted that a number of urban areas were omitted for various
reasons. In some cases, NTD agency profile data for the systems in question were not available
or inconsistent (e.g., Las Vegas, Eugene, Charleston). In some cases, core cities were already
served by “legacy” rail transit (RPR), thus making their “bus-only” status dubious (e.g.,
Hartford, New Haven, Providence, Wilmington, Trenton, etc.). Similarly, Ft. Worth has been
excluded, since the Trinity Railway Express service was extended to it in 2001.
Evaluating New Start Program Performance Victoria Transport Policy Institute
8
Table 3 Bus-Only Cities
City 1996 Population City 1996 Population
Akron 527,863 Louisville 754,956
Albuquerque 497,120 Madison 244,336
Ann Arbor 222,061 Memphis 825,193
Augusta GA 118,829 Milwaukee 1,226,293
Baton Rouge 365,943 Minneapolis 2,079,676
Birmingham 622,074 Montgomery 210,007
Charlotte 455,597 Nashville 573,294
Chattanooga 296,955 Oklahoma City 784,425
Cincinnati 1,212,675 Omaha 544,292
Colorado Springs 352,989 Orlando 887,126
Columbus 945,237 Peoria 242,353
Dayton 613,467 Phoenix 2,006,239
Des Moines 293,666 Raleigh-Durham 511,280
Detroit 3,697,529 Reno 213,747
El Paso 571,017 Richmond 589,980
Harrisburg 292,904 Rochester 619,653
Honolulu 632,603 St. Petersburg 820,180
Houston 2,901,851 San Antonio 1,129,154
Indianapolis 914,761 Shreveport 256,489
Jacksonville 738,413 Spokane 279,038
Kansas City 1,275,315 Tampa 888,530
Knoxville 304,466 Toledo 489,155
Lansing 265,095 Tucson 579,235
Little Rock 305,353 Totals 35,178,414
Evaluating New Start Program Performance Victoria Transport Policy Institute
9
Study Results: Urban Area Groups The two groups show striking differences in performance, as summarized below. See the report
appendix for more detailed information on the data used.
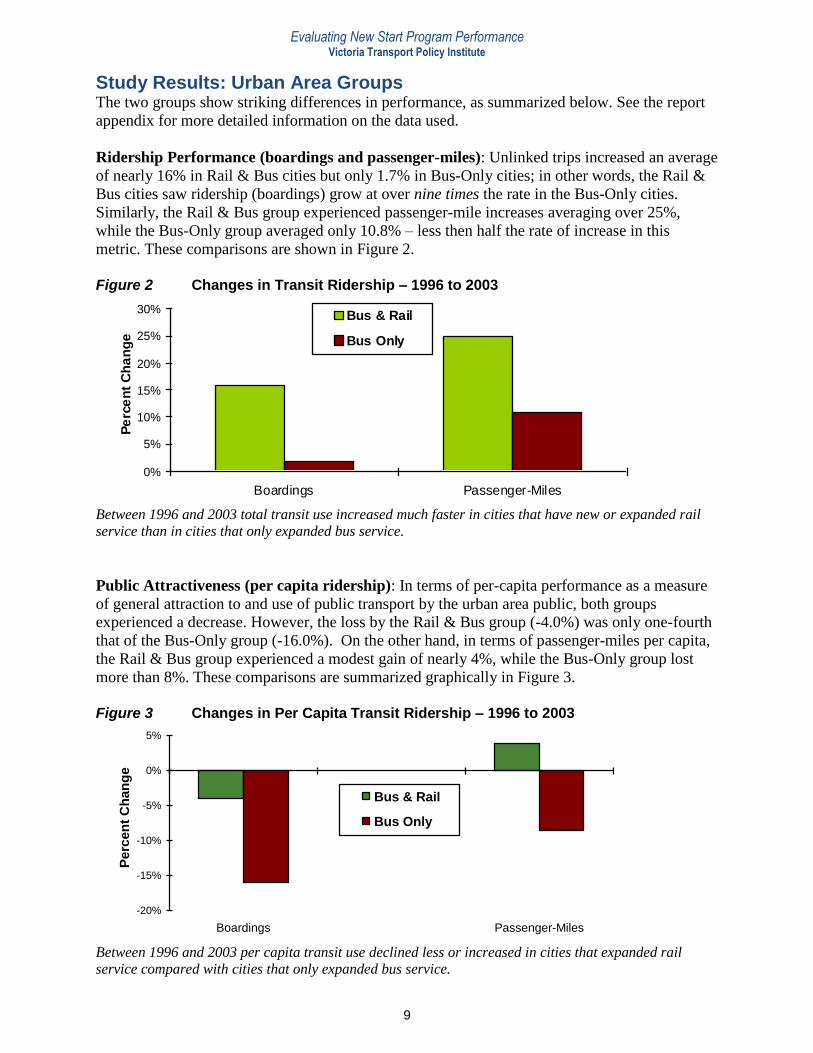
Ridership Performance (boardings and passenger-miles): Unlinked trips increased an average
of nearly 16% in Rail & Bus cities but only 1.7% in Bus-Only cities; in other words, the Rail &
Bus cities saw ridership (boardings) grow at over nine times the rate in the Bus-Only cities.
Similarly, the Rail & Bus group experienced passenger-mile increases averaging over 25%,
while the Bus-Only group averaged only 10.8% – less then half the rate of increase in this
metric. These comparisons are shown in Figure 2.
Figure 2 Changes in Transit Ridership – 1996 to 2003
0%
5%
10%
15%
20%
25%
30%
Boardings Passenger-Miles
Pe
rce
nt
Ch
an
ge
Bus & Rail
Bus Only
Between 1996 and 2003 total transit use increased much faster in cities that have new or expanded rail
service than in cities that only expanded bus service.
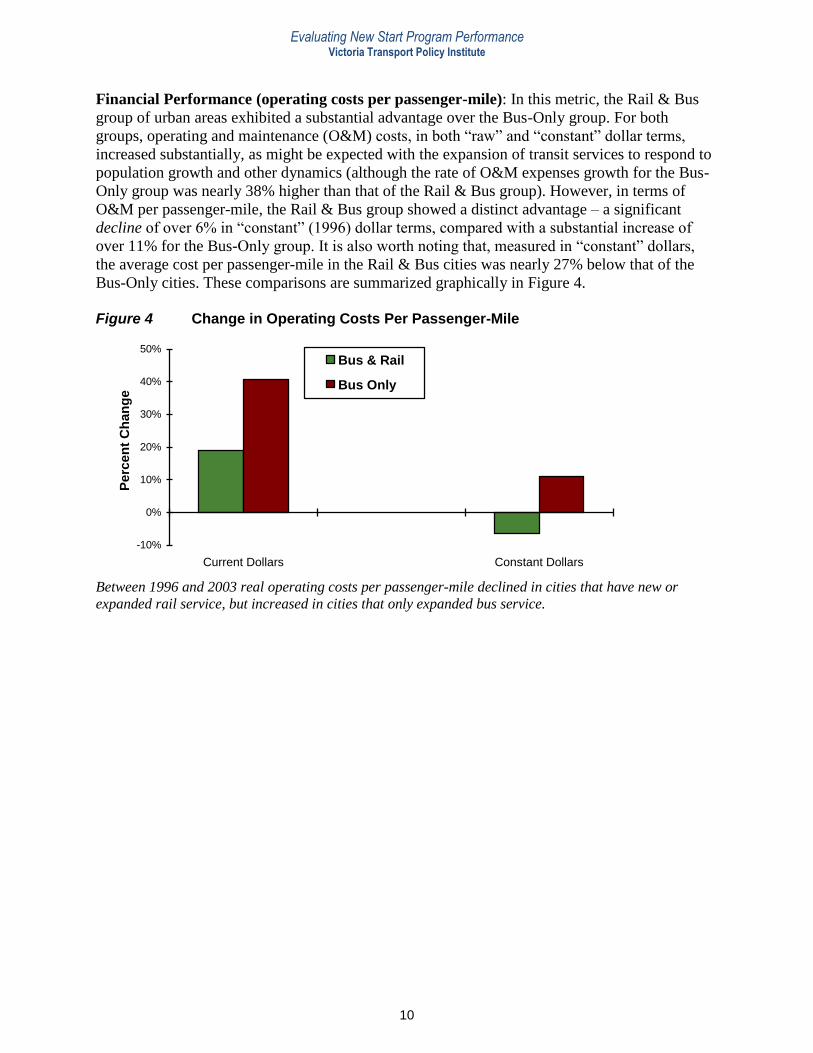
Public Attractiveness (per capita ridership): In terms of per-capita performance as a measure
of general attraction to and use of public transport by the urban area public, both groups
experienced a decrease. However, the loss by the Rail & Bus group (-4.0%) was only one-fourth
that of the Bus-Only group (-16.0%). On the other hand, in terms of passenger-miles per capita,
the Rail & Bus group experienced a modest gain of nearly 4%, while the Bus-Only group lost
more than 8%. These comparisons are summarized graphically in Figure 3.
Figure 3 Changes in Per Capita Transit Ridership – 1996 to 2003
-20%
-15%
-10%
-5%
0%
5%
Boardings Passenger-Miles
Pe
rcen
t C
han
ge
Bus & Rail
Bus Only
Between 1996 and 2003 per capita transit use declined less or increased in cities that expanded rail
service compared with cities that only expanded bus service.
Evaluating New Start Program Performance Victoria Transport Policy Institute
10
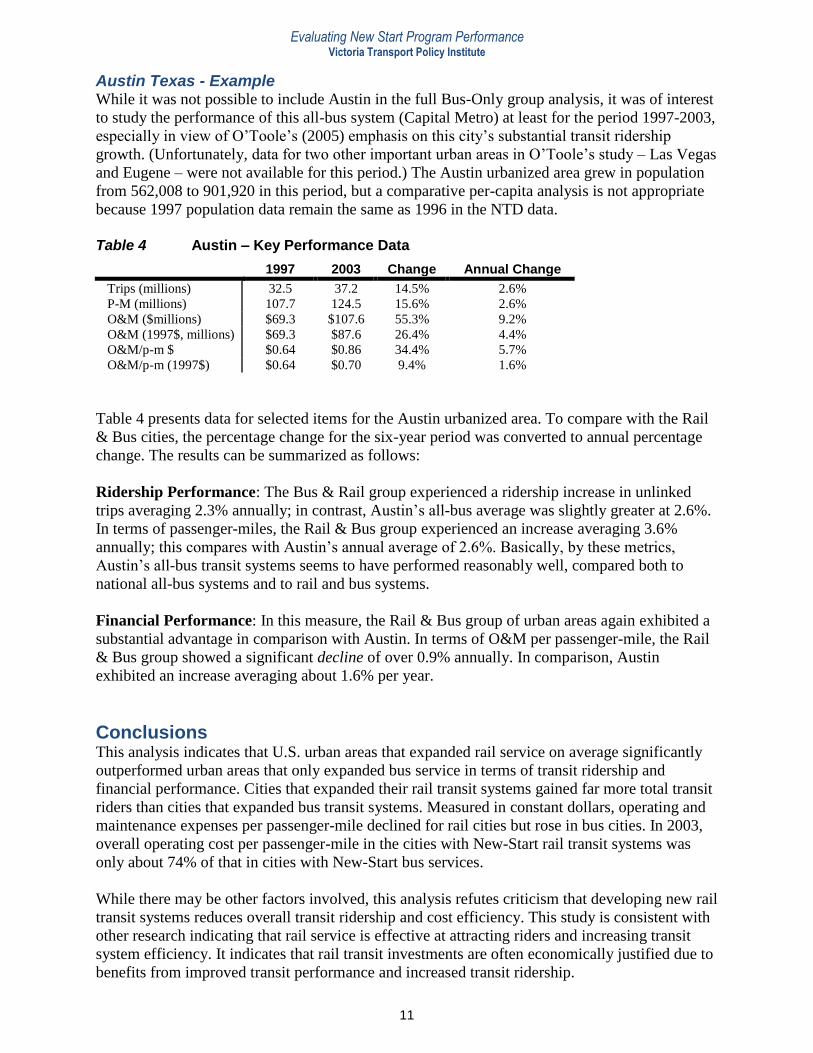
Financial Performance (operating costs per passenger-mile): In this metric, the Rail & Bus
group of urban areas exhibited a substantial advantage over the Bus-Only group. For both
groups, operating and maintenance (O&M) costs, in both “raw” and “constant” dollar terms,
increased substantially, as might be expected with the expansion of transit services to respond to
population growth and other dynamics (although the rate of O&M expenses growth for the Bus-
Only group was nearly 38% higher than that of the Rail & Bus group). However, in terms of
O&M per passenger-mile, the Rail & Bus group showed a distinct advantage – a significant
decline of over 6% in “constant” (1996) dollar terms, compared with a substantial increase of
over 11% for the Bus-Only group. It is also worth noting that, measured in “constant” dollars,
the average cost per passenger-mile in the Rail & Bus cities was nearly 27% below that of the
Bus-Only cities. These comparisons are summarized graphically in Figure 4.
Figure 4 Change in Operating Costs Per Passenger-Mile
-10%
0%
10%
20%
30%
40%
50%
Current Dollars Constant Dollars
Pe
rce
nt
Ch
an
ge
Bus & Rail
Bus Only
Between 1996 and 2003 real operating costs per passenger-mile declined in cities that have new or
expanded rail service, but increased in cities that only expanded bus service.
Evaluating New Start Program Performance Victoria Transport Policy Institute
11
Austin Texas - Example While it was not possible to include Austin in the full Bus-Only group analysis, it was of interest
to study the performance of this all-bus system (Capital Metro) at least for the period 1997-2003,
especially in view of O’Toole’s (2005) emphasis on this city’s substantial transit ridership
growth. (Unfortunately, data for two other important urban areas in O’Toole’s study – Las Vegas
and Eugene – were not available for this period.) The Austin urbanized area grew in population
from 562,008 to 901,920 in this period, but a comparative per-capita analysis is not appropriate
because 1997 population data remain the same as 1996 in the NTD data.
Table 4 Austin – Key Performance Data
1997 2003 Change Annual Change
Trips (millions) 32.5 37.2 14.5% 2.6%
P-M (millions) 107.7 124.5 15.6% 2.6%
O&M ($millions) $69.3 $107.6 55.3% 9.2%
O&M (1997$, millions) $69.3 $87.6 26.4% 4.4%
O&M/p-m $ $0.64 $0.86 34.4% 5.7%
O&M/p-m (1997$) $0.64 $0.70 9.4% 1.6%
Table 4 presents data for selected items for the Austin urbanized area. To compare with the Rail
& Bus cities, the percentage change for the six-year period was converted to annual percentage
change. The results can be summarized as follows:
Ridership Performance: The Bus & Rail group experienced a ridership increase in unlinked
trips averaging 2.3% annually; in contrast, Austin’s all-bus average was slightly greater at 2.6%.
In terms of passenger-miles, the Rail & Bus group experienced an increase averaging 3.6%
annually; this compares with Austin’s annual average of 2.6%. Basically, by these metrics,
Austin’s all-bus transit systems seems to have performed reasonably well, compared both to
national all-bus systems and to rail and bus systems.
Financial Performance: In this measure, the Rail & Bus group of urban areas again exhibited a
substantial advantage in comparison with Austin. In terms of O&M per passenger-mile, the Rail
& Bus group showed a significant decline of over 0.9% annually. In comparison, Austin
exhibited an increase averaging about 1.6% per year.
Conclusions This analysis indicates that U.S. urban areas that expanded rail service on average significantly
outperformed urban areas that only expanded bus service in terms of transit ridership and
financial performance. Cities that expanded their rail transit systems gained far more total transit
riders than cities that expanded bus transit systems. Measured in constant dollars, operating and
maintenance expenses per passenger-mile declined for rail cities but rose in bus cities. In 2003,
overall operating cost per passenger-mile in the cities with New-Start rail transit systems was
only about 74% of that in cities with New-Start bus services.
While there may be other factors involved, this analysis refutes criticism that developing new rail
transit systems reduces overall transit ridership and cost efficiency. This study is consistent with
other research indicating that rail service is effective at attracting riders and increasing transit
system efficiency. It indicates that rail transit investments are often economically justified due to
benefits from improved transit performance and increased transit ridership.
Evaluating New Start Program Performance Victoria Transport Policy Institute
12
References
Abt Associates (2010), Research on Factors Relating to Density and Climate Change, National Association
of Home Builders (www.nahb.org); www.nahb.org/fileUpload_details.aspx?contentID=139993.
Nathaniel Baum-Snow and Matthew E. Kahn (2005), The Effects of Urban Rail Transit Expansions: Evidence
from Sixteen Cities, 1970 to 2000, Brookings Papers on Urban Affairs
(www.econ.brown.edu/fac/Nathaniel_Baum-Snow/brook_final.pdf).
Antonio M. Bento, Maureen L. Cropper, Ahmed Mushfiq Mobarak and Katja Vinha (2003), The Impact of
Urban Spatial Structure on Travel Demand in the United States, World Bank Group Working Paper 2007,
World Bank (http://econ.worldbank.org/files/24989_wps3007.pdf).
Nate Berg (2012), Boosting Ridership by Replacing Buses With Rail, Atlantic Cities
(www.theatlanticcities.com); at www.theatlanticcities.com/commute/2012/09/boosting-ridership-replacing-
buses-rail/3222.
Eric Bruun (2005), Comparison of BRT and LRT Operating Costs Using a Parametric Cost Model,
Transportation Research Board Annual Meeting (www.trb.org).
Alasdair Cain, Jennifer Flynn, and Mike McCourt (2009), Quantifying the Importance of Image and
Perception to Bus Rapid Transit, National Center for Transit Research (www.nctr.usf.edu) for the Federal
Transit Administration: at www.nbrti.org/docs/pdf/NBRTI%20-%20BRT%20Image%20Study%20-
%20March%202009_Final%20Draft_highres.pdf.
Graham Currie and Alexa Delbosc (2013), “Exploring Comparative Ridership Drivers of Bus Rapid Transit
and Light Rail Transit Routes,” Journal of Public Transportation, Vol. 16, No. 2, pp. 47-65; at
www.nctr.usf.edu/wp-content/uploads/2013/07/16.2_currie.pdf.
Leroy W. Demery, Jr. (2005), The Rail 'Economy of Scale' Effect, PublicTransit.US
(http://publictransit.us/index.php?itemid=40).
Leroy W. Demery, Jr. and Michael D. Setty (2005), Portland and Seattle Transit Operating Cost Alternative
Strategies Compared, PublicTransit.US
(www.publictransit.us/ptlibrary/specialreports/sr6.PortlandvsSeattle.htm).
Yonah Freemark (2014), Have U.S. Light Rail Systems Been Worth the Investment? Atlantic Cities
(www.theatlanticcities.com); at www.theatlanticcities.com/commute/2014/04/have-us-light-rail-systems-
been-worth-investment/8838.
FTA (2003), National Transit Database, Transit Agency Profiles, Federal Transit Administration
(www.fta.gov).
FTA (2005), New Starts Project Planning & Development: Program Overview, Federal Transit
Administration (www.fta.dot.gov/16205_ENG_HTML.htm).
Carmen Hass-Klau, Graham Crampton, Carsten Biereth & Volker Deutsch (2003), Bus or Light Rail: Making
The Right Choice, Environmental and Transportation Planning (www.etphassklau.co.uk).
Carmen Hass-Klau, Graham Crampton and Rabia Benjari (2004), Economic Impact of Light Rail: The Results
Of 15 Urban Areas In France, Germany, UK and North America, Environmental & Transport Planning
(http://etphassklau.co.uk).
Lyndon Henry (2006), Comparative Performance of Public Transport in The US: New-Start Rail Cities vs.
Bus-Only Cities, to be presented at the Joint International Light Rail Conference held 9-11 April 2006, St.
Evaluating New Start Program Performance Victoria Transport Policy Institute
13
Louis, Missouri, Sponsored by The Transportation Research Board, The International Union of Public
Transport and the American Transportation Association.
Lyndon Henry and Dave Dobbs (2013), Comparative Examination of New Start Light Rail Transit, Light
Railway, and Bus Rapid Transit Services Opened from 2000, Sustaining the Metropolis LRT and Streetcars
for Super Cities, 12th National Light Rail Conference, Transportation Circular E-C177, Transportation
Research Board (www.trb.org); at http://onlinepubs.trb.org/onlinepubs/circulars/ec177.pdf.
David A. Hensher (2007), Bus Transport: Economics, Policy and Planning, Research in Transportation
Economics Vol. 18, Elsevier (www.elsevier.com).
Yonah Freemark (2010), Transit Mode Share Trends Looking Steady; Rail Appears to Encourage Non-
Automobile Commutes, The Transport Politic (www.thetransportpolitic.com); at http://tinyurl.com/k22yt75.
Jeff Kenworthy (2008), “An International Review of The Significance of Rail in Developing More
Sustainable Urban Transport Systems in Higher Income Cities,” World Transport Policy & Practice, Vol. 14,
No. 2 (www.eco-logica.co.uk); at www.eco-logica.co.uk/pdf/wtpp14.2.pdf.
Michael Kuby, Anthony Barranda and Christopher Upchurch (2004), “Factors Influencing Light-Rail Station
Boardings In The United States,” Transportation Research A, Vol. 38, No. 3 (www.elsevier.com/locate/tra),
March 2004, pp. 223-247.
Todd Litman (2004), Evaluating Public Transit Benefits and Costs, VTPI (www.vtpi.org/tranben.pdf).
Todd Litman (2005), Rail Transit In America: Comprehensive Evaluation of Benefits, Victoria Transport
Policy Institute (www.vtpi.org/railben.pdf).
Todd Litman (2006), “Evaluating Rail Transit Criticism”, VTPI (www.vtpi.org/railcrit.pdf).
Todd Litman (2011), The First Casualty of a Non-Existent War: Evaluating Claims of Unjustified
Restrictions on Automobile Use, and a Critique of 'Washingtons War On Cars And The Suburbs', Victoria
Transport Policy Institute (www.vtpi.org); at www.vtpi.org/carwars.pdf.
Arthur C. Nelson, Bruce Appleyard, Shyam Kannan, Reid Ewing, Matt Miller, Dejan Eskic (2013), “Bus
Rapid Transit and Economic Development: Case Study of the Eugene-Springfield BRT System,” Journal of
Public Transportation, Vol. 16, No. 3, pp. 39-57; at www.nctr.usf.edu/wp-
content/uploads/2013/10/JPT_16.3.pdf.
LRN (2005), “Randal O'Toole's ‘Great Rail Disaster’: Ideological Train Wreck Disguised as ‘Research
Study’", Light Rail Now (www.lightrailnow.org/features/f_lrt_2005-04.htm)
LRN (2006), Rail Transit vs. "Bus Rapid Transit": Comparative Success and Potential in Attracting
Ridership, Light Rail Now (www.lightrailnow.org/facts/fa_brt_2006-08a.htm).
Randal O'Toole (2004), “Great Rail Disasters: The Impact of Rail Transit on Urban Livability”, Issue Paper
1-2004, American Dream Coalition (http://americandreamcoalition.org/1-2004.pdf).
Randal O'Toole (2005), “Rail Disasters 2005: The Impact of Rail Transit on Transit Ridership – An update to
Great Rail Disasters”, American Dream Coalition (http://americandreamcoalition.org/RD2005.pdf)
Glenn Pascall (2001), The Rail Transit Debate; Assessment Of The Arguments, Discovery Institute
(www.discovery.org).
John L. Renne (2005), Transit-Oriented Development: Measuring Benefits, Analyzing Trends, And
Evaluating Policy, Dissertation, Rutgers State University; at http://gradworks.umi.com/31/95/3195744.html.
Evaluating New Start Program Performance Victoria Transport Policy Institute
14
John Schumann (2005), “Assessing Transit Changes in Columbus, Ohio, and Sacramento, California:
Progress and Survival in Two State Capitals, 1995-2002,” Transportation Research Record 1930, Transit:
Intermodal Transfer Facilities, Rail, Commuter Rail, Light Rail, and Major Activity Center Circulation
Systems, Transportation Research Board (www.trb.org), pp. 62-67.
Steer Davies Gleave (2005), What Light Rail Can Do For Cities: A Review of the Evidence, UK Passenger
Transport Executive Committee (www.pteg.net).
VTPI (2006), Online TDM Encyclopedia, Victoria Transport Policy Institute (www.vtpi.org).
Lloyd Wright and Walter Hook (2006), BRT Planning Guide, GTZ and the Institute for Transportation and
Development Policy (www.itdp.org/brt_guide.html).
Evaluating New Start Program Performance Victoria Transport Policy Institute
15
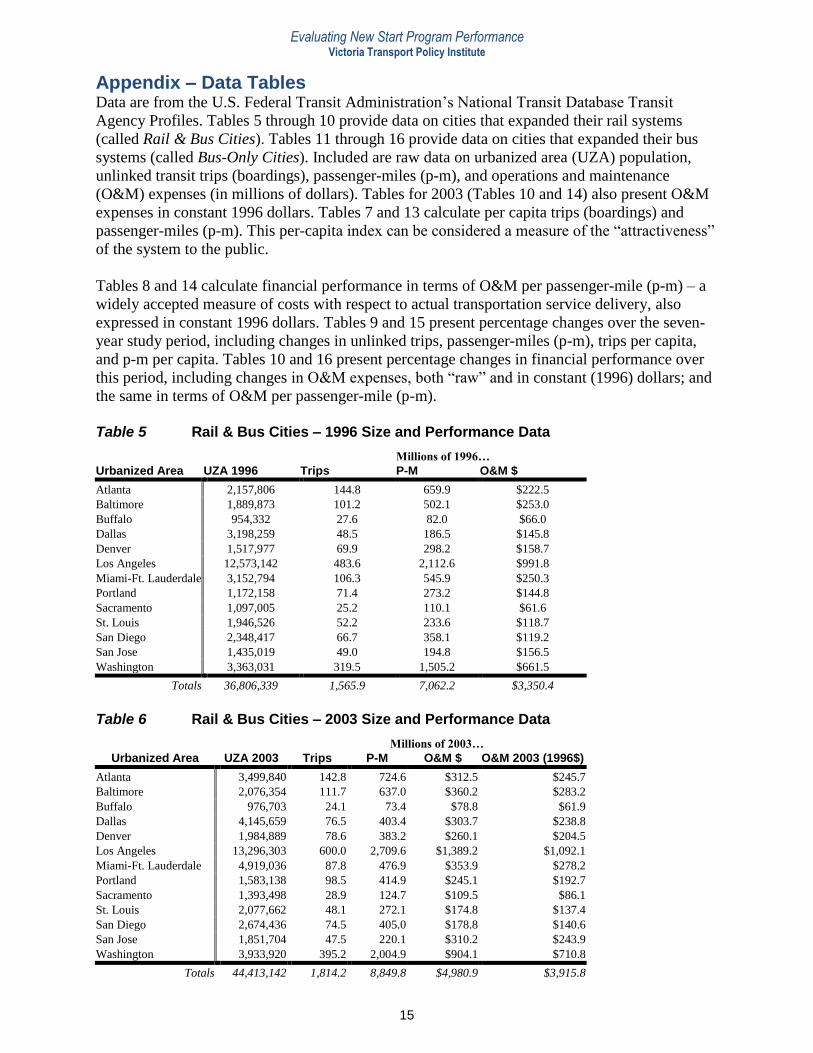
Appendix – Data Tables Data are from the U.S. Federal Transit Administration’s National Transit Database Transit
Agency Profiles. Tables 5 through 10 provide data on cities that expanded their rail systems
(called Rail & Bus Cities). Tables 11 through 16 provide data on cities that expanded their bus
systems (called Bus-Only Cities). Included are raw data on urbanized area (UZA) population,
unlinked transit trips (boardings), passenger-miles (p-m), and operations and maintenance
(O&M) expenses (in millions of dollars). Tables for 2003 (Tables 10 and 14) also present O&M
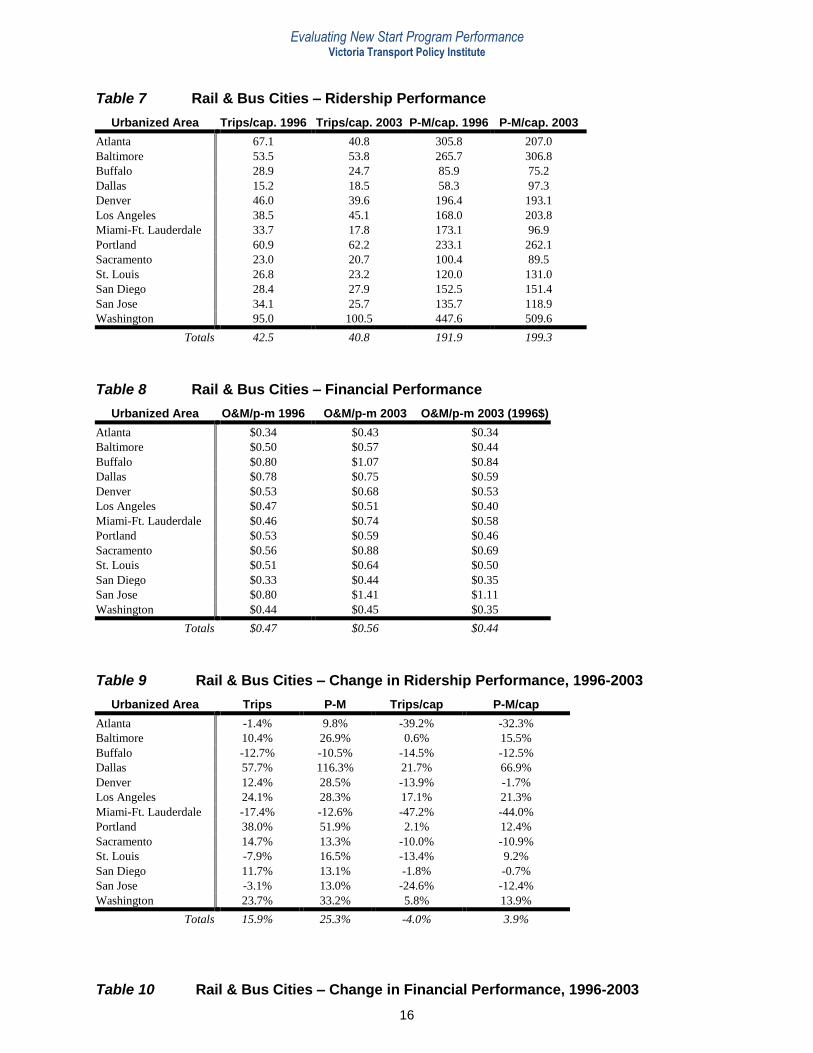
expenses in constant 1996 dollars. Tables 7 and 13 calculate per capita trips (boardings) and
passenger-miles (p-m). This per-capita index can be considered a measure of the “attractiveness”
of the system to the public.
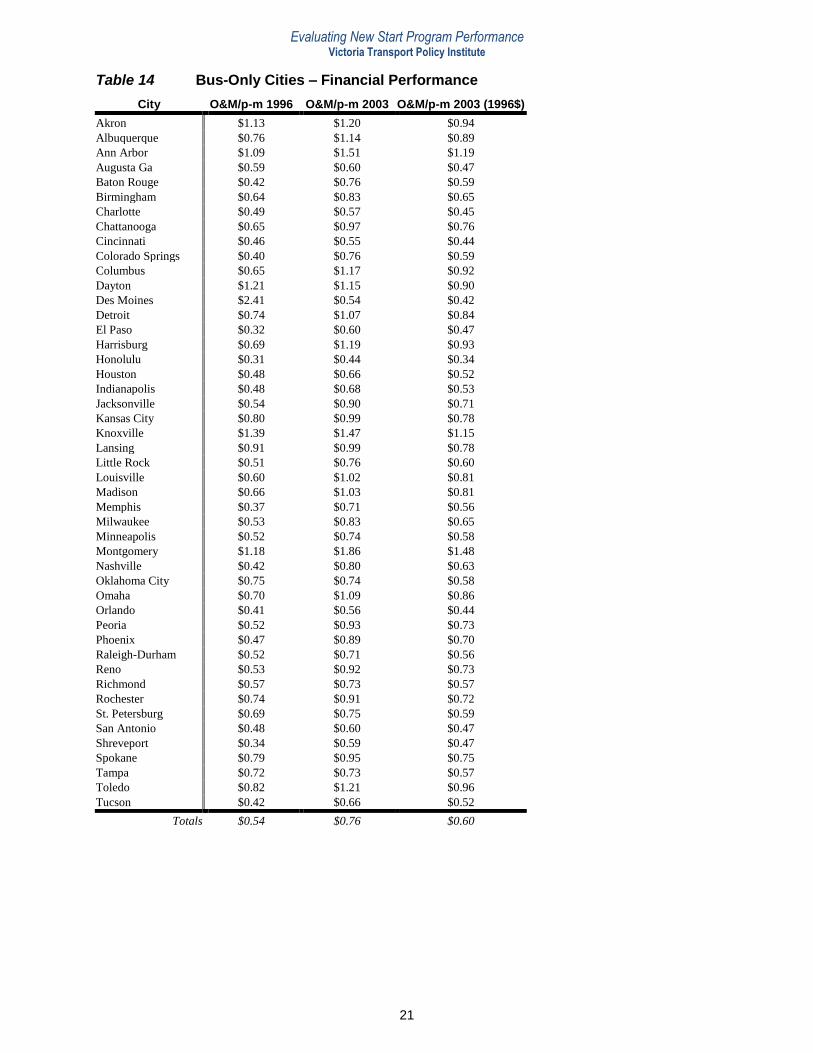
Tables 8 and 14 calculate financial performance in terms of O&M per passenger-mile (p-m) – a
widely accepted measure of costs with respect to actual transportation service delivery, also
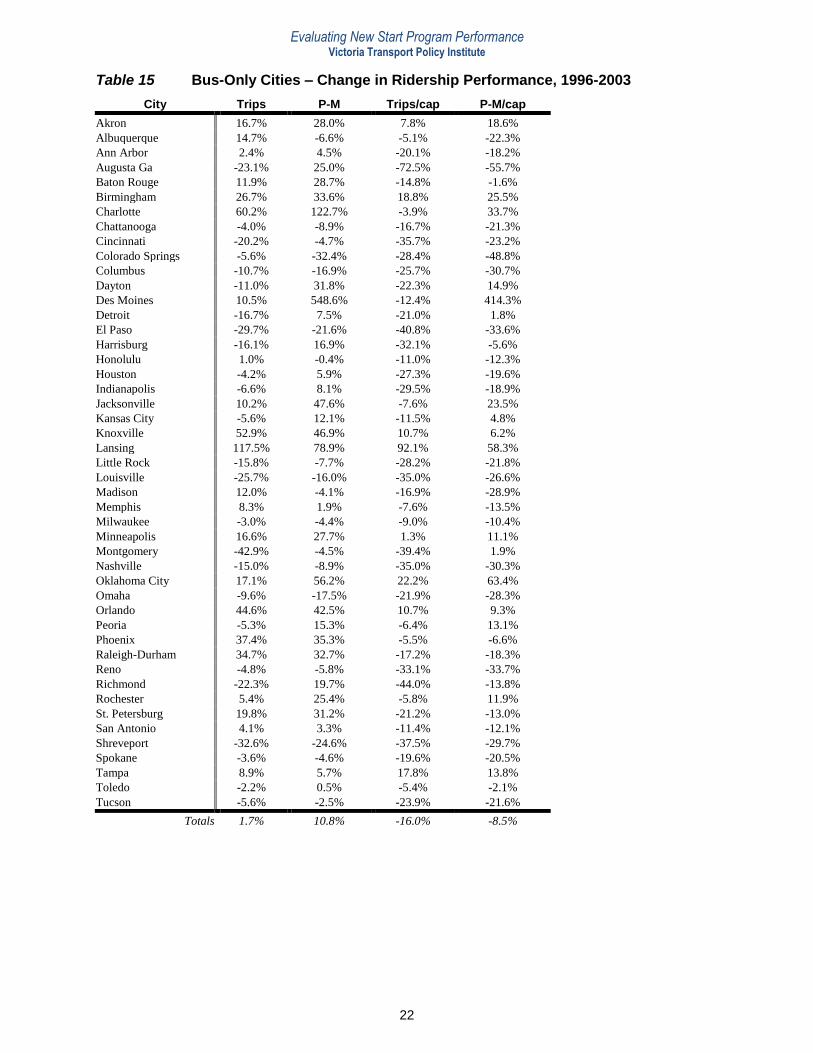
expressed in constant 1996 dollars. Tables 9 and 15 present percentage changes over the seven-
year study period, including changes in unlinked trips, passenger-miles (p-m), trips per capita,
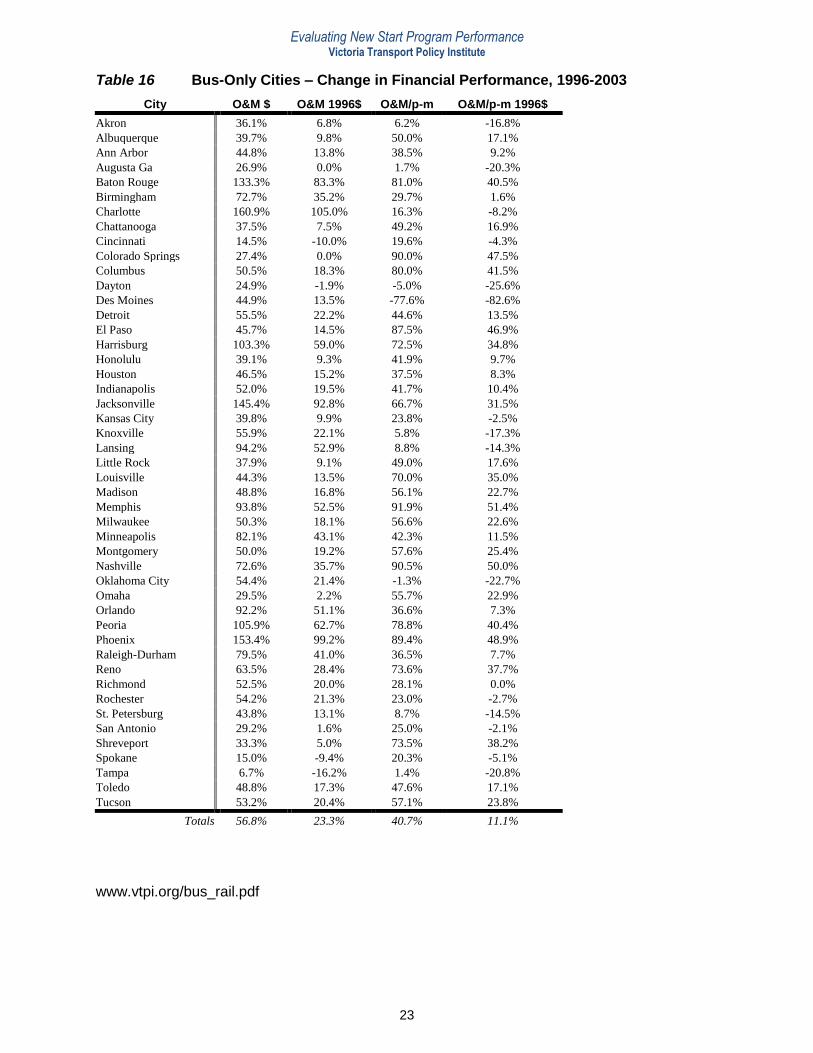
and p-m per capita. Tables 10 and 16 present percentage changes in financial performance over
this period, including changes in O&M expenses, both “raw” and in constant (1996) dollars; and
the same in terms of O&M per passenger-mile (p-m).
Table 5 Rail & Bus Cities – 1996 Size and Performance Data
Millions of 1996…
Urbanized Area UZA 1996 Trips P-M O&M $
Atlanta 2,157,806 144.8 659.9 $222.5
Baltimore 1,889,873 101.2 502.1 $253.0
Buffalo 954,332 27.6 82.0 $66.0
Dallas 3,198,259 48.5 186.5 $145.8
Denver 1,517,977 69.9 298.2 $158.7
Los Angeles 12,573,142 483.6 2,112.6 $991.8
Miami-Ft. Lauderdale 3,152,794 106.3 545.9 $250.3
Portland 1,172,158 71.4 273.2 $144.8
Sacramento 1,097,005 25.2 110.1 $61.6
St. Louis 1,946,526 52.2 233.6 $118.7
San Diego 2,348,417 66.7 358.1 $119.2
San Jose 1,435,019 49.0 194.8 $156.5
Washington 3,363,031 319.5 1,505.2 $661.5
Totals 36,806,339 1,565.9 7,062.2 $3,350.4
Table 6 Rail & Bus Cities – 2003 Size and Performance Data
Millions of 2003…
Urbanized Area UZA 2003 Trips P-M O&M $ O&M 2003 (1996$)
Atlanta 3,499,840 142.8 724.6 $312.5 $245.7
Baltimore 2,076,354 111.7 637.0 $360.2 $283.2
Buffalo 976,703 24.1 73.4 $78.8 $61.9
Dallas 4,145,659 76.5 403.4 $303.7 $238.8
Denver 1,984,889 78.6 383.2 $260.1 $204.5
Los Angeles 13,296,303 600.0 2,709.6 $1,389.2 $1,092.1
Miami-Ft. Lauderdale 4,919,036 87.8 476.9 $353.9 $278.2
Portland 1,583,138 98.5 414.9 $245.1 $192.7
Sacramento 1,393,498 28.9 124.7 $109.5 $86.1
St. Louis 2,077,662 48.1 272.1 $174.8 $137.4
San Diego 2,674,436 74.5 405.0 $178.8 $140.6
San Jose 1,851,704 47.5 220.1 $310.2 $243.9
Washington 3,933,920 395.2 2,004.9 $904.1 $710.8
Totals 44,413,142 1,814.2 8,849.8 $4,980.9 $3,915.8
Evaluating New Start Program Performance Victoria Transport Policy Institute
16
Table 7 Rail & Bus Cities – Ridership Performance
Urbanized Area Trips/cap. 1996 Trips/cap. 2003 P-M/cap. 1996 P-M/cap. 2003
Atlanta 67.1 40.8 305.8 207.0
Baltimore 53.5 53.8 265.7 306.8
Buffalo 28.9 24.7 85.9 75.2
Dallas 15.2 18.5 58.3 97.3
Denver 46.0 39.6 196.4 193.1
Los Angeles 38.5 45.1 168.0 203.8
Miami-Ft. Lauderdale 33.7 17.8 173.1 96.9
Portland 60.9 62.2 233.1 262.1
Sacramento 23.0 20.7 100.4 89.5
St. Louis 26.8 23.2 120.0 131.0
San Diego 28.4 27.9 152.5 151.4
San Jose 34.1 25.7 135.7 118.9
Washington 95.0 100.5 447.6 509.6
Totals 42.5 40.8 191.9 199.3
Table 8 Rail & Bus Cities – Financial Performance
Urbanized Area O&M/p-m 1996 O&M/p-m 2003 O&M/p-m 2003 (1996$)
Atlanta $0.34 $0.43 $0.34
Baltimore $0.50 $0.57 $0.44
Buffalo $0.80 $1.07 $0.84
Dallas $0.78 $0.75 $0.59
Denver $0.53 $0.68 $0.53
Los Angeles $0.47 $0.51 $0.40
Miami-Ft. Lauderdale $0.46 $0.74 $0.58
Portland $0.53 $0.59 $0.46
Sacramento $0.56 $0.88 $0.69
St. Louis $0.51 $0.64 $0.50
San Diego $0.33 $0.44 $0.35
San Jose $0.80 $1.41 $1.11
Washington $0.44 $0.45 $0.35
Totals $0.47 $0.56 $0.44
Table 9 Rail & Bus Cities – Change in Ridership Performance, 1996-2003
Urbanized Area Trips P-M Trips/cap P-M/cap
Atlanta -1.4% 9.8% -39.2% -32.3%
Baltimore 10.4% 26.9% 0.6% 15.5%
Buffalo -12.7% -10.5% -14.5% -12.5%
Dallas 57.7% 116.3% 21.7% 66.9%
Denver 12.4% 28.5% -13.9% -1.7%
Los Angeles 24.1% 28.3% 17.1% 21.3%
Miami-Ft. Lauderdale -17.4% -12.6% -47.2% -44.0%
Portland 38.0% 51.9% 2.1% 12.4%
Sacramento 14.7% 13.3% -10.0% -10.9%
St. Louis -7.9% 16.5% -13.4% 9.2%
San Diego 11.7% 13.1% -1.8% -0.7%
San Jose -3.1% 13.0% -24.6% -12.4%
Washington 23.7% 33.2% 5.8% 13.9%
Totals 15.9% 25.3% -4.0% 3.9%
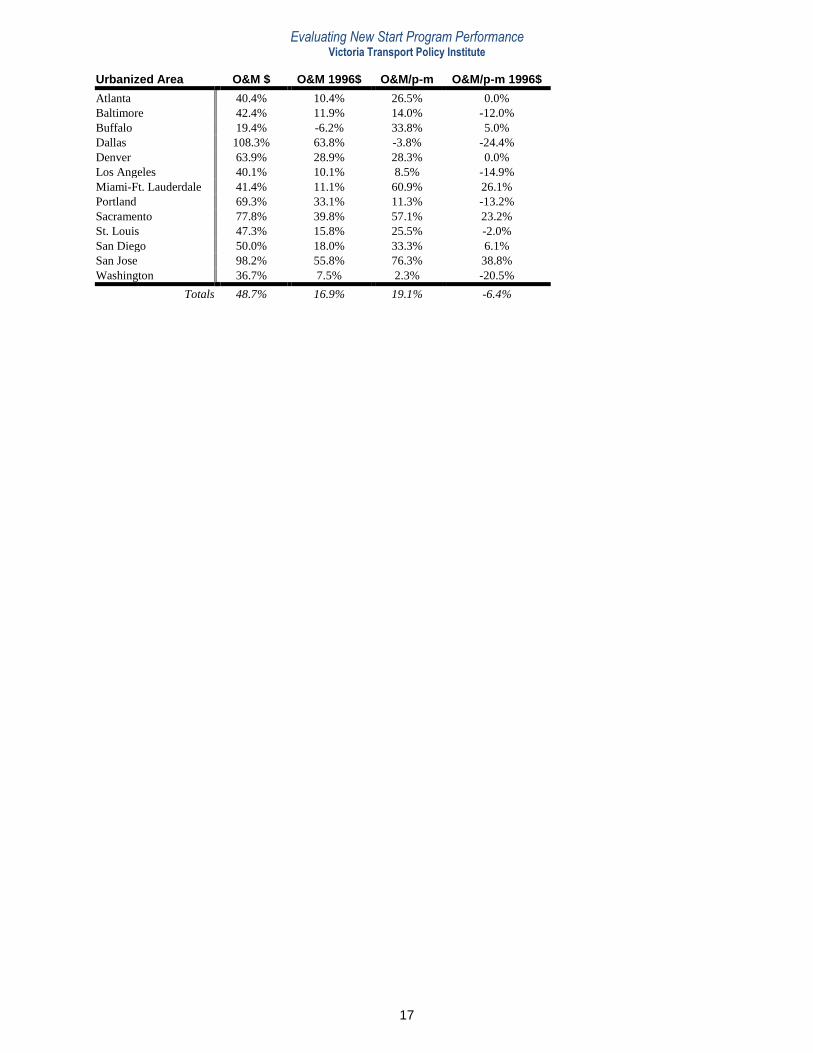
Table 10 Rail & Bus Cities – Change in Financial Performance, 1996-2003
Evaluating New Start Program Performance Victoria Transport Policy Institute
17
Urbanized Area O&M $ O&M 1996$ O&M/p-m O&M/p-m 1996$
Atlanta 40.4% 10.4% 26.5% 0.0%
Baltimore 42.4% 11.9% 14.0% -12.0%
Buffalo 19.4% -6.2% 33.8% 5.0%
Dallas 108.3% 63.8% -3.8% -24.4%
Denver 63.9% 28.9% 28.3% 0.0%
Los Angeles 40.1% 10.1% 8.5% -14.9%
Miami-Ft. Lauderdale 41.4% 11.1% 60.9% 26.1%
Portland 69.3% 33.1% 11.3% -13.2%
Sacramento 77.8% 39.8% 57.1% 23.2%
St. Louis 47.3% 15.8% 25.5% -2.0%
San Diego 50.0% 18.0% 33.3% 6.1%
San Jose 98.2% 55.8% 76.3% 38.8%
Washington 36.7% 7.5% 2.3% -20.5%
Totals 48.7% 16.9% 19.1% -6.4%
Evaluating New Start Program Performance Victoria Transport Policy Institute
18
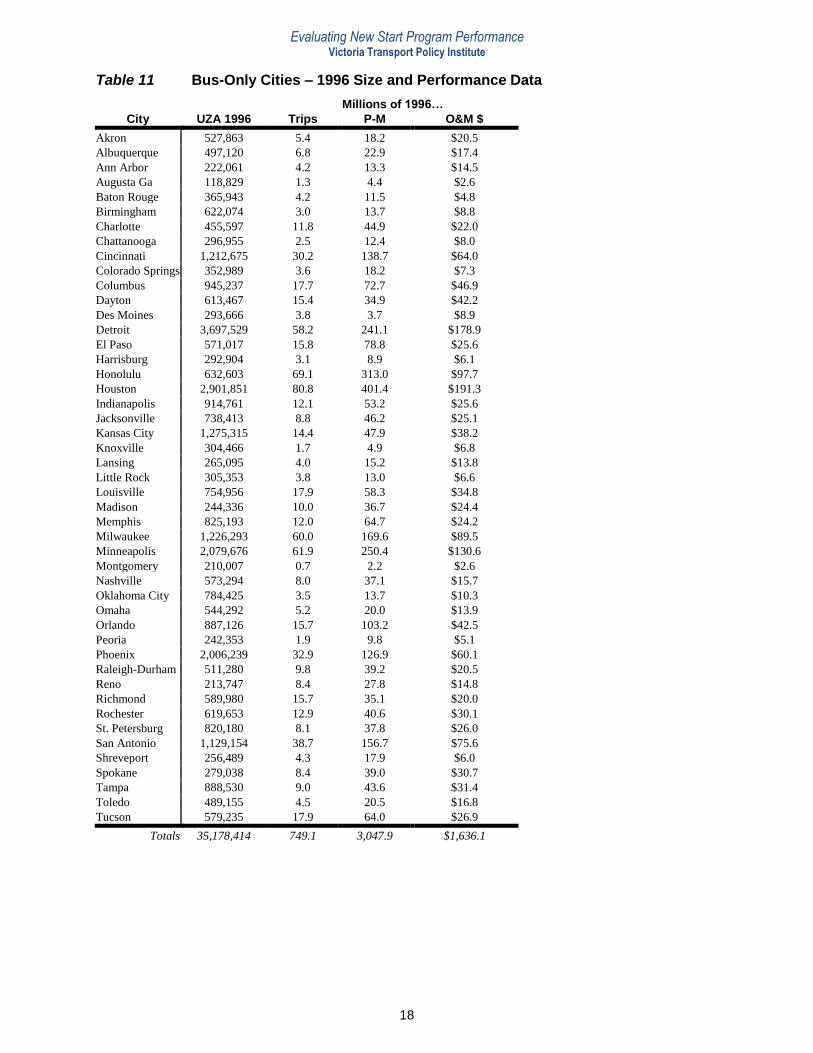
Table 11 Bus-Only Cities – 1996 Size and Performance Data
Millions of 1996…
City UZA 1996 Trips P-M O&M $
Akron 527,863 5.4 18.2 $20.5
Albuquerque 497,120 6.8 22.9 $17.4
Ann Arbor 222,061 4.2 13.3 $14.5
Augusta Ga 118,829 1.3 4.4 $2.6
Baton Rouge 365,943 4.2 11.5 $4.8
Birmingham 622,074 3.0 13.7 $8.8
Charlotte 455,597 11.8 44.9 $22.0
Chattanooga 296,955 2.5 12.4 $8.0
Cincinnati 1,212,675 30.2 138.7 $64.0
Colorado Springs 352,989 3.6 18.2 $7.3
Columbus 945,237 17.7 72.7 $46.9
Dayton 613,467 15.4 34.9 $42.2
Des Moines 293,666 3.8 3.7 $8.9
Detroit 3,697,529 58.2 241.1 $178.9
El Paso 571,017 15.8 78.8 $25.6
Harrisburg 292,904 3.1 8.9 $6.1
Honolulu 632,603 69.1 313.0 $97.7
Houston 2,901,851 80.8 401.4 $191.3
Indianapolis 914,761 12.1 53.2 $25.6
Jacksonville 738,413 8.8 46.2 $25.1
Kansas City 1,275,315 14.4 47.9 $38.2
Knoxville 304,466 1.7 4.9 $6.8
Lansing 265,095 4.0 15.2 $13.8
Little Rock 305,353 3.8 13.0 $6.6
Louisville 754,956 17.9 58.3 $34.8
Madison 244,336 10.0 36.7 $24.4
Memphis 825,193 12.0 64.7 $24.2
Milwaukee 1,226,293 60.0 169.6 $89.5
Minneapolis 2,079,676 61.9 250.4 $130.6
Montgomery 210,007 0.7 2.2 $2.6
Nashville 573,294 8.0 37.1 $15.7
Oklahoma City 784,425 3.5 13.7 $10.3
Omaha 544,292 5.2 20.0 $13.9
Orlando 887,126 15.7 103.2 $42.5
Peoria 242,353 1.9 9.8 $5.1
Phoenix 2,006,239 32.9 126.9 $60.1
Raleigh-Durham 511,280 9.8 39.2 $20.5
Reno 213,747 8.4 27.8 $14.8
Richmond 589,980 15.7 35.1 $20.0
Rochester 619,653 12.9 40.6 $30.1
St. Petersburg 820,180 8.1 37.8 $26.0
San Antonio 1,129,154 38.7 156.7 $75.6
Shreveport 256,489 4.3 17.9 $6.0
Spokane 279,038 8.4 39.0 $30.7
Tampa 888,530 9.0 43.6 $31.4
Toledo 489,155 4.5 20.5 $16.8
Tucson 579,235 17.9 64.0 $26.9
Totals 35,178,414 749.1 3,047.9 $1,636.1
Evaluating New Start Program Performance Victoria Transport Policy Institute
19
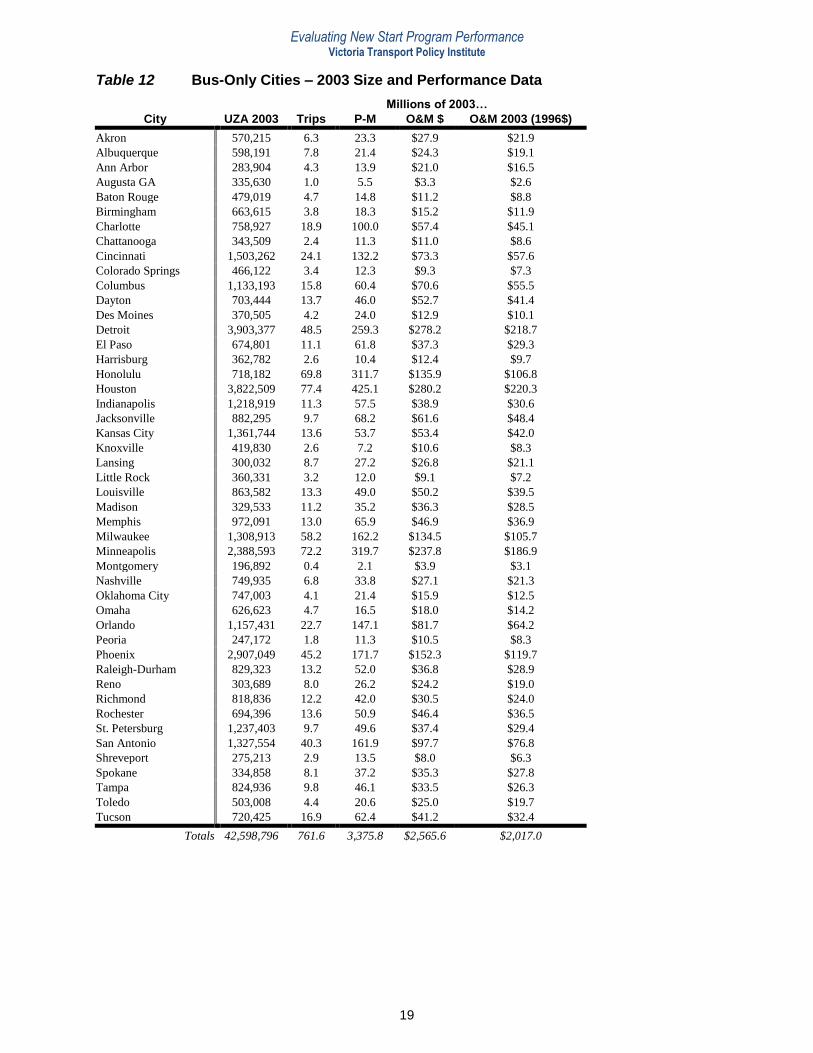
Table 12 Bus-Only Cities – 2003 Size and Performance Data
Millions of 2003…
City UZA 2003 Trips P-M O&M $ O&M 2003 (1996$)
Akron 570,215 6.3 23.3 $27.9 $21.9
Albuquerque 598,191 7.8 21.4 $24.3 $19.1
Ann Arbor 283,904 4.3 13.9 $21.0 $16.5
Augusta GA 335,630 1.0 5.5 $3.3 $2.6
Baton Rouge 479,019 4.7 14.8 $11.2 $8.8
Birmingham 663,615 3.8 18.3 $15.2 $11.9
Charlotte 758,927 18.9 100.0 $57.4 $45.1
Chattanooga 343,509 2.4 11.3 $11.0 $8.6
Cincinnati 1,503,262 24.1 132.2 $73.3 $57.6
Colorado Springs 466,122 3.4 12.3 $9.3 $7.3
Columbus 1,133,193 15.8 60.4 $70.6 $55.5
Dayton 703,444 13.7 46.0 $52.7 $41.4
Des Moines 370,505 4.2 24.0 $12.9 $10.1
Detroit 3,903,377 48.5 259.3 $278.2 $218.7
El Paso 674,801 11.1 61.8 $37.3 $29.3
Harrisburg 362,782 2.6 10.4 $12.4 $9.7
Honolulu 718,182 69.8 311.7 $135.9 $106.8
Houston 3,822,509 77.4 425.1 $280.2 $220.3
Indianapolis 1,218,919 11.3 57.5 $38.9 $30.6
Jacksonville 882,295 9.7 68.2 $61.6 $48.4
Kansas City 1,361,744 13.6 53.7 $53.4 $42.0
Knoxville 419,830 2.6 7.2 $10.6 $8.3
Lansing 300,032 8.7 27.2 $26.8 $21.1
Little Rock 360,331 3.2 12.0 $9.1 $7.2
Louisville 863,582 13.3 49.0 $50.2 $39.5
Madison 329,533 11.2 35.2 $36.3 $28.5
Memphis 972,091 13.0 65.9 $46.9 $36.9
Milwaukee 1,308,913 58.2 162.2 $134.5 $105.7
Minneapolis 2,388,593 72.2 319.7 $237.8 $186.9
Montgomery 196,892 0.4 2.1 $3.9 $3.1
Nashville 749,935 6.8 33.8 $27.1 $21.3
Oklahoma City 747,003 4.1 21.4 $15.9 $12.5
Omaha 626,623 4.7 16.5 $18.0 $14.2
Orlando 1,157,431 22.7 147.1 $81.7 $64.2
Peoria 247,172 1.8 11.3 $10.5 $8.3
Phoenix 2,907,049 45.2 171.7 $152.3 $119.7
Raleigh-Durham 829,323 13.2 52.0 $36.8 $28.9
Reno 303,689 8.0 26.2 $24.2 $19.0
Richmond 818,836 12.2 42.0 $30.5 $24.0
Rochester 694,396 13.6 50.9 $46.4 $36.5
St. Petersburg 1,237,403 9.7 49.6 $37.4 $29.4
San Antonio 1,327,554 40.3 161.9 $97.7 $76.8
Shreveport 275,213 2.9 13.5 $8.0 $6.3
Spokane 334,858 8.1 37.2 $35.3 $27.8
Tampa 824,936 9.8 46.1 $33.5 $26.3
Toledo 503,008 4.4 20.6 $25.0 $19.7
Tucson 720,425 16.9 62.4 $41.2 $32.4
Totals 42,598,796 761.6 3,375.8 $2,565.6 $2,017.0
Evaluating New Start Program Performance Victoria Transport Policy Institute
20
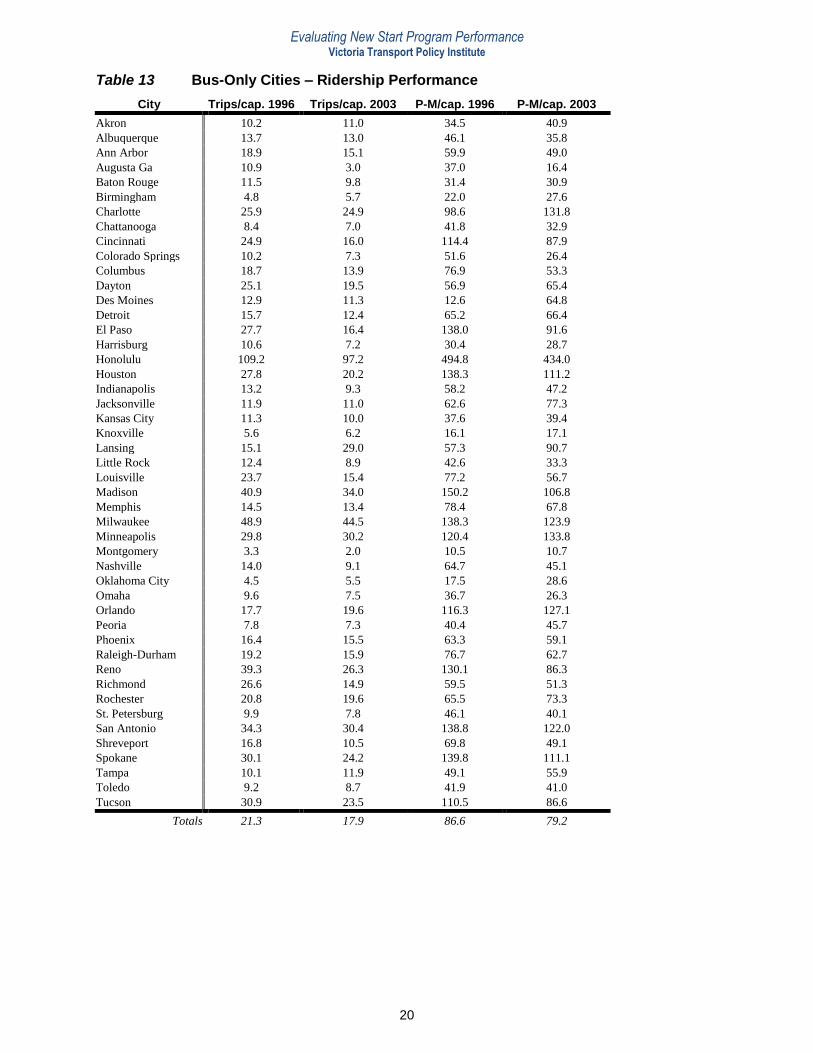
Table 13 Bus-Only Cities – Ridership Performance
City Trips/cap. 1996 Trips/cap. 2003 P-M/cap. 1996 P-M/cap. 2003
Akron 10.2 11.0 34.5 40.9
Albuquerque 13.7 13.0 46.1 35.8
Ann Arbor 18.9 15.1 59.9 49.0
Augusta Ga 10.9 3.0 37.0 16.4
Baton Rouge 11.5 9.8 31.4 30.9
Birmingham 4.8 5.7 22.0 27.6
Charlotte 25.9 24.9 98.6 131.8
Chattanooga 8.4 7.0 41.8 32.9
Cincinnati 24.9 16.0 114.4 87.9
Colorado Springs 10.2 7.3 51.6 26.4
Columbus 18.7 13.9 76.9 53.3
Dayton 25.1 19.5 56.9 65.4
Des Moines 12.9 11.3 12.6 64.8
Detroit 15.7 12.4 65.2 66.4
El Paso 27.7 16.4 138.0 91.6
Harrisburg 10.6 7.2 30.4 28.7
Honolulu 109.2 97.2 494.8 434.0
Houston 27.8 20.2 138.3 111.2
Indianapolis 13.2 9.3 58.2 47.2
Jacksonville 11.9 11.0 62.6 77.3
Kansas City 11.3 10.0 37.6 39.4
Knoxville 5.6 6.2 16.1 17.1
Lansing 15.1 29.0 57.3 90.7
Little Rock 12.4 8.9 42.6 33.3
Louisville 23.7 15.4 77.2 56.7
Madison 40.9 34.0 150.2 106.8
Memphis 14.5 13.4 78.4 67.8
Milwaukee 48.9 44.5 138.3 123.9
Minneapolis 29.8 30.2 120.4 133.8
Montgomery 3.3 2.0 10.5 10.7
Nashville 14.0 9.1 64.7 45.1
Oklahoma City 4.5 5.5 17.5 28.6
Omaha 9.6 7.5 36.7 26.3
Orlando 17.7 19.6 116.3 127.1
Peoria 7.8 7.3 40.4 45.7
Phoenix 16.4 15.5 63.3 59.1
Raleigh-Durham 19.2 15.9 76.7 62.7
Reno 39.3 26.3 130.1 86.3
Richmond 26.6 14.9 59.5 51.3
Rochester 20.8 19.6 65.5 73.3
St. Petersburg 9.9 7.8 46.1 40.1
San Antonio 34.3 30.4 138.8 122.0
Shreveport 16.8 10.5 69.8 49.1
Spokane 30.1 24.2 139.8 111.1
Tampa 10.1 11.9 49.1 55.9
Toledo 9.2 8.7 41.9 41.0
Tucson 30.9 23.5 110.5 86.6
Totals 21.3 17.9 86.6 79.2
Evaluating New Start Program Performance Victoria Transport Policy Institute
21
Table 14 Bus-Only Cities – Financial Performance
City O&M/p-m 1996 O&M/p-m 2003 O&M/p-m 2003 (1996$)
Akron $1.13 $1.20 $0.94
Albuquerque $0.76 $1.14 $0.89
Ann Arbor $1.09 $1.51 $1.19
Augusta Ga $0.59 $0.60 $0.47
Baton Rouge $0.42 $0.76 $0.59
Birmingham $0.64 $0.83 $0.65
Charlotte $0.49 $0.57 $0.45
Chattanooga $0.65 $0.97 $0.76
Cincinnati $0.46 $0.55 $0.44
Colorado Springs $0.40 $0.76 $0.59
Columbus $0.65 $1.17 $0.92
Dayton $1.21 $1.15 $0.90
Des Moines $2.41 $0.54 $0.42
Detroit $0.74 $1.07 $0.84
El Paso $0.32 $0.60 $0.47
Harrisburg $0.69 $1.19 $0.93
Honolulu $0.31 $0.44 $0.34
Houston $0.48 $0.66 $0.52
Indianapolis $0.48 $0.68 $0.53
Jacksonville $0.54 $0.90 $0.71
Kansas City $0.80 $0.99 $0.78
Knoxville $1.39 $1.47 $1.15
Lansing $0.91 $0.99 $0.78
Little Rock $0.51 $0.76 $0.60
Louisville $0.60 $1.02 $0.81
Madison $0.66 $1.03 $0.81
Memphis $0.37 $0.71 $0.56
Milwaukee $0.53 $0.83 $0.65
Minneapolis $0.52 $0.74 $0.58
Montgomery $1.18 $1.86 $1.48
Nashville $0.42 $0.80 $0.63
Oklahoma City $0.75 $0.74 $0.58
Omaha $0.70 $1.09 $0.86
Orlando $0.41 $0.56 $0.44
Peoria $0.52 $0.93 $0.73
Phoenix $0.47 $0.89 $0.70
Raleigh-Durham $0.52 $0.71 $0.56
Reno $0.53 $0.92 $0.73
Richmond $0.57 $0.73 $0.57
Rochester $0.74 $0.91 $0.72
St. Petersburg $0.69 $0.75 $0.59
San Antonio $0.48 $0.60 $0.47
Shreveport $0.34 $0.59 $0.47
Spokane $0.79 $0.95 $0.75
Tampa $0.72 $0.73 $0.57
Toledo $0.82 $1.21 $0.96
Tucson $0.42 $0.66 $0.52
Totals $0.54 $0.76 $0.60
Evaluating New Start Program Performance Victoria Transport Policy Institute
22
Table 15 Bus-Only Cities – Change in Ridership Performance, 1996-2003
City Trips P-M Trips/cap P-M/cap
Akron 16.7% 28.0% 7.8% 18.6%
Albuquerque 14.7% -6.6% -5.1% -22.3%
Ann Arbor 2.4% 4.5% -20.1% -18.2%
Augusta Ga -23.1% 25.0% -72.5% -55.7%
Baton Rouge 11.9% 28.7% -14.8% -1.6%
Birmingham 26.7% 33.6% 18.8% 25.5%
Charlotte 60.2% 122.7% -3.9% 33.7%
Chattanooga -4.0% -8.9% -16.7% -21.3%
Cincinnati -20.2% -4.7% -35.7% -23.2%
Colorado Springs -5.6% -32.4% -28.4% -48.8%
Columbus -10.7% -16.9% -25.7% -30.7%
Dayton -11.0% 31.8% -22.3% 14.9%
Des Moines 10.5% 548.6% -12.4% 414.3%
Detroit -16.7% 7.5% -21.0% 1.8%
El Paso -29.7% -21.6% -40.8% -33.6%
Harrisburg -16.1% 16.9% -32.1% -5.6%
Honolulu 1.0% -0.4% -11.0% -12.3%
Houston -4.2% 5.9% -27.3% -19.6%
Indianapolis -6.6% 8.1% -29.5% -18.9%
Jacksonville 10.2% 47.6% -7.6% 23.5%
Kansas City -5.6% 12.1% -11.5% 4.8%
Knoxville 52.9% 46.9% 10.7% 6.2%
Lansing 117.5% 78.9% 92.1% 58.3%
Little Rock -15.8% -7.7% -28.2% -21.8%
Louisville -25.7% -16.0% -35.0% -26.6%
Madison 12.0% -4.1% -16.9% -28.9%
Memphis 8.3% 1.9% -7.6% -13.5%
Milwaukee -3.0% -4.4% -9.0% -10.4%
Minneapolis 16.6% 27.7% 1.3% 11.1%
Montgomery -42.9% -4.5% -39.4% 1.9%
Nashville -15.0% -8.9% -35.0% -30.3%
Oklahoma City 17.1% 56.2% 22.2% 63.4%
Omaha -9.6% -17.5% -21.9% -28.3%
Orlando 44.6% 42.5% 10.7% 9.3%
Peoria -5.3% 15.3% -6.4% 13.1%
Phoenix 37.4% 35.3% -5.5% -6.6%
Raleigh-Durham 34.7% 32.7% -17.2% -18.3%
Reno -4.8% -5.8% -33.1% -33.7%
Richmond -22.3% 19.7% -44.0% -13.8%
Rochester 5.4% 25.4% -5.8% 11.9%
St. Petersburg 19.8% 31.2% -21.2% -13.0%
San Antonio 4.1% 3.3% -11.4% -12.1%
Shreveport -32.6% -24.6% -37.5% -29.7%
Spokane -3.6% -4.6% -19.6% -20.5%
Tampa 8.9% 5.7% 17.8% 13.8%
Toledo -2.2% 0.5% -5.4% -2.1%
Tucson -5.6% -2.5% -23.9% -21.6%
Totals 1.7% 10.8% -16.0% -8.5%
Evaluating New Start Program Performance Victoria Transport Policy Institute
23
Table 16 Bus-Only Cities – Change in Financial Performance, 1996-2003
City O&M $ O&M 1996$ O&M/p-m O&M/p-m 1996$
Akron 36.1% 6.8% 6.2% -16.8%
Albuquerque 39.7% 9.8% 50.0% 17.1%
Ann Arbor 44.8% 13.8% 38.5% 9.2%
Augusta Ga 26.9% 0.0% 1.7% -20.3%
Baton Rouge 133.3% 83.3% 81.0% 40.5%
Birmingham 72.7% 35.2% 29.7% 1.6%
Charlotte 160.9% 105.0% 16.3% -8.2%
Chattanooga 37.5% 7.5% 49.2% 16.9%
Cincinnati 14.5% -10.0% 19.6% -4.3%
Colorado Springs 27.4% 0.0% 90.0% 47.5%
Columbus 50.5% 18.3% 80.0% 41.5%
Dayton 24.9% -1.9% -5.0% -25.6%
Des Moines 44.9% 13.5% -77.6% -82.6%
Detroit 55.5% 22.2% 44.6% 13.5%
El Paso 45.7% 14.5% 87.5% 46.9%
Harrisburg 103.3% 59.0% 72.5% 34.8%
Honolulu 39.1% 9.3% 41.9% 9.7%
Houston 46.5% 15.2% 37.5% 8.3%
Indianapolis 52.0% 19.5% 41.7% 10.4%
Jacksonville 145.4% 92.8% 66.7% 31.5%
Kansas City 39.8% 9.9% 23.8% -2.5%
Knoxville 55.9% 22.1% 5.8% -17.3%
Lansing 94.2% 52.9% 8.8% -14.3%
Little Rock 37.9% 9.1% 49.0% 17.6%
Louisville 44.3% 13.5% 70.0% 35.0%
Madison 48.8% 16.8% 56.1% 22.7%
Memphis 93.8% 52.5% 91.9% 51.4%
Milwaukee 50.3% 18.1% 56.6% 22.6%
Minneapolis 82.1% 43.1% 42.3% 11.5%
Montgomery 50.0% 19.2% 57.6% 25.4%
Nashville 72.6% 35.7% 90.5% 50.0%
Oklahoma City 54.4% 21.4% -1.3% -22.7%
Omaha 29.5% 2.2% 55.7% 22.9%
Orlando 92.2% 51.1% 36.6% 7.3%
Peoria 105.9% 62.7% 78.8% 40.4%
Phoenix 153.4% 99.2% 89.4% 48.9%
Raleigh-Durham 79.5% 41.0% 36.5% 7.7%
Reno 63.5% 28.4% 73.6% 37.7%
Richmond 52.5% 20.0% 28.1% 0.0%
Rochester 54.2% 21.3% 23.0% -2.7%
St. Petersburg 43.8% 13.1% 8.7% -14.5%
San Antonio 29.2% 1.6% 25.0% -2.1%
Shreveport 33.3% 5.0% 73.5% 38.2%
Spokane 15.0% -9.4% 20.3% -5.1%
Tampa 6.7% -16.2% 1.4% -20.8%
Toledo 48.8% 17.3% 47.6% 17.1%
Tucson 53.2% 20.4% 57.1% 23.8%
Totals 56.8% 23.3% 40.7% 11.1%
www.vtpi.org/bus_rail.pdf