Embed Size (px)
Citation preview
Part 2 of a Guide to Network Evaluation
Evaluating Networks for Social Change: A CasebookMadeleine Taylor, Peter Plastrik, Julia Coffman and Anne Whatley
Network Impact and Center for Evaluation Innovation
July 2014

Introduction
In response to the growing interest of grantmakers and network
builders, this casebook profiles nine evaluations that address key
questions about network effectiveness while expanding what is
known about assessment approaches that fit with how networks
develop and function. The foundations that supported the
assessments aimed to accomplish one or more of the following:
• Determine whether a network is achieving a desired change or
outcome
• Better understand the nature of a network’s needs and identify
opportunities for supporting the network’s progress
• Generate new knowledge for the social-change field by creating
new understanding about what networks do best and how
The casebook can be used as a stand-alone document for funders, network
practitioners, and network evaluators. It also was designed for use with the
framing paper: The State of Network Evaluation. (Both can be found at www.
NetworkImpact.org/NetworkEvaluation) Together, the two resources offer real-life
examples of funder-driven evaluations of networks, including their methods and
results.
This casebook and the framing paper are based on extensive literature
and document review of different types of networks, both domestically and
internationally, and their evaluations; and interviews with funders, network
practitioners, and evaluation experts. The ideas presented here and in the framing
paper were then vetted during an April 2014 convening of leading network
funders, practitioners, and evaluators.
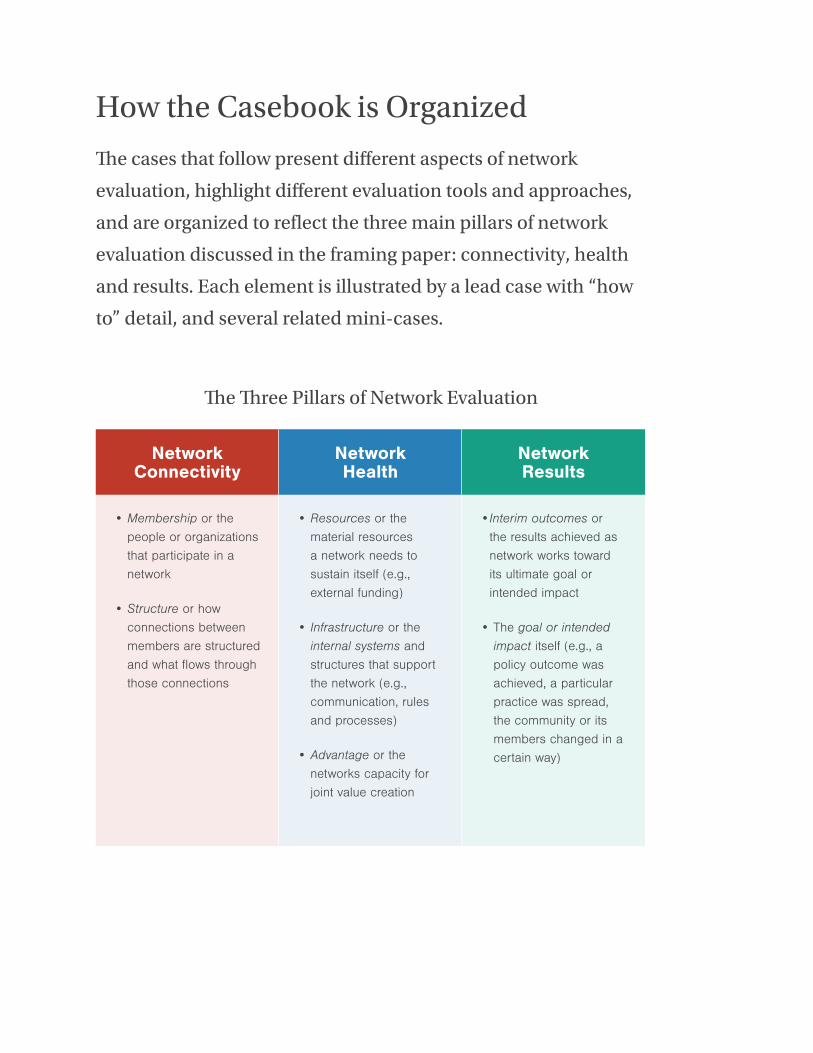
How the Casebook is Organized
The cases that follow present different aspects of network
evaluation, highlight different evaluation tools and approaches,
and are organized to reflect the three main pillars of network
evaluation discussed in the framing paper: connectivity, health
and results. Each element is illustrated by a lead case with “how
to” detail, and several related mini-cases.
The Three Pillars of Network Evaluation
NetworkConnectivity
NetworkHealth
NetworkResults
• Membership or the
people or organizations
that participate in a
network
• Structure or how
connections between
members are structured
and what flows through
those connections
• Resources or the
material resources
a network needs to
sustain itself (e.g.,
external funding)
• Infrastructure or the
internal systems and
structures that support
the network (e.g.,
communication, rules
and processes)
• Advantage or the
networks capacity for
joint value creation
• Interim outcomes or
the results achieved as
network works toward
its ultimate goal or
intended impact
• The goal or intended impact itself (e.g., a
policy outcome was
achieved, a particular
practice was spread,
the community or its
members changed in a
certain way)

The nine networks that are profiled represent a range of network types. Some
are networks of organizations, others of individuals. Some are rooted in a
particular place, others involve members in many places. The networks have
different purposes. Some focus on learning or service delivery, others on
innovation or public policy change. They are of different sizes and have different
types of funders: national foundations, local community foundations, and family
foundations. Most are U.S. - based networks, but there is also an international
network. Some are single-sector, others are cross-sector.
Each of the cases was honed to make it as informative as possible, detailing the
methods used as well as the results of the evaluation process.1
1
2
11
13
14
15
23
24
25
26
33
35
36
Page
1 Four of the assessments were conducted by one or more of the casebook authors: Reboot (Taylor and Plastrik), RE-AMP (Plastrik), Massachusetts Regional Networks to End Homelessness Pilot (Taylor), Macon Money (Taylor and Whatley)
Network Connectivity
Reboot
Barr Fellows Program
Interagency Collaboration in the Safe Schools/Healthy Students Initiative
Network Health
Urban Sustainability Directors Network
RE-AMP
KnowHow2GO Network
Network Results
Massachusetts Regional Networks to End Homelessness Pilot
The Fire Learning Network
International Land Coalition
Cases
Bonus: Communicating Evaluation Findings The Knight Foundation Macon Money Game Evaluation

1
Part 1:Network Connectivitybook
2
CASE STUDY
Reboot Network Assessment2010 - 2012
Evaluation Overview
Assessing network connectivity requires unique data and analytic tools and yields findings that are relevant to understanding the role that member ties play in building a network and how different connectivity structures enable network learning and action.
The Reboot evaluation took on these topics as part of a larger evaluation process funded by the Jim Joseph Foundation. Although no previous connectivity data had been collected in the network, the evaluation revealed a set of clear structural patterns with
implications for the network’s future.
Key Evaluation Questions:
• How and in what ways has Reboot had an impact on its members?
• How and in what ways are Rebooters connecting to each other? Is
Reboot succeeding in building a strong community of young Jewish
thought leaders?
• What impact does the Reboot network have on the Rebooters’ broader
community of friends and colleagues and on the Jewish organizational
landscape?
Essentially these were questions about connectivity — among Reboot members and
between members and their personal and professional networks.
Evaluation Methods: focus groups, member survey, member connectivity mapping,
member interviews, review of network activity documentation.
Cost of external network assessment: About $150,000.
Network Connectivity
3
Background
Reboot is a network of individuals in the United States established in 2003. Reboot’s
purpose is to reinterpret Judaism/Jewishness in America so it has meaning and value
for younger Jewish Americans. Its members create innovations in cultural and religious
practices — new events, products (e.g., movies, books, CDs), services, and organizations.
At the time of the evaluation, Reboot had about 350 network members; many, but not all
of them, were active in network activities. Each year, Reboot had added about 30 new
members, by invitation only and with an emphasis on recruiting young, “cultural creatives”
working in the arts and media sectors. Most members lived in Los Angeles, New York
City, or San Francisco, the nation’s population centers for Jews.
Several Reboot founders worked for foundations. After initial efforts to test possibilities,
explains cofounder Rachel Levin, who manages Steven Spielberg’s Righteous Persons
Foundation: “We fell into the notion of having an ongoing network as ideas started
emerging and we saw people working together from so many creative sectors. We saw
how impact was magnified and leveraged in ways we could not have imagined.”
The network established a 501(c)(3), with a board of directors made up of network
members. Three full-time staff members in New York with a part-time staff member in Los
Angeles and another part-time staff member in San Francisco supported the network.
Reboot had received funding from a number of foundations: the Jim Joseph Foundation,
Andrea and Charles Bronfman Philanthropies, the Goldman Foundation, the Koret
Foundation and the Righteous Persons Foundation.
Evaluation Design
The Jim Joseph Foundation had made a $3 million grant to Reboot in 2008. Program
officer Adene Sacks, who had developed the grant, needed to evaluate the network so
the foundation board could consider the possibility of making a follow-up grant. (The
foundation invests in evaluation as a standard practice, but it hadn’t funded a network
evaluation before.) An evaluation was also an opportunity to help the foundation board
understand more about why and how to invest in network building as a broader strategy
to achieve its goals. And an evaluation was a chance to engage Reboot’s board, staff,
and other funders in reflection about the network’s condition and future.
The foundation and Reboot — Sacks, Levin, and Lou Cove, then Reboot’s executive
director — decided to co-develop the evaluation to meet both of their organizations’
needs. But it took some time to find an outside evaluator. Traditional evaluators of
organizations, Sacks says, “weren’t speaking the same language as Reboot. They would
Network Connectivity

4
say, ‘We want to see your business plan and metrics for success,’ and Reboot would say
things like, ‘We’re redefining Jewishness for a new generation.’ And the evaluators would
say, ‘Can you put some numbers on that?’ They wanted to tie organizational outcomes to
the network. I was struggling to figure this out. We needed a framework that would help
us understand what Reboot was trying to do.”
The evaluation used a number of methods to develop data and analysis of the network:
1. Review of Reboot background and products. Evaluators read Reboot
materials provided by staff, including the results of several earlier surveys of
members. Evaluators also read, viewed, or listened to a number of Reboot’s
innovative products.
2. Articulation of the Reboot “Theory of Change.” After digesting the Reboot
materials, the evaluators presented a TOC model, which was reviewed and
revised in discussions with Reboot and the Foundation. This provided a
common understanding of what Reboot was seeking to accomplish and its
strategies for doing so.
3. Interviews with 23 Reboot founders, board, staff, expert faculty, and Jim
Joseph Foundation staff. The interviews provided background about Reboot
and its activities, and allowed evaluators to develop “journey maps” of 12
network members to depict the flow and drivers of their various experiences in
the network. The journey maps were essential for understanding in depth how
the network had impacted different members.
4. Focus group interviews with Reboot members. Three 90-minute focus
groups were conducted, one each in Los Angeles, New York City, and San
Francisco. A total of 25 Reboot members participated. These sessions added
to evaluator’s understanding of Rebooters’ journeys, and helped them to
develop questions for the survey of members.
5. Online survey of Reboot members. The survey contained nearly 50
questions, including respondent demographic information. More than 140
members, 40 percent of the network, responded, a large enough sample size
to provide statistically significant correlations. The survey focused heavily on
members’ experiences in the network, their value propositions for participating
in the network, and any changes in their engagement with family, friends, and
colleagues as a result of Reboot.
6. Second online survey to identify Reboot members’ connections to one
another. Ninety-six members responded to this additional survey. They
identified which other network members they connected with for non-Reboot
Network Connectivity

5
network reasons (social, professional, celebration linked to Jewish calendar,
or other reasons), and what they felt was the strength of the connection (on a
scale of 1 to 5).
7. Social network analysis (SNA) and mapping of member connections2.
A total of 38 maps were produced, analyzing members’ connections through
many lenses: member-cohort year, location, purpose in connecting, and
others. The analysis examined common SNA indicators: the degree to which
connections center around key people and to which there are “clusters” of
people who connect to each other, and more.3
8. Additional interviews to fill gaps in information and enhance emerging
themes. Evaluators conducted a handful of additional interviews with members
and advisors (known as faculty) to complete assessment of specific topics that
had emerged during the evaluation process.
Evaluation Implementation
A six-member Evaluation Advisory Group (EAG) — consisting of Sacks, a Reboot board member, the Reboot staff, and the two-person evaluation team — was formed. The EAG met periodically (in person and by telephone) to guide and drive the evaluation process, review data produced by the various evaluation methods, and discuss findings and potential conclusions. It also tasked Reboot staff with certain work in the process, such as marketing the survey to the network’s membership.
The EAG-led evaluation process unfolded during about 15 months, starting in the fall of 2010, and involved these major steps:
• Agreeing on the evaluation questions and methods. EAG had lengthy discussions in order to narrow down the questions it wanted to answer in the evaluation, and to decide what methods —surveys, mapping, focus groups, etc. — would be used. Part of these conversations focused on Reboot background and Theory of Change, both to inform the evaluators but also so the Reboot and the foundation could reach common ground about their understandings.
• One-on-one interviews of Reboot founders, members, faculty members, and foundation staff. Materials from the interviews contributed to the EAG’s discussions about evaluation questions, and also helped introduce the evaluators to the network’s “language” and
2 Using the tools UCINET and NetDraw.
3 Social Network Analysis typically details several characteristics of network connectivity: Path Lengths—the average number of “hops” between any two people in the network; Clustering Co-efficient—the extent to which there are “clusters” of people who all know each other (1 = highly clustered, 0 = not at all); Centralization = the extent to which the network is centered around key people (0 = everyone in the network has the same number of links, 1 = everyone in the network is connected to only one person).
Network Connectivity

6
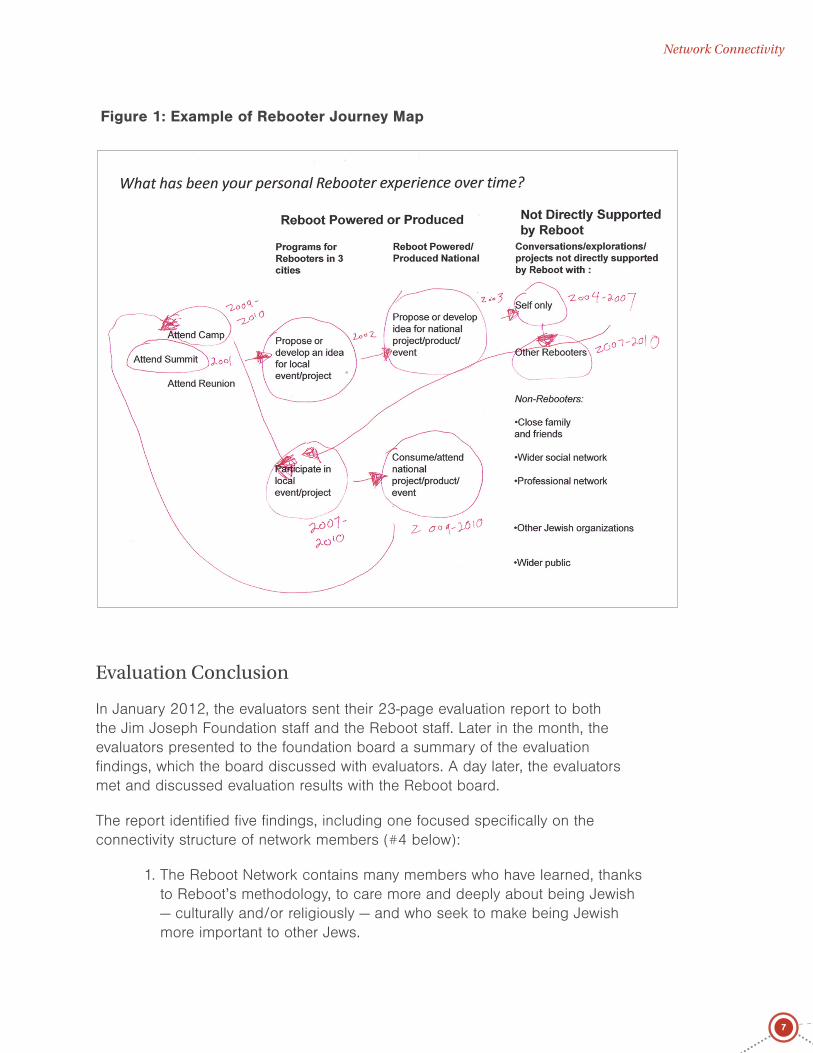
some of its more active members. As a result, evaluators began to create the “journey maps” that identified variations and patterns in the ways that members engaged in the network. This informed the focus groups and survey design. (Figure 1 on next page is a sample journey map.)
• Design and implementation of focus groups. There were two reasons to conduct focus groups in each of the three cities containing the bulk of Reboot membership. First, it would help the evaluators design the member survey — allowing them to better understand the potential impacts of Reboot on members and the ways that members talked about their experiences in the network and its impacts. Second, it would help the evaluators get a sense of the degree to which different cities’ Reboot members had been affected by their participation in the network. EAG members helped identify which Rebooters to invite to the focus groups so it would be a mix from different cohort years and of different levels of engagement, but they did not attend the focus groups.
• Design of online member survey. After the EAG agreed on what the survey would seek to accomplish, evaluators presented a draft of questions, which was revised and shortened. The revised questionnaire was test-driven by several Reboot members, and further revised based on their feedback.
• Marketing the survey to members. The Reboot staff developed and implemented communications to members, asking them to fill out the survey.
• Analysis of survey and connections data, reviewed with EAG. The evaluators produced an initial report on the survey and connectivity results and presented it to the EAG at a daylong working session that reviewed the data, considered its implications for the network, and identified any gaps or new questions that ought to be answered as a part of next steps.
• Additional interviews.
• Discussions with EAG, the Jim Joseph Foundation staff and board, and Reboot board of findings and recommendations.
Network Connectivity
7
Evaluation Conclusion
In January 2012, the evaluators sent their 23-page evaluation report to both the Jim Joseph Foundation staff and the Reboot staff. Later in the month, the evaluators presented to the foundation board a summary of the evaluation findings, which the board discussed with evaluators. A day later, the evaluators met and discussed evaluation results with the Reboot board.
The report identified five findings, including one focused specifically on the connectivity structure of network members (#4 below):
1. The Reboot Network contains many members who have learned, thanks to Reboot’s methodology, to care more and deeply about being Jewish — culturally and/or religiously — and who seek to make being Jewish more important to other Jews.
Figure 1: Example of Rebooter Journey Map
Network Connectivity

8
2. Although Reboot is best known for its mass-audience projects, such as Dawn, Sukkah City, 10Q, and the National Day of Unplugging, its “production process” has evolved and is already generating several types of Jewish innovations.
3. Rebooters take quite different, complex, and seemingly unpredictable journeys as they engage post-Summit in Jewish innovation — but examined closely these experiences reveal patterns that may be managed to increase Reboot’s effectiveness.
4. As Rebooters connect with each other, the network is taking on a distinct structure — a committed core of well-linked members; a “cluster” of members in each of the three main cities; and a number of “boundary spanners” who link Rebooters nationally.
5. Many Rebooters exist within and are helping to build a larger and growing ecology of linked networks and organizations engaged in Jewish innovation — and Reboot plays a particular, perhaps unique, value-adding role within the ecology.
The evaluation report also produced four recommendations, the second and third of which focused on connectivity in the network.
1. Let Reboot continue to be Reboot — a self-organizing platform for Jewish innovation — but reposition the network within the ecology of Jewish innovation.
2. Leverage network strengths by building on existing connectivity and expertise.
3. Experiment with more diversity — in Reboot membership and network-building approaches.
4. Get more impact (and energy) by partnering.
Network Connectivity
When Sacks worked with Reboot’s governing board members and staff to design their evaluation, they also decided to map the network’s structure but they had more than a decade of member connecting to catch up with. Some 90 members provided connectivity information, enough to capture important details of the network’s structural shape.
The process generated over 30 maps — factored in the following ways: location of member, starting year in the network, purpose of connection and participation in
Network Connectivity
9
different Reboot events.
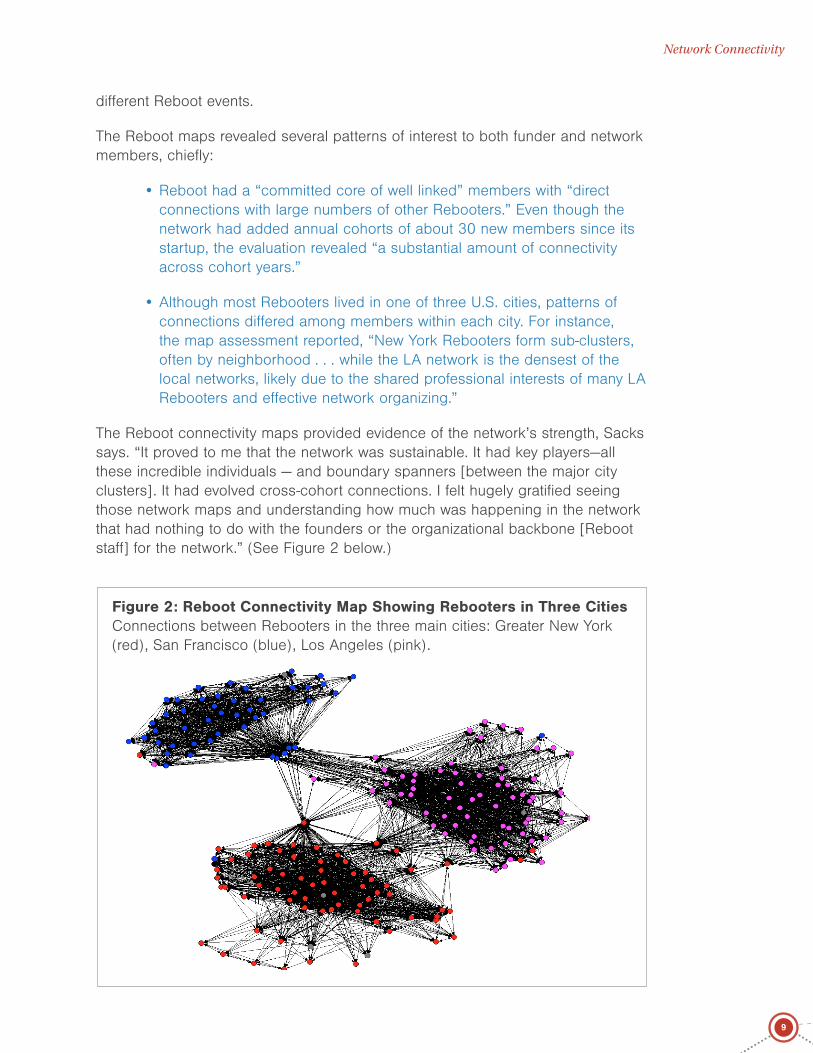
The Reboot maps revealed several patterns of interest to both funder and network members, chiefly:
• Reboot had a “committed core of well linked” members with “direct connections with large numbers of other Rebooters.” Even though the network had added annual cohorts of about 30 new members since its startup, the evaluation revealed “a substantial amount of connectivity across cohort years.”
• Although most Rebooters lived in one of three U.S. cities, patterns of connections differed among members within each city. For instance, the map assessment reported, “New York Rebooters form sub-clusters, often by neighborhood . . . while the LA network is the densest of the local networks, likely due to the shared professional interests of many LA Rebooters and effective network organizing.”
The Reboot connectivity maps provided evidence of the network’s strength, Sacks says. “It proved to me that the network was sustainable. It had key players—all these incredible individuals — and boundary spanners [between the major city clusters]. It had evolved cross-cohort connections. I felt hugely gratified seeing those network maps and understanding how much was happening in the network that had nothing to do with the founders or the organizational backbone [Reboot staff] for the network.” (See Figure 2 below.)
Figure 2: Reboot Connectivity Map Showing Rebooters in Three Cities Connections between Rebooters in the three main cities: Greater New York (red), San Francisco (blue), Los Angeles (pink).
Network Connectivity
10
Evaluation Application
The Jim Joseph Foundation’s executive director Charles “Chip” Edelsberg says that Jim Joseph posts all of its evaluations on the foundation Web site, and seeks to have each evaluation create multiple value. “All of the professionals read every evaluation” and the foundation often directs grantees to particular evaluations that could be of value. The Reboot evaluation helped the staff think about what to look for in other network-building approaches it might support.
The Reboot evaluation was a learning opportunity for the foundation’s board of directors and influenced what they wanted to see in a follow-on renewal grant. Sacks helped the board understand what the evaluation could tell them about the Reboot network. “I wanted the board to understand network evaluation and network-building process metrics, in order to appreciate how networks build value and why greater connectivity was good.” She used the presentation of evaluation findings as an opportunity for the board to consider the connection between network strength and impact. “The board used Reboot to teach themselves about networks.”
When board members focused on the evaluation, says Edelsberg, they were particularly interested in how the experience of being in the Reboot network had affected the Jewishness of individual members. “What influence does it have on their Jewish community involvement? How does it relate to their expressions of Jewish practice?” These concerns, he adds, were “front and center” in considering Reboot’s request for a renewal grant renewal, which the board approved.
For Reboot staff and board, the network maps revealed how members’ relationships had evolved over a period of years. “Seeing the big picture in this way,” says Levin, “helped us think about how to support the hubs and keep the network connected as we continue to grow.”
The foundation and Reboot collaborated on producing a summary of the evaluation report that could be posted online, and made an effort to design the report and promote the key findings so that they would be relevant and accessible to others in the field.
Network Connectivity

11
MINI-CASE STUDY
The Barr Fellows Program Evaluation
2005 - present
Beginning in 2005 and every few years since, the Barr Foundation has invited twelve distinguished nonprofit and school leaders in Boston to participate in a three-year fellowship that begins with a two-week learning journey and three-month sabbatical that includes many opportunities for network building. This fellowship was based on the hypothesis that recognizing talented leaders and investing in their personal connections with one another will result in positive outcomes for individual leaders and their nonprofit organizations as well as for Boston’s neighborhoods and communities.
The foundation’s Fellowship strategy was grounded in research on the role social capital plays in peer exchange and collaboration, but it is not prescriptive. Fellows have been encouraged to focus first on building strong personal relationships with other nonprofit and school leaders, both within and across fellowship cohorts, and to remain open to activating these connections as opportunities arise. In keeping with this approach, the Barr Fellowship evaluation has been a hybrid: using a logic model to guide assessment of intended outcomes and a developmental approach to track emergent connections, new collaborations, and unintended outcomes. An external evaluator traces evolving connections between fellows based on information from an annual survey that captures each fellow’s relationship to other members of the network (how well they know each person, if they have collaborated with them, how frequently they receive work-related advice, etc.). Social Network Analysis (SNA) and network mapping tools (UCINET and NetDraw) have been used to chart this information, displaying each fellow’s characteristics, such as organization focus and cohort year as well as the structure of their connections. Combined with information from interviews about fellows’ relationships and the collaborative work in which fellows are engaged, the evaluation has provided a record of changes in levels of social capital for individuals and the network, flows of information, advice and resources within and across cohorts, and bridging across differences.
After four classes and 48 fellows, evaluation findings have demonstrated that clusters of leaders from different sectors and neighborhoods actively engaging in joint projects. In 2011, for example, Barr fellows and other Boston stakeholders collaborated to produce a single application to a competitive federal grants program rather than submit separate applications. The collective proposal led to the selection of the Boston Promise Initiative as one of seven new sites to receive a planning grant supported by the U.S. Department
Network Connectivity

12
of Education Promise Neighborhood program. Implementation funding was turned down in the first round, but the strength of the relationships kept the work moving until implementation funding was awarded in the second round. These and other network developments among fellows provide compelling evidence that investing in social relationships and building social capital can catalyze new types of collaboration in the nonprofit sector and long-term stewardship of positive change.
For more information about this assessment, including examples of network maps, you can check out a Stanford Social Innovation Review article on the program, Networking a City; as well as an article in The Foundation Review, Only Connect: How an Investment in Relationships Among Social Change Leaders Is Changing Them, Their Organizations, and Their City. The Barr Foundation also has the program’s logic model posted: Barr Fellowship Logic Model.
Network Connectivity

13
MINI-CASE STUDY
Safe Schools/Healthy Students Initiative Network Analysis of Interagency Collaboration
2000 - 2003
Based on evidence that an integrated community-wide approach is an effective strategy for preventing school violence, the federal grant-making program Safe Schools/Healthy Students Initiative (SS/HS) supports local educational agencies that promote prevention in partnership with other agencies such as human services agencies, law enforcement, mental health agencies and juvenile justice. Funded sites are required to demonstrate the existence of these partnerships and establish performance measures that evaluate interagency collaboration.
In this site, evaluators from Colorado State University approached interagency collaboration as a network phenomenon rather than as a simple partnership between lead agencies. Steps in the network analysis included: identification of relevant agencies, including funded and non-funded entities; identification of functional groups working toward the goals of the grant within and across agencies (e.g., mental health team, youth support center); the development of a rating scale to measure the quality of network ties between these groups from “no tie” to “close collaboration”; facilitated discussions with network members at regular intervals to document members’ rating of their connections to other groups; use of Social Network Analysis (SNA) and network mapping tools (Pajek and NetDraw) to measure network structure and chart the evolution of collaborative relationships. In addition, evaluators conducted interviews with network members to document perceived changes in their relationships.
Examination of qualitative data and results from a network analysis of the largest set of participants related to the grant revealed that new programs and services were increasingly provided through a network of smaller clusters rather than through the formation of a single coalition or partnership. Results also showed that connections between funded partners weakened as the end of the grant period approached, while some network clusters continued to evolve and contribute substantially to grant objectives. According to evaluators: “Had we used traditional surveys of the effectiveness of the coalition, or limited our analysis to the Project-Funded Partnership, these insights would have been lost.”
A full description of the evaluation and its results can be found here: Using Mixed-Method Design and Network Analysis to Measure Development of Interagency Collaboration, American Journal of Evaluation (2009)
Network Connectivity

14
Part 2:Network Health

15
CASE STUDY
Urban Sustainability Directors Network Assessment 2009 - 2013
Evaluation Overview
The health of a network — the members’ satisfaction and sense of shared purpose, the effectiveness of network infrastructure and activities—is an important ongoing concern, not just something to be examined every three or five years. The Urban Sustainability Directors Network (USDN) process of continuous assessment and improvement offers an example of how to build such an approach into the everyday fabric of a network and how to get substantial value out of the flow of comprehensive assessments. “Having this data,” says Darryl Young, director of the Sustainable Cities Program at Summit Foundation, a USDN funder, “makes is easy for me to update my trustees and to reinforce—or contradict—what I already understand about the network from a ‘gut check’ standpoint.”
For early funders of USDN, data about network health provided useful information. “With the initial funds we invested,” recalls Young, “I had the ability to say, it’s for capacity building, let’s see what happens.” The data, he says, showed funders and network leaders “what was working out and what was not taking hold as well as you might want.” This, he continues, made it easier to help other, larger funders decide to invest in the network. “The data spoke for itself.”
Key Evaluation Questions:
• What are the members’ most important value propositions and how well do they feel they are being met?
• What level of engagement in network activities does each member have? How does the infrastructure enable engagement—and what barriers do members face?
• What are members’ ideas about how the network’s performance could be improved?
Network Health
16
Evaluation Methods: surveys of members, monitoring member participation in network events/activities, mapping connectivity of members, annual report on “state of the network” and member feedback opportunities.
Cost of internal assessment: Undetermined portion of network operational costs. The annual cost of network mapping for USDN is about $4,000.
Background
The USDN is a network of individuals — local government sustainability directors — in North America, established in 2009. Sustainability directors are local government employees with responsibility for developing, coordinating, and implementing their government’s sustainability initiatives. USDN’s purpose is to help sustainability directors “to exchange information, collaborate to enhance our practice, and work together to advance the field of urban sustainability.”
USDN has about 120 core and associate members from about that many cities and counties, plus 300 of their city staff who participate in network working groups and its online communication. Through the years, about 10 foundations have supported USDN, including Bloomberg Philanthropies, The JPB Foundation, The Kresge Foundation, the John D. and Catherine T. MacArthur Foundation, the Summit Foundation and the Surdna Foundation.
USDN has a Planning Committee of 10 members that, in consultation with the membership, sets network priorities and budgets. In 2014, a full-time staff of four supports the network. USDN has a fiscal sponsor, Global Philanthropy Partnership, which manages funding, employs staff, and provides accounting and payroll services.
USDN conducts an annual self-assessment that incorporates data from two membership surveys, connectivity maps, and regular monitoring of member participation in USDN activities. This ongoing flow of information supports efforts to continuously improve network connectivity, health, infrastructure, and impact. A summary “State of the Network” is presented at the membership’s annual meeting. (The 2013 report contained 19 PowerPoint slides, dealing with member engagement, satisfaction, and connectivity, and implications.) The Planning Committee reviews a more detailed assessment report (available to any member) as a part of setting the next year’s priorities.
Evaluation Design
At the network’s beginning, Managing Director Julia Parzen wanted to adopt
Network Health
17
a continuous-improvement process. “The network is a living organism,” she explains. “If you don’t take its temperature, how do you know how it’s doing?” Working with consultants, she developed an initial assessment framework — connectivity of members plus indicators of network health, such as member engagement and satisfaction with value propositions. Over the years, indicators have been added to these broad categories and the category of network impact — on members, their communities, and the field of urban sustainability—has been added to the assessment process.
The network assesses its members’ value propositions and their satisfaction with the network through an annual survey that asks members to identify their three most important value propositions from a list of a dozen statements, or write in additional important value propositions. Then members are asked to rate how well their most important value propositions were being met. Members are also asked to agree or disagree with a set of statements about what the network is accomplishing and how they feel about the network, another way of understanding member satisfaction.
Member engagement is assessed through monitoring by staff of who is taking a role in network leadership (such as serving on the Planning Committee or co-chairing an active working group) and has participated in various network activities, such as attending working group meetings, initiating projects with other members, as well as engaging in online activities, such as responding to other members’ questions and posting information at the USDN web site. This information might be augmented with information from member surveys. A participation “score” would then be compiled for each member and total participation of the membership would be part of an annual report to members.
In surveys, members are also asked about their experiences with specific activities and infrastructure of the network — online, working groups, annual meeting, etc. — to determine what activities and infrastructure might need to be improved or even eliminated.
USDN uses the same process for each of its working groups, including an initial survey of goals and interests, tracking of participation (which is a requirement for continuing to support the group), and a follow-up survey later in the year to assess whether there is a need for near-term corrections. USDN ends all working groups each year and then assesses what working groups members want to continue or build. Every year, members self-organize around new working group topics.
USDN is also trying to help eight regional networks that are part of its regional network coordinating committee to pursue a similar continuous improvement process. These networks have almost 100 members that are not USDN members. USDN works with the regional networks to produce an annual network mapping and member satisfaction survey.
Network Health

18
Evaluation Implementation
The USDN assessment process works on an annual cycle, with information collected throughout the year. Anchoring the cycle is the “State of the Network” report, presented by the managing director at the members’ annual meeting in the fall. This has become a regular feature of the session, and is part of the information members receive before indicating their priorities for the coming year. Each element of the assessment cycle is linked to mechanisms to use the data to improve the network’s performance. For instance, survey data about members use of and satisfaction with the network’s website, which facilitates communications among the widely dispersed members, is studied by a committee of members, staff, and consultants, which determines what to change or add to the website’s functionality.
Major features of the network’s assessment process include:
• Member surveys. USDN conducts two membership surveys annually, as well as targeted surveys of working group members and participants in other activities. Survey questions are developed by the managing director and a consultant, in consultation with several member-based committees. Several members test-drive the surveys before all members are asked to respond. Individual survey responses are confidential but not anonymous, which permits staff to follow-up with specific members about specific items. Both membership surveys include a focus on network health: members’ value propositions and satisfaction with the network; member’s level of engagement in the network; members’ ideas about how to improve the network. The first survey in 2014 contained 33 highly detailed questions; respondents needed 20-30 minutes to complete the survey. More than 90 percent of the members completely filled out the survey.
• Marketing the survey to members. The survey is in the field, available to members, for between four to six weeks. Members are informed of its availability by e-mail, with weekly reminders — including a list of members who responded in the past week (and a thank you to them) — in the network’s electronic newsletter. In addition, after several weeks, the managing director sends e-mails to all members who have not yet responded or have not completed their surveys, asking them to take/finish the survey. These communications stress the importance of the survey results in helping to set the network’s direction, and note that survey results will be shared with all members.
• Monitoring of member participation. USDN monitors and documents member participation in a wide range of USDN activities, both whether they are participating or not and whether they are providing “leadership” for network activities. Participation data is framed into a Participation
Network Health

19
Index score. Each of the 10 members of the Planning Committee takes responsibility for helping a set of members to become more engaged and contribute more to the network. Figure 3 below depicts month-by-month percentage of members meeting the network’s participation requirements.
• Analyzing the Network’s Performance Data. A fairly large amount of network performance data is collected throughout the year, with big “bumps” in information when the member surveys are done. The data is analyzed by USDN staff and consultants, with their initial findings and conclusions shared with several member-based committees for discussion and revision.
• Reporting to the Membership and Funders. The annual meeting, the only time all network members gather, is the setting for an overview report on performance. The USDN Planning Committee meets immediately before the annual meeting to discuss the implications of the State of the Network findings and the options to share with members for addressing concerns or desires the following year. Funders and network leaders also meet during the annual meeting for a progress report and feedback. Several of the network’s key functions, such as its member-directed Innovation Fund, obtain data at other times of the year to determine how to improve their efforts.
Network Health
Figure 3: Percent of of Core Members Meeting Requirements
100%
80%
60%
40%
20%
0%
Jan -12
Feb
-12
Mar -1
2
Apr -
12
May -1
2
Jun -12
Jul -1
2
Aug
-12
Sep -12
Oct -12
Nov -1
2
Dec -1
2
Jan -13
Feb
-13
Mar -1
3
Apr -
13
May -1
2
Jun -13
July
-13
Aug
-13
All47%
All68%
All73%
All78%
All59% All
46%
All63%
All Most Some NoneKey:
20
Evaluation Conclusion
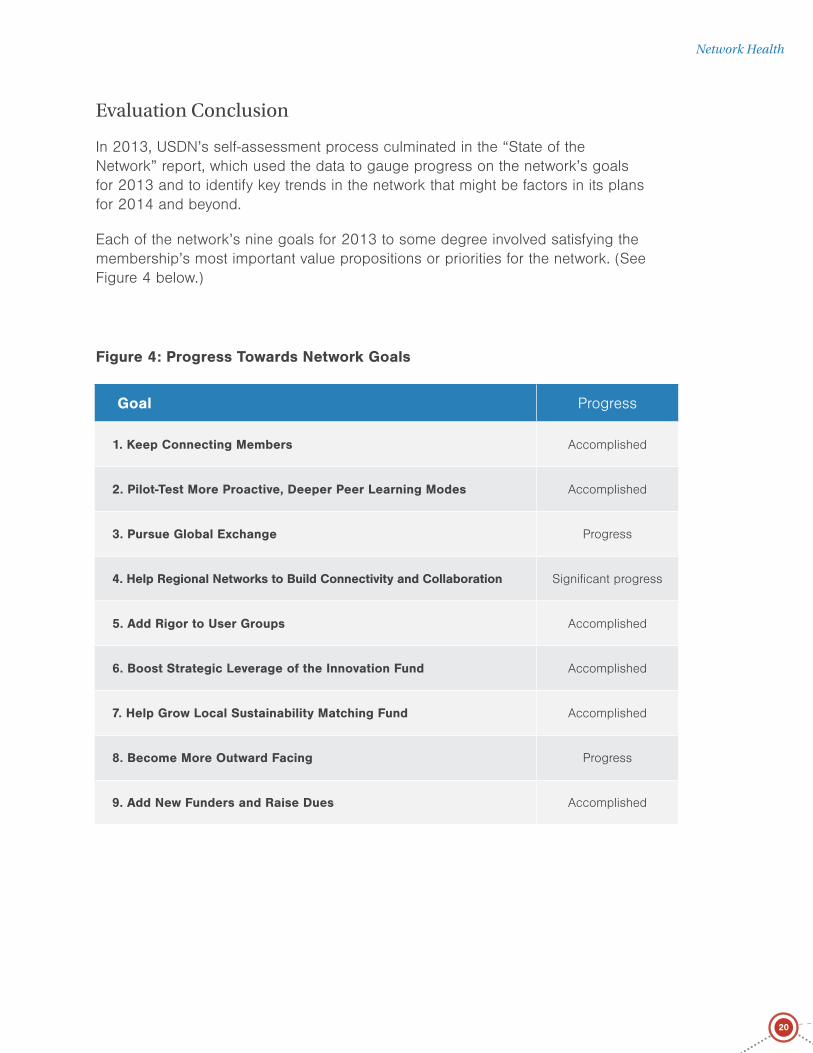
In 2013, USDN’s self-assessment process culminated in the “State of the Network” report, which used the data to gauge progress on the network’s goals for 2013 and to identify key trends in the network that might be factors in its plans for 2014 and beyond.
Each of the network’s nine goals for 2013 to some degree involved satisfying the membership’s most important value propositions or priorities for the network. (See Figure 4 below.)
Goal Progress
1. Keep Connecting Members Accomplished
2. Pilot-Test More Proactive, Deeper Peer Learning Modes Accomplished
3. Pursue Global Exchange Progress
4. Help Regional Networks to Build Connectivity and Collaboration Significant progress
5. Add Rigor to User Groups Accomplished
6. Boost Strategic Leverage of the Innovation Fund Accomplished
7. Help Grow Local Sustainability Matching Fund Accomplished
8. Become More Outward Facing Progress
9. Add New Funders and Raise Dues Accomplished
Figure 4: Progress Towards Network Goals
Network Health

21
More specifically, the report found:
• Member satisfaction had increased since 2012 with the members’ top three value propositions, and that large majorities reported the network was “delivering very well” on what was most important to them. 90 percent of members reported the network provided them with “access to trusted information about issues, models, solutions, etc.”
• New users groups were starting and others ending. Nearly all members participated in at least one network group or committee, and about half of the members were in at least one leadership position in the network. (See Figure 5 below.)
• Increasing numbers of members had applied for grants from the network’s internal funds and were collaborating with other members on projects.
• A rise in the percentage of members who reported that participating in the network had helped them to “save time,” “find a solution to a key challenge,” “make a change in policy/program/process,” and/or “avoid a problem already faced by peers.” Two-thirds of members said participation had helped them find a solution to a key challenge.
In her presentation at the annual meeting, Managing Director Parzen noted that the network’s growing capacity for collaborative problem solving was leading to a change in the network’s focus. “At the outset USDN was about paying attention to the dynamics of the core and building it so that USDN could be generative. USDN was essentially inwardly focused. And it was successful in getting the conditions right. Today USDN is a strong network whose members value it highly for fostering exchange and collaboration. Now there is a drive to engage more
Network Health
Figure 5: Percent of Core Primary Members in at least one Working Group, User Group, or Committee

22
and exchange more value at the periphery [with organizations and other networks] ... This evolution will change where the network fits in the world.”
Evaluation Application
At the annual meeting, members overwhelmingly embraced recommendations that emerged from the self-assessment process, including:
• Support more opportunities for deep, in person exchanges among members.
• Devote more resources to collaborative activities among members, including regional collaborations, but maintain the quality of information-sharing activities, which continue to be very important to members.
• Help regional networks build their capacity for collaborative action in addition to information exchange.
• Form long-term relationships with other entities, such as the federal government and key nonprofits in the urban sustainability field—both of which are increasingly important value propositions for many members.
•Support more peer-exchange globally.
• Continue to stress the network’s participation requirements and efforts to help members get and stay involved with network activities—because those result in increased member satisfaction.
For more information go to the Urban Sustainability Directors Network website.
Network Health

23
MINI-CASE STUDY
RE-AMP Evaluation
2011
RE-AMP is an active network of nearly 160 nonprofits and foundations across eight Midwestern states working on climate change and energy policy. RE-AMP’s purpose is to reduce greenhouse gas emissions in the region’s economy by 80 percent by 2050. Its members align with each other to develop and advocate for public policies at state-government level. More than a dozen foundations have supported RE-AMP with grants. In 2011, after seven years of operation, RE-AMP funders expressed a desire for an independent assessment of the network. This prompted the organization of a RE-AMP Evaluation Committee and the implementation of an assessment process. The Committee - consisting of RE-AMP funders, other Steering Committee members and the network coordinator - worked with an external evaluator to identify key questions for the assessment. The plan that emerged focused mainly on the network’s health and operations, including questions about the effectiveness of the network’s governance arrangements and internal structure of committees and working groups, the use and impact of the network’s shared resources (such as communications), the prioritization of RE-AMP’s strategic approaches, and RE-AMP’s strategic value to members.
The evaluation took seven months to complete. Evaluators administered an online survey to RE-AMP members, observed selected RE-AMP activities, interviewed selected members, and reviewed RE-AMP documents including existing surveys, documentation of member participation, grant-making patterns since 2007, reports of annual meetings, and patterns of Steering Committee membership. Evaluators also read Working Group and other materials on the RE-AMP internal Web site. Results communicated in a final 20-page evaluation report confirmed that RE-AMP has effective, well-established structures and processes in place and generates substantial value for members. The final report included 10 recommendations, each with a set of suggested actions. The RE-AMP Steering Committee prioritized a list of issues from both the evaluation report and annual meeting discussions. Subcommittees of members then examined each issue more closely and suggested next steps. These were shared with the RE-AMP Steering Committee to inform decision making.
“The evaluation results were influential in our thinking at the time,” says Rick Reed, a consultant for the Garfield Foundation which has been a leader in RE-AMP network design. “They became integrated into our overall mental model. It doesn’t get more influential than that!”
For more information go to the RE-AMP website.
Network Health
24
MINI-CASE STUDY
The KnowHow2GO Network Survey
2009 - 2011
A joint effort of Lumina Foundation, the Advertising Council, and the American Council on Education, KnowHow2GO was established in 2007 to inform low-income and historically underrepresented middle and high school students, as well as their parents and guardians, about the steps necessary to prepare for college, and to motivate and assist students through college acceptance. The initiative began as a national multimedia campaign with grants to campaign organizers in more than a dozen U.S. states. After two years, it was clear to Lumina staff that the media campaign could have greater impact if there was improved collaboration among KnowHow2GO grantees, college access providers, secondary and higher education systems, and public- and private-sector stakeholders. In 2009, Lumina launched a network-building effort, encouraging grantees to establish and/or strengthen regional or statewide college access networks.
The KnowHow2GO technical assistance team worked with network development experts to identify key dimensions of effective networks that could be used to support the work of KnowHow2GO grantees. The framework, which included elements such as “shared purpose of high importance to stakeholders,” and “data-driven decision making,” informed the development of a self-assessment tool to help grantees chart their progress along a continuum of network development. One of several methods used in the process evaluation of the KnowHow2GO initiative, the network survey served multiple purposes: It helped to clarify organizing principles that were fundamental to the development of the KnowHow2GO networks. It allowed Lumina, KnowHow2GO partners and their evaluation team to triangulate other evaluation data (e.g., network leader and staff interviews and program reports). With repeated use, it provided grantees with an overview of network functioning so they could see trends and make internal adjustments. It also helped guide technical assistance and professional development efforts to individual networks.
Evaluators included network survey results in annual evaluation reports to funders as well as in grantee-specific reports shared with network coordinators. Several grantees participated in the survey to support the national evaluation, but did not use the results for the evaluation of their own network efforts. Other grantees used the network survey to inform their work and measure progress toward expected outcomes. According to the team who developed the survey initiative, sharing results at the state-level and evaluation team presentations at grantee network meetings helped to increase utilization of findings.
For additional details including the KnowHow2Go network survey protocol: Measuring Dimensions of Network Functioning: The KnowHow2GO Network Survey
Network Health

25
Part 3:Network Results
26
CASE STUDY
Massachusetts Regional Networks to End Homelessness Pilot Evaluation2009 - 2011
Evaluation Overview
It’s rare to see evaluations that thoroughly address both a network’s development and its impact on external stakeholders as well as other outcomes. The evaluation of the Regional Network to End Homelessness (RNEH) pilot in Massachusetts stands out as a comprehensive effort that combined the monitoring of network development with an examination of the connection between network-based implementation of innovations to prevent homelessness and the outcomes achieved.
A multilayered, mixed methods evaluation teased apart the various strands of network efforts in ten regions of the state. Results spurred the state’s decision to continue to support regional cross-sector collaboration to end homelessness and encouraged state and other funders to invest substantially in network coordination of homeless service provision on a regional basis.4 At the same time, the real-time use of reporting from the evaluation research, combined with peer learning sessions, accelerated the spread of network-building best practices throughout the pilot networks.
Key Evaluation Questions:
• Are regional broad-based cross-sector networks effective vehicles for implementing housing focused approaches to ending homelessness?
• What capacities do networks need to do this work?
• Can network-based housing focused interventions reduce the need for shelter and drive systems change?
4 Sources for this case study include the Regional Networks to End Homelessness Pilot Evaluation Final Report (2011), interviews with Director of Special Initiatives Susanne Beaton, Fireman Foundation, DHCD Associate Director Robert Pulster and ICHH Director Elizabeth Rogers.
Network Results

27
Evaluation Methods: focus group interviews, quantitative and qualitative reporting by networks, and network member responses to a Network Health Survey.
Cost of external network assessment: In addition to internal state commitments: about $120,000.
Background
In 2008, the Massachusetts Special Commission to End Homelessness called for a system redesign that would reduce reliance on shelters as a strategy to address homelessness in the Commonwealth and convert shelter expenditures into resources for housing. The Massachusetts Interagency Council on Housing and Homelessness (ICHH) responded by releasing a Request for Responses (RFR) inviting stakeholders from around the state to test innovative strategies that could inform emerging statewide housing approaches. The goal of the pilot was to demonstrate how housing-focused innovations and regional-level coordination could improve the Commonwealth’s ability to eliminate homelessness.
The state’s investment in regional networks rather than in individual organizations was deliberate. Compared to shelter-centered approaches, housing-focused approaches require coordination among a broader group of stakeholders to get “the right resources to the right people at the right time” and facilitate re-housing as quickly as possible. (For more information about the innovations tested, see http://www.ppffound.org/documents/ichh_final_report.pdf.) The ICHH also anticipated that system re-design would benefit from the opinions, resources and support of people not traditionally involved in the homeless service system. “We wanted to understand how the organizations were being thoughtful about meeting the diverse needs of their clientele,” explains ICHH Director Elizabeth Rogers. The RFR identified eligible candidates for the 18-month pilot as regional broad-based cross-sector collaborations that reflected a public-private partnership. Membership might include municipal leaders, philanthropies, business leaders and advocacy groups in addition to entities that provide services to the homeless.
In all, 10 regional networks participated in the pilot, reaching every community in Massachusetts. Eight networks were funded with state resources and two with support from the Paul and Phyllis Fireman Charitable Foundation, which also funded the evaluation. According to Foundation senior executive Susanne Beaton, the pilot came at a critical time in a statewide conversation about homeless services and systems change. Contributing to the evaluation gave the Foundation a “seat at the table” to ensure that successful innovations and the collaborations that produced them were thoroughly documented. The evaluation would not have occurred without the foundation’s support. “It’s very difficult to fund an evaluation with state resources, because it’s expensive,” says Rogers. “You’re trying to fund as many services as possible.”
Network Results
28
Embedding a comprehensive evaluation into the state’s pilot, rather than waiting until later to assess the effort, was also a way to signal to the networks that “at the beginning, there would be some kind of judgment” about the pilot’s efficacy, says Bob Pulster, who designed the RFR while Director of the ICHH prior to assuming his position as Associate Director of the Division of Housing Stabilization within the Commonwealth’s Department of Housing and Community Development.
Evaluation Design
The ICHH and Fireman Foundation anticipated that networks would experiment with new ways of working and adapt these over time. Given the limited period for the pilot, the bias in the evaluation was toward regular actionable reporting so that the networks could adjust their strategies based on data in “real time.”
The ICHH, external evaluators and the regional networks each had an important role to play. The ICHH provided daily counts of the number of families in EA-funded motels (since all contracted shelter units were full). Networks reported on progress toward shared goals and benchmarks outlined in a Regional Network Work Plan.5 As required by the ICHH, some of these goals were client-centered, such as reducing the need for shelter and achieving housing placement outcomes. Others focused on network-related outcomes, such as increasing opportunities for broad-based discussion with diverse stakeholders. Networks’ reporting responsibilities included:
• Continuous use of a uniform assessment tool capturing client-level assessment data, services provided and client outcomes;
• Quarterly reporting on progress toward goals in the network work plan, including aggregate client outcomes and network development outcomes;
• Quarterly submission of short case studies describing challenges and promising practices related to client-centered interventions and network organizing.
Network evaluation activities led by an external network evaluator included:
• Baseline and follow up focus groups with representatives from regional networks to document each network’s structure and operations, and changes over time;
• A Network Health Survey administered to all network members to document their assessment of their network’s progress. The Network Health Survey was adapted from an existing tool to measure network effectiveness.6
5 The ICHH set out broad goals that the Regional Networks were required to address as they tested the viability of new approaches. These were: 1) Reduce the Need for Shelter and Achieve Housing Placement Outcomes 2) Collect Data and Measure Impacts 3) Create Opportunities for Broad-based Discussion with Diverse Stakeholders 4) Implement a Regional System that is a Model for Accountability and Transparency to Consumers and the Public 5) Build Systems Change and Accountability
6 Network Health Scorecard developed by Cause Communications and Network Impact.
Network Results
29
The ICHH and the Fireman Foundation also assembled a joint TA/Evaluation team of experts to develop technical assistance as well as peer learning opportunities for the regional networks in line with network needs surfaced through the evaluation.
Network Evaluation Implementation
The evaluation process involved five major steps:
1. Baseline focus groups with a cross-section of network members. Each network was required to create a leadership council with broad-based multi-stakeholder participation and systems for network communications and coordination, and was encouraged to build on, as well as expand or reconfigure, existing regional partnerships. To confirm each network’s structure and strategy and the rationale for these, the evaluator conducted focus group interviews with a cross section of network members soon after the pilot’s launch. Concurrent interviews conducted by homelessness prevention specialists also established which housing-focused innovations the network would test. Focus groups and interviews occurred during site visits, which helped evaluators understand the regional contexts for network efforts.
2. Quarterly reports from the networks provided point-in-time information about progress toward network development goals set out in the networks’ work plans. Narrative accounts that networks included in their case studies offered valuable insights into how these arrangements were working in practice.
3. Midterm focus groups. Since quarterly reports were providing an excellent record of network activities and results, the TA/Evaluation team decided to limit midterm focus groups to a handful of representatives from each network, including the network’s coordinator. (As in many other network initiatives, coordinators were emerging as network “hubs,” with a perspective on network efforts at every level. Interviews revealed that coordinators from different networks were facing many of the same challenges. In subsequent months, the ICHH Director hosted monthly coordinator conference calls so that coordinators could share promising practices and lessons learned.)
4. Network Health Survey. Just after the midpoint in the pilot period, the evaluator administered a Network Health Survey to all regional network members. The survey included questions about resources, infrastructure and network collaborations that are pertinent to most networks, as well as questions about network capacity and performance related to ICHH pilot goals. The survey was originally conceived as a means to capture members’
Network Results
30
perceptions of network effectiveness at pilot completion, but the TA/Evaluation team decided to administer the survey early so that networks could make mid-course adjustments based on results. Each network received their individual results as well as a comparison of regional network scores.
5. Focus group interviews with network members after pilot completion. The evaluation team designed a Pilot Closing Event to capture network members’ perspectives on their successes and challenges. Attended by a broad cross-section of members from all networks, the event allowed evaluators to document overarching themes. Additional detail was provided through final quarterly reports in which networks offered a brief narrative reflection on progress with regional network goals.
Network Evaluation Conclusions
The 89-page evaluation report was widely distributed to key state legislators, members of the ICHH, legislative allies, all of the networks’ members, shelter providers and others. “We used it as a planning tool internally to affect additional programming,” says Rogers. The report focused on three aspects: the process of network development; the outcomes of network development process; and the impact of the networks.
Network Development Processes
Noting significant differences between the networks’ development processes, the evaluation found that:
• Collaborative partnerships with a broad range of stakeholders allowed networks to identify and serve clients at the earliest possible stage.
• Network coordinators played a critical role in developing and maintaining region-wide systems for efficient collaboration. Networks with coordinators in place early in the pilot were better able to sort out network work plans and timelines and implement proposed innovations quickly.
• The time and resources devoted to building and deepening connections among network members yielded higher personal satisfaction with the work in addition to more efficient coordination.
• In some networks, service coordination continued to occur mainly among shelter or homeless service providers despite growing evidence that collaborations among employment, education, housing and other mainstream
Network Results

31
service providers were improving outcomes for families.
• Regular opportunities for peer exchange accelerated the spread of best practices.
• On-going evaluation reporting to the networks led to changes in network organization. For example, results of the Network Health Survey prompted several regions to adjust their membership or membership responsibilities and improve internal communications.
Network Development Outcomes
The evaluation created a record of the networks’ progress in developing network infrastructure such as leadership councils with broad representation, a dedicated coordinator, shared tools and more. Despite these supports for network cooperation, some networks were more effective than others in creating efficient vehicles for the delivery of housing - focused interventions. For example, preexisting partnerships affected the configuration of new collaborations, providing some regions with connections that could be more easily leveraged to support housing-focused work.
According to the ICHH’s Rogers, use of the Network Health Survey was pivotal, because it allowed comparison of network members’ perceptions of progress with evaluation data from other sources (quarterly reports, information form coordinators) and confirmed that, in the view of most network members, new ways of working held promise. “Seventy percent of the respondents said they were working with people they had never worked with before,” she notes, “and they were delivering services in a more effective way than they had done before.”
Network Results
The ICHH’s final calculation of outcomes for clients served through the pilot showed that the networks’ innovations prevented 10,883 families from becoming homeless, housed 376 chronically homeless adults, re-housed 409 homeless individuals, and diverted 839 families from shelter. Monitoring and evaluation of the networks’ activities identified the innovations that most contributed to these results, including court-based prevention and tenancy preservation in partnership with private and public landlords and co-location of prevention staff and resources. These and other innovations required new ways of working through the regional network model. The report concluded that “Regional Networks … are an effective platform on which to build innovative and efficient homelessness prevention, shelter diversion, triage and rehousing services.” Based on
Network Results
32
an analysis of shelter use and length of stay data, the ICHH further concluded that “cost savings associated with the Networks’ interventions around prevention, diversion and rapid re-housing suggest that these new ways of working can pave the way for further conversion of EA shelter spending to flexible housing resources.”
The evaluation offered a set of recommendations to the Governor’s office and the legislature concerning use of the network model, including:
• The regional networks should continue to coordinate resources across multiple client access points and facilitate broad-based discussions.
• The state should continue to provide technical assistance to regional networks related to data and evaluation. Working with the ICHH, networks should continue to assess effectiveness and network health, use data strategically to improve outcomes, lead regional planning efforts based on data, and make the case for programmatic or policy changes necessary to end homelessness.
Evaluation Application
The evaluation’s documentation of the networks’ record of success led the United Ways of Massachusetts and the ICHH to immediately commit $1 million to support network coordination in all regions through the following fiscal year. As a direct consequence of pilot results, the state legislature approved HomeBASE, a major new program that builds on the innovations successfully used in the pilot. Nine of the ten regional networks continue to function, says Rogers — meeting and running working groups. “In one memorable case, a network redid its ten-year plan and institutionalized the network.” And the legislature and the Governor’s office continued to consider systems change strategies that will re-purpose shelter resources to further investments in housing.
For additional information about this assessment: Massachusetts Interagency Council on Housing and Homelessness Regional Networks to End Homelessness Pilot Evaluation Final Report
Network Results
33
MINI-CASE STUDY
The Fire Learning Network Case Study
2005 - 2010
The goal of the U.S. Fire Learning Network is to address the threat of fire suppression practices to large landscapes in the United States by leveraging lessons from conservation practitioners and their landscape partners, including federal agencies, state agencies, private land owners and county representatives. In 2005, two researchers proposed to study the Fire Learning Network (FLN) as a model for “multi-scalar” collaborative learning. The Nature Conservancy’s Lynn Decker, director of the FLN, agreed, reasoning that an external assessment would provide knowledge and perspective about the FLN that she and other network members didn’t have. The study that emerged tested the hypothesis that, by organizing as a network, the FLN accelerates learning and contributes to changes in fire management practices at landscape, regional and national levels.
The assessment unfolded over a period of five years using a case-study approach. Researchers conducted interviews with network leaders, participants, and high-level staff in participating organizations, observed and recorded audio in regional and national workshops and leadership meetings, and conducted extensive document review including review of fire restoration plans, inter-organizational agreements, meeting agendas, meeting summaries, network newsletters, listserv communications, and media reports. The case study offered insight into how the FLN links multiple place-based collaboratives in a larger network at regional and national scales and how the circulation of people, products and information in the network prompts the generation and spread of innovative fire planning and management techniques. Case details illustrate how FLN landscape collaboratives and regional networks have facilitated integration of ecological restoration objectives and practices into public agency fire and land management planning. Examples include revisions to the Ozark-Saint Francis National Forest Land and Resource Management Plan based on landscape-scale ecological restoration approaches and planning products developed by the FLN. Additional examples of the network’s influence include the use of FLN collaboratives as models in federal legislation leading in 2009 to increased U.S. federal-level support for collaborative landscape-scale restoration projects.
Researchers shared and discussed findings with Decker and other FLN managers at intervals over the course of the study. This allowed managers to make small adjustments to improve the network’s function and outcomes. According to Decker, researchers’ insights on network theory and collaboration science helped them incorporate best social
Network Results

34
science into management of the network faster.
For additional details about this assessment refer to the article The US Fire Learning Network: Springing a Rigidity Trap through Multiscalar Collaborative Networks; the journal article, The Fire Learning Network: A Promising Conservation Strategy for Forestry or a blog post with an interview of the network’s director, The Fire Learning Network Goes Under the Microscope.
Network Results
35
MINI-CASE STUDY
International Land Coalition Independent Review of Implementation and Impact
2010 - 2011
The International Land Coalition (ILC) is a global alliance of civil society and intergovernmental organizations working to promote secure and equitable access to and control over land for poor women and men through advocacy, dialogue, knowledge sharing and capacity building. Since its founding in 1995, the ILC has grown to encompass 116 organizations based in 46 countries.
In 2010, the ILC commissioned an independent assessment of ILC’s influence during the period 2007-2011 as input to the development of its 2011-2015 strategy plan. The assessment was led by a team of evaluators and focused on the ILC’s development as a network. The scope of the assessment was limited by insufficient definition of baseline conditions and obstacles with surveying of members. Nevertheless, evaluators were able to gather relevant data through interviews and focus groups with ILC members, observation of a 2010 ILC Council meeting and extensive document review. A first step in the assessment was to match activities and outputs described in ILC reports with objectives outlined in the ILC’s 2007-2011 strategic framework and locate these within an implicit ILC theory of change. Evaluators then used information from multiple sources to identify key ILC achievements under each objective, for example, adoption of pro-poor perspectives in international agendas and national level policy. Evaluators also assessed ILC network development during the 2007-2011 period, such as increases in the quality and density member interactions, progress toward being member led, and capacity for joint action. Using this network lens led to several important insights and four recommendations, including one to expand multi-stakeholder participation in the ILC and increase collective action to ensure that international agreements are implemented in practice. In their 19-page summary report, evaluators also proposed a reframe of ILC strategic objectives within a theory of change that more clearly reflects network principles. ILC Director Madiodio Niasse reported that this independent review of network performance for the period 2007-2011 led to a radical collective reflection within the ILC about the Coalition’s comparative advantage and its positioning in the future.
For more information about this assessment you can refer to Summary Report: An Independent Review of the Implementation and Impact of the International Land Coalition 2007-2011 Strategic Framework, IScale (2011) and A New Approach to Multi-Stakeholder Network Assessment, Steve Waddell (2011).
Network Results

36
Bonus: Communicating Evaluation Findings
MINI-CASE STUDY
The Knight Foundation Macon Money Game Evaluation
2012 - 2012
In 2010, the Knight Foundation funded two social impact games as pilot projects. Unlike the digital games that the foundation had previously supported, these games took place in real-time with people in the real world and they supported ongoing efforts to tackle local issues. To learn about the impact of these innovative games, the foundation engaged a collaborative team with network evaluation and communications expertise. Communicating the results of the evaluation was considered a priority from the start. Anticipated audiences included Knight Foundation board and staff, other funders who were interested in investing in social impact games, social change makers who were curious about best uses for game mechanics as tools for advancing their initiatives, and members of the game developer community who might have an interest in looking more closely at real life games and outcomes beyond actions taken within a game.
The Macon Money game took place in Macon, Georgia in 2011, and used a mechanic that involved an alternative currency to bring people from different backgrounds together while attracting residents to local businesses. The evaluation of the game included a survey administered to residents when they joined the game and again after the game ended, interviews with players and observation of the game, and an ongoing analysis of game website and Facebook traffic. Results confirmed that the game was successful in achieving its main goals: a large proportion of players made connections with other residents whom they might not have met otherwise and purchased items from local businesses that they had not visited before.
Knight Foundation staff and the evaluation team worked with the game designer and with the game’s community partners to blog about the games and share what the foundation was learning. In order to communicate findings to a broad spectrum of interested audiences, the evaluation team also generated a microsite with infographics and data visualizations, brief PowerPoint presentations posted on SlideShare, a highly designed and visually compelling evaluation findings brochure in addition to a more conventional narrative report. Results were also shared directly with the media to generate coverage in the technology press (Wired magazine), niche and trade publications such as New Scientist and Next City as well as the philanthropic media. This multi-pronged approach helped to draw attention to the topic: the Macon Money evaluation was a top tweeted item
Bonus Material

37
at the Games4Change conference on the day it was presented; the games evaluation section became one of the top visited areas of the Knight Foundation site that year.
More information about the evaluation and accompanying communications materials can be found at: Knight Foundation Social Impact Games: Do they work? and Macon Money Matches Data Visualization.
Network Results

38
Networks and Evaluation Additional Resources
Catalyzing Networks for Social Change: A Guide for Funders Insights from the Network of Network Funders community of practice are incorporated into this guide for grantmakers. Diana Scearce, Monitor Institute and Grantmakers for Effective Organizations, 2011
Connecting to Change the World: Harnessing the Power of Networks for Social Impact This resource offers easily understandable, field-tested information on how to form, manage and evaluate social-impact networks. Peter Plastrik, Madeleine Taylor and John Cleveland, Island Press, 2014
Evaluating International Social Change Networks: A Conceptual Framework for a Participatory Approach A detailed inventory of key dimensions of international social change networks that can be assessed using participatory approaches. Ricardo Wilson-Grau and Martha Nunez, Development in Practice, 2007
Knowledge Networks: Guidelines for Assessment A working paper prepared for the International Institute for Sustainable Development that includes a multi-dimensional framework for evaluating international knowledge networks. Heather Creech and Ali Ramji, 2004
Net Gains: A Handbook for Network Builders Seeking Social Change Using a variety of case examples, this guide summarizes basic concepts and approaches for building networks for social change. Peter Plastrik and Madeleine Taylor, 2006.
Network Evaluation: Cultivating Healthy Networks for Social Change Network evaluation strategies and easy-to-use tools designed for network practitioners. Eli Malinsky and Chad Lubelsky, Centre for Social Innovation and Canada Millennium Scholarship Fund, 2011
Networks and Evaluation A brief, high-level overview of network evaluations techniques. June Holley, Impact Alliance, 2007
Next Generation Network Evaluation Reviews the field of network monitoring and evaluation identifying where progress has been made and where further work is needed. Innovations for Scaling Impact and
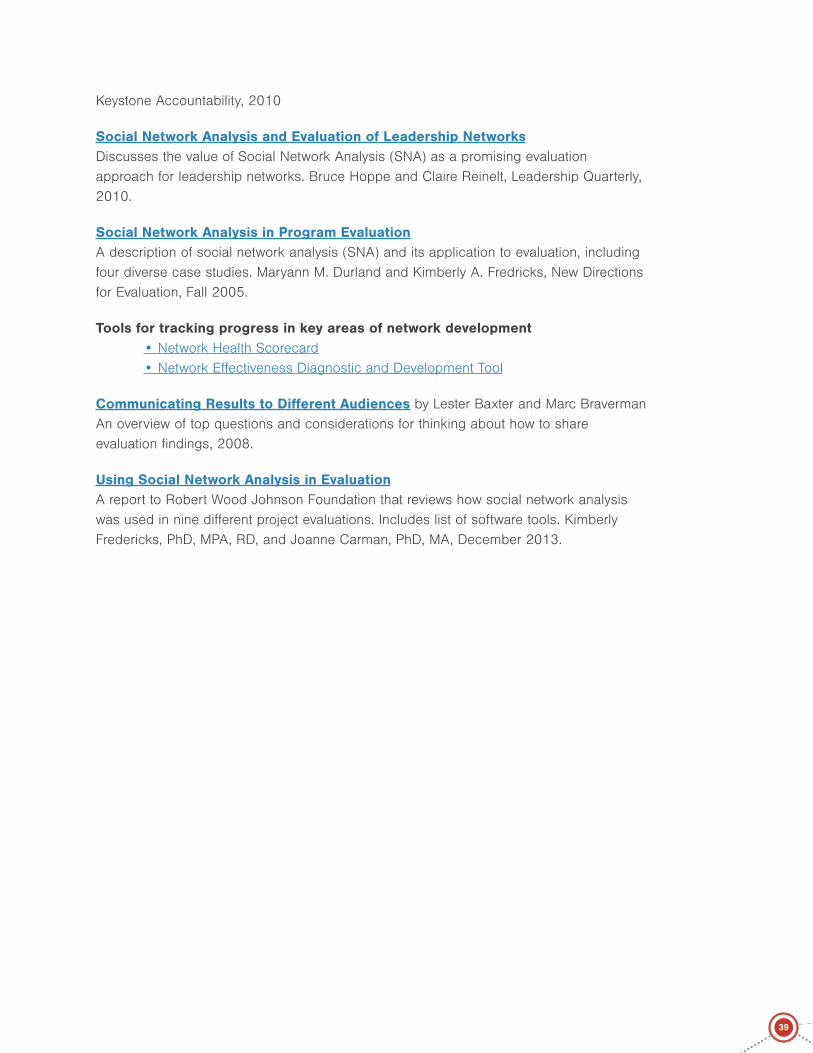
39
Keystone Accountability, 2010
Social Network Analysis and Evaluation of Leadership Networks Discusses the value of Social Network Analysis (SNA) as a promising evaluation approach for leadership networks. Bruce Hoppe and Claire Reinelt, Leadership Quarterly, 2010.
Social Network Analysis in Program Evaluation A description of social network analysis (SNA) and its application to evaluation, including four diverse case studies. Maryann M. Durland and Kimberly A. Fredricks, New Directions for Evaluation, Fall 2005.
Tools for tracking progress in key areas of network development • Network Health Scorecard • Network Effectiveness Diagnostic and Development Tool
Communicating Results to Different Audiences by Lester Baxter and Marc Braverman An overview of top questions and considerations for thinking about how to share evaluation findings, 2008.
Using Social Network Analysis in Evaluation A report to Robert Wood Johnson Foundation that reviews how social network analysis was used in nine different project evaluations. Includes list of software tools. Kimberly Fredericks, PhD, MPA, RD, and Joanne Carman, PhD, MA, December 2013.

40
Thank you to the David and Lucille Packard Foundation, the California Endowment, the W.K. Kellogg Foundation and the Jim Joseph Foundation for their support of this project.
Thank you to our advisory committee that provided input on the framing paper and the casebook: Chip Edelsberg, Adene Sacks, and Diana Scearce.
Thank you to the network builders whom we interviewed whose comments informed this work: Susanne Beaton, Seth Cohen, Heather Creech, Roberto Cremonini, Audrey Jordan, Marty Kearns, Nushina Mir, Julia Parzen, Robert Pulster, Kathy Reich, Elizabeth Rogers, and Darryl Young.
This network evaluation project is a collaboration between Network Impact and the Center for Evaluation Innovation.
About Network Impact
Most people are natural networkers, but it takes real know-how and skills to develop and grow networks that achieve large-scale social impact. Network Impact is accelerating and spreading the use of networks to achieve increased social impact by providing consulting, tool-building, research and assessment services to support social-impact networks, foundations, and the emerging
field of network builders. www.NetworkImpact.org
About the Center for Evaluation Innovation
The Center for Evaluation Innovation is dedicated to pushing evaluation practice in new directions and promoting cutting-edge approaches. We develop and commission original research on emerging evaluation questions and challenges. We also ask people doing cutting-edge work to write about their experiences and findings. As new fields of practice emerge, it is useful
to bring people together periodically to discuss and share what we all are doing and learning. We organize in-person and online conversations to accelerate field development and encourage new collaboration. www.EvaluationInnovation.org
Acknowledgments
JIM JOSEPHF O U N D A T I O NSh imon ben Joseph