Embed Size (px)
Citation preview
Evaluating immune activation and cellular determinants of thrombosis in pre-diabetes
BY: ZIBUSISO MKANDLA
Submitted in fulfilment of the requirements for the degree:
PhD: Physiology
Department of Human Physiology, College of Health Sciences, Westville, University of
KwaZulu-Natal, Durban, South Africa
2018
As the candidate’s supervisor I agree to the submission of this thesis.
ii
Preface
This thesis is in fulfillment of the requirements for Doctor of Philosophy degree Health sciences.
Chapter 1 describes the problem statement, the aims and research questions covered in the thesis.
Chapter 2 covers the literature review providing an overview of research providing rationale for the
current project. Three manuscripts submitted for peer review in accredited journals make up chapters
3, 4 and 5. Chapter 6 is the synthesis and conclusion summarizing the entire project.
This work has not been submitted in any form for any other degree or diploma at another institution.
Use of other people’s work has been acknowledged accordingly in-text.
Zibusiso Mkandla ……………………………… Date ………………………..
Dr. B Nkambule……………………………….. Date ………………………..
Dr. P Dludla………………………..………….. Date ………………………..
iii
Declaration
I……………Zibusiso Mkandla……………………………. declare that
I. The research reported in this thesis, except where indicated, is my original work.
II. This thesis has not been submitted for any degree or examination at any other university
III. This thesis does not contain other person’s data, pictures, graphs or other information unless
specifically acknowledged as being sourced from other persons.
IV. This thesis does not contain other person’s writing, unless specifically acknowledged as being
sourced from other researchers. Where other written sources have been quoted, then:
a. their words have been re-written but general information.
iv
Publications to international peer-reviewed journals
Under review
1. Mkandla, Z., Mutize, T., Dludla, P.V., Nkambule, B.B. 2018. High-fat-diet impairs
glucose tolerance and enhances platelet reactivity in C57BL/6 mice. Purinergic signalling,
(submitted for review).
2. Mkandla, Z., Mutize, T., Mazibuko-Mbeje, S.E., Dludla, P.V., Nkambule, B.B. 2018.
Metformin and low-dose aspirin reduce residual platelet activation in pre-diabetic mice.
Journal of Diabetes Investigation, (submitted for review).
Published manuscripts
1. Mkandla, Z., Mutize, T., Dludla, P.V., Nkambule, B.B. 2019. Impaired Glucose
Tolerance is Associated with Enhanced Platelet-Monocyte Aggregation in Short-Term
High-Fat Diet-Fed Mice. Nutrients
2. Dludla, P., Nkambule, B., Jack, B, Mkandla, Z., Mutize, T., Silvestri, S., Orlando, P.,
Tinao, L., Louw, J., Mazibuko-Mbeje, S. 2018. Inflammation and oxidative stress in an
obese state and the protective effects of gallic acid. Nutrients (Accepted)
3. Mutize, T., Mkandla, Z. & Nkambule, B.B. 2018. Global and gene-specific DNA
methylation in adult type 2 diabetic individuals: A protocol for a systematic review.
Systematic Reviews, 7(1): 1–5.
4. Nkambule, B.B., Mkandla, Z., Mutize, T. & Dludla, P.V. 2017. Platelet function and
cardiovascular risk in adult HIV-infected patients on HAART: A protocol for a systematic
review and meta-analysis. BMJ Open, 7(12): 1–5.
v
Conference presentations
1. Mkandla, Z., Mutize, T., Dludla, P.V., Nkambule, B.B 2017. TLR4 binding ligand mediates
the polarization of classical monocytes to M2 monocytes. College of Health Sciences Research
Symposium, 5-6 October 2017, University of KwaZulu-Natal, Durban, South Africa.
2. Mkandla, Z., Mutize, T., Dludla, P.V., Nkambule, B.B 2018. Increased platelet response to
endogenous agonists, in pre-diabetic C57BL/6 mice. European Hematology Association (EHA)
23rd Congress, 14-17 June 2018, Stockholm, Sweden.
3. Mkandla, Z., Mutize, T., Dludla, P.V., Nkambule, B.B 2018. Increased platelet-monocyte
aggregates in pre-diabetes. First Conference of Biomedical and Natural Sciences and
Therapeutics (CoBNEST), 7-10 October 2018. Spier Estate, Stellenbosch, Cape Town.

vi
Dedication
This thesis is dedicated to Ntandoyenkosi Mkandla and Sandile Mkandla

vii
Acknowledgements
Tinashe Mutize, Vuyo Mxinwa and Thabisile Mahlangu for the assistance throughout the course of the
study
The Biomedical research unit (BRU) for providing the animals, animal housing and conducting
procedures relevant to the study.
Human Physiology Department, Westville, laboratory technicians for assistance with lab procedures
and access to lab instruments and equipment.
The College of Health Sciences for PhD funding.
viii
Table of Contents
Preface .................................................................................................................................................... ii
Declaration............................................................................................................................................ iii
Publications to international peer-reviewed journals ....................................................................... iv
Conference presentations ..................................................................................................................... v
Dedication ............................................................................................................................................. vi
Acknowledgements ............................................................................................................................. vii
Table of Contents ............................................................................................................................... viii
List of figures ....................................................................................................................................... xii
List of tables........................................................................................................................................ xiii
Abbreviations ..................................................................................................................................... xiii
Abstract .............................................................................................................................................. xviii
Chapter 1. Introduction ........................................................................................................................ 1
1.1. Aims ............................................................................................................................................ 2
1.2. Research questions .................................................................................................................... 2
1.3. References .................................................................................................................................. 3
Chapter 2. Literature review ............................................................................................................... 5
2.1. Introduction ................................................................................ Error! Bookmark not defined.
2.2. Type 2 diabetes and cardiovascular disease (CVD) ................ Error! Bookmark not defined.
2.3. Inflammation in obesity and type 2 diabetes ........................... Error! Bookmark not defined.
2.4. Inflammatory mechanisms involved in diabetes-induced cardiovascular complications
Error! Bookmark not defined.
2.4.1. Tissue factor is implicated in pro-inflammatory induced injury ...... Error! Bookmark not
defined.
2.4.2. Platelet structure and function and its role pro-inflammatory induced endothelial
injury Error! Bookmark not defined.
2.5. Adenosine diphosphate (ADP) receptors involved in platelet activation and function
Error! Bookmark not defined.
2.5.1. P2Y1 receptors .................................................................. Error! Bookmark not defined.
2.5.2. P2Y12 receptor .................................................................. Error! Bookmark not defined.
2.6. Platelet signalling pathways ...................................................... Error! Bookmark not defined.
2.6.1. Cyclooxygenase pathway ................................................ Error! Bookmark not defined.
2.6.2. Calcium signalling .......................................................... Error! Bookmark not defined.
2.6.3. Protein kinase C .............................................................. Error! Bookmark not defined.
2.7. Platelet function in type 2 diabetes ........................................... Error! Bookmark not defined.
2.8. Glucose-lowering drugs and platelet function ......................... Error! Bookmark not defined.
2.9. Concluding remarks .................................................................. Error! Bookmark not defined.
ix
2.10. References ............................................................................... Error! Bookmark not defined.
Chapter 3. Research article one ......................................................................................................... 25
Increased platelet-monocyte aggregates in diet-induced pre-diabetes. .......................................... 25
3. Abstract ........................................................................................................................................ 26
3.1. Introduction ............................................................................................................................. 26
3.2. Methodology ............................................................................................................................ 27
3.2.1. Study design ...................................................................................................................... 27
3.2.2. Oral glucose tolerance tests ............................................................................................. 27
3.2.3. Blood collection for haematology characteristics and flow cytometry analysis ............. 28
3.2.4. Measurement of haematological parameters .................................................................. 28
3.2.5. Instrument set-up and optimization ................................................................................. 28
3.2.6. Measurement of baseline platelet-monocyte aggregates (PMA) .................................... 28
3.2.7. Measurement of PMA post stimulation with ADP .......................................................... 28
3.2.8. Gating strategy ................................................................................................................. 29
3.2.9. Statistical analysis ............................................................................................................ 29
3.3. Results ........................................................................................................................................... 29
3.3.1. Baseline characteristics ................................................................................................... 29
3.3.2. Baseline levels of monocytes and platelet-monocyte aggregates .................................... 31
3.3.3. Increased levels of PMAs post stimulation with ADP in the control group ................... 32
3.3.4. Increased levels of PMAs post stimulation with 20µM ADP in HFD group ................. 33
3.4. Discussion................................................................................................................................. 33
3.5. Acknowledgements ................................................................................................................. 34
3.6. Author contributions .............................................................................................................. 34
3.7. Ethical approval ...................................................................................................................... 34
3.8. References ................................................................................................................................ 35
3.9. Bridging chapter ..................................................................................................................... 38
Chapter 4. Research article two......................................................................................................... 39
High-fat-diet impairs glucose tolerance and enhances platelet reactivity in C57BL/6 mice ........ 39
4. Abstract ........................................................................................................................................ 40
4.1. Introduction ............................................................................................................................. 40
4.2. Methodology ............................................................................................................................ 41
4.2.1. Study design and animal care .......................................................................................... 41
4.2.2. Oral glucose tolerance tests ............................................................................................. 42
4.2.3. Blood collection for baseline measurements and flow cytometry analysis .................... 42
4.2.4. Measurement of baseline haematological parameters ................................................... 42
4.2.5. Platelet flow cytometry and platelet function analysis .................................................... 42
x
4.2.6. Baseline measurement of markers of platelet activation ................................................ 42
4.2.7. Platelet function analysis .................................................... Error! Bookmark not defined.
4.2.8. Agonist-induced platelet activation ................................................................................. 43
4.2.9. Gating strategy ................................................................................................................. 43
4.2.10. Statistical analysis ............................................................................................................ 44
4.3. Results ...................................................................................................................................... 45
4.3.1. Establishment of a pre-diabetic model ............................................................................ 45
4.3.2. Platelet activation post stimulation with ADP ................................................................. 50
4.3.3. Increased levels of platelet activation (%CD62P) and reactivity in response to
endogenous agonists in HFD group................................................................................................ 51
4.3.4. Increased CD36 expression post stimulation with agonists in HFD group ................... 52
4.4. Discussion................................................................................................................................. 53
4.5. Conclusion ............................................................................................................................... 56
4.7. Declarations ............................................................................................................................. 56
4.7.1. Ethics approval and consent to participate ..................................................................... 56
4.7.2. Consent of publication ..................................................................................................... 56
4.7.3. Availability of data and material ..................................................................................... 56
4.7.4. Competing interests .......................................................................................................... 56
4.7.5. Funding ............................................................................................................................ 56
4.7.6. Author contributions ........................................................................................................ 56
4.7.7. Acknowledgements ........................................................................................................... 57
4.8. References ................................................................................................................................ 57
4.9. Bridging chapter ..................................................................................................................... 61
Chapter 5. Research article three ...................................................................................................... 62
Dual metformin and low-dose aspirin therapy reduces residual platelet activation in pre-
diabetic mice ........................................................................................................................................ 62
5. Abstract ........................................................................................................................................ 63
5.1. Introduction ............................................................................................................................. 64
5.2. Methodology ............................................................................................................................ 65
5.2.1. Animal husbandry ............................................................................................................ 65
5.2.2. Induction of pre-diabetes and experimental design ........................................................ 65
5.2.3. Treatment randomization and oral glucose tolerance testing ........................................ 65
5.2.4. Blood collection and measurement of baseline haematological parameters ................. 65
5.2.5. Platelet function and reactivity measurements ............................................................... 65
5.2.6. Measurements of baseline platelet activation and reactivity .......................................... 65
5.2.7. Assessment of platelet function ....................................................................................... 66
xi
5.2.8. Statistical analysis ............................................................................................................ 66
5.3. Results ...................................................................................................................................... 66
5.3.1. Establishment of a pre-diabetic model ............................................................................ 66
5.3.2. P2Y12 receptor responses in HFD-fed mice following metformin and low-dose aspirin
treatment 69
5.3.3. P2Y12 receptor responses in HFD-fed mice following on low-dose aspirin treatment ... 69
5.3.4. P2Y12 receptor responses in HFD-fed mice following clopidogrel treatment ................ 69
5.3.5. Glycoprotein VI mediated responses in HFD-fed mice following low-dose aspirin and
clopidogrel treatment ....................................................................................................................... 71
5.3.6. Cyclooxygenase pathway response .................................................................................. 72
5.4. Discussion................................................................................................................................. 73
5.6. Acknowledgements ................................................................................................................. 75
5.7. Funding .................................................................................................................................... 76
5.8. Disclosure statement ............................................................................................................... 76
5.9. References ................................................................................................................................ 76
Chapter 6. Conclusion ........................................................................................................................ 81
6.1. Increased platelet activation in pre-diabetes ........................... Error! Bookmark not defined.
6.2. Platelet function in pre-diabetes ............................................... Error! Bookmark not defined.
6.3. High on-treatment platelet reactivity (HTPR) in pre-diabetes ............. Error! Bookmark not
defined.
6.4. References ................................................................................... Error! Bookmark not defined.
xii
List of figures
Chapter 2. Introduction
Figure 2.1. Illustration of the components of the Virchow’s triad that are altered in type 2 diabetes
mellitus (T2DM) ……………………………………..………………………………6
Figure 2.2 Illustration of the effect of hyperglycaemic conditions on platelet CD40L, monocyte
tissue factor (TF) mRNA and membrane surface protein……………………………..8
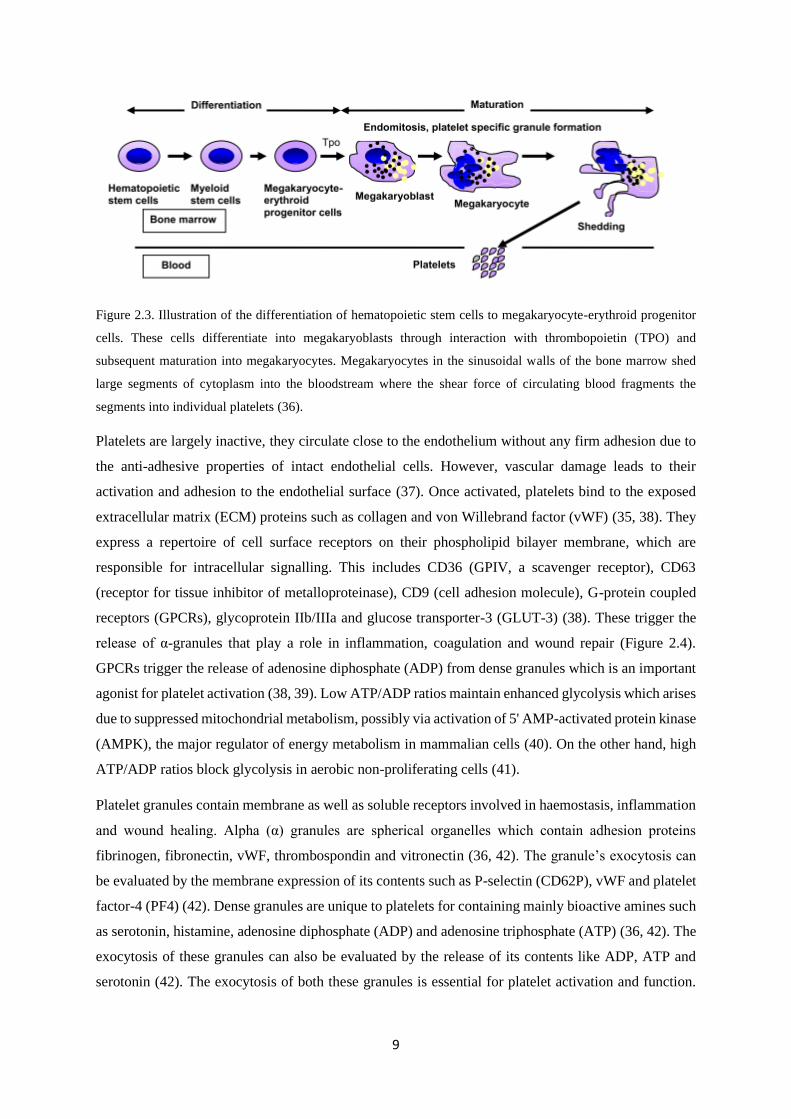
Figure 2.3. Illustration of the differentiation of hematopoietic stem cells to megakaryocyte-
erythroid progenitor cells…………………….…………………………….....……....9
Figure 2.4. Illustration of the structure of a resting platelet………………….………….……….10
Figure 2.5. Illustration of pathways involved in platelet activation and the cyclooxygenase (COX)
inhibitory role of aspirin………………….………………………….……..………..15
Chapter 3. Research article one
Figure 3.1. Gating strategy for the analysis for platelet-monocyte aggregates (PMAs)……….....29
Figure 3.2. Monocyte and platelet-monocyte aggregate levels between the control group and the
high-fat diet (HFD) group…………………………………..………………….……..31
Chapter 4. Research article two
Figure 4.1. Platelet gating strategy………………..……………………………...……….…..….44
Figure 4.2. Animal weight and glucose control…………….………………………..…….……..46
Figure 4.3. Correlations between red blood cell-bound platelet and freely circulating platelets in
the control diet group………………………..…..……………………………...…….47
Figure 4.4. Correlations between red blood cell-bound platelet and freely circulating platelets in
the high-fat diet group………………………………………………………....……..48
Figure 4.5. Biphasic platelet activation post stimulation with 4µM and 20µM ADP……………..50
Figure 4.6. Platelet activation and function post stimulation with collagen and arachidonic
acid…………….….………………………………………………………………….53
Chapter 5. Research article three
Figure 5.1. Platelet reactivity index in low-dose aspirin (monotherapy) and dual therapy (low-dose
aspirin + Metformin)…………………………………...…………………………….71
Figure 5.2. Monotherapy and dual therapy platelet reactivity……………...…………….……….72
xiii
List of tables
Chapter 3. Research article one
Table 3.1. Baseline characteristics……………………………………………….……………...30
Table 3.2. Baseline platelet monocyte aggregate (PMA) levels………………………….……...32
Table 3.3. PMA levels post stimulation with ADP……………………………………….…...…32
Chapter 4. Research article two
Table 4.1. Baseline haematological parameters……………………………………..…….……45
Table 4.2. Quantitative (%CD41) comparison of red blood cell bound platelets between control
and high-fat diet………………………………………………...………………....…49
Table 4.3. Qualitative (CD41 MFI) comparison of red blood cell-bound platelets between control
and high-fat diet……………………………………………...….………………...…49
Table 4.4. Platelet reactivity post stimulation with endogenous agonists………..……………....51
Table 4.5. CD62P expression post stimulation with collagen and arachidonic
acid………………………………………………...……………………………........52
Table 4.6. CD36 expression post stimulation with collagen and arachidonic
acid…………………………………………...…………………………………...….52
Chapter 5. Research article three
Table 5.1. Baseline characteristics of pre-diabetic mice and controls…………..………....…….67
Table 5.2. %CD62P platelet response in low-dose aspirin, metformin and low-dose aspirin,
clopidogrel-treated pre-diabetic mice………………………………………….…......70
Table 5.3. %CD36 platelet reactivity in response to agonist stimulation…………………….......73
Abbreviations
ADP- adenosine diphosphate
AMPK- 5’ AMP-activated protein kinase
AREC- animal research ethics committee
Asp- low-dose aspirin
ASVD- atherosclerotic vascular disease
ATP- adenosine triphosphate
xiv
AUC- area under the curve
BD- Becton Dickson
BRU- biomedical research unit
CA- California
CAD- coronary artery disease
CD40L- CD40 ligand
CHS- College of health science
Clo- clopidogrel
COX-1- cyclooxygenase-1
COX-2- cyclooxygenase-2
cPGES- cytosolic prostaglandin E synthase
CST- cytometer set-up and tracking
CVD- cardiovascular disease
DAG- 1,2 diacyl-glycerol
EC- endothelial cell
ECM- extracellular matrix
FIC- fogarty international centre
GM-CSF- granulocyte macrophage colony stimulating factor
GPCR- G-protein coupled receptor
GPIV- glycoprotein-IV
HFD- high fat diet
hsCRP- high sensitivity c-reactive protein
hsIL-6- high sensitivity interleukin-6
HTPR- high on treatment platelet reactivity
IFN-γ- interferon γ
IL-1- interleukin 1
xv
IL-6- interleukin 6
IL-8- interleukin 8
IL-β- interleukin β
IP3- inositol-1, 4, 5-triphosphate
IQR- interquartile range
IR- insulin receptor
JPAD- Japanese primary prevention of atherosclerosis with aspirin for diabetes
LBP- LPS binding protein
LPS- lipopolysaccharide
MCP-1- monocyte chemoattractant protein-1
MeSH- medical subheadings
Met- metformin
MFI- mean fluorescence intensity
MI- myocardial infarct
MIP-1- macrophage inflammatory protein 1
mPGES- microsomal prostaglandin E synthase-1
MPV- mean platelet volume
mRNA- messenger ribonucleic acid
NJ- New Jersey
NO- nitric oxide
NOS- nitric acid synthase
NRF- National Research Foundation
OCS- open canicular system
OGTT- oral glucose tolerance test
PAC-1- procaspase activating compound 1
PAI-1- plasminogen activator inhibitor-1
xvi
PAR- protease activated receptor
PBMC- peripheral blood mononuclear cells
PDGF- platelet derived growth factor
PF4- platelet factor 4
PGIS- prostaglandin I synthase
PI3K- phosphoinositide-3 kinase
PKC- protein kinase C
PLA- phospholipase A
PLC- phospholipase C
PLT- freely circulating platelets
PMA- platelet monocyte aggregate
PRI- platelet reactivity index
PSGL-1- P-selectin glycoprotein ligand-1
QC- quality control
RANTES- regulated on activation, normal T-cell expressed and secreted
RBC-PLT- red blood cell bound platelets
RNA- ribonucleic acid
SD- standard deviation
sICAM- soluble intercellular adhesion molecule
sP-selectin- soluble P-selectin
sVCAM- soluble vascular cell adhesion molecule
T2DM- type 2 diabetes mellitus
TF- tissue factor
TF-ĸB- transcription factor ĸB
TNF-α- tumour necrosis factor α
TP- thromboxane receptor
xvii
TPO- thrombopoietin
TRAP- thrombin receptor activating peptide
TxA2- thromboxane A2
TxS- thromboxane synthase
UKZN- University of KwaZulu-Natal
USA- United States of America
VSMC- vascular smooth muscle cells
vWF- von Willebrand factor
xviii
Abstract
Introduction
Platelet dysregulation in pre-diabetes plays a major role in the progression of prothrombotic and pro-
inflammatory conditions. Cardiovascular disease (CVD), which may occur at the pre-diabetic stage, are
a common cause of morbidity in diabetic individuals. Despite treatment, people living with type 2
diabetes are at an increased risk of developing CVD, which is attributed to increased platelet activation
and platelet mediated cellular cross-talks. The aim of the study was to investigate platelet activation and
function in prediabetes and to further evaluate the effects of oral glucose lowering and anti-
inflammatory therapy on platelet function a pre-diabetic state.
Methodology
Male mice were fed experimental diets, control low-fat diet (D12450J 10 kcal% fat) and a high-fat diet
(HFD) (D12492, 60 kcal% fat) (Research Diets, NJ, USA). Platelet activation was determined by
measuring the formation of spontaneous platelet-monocyte aggregate (PMA). The high-fat diet (HFD)
fed mice were then randomized into 3 treatment groups; metformin (150mg/kg) and low-dose aspirin
(3mg/kg) dual therapy; low-dose aspirin (3mg/kg); and clopidogrel (0.25mg/kg). The drugs were
administered orally, once a day, every day for 3-weeks. We determined the pre-diabetic status of the
mice by measuring their oral glucose tolerance and insulin levels. We further measured the
haematological parameters. Platelet function and reactivity were determined by stimulating them with
endogenous agonists, adenosine diphosphate (ADP), collagen and arachidonic acid, before and after
treatment.
Results
Overall, there were no significant differences in the baseline characteristics such as body weights and
insulin levels. However, after three weeks on the experimental diets, the high-fat diet (HFD) fed group
exhibited delayed glucose clearance (p=0.0362). Baseline levels of platelet-monocyte aggregates were
increased in the HFD group, p=0.0156. Post-stimulation with 4µM ADP and 20µM ADP, the HFD
group expressed elevated levels of activated platelets, p<0.05. Metformin and low-dose aspirin-
treatment inhibited reversible platelet aggregation, p=0.0220. While, residual platelet activation was
observed at a concentration of 20µM ADP, p=0.0535. In the low-dose aspirin group, there were no
significant variations in platelet reactivity following stimulation with ADP, p>0.05. Clopidogrel
treatment inhibited the platelet response to 20µM ADP (p=0.0313).
Conclusion
Despite anti-platelet treatment in pre-diabetes, platelets exhibit a varied response to endogenous
agonists. Therapeutic targeting of these pathways may reduce the risk of thrombotic complications in

xix
pre-diabetes. We further highlight the potential synergistic benefit of using dual oral glucose lowering
and antiplatelet treatment to minimize the high on-treatment platelet responses observed in pre-diabetes
and T2DM.
1
Chapter 1. Introduction
The metabolic syndrome, a cluster of insulin resistance, hyperinsulinaemia, dyslipidaemia,
hypertension and obesity, is a common risk factor for both type 2 diabetes mellitus (T2DM) and
cardiovascular disease (CVD) (1,2). In diabetics, the prevalence of masked hypertension may reach
26.5%, which is associated with 31% higher odds of developing CVD in comparison with non-diabetics
(3). Most individuals with T2DM are obese, and the global epidemic of obesity has played a major role
in the dramatic increase in the incidence and prevalence of noncommunicable diseases in recent years
(4). Low-grade chronic inflammation, which is characterised by abnormal adipokine and pro-
inflammatory signalling is one of the foremost factors identified in obese and T2DM individuals (5).
For the latter, persistent levels of pro-inflammatory proteins can activate and upregulate the expression
of tissue factor (TF), which is the initiator of the extrinsic coagulation cascade, on the surface of
endothelial cells resulting in increased risk of atherothrombotic conditions (6). Activation of the
extrinsic pathway results in the enzymatically active complex (FVIIa) which activates FIX and FX
(serine proteases for the coagulation cascade). This ultimately leads to thrombin generation, as well as
activation of fibrinogen and fibrin stabilizing factor FXIII in association with fibrin clot formation (7).
Currently, there are limited therapies available to protect diabetic individuals at risk of developing the
aforementioned complications. However, metformin, which is a commonly used glucose-lowering
drug, is known to reduce platelet activation in newly diagnosed subjects with T2DM (8). Some of the
mechanisms by which metformin induce its effects include enhancing intracellular antioxidants leading
to the reduction of oxidative stress, as well as blocking plasminogen activator inhibitor-1 (PAI-1),
thereby promoting fibrinolysis in diabetic individuals (1). Metformin also reduces the levels of FVII,
fibrinogen and also shortens fibrinolysis times in non-diabetic individuals with a high hip-to-waist
circumference ratio (1,9).
Much evidence points to accelerated thrombogenesis and fibrinolysis in remaining the main underlying
factors that contribute to the high risk of atherosclerosis in diabetic individuals (2). However, activated
platelets also play a crucial role in the development of hypercoagulable states in T2DM (10,11).
Elevated platelet reactivity in T2DM can be influenced by upregulated multiple signalling pathways
(12). For example, increased platelet activation in high glucose concentrations can result in enhanced
expression of P-selectin and drive fibrinogen binding leading to the formation of platelet-leukocyte
aggregates (13). Similarly, activated monocytes have the potential to exacerbate a hypercoagulable state
(14). Activated platelets are capable of binding to monocytes to form platelet-monocyte aggregates
(PMAs), which are robust markers of exacerbated hypercoagulable state (11). Activated platelets and
monocytes express surface TF which initiates the activation of the extrinsic coagulation cascade (15),
contributing to the presence of hypercoagulable states in diabetic individuals (16,17). This phenomenon
can be explained by the increased levels of TF expression on monocyte surfaces in T2DM (11).
2
Anti-coagulant drugs including salicylates display a high potential to reduce elevated platelet activation
and function, leading to lower risk of cardiovascular events (10,18). However, it has also been noted
that commonly used anticoagulant drugs may present limited efficacy in protecting against
inflammatory induced complications. Notably, a recent study showed that aspirin monotherapy does
not significantly reduce the incidence of CVD in T2DM individuals (19). Thus, in addition to
investigating mechanisms involved in pro-inflammatory linked cardiovascular complications in
diabetic individuals, novel therapeutics should also be assessed for the protective properties against
such complications. To date, limited data is available on the role activated platelets and monocytes play
in the development of CVD, hence this phenomenon needs to be evaluated. Therefore, in a series of co-
ordinated studies, this project investigated the effects of current T2DM therapy on the thrombotic
profile in a pre-diabetic state. Mechanisms involved in disease development and progression, linking
inflammation and pre-diabetes induced CVD complications were also assessed. Potential findings may
prompt the inclusion of non-steroidal anti-inflammatory drugs to the current therapy which will also
aid in reducing the prothrombotic state present in pre-diabetic individuals. It is of note that increasing
research is targeting a pre-diabetic state to curb complications associated with diabetes-induced
cardiovascular complications.
1.1 Overall aim
To investigate the effects of current T2DM therapy on the thrombotic profile in a pre-diabetic state.
1.2. Objectives
• To investigate platelet activation and function during the development of type 2 diabetes
mellitus using a diet-induced model of pre-diabetes.
• To determine the effects of endogenous agonists like arachidonic acid and adenosine
diphosphate (ADP) in modulating platelet reactivity and monocyte function in pre-diabetic
mice on anti-hyperglycaemic and anti-inflammatory treatment.
• To investigate platelet reactivity in combined therapy of low dose aspirin and metformin-treated
pre-diabetic mice.
1.3. Research questions
• How does pre-diabetes affect the reactivity and function of platelets during the development of
T2DM?
• What is the polarization status of monocytes in the pre-diabetic state?
• Does aspirin as a monotherapy or as an add-on therapy to metformin inhibit platelet activation
and function in pre-diabetic mice?
• Does aspirin as a monotherapy show anti-inflammatory effects in pre-diabetic mice compared
to add-on therapy when combined with metformin?
3
1.3. References
1. Lemkes BA, Hermanides J, Devries JH, Holleman F, Meijers JCM, Hoekstra JBL.
Hyperglycemia: A prothrombotic factor? J Thromb Haemost. 2010;8(8):1663–9.
2. Vazzana N, Ranalli P, Cuccurullo C, Davì G. Diabetes mellitus and thrombosis [Internet]. Vol.
129, Thrombosis Research. Elsevier Ltd; 2012 [cited 2015 Feb 25]. p. 371–7. Available from:
http://www.ncbi.nlm.nih.gov/pubmed/22197180
3. Zhao H, Zeng F, Wang X, Wang L. Prevalence, risk factors, and prognostic significance of
masked hypertension in diabetic patients. Medicine (Baltimore) [Internet]. 2017;96(43):e8363.
Available from: http://insights.ovid.com/crossref?an=00005792-201710270-00049
4. Eckel RH, Kahn SE, Ferrannini E, Goldfine AB, Nathan DM, Schwartz MW, et al. Obesity and
type 2 diabetes: What Can be unified and what needs to be individualized? Diabetes Care.
2011;34(6):1424–30.
5. Zimmet P, Magliano D, Matsuzawa Y, Alberti G, Shaw J. The Metabolic Syndrome: A Global
Public Health Problem and A New Definition. J Atheroscler Thromb [Internet]. 2005;12(6):295–
300. Available from: http://joi.jlc.jst.go.jp/JST.JSTAGE/jat/12.295?from=CrossRef
6. Alzahrani SH, Ajjan RA. Review article: Coagulation and fibrinolysis in diabetes. Diabetes Vasc
Dis Res. 2010;7(4):260–73.
7. Hess K, Grant PJ. Inflammation and thrombosis in diabetes. Thromb Haemost.
2011;105(SUPPL. 1):43–54.
8. Formoso G, De Filippis E, Di Fulvio P, Pandolfi A, Bucciarelli T, Ciabattoni G, et al. Decreased
in vivo oxidative stress and decreased platelet activation following metformin treatment in
newly diagnosed type 2 diabetic subjects. Diabetes Metab Res Rev [Internet]. 2014;32(30):13–
23. Available from: http://libweb.anglia.ac.uk/
9. Fontbonne A, Charles M a, Juhan-Vague I, Bard JM, André P, Isnard F, et al. The effect of
metformin on the metabolic abnormalities associated with upper-body fat distribution. BIGPRO
Study Group. Diabetes Care. 1996;19(9):920–6.
10. Aspirin Therapy in Diabetes. American Diabetes Association. Annals of Internal Medicine.
2004;27(June 1997):1997–8.
11. Davison GM, Nkambule BB, Mkandla Z, Hon GM, Kengne AP, Erasmus RT, et al. Platelet,
monocyte and neutrophil activation and glucose tolerance in South African Mixed Ancestry
individuals. Sci Rep [Internet]. 2017 Jan 16;7:40329. Available from:
http://www.nature.com/articles/srep40329
4
12. Angiolillo DJ, Bernardo E, Sabat?? M, Jimenez-Quevedo P, Costa MA, Palazuelos J, et al.
Impact of Platelet Reactivity on Cardiovascular Outcomes in Patients With Type 2 Diabetes
Mellitus and Coronary Artery Disease. J Am Coll Cardiol. 2007;50(16):1541–7.
13. Sudic D, Razmara M, Forslund M, Ji Q, Hjemdahl P, Li N. High glucose levels enhance platelet
activation: Involvement of multiple mechanisms. Br J Haematol. 2006;133(3):315–22.
14. Cermak J, Key NS, Bach RR, Balla J, Jacob HS, Vercellotti GM. C-reactive protein induces
human peripheral blood monocytes to synthesize tissue factor. Blood. 1993;82(2):513–20.
15. Shantsila E, Lip GYH. The role of monocytes in thrombotic disorders: Insights from tissue
factor, monocyte-platelet aggregates and novel mechanisms. Thromb Haemost.
2009;102(5):916–24.
16. Dorsam RT, Kunapuli SP. Central role of the P2Y 12 receptor in platelet activation. J Clin Invest.
2004;113(3):10–5.
17. Wang Y, Li Z, Wang W. Platelet-Leukocyte Interaction in Atherosclerosis and
Atherothrombosis : What We Have Learnt From Human Studies and Animal Models. J Cardiol
Ther [Internet]. 2014;1(5):92–7. Available from:
http://ghrnet.org/index.php/jct/article/view/710
18. Yeomans ND. Aspirin: Old drug, new uses and challenges. J Gastroenterol Hepatol.
2011;26(3):426–31.
19. Saito Y, Okada S, Ogawa H, Soejima H, Sakuma M, Nakayama M, Doi N, Jinnouchi H, Waki
M, Masuda I, Morimoto T. Low-Dose Aspirin for Primary Prevention of Cardiovascular
Events in Patients with Type 2 Diabetes Mellitus. Circulation. 2017;135(7):659–70.
5
Chapter 2. Literature review
2.1. Introduction
Type 2 diabetes (T2DM) is diagnosed based on abnormally elevated fasting plasma glucose
concentrations. It continues to be a global pandemic with over 415 million cases reported in 2015, and
estimated to rise to 642 million by 2040 (1, 2). The prevalence of diabetes in adults was estimated to be
8.8%, with 75% coming from low and middle-income countries such as those in Southern Africa (2).
In 2013, Africa had a diabetes prevalence of 4.9%, and this figure is expected to have an increase of
110% to 41.5 million cases by the year 2035 (3). In addition to a large number of undiagnosed cases,
the rate of diabetes prevalence in developing countries has been hugely affected by increasing
individuals classified as pre-diabetic (1,2). The state of pre-diabetes can be defined as impaired fasting
glucose, impaired glucose tolerance or both (4), with these individuals at higher risk of developing
T2DM (5). In 2010, an estimated 57 million people were diagnosed with pre-diabetes. In the United
States of America, pre-diabetes contributed to 29.5% of the total diabetes prevalence. More than 470
million people globally are expected to be suffering from this condition by 2030 (5, 6). Pre-diabetes is
a high-risk state for diabetes with 5-10% conversion rate and a similar percentage reverting to
normoglycaemia. It is associated with insulin resistance and beta β cell dysfunction which occur before
noticeable changes in glucose levels (7). T2DM accounts for over 90% of all diabetes cases and is
caused by the body’s inability to utilise insulin effectively (decreased insulin sensitivity) resulting in
increased blood glucose levels (hyperglycaemia) accompanied by subsequent damage to body organs
and vasculature (8). Indeed, almost four-fold of diabetic individuals die of cardiovascular complications
(9). Therefore, this review discussed the relationship between T2DM and cardiovascular disease
(CVD). It focused on the role hyperglycaemia has in the development of pro-inflammatory and
ultimately hypercoagulable states associated with CVD. In addition, the review highlights the role of
current anti-diabetic and anti-platelet treatment in curbing the susceptibility of vasculature in a diabetic
state. To achieve this, a search strategy was developed using medical subheadings (MeSH) keywords
type 2 diabetes mellitus, cardiovascular disease, inflammation, anti-diabetic treatment and anti-platelet
treatment. MEDLINE (OVID interface, 2000 onwards), EMBASE (OVID interface, 2000 onwards) and
Cochrane Central Register of Controlled Trials (Wiley interface, current issue) was used to search for
published articles. A comprehensive approach was used to analyse extracted literature, discussing
different components of risk factors and detrimental effects associated with inflammation and its role
in T2DM induced cardiovascular complications.
2.2. Type 2 diabetes and cardiovascular disease (CVD)
T2DM individuals have a 2-4-fold increased risk of premature atherosclerotic vascular disease (ASVD)
when compared to nondiabetic counterparts (10). These include; myocardial infarctions (MI), cerebral
vascular disease and peripheral vascular diseases (10). T2DM is a combination of both pro-
6
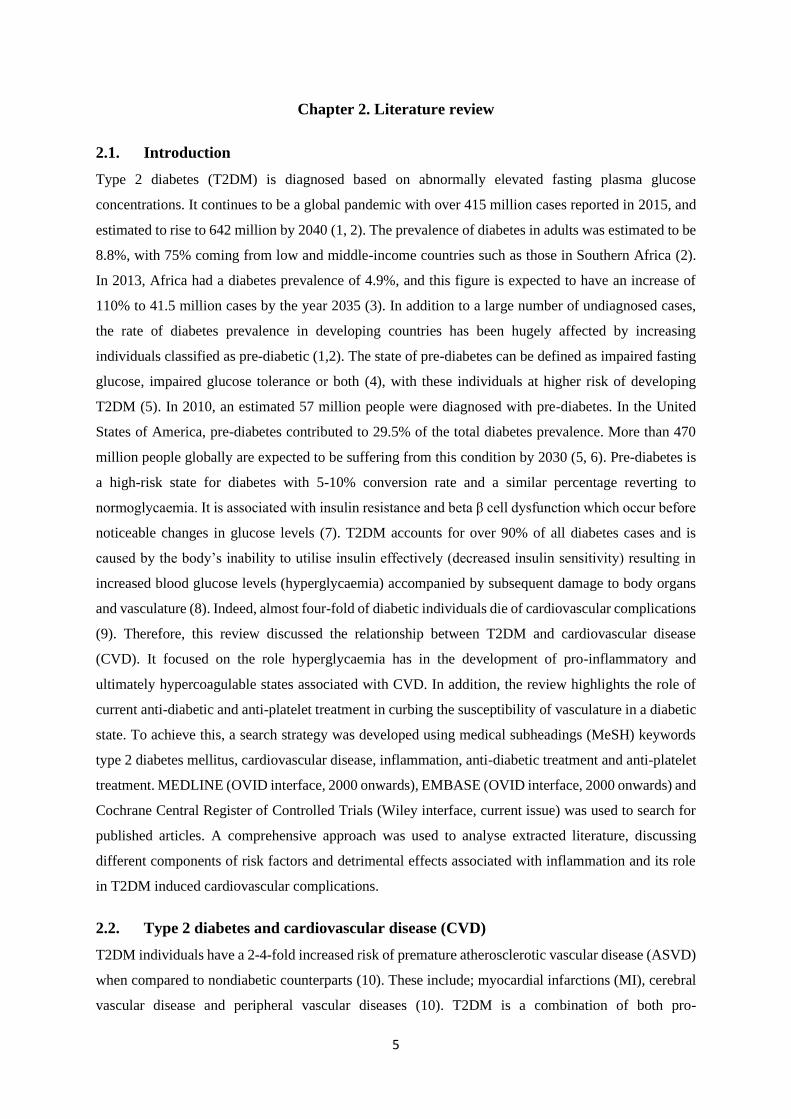
inflammatory and hypercoagulable states with alterations in the components of the Virchow’s triad (11).
These altered components include endothelial damage or dysfunction, abnormal blood stasis, and
altered haemostasis, platelets and fibrinolysis (Figure 2.1) (12). Alterations in any two of the Virchow’s
triad components increases the risk of vascular thrombosis (13).
Figure 2.1. Illustration of the components of the Virchow’s triad that are altered in type 2 diabetes mellitus
(T2DM). Vessel injury: this involves altered nitric oxide (NO) synthesis resulting in increased adhesion of
peripheral blood mononuclear cells (PBMCs) to the endothelial surface of blood vessels. Endothelial cell
dysfunction also results in altered NO synthesis as well as increased adhesion of PBMCs. Blood flow: stasis,
varicose veins and valve stenosis result in alteration of the blood flow through slowing down or blockage caused
by fibrin clot formation. Hypercoagulability: T2DM has been associated with increased levels of activated
platelets as well as microparticles which contribute to the hypercoagulable state. Increased resistance to
fibrinolysis has also been described in T2DM (11).
2.3. Inflammation in obesity and type 2 diabetes
Inflammation is the tissue’s response to injury and can be classified into cellular and humoral responses
(14, 15). In humoral immune response, antibody-mediated immune response, triggers B-cells to become
plasma cells which secrete antibodies. On the other hand, cellular immune response is primarily
mediated by T-cells (T-helper and killer T-cells) that can activate other immune cells such as B-cells
and natural killer cells (16). Acute inflammation is characterised by increased blood flow and
accumulation of fluid, leukocytes and cytokines at the site of injury. It also includes the activation of
endothelial cells (EC), tissue macrophages and platelets (15). Chronic inflammation is characterised by
specific cellular and humoral immune cell responses at the site of injury and is defined according to the
nature of inflammatory cells present (14, 15). Once the tissue injury has been resolved, acute
7
inflammatory cells are removed by lymphatics or apoptosis (17). Chronic inflammation results in
monocyte chemotaxis to the site of inflammation where interferon γ (IFN γ) and monocyte
chemoattractant protein-1 (MCP-1) activate macrophages. These macrophages are then retained at the
site of inflammation by granulocyte macrophage colony stimulating factor (GM-CSF) and IFN γ where
they increase levels of interleukin 1 (IL-1) and tumour necrosis factor (TNF) (14).
Chronic inflammation, which is exacerbated by abdominal obesity, is associated with other metabolic
syndrome complications such as insulin resistance (IR), T2DM and CVD (18). In obese individuals,
adipocytes secrete adipokines that are involved in the initiation of inflammation (19). Acute
hyperglycaemia induces an increase in the production of pro-inflammatory cytokines such as
interleukin-6 (IL-6), tumour necrosis factor (TNF-α) and interleukin 18 (IL-18) (20). Diabetic
individuals have increased plasma levels of inflammatory markers, including high-sensitivity C-
reactive protein, IL-6, TNF-α, soluble intercellular adhesion molecule (sICAM)-1, soluble vascular cell
adhesion molecule (sVCAM)-1, soluble E-selectin, and matrix metalloprotease 2 and 9 (21). In
addition, inflammatory conditions can trigger the production of TF in various cells, namely the ECs,
vascular smooth muscle cells (VSMCs), monocytes and macrophages, granulocytes and platelets (22).
2.4. Inflammatory mechanisms involved in diabetes-induced cardiovascular
complications
2.4.1. Tissue factor is implicated in pro-inflammatory induced injury
Tissue factor is a membrane protein cofactor component of TF-factor VIIa complex enzyme (23, 24).
It is associated with microvascular complications which are an indicator of endothelial dysfunction
rather than pro-coagulant activity (25), and elevated levels of circulating TF in T2DM (10). The levels
of circulating leukocyte and microparticle derived TF in blood have also been associated with the
hypercoagulable state (10, 26). Although it remains unclear whether platelets are able to synthesize
their own TF messenger RNA (mRNA), it has been previously suggested that TF can be expressed on
the surface of platelets as a result of contamination from monocytes (27).
There is still more research to be done to define hypercoagulable states with respect to coagulation, and
various factors can initiate a pathological state leading to cardiovascular events. In this case, factor VIIa
(activated coagulation factor VII) can also initiate the extrinsic coagulation cascade leading to fibrin
deposition and platelet activation (28). When the endothelial surface is disrupted or activated, TF binds
to FVIIa to form the complex which is responsible for the downstream activation of FIX and FX to
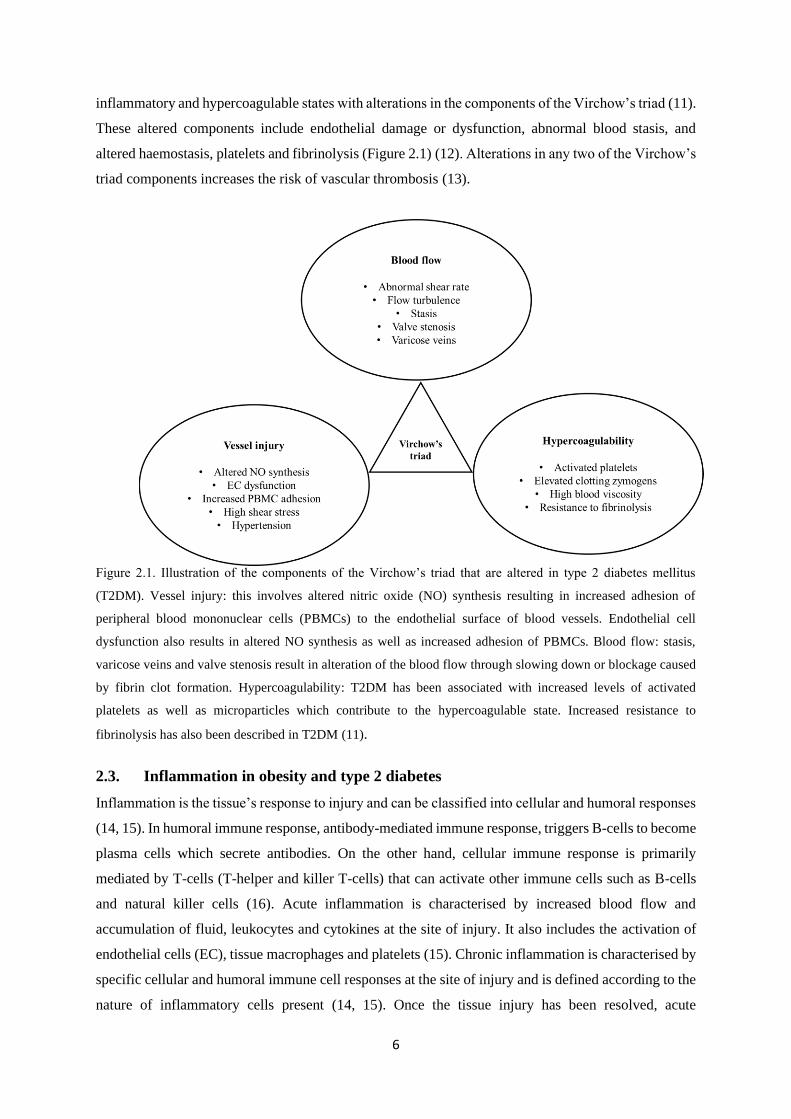
FIXa and FXa, respectively (Figure 2.2). These two factors lead to the formation of prothrombinase
complex and thrombin generation (10, 26).
8
Figure 2.2. Illustration of the effect of hyperglycaemic conditions on platelet CD40L, monocyte tissue factor (TF)
mRNA and membrane surface protein. Based on a previous study, exposure to 24-hours of hyperglycaemic (20%
glucose solution and glucose levels maintained at 11 mmol/l) conditions results in elevated levels of CD40L (a
marker of platelet activation and immune modulation) and monocyte TF mRNA as well as the membrane surface
protein. Increase in monocyte mRNA and protein leads to a hypercoagulable state (10).
During T2DM disease progression, it is postulated that monocytes produce TF when they undergo
phenotypic change as a result of altered transcription factors (NF-ĸB) leading to the formation of pro-
coagulant cells (27, 29). Lipopolysaccharide (LPS) induces the expression of TF on the surface of
monocytes. It binds to LPS binding protein (LBP) to form an LPS/LBP complex which binds to CD14,
activating signal transduction pathways and transcription factors to induce TF gene expression (30).
Antigen derived T-helper cells, lymphokines, complement-derived anaphylatoxin C5a and antigen-
antibody complexes are also able to elicit TF expression on monocyte surface membrane (31). The
underlying mechanisms of monocyte and neutrophil function in microvascular thrombosis remain
unclear (22, 32). Nonetheless, the presence of leukocytes, monocytes and neutrophils, at the site of
inflammation or vascular injury have been reported. Their interaction with platelets may directly
contribute to increased fibrin generation by exposing TF, and indirectly by inactivating TF inhibitor
(32). The tissue factor pathway inhibitor is a protein associated with the endothelial membrane and its
increased levels indicate endothelial damage (33).
2.4.2. Platelet structure and function and its role pro-inflammatory induced endothelial
injury
Platelets are very small enucleate cells with a diameter of 2-3µm formed by the fragmentation of much
larger megakaryocytes (100µm) in the bone marrow (Figure 2.3) (34, 35).
9
Figure 2.3. Illustration of the differentiation of hematopoietic stem cells to megakaryocyte-erythroid progenitor
cells. These cells differentiate into megakaryoblasts through interaction with thrombopoietin (TPO) and
subsequent maturation into megakaryocytes. Megakaryocytes in the sinusoidal walls of the bone marrow shed
large segments of cytoplasm into the bloodstream where the shear force of circulating blood fragments the
segments into individual platelets (36).
Platelets are largely inactive, they circulate close to the endothelium without any firm adhesion due to
the anti-adhesive properties of intact endothelial cells. However, vascular damage leads to their
activation and adhesion to the endothelial surface (37). Once activated, platelets bind to the exposed
extracellular matrix (ECM) proteins such as collagen and von Willebrand factor (vWF) (35, 38). They
express a repertoire of cell surface receptors on their phospholipid bilayer membrane, which are
responsible for intracellular signalling. This includes CD36 (GPIV, a scavenger receptor), CD63
(receptor for tissue inhibitor of metalloproteinase), CD9 (cell adhesion molecule), G-protein coupled
receptors (GPCRs), glycoprotein IIb/IIIa and glucose transporter-3 (GLUT-3) (38). These trigger the
release of α-granules that play a role in inflammation, coagulation and wound repair (Figure 2.4).
GPCRs trigger the release of adenosine diphosphate (ADP) from dense granules which is an important
agonist for platelet activation (38, 39). Low ATP/ADP ratios maintain enhanced glycolysis which arises
due to suppressed mitochondrial metabolism, possibly via activation of 5' AMP-activated protein kinase
(AMPK), the major regulator of energy metabolism in mammalian cells (40). On the other hand, high
ATP/ADP ratios block glycolysis in aerobic non-proliferating cells (41).
Platelet granules contain membrane as well as soluble receptors involved in haemostasis, inflammation
and wound healing. Alpha (α) granules are spherical organelles which contain adhesion proteins
fibrinogen, fibronectin, vWF, thrombospondin and vitronectin (36, 42). The granule’s exocytosis can
be evaluated by the membrane expression of its contents such as P-selectin (CD62P), vWF and platelet
factor-4 (PF4) (42). Dense granules are unique to platelets for containing mainly bioactive amines such
as serotonin, histamine, adenosine diphosphate (ADP) and adenosine triphosphate (ATP) (36, 42). The
exocytosis of these granules can also be evaluated by the release of its contents like ADP, ATP and
serotonin (42). The exocytosis of both these granules is essential for platelet activation and function.
10
For example, upon activation of platelets, the P-selectin expressed from the α-granules acts as a point
of adherence for leukocytes in the formation of platelet-leukocyte aggregates (43).
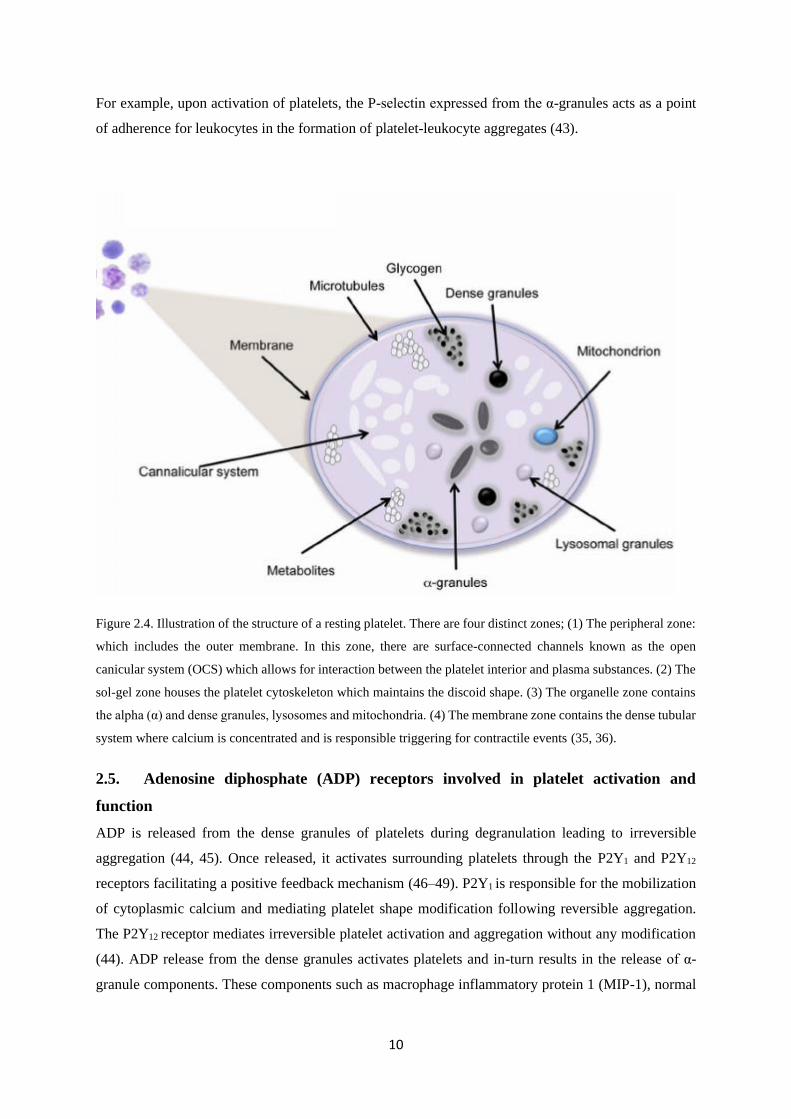
Figure 2.4. Illustration of the structure of a resting platelet. There are four distinct zones; (1) The peripheral zone:
which includes the outer membrane. In this zone, there are surface-connected channels known as the open
canicular system (OCS) which allows for interaction between the platelet interior and plasma substances. (2) The
sol-gel zone houses the platelet cytoskeleton which maintains the discoid shape. (3) The organelle zone contains
the alpha (α) and dense granules, lysosomes and mitochondria. (4) The membrane zone contains the dense tubular
system where calcium is concentrated and is responsible triggering for contractile events (35, 36).
2.5. Adenosine diphosphate (ADP) receptors involved in platelet activation and
function
ADP is released from the dense granules of platelets during degranulation leading to irreversible
aggregation (44, 45). Once released, it activates surrounding platelets through the P2Y1 and P2Y12
receptors facilitating a positive feedback mechanism (46–49). P2Y1 is responsible for the mobilization
of cytoplasmic calcium and mediating platelet shape modification following reversible aggregation.
The P2Y12 receptor mediates irreversible platelet activation and aggregation without any modification
(44). ADP release from the dense granules activates platelets and in-turn results in the release of α-
granule components. These components such as macrophage inflammatory protein 1 (MIP-1), normal
11
T-cell expressed, secreted (RANTES), interleukin-8 (IL-8), interleukin-β (IL-β), CD40 ligand (CD40L)
and P-selectin are involved in recruitment and activation of other leukocytes (50).
2.5.1. P2Y1 receptors
The P2Y1 is a purinergic receptor and widely expressed in various cell lineages but is mostly expressed
by platelets (51, 52). It is coupled with the Gαq proteins thereby triggering calcium release from internal
stores in the dense tubular system leading to shape change and reversible aggregation (36, 44, 51).
Transgenic P2Y1 deficient mice have been shown to display impaired platelet aggregation and resistance
to ADP agonist-induced activation (44, 53), and the inhibition of P2Y1 receptor does not lead to platelet
activation and aggregation (51). This is further demonstrated when P2Y1 deficient platelets exhibit no
effect on ADP-dependant inhibition of adenylyl cyclase (39).
2.5.2. P2Y12 receptor
Similar to P2Y1, the P2Y12 receptor expression is not limited to platelets but is also present in the brain,
glial cells and vascular smooth muscle (54). P2Y12 is a Gi-coupled (primarily Gαi2) receptor and plays
a role in the activation of the fibrinogen receptor (integrin αIIbβ3), shear-induced platelet aggregation
and thrombus formation (39, 55). Inhibition of this receptor by clopidogrel reduces levels of cyclic
adenosine monophosphate (cAMP) suppressing the phosphorylation of vasodilator-stimulated
phosphoprotein (VASP-P) by protein kinases (54, 56, 57). It has been shown that platelet reactivity
measured in P2Y12 reactivity units (PRU) is significantly higher in diabetic individuals when compared
to non-diabetic individuals (58). This may suggest the importance of the pathways involved in platelet
function and their contribution to the hypercoagulable state in pre-diabetic and T2DM individuals.
2.6. Platelet signalling pathways
Platelet activation and signalling are classified into agonist interactions with their respective receptors
and receptor-mediated early platelet activation pathways. The pathways can also be described by
intermediate common signalling, integrin intervention inside-out signalling and outside in signalling
(59). Platelets interact extracellularly and intracellularly through ligand binding using inside-out
signalling. Once ligands bind to the integrins, they pass on information into the cell (outside-in
signalling) (60). Some of the pathways that are implicated in the platelet-induced mechanism are briefly
described below, namely the cyclooxygenase pathway, calcium signalling and protein kinase C
signalling.
2.6.1. Cyclooxygenase pathway
Activated platelets release the enzyme cyclooxygenase (COX) which leads to oxidation of arachidonic
acid and consequent synthesis of bioactive compounds such as thromboxane A2 (TxA2) (36, 61, 62).
Arachidonic acid is metabolised into short-lived intermediates prostaglandin G2 and H2 which result in
platelet activation and vasoconstriction (62). Cyclooxygenase 1 and COX 2 are the two main isoforms
12
which transform arachidonic acid into prostaglandin H2. This is then transformed into prostanoids,
prostaglandin E2 (PGE2), prostaglandin D2 (PGD2), prostaglandin I2 (PGI2) and TxA2 (63). Prostanoids
are lipid mediators generated in response to the action of COX on arachidonic acid; they consist of
thromboxanes, prostacyclins and prostaglandins. During low-grade inflammatory conditions such as
pre-diabetes and T2DM, the biosynthesis of these prostanoids is elevated (64). Prostaglandin I2 and
TxA2 are synthesised by COX-1 and COX-2 respectively and play a major role in the physiology and
dysregulation of the function of blood vessels (63).
2.6.2. Calcium signalling
Cytosolic calcium plays a crucial role in platelet activation. Its elevation may be induced by intracellular
store release of inositol-1,4,5-trisphosphate (IP3) receptor, or extracellularly by its entry through the
plasma membrane by 1,2 diacyl-glycerol (DAG) (59, 65). In T2DM, intracellular calcium
concentrations are elevated in resting platelets (66). Elevation of calcium activates the actin-myosin
interaction which results in cytoskeleton reorganisation and ultimately platelet shape change (59, 65).
Activation of the αIIbβ3 integrin is also attributed to elevated calcium levels, and this results in platelet
degranulation, enhanced thromboxane production and aggregation (59, 65, 67). Additional effects of
elevated calcium levels include activation of the protein kinase C (PKC), calmodulin and NO synthesis
(59).
2.6.3. Protein kinase C
Protein kinase C (PKC) is involved in platelet granule secretion as well as aggregation which can be
directly activated by arachidonic acid and DAG (68, 69). Together with increased intracellular calcium,
prolonged PKC activation results in irreversible platelet aggregation (69). A study using a PKC inhibitor
resulted in inhibited dense granule secretion thereby blocking aggregation and αIIbβ3 activation in
platelets (61). In hyperglycaemic conditions, there is increased membrane-bound PKC in vivo and DAG
levels are chronically elevated resulting in its activation (70, 71).
Endogenous agonists such as ADP, arachidonic acid and collagen may contribute to the development
of atherosclerosis. Adenosine diphosphate activates the P2Y pathway, consequently leading to platelet
activation, shape change and aggregation (44). Whereas collagen is involved in initiating the intrinsic
clotting cascade and has been shown to increase transforming growth factor (TGF-β1) and platelet-
derived growth factor (PDGF) (72). Platelet aggregation can be induced by collagen acting on
glycoprotein VI/Fc receptor γ chain complex thereby activating enzymes Src and Syk family tyrosine
kinases. These prompt signalling of the phosphatidylinositol 3-kinase (PI3K) which leads to activation
of the fibrinogen receptor αIIbβ3 and therefore platelet aggregation (73). PI3K regulates cell survival
and insulin signalling, and its dysregulation can initiate platelet aggregation (74). Aspirin inhibits the
COX-1 and COX-2 pathways thereby attenuating the production of TxA2 (50), a mediator of platelet
activation that can be upregulated in diabetes by the oxidation of arachidonic acid (75, 76).
13
Arachidonic acid causes an increase in platelet calcium levels in a positive feedback process that
promotes its release from intracellular stores and microsomes (68). Current anti-diabetic drugs
biguanides, such as metformin, can present anti-atherogenic and cardioprotective effects as shown by
their ability to decrease platelet volume (77, 78). However, the mechanism by which this is achieved is
not completely understood, with one study citing their ability to lower the mean platelet volume (MPV)
in T2DM, as a potential mechanism (79). The use of metformin improves glycaemic control in T2DM
individuals and decreases levels of markers of active coagulation such as platelet factor-4, thrombin
and d-dimers (80, 81). Anti-platelet drugs such as aspirin and clopidogrel, have since been introduced
to T2DM therapy to improve the risk of atherosclerosis by reducing plasma cytokines, C-reactive
protein levels and intima-media thickness (82).
2.7. Platelet function in type 2 diabetes
Platelet dysregulation is common in T2DM, as platelets exhibit increased activation, adhesion and
aggregation during this state (83). Diabetic individuals already display increased soluble form of P-
selectin (sP-selectin) found in plasma, when compared to non-diabetic controls (84). Hyperglycaemic
conditions increase levels of ADP and thrombin receptor activating peptide (TRAP) induced platelet P-
selectin expression. In human blood incubated with high glucose concentrations, TRAP stimulation also
increased fibrinogen binding and platelet-leukocyte aggregates (PLA) (70). Mean platelet volume has
been used as a marker for platelet activation and its levels are significantly higher in T2DM that
decreased after improved glycaemic control (79). High-fat diet (60% beef lard) induced diabetic
C57BL/6J mice have been shown not to exhibit hyperaggregability or hypercoagulability (85). In this
study, authors found no differences in P-selectin and CD61 (IIIa portion of the integrin GPIIb/IIIa)
between the diabetic and non-diabetic control mice (85). These results highlight the need for more
studies to confirm if high fat diet fed mouse is an appropriate model to investigate platelet function and
aggregation in obesity and T2DM.
2.8. Glucose-lowering drugs and platelet function
Metformin is a glucose lowering drug that is widely used as the first line of therapy for T2DM
individuals. The drug lowers blood glucose levels by improving insulin sensitivity and suppressing
hepatic gluconeogenesis (86). The mode of action of metformin is still poorly understood; however, the
improvement in insulin sensitivity is mediated by the post-receptor signalling modification in the insulin
pathway (87–89). In addition, metformin can reduce platelet activation and oxidative stress by
preserving intracellular anti-oxidant function in T2DM (90). This biguanide can also enhance insulin
hepatic sensitivity which results in the reduction of gluconeogenesis and glycogenolysis, contributing
to lower plasma glucose levels through the modulation of AMPK (89). Metformin induces the
upregulation of GLUT1 and GLUT4 transporters in skeletal muscle and adipocytes leading to increased
glucose uptake (89). The use of metformin has been tested in a combination therapy with anti-diabetic
14
add-ons of sulfonylureas and thiazolidinediones like glipizide and pioglitazone, respectively.
Pioglitazone greatly reduced procaspase activating compound (PAC-1) binding, P-selectin expression
and ADP induced aggregation as compared to glipizide (91). However, glipizide as an add-on therapy
to metformin did have a better anti-glycaemic effect that pioglitazone (91). Anti-platelet drugs have
also been introduced in addition to the anti-diabetic drugs as dual therapy in order to curb the increased
hypercoagulable state associated with diabetics.
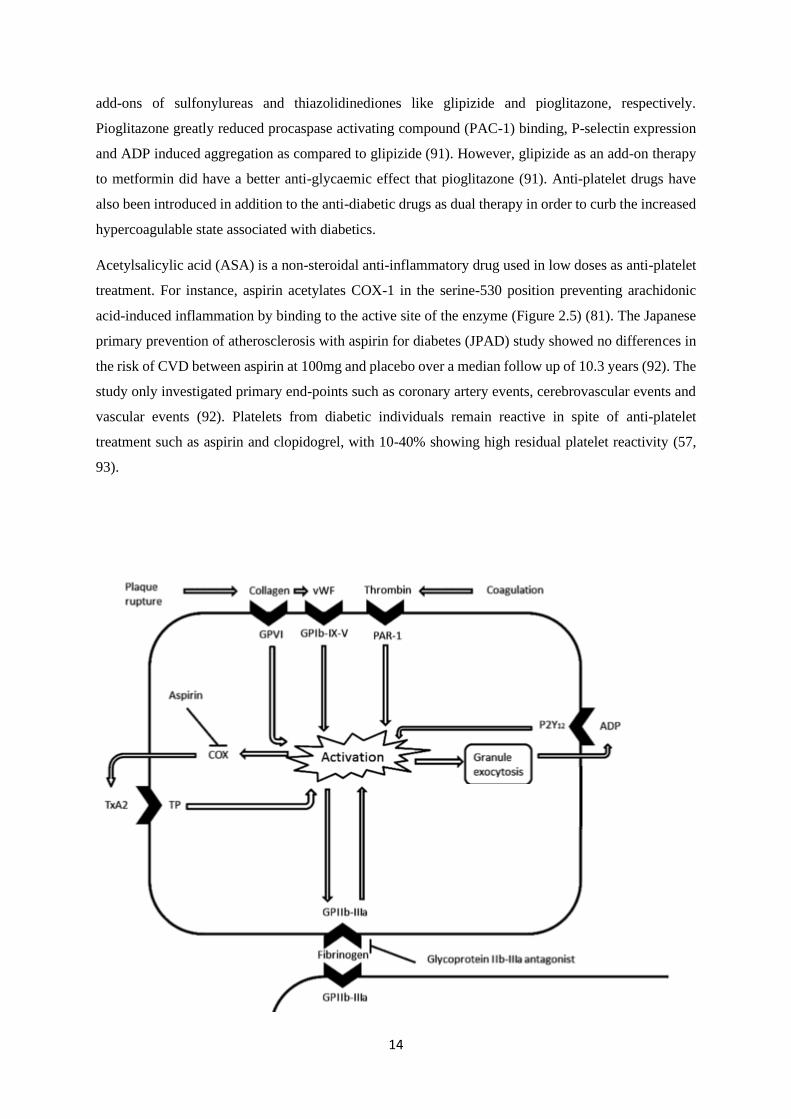
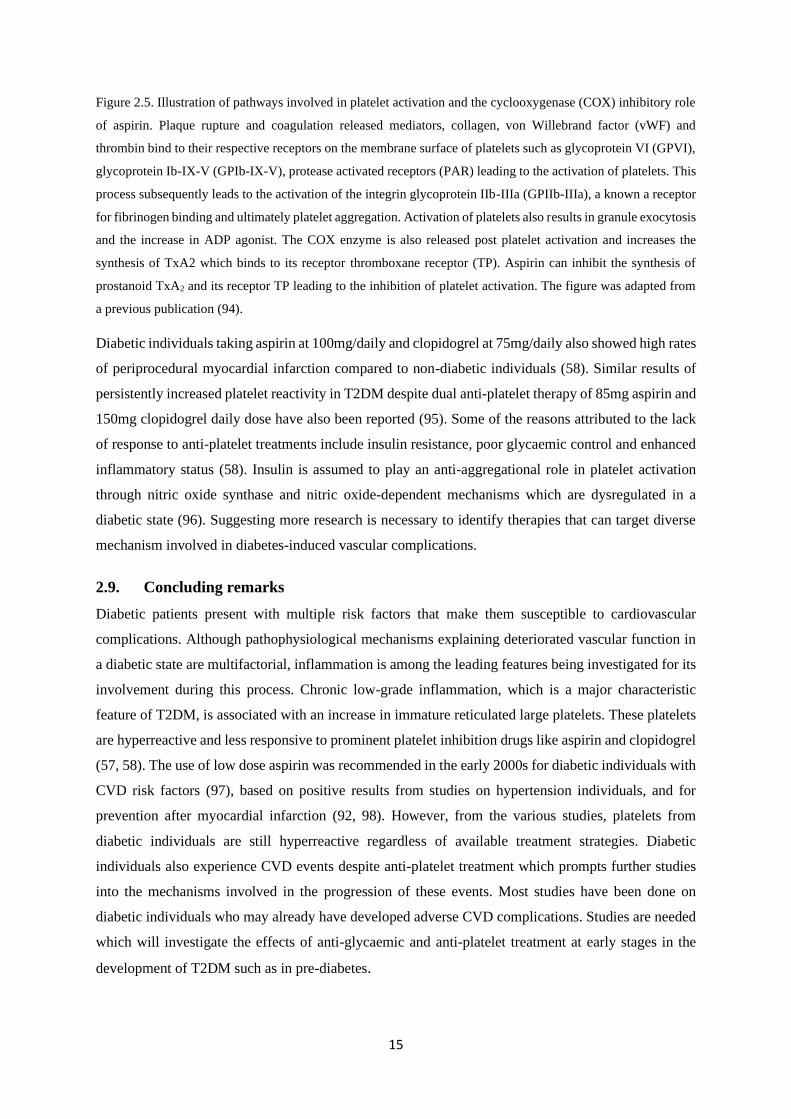
Acetylsalicylic acid (ASA) is a non-steroidal anti-inflammatory drug used in low doses as anti-platelet
treatment. For instance, aspirin acetylates COX-1 in the serine-530 position preventing arachidonic
acid-induced inflammation by binding to the active site of the enzyme (Figure 2.5) (81). The Japanese
primary prevention of atherosclerosis with aspirin for diabetes (JPAD) study showed no differences in
the risk of CVD between aspirin at 100mg and placebo over a median follow up of 10.3 years (92). The
study only investigated primary end-points such as coronary artery events, cerebrovascular events and
vascular events (92). Platelets from diabetic individuals remain reactive in spite of anti-platelet
treatment such as aspirin and clopidogrel, with 10-40% showing high residual platelet reactivity (57,
93).
15
Figure 2.5. Illustration of pathways involved in platelet activation and the cyclooxygenase (COX) inhibitory role
of aspirin. Plaque rupture and coagulation released mediators, collagen, von Willebrand factor (vWF) and
thrombin bind to their respective receptors on the membrane surface of platelets such as glycoprotein VI (GPVI),
glycoprotein Ib-IX-V (GPIb-IX-V), protease activated receptors (PAR) leading to the activation of platelets. This
process subsequently leads to the activation of the integrin glycoprotein IIb-IIIa (GPIIb-IIIa), a known a receptor
for fibrinogen binding and ultimately platelet aggregation. Activation of platelets also results in granule exocytosis
and the increase in ADP agonist. The COX enzyme is also released post platelet activation and increases the
synthesis of TxA2 which binds to its receptor thromboxane receptor (TP). Aspirin can inhibit the synthesis of
prostanoid TxA2 and its receptor TP leading to the inhibition of platelet activation. The figure was adapted from
a previous publication (94).
Diabetic individuals taking aspirin at 100mg/daily and clopidogrel at 75mg/daily also showed high rates
of periprocedural myocardial infarction compared to non-diabetic individuals (58). Similar results of
persistently increased platelet reactivity in T2DM despite dual anti-platelet therapy of 85mg aspirin and
150mg clopidogrel daily dose have also been reported (95). Some of the reasons attributed to the lack
of response to anti-platelet treatments include insulin resistance, poor glycaemic control and enhanced
inflammatory status (58). Insulin is assumed to play an anti-aggregational role in platelet activation
through nitric oxide synthase and nitric oxide-dependent mechanisms which are dysregulated in a
diabetic state (96). Suggesting more research is necessary to identify therapies that can target diverse
mechanism involved in diabetes-induced vascular complications.
2.9. Concluding remarks
Diabetic patients present with multiple risk factors that make them susceptible to cardiovascular
complications. Although pathophysiological mechanisms explaining deteriorated vascular function in
a diabetic state are multifactorial, inflammation is among the leading features being investigated for its
involvement during this process. Chronic low-grade inflammation, which is a major characteristic
feature of T2DM, is associated with an increase in immature reticulated large platelets. These platelets
are hyperreactive and less responsive to prominent platelet inhibition drugs like aspirin and clopidogrel
(57, 58). The use of low dose aspirin was recommended in the early 2000s for diabetic individuals with
CVD risk factors (97), based on positive results from studies on hypertension individuals, and for
prevention after myocardial infarction (92, 98). However, from the various studies, platelets from
diabetic individuals are still hyperreactive regardless of available treatment strategies. Diabetic
individuals also experience CVD events despite anti-platelet treatment which prompts further studies
into the mechanisms involved in the progression of these events. Most studies have been done on
diabetic individuals who may already have developed adverse CVD complications. Studies are needed
which will investigate the effects of anti-glycaemic and anti-platelet treatment at early stages in the
development of T2DM such as in pre-diabetes.
16
2.10. References
1. World Health Organization (2006) Definition and diagnosis of diabetes mellitus and
intermediate hyperglycemia:Report of a WHO/IDF consultation. Production 1–52 . doi: ISBN
92 4 159493 4
2. Ogurtsova K, da Rocha Fernandes JD, Huang Y, Linnenkamp U, Guariguata L, Cho NH,
Cavan D, Shaw JE, Makaroff LE (2017) IDF Diabetes Atlas: Global estimates for the
prevalence of diabetes for 2015 and 2040. Diabetes Res Clin Pract 128:40–50 . doi:
10.1016/j.diabres.2017.03.024
3. Peer N, Kengne AP, Motala AA, Mbanya JC (2014) Diabetes in the Africa region: An update.
Diabetes Res Clin Pract 103:197–205 . doi: 10.1016/j.diabres.2013.11.006
4. Yip WCY, Sequeira IR, Plank LD, Poppitt SD (2017) Prevalence of pre-diabetes across
ethnicities: A review of impaired fasting glucose (IFG) and impaired glucose tolerance (IGT)
for classification of dysglycaemia. Nutrients 9:1–18 . doi: 10.3390/nu9111273
5. Aldossari KK, Aldiab A, Al-Zahrani JM, Al-Ghamdi SH, Abdelrazik M, Batais MA, Javad S,
Nooruddin S, Razzak HA, El-Metwally A (2018) Prevalence of Prediabetes, Diabetes, and Its
Associated Risk Factors among Males in Saudi Arabia: A Population-Based Survey. J
Diabetes Res 2018:1–12 . doi: 10.1155/2018/2194604
6. Gossain V V., Aldasouqi S (2010) The challenge of undiagnosed pre-diabetes, diabetes and
associated cardiovascular disease. Int J Diabetes Mellit 2:43–46 . doi:
10.1016/j.ijdm.2009.10.004
7. Tabák AG, Herder C, Kivimäki M (2017) Prediabetes : A high-risk state for developing
diabetes Progression from prediabetes to diabetes Reversion to normoglycaemia Risk
prediction. Pmc 379:1–14 . doi: 10.1016/S0140-6736(12)60283-9.Prediabetes
8. World Health Organization (2016) Global report on diabetes. Decis Support Syst 38:557–573 .
doi: 10.1016/j.dss.2003.08.004
9. Leon BM (2015) Diabetes and cardiovascular disease: Epidemiology, biological mechanisms,
treatment recommendations and future research. World J Diabetes 6:1246 . doi:
10.4239/wjd.v6.i13.1246
10. Vaidyula VR, Rao AK, Mozzoli M, Homko C, Cheung P, Boden G (2006) Effects of
hyperglycemia and hyperinsulinemia on circulating tissue factor procoagulant activity and
platelet CD40 ligand. Diabetes 55:202–208 . doi: 10.2337/diabetes.55.1.202
11. Bogdanov VY, Østerud B (2010) Cardiovascular complications of diabetes mellitus: The
17
Tissue Factor perspective. Thromb Res 125:112–118 . doi: 10.1016/j.thromres.2009.06.033
12. Watson T, Shantsila E, Lip GY (2009) Mechanisms of thrombogenesis in atrial fibrillation:
Virchow’s triad revisited. Lancet 373:155–166 . doi: 10.1016/S0140-6736(09)60040-4
13. del Zoppo GJ (2008) Virchow’s triad: the vascular basis of cerebral injury. Rev Neurol Dis 5
Suppl 1:S12–S21
14. Wright TM (1997) Cytokines in acute and chronic inflammation. Front Biosci 2:A171 . doi:
10.2741/A171
15. Ward PA (2010) Part I. The Inflammatory Response - An Overview - Acute and Chronic
Inflammation. Fundam Inflamm I:1–10
16. Nauta J (2011) Statistics in clinical vaccine trials. Stat Clin Vaccine Trials 1–153 . doi:
10.1007/978-3-642-14691-6
17. Serhan CN, Brain SD, Buckley CD, Gilroy DW, Haslett C, O’Neill LAJ, Perretti M, Rossi
AG, Wallace JL (2007) Resolution of inflammation: state of the art, definitions and terms.
FASEB J 21:325–332 . doi: 10.1096/fj.06-7227rev
18. Hess K, Grant PJ (2011) Inflammation and thrombosis in diabetes. Thromb Haemost 105:43–
54 . doi: 10.1160/THS10-11-0739
19. Fernández-Sánchez A, Madrigal-Santillán E, Bautista M, Esquivel-Soto J, Morales-González
Á, Esquivel-Chirino C, Durante-Montiel I, Sánchez-Rivera G, Valadez-Vega C, Morales-
González J a (2011) Inflammation, oxidative stress, and obesity. Int J Mol Sci 12:3117–3132
20. Esposito K, Nappo F, Marfella R, Giugliano G, Giugliano F, Ciotola M, Quagliaro L, Ceriello
A, Giugliano D (2002) Inflammatory cytokine concentrations are acutely increased by
hyperglycemia in humans: Role of oxidative stress. Circulation 106:2067–2072 . doi:
10.1161/01.CIR.0000034509.14906.AE
21. Derosa G, Franzetti IG, Querci F, Carbone A, Ciccarelli L, Piccinni MN, Fogari E, Maffioli P
(2013) Variation in inflammatory markers and glycemic parameters after 12 months of
exenatide plus metformin treatment compared with metformin alone: A randomized placebo-
controlled trial. Pharmacotherapy 33:817–826 . doi: 10.1002/phar.1301
22. Breitenstein A, Tanner FC, Lüscher TF (2010) Tissue Factor and Cardiovascular Disease: Circ
J 74:3–12 . doi: 10.1253/circj.CJ-09-0818
23. Butenas S, Orfeo T, Mann KG (2009) Tissue factor in coagulation: Which? where? when?
Arterioscler Thromb Vasc Biol 29:1989–1996 . doi: 10.1161/ATVBAHA.108.177402
18
24. Shantsila E, Lip GYH (2009) The role of monocytes in thrombotic disorders: Insights from
tissue factor, monocyte-platelet aggregates and novel mechanisms. Thromb Haemost 102:916–
924
25. El-Hagracy R, Kamal G, Sabry I, Saad A, Abou El Ezz N, Nasr H (2010) Tissue Factor,
Tissue Factor Pathway Inhibitor and Factor VII Activity in Cardiovascular Complicated Type
2 Diabetes Mellitus. Oman Med J 25:173–178 . doi: 10.5001/omj.2010.52
26. Maroney SA, Ellery PE, Mast AE (2010) Alternatively spliced isoforms of tissue factor
pathway inhibitor. Thromb Res 125:S52–S56 . doi: 10.1016/j.thromres.2010.01.038
27. Gerrits A, Koekman C (2010) Platelet tissue factor synthesis in type 2 diabetic patients is
resistant to inhibition by insulin. Diabetes 59:1487–1495 . doi: 10.2337/db09-1008.
28. Pendurthi UR, Rao LVM (2008) Factor VIIa Interaction With Tissue Factor and Endothelial
Cell Protein C Receptor on Cell Surfaces. Semin Hematol 45:1–7 . doi:
10.1053/j.seminhematol.2008.03.014
29. Metcalf Pate KA, Lyons CE, Dorsey JL, Shirk EN, Queen SE, Adams RJ, Gama L, Morrell
CN, Mankowski JL (2013) Platelet activation and platelet-monocyte aggregate formation
contribute to decreased platelet count during acute simian immunodeficiency virus infection in
pig-tailed macaques. J Infect Dis 208:874–883 . doi: 10.1093/infdis/jit278
30. Guha M, Connell MAO, Pawlinski R, Hollis A, Mcgovern P, Yan S, Stern D, Mackman N
(2001) Lipopolysaccharide activation of the MEK-ERK1/2 pathway in human monocytic cells
mediates tissue factor and tumor necrosis factor ? expression by inducing Elk-1
phosphorylation and Egr-1 expression. Blood 98:1429–1439 . doi: 10.1182/blood.V98.5.1429
31. Kappelmayer J, Bernabei A, Edmunds LH, Edgington TS, Colman RW (1993) Tissue factor is
expressed on monocytes during simulated extracorporeal circulation. Circ Res 72:1075–1081 .
doi: 10.1161/01.RES.72.5.1075
32. Darbousset R, Thomas GM, Mezouar S, Frère C, Bonier R, Mackman N, Renné T, Dignat-
George F, Dubois C, Panicot-Dubois L (2012) Tissue factor-positive neutrophils bind to
injured endothelial wall and initiate thrombus formation. Blood 120:2133–2143 . doi:
10.1182/blood-2012-06-437772
33. Mitchell CT, Kamineni A, Palmas W, Cushman M (2009) Tissue factor pathway inhibitor,
vascular risk factors and subclinical atherosclerosis: The Multi-Ethnic Study of
Atherosclerosis. Atherosclerosis 207:277–283 . doi: 10.1016/j.atherosclerosis.2009.04.024
34. Patel SR, Richardson JL, Schulze H, Kahle E, Galjart N, Drabek K, Shivdasani RA, Hartwig
19
JH, Italiano JE (2005) Differential roles of microtubule assembly and sliding in proplatelet
formation by megakaryocytes. Blood 106:4076–4085 . doi: 10.1182/blood-2005-06-2204
35. Zapata JC, Cox D, Salvato MS (2014) The Role of Platelets in the Pathogenesis of Viral
Hemorrhagic Fevers. PLoS Negl Trop Dis 8: . doi: 10.1371/journal.pntd.0002858
36. Anjali A. Sharathkumar AS (2008) Platelet Function Disorders Second Edition. World Fed
Hemoph 1–28
37. Kaplan ZS, Jackson SP (2011) The Role of Platelets in Atherothrombosis. 51–61
38. Ghoshal K, Bhattacharyya M (2014) Overview of platelet physiology: Its hemostatic and
nonhemostatic role in disease pathogenesis. Sci World J 2014: . doi: 10.1155/2014/781857
39. Kim S, Kunapuli SP (2011) P2Y12 receptor in platelet activation. Platelets 22:54–58 . doi:
10.3109/09537104.2010.497231
40. Heidrich F, Schotola H, Popov AF, Sohns C, Schuenemann J, Coskun KO, Lewinski D Von,
Hinz J, Bauer M, Mokashi S a, Sossalla S, Schmitto JD (2010) AMPK - Activated Protein
Kinase and its Role in Energy Metabolism of the Heart. Curr Cardiol Rev 6:337–342 . doi:
10.2174/157340310793566073
41. Maldonado E, Lemasters J (2015) ATP/ADP Ratio, the Missed Connection between
Mitochondria and the Warburg Effect. Pubmed Cent 31:1713–1723 . doi:
10.1109/TMI.2012.2196707.Separate
42. Sharda A, Flaumenhaft R (2018) The life cycle of platelet granules. F1000Research 7:236 .
doi: 10.12688/f1000research.13283.1
43. Cerletti C, de Gaetano G, Lorenzet R (2010) Platelet-leukocyte interactions: Multiple links
between inflammation, blood coagulation and vascular risk. Mediterr J Hematol Infect Dis 2: .
doi: 10.4084/MJHID.2010.023
44. Oury C, Toth-Zsamboki E, Vermylen J, Hoylaerts MF (2006) The platelet ATP and ADP
receptors. Curr Pharm Des 12:859–875 . doi: 10.2174/138161206776056029
45. Kapur R, Semple JW (2017) Platelet functions beyond hemostasis. Mol Cell Biol Platelet
Form Implic Heal Dis 7:221–237 . doi: 10.1007/978-3-319-39562-3_10
46. Krinsky NI, Sladdin DG, Levine PH, Taub IA, Simic MG (1981) Modification of platelet
function by radical species produced during irradiation of oxygenated water. Thromb Haemost
45:116–120
47. Grove EL (2012) Antiplatelet effect of aspirin in patients with coronary artery disease. Dan
20
Med J 59:B4506
48. Cunningham MR, Nisar SP, Mundell SJ (2013) Molecular mechanisms of platelet P2Y 12
receptor regulation. Biochem Soc Trans 41:225–230 . doi: 10.1042/BST20120295
49. Nkambule BB, Davison G, Ipp H (2015) The value of flow cytometry in the measurement of
platelet activation and aggregation in human immunodeficiency virus infection. Platelets
26:250–257 . doi: 10.3109/09537104.2014.909021
50. Schrottmaier WC, Kral JB, Badrnya S, Assinger A (2015) Aspirin and P2Y12 Inhibitors in
platelet-mediated activation of neutrophils and monocytes. Thromb Haemost 114:478–489 .
doi: 10.1160/TH14-11-0943
51. Gachet C (2012) P2Y12 receptors in platelets and other hematopoietic and non-hematopoietic
cells. Purinergic Signal 8:609–619
52. Abbracchio MP, Burnstock G, Boeynaems J, Eric A, Boyer JL, Kennedy C, Knight GE,
Gachet C, Jacobson KA, Weisman GA (2012) International Union of Pharmacology LVIII:
Update on the P2Y G Protein-Coupled Nucleotide Receptors: From Molecular Mechanisms
and Pathophysiology to Therapy. Am Soc Pharmacol Exp Ther 58:281–341 . doi:
10.1124/pr.58.3.3.International
53. Léon C, Hechler B, Freund M, Eckly A, Vial C, Ohlmann P, Dierich A, LeMeur M, Cazenave
JP, Gachet C (1999) Defective platelet aggregation and increased resistance to thrombosis in
purinergic P2Y1receptor-null mice. J Clin Invest 104:1731–1737 . doi: 10.1172/JCI8399
54. Hechler B, Gachet C (2011) P2 receptors and platelet function. Purinergic Signal 7:293–303 .
doi: 10.1007/s11302-011-9247-6
55. Dorsam RT, Kunapuli SP (2004) Central role of the P2Y 12 receptor in platelet activation. J
Clin Invest 113:10–15 . doi: 10.1172/JCI200420986.The
56. Geisler T, Mueller K, Aichele S, Bigalke B, Stellos K, Htun P, Ninci E, Fateh-Moghadam S,
May AE, Gawaz M (2010) Impact of inflammatory state and metabolic control on
responsiveness to dual antiplatelet therapy in type 2 diabetics after PCI: Prognostic relevance
of residual platelet aggregability in diabetics undergoing coronary interventions. Clin Res
Cardiol 99:743–752 . doi: 10.1007/s00392-010-0179-x
57. Kakouros N, Rade JJ, Kourliouros A, Resar JR (2011) Platelet function in patients with
diabetes mellitus: From a theoretical to a practical perspective. Int J Endocrinol 2011:1–14 .
doi: 10.1155/2011/742719
58. Mangiacapra F, Patti G, Peace A, Gatto L, Vizzi V, Ricottini E, D’Ambrosio A, Muller O,
21
Barbato E, Di Sciascio G (2010) Comparison of platelet reactivity and periprocedural
outcomes in patients with versus without diabetes mellitus and treated with clopidogrel and
percutaneous coronary intervention. Am J Cardiol 106:619–623 . doi:
10.1016/j.amjcard.2010.04.015
59. Li Z, Delaney MK, O’Brien K a., Du X (2010) Signaling during platelet adhesion and
activation. Arterioscler Thromb Vasc Biol 30:2341–2349 . doi:
10.1161/ATVBAHA.110.207522
60. Jin J, Quinton TM, Zhang J, Rittenhouse SE, Kunapuli SP (2002) Adenosine diphosphate
(ADP)-induced thromboxane A2generation in human platelets requires coordinated signaling
through integrin αIIbβ3and ADP receptors. Blood 99:193–198 . doi: 10.1182/blood.V99.1.193
61. Yeung J, Apopa PL, Vesci J, Kenyon V, Rai G, Jadhav A, Simeonov A, Holman TR, Maloney
DJ, Boutaud O, Holinstat M (2012) Protein kinase C regulation of 12-lipoxygenase-mediated
human platelet activation. Mol Pharmacol Fast Forw 3:420–430
62. Khan N, Farooq AD, Sadek B (2015) Investigation of cyclooxygenase and signaling pathways
involved in human platelet aggregation mediated by synergistic interaction of various agonists.
Drug Des Devel Ther 9:3497–3509 . doi: 10.2147/DDDT.S84335
63. Korbecki J, Baranowska-Bosiacka I, Gutowska I, Chlubek D (2014) Cyclooxygenase
pathways. Acta Biochim Pol 61:639–649
64. Smyth EM, Grosser T, Wang M, Yu Y, FitzGerald GA (2009) Prostanoids in health and
disease. J Lipid Res 50:S423–S428 . doi: 10.1194/jlr.R800094-JLR200
65. Varga-Szabo D, Braun A, Nieswandt B (2009) Calcium signaling in platelets. J Thromb
Haemost 7:1057–1066 . doi: 10.1111/j.1538-7836.2009.03455.x
66. El Haouari M, Rosado JA (2008) Platelet signalling abnormalities in patients with type 2
diabetes mellitus: a review. Blood Cells Mol Dis 41:119–23 . doi: 10.1016/j.bcmd.2008.02.010
67. Damman P, Woudstra P, Kuijt WJ, De Winter RJ, James SK (2012) P2Y12 platelet inhibition
in clinical practice. J Thromb Thrombolysis 33:143–153
68. Signorello MG, Segantin A, Leoncini G (2009) The arachidonic acid effect on platelet nitric
oxide level. Biochim Biophys Acta - Mol Cell Biol Lipids 1791:1084–1092 . doi:
10.1016/j.bbalip.2009.07.003
69. Wu CC, Wu SY, Liao CY, Teng CM, Wu YC, Kuo SC (2010) The roles and mechanisms of
PAR4 and P2Y 12/phosphatidylinositol 3-kinase pathway in maintaining thrombin-induced
platelet aggregation. Br J Pharmacol 161:643–658 . doi: 10.1111/j.1476-5381.2010.00921.x
22
70. Sudic D, Razmara M, Forslund M, Ji Q, Hjemdahl P, Li N (2006) High glucose levels enhance
platelet activation: Involvement of multiple mechanisms. Br J Haematol 133:315–322 . doi:
10.1111/j.1365-2141.2006.06012.x
71. Geraldes P, King GL (2011) Activation of Protein Kinase C Isoforms & Its Impact on Diabetic
Complications. Circ Res 106:1319–1331 . doi:
10.1161/CIRCRESAHA.110.217117.Activation
72. Harrison S, Vavken P, Kevy S, Jacobson M, Zurakowski D, Murray MM (2011) Platelet
activation by collagen provides sustained release of anabolic cytokines. Am J Sports Med
39:729–734 . doi: 10.1177/0363546511401576
73. Weng Z, Li D, Zhang L, Chen J, Ruan C, Chen G, Gartner TK, Liu J (2010) PTEN regulates
collagen-induced platelet activation. Blood 116:2579–2581 . doi: 10.1182/blood-2010-03-
277236
74. Manna P, Jain SK (2015) Phosphatidylinositol-3,4,5-Triphosphate and Cellular Signaling:
Implications for Obesity and Diabetes. Cell Physiol Biochem 35:1253–1275 . doi:
10.1159/000373949
75. Evangelista V, De Berardis G, Totani L, Avanzini F, Giorda CB, Brero L, Levantesi G,
Marelli G, Pupillo M, Iacuitti G, Pozzoli G, Di Summa P, Nada E, De Simone G, Dell’elba G,
Amore C, Manarini S, Pecce R, Maione A, Tognoni G, Nicolucci A (2007) Persistent platelet
activation in patients with type 2 diabetes treated with low doses of aspirin. J Thromb Haemost
5:2197–2203 . doi: 10.1111/j.1538-7836.2007.02728.x
76. Bambace NM, Holmes CE (2011) The platelet contribution to cancer progression. J Thromb
Haemost 9:237–249 . doi: 10.1111/j.1538-7836.2010.04131.x
77. Dolasik I, Sener SY, Celebi K, Aydin ZM, Korkmaz U, Canturk Z (2013) The effect of
metformin on mean platelet volume in diabetic patients. Platelets 24:118–121 . doi:
10.3109/09537104.2012.674165
78. Verdoia M, Schaffer A, Barbieri L, Cassetti E, Nardin M, Bellomo G, Marino P, Sinigaglia F,
De Luca G (2014) Diabetes, glucose control and mean platelet volume: A single-centre cohort
study. Diabetes Res Clin Pract 104:288–294 . doi: 10.1016/j.diabres.2013.12.020
79. Demirtunc R, Duman D, Basar M, Bilgi M, Teomete M, Garip T (2009) The relationship
between glycemic control and platelet activity in type 2 diabetes mellitus. J Diabetes
Complications 23:89–94 . doi: 10.1016/j.jdiacomp.2008.01.006
80. Lemkes BA, Hermanides J, Devries JH, Holleman F, Meijers JCM, Hoekstra JBL (2010)
23
Hyperglycemia: A prothrombotic factor? J Thromb Haemost 8:1663–1669 . doi:
10.1111/j.1538-7836.2010.03910.x
81. Gonçalves LH, Silva MVF, Duarte RCF, Dusse LMS, Fernandes AP, Bosco AA, Gomes KB,
Carvalho M das G (2014) Acetylsalicylic acid therapy: Influence of metformin use and other
variables on urinary 11-dehydrothromboxane B2 levels. Clin Chim Acta 429:76–78 . doi:
10.1016/j.cca.2013.11.028
82. Hartge MM, Unger T, Kintscher U (2007) The endothelium and vascular inflammation in
diabetes. Diabetes Vasc Dis Res 4:84–88 . doi: 10.3132/dvdr.2007.025
83. Kim JH, Bae HY, Kim SY (2013) Clinical marker of platelet hyperreactivity in diabetes
mellitus. Diabetes Metab J 37:423–428 . doi: 10.4093/dmj.2013.37.6.423
84. Soma P, Swanepoel AC, du Plooy JN, Mqoco T, Pretorius E (2016) Flow cytometric analysis
of platelets type 2 diabetes mellitus reveals ‘angry’ platelets. Cardiovasc Diabetol 15:1–7 . doi:
10.1186/s12933-016-0373-x
85. Henry M, Davidson L, Cohen Z, McDonagh PF, Nolan PE, Ritter LS (2009) Whole blood
aggregation, coagulation, and markers of platelet activation in diet-induced diabetic C57BL/6J
mice. Diabetes Res Clin Pract 84:11–18 . doi: 10.1016/j.diabres.2009.01.011
86. He L, Sabet A, Djedjos S, Miller R, Sun X, Mehboob A, Radovick S, Wondisford FE (2010)
Metformin and Insulin Suppress Hepatic Gluconeogenesis by Inhibiting cAMP Signaling
Through Phosphorylation of CREB Binding Protein (CBP). Cell 137:635–646 . doi:
10.1016/j.cell.2009.03.016.Metformin
87. Hawley SA, Gadalla AE, Olsen GS, Grahame Hardie D (2002) The antidiabetic drug
metformin activates the AMP-activated protein kinase cascade via an adenine nucleotide-
independent mechanism. Diabetes 51:2420–2425 . doi: 10.2337/diabetes.51.8.2420
88. Shaw RJ, Lamia K a, Vasquez D, Koo S, Depinho RA, Montminy M, Cantley LC (2005) The
Kinase LKB1 Mediates Glucose Homeostasis in Liver and Therapeutic Effects of Metformin.
Science (80- ) 310:1642–1646 . doi: 10.1126/science.1120781.The
89. Bösenberg LH, van Zyl DG (2008) The mechanism of action of oral antidiabetic drugs: A
review of recent literature. J Endocrinol Metab Diabetes South Africa 13:80–88 . doi:
10.1080/22201009.2008.10872177
90. Formoso G, De Filippis E, Di Fulvio P, Pandolfi A, Bucciarelli T, Ciabattoni G, Nicolucci A,
Davi G, Consoli A (2008) Decreased in vivo oxidative stress and decreased platelet activation
following metformin treatment in newly diagnosed type 2 diabetic subjects. Diabetes Metab
24
Res Rev 24:13231–237 . doi: 10.1002/dmrr
91. Xiao CC, Ren A, Yang J, Ye SD, Xing XN, Li SM, Chen C, Chen RP (2015) Effects of
pioglitazone and glipizide on platelet function in patients with type 2 diabetes. Eur Rev Med
Pharmacol Sci 19:963–970
92. Saito Y, Okada S, Ogawa H, Soejima H, Sakuma M, Nakayama M, Doi N, Jinnouchi H, Waki
M, Masuda I, Morimoto T (2017) Low-Dose Aspirin for Primary Prevention of Cardiovascular
Events in Patients with Type 2 Diabetes Mellitus. Circulation 135:659–670 . doi:
10.1161/CIRCULATIONAHA.116.025760
93. Calkin AC, Drew BG, Ono A, Duffy SJ, Gordon M V., Schoenwaelder SM, Sviridov D,
Cooper ME, Kingwell BA, Jackson SP (2009) Reconstituted high-density lipoprotein
attenuates platelet function in individuals with type 2 diabetes mellitus by promoting
cholesterol efflux. Circulation 120:2095–2104 . doi:
10.1161/CIRCULATIONAHA.109.870709
94. Linden MD (2013) Using platelet function testing to guide antiplatelet therapy. Drug Dev Res
74:517–525 . doi: 10.1002/ddr.21110
95. Angiolillo DJ, Shoemaker SB, Desai B, Yuan H, Charlton RK, Bernardo E, Zenni MM,
Guzman LA, Bass TA, Costa MA (2007) Randomized comparison of a high clopidogrel
maintenance dose in patients with diabetes mellitus and coronary artery disease: Results of the
optimizing antiplatelet therapy in diabetes mellitus (OPTIMUS) study. Circulation 115:708–
716 . doi: 10.1161/CIRCULATIONAHA.106.667741
96. Suslova TE, Sitozhevskii A V., Ogurkova ON, Kravchenko ES, Kologrivova I V.,
Anfinogenova Y, Karpov RS (2015) Platelet hemostasis in patients with metabolic syndrome
and type 2 diabetes mellitus: cGMP- and NO-dependent mechanisms in the insulin-mediated
platelet aggregation. Front Physiol 5:1–8 . doi: 10.3389/fphys.2014.00501
97. American Diabetes Association (2004) Aspirin Therapy in Diabetes. Ann Intern Med
27:1997–1998 . doi: 10.2337/diacare.27.2007.S72
98. Collaboration AT (2002) Collaborative meta-analysis of randomised trials of antiplatelet
therapy for prevention of death, myocardial infarction, and stroke in high risk patients. Bmj
324:71–86 . doi: 10.1136/bmj.324.7329.71
25
Chapter 3. Research article one
Increased platelet-monocyte aggregates in diet-induced pre-diabetes.
1Zibusiso Mkandla, 1Tinashe Mutize, 2, 3 Phiwayinkosi V Dludla, 1Bongani B Nkambule
1University of KwaZulu-Natal (UKZN), University Road, Westville, Private Bag X54001,
Durban, 4000, South Africa.
2Department of Life and Environmental Sciences, Polytechnic University of Marche, Ancona
60131, Italy.
3Biomedical Research and Innovation Platform (BRIP), South African Medical Research
Council, Tygerberg 7505, South Africa.
Corresponding author: Zibusiso Mkandla
Email: [email protected]
26
3. Abstract
Introduction
The formation of platelet-monocyte aggregates (PMA) is a physiological feature which mediates the
pro-inflammatory role of platelets. Elevated PMAs in pre-diabetes may result in the development of
atherosclerosis. The aim of this study was to evaluate PMA formation in a pre-diabetes using a high-fat
diet mouse model, providing evidence of a link between inflammation and the hypercoagulable state in
pre-diabetes.
Methods
Whole blood was collected from two animal groups on low fat (control group) and high-fat diet (pre-
diabetic group). The glucose tolerance was determined using the oral glucose tolerance test and insulin
measurement was done using the enzyme linked immunoassay (ELISA) technique. Baseline
haematological parameters were also measured using the haemocytometer. PMAs were determined
using whole blood flow cytometry. To determine the level of PMA formation, blood from mice was
stained with an antibody cocktail containing CD45-BV500, CD14-PE and CD41-FITC antibodies.
Results
The mice had comparable body weights and insulin levels, however, the high-fat diet fed mice
demonstrated delayed glucose clearance, indicating that these mice were pre-diabetic. Baseline PMA
levels were elevated in the pre-diabetic group when compared to the controls. In addition, stimulation
with the adenosine diphosphate (ADP) agonist also significantly increased the level of platelet-
monocyte aggregates in the non-diabetic control mice however these remained comparable in the pre-
diabetic mice. Baseline levels of monocytes, measured using the CD14 monocyte marker, were
significantly decreased in the pre-diabetes.
Conclusions
In pre-diabetes, platelets readily interact with circulating monocytes and form PMAs which are early
markers for atherosclerosis. For the present study, the decrease in CD14 monocyte marker, indicated a
shift in the monocyte phenotype to the pro-inflammatory form CD14++, further providing a possible
link of the pro-thrombotic and pro-inflammatory role of platelets in pre-diabetes.
Keywords: flow cytometry; platelet-monocyte aggregates; pre-diabetes; pro-inflammation
3.1. Introduction
Chronic platelet activation has been associated with a sustained pro-inflammatory response and an
increased risk of cardiovascular complications (1). Monocytes, via the surface membrane P-selectin
glycoprotein ligand-1 (PSGL-1), bind to P-selectin expressed on the activated endothelial surface
27
mediated interaction (2). This represents the early events in the pathophysiological mechanisms leading
to atherosclerosis in type 2 diabetes mellitus (T2DM) (3). In a similar manner, activated platelets are
able to bind circulating peripheral blood leucocytes via P-selectin and PSGL-1 interactions, forming
platelet-leukocyte aggregates (PLAs) (4,5). The binding of P-selectin to its counter-receptor PGSL1
induces leukocyte tethering and firm adhesion of monocytes to the endothelium (6,7). As a result of the
receptor-ligand binding, leukocytes are activated through the translocation of nuclear factor ĸB (NF-
ĸB), an important transcriptional factor that is responsible for pro-inflammatory molecule synthesis (7).
Activation of the NF-ĸB pathway, in addition to increasing superoxide anion production, promotes
accelerated levels of monocyte chemoattractant protein-1 (MCP-1), tumour necrosis factor-α (TNF-α),
interleukin-8 (IL-8), IL-1β and cyclooxygenase-2 (COX-2) (5). Elevated expression of these pro-
inflammatory markers is concomitant with the formation of monocyte aggregates (PMA) (8). Previous
studies have shown that platelets preferentially bind to monocytes, thus PMAs are regarded as stable
markers of platelet activation (3,5,9). These interactions provide a link between the inflammatory and
thrombotic responses involved in conditions such as T2DM where elevated levels of PMAs have been
reported (10–12). The aim of this study was to evaluate PMA formation in a pre-diabetic mouse model,
providing evidence of a link in the inflammatory status of diabetes with hypercoagulable status.
Investigating a pre-diabetic state could identify essential pathophysiological mechanisms that are
involved in early-stage development of T2DM.
3.2. Methodology
3.2.1. Study design
Five-week-old C57BL/6 male mice were housed, individually in a cage, at the University of KwaZulu-
Natal (UKZN) biomedical research unit (BRU). Animals were handled according to the principles of
laboratory Animal Care of the National Society of Medical Research and the National Institutes of
Animal Care and Use of Laboratory Animals of the National Academy of Sciences (National Institute
of Health publication 80-23, revised 1978). Ethical clearance was granted by the UKZN animal research
ethics committee (AREC), ethics registration number AREC/086/016. Animals were allowed to
acclimatize for a week before being fed on the experimental diets, control low-fat diet (n=8) (D12450J
10 kcal% fat) and a high-fat diet (HFD) (n=22) (D12492, 60 kcal% fat) (Research Diets, NJ, USA). All
mice had free access to water and food ad libitium. The animals were regularly monitored while the
cages were cleaned once a week, to ensure a clean environment for the mice.
3.2.2. Oral glucose tolerance tests
Oral glucose tolerance tests were performed as previously described (13). In brief, after an 8 hour fast,
2g/kg of glucose was administered using oral gavage technique. Blood glucose levels were then
measured at different time intervals (30, 60, 120 minutes) using the Accu-Chek active blood glucometer
(Roche, Basel, Switzerland).
28
3.2.3. Blood collection for haematology characteristics and flow cytometry analysis
After 3 weeks on an HFD or control diet, 200µl of venous blood was collected using the tail bleeding
method and the mice were terminated using inhalation of halothen. Venous blood was collected into
3.2% citrate coated microtainer tubes (Sigma Aldrich, St Louis, Missouri, USA).
3.2.4. Measurement of haematological parameters
The Beckman Coulter Ac T diffTM analyser (Beckman Coulter, Brea, CA, USA.) was used to measure
the baseline haematological parameters such as red blood cell count, white cell count, platelet count,
haematocrit, mean cell volume and plateletcrit as per manufacturer’s protocol.
3.2.5. Instrument set-up and optimization
The BD FACSCanto II flow cytometer (BD Bioscience, NJ, USA) was used and the cytometer set-up
and tracking (CST) beads (BD Bioscience, NJ, USA) were used to perform internal quality control (QC)
as per manufacturer’s protocol. To compute and compensate for spectral overlap the BD ™ Compbead
compensation particles (BD Bioscience, NJ, USA) were used. In addition, SPHERO ™ 6-peak Rainbow
calibration particles (BD Bioscience, NJ, USA) were used daily as QC for the median fluorescence
intensity (MFI).
3.2.6. Measurement of baseline platelet-monocyte aggregates (PMA)
The measurement of baseline (unstimulated) PMA levels was performed within 30 min blood
collection. Briefly, 25µl of the blood was stained with 2.5µl (ratio 1:10) of the anti-mouse monoclonal
antibody cocktail containing CD14-PE (clone: rmC5-3) (monocyte marker), CD41-FITC (clone:
MWReg30) (platelet marker) and CD45-BV510 (clone: 30-F11) (leukocyte marker) for 10 minutes in
the dark at room temperature. These samples were fixed using 25µl of thrombofix (Beckman Coulter,
Brea, CA, USA) prior to red blood cell lysis. The samples were then lysed with 350µl FACSLyse lysis
buffer (BD Bioscience, NJ, USA) for 15minutes in the dark at room temperature. This was then analysed
on the BD FACSCanto II flow cytometer (BD Bioscience, NJ, USA).
3.2.7. Measurement of PMA post stimulation with ADP
To investigate the role of agonist-activated platelets in the formation of PMAs in hyperglycemic
conditions, ADP was used to stimulate platelets and PMA levels were determined by flow cytometry.
Briefly, 25µl of the citrated blood was incubated with 10µl (20µM) ADP for 15 minutes and then fixed
with 25µl of thrombofix (Beckman Coulter, Brea, CA, USA). The sample was then stained with 2.5µl
(ratio 1:10) of anti-mouse monoclonal antibody cocktail containing CD14-PE PE (clone: rmC5-3),
CD41-FITC (clone: MWReg30) and CD45-BV510 (clone: 30-F11) (BD Bioscience, NJ, USA) and
incubated for 10 minutes, at room temperature in the dark. The analysis was then done on the BD
FACSCanto II flow cytometer (BD Bioscience, NJ, USA).
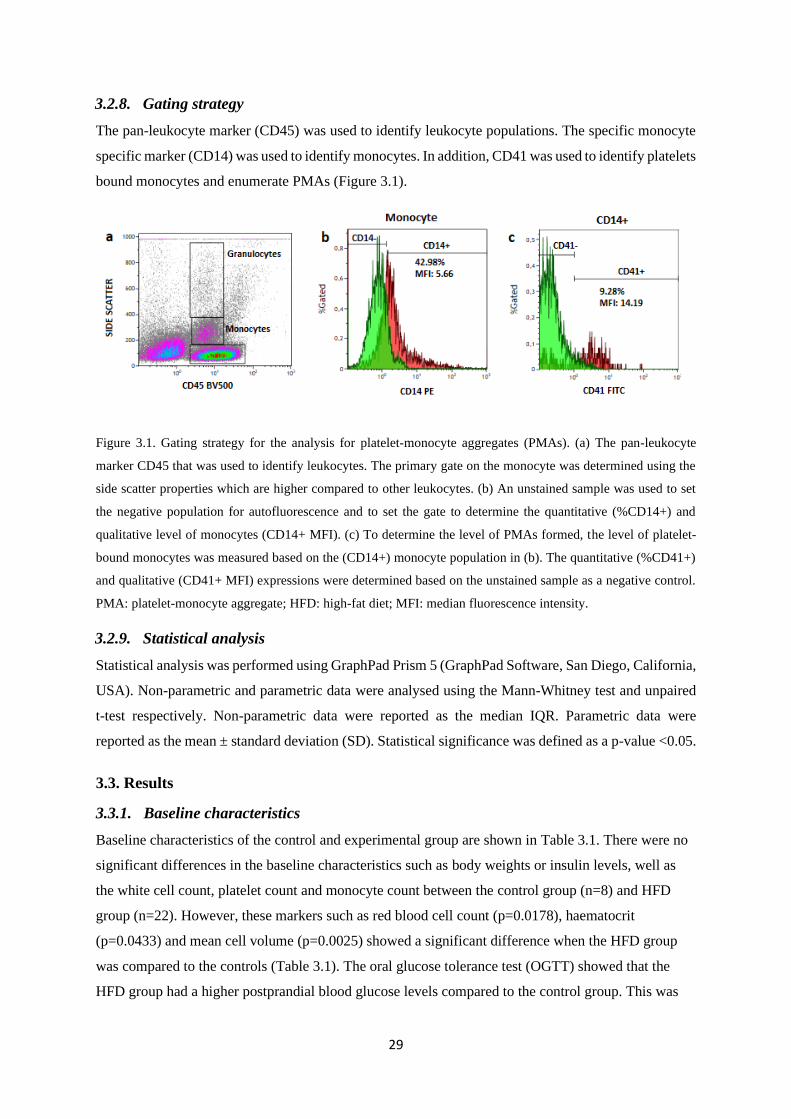
29
3.2.8. Gating strategy
The pan-leukocyte marker (CD45) was used to identify leukocyte populations. The specific monocyte
specific marker (CD14) was used to identify monocytes. In addition, CD41 was used to identify platelets
bound monocytes and enumerate PMAs (Figure 3.1).
Figure 3.1. Gating strategy for the analysis for platelet-monocyte aggregates (PMAs). (a) The pan-leukocyte
marker CD45 that was used to identify leukocytes. The primary gate on the monocyte was determined using the
side scatter properties which are higher compared to other leukocytes. (b) An unstained sample was used to set
the negative population for autofluorescence and to set the gate to determine the quantitative (%CD14+) and
qualitative level of monocytes (CD14+ MFI). (c) To determine the level of PMAs formed, the level of platelet-
bound monocytes was measured based on the (CD14+) monocyte population in (b). The quantitative (%CD41+)
and qualitative (CD41+ MFI) expressions were determined based on the unstained sample as a negative control.
PMA: platelet-monocyte aggregate; HFD: high-fat diet; MFI: median fluorescence intensity.
3.2.9. Statistical analysis
Statistical analysis was performed using GraphPad Prism 5 (GraphPad Software, San Diego, California,
USA). Non-parametric and parametric data were analysed using the Mann-Whitney test and unpaired
t-test respectively. Non-parametric data were reported as the median IQR. Parametric data were
reported as the mean ± standard deviation (SD). Statistical significance was defined as a p-value <0.05.
3.3. Results
3.3.1. Baseline characteristics
Baseline characteristics of the control and experimental group are shown in Table 3.1. There were no
significant differences in the baseline characteristics such as body weights or insulin levels, well as
the white cell count, platelet count and monocyte count between the control group (n=8) and HFD
group (n=22). However, these markers such as red blood cell count (p=0.0178), haematocrit
(p=0.0433) and mean cell volume (p=0.0025) showed a significant difference when the HFD group
was compared to the controls (Table 3.1). The oral glucose tolerance test (OGTT) showed that the
HFD group had a higher postprandial blood glucose levels compared to the control group. This was
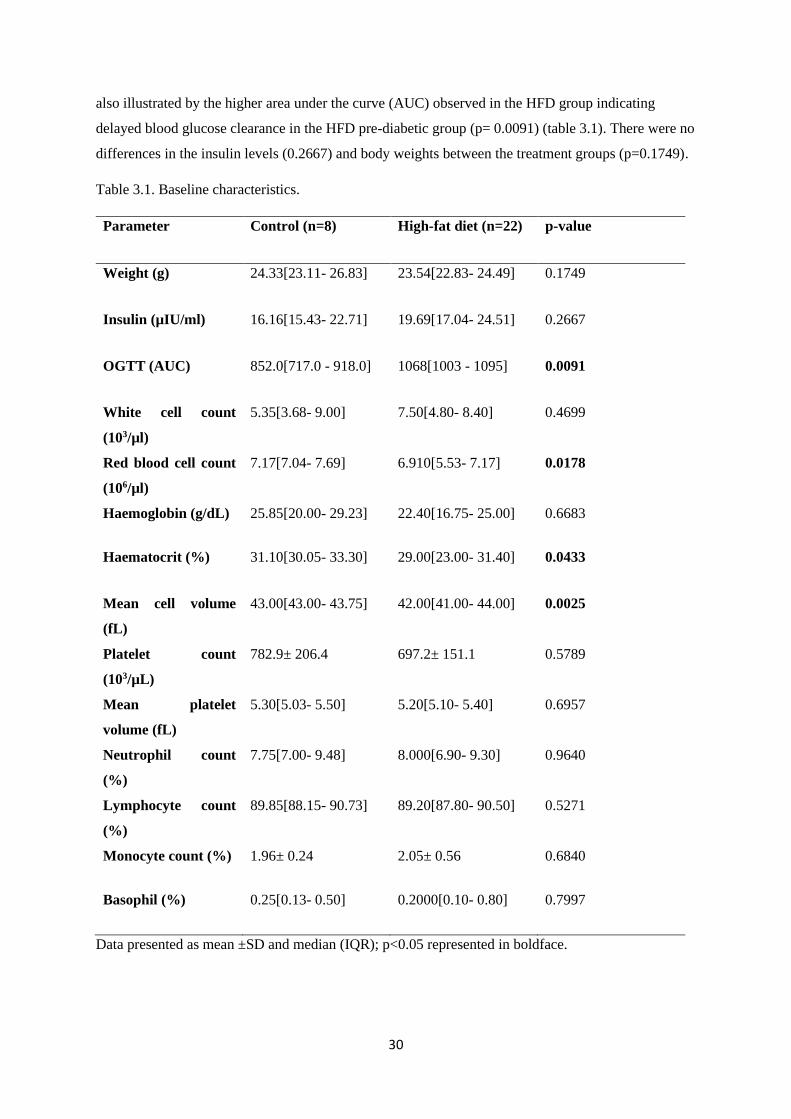
30
also illustrated by the higher area under the curve (AUC) observed in the HFD group indicating
delayed blood glucose clearance in the HFD pre-diabetic group (p= 0.0091) (table 3.1). There were no
differences in the insulin levels (0.2667) and body weights between the treatment groups (p=0.1749).
Table 3.1. Baseline characteristics.
Parameter Control (n=8) High-fat diet (n=22) p-value
Weight (g) 24.33[23.11- 26.83] 23.54[22.83- 24.49] 0.1749
Insulin (µIU/ml) 16.16[15.43- 22.71] 19.69[17.04- 24.51] 0.2667
OGTT (AUC) 852.0[717.0 - 918.0] 1068[1003 - 1095] 0.0091
White cell count
(103/µl)
5.35[3.68- 9.00] 7.50[4.80- 8.40] 0.4699
Red blood cell count
(106/µl)
7.17[7.04- 7.69] 6.910[5.53- 7.17] 0.0178
Haemoglobin (g/dL) 25.85[20.00- 29.23] 22.40[16.75- 25.00] 0.6683
Haematocrit (%) 31.10[30.05- 33.30] 29.00[23.00- 31.40] 0.0433
Mean cell volume
(fL)
43.00[43.00- 43.75] 42.00[41.00- 44.00] 0.0025
Platelet count
(103/µL)
782.9± 206.4 697.2± 151.1 0.5789
Mean platelet
volume (fL)
5.30[5.03- 5.50] 5.20[5.10- 5.40] 0.6957
Neutrophil count
(%)
7.75[7.00- 9.48] 8.000[6.90- 9.30] 0.9640
Lymphocyte count
(%)
89.85[88.15- 90.73] 89.20[87.80- 90.50] 0.5271
Monocyte count (%) 1.96± 0.24 2.05± 0.56 0.6840
Basophil (%) 0.25[0.13- 0.50] 0.2000[0.10- 0.80] 0.7997
Data presented as mean ±SD and median (IQR); p<0.05 represented in boldface.
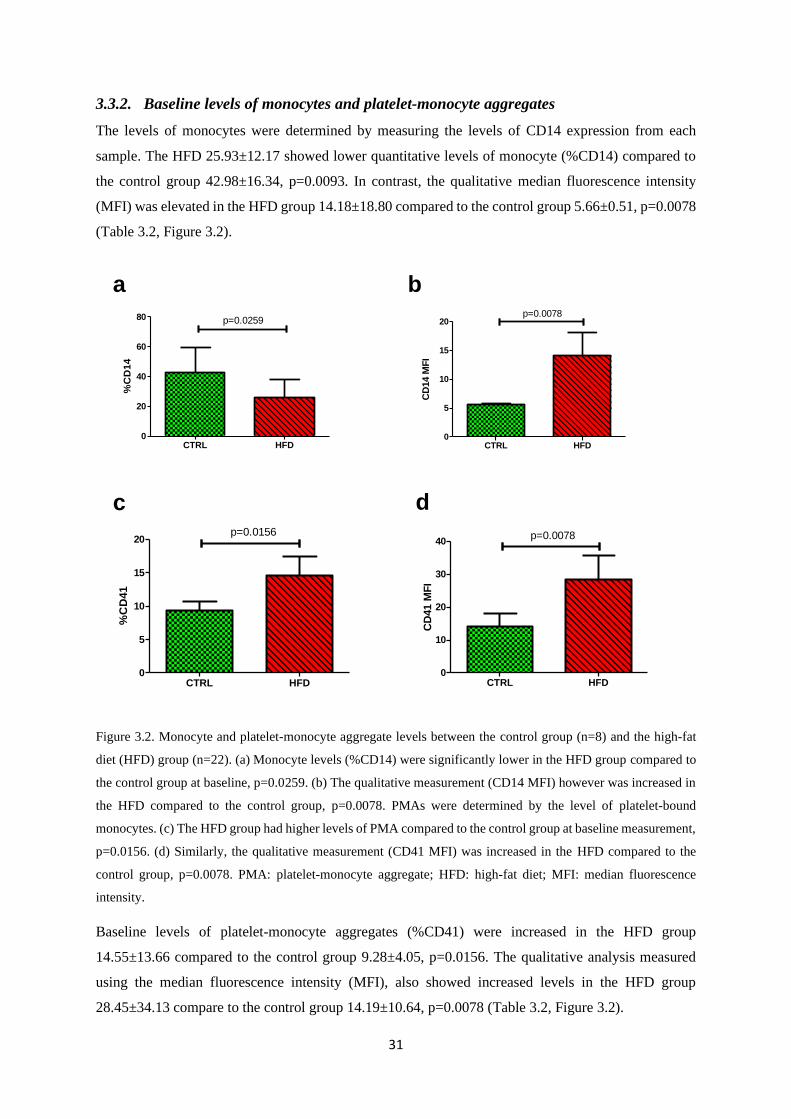
31
3.3.2. Baseline levels of monocytes and platelet-monocyte aggregates
The levels of monocytes were determined by measuring the levels of CD14 expression from each
sample. The HFD 25.93±12.17 showed lower quantitative levels of monocyte (%CD14) compared to
the control group 42.98±16.34, p=0.0093. In contrast, the qualitative median fluorescence intensity
(MFI) was elevated in the HFD group 14.18±18.80 compared to the control group 5.66±0.51, p=0.0078
(Table 3.2, Figure 3.2).
CTRL HFD0
5
10
15
20p=0.0156
%C
D41
CTRL HFD0
10
20
30
40p=0.0078
CD
41 M
FI
a b
CTRL HFD0
20
40
60
80 p=0.0259
%C
D1
4
CTRL HFD0
5
10
15
20p=0.0078
CD
14 M
FI
c d
Figure 3.2. Monocyte and platelet-monocyte aggregate levels between the control group (n=8) and the high-fat
diet (HFD) group (n=22). (a) Monocyte levels (%CD14) were significantly lower in the HFD group compared to
the control group at baseline, p=0.0259. (b) The qualitative measurement (CD14 MFI) however was increased in
the HFD compared to the control group, p=0.0078. PMAs were determined by the level of platelet-bound
monocytes. (c) The HFD group had higher levels of PMA compared to the control group at baseline measurement,
p=0.0156. (d) Similarly, the qualitative measurement (CD41 MFI) was increased in the HFD compared to the
control group, p=0.0078. PMA: platelet-monocyte aggregate; HFD: high-fat diet; MFI: median fluorescence
intensity.
Baseline levels of platelet-monocyte aggregates (%CD41) were increased in the HFD group
14.55±13.66 compared to the control group 9.28±4.05, p=0.0156. The qualitative analysis measured
using the median fluorescence intensity (MFI), also showed increased levels in the HFD group
28.45±34.13 compare to the control group 14.19±10.64, p=0.0078 (Table 3.2, Figure 3.2).
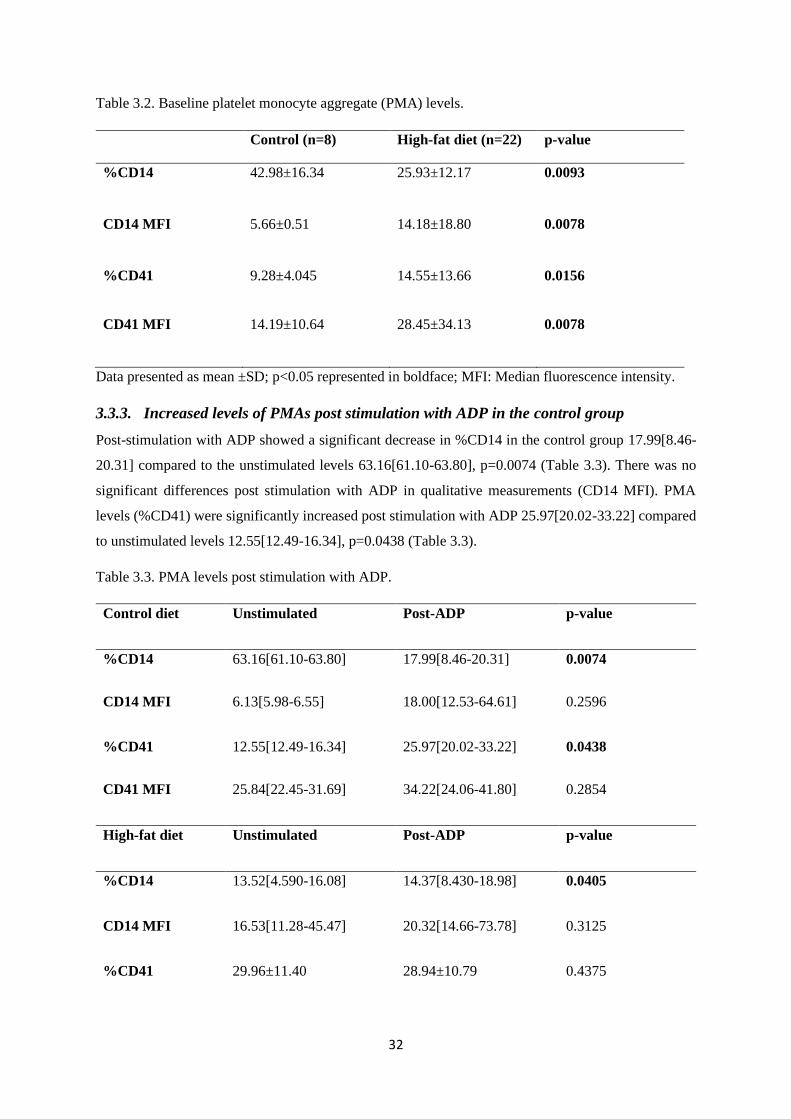
32
Table 3.2. Baseline platelet monocyte aggregate (PMA) levels.
Control (n=8) High-fat diet (n=22) p-value
%CD14 42.98±16.34 25.93±12.17 0.0093
CD14 MFI 5.66±0.51 14.18±18.80 0.0078
%CD41 9.28±4.045 14.55±13.66 0.0156
CD41 MFI 14.19±10.64 28.45±34.13 0.0078
Data presented as mean ±SD; p<0.05 represented in boldface; MFI: Median fluorescence intensity.
3.3.3. Increased levels of PMAs post stimulation with ADP in the control group
Post-stimulation with ADP showed a significant decrease in %CD14 in the control group 17.99[8.46-
20.31] compared to the unstimulated levels 63.16[61.10-63.80], p=0.0074 (Table 3.3). There was no
significant differences post stimulation with ADP in qualitative measurements (CD14 MFI). PMA
levels (%CD41) were significantly increased post stimulation with ADP 25.97[20.02-33.22] compared
to unstimulated levels 12.55[12.49-16.34], p=0.0438 (Table 3.3).
Table 3.3. PMA levels post stimulation with ADP.
Control diet Unstimulated Post-ADP p-value
%CD14 63.16[61.10-63.80] 17.99[8.46-20.31] 0.0074
CD14 MFI 6.13[5.98-6.55] 18.00[12.53-64.61] 0.2596
%CD41 12.55[12.49-16.34] 25.97[20.02-33.22] 0.0438
CD41 MFI 25.84[22.45-31.69] 34.22[24.06-41.80] 0.2854
High-fat diet Unstimulated Post-ADP p-value
%CD14 13.52[4.590-16.08] 14.37[8.430-18.98] 0.0405
CD14 MFI 16.53[11.28-45.47] 20.32[14.66-73.78] 0.3125
%CD41 29.96±11.40 28.94±10.79 0.4375
33
CD41 MFI 67.22±28.19 40.08±14.95 0.0938
Data presented as mean ±SD; p<0.05 represented in boldface; MFI: Median fluorescence intensity;
ADP: adenosine diphosphate.
3.3.4. Increased levels of PMAs post stimulation with 20µM ADP in HFD group
The HFD group showed a significant decrease in the %CD14 post stimulation with ADP 14.37[8.430-
18.98] compared to unstimulated levels 13.52[4.590-16.08], p=0.0405. Interestingly there was no
significant difference between the unstimulated PMA levels 29.96±11.40 and post-ADP stimulation
28.94±10.79, p=0.4375 (Table 3.3).
3.4. Discussion
The aim of this study was to evaluate PMA formation in an HFD induced pre-diabetic mouse model.
The C57BL/6 mice used were the ideal model for this study as they develop glucose intolerance when
fed on an HFD (13) This study also aimed at elucidating a link between inflammation and the
hypercoagulable state observed in diabetes. Although animals presented with nonsignificant differences
in basic parameters such as body weight and insulin levels, markers indicating platelet activation
enhanced. This result may suggest that pathogenesis of pre-diabetes leading to the development of
T2DM may initiate even before individuals present significant changes in body weight or insulin levels.
Overall, this study was able to demonstrate that in pre-diabetes, activated platelets readily interact with
monocytes forming PMAs which have been described as early markers for atherosclerosis in T2DM
(14). The formation of these aggregates at this early stage of pre-diabetes may indicate the hyperreactive
nature of platelets which characterize the diabetic condition. We were able to demonstrate that activated
platelets were capable of forming these interactions by flow cytometry measurements of platelet-bound
monocytes. This is in agreement with previous studies which demonstrated that activated platelets
interact with monocytes via P-selectin and its counter-receptor PSGL-1 expressed on the surface of
monocytes (3,4,15). To the best of our knowledge, our study is the first to assess PMAs using a diet-
induced pre-diabetes animal model, which could significantly enhance our current understanding on the
susceptibility of the vasculature to abnormally enhanced platelet activation.
The animal experimental model showed that pre-diabetic mice exhibited elevated levels of PMAs,
indicating increased interactions between platelets and monocytes than in non-diabetic states. The
qualitative increase of the PMAs also reiterates the increased levels of platelet-monocyte interactions
in the pre-diabetes which may promote thrombosis. A previous study showed that increased PMA levels
in individuals who already had coronary artery disease (15). In any case, individuals with myocardial
infarctions exhibit high levels of PMAs (16,17). It has been suggested that increased levels of PMA as
well as platelet-neutrophil aggregates in T2DM further highlighting the importance of the platelet-
monocyte interactions in the progression of the pro-thrombotic state (12).
34
Consistently, in response to ADP stimulation, the pre-diabetic group exhibited an increase in the
formation of PMAs indicating the hyperreactive nature of platelets in this disease state. ADP is a platelet
agonist which activates the P2Y12 pathway resulting to its the translocation of P-selectin from the alpha
granules to the cell surface (16,18,19). Activated platelets form interactions with monocytes, this is
mediated by the binding of P-selectin to its receptor PSGL-1 on the surface of these cells (3). Platelet-
bound monocytes are activated and differentiated into pro-inflammatory monocytes. This is
accompanied by an increase in the expression of CD11b, a marker of monocyte activation (3,16,20).
To that effect, our study showed a decrease in CD14 monocyte marker, indicating a shift in the
monocyte phenotype to the pro-inflammatory form CD14++ which can be explained by the higher
qualitative analysis (CD14 MFI).
The hyperreactive nature of platelets in pre-diabetes may be associated with increased PMA formation,
the early marker of atherosclerosis that is known to promote a pro-inflammatory state (13,21). A
drawback of this study may be that the levels of pro-inflammatory markers produced as a result of PMA
formation were not determined. Further studies evaluating the monocyte pro-inflammatory response as
a result of platelet binding interactions in pre-diabetes will provide insight into the role of these in the
transmigration of monocytes into metabolic tissue.
3.5. Acknowledgements
We would like to acknowledge the Biomedical research unit and the Department of Human Physiology,
College of Health Sciences (CHS), University of KwaZulu-Natal for providing access to the flow
cytometry analysis facility and Biomedical research unit for the animal housing facilities.
3.6. Author contributions
ZM: contributed in the conceptualisation and drafting of the article, analysis and interpretation of data
and final approval of the version to be published.
TM: revision and final approval of the article.
PVD: revision and final approval of the article.
BBN: contributed to the conceptualisation analysis and interpretation of data and final approval of the
version to be published.
3.7. Ethical approval
All applicable international, national, and/or institutional guidelines for the care and use of animals
were followed. Animals were handled according to the principles of laboratory Animal Care of the
National Society of Medical Research and the National Institutes of Animal Care and Use of Laboratory
Animals of the National Academy of Sciences (National Institute of Health publication 80-23, revised
35
1978). Ethical clearance was granted by the UKZN animal research ethics committee (AREC), ethics
registration number AREC/086/016
3.8. References
1. Samad F, Ruf W. Review Article In flammation , obesity , and thrombosis. 2016;122(20):3415–
23.
2. Yngen M, Östenson CG, Hu H, Li N, Hjemdahl P, Wallén NH. Enhanced P-selectin expression
and increased soluble CD40 Ligand in patients with Type 1 diabetes mellitus and
microangiopathy: Evidence for platelet hyperactivity and chronic inflammation. Diabetologia.
2004;47(3):537–40.
3. Bournazos S, Rennie J, Hart SP, Fox KAA, Dransfield I. Monocyte functional responsiveness
after PSGL-1-mediated platelet adhesion is dependent on platelet activation status. Arterioscler
Thromb Vasc Biol. 2008;28(8):1491–8.
4. Liang H, Duan Z, Li D, Li D, Wang Z, Ren L, et al. Higher levels of circulating monocyte-
platelet aggregates are correlated with viremia and increased sCD163 levels in HIV-1 infection.
Cell Mol Immunol [Internet]. 2015;12(4):435–43. Available from:
http://www.pubmedcentral.nih.gov/articlerender.fcgi?artid=4496539&tool=pmcentrez&render
type=abstract
5. Hui H, Fuller KA, Erber WN, Linden MD. Imaging flow cytometry in the assessment of
leukocyte-platelet aggregates. Methods [Internet]. 2017;112:46–54. Available from:
http://dx.doi.org/10.1016/j.ymeth.2016.10.002
6. Dorsam RT, Kunapuli SP. Central role of the P2Y 12 receptor in platelet activation. J Clin Invest.
2004;113(3):10–5.
7. Cerletti C, Tamburrelli C, Izzi B, Gianfagna F, Gaetano G De. Platelet-leukocyte interactions in
thrombosis. Thromb Res [Internet]. 2012;129(3):263–6. Available from:
http://dx.doi.org/10.1016/j.thromres.2011.10.010
8. Wrigley BJ, Shantsila E, Tapp LD, Lip GYH. Increased Formation of monocyte-platelet
aggregates in ischemic heart failure. Circ Hear Fail. 2013;6(1):127–35.
9. Michelson AD, Barnard MR, Krueger LA, Valeri CR, Furman MI. Circulating Monocyte-
Platelet Aggregates Are a More Sensitive Marker of In Vivo Platelet Activation Than Platelet
Surface P-Selectin: Studies in Baboons, Human Coronary Intervention, and Human Acute
Myocardial Infarction. Circulation [Internet]. 2001;104(13):1533–7. Available from:
http://circ.ahajournals.org/cgi/doi/10.1161/hc3801.095588
36
10. van Gils JM, Zwaginga JJ, Hordijk PL. Molecular and functional interactions among monocytes,
platelets, and endothelial cells and their relevance for cardiovascular diseases. J Leukoc Biol.
2009;85(2):195–204.
11. Li Z, Yang F, Dunn S, Gross AK, Smyth SS. Platelets as immune mediators: Their role in host
defense responses and sepsis [Internet]. Vol. 127, Thrombosis Research. Elsevier B.V.; 2011. p.
184–8. Available from: http://dx.doi.org/10.1016/j.thromres.2010.10.010
12. Davison GM, Nkambule BB, Mkandla Z, Hon GM, Kengne AP, Erasmus RT, et al. Platelet,
monocyte and neutrophil activation and glucose tolerance in South African Mixed Ancestry
individuals. Sci Rep [Internet]. 2017 Jan 16;7:40329. Available from:
http://www.nature.com/articles/srep40329
13. Andrikopoulos S, Blair AR, Deluca N, Fam BC, Proietto J. Evaluating the glucose tolerance test
in mice. 2008;1323–32.
14. Patkó Z, Császár A, Acsády G, Ôry I, Takács ÉVA, Fûrész J. Elevation of monocyte – platelet
aggregates is an early marker of type 2 diabetes. 2012;4(2):181–5.
15. Furman MI, Benoit SE, Barnard MR, Valeri CR, Borbone ML, Becker RC, et al. Increased
platelet reactivity and circulating monocyte-platelet aggregates in patients with stable coronary
artery disease. J Am Coll Cardiol [Internet]. 1998;31(2):352–8. Available from:
http://dx.doi.org/10.1016/S0735-1097(97)00510-X
16. Projahn D, Koenen RR. Platelets: key players in vascular inflammation. J Leukoc Biol [Internet].
2012;92(6):1167–75. Available from: http://www.jleukbio.org/cgi/doi/10.1189/jlb.0312151
17. Furman MI, Barnard MR, Krueger LA, Fox ML, Shilale EA, Lessard DM, et al. Circulating
monocyte-platelet aggregates are an early marker of acute myocardial infarction. J Am Coll
Cardiol. 2001;38(4):1002–6.
18. Sudic D, Razmara M, Forslund M, Ji Q, Hjemdahl P, Li N. High glucose levels enhance platelet
activation: Involvement of multiple mechanisms. Br J Haematol. 2006;133(3):315–22.
19. von Hentig N, Förster A-K, Kuczka K, Klinkhardt U, Klauke S, Gute P, et al. Platelet-leucocyte
adhesion markers before and after the initiation of antiretroviral therapy with HIV protease
inhibitors. J Antimicrob Chemother [Internet]. 2008;62(5):1118–21. Available from:
http://www.ncbi.nlm.nih.gov/pubmed/18753189
20. Barnard MR, Linden MD, Frelinger AL, Li Y, Fox ML, Furman MI, et al. Effects of platelet
binding on whole blood flow cytometry assays of monocyte and neutrophil procoagulant
activity. J Thromb Haemost. 2005;3(11):2563–70.

37
21. Rutten B, Tersteeg C, Vrijenhoek JEP, Van Holten TC, Elsenberg EHAM, Mak-Nienhuis EM,
et al. Increased platelet reactivity is associated with circulating platelet-monocyte complexes
and macrophages in human atherosclerotic plaques. PLoS One. 2014;9(8):1–8.
38
3.9. Bridging chapter
The formation of platelet monocyte aggregates provides a robust measurement of platelet activation. It
gives a basis for further analysis on the functionality of the activated platelets in the following chapter.
After determining increased platelet activation levels in pre-diabetes, we further elucidated on the role
of platelet hyperactivity in pre-diabetes by measured platelet reactivity and function in response to
stimulation of the P2Y, cyclooxygenase and glycoprotein VI mediated signalling pathways.
39
Chapter 4. Research article two
High-fat-diet impairs glucose tolerance and enhances platelet reactivity in C57BL/6 mice
Zibusiso Mkandla (MSc) a, Tinashe Mutize (MSc) a, Phiwayinkosi V Dludla (Ph.D.) b, c, Bongani B
Nkambule (Ph.D.) a
aUniversity of KwaZulu-Natal (UKZN), University Road, Westville, Private Bag X54001, Durban,
4000, South Africa.
bDepartment of Life and Environmental Sciences, Polytechnic University of Marche, Ancona 60131,
Italy.
cBiomedical Research and Innovation Platform (BRIP), South African Medical Research Council,
Tygerberg 7505, South Africa.
Corresponding author: Zibusiso Mkandla
Phone: +27792731696
Email: [email protected]
Total word count: 4953 words
40
4. Abstract
Background
Platelet hyperactivity is associated with microvascular and macrovascular complications in type 2
diabetics. Although such complications have been identified in pre-diabetes, the role of platelet activity
in a pre-diabetic state is poorly understood. This study aimed at assessing the levels of platelet activation
and function in a pre-diabetic mouse model to improve our understanding of mechanisms involved in
the development of diabetes induced vascular damage.
Methods
A 60% high-fat diet (HFD) was used to induce pre-diabetes in C57BL/6 mice. Body weights, glucose
tolerance, insulin levels and haematological parameters were measured after 3 weeks on the diet. In
order to investigate platelet reactivity in HFD fed mice, their whole blood samples were stimulated with
varying concentrations of adenosine diphosphate (ADP) and then stained with the platelet markers
including glycoprotein IIb/IIIa (CD41), P-selectin (CD62P), and glycoprotein IV (CD36).
Results
Results showed that despite no significant differences in body weights, glucose tolerance was impaired
in these pre-diabetic mice. There were no significant differences in the haematological parameters
measured between the two study groups. Post-stimulation with different agonists concentrations
resulted in elevated %CD62P expression in the HFD group.
Conclusions
The results show that despite not gaining weight, mice fed an HFD diet displayed impaired glucose
tolerance and platelet reactivity. In addition to inferring that a pre-diabetic state may occur independent
of weight gain in individuals, it also shows the high risk of such individuals in this state to develop
cardiovascular complications.
Keywords: Pre-diabetes; Platelet reactivity; Platelet function; Flow cytometry
4.1. Introduction
Type 2 diabetes mellitus (T2DM) is characterised by insulin resistance, hyperglycaemia,
hyperinsulinemia and an increased incidence of microvascular and macrovascular complications (1,2).
On the other hand, pre-diabetes is defined as a state of impaired glucose tolerance that is associated
with at higher risk of developing T2DM (3,4). Previous studies have focused on the pathophysiological
mechanisms in a pre-diabetic state, in efforts to identify interventions to curb diabetic complications
that may lead to the development of cardiovascular disease (CVD). In pre-diabetic individuals, elevated
levels of activated peripheral blood platelets have been associated with myocardial infarcts of coronary
41
artery disease (5,6). Although precise mechanisms involved in this process are not fully known,
disturbances in several platelet signalling pathways such as adenosine diphosphate receptor (P2Y12)
may initiate these irregularities (5,7). It is also reported that activated platelets play a crucial role in
initiating inflammation, coagulation and subsequent thrombus formation through the actions of a cell
adhesion molecule, P-selectin (8,9). Elevated levels of P-selectin have already been linked with an
increased risk of coronary artery disease in individuals living with T2DM (5,10), suggesting that
increased platelet activation plays a major role in the development of CVD.
Platelets also express glycoprotein IV (CD36), a major platelet glycoprotein that is involved in
thrombus formation (11,12). In resting platelets, CD36 is localised on the alpha granule membrane and
the open canalicular system (13). Whereas on activated platelets, CD36 is densely expressed on
pseudopods and the plasma membrane (13). The soluble form of CD36, sCD36, has been described as
a novel biomarker of T2DM (14). Several other studies have shown that sCD36 is associated with the
development of obesity, insulin resistance, increased risk of T2DM and atherosclerosis (14–16).
Although elevated levels of both P-selectin and CD36 are linked with the aggravation of inflammation,
comprehensive understanding of enhanced platelet-mediated responses in a pre-diabetic state remain
unclear. However, it is currently understood that an elevated platelet reactivity index (PRI) may be
associated with an increased incidence of long-term cardiovascular events (5,17). In this study, we
aimed at assessing the role of platelet activation and function in a pre-diabetic state through the use of
endogenous agonists which stimulate the purinergic receptor (P2Y12), phospholipase C (PLC) and
cyclooxygenase (COX) platelet signalling pathways.
4.2. Methodology
4.2.1. Study design and animal care
Male C57BL/6 mice (age: 5 weeks) were purchased from the University of KwaZulu-Natal (UKZN)
biomedical research unit (BRU) and handled according to the principles of laboratory animal Care of
the National Society of Medical Research and the National Institutes of Animal Care and Use of
Laboratory Animals of the National Academy of Sciences (National Institute of Health publication 80-
23, revised 1978). Ethical clearance was granted by the UKZN animal research ethics committee
(AREC), ethics registration number AREC/086/016.
After the 1-week acclimatization period, the mice (n=18) were randomized into two diet groups and
kept on the respective diets for a duration of 3 weeks. Mice in the experimental group (n=13) were fed
a high-fat diet (HFD), which contained 60% kilocalories derived from fats (Research diet no. D12492;
Research Diets, New Brunswick, NJ, USA). The control group (n=5) received a low-fat control diet
containing 10% kilocalories fat (Research diet no. D12450J; Research Diets, New Brunswick, NJ,
USA). Mice were housed in a controlled environment with a twelve-hour light/dark cycle (lights were
42
switched on at 6:00 AM and switched off at 6:00 PM) and a temperature range of 23-25ºC (relative
humidity: ∼50%). The mice also had unlimited access to water. Furthermore, they were regularly
monitored while the cages were cleaned once a week, to ensure a clean environment.
4.2.2. Oral glucose tolerance tests
After 3-weeks on HFD, all mice fasted for 8 hours before their fasting blood glucose levels were
measured as previously described (18). Briefly, using oral gavage method, 2g/kg of glucose was
administered, and blood glucose levels were measured at varying time intervals (0 minutes (baseline),
30 minutes, 60 minutes, and 120 minutes), using the Accu-Check active blood glucometer (Roche,
Basel, Switzerland).
4.2.3. Blood collection
After 3 weeks on the experimental diets (at 9 weeks of age), 200µl of venous blood was collected from
the lateral tail vein. This was collected into 3.2% sodium citrate coated microtainer tubes (Sigma
Aldrich, St Louis, Missouri, USA).
4.2.4. Measurement of baseline haematological parameters
The baseline haematological parameters which included the platelet counts and mean platelet volume
were measured using the Beckman Coulter AcT diffTM analyser (Beckman Coulter, Brea, CA, USA),
following manufacturer’s instructions.
4.2.5. Platelet flow cytometry and platelet function analysis
Flow cytometry analysis was performed within 30 minutes of blood collection. Internal quality control
(QC) was performed using the Becton Dickson (BD) cytometer set-up and tracking (CST) beads (BD
Bioscience, NJ, USA), as per manufacturer’s instructions. The BD ™ Compbead compensation
particles were used to calculate and compensate for spectral overlap between the fluorescent channels.
In addition, daily monitoring of potential instrumental drifts was performed using the SPHERO ™ 6-
peak Rainbow calibration particles (BD Bioscience, NJ, USA) and used as QC for all median
fluorescence intensity (MFI) measurements.
4.2.6. Baseline measurement of markers of platelet activation
The baseline levels of circulating activated platelets were determined as previously described (19).
Briefly, 25µl of whole blood was stained with 2.5µl of a titrated antibody cocktail containing
glycoprotein IIb/IIIa, CD41-FITC (used as a platelet marker); P-selectin, CD62P-BV421 (used as a
platelet activation marker) and glycoprotein IV, and CD36-PE (used as a platelet aggregation marker)
(BD Bioscience, NJ, USA). The samples were then incubated at room temperature for 10 minutes and
immediately analysed on the BD FACS Canto II flow cytometer (BD Bioscience, NJ, USA).
43
4.2.7. Platelet function analysis: Agonist-induced platelet activation
Two varying concentrations of ADP (4µM for reversible and 20µM for irreversible platelet activation),
collagen (0.19mg/mL) and arachidonic acid (500µg/mL) (irreversible single wave platelet activation)
(Bio-data co-operation, Pennsylvania, USA) were used as previously described (19). Briefly, 25µl of
whole blood was stimulated with 10µl of agonist in a staggered manner and incubated at room
temperature for 15 minutes. The samples were then stained with 2.5µl of the antibody cocktail
containing CD41-FITC (clone MWReg30), CD62P-BV421 (clone RB40.34), and CD36-PE (clone
CRF D-2712) (BD Bioscience, New Jersey, USA) and incubated for 10 minutes in the dark, at room
temperature. The lysis of red blood cells was omitted as this has been shown to induce platelet activation
by releasing ADP as described by Helms et. al (20). Thus, 350µl of phosphate buffer saline was added
before the sample analysed on the BD FACS Canto II flow cytometer (BD Bioscience, NJ, USA). The
percentage expression (quantitative) and MFI (qualitative) of both markers (CD62P and CD36) were
also measured. The PRI for each activation marker was calculated, using the baseline CD62P MFI and
CD36 MFI according to the following equation.
Platelet reactivity Index= (MFI post Agonist stimulation -MFI at Baseline
MFI post Agonist Simulation x 100).
4.2.8 Gating strategy
The platelet marker CD41 was used to gate on unbound, freely circulating platelets (PLT) with lower
side scatter properties. The red-blood cell bound platelets (RBC-PLT) were also gated using CD41
and higher side scatter properties. An unstained control was used to gate out autofluorescence. The
level of level of activated, freely circulating platelets was determined by the membrane surface
expression of activation marker CD62P (P-selectin) (Figure 4.1)
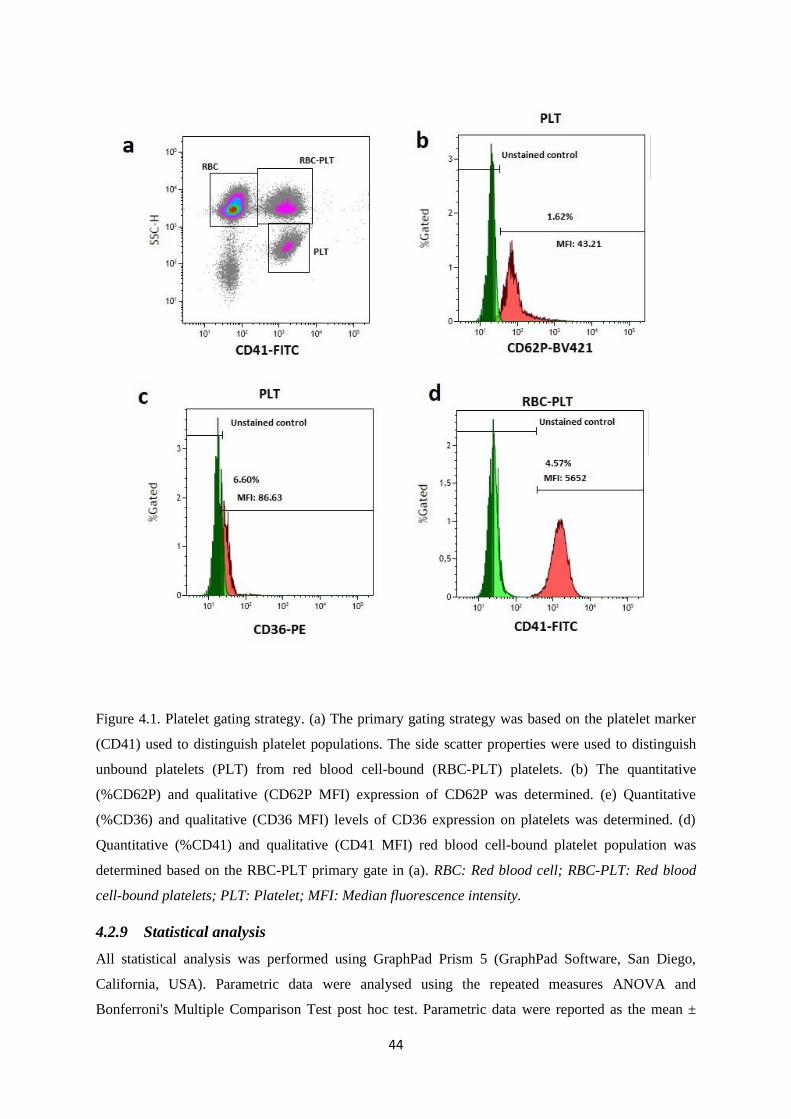
44
Figure 4.1. Platelet gating strategy. (a) The primary gating strategy was based on the platelet marker
(CD41) used to distinguish platelet populations. The side scatter properties were used to distinguish
unbound platelets (PLT) from red blood cell-bound (RBC-PLT) platelets. (b) The quantitative
(%CD62P) and qualitative (CD62P MFI) expression of CD62P was determined. (e) Quantitative
(%CD36) and qualitative (CD36 MFI) levels of CD36 expression on platelets was determined. (d)
Quantitative (%CD41) and qualitative (CD41 MFI) red blood cell-bound platelet population was
determined based on the RBC-PLT primary gate in (a). RBC: Red blood cell; RBC-PLT: Red blood
cell-bound platelets; PLT: Platelet; MFI: Median fluorescence intensity.
4.2.9 Statistical analysis
All statistical analysis was performed using GraphPad Prism 5 (GraphPad Software, San Diego,
California, USA). Parametric data were analysed using the repeated measures ANOVA and
Bonferroni's Multiple Comparison Test post hoc test. Parametric data were reported as the mean ±
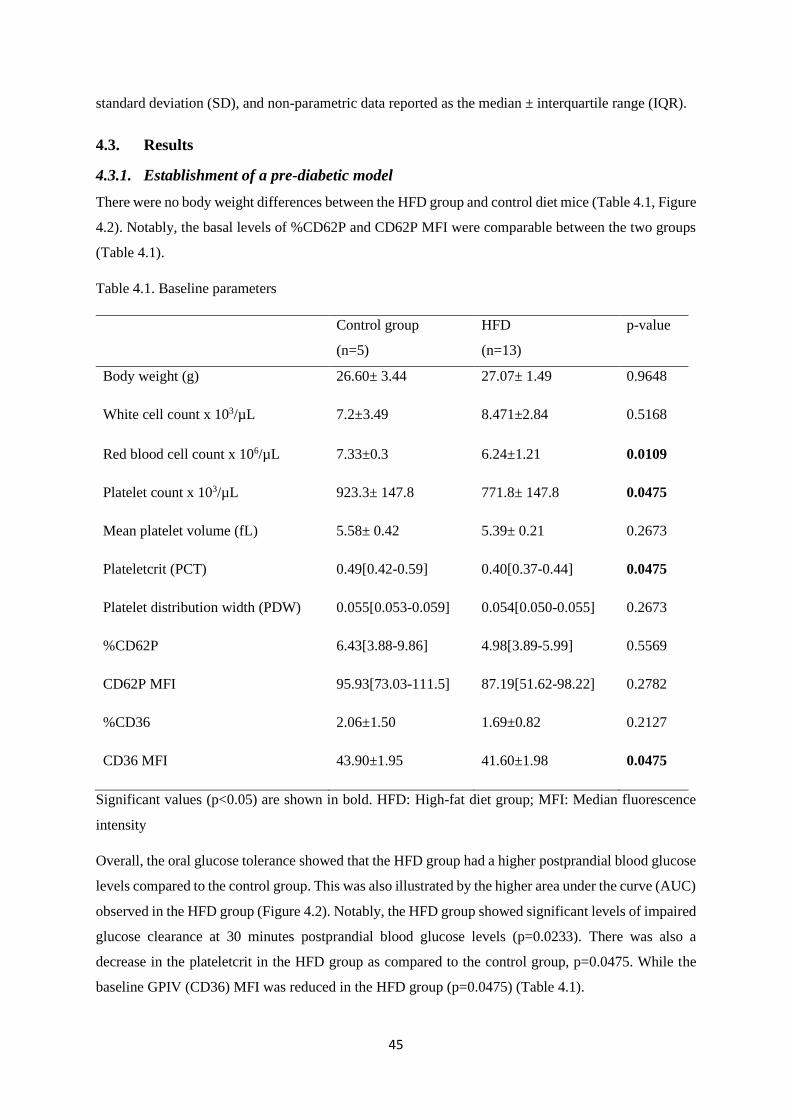
45
standard deviation (SD), and non-parametric data reported as the median ± interquartile range (IQR).
4.3. Results
4.3.1. Establishment of a pre-diabetic model
There were no body weight differences between the HFD group and control diet mice (Table 4.1, Figure
4.2). Notably, the basal levels of %CD62P and CD62P MFI were comparable between the two groups
(Table 4.1).
Table 4.1. Baseline parameters
Control group
(n=5)
HFD
(n=13)
p-value
Body weight (g) 26.60± 3.44 27.07± 1.49 0.9648
White cell count x 103/µL 7.2±3.49 8.471±2.84 0.5168
Red blood cell count x 106/µL 7.33±0.3 6.24±1.21 0.0109
Platelet count x 103/µL 923.3± 147.8 771.8± 147.8 0.0475
Mean platelet volume (fL) 5.58± 0.42 5.39± 0.21 0.2673
Plateletcrit (PCT) 0.49[0.42-0.59] 0.40[0.37-0.44] 0.0475
Platelet distribution width (PDW) 0.055[0.053-0.059] 0.054[0.050-0.055] 0.2673
%CD62P 6.43[3.88-9.86] 4.98[3.89-5.99] 0.5569
CD62P MFI 95.93[73.03-111.5] 87.19[51.62-98.22] 0.2782
%CD36 2.06±1.50 1.69±0.82 0.2127
CD36 MFI 43.90±1.95 41.60±1.98 0.0475
Significant values (p<0.05) are shown in bold. HFD: High-fat diet group; MFI: Median fluorescence
intensity
Overall, the oral glucose tolerance showed that the HFD group had a higher postprandial blood glucose
levels compared to the control group. This was also illustrated by the higher area under the curve (AUC)
observed in the HFD group (Figure 4.2). Notably, the HFD group showed significant levels of impaired
glucose clearance at 30 minutes postprandial blood glucose levels (p=0.0233). There was also a
decrease in the plateletcrit in the HFD group as compared to the control group, p=0.0475. While the
baseline GPIV (CD36) MFI was reduced in the HFD group (p=0.0475) (Table 4.1).
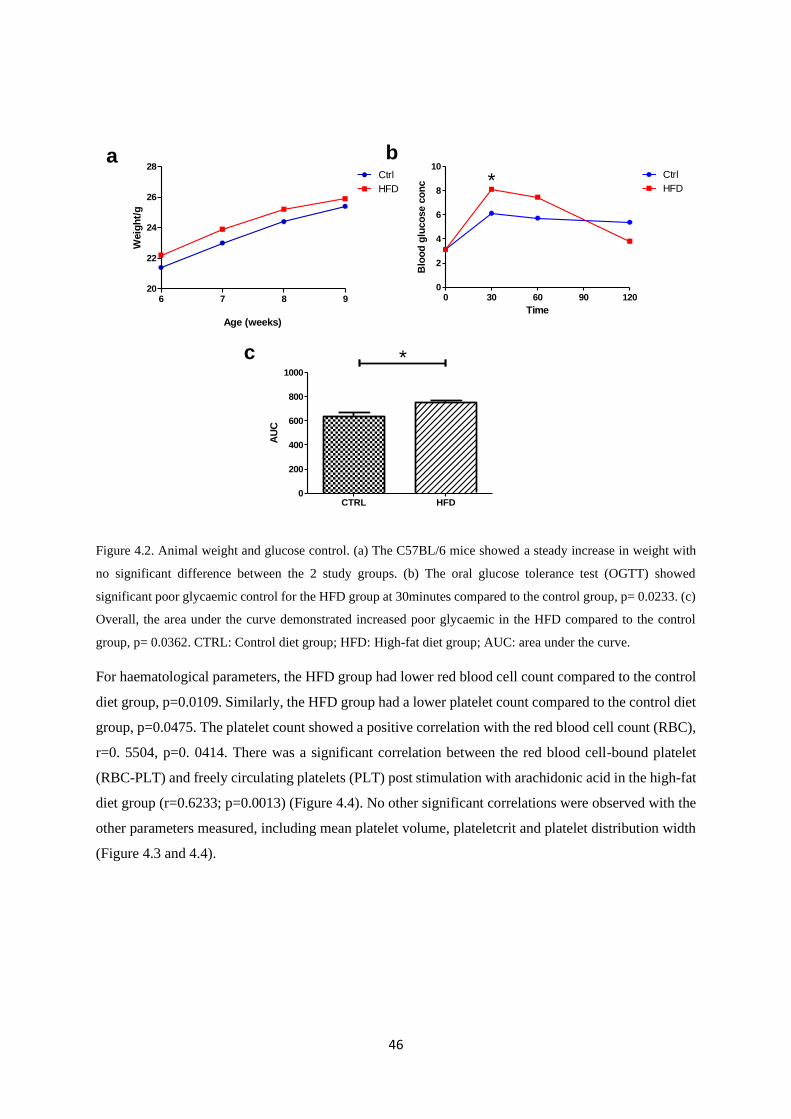
46
6 7 8 920
22
24
26
28Ctrl
HFD
Age (weeks)
Weig
ht/
g
0 30 60 90 1200
2
4
6
8
10Ctrl
HFD*
Time
Blo
od
glu
co
se c
on
c
CTRL HFD0
200
400
600
800
1000
*
AU
C
a b
c
Figure 4.2. Animal weight and glucose control. (a) The C57BL/6 mice showed a steady increase in weight with
no significant difference between the 2 study groups. (b) The oral glucose tolerance test (OGTT) showed
significant poor glycaemic control for the HFD group at 30minutes compared to the control group, p= 0.0233. (c)
Overall, the area under the curve demonstrated increased poor glycaemic in the HFD compared to the control
group, p= 0.0362. CTRL: Control diet group; HFD: High-fat diet group; AUC: area under the curve.
For haematological parameters, the HFD group had lower red blood cell count compared to the control
diet group, p=0.0109. Similarly, the HFD group had a lower platelet count compared to the control diet
group, p=0.0475. The platelet count showed a positive correlation with the red blood cell count (RBC),
r=0. 5504, p=0. 0414. There was a significant correlation between the red blood cell-bound platelet
(RBC-PLT) and freely circulating platelets (PLT) post stimulation with arachidonic acid in the high-fat
diet group (r=0.6233; p=0.0013) (Figure 4.4). No other significant correlations were observed with the
other parameters measured, including mean platelet volume, plateletcrit and platelet distribution width
(Figure 4.3 and 4.4).
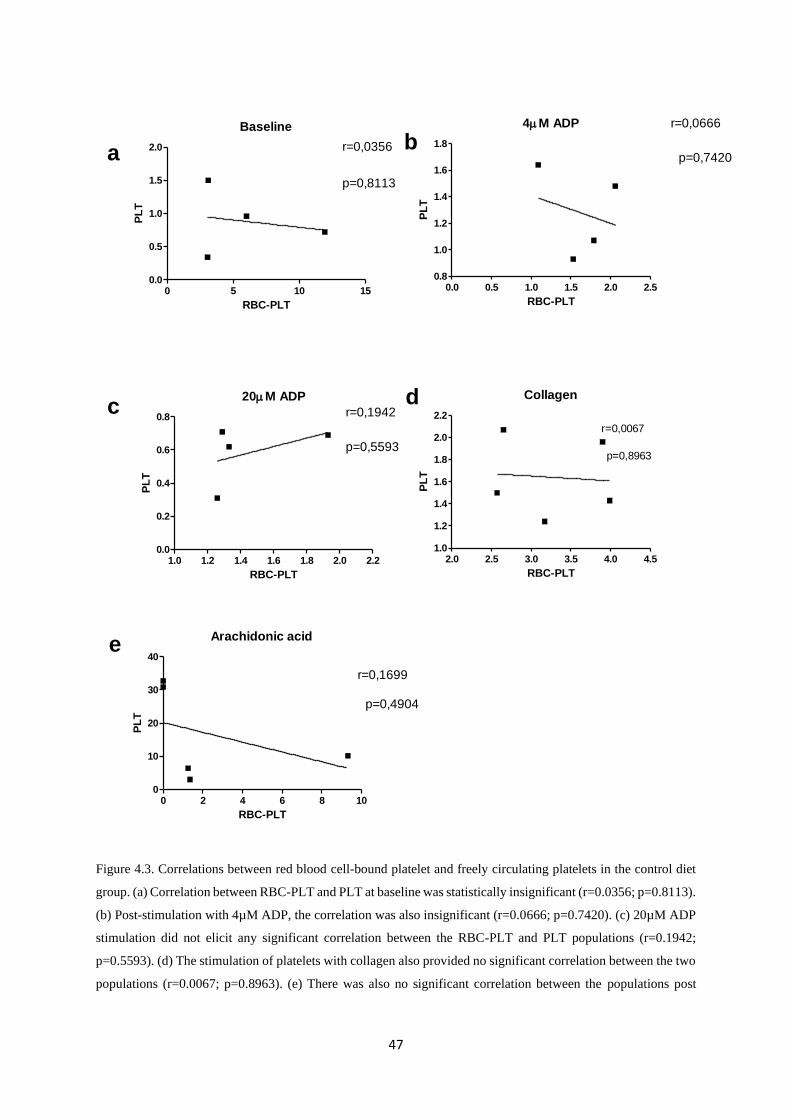
47
Baseline
0 5 10 150.0
0.5
1.0
1.5
2.0 r=0,0356
p=0,8113
RBC-PLT
PL
T
4M ADP
0.0 0.5 1.0 1.5 2.0 2.50.8
1.0
1.2
1.4
1.6
1.8
r=0,0666
p=0,7420
RBC-PLT
PL
T
20M ADP
1.0 1.2 1.4 1.6 1.8 2.0 2.20.0
0.2
0.4
0.6
0.8 r=0,1942
p=0,5593
RBC-PLT
PL
T
Collagen
2.0 2.5 3.0 3.5 4.0 4.51.0
1.2
1.4
1.6
1.8
2.0
2.2
r=0,0067
p=0,8963
RBC-PLT
PL
T
Arachidonic acid
0 2 4 6 8 100
10
20
30
40
r=0,1699
p=0,4904
RBC-PLT
PL
T
ab
c d
e
Figure 4.3. Correlations between red blood cell-bound platelet and freely circulating platelets in the control diet
group. (a) Correlation between RBC-PLT and PLT at baseline was statistically insignificant (r=0.0356; p=0.8113).
(b) Post-stimulation with 4µM ADP, the correlation was also insignificant (r=0.0666; p=0.7420). (c) 20µM ADP
stimulation did not elicit any significant correlation between the RBC-PLT and PLT populations (r=0.1942;
p=0.5593). (d) The stimulation of platelets with collagen also provided no significant correlation between the two
populations (r=0.0067; p=0.8963). (e) There was also no significant correlation between the populations post
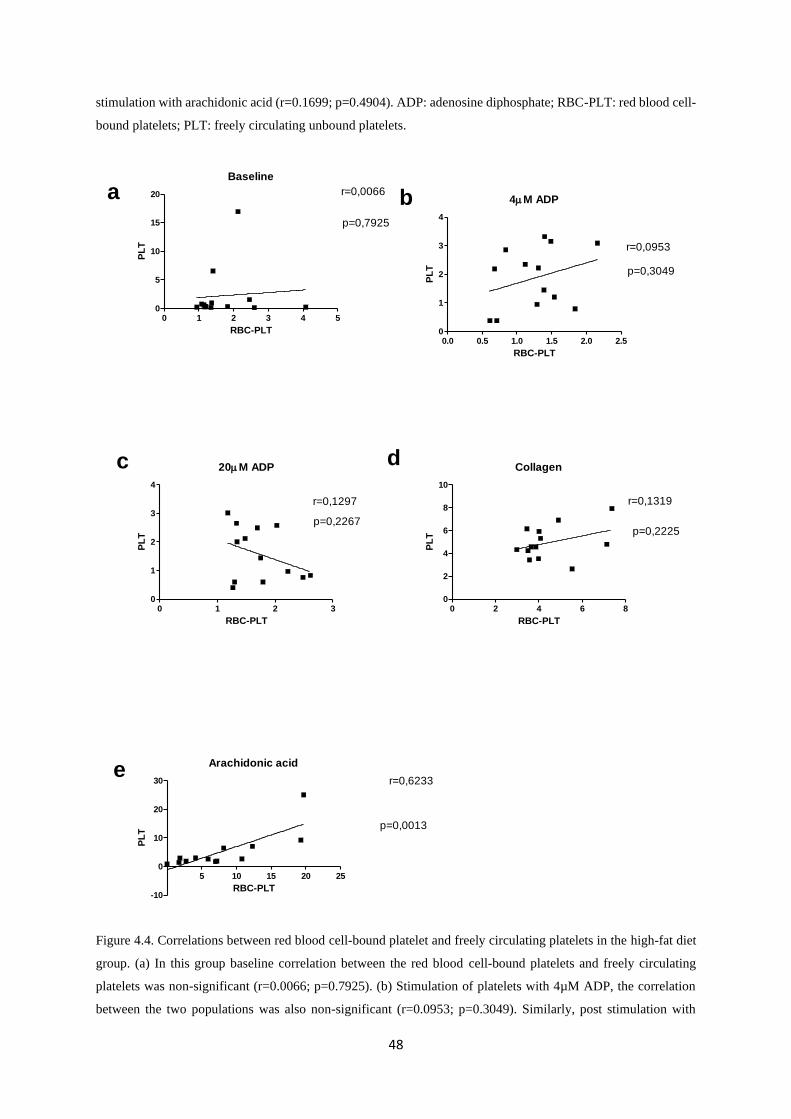
48
stimulation with arachidonic acid (r=0.1699; p=0.4904). ADP: adenosine diphosphate; RBC-PLT: red blood cell-
bound platelets; PLT: freely circulating unbound platelets.
Baseline
0 1 2 3 4 50
5
10
15
20 r=0,0066
p=0,7925
RBC-PLT
PL
T
4M ADP
0.0 0.5 1.0 1.5 2.0 2.50
1
2
3
4
r=0,0953
p=0,3049
RBC-PLT
PL
T
20M ADP
0 1 2 30
1
2
3
4
r=0,1297
p=0,2267
RBC-PLT
PL
T
Collagen
0 2 4 6 80
2
4
6
8
10
r=0,1319
p=0,2225
RBC-PLT
PL
T
Arachidonic acid
5 10 15 20 25
-10
0
10
20
30 r=0,6233
p=0,0013
RBC-PLT
PL
T
a b
c d
e
Figure 4.4. Correlations between red blood cell-bound platelet and freely circulating platelets in the high-fat diet
group. (a) In this group baseline correlation between the red blood cell-bound platelets and freely circulating
platelets was non-significant (r=0.0066; p=0.7925). (b) Stimulation of platelets with 4µM ADP, the correlation
between the two populations was also non-significant (r=0.0953; p=0.3049). Similarly, post stimulation with
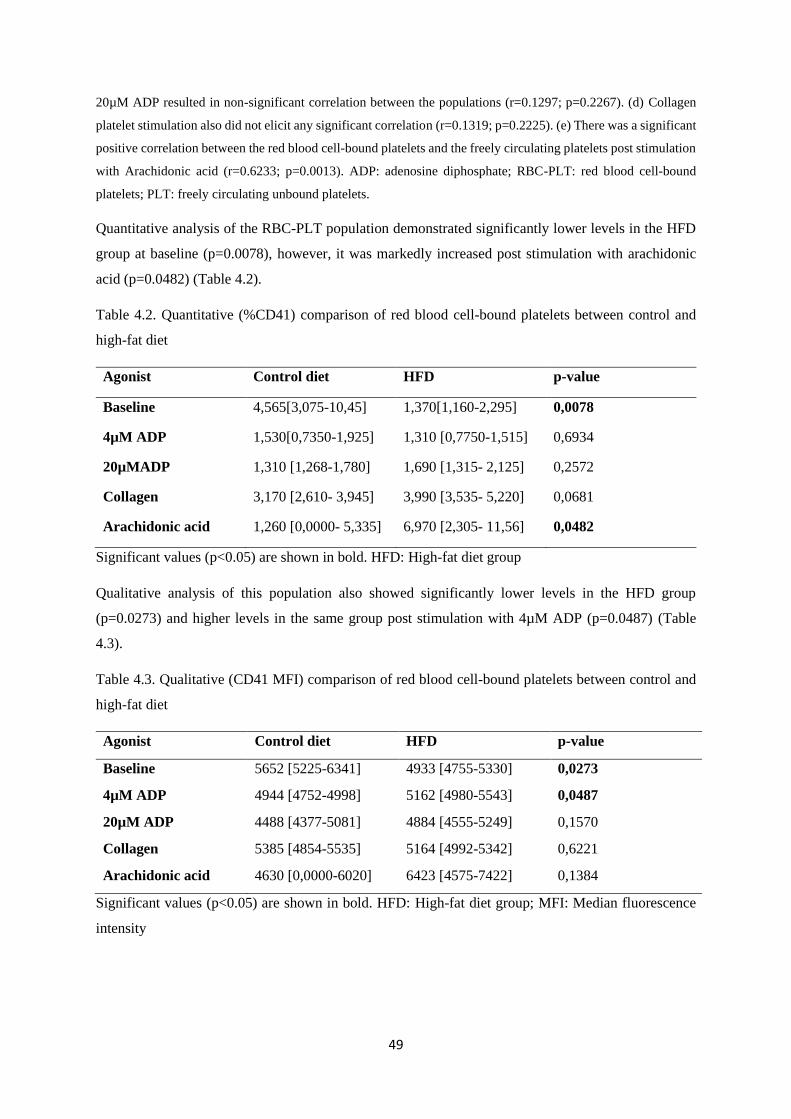
49
20µM ADP resulted in non-significant correlation between the populations (r=0.1297; p=0.2267). (d) Collagen
platelet stimulation also did not elicit any significant correlation (r=0.1319; p=0.2225). (e) There was a significant
positive correlation between the red blood cell-bound platelets and the freely circulating platelets post stimulation
with Arachidonic acid (r=0.6233; p=0.0013). ADP: adenosine diphosphate; RBC-PLT: red blood cell-bound
platelets; PLT: freely circulating unbound platelets.
Quantitative analysis of the RBC-PLT population demonstrated significantly lower levels in the HFD
group at baseline (p=0.0078), however, it was markedly increased post stimulation with arachidonic
acid (p=0.0482) (Table 4.2).
Table 4.2. Quantitative (%CD41) comparison of red blood cell-bound platelets between control and
high-fat diet
Agonist Control diet HFD p-value
Baseline 4,565[3,075-10,45] 1,370[1,160-2,295] 0,0078
4µM ADP 1,530[0,7350-1,925] 1,310 [0,7750-1,515] 0,6934
20µMADP 1,310 [1,268-1,780] 1,690 [1,315- 2,125] 0,2572
Collagen 3,170 [2,610- 3,945] 3,990 [3,535- 5,220] 0,0681
Arachidonic acid 1,260 [0,0000- 5,335] 6,970 [2,305- 11,56] 0,0482
Significant values (p<0.05) are shown in bold. HFD: High-fat diet group
Qualitative analysis of this population also showed significantly lower levels in the HFD group
(p=0.0273) and higher levels in the same group post stimulation with 4µM ADP (p=0.0487) (Table
4.3).
Table 4.3. Qualitative (CD41 MFI) comparison of red blood cell-bound platelets between control and
high-fat diet
Agonist Control diet HFD p-value
Baseline 5652 [5225-6341] 4933 [4755-5330] 0,0273
4µM ADP 4944 [4752-4998] 5162 [4980-5543] 0,0487
20µM ADP 4488 [4377-5081] 4884 [4555-5249] 0,1570
Collagen 5385 [4854-5535] 5164 [4992-5342] 0,6221
Arachidonic acid 4630 [0,0000-6020] 6423 [4575-7422] 0,1384
Significant values (p<0.05) are shown in bold. HFD: High-fat diet group; MFI: Median fluorescence
intensity
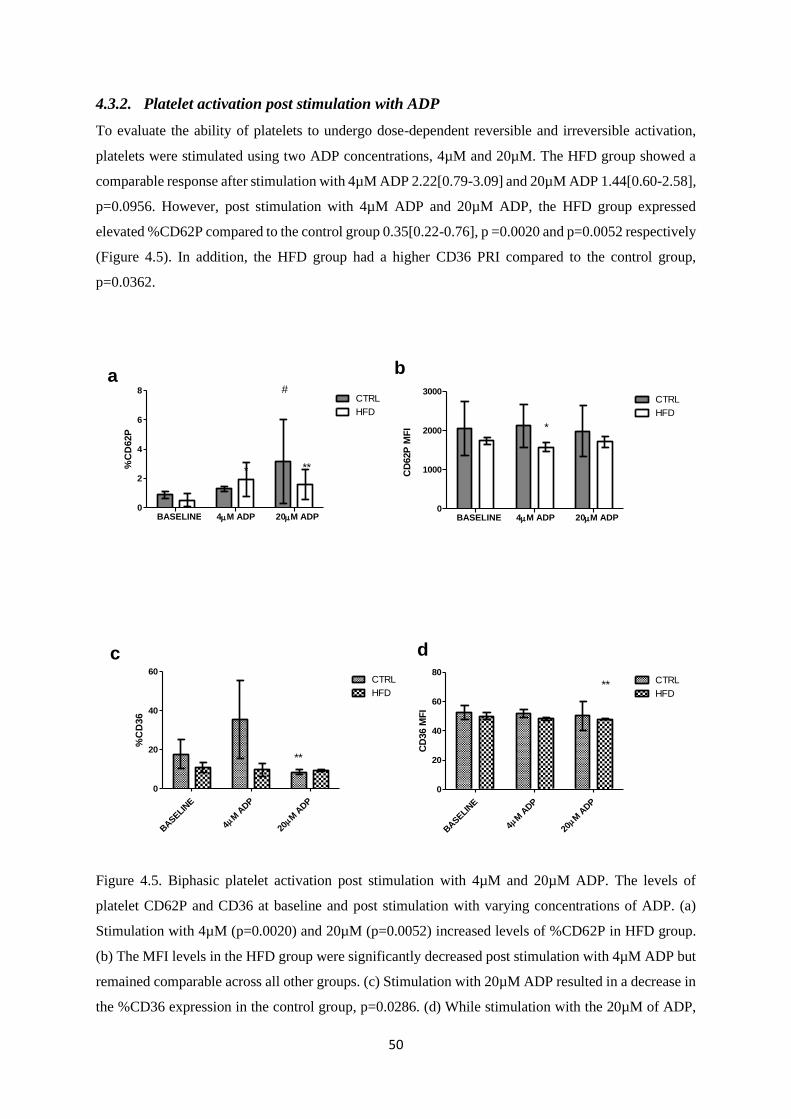
50
4.3.2. Platelet activation post stimulation with ADP
To evaluate the ability of platelets to undergo dose-dependent reversible and irreversible activation,
platelets were stimulated using two ADP concentrations, 4µM and 20µM. The HFD group showed a
comparable response after stimulation with 4µM ADP 2.22[0.79-3.09] and 20µM ADP 1.44[0.60-2.58],
p=0.0956. However, post stimulation with 4µM ADP and 20µM ADP, the HFD group expressed
elevated %CD62P compared to the control group 0.35[0.22-0.76], p =0.0020 and p=0.0052 respectively
(Figure 4.5). In addition, the HFD group had a higher CD36 PRI compared to the control group,
p=0.0362.
BASELIN
E
M A
DP
4M
ADP
20
0
20
40
60CTRL
HFD
**
%C
D36
BASELIN
E
M A
DP
4M
ADP
20
0
20
40
60
80CTRL
HFD**
CD
36 M
FI
a b
c d
BASELINE 4M ADP 20M ADP0
2
4
6
8CTRL
HFD
#
* **%C
D62P
BASELINE 4M ADP 20M ADP0
1000
2000
3000CTRL
HFDC
D62P
MF
I *
Figure 4.5. Biphasic platelet activation post stimulation with 4µM and 20µM ADP. The levels of
platelet CD62P and CD36 at baseline and post stimulation with varying concentrations of ADP. (a)
Stimulation with 4µM (p=0.0020) and 20µM (p=0.0052) increased levels of %CD62P in HFD group.
(b) The MFI levels in the HFD group were significantly decreased post stimulation with 4µM ADP but
remained comparable across all other groups. (c) Stimulation with 20µM ADP resulted in a decrease in
the %CD36 expression in the control group, p=0.0286. (d) While stimulation with the 20µM of ADP,
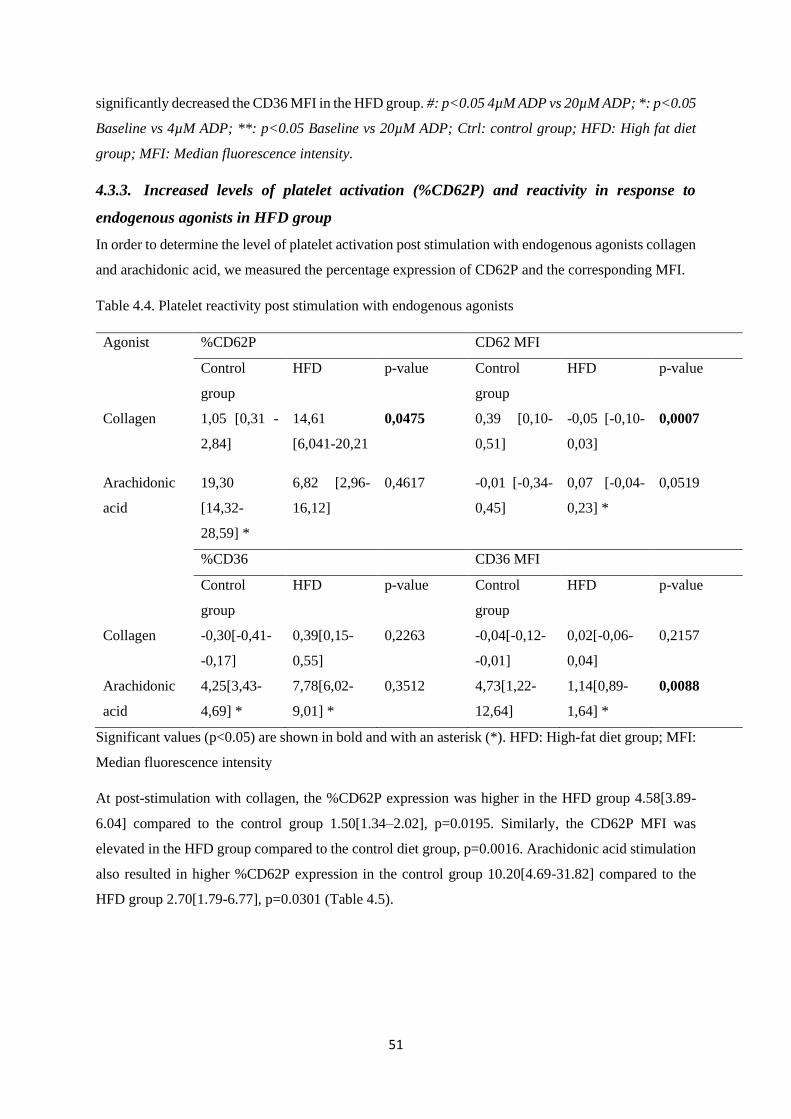
51
significantly decreased the CD36 MFI in the HFD group. #: p<0.05 4µM ADP vs 20µM ADP; *: p<0.05
Baseline vs 4µM ADP; **: p<0.05 Baseline vs 20µM ADP; Ctrl: control group; HFD: High fat diet
group; MFI: Median fluorescence intensity.
4.3.3. Increased levels of platelet activation (%CD62P) and reactivity in response to
endogenous agonists in HFD group
In order to determine the level of platelet activation post stimulation with endogenous agonists collagen
and arachidonic acid, we measured the percentage expression of CD62P and the corresponding MFI.
Table 4.4. Platelet reactivity post stimulation with endogenous agonists
Agonist %CD62P CD62 MFI
Control
group
HFD p-value Control
group
HFD p-value
Collagen 1,05 [0,31 -
2,84]
14,61
[6,041-20,21
0,0475 0,39 [0,10-
0,51]
-0,05 [-0,10-
0,03]
0,0007
Arachidonic
acid
19,30
[14,32-
28,59] *
6,82 [2,96-
16,12]
0,4617 -0,01 [-0,34-
0,45]
0,07 [-0,04-
0,23] *
0,0519
%CD36 CD36 MFI
Control
group
HFD p-value Control
group
HFD p-value
Collagen -0,30[-0,41-
-0,17]
0,39[0,15-
0,55]
0,2263 -0,04[-0,12-
-0,01]
0,02[-0,06-
0,04]
0,2157
Arachidonic
acid
4,25[3,43-
4,69] *
7,78[6,02-
9,01] *
0,3512 4,73[1,22-
12,64]
1,14[0,89-
1,64] *
0,0088
Significant values (p<0.05) are shown in bold and with an asterisk (*). HFD: High-fat diet group; MFI:
Median fluorescence intensity
At post-stimulation with collagen, the %CD62P expression was higher in the HFD group 4.58[3.89-
6.04] compared to the control group 1.50[1.34–2.02], p=0.0195. Similarly, the CD62P MFI was
elevated in the HFD group compared to the control diet group, p=0.0016. Arachidonic acid stimulation
also resulted in higher %CD62P expression in the control group 10.20[4.69-31.82] compared to the
HFD group 2.70[1.79-6.77], p=0.0301 (Table 4.5).
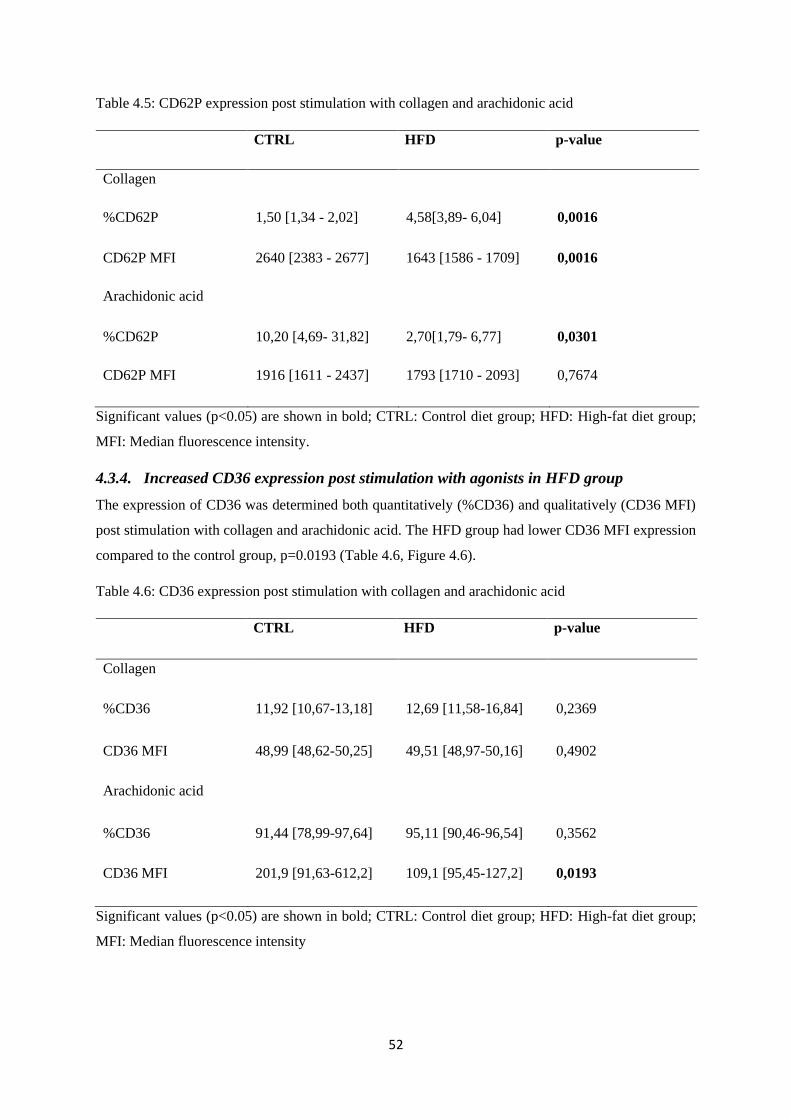
52
Table 4.5: CD62P expression post stimulation with collagen and arachidonic acid
CTRL HFD p-value
Collagen
%CD62P 1,50 [1,34 - 2,02] 4,58[3,89- 6,04] 0,0016
CD62P MFI 2640 [2383 - 2677] 1643 [1586 - 1709] 0,0016
Arachidonic acid
%CD62P 10,20 [4,69- 31,82] 2,70[1,79- 6,77] 0,0301
CD62P MFI 1916 [1611 - 2437] 1793 [1710 - 2093] 0,7674
Significant values (p<0.05) are shown in bold; CTRL: Control diet group; HFD: High-fat diet group;
MFI: Median fluorescence intensity.
4.3.4. Increased CD36 expression post stimulation with agonists in HFD group
The expression of CD36 was determined both quantitatively (%CD36) and qualitatively (CD36 MFI)
post stimulation with collagen and arachidonic acid. The HFD group had lower CD36 MFI expression
compared to the control group, p=0.0193 (Table 4.6, Figure 4.6).
Table 4.6: CD36 expression post stimulation with collagen and arachidonic acid
CTRL HFD p-value
Collagen
%CD36 11,92 [10,67-13,18] 12,69 [11,58-16,84] 0,2369
CD36 MFI 48,99 [48,62-50,25] 49,51 [48,97-50,16] 0,4902
Arachidonic acid
%CD36 91,44 [78,99-97,64] 95,11 [90,46-96,54] 0,3562
CD36 MFI 201,9 [91,63-612,2] 109,1 [95,45-127,2] 0,0193
Significant values (p<0.05) are shown in bold; CTRL: Control diet group; HFD: High-fat diet group;
MFI: Median fluorescence intensity
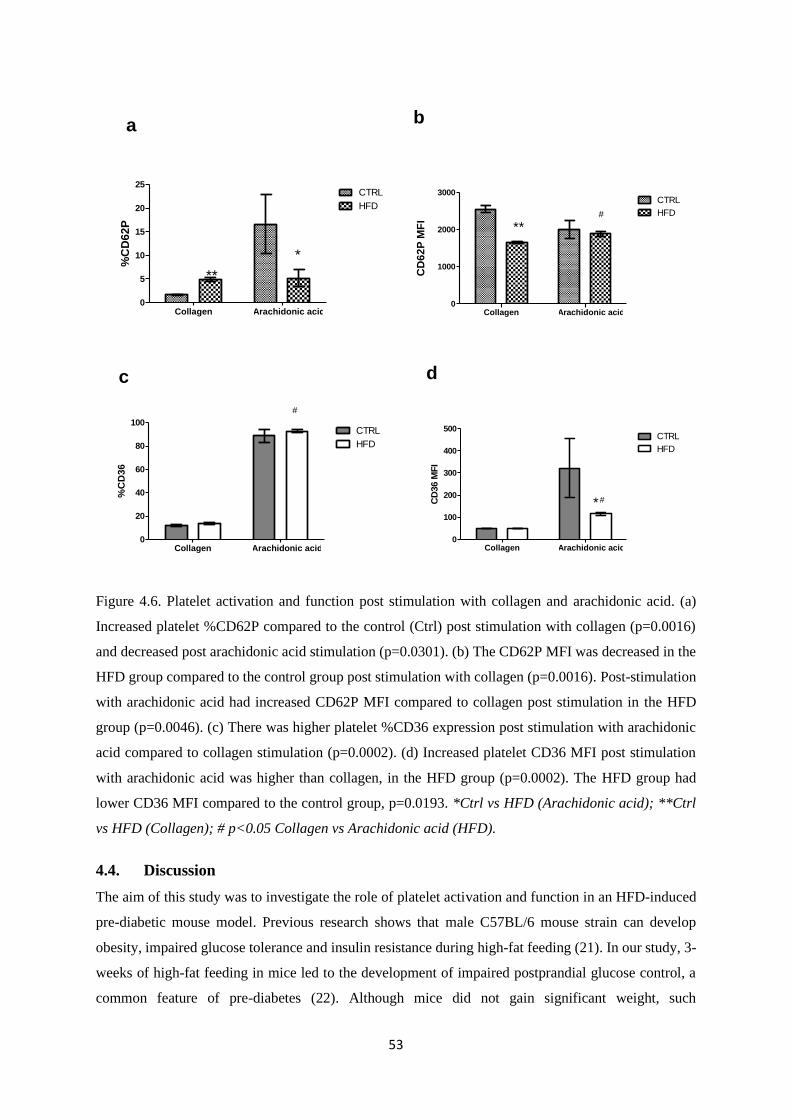
53
Collagen Arachidonic acid0
5
10
15
20
25CTRL
HFD
*
**
%C
D6
2P
Collagen Arachidonic acid0
1000
2000
3000CTRL
HFD#
**
CD
62
P M
FI
Collagen Arachidonic acid0
20
40
60
80
100CTRL
HFD
#
%C
D3
6a b
c d
Collagen Arachidonic acid0
100
200
300
400
500CTRL
HFD
#*CD
36 M
FI
Figure 4.6. Platelet activation and function post stimulation with collagen and arachidonic acid. (a)
Increased platelet %CD62P compared to the control (Ctrl) post stimulation with collagen (p=0.0016)
and decreased post arachidonic acid stimulation (p=0.0301). (b) The CD62P MFI was decreased in the
HFD group compared to the control group post stimulation with collagen (p=0.0016). Post-stimulation
with arachidonic acid had increased CD62P MFI compared to collagen post stimulation in the HFD
group (p=0.0046). (c) There was higher platelet %CD36 expression post stimulation with arachidonic
acid compared to collagen stimulation (p=0.0002). (d) Increased platelet CD36 MFI post stimulation
with arachidonic acid was higher than collagen, in the HFD group (p=0.0002). The HFD group had
lower CD36 MFI compared to the control group, p=0.0193. *Ctrl vs HFD (Arachidonic acid); **Ctrl
vs HFD (Collagen); # p<0.05 Collagen vs Arachidonic acid (HFD).
4.4. Discussion
The aim of this study was to investigate the role of platelet activation and function in an HFD-induced
pre-diabetic mouse model. Previous research shows that male C57BL/6 mouse strain can develop
obesity, impaired glucose tolerance and insulin resistance during high-fat feeding (21). In our study, 3-
weeks of high-fat feeding in mice led to the development of impaired postprandial glucose control, a
common feature of pre-diabetes (22). Although mice did not gain significant weight, such
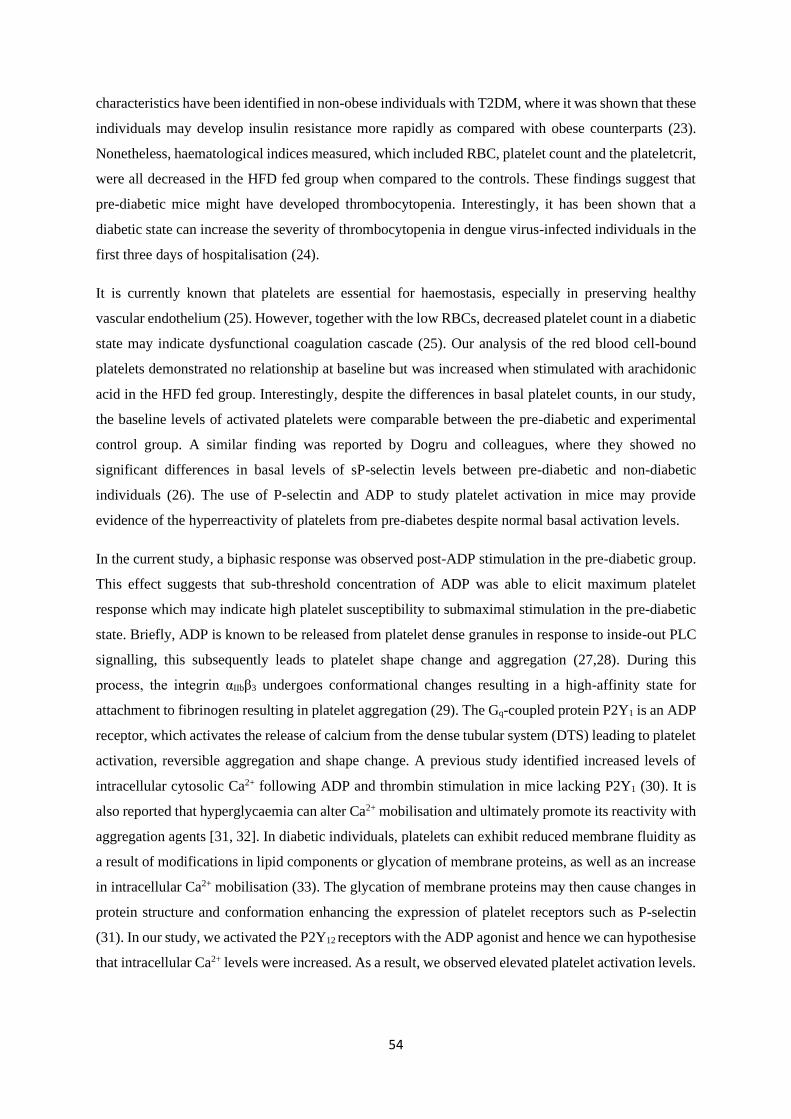
54
characteristics have been identified in non-obese individuals with T2DM, where it was shown that these
individuals may develop insulin resistance more rapidly as compared with obese counterparts (23).
Nonetheless, haematological indices measured, which included RBC, platelet count and the plateletcrit,
were all decreased in the HFD fed group when compared to the controls. These findings suggest that
pre-diabetic mice might have developed thrombocytopenia. Interestingly, it has been shown that a
diabetic state can increase the severity of thrombocytopenia in dengue virus-infected individuals in the
first three days of hospitalisation (24).
It is currently known that platelets are essential for haemostasis, especially in preserving healthy
vascular endothelium (25). However, together with the low RBCs, decreased platelet count in a diabetic
state may indicate dysfunctional coagulation cascade (25). Our analysis of the red blood cell-bound
platelets demonstrated no relationship at baseline but was increased when stimulated with arachidonic
acid in the HFD fed group. Interestingly, despite the differences in basal platelet counts, in our study,
the baseline levels of activated platelets were comparable between the pre-diabetic and experimental
control group. A similar finding was reported by Dogru and colleagues, where they showed no
significant differences in basal levels of sP-selectin levels between pre-diabetic and non-diabetic
individuals (26). The use of P-selectin and ADP to study platelet activation in mice may provide
evidence of the hyperreactivity of platelets from pre-diabetes despite normal basal activation levels.
In the current study, a biphasic response was observed post-ADP stimulation in the pre-diabetic group.
This effect suggests that sub-threshold concentration of ADP was able to elicit maximum platelet
response which may indicate high platelet susceptibility to submaximal stimulation in the pre-diabetic
state. Briefly, ADP is known to be released from platelet dense granules in response to inside-out PLC
signalling, this subsequently leads to platelet shape change and aggregation (27,28). During this
process, the integrin αIIbβ3 undergoes conformational changes resulting in a high-affinity state for
attachment to fibrinogen resulting in platelet aggregation (29). The Gq-coupled protein P2Y1 is an ADP
receptor, which activates the release of calcium from the dense tubular system (DTS) leading to platelet
activation, reversible aggregation and shape change. A previous study identified increased levels of
intracellular cytosolic Ca2+ following ADP and thrombin stimulation in mice lacking P2Y1 (30). It is
also reported that hyperglycaemia can alter Ca2+ mobilisation and ultimately promote its reactivity with
aggregation agents [31, 32]. In diabetic individuals, platelets can exhibit reduced membrane fluidity as
a result of modifications in lipid components or glycation of membrane proteins, as well as an increase
in intracellular Ca2+ mobilisation (33). The glycation of membrane proteins may then cause changes in
protein structure and conformation enhancing the expression of platelet receptors such as P-selectin
(31). In our study, we activated the P2Y12 receptors with the ADP agonist and hence we can hypothesise
that intracellular Ca2+ levels were increased. As a result, we observed elevated platelet activation levels.
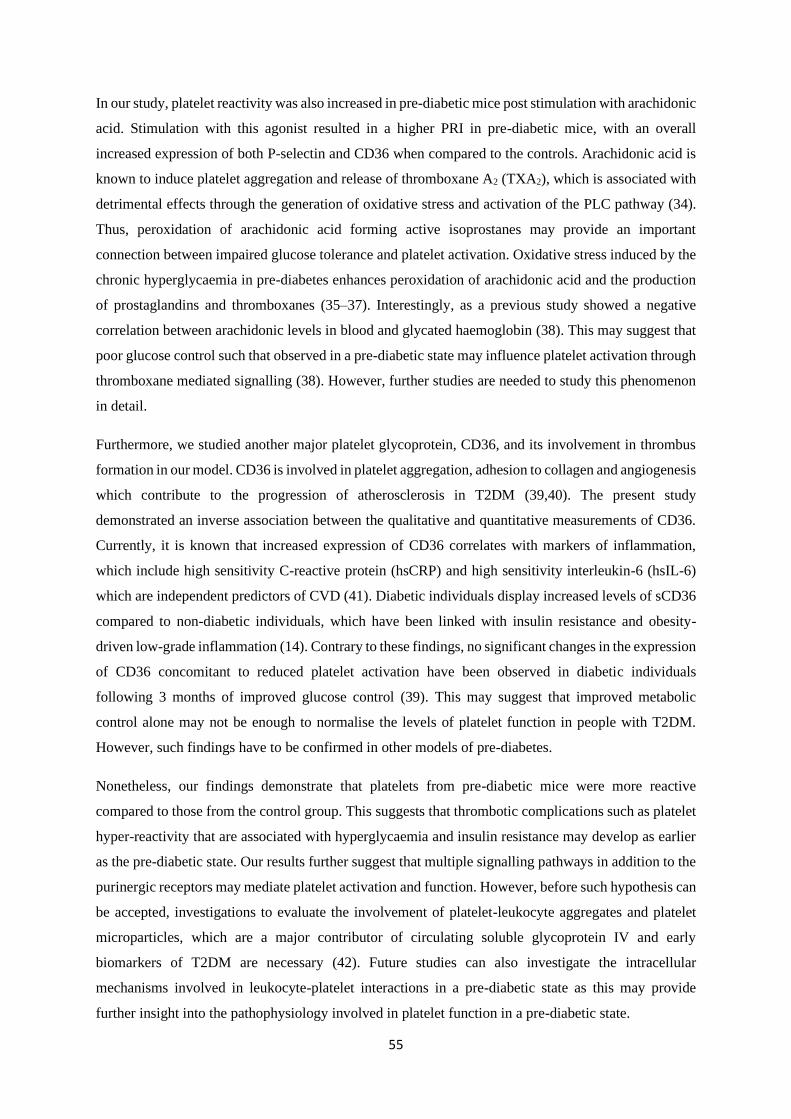
55
In our study, platelet reactivity was also increased in pre-diabetic mice post stimulation with arachidonic
acid. Stimulation with this agonist resulted in a higher PRI in pre-diabetic mice, with an overall
increased expression of both P-selectin and CD36 when compared to the controls. Arachidonic acid is
known to induce platelet aggregation and release of thromboxane A2 (TXA2), which is associated with
detrimental effects through the generation of oxidative stress and activation of the PLC pathway (34).
Thus, peroxidation of arachidonic acid forming active isoprostanes may provide an important
connection between impaired glucose tolerance and platelet activation. Oxidative stress induced by the
chronic hyperglycaemia in pre-diabetes enhances peroxidation of arachidonic acid and the production
of prostaglandins and thromboxanes (35–37). Interestingly, as a previous study showed a negative
correlation between arachidonic levels in blood and glycated haemoglobin (38). This may suggest that
poor glucose control such that observed in a pre-diabetic state may influence platelet activation through
thromboxane mediated signalling (38). However, further studies are needed to study this phenomenon
in detail.
Furthermore, we studied another major platelet glycoprotein, CD36, and its involvement in thrombus
formation in our model. CD36 is involved in platelet aggregation, adhesion to collagen and angiogenesis
which contribute to the progression of atherosclerosis in T2DM (39,40). The present study
demonstrated an inverse association between the qualitative and quantitative measurements of CD36.
Currently, it is known that increased expression of CD36 correlates with markers of inflammation,
which include high sensitivity C-reactive protein (hsCRP) and high sensitivity interleukin-6 (hsIL-6)
which are independent predictors of CVD (41). Diabetic individuals display increased levels of sCD36
compared to non-diabetic individuals, which have been linked with insulin resistance and obesity-
driven low-grade inflammation (14). Contrary to these findings, no significant changes in the expression
of CD36 concomitant to reduced platelet activation have been observed in diabetic individuals
following 3 months of improved glucose control (39). This may suggest that improved metabolic
control alone may not be enough to normalise the levels of platelet function in people with T2DM.
However, such findings have to be confirmed in other models of pre-diabetes.
Nonetheless, our findings demonstrate that platelets from pre-diabetic mice were more reactive
compared to those from the control group. This suggests that thrombotic complications such as platelet
hyper-reactivity that are associated with hyperglycaemia and insulin resistance may develop as earlier
as the pre-diabetic state. Our results further suggest that multiple signalling pathways in addition to the
purinergic receptors may mediate platelet activation and function. However, before such hypothesis can
be accepted, investigations to evaluate the involvement of platelet-leukocyte aggregates and platelet
microparticles, which are a major contributor of circulating soluble glycoprotein IV and early
biomarkers of T2DM are necessary (42). Future studies can also investigate the intracellular
mechanisms involved in leukocyte-platelet interactions in a pre-diabetic state as this may provide
further insight into the pathophysiology involved in platelet function in a pre-diabetic state.
56
4.5. Conclusion
Platelet hyperreactivity is a common feature of pre-diabetes and T2DM (43), which consequently
increases the risk of developing CVD (7). Platelet activation involves a convergence of several
activation pathways. Our study showed that in a pre-diabetic state, platelets are hyper-reactive to
arachidonic acid compared to ADP and collagen. This may suggest that the COX-1 regulated signalling
pathway is highly activated in pre-diabetics and early anti-platelet treatment interventions targeting this
pathway in pre-diabetic individuals may lower the risk of thrombotic complications in overt diabetes.
4.7. Declarations
4.7.1. Ethics approval and consent to participate
All institutional and national guidelines for the care and use of laboratory animals were followed and
approved. Ethical clearance was granted by the UKZN animal research ethics committee (AREC),
ethics registration number AREC/086/016.
4.7.2. Consent of publication
Not applicable
4.7.3. Availability of data and material
The datasets generated during and/or analysed during the current study are available from the
corresponding author on request.
4.7.4. Competing interests
The authors declare no competing financial interests
4.7.5. Funding
This study was funded by the South African National Research Foundation (NRF) Thuthuka grant
(TTK150610119176). The NRF did not directly participate in the analysis or interpretation of the
findings presented in this manuscript. BB Nkambule is partially supported as a Post-Doctoral fellow,
by the Fogarty International Centre (FIC), NIH Common Fund, Office of Strategic Coordination, Office
of the Director (OD/OSC/CF/NIH), Office of AIDS Research, Office of the Director (OAR/NIH),
National Institute of Mental Health (NIMH/NIH) of the National Institutes of Health under Award
Number D43TW010131.
4.7.6. Author contributions
ZM: contributed in the conceptualisation and drafting of the article, analysis and interpretation of data
and final approval of the version to be published.
TM: revision and final approval of the article.
PVD: revision and final approval of the article.
57
BBN: contributed to the conceptualisation analysis and interpretation of data and final approval of the
version to be published.
4.7.7. Acknowledgements
We would like to acknowledge the Biomedical research unit and the Department of Human Physiology,
College of Health Sciences (CHS) the University of KwaZulu-Natal for providing access to the flow
cytometry analysis facility and Biomedical research unit for the animal housing facilities.
4.8. References
1. Reaven GM. Role of insulin resistance in human disease. Diabetes. 1988;37(12):1595–607.
2. Duckworth W, Abraira C, Moritz T, Reda D, Emanuele N, Reaven PD, et al. Glucose control
and vascular complications in veterans with type 2 diabetes. NEnglJMed. 2009;360(1533–4406
(Electronic)):129–39.
3. World Health Organization. Definition and diagnosis of diabetes mellitus and intermediate
hyperglycemia:Report of a WHO/IDF consultation. Production. 2006;1–52.
4. Bansal N. Prediabetes diagnosis and treatment: A review. World J Diabetes [Internet].
2015;6(2):296. Available from: http://www.wjgnet.com/1948-9358/full/v6/i2/296.htm
5. Ferreiro JL, Gómez-Hospital JA, Angiolillo DJ. Platelet abnormalities in diabetes mellitus. Diab
Vasc Dis Res. 2010;7(4):251–9.
6. Davison GM, Nkambule BB, Mkandla Z, Hon GM, Kengne AP, Erasmus RT, et al. Platelet,
monocyte and neutrophil activation and glucose tolerance in South African Mixed Ancestry
individuals. Sci Rep [Internet]. 2017 Jan 16;7:40329. Available from:
http://www.nature.com/articles/srep40329
7. El Haouari M, Rosado JA. Platelet signalling abnormalities in patients with type 2 diabetes
mellitus: a review. Blood Cells Mol Dis [Internet]. 2008;41(1):119–23. Available from:
http://www.ncbi.nlm.nih.gov/pubmed/18387322
8. Stokes KY, Granger DN. Platelets: a critical link between inflammation and microvascular
dysfunction. J Physiol. 2012;590(Pt 5):1023–34.
9. Haugaard AK, Lund TT, Birch C, Rönsholt F, Trøseid M, Ullum H, et al. Discrepant coagulation
profile in HIV infection: elevated D-dimer but impaired platelet aggregation and clot initiation.
AIDS. 2013;
10. Angiolillo DJ, Bernardo E, Sabat?? M, Jimenez-Quevedo P, Costa MA, Palazuelos J, et al.
Impact of Platelet Reactivity on Cardiovascular Outcomes in Patients With Type 2 Diabetes
58
Mellitus and Coronary Artery Disease. J Am Coll Cardiol. 2007;50(16):1541–7.
11. Podrez EA, Byzova T V, Febbraio M, Salomon RG, Ma Y, Valiyaveettil M, et al. Platelet CD36
links hyperlipidemia , oxidant stress and a prothrombotic phenotype. 2007;13(9).
12. Febbraio M, Hajjar DP, Silverstein RL. CD36: a class B scavenger receptor involved in
angiogenesis, atherosclerosis,inflammation, and lipid metabolism. J Clin Invest.
2001;108(6):785–91.
13. Berger G, Caen JP, Berndt MC, Cramer EM. Ultrastructural demonstration of CD36 in the alpha-
granule membrane of human platelets and megakaryocytes. Blood. 1993;82(10):3034–44.
14. Handberg A, Lopez-Bermejo A, Bassols J, Vendrell J, Ricart W, Fernandez-Real JM.
Circulating soluble CD36 is associated with glucose metabolism and interleukin-6 in glucose-
intolerant men. Diabetes Vasc Dis Res [Internet]. 2009;6(1):15–20. Available from:
http://journals.sagepub.com/doi/10.3132/dvdr.2009.003
15. Gachet C. P2Y12 receptors in platelets and other hematopoietic and non-hematopoietic cells.
Vol. 8, Purinergic Signalling. 2012. p. 609–19.
16. Burnstock G, Novak I. Purinergic signalling and diabetes. Vol. 9, Purinergic Signalling. 2013.
p. 307–24.
17. Chu SG, Becker RC, Berger PB, Bhatt DL, Eikelboom JW, Konkle B, et al. Mean platelet
volume as a predictor of cardiovascular risk: A systematic review and meta-analysis. J Thromb
Haemost. 2010;8(1):148–56.
18. Andrikopoulos S, Blair AR, Deluca N, Fam BC, Proietto J. Evaluating the glucose tolerance test
in mice. Am J Physiol Endocrinol Metab 2008;1323–32.
19. Nkambule BB, Davison G, Ipp H. The value of flow cytometry in the measurement of platelet
activation and aggregation in human immunodeficiency virus infection. Platelets.
2015;26(3):250–7.
20. Helms CC, Marvel M, Zhao W, Stahle M, Vest R, Kato GJ, et al. Mechanisms of hemolysis-
associated platelet activation. J Thromb Haemost. 2013;11(12):2148–54.
21. Henry M, Davidson L, Cohen Z, McDonagh PF, Nolan PE, Ritter LS. Whole blood aggregation,
coagulation, and markers of platelet activation in diet-induced diabetic C57BL/6J mice. Diabetes
Res Clin Pract. 2009;84(1):11–8.
22. Ford ES, Zhao G, Li C. Pre-Diabetes and the Risk for Cardiovascular Disease. A Systematic
Review of the Evidence. J Am Coll Cardiol [Internet]. 2010;55(13):1310–7. Available from:
http://dx.doi.org/10.1016/j.jacc.2009.10.060
59
23. Vaag A, Lund SS. Non-obese patients with type 2 diabetes and prediabetic subjects: distinct
phenotypes requiring special diabetes treatment and (or) prevention? Appl Physiol Nutr Metab
[Internet]. 2007;32(5):912–20. Available from:
http://www.nrcresearchpress.com/doi/abs/10.1139/H07-100
24. Chen CY, Lee MY, Lin K Der, Hsu WH, Lee YJ, Hsiao PJ, et al. Diabetes mellitus increases
severity of thrombocytopenia in dengue-infected patients. Int J Mol Sci. 2015;16(2):3820–30.
25. Vinik AI, Erbas T, Park TS, Nolan R, Pittenger GL. Platelet dysfunction in type 2 diabetes.
Diabetes Care [Internet]. 2001;24(8):1476–85. Available from:
http://www.ncbi.nlm.nih.gov/pubmed/11473089
26. Dogru T, Tasci I, Sonmez A, Genc H, Gok M, Yilmaz MI, et al. The plasma levels of soluble P-
selectin in subjects with prediabetes. Int J Clin Pract. 2006;60(9):1048–52.
27. Léon C, Hechler B, Freund M, Eckly A, Vial C, Ohlmann P, et al. Defective platelet aggregation
and increased resistance to thrombosis in purinergic P2Y1receptor-null mice. J Clin Invest.
1999;104(12):1731–7.
28. Jurk K, Kehrel BE. Platelets: Physiology and biochemistry. Semin Thromb Hemost.
2005;31(4):381–92.
29. Oury C, Toth-Zsamboki E, Vermylen J, Hoylaerts MF. The platelet ATP and ADP receptors.
Curr Pharm Des. 2006;12(7):859–75.
30. Fabre JE, Nguyen M, Latour A, Keifer JA, Audoly LP, Coffman TM, et al. Decreased platelet
aggregation, increased bleeding time and resistance to thromboembolism in P2Y1-deficient
mice. Nat Med [Internet]. 1999;5(10):1199–202. Available from:
http://www.ncbi.nlm.nih.gov/pubmed/10502826
31. Natarajan A, Zaman AG, Marshall SM. Platelet hyperactivity in type 2 diabetes: role of
antiplatelet agents. Diabetes Vasc Dis Res [Internet]. 2008;5(2):138–44. Available from:
http://journals.sagepub.com/doi/10.3132/dvdr.2008.023
32. Santilli F, Vazzana N, Liani R, Guagnano MT, Davì G. Platelet activation in obesity and
metabolic syndrome [Internet]. Vol. 13, Obesity Reviews. 2012 [cited 2015 Feb 25]. p. 27–42.
Available from: http://www.ncbi.nlm.nih.gov/pubmed/21917110
33. Colwell JA, Nesto RW. The platelet in diabetes: focus on prevention of ischemic events.
Diabetes Care. 2003;26(7):2181–8.
34. Signorello MG, Segantin A, Leoncini G. The arachidonic acid effect on platelet nitric oxide
level. Biochim Biophys Acta - Mol Cell Biol Lipids [Internet]. 2009;1791(11):1084–92.
60
Available from: http://dx.doi.org/10.1016/j.bbalip.2009.07.003
35. Helmersson J, Vessby B, Larsson A, Basu S. Association of Type 2 Diabetes with
Cyclooxygenase-Mediated Inflammation and Oxidative Stress in an Elderly Population.
Circulation. 2004;109(14):1729–34.
36. Ferroni P, Basili S, Falco a, Davì G. Platelet activation in type 2 diabetes mellitus. J Thromb
Haemost. 2004;2(8):1282–91.
37. Angiolillo DJ, Bernardo E, Ramírez C, Costa M a., Sabaté M, Jimenez-Quevedo P, et al. Insulin
Therapy Is Associated With Platelet Dysfunction in Patients With Type 2 Diabetes Mellitus on
Dual Oral Antiplatelet Treatment. J Am Coll Cardiol. 2006;48(2):298–304.
38. Jones DB, Carter RD, Haitas B, Mann JI. Low phospholipid arachidonic acid values in diabetic
platelets. Br Med J (Clin Res Ed). 1983;286(6360):173–5.
39. Eibl N, Krugluger W, Streit G, Schrattbauer K, Hopmeier P, Schernthaner G. Improved
metabolic control decreases platelet activation markers in patients with type-2 diabetes. Eur J
Clin Invest. 2004;34(3):205–9.
40. Saboor M, Ayub Q, Ilyas S, Moinuddin. Platelet receptors: An instrumental of platelet
physiology. Pakistan J Med Sci. 2013;29(3).
41. Sun Y, Scavini M, Orlando, A R, Murata G, Servilla K, Tzamaloukas A, et al. Increased CD36
Expression Signals Monocyte Activation Among Patients With Type 2 Diabetes. Diabetes Care.
2010;33(9):2065–7.
42. Alkhatatbeh MJ, Enjeti AK, Acharya S, Thorne RF, Lincz LF. The origin of circulating CD36
in type 2 diabetes. Nutr Diabetes [Internet]. 2013;3:e59-7. Available from:
http://dx.doi.org/10.1038/nutd.2013.1
43. Kakouros N, Rade JJ, Kourliouros A, Resar JR. Platelet function in patients with diabetes
mellitus: From a theoretical to a practical perspective. Int J Endocrinol. 2011;2011.
61
4.9. Bridging chapter
In pre-diabetes, platelets exhibited hyperreactivity to stimulation of the purinergic receptor,
glycoprotein VI and cyclooxygenase mediated signalling pathways. The hyperreactivity of platelets in
this early stage of pre-diabetes may be the major driver of atherosclerotic conditions and cardiovascular
disease at later stages in the progression into overt type 2 diabetes. The occurrence of cardiovascular
disease in treated type 2 diabetes has been reported and persistent platelet reactivity may be a major
role player in this phenomenon. The following study investigated the effect of combinational use of
metformin and low-dose dual therapy in inhibiting platelet hyperreactivity to protect against diabetes-
induced vascular complications. Treatment with low-dose aspirin and clopidogrel agents was used as a
comparative therapy.
62
Chapter 5. Research article three
Dual metformin and low-dose aspirin therapy reduces residual platelet activation in
pre-diabetic mice
Short title: Metformin and low-dose aspirin therapy
Zibusiso Mkandla a, Tinashe Mutize a, Sithandiwe Mazibuko-Mbeje b, c, Phiwayinkosi V Dludla c, d,
Bongani B Nkambule a
aUniversity of KwaZulu-Natal (UKZN), University Road, Westville, Private Bag X54001, Durban
4000, South Africa.
bBiomedical Research and Innovation Platform (BRIP), South African Medical Research Council,
Tygerberg 7505, South Africa.
cDivision of Medical Physiology, Faculty of Health Sciences, Stellenbosch University, Tygerberg 7505,
South Africa
d Department of Life and Environmental Sciences, Polytechnic University of Marche, Ancona 60131,
Italy.
Corresponding author: Zibusiso Mkandla
Phone: +27792731696
Email: [email protected]
63
5. Abstract
Introduction
Aspirin is a common drug used in the prevention of cardiovascular disease (CVD), whereas metformin
is used to improve glucose homeostasis in type 2 diabetic patients. There is currently limited evidence
on the effects and benefits of combined of metformin and low-dose aspirin therapy in reducing diabetes-
associated cardiovascular complications. This study investigated the platelet function in the combined
metformin and low-dose aspirin therapy, in comparison we further evaluated clopidogrel a commonly
used anti-platelet drug.
Methods
Pre-diabetic mice were randomized into different treatment groups; combination therapy of metformin
(150mg/kg) and low-dose aspirin (3mg/kg) (n=5), low-dose aspirin (3mg/kg) (n=5) or clopidogrel
(0.25mg/kg) (n=5) monotherapy. Baseline measurements were taken before treatment and 4 weeks after
treatment, the body weights and insulin levels were again measured. Platelet function was assessed
using varying concentrations of ADP (4µM and 20µM), collagen (0.19mg/mL) and arachidonic acid
(500µg/mL).
Results
The animal body weights were comparable across the groups (p>0.05). The dual-treatment with
metformin and low-dose aspirin inhibited platelet activation post stimulation with 4µM ADP
(p=0.0220). Interestingly, the low-dose aspirin-treated group showed no significant difference in the
residual levels of platelet activation post stimulation with both ADP concentrations (p>0.05).
Clopidogrel treatment inhibited the response to collagen stimulation (p=0.0270).
Discussion
Our study showed varied platelet response to agonist-induced activation in the pre-diabetic group
despite treatment. This highlights the involvement of different signalling pathways in platelet activation
and the potential benefit of dual-therapy in pre-diabetes. The synergistic use of metformin and low-dose
aspirin led to greater inhibition of platelet activation compared to low-dose aspirin monotherapy
treatment.
Keywords: Pre-diabetes; platelet reactivity; dual-therapy
64
5.1. Introduction
People living with type 2 diabetes mellitus (T2DM) are at a higher risk of developing cardiovascular
disease compared to nondiabetic individuals (1). There is no specific treatment currently available to
protect diabetic individuals at risk of cardiovascular complications (2,3). However, conventional
therapies that target both T2DM and cardiovascular disease are used to prolong the lives of diabetic
patients. In fact, low-dose aspirin is used in the primary prevention of cardiovascular complications and
subclinical atherosclerosis in patients with T2DM, who may be at risk of developing vascular events
(4). While the use of low-dose aspirin is recommended in the prevention of cardiovascular events (4,5),
cyclooxygenase (COX) and P2Y12 receptor inhibitors such as clopidogrel are the commonly used anti-
platelet drugs to prevent such complications (6,7). Alarmingly, a sub-optimal response to low-dose
aspirin and clopidogrel treatments has been reported in T2DM patients with coronary artery disease (8–
10). Residual platelet activation persists in type 2 diabetics who are on low-dose aspirin (11).
Interestingly, the use of a combination of metformin and low-dose aspirin can ameliorate diabetes-
associated complications, involving lipogenesis and hepatic glucose production, leading to improved
insulin sensitivity (12,13). Metformin acts on the liver and the gut to lower glucose production and
enhance glucose utilization (14). Furthermore, metformin lowers the cardiovascular mortality rate in
diabetic patients (15). The use of metformin in combination with low-aspirin reduces the levels of
urinary thromboxane A2 metabolite (11-dehydrothromboxane B2) which is directly associated with the
levels of sCD40L, a platelet activation marker (13,16).
Clopidogrel acts on blood platelets by inhibiting the P2Y12 receptor, thus preventing the binding of
adenosine diphosphate (ADP) and consequently inhibit platelet activation (17–19). This process inhibits
the function of platelet-monocyte aggregates (PMAs), which are associated with cardiovascular
complications in T2DM associated (17–19). The therapeutic benefits of clopidogrel in people living
with T2DM include a reduction in the relative risk of developing myocardial infarcts and strokes (20).
Although the benefits of dual metformin and low-dose aspirin therapy include, reduced in platelet
hyperreactivity and chronic inflammation (16), high on-treatment platelet reactivity (HTPR) has been
associated with thrombotic complications in T2DM patients on combined aspirin and clopidogrel
treatment (21). There is minimal data available on combinational effects of metformin and low dose
aspirin in protecting against diabetes-induced cardiovascular complications. In this study, we assessed
platelet activation and reactivity in pre-diabetes following combined metformin and low-dose aspirin
treatment, as well as clopidogrel monotherapy.
65
5.2. Methodology
5.2.1. Animal husbandry
A total of 20 C57BL/6 male mice were purchased from the University of KwaZulu-Natal (UKZN)
biomedical research unit (BRU). The mice were housed in a controlled environment with a twelve-hour
light/dark cycle (lights were switched on at 6:00 AM and switched off at 6:00 PM) and a temperature
range of 23-25ºC (relative humidity: ∼50%). All study procedures and animal handling were performed
according to the principles of laboratory animal Care of the National Society of Medical Research and
the National Institutes of Animal Care and Use of Laboratory Animals of the National Academy of
Sciences (National Institute of Health publication 80-23, revised 1978). Ethical clearance for the study
was obtained from the UKZN animal research ethics committee (AREC), ethics registration number
AREC/086/016.
5.2.2. Induction of pre-diabetes and experimental design
The control group (n=5) was fed on a low-fat diet containing 10% Kcal fat (Research diet no. D12450J,
Research Diets, New Brunswick, NJ, USA). While the high-fat diet experimental groups (n=15/group)
were kept on a high-fat diet containing 60% Kcal fat (Research diet no. D12492, Research Diets, New
Brunswick, NJ, USA).
5.2.3. Treatment randomization and oral glucose tolerance testing
The high-fat diet (HFD) fed mice (n=15) were then randomized into 3 treatment groups (n=5/group);
metformin and low-dose aspirin (150mg/kg metformin + 3mg/kg aspirin); low-dose aspirin (3mg/kg
aspirin), and clopidogrel (0.25mg/kg). All treatment drugs were administered daily via oral gavage,
once a day daily for 4 weeks. Glucose tolerance was assessed in both control and the HFD-fed mice as
previously described (22). Briefly, using oral gavage method, 2g/kg of glucose was administered, and
blood glucose levels were measured at varying time intervals (30 minutes, 60 minutes, and 120 minutes)
using the Accu-Check active blood glucometer (Roche, Basel, Switzerland).
5.2.4. Blood collection and measurement of baseline haematological parameters
A total of 200µl of venous blood was collected from the lateral tail vein into 3.2% sodium citrate coated
microtainer tubes (Sigma Aldrich, St Louis, Missouri, USA). Baseline haematological parameters
which included the platelet counts, mean platelet volume, were measured before treatment using the
Beckman Coulter AcT diffTM analyser (Beckman Coulter, Brea, CA, USA).
5.2.5. Platelet function and reactivity measurements
5.2.6. Measurements of baseline platelet activation and reactivity
Twenty-five microliters of blood was stained with an antibody cocktail containing CD41-FITC (1:10;
clone MWReg30), CD62P-BV421 (1:10; clone RB40.34), and CD36-PE (1:10; clone CRF D-2712)
(BD Bioscience, New Jersey, USA. In order to avoid the release of ADP and subsequent artefactual
66
activation of platelets, the red blood cells were not lysed (23). The samples were then incubated for 10
minutes at room temperature before the samples were suspended in 350µl of PBS. Samples were then
immediately analyzed on the BD FACS Canto II flow cytometer (BD Bioscience, NJ, USA).
5.2.7. Assessment of platelet function
Two varying concentrations of ADP were used to assess platelet purinergic receptor-mediated platelet
activation. These concentrations are known to induce reversible (4µM) and irreversible (20µM) platelet
activation (24). Collagen (0.19mg/mL) and arachidonic acid (500µg/mL) (Bio-data co-operation,
Pennsylvania, USA) were used to stimulate irreversible platelet activation via the glycoprotein VI
(GPVI) receptor and COX signalling pathway respectively (25). The platelet reactivity index (PRI) for
CD62P and CD36 was calculated as follows:
PRI= ((%levels of CD62P/CD36 post stimulation)-(Basal % levels of CD62P/CD36)
(%levels of CD62P/CD36 post stimulation)).
5.2.8. Statistical analysis
All statistical analysis was performed using GraphPad Prism 5 (GraphPad Software, San Diego,
California, USA). Parametric data were analysed using the repeated measures ANOVA and
Bonferroni's Multiple Comparison Test post hoc test. Non-parametric data were analysed using the
Kruskal-Wallis test and Dunns post-test. Parametric data were reported as the mean ± standard deviation
(SD), and non-parametric data reported as the median and interquartile range (IQR)
5.3. Results
5.3.1. Establishment of a pre-diabetic model
The oral glucose tolerance test (OGTT) showed that the HFD group had a higher postprandial blood
glucose levels compared to the control group. This was also illustrated by the higher area under the
curve (AUC) observed in the HFD group indicating delayed blood glucose clearance in the HFD pre-
diabetic group (p=0.0362). There were no differences in the insulin levels and body weights between
the treatment groups (p=0.0675) (Table 5.1).
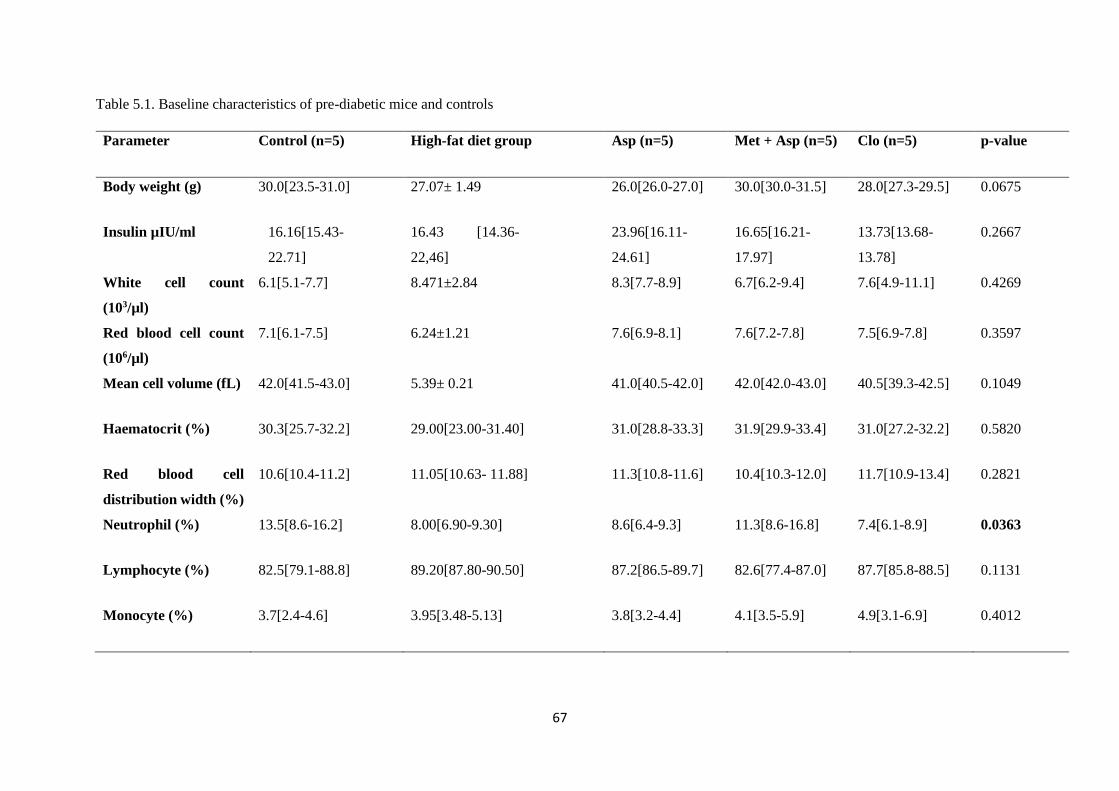
67
Table 5.1. Baseline characteristics of pre-diabetic mice and controls
Parameter Control (n=5) High-fat diet group Asp (n=5) Met + Asp (n=5) Clo (n=5) p-value
Body weight (g) 30.0[23.5-31.0] 27.07± 1.49 26.0[26.0-27.0] 30.0[30.0-31.5] 28.0[27.3-29.5] 0.0675
Insulin µIU/ml 16.16[15.43-
22.71]
16.43 [14.36-
22,46]
23.96[16.11-
24.61]
16.65[16.21-
17.97]
13.73[13.68-
13.78]
0.2667
White cell count
(103/µl)
6.1[5.1-7.7] 8.471±2.84 8.3[7.7-8.9] 6.7[6.2-9.4] 7.6[4.9-11.1] 0.4269
Red blood cell count
(106/µl)
7.1[6.1-7.5] 6.24±1.21 7.6[6.9-8.1] 7.6[7.2-7.8] 7.5[6.9-7.8] 0.3597
Mean cell volume (fL) 42.0[41.5-43.0] 5.39± 0.21 41.0[40.5-42.0] 42.0[42.0-43.0] 40.5[39.3-42.5] 0.1049
Haematocrit (%) 30.3[25.7-32.2] 29.00[23.00-31.40] 31.0[28.8-33.3] 31.9[29.9-33.4] 31.0[27.2-32.2] 0.5820
Red blood cell
distribution width (%)
10.6[10.4-11.2] 11.05[10.63- 11.88] 11.3[10.8-11.6] 10.4[10.3-12.0] 11.7[10.9-13.4] 0.2821
Neutrophil (%) 13.5[8.6-16.2] 8.00[6.90-9.30] 8.6[6.4-9.3] 11.3[8.6-16.8] 7.4[6.1-8.9] 0.0363
Lymphocyte (%) 82.5[79.1-88.8] 89.20[87.80-90.50] 87.2[86.5-89.7] 82.6[77.4-87.0] 87.7[85.8-88.5] 0.1131
Monocyte (%) 3.7[2.4-4.6] 3.95[3.48-5.13] 3.8[3.2-4.4] 4.1[3.5-5.9] 4.9[3.1-6.9] 0.4012
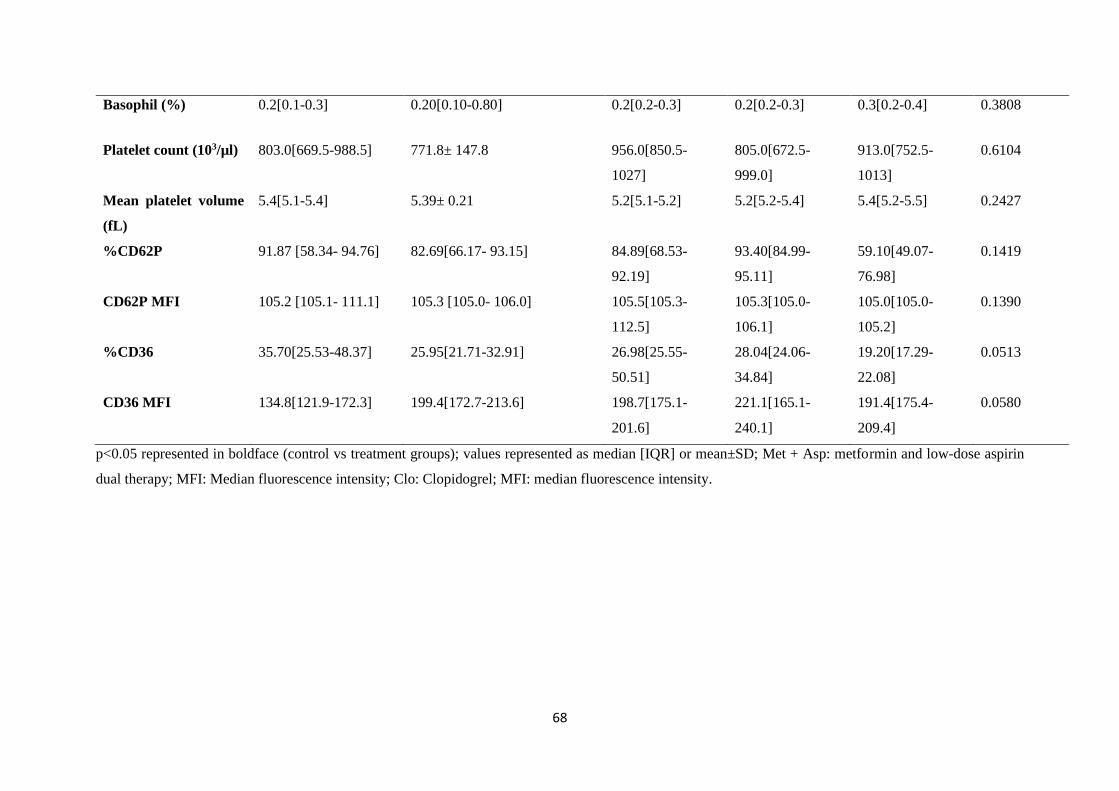
68
Basophil (%) 0.2[0.1-0.3] 0.20[0.10-0.80] 0.2[0.2-0.3] 0.2[0.2-0.3] 0.3[0.2-0.4] 0.3808
Platelet count (103/µl) 803.0[669.5-988.5] 771.8± 147.8 956.0[850.5-
1027]
805.0[672.5-
999.0]
913.0[752.5-
1013]
0.6104
Mean platelet volume
(fL)
5.4[5.1-5.4] 5.39± 0.21 5.2[5.1-5.2] 5.2[5.2-5.4] 5.4[5.2-5.5] 0.2427
%CD62P 91.87 [58.34- 94.76] 82.69[66.17- 93.15] 84.89[68.53-
92.19]
93.40[84.99-
95.11]
59.10[49.07-
76.98]
0.1419
CD62P MFI 105.2 [105.1- 111.1] 105.3 [105.0- 106.0] 105.5[105.3-
112.5]
105.3[105.0-
106.1]
105.0[105.0-
105.2]
0.1390
%CD36 35.70[25.53-48.37] 25.95[21.71-32.91] 26.98[25.55-
50.51]
28.04[24.06-
34.84]
19.20[17.29-
22.08]
0.0513
CD36 MFI 134.8[121.9-172.3] 199.4[172.7-213.6] 198.7[175.1-
201.6]
221.1[165.1-
240.1]
191.4[175.4-
209.4]
0.0580
p<0.05 represented in boldface (control vs treatment groups); values represented as median [IQR] or mean±SD; Met + Asp: metformin and low-dose aspirin
dual therapy; MFI: Median fluorescence intensity; Clo: Clopidogrel; MFI: median fluorescence intensity.
69
5.3.2. P2Y12 receptor responses in HFD-fed mice following metformin and low-dose aspirin
treatment
In order to assess the P2Y12 receptor-mediated response, the levels of P-selectin (%CD62P) were
measured post stimulation with 4µM and 20µM of ADP. In the metformin and low-dose aspirin-treated
group, the platelet P2Y12 receptor-mediated %CD62P expression was only inhibited at 4µM of ADP
(p=0.0220). Residual platelet activation was observed at the concentration of 20µM ADP (p=0.0535)
(Table 5.2). Whereas the levels of %CD36 expression were only inhibited at a concentration of 20µM
ADP (p=0.0002). Furthermore, the glycoprotein GPVI- mediated responses were also inhibited
following the 4-week metformin and low-dose aspirin treatment (p=0.0329).
5.3.3. P2Y12 receptor responses in HFD-fed mice following on low-dose aspirin treatment
In the low-dose aspirin group, there were no significant variations in the %CD62P and %CD36
expression following stimulation with ADP (p>0.05). Collagen was used to stimulate platelet GPVI
receptor-mediated platelet activation. No significant difference in the %CD62P expression from the
low-dose aspirin-treated post stimulation with collagen compared to pre-treatment levels (p=0.1396).
5.3.4. P2Y12 receptor responses in HFD-fed mice following clopidogrel treatment
Clopidogrel treatment only inhibited the platelet response to 20µM ADP (p=0.0313) (Table 5.2).
Variations in P2Y12 receptor-mediated platelet responses across the treatment groups were assessed and
the %CD62P platelet reactivity index (%CD62P PRI) was compared across the metformin and low-
dose aspirin group. A higher %CD62P PRI was observed in the metformin and low-dose aspirin group
compared to the low-dose aspirin-treated group, post stimulation with 20µM ADP (p=0.0001) (Figure
5.1).
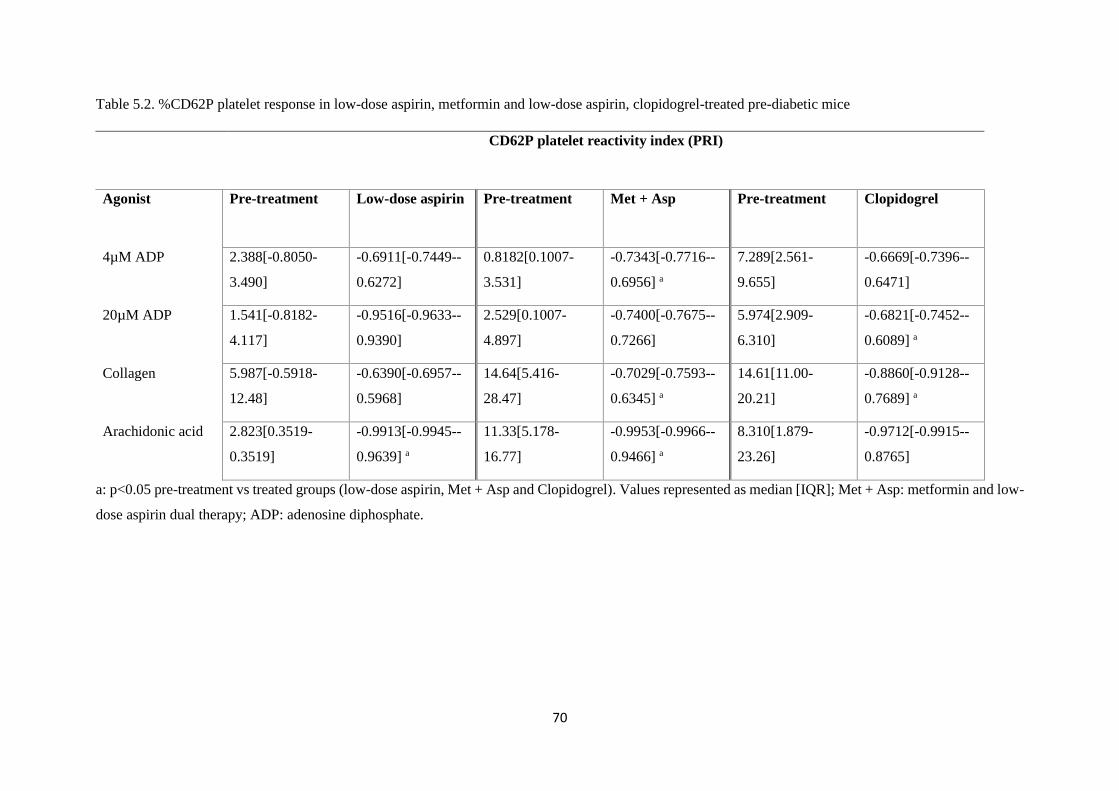
70
Table 5.2. %CD62P platelet response in low-dose aspirin, metformin and low-dose aspirin, clopidogrel-treated pre-diabetic mice
CD62P platelet reactivity index (PRI)
Agonist Pre-treatment Low-dose aspirin Pre-treatment Met + Asp Pre-treatment Clopidogrel
4µM ADP 2.388[-0.8050-
3.490]
-0.6911[-0.7449--
0.6272]
0.8182[0.1007-
3.531]
-0.7343[-0.7716--
0.6956] a
7.289[2.561-
9.655]
-0.6669[-0.7396--
0.6471]
20µM ADP 1.541[-0.8182-
4.117]
-0.9516[-0.9633--
0.9390]
2.529[0.1007-
4.897]
-0.7400[-0.7675--
0.7266]
5.974[2.909-
6.310]
-0.6821[-0.7452--
0.6089] a
Collagen 5.987[-0.5918-
12.48]
-0.6390[-0.6957--
0.5968]
14.64[5.416-
28.47]
-0.7029[-0.7593--
0.6345] a
14.61[11.00-
20.21]
-0.8860[-0.9128--
0.7689] a
Arachidonic acid 2.823[0.3519-
0.3519]
-0.9913[-0.9945--
0.9639] a
11.33[5.178-
16.77]
-0.9953[-0.9966--
0.9466] a
8.310[1.879-
23.26]
-0.9712[-0.9915--
0.8765]
a: p<0.05 pre-treatment vs treated groups (low-dose aspirin, Met + Asp and Clopidogrel). Values represented as median [IQR]; Met + Asp: metformin and low-
dose aspirin dual therapy; ADP: adenosine diphosphate.
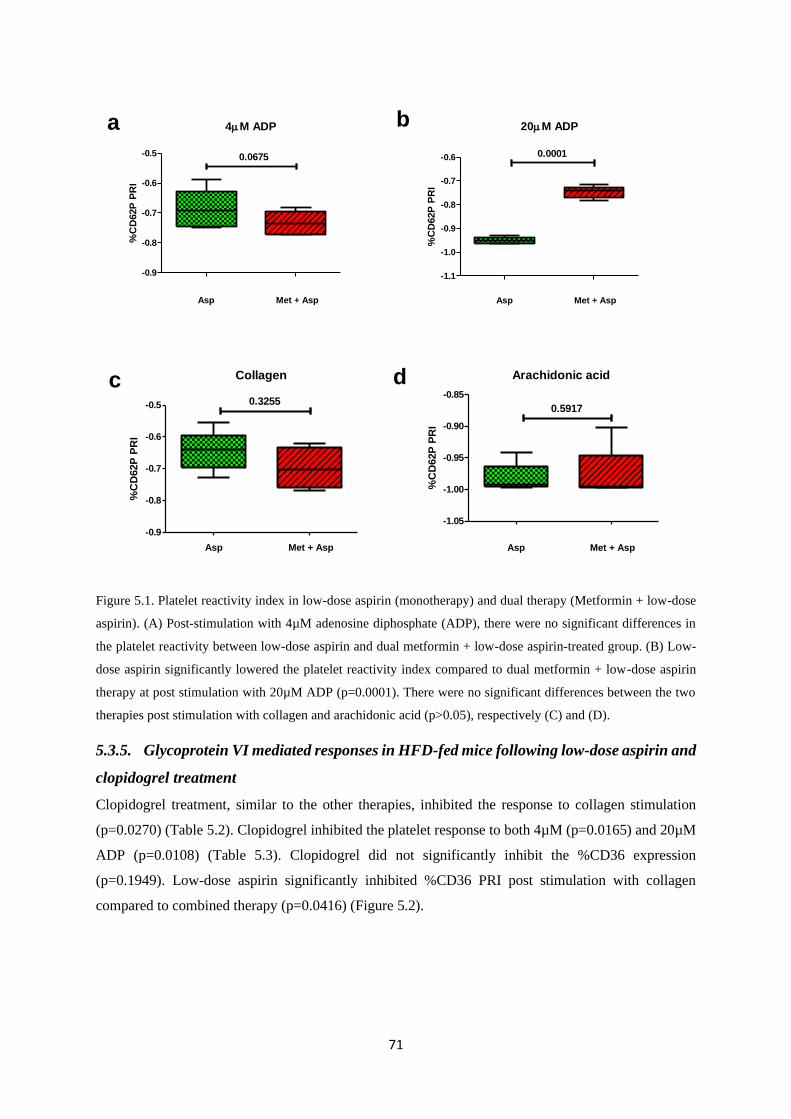
71
4M ADP
Asp Met + Asp
-0.9
-0.8
-0.7
-0.6
-0.5 0.0675
%C
D62P
PR
I20M ADP
Asp Met + Asp
-1.1
-1.0
-0.9
-0.8
-0.7
-0.6 0.0001
%C
D62P
PR
I
Collagen
Asp Met + Asp
-0.9
-0.8
-0.7
-0.6
-0.5 0.3255
%C
D62P
PR
I
Arachidonic acid
Asp Met + Asp
-1.05
-1.00
-0.95
-0.90
-0.85
0.5917
%C
D62P
PR
I
a b
c d
Figure 5.1. Platelet reactivity index in low-dose aspirin (monotherapy) and dual therapy (Metformin + low-dose
aspirin). (A) Post-stimulation with 4µM adenosine diphosphate (ADP), there were no significant differences in
the platelet reactivity between low-dose aspirin and dual metformin + low-dose aspirin-treated group. (B) Low-
dose aspirin significantly lowered the platelet reactivity index compared to dual metformin + low-dose aspirin
therapy at post stimulation with 20µM ADP (p=0.0001). There were no significant differences between the two
therapies post stimulation with collagen and arachidonic acid (p>0.05), respectively (C) and (D).
5.3.5. Glycoprotein VI mediated responses in HFD-fed mice following low-dose aspirin and
clopidogrel treatment
Clopidogrel treatment, similar to the other therapies, inhibited the response to collagen stimulation
(p=0.0270) (Table 5.2). Clopidogrel inhibited the platelet response to both 4µM (p=0.0165) and 20µM
ADP (p=0.0108) (Table 5.3). Clopidogrel did not significantly inhibit the %CD36 expression
(p=0.1949). Low-dose aspirin significantly inhibited %CD36 PRI post stimulation with collagen
compared to combined therapy (p=0.0416) (Figure 5.2).
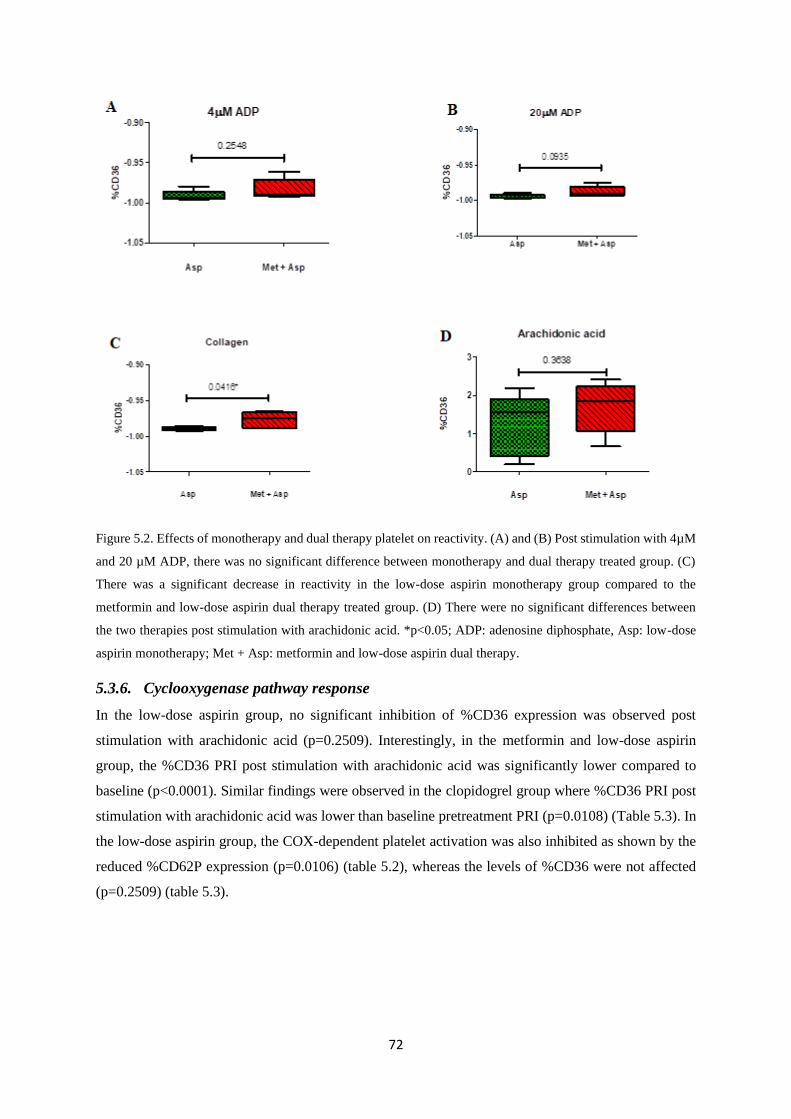
72
Figure 5.2. Effects of monotherapy and dual therapy platelet on reactivity. (A) and (B) Post stimulation with 4µM
and 20 µM ADP, there was no significant difference between monotherapy and dual therapy treated group. (C)
There was a significant decrease in reactivity in the low-dose aspirin monotherapy group compared to the
metformin and low-dose aspirin dual therapy treated group. (D) There were no significant differences between
the two therapies post stimulation with arachidonic acid. *p<0.05; ADP: adenosine diphosphate, Asp: low-dose
aspirin monotherapy; Met + Asp: metformin and low-dose aspirin dual therapy.
5.3.6. Cyclooxygenase pathway response
In the low-dose aspirin group, no significant inhibition of %CD36 expression was observed post
stimulation with arachidonic acid (p=0.2509). Interestingly, in the metformin and low-dose aspirin
group, the %CD36 PRI post stimulation with arachidonic acid was significantly lower compared to
baseline (p<0.0001). Similar findings were observed in the clopidogrel group where %CD36 PRI post
stimulation with arachidonic acid was lower than baseline pretreatment PRI (p=0.0108) (Table 5.3). In
the low-dose aspirin group, the COX-dependent platelet activation was also inhibited as shown by the
reduced %CD62P expression (p=0.0106) (table 5.2), whereas the levels of %CD36 were not affected
(p=0.2509) (table 5.3).
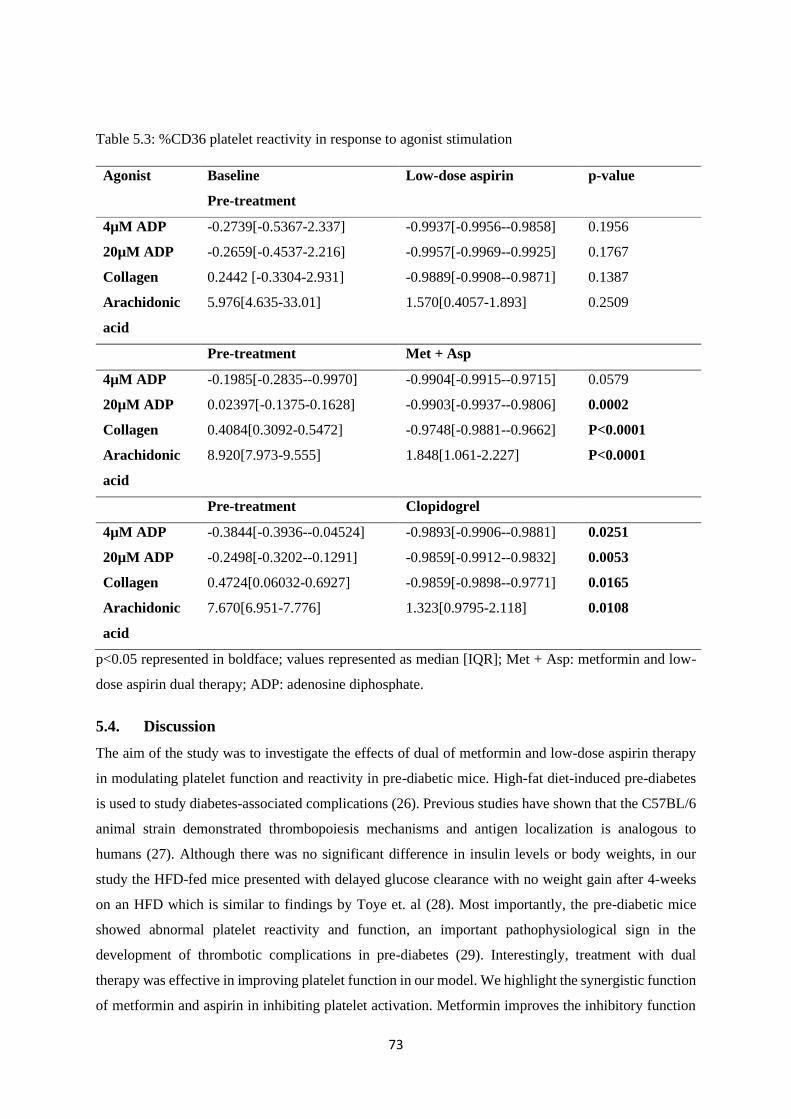
73
Table 5.3: %CD36 platelet reactivity in response to agonist stimulation
Agonist Baseline
Pre-treatment
Low-dose aspirin p-value
4µM ADP -0.2739[-0.5367-2.337] -0.9937[-0.9956--0.9858] 0.1956
20µM ADP -0.2659[-0.4537-2.216] -0.9957[-0.9969--0.9925] 0.1767
Collagen 0.2442 [-0.3304-2.931] -0.9889[-0.9908--0.9871] 0.1387
Arachidonic
acid
5.976[4.635-33.01] 1.570[0.4057-1.893] 0.2509
Pre-treatment Met + Asp
4µM ADP -0.1985[-0.2835--0.9970] -0.9904[-0.9915--0.9715] 0.0579
20µM ADP 0.02397[-0.1375-0.1628] -0.9903[-0.9937--0.9806] 0.0002
Collagen 0.4084[0.3092-0.5472] -0.9748[-0.9881--0.9662] P<0.0001
Arachidonic
acid
8.920[7.973-9.555] 1.848[1.061-2.227] P<0.0001
Pre-treatment Clopidogrel
4µM ADP -0.3844[-0.3936--0.04524] -0.9893[-0.9906--0.9881] 0.0251
20µM ADP -0.2498[-0.3202--0.1291] -0.9859[-0.9912--0.9832] 0.0053
Collagen 0.4724[0.06032-0.6927] -0.9859[-0.9898--0.9771] 0.0165
Arachidonic
acid
7.670[6.951-7.776] 1.323[0.9795-2.118] 0.0108
p<0.05 represented in boldface; values represented as median [IQR]; Met + Asp: metformin and low-
dose aspirin dual therapy; ADP: adenosine diphosphate.
5.4. Discussion
The aim of the study was to investigate the effects of dual of metformin and low-dose aspirin therapy
in modulating platelet function and reactivity in pre-diabetic mice. High-fat diet-induced pre-diabetes
is used to study diabetes-associated complications (26). Previous studies have shown that the C57BL/6
animal strain demonstrated thrombopoiesis mechanisms and antigen localization is analogous to
humans (27). Although there was no significant difference in insulin levels or body weights, in our
study the HFD-fed mice presented with delayed glucose clearance with no weight gain after 4-weeks
on an HFD which is similar to findings by Toye et. al (28). Most importantly, the pre-diabetic mice
showed abnormal platelet reactivity and function, an important pathophysiological sign in the
development of thrombotic complications in pre-diabetes (29). Interestingly, treatment with dual
therapy was effective in improving platelet function in our model. We highlight the synergistic function
of metformin and aspirin in inhibiting platelet activation. Metformin improves the inhibitory function
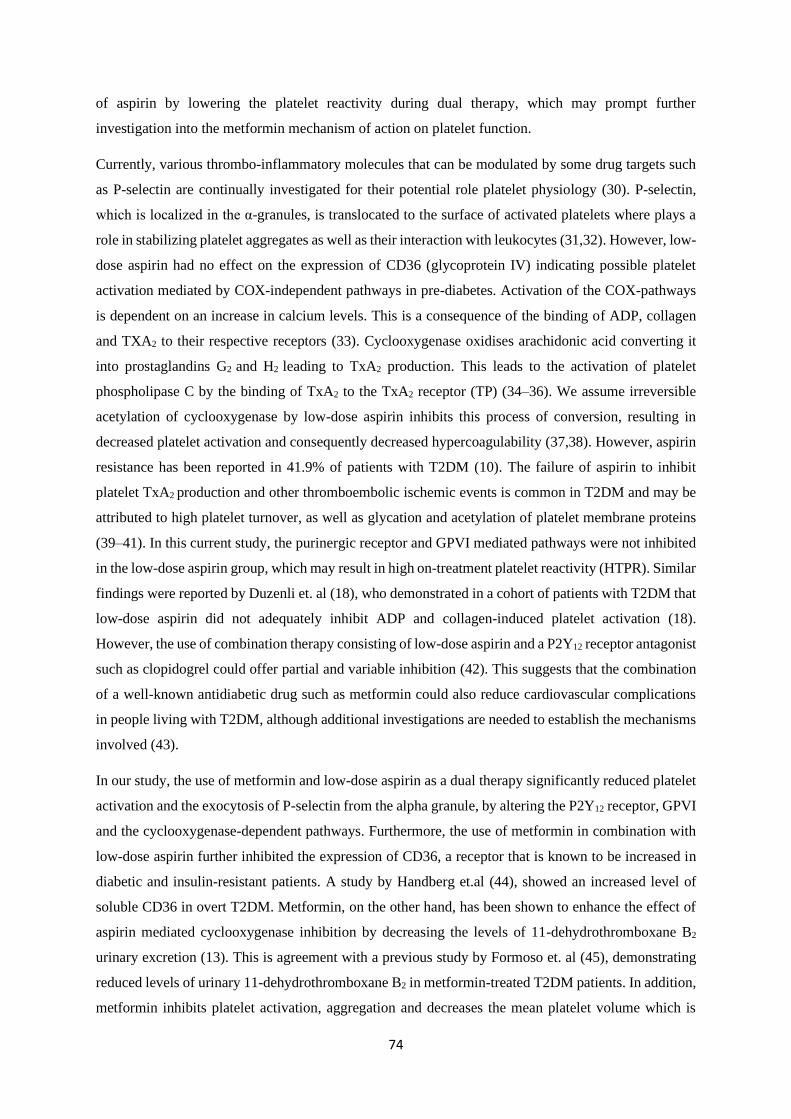
74
of aspirin by lowering the platelet reactivity during dual therapy, which may prompt further
investigation into the metformin mechanism of action on platelet function.
Currently, various thrombo-inflammatory molecules that can be modulated by some drug targets such
as P-selectin are continually investigated for their potential role platelet physiology (30). P-selectin,
which is localized in the α-granules, is translocated to the surface of activated platelets where plays a
role in stabilizing platelet aggregates as well as their interaction with leukocytes (31,32). However, low-
dose aspirin had no effect on the expression of CD36 (glycoprotein IV) indicating possible platelet
activation mediated by COX-independent pathways in pre-diabetes. Activation of the COX-pathways
is dependent on an increase in calcium levels. This is a consequence of the binding of ADP, collagen
and TXA2 to their respective receptors (33). Cyclooxygenase oxidises arachidonic acid converting it
into prostaglandins G2 and H2 leading to TxA2 production. This leads to the activation of platelet
phospholipase C by the binding of TxA2 to the TxA2 receptor (TP) (34–36). We assume irreversible
acetylation of cyclooxygenase by low-dose aspirin inhibits this process of conversion, resulting in
decreased platelet activation and consequently decreased hypercoagulability (37,38). However, aspirin
resistance has been reported in 41.9% of patients with T2DM (10). The failure of aspirin to inhibit
platelet TxA2 production and other thromboembolic ischemic events is common in T2DM and may be
attributed to high platelet turnover, as well as glycation and acetylation of platelet membrane proteins
(39–41). In this current study, the purinergic receptor and GPVI mediated pathways were not inhibited
in the low-dose aspirin group, which may result in high on-treatment platelet reactivity (HTPR). Similar
findings were reported by Duzenli et. al (18), who demonstrated in a cohort of patients with T2DM that
low-dose aspirin did not adequately inhibit ADP and collagen-induced platelet activation (18).
However, the use of combination therapy consisting of low-dose aspirin and a P2Y12 receptor antagonist
such as clopidogrel could offer partial and variable inhibition (42). This suggests that the combination
of a well-known antidiabetic drug such as metformin could also reduce cardiovascular complications
in people living with T2DM, although additional investigations are needed to establish the mechanisms
involved (43).
In our study, the use of metformin and low-dose aspirin as a dual therapy significantly reduced platelet
activation and the exocytosis of P-selectin from the alpha granule, by altering the P2Y12 receptor, GPVI
and the cyclooxygenase-dependent pathways. Furthermore, the use of metformin in combination with
low-dose aspirin further inhibited the expression of CD36, a receptor that is known to be increased in
diabetic and insulin-resistant patients. A study by Handberg et.al (44), showed an increased level of
soluble CD36 in overt T2DM. Metformin, on the other hand, has been shown to enhance the effect of
aspirin mediated cyclooxygenase inhibition by decreasing the levels of 11-dehydrothromboxane B2
urinary excretion (13). This is agreement with a previous study by Formoso et. al (45), demonstrating
reduced levels of urinary 11-dehydrothromboxane B2 in metformin-treated T2DM patients. In addition,
metformin inhibits platelet activation, aggregation and decreases the mean platelet volume which is
75
associated with vascular complications in T2DM (46). Although our results support the use of
metformin in combination a low-dose aspirin, the direct impact of this antidiabetic drug on platelets
still remains unclear. However, it is suggested that metformin may inhibit platelet mitochondrial DNA
release in platelets activated with either ADP, arachidonic acid or thrombin, leading to platelet
aggregation (43). In our study, we observed reduced levels of platelet degranulation and the exocytosis
of P-selectin in the response to post-treatment with metformin and low-dose aspirin.
We further assessed platelet function following clopidogrel treatment, which is a known antagonist of
the P2Y12 receptor that is activated in the liver by cytochrome P450 34A (17,19,47). The P2Y12 receptor
antagonist reduced platelet degranulation and the exocytosis of P-selectin, leading to inhibition of both
GPVI and P2Y12 pathways. However, residual platelet activation in response to activation of the
cyclooxygenase pathway by arachidonic acid was observed. In addition, a variable dose-dependent
response to ADP in the clopidogrel group was also observed, which may be due to the variability in the
platelet response to endogenous agonists following clopidogrel treatment (17,48). An accelerated
platelet turnover or single nucleotide polymorphism (SNPs) in the P2Y1 and P2Y12 receptors, as well as
variations in surface density of the receptors, may be responsible for the observed variability (17,49).
This was a limitation to our study, however, clopidogrel dose used in this study significantly reduced
the expression of CD36 which may indicate inhibition of platelet shape change caused by increased
intracellular calcium levels (50).
Platelet activation is orchestrated by multiple pathways that converge and result in morphological
changes, degranulation and aggregation (51,52). In T2DM, there is increased platelet reactivity in
response to endogenous agonists such as ADP, arachidonic acid and collagen (9). The complex nature
of platelet signalling creates for a challenge in tailoring patient treatment options. Residual platelet
activation during aspirin and clopidogrel treatment at the pre-diabetic stage may be useful in the
thrombotic risk stratification of pre-diabetic individuals. In addition, resistance to both anti-platelet
therapies has been reported in T2DM (17,49). The therapeutic targeting of these pathways plays a
pivotal cardioprotective role and may reduce the risk of thrombotic complications (53). In our study,
the combination therapy consisting of metformin and low-dose aspirin inhibited residual platelet
activation in pre-diabetic mice. The high on-treatment platelet reactivity highlights the involvement of
complex platelet signalling pathways and may suggest the importance of dual-therapy approach in
preventing thrombotic complications in pre-diabetes.
5.6. Acknowledgements
We would like to acknowledge the Biomedical research unit and the Department of Human Physiology,
College of Health Sciences (CHS), University of KwaZulu-Natal for providing access to the flow
cytometry analysis facility and Biomedical research unit for the animal housing facilities.
76
5.7. Funding
This study was funded by the South African National Research Foundation (NRF) Thuthuka grant
(TTK150610119176). The NRF did not directly participate in the analysis or interpretation of the
findings presented in this manuscript. BB Nkambule is partially supported as a Post-Doctoral fellow,
by the Fogarty International Centre (FIC), NIH Common Fund, Office of Strategic Coordination, Office
of the Director (OD/OSC/CF/NIH), Office of AIDS Research, Office of the Director (OAR/NIH),
National Institute of Mental Health (NIMH/NIH) of the National Institutes of Health under Award
Number D43TW010131.
5.8. Disclosure statement
The authors declare no competing financial interests to disclose.
5.9. References
1. Leon BM. Diabetes and cardiovascular disease: Epidemiology, biological mechanisms,
treatment recommendations and future research. World J Diabetes [Internet]. 2015;6(13):1246.
Available from: http://www.wjgnet.com/1948-9358/full/v6/i13/1246.htm
2. Szuszkiewicz-Garcia MM, Davidson JA. Cardiovascular disease in diabetes mellitus: Risk
factors and medical therapy. Endocrinol Metab Clin North Am [Internet]. 2014;43(1):25–40.
Available from: http://dx.doi.org/10.1016/j.ecl.2013.09.001
3. Papazafiropoulou AK, Melidonis A. Diabetes drugs and cardiovascular safety. Arch Hell Med.
2017;34(3):321–6.
4. Udell JA, Scirica BM, Braunwald E, Raz I, Gabriel Steg P, Davidson J, et al. Statin and aspirin
therapy for the prevention of cardiovascular events in patients with type 2 diabetes mellitus. Clin
Cardiol. 2012;35(12):722–9.
5. Li Z, Yang F, Dunn S, Gross AK, Smyth SS. Platelets as immune mediators: Their role in host
defense responses and sepsis [Internet]. Vol. 127, Thrombosis Research. Elsevier B.V.; 2011. p.
184–8. Available from: http://dx.doi.org/10.1016/j.thromres.2010.10.010
6. Wang Y, Li Z, Wang W. Platelet-Leukocyte Interaction in Atherosclerosis and
Atherothrombosis : What We Have Learnt From Human Studies and Animal Models. J Cardiol
Ther [Internet]. 2014;1(5):92–7. Available from:
http://ghrnet.org/index.php/jct/article/view/710
7. Schrottmaier WC, Kral JB, Badrnya S, Assinger A. Aspirin and P2Y12 Inhibitors in platelet-
mediated activation of neutrophils and monocytes. Thromb Haemost. 2015;114(3):478–89.
8. Evangelista V, De Berardis G, Totani L, Avanzini F, Giorda CB, Brero L, et al. Persistent
77
platelet activation in patients with type 2 diabetes treated with low doses of aspirin. J Thromb
Haemost. 2007;5(11):2197–203.
9. Natarajan A, Zaman AG, Marshall SM. Platelet hyperactivity in type 2 diabetes: role of
antiplatelet agents. Diabetes Vasc Dis Res [Internet]. 2008;5(2):138–44. Available from:
http://journals.sagepub.com/doi/10.3132/dvdr.2008.023
10. Tasdemir E, Toptas T, Demir C, Esen R, Atmaca M. Aspirin resistance in patients with type II
diabetes mellitus. Ups J Med Sci. 2014;119(1):25–31.
11. Lemkes B, Bähler L, Kamphuisen PW, Stroobants a K, Van Den Dool EJ, Hoekstra JB, et al.
The influence of aspirin dose and glycemic control on platelet inhibition in patients with type 2
diabetes mellitus. J Thromb Haemost [Internet]. 2012;10(4):639–46. Available from:
http://www.ncbi.nlm.nih.gov/pubmed/22252020
12. Ford RJ, Fullerton MD, Pinkosky SL, Day EA, Scott JW, Oakhill JS, et al. Metformin and
salicylate synergistically activate liver AMPK, inhibit lipogenesis and improve insulin
sensitivity. Pediatr Emerg Care. 2010;26(2):952–62.
13. Gonçalves LH, Silva MVF, Duarte RCF, Dusse LMS, Fernandes AP, Bosco AA, et al.
Acetylsalicylic acid therapy: Influence of metformin use and other variables on urinary 11-
dehydrothromboxane B2 levels. Clin Chim Acta [Internet]. 2014;429:76–8. Available from:
http://dx.doi.org/10.1016/j.cca.2013.11.028
14. Rena G, Hardie DG, Pearson ER. The mechanisms of action of metformin. Diabetologia.
2017;60(9):1577–85.
15. MACDONALD MR, EURICH DT, R.MAJUMDAR S, LEWSEY JD, BHAGRA S, JHUND
PS, et al. Treatment of Type 2 Diabetes and Outcomes in Patients With Heart Failure: A Nested
Case–Control Study From the U.K. General Practice Research Database. Cardiovasc Res.
2010;33(6).
16. Schöndorf T, Musholt PB, Hohberg C, Forst T, Lehmann U, Fuchs W, et al. The fixed
combination of pioglitazone and metformin improves biomarkers of platelet function and
chronic inflammation in type 2 diabetes patients: results from the PIOfix study. J Diabetes Sci
Technol [Internet]. 2011;5(2):426–32. Available from:
http://www.pubmedcentral.nih.gov/articlerender.fcgi?artid=3125938&tool=pmcentrez&render
type=abstract
17. Michelson AD, Linden MD, Furman MI, Li Y, Barnard MR, Fox ML, et al. Evidence that pre-
existent variability in platelet response to ADP accounts for “clopidogrel resistance.” J Thromb
Haemost. 2007;5(1):75–81.
78
18. Duzenli MA, Ozdemir K, Aygul N, Soylu A, Tokac M. Comparison of Increased Aspirin Dose
Versus Combined Aspirin Plus Clopidogrel Therapy in Patients With Diabetes Mellitus and
Coronary Heart Disease and Impaired Antiplatelet Response to Low-Dose Aspirin. Am J
Cardiol. 2008;102(4):396–400.
19. Diehl P, Olivier C, Haischeid C, Helbing T, Bode C, Moser M. Clopidogrel affects leukocyte
dependent platelet aggregation by P2Y 12 expressing leukocytes. Basic Res Cardiol [Internet].
2010 May [cited 2015 Feb 25];105(3):379–87. Available from:
http://www.ncbi.nlm.nih.gov/pubmed/19943165
20. Mathewkutty S, Mcguire DK. Platelet perturbations in diabetes : implications for cardiovascular
disease risk and treatment. 2009;541–50.
21. Angiolillo DJ, Bernardo E, Sabat?? M, Jimenez-Quevedo P, Costa MA, Palazuelos J, et al.
Impact of Platelet Reactivity on Cardiovascular Outcomes in Patients With Type 2 Diabetes
Mellitus and Coronary Artery Disease. J Am Coll Cardiol. 2007;50(16):1541–7.
22. Andrikopoulos S, Blair AR, Deluca N, Fam BC, Proietto J. Evaluating the glucose tolerance test
in mice. 2008;1323–32.
23. Helms CC, Marvel M, Zhao W, Stahle M, Vest R, Kato GJ, et al. Mechanisms of hemolysis-
associated platelet activation. J Thromb Haemost. 2013;11(12):2148–54.
24. Cosemans JMEM, Angelillo-Scherrer A, Mattheij NJA, Heemskerk JWM. The effects of arterial
flow on platelet activation, thrombus growth, and stabilization [Internet]. Vol. 99,
Cardiovascular Research. 2013 [cited 2015 Feb 25]. p. 342–52. Available from:
http://www.ncbi.nlm.nih.gov/pubmed/23667186
25. Nkambule BB, Davison G, Ipp H. The value of flow cytometry in the measurement of platelet
activation and aggregation in human immunodeficiency virus infection. Platelets.
2015;26(3):250–7.
26. King AJF. The use of animal models in diabetes research. Br J Pharmacol. 2012;166(3):877–94.
27. Schmitt A, Guichard J, Massé J, Debili N, Cramer EM. Of mice and men : Comparison of the
ultrastructure of megakaryocytes and platelets. 2001;29:1295–302.
28. Toye AA, Lippiat JD, Proks P, Shimomura K, Bentley L, Hugill A, et al. A genetic and
physiological study of impaired glucose homeostasis control in C57BL/6J mice. Diabetologia.
2005;48(4):675–86.
29. Kakouros N, Rade JJ, Kourliouros A, Resar JR. Platelet function in patients with diabetes
mellitus: From a theoretical to a practical perspective. Int J Endocrinol. 2011;2011.
79
30. Théorêt JF, Yacoub D, Hachem A, Gillis MA, Merhi Y. P-selectin ligation induces platelet
activation and enhances microaggregate and thrombus formation. Thromb Res [Internet].
2011;128(3):243–50. Available from: http://dx.doi.org/10.1016/j.thromres.2011.04.018
31. Merten M, Thiagarajan P. P-selectin expression on platelets determines size and stability of
platelet aggregates. Circulation. 2000;102(16):1931–6.
32. Polgar J, Matuskova J, Wagner DD. The P-selectin, tissue factor, coagulation triad. J Thromb
Haemost. 2005;3(8):1590–6.
33. Xiang YZ, Xia Y, Gao XM, Shang HC, Kang LY, Zhang BL. Platelet activation, and antiplatelet
targets and agents: Current and novel strategies. Drugs. 2008;68(12):1647–64.
34. Offermanns S. Activation of platelet function through G protein-coupled receptors. Circ Res.
2006;99(12):1293–304.
35. Korbecki J, Baranowska-Bosiacka I, Gutowska I, Chlubek D. Cyclooxygenase pathways. Acta
Biochim Pol. 2014;61(4):639–49.
36. Khan N, Farooq AD, Sadek B. Investigation of cyclooxygenase and signaling pathways involved
in human platelet aggregation mediated by synergistic interaction of various agonists. Drug Des
Devel Ther. 2015;9(Figure 1):3497–509.
37. Smith JP, Haddad E V., Taylor MB, Oram D, Blakemore D, Chen Q, et al. Suboptimal inhibition
of platelet cyclooxygenase-1 by aspirin in metabolic syndrome. Hypertension. 2012;59(3):719–
25.
38. Li R, Diamond SL. Detection of platelet sensitivity to inhibitors of COX-1, P2Y1, and P2Y12
using a whole blood microfluidic flow assay. Thromb Res. 2014;133(2):203–10.
39. Hankey GJ, Eikelboom JW. Aspirin resistance. Lancet. 2006;367(9510):606–17.
40. Floyd CN, Ferro A. Mechanisms of aspirin resistance. Pharmacol Ther [Internet].
2014;141(1):69–78. Available from: http://dx.doi.org/10.1016/j.pharmthera.2013.08.005
41. Kimura Y, Takano K, Satoh K, Aida K, Kobayashi T, Ozaki Y. Aspirin half maximal inhibitory
concentration value on platelet cyclooxygenase1 in severe type-2 diabetes mellitus is not
significantly different from that of healthy individuals. Clin Appl Thromb. 2014;20(6):629–36.
42. Warner TD, Nylander S, Whatling C. Anti-platelet therapy: Cyclo-oxygenase inhibition and the
use of aspirin with particular regard to dual anti-platelet therapy. Br J Clin Pharmacol.
2011;72(4):619–33.
43. Huang W, Xin G, Wei Z, Ji C, Zheng H, Gu J, et al. Metformin Uniquely Prevents Thrombosis
80
by Inhibiting Platelet Activation and mtDNA Release. Sci Rep. 2016;6(July):1–12.
44. Handberg A, Norberg M, Stenlund H, Hallmans G, Attermann J, Eriksson JW. Soluble CD36
(sCD36) clusters with markers of insulin resistance, and high sCD36 is associated with increased
type 2 diabetes risk. J Clin Endocrinol Metab. 2010;95(4):1939–45.
45. Formoso G, De Filippis E, Di Fulvio P, Pandolfi A, Bucciarelli T, Ciabattoni G, et al. Decreased
in vivo oxidative stress and decreased platelet activation following metformin treatment in
newly diagnosed type 2 diabetic subjects. Diabetes Metab Res Rev [Internet]. 2014;32(30):13–
23. Available from: http://libweb.anglia.ac.uk/
46. Papazafiropoulou A, Papanas N, Pappas S, Maltezos E, Mikhailidis DP. Effects of oral
hypoglycemic agents on platelet function. J Diabetes Complications. 2015;29(6):846–51.
47. Hall HM, Banerjee S, McGuire DK. Variability of clopidogrel response in patients with type 2
diabetes mellitus. Diabetes Vasc Dis Res. 2011;8(4):245–53.
48. Damman P, Woudstra P, Kuijt WJ, De Winter RJ, James SK. P2Y12 platelet inhibition in
clinical practice. Vol. 33, Journal of Thrombosis and Thrombolysis. 2012. p. 143–53.
49. Feher G, Feher A, Pusch G, Koltai K, Tibold A, Gasztonyi B, et al. Clinical importance of aspirin
and clopidogrel resistance. World J Cardiol [Internet]. 2010;2(7):171–86. Available from:
http://www.pubmedcentral.nih.gov/articlerender.fcgi?artid=2998916&tool=pmcentrez&render
type=abstract
50. Rauchfuss S, Geiger J, Walter U, Renne T, Gambaryan S. Insulin inhibition of platelet-
endothelial interaction is mediated by insulin effects on endothelial cells without direct effects
on platelets. 2008;(January):856–64.
51. Jurk K, Kehrel BE. Platelets: Physiology and biochemistry. Semin Thromb Hemost.
2005;31(4):381–92.
52. Li Z, Delaney MK, O’Brien KA, Du X. Signaling during platelet adhesion and activation.
Arterioscler Thromb Vasc Biol. 2010;30(12):2341–9.
53. Patrono C. Low-dose aspirin in primary prevention: Cardioprotection, chemoprevention, both,
or neither? Eur Heart J. 2013;34(44):3403–11.
81
Chapter 6. General discussion
The project investigated platelet activation and function in pre-diabetes following treatment with anti-
inflammatory and anti-thrombotic drugs. We further assessed the association of PMAs as a possible
link between the pro-thrombotic and pro-inflammatory condition reported in pre-diabetes. The effect of
low-dose aspirin and clopidogrel as monotherapy were compared to the dual therapy consisting of
metformin and low-dose aspirin. This was conducted to assess the levels of residual high on-treatment
platelet reactivity (HTPR), that contributes to residual platelet activation associated with adverse
cardiovascular disease (CVD) outcomes in type 2 diabetes mellitus (T2DM) (1, 2). Residual platelet
reactivity has been reported in obese individuals (3) whereas we report on the presence of HTPR using
a non-obese pre-diabetic mouse model.
6.1. Increased platelet activation in pre-diabetes
P-selectin is expressed on the membrane surface due to the degranulation of α-granules when platelets
are activated (4). It binds to P-selectin glycoprotein ligand-1 (PSGL-1) on the surface of monocyte and
neutrophils prompting a pro-inflammatory response thereby highlighting the role of platelets in the
inflammatory process (4, 5). Platelet-monocyte aggregates (PMAs) are more robust markers for platelet
activation and function which contribute to the increased thrombotic and pro-inflammatory
environment in T2DM (6–8). Our study demonstrated comparable levels of PMA formation in the pre-
diabetic condition in post-stimulation with adenosine diphosphate (ADP). This highlights an important
finding that in the pre-diabetic condition, platelets are already at their maximal activation state hence
can bind to monocytes and other leukocytes to form aggregates. Platelet binding also increases the pro-
coagulant activity of monocytes with increased expression of tissue factor (9). Platelets from the pre-
diabetes group are hyperreactive and exhibit high affinity to monocyte binding giving rise to PMAs
which are sensitive markers of in vivo platelet activation (10–12). An increase in the formation of PMAs
is also regarded as an early marker for T2DM that occurs independently of inflammation (13). Our
study was able to demonstrate the formation of PMA providing evidence of the interaction between
inflammatory and thrombotic mechanisms at the pre-diabetic stage.
6.2. Platelet function in pre-diabetes
Platelet activation is mediated by various signalling pathways activated through the interaction of
ligands and surface receptors which include, the purinergic receptor (P2Y12) (14), thromboxane A2
receptor (TP) (15, 16) and collagen receptor (GPVI) (17). The common activation pathways involve
receptor agonist binding on the platelet surface leading to the activation of phospholipase-Cγ (PLCγ),
phospholipase-Cβ (PLCβ), phosphoinositide-3 kinase (PI3K) and adenyl cyclase. Activation of these
receptors culminates in elevated calcium levels which play a role in shape change and secretion of
platelet granules. The pathophysiology of platelet hyperreactivity in pre-diabetes and T2DM is well
documented. Increase in platelet reactivity is attributed to glycation of the membrane proteins, increased
82
surface expression of P-selectin, increased intracellular calcium concentration, activation of protein
kinase C (PKC) and increased cellular adhesion molecules (18). Metabolic changes which include
impaired glucose metabolism contribute to increased platelet reactivity in T2DM (2, 19). In healthy
individuals, acute hyperglycaemia results in the increased expression of P-selectin and CD40-ligand as
well as activation of the PKC (2). Insulin deficiency, which was not exhibited by the pre-diabetic mice
in this study, enhances the platelet response to collagen and ADP agonist (19).
It is currently known that ADP is an endogenous agonist capable of reversible or irreversible platelet
activation at varying concentrations (20). In our study, in the pre-diabetic group, platelets were
hyperreactive to stimulation with ADP which resulted in dense and α granule release and consequently
increased expression of P-selectin from the α-granules on the platelet surface (21). In this manner,
stimulation of the P2Y12 receptor maintains and amplifies platelet activation, as well as stabilizes
platelet aggregates (22, 23). In addition, the P2Y12 receptor plays a role in ADP mediated thromboxane
A2 generation which in turn irreversibly activates the receptor itself (21). Cyclooxygenase plays a role
in the metabolization of arachidonic acid into short-lived prostaglandins which are later converted to
bioactive thromboxane A2, an activator of platelet aggregation (4, 24). In brief, cyclooxygenase
transforms arachidonic acid into prostaglandin H2 which is transformed into prostaglandins and
thromboxanes by synthases including cytosolic prostaglandin E synthase (cPGES), microsomal
prostaglandin E synthase-1 (mPGES-1), prostaglandin I synthase (PGIS) and thromboxane synthase
(TxS) (5). In our study, we demonstrated that stimulation of the cyclooxygenase pathway increased
platelet reactivity in the pre-diabetic condition. Thromboxane A2 is a potent vasoconstrictor and induces
platelet adhesion, shape change and aggregation which may contribute to vascular occlusion and the
development of cardiovascular disorders (4). In the pre-diabetes group, platelets were hyperreactive to
activation of the GPVI receptor post stimulation with collagen. Once collagen is bound to GPVI,
enzyme phospholipase Cγ (PLCγ) is activated, which hydrolyzes the lipid phosphatidylinositol-4,5-
bisphosphate (PIP2) into DAG and IP3 (6). As a result, intracellular calcium levels are increased leading
to shape change and granule secretion (7, 16). Increased PKC levels lead to the expression of the GP
IIb/IIIa complex and consequently platelet aggregation via the binding of fibrinogen to its co-receptor
(8). Increased fibrinogen binding, as well as expression of granule secreted P-selectin, have been
demonstrated in hyperglycaemia and in diabetic patients with CVD (8, 9).
6.3. High on-treatment platelet reactivity (HTPR) in pre-diabetes
We assessed whether the use of clopidogrel, a P2Y receptor antagonist that blocks the binding of ADP
(10), could inhibit residual platelet reactivity in pre-diabetes. Our study demonstrated the inhibition of
the P2Y12 receptor-mediated platelet activation in clopidogrel-treated pre-diabetic mice. We further
demonstrated the synergistic effect of metformin and low-dose aspirin dual therapy in inhibiting platelet
activation and function. The combination of metformin and low-dose aspirin reduced platelet reactivity
83
in response to ADP stimulation compared to low-dose aspirin monotherapy. Low-dose aspirin
monotherapy reduced platelet reactivity in pre-diabetic platelets stimulated with arachidonic acid
providing evidence of its COX inhibitory function. Similarly, the addition of metformin to low-dose
aspirin therapy also inhibited COX activation. Whereas in the clopidogrel-treated group, platelet
hyperreactivity to arachidonic acid was observed in the pre-diabetic group. The continued platelet
hyperreactivity despite clopidogrel treatment, illustrates that the calcium levels can still be elevated
even after inhibition of the GPVI receptor. Therefore, the COX pathway is still activated due to
increased calcium levels. Treatment with metformin and low-dose aspirin dual therapy reduces platelet
hyperreactivity post stimulation with collagen, which was not observed following low-dose aspirin
treatment. This may suggest the synergistic properties of dual therapy in pre-diabetes and a possible
GPVI downstream inhibitory effect of metformin.
Overall, the current study demonstrated increased platelet activation and function in pre-diabetes. We
further highlight the interaction between monocytes and activated platelets. In addition, we
demonstrated variable significant HTPR in the dual metformin and low-dose aspirin therapy, low-dose
aspirin and clopidogrel monotherapy indicating residual platelet activity. Our findings provide evidence
of interaction of pro-inflammatory and pro-coagulant mechanisms and the role of platelets in increasing
the risk of CVD in as early as the pre-diabetes stage. We also highlighted the pathways involved in
platelet activation in response to agonists, as well as the increased platelet hyperreactivity to
endogenous agonists in pre-diabetes. Importantly, we demonstrate a variant platelet inhibitory response
to anti-glycaemic and anti-platelet therapy. This further highlighted the variable inhibition of the PKC
and COX-1 mediated pathways by the anti-platelet therapy giving rise to persistent HTPR. This may
explain the occurrence of CVD in pre-diabetic and diabetic patients on either anti-glycaemic and anti-
platelet treatment (11–13). Further work is required to investigate the efficacy of the combination of
anti-platelet therapy and anti-inflammatory treatment regimens in a CVD model. Prospective work will
investigate other coagulation factors such as tissue factor involved in the progression of thrombotic
conditions in pre-diabetes. The targeting of the scavenger receptor sCD36 may provide important
therapeutic impact in reducing the hypercoagulable state in T2DM. Further molecular work targeted at
inhibiting or overexpression of PKC, including modulation of calcium homeostasis in pre-diabetes is
planned for future experiments.
6.4. References
1. Feher G, Feher A, Pusch G, Koltai K, Tibold A, Gasztonyi B, Papp E, Szapary L, Kesmarky
G, Toth K (2010) Clinical importance of aspirin and clopidogrel resistance. World J Cardiol
2:171–86 . doi: 10.4330/wjc.v2.i7.171
2. Kakouros N, Rade JJ, Kourliouros A, Resar JR (2011) Platelet function in patients with
diabetes mellitus: From a theoretical to a practical perspective. Int J Endocrinol 2011:1–14 .
84
doi: 10.1155/2011/742719
3. Badimon L, Hernández Vera R, Padró T, Vilahur G (2013) Antithrombotic therapy in obesity.
Thromb Haemost 110:681–688
4. Khan N, Farooq AD, Sadek B (2015) Investigation of cyclooxygenase and signaling pathways
involved in human platelet aggregation mediated by synergistic interaction of various agonists.
Drug Des Devel Ther 9:3497–3509 . doi: 10.2147/DDDT.S84335
5. Korbecki J, Baranowska-Bosiacka I, Gutowska I, Chlubek D (2014) Cyclooxygenase
pathways. Acta Biochim Pol 61:639–649
6. Xiang YZ, Xia Y, Gao XM, Shang HC, Kang LY, Zhang BL (2008) Platelet activation, and
antiplatelet targets and agents: Current and novel strategies. Drugs 68:1647–1664
7. Clemetson KJ (2012) Platelets and primary haemostasis. Thromb Res 129:220–224 . doi:
10.1016/j.thromres.2011.11.036
8. Sudic D, Razmara M, Forslund M, Ji Q, Hjemdahl P, Li N (2006) High glucose levels enhance
platelet activation: Involvement of multiple mechanisms. Br J Haematol 133:315–322 . doi:
10.1111/j.1365-2141.2006.06012.x
9. Soma P, Swanepoel AC, du Plooy JN, Mqoco T, Pretorius E (2016) Flow cytometric analysis
of platelets type 2 diabetes mellitus reveals ‘angry’ platelets. Cardiovasc Diabetol 15:1–7 . doi:
10.1186/s12933-016-0373-x
10. Diehl P, Olivier C, Haischeid C, Helbing T, Bode C, Moser M (2010) Clopidogrel affects
leukocyte dependent platelet aggregation by P2Y 12 expressing leukocytes. Basic Res Cardiol
105:379–387 . doi: 10.1007/s00395-009-0073-8
11. Boussageon R, Supper I, Bejan-Angoulvant T, Kellou N, Cucherat M, Boissel JP, Kassai B,
Moreau A, Gueyffier F, Cornu C (2012) Reappraisal of metformin efficacy in the treatment of
type 2 diabetes: A meta-analysis of randomised controlled trials. PLoS Med 9: . doi:
10.1371/journal.pmed.1001204
12. Hall HM, Banerjee S, McGuire DK (2011) Variability of clopidogrel response in patients with
type 2 diabetes mellitus. Diabetes Vasc Dis Res 8:245–253 . doi: 10.1177/1479164111420890
13. Lorber D (2014) Importance of cardiovascular disease risk management in patients with type 2
diabetes mellitus. Diabetes, Metab Syndr Obes Targets Ther 7:169–183 . doi:
10.2147/DMSO.S61438
14. Burnstock G, Novak I (2013) Purinergic signalling and diabetes. Purinergic Signal 9:307–324
85
15. Jurk K, Kehrel BE (2005) Platelets: Physiology and biochemistry. Semin Thromb Hemost
31:381–392 . doi: 10.1055/s-2005-916671
16. Ghoshal K, Bhattacharyya M (2014) Overview of platelet physiology: Its hemostatic and
nonhemostatic role in disease pathogenesis. Sci World J 2014: . doi: 10.1155/2014/781857
17. Furihata K, Nugent DJ, Kunicki TJ (2002) Influence of platelet collagen receptor
polymorphisms on risk for arterial thrombosis. Arch Pathol Lab Med 126:305–309 . doi:
10.1043/0003-9985(2002)126<0305:iopcrp>2.0.co;2
18. Hess K, Grant PJ (2011) Inflammation and thrombosis in diabetes. Thromb Haemost 105:43–
54 . doi: 10.1160/THS10-11-0739
19. Schneider DJ (2009) Factors Contributing to Increased Platelet Reactivity in People With
Diabetes. Diabetes Care 32:525–527 . doi: 10.2337/dc08-1865
20. Cattaneo M (2011) The platelet P2Y12 receptor for adenosine diphosphate: congenital and
drug-induced defects. Syst Rev 4:2102–2112
21. Dorsam RT, Kunapuli SP (2004) Central role of the P2Y 12 receptor in platelet activation. J
Clin Invest 113:10–15 . doi: 10.1172/JCI200420986.The
22. Damman P, Woudstra P, Kuijt WJ, De Winter RJ, James SK (2012) P2Y12 platelet inhibition
in clinical practice. J Thromb Thrombolysis 33:143–153
23. Nicholas RA (2015) Insights into platelet P2Y 12 receptor activation. 125:893–896
24. Grove EL (2012) Antiplatelet effect of aspirin in patients with coronary artery disease. Dan
Med J 59:B4506