Embed Size (px)
Citation preview

Evaluating Hurricane Intensity Prediction Techniques in Real Time
Vladimir Jovanovic, Margaret H. Dunham, Michael Hahsler, Yu Su
Department of Computer Science and Engineering
Southern Methodist University
Dallas, TX, USA
e-mail: {vjovanovic,mhd,mhahsler,ysu}@lyle.smu.edu
Abstract— While the accuracy of hurricane track prediction
has been improving, predicting intensity, the maximum
sustained wind speed, is still a very difficult challenge. This
is problematic because the destructive power of a hurricane
is directly related to its intensity. In this paper, we present
Prediction Intensity Interval model for Hurricanes (PIIH)
which combines sophisticated data mining techniques to
create an online real time model for accurate intensity
predictions and we present a web-based framework to
dynamically compare PIIH to operational models used by
the National Hurricane Center (NHC). The created
dynamic website tracks, compares, and provides
visualization to facilitate immediate comparisons of
prediction techniques. This paper is a work in progress
paper reporting on both, new features of the PIIH model
and online visualization of the accuracy of that model as
compared to other techniques.
Keywords- Hurricane, intensity prediction, Prediction
Interval, Markov chain
I. INTRODUCTION
Hurricanes are tropical cyclones with sustained wind speed of at least 64 kt (119 km/h, 74 mph), and, on average, more than five tropical cyclones become hurricanes in the Atlantic basin causing large economic and human losses [1]. To reduce potential losses, several models have been introduced to predict the track and intensity of hurricanes. Track prediction models are more accurate than intensity prediction models due to a better understanding of the atmosphere and its role in hurricane formation [2]. On top of this, the average intensity forecast error is 15 mph per day, which can lead to considerable error rates for predictions over four to five days [3]. Thus, it is important to improve hurricane readiness and reduce the risk to property and human life by building intensity models that can better predict the wind speed of hurricanes prior to landfall.
In addition to improving accuracy of intensity prediction, it is desirable to provide a real time method to compare ongoing accuracies of different techniques. This real time comparison can be used to improve the overall prediction and evaluation of different techniques.
This paper describes novel features of the Prediction Intensity Interval model for Hurricanes (PIIH), a method for hurricane intensity prediction introduced in [5]. The most notable improvement to the model is the estimation
of confidence intervals around the prediction. In addition we present the current implementation of an easy-to-use web-based framework that allows immediate, dynamic, real time accuracy comparisons by using the average errors for the predictions of each hurricane against all the current models available from NOAA’s Automated Tropical Cyclone Forecast (ATCF) system. The framework is currently used for hurricanes in the Atlantic basis for the, at the time of writing this paper, ongoing 2011 hurricane season
The paper is organized as follows. The next section provides a quick summary of some important hurricane intensity prediction models currently used by the National Hurricane Center (NHC). Section 3 provides a brief overview of our new data mining model PIIH with a focus on the new prediction confidence intervals. Section 4 describes our ongoing work, the current online implementation of PIIH and illustrates the approach with an example. Section 5 is a comparison of PIIH against the leading models used by NHC for the 2011 hurricane season. We conclude the paper with Section 6.
II. RELATED WORK
The current number of models used for hurricane intensity predictions is less than the overall number of models developed for track prediction or for both track and intensity prediction [4]. There have been several intensity prediction techniques proposed. Since we are interested in real-time prediction, our initial comparison looks at four intensity models that create a prediction within a forecast cycle (so called “early models”) [4]. These models are: SHIFOR5 (ATCF ID: SHF5), Decay-SHIFOR5 (ATCF ID: DSF5), Statistical Hurricane Intensity Prediction Scheme (SHIPS, ATCF ID: SHIP), SHIPS with inland decay (ATCF ID: DSHP), and Logistic Growth Equation Model (ATCF ID: LGEM).
SHIFOR5 [4] uses a statistical approach to predict intensity by combining “climatology and persistence predictors.” According to the NHC, this model has been replaced by Decay-SHIFOR5 [4] which uses decay models to help predict the decay of tropical cyclones when they move inland. It is the official NHC intensity forecast. SHIPS uses a multiple linear regression with a variety of features to describe hurricanes, including temperature of the ocean, and vertical wind shear. This model is updated every year by the cyclone data of the year before. Decay-

SHIPS [4] is akin to Decay-SHIFOR5 in the sense that decay factors are put into the model to better predict the interplay between the hurricanes and land (as land usually weakens hurricanes). Finally, Logistic Growth Equation Model [4] has the same input as SHIPS, but it does not use multiple regression for the prediction. Instead, the course of the changes in intensity is modeled with logistic growth that depends on sea surface temperature and other parameters. Its emphasis on environmental factors throughout the course of the storm and averaging methods allow it to better predict intensity when a hurricane goes from water to land and back to water compared to the SHIPS model.
III. PIIH
The new approach, PIIH (Prediction Intensity Interval model for Hurricanes), is based on our previous work [5] with several significant extensions. It dynamically models hurricane life cycle behavior and applies this model to predict storm intensities up to 5 days in advance. What is completely new with this approach is the fact that it also provides potential ranges (high to low) of maximum wind speed prediction with an indication of how likely wind speeds in different ranges are expected to occur. The two major benefits of PIIH are:
1. PIIH is the only model that is able to directly
estimate prediction intervals for given confidence
levels by estimating localized intensity
distributions.
2. PIIH uses advanced machine learning to discover
similar states in storms and then links these states
together into a life cycle model. Thus by
capturing what behavior similar hurricanes had in
the past, PIIH predicts the behavior of a new
hurricane. This process is completely automatic,
is performed in real time, and results in more
specific and thus, in many cases, more accurate
predictions compared to "global" statistical
approaches.
PIIH is divided into learning and prediction phases as illustrated in Fig. 1. Learning takes place from historical information about storms. Each storm is represented as a sequence of feature vectors. Feature vector values represent the measured (or estimated) true feature values at a point in time. For our current model, we use 23 of the predictors in SHIPS 2009 [6]. Some attributes include VMAX which is the current maximum wind intensity, and POT which is the difference in maximum possible intensity.
To be comparable to existing models, we assume the same fixed time delta of 12 hours between the input feature vectors; however, PIIH can work with any time delta (e.g., the 6 hour intervals used currently by NOAA for recording features). Using this sequence of feature vectors for all hurricanes as input, the PIIH learning phase clusters similar feature vectors across all hurricanes into states and identifies transitions between these states based
on the ordering of the input feature vectors. The resulting Markov chain then can be viewed as a signature of previous storm behavior. Clustering vectors into states in the Markov chain not only serves to reduce the size of the resulting model, but also captures the similarity among feature vectors across and within storms. The learning phase of PIIH is based on algorithms used in the EMM technique [7].
Future feature values for a target storm are predicted based on the current feature vector representing the target storm (see Fig. 1(b)). The state in the model closest to the feature vector is found and considered the current state of the storm. Future states are identified based on transitions emanating from this current state. Prediction for feature values (including intensity) that are n time steps away are identified by looking at all paths of length n emanating from the current state. The learned transition probabilities are used to calculate probabilities associated with each path. These various paths are also used to fit a lognormal distribution to the expected intensities which is the basis for creating the prediction intervals. All of these PIIH functions are discussed in much more detail in the literature ([5], [6]). Note that PIIH currently does not include decay over land like DSHIPS. This will be a future extension.
Figure 1. Two Parts to PIIH Approach
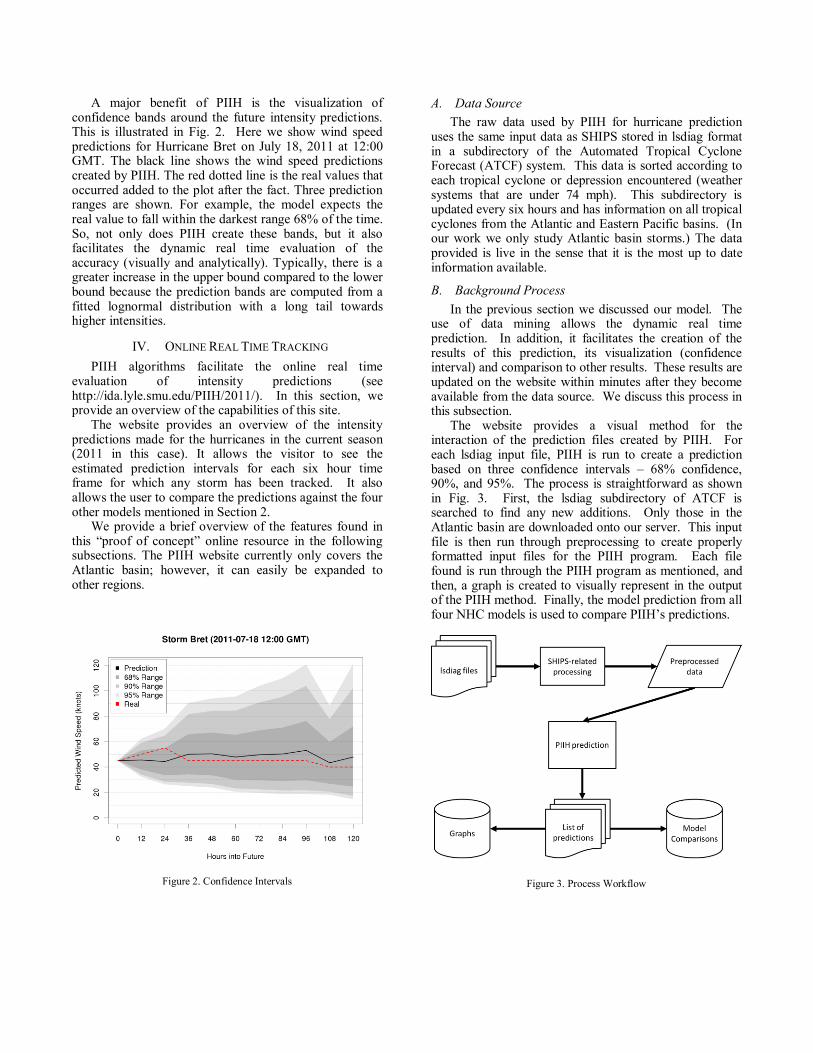
A major benefit of PIIH is the visualization of confidence bands around the future intensity predictions. This is illustrated in Fig. 2. Here we show wind speed predictions for Hurricane Bret on July 18, 2011 at 12:00 GMT. The black line shows the wind speed predictions created by PIIH. The red dotted line is the real values that occurred added to the plot after the fact. Three prediction ranges are shown. For example, the model expects the real value to fall within the darkest range 68% of the time. So, not only does PIIH create these bands, but it also facilitates the dynamic real time evaluation of the accuracy (visually and analytically). Typically, there is a greater increase in the upper bound compared to the lower bound because the prediction bands are computed from a fitted lognormal distribution with a long tail towards higher intensities.
IV. ONLINE REAL TIME TRACKING
PIIH algorithms facilitate the online real time evaluation of intensity predictions (see http://ida.lyle.smu.edu/PIIH/2011/). In this section, we provide an overview of the capabilities of this site.
The website provides an overview of the intensity predictions made for the hurricanes in the current season (2011 in this case). It allows the visitor to see the estimated prediction intervals for each six hour time frame for which any storm has been tracked. It also allows the user to compare the predictions against the four other models mentioned in Section 2.
We provide a brief overview of the features found in this “proof of concept” online resource in the following subsections. The PIIH website currently only covers the Atlantic basin; however, it can easily be expanded to other regions.
A. Data Source
The raw data used by PIIH for hurricane prediction uses the same input data as SHIPS stored in lsdiag format in a subdirectory of the Automated Tropical Cyclone Forecast (ATCF) system. This data is sorted according to each tropical cyclone or depression encountered (weather systems that are under 74 mph). This subdirectory is updated every six hours and has information on all tropical cyclones from the Atlantic and Eastern Pacific basins. (In our work we only study Atlantic basin storms.) The data provided is live in the sense that it is the most up to date information available.
B. Background Process
In the previous section we discussed our model. The use of data mining allows the dynamic real time prediction. In addition, it facilitates the creation of the results of this prediction, its visualization (confidence interval) and comparison to other results. These results are updated on the website within minutes after they become available from the data source. We discuss this process in this subsection.
The website provides a visual method for the interaction of the prediction files created by PIIH. For each lsdiag input file, PIIH is run to create a prediction based on three confidence intervals – 68% confidence, 90%, and 95%. The process is straightforward as shown in Fig. 3. First, the lsdiag subdirectory of ATCF is searched to find any new additions. Only those in the Atlantic basin are downloaded onto our server. This input file is then run through preprocessing to create properly formatted input files for the PIIH program. Each file found is run through the PIIH program as mentioned, and then, a graph is created to visually represent in the output of the PIIH method. Finally, the model prediction from all four NHC models is used to compare PIIH’s predictions.
Figure 2. Confidence Intervals
Figure 3. Process Workflow

C. Website
The website is completely dynamic, implemented using PHP. The first part of the website is the main page. A screen shot of the main page of the website is shown in Fig. 4. As can be seen in the image, the first thing that is posted is an image courtesy of the NHC, showing the locations of any current hurricanes. Below that is the list of the named hurricanes of the current hurricane season. As of October 15th, there were 16 named hurricanes in 2011 with Philippe being the last one active. The visitor has the option of seeing the prediction intervals, a comparison of PIIH against current models in use for this hurricane, or NOAA’s advisories and graphics for the hurricane. Based on the dynamic nature of the site, this page and all pages are updated in real time with no human intervention.
Detailed information about a particular storm is also shown and updated dynamically as seen in the screen shot in Fig. 5. This page displays a graph for every ACTF entry made for which the hurricane has existed. The graph displays the prediction bands for the hurricane made at the particular timestamp. When a new entry is found for the corresponding hurricane, a new graph is appended to the current list and each graph is updated to represent the change in “Real” data. “Real” refers to the actual wind speed of the hurricane at that time. As every six hours passes, the graphs are all updated with a new real value, thus slowly extending further across the x-axis. The visitor also has the option to download the predictions made by PIIH in ATCF format by clicking on the download entry link.
Figure 4. Screen shot of PIIH Main Page
Figure 5. Prediction for an individual storm
The third major page shows the comparison of different prediction models. A screen shot of this page is shown in Fig. 6. This page displays the average errors for each model for a given ATCF entry. Using the real data of later entries, the errors can be calculated for every entry, and, as is shown by the second table, across each time period. On this page, the average errors table represents the average error for each model across every point of comparison (each entry at each interval prediction).
Comparison of different predictions is performed using the following two standard error estimates:
Mean Absolute Deviation (MAD) calculates the mean of the absolute value of the differences between the prediction of the intensity and its actual value.
1
Mean Squared Error (MSE) calculates the mean of the squares of errors for intensity prediction which puts more weight on larger errors.
The average error by forecast period is calculated by taking the average error of the real wind speed compared to the predicted wind speed for each entry at the same prediction interval. For example, if there are two entries six hours apart, the predicted versus real wind speeds twelve hours into the future for both entries are taken for the average error.
The last part of the comparison page is a graph and average error chart for each entry. For any given entry, each model will make ten predictions into the future spread apart by 12 hours for a total of 120 hours (5 days). The real data is plotted along with the predictions to show the difference between the prediction and real data for every model. Finally, all of the errors are averaged and presented in a table to the right of the graph. As
1 As stated by James Franklin of NOAA in a personal communication,
this actual value is really an “operational assessment of what happened,
but that the post-analysis best track will be different.” In other words
the real value we use is the current best guess and may change when
NOAA does a further detailed examination of all data for storms.

mentioned on the individual hurricane pages, the real data is updated every time a new entry is made for the hurricane.
D. Example: Hurricane Irene
Hurricane Irene was one of the most talked about hurricanes of the 2011 hurricane season. To show how PIIH performs compared to the other models, Hurricane Irene will be used as an example to demonstrate website functionality and model competitiveness.
The first entry for hurricane Irene in its dedicated webpage was made at 18:00 GMT on August, 20th. Fig. 5 shows the screen shot for this page. The hurricane lasted for nine days, so the 120 hours that were predicted in the first graph were all compared to real intensity data. (Hence the dotted red line in the graph). The list of graphs for the entries is in ascending order, so, to see the last prediction, one must simply scroll to the bottom of the page Once this page is seen, the visitor can simply hit the back button or click the link at the bottom of the page, and then the visitor can inspect the Model Accuracy page for the storm.
A screen shot of the model accuracy page is shown in Fig. 6. Here one can compare the average errors and see which model had the lowest average error in both MAD and MSE. The visitor can then look at the next table and compare forecast periods (as mentioned in the previous section) to see how the different models compare. The visitor can scroll down to see how the models compare at one particular point in time. This is shown in Fig. 7. Looking at the 18:00 of August 20th, the visitor sees that SHF5 predicts the real intensity more accurately compared to the other models. Of course from that, the visitor can see why SHF5 would have the lowest average error for that particular entry by looking at the table to the right of the graph.
V. MODEL COMPARISONS
A. Hurricane Irene
As mentioned in the previous section, Hurricane Irene will be used to compare model performances. In Fig. 6, it is apparent that in the average errors table that, for this hurricane, SHF5 had the lowest average error out of the five models compared, while PIIH had the second lowest average error. Looking at the forecast periods, one can see how PIIH performed with predictions at each time interval. PIIH had the lowest MAD error predicting 12 hours in the future, with steadily growing average error that peaks at 72 hours into the future only to decrease in error by the end of the 120 hour prediction window. SHIP follows the same pattern of peaking in MAD, while SHF5 peaks at the 84 hour forecast period. DSHP and LGEM peak at the 96 and 108 hour forecast period, respectively. As far as MSE rates go, LGEM had a peak at the 84 interval. The remaining models had the same peaks.
Due to the fact that MSE puts a greater emphasis on larger errors, it can be inferred that DSHP, by having the highest MSE from the 60 hour forecast period and on, had
difficulty accurately predicting the hurricane intensity past 2.5 days compared to the other models.
Hurricane Irene made landfall on mainland United States at approximately 9:00 PM GMT on August 26, 2011. The hurricane affected the Carolinas first before going up along the cost, with the data collection stopping once the center of the hurricane reached Canada, northwest of Maine [8]. By looking at the individual forecast error comparisons, it can be seen that during the period right before landfall and the hurricane’s movement up along the Eastern seaboard, three models alternated between having the lowest MAD and MSE: PIIH, LGEM, and DSHP. PIIH, when not having the lowest average error, was usually ranked in third place for lowest error. Finally, PIIH had the lowest average error the hours before and right after the center of the hurricane made landfall.
B. All Hurricanes
The Model Accuracy page for all hurricanes is the final feature of the website not explicitly discussed. The link to this is at the bottom of the main page. This page keeps track of all of the hurricane predictions and creates two tables: a running average for both MAD and MSE on all models and a running average by forecast period on all models.
The MSE and MAD for all model errors ranks PIIH as having the fourth lowest average error. PIIH might be competitive with the other models, but, in this particular season, it is difficult to differentiate on these results alone.
When looking at the model differences of MSE and MAD by forecast period, it is clear that PIIH, like SHF5 and SHIP, peak in average error at the 72 and 84 hr forecast period, while LGEM and DSHP continue to increase in error the larger the forecast period (Fig. 8 & 9). This is a good indicator that PIIH, while able to predict relatively accurately in the near future and distant future (first, second and firth day), needs improvement for the third and fourth day.
Figure 6. Model Accuracy page
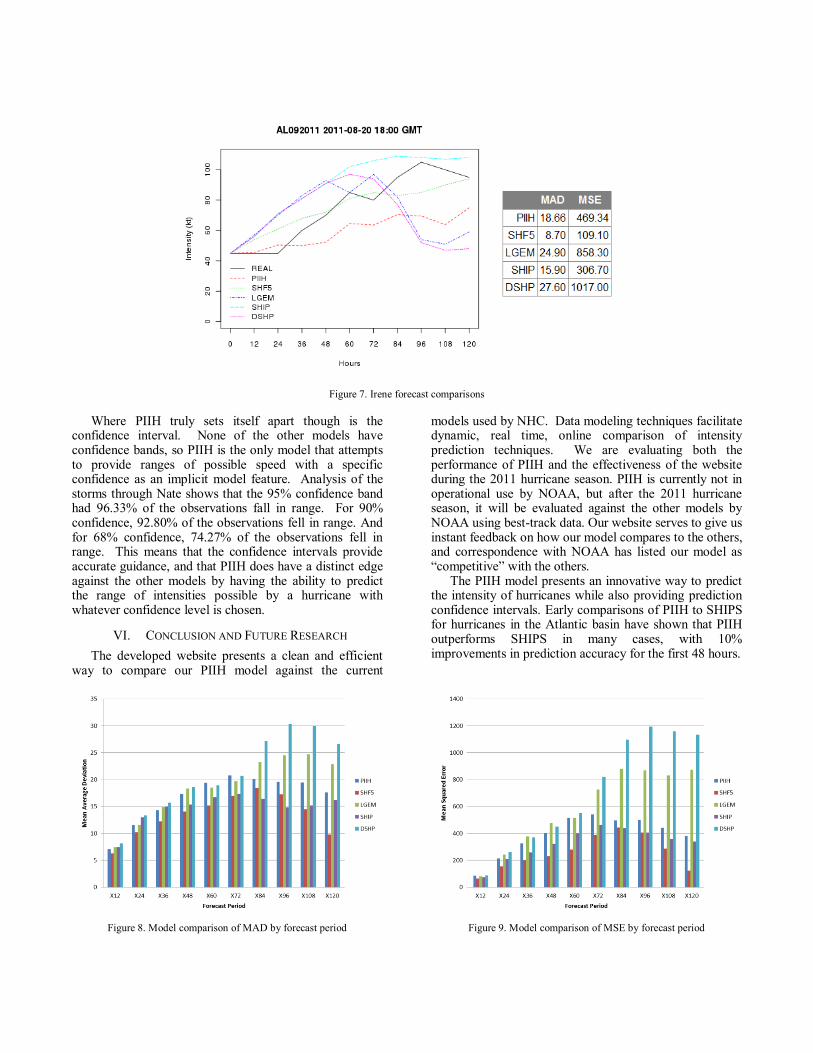
Figure 7. Irene forecast comparisons
Where PIIH truly sets itself apart though is the confidence interval. None of the other models have confidence bands, so PIIH is the only model that attempts to provide ranges of possible speed with a specific confidence as an implicit model feature. Analysis of the storms through Nate shows that the 95% confidence band had 96.33% of the observations fall in range. For 90% confidence, 92.80% of the observations fell in range. And for 68% confidence, 74.27% of the observations fell in range. This means that the confidence intervals provide accurate guidance, and that PIIH does have a distinct edge against the other models by having the ability to predict the range of intensities possible by a hurricane with whatever confidence level is chosen.
VI. CONCLUSION AND FUTURE RESEARCH
The developed website presents a clean and efficient way to compare our PIIH model against the current
models used by NHC. Data modeling techniques facilitate dynamic, real time, online comparison of intensity prediction techniques. We are evaluating both the performance of PIIH and the effectiveness of the website during the 2011 hurricane season. PIIH is currently not in operational use by NOAA, but after the 2011 hurricane season, it will be evaluated against the other models by NOAA using best-track data. Our website serves to give us instant feedback on how our model compares to the others, and correspondence with NOAA has listed our model as “competitive” with the others.
The PIIH model presents an innovative way to predict the intensity of hurricanes while also providing prediction confidence intervals. Early comparisons of PIIH to SHIPS for hurricanes in the Atlantic basin have shown that PIIH outperforms SHIPS in many cases, with 10% improvements in prediction accuracy for the first 48 hours.
Figure 8. Model comparison of MAD by forecast period
Figure 9. Model comparison of MSE by forecast period

Future work will primarily revolve around improving prediction accuracy for PIIH, especially when it comes to decay over land and to long term predictions as can be seen by some of the average errors by forecast periods.
ACKNOWLEDGMENT
We would like to thank Sudheer Chelluboina, James Franklin (Branch Chief, Hurricane Specialist Unit, NHC, NOAA) and Dr. Mark DeMaria (NESDIS Regional and Mesoscale Meteorology Branch, CIRA) for their help.
This work was supported in part by the U.S. National Science Foundation under Grant No. IIS-0948893.
REFERENCES
[1] NOAA, “Hurricanes… Unleashing Nature’s Fury: A Preparedness Guide,” National Oceanic and Atmospheric Administration, National Weather Service, August 2001, http://www.nws.noaa.gov/om/brochures/hurr.pdf .
[2] M. DeMaria, M. Mainelli, L.K. Shay, J.A. Knaff, and J. Kaplan, “Further Improvements to the Statistical Hurricane Intensity Prediction Scheme (SHIPS),” Weather and Forecasting, Vol. 20, pp 531-543, 2005.
[3] J. Kaplan and M. DeMaria, “A Simple Empirical Model for Predicting the Decay of Tropical Cyclone Winds after Landfall,” Application of Meteorology, Vol. 34, pp 2499-2512, 1995.
[4] NOAA, “Technical Summary of the National Hurricane Center Track and Intensity Models,” July 2009, http://www.nhc.noaa.gov/pdf/model_summary_20090724.pdf .
[5] Y. Su, S. Chelluboina, M. Hahsler, M. H. Dunham, “A New Data Mining Model for Hurricane Intensity Prediction,” Second IEEE ICDM Workshop on Knowledge Discovery from Climate Data: Prediction, Extremes, and Impacts, Proceedings of the 2010 IEEE International Conference on Data Mining Workshops, pp 98-105.
[6] Y. Su, M. Hahsler, M. H. Dunham, “Learning a Prediction Interval Model for Hurricane Intensities,” to be submitted.
[7] Jie Huang, Yu Meng, and Margaret H. Dunham, “Extensible Markov Model,” Proceedings IEEE ICDM Conference, November 2004, pp 371-374.
[8] “Surface Wind Field of Hurricane Irene” Internet: http://www.nhc.noaa.gov/archive/2011/graphics/al09/loop_R.shtml, Aug. 29, 2011[Oct. 12, 2011]


![Hindcast and validation of Hurricane Ike (2008) waves ... · 1] Hurricane Ike (2008) made landfall near Galveston, Texas, as a moderate intensity storm. Its large wind field in conjunction](https://img.pdfslide.us/doc/110x75/5f0522f87e708231d411735c/hindcast-and-validation-of-hurricane-ike-2008-waves-1-hurricane-ike-2008.jpg)