Embed Size (px)
Citation preview
BRIEF REPORT
Evaluating everyday explanations
Jeffrey C. Zemla1 & Steven Sloman1& Christos Bechlivanidis2 & David A. Lagnado2
# Psychonomic Society, Inc. 2017
Abstract People frequently rely on explanations provided byothers to understand complex phenomena. A fair amount ofattention has been devoted to the study of scientific explana-tion, and less on understanding how people evaluate natu-ralistic, everyday explanations. Using a corpus of diverseexplanations from Reddit’s BExplain Like I’m Five^ andother online sources, we assessed how well a variety ofexplanatory criteria predict judgments of explanationquality. We find that while some criteria previously iden-tified as explanatory virtues do predict explanation qualityin naturalistic settings, other criteria, such as simplicity,do not. Notably, we find that people have a preference forcomplex explanations that invoke more causal mecha-nisms to explain an effect. We propose that this preferencefor complexity is driven by a desire to identify enoughcauses to make the effect seem inevitable.
Keywords Causal reasoning . Knowledge . Explanation
People are explanatory creatures. We often seek to generateexplanations based on our own knowledge of how the worldworks. However, our ability to generate complete explana-tions on our own is frequently inadequate. We may not haveall of the evidence or the expertise to be able to form accurate
models of complex phenomena. So we use the knowledge ofexperts, friends, and communities to piece together explana-tions. Our beliefs about science are not limited to intuitivepreconceptions, but are also derived from scientists who in-form us of how things work. Our beliefs about the economyare affected not only by our own experiences, but also by whateconomists and politicians tell us about large-scale financialsystems. We rely on the explanations of others to form ourown beliefs. How, then, do we evaluate the explanations ofothers?
Explanatory criteria
A common view has emerged that the quality or value of anexplanation can be determined by how well it satisfies a set ofcriteria known as explanatory virtues (Lipton, 2004; Thagard,1978; Harman, 1965; Mackonis, 2013; Glymour, 2014;Lombrozo, 2011). However, there is disagreement about whatcounts as an explanatory virtue, how these virtues are definedand measured, and how they are weighted when we evaluatean explanation. Two commonly proposed virtues are simplic-ity and coherence. For example, a good explanation should besimple, requiring the fewest number of causes to explain aphenomenon (e.g., Lombrozo, 2007). A good explanationshould also be coherent; it should be compatible with ourexisting beliefs, and consistent with the evidence and withitself (e.g., Thagard, 1989).
We may also evaluate an explanation using other criteria,such as the credibility of the explainer, or how well the expla-nation is articulated, that do not reflect the intrinsic value of anexplanation. These criteria are useful in satisfying goals be-yond identifying the information inherent to an explanation(Patterson, Operskalski, & Barbey, 2015). For instance, awell-articulated explanation can be useful for pedagogical
Electronic supplementary material The online version of this article(doi:10.3758/s13423-017-1258-z) contains supplementary material,which is available to authorized users.
* Jeffrey C. [email protected]
1 Department of Cognitive, Linguistic, and Psychological Sciences,Brown University, Providence, RI 02912, USA
2 University College London, London, UK
Psychon Bull RevDOI 10.3758/s13423-017-1258-z
reasons. The perceived credibility of an explainer may affectwhether or not one believes the explanation, regardless of itsintrinsic merit. While these criteria do not affect the inherentquality of an explanation, they may still serve important prag-matic functions and can be useful indicators of explanationquality.
Everyday explanations
Philosophers have examined features central to scientific ex-planation that may improve our understanding. Does an ex-planation need to appeal to general laws (Hempel, 1965)?Should an explanation aim to unify the widest range of phe-nomena (Kitcher, 1989)? A common method in philosophicalinquiry is to analyze existing scientific explanations: whattypes of explanations do scientists provide, and what makesthem good or bad explanations?
However, many of the criteria used for evaluating explana-tions in a scientific context may differ from the criteria that areimportant for explaining everyday events. Explanations innon-scientific domains may require a different set of explan-atory criteria because they are structured differently. For ex-ample, historical explanations are more likely to appeal to anarrative, and less likely to invoke general laws (Dray, 2000).
Although some philosophical theories suggest that abstractexplanations are desirable (e.g., Strevens, 2007), people some-times prefer explanations that are more concrete(Bechlivanidis, Lagnado, Zemla, & Sloman, 2017) and lessgeneralizable (Khemlani, Sussman, & Oppenheimer, 2011).Despite philosophical claims that explanations should be sim-ple (e.g., Thagard, 1978), people tend to explain inconsis-tencies by positing additional causes rather than disputing apremise, resulting in a more complex causal structure(Khemlani & Johnson-Laird, 2011; Johnson-Laird, Girotto,& Legrenzi, 2004). Non-scientific explanations may alsoserve different explanatory goals. For instance, Newtonianmechanics is a source of good explanations for pedagogicaland most practical purposes, even though Einstein’s relativis-tic mechanics provides a more faithful explanation of how theworld works.
In contrast to the philosophical literature on explanations,psychologists have tended to study short and simple explana-tions (e.g., Kelemen & Rosset, 2009; Weisberg, Keil,Goodstein, Rawson, & Gray, 2008; Cimpian & Salomon,2014). These explanations have minimal causal structure, of-ten only a single causal relation. Some experiments of thistype rely on causal inference (e.g., Lombrozo, 2007;Khemlani et al., 2011); they ask participants to identify thecause or causes that best explain the observed effects, oftenholding constant the probability of an effect given its cause.We intend to test whether results obtained with these para-digms also apply to explanations that are more naturalistic.
Explanations that do consist of multiple causal relationsrequire people to consider additional criteria, such as whetherthere are gaps in the causal structure (Keil, 2006). For exam-ple, it is undoubtedly true that leaves change color in autumnbecause chlorophyll in the leaves breaks down. However, thisexplanation omits parts of the causal model, such as whychlorophyll causes leaves to be green, and what causeschlorophyll to break down. People may be sensitive to thisomission, leading them to evaluate the explanation negativelyeven if they agree on the primary cause.
In more natural settings, we sometimes construct complexcausal explanations in order to explain many pieces of evi-dence. Pennington and Hastie (1986, 1988) found that peopleexplain complex events by constructing stories around theevidence, and that these stories can differ depending on theorder that evidence is presented. These stories can be evaluat-ed by how well they cohere with the available evidence(Byrne, 1995) using a set of coherence principles (Thagard,1989). It is generally taken for granted that these principles aredesirable, and subsequent work has provided some empiricalsupport for these principles (Read & Marcus-Newhall, 1993;Schank & Ranney, 1992).
We should also consider how an explanation fits with ourbroader knowledge of the world. When evaluating a singleexplanation, we should consider possible alternative explana-tions (Fernbach, Darlow, & Sloman, 2010) and counterfac-tuals (Woodward & Hitchcock, 2003). When explanationsprovide evidence in support of a causal mechanism (Sloman,2005), that evidence should be evaluated independently todetermine whether it is credible and relevant (Kuhn, 1991).
Real-world explanations are typically more nuanced thanexperimental stimuli, and thus provide a more ecologicallyvalid way of understanding the explanatory criteria peopleuse to evaluate explanations. Experimental stimuli used to testexplanatory criteria are often focused on a narrow subset ofexplanation types—for instance, explanations that explain to-ken events or explanations that explain classes of events(types), but not both. Though many explanatory criteria havebeen established for evaluating scientific explanations, we testwhether those same criteria are seen as virtues in everydaycontexts. In addition, evaluating explanations can require usto engage in a number of processes simultaneously, includingdialectical reasoning (resolving inconsistencies), probabilisticreasoning (finding the most likely causes, or the causes thatmake the effect most likely), and didactic methods (educatingthe reader). We observe whether previously touted explanato-ry virtues endure in the face of these multiple goals.
Experiment 1
To investigate how people evaluate everyday explanations, wecompiled a small corpus of explanations that were generated
Psychon Bull Rev
in a non-scientific and non-experimental context. Specifically,we gathered explanations from Reddit’s Explain Like I’m Five(ELI5; www.reddit.com/r/explainlikeimfive), an Internetcommunity that receives roughly 7 million unique visitorsper month. The explanations in our corpus were rated byparticipants on a host of explanatory criteria that have beenproposed in prior literature.
Method
Participants
Two hundred and forty participants located in the UnitedStates were recruited using Amazon’s Mechanical Turk(Paolacci, Chandler, & Ipeirotis, 2010). Five participants wereremoved from the data set prior to analyses for failing anattention check question1 (Oppenheimer, Meyvis, &Davidenko, 2009). Of the remaining 235 participants, 131were male and 104 were female, aged 18–69 years (medianage of 34 years).
Materials
Eight explananda2 (see Table 1) were selected from ELI5 withthree explanations for each, for a total of 24 explanations. Theexplananda were selected to fit into one of four categories:historical, public health, legal, and social policy. These cate-gories were chosen to contrast with scientific explanation, andalso reflect topics of interest to the general public. By selectingexplanations from several categories, we sought to identifywhether explanatory criteria are domain-general rather thanapply only in certain domains. The explanations also variedin style, including a mixture of token and type explanations, aswell as teleological and mechanistic explanations.We selectedexplananda from ELI5 that had a high level of engagement(i.e., many unique explanations and many Bvotes^ from thesite’s users). For each explanandum, we chose three differentexplanations that proposed distinct mechanisms or offereddifferent evidence in support of a given mechanism. In addi-tion, the specific explanations were chosen because they var-ied prima facie on several explanatory criteria, such as appealsto expertise and evidence, complexity, and generality. An ex-ample explanation is shown in Table 2, and all of the expla-nations are provided in the Supplementary Material.
Procedure
Each participant was shown one explanandum with one cor-responding explanation. After reading the explanation in full,participants assessed the quality of the explanation by ratingwhether the text constitutes a Bgood explanation.^Afterwards,participants rated the remainder of the attributes (see Table 3)in a randomized order. To prevent participants from referringto their previous ratings, each attribute was rated on its ownpage, with two exceptions. Generality was rated on the same
1 Participants were shown a Likert scale with the prompt: BTo ensure you arefollowing instructions, please leave this question blank and hit next.^2 Explanandum (pl. explananda) refers to the Bthing being explained,^ or thesubject of inquiry.
Table 1 Explananda used in Experiment 1
Explananda
•Whyhas the price of higher education skyrocketed in theUS, andwho isprofiting from it?
•Why don't opponents of illegal immigration go after the employers whohire illegal immigrants?
•How can Malt-O-Meal blatantly rip off every brand-name cereal whileApple and Samsung have been in legal issues since the beginning oftime?
•Why do the FBI and CIA use polygraph ("lie detector") tests on theiremployees, if polygraph tests are considered pseudoscience and sounreliable that US courts don't allow them as evidence?
• If Ebola is so difficult to transmit (direct contact with bodily fluids), howdo trained medical professionals with modern safety equipmentcontract the disease?
•Why are so many people up in arms over Byou have to have healthinsurance^ initiatives, but are okay with mandated car insurance?
•Why is Ronald Reagan held to be one of the best US presidents, evenamong scandals like Iran-Contra that would have destroyed thereputation of other presidents?
•Howhas Switzerlandmanaged to stay in a neutral position during timesof conflict like WWII?
Table 2 An example explanation used in Experiment 1 to explain BIfEbola is so difficult to transmit (direct contact with bodily fluids), how dotrained medical professionals with modern safety equipment contract thedisease?
I am a biomedical scientist and part of the Ebola response team at a largeand prestigious hospital on the east coast.
1) Themost recent persons to get it is a doctorswithout borders doc.Whatpeople don't realize is that these doctors go into "battle" vastly undersupplied in these foreign countries. They do not have Tyvek coveralls,respirators, gloves, and proper sterilization equipment. A lot of thembecause of supplies are forced to use the same pair of gloves onmultiple patients for the day. Some don't use gloves at all.
2) Taking care of someone with Ebola is hell. There are literally bodyfluids everywhere. Imagine bloody decomposed fluid oozing out ofevery pore in your body, plus gallons of diarrhea and vomit. Theprotective equipment people are wearing here is good, but only if itstays intact and it doffed correctly. 90% of the infections occur becausethe person contaminates themselves when removing the soiledequipment.
In other words, taking the protective gear off improperly contaminatesyou, and 3rd world country doctors don't have the proper supplies.
Psychon Bull Rev
page as principle consensus because the latter question refersto the former. Evidence credibility and evidence relevancewere rated last and on the same page, after participants wereasked to highlight any evidence in the explanation. All attri-butes were rated using a 7-point Likert scale ranging fromStrongly Disagree to Strongly Agree.
Results
Overview
We first examined the relation between explanation qualityand each attribute without controlling for the other attributes.A mean score was computed for each attribute for each of the24 explanations. Partial correlations were computed using amixed effect model for each attribute, in each case treatingquality as the dependent variable, 1 of the 20 remaining attri-butes as a fixed effect, and explanandum as a random effect. Apartial correlation was used in place of a simple Pearson cor-relation because the 24 data points are not truly independent(there are three explanations for each explanandum). All sub-sequent correlations reported for Experiment 1 reflect a partialR after controlling for explanandum as a random effect.
Of the 20 attributes, 14 significantly predicted explanationquality, as shown in Table 4. Those that did not include: thedesired complexity of an explanation, whether the evidence
was credible (evidence credibility), whether the evidence wasrelevant (evidence relevance), whether the explanation referredto an expert, whether the participant had a lot of prior knowledgein the domain, and whether the explanandum required an expla-nation (requires explanation). To aid in interpretation, we alsocorrected for multiple comparisons using a full Bonferroni cor-rection, though it is likely that this correction is overly conser-vative: all tests were planned a priori, and the tested hypothesesare often complementary rather than orthogonal. Nonetheless,six attributes survived the multiple comparison correction, sug-gesting that their relation with explanation quality may be par-ticularly strong: whether the explanation had a number of pos-sible alternatives, the articulation of the explanation, whetherthere were gaps in the explanation (incompleteness), whether theparts of the explanation fit together (internal coherence), wheth-er the explanation was regarded as true (perceived truth), andwhether most people agree with the general rule provided in theexplanation (principle consensus).
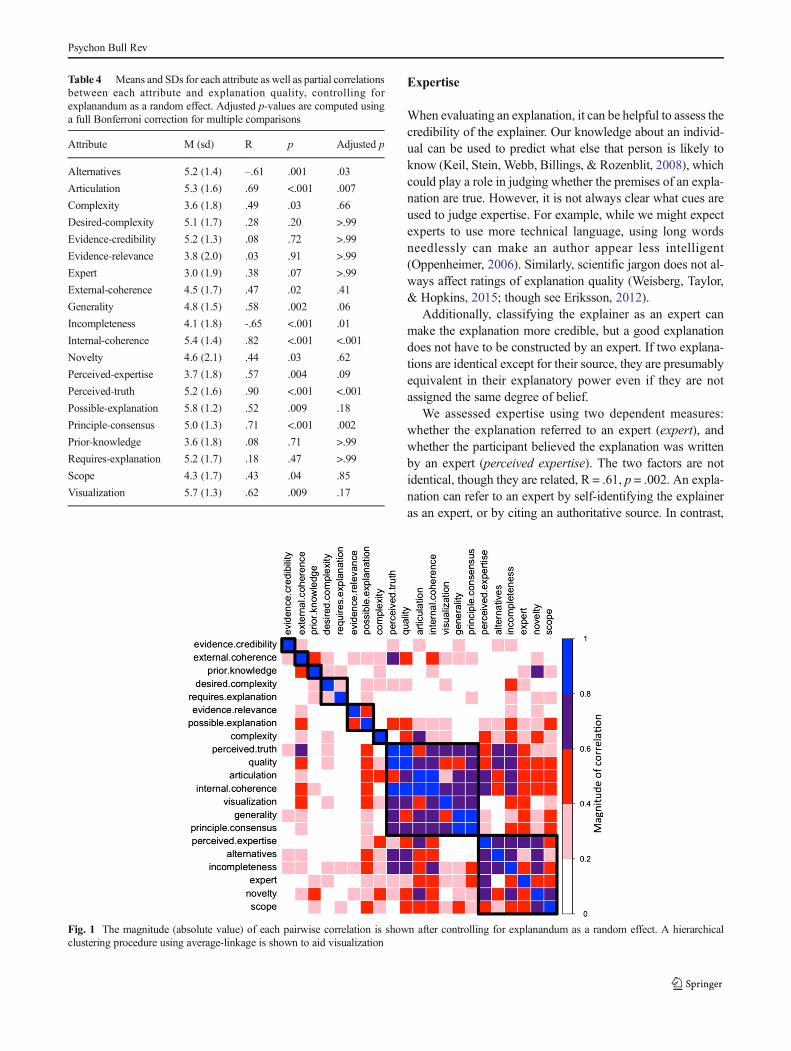
Though many of the attributes were able to predict expla-nation quality, we also observed substantial covariance be-tween the attributes. The attribute correlation matrix (Fig. 1)depicts the magnitude of the correlation between all attributespairwise, including explanation quality. It is likely that manyof these attributes are not independent predictors of explana-tion quality, but instead reflect a smaller number of latentfactors. For further discussion of how these attributes grouptogether, see the Supplementary Material.
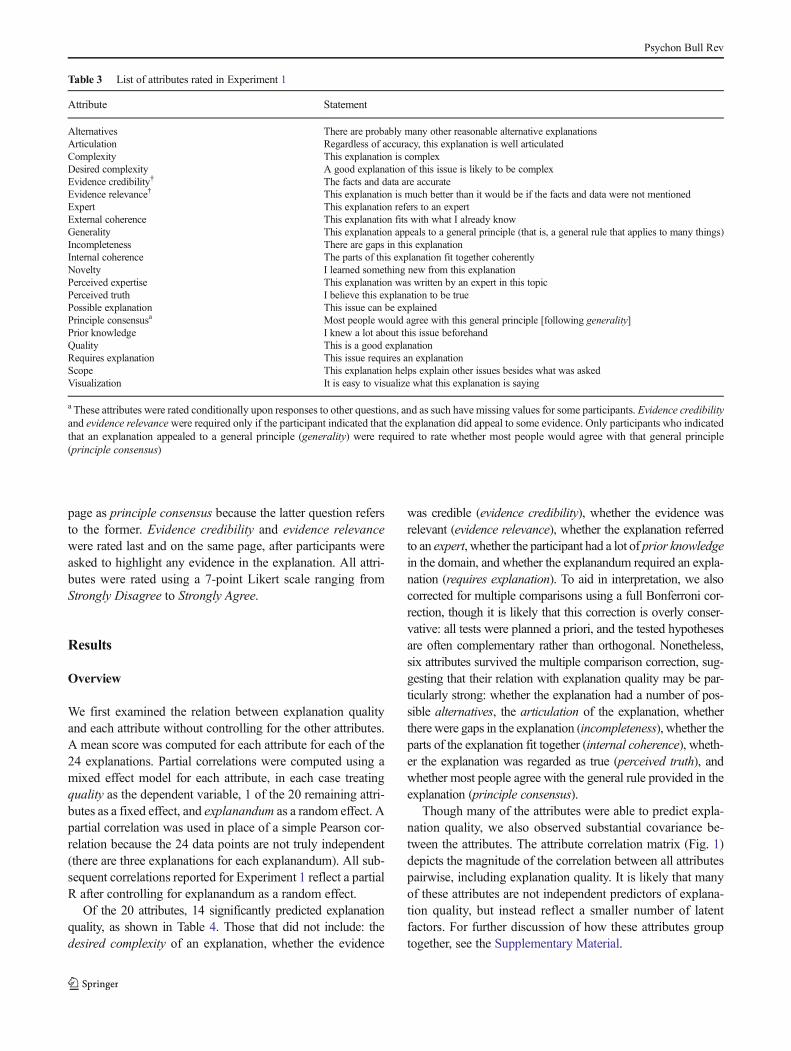
Table 3 List of attributes rated in Experiment 1
Attribute Statement
Alternatives There are probably many other reasonable alternative explanationsArticulation Regardless of accuracy, this explanation is well articulatedComplexity This explanation is complexDesired complexity A good explanation of this issue is likely to be complexEvidence credibility† The facts and data are accurateEvidence relevance† This explanation is much better than it would be if the facts and data were not mentionedExpert This explanation refers to an expertExternal coherence This explanation fits with what I already knowGenerality This explanation appeals to a general principle (that is, a general rule that applies to many things)Incompleteness There are gaps in this explanationInternal coherence The parts of this explanation fit together coherentlyNovelty I learned something new from this explanationPerceived expertise This explanation was written by an expert in this topicPerceived truth I believe this explanation to be truePossible explanation This issue can be explainedPrinciple consensusa Most people would agree with this general principle [following generality]Prior knowledge I knew a lot about this issue beforehandQuality This is a good explanationRequires explanation This issue requires an explanationScope This explanation helps explain other issues besides what was askedVisualization It is easy to visualize what this explanation is saying
a These attributes were rated conditionally upon responses to other questions, and as such have missing values for some participants. Evidence credibilityand evidence relevancewere required only if the participant indicated that the explanation did appeal to some evidence. Only participants who indicatedthat an explanation appealed to a general principle (generality) were required to rate whether most people would agree with that general principle(principle consensus)
Psychon Bull Rev
Expertise
When evaluating an explanation, it can be helpful to assess thecredibility of the explainer. Our knowledge about an individ-ual can be used to predict what else that person is likely toknow (Keil, Stein, Webb, Billings, & Rozenblit, 2008), whichcould play a role in judging whether the premises of an expla-nation are true. However, it is not always clear what cues areused to judge expertise. For example, while we might expectexperts to use more technical language, using long wordsneedlessly can make an author appear less intelligent(Oppenheimer, 2006). Similarly, scientific jargon does not al-ways affect ratings of explanation quality (Weisberg, Taylor,& Hopkins, 2015; though see Eriksson, 2012).
Additionally, classifying the explainer as an expert canmake the explanation more credible, but a good explanationdoes not have to be constructed by an expert. If two explana-tions are identical except for their source, they are presumablyequivalent in their explanatory power even if they are notassigned the same degree of belief.
We assessed expertise using two dependent measures:whether the explanation referred to an expert (expert), andwhether the participant believed the explanation was writtenby an expert (perceived expertise). The two factors are notidentical, though they are related, R = .61, p = .002. An expla-nation can refer to an expert by self-identifying the explaineras an expert, or by citing an authoritative source. In contrast,
Fig. 1 The magnitude (absolute value) of each pairwise correlation is shown after controlling for explanandum as a random effect. A hierarchicalclustering procedure using average-linkage is shown to aid visualization
Table 4 Means and SDs for each attribute as well as partial correlationsbetween each attribute and explanation quality, controlling forexplanandum as a random effect. Adjusted p-values are computed usinga full Bonferroni correction for multiple comparisons
Attribute M (sd) R p Adjusted p
Alternatives 5.2 (1.4) –.61 .001 .03
Articulation 5.3 (1.6) .69 <.001 .007
Complexity 3.6 (1.8) .49 .03 .66
Desired-complexity 5.1 (1.7) .28 .20 >.99
Evidence-credibility 5.2 (1.3) .08 .72 >.99
Evidence-relevance 3.8 (2.0) .03 .91 >.99
Expert 3.0 (1.9) .38 .07 >.99
External-coherence 4.5 (1.7) .47 .02 .41
Generality 4.8 (1.5) .58 .002 .06
Incompleteness 4.1 (1.8) -.65 <.001 .01
Internal-coherence 5.4 (1.4) .82 <.001 <.001
Novelty 4.6 (2.1) .44 .03 .62
Perceived-expertise 3.7 (1.8) .57 .004 .09
Perceived-truth 5.2 (1.6) .90 <.001 <.001
Possible-explanation 5.8 (1.2) .52 .009 .18
Principle-consensus 5.0 (1.3) .71 <.001 .002
Prior-knowledge 3.6 (1.8) .08 .71 >.99
Requires-explanation 5.2 (1.7) .18 .47 >.99
Scope 4.3 (1.7) .43 .04 .85
Visualization 5.7 (1.3) .62 .009 .17
Psychon Bull Rev
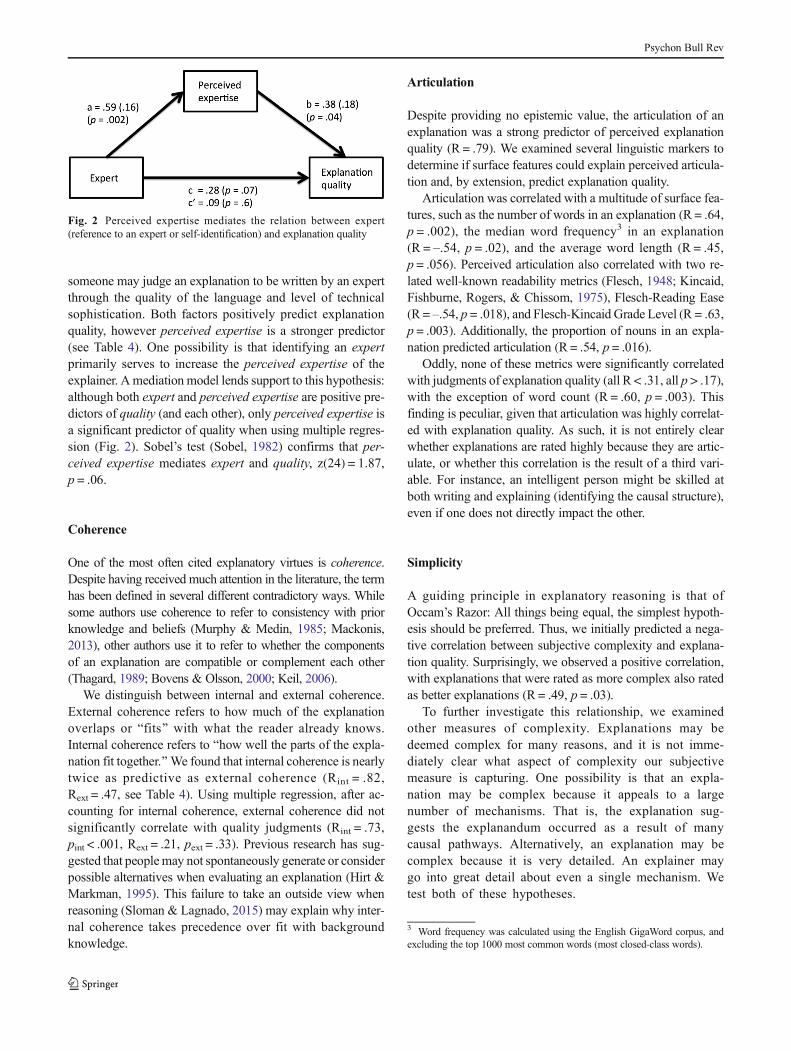
someone may judge an explanation to be written by an expertthrough the quality of the language and level of technicalsophistication. Both factors positively predict explanationquality, however perceived expertise is a stronger predictor(see Table 4). One possibility is that identifying an expertprimarily serves to increase the perceived expertise of theexplainer. Amediation model lends support to this hypothesis:although both expert and perceived expertise are positive pre-dictors of quality (and each other), only perceived expertise isa significant predictor of quality when using multiple regres-sion (Fig. 2). Sobel’s test (Sobel, 1982) confirms that per-ceived expertise mediates expert and quality, z(24) = 1.87,p = .06.
Coherence
One of the most often cited explanatory virtues is coherence.Despite having received much attention in the literature, the termhas been defined in several different contradictory ways. Whilesome authors use coherence to refer to consistency with priorknowledge and beliefs (Murphy & Medin, 1985; Mackonis,2013), other authors use it to refer to whether the componentsof an explanation are compatible or complement each other(Thagard, 1989; Bovens & Olsson, 2000; Keil, 2006).
We distinguish between internal and external coherence.External coherence refers to how much of the explanationoverlaps or Bfits^ with what the reader already knows.Internal coherence refers to Bhow well the parts of the expla-nation fit together.^We found that internal coherence is nearlytwice as predictive as external coherence (Rint = .82,Rext = .47, see Table 4). Using multiple regression, after ac-counting for internal coherence, external coherence did notsignificantly correlate with quality judgments (Rint = .73,pint < .001, Rext = .21, pext = .33). Previous research has sug-gested that peoplemay not spontaneously generate or considerpossible alternatives when evaluating an explanation (Hirt &Markman, 1995). This failure to take an outside view whenreasoning (Sloman & Lagnado, 2015) may explain why inter-nal coherence takes precedence over fit with backgroundknowledge.
Articulation
Despite providing no epistemic value, the articulation of anexplanation was a strong predictor of perceived explanationquality (R = .79). We examined several linguistic markers todetermine if surface features could explain perceived articula-tion and, by extension, predict explanation quality.
Articulation was correlated with a multitude of surface fea-tures, such as the number of words in an explanation (R = .64,p = .002), the median word frequency3 in an explanation(R = –.54, p = .02), and the average word length (R = .45,p = .056). Perceived articulation also correlated with two re-lated well-known readability metrics (Flesch, 1948; Kincaid,Fishburne, Rogers, & Chissom, 1975), Flesch-Reading Ease(R = –.54, p = .018), and Flesch-Kincaid Grade Level (R = .63,p = .003). Additionally, the proportion of nouns in an expla-nation predicted articulation (R = .54, p = .016).
Oddly, none of these metrics were significantly correlatedwith judgments of explanation quality (all R < .31, all p > .17),with the exception of word count (R = .60, p = .003). Thisfinding is peculiar, given that articulation was highly correlat-ed with explanation quality. As such, it is not entirely clearwhether explanations are rated highly because they are artic-ulate, or whether this correlation is the result of a third vari-able. For instance, an intelligent person might be skilled atboth writing and explaining (identifying the causal structure),even if one does not directly impact the other.
Simplicity
A guiding principle in explanatory reasoning is that ofOccam’s Razor: All things being equal, the simplest hypoth-esis should be preferred. Thus, we initially predicted a nega-tive correlation between subjective complexity and explana-tion quality. Surprisingly, we observed a positive correlation,with explanations that were rated as more complex also ratedas better explanations (R = .49, p = .03).
To further investigate this relationship, we examinedother measures of complexity. Explanations may bedeemed complex for many reasons, and it is not imme-diately clear what aspect of complexity our subjectivemeasure is capturing. One possibility is that an expla-nation may be complex because it appeals to a largenumber of mechanisms. That is, the explanation sug-gests the explanandum occurred as a result of manycausal pathways. Alternatively, an explanation may becomplex because it is very detailed. An explainer maygo into great detail about even a single mechanism. Wetest both of these hypotheses.
Fig. 2 Perceived expertise mediates the relation between expert(reference to an expert or self-identification) and explanation quality
3 Word frequency was calculated using the English GigaWord corpus, andexcluding the top 1000 most common words (most closed-class words).
Psychon Bull Rev
Causal pathways
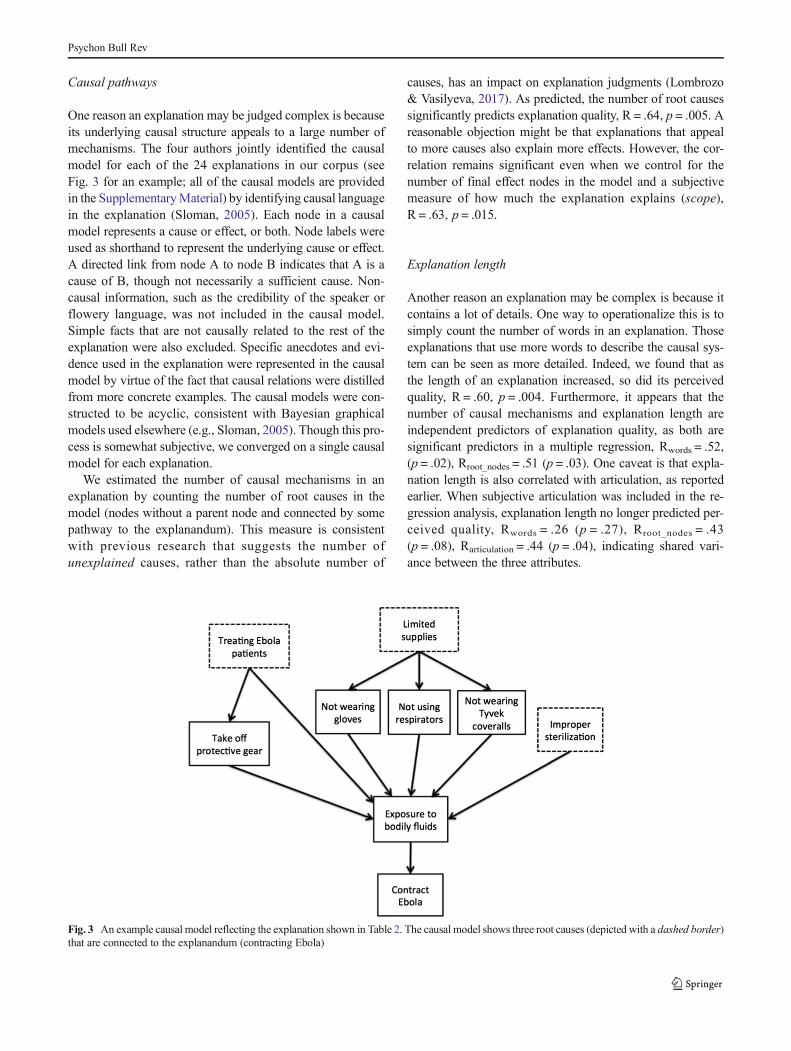
One reason an explanation may be judged complex is becauseits underlying causal structure appeals to a large number ofmechanisms. The four authors jointly identified the causalmodel for each of the 24 explanations in our corpus (seeFig. 3 for an example; all of the causal models are providedin the SupplementaryMaterial) by identifying causal languagein the explanation (Sloman, 2005). Each node in a causalmodel represents a cause or effect, or both. Node labels wereused as shorthand to represent the underlying cause or effect.A directed link from node A to node B indicates that A is acause of B, though not necessarily a sufficient cause. Non-causal information, such as the credibility of the speaker orflowery language, was not included in the causal model.Simple facts that are not causally related to the rest of theexplanation were also excluded. Specific anecdotes and evi-dence used in the explanation were represented in the causalmodel by virtue of the fact that causal relations were distilledfrom more concrete examples. The causal models were con-structed to be acyclic, consistent with Bayesian graphicalmodels used elsewhere (e.g., Sloman, 2005). Though this pro-cess is somewhat subjective, we converged on a single causalmodel for each explanation.
We estimated the number of causal mechanisms in anexplanation by counting the number of root causes in themodel (nodes without a parent node and connected by somepathway to the explanandum). This measure is consistentwith previous research that suggests the number ofunexplained causes, rather than the absolute number of
causes, has an impact on explanation judgments (Lombrozo& Vasilyeva, 2017). As predicted, the number of root causessignificantly predicts explanation quality, R = .64, p = .005. Areasonable objection might be that explanations that appealto more causes also explain more effects. However, the cor-relation remains significant even when we control for thenumber of final effect nodes in the model and a subjectivemeasure of how much the explanation explains (scope),R = .63, p = .015.
Explanation length
Another reason an explanation may be complex is because itcontains a lot of details. One way to operationalize this is tosimply count the number of words in an explanation. Thoseexplanations that use more words to describe the causal sys-tem can be seen as more detailed. Indeed, we found that asthe length of an explanation increased, so did its perceivedquality, R = .60, p = .004. Furthermore, it appears that thenumber of causal mechanisms and explanation length areindependent predictors of explanation quality, as both aresignificant predictors in a multiple regression, Rwords = .52,(p = .02), Rroot_nodes = .51 (p = .03). One caveat is that expla-nation length is also correlated with articulation, as reportedearlier. When subjective articulation was included in the re-gression analysis, explanation length no longer predicted per-ceived quality, Rwords = .26 (p = .27), Rroot_nodes = .43(p = .08), Rarticulation = .44 (p = .04), indicating shared vari-ance between the three attributes.
Fig. 3 An example causal model reflecting the explanation shown in Table 2. The causal model shows three root causes (depicted with a dashed border)that are connected to the explanandum (contracting Ebola)
Psychon Bull Rev
Complexity and expertise
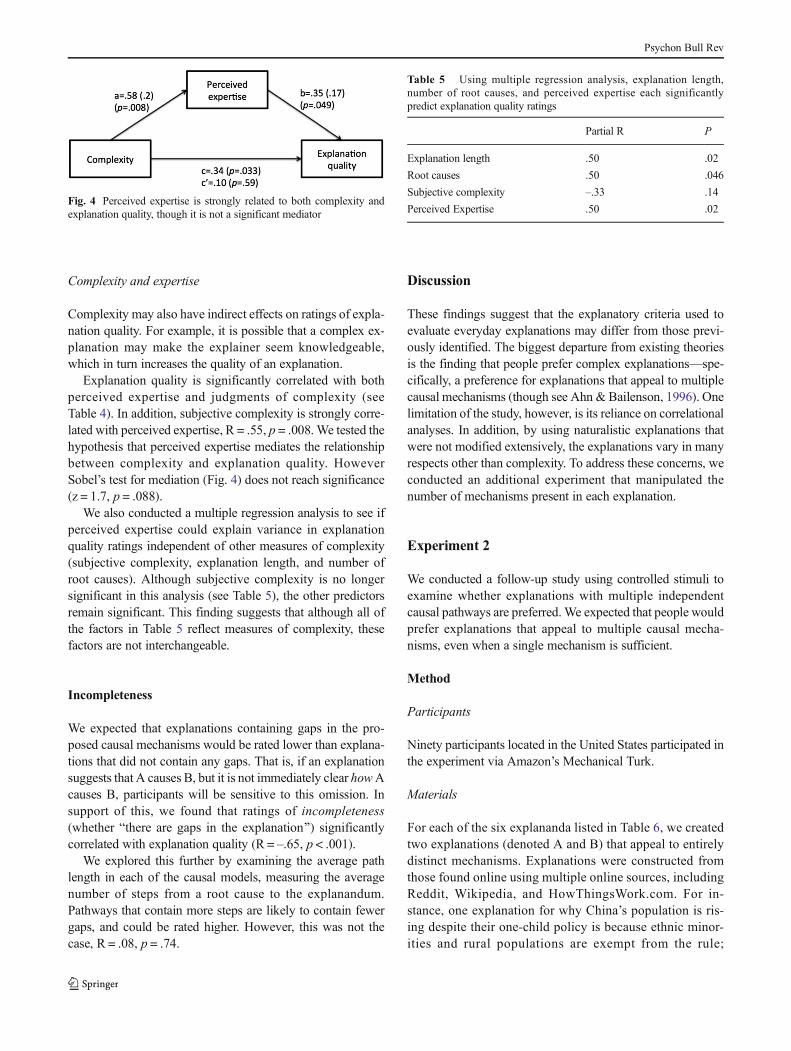
Complexity may also have indirect effects on ratings of expla-nation quality. For example, it is possible that a complex ex-planation may make the explainer seem knowledgeable,which in turn increases the quality of an explanation.
Explanation quality is significantly correlated with bothperceived expertise and judgments of complexity (seeTable 4). In addition, subjective complexity is strongly corre-lated with perceived expertise, R = .55, p = .008.We tested thehypothesis that perceived expertise mediates the relationshipbetween complexity and explanation quality. HoweverSobel’s test for mediation (Fig. 4) does not reach significance(z = 1.7, p = .088).
We also conducted a multiple regression analysis to see ifperceived expertise could explain variance in explanationquality ratings independent of other measures of complexity(subjective complexity, explanation length, and number ofroot causes). Although subjective complexity is no longersignificant in this analysis (see Table 5), the other predictorsremain significant. This finding suggests that although all ofthe factors in Table 5 reflect measures of complexity, thesefactors are not interchangeable.
Incompleteness
We expected that explanations containing gaps in the pro-posed causal mechanisms would be rated lower than explana-tions that did not contain any gaps. That is, if an explanationsuggests that A causes B, but it is not immediately clear howAcauses B, participants will be sensitive to this omission. Insupport of this, we found that ratings of incompleteness(whether Bthere are gaps in the explanation^) significantlycorrelated with explanation quality (R = –.65, p < .001).
We explored this further by examining the average pathlength in each of the causal models, measuring the averagenumber of steps from a root cause to the explanandum.Pathways that contain more steps are likely to contain fewergaps, and could be rated higher. However, this was not thecase, R = .08, p = .74.
Discussion
These findings suggest that the explanatory criteria used toevaluate everyday explanations may differ from those previ-ously identified. The biggest departure from existing theoriesis the finding that people prefer complex explanations—spe-cifically, a preference for explanations that appeal to multiplecausal mechanisms (though see Ahn & Bailenson, 1996). Onelimitation of the study, however, is its reliance on correlationalanalyses. In addition, by using naturalistic explanations thatwere not modified extensively, the explanations vary in manyrespects other than complexity. To address these concerns, weconducted an additional experiment that manipulated thenumber of mechanisms present in each explanation.
Experiment 2
We conducted a follow-up study using controlled stimuli toexamine whether explanations with multiple independentcausal pathways are preferred.We expected that people wouldprefer explanations that appeal to multiple causal mecha-nisms, even when a single mechanism is sufficient.
Method
Participants
Ninety participants located in the United States participated inthe experiment via Amazon’s Mechanical Turk.
Materials
For each of the six explananda listed in Table 6, we createdtwo explanations (denoted A and B) that appeal to entirelydistinct mechanisms. Explanations were constructed fromthose found online using multiple online sources, includingReddit, Wikipedia, and HowThingsWork.com. For in-stance, one explanation for why China’s population is ris-ing despite their one-child policy is because ethnic minor-ities and rural populations are exempt from the rule;
Table 5 Using multiple regression analysis, explanation length,number of root causes, and perceived expertise each significantlypredict explanation quality ratings
Partial R P
Explanation length .50 .02
Root causes .50 .046
Subjective complexity –.33 .14
Perceived Expertise .50 .02Fig. 4 Perceived expertise is strongly related to both complexity andexplanation quality, though it is not a significant mediator
Psychon Bull Rev
another explanation suggests that Chinese are living longeron average, and that wealthy couples can afford to payfines associated with violating the policy. Explanationswere designed to be roughly equal in length, amount ofdetail, and number of mechanisms. We also created a thirdexplanation that was simply a concatenation of the othertwo (denoted AB). This explanation encompasses the othertwo as it appeals to all of the causal mechanisms in A andB and does not vary in any other way. See theSupplementary Material for the full text of each explana-tion used in the study.
Procedure
Participants read an explanandum and were asked to maketwo ratings on a 7-point Likert scale: BHow many reasons ormechanisms should a good answer to this question include?^and BHow detailed should a good answer to this question be?^The response scale for both questions was ordinal, rangingfrom B1—A good answer would offer only one reason ormechanism^ to B7—A good answer would appeal to manyreasons or mechanisms^ for the former question, and fromB1—Very little detail is needed^ to B7—A lot of details areneeded^ for the latter question.
On the following page, participants read the full explana-tion and rated the number of mechanisms in the explanation(from B1—Only a single mechanism^ to B7—A lot of mech-anisms^), the amount of detail in the explanation (from B1—Not detailed at all^ to B7—Very detailed^), the overall qualityof the explanation (whether it was a Bgood^ explanation to thequestion being asked, from B1—Strongly disagree^ to B7—Strongly agree^), and whether the participant learned a lotfrom the explanation (from B1—I didn’t learn anything atall^ to B7—I learned a great deal^).
This procedure was repeated for all six explananda. Eachparticipant was shown only one of three explanations (A, B, orAB) for each explanandum. The explanations werecounterbalanced so that each explanation was presented toexactly 30 participants. The order of the explanations was alsocounterbalanced. Prior to beginning the experiment,
participants were shown an example explanation and in-formed of the types of questions they would be answering.
Results
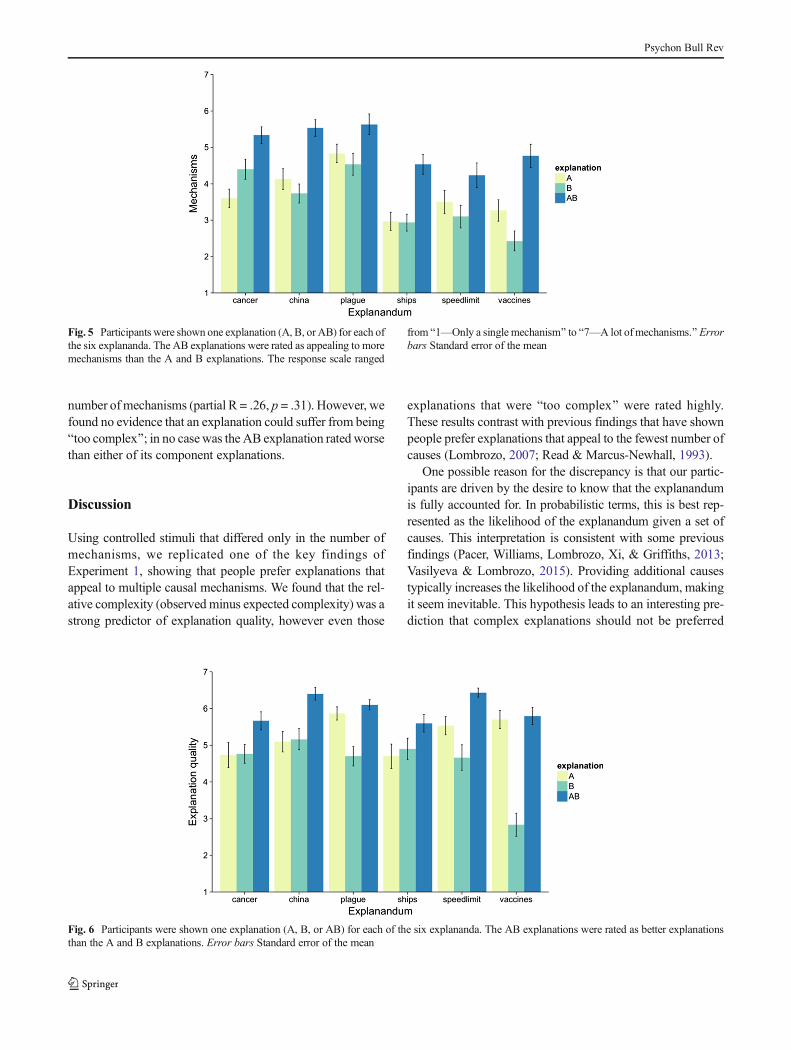
For all six explananda, the concatenated AB explanation wasrated as having more mechanisms than the A and B explana-tions (pooled), all p < .05. In five cases, the AB explanationwas rated as having significantly more mechanisms than itsnearest competitor (A or B; all p < .05 except pships = .12; seeFig. 5). This validates our manipulation—explanations withmore mechanisms were rated as such. Additionally, AB ex-planations were rated as having more details than their corre-sponding A and B explanations for all six explananda(pooled), as well as having more details than their nearestcompetitor (A or B), all p < .001.
In all six explananda, the quality of the AB explanation wasrated significantly higher than the individual A and B expla-nations (pooled), all p < .05 (see Fig. 6). The concatenatedexplanation (AB) typically performed better than the second-most preferred explanation (A or B); significant in three ex-planations (p < .05), nearly significant in one (pships = .07) andnot significant in two (pplague = .3, pvaccines = .77). All of thecomponent explanations (A or B) except one were rated asabove average in quality (above the midpoint). Despite this,participants showed a preference for the concatenated expla-nation (AB) in each case. In addition, 75 of 90 participantsrated AB explanations higher on average compared to A or Bexplanations (across all six explananda), binomial testp < .001.
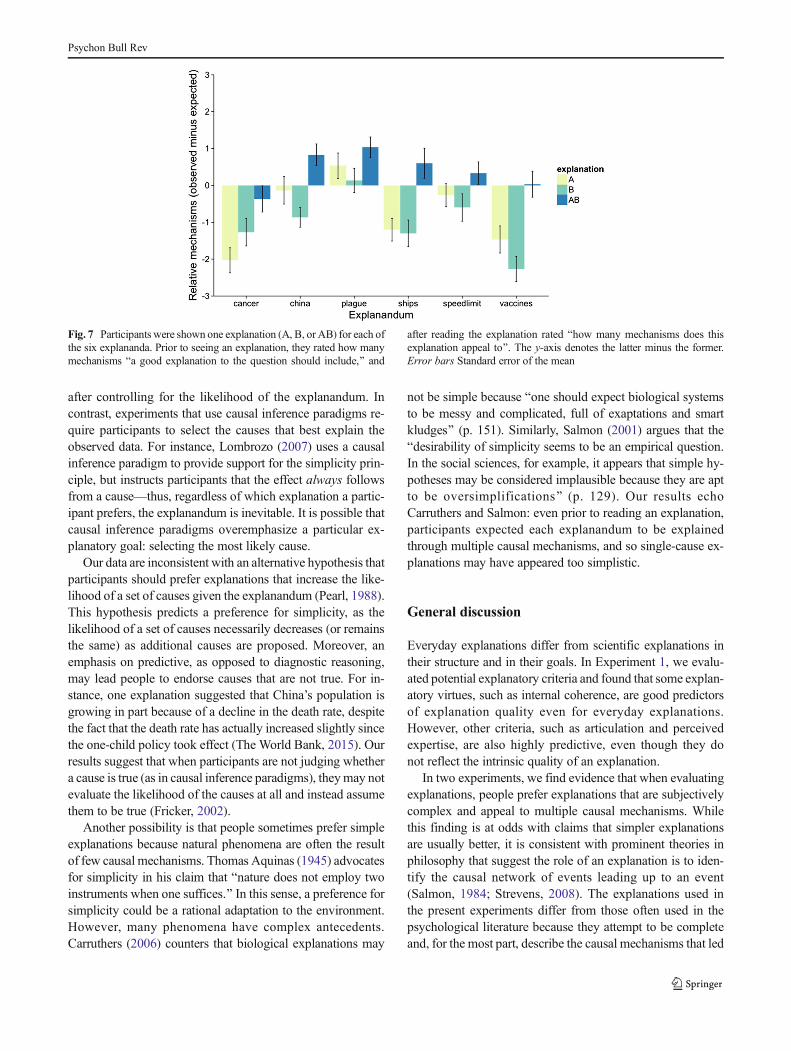
Perhaps participants judged AB explanations as better be-cause the phenomena to be explained were complicated, andthus benefited from an appeal to numerous mechanisms. Priorto reading each explanation, participants indicated that a goodexplanation should appeal to multiple mechanisms (mean rat-ings for the six explananda range from 3.8 to 5.7). We ex-plored this possibility further by examining the relative com-plexity of each explanation: whether an explanation thatappealed to more mechanisms than a Bgood explanation tothe question should include^ would still be preferred. We cal-culated a measure of relative complexity for each explanationby subtracting the mean rating of the number of mechanisms agood explanation should appeal to from the mean rating of thenumber of mechanisms the explanation did appeal to. Asshown in Fig. 7, the majority of the AB explanations appealedto more mechanisms than initially expected from a goodexplanation.
Furthermore, this relative complexity measure predictedquality ratings as well or better than the ordinal rating of num-ber of mechanisms alone. Multiple regression controlling forexplanandum found a near-significant effect of relative com-plexity (partial R = .45, p = .07) but no significant effect of the
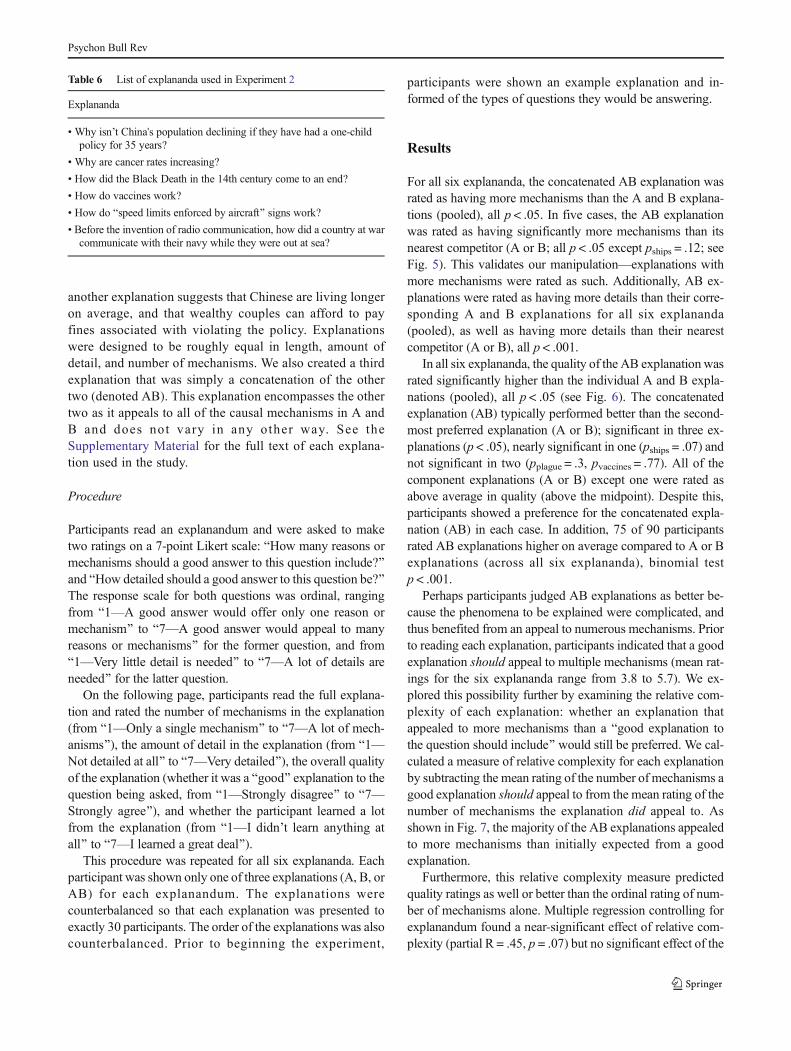
Table 6 List of explananda used in Experiment 2
Explananda
• Why isn’t China's population declining if they have had a one-childpolicy for 35 years?
• Why are cancer rates increasing?
• How did the Black Death in the 14th century come to an end?
• How do vaccines work?
• How do Bspeed limits enforced by aircraft^ signs work?
• Before the invention of radio communication, how did a country at warcommunicate with their navy while they were out at sea?
Psychon Bull Rev
number of mechanisms (partial R = .26, p = .31). However, wefound no evidence that an explanation could suffer from beingBtoo complex^; in no casewas the AB explanation rated worsethan either of its component explanations.
Discussion
Using controlled stimuli that differed only in the number ofmechanisms, we replicated one of the key findings ofExperiment 1, showing that people prefer explanations thatappeal to multiple causal mechanisms. We found that the rel-ative complexity (observed minus expected complexity) was astrong predictor of explanation quality, however even those
explanations that were Btoo complex^ were rated highly.These results contrast with previous findings that have shownpeople prefer explanations that appeal to the fewest number ofcauses (Lombrozo, 2007; Read & Marcus-Newhall, 1993).
One possible reason for the discrepancy is that our partic-ipants are driven by the desire to know that the explanandumis fully accounted for. In probabilistic terms, this is best rep-resented as the likelihood of the explanandum given a set ofcauses. This interpretation is consistent with some previousfindings (Pacer, Williams, Lombrozo, Xi, & Griffiths, 2013;Vasilyeva & Lombrozo, 2015). Providing additional causestypically increases the likelihood of the explanandum, makingit seem inevitable. This hypothesis leads to an interesting pre-diction that complex explanations should not be preferred
Fig. 6 Participants were shown one explanation (A, B, or AB) for each of the six explananda. The AB explanations were rated as better explanationsthan the A and B explanations. Error bars Standard error of the mean
Fig. 5 Participants were shown one explanation (A, B, or AB) for each ofthe six explananda. The AB explanations were rated as appealing to moremechanisms than the A and B explanations. The response scale ranged
from B1—Only a single mechanism^ to B7—A lot ofmechanisms.^ Errorbars Standard error of the mean
Psychon Bull Rev
after controlling for the likelihood of the explanandum. Incontrast, experiments that use causal inference paradigms re-quire participants to select the causes that best explain theobserved data. For instance, Lombrozo (2007) uses a causalinference paradigm to provide support for the simplicity prin-ciple, but instructs participants that the effect always followsfrom a cause—thus, regardless of which explanation a partic-ipant prefers, the explanandum is inevitable. It is possible thatcausal inference paradigms overemphasize a particular ex-planatory goal: selecting the most likely cause.
Our data are inconsistent with an alternative hypothesis thatparticipants should prefer explanations that increase the like-lihood of a set of causes given the explanandum (Pearl, 1988).This hypothesis predicts a preference for simplicity, as thelikelihood of a set of causes necessarily decreases (or remainsthe same) as additional causes are proposed. Moreover, anemphasis on predictive, as opposed to diagnostic reasoning,may lead people to endorse causes that are not true. For in-stance, one explanation suggested that China’s population isgrowing in part because of a decline in the death rate, despitethe fact that the death rate has actually increased slightly sincethe one-child policy took effect (The World Bank, 2015). Ourresults suggest that when participants are not judging whethera cause is true (as in causal inference paradigms), theymay notevaluate the likelihood of the causes at all and instead assumethem to be true (Fricker, 2002).
Another possibility is that people sometimes prefer simpleexplanations because natural phenomena are often the resultof few causal mechanisms. Thomas Aquinas (1945) advocatesfor simplicity in his claim that Bnature does not employ twoinstruments when one suffices.^ In this sense, a preference forsimplicity could be a rational adaptation to the environment.However, many phenomena have complex antecedents.Carruthers (2006) counters that biological explanations may
not be simple because Bone should expect biological systemsto be messy and complicated, full of exaptations and smartkludges^ (p. 151). Similarly, Salmon (2001) argues that theBdesirability of simplicity seems to be an empirical question.In the social sciences, for example, it appears that simple hy-potheses may be considered implausible because they are aptto be oversimplifications^ (p. 129). Our results echoCarruthers and Salmon: even prior to reading an explanation,participants expected each explanandum to be explainedthrough multiple causal mechanisms, and so single-cause ex-planations may have appeared too simplistic.
General discussion
Everyday explanations differ from scientific explanations intheir structure and in their goals. In Experiment 1, we evalu-ated potential explanatory criteria and found that some explan-atory virtues, such as internal coherence, are good predictorsof explanation quality even for everyday explanations.However, other criteria, such as articulation and perceivedexpertise, are also highly predictive, even though they donot reflect the intrinsic quality of an explanation.
In two experiments, we find evidence that when evaluatingexplanations, people prefer explanations that are subjectivelycomplex and appeal to multiple causal mechanisms. Whilethis finding is at odds with claims that simpler explanationsare usually better, it is consistent with prominent theories inphilosophy that suggest the role of an explanation is to iden-tify the causal network of events leading up to an event(Salmon, 1984; Strevens, 2008). The explanations used inthe present experiments differ from those often used in thepsychological literature because they attempt to be completeand, for the most part, describe the causal mechanisms that led
Fig. 7 Participants were shown one explanation (A, B, or AB) for each ofthe six explananda. Prior to seeing an explanation, they rated how manymechanisms Ba good explanation to the question should include,^ and
after reading the explanation rated Bhow many mechanisms does thisexplanation appeal to^. The y-axis denotes the latter minus the former.Error bars Standard error of the mean
Psychon Bull Rev
to an event. Rather than asking participants to ascribe causesto events or adjudicate between simple causes, participantswere asked to evaluate the aptness of an entire causal system.
The ubiquity of explanations in our lives leads us to con-stantly evaluate potential causal mechanisms affecting theworld. Deepening our understanding of what leads us to ac-cept some explanations and reject others has implications forscientific communication, pubic policy, legal precedents, andbeyond. Our current findings suggest that everyday explana-tory practices are more complex and nuanced than previouslythought.
Acknowledgments This project/publication was made possiblethrough the support of a grant from The Varieties of UnderstandingProject at Fordham University and The John Templeton Foundation.The opinions expressed in this publication are those of the author(s) anddo not necessarily reflect the views of The Varieties of UnderstandingProject, Fordham University, or The John Templeton Foundation. Theauthors would like to thank Kethural Manokaran and Kenneth Pelusofor their excellent research assistance, Uriel Cohen Priva for linguisticanalysis suggestions, and members of the Sloman-Austerweil laboratoryfor helpful discussions. In addition, we thank Tania Lombrozo and SunnyKhemlani for their feedback on an earlier draft of this manuscript.
References
Ahn, W. K., & Bailenson, J. (1996). Causal attribution as a search forunderlying mechanisms: an explanation of the conjunction fallacyand the discounting principle.Cognitive Psychology, 31(1), 82–123.
Aquinas, T. (1945) Basic Writings of St. Thomas Aquinas, trans. A.C.Pegis, New York: Random House.
Bechlivanidis, C., Lagnado, D. A., Zemla, J. C., & Sloman, S. (2017).Concreteness and abstraction in everyday explanation. (In press).
Bovens, L., & Olsson, E. J. (2000). Coherentism, reliability and Bayesiannetworks. Mind, 109(436), 685–719.
Byrne, M. D. (1995). The convergence of explanatory coherence and thestory model: a case study in juror decision. In J. D. Moore & J. F.Lehman (Eds.), Proceedings of the Seventeenth Annual Meeting ofthe Cognitive Science Society (pp. 539–543). Mahwah, NJ:Erlbaum.
Carruthers, P. (2006). The architecture of the mind. New York, NY:Oxford University Press.
Cimpian, A., & Salomon, E. (2014). The inherence heuristic: An intuitivemeans of making sense of the world, and a potential precursor topsychological essentialism. Behavioral and Brain Sciences, 37(05),461–480.
Dray, W. H. (2000). Explanation in history. In J. H. Fetzer (Ed.), Science,Explanation, and Rationality: Aspects of the Philosophy of Carl G(pp. 217–242). Hempel, Oxford: Oxford University Press.
Eriksson, K. (2012). The nonsense math effect. Judgment and DecisionMaking, 7(6), 746–749.
Fernbach, P. M., Darlow, A., & Sloman, S. A. (2010). Neglect of alter-native causes in predictive but not diagnostic reasoning.Psychological Science, 21(3), 329–336.
Flesch, R. (1948). A new readability yardstick. Journal of AppliedPsychology, 32(3), 221–233.
Fricker, E. (2002). Trusting others in the sciences: A priori or empiricalwarrant? Studies in History and Philosophy of Science Part A, 33(2),373–383.
Glymour, C. (2014). Probability and the Explanatory Virtues. The BritishJournal for the Philosophy of Science, axt051, 1–14.
Harman, G. H. (1965). The inference to the best explanation. ThePhilosophical Review, 88–95.
Hempel, C. G. (1965). Inductive-statistical explanation. In Aspects ofscientific explanation (pp. 381–403). New York, NY: Free.
Hirt, E. R., & Markman, K. D. (1995). Multiple explanation: A consider-an-alternative strategy for debiasing judgments. Journal ofPersonality and Social Psychology, 69(6), 1069–1086.
Johnson-Laird, P. N., Girotto, V., & Legrenzi, P. (2004). Reasoning frominconsistency to consistency. Psychological Review, 111(3), 640–661.
Keil, F. C. (2006). Explanation and understanding. Annual Review ofPsychology, 57, 227–254.
Keil, F. C., Stein, C., Webb, L., Billings, V. D., & Rozenblit, L. (2008).Discerning the division of cognitive labor: An emerging understand-ing of how knowledge is clustered in other minds. CognitiveScience, 32(2), 259–300.
Kelemen, D., & Rosset, E. (2009). The human function compunction:Teleological explanation in adults. Cognition, 111(1), 138–143.
Khemlani, S. S., & Johnson-Laird, P. N. (2011). The need to explain. TheQuarterly Journal of Experimental Psychology, 64(11), 2276–2288.
Khemlani, S. S., Sussman, A. B., & Oppenheimer, D. M. (2011). HarryPotter and the sorcerer's scope: Latent scope biases in explanatoryreasoning. Memory & Cognition, 39(3), 527–535.
Kincaid, J. P., Fishburne Jr, R. P., Rogers, R. L., & Chissom, B. S. (1975).Derivation of new readability formulas (automated readability in-dex, fog count and Flesch reading ease formula) for Navy enlistedpersonnel (No. RBR-8-75). Naval Technical Training CommandMillington TN Research Branch.
Kitcher, P. (1989). Explanatory unification and the causal structure of theworld. Scientific Explanation, 13, 410–505.
Kuhn, D. (1991). The skills of argument. New York, NY: CambridgeUniversity Press.
Lipton, P. (2004). Inference to the best explanation (2mdth ed.). Oxford:Oxford University Press.
Lombrozo, T. (2007). Simplicity and probability in causal explanation.Cognitive Psychology, 55(3), 232–257.
Lombrozo, T. (2011). The instrumental value of explanations. PhilosophyCompass, 6(8), 539–551.
Lombrozo, T., & Vasilyeva, N. (2017). Causal explanation. In M.Waldmann (Ed.), Oxford Handbook of Causal Reasoning. Oxford:Oxford University Press.
Mackonis, A. (2013). Inference to the best explanation, coherence andother explanatory virtues. Synthese, 190(6), 975–995.
Murphy, G. L., & Medin, D. L. (1985). The role of theories in conceptualcoherence. Psychological Review, 92(3), 289–316.
Oppenheimer, D. M. (2006). Consequences of erudite vernacular utilizedirrespective of necessity: Problems with using long words needless-ly. Applied Cognitive Psychology, 20(2), 139–156.
Oppenheimer, D. M., Meyvis, T., & Davidenko, N. (2009). Instructionalmanipulation checks: Detecting satisficing to increase statisticalpower. Journal of Experimental Social Psychology, 45(4), 867–872.
Pacer, M., Williams, J., Xi, C., Lombrozo, T., & Griffiths, T. L. (2013).Evaluating computational models of explanation using human judg-ments. Proceedings of the Twenty-Ninth Conference on Uncertaintyin Artificial Intelligence. arXiv:1309.6855 [cs.AI]
Paolacci, G., Chandler, J., & Ipeirotis, P. G. (2010). Running experimentsonAmazonMechanical Turk. Judgment and DecisionMaking, 5(5),411–419.
Patterson, R., Operskalski, J. T., & Barbey, A. K. (2015). Motivatedexplanation. Frontiers in Human Neuroscience, 9, 1–15.
Pearl, J. (1988). Probabilistic reasoning in intelligent systems. SanFrancisco: Kaufmann.
Psychon Bull Rev
Pennington, N., & Hastie, R. (1986). Evidence evaluation in complexdecision making. Journal of Personality and Social Psychology,51(2), 242–258.
Pennington, N., & Hastie, R. (1988). Explanation-based decision mak-ing: Effects of memory structure on judgment. Journal ofExperimental Psychology: Learning, Memory, and Cognition,14(3), 521–533.
Read, S. J., & Marcus-Newhall, A. (1993). Explanatory coherence insocial explanations: A parallel distributed processing account.Journal of Personality and Social Psychology, 65(3), 429–447.
Salmon, W. C. (1984). Scientific explanation and the causal structure ofthe world. Princeton, NJ: Princeton University Press.
Salmon, W. C. (2001). Reflections of a bashful Bayesian: a reply to PeterLipton. In Explanation (pp. 121–136). Springer Netherlands.
Schank, P., & Ranney, M. (1992). Assessing explanatory coherence: anew method for integrating verbal data with models of on-linebelief revision. In Proceedings of the Fourteenth AnnualConference of the Cognitive Science Society (pp. 599–604).Hillsdale, NJ: Erlbaum.
Sloman, S. (2005). Causal models: How people think about the worldand its alternatives. New York: Oxford University Press.
Sloman, S. A., & Lagnado, D. (2015). Causality in thought. AnnualReview of Psychology, 66, 223–247.
Sobel, M. E. (1982). Asymptotic confidence intervals for indirect effectsin structural equation models. Sociological Methodology, 13, 290–312.
Strevens, M. (2007). Why explanations lie: Idealization in explanation.Unpublished Manuscript. Retrieved from http://www.strevens.org/research/expln/Idealization.pdf
Strevens, M. (2008). Depth: An account of scientific explanation.Harvard University Press.
Thagard, P. R. (1978). The best explanation: Criteria for theory choice.The Journal of Philosophy, 1978, 76–92.
Thagard, P. (1989). Explanatory coherence. Behavioral and BrainSciences, 12, 435–502.
The World Bank, World Development Indicators (2015). Death rate,crude (per 1,000 people) [Data file]. Retrieved from http://data.worldbank.org/indicator/SP.DYN.CDRT.IN
Vasilyeva, N., & Lombrozo, T. (2015). Explanations and causal judg-ments are differentially sensitive to covariation and mechanism in-formation. In D. C. Noelle, R. Dale, A. S. Warlaumont, J. Yoshimi,T. Matlock, C. D. Jennings, & P. P. Maglio (Eds.), Proceedings ofthe 37th Annual Meeting of the Cognitive Science Society (pp.2475–2480). Austin, TX: Cognitive Science Society.
Weisberg, D. S., Keil, F. C., Goodstein, J., Rawson, E., & Gray, J. R.(2008). The seductive allure of neuroscience explanations. Journalof Cognitive Neuroscience, 20(3), 470–477.
Weisberg, D. S., Taylor, J. C., & Hopkins, E. J. (2015). Deconstructingthe seductive allure of neuroscience explanations. Judgment andDecision Making, 10(5), 429–441.
Woodward, J., & Hitchcock, C. (2003). Explanatory generalizations, partI: A counterfactual account. Noûs, 37(1), 1–24.
Psychon Bull Rev