Embed Size (px)
Citation preview

Department of Architecture and Civil Engineering Division of Geology and Geotechnics Urban Mobility Systems research group CHALMERS UNIVERSITY OF TECHNOLOGY Master’s Thesis ACEX30-19-33 Gothenburg, Sweden 2019
Evaluating design alternatives for a
complete street in Gothenburg, Sweden,
using microscopic simulation
Master’s thesis in the Master’s programme Infrastructure and Environmental Engineering
PONTUS AHLSTRÖM
FATEMEH SHAYAN

MASTER’S THESIS ACEX30-19-33
Evaluating design alternatives for a complete street in
Gothenburg, Sweden, using microscopic simulation
Master’s Thesis in the Master’s Programme Infrastructure and Environmental
Engineering
PONTUS AHLSTRÖM
FATEMEH SHAYAN
Department of Architecture and Civil Engineering
Division of Geology and Geotechnics
Urban Mobility Systems research group
CHALMERS UNIVERSITY OF TECHNOLOGY
Göteborg, Sweden 2019


I
Evaluating design alternatives for a complete street in Gothenburg, Sweden, using microscopic
simulation
Master’s Thesis in the Master’s Programme Infrastructure and Environmental Engineering
PONTUS AHLSTRÖM
FATEMEH SHAYAN
© PONTUS AHLSTRÖM, 2019
© FATEMEH SHAYAN, 2019
Examensarbete ACEX30-19-33
Institutionen för arkitektur och samhällsbyggnadsteknik
Chalmers tekniska högskola, 2019
Department of Architecture and Civil Engineering
Division of Geology and Geotechnics
Urban Mobility Systems Research Group
Chalmers University of Technology
SE-412 96 Göteborg
Sweden
Telephone: + 46 (0)31-772 1000
Cover:
Screenshot of the currently existing street layout as modeled in the microscopic simulation
software PTV Vissim.
Department of Architecture and Civil Engineering
Göteborg, Sweden, 2019

II
Evaluating design alternatives for a complete street in Gothenburg, Sweden, using microscopic
simulation
Master’s Thesis in the Master’s Programme Infrastructure and Environmental Engineering
PONTUS AHLSTRÖM
FATEMEH SHAYAN
Department of Architecture and Civil Engineering
Division of Geology and Geotechnics
Urban Mobility Systems Research Group
Chalmers University of Technology
ABSTRACT
Bicycle infrastructure on the parade street Kungsportsavenyen in Gothenburg, Sweden, is lacking
and bicycles are forced to share the road with cars on large stretches of the street. In this report, four
new design alternatives for the street are suggested in order to improve the situations for bicyclists.
They were then modeled in the microsimulation software PTV Vissim and compared to a model of
the current situation. A literature study was also conducted to further investigate what aspects affect
bicycle infrastructure quality. Detailed descriptions of the model setups, data collections and
assumptions are included in the report for transparency. Several simulation runs were made for each
design scenario and the average results for travel times, speeds, delays and level of service were
investigated. Other design aspects such as bicycle quality of service and conflict areas between
transport modes are also discussed. The results show that the largest impacts on traffic mobility in
the study area come from changing the infrastructure, as well as allowing, or forbidding cars at the
intersection with Engelbrektsgatan. Impacts of banning cars on the street are discussed. A final
design recommendation is presented based on the results and discussions, where cars are banned
from traveling on Avenyn except for crossing at Parkgatan and Engelbrektsgatan. Further
investigations needed before implementing the design are then discussed.
Keywords: Traffic planning, traffic analysis, urban street, microscopic simulation, bicycle
infrastructure, multimodal street, Vissim, Viswalk, Avenyn, Kungsportsavenyen.

III
Utvärdering av designalternativ för en komplett gata i Göteborg, Sverige, användande
mikroskopisk simulering
Examensarbete inom mastersprogrammet Infrastruktur och Miljöteknik
PONTUS AHLSTRÖM
FATEMEH SHAYAN
Institutionen för arkitektur och samhällsbyggnadsteknik
Avdelningen för geologi och geoteknik
Forskargruppen väg och trafik
Chalmers tekniska högskola
SAMMANFATTNING
Cykelinfrastruktur på paradgatan Kungsportsavenyen i Göteborg är otillräcklig och cyklar tvingas
att dela vägen med bilar på stora sträckor av gatan. I denna rapport föreslås fyra nya designalternativ
för gatan med syfte att förbättra situationen för cyklister. De var sedan modellerade med en
mikrosimulering i programmet PTV Vissim och jämförda med en modell av den nuvarande
situationen. En litteraturstudie genomfördes också för att undersöka vilka aspekter som påverkar
kvalitén av cykelinfrastruktur. Detaljerade beskrivningar av uppbyggandet av modellen,
datainsamling och antaganden är också inkluderade i rapporten. Ett flertal simuleringar
genomfördes för varje designalternativ och de genomsnittliga resultaten för restider, hastigheter,
förseningar och servicenivå undersöktes. Andra designaspekter som servicekvalitet för cyklar och
konfliktytor mellan trafikslag diskuteras också. Resultaten visar att den största påverkan på
mobiliteten hos trafiken i studieområdet beror på hur infrastrukturen vid korsningen med
Engelbrektsgatan utformas och om biltrafiken där tillåts eller inte. Följder av att förbjuda biltrafik
från Avenyn diskuteras. En slutgiltig designrekommendation presenteras tillslut baserat på resultat
och diskussioner, där bilar förbjuds från att vistas på Avenyn men tillåts korsa vid Parkgatan och
Engelbrektsgatan. Tillslut diskuteras vidare undersökningar som behövs innan implementering av
förslaget kan ske.
Nyckelord: Trafikplanering, trafikanalys, stadsgata, mikroskopisk simulering, cykelinfrastruktur,
multimodal gata, Vissim, Viswalk, Avenyn, Kungsportsavenyen.

IV

V
Table of contents Preface VIII
1 Introduction 1
1.1 Background 1
1.2 Study area 2
1.3 Aims and objectives 4
1.4 Demarcations and study limits 5
2 Literature study 7
2.1 Quality of service 7
2.2 Level of service 8
2.3 Street design 10
3 Method 11
3.1 Data input used for the model 11
3.1.1 Geometry 11
3.1.1.1 General geometry 12
3.1.1.2 Bicycle lanes 12
3.1.2 Cyclists 12
3.1.3 Pedestrians 15
3.1.4 Motorized Vehicles traffic 17
3.1.5 Public Transportation 19
3.1.6 Traffic signals 19
3.2 Simulation softwares 20
3.2.1 PTV Vissim 20
3.2.2 Vissim add-on: Viswalk 20
3.2.3 Vissim add-on: VisVAP 20
3.2.4 Vissim add-on: Vissig 20
3.3 Modeling traffic behavior 21
3.3.1 Motorized vehicles 21
3.3.2 Bicycles 21
3.3.3 Pedestrians 22
3.3 Design model scenarios 22
3.3.1 Scenario 1: Current situation 22
3.3.2 Scenario 2: Separate bicycle lanes by taking space from existing sidewalks 23
3.3.3 Scenario 3: Banning cars on Avenyn but allowing them to cross 24

VI
3.3.4 Scenario 4: Banning cars, no crossing except at Götaplatsen 25
3.3.5 Scenario 5: Banning cars, no crossing except at Engelbrektsgatan 26
3.4 Generating results 27
4 Vissim model 28
4.1 Model setup 28
4.1.1 Speed related distributions and driving behaviors 28
4.1.1.1 Bicycle distributions 28
4.1.1.2 Motorized vehicle distributions 28
4.1.2 Bicycle paths 29
4.1.3 Traffic signals 29
4.1.3.1 Parkgatan, all scenarios 30
4.1.3.2 Engelbrektsgatan, scenario 1 31
4.1.3.3 Engelbrektsgatan, scenario 2, 3 and 5 32
4.1.3.4 Engelbrektsgatan, scenario 4 34
4.1.3.5 Götaplatsen, scenario 4 35
4.1.4 Comparison of the critical intersections 36
4.1.4.1 Parkgatan 37
4.1.4.2 Vasagatan 38
4.1.4.3 Engelbrektsgatan 39
4.1.4.4 Götaplatsen 40
4.2 Assumptions 41
5 Results 43
5.1 Travel times 43
5.1.1 Pedestrian travel times 44
5.1.2 Bicycle travel times 46
5.1.3 Public transport travel times 48
5.2 Delays 50
5.2.1 Parkgatan intersection 51
5.2.2 Vasagatan intersection 52
5.2.3 Engelbrektsgatan intersection 52
5.2.4 Götaplatsen intersection 53
5.2.5 Average delay in system 54
5.3 Average speed in system 54

VII
5.3.1 Pedestrian speed 55
5.3.2 Bicycle speed 55
5.4 Bicycle infrastructure changes 56
5.4.1 Bicycle level of service 56
5.4.2 Bicycle quality of service 57
5.5 Conflict areas between traffic modes 58
5.5.1 Conflicts at Vasagatan 58
5.5.2 Conflicts at Engelbrektsgatan 59
6. Discussion and conclusions 62
6.1 Discussion about the model 62
6.2 General discussion 63
6.3 Conclusions 64
References 66
Appendix A - Vehicle parameters used in Vissim I
Appendix B - Signal control data files VI
Appendix C - Vehicle OD matrices, all scenarios XIII
VIII
Preface
In this project, impacts of improving bicycle infrastructure on a street in Gothenburg, Sweden, have
been investigated using microscopic simulation in the software PTV Vissim. The project was
conducted between January and June 2019 as a master’s thesis project at Chalmers University of
Technology in Gothenburg. Most of the project was conducted at the Advisory department of the
company WSP in Gothenburg.
The project supervisor and examiner at Chalmers was Assistant Professor Ivana Tasic and the
supervisor at WSP was Carl-Johan Schultze.
We want to thank Ivana Tasic for her helpful input to the project and for answering any questions
we had during the project. We also want to thank all the people at WSP’s Advisory department for
making us feel welcomed and included at their workplace. A special thanks to Carl-Johan Schultze
for his help teaching us how to use the software and answering questions about the modeling. Lastly,
we want to thank PTV for letting us use a thesis version of their software Vissim, without which
this project would not be possible.
Gothenburg, May 2019
Pontus Ahlström and Fatemeh Shayan

CHALMERS, Architecture and Civil Engineering, Master’s Thesis ACEX30-19-33 1
1 Introduction
An introduction to the project, “Evaluating design alternatives for a complete street in
Gothenburg, Sweden, using microscopic simulation”.
1.1 Background In the modern world of city planning, working with already existing infrastructure and
repurposing existing space is becoming more and more important in order to adapt to
changing transportation behaviors. Sustainable development has as much to do with
creating new innovative solutions for mobility as with rethinking what already exists and
making modifications. One action more and more used in city planning as cities grow,
often coupled with densification efforts, is to ban motorized vehicles or to make walking
speed streets in city centers or areas particularly susceptible to local air- or noise pollution.
This is often done in order to promote other, more sustainable, modes of transport such
as walking, cycling and public transport.
The city of Gothenburg, Sweden's second largest city, is growing and is expected to
increase its population by 150 000 inhabitants and 80 000 new jobs until 2035 making it
the center of a labor market with 1,7 million inhabitants (Göteborgs Stad: Trafikkontoret,
2014). Gothenburg city authorities have adopted a transport strategy called “Gothenburg
2035: Transport strategy for a close-knit city” where they describe how transportation in
the city is planned to expand and adapt to this growth (Trafikkontoret, 2014). One of the
goals specified in the transport strategy is that 35 % of all trips 2035 should be made by
walking or cycling. A bicycle program has been adopted in order to help reach this goal
where further goals and plans for how to improve cycling in Gothenburg is presented. For
example, the city wants to triple the number of bicycle trips made from 2011 to 2025
(Göteborgs Stad: Trafikkontoret, 2015).
Cycling is a space-efficient, economic and healthy transport mode. In order to make
cycling more attractive and encourage people to use more bicycle for traveling,
Gothenburg plan on improving bicycle infrastructure and facilities, including for example
an adequate number of secure bicycle parking spaces and an efficient bicycle network
with separation from, and priority over other transport modes. Furthermore, safety and
minimal conflicts with other road users is a priority in developing a sustainable bicycle
network. As stated in the previously mentioned transport strategy: “Cycling should be
regarded as its own transport mode and should as a rule be clearly separated from other
transport modes” (Göteborgs Stad: Trafikkontoret, 2014).
One of the major commercial streets of Gothenburg is Kungsportsavenyen, or Avenyn
for short. Avenyn contains a lot of shops and restaurants as well as many nightclubs and
pubs making it a popular destination for both tourists and the domestic population. The
high commercial value and the closeness to the rest of the central city means that it should
be easy to travel to-, from- and on Avenyn with a bicycle. Car traffic on Avenyn itself is

2 CHALMERS, Architecture and Civil Engineering, Master’s Thesis ACEX30-19-33
relatively light, although some of the crossing streets have a higher traffic load. The road
is missing separate bicycle infrastructure on most of the stretch meaning that bicycles
share the road with motorized vehicles. The sidewalk is not meant for bicycles but the
large width, leading to a perceived higher feeling of safety, combined with occasional
low density of pedestrians, often leads to cyclists using the sidewalk instead of the road
or generally finding it hard to know where to go.
Gothenburg city has made a general design plan for how they envision
Kungsportsavenyen in the future. The goal of the city authorities is to have public
transport by trams in the middle of Avenyn with bicycle paths either side, and furnished
zones as well as pedestrian zones closest to the buildings. This vision includes removing
all motorized vehicles, including buses, from Avenyn but allowing them on the crossing
streets (Göteborgs Stad: Stadsbyggnadskontoret, 2013). The city authorities have a clear
vision for more bicycle use on Avenyn and in the city in general as can be seen in previous
paragraphs. Improving bicycle infrastructure seems to be a good idea in order to make
transportation in Gothenburg more sustainable but what impacts will it have on other
modes of traffic? In the case of Avenyn, one of the largest uncertainties is how improved
bicycle infrastructure would affect pedestrian safety and mobility, which the city also
wants to treat as its own transport mode, as well as the mobility of public transport. The
goal specified in the Gothenburg 2035 plan is to have 35 percent of trips made by walking
or cycling and increasing one of the two might lower the other. Is it “worth” improving
bicycle infrastructure if the mobility of pedestrians, sometimes the largest transport mode
in the study area, is impacted negatively? How can the bicycle infrastructure be designed
so that it has a minimal negative impact on other modes of transportation? Is banning cars
from the street worth the effort or is the difference in travel times for other transport
modes insignificant? Where will the cars go instead?
Many cities in Europe of similar size and historic significance have parade streets like
Kungsportsavenyen meaning that a case study of design alternatives of the street could
potentially be applicable elsewhere too. Environmentally friendly transport modes like
cycling are becoming more popular throughout Europe, especially following the
increasing sales of electric bikes and cities need to adapt their streets to accommodate the
increased number of cyclists.
1.2 Study area The area studied in the report is part of the street Kungsportsavenyen, in Gothenburg,
Sweden. Most parts of Avenyn was built in the late 1800s with the last stretch up to
Götaplatsen to the south built in the early 1900s for the Gothenburg Exhibition, a world’s
fair held in Gothenburg in 1923. The street has, in some places, up to ten-meter-wide
sidewalks along its 860 meters length (Avenyföreningen, n.d.). Parts of streets crossing
Avenyn are included in the study area as well, as most of the motorized vehicles utilizing
Avenyn either just cross it or drive along it a block or two before exiting. Beginning from
north to south, the streets crossing Avenyn that are included in the study are called:

CHALMERS, Architecture and Civil Engineering, Master’s Thesis ACEX30-19-33 3
Parkgatan, Storgatan, Vasagatan, Kristinelundsgatan, Engelbrektsgatan, Geijersgatan,
Viktor Rydbergsgatan and Berzeliigatan, see Figure 1.1 below. A square called
Götaplatsen is located to the south of the study area where Kungsportsavenyen, Viktor
Rydbergsgatan and Berzeliigatan meet. The only parts of Avenyn itself which has
separate bicycle lanes today are to the north of the study area, beyond Parkgatan, and one
block in the middle of the study area between the intersections with Vasagatan and
Kristinelundsgatan, see Figure 1.1 below. There are existing bicycle paths crossing
perpendicular to Avenyn in the study area north of Parkgatan, at Vasagatan and at
Berzeliigatan, where new bicycle lanes along Avenyn could connect to the existing
bicycle network. The speed limit in the entire area is 50 km/h (Trafikverket, 2016), but
most cars are driving slower than that. Most intersections in the area are regulated using
priority rules but the intersections Kungsportsavenyen/Parkgatan as well as
Kungsportsavenyen/Engelbrektsgatan are signalized intersections. Public transport has
priority in both these intersections as well as in the priority rules on the rest of Avenyn.
Figure 1.1 The location of the study area in the city of Gothenburg is shown to the
left and a closer view of the study area with the crossing streets can be
seen to the right. (Google maps, 2019), (red markings and texts added by
the authors).

4 CHALMERS, Architecture and Civil Engineering, Master’s Thesis ACEX30-19-33
Figure 1.2 View of the study area, looking northwest from Götaplatsen (credit:
authors).
1.3 Aims and objectives The aim of the report is to investigate the impacts of improving the bicycle infrastructure
by constructing separate bicycle lanes along Kungsportsavenyen and the actions allowing
this to happen. Possible actions to allow for the construction of separate bicycle lanes
include for example taking space from existing sidewalks or freeing up space by banning
motorized vehicles to different degrees.
The microscopic traffic simulation software Vissim is used to model the study area.
Average travel times between predetermined departure and arrival nodes as well as
delays, speeds and level of service are produced from the models in order to investigate
and compare the different design scenarios. These are investigated for different transport
modes; motorized vehicles, public transport, bicyclists and pedestrians. This is done to
see how improving the traffic situation for one transport mode can affect other
surrounding modes of transportation. The simulations are also used to try to find areas of
conflict between the different transport modes, where most of the interactions between
the modes causing delays or safety hazards occur. In the case of pedestrians for example,
safety might be more important than travel times and speed when rating infrastructure
quality.

CHALMERS, Architecture and Civil Engineering, Master’s Thesis ACEX30-19-33 5
Questions to be answered in the study:
● How can the bicycle infrastructure on Kungsportsavenyen be improved?
● What is the mobility impact on different traffic modes if the bicycle infrastructure
is improved on Avenyn?
● Where can major areas of conflict between transport modes be found?
● How can the motorized vehicle traffic be redirected if vehicles are banned from
Avenyn?
1.4 Demarcations and study limits The study area is limited to the street Kungsportsavenyen in Gothenburg, also called
Avenyn as described in the “Study area” section, see Figure 1.1 for a visual
representation. The micro simulation model is limited to the chosen study area and the
infrastructure in the surrounding streets will be excluded from the model, for example
intersections between side streets of Avenyn. Future changes in infrastructure adjacent
to, or in other parts of the city that could influence the traffic flows are not included. This
is related to the fact that the study is made using a microsimulation. To further study the
effects on surrounding streets and traffic flows, a macrosimulation is recommended.
The different traffic modes and vehicle types that will be investigated are defined as
pedestrians, bicyclists, motorized vehicles and public transport. Motorized vehicles
include all cars and trucks, both private and corporate operated, as well as chartered buses
not used in public transport. This simplification is made as these vehicles behave
relatively similar to each other in a traffic analysis perspective and they share the same
lanes, points of origin and destinations in the model. Trucks delivering goods to the shops
and restaurants in the area will not be included in the models as they are relatively rare
and do not behave as regular vehicles. Public transport is divided in two different types,
buses and trams, as they share some space on the street but have some differences in the
routing.
No changes are made to the public transport even though the city planning office have
expressed a wish to ban not only motorized vehicles but also buses in public transport
from traveling on Avenyn in the future (Göteborgs Stad: Stadsbyggnadskontoret, 2013).
For the purpose of this study, buses continue to be allowed to travel in the public transport
lanes on Avenyn in all the scenarios banning cars as well. The bus lines stopping at the
bus stop at Götaplatsen, are allowed to continue using Avenyn but all other motorized
vehicles are prohibited. The decision to keep the bus traffic on the street in all scenarios
was made in order to be able to compare the mobility for public transport. Since trams
will still travel on the street there is still a need for public transport lanes along all of
Avenyn except between Engelbrektsgatan and Götaplatsen, meaning that most of the
infrastructure will need to remain either way. The width of the existing road and adjacent
parking spaces is enough between Engelbrektsgatan and Götaplatsen to allow for bus
lanes on the old road and new bicycle lanes on the old parking spaces.
6 CHALMERS, Architecture and Civil Engineering, Master’s Thesis ACEX30-19-33
The design options presented in the report are to be considered as general design ideas
and not precise plans capable of being directly implemented without further planning and
study. They are fitted as close as possible to the real locations and relationships using
aerial photos and approximations and might differ from reality. The same limits apply to
the data used in the model of for example traffic flows and signalized intersections.
CHALMERS, Architecture and Civil Engineering, Master’s Thesis ACEX30-19-33 7
2 Literature study
A literature study is included in the report to better understand what factors define an
improved infrastructure and how to build a complete, sustainable, street for all road users.
Travel times, delays and speeds are not enough to describe an improvement of
infrastructure. There are other factors that needs to be investigated as well, for example
how to achieve good safety standards, comfort and feeling of safety. There are many ways
of trying to determine the quality of a street and it is very hard to determine a “right” way
to do it since the user experience can differ greatly from person to person. One concept
commonly used is to describe the quality of a street using “quality of service” often
represented by “level of service values”. This concept is defined in the highway capacity
manual, often abbreviated HCM, published by the US transportation research board, and
is meant to “describe performance from the traveler point of view in a way that is designed
to be useful to roadway operators, decision makers and members of the community”
(Transportation Research Board, 2010).
2.1 Quality of service Quality of service is trying to describe how well the road is performing from the traveler’s
perspective which can include for example comfort and other more abstract
measurements compared to level of service which is based on measurements. Factors that
can influence perceived quality of service according to the HCM are:
● “Travel time, speed, and delay;
● Number of stops incurred;
● Travel time reliability;
● Maneuverability (e.g., ease of lane changing, percent time-spent-following other
vehicles);
● Comfort (e.g., bicycle and pedestrian interaction with and separation from
traffic, transit vehicle crowding, ride comfort);
● Convenience (e.g., directness of route, frequency of transit service);
● Safety (actual or perceived);
● User cost;
● Availability of facilities and services;
● Facility aesthetics; and
● Information availability (e.g., highway wayfinding signage, transit route and
schedule information).” (TRB, 2010)
This all means that quality of service is hard to easily determine and put into numbers.
Ways of determining quality of service of a road include surveys of users, tracking
complaints and models based on previous surveys. It also means that determining quality
of service from a model of a street like in this project is not possible since not all the
parameters can be modeled. All these factors should be considered when constructing

8 CHALMERS, Architecture and Civil Engineering, Master’s Thesis ACEX30-19-33
new infrastructure, but to be able to quantify the quality of the street more easily, level of
service can be used instead.
A study made in Nanjing, China, (Bai, Liu, Chan, and Li, 2017) showed that the comfort
of cyclists on mid-block bicycle paths with mixed bicycle traffic (including regular
bicycles, electric bicycles and electric scooters similar to motorcycles or mopeds) was
largely influenced by:
● Age of the person;
● Type of two-wheeled vehicle;
● Volume of vehicles;
● Width of the bicycle lane;
● Proportions of conventional bikes, e-bikes and e-scooters;
● Physical separation between motorized, bicycle and pedestrian lanes;
● Slope of the bicycle lane;
● Number of access points (conflicts with other modes);
● Roadside land use;
The report also drew the conclusion that the likelihood of poor perceived comfort was
most likely for e-bikes since they are faster than regular bikes but slower than e-scooters
forcing e-bike riders to be more aware of traffic both behind and in front. The higher
speeds of e-scooters meant that the comfort of e-scooters compared to regular bikes was
likely to be poorer (Bai et al., 2017).
These results could be applicable in Gothenburg as well since regular bicycles, electric
bicycles and (since the end of 2018) a new type of electric scooters are present in the city
as well. One big difference between the two cities however is that the two types of
scooters are very different. Electric scooters in China are similar to mopeds while they
are similar to electric kick scooters in Sweden. Both are, however, supposed to be limited
to 20 km/h but the compliance of the manufacturers to these limits seem to be debated in
both countries.
2.2 Level of service Level of service is a quantitative measurement based on for example pedestrian density
or vehicle delay, meant to correspond to, and give an indication of, quality of service. The
level of service is scored on a scale from LOS A which is best to LOS F which is worst.
The calculated LOS, A to F, is meant to correlate as close as possible to what people
would rate a road if asked to rate it based on quality of service from A to F. Measures
used to determine LOS are called “service measures” (TRB, 2010). There are different
formulas used to calculate LOS depending on the type of road and situation, i.e. freeways,
highways, urban streets, urban intersections, signalized or non-signalized intersections as
well as whole intersections or a specific approach. Furthermore, the HCM defines
different ways of calculating LOS based on different road users, for example cars, public

CHALMERS, Architecture and Civil Engineering, Master’s Thesis ACEX30-19-33 9
transport, bikes or pedestrians. The reason for this is that the perceived level of service
for bicycles and pedestrians might have more to do with for example feeling of safety and
comfort compared to more speed and delay focus for cars. As a rule, car and bicycle LOS
is mostly based on parameters relating to vehicle delay while pedestrian LOS is based on
parameters related to pedestrian density (PTV AG, 2018)
How to calculate level of service for bicycles at a signalized intersection approach in an
urban environment according to the HCM:
● Step 1: Determine bicycle delay
● Step 2: Determine the bicycle LOS-score
● Step 3: Convert LOS-score to LOS
Another calculation method is used to determine LOS for cars for an entire urban
intersection. First, delay is calculated, and the values are then compared to threshold
values based on previous research and surveys to directly get a level of service for the
entire intersection. This is also the method used by Vissim to calculate bicycle LOS. The
thresholds can be seen below:
Table 2.1 LOS limits used by Vissim, as defined in the HCM (TRB, 2010)
Signalized intersection Non-signalized intersection
LOS A Delay < 10 s. (Could also be caused by no volume or no vehicle movement
due to traffic jam)
LOS B > 10 s to 20 s > 10 s to 15 s
LOS C > 20 s to 35 s > 15 s to 25 s
LOS D > 35 s to 55 s > 25 s to 35 s
LOS E > 55 s to 80 s > 35 s to 50 s
LOS F > 80 s > 50 s
According to a study made by the Community Planning Association of Southwest Idaho,
COMPASS, where they investigated the LOS on the road network in Treasure Valley in
Idaho using a software based on the HCM called Q/LOS, the most important parameters
for LOS calculations can be seen in Table 2.2 below (COMPASS, 2014). The parameters
are ranked in order of relative importance, beginning with the most important one.
Table 2.2 The most important parameters for LOS calculations according to
COMPASS.
Pedestrian LOS Model Bicycle LOS Model
1. Existence of a sidewalk 1. Average width of the outside
(automobile) through lane
2. Sidewalk/roadway separation 2. Motorized vehicle volumes
3. Motorized vehicle volumes 3. Motorized vehicle speeds
4. Motorized vehicle speeds 4. Heavy vehicle/truck volume
5. Pavement condition

10 CHALMERS, Architecture and Civil Engineering, Master’s Thesis ACEX30-19-33
2.3 Street design The study made by COMPASS mentioned above, investigate LOS of a system from a
complete street perspective, where “Complete Streets are street designs that consider all
transportation modes including pedestrians, bicyclists, motorists, and public
transportation, focusing on the operation of safe and accessible streets for all users.
Complete Streets are for everyone regardless of age or ability, whether they are
commuting by bicycle to work, walking to school, or just crossing the street.”
(COMPASS, 2014). In other words, the level of service was investigated for cars, public
transport, bikes and pedestrians to investigate if the LOS is lacking for one or more of
these modes. The concept of complete streets however seems very focused on the fact
that all modes of traffic should be equally accommodated on all streets, something that
does not necessarily need to be the case. This is especially true when comparing US and
European cities, since the modal share of cars as private transportation is generally
considerably higher in the United States (UN-Habitat, 2014).
However, the concepts of complete streets, comfort, quality of service and level of
service, are all useful tools to have in mind when constructing a new street or
infrastructure to ensure a sustainable, safe and user-friendly design for all road users.

CHALMERS, Architecture and Civil Engineering, Master’s Thesis ACEX30-19-33 11
3 Method
Five different scenarios are modeled in the microsimulation software PTV Vissim. The
base scenario, called scenario one in the report, consists of the street as it looks today and
is modeled to be able to compare the impact of changes made to the infrastructure with
the current situation. Scenario two involves taking space away from the pedestrian
sidewalks and using it for bicycle lanes instead. The third scenario involves banning
motorized vehicles from traveling along Avenyn itself and using the old roads for bicycle
lanes while allowing car traffic to cross Avenyn from all side streets. Scenario 4 and 5 is
similar to scenario 3 in that vehicles are banned from traveling on Kungsportsavenyen,
but they are banned from crossing it as well except at one location at either Götaplatsen
or Engelbrektsgatan respectively. The time of day modeled is considered a worst-case
rush-hour between 16:00-17:00.
3.1 Data input used for the model
Data used in the project consists of geometry of the street and intersections, traffic rules
in the study area, traffic counts and distributions aa swell as observations of transport
mode behavior. The data is collected from site investigations, and through contact with
traffic authorities. An overall geometry is gathered from online map services like google
maps and Bing maps. Traffic counts and distributions are obtained through
Trafikkontoret, the local traffic authority. Traffic rules are obtained by site investigations
as well as through Trafikverket and Trafikkontoret.
3.1.1 Geometry
Avenyn is modeled as only being roads for different modes of transport, pedestrians,
bicycles, motorized vehicles and public transport. Modelling of the roads is simplified by
excluding buildings entrances, temporary locations and different forms of vegetation. On
some stretches, sidewalks are modeled narrower than in reality to simulate the effect of
temporary outdoor seating areas used on the street. Altitude differences and inclinations
along Avenyn are not considered even if it could affect the acceleration of vehicles since
the impact is assumed to be small, the street is fairly level. Similar geometry is modelled
for all scenarios, meaning that as a comparative model the impact of elevation on the
result will be negligible. An existing separate side-lane for taxis between Götaplatsen and
Engelbrektsgatan is added to the model to show that it’s there, but without traffic since
the volumes are low, not peaking during the regular rush-hour and is the same for all
scenarios. Parking lots and loading zones along Avenyn are not included in the geometry
of model.

12 CHALMERS, Architecture and Civil Engineering, Master’s Thesis ACEX30-19-33
3.1.1.1 General geometry
The general geometry of the street is obtained using google maps with the tool “measure
distance” (Google maps, 2019). It is important to note that this results in approximated
distances and not exact measurements, but the accuracy is assumed to be good enough
for the purposes of this study. The streets with the approximated widths and locations are
then fitted as close as possible to a background of aerial photographs from Bing maps
aerial view included in Vissim (Bing maps, 2019).
3.1.1.2 Bicycle lanes
Gothenburg city have developed demands for the width of bicycle lanes based on amount
of traffic and type of bicycle path. Bicycle paths are categorized in three different classes:
commuting bicycle roads, general bicycle roads and local bicycle roads. Together, these
three types of roads form a network with increasingly finer mesh. The idea is that the
demands on speeds and mobility is highest for the commuting bicycle roads making it
easier for people to move quickly on larger distances in the network. Once a cyclist gets
closer to his or her destination, they can use the general network with slightly lower
demands for mobility and finally the local network to travel the last stretch. Local bicycle
paths are often not identified as such and are used to connect properties and businesses to
the larger network. These classifications, and the demands set for each, can be found in
the report “Cykelprogram för en nära storstad 2015-2025” (Göteborgs Stad:
Trafikkontoret, 2015) and are presented in Table 3.1 below. The infrastructure on Avenyn
is currently classified as a general bicycle path. The same can be said for Vasagatan which
crosses Avenyn, even though it is the street with the highest bicycle flows in the entire
city (Ramboll/Göteborgs Stad: Trafikkontoret, 2018).
Table 3.1 Demands on bicycle path widths set by the Gothenburg traffic authorities.
(Göteborgs Stad: Trafikkontoret 2015)
Commuting bicycle path Width, one-way path Width, two-way path
Fewer than 500 bikes/max-h 2,0 m 3,0 m
501-1000 bikes/max-h 2,4 m 3,6 m
More than 1001 bikes/max-h 3,0 m 4,8 m
General bicycle path Width, one-way path Width, two-way path
Fewer than 500 bikes/max-h 1,6 m (Avenyn, current flow) 2,4 m
501-1500 bikes/max-h 2,0 m 3,6 m
More than 1501 bikes/max-h 2,4 m 4,8 m
3.1.2 Cyclists
The average number of bicyclists traveling on Vasagatan per day each month for the past
three years can be seen in Figure 3.1 below. Highest average flows are measured in May
and September (Göteborgs Stad: Trafikkontoret, 2018).

CHALMERS, Architecture and Civil Engineering, Master’s Thesis ACEX30-19-33 13
Figure 3.1 Average number of bikes/day each month at Vasagatan (Göteborgs Stad:
Trafikkontoret, 2018)
Gathering the exact number of bicycles and their routing percentages was not possible in
the timeframe of the project. A separate study would be needed just to investigate bicycle
routing in the entire study area. Keeping this in mind, the bicycle flows in the study area
are approximated based on data gathered by trafikkontoret (Ramboll/Göteborgs Stad:
Trafikkontoret, 2018) and the routings are assumed based on estimations by the authors.
The data was gathered in May 2018 which is, as can be seen in Figure 3.1 above, one of
the months with the highest bicycle flows. Maximum total flows on each of the streets
leading from the intersection between Avenyn and Vasagatan are used as somewhat fixed
values and the rest of the flows are assumed and corrected against this fixed intersection.
The study area is divided to two sections, north and south to simplify the
Origin/Destination matrix, abbreviated OD matrix. Figures 3.2 and 3.3, show the origin
and destination locations for bicycles and the corresponding OD matrices can be found in
Table 3.2 and 3.3. In the tables, the columns represent the “from” or origin point and the
rows represent the “to” or destination points. Vasagatan has the highest incoming and
outgoing traffic flow of cyclists into the area (D and E in figure 3.2). The other high flows
are at Götaplatsen (H and G in figure 3.3).

14 CHALMERS, Architecture and Civil Engineering, Master’s Thesis ACEX30-19-33
Figure 3.2 Origin/destination points for cyclists in the northern half of the study
area.
Table 3.2 Bicycles routing and relative flows between points in Figure 3.2
To-From A B C D E F
A 0 0 19 83 40
B 0 0 0 0 0
C 10 0 0 0 0
D 63 0 0 177 50
E 44 0 0 234 62
F 35 0 0 37 80
Figure 3.3 Origin/destination points for cyclists in the southern half of the study
area.

CHALMERS, Architecture and Civil Engineering, Master’s Thesis ACEX30-19-33 15
Table 3.3 Bicycles routing and relative flows between points in Figure 3.3
To-From A B C D E F G H
A 0 0 27 0 0 63 62
B 0 0 3 0 0 6 6
C 0 0 0 0 0 0 0
D 23 0 2 35 0 7 8
E 18 0 2 30 0 8 7
F 11 0 1 1 4 0 0
G 50 0 5 7 13 0 100
H 50 0 5 7 13 0 100
3.1.3 Pedestrians
A study made by Avenyföreningen (Avenyföreningen, n.d.) show that the number of
pedestrians in the study area is higher during the summer, see figure 3.4.
Figure 3.4 Pedestrians statistics at Vasagatan (Avenyföreningen, n.d.)
Figure 3.4 shows that the number of pedestrians might be 50% higher during the summer
season compared to winter. Similar to bicycle data on flows and routing decisions, the
time frame and scope of the project did not allow for a comprehensive investigation into
exact numbers. The required data about the maximum number of pedestrians during peak
hours was found in the same study made by trafikkontoret as the bicycle data. The OD
matrix was constructed in the same way as for bicycles, with fixed values in the
intersection at Vasagatan. Table 3.4 shows the thirteen locations used on the edge of the
study area as well as six public transport locations used for the OD matrix.

16 CHALMERS, Architecture and Civil Engineering, Master’s Thesis ACEX30-19-33
Figure 3.5 Origin/destination locations for pedestrians in the study area.
Table 3.4 Pedestrian routing and relative flows between points in Figure 3.5
To-From 101 102 103 104 105 106 107 108 109 110 111 112 113
101 0 4 4 30 6 3 4 5 2 1 100 100
102 0 0 2 9 15 2 3 5 4 2 100 100
103 5 5 2 0 2 0 2 0 2 1 1 1
104 5 5 4 2 0 2 0 3 0 0 1 1
105 34 34 0 2 35 0 2 0 2 3 15 15
106 20 20 2 0 40 2 0 2 0 0 3 3
107 2 2 0 3 0 3 5 0 2 1 2 0
108 2 2 3 0 5 0 5 2 0 1 0 2
109 6 5 0 4 0 5 0 4 15 1 2 0
110 3 2 4 0 2 0 4 0 15 0 0 2
111 1 1 1 0 1 0 2 0 1 0 0 2
112 100 100 2 0 8 4 5 3 15 3 0 50
113 100 100 0 3 1 6 3 5 0 10 1 60
PT1 26 26 2 2 50 26 2 2 5 3 1 15 15
PT2 26 26 2 2 50 26 2 2 5 3 1 15 15
PT3 30 31 2 2 51 26 3 3 36 4 0 18 17
PT4 30 31 2 2 51 26 3 3 36 4 0 18 17
PT5 5 5 1 1 0 0 1 1 5 3 1 25 30
PT6 5 5 1 1 0 0 1 1 5 3 1 25 30

CHALMERS, Architecture and Civil Engineering, Master’s Thesis ACEX30-19-33 17
At first, pedestrian origins from public transport was included in the models. However,
the simultaneous arrival of 10-15 pedestrians to the simulation whenever a tram arrived
at a public transport stop caused a lot of interruptions to the simulation and increased the
simulation time significantly, sometimes even causing crashes. A decision was therefore
made to remove these pedestrians from the system which is why no arrivals from PT1-
PT6 are included in Table 3.4. To make up the loss of pedestrian numbers, all other
arrivals are increased by 20 %, something which is not reflected in Table 3.4. The relative
flows presented are still the same as the ones used in the model, but the final pedestrian
inputs used are increased by 20 % compared to Table 3.4. The total amount of pedestrians
per hour in the simulation after these changes were 70 percent of the original assumed
amount, which was deemed acceptable for the purpose of the study as the numbers are
based on a measured maximum pedestrian flow and the numbers are the same in all design
scenarios.
3.1.4 Motorized Vehicles traffic
The study area is divided in two sections: North and South with respectively five and
seven locations at the boundaries of the simulation area used in the OD matrices as shown
in Figures 3.6 and 3.7. The traffic flow for the motorized vehicles, speed distribution and
the percentage of different type of vehicles is taken from the Trafikkontoret web page
(Göteborgs stad, n.d.). The maximum number of vehicles per hour in the afternoon for
the last available year on Avenyn and the other crossing streets are investigated.
Motorized vehicle type shares were taken from the data as well, and is divided into 93,5%
normal cars, 6 % heavy goods vehicles (HGV) and 0,5 % buses. The resulting OD
matrices can be seen in Tables 3.5 and 3.6. Some of the streets have one-way traffic and
is therefore only used as either an origin or a destination. The largest flows of motorized
vehicles enter and exit the study area at Parkgatan, Engelbrektsgatan and Berzeliigatan.
Figure 3.6 Origin/destination locations for motorized vehicles in the northern half
of the study area

18 CHALMERS, Architecture and Civil Engineering, Master’s Thesis ACEX30-19-33
Table 3.5 Motorized vehicle routing and relative flows between points in Figure
3.6
From-To A B C D E
A 990 0 20 30
B 0 0 0 0
C 0 30 0 0
D 0 0 0 0
E 0 20 0 0
Figure 3.7 Origin/destination locations for motorized vehicles in the southern half
of the study area
Table 3.6 Motorized vehicle routing and relative flows between points in Figure
3.7
From-To A B C D E F G
A 0 5 30 5 3 7
B 0 0 0 0 0 0
C 0 0 475 10 7 13
D 0 30 375 15 10 20
E 0 0 0 0 0 0
F 0 4 6 10 0 360
G 0 6 9 15 0 330

CHALMERS, Architecture and Civil Engineering, Master’s Thesis ACEX30-19-33 19
The relative flows are kept the same, where possible, in all modeled scenarios. In places
where turning directions are removed because of traffic restrictions, that possibility is
simply removed in the vehicle routing decisions and the remaining traffic is allowed to
travel following the rest of the available routing decisions and their respective relative
flow distributions. Traffic inputs are moved from one street to other similar ones in cases
where no traffic is allowed at all on a street that previously allowed it. This means that
the total number of vehicles per hour in the entire model is kept the same in all model
scenarios allowing for a “worst case” approach. See Appendix C for more details about
vehicle volumes and routing used in modeling the design scenarios.
3.1.5 Public Transportation
Both tram and bus lines are present in the study area, all of which go either in or out of
the study area to the north. The other entrance/exit to the system for the respective lines
can be seen in the table below. Travel routes for the public transport lines and arrival
times are from the public transport company Västtrafik’s website (Västtrafik, 2018).
Table 3.7. Public transport lines in the study area
Entering/exiting the study area at street: Bus line: Tram line:
Southwest on Vasagatan 19, 753* 2, 3, 7, 10, 1**
Northeast on Engelbrektsgatan 4, 5
Southwest on Berzeliigatan 18, 55
Northeast on Berzeliigatan 52
* Enters/exits northeast on Parkgatan instead of continuing northwest on Avenyn as all
other lines.
** Only travels through the study area at night
3.1.6 Traffic signals
Information about the traffic signals in the intersections between Kungsportsavenyen and
Parkgatan as well as with Engelbrektsgatan was collected using a field study. The
intersections were filmed for 10 and 15 minutes respectively during the time of day that
is modeled, i.e. between 16:00 and 17:00. The videos were then analyzed to get an idea
of how the signal groups, stages, green times, intergreens and public transport priority are
set up. Some assumptions and simplifications were later made, especially for the
intersection with Engelbrektsgatan to make the intersections work in the model and to be
able to code priority for trams, see chapter 4.1.3 for more detailed descriptions of how the
signals are modeled in VISSIM, which signal stages and green times was used etc.

20 CHALMERS, Architecture and Civil Engineering, Master’s Thesis ACEX30-19-33
3.2 Simulation softwares A description of the used software and software add-ons can be seen below.
3.2.1 PTV Vissim
PTV Vissim is a commercial software widely used in the industry for microscopic
simulations of traffic. It is developed by the German company PTV group. The version
of the program used in this project is an academic license for PTV Vissim 11 and the
installed version is Vissim 11.00 - 06.
3.2.2 Vissim add-on: Viswalk
Viswalk is a software both available as a standalone product or as an add-on module to
Vissim used to model pedestrian behavior more realistically. The default way of modeling
pedestrians in Vissim is as “vehicles”, keeping to certain routes and lanes, overtaking
each other as vehicles and with little interactions with oncoming “traffic”. Viswalk allows
for pedestrians in both directions on the same link with more interactions and “social
forces” affecting the way pedestrians move in the model, see Section 3.3.3 for more
information about how pedestrians are modeled in Viswalk.
3.2.3 Vissim add-on: VisVAP
The add-on software VisVAP is used in the project to be able to code priority for public
transport in signalized intersections. VAP stands for “vehicle-actuated programming”
(PTV AG, 2018). The program logic works as a flow chart where detection of public
transport can be included, and the signal stages can be switched accordingly. A (.vap)
logic file can be exported from VisVAP and is one of two files needed in Vissim to make
a VAP-controlled signal control.
3.2.4 Vissim add-on: Vissig
Vissig is an add-on included in the thesis license version of Vissim that is used to produce
a signal data file (.pua), for example for a signalized intersection with fixed times, or to
get the basic signal data used together with a (.vap) logic file to describe a VAP signal
control. See Section 4.1.3 for more information about how these programs are used to
program a VAP-controlled intersection.

CHALMERS, Architecture and Civil Engineering, Master’s Thesis ACEX30-19-33 21
3.3 Modeling traffic behavior Different models and theories are used in microscopic modeling to describe different
kinds of transportation modes. A description of how the theories used can be found below.
3.3.1 Motorized vehicles
The traffic flow model in Vissim consist of two parts, a car-following model and a lane-
changing model (PTV AG, 2018). Vehicle parameters are defined stochastically as:
desired speed, desired acceleration/deceleration, maximum acceleration/deceleration,
size, weight, power etc. and vehicles are then given variation using a random seed.
The car following model in Vissim is based on the psychosocial Wiedemann model from
1974 which is continuously calibrated by the Karlsruhe Institute of Technology to match
current driver behavior (PTV AG, 2018). The Wiedemann model considers the fact that
drivers do not immediately match the speed of vehicles in front but might for example
slow down too much when trying to estimate the speed of leading vehicles. This is
especially true for fast moving vehicles with a large difference in speed between the
approaching and leading vehicle and leads to fluctuations in the speeds of vehicles
following each other while drivers over-adjust their speed. According to the Wiedemann
model, there are four driving states when traveling on a road: free flow, following,
approaching and braking.
There are two different versions of the Wiedemann model used in Vissim, Wiedemann
74 and Wiedemann 99, which are based on the same principle as described above. The
later version is more complex and includes more parameters for the car following model.
Wiedemann 74 is more suitable for urban traffic while Wiedemann 99 better describes
highway traffic (PTV AG, 2018). Wiedemann 74 is used for modeling motorized vehicles
and public transport in the study.
3.3.2 Bicycles
The Wiedemann model (car following model), mentioned above, was used to model
bicycles as well meaning that they are modeled more or less like cars but with different
parameter values determining their behavior. In the case of bicycles however, Wiedemann
99 was used to allow for more parameter choice, see Section 4.1.1.1 for more information
on parameter choices.

22 CHALMERS, Architecture and Civil Engineering, Master’s Thesis ACEX30-19-33
3.3.3 Pedestrians
Two models with different functions can be used to perform simulation of pedestrians in
Vissim. One, is the default model in Vissim, the previously mentioned Wiedemann
model. The add-on software PTV Viswalk can also be used to simulate pedestrians based
on the Helbing model. In Helbing's model, pedestrians move around freely in two spatial
dimensions and their characteristics are calculated while simulating the model. Helbing's
model is more flexible and realistic and include more details. Since pedestrians behavioral
is complex, very irregular and not predictable, the social force model described by
Helbing and Molnár, 1995 is applied to the pedestrian movements in this project.
3.3 Design model scenarios Five scenarios of the study area are modeled in order to compare how improved bicycle
infrastructure would affect bicycle mobility and the mobility of other transport modes.
Traffic counts for different modes is assumed to be above average in all scenarios to better
capture the “worst case” scenario and conflict areas.
The total traffic volume for each transport mode including motorized vehicles, public
transport, pedestrians and bicycles are kept the same in all scenarios. For scenarios 3, 4
and 5, the numbers of motorized vehicles as well as routing decisions, are in some streets
moved to the other streets in order to keep the same number of motorized vehicles in
study area.
All new bicycle lanes are constructed as general bicycle path, in one way, with 1.6 m
width as described in Section 3.1.1.2.
Taxis are allowed to travel on the northbound road or bus lane between Götaplatsen and
Engelbrektsgatan to pick up and drop off passengers at the hotel located on the street in
all scenarios. They are not included in the model for simplification since they are kept in
all scenarios.
3.3.1 Scenario 1: Current situation
In scenario 1, the study area is modeled as it looks today in order to have a traffic situation
to compare the other four scenarios with. See Figure 3.8 for a description of motorized
vehicle flows in the current situation. Bicycles traveling on Avenyn have separate bicycle
lanes north of Parkgatan and between the intersections with Vasagatan and with
Kristinelundsgatan. On the rest of Kungsportsavenyen, they share the road with
motorized vehicles.

CHALMERS, Architecture and Civil Engineering, Master’s Thesis ACEX30-19-33 23
Figure 3.8 Motorized vehicle flows for current situation
3.3.2 Scenario 2: Separate bicycle lanes by taking space from existing
sidewalks
For scenario 2, cars are allowed to continue to use Avenyn and the space required for new
separated bicycle lanes is taken from the existing sidewalks. This would be a possibility
since the sidewalks are generally very wide on Avenyn but could pose a problem because
the city wants to use much of the sidewalks for outdoor seating for cafés and restaurants
as well as public art exhibitions, significantly limiting the available space. Another slight
downside with this alternative is that there is a row of trees growing next to the road on
both sides of Avenyn. Ideally the bicycle lanes are to be placed between these trees and
the existing roads to keep pedestrians from accidentally stepping out into the bicycle lanes
(Göteborgs Stad: Trafikkontoret, 2015). However, the limited space means that they have
to be placed on the side of the trees closest to the sidewalks meaning that there is no space
divider between the cyclists and pedestrians.

24 CHALMERS, Architecture and Civil Engineering, Master’s Thesis ACEX30-19-33
People riding bikes that want to transition from Avenyn to Engelbrektsgatan in the
intersection between the two streets travel on the road itself, inside the intersection, and
not around on bicycle lanes. They have their own traffic light stage to make it safer, but
it could lead to more delays for the other modes of traffic. If there would have been
separated bicycle lanes on Engelbrektsgatan too, it would make more sense to have
bicycle lanes crossing Avenyn as well.
The motorized vehicles continue to be allowed to travel as they are today since the space
for bicycle lanes are taken from the sidewalks instead, see Figure 3.8 for vehicle routing.
3.3.3 Scenario 3: Banning cars on Avenyn but allowing them to cross
All motorized vehicles, except public transport, are banned from using Avenyn but are
allowed to cross in the intersections. Even more possibilities for crossing Avenyn in a car
compared to today are opened up, limiting the negative impacts on motorized vehicle
mobility. Vehicles are allowed to cross at each spot where a side street meets
Kungsportsavenyen.
Scenario 3 is the one that closest resembles the city authorities’ future vision for Avenyn
where all car traffic is prohibited along Avenyn but is allowed to cross on the intersecting
streets, as described by the city authorities in the document “Avenyn:
Gestaltningsprogram” (Göteborgs Stad: Stadsbyggnadskontoret, 2013). Although it
might not include opening up more possibilities than today for crossing Avenyn by car as
included in this scenario. Buses used for public transport are still allowed to use the street
in the model which is the biggest difference from the authorities’ vision. The reason for
this is that the aim of the project is to investigate the effects of improving bicycle
infrastructure on mobility for the different road users, not the effects of removing public
transport. The public transport is therefore kept the same in all scenarios. An assumption
is made that a major remake of all bus lines stopping at Avenyn with the new
infrastructure needed will be such a large change that it is unlikely to happen very soon.
Investments in bicycle infrastructure is assumed to be more urgent since the city wants to
triple the percentage of bicycle trips made by 2025.
In this scenario, traffic mobility at Parkgatan, Engelbrektsgatan and Götaplatsen is kept
the same as in scenario 1. New possibilities created to cross Avenyn in both directions at
Vasagatan, westbound on Storgatan and eastbound on Kristinelundsgatan instead of
turning on to Avenyn, see Figure 3.9 below. See Section 4.1.3 for traffic signal controls.
Public transport lanes are kept in the middle of Avenyn and new, separated, bicycle lanes
are constructed on either side.

CHALMERS, Architecture and Civil Engineering, Master’s Thesis ACEX30-19-33 25
Figure 3.9 Motorized vehicle flows for scenario 3.
3.3.4 Scenario 4: Banning cars, no crossing except at Götaplatsen
Scenario four is similar to the previous scenario but puts even higher restrictions on cars
and other motorized vehicles. All motorized vehicle traffic, except public transport, is
banned from Avenyn altogether, both from driving on Avenyn and from crossing it. They
are only allowed to cross in the ends of the study area at Parkgatan and Götaplatsen. The
largest impact on car traffic in this scenario is that cars are no longer allowed to cross
Avenyn using Engelbrektsgatan, the second most trafficked street in the study area after
Parkgatan. Scenario four includes the largest change to existing infrastructure and is made
in order to see what the results are of a complete ban of motorized vehicles on
Kungsportsavenyen.
Turnarounds are constructed where a side street meets Kungsportsavenyen to make the
street more accessible for delivery vehicles, or people dropped off or picked up by cars
or taxis. The traffic flows on the previously open side streets are moved to either
Parkgatan to the north or Götaplatsen to the south. See Figure 3.10 below for motorized
vehicle flows and Section 4.1.3 for traffic signal controls.
Public transport lanes are kept in the middle of Avenyn and separated bicycle lanes are
constructed on either side just like in scenario 3.
26 CHALMERS, Architecture and Civil Engineering, Master’s Thesis ACEX30-19-33
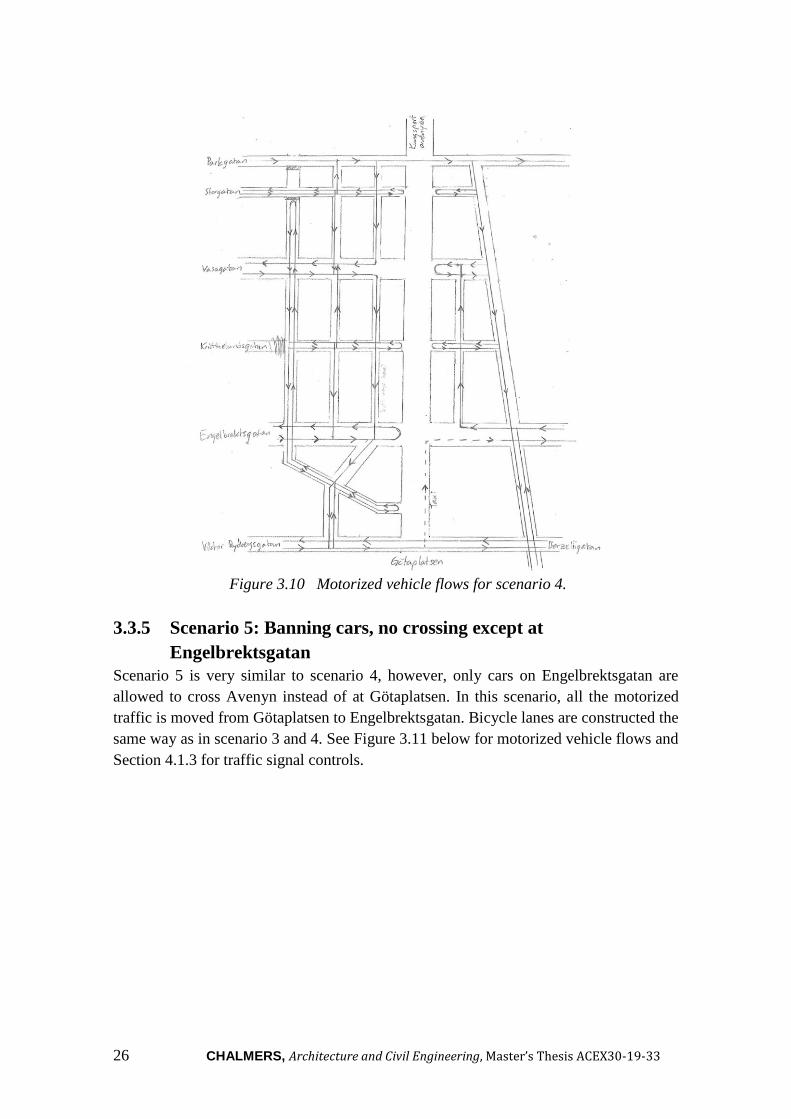
Figure 3.10 Motorized vehicle flows for scenario 4.
3.3.5 Scenario 5: Banning cars, no crossing except at
Engelbrektsgatan
Scenario 5 is very similar to scenario 4, however, only cars on Engelbrektsgatan are
allowed to cross Avenyn instead of at Götaplatsen. In this scenario, all the motorized
traffic is moved from Götaplatsen to Engelbrektsgatan. Bicycle lanes are constructed the
same way as in scenario 3 and 4. See Figure 3.11 below for motorized vehicle flows and
Section 4.1.3 for traffic signal controls.

CHALMERS, Architecture and Civil Engineering, Master’s Thesis ACEX30-19-33 27
Figure 3.11 Motorized vehicle flows for scenario 5.
3.4 Generating results Average travel times between predetermined departure and arrival points, average speeds,
delays and level of service will be generated in order to compare the different scenarios
with each other for the different transportation modes. Bicycle quality of service will also
be discussed for each design scenario based on the literature study. The simulations will
also be used to visually identify areas with major conflicts between transport modes to be
able to make suggestions for improvements. More information about result measurements
can be found in the results chapter, Chapter 5.
28 CHALMERS, Architecture and Civil Engineering, Master’s Thesis ACEX30-19-33
4 Vissim model
The data and methods described in Chapter 3 was used in the software PTV Vissim to
model and simulate the traffic conditions in each scenario. Some aspects of the modeling
process is described in this chapter.
4.1 Model setup The most important parameters and assumptions made in the model setup are presented
below. Parameters not described in this chapter can be assumed to be using the default
values in Vissim or defaults used by traffic analysts at WSP. The streets modeled in
Vissim are fitted to a background composed of aerial photographs which is not shown in
the report for copyright reasons.
4.1.1 Speed related distributions and driving behaviors
Some speed and acceleration distribution curves are changed from the default values to
better represent reality in the studied area. The new values used in the model can be seen
below.
4.1.1.1 Bicycle distributions
Many bicycle parameters were changed in Vissim to better represent real life bicyclists.
The default values in Vissim leads to bicycle behavior very similar to that of motorized
vehicles. New speed distributions, accelerations and types of vehicle links were added,
based on a report by COWI about modeling bicycle behavior of cyclists in Copenhagen
using Vissim (COWI, 2013). The two new desired speed distributions created and used
in the model are called “Copenhagen-bike” and “Reduced speed bike”. “Copenhagen-
bike” is used as the basic speed distribution for bikes in the system as a whole while
“Reduced speed bike” is used in reduced speed areas added to 90-degree turns. Three new
driving behaviors for different types of links were created called “Normal bicycle path”,
“Bicycle waiting zone” and “Approaching bicycle waiting zone”. “Normal bicycle path”
was applied to all basic separated bicycle lanes. The two others were used to allow for
smaller distances between cyclists in, or before, bicycle waiting zones at traffic lights in
scenario 1 where cars and bikes share the road. See Appendix A for exact speed and
acceleration/deceleration distributions and definitions of driving behavior.
4.1.1.2 Motorized vehicle distributions
Three new speed distributions for motorized vehicles were added to Vissim to better
represent the measured speeds of vehicles noted in the collected vehicle data (Göteborgs
stad, n.d.). The desired speed distributions were named “Slow veh Avenyn”, “Med veh
Avenyn” and “Fast veh Avenyn”. Slow vehicle distribution is used for vehicles traveling
on smaller side streets of Avenyn, medium on Avenyn itself and fast on the roads
Parkgatan, Engelbrektsgatan, Berzeliigatan and Viktor Rydbergsgatan. See Appendix A5
for more information about the speed distributions. Accelerations and deceleration
distributions are kept as default Vissim values.

CHALMERS, Architecture and Civil Engineering, Master’s Thesis ACEX30-19-33 29
The vehicle composition for motorized vehicles on Avenyn is based on the traffic data
provided by Trafikkontoret (Göteborgs stad. b, n.d.). 93,5 % of motorized vehicles are
assumed to be cars, 6 % heavy goods vehicles and 0,5 % buses not for public transport.
A new motorized vehicle driving behavior was defined as well, called “Cars sharing with
bikes, keep left”. This is used where cars are approaching stop lights with a bicycle
waiting zone in front and a narrow lane for bicycles to pass a car-queue to reach the
waiting zone on the right-hand side of the street. The main purpose of this driving
behavior definition is to allow for less space between cars and bicycles when passing each
other.
4.1.2 Bicycle paths
New bicycle paths will be modeled as being 1,6 meters wide and separated so that the
northbound path is on the east side of the street and the southbound path is on the west
side. The width is based on the values in Table 3.1 and the data collected on bicycle counts
on Avenyn showing a maximum hourly count of around 300 cyclists per hour. The
number of bicycles will likely end up below 500 bikes/max-h even with increasing bicycle
traffic and some generated growth of traffic due to better infrastructure. Avenyn is located
close to an almost parallel bicycle commuting path on Södra vägen 50-150 m to the north
east meaning that it will likely not change designation from a general bicycle path to a
commuting bicycle path anytime soon, see Section 3.1.1.2. Some bicycle lanes are
modeled as having two lanes parallel to each other to make the queueing at intersections
more realistic. This means that bicycles going straight can pass others who are standing
still waiting to turn for example instead of going one after another.
4.1.3 Traffic signals
The five different traffic signal controls used in the modeled scenarios can be seen below.
The same signal control is used in all five scenarios for the intersection between
Kungsportsavenyen and Parkgatan since very little change in the intersection between the
scenarios. Three different signal controls are used for the intersection with
Engelbrektsgatan, one for the base scenario, one for scenarios 2, 3 and 5 and one for
scenario 4. The last signal control is used for the intersection with Berzeliigatan and
Viktor Rydbergsgatan at Götaplatsen in scenario 4.
A signal control how the traffic lights in an entire intersection is programmed and
controlled. Signal group is a single or a group of traffic lights for a specific transport mode
while a signal stage is a collection of signal groups that share green time simultaneously.
For example, two signal groups, one for pedestrians and one for cars, can share the same
signal stage and be allowed to use an intersection at the same time.

30 CHALMERS, Architecture and Civil Engineering, Master’s Thesis ACEX30-19-33
In figures showing signal stages, grey areas represent regular roads mostly used by
motorized vehicles and sometimes bikes, orange represents bike lanes, blue represents
sidewalks and pink bus lanes.
4.1.3.1 Parkgatan, all scenarios
The same signal control is used for all scenarios at Parkgatan. The signal control consists
of two stages, one where the cars on Parkgatan have green light as well as the pedestrians
crossing Avenyn. The other is where public transport, cars and bicycles on Avenyn have
green light as well as pedestrians crossing Parkgatan. Observations during the field study
of the signalized intersections in the area concluded that trams have priority in the
intersections but not buses. Therefore, the intersection is programmed to detect incoming
trams and activate the public transport stage of the signal control as soon as possible after
the minimum green time for the cars on Parkgatan is met. If no trams are detected the
public transport stage is activated after a maximum green time for the cars on Parkgatan
is met. See Figure 4.1 Below for the signal stages and Figure 4.2 for the program logic
coded in VisVAP.
Figure 4.1 The two signal stages for the signalized intersection at Parkgatan.

CHALMERS, Architecture and Civil Engineering, Master’s Thesis ACEX30-19-33 31
Figure 4.2 The program logic coded in VisVAP for the signalized intersection at
Parkgatan.
The program logic in VisVAP can be seen for example in Figure 4.2 above. It is
programed using “questions” in hexes and “actions” in squares continuously checked
over and over. Once the logic reaches “End” it starts over again from the beginning at
“Start”. If the answer to a “question” is “yes” then the program continues looking where
the rightward pointing arrow shows and if the answer is “no” it looks where the downward
pointing arrow indicates. “Stage_active” first of all looks at which signal stage is currently
active, “MinGreen” and “MaxGreen” asks if minimum or maximum green time for
different signal stages have been met. “Detection” asks is a tram has been detected or not
and “Interstage(X, Y)” means that the action to change from signal stage X to signal stage
Y should be taken. “RedTime”, used in later intersections, looks at the duration of red
time for a signal stage similar to “MinGreen” or “MaxGreen”.
4.1.3.2 Engelbrektsgatan, scenario 1
Field observations of the intersection at Engelbrektsgatan determined that the signal
control is complex and hard to code using VisVAP. Some simplifications were therefore
made to make intersection as realistic as possible while still more easily programmable.
The Signal control has two main stages, one with green time for vehicles traveling on
Engelbrektsgatan and one for vehicles traveling on Avenyn, with a third stage for trams
which is activated as soon as possible only if a tram is detected. Some signal groups are
activated in more than one signal stage. See Figure 4.3 Below for the signal stages and
Figure 4.4 for the program logic coded in VisVAP.

32 CHALMERS, Architecture and Civil Engineering, Master’s Thesis ACEX30-19-33
Figure 4.3 The signal stages in the intersection at Engelbrektsgatan for scenario 1.
Figure 4.4 The program logic coded in VisVAP for the signalized intersection at
Engelbrektsgatan for scenario 1.
4.1.3.3 Engelbrektsgatan, scenario 2, 3 and 5
The signal control for the intersection with Engelbrektsgatan is very similar to the one
used in scenario 1 and uses the same signal stages with an added stage for bicycles
traveling on Avenyn bicycle lanes, to allow them to traverse the intersection before the
other vehicles on Avenyn are allowed to go. See Figure 4.5 Below for the signal stages
and Figure 4.6 for the program logic coded in VisVAP.

CHALMERS, Architecture and Civil Engineering, Master’s Thesis ACEX30-19-33 33
Figure 4.5 Signal stages for the intersection at Engelbrektsgatan for scenario 2, 3
and 5.
Figure 4.6 The program logic coded in VisVAP for the signalized intersection at
Engelbrektsgatan for scenarios 2, 3 and 5.

34 CHALMERS, Architecture and Civil Engineering, Master’s Thesis ACEX30-19-33
4.1.3.4 Engelbrektsgatan, scenario 4
All motorized vehicles except trams and buses are banned from both Avenyn and
Engelbrektsgatan in the intersection meaning that the conflicts between buses, bicycles
and pedestrians can be solved by using conflict areas (right-of-way rules). The trams still
have priority which is solved using a new signal control with two stages. In the first stage,
trams have green light, which is triggered when a tram is detected, and all conflicting
traffic has red light. Traffic lights are turned off in the second stage when no trams are
detected meaning that the intersection is treated as a regular unsignalized intersection
where the previously mentioned conflict areas determine the right of way. Traveling along
Avenyn itself is considered as the main direction of travel having priority in this case. See
Figure 4.7 below for the signal groups and Figure 4.8 for the program logic coded in
VisVAP.
Figure 4.7 Signal stages for the intersection at Engelbrektsgatan for scenario 4.
Figure 4.8 The program logic coded in VisVAP for the signalized intersection at
Engelbrektsgatan for scenario 4.

CHALMERS, Architecture and Civil Engineering, Master’s Thesis ACEX30-19-33 35
4.1.3.5 Götaplatsen, scenario 4
The intersection at Götaplatsen in scenario 4 is the only one to use fixed times instead of
being VAP controlled. This intersection is controlled using simple conflict area rules for
the rest of the scenarios, but that solution could not support the increased traffic caused
by banning traffic on Engelbrektsgatan in scenario 4. A worst-case scenario was assumed
in which all traffic previously using Engelbrektsgatan was moved to either Parkgatan or
Viktor Rydbergsgatan/Berzeliigatan, instead of taking routes outside of the study area.
Because the traffic on Avenyn itself consists of only buses in public transport, bicycles
and a few taxis (not included in the simulation), and is therefore very light compared to
the perpendicular traffic at Götaplatsen, a simple fixed time signal control is assumed
where a majority of the green time is dedicated to the traffic on Berzeliigatan/Viktor
Rydbergsgatan. From the field study of the other signalized intersections on Avenyn it
was determined that only trams, not buses, have priority in the intersections on Avenyn
which is why a signal stage with fixed times was deemed sufficient. The cycle time for
the signal control program is 80 seconds with green times and interstages as shown in
Figure 4.10 below. Signal stage 1 consists of signal group 1 and 4 in Figure 4.10, stage 2
of signal group 2 and stage 3 of signal group 3.
Figure 4.9 The signal stages at the intersection at Götaplatsen.

36 CHALMERS, Architecture and Civil Engineering, Master’s Thesis ACEX30-19-33
Figure 4.10 Signal control used at Götaplatsen in scenario 4 as seen in VISSIG.
4.1.4 Comparison of the critical intersections
There are four larger intersections in the study area where a lot of interactions between
different modes of transportation occur. The intersections with Parkgatan,
Engelbrektsgatan and at Götaplatsen have large volumes of motorized vehicles crossing
Avenyn compared to the rest of the study area. At the intersection with Vasagatan it is
instead the large number of public transport vehicles as well as pedestrians and bicycles
resulting in most interactions. These four intersections are compared below by showing
how each one is modeled in Vissim. Different colors in the model represent areas used
by different traffic modes. Grey areas represent regular roads where primarily motorized
vehicles travel but also public transport and bicycles when designated areas for those
traffic modes are absent. Orange lines represent bicycle lanes, pink one’s bus lanes and
blue areas indicate pedestrian walking areas. In some cases, several modes of transport
exist at the same place at which point only one of the colors is clearly visible depending
on which of the links was added last in Vissim. Examples of this are pedestrian crossings
and waiting zones for bicycles at traffic lights. Figure 4.11 - 4.14 shows comparisons of
the four mentioned intersections in the different design scenarios.

CHALMERS, Architecture and Civil Engineering, Master’s Thesis ACEX30-19-33 37
4.1.4.1 Parkgatan
Figure 4.11 Comparison of the modeled intersection at Parkgatan for the five
scenarios.

38 CHALMERS, Architecture and Civil Engineering, Master’s Thesis ACEX30-19-33
4.1.4.2 Vasagatan
Figure 4.12 Comparison of the modeled intersection at Vasagatan for the five
scenarios.

CHALMERS, Architecture and Civil Engineering, Master’s Thesis ACEX30-19-33 39
4.1.4.3 Engelbrektsgatan
Figure 4.13 Comparison of the modeled intersection at Engelbrektsgatan for the five
scenarios.

40 CHALMERS, Architecture and Civil Engineering, Master’s Thesis ACEX30-19-33
4.1.4.4 Götaplatsen
Figure 4.14 Comparison of the modeled intersection at Götaplatsen for the five
scenarios.
CHALMERS, Architecture and Civil Engineering, Master’s Thesis ACEX30-19-33 41
4.2 Assumptions In order to be able to run the simulation, have a suitable amount of data to investigate and
to be able to set up the model, some assumptions and simplifications are made with
regards to how the system is modelled, which are presented below.
● All transport modes, including motorized vehicles, bicycles and pedestrians are
assumed to follow the traffic rules, meaning for example that bicycles in the model
cannot travel the wrong way on a one-way street, on the sidewalk or outside the
designated bicycle lane or road. Pedestrians are also confined to designated
sidewalks and does not cross roads or bicycle lanes other than on pedestrian
crossings. This is not the case in reality, especially in the study area, where
bicycles often go on the sidewalks or the wrong way on one-way streets and
pedestrians cross the street almost everywhere.
● All vehicles, cyclists and pedestrians are assumed to enter the system and
immediately travel to their destination where they exit the model. There are no
pedestrians entering shops, waiting a while and then walking out again for
example, and no bicyclists parking their bicycle on Avenyn, becoming
pedestrians. The only entity waiting in the system other than vehicles in a queue
are pedestrians waiting for public transport in designated public transport waiting
zones.
● No increase of traffic is investigated in this study to look at future flows.
Maximum values for pedestrian flows, vehicle flows, and bicycle flows are
already used as inputs in the model meaning that the average traffic is, and will
be, less that in the model, even in the near future.
● Some pedestrians had to be removed from the first iteration of the model for the
simulation to be able to finish on the computer used. The add-on software Viswalk
and the large number of pedestrians moving about in the model caused the
simulation to terminate after about 3000 simulation seconds. An observation was
made that the computer seemed to have the most problems coping with the
software at the exact moments when pedestrians were arriving with public
transport. A decision was therefore made to remove all pedestrians arriving by
public transport, and to add back some of the lost number of pedestrians by
increasing all other pedestrian inputs by 20 percent. This resulted in the total
pedestrian input to the system being 70 percent of the original input which allowed
the simulations to finish while still using almost all available computing power of
the used hardware. More about how this was implemented can be found in Section
3.1.3.
● Some pedestrian paths are not included in the model, for example on Vasagatan,
where in reality there are three possible pedestrian paths or sidewalks in each
direction. These are simplified as being two to the west of the intersection to
accommodate the public transport stops, and one east of the intersection in the
middle divider, which was assumed to be the path most used by pedestrians. This
assumption was made to simplify the model in order to have less origin and

42 CHALMERS, Architecture and Civil Engineering, Master’s Thesis ACEX30-19-33
destination nodes and links. The side streets Storgatan, Kristinelundsgatan,
Engelbrektsgatan, Geijersgatan, Berzeliigatan and Viktor Rydbergsgatan are all
modeled as having a sidewalk on one side of the road only, instead of both, and
Parkgatan is modeled as having no sidewalk, also to limit the number of arrival
and departure nodes.
● The effects on outdoor seating on the width of the sidewalks along Avenyn was
approximated using google maps and google street view. This means that the
placement and size of the outdoor seating areas is based on pictures mostly from
May and June 2017. The placement and size of these areas might change from
year to year, especially the freestanding temporary seating areas meaning that the
impact of a bicycle path can differ from year to year depending on the size of
outdoor seating areas.
● Trams and buses are added according to the time schedule and are not randomly
arriving to the system.

CHALMERS, Architecture and Civil Engineering, Master’s Thesis ACEX30-19-33 43
5 Results
In this chapter, observations and results produced from the five modeled design scenarios
and for the different transport modes are presented. A total time of 5400 seconds was
chosen as the simulation run time where the first 1800 seconds are allowed to run without
gathering results to make sure that the model is saturated with traffic before data gathering
begins. 10 simulation runs are made for each scenario for better accuracy in the results
and average results from the 10 runs are presented below. The simulation resolution is 5
time steps per simulation second.
Key measurements investigated and compared in the study are: Travel time, Delay, Speed
and Level of Service. Other results, harder to quantify, are also addressed such as bicycle
quality of service as well as identified conflict areas between modes.
5.1 Travel times Travel times are measured between predetermined points located at the same locations in
the study area in all five scenarios. Times are measured for pedestrians, bicyclists, as well
as public transport in the form of trams and buses. Cars are not included in the comparison
of travel times as they are not able to travel between the same points in all scenarios. It
is, for example, possible to travel from Parkgatan to Vasagatan by car in scenario 1 and
2 but not in scenarios 3-5. The effect of changing bicycle infrastructure on car traffic is
therefore only measured by comparing vehicle delay in crucial intersections instead, see
Section 5.2 below. The points in the system between which travel times for pedestrians
are measured can be seen in Figure 5.1 and bikes and public transport in Figure 5.3 and
5.5 below.
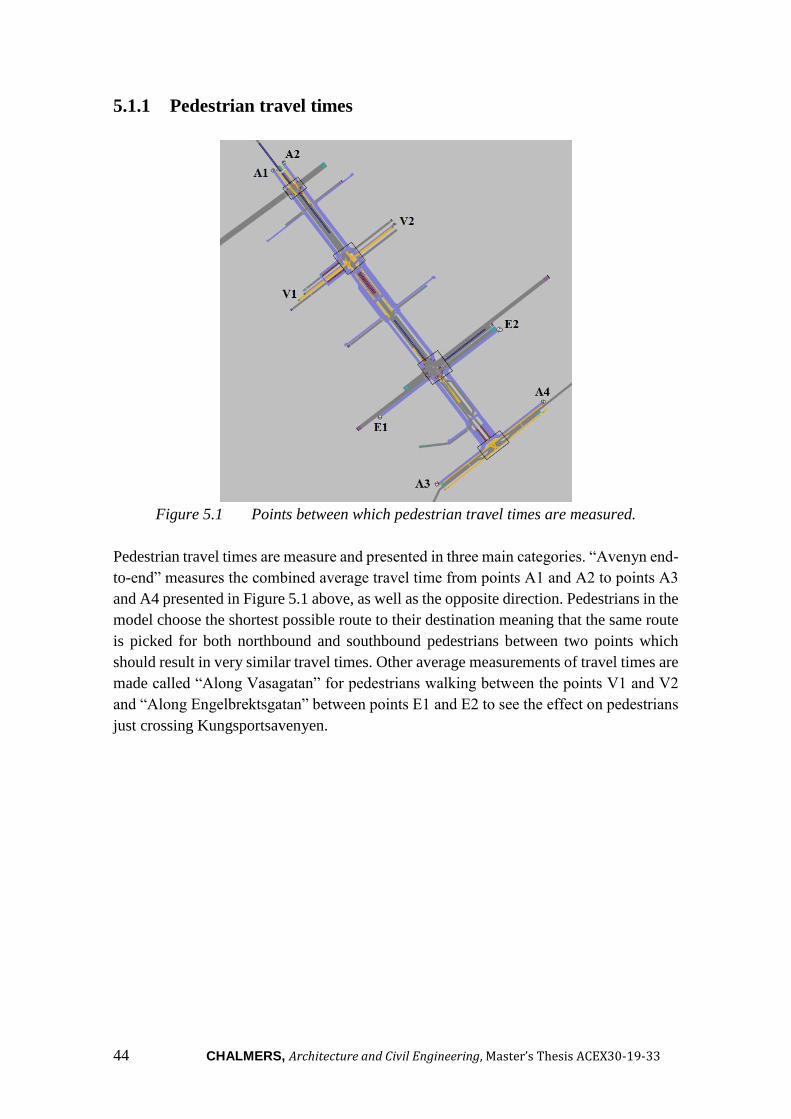
44 CHALMERS, Architecture and Civil Engineering, Master’s Thesis ACEX30-19-33
5.1.1 Pedestrian travel times
Figure 5.1 Points between which pedestrian travel times are measured.
Pedestrian travel times are measure and presented in three main categories. “Avenyn end-
to-end” measures the combined average travel time from points A1 and A2 to points A3
and A4 presented in Figure 5.1 above, as well as the opposite direction. Pedestrians in the
model choose the shortest possible route to their destination meaning that the same route
is picked for both northbound and southbound pedestrians between two points which
should result in very similar travel times. Other average measurements of travel times are
made called “Along Vasagatan” for pedestrians walking between the points V1 and V2
and “Along Engelbrektsgatan” between points E1 and E2 to see the effect on pedestrians
just crossing Kungsportsavenyen.

CHALMERS, Architecture and Civil Engineering, Master’s Thesis ACEX30-19-33 45
Figure 5.2 Simulated results of average pedestrian travel time between predefined
points.
As can be seen in figure 5.2, no clear change in the travel time for pedestrians could be
seen from simulation runs along Vasagatan. However, for the Avenyn end-to-end
measurement, the travel time is lower for all other scenarios compared to scenario 1. The
biggest difference can be seen between scenario 1 and 4 where the latter is 6 % less than
the current travel times. For crossing Engelbrektsgatan, the travel times are on average
about the same in scenarios 1, 3 and 5 while slightly higher in scenario 2 and lower in
scenario 4. Average travel times for pedestrians along Engelbrektsgatan in scenario 4 is
11,4 % less than scenario 2 and 8,7 % less than today's situation in scenario 1.

46 CHALMERS, Architecture and Civil Engineering, Master’s Thesis ACEX30-19-33
5.1.2 Bicycle travel times
Figure 5.3 Points between which bicycle travel times are measured.
Bicycle travel times are measured along Avenyn for four different routes. Route 1 is the
southbound route from B1 to B2, route 2 southbound from B1 to B3, route 3 is northbound
from B2 to B1 and route 4 is the northbound route from B3 to B1, described in Figure 5.3
above. Only travel times for bicycles traveling the whole stretch of Avenyn, end-to-end,
are measured. The effects on bicyclists crossing Avenyn is investigated using delay
measurements in each intersection instead, see Section 5.2 below.

CHALMERS, Architecture and Civil Engineering, Master’s Thesis ACEX30-19-33 47
Figure 5.4 Simulated results of bicycle travel times along the whole stretch of Avenyn.
Figure 5.4 shows that the travel time for bicycles in all routes was significantly lower for
scenario 4 compared to all other scenarios. In scenarios 2, 3 and 5, the travel times are
lower than the current situation for southbound routes with around 13-15 % difference.
The northbound routes however show less of a difference in the same comparison, where
route 3 only shows slightly lower values and route 4 a slightly increased or similar travel
times to today. The graph shows that scenario 4 results in the shortest travel times by far
and that scenario 5 is on average slightly better than scenarios 1-3.

48 CHALMERS, Architecture and Civil Engineering, Master’s Thesis ACEX30-19-33
5.1.3 Public transport travel times
Figure 5.5 Points between which travel times for public transport are measured.
One of the most important traffic modes on Kungsportsavenyen is public transport, which
is why the travel times are measured in all scenarios for all public transport lines, except
bus 753, and in both directions. Bus 753 was assumed to not be significantly affected by
the proposed changes to the infrastructure and makes up such a small part of public
transport in the system that no separate travel time measurement for the PT-line was
deemed to be of interest. The travel times for buses are measured in both directions
between PT1 and PT4 as well as between PT1 and PT5 and for trams between points PT1
and PT2 as well as PT1 and PT3. The point locations can be seen in Figure 5.5 above.
Bus line 18 and 55 travels between PT1 and PT4 while line 52 travels between PT1 and
PT5. Tram lines 4 and 5 travels between PT1 and PT3 and the rest of the tram traffic is
traveling between PT1 and PT2.

CHALMERS, Architecture and Civil Engineering, Master’s Thesis ACEX30-19-33 49
Figure 5.6 Simulated results of average travel time between predefined points for
buses in public transport.
The overall trend of bus travel times seen in Figure 5.6 shows that the travel times
decrease in all scenarios compared to scenario 1 except for the southbound bus line 52 in
scenario 2. The difference in average travel time is only 3 seconds however and could be
considered neglectable or within the margin of error. A significant decrease can be seen
for northbound buses when comparing scenario 1 to the rest. Longer travel times for
northbound buses in scenario 1 can be expected, since they share the road with cars and
bicycles at Engelbrektsgatan and have a bicycle waiting zone in front at the traffic light.
Southbound buses use the public transport lane when entering the intersection and have
a green light in two out of the three stages of the signal program, one of which is also
prioritized if a tram is detected, while northbound buses are only included in one, see
chapter 4.1.3.2. Removing potential conflicts between buses, cars and bicycles seem to
decrease the travel time overall. The scenario resulting in the shortest travel times for
buses on average is scenario 5.

50 CHALMERS, Architecture and Civil Engineering, Master’s Thesis ACEX30-19-33
Figure 5.7 Simulated results of average travel time between predefined points for
trams.
The results of travel time for trams show a trend of increasing of travel times in scenarios
2, 3 and 5, while travel times in scenario 4 is on average lower than in scenario 1 when
looking at tram lines 4 and 5. This is most likely a result of the implementation of one
more signal stage in the signal control at Engelbrektsgatan where trams have priority. The
increased number of signal stages means that the trams on average need to wait slightly
longer for green time in the intersection. The difference in travel times for the rest of the
tram lines is negligible. Only small changes to the public transport infrastructure is
implemented in the northern parts of the study area in all scenarios and trams have priority
in all cases resulting in very small changes in travel times. To summarize, scenarios 2,3
and 5 show similar or slightly increased travel times compared to today and scenario 4
shows similar or slightly lower travel times compared to today.
5.2 Delays The node evaluation tool is used in Vissim to evaluate the average delay per vehicle type
at each intersection. “Delay” describes, in a unit of time (seconds), the amount of time
lost by a vehicle in an intersection. This is done by summing up the approach delay and
the acceleration delay. The approach delay is defined as the difference between the time
it takes for a vehicle to pass the intersection and the time a vehicle needs to pass the
intersection at free flow. Nodes are applied for each intersection separately. Parkgatan,
Vasagatan, Engelbrektsgatan and Götaplatsen are found to be the most important
intersections and results were gathered for each node separately. Results regarding
bicycles, cars and buses, measured in seconds, at each intersection are shown in Figures
5.8-5.11. Vissim separates motorized vehicles into cars, heavy goods vehicles (HGVs)
and buses meaning that delay is measured separately for these vehicle types. Since cars

CHALMERS, Architecture and Civil Engineering, Master’s Thesis ACEX30-19-33 51
make up 93,5 % of the motorized vehicles and they all travel on the same roads, an
assumption was made that measured delay for cars is representative for the whole
“motorized vehicle” category for comparative purposes. Similarly, buses not in public
transport only makes up 0,5 % of the motorized vehicle category meaning that the
measured delay for buses in the nodes and in the system can be assumed to be
representative for the buses used in public transport since they are much more commonly
occurring in the simulation.
5.2.1 Parkgatan intersection
Figure 5.8 Simulated average vehicle delays in the intersection at Parkgatan
Improvements in vehicle delay times can be seen in all scenarios for all traffic modes
compared to scenario 1. Out of the four scenarios where changes to the infrastructure has
been made, scenario 3 has the lowest delay for cars and buses but the highest for bicycles.
A similar, but switched, result can be seen for scenario 4 when comparing car and bicycle
delay. The reason for the long delays for cars in scenario 4 is most likely that traffic was
moved from Engelbrektsgatan to Parkgatan, increasing the amount of traffic on the street
by almost 20 %.

52 CHALMERS, Architecture and Civil Engineering, Master’s Thesis ACEX30-19-33
5.2.2 Vasagatan intersection
Figure 5.9 Simulated average delays in the intersection at Vasagatan.
Both bicycle and bus delays are slightly lower in scenarios 4 and 5 compared to the rest
but the results are very similar to each other. Note that the cars in scenario 3 have different
routes compared to scenario 1 and 2 but the delay is almost the same. The reason for
lower delay times in scenarios 4 and 5 for bikes and buses is likely that no cars are present
in the intersection in these scenarios.
5.2.3 Engelbrektsgatan intersection
Figure 5.10 Simulated average delays in the intersection at Engelbrektsgatan.

CHALMERS, Architecture and Civil Engineering, Master’s Thesis ACEX30-19-33 53
Scenario 4 has by far the lowest delay times for bikes and buses in the comparison, as a
result of banning car traffic from the intersection. Scenario 5 is causing more delay than
any other scenario for cars and bicycles but is still better than scenario 1 for bus delay,
likely because of motorized vehicle traffic flows being removed from Avenyn itself.
Scenarios 2 and 3 are both worse for cars and bicycles but better for buses compared to
the current situation in the intersection.
5.2.4 Götaplatsen intersection
Figure 5.11 Simulated average delays in the intersection at Götaplatsen.
Similarities can be seen between the intersection results from Götaplatsen and
Engelbrektsgatan. At Götaplatsen, motorized vehicle traffic is increased in scenario 4 and
removed in scenario 5. One difference when comparing the intersection at Götaplatsen
with the one at Engelbrektsgatan is that the scenario with increased traffic (scenario 4) is
still better than the current situation for bicycles but instead worse for buses. Another
difference compared to the intersection at Engelbrektsgatan, is that scenarios 2 and 3 are
both better than the current situation for all three transportation modes.

54 CHALMERS, Architecture and Civil Engineering, Master’s Thesis ACEX30-19-33
5.2.5 Average delay in system
Figure 5.12 Simulated average delays for cars and bicycles in the system as a whole.
Parkgatan and Vasagatan do not show significant change in delay times between
scenarios compared to Engelbrektsgatan and Götaplatsen. When the routes where cars are
allowed to cross Avenyn are limited, the delays increase on the remaining routes. As can
be seen in Figure 5.12, cars in scenario 4 and 5 have higher average delays than other
scenarios, especially in scenario 5, while the average delay is lower for scenario 2 and 3.
Separating cars from bicycles influence bicycle delay in the opposite way. All scenarios
show an average lower delay for bicycles compared to the current situation represented
by scenario 1 with the lowest being scenario 4. The average delay in the study area for
bicycles in scenario 4 is about 40 % less compared to scenarios 2,3 and 5 and 48,7 % less
than in the current situation.
5.3 Average speed in system Based on the network performance data gathered, the average speed for pedestrians and
bicycles in the entire study area is analyzed and presented in Figures 5.13 and 5.14 below.
The average speed of motorized vehicles is not included in the analysis as the cars do not
travel on the same streets in the different scenarios. This can for example mean that a
vehicle input for cars are moved from a slow street to a street where the vehicles drive
faster from one scenario to another or that they do not have the same origin and destination
locations, resulting in non-comparable values.

CHALMERS, Architecture and Civil Engineering, Master’s Thesis ACEX30-19-33 55
5.3.1 Pedestrian speed
Figure 5.13 Simulated average pedestrian speeds in the system for each scenario.
Although the most important factor for pedestrians might not be average speed but
pedestrian density, feeling of safety etc., it can still be noted that the results between the
five scenarios are very similar. The fastest average speed is 0,067 km/h or 2,2 % higher
compared to the slowest.
5.3.2 Bicycle speed
Figure 5.14 Simulated average bicycle speeds in the system for each scenario,
described for each simulation run.

56 CHALMERS, Architecture and Civil Engineering, Master’s Thesis ACEX30-19-33
The average bicycle speed is about 0,4-0,5 km/h faster in scenarios 2,3 and 5 compared
to the current situation. In scenario 4 it is 2,7 km/h faster, a 19 % increase compared to
scenario 1.
5.4 Bicycle infrastructure changes The main purpose of changing the infrastructure on Avenyn in this study is as previously
mentioned to improve bicycle infrastructure and mobility. Therefore, it is important to
see the effects on less quantifiable measures than previously addressed in this chapter. As
mentioned in Chapter 2, bicyclist quality of service and level of service is affected by
many parameters other than speed, travel time and delays.
5.4.1 Bicycle level of service
Level of service for bicycles is measured for each of the identified critical intersections
to better analyze if the changes made to the bicycle infrastructure in each scenario have a
significant impact. The level of service from the highway capacity manual mentioned in
chapter 2 is used in Vissim, where average delay is calculated and then directly translated
into LOS. The thresholds between LOS grades for vehicles and bicycles can be seen in
Table 2.1. According to the method described in the literature study in chapter 2, further
calculations are to be made to get LOS for bicycles after the delay has been calculated.
LOS is also to be calculated for each intersection approach separately. Vissim uses a
simplification by just using the same delay thresholds for both bicycles and cars, since
bicycles are basically modeled the same way as cars, as well as calculating the LOS for
the entire intersection rather than each approach separately. This results in hard-to-
quantify parameters such as comfort and perceived safety being somewhat neglected in
the results. It was assumed, however, to be sufficient for the purpose of this study as a
tool for comparing design alternatives.

CHALMERS, Architecture and Civil Engineering, Master’s Thesis ACEX30-19-33 57
Figure 5.15 The average bicycle level of service for the four major intersections. A is
the best level of service measured in the simulation and D is the worst.
Similar to the results of average delay, bicycle LOS remains the same in all scenarios for
the Parkgatan-, and Vasagatan intersections. The level of service results for
Engelbrektsgatan shows worse LOS for scenarios 2,3 and 5 but significantly better for
scenario 4 which resulted in LOS A. LOS A can be observed as well in the intersection
at Götaplatsen for scenarios 2,3 and 5 and LOS B for scenario 4 compared to a LOS C in
the current situation. LOS grades E and F was not reached in any of the scenarios when
looking at average LOS values.
5.4.2 Bicycle quality of service
As mentioned in the literature study in Chapter 2, quality of service for bicycles depend
on a lot of parameters that are hard to collect without surveys or similar methods. Some
comparisons between the scenarios can be made however regarding quality of service and
perceived comfort for bicycles:
● Regarding bicycle volumes, proportions of bicycle types, slope of bicycle lane,
roadside land use, width of bicycle lane and many other parameters, there is no
difference between scenarios. The same volumes and distributions were used in
the model for all scenarios and while the width of bicycle lanes is different in
scenario 1 compared to the rest, because bikes sometimes share the road with cars,
the same width was used for all new bicycle lanes.
● The biggest difference between scenarios can be seen in travel time, speed and
delay as mentioned in earlier sections of this chapter and in separation from-, and
number of conflict points with-, other transport modes.

58 CHALMERS, Architecture and Civil Engineering, Master’s Thesis ACEX30-19-33
○ Bicycles are separated from cars in all scenarios except in the current
situation (scenario 1). The separation between bicycles and pedestrians is
much better in scenarios 3-5 compared to scenario 2 where, because of
space restrictions, the bicycle lane is right next to the sidewalk.
○ Number of conflict points with other transport modes, i.e. number of
crossings of the bicycle paths, is worst in scenario 3 where even more
crossings are allowed compared to the current situation. Scenarios 4 and 5
are both better and similar to each other in number of conflict points even
though scenario 4 can be considered slightly better. This is because the
intersection at Engelbrektsgatan is more complicated than the one at
Götaplatsen and removing conflicts with cars there is more beneficial. At
the same time, removing the traffic lights means that cyclists need to be
more aware of crossing bicycles and pedestrians and less obvious
designated crossings could lead to more confusion. See Section 4.1.4 for
comparative figures of the modeled scenarios.
5.5 Conflict areas between traffic modes Some conflict areas between traffic modes were noticed when visually inspecting the
model during simulation runs. Two major conflict areas were identified, one is the
intersection at Vasagatan, and one is the intersection at Engelbrektsgatan. The
intersection at Götaplatsen could also be considered as a major conflict area in scenario
4 because of the large amount of traffic present there in that scenario.
5.5.1 Conflicts at Vasagatan
Vasagatan is the most crowded intersection in study area when looking at pedestrians and
bicycles. Existence of four public transport stations as well as many people who are
walking toward or waiting for trams or buses around stations, increase the conflict areas
between pedestrian and other traffic modes. Moreover, Vasagatan is the most traveled
bicycle path in Gothenburg which increases the possibility of collisions for cyclists at the
intersection. During rush hours, trams and buses continuously pass through Vasagatan
with short intervals in between, leading to interruptions of other traffic modes
movements.

CHALMERS, Architecture and Civil Engineering, Master’s Thesis ACEX30-19-33 59
Figure 5.16 Vasagatan from above, showing pedestrians, bikes and trams in the
simulation.
Figure 5.17 3D view of Vasagatan and potential conflicts.
5.5.2 Conflicts at Engelbrektsgatan
Engelbrektsgatan is arguably the most trafficked intersection in the study area and one of
the few places where large numbers of all transport modes are present. Cars, bikes and
buses share the same roads, especially in scenario one, traveling at different speeds which
could lead to conflicts. In scenario one, bus- and HGV-drivers need to be observant at the
bicycle waiting zones where visibility is limited, to make sure that bicycles in front are
noticed and not run over. Turning vehicles and pedestrians have green lights at the same
time which means that they both have to be observant of each other to avoid

60 CHALMERS, Architecture and Civil Engineering, Master’s Thesis ACEX30-19-33
misunderstandings. Some instances of “collisions” were observed when turning vehicles
were standing still waiting for pedestrians to cross for so long that vehicles from another
direction got a green light. In reality these types of collisions would most likely not occur,
since the accelerating cars would see the vehicles in front of them waiting, but it would
cause irritation and delays. The speed of the cars on Engelbrektsgatan is relatively high
as well, further increasing the potential for accidents in the intersection. The majority of
pedestrians traveling along Avenyn in the model chose to go on the northeast crossing
because pedestrians in the model choose the shortest route to the destination, combined
with the geometry of the model. This, combined with the assumed high number of
pedestrians, means that the pedestrian island in the middle of the crossing is heavily
congested and sometimes not enough to accommodate all pedestrians. This could
potentially be a problem in reality as well during peak pedestrian hours or big events in
the area.
Figure 5.18 Potential conflicts at Engelbrektsgatan seen from above.

CHALMERS, Architecture and Civil Engineering, Master’s Thesis ACEX30-19-33 61
Figure 5.19 3D view of Engelbrektsgatan and potential conflicts.

62 CHALMERS, Architecture and Civil Engineering, Master’s Thesis ACEX30-19-33
6 Discussion and conclusions
6.1 Discussion about the model A large number of pedestrians waiting for public transport can be observed at the end of
the simulated hour, especially at the public transport stops on Avenyn at Valand, close to
the intersection with Vasagatan. So many pedestrians are waiting that they can be
observed blocking each other’s path. This could be the effect of the way pedestrians are
modeled, some modeling parameters or an overestimation of the number of pedestrians
in the area wanting to travel by public transport. The queueing issues seem to be very
similar in all five scenarios however, and the impact on the comparative results are
therefore most likely neglectable.
Only conventional bicycle traffic is included in the study. No difference is made between
regular bicycles and electric bicycles in the traffic counts used as input for the traffic in
Vissim meaning that they both counts as just bicycles. There are also new services using
electric scooters in the city of Gothenburg launched in late 2018 and early 2019 gathering
increasing popularity as mentioned in Section 2.1. Electric scooters are placed throughout
the city and people can unlock them using an app on their phone, travel to their destination
and leave the scooter wherever. This could potentially lead to a big shift from pedestrians
walking on the sidewalks to behaving more like bicycles instead. A large enough shift
could cause major gridlocks on the bicycle infrastructure, but the popularity of the service
took off late in the duration of the study and it is still too early to say what the impact will
be. For this reason, no resulting increase of bicycle traffic is included in the study.
The signal controls used in the model is based on approximations following short visits
to the intersections. They could be further optimized to increase efficiency and the
optimal signal program might change between scenarios. These changes might further
influence the results of the study, but the results could be considered as a good
approximation of how changes to the infrastructure might influence transport flows in the
study area.
VISSIM is a simulation software based on mathematical theories regarding traffic
movement and behaviors. Some limitations by VISSIM could affect the results. For
instance, pedestrians are modeled to always take the shortest path to their destination in
this model. This means that pedestrians do not disperse evenly and when a large enough
stream of them walk a certain path it results in a high density on that zone and affect the
other modes negatively.
As seen in Section 5.4.1, level of service worse than the current situation could be
observed for bicycles when looking at the intersection at Engelbrektsgatan for most
scenarios. This is most likely caused by the fact that the bicycles were modeled as their
own traffic mode with their own signal group, and that they go through the “middle” of
the intersection instead of parallel to the pedestrian paths in the outskirts of the

CHALMERS, Architecture and Civil Engineering, Master’s Thesis ACEX30-19-33 63
intersection which is the most common way to do it. If bicycle paths were constructed as
such then the cyclists could go at the same time as the pedestrians in the signal control,
not needing to wait for their own signal stage, which would most likely reduce delay
times. The reason for why this type of intersection was not modeled is that no separate
bicycle paths exist on Engelbrektsgatan itself making modeling the transition from
bicycle path on Avenyn to shared road with cars on Engelbrektsgatan very complex. This
kind of solution would be possible in reality without separated bicycle paths on
Engelbrektsgatan. Cyclists would use common sense to navigate conflict areas with
pedestrians and vehicles when transitioning from Avenyn to Engelbrektsgatan and vice
versa, using sidewalks and available space to find gaps in traffic. The limitations of
vehicle and pedestrian behavior in a traffic simulation software however, made modeling
this type of intersection much too complicated for this study.
6.2 General discussion One potentially large impact of banning motorized vehicles on Avenyn in modeling
scenario 3, 4 and 5 is the limited accessibility for transports and deliveries to the shops
and restaurants on the street. There are some loading zones on Avenyn that would be
removed as a result of banning traffic which could lead to problems with deliveries. Some
of the businesses on the street already get their deliveries on the back-, or side-streets
while others rely on the loading zones on Avenyn itself. Some solutions for how to solve
the problem could be building loading zones on the side streets closest to Avenyn,
walking-speed driving areas on some parts of the pedestrian areas for delivery vehicles,
at all hours, during early mornings, or off-hours only. Decreased accessibility for
conventional transport vehicles combined with an improvement of bicycle infrastructure
could however lead to new possibilities for unconventional delivery methods such as
bicycle deliveries, which are already present in Gothenburg.
The results for pedestrian’s travel times and speeds do not show major changes between
different scenarios, with a largest change of 6 % in travel times, meaning that pedestrian
mobility is not significantly affected by the changed infrastructure. This most likely is a
result of the fact that the majority of the sidewalks on the street are very wide compared
to a usual city street. However, that does not mean that all scenarios should be considered
to be equal from a pedestrian point of view. Other factors affect pedestrian quality of
service and level of service more than just travel times. Similar to bicycle quality of
service, factors like separation from other transport modes and number of conflict points
have a large impact on the perceived quality of service, where the five scenarios are not
equal. Scenario 2 for example, would increase the conflicts between pedestrians and
bicycles by moving the bikes closer to the sidewalks. Scenario 3 have a good separation
between bicycles and pedestrians but potentially increase conflicts with cars. Both
scenario 4 and 5 achieves a good separation between transport modes as well as less
conflict points with other transport modes. However, they both involves causing higher
flows of cars in the few places where conflicts do occur. Access for people with

64 CHALMERS, Architecture and Civil Engineering, Master’s Thesis ACEX30-19-33
disabilities could get worse if car traffic is banned and should be addressed by expanding
disability parking on side streets closest to Avenyn.
The results indicate that the largest impact on travel times, delays and speeds in the study
area is the presence and amount of car traffic. Moving traffic flows from one intersection
to another improves the traffic situation in the intersection with less traffic and worsens
it in the intersection with more as expected. Removing the car traffic altogether
dramatically improves the situation for all other modes of transportation. Scenario 4
shows the best overall results for pedestrians, bicycles and public transport but would
likely cause a lot of problems for car traffic in and outside of the study area. It would
result in moving a lot of traffic from the two-lane street at Engelbrektsgatan to the one
lane street at Götaplatsen, increasing queue lengths to where it would likely interfere with
surrounding street flows not included in the modeled area. Götaplatsen is sometimes also
used for large events and concerts which makes having more traffic on the closest streets
even less viable. Scenario 4 is also likely the most expensive alternative with the biggest
changes to infrastructure. For these reasons, as well as it most likely being the one hardest
to sell to the public, scenario 4 will not be recommended as the best solution.
Comparatively, scenario 5 seems more easily implemented while still having good results
in most measured results, for example second best results in bicycle travel times and best
in bus travel times. It also achieves almost the same good results when looking at bicycle
and pedestrian quality of service with good separation between transport modes and fewer
conflict areas compared to scenarios 2 and 3. If Engelbrektsgatan can be kept open, the
impact on car traffic should be considerably less than in scenario 4. More actions can be
taken to ensure that the negative results in scenario 5 are lessened, for example
optimization of the traffic lights and further redesign of the intersection at
Engelbrektsgatan to fit the new traffic flows.
Traffic violations are not modeled in the study. In reality, it was observed at the signalized
intersections that the pedestrians and bicycles will go as long as no trams or motorized
vehicle is near, even if they have a red light for example. This means that real delays and
travel times are most likely shorter in reality compared to the model. Pedestrians in reality
also chooses shortest paths to their destinations by taking shortcuts not on designated as
pedestrian areas in the model meaning that the pedestrian’s density in reality is less.
6.3 Conclusions Changes made to the infrastructure at Engelbrektsgatan has the most impact on the results
of the simulation. This makes sense because that is the place in the study area where all
modes of transportation are present in large numbers today, pedestrians, bicycles, cars,
buses and trams.
The recommended scenario for improving bicycle infrastructure on Kungsportsavenyen
is Scenario 5. However, further studies are needed to investigate the effects on

CHALMERS, Architecture and Civil Engineering, Master’s Thesis ACEX30-19-33 65
surrounding streets from banning cars passing Götaplatsen and the rest of Avenyn. The
negative effects of scenario 5 will likely not be as bad as the result chapter shows because
people will choose other routes instead of all moving to Engelbrektsgatan. Further studies
are needed to optimize the signal control at Engelbrektsgatan to make the negative effects
even less, or to somewhat redesign it to better fit the new traffic distributions. Perhaps by
placing the bicycle lanes next to the pedestrian crossings instead, constructing separated
bike lanes on Engelbrektsgatan as well, thereby making bikes and pedestrians share green
time, removing the need for a separate signal stage for bikes. A good separation between
cars, bikes and pedestrians is achieved with less conflict areas and it is easier to implement
and sell to the public than scenario 4.
The scenarios suggested are just some possibilities of how to improve the bicycle
infrastructure on the street. Other options are possible as well, or a combination of isolated
parts of the scenarios presented. Comparisons of travel times, delays and speeds can be
made between the modeled results and real-life measurements to see how well the model
fits with reality. The surrounding area can also be modeled using a macrosimulation to
investigate the effects of banning traffic from Avenyn on the surrounding streets.

66 CHALMERS, Architecture and Civil Engineering, Master’s Thesis ACEX30-19-33
References
Avenyföreningen. (n.d.). Om Avenyn. Retrieved from:
https://www.avenyn.se/bra-att-veta/om-avenyn/ (2019-01-31)
Bai, L. Liu, P. Chan, C-Y. Li, Z. (2017). Estimating level of service of mid-block
bicycle lanes considering mixed traffic flow. Transportation Research Part A: Policy
and Practice, Volume 101, 203-217. doi: 10.1016/j.tra.2017.04.031
Bing maps. (2019). Map over Gothenburg. Retrieved from:
https://www.bing.com/maps/ (2019-04-15)
COMPASS. (2014). Complete Streets Level of Service. Idaho, USA. Retrieved from:
http://www.compassidaho.org/documents/prodserv/reports/CSLOSReportFinal.pdf
COWI. (2013). Micro simulation of cyclists in peak hour traffic. Copenhagen,
Denmark: COWI
Google maps. (2019). Map over Gothenburg. Retrieved from:
https://www.google.se/maps/@57.699718,11.9737038,16.57z (2019-02-01)
Göteborgs stad. (n.d.). Trafikmängder på olika gator. Retrieved from:
https://goteborg.se/wps/portal/start/gator-vagar-och-torg/gator-och-vagar/statistik-om-
trafiken/trafikmangder-pa-
olika/!ut/p/z1/hY5NC4JAGIR_jdd9Xz9w1252MFJJg0DbS2hsq6CurFsL_frsGBTNbZhnmAEONf
CpefSyMb2ammH1Zx5eSjc9sq0bY7GLEtyfsjI5ZHmRMoTqH8DXGH8oRkiB9-
1I7HUkSHzqhTRwaRBRykKPvufjqfWZBK7FTWihyV2vrzpj5mXjoIPWWiKVkoMgi3DwW6NTi4H
6A4R5rJ-5qOIXYHw38g!!/dz/d5/L2dBISEvZ0FBIS9nQSEh/#htoc-0
Göteborgs Stad: Stadsbyggnadskontoret. (2013). Avenyn: Gestaltningsprogram.
Retrieved from:
https://www5.goteborg.se/prod/fastighetskontoret/etjanst/planobygg.nsf/vyFiler/Central
a%20G%C3%B6teborg%20-
%20Stadsmilj%C3%B6upprustning%20Kungsportsavenyen-Gestaltningsprogram-
Remissversion%20av%20Gestaltningsprogrammet/$File/Gestaltningsprogram.pdf?Ope
nElement
Göteborgs Stad: Trafikkontoret. (2014). Gothenburg 2035: transport strategy for a
close-knit city. Gothenburg: Urban Transport Administration. Retrieved from:
https://goteborg.se/wps/wcm/connect/6c603463-f0b8-4fc9-9cd4-
c1e934b41969/Trafikstrategi_eng_140821_web.pdf?MOD=AJPERES
CHALMERS, Architecture and Civil Engineering, Master’s Thesis ACEX30-19-33 67
Göteborgs Stad: Trafikkontoret. (2015). Cykelprogram för en nära storstad 2015-2025.
Gothenburg: Trafikkontoret. Retrieved from:
https://goteborg.se/wps/wcm/connect/538134e2-844e-4e46-acc4-
fe74a673cefb/Cykelprogram_antagen_web_FINAL.pdf?MOD=AJPERES
Göteborgs Stad: Trafikkontoret. (2018) Cykeldata 2016 - 2018 [bicycle data from
measuring points, 2016-2018]. Retrieved via email conversation with Fredrik Larsson at
Trafikkontoret.
Helbing, D. and Molnár, P. (1995), Social force model for pedestrian dynamics.
Retrieved from: https://arxiv.org/pdf/cond-mat/9805244.pdf
PTV AG. (2018). PTV VISSIM 11: USER MANUAL. Karlsruhe, Germany: PTV AG
Ramboll/Göteborgs Stad: Trafikkontoret. (2018). Inventering av fotgängare och
cyklister i Göteborg. Gothenburg, Sweden. Retrieved from:
http://www.th.tkgbg.se/Portals/0/STARTFLIKEN/Program%20och%20policys/Cykel/I
nventering%20g%C3%A5ng-%20och%20cykelfl%C3%B6de%202018_2018-10.pdf
Trafikverket. (2016). NVDB på webb. Retrieved from:
https://nvdb2012.trafikverket.se/SeTransportnatverket
Transportation Research Board. 2010. Highway Capacity Manual 2010, volumes 1-4,
including 2014 Errata. ISBN 978-0-309-16077-3
UN-Habitat. (2014). Planning and Design for Sustainable Urban Mobility: Global Report
on Human Settlements 2013 (Chapter 2, January 2014 revision). Retrieved from:
https://unhabitat.org/wp-content/uploads/2013/06/GRHS.2013_Rev.2014.01_02.pdf
Västtrafik. (2018). Spårvagns- och stombusstrafik. Retrieved from:
https://www.vasttrafik.se/globalassets/media/kartor/linjenatskartor/sparvagn/sparvgns--
och-stombusstrafik.pdf (2019-02-06)


I
Appendix A - Vehicle parameters used in Vissim
(Parameters not mentioned here were not changed in which case the standard values
supplied by the software itself, or in some cases by WSP, are used.)
Bicycle parameters used in the simulation The parameters used are based on the report “Micro simulation of cyclists in peak hour
traffic”, by COWI who did a study of cyclists in Copenhagen (COWI, 2013).
A1 Desired Speed Distribution
Speed [km/h] Percent of vehicles driving slower [%]
14 0
18 9
22 44
26 77
30 93
35 100
A2 Desired- and Maximum Acceleration
Speed [km/h] Acceleration [m/s2]
0,0 0,4
2,6 1,2
3,7 1,6
5,1 1,8
6,7 1,6
8,0 1,3
13,2 0,4
18,5 0,3
22,2 0,3
25,9 0,3
29,7 0,2
60,0 0
A3 Desired- and Maximum Deceleration
Speed [km/h] Avg. deceleration
[m/s2]
Min deceleration [m/s2] Max deceleration [m/s2]
0,0 -3,0 -2,5 -4,0
5,0 -4,0 -3,75 -4,4
20,0 -2,0 -1,75 -2,5
60,0 0 0 0

II
A4 Reduced speed areas (90-degree turns)
Speed [km/h] % of bicycles slower
5 0
8 19
12 50
16 84
17 100
Motorized vehicle parameters Standard values for acceleration and deceleration was used for cars, trucks and buses
not included public transport.
A5 Desired Speed Distribution
Slow streets Medium streets Fast streets
Speed [km/h] % slower Speed [km/h] % slower Speed [km/h] % slower
4 0 13 0 22 0
10 15 20 15 27 15
17 50 25 50 30 50
25 85 30 85 33 85
30 100 37 100 38 100
Driving behaviors Four new driving behaviors were created in Vissim, the first three for bicycles and the
last one for cars sharing the road with bicycles before a bicycle waiting zone.

III
A6 “Normal bicycle path” driving behavior

IV
A7 “Bicycle waiting zone” driving behavior

V
A8 “Approaching bicycle waiting zone”
The “approaching bicycle waiting zone” parameters are identical to the ones used in
“bicycle waiting zone” except that minimum lateral distance standing is set to 0,2 m
and distance driving to 0,75 instead of both being zero.
A9 “Cars sharing with bikes, keep left”

VI
Appendix B - Signal control data files
All signal controls in the model except for Götaplatsen in scenario 4 uses VAP logic
files combined with signal data files (.pua) to control the signalized intersections. The
data in these .pua files can be found below. See chapter 4.1.3 for more information
about the signal controls and VAP coding. The interesting parts needed to control the
intersections together with the .vap files are §SIGNAL_GROUPS, §STAGES and
§INTERSTAGE which is why not all the §IGM text is included below.
B1 Parkgatan signal data file

VII
B2 Engelbrektsgatan scenario 1 signal data file

VIII

IX
B3 Engelbrektsgatan scenario 2,3 and 5 signal data file

X

XI
B4 Engelbrektsgatan scenario 4 signal data file

XII
B5 Götaplatsen scenario 4 signal data file

XIII
Appendix C - Vehicle OD matrices, all scenarios
Origin and destination points are named the same in all scenarios and can be found in
Section 3.1.4.
Scenario 1 and 2
See Section 3.1.4.
Scenario 3
North:
South:
Scenario 4
North:
South:
Scenario 5

XIV
North:
South: