Embed Size (px)
Citation preview
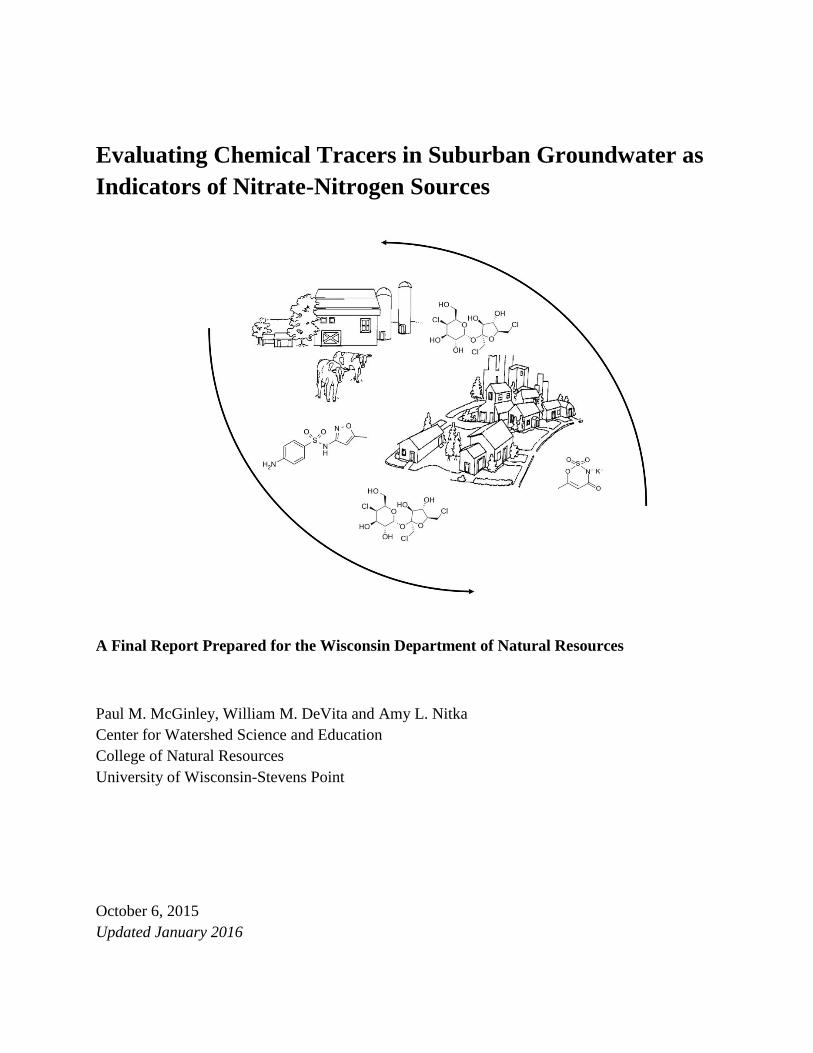
Evaluating Chemical Tracers in Suburban Groundwater as
Indicators of Nitrate-Nitrogen Sources
A Final Report Prepared for the Wisconsin Department of Natural Resources
Paul M. McGinley, William M. DeVita and Amy L. Nitka
Center for Watershed Science and Education
College of Natural Resources
University of Wisconsin-Stevens Point
October 6, 2015
Updated January 2016
2
TABLE OF CONTENTS
LIST OF FIGURES AND TABLES............................................................................................... 3
ACKNOWLEDGEMENTS ............................................................................................................ 4
PROJECT SUMMARY .................................................................................................................. 5
INTRODUCTION .......................................................................................................................... 7
PURPOSE ....................................................................................................................................... 8
METHODS ..................................................................................................................................... 9
ANALYTE SELECTION ........................................................................................................... 9
INORGANIC ANALYTES ........................................................................................................ 9
ORGANIC ANALYTES ............................................................................................................ 9
Food and consumable products ............................................................................................... 9
Pharmaceuticals (human and veterinary) .............................................................................. 10
Pesticides............................................................................................................................... 11
SAMPLE PREPARATION AND ANALYSIS ........................................................................ 14
Pharmaceuticals and personal care products (PPCPs) .......................................................... 14
Chloroacetanilide metabolites (CAAMs) ............................................................................. 15
Nitrate/chloride ..................................................................................................................... 16
Metals .................................................................................................................................... 16
EXPERIMENTAL DESIGN ........................................................................................................ 17
STUDY SITE ............................................................................................................................ 17
SELECTION OF PRIVATE WELLS ...................................................................................... 18
INSTALLATION OF MONITORING WELLS ...................................................................... 18
SAMPLING .............................................................................................................................. 20
RESULTS ..................................................................................................................................... 21
CONCLUSIONS........................................................................................................................... 33
REFERENCES ............................................................................................................................. 35
3
LIST OF FIGURES AND TABLES
Figure 1. Map indicating the location of the Town of Hull in central Wisconsin ........................ 17
Figure 2. North study area ............................................................................................................ 19
Figure 3. South study area ............................................................................................................ 19
Figure 4. Nitrate concentrations for private wells ........................................................................ 26
Figure 5. Metolachlor ESA concentrations for private wells ....................................................... 27
Figure 6. Acesulfame concentrations in private wells .................................................................. 28
Figure 7. Sucralose concentrations in private wells...................................................................... 29
Figure 8. Sulfamethoxazole concentrations in private wells ........................................................ 30
Figure 9. Nitrate and sources indicator concentrations for the monitoring wells. ........................ 31
Figure 10. Principal components analysis (PCA) of nitrate and source indicators ...................... 32
Table 1. Nitrate source indicators analyzed by LC/MS/MS. ........................................................ 12
Table 2. Pesticide metabolites analyzed by HPLC ....................................................................... 12
Table 3. Method detection limit for indicators of septic waste contamination ............................. 13
Table 4. Summary of general water chemistry for the private wells ............................................ 21
Table 5. Summary of general water chemistry for the eight monitoring wells ............................ 23
Table 6. Occurrence percentage for sucralose, acesulfame and sulfamethoxazole ...................... 32
4
ACKNOWLEDGEMENTS
We thank the Wisconsin Department of Natural Resources and the Groundwater Coordinating
Council for funding this project. We acknowledge the assistance of William Phelps from the
Wisconsin Department of Natural Resources and Roy Irving from the Wisconsin Department of
Health Services. We also thank the Town of Hull Board and residents for their interest and
participation in this project.
5
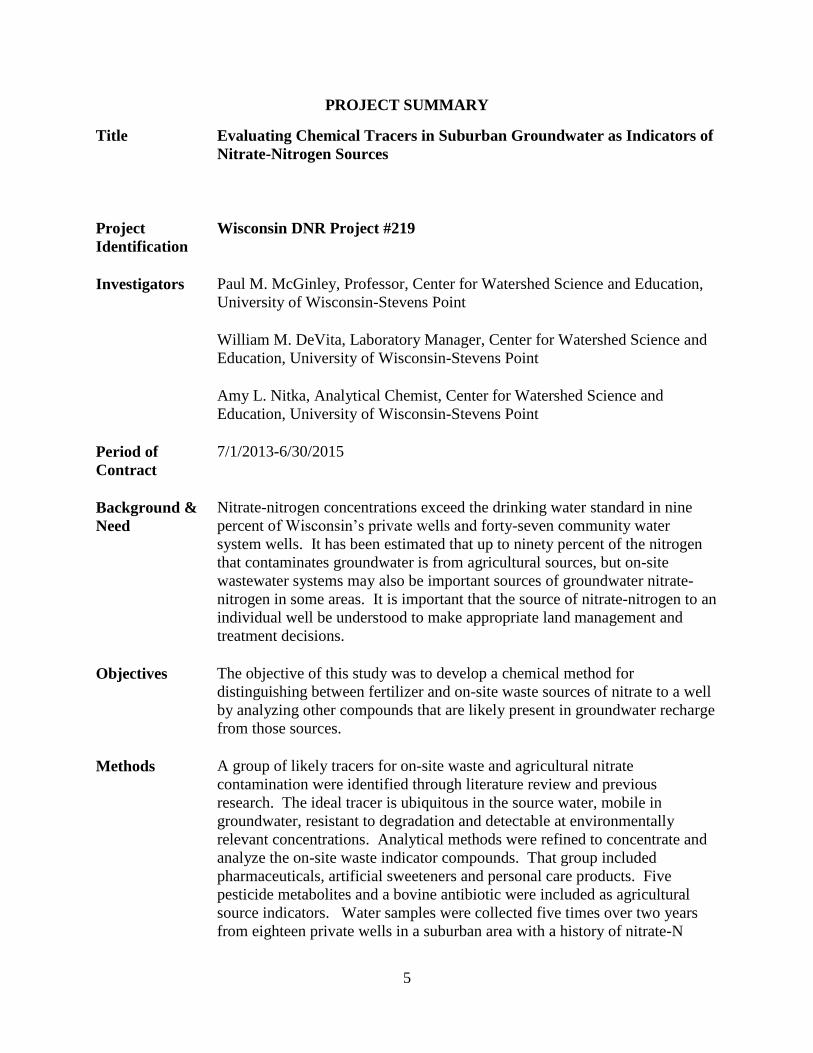
PROJECT SUMMARY
Title
Evaluating Chemical Tracers in Suburban Groundwater as Indicators of
Nitrate-Nitrogen Sources
Project
Identification
Wisconsin DNR Project #219
Investigators Paul M. McGinley, Professor, Center for Watershed Science and Education,
University of Wisconsin-Stevens Point
William M. DeVita, Laboratory Manager, Center for Watershed Science and
Education, University of Wisconsin-Stevens Point
Amy L. Nitka, Analytical Chemist, Center for Watershed Science and
Education, University of Wisconsin-Stevens Point
Period of
Contract
7/1/2013-6/30/2015
Background &
Need
Nitrate-nitrogen concentrations exceed the drinking water standard in nine
percent of Wisconsin’s private wells and forty-seven community water
system wells. It has been estimated that up to ninety percent of the nitrogen
that contaminates groundwater is from agricultural sources, but on-site
wastewater systems may also be important sources of groundwater nitrate-
nitrogen in some areas. It is important that the source of nitrate-nitrogen to an
individual well be understood to make appropriate land management and
treatment decisions.
Objectives The objective of this study was to develop a chemical method for
distinguishing between fertilizer and on-site waste sources of nitrate to a well
by analyzing other compounds that are likely present in groundwater recharge
from those sources.
Methods A group of likely tracers for on-site waste and agricultural nitrate
contamination were identified through literature review and previous
research. The ideal tracer is ubiquitous in the source water, mobile in
groundwater, resistant to degradation and detectable at environmentally
relevant concentrations. Analytical methods were refined to concentrate and
analyze the on-site waste indicator compounds. That group included
pharmaceuticals, artificial sweeteners and personal care products. Five
pesticide metabolites and a bovine antibiotic were included as agricultural
source indicators. Water samples were collected five times over two years
from eighteen private wells in a suburban area with a history of nitrate-N
6
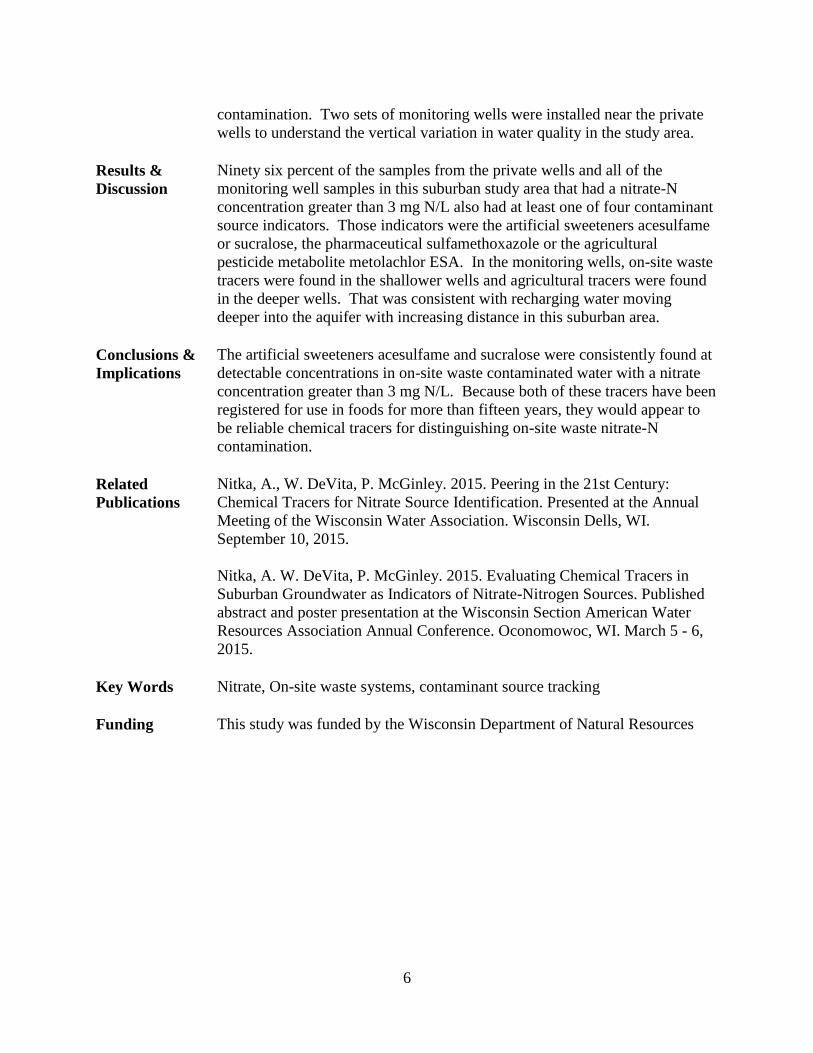
contamination. Two sets of monitoring wells were installed near the private
wells to understand the vertical variation in water quality in the study area.
Results &
Discussion
Ninety six percent of the samples from the private wells and all of the
monitoring well samples in this suburban study area that had a nitrate-N
concentration greater than 3 mg N/L also had at least one of four contaminant
source indicators. Those indicators were the artificial sweeteners acesulfame
or sucralose, the pharmaceutical sulfamethoxazole or the agricultural
pesticide metabolite metolachlor ESA. In the monitoring wells, on-site waste
tracers were found in the shallower wells and agricultural tracers were found
in the deeper wells. That was consistent with recharging water moving
deeper into the aquifer with increasing distance in this suburban area.
Conclusions &
Implications
The artificial sweeteners acesulfame and sucralose were consistently found at
detectable concentrations in on-site waste contaminated water with a nitrate
concentration greater than 3 mg N/L. Because both of these tracers have been
registered for use in foods for more than fifteen years, they would appear to
be reliable chemical tracers for distinguishing on-site waste nitrate-N
contamination.
Related
Publications
Nitka, A., W. DeVita, P. McGinley. 2015. Peering in the 21st Century:
Chemical Tracers for Nitrate Source Identification. Presented at the Annual
Meeting of the Wisconsin Water Association. Wisconsin Dells, WI.
September 10, 2015.
Nitka, A. W. DeVita, P. McGinley. 2015. Evaluating Chemical Tracers in
Suburban Groundwater as Indicators of Nitrate-Nitrogen Sources. Published
abstract and poster presentation at the Wisconsin Section American Water
Resources Association Annual Conference. Oconomowoc, WI. March 5 - 6,
2015.
Key Words Nitrate, On-site waste systems, contaminant source tracking
Funding This study was funded by the Wisconsin Department of Natural Resources
7
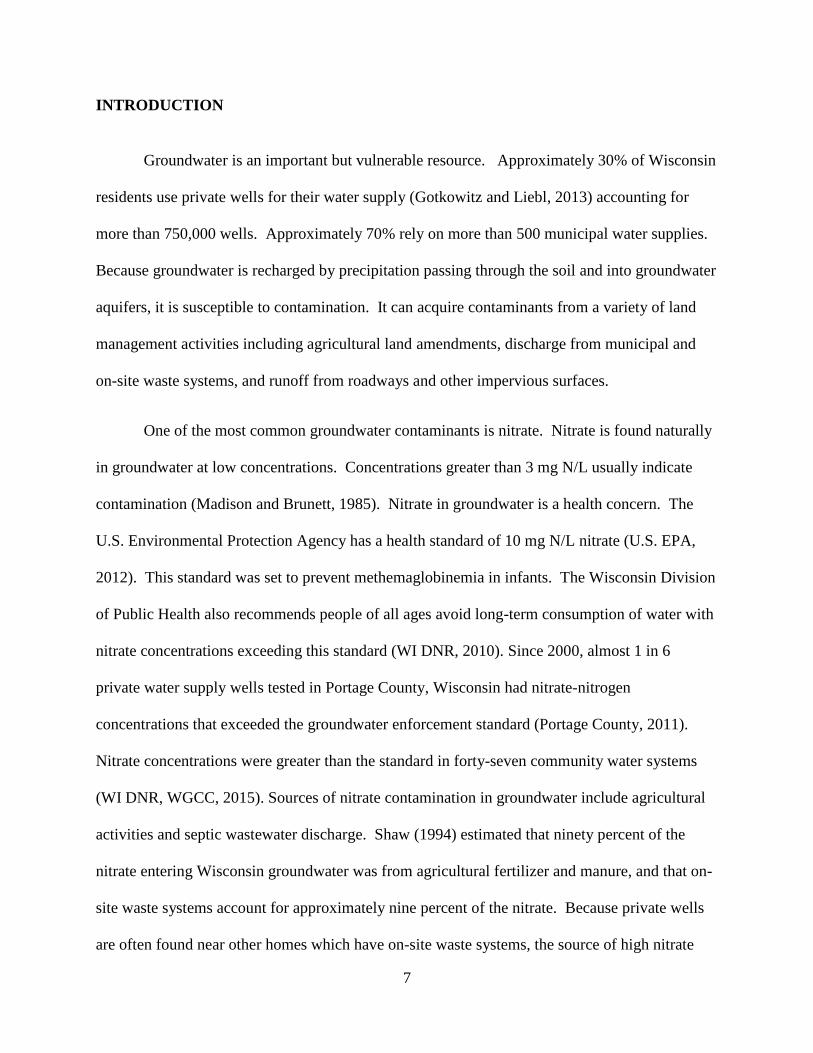
INTRODUCTION
Groundwater is an important but vulnerable resource. Approximately 30% of Wisconsin
residents use private wells for their water supply (Gotkowitz and Liebl, 2013) accounting for
more than 750,000 wells. Approximately 70% rely on more than 500 municipal water supplies.
Because groundwater is recharged by precipitation passing through the soil and into groundwater
aquifers, it is susceptible to contamination. It can acquire contaminants from a variety of land
management activities including agricultural land amendments, discharge from municipal and
on-site waste systems, and runoff from roadways and other impervious surfaces.
One of the most common groundwater contaminants is nitrate. Nitrate is found naturally
in groundwater at low concentrations. Concentrations greater than 3 mg N/L usually indicate
contamination (Madison and Brunett, 1985). Nitrate in groundwater is a health concern. The
U.S. Environmental Protection Agency has a health standard of 10 mg N/L nitrate (U.S. EPA,
2012). This standard was set to prevent methemaglobinemia in infants. The Wisconsin Division
of Public Health also recommends people of all ages avoid long-term consumption of water with
nitrate concentrations exceeding this standard (WI DNR, 2010). Since 2000, almost 1 in 6
private water supply wells tested in Portage County, Wisconsin had nitrate-nitrogen
concentrations that exceeded the groundwater enforcement standard (Portage County, 2011).
Nitrate concentrations were greater than the standard in forty-seven community water systems
(WI DNR, WGCC, 2015). Sources of nitrate contamination in groundwater include agricultural
activities and septic wastewater discharge. Shaw (1994) estimated that ninety percent of the
nitrate entering Wisconsin groundwater was from agricultural fertilizer and manure, and that on-
site waste systems account for approximately nine percent of the nitrate. Because private wells
are often found near other homes which have on-site waste systems, the source of high nitrate
8
concentrations in an individual well may be more likely to result from on-site waste than the
state-wide nitrogen budget would suggest. The source of nitrate cannot be determined through
routine nitrate analysis. With nitrate concentrations increasing in groundwater at many locations
in Wisconsin (GCC, 2009), it is important to better understand the sources of nitrate-nitrogen to
an individual well for developing remedial strategies for improving groundwater quality.
PURPOSE
The objective of this research was to evaluate the relationship between groundwater
nitrate and a group of chemical tracers that could be used as indicators of on-site wastewater
disposal or agricultural activities. It was the goal of this research to develop a tool to help water
resource managers, municipalities, and well owners understand the source of nitrate
contamination so they can determine appropriate treatment and remediation options.
9
METHODS
ANALYTE SELECTION
A variety of nitrate source indicators were chosen for this study. Chemical
characteristics, such as mobility in groundwater and water solubility, as well as their common
use, were considered when choosing source indicators. A group of fourteen pharmaceuticals and
personal care products unique to human use was chosen to identify wells likely impacted by on-
site waste systems. A bovine antibiotic, fungicide metabolite, and four chloroacetanilide
herbicide metabolites (CAAMs) were used to identify contamination from agricultural sources.
INORGANIC ANALYTES
The inorganic tracer compounds included the major ions chloride, boron and phosphorus.
Both on-site waste systems and agricultural activities can increase chloride concentrations in
groundwater (Kraft et al., 2008; Hinkle et al., 2009). Boron was also used as an inorganic tracer
as previous studies have suggested its use in detergents make it a potential wastewater indicator
(EPA, 2008). Phosphorus was also explored as an inorganic tracer. On-site waste systems are
a source of phosphorus; however, significant removal can occur (25% to 99%), preventing much
of the phosphorus from entering the groundwater (Robertson, 1998).
ORGANIC ANALYTES
Food and consumable products
Several food products were chosen as human waste tracers (Table 1). Caffeine is found
in coffee, soft drinks and other products unique to human consumption. It has been detected in
surface water samples near wastewater treatment plants (Glassmeyer et al., 2005). Its primary
metabolite, paraxanthine, has been detected in untreated groundwater used for public drinking-
10
water supplies in California (Fram et al., 2011). Artificial sweeteners are commonly added to
low-calorie foods and beverages. Sucralose has been found in European surface waters (Loos et
al., 2009) and Canadian urban areas (Van Stempvoort et al., 2011). Scheurer et al. (2009)
evaluated multiple artificial sweeteners in German waste water and surface waters. Acesulfame
and sucralose have been detected in previous groundwater samples from the Town of Hull
(Nitka, 2014). For this study, the artificial sweetener saccharin was added to the suite of tracers.
Sulfanilic acid is a food color additive that was also added for this study. The nicotine
metabolite cotinine was also included in the tracer suite.
Pharmaceuticals (human and veterinary)
Pharmaceuticals are another group of compounds used as indicators of human waste
impacts. Acetaminophen is an over-the-counter analgesic that has been found in surface water
and groundwater samples (Glassmeyer et al., 2005; Fram et al., 2011). Triclosan is an
antimicrobial compound found in many sanitizing products. Carbamazepine is a mood stabilizer
and anti-seizure medication and is also used to treat attention deficit disorder. While not as
widely used as other waste tracers, it does not appear to be removed while passing through soil
(Nakada et al., 2008) and is one of the most frequently detected pharmaceuticals in groundwater
(Fram et al., 2011). The Minnesota Pollution Control Agency (MPCA) collected surface water
samples upstream, at the point of discharge, and downstream from at least 20 wastewater
treatment plants (WWTPs) and found carbamazepine, sulfamethoxazole (human antibiotic), and
venlafaxine (antidepressant) were the most commonly detected pharmaceuticals in 96 percent of
effluent samples and in greater than 40 percent of surface water samples. Trimethoprim was also
frequently detected (Ferry, 2011). Carbamazepine was already included in the human waste
tracer suite (Nitka, 2014). Sulfamethoxazole, trimethoprim, and the venlafaxine were added for
11
this study. The bovine antibiotic sulfamethazine was added to the suite as an indicator of
agricultural contamination.
Pesticides
Pesticide metabolites were used as tracers of agricultural contamination (Table 2). The
chloroacetanilide herbicides alachlor and metolachlor are commonly used in Central Wisconsin
on corn and soybeans. They metabolize into ethane sulfonic acid and oxanilic acid products.
Chlorothalonil is a fungicide commonly used for potatoes and it readily degrades into 4-hydroxy-
chlorothalonil. These metabolites were all added to the tracer suite for this study as an indicator
of agricultural impacts to groundwater.
12
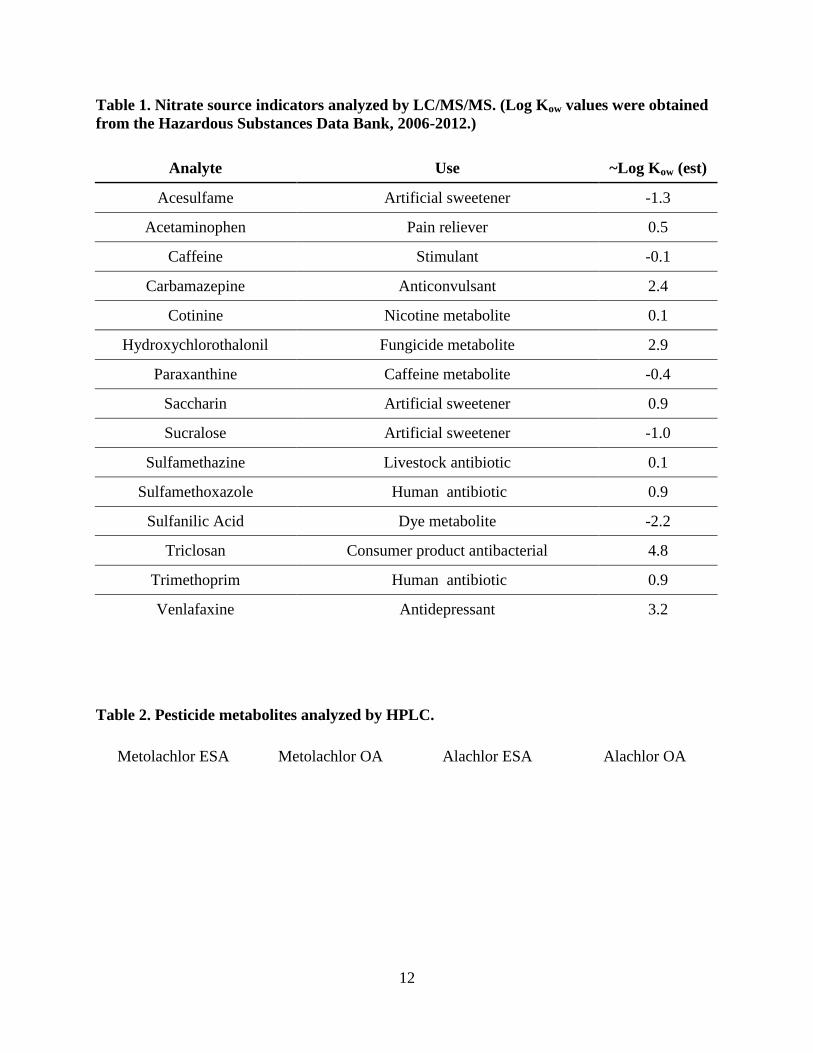
Table 1. Nitrate source indicators analyzed by LC/MS/MS. (Log Kow values were obtained
from the Hazardous Substances Data Bank, 2006-2012.)
Analyte Use ~Log Kow (est)
Acesulfame Artificial sweetener -1.3
Acetaminophen Pain reliever 0.5
Caffeine Stimulant -0.1
Carbamazepine Anticonvulsant 2.4
Cotinine Nicotine metabolite 0.1
Hydroxychlorothalonil Fungicide metabolite 2.9
Paraxanthine Caffeine metabolite -0.4
Saccharin Artificial sweetener 0.9
Sucralose Artificial sweetener -1.0
Sulfamethazine Livestock antibiotic 0.1
Sulfamethoxazole Human antibiotic 0.9
Sulfanilic Acid Dye metabolite -2.2
Triclosan Consumer product antibacterial 4.8
Trimethoprim Human antibiotic 0.9
Venlafaxine Antidepressant 3.2
Table 2. Pesticide metabolites analyzed by HPLC.
Metolachlor ESA Metolachlor OA Alachlor ESA Alachlor OA
13
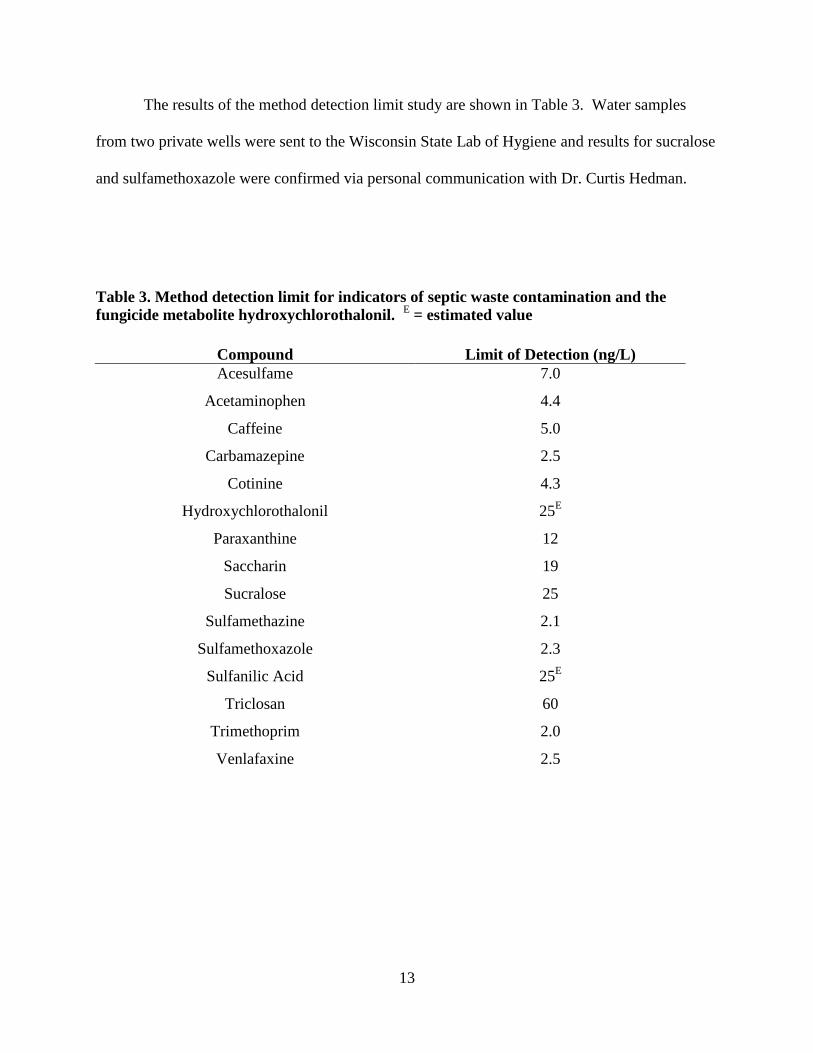
The results of the method detection limit study are shown in Table 3. Water samples
from two private wells were sent to the Wisconsin State Lab of Hygiene and results for sucralose
and sulfamethoxazole were confirmed via personal communication with Dr. Curtis Hedman.
Table 3. Method detection limit for indicators of septic waste contamination and the
fungicide metabolite hydroxychlorothalonil. E = estimated value
Compound Limit of Detection (ng/L)
Acesulfame 7.0
Acetaminophen 4.4
Caffeine 5.0
Carbamazepine 2.5
Cotinine 4.3
Hydroxychlorothalonil 25E
Paraxanthine 12
Saccharin 19
Sucralose 25
Sulfamethazine 2.1
Sulfamethoxazole 2.3
Sulfanilic Acid 25E
Triclosan 60
Trimethoprim 2.0
Venlafaxine 2.5
14
SAMPLE PREPARATION AND ANALYSIS
Pharmaceuticals and personal care products (PPCPs)
Samples analyzed for pharmaceuticals, personal care and food products were filtered
through glass fiber filters (Whatman), collected in one-liter amber bottles and stored at 4ºC.
Samples were concentrated prior to analysis using methods developed previously (Nitka,
2014). Waters Oasis 6cc (200 mg) HLB cartridges were used with a Dionex Autotrace 280
(Thermo Scientific) unit for automated solid phase extraction (SPE) of samples. Cartridges were
conditioned with 5 mL of methanol and 5 mL of reverse osmosis (RO) water. Cartridges were
loaded with 100 mL of sample then dried with nitrogen gas for 30 minutes. Cartridges were
eluted with 5 mL of methanol and dried to less than 50 µL at 50˚C using a Turbovap
Concentration Workstation.
Deuterated analogs of acesulfame, caffeine, carbamazepine, cotinine, sucralose,
sulfamethazine, triclosan were used as internal standards for their respective analytes.
Deuterated analogs were not available for some analytes. Those analytes were assigned internal
standards with similar structures or retention times. Fifty µL of internal standard mix of varying
concentrations were added, and samples were brought to a volume of 500 µL in 15 mM acetic
acid.
Analysis of the indicators was performed using an Agilent 1200 series high performance
liquid chromatograph coupled to an Agilent 6430 triple quadrupole mass spectrometer with an
electrospray ionization source. Twenty µL of sample was injected and carried through the LC
column (Zorbax Eclipse XDB-C8 column, 4.6 × 50 mm; 1.8 μ) (Scheurer et al., 2009) by a
mobile phase of 15 mM acetic acid in reverse osmosis (RO) water (mobile phase A) and 15 mM
15
acetic acid in methanol (mobile phase B). An Agilent 1200 series LC pump was used to provide
a pre-programmed gradient at a flow rate of 0.5 mL/minute. Benzoylecgonine-D3 was added to
samples prior to extraction for use as a surrogate standard. Recoveries of this compound were
used to evaluate the efficiency of the solid phase extraction process.
Chloroacetanilide metabolites (CAAMs)
Filtered (Whatman glass fiber) groundwater samples analyzed for the ethane sulfonic
acid (ESA) and oxanilic acid (OA) metabolites of the chloroacetanilide herbicides metolachlor
and alachlor were collected in one-liter amber bottles and stored at 4ºC. Extraction for
chloroacetanilide herbicide metabolites was performed according to the method of Zimmerman
et al. (2000). 125 mL of each sample was processed through the Dionex Autotrace 280 Solid
Phase Extraction (SPE) system utilizing Waters SepPak C18 cartridges, which had been
conditioned withmethanol, ethyl acetate, again with methanol, and RO water. The C18 cartridge
was first eluted with ethyl acetate, to remove the non-polar compounds. Methanol was used to
elute the second fraction, containing the polar CAAMs, and was collected in 5 mL glass
centrifuge tubes. Samples were concentrated using a Turbovap Concentration Work Station at
50ºC to take the samples to complete dryness. Extracts were reconstituted with 1000 μL 80:20
buffer:acetonitrile. These samples were stored in a freezer until they were analyzed by the
Agilent 1100 HPLC, equipped with a UV photodiode array detector (PDA). Analytes were
identified and quantified using a Betasil C18 250 x 5 mm column with 5 micron particles, and
positive samples confirmed with an Aquasil C18 250 x 5 mm column with 5 micron particles.
16
Nitrate/chloride
Samples for nitrate and chloride were collected in high-density polyethylene (HDPE)
bottles and stored at 4ºC. Samples taken from the monitoring wells were filtered using a 0.45 um
membrane filter. A Lachat 8000 flow injection analyzer was used for nitrate (Lachat Method 10-
107-04-1-A) and chloride (Lachat Method 10-117-07-1-B) analysis.
Metals
Samples for metal analyses were collected in high-density polyethylene (HDPE) bottles
and stored at 4ºC. Samples taken from the monitoring wells were filtered using a 0.45 um
membrane filter. All samples were acidified with nitric acid to a pH of less than 2. An Agilent
ICP-OES was used to analyze samples according to EPA Method 200.7 for sodium, boron,
phosphorus, potassium, calcium, magnesium, manganese, sulfate, and iron. Metals of emerging
concern, including vanadium, chromium, cobalt, strontium, molybdenum, uranium were
analyzed by an Agilent ICP-MS.
17
EXPERIMENTAL DESIGN
STUDY SITE
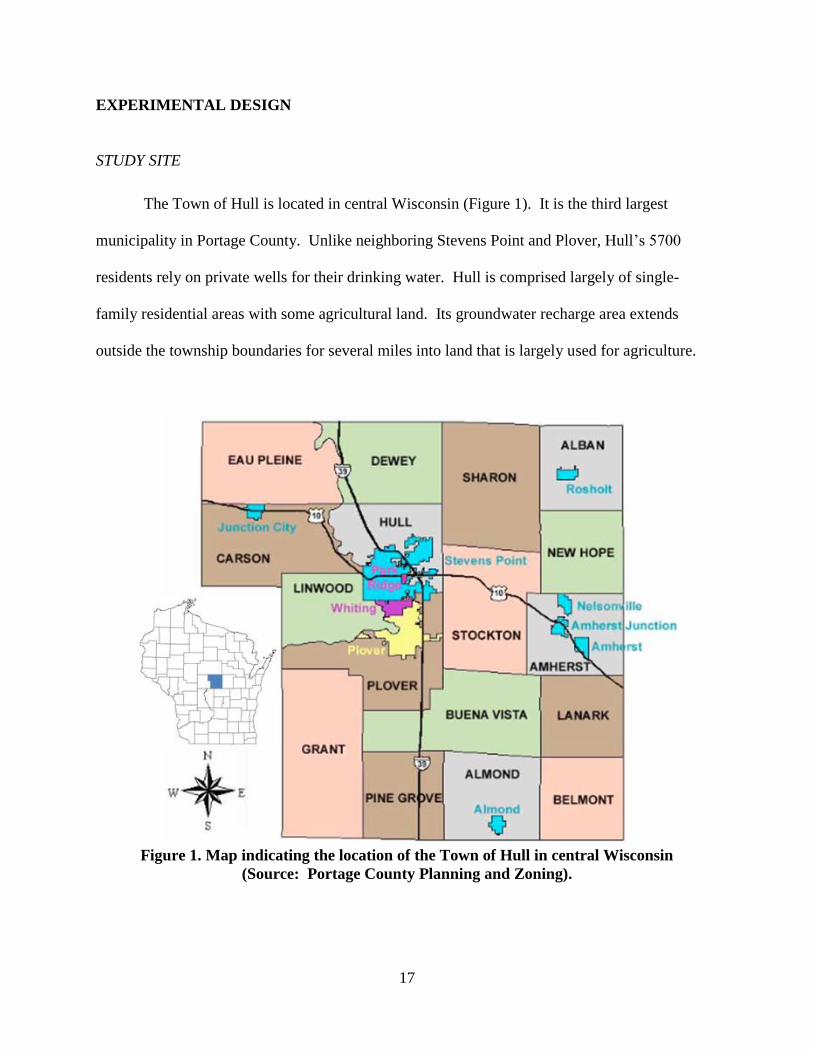
The Town of Hull is located in central Wisconsin (Figure 1). It is the third largest
municipality in Portage County. Unlike neighboring Stevens Point and Plover, Hull’s 5700
residents rely on private wells for their drinking water. Hull is comprised largely of single-
family residential areas with some agricultural land. Its groundwater recharge area extends
outside the township boundaries for several miles into land that is largely used for agriculture.
Figure 1. Map indicating the location of the Town of Hull in central Wisconsin
(Source: Portage County Planning and Zoning).
18
SELECTION OF PRIVATE WELLS
Eighteen private wells were chosen for this study. Six wells were selected based on their
nitrate results from a drinking water program conducted by UWSP and UW-Extension in
October 2013. Twelve more wells were selected in areas that had previously shown high nitrate
concentrations. Wells were located in suburban subdivisions with on-site waste systems and
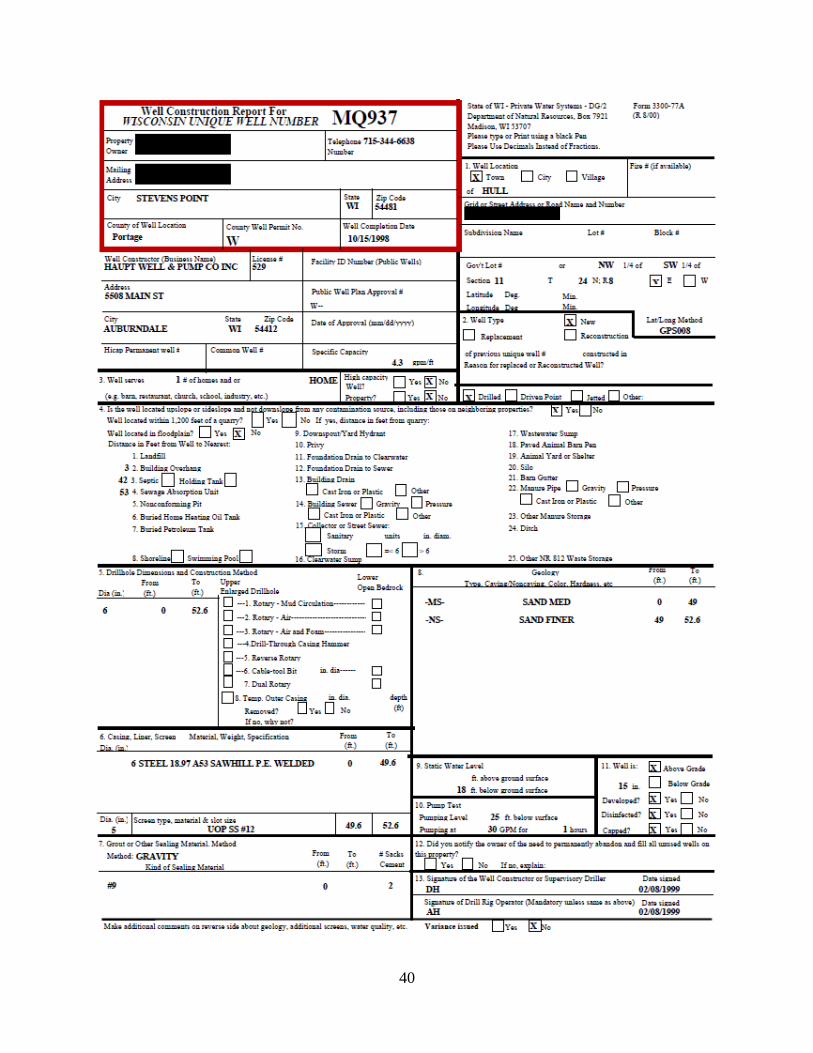
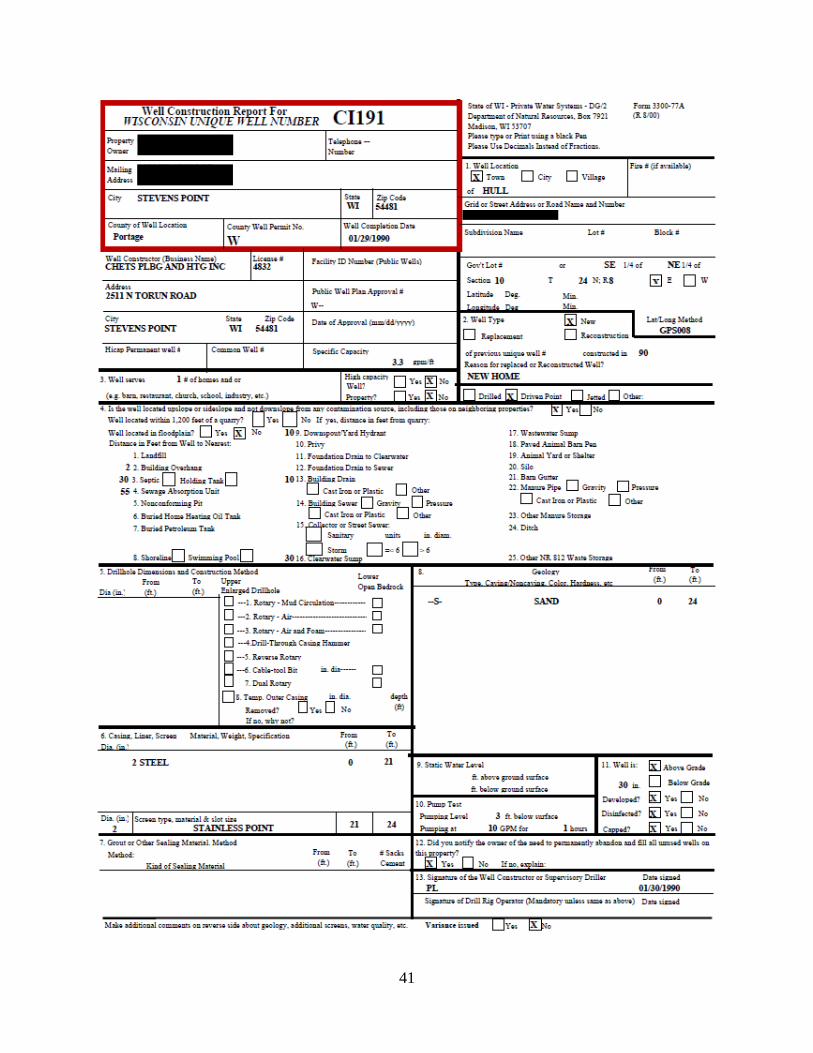
nearby agricultural land. Well construction reports were available for four wells (APPENDIX
A). Five of the wells were drilled wells and thirteen were driven-point wells.
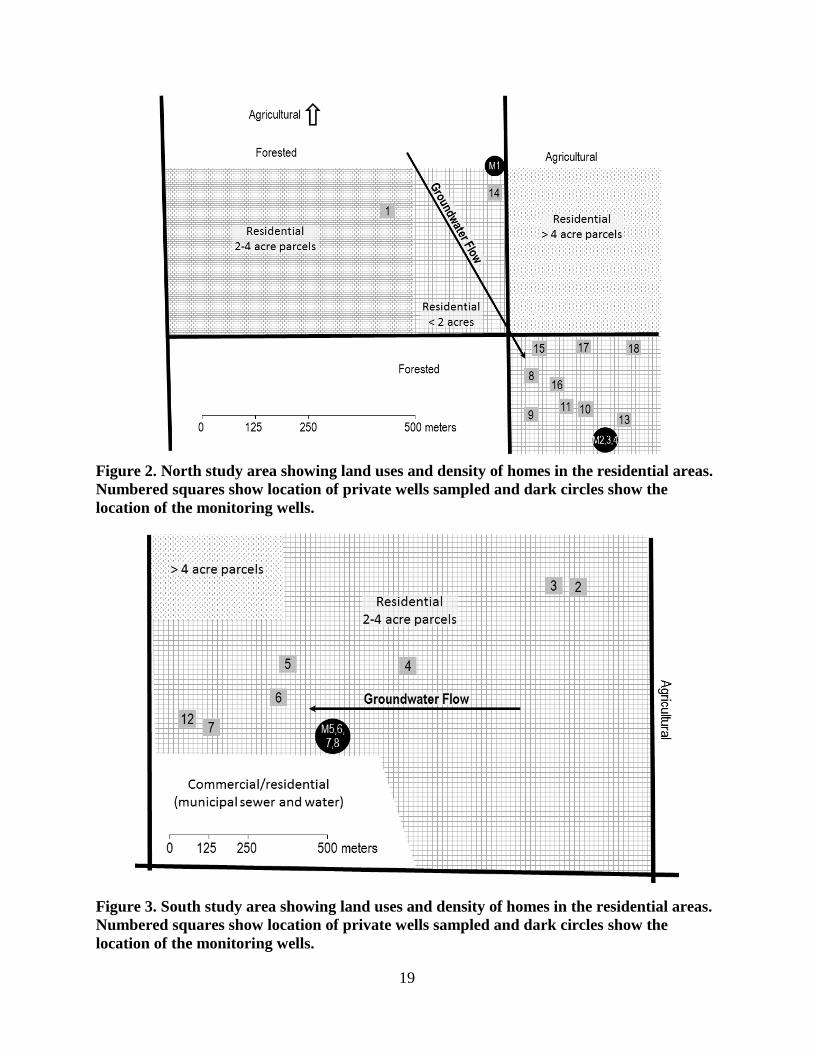
Well selection was also based on the direction of groundwater flow. Nine wells were
located in a northern subdivision, with two addition wells located upgradient (Figure 2).
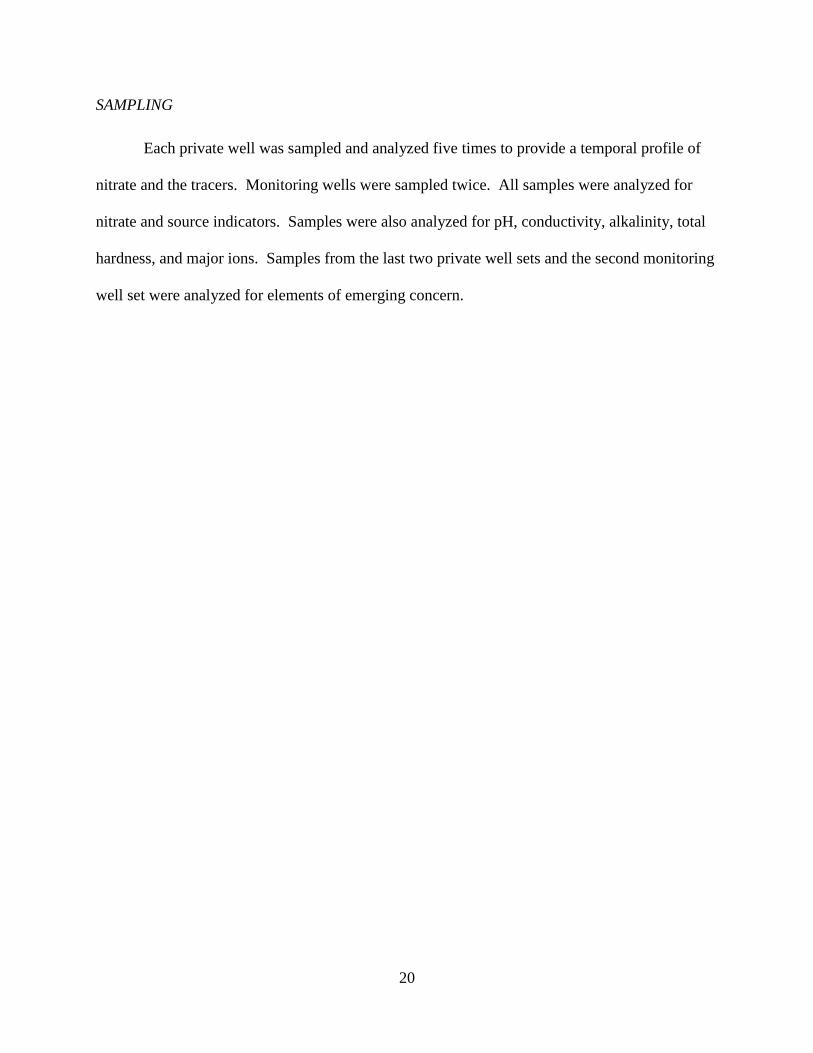
Groundwater in this area flows generally from northwest to southeast. Seven other wells were
located in the southern part of the study area (Figure 3), where groundwater flows east to west.
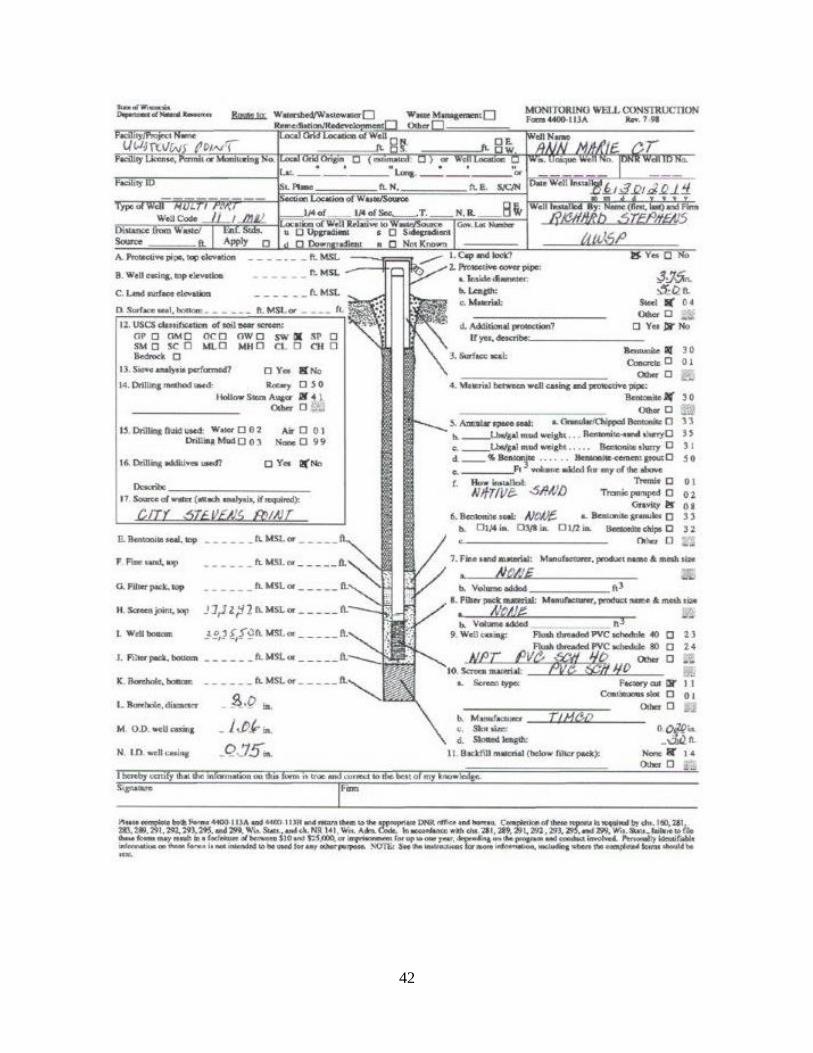
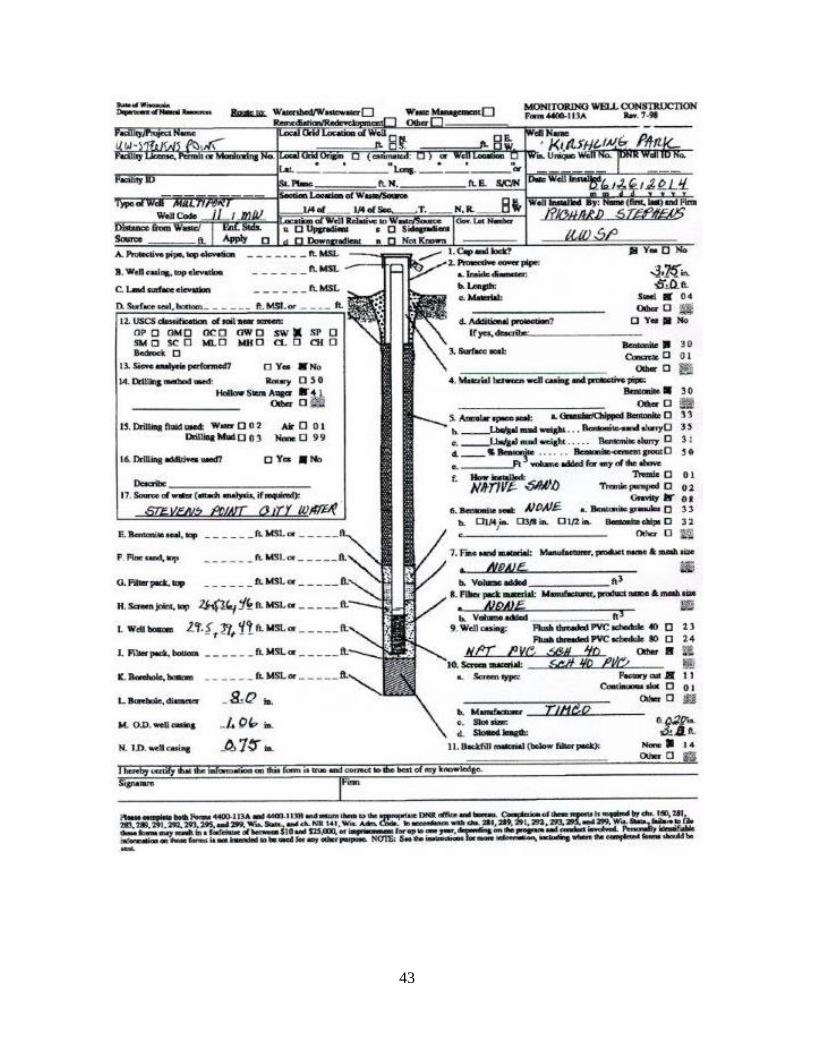
INSTALLATION OF MONITORING WELLS
Monitoring wells were installed to provide a depth profile for nitrate and source
indicators (APPENDIX A). Town of Hull officials were consulted to authorize placement of
monitoring wells. Two multi-port wells were installed on township right-of-way property. One
three-port well was installed downgradient of the northern subdivision at depths of 6.2, 10.8, and
15.4 meters each with 0.9 meter screens. A second three-port well and a deeper drilled well were
installed along the flow path of the wells in the southern subdivision. The well ports were at
depths of 9.1, 12.0, 15.1, and 21.5 meters, each with 0.9 meter screens.
19
Figure 2. North study area showing land uses and density of homes in the residential areas.
Numbered squares show location of private wells sampled and dark circles show the
location of the monitoring wells.
Figure 3. South study area showing land uses and density of homes in the residential areas.
Numbered squares show location of private wells sampled and dark circles show the
location of the monitoring wells.
20
SAMPLING
Each private well was sampled and analyzed five times to provide a temporal profile of
nitrate and the tracers. Monitoring wells were sampled twice. All samples were analyzed for
nitrate and source indicators. Samples were also analyzed for pH, conductivity, alkalinity, total
hardness, and major ions. Samples from the last two private well sets and the second monitoring
well set were analyzed for elements of emerging concern.
21
RESULTS
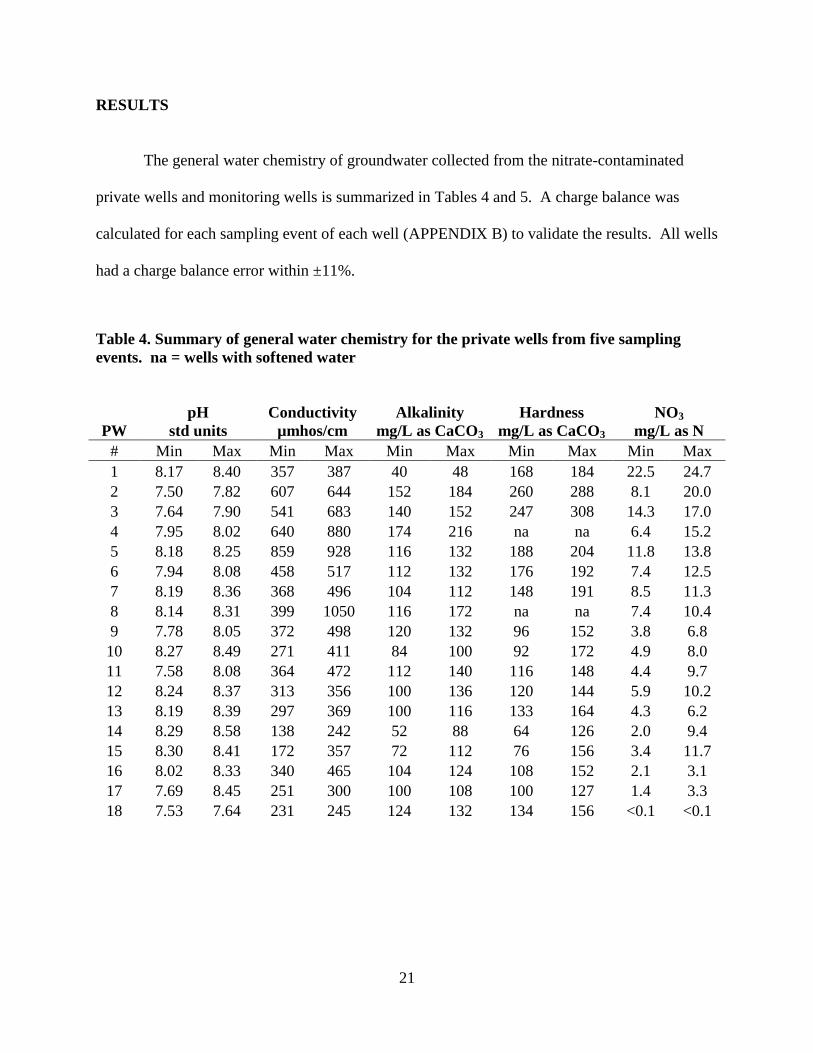
The general water chemistry of groundwater collected from the nitrate-contaminated
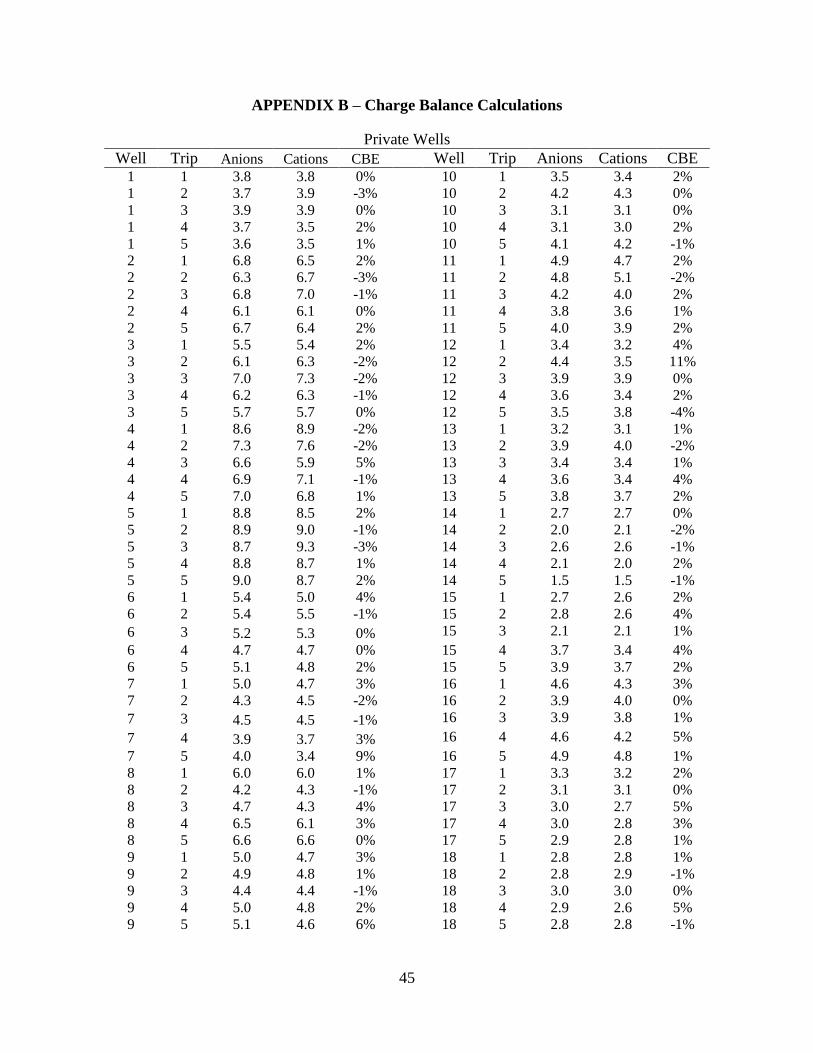
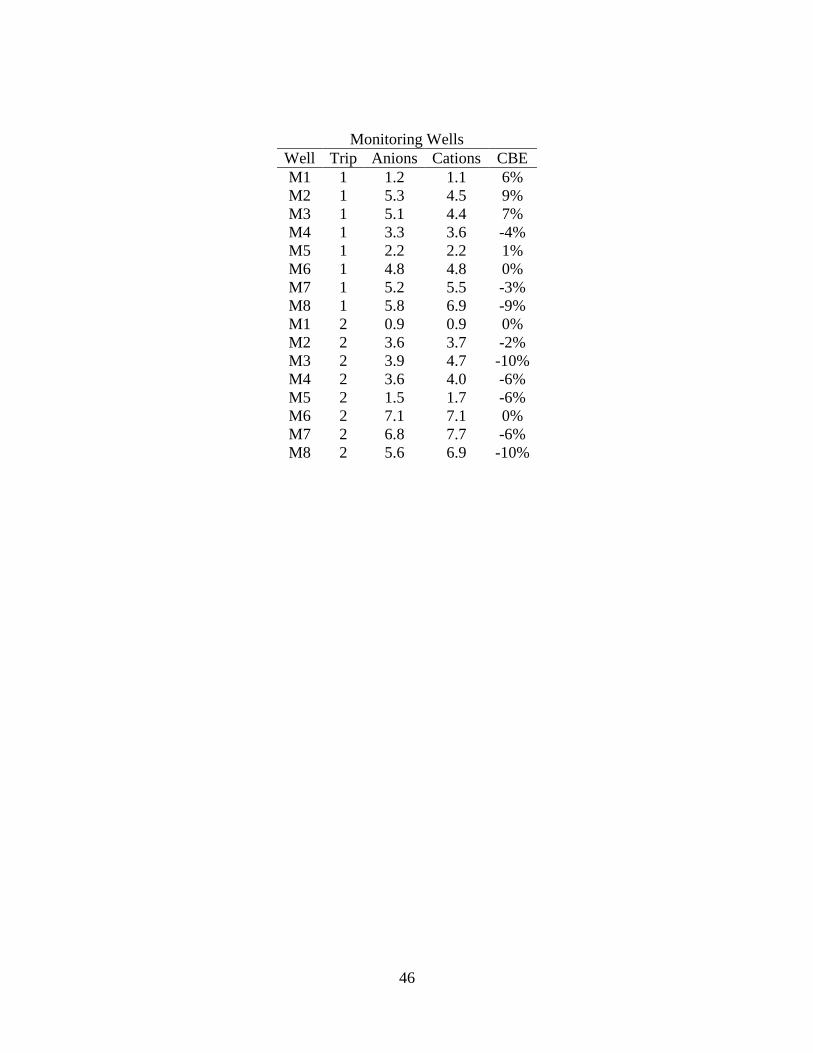
private wells and monitoring wells is summarized in Tables 4 and 5. A charge balance was
calculated for each sampling event of each well (APPENDIX B) to validate the results. All wells
had a charge balance error within ±11%.
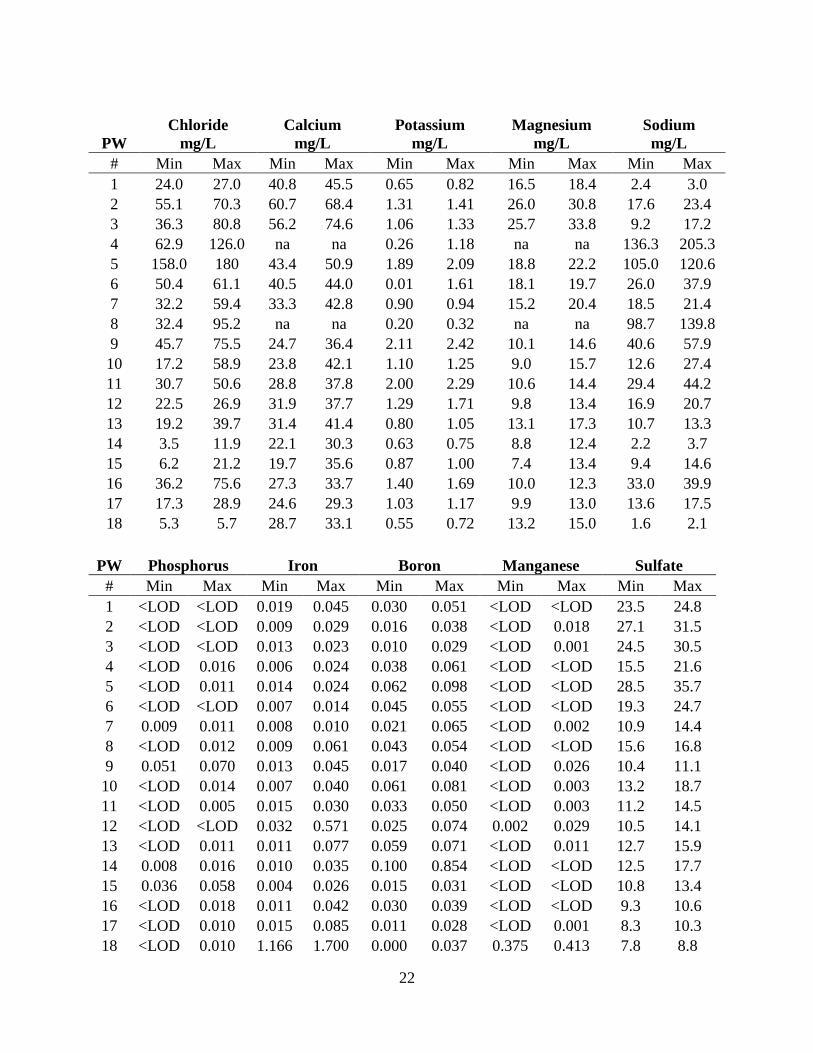
Table 4. Summary of general water chemistry for the private wells from five sampling
events. na = wells with softened water
PW
pH
std units
Conductivity
µmhos/cm
Alkalinity
mg/L as CaCO3
Hardness
mg/L as CaCO3
NO3
mg/L as N
# Min Max Min Max Min Max Min Max Min Max
1 8.17 8.40 357 387 40 48 168 184 22.5 24.7
2 7.50 7.82 607 644 152 184 260 288 8.1 20.0
3 7.64 7.90 541 683 140 152 247 308 14.3 17.0
4 7.95 8.02 640 880 174 216 na na 6.4 15.2
5 8.18 8.25 859 928 116 132 188 204 11.8 13.8
6 7.94 8.08 458 517 112 132 176 192 7.4 12.5
7 8.19 8.36 368 496 104 112 148 191 8.5 11.3
8 8.14 8.31 399 1050 116 172 na na 7.4 10.4
9 7.78 8.05 372 498 120 132 96 152 3.8 6.8
10 8.27 8.49 271 411 84 100 92 172 4.9 8.0
11 7.58 8.08 364 472 112 140 116 148 4.4 9.7
12 8.24 8.37 313 356 100 136 120 144 5.9 10.2
13 8.19 8.39 297 369 100 116 133 164 4.3 6.2
14 8.29 8.58 138 242 52 88 64 126 2.0 9.4
15 8.30 8.41 172 357 72 112 76 156 3.4 11.7
16 8.02 8.33 340 465 104 124 108 152 2.1 3.1
17 7.69 8.45 251 300 100 108 100 127 1.4 3.3
18 7.53 7.64 231 245 124 132 134 156 <0.1 <0.1
22
PW
Chloride
mg/L
Calcium
mg/L
Potassium
mg/L
Magnesium
mg/L
Sodium
mg/L
# Min Max Min Max Min Max Min Max Min Max
1 24.0 27.0 40.8 45.5 0.65 0.82 16.5 18.4 2.4 3.0
2 55.1 70.3 60.7 68.4 1.31 1.41 26.0 30.8 17.6 23.4
3 36.3 80.8 56.2 74.6 1.06 1.33 25.7 33.8 9.2 17.2
4 62.9 126.0 na na 0.26 1.18 na na 136.3 205.3
5 158.0 180 43.4 50.9 1.89 2.09 18.8 22.2 105.0 120.6
6 50.4 61.1 40.5 44.0 0.01 1.61 18.1 19.7 26.0 37.9
7 32.2 59.4 33.3 42.8 0.90 0.94 15.2 20.4 18.5 21.4
8 32.4 95.2 na na 0.20 0.32 na na 98.7 139.8
9 45.7 75.5 24.7 36.4 2.11 2.42 10.1 14.6 40.6 57.9
10 17.2 58.9 23.8 42.1 1.10 1.25 9.0 15.7 12.6 27.4
11 30.7 50.6 28.8 37.8 2.00 2.29 10.6 14.4 29.4 44.2
12 22.5 26.9 31.9 37.7 1.29 1.71 9.8 13.4 16.9 20.7
13 19.2 39.7 31.4 41.4 0.80 1.05 13.1 17.3 10.7 13.3
14 3.5 11.9 22.1 30.3 0.63 0.75 8.8 12.4 2.2 3.7
15 6.2 21.2 19.7 35.6 0.87 1.00 7.4 13.4 9.4 14.6
16 36.2 75.6 27.3 33.7 1.40 1.69 10.0 12.3 33.0 39.9
17 17.3 28.9 24.6 29.3 1.03 1.17 9.9 13.0 13.6 17.5
18 5.3 5.7 28.7 33.1 0.55 0.72 13.2 15.0 1.6 2.1
PW Phosphorus Iron Boron Manganese Sulfate
# Min Max Min Max Min Max Min Max Min Max
1 <LOD <LOD 0.019 0.045 0.030 0.051 <LOD <LOD 23.5 24.8
2 <LOD <LOD 0.009 0.029 0.016 0.038 <LOD 0.018 27.1 31.5
3 <LOD <LOD 0.013 0.023 0.010 0.029 <LOD 0.001 24.5 30.5
4 <LOD 0.016 0.006 0.024 0.038 0.061 <LOD <LOD 15.5 21.6
5 <LOD 0.011 0.014 0.024 0.062 0.098 <LOD <LOD 28.5 35.7
6 <LOD <LOD 0.007 0.014 0.045 0.055 <LOD <LOD 19.3 24.7
7 0.009 0.011 0.008 0.010 0.021 0.065 <LOD 0.002 10.9 14.4
8 <LOD 0.012 0.009 0.061 0.043 0.054 <LOD <LOD 15.6 16.8
9 0.051 0.070 0.013 0.045 0.017 0.040 <LOD 0.026 10.4 11.1
10 <LOD 0.014 0.007 0.040 0.061 0.081 <LOD 0.003 13.2 18.7
11 <LOD 0.005 0.015 0.030 0.033 0.050 <LOD 0.003 11.2 14.5
12 <LOD <LOD 0.032 0.571 0.025 0.074 0.002 0.029 10.5 14.1
13 <LOD 0.011 0.011 0.077 0.059 0.071 <LOD 0.011 12.7 15.9
14 0.008 0.016 0.010 0.035 0.100 0.854 <LOD <LOD 12.5 17.7
15 0.036 0.058 0.004 0.026 0.015 0.031 <LOD <LOD 10.8 13.4
16 <LOD 0.018 0.011 0.042 0.030 0.039 <LOD <LOD 9.3 10.6
17 <LOD 0.010 0.015 0.085 0.011 0.028 <LOD 0.001 8.3 10.3
18 <LOD 0.010 1.166 1.700 0.000 0.037 0.375 0.413 7.8 8.8
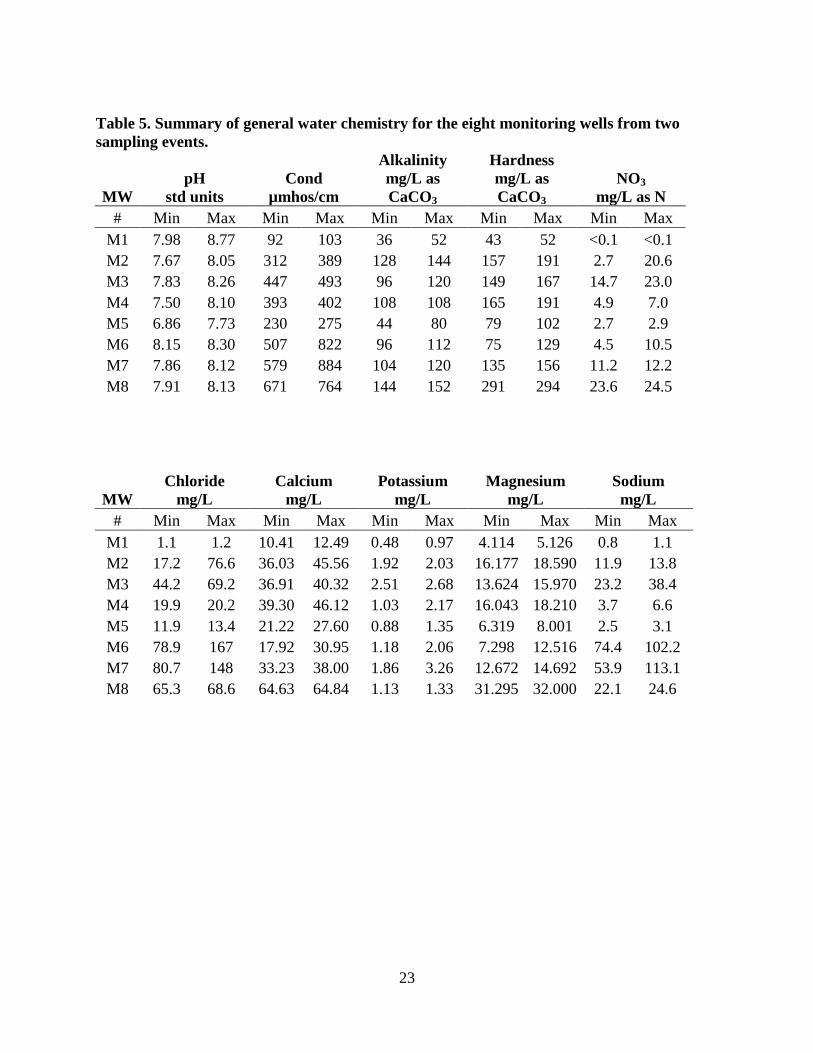
23
Table 5. Summary of general water chemistry for the eight monitoring wells from two
sampling events.
MW
pH
std units
Cond
µmhos/cm
Alkalinity
mg/L as
CaCO3
Hardness
mg/L as
CaCO3
NO3
mg/L as N
# Min Max Min Max Min Max Min Max Min Max
M1 7.98 8.77 92 103 36 52 43 52 <0.1 <0.1
M2 7.67 8.05 312 389 128 144 157 191 2.7 20.6
M3 7.83 8.26 447 493 96 120 149 167 14.7 23.0
M4 7.50 8.10 393 402 108 108 165 191 4.9 7.0
M5 6.86 7.73 230 275 44 80 79 102 2.7 2.9
M6 8.15 8.30 507 822 96 112 75 129 4.5 10.5
M7 7.86 8.12 579 884 104 120 135 156 11.2 12.2
M8 7.91 8.13 671 764 144 152 291 294 23.6 24.5
MW
Chloride
mg/L
Calcium
mg/L
Potassium
mg/L
Magnesium
mg/L
Sodium
mg/L
# Min Max Min Max Min Max Min Max Min Max
M1 1.1 1.2 10.41 12.49 0.48 0.97 4.114 5.126 0.8 1.1
M2 17.2 76.6 36.03 45.56 1.92 2.03 16.177 18.590 11.9 13.8
M3 44.2 69.2 36.91 40.32 2.51 2.68 13.624 15.970 23.2 38.4
M4 19.9 20.2 39.30 46.12 1.03 2.17 16.043 18.210 3.7 6.6
M5 11.9 13.4 21.22 27.60 0.88 1.35 6.319 8.001 2.5 3.1
M6 78.9 167 17.92 30.95 1.18 2.06 7.298 12.516 74.4 102.2
M7 80.7 148 33.23 38.00 1.86 3.26 12.672 14.692 53.9 113.1
M8 65.3 68.6 64.63 64.84 1.13 1.33 31.295 32.000 22.1 24.6
24
The nitrate-N concentrations in the private wells ranged from <0.01 mg N/L to 24.7 mg
N/L. One of the wells had a nitrate-N concentration below the detection limit (<0.1 mg N/L) for
all five sampling events. This well also had high iron and manganese concentrations suggesting
that any nitrate in the groundwater may have been removed through denitrification. The other
seventeen wells all had detectable nitrate-N on each trip and relatively low iron and manganese
concentrations. Figure 4 shows the variation in nitrate concentrations for all sampling events and
all wells.
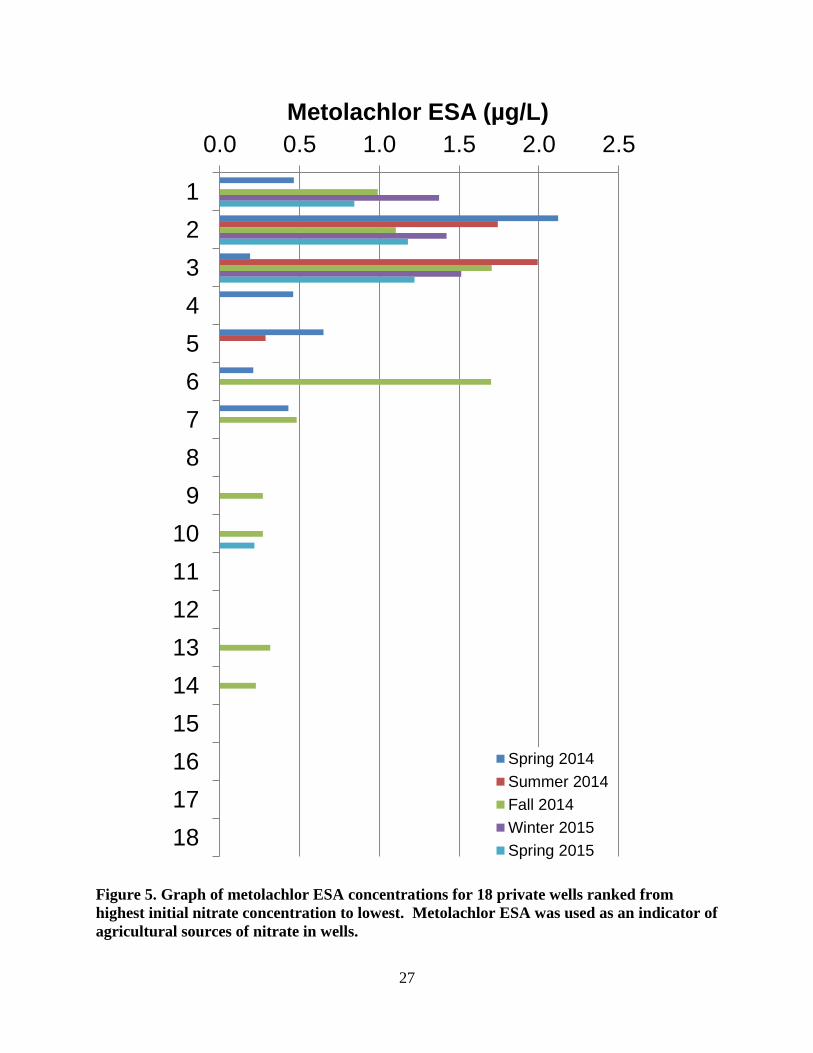
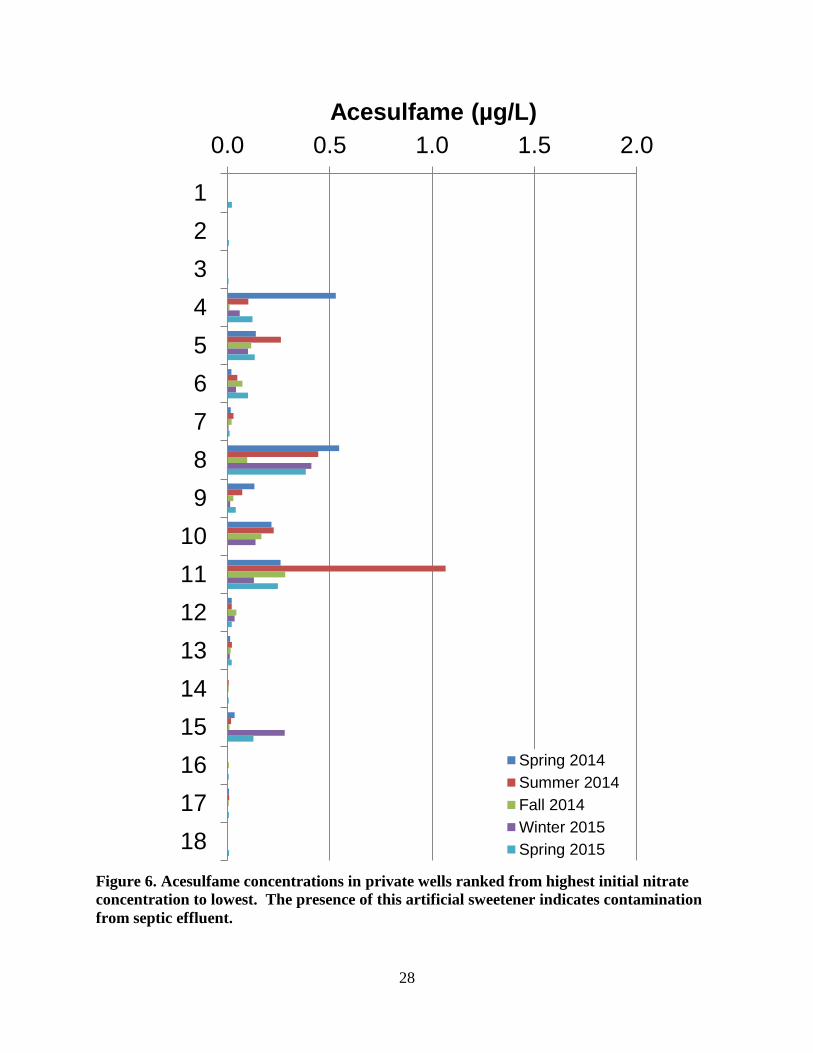
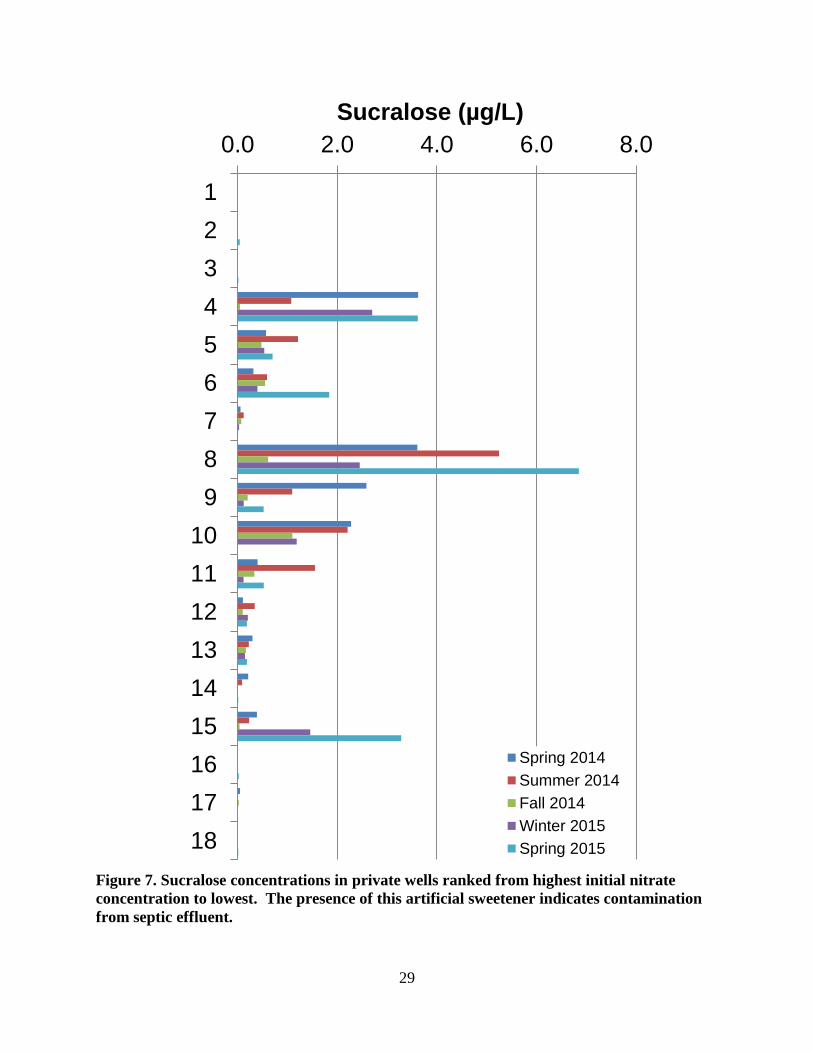
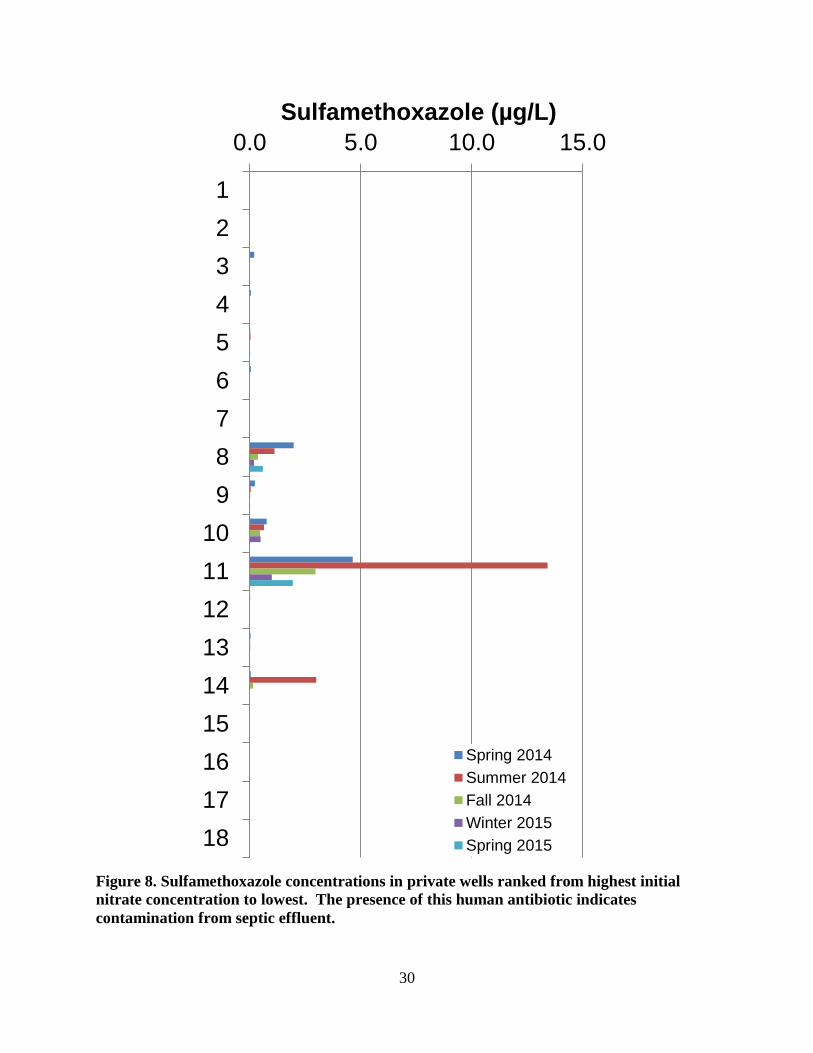
Of the fourteen on-site waste indicators that were analyzed in each of five sampling
events at all eighteen private wells, only three compounds were detected. These were
acesulfame, sucralose and sulfamethoxazole. They were detected in 66 of the 90 samples. Table
6 shows that the sucralose was found during 85% of samples where at least one on-site waste
indicator was detected; acesulfame was detected in 83% and sulfamethoxazole in 79%. Of the
nitrate-contaminated private wells that had an on-site waste indicator detected, acesulfame was
detected in 76%, sucralose in 82% and sulfamethoxazole in 88% of the wells. Three of the five
agricultural contaminants were detected. The herbicide metabolite metolachlor ESA was
detected in 50% of the wells. Figures 5 through 8 summarize the analysis of the most
commonly detected on-site waste and agricultural tracers.
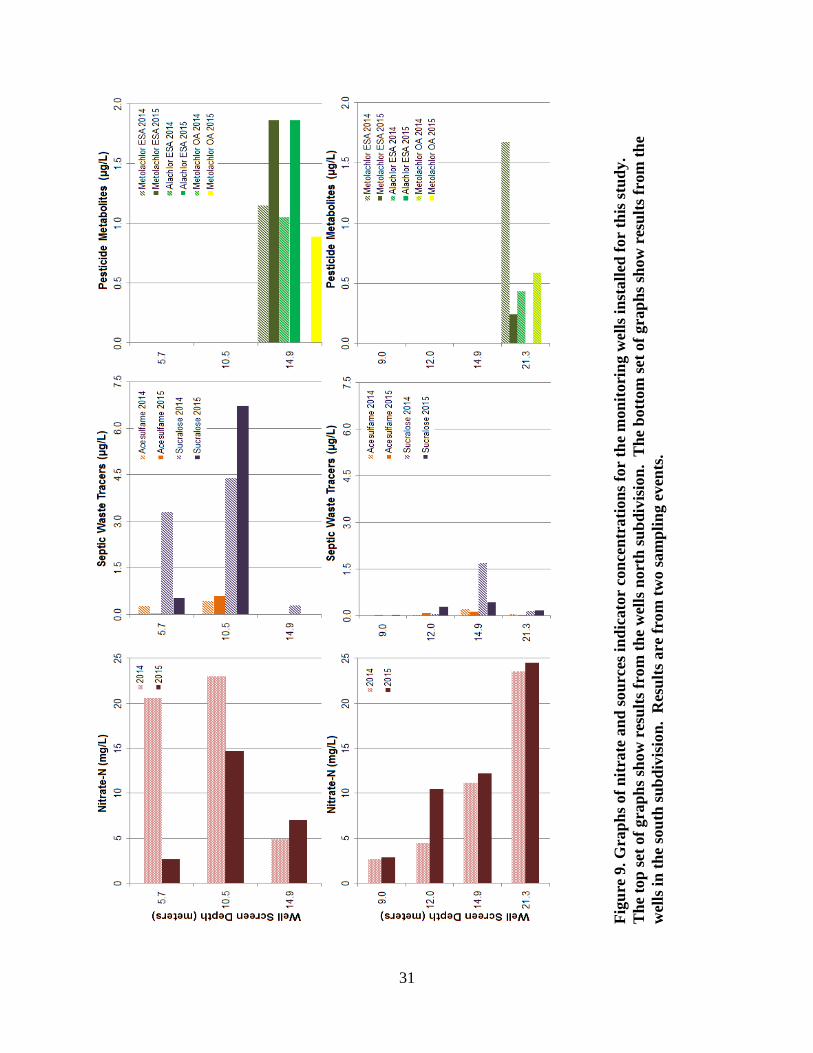
Monitoring well samples were also analyzed for nitrate and source indicators (Figure 9).
In the north study area, nitrate and all contaminant indicator concentrations were below the
detection limit in M1, the existing upgradient monitoring well. In the downgradient multi-port
wells (M2, M3, and M4) acesulfame and sucralose were detected in the two shallower wells.
25
Very low concentrations (<0.025 ng/L) of sulfamethoxazole were also detected in the shallow
wells. Metolachlor ESA was detected in the deepest well. In the south study area, the
concentration of nitrate increased with depth. On-site waste tracers were detected in all of the
nitrate-contaminated monitoring wells with the highest concentrations at the 14.9 meter depth
(M7). Metolachlor ESA was only detected in the deepest well (M8) at 21.3 meters from the
surface.
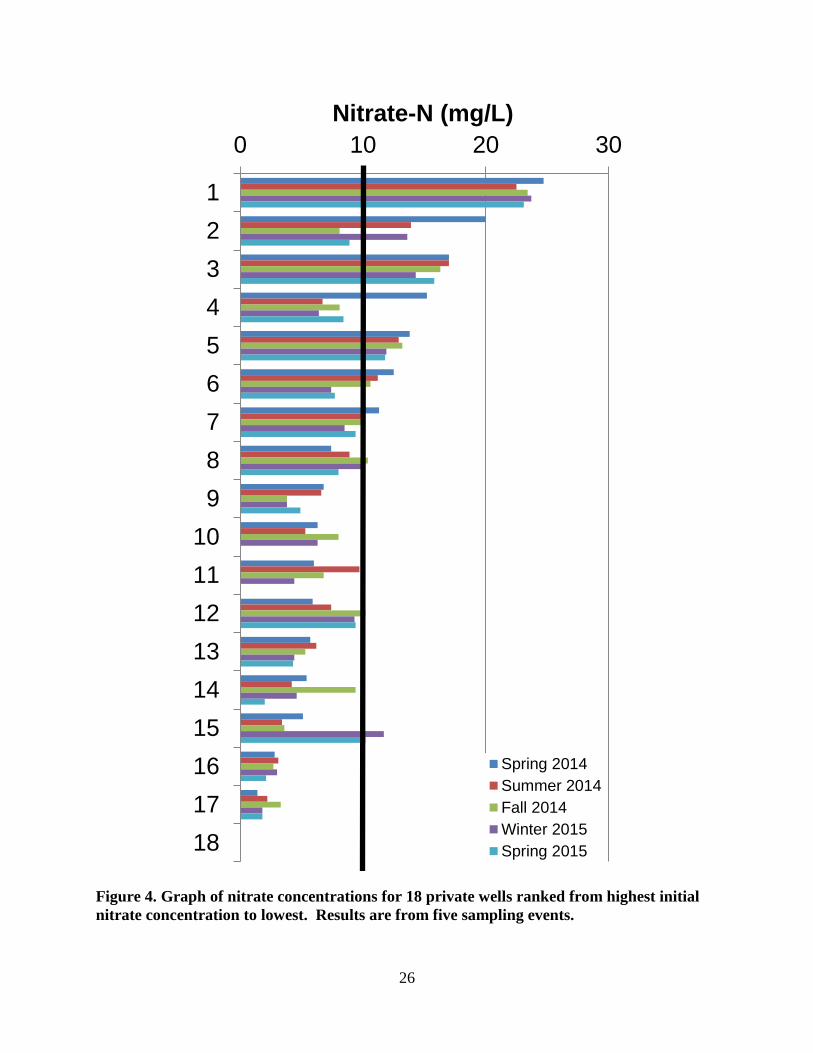
26
Figure 4. Graph of nitrate concentrations for 18 private wells ranked from highest initial
nitrate concentration to lowest. Results are from five sampling events.
0 10 20 30
1
2
3
4
5
6
7
8
9
10
11
12
13
14
15
16
17
18
Nitrate-N (mg/L)
Spring 2014
Summer 2014
Fall 2014
Winter 2015
Spring 2015
27
Figure 5. Graph of metolachlor ESA concentrations for 18 private wells ranked from
highest initial nitrate concentration to lowest. Metolachlor ESA was used as an indicator of
agricultural sources of nitrate in wells.
0.0 0.5 1.0 1.5 2.0 2.5
1
2
3
4
5
6
7
8
9
10
11
12
13
14
15
16
17
18
Metolachlor ESA (µg/L)
Spring 2014
Summer 2014
Fall 2014
Winter 2015
Spring 2015
28
Figure 6. Acesulfame concentrations in private wells ranked from highest initial nitrate
concentration to lowest. The presence of this artificial sweetener indicates contamination
from septic effluent.
0.0 0.5 1.0 1.5 2.0
1
2
3
4
5
6
7
8
9
10
11
12
13
14
15
16
17
18
Acesulfame (µg/L)
Spring 2014
Summer 2014
Fall 2014
Winter 2015
Spring 2015
29
Figure 7. Sucralose concentrations in private wells ranked from highest initial nitrate
concentration to lowest. The presence of this artificial sweetener indicates contamination
from septic effluent.
0.0 2.0 4.0 6.0 8.0
1
2
3
4
5
6
7
8
9
10
11
12
13
14
15
16
17
18
Sucralose (µg/L)
Spring 2014
Summer 2014
Fall 2014
Winter 2015
Spring 2015
30
Figure 8. Sulfamethoxazole concentrations in private wells ranked from highest initial
nitrate concentration to lowest. The presence of this human antibiotic indicates
contamination from septic effluent.
0.0 5.0 10.0 15.0
1
2
3
4
5
6
7
8
9
10
11
12
13
14
15
16
17
18
Sulfamethoxazole (µg/L)
Spring 2014
Summer 2014
Fall 2014
Winter 2015
Spring 2015
31
Fig
ure
9. G
rap
hs
of
nit
rate
an
d s
ou
rces
in
dic
ato
r c
on
cen
tra
tion
s fo
r th
e m
on
itori
ng w
ells
in
stall
ed f
or
this
stu
dy.
Th
e to
p s
et o
f gra
ph
s sh
ow
res
ult
s fr
om
th
e w
ells
nort
h s
ub
div
isio
n. T
he
bott
om
set
of
gra
ph
s sh
ow
res
ult
s fr
om
th
e
wel
ls i
n t
he
sou
th s
ub
div
isio
n. R
esu
lts
are
fro
m t
wo s
am
pli
ng e
ven
ts.
32
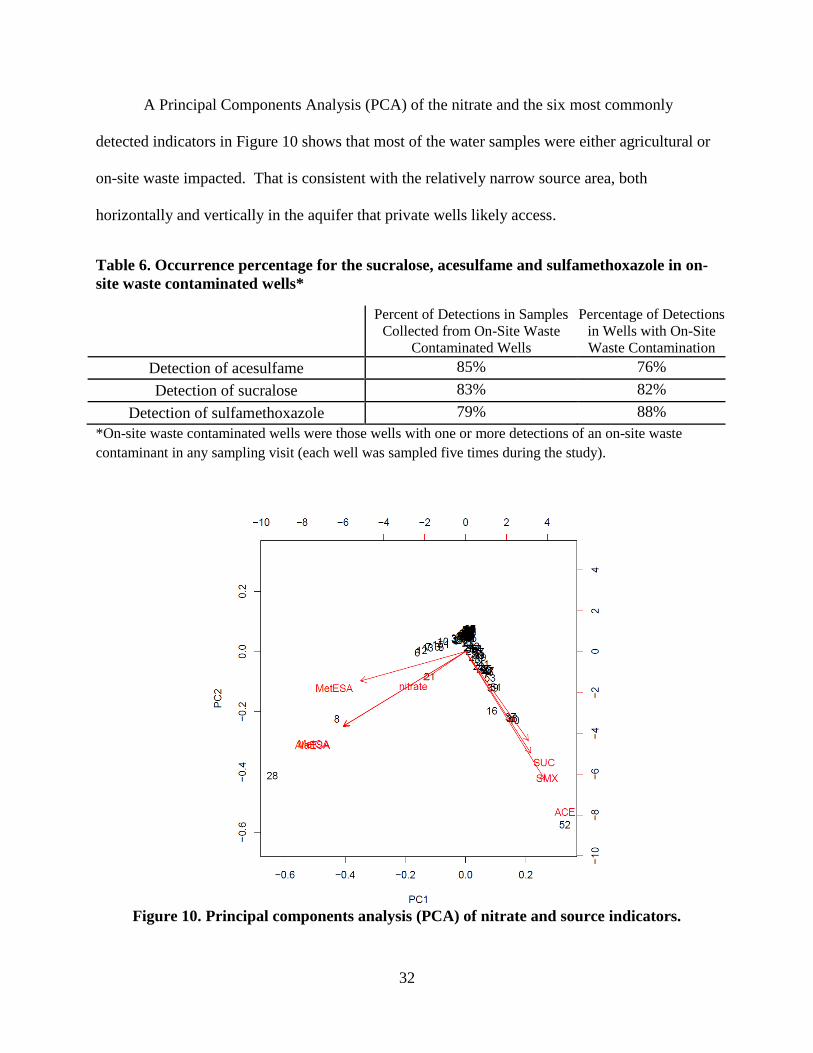
A Principal Components Analysis (PCA) of the nitrate and the six most commonly
detected indicators in Figure 10 shows that most of the water samples were either agricultural or
on-site waste impacted. That is consistent with the relatively narrow source area, both
horizontally and vertically in the aquifer that private wells likely access.
Table 6. Occurrence percentage for the sucralose, acesulfame and sulfamethoxazole in on-
site waste contaminated wells*
Percent of Detections in Samples
Collected from On-Site Waste
Contaminated Wells
Percentage of Detections
in Wells with On-Site
Waste Contamination
Detection of acesulfame 85% 76%
Detection of sucralose 83% 82%
Detection of sulfamethoxazole 79% 88%
*On-site waste contaminated wells were those wells with one or more detections of an on-site waste
contaminant in any sampling visit (each well was sampled five times during the study).
Figure 10. Principal components analysis (PCA) of nitrate and source indicators.
33
CONCLUSIONS
The results of this study show that chemical tracers can be used to identify sources of
nitrate contamination. All of the nitrate-contaminated wells in this suburban study area had
detectable concentrations of at least one of the nitrate agriculture and on-site waste indicator
compounds. Ninety-six percent of private well samples with nitrate-N concentrations 3.0 mg/L
or greater had at least one of four contaminant source indicators. Ninety-nine percent of samples
with nitrate-N concentrations 5.0 mg/L or greater had at least one contaminant source indicator.
Similar results were found in the monitoring wells used in this study where all of the well
samples with nitrate-N concentrations 3.0 mg/L or greater had at least one of four contaminant
source indicators. Those four indicators were acesulfame, sucralose, sulfamethoxazole, and
metolachlor ESA.
The mixture of both agricultural and on-site waste compounds in the study wells is
consistent with the importance of both to groundwater quality in the study area. Agricultural
contaminants were found in the deeper monitoring wells consistent with their distance away
from the study area. Longer groundwater travel distances lead to contaminants moving deeper in
the aquifer. The on-site waste indicators were found in the shallower monitoring wells as
expected for contaminant sources that are closer to the monitoring wells.
The results of this study confirm several recent studies suggesting that artificial
sweeteners sucralose and acesulfame are useful as indicators of on-site waste contamination of
groundwater. These sweeteners have been approved for use in food products for more than
fifteen years, are water soluble and relatively recalcitrant in aquifers. Their analysis can be a
useful tool for identifying likely on-site waste contamination in many areas. The occurrence of
34
sulfamethoxazole in many of the study wells was not expected because antibiotics are typically
prescribed for short-term use. It appears that its use in the study area was common. Combined
with its mobility and persistence this suggests it may also be a useful on-site waste indicator.
Other on-site waste indicators were not found in groundwater in the study area although previous
studies have suggested their presence down-gradient from household systems. Our limited
detections of these other compounds may reflect the longer travel distance between on-site waste
systems and sampling points in our study. The chloroacetanilide herbicide metabolites were
shown to be useful agricultural contamination indicators while the fungicide metabolite and the
bovine antibiotic in the indicator group were not found in this study area.
35
REFERENCES
Ferry, M. 2011. Wastewater treatment plant endocrine disrupting chemical monitoring study.
Minnesota Pollution Control Agency Report lrp-ei-1sy11.
Fram, M.S. and K. Belitz. 2011. Occurrence and concentrations of pharmaceutical compounds
in groundwater used for public drinking-water supply in California. Science of the Total
Environment 409:3409-3417.
Glassmeyer, S. T., E. T. Furlong, D. W. Kolpin, J. D. Cahill, S. D. Zaugg, S. L. Werner,
M. T. Meyer, and D. D. Kryak. 2005. Transport of chemical and microbial
compounds from known wastewater discharges: potential for use as indicators of
human fecal contamination. Environmental Science & Technology. 39:5157-
5169.
Gotkowitz, M.B., and D.S Liebl. 2013. Municipal drinking water safety.
http://www4.uwm.edu/shwec/publications/cabinet/other/ES053fin3-229-13.pdf.
Hinkle, S.R. et al. 2009. Organic wastewater compounds, pharmaceuticals, and coliphage in
ground water receiving discharge from onsite wastewater treatment systems near La Pine,
Oregon: occurrence and implications for transport. USGS Scientific Investigations Report 2005-
5055.
Kraft, G.J., B.A. Browne, W.M. DeVita and D.J. Mechenich. 2008. Agricultural pollutant
penetration and steady state in thick aquifers. Ground Water 46:41-50.
Loos, R., B. M. Gawlik, K. Boettcher, G. Locoro, S. Contini, G. Bidoglio. 2009.
Sucralose screening in European surface waters using a solid-phase extraction liquid
chromatography–triple quadrupole mass spectrometry method. Journal of
Chromatography A. 1216:1126–1131. DOI: 10.1016/j.chroma.2008.12.048.
Madison, R. J. and Burnett, J. O. 1985. Overview of the occurrence of nitrate in ground
water of the United States, in National Water Summary 1984-Hydrologic Events,
Selected Water-Quality Trends, and Ground-Water Resources: U.S. Geological
Survey Water-Supply Paper 2275, pp. 93-105.
Nakada, N., K. Kiri, H. Shinohara, A. Harada, K. Kuroda, S. Takizawa, and H. Takada.
2008. Evaluation of pharmaceuticals and personal care products as water-soluble
molecular markers of sewage. Environmental Science & Technology.
42:6347-6353.
Nitka, A. L. 2014. Developing and Testing a Method for the Analysis of
Chemical Human Waste Markers in Groundwater and Identifying Sources of Nitrate
Contamination (Thesis).
36
Portage County Planning and Zoning. 2011. Continuous Assessment Subcommittee
Report to the Portage County Groundwater Citizens Advisory Committee.
Robertson, W.D. 2008. Irreversible phosphorus sorption in septic system plumes? Ground
Water 46:51-60.
Scheurer, M., H-J. Brauch, and F. T. Lange. 2009. Analysis and occurrence of seven
artificial sweeteners in German waste water and surface water in soil aquifer
treatment (SAT). Analytical and Bioanalytical Chemistry. 394:1585-1594.
Shaw, B. 1994. Nitrogen Contamination sources: A Look at Relative Contributions, IN:
Conference Proceedings: Nitrate in Wisconsin’s Groundwater: Strategies and Challenges, May
10, 1994, Central Wisconsin Groundwater Center (UWEX), Golden Sands RC&D, WI Dept of
Natural Resources and WI Dept. of Health and Social Services.
Van Stempvoort, D.R., W.D. Robertson, and S.J. Brown. 2011. Artificial sweeteners in a large
septic plume. Ground Water Monitoring and Remediation 31:95-102.
U. S. EPA. 2008. Drinking Water Health Advisory for Boron. US EPA 822-R-08-013.
U. S. EPA. 2012. 2012 Edition of the Drinking Water Standards and Health Advisories.
http://water.epa.gov/action/advisories/drinking/upload/dwstandards2012.pdf.
WI Administrative Code ch. NR 140.10. 2012.
http://docs.legis.wisconsin.gov/code/admin_code/nr/100/140.pdf#page=3.
Wisconsin Department of Natural Resources. 2015. Nitrate in groundwater – a continuing issue
for Wisconsin citizens.
http://dnr.wi.gov/topic/groundwater/documents/pubs/nitrateingroundwater.pdf
Wisconsin Department of Natural Resources. 2010. Nitrate in drinking water. PUB-DG-
001. Bureau of Drinking Water and Groundwater.
http://dnr.wi.gov/files/PDF/pubs/DG/DG0001.pdf.
Wisconsin Groundwater Coordinating Council. 2009. Nitrate in Groundwater.
http://aqua.wisc.edu/publications/pdfs/nitratefactsheet.pdf.
Wisconsin Groundwater Coordinating Council, 2015. Report to Legislature,
http://dnr.wi.gov/topic/groundwater/documents/GCC/GwQuality/Nitrate.pdf
Zimmerman, L. R., K.A. Hostetler, and E.M. Thurman. 2000. Methods of analysis by the
U.S. Geological Survey Organic Geochemistry Research Group-determination of
chloroacetanilide herbicide metabolites in water using high-performance liquid
chromatography-diode array detection and high-performance liquid
chromatography/mass spectrometry. U.S. Geological Survey Open-File Report 00-182.
37
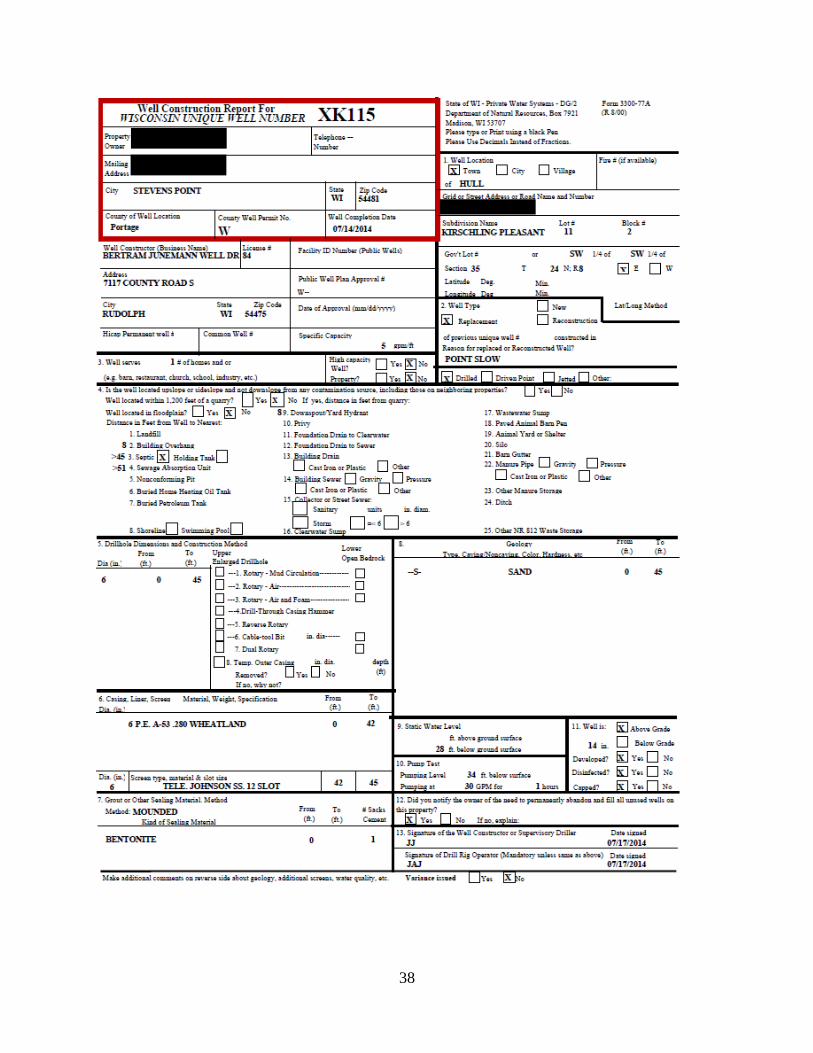
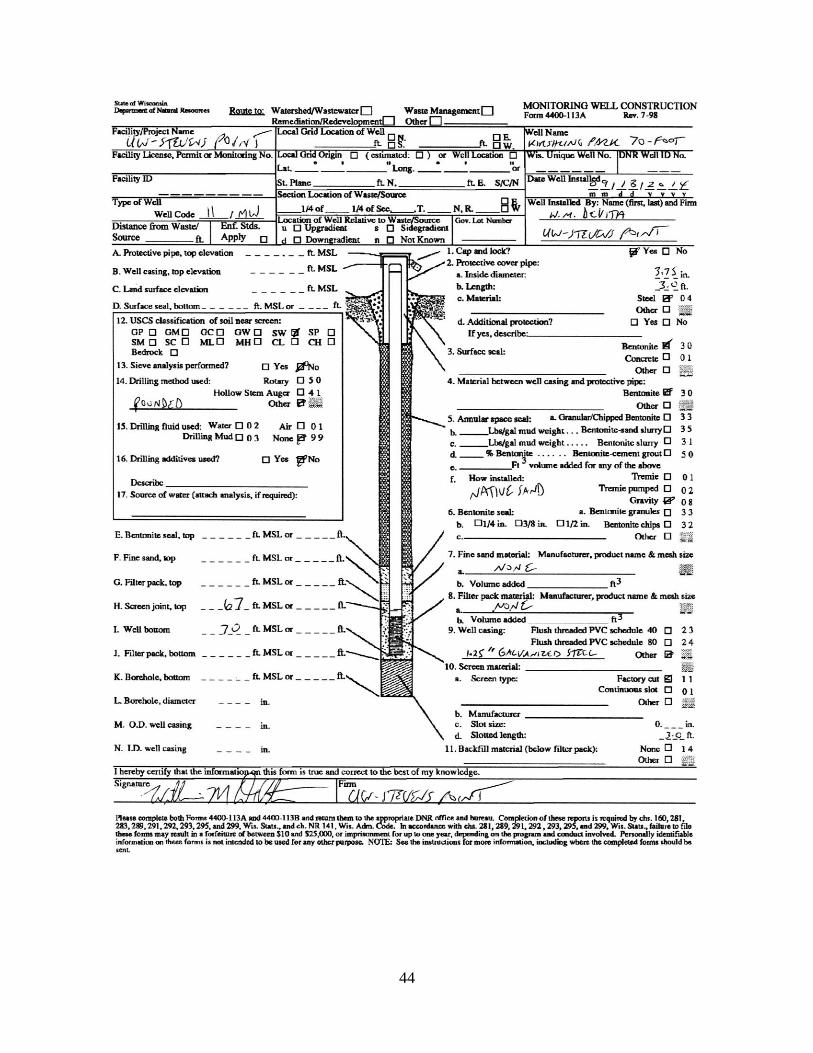
APPENDIX A– Well Construction Reports
The following are well construction reports for four of the private wells in this study, and the
monitoring wells installed for this project. Well construction reports were not available for the
other private wells, nor the existing monitoring well (M1).
38

39
40
41
42
43
44
45
APPENDIX B – Charge Balance Calculations
Private Wells
Well Trip Anions Cations CBE Well Trip Anions Cations CBE 1 1 3.8 3.8 0% 10 1 3.5 3.4 2%
1 2 3.7 3.9 -3% 10 2 4.2 4.3 0%
1 3 3.9 3.9 0% 10 3 3.1 3.1 0%
1 4 3.7 3.5 2% 10 4 3.1 3.0 2%
1 5 3.6 3.5 1% 10 5 4.1 4.2 -1%
2 1 6.8 6.5 2% 11 1 4.9 4.7 2%
2 2 6.3 6.7 -3% 11 2 4.8 5.1 -2%
2 3 6.8 7.0 -1% 11 3 4.2 4.0 2%
2 4 6.1 6.1 0% 11 4 3.8 3.6 1%
2 5 6.7 6.4 2% 11 5 4.0 3.9 2%
3 1 5.5 5.4 2% 12 1 3.4 3.2 4%
3 2 6.1 6.3 -2% 12 2 4.4 3.5 11%
3 3 7.0 7.3 -2% 12 3 3.9 3.9 0%
3 4 6.2 6.3 -1% 12 4 3.6 3.4 2%
3 5 5.7 5.7 0% 12 5 3.5 3.8 -4%
4 1 8.6 8.9 -2% 13 1 3.2 3.1 1%
4 2 7.3 7.6 -2% 13 2 3.9 4.0 -2%
4 3 6.6 5.9 5% 13 3 3.4 3.4 1%
4 4 6.9 7.1 -1% 13 4 3.6 3.4 4%
4 5 7.0 6.8 1% 13 5 3.8 3.7 2%
5 1 8.8 8.5 2% 14 1 2.7 2.7 0%
5 2 8.9 9.0 -1% 14 2 2.0 2.1 -2%
5 3 8.7 9.3 -3% 14 3 2.6 2.6 -1%
5 4 8.8 8.7 1% 14 4 2.1 2.0 2%
5 5 9.0 8.7 2% 14 5 1.5 1.5 -1%
6 1 5.4 5.0 4% 15 1 2.7 2.6 2%
6 2 5.4 5.5 -1% 15 2 2.8 2.6 4%
6 3 5.2 5.3 0% 15 3 2.1 2.1 1%
6 4 4.7 4.7 0% 15 4 3.7 3.4 4%
6 5 5.1 4.8 2% 15 5 3.9 3.7 2%
7 1 5.0 4.7 3% 16 1 4.6 4.3 3%
7 2 4.3 4.5 -2% 16 2 3.9 4.0 0%
7 3 4.5 4.5 -1% 16 3 3.9 3.8 1%
7 4 3.9 3.7 3% 16 4 4.6 4.2 5%
7 5 4.0 3.4 9% 16 5 4.9 4.8 1%
8 1 6.0 6.0 1% 17 1 3.3 3.2 2%
8 2 4.2 4.3 -1% 17 2 3.1 3.1 0%
8 3 4.7 4.3 4% 17 3 3.0 2.7 5%
8 4 6.5 6.1 3% 17 4 3.0 2.8 3%
8 5 6.6 6.6 0% 17 5 2.9 2.8 1%
9 1 5.0 4.7 3% 18 1 2.8 2.8 1%
9 2 4.9 4.8 1% 18 2 2.8 2.9 -1%
9 3 4.4 4.4 -1% 18 3 3.0 3.0 0%
9 4 5.0 4.8 2% 18 4 2.9 2.6 5%
9 5 5.1 4.6 6% 18 5 2.8 2.8 -1%
46
Monitoring Wells
Well Trip Anions Cations CBE
M1 1 1.2 1.1 6%
M2 1 5.3 4.5 9%
M3 1 5.1 4.4 7%
M4 1 3.3 3.6 -4%
M5 1 2.2 2.2 1%
M6 1 4.8 4.8 0%
M7 1 5.2 5.5 -3%
M8 1 5.8 6.9 -9%
M1 2 0.9 0.9 0%
M2 2 3.6 3.7 -2%
M3 2 3.9 4.7 -10%
M4 2 3.6 4.0 -6%
M5 2 1.5 1.7 -6%
M6 2 7.1 7.1 0%
M7 2 6.8 7.7 -6%
M8 2 5.6 6.9 -10%
47
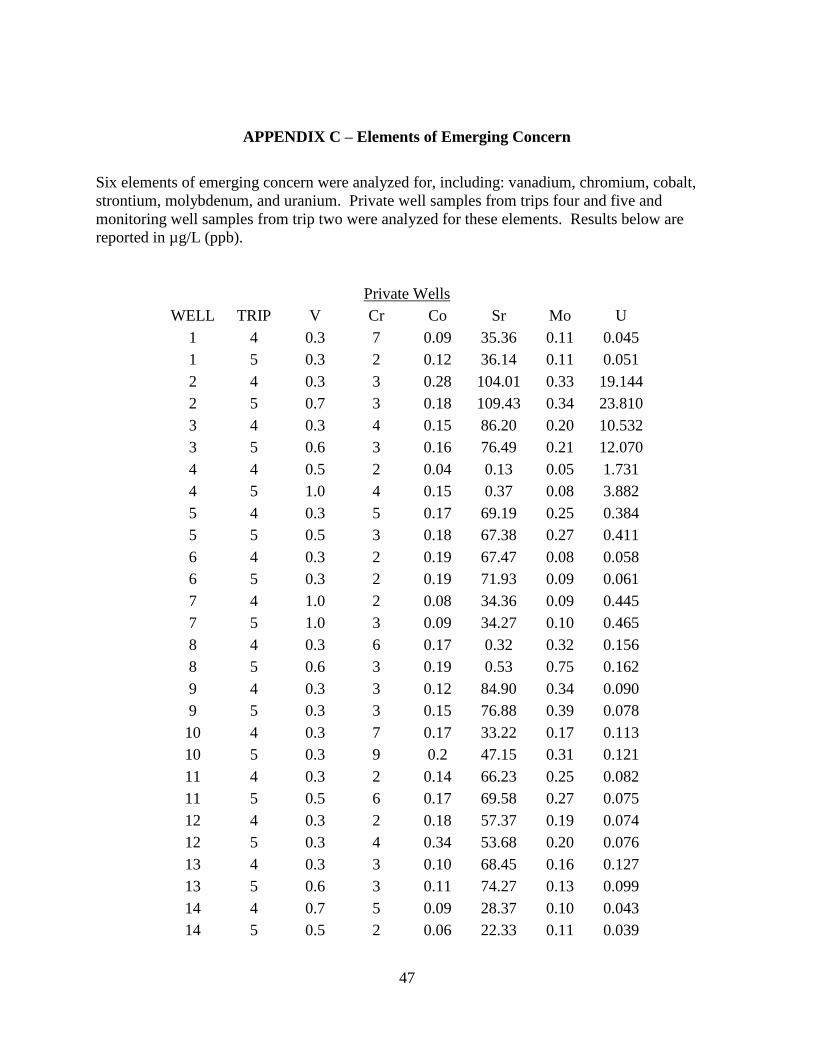
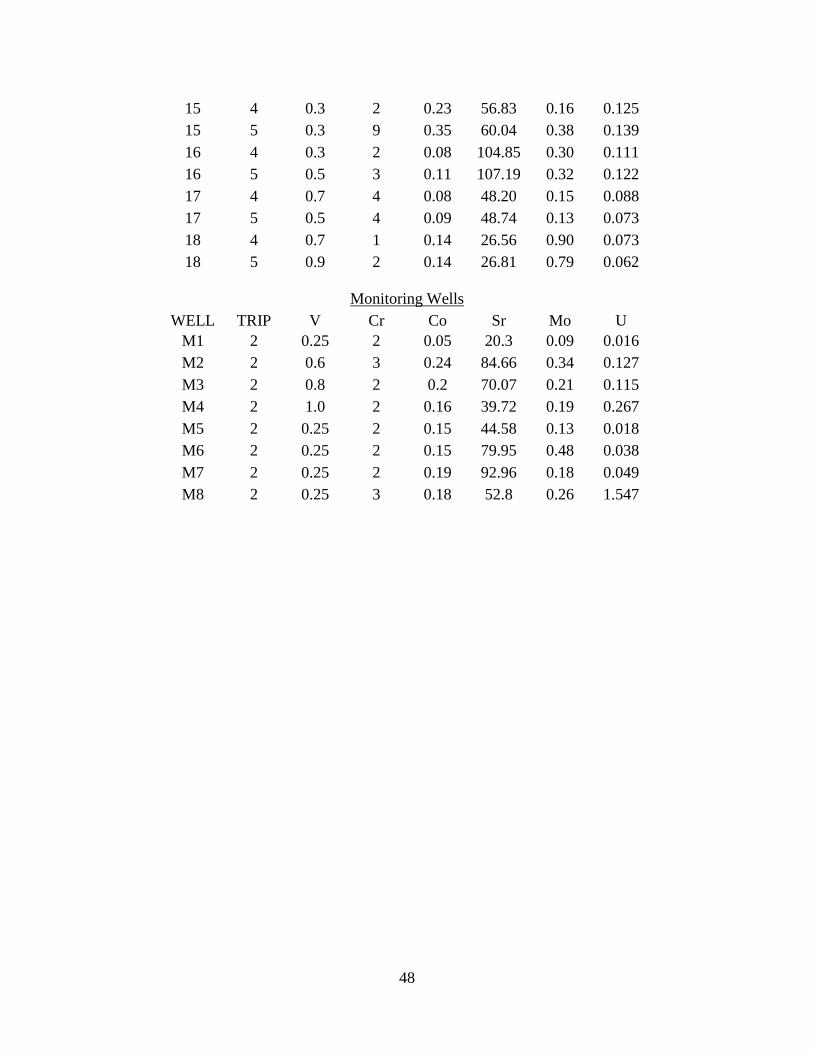
APPENDIX C – Elements of Emerging Concern
Six elements of emerging concern were analyzed for, including: vanadium, chromium, cobalt,
strontium, molybdenum, and uranium. Private well samples from trips four and five and
monitoring well samples from trip two were analyzed for these elements. Results below are
reported in µg/L (ppb).
Private Wells
WELL TRIP V Cr Co Sr Mo U
1 4 0.3 7 0.09 35.36 0.11 0.045
1 5 0.3 2 0.12 36.14 0.11 0.051
2 4 0.3 3 0.28 104.01 0.33 19.144
2 5 0.7 3 0.18 109.43 0.34 23.810
3 4 0.3 4 0.15 86.20 0.20 10.532
3 5 0.6 3 0.16 76.49 0.21 12.070
4 4 0.5 2 0.04 0.13 0.05 1.731
4 5 1.0 4 0.15 0.37 0.08 3.882
5 4 0.3 5 0.17 69.19 0.25 0.384
5 5 0.5 3 0.18 67.38 0.27 0.411
6 4 0.3 2 0.19 67.47 0.08 0.058
6 5 0.3 2 0.19 71.93 0.09 0.061
7 4 1.0 2 0.08 34.36 0.09 0.445
7 5 1.0 3 0.09 34.27 0.10 0.465
8 4 0.3 6 0.17 0.32 0.32 0.156
8 5 0.6 3 0.19 0.53 0.75 0.162
9 4 0.3 3 0.12 84.90 0.34 0.090
9 5 0.3 3 0.15 76.88 0.39 0.078
10 4 0.3 7 0.17 33.22 0.17 0.113
10 5 0.3 9 0.2 47.15 0.31 0.121
11 4 0.3 2 0.14 66.23 0.25 0.082
11 5 0.5 6 0.17 69.58 0.27 0.075
12 4 0.3 2 0.18 57.37 0.19 0.074
12 5 0.3 4 0.34 53.68 0.20 0.076
13 4 0.3 3 0.10 68.45 0.16 0.127
13 5 0.6 3 0.11 74.27 0.13 0.099
14 4 0.7 5 0.09 28.37 0.10 0.043
14 5 0.5 2 0.06 22.33 0.11 0.039
48
15 4 0.3 2 0.23 56.83 0.16 0.125
15 5 0.3 9 0.35 60.04 0.38 0.139
16 4 0.3 2 0.08 104.85 0.30 0.111
16 5 0.5 3 0.11 107.19 0.32 0.122
17 4 0.7 4 0.08 48.20 0.15 0.088
17 5 0.5 4 0.09 48.74 0.13 0.073
18 4 0.7 1 0.14 26.56 0.90 0.073
18 5 0.9 2 0.14 26.81 0.79 0.062
Monitoring Wells
WELL TRIP V Cr Co Sr Mo U
M1 2 0.25 2 0.05 20.3 0.09 0.016
M2 2 0.6 3 0.24 84.66 0.34 0.127
M3 2 0.8 2 0.2 70.07 0.21 0.115
M4 2 1.0 2 0.16 39.72 0.19 0.267
M5 2 0.25 2 0.15 44.58 0.13 0.018
M6 2 0.25 2 0.15 79.95 0.48 0.038
M7 2 0.25 2 0.19 92.96 0.18 0.049
M8 2 0.25 3 0.18 52.8 0.26 1.547