Embed Size (px)
Citation preview
r Human Brain Mapping 00:000–000 (2011) r
Evaluating and Reducing the Impact of WhiteMatter Lesions on Brain Volume Measurements
Marco Battaglini,1 Mark Jenkinson,2 and Nicola De Stefano1*
1Department of Neurological and Behavioral Sciences, University of Siena, Italy2Department of Clinical Neurology, Oxford University Centre for Functional MRI of the Brain (FMRIB),
University of Oxford, United Kingdom
r r
Abstract: MR-based measurements of brain volumes may be affected by the presence of white matter(WM) lesions. Here, we assessed how and to what extent this may happen for WM lesions of varioussizes and intensities. After inserting WM lesions of different sizes and intensities into T1-W brainimages of healthy subjects, we assessed the effect on two widely used automatic methods for brainvolume measurement such as SIENAX (segmentation-based) and SIENA (registration-based). Toexplore the relevance of partial volume (PV) estimation, we performed the experiments with two dif-ferent PV models, implemented by the same segmentation algorithm (FAST) of SIENAX and SIENA.Finally, we tested potential solutions to this issue. The presence of WM lesions did not bias measure-ments for registration-based method such as SIENA. By contrast, the presence of WM lesions affectedsegmentation-based brain volume measurements such as SIENAx. The misclassification of both graymatter (GM) and WM volumes varied considerably with lesion size and intensity, especially when thelesion intensity was similar to that of the GM/WM interface. The extent to which the presence of WMlesions could affect tissue-class measures was clearly driven by the PV modeling used, with the mixel-type PV model giving a lower error in the presence of WM lesions. The tissue misclassification due toWM lesions was still present when they were masked out. By contrast, refilling the lesions withintensities matching the surrounding normal-appearing WM ensured accurate tissue-class measure-ments and thus represents a promising approach for accurate tissue classification and brain volumemeasurements. Hum Brain Mapp 00:000–000, 2011. VC 2011 Wiley-Liss, Inc.
Keywords: brain atrophy; white matter lesions; SIENA; SIENAX
r r
INTRODUCTION
The development of computational methods that, usingconventional magnetic resonance (MR) images, are able toprovide sensitive and reproducible measures of brain vol-umes, has allowed an indirect quantification of the brain.
These methods have been extensively used in the study ofmultiple sclerosis (MS) to estimate total and regional (i.e.,white matter [WM] and gray matter [GM]) cerebral tissueloss, providing measures able to accurately assess andmonitor the pathologic evolution of the disease [Battagliniet al., 2009; Bendfeldt et al., 2009; Chard et al., 2004; Chenet al., 2004; De Stefano et al., 2003].
Recently, much effort has been dedicated to improve theefficiency of automated segmentation algorithms for MRimages [Nakamura and Fisher, 2009; Sdika and Pelletier,2009], particularly in relation to the influence that the pres-ence of WM lesions, such as those found in the brain ofMS patients, can have in the measurement of tissue spe-cific brain volumes [Chard et al., 2010; Nakamura andFisher, 2009; Sdika and Pelletier, 2009]. In one recent study
*Correspondence to: Nicola De Stefano, MD PhD, Department ofNeurological and Behavioral Sciences, University of Siena, VialeBracci 2, 53100 Siena, Italy. E-mail: [email protected]
Received for publication 14 June 2010; Revised 6 March 2011;Accepted 11 April 2011
DOI: 10.1002/hbm.21344Published online in Wiley Online Library (wileyonlinelibrary.com).
VC 2011 Wiley-Liss, Inc.
[Sdika and Pelletier, 2009], WM lesions were shown to dis-tort the output of non-linear registration, and the filling ofthe lesions with the intensity of the normal-appearingneighbor voxels appeared as an effective solution for thisbias. In another recent study [Nakamura and Fisher, 2009],a new segmentation algorithm was developed and tested.This was able to calculate GM volumes avoiding themisclassification of WM lesions by using a combination ofintensity, anatomical and morphological probability maps.The work pointed out that, in the presence of WM lesions,GM could be linearly underestimated (and consequentlythe WM overestimated), even when the misclassification oflesions was avoided, due to a misclassification of voxelswith overlapping intensities [Nakamura and Fisher, 2009].Finally, Chard et al. [2010] confirmed that lesions with anintermediate intensity between GM and WM produce anunderestimation of GM volumes. They also investigatedthe effect of filling lesions before the segmentation, usingintensities sampled from a single, global WM distribution,with the mean and standard deviation equal to that of theoriginal WM.
Given the limited resolution of MR images and the irreg-ular shape of brain tissue interfaces, the accuracy of anysegmentation method in assigning partial volume (PV) vox-els to a single tissue type is inherently limited [Niessenet al., 1999] and PV classification models need to be used[Santago and Gage, 1995; Van Leemput et al., 2003]. How-ever, although it may be true that PV models fail to provideadequate tissue classification in the presence of WM lesions[Nakamura and Fisher, 2009], it is less certain to whatextent this affects the measurements of global and regionalbrain volume. To address these issues, we performed thepresent study with the aims (i) to assess how and to whatextent the presence of WM lesions of various sizes andintensities can affect brain volume measurements using asegmentation-based approach such as SIENAX [Smithet al., 2002], and with different PV models; (ii) to assesswhether these issues hold for a registration-based approachsuch as SIENA [Smith et al., 2001]; (iii) to propose a robustand practical approach to solve the issues related to thepresence of WM lesions in tissue classification analysis.
METHODS
To estimate the accuracy of performing total and tissuetype brain volume measurements in the presence of WMlesions that vary in size and intensity, we needed to workwith brain volume measures with a known ground truth.Thus, we selected five normal T1-weighted three-dimen-sional gradient echo (T1-W) images (FFE, flip angle ¼ 40,TR/TE ¼ 35/10 ms, 256 � 256 matrix, 1 signal average,250 � 250 mm2 field of view, 50 contiguous 3-mm slices)of five healthy subjects obtained by using a Philips Gyro-scan operating at 1.5 T (Philips Medical Systems, Best, TheNetherlands), and six binarized lesion masks previouslycreated from T2-weighted (T2-W)/proton-density (PD) MR
images of six different MS patients with different lesionloads (6, 12, 18, 24, 30 and 60 cm3). We then ‘‘created’’lesions in the images using these six lesion masks, on eachof the five ‘‘original’’ T1-W images, thus creating 30 ‘‘artifi-cial’’ images with binarized regions of interest (ROIs) hav-ing a known and relatively wide range of volumes.
To fill the ROIs of each of the 30 ‘‘artificial’’ images withintensity values of cerebrospinal fluid (CSF), CSF/GMinterface, GM, and GM/WM interface, this strategy wasfollowed:
i. Each ‘‘original’’ T1-W image of the healthy controlswas hard segmented and binarized maps of WM,GM, and CSF were created.
ii. Each of these binarized maps was multiplied by theoriginal T1-W image, and the mean and standarddeviation within the WM, GM, and CSF tissuemasks were calculated.
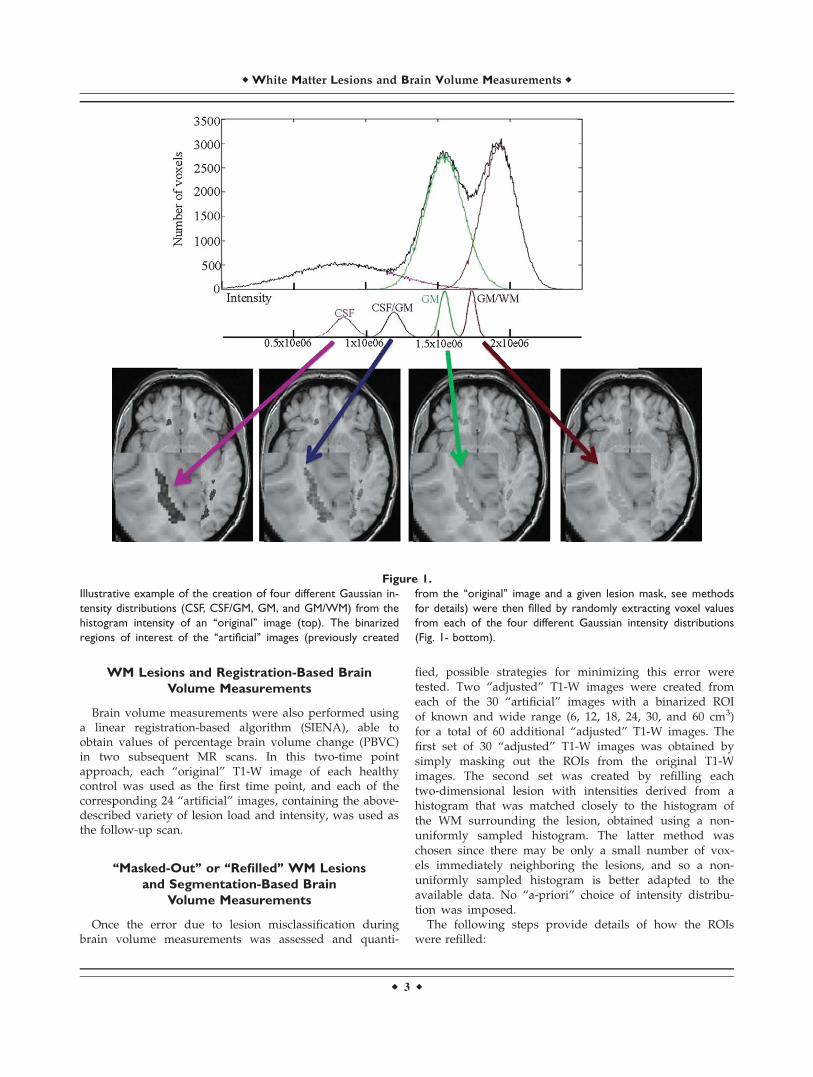
iii. Four different Gaussian intensity distributions weregenerated for each ‘‘original’’ image: CSF, CSF/GM,GM, GM/WM (Fig. 1- top). They had an intensitymean equal to the mean intensity of the CSF, CSF/GM interface, GM and GM/WM interface, respec-tively. The GM/WM and CSF/GM intensity meanswere defined as the average of the GM and WMmean values or the average of the CSF and GMmean values, respectively. The standard deviationsof each of the intensity distributions were calculatedby dividing the standard deviation of each tissue ortissue mixel types (i.e., tissue made by a mixture ofdifferent tissues) by 4, in order to obtain a narrowrange around the mean. In this case, the GM/WMand CSF/GM standard deviations were set to be thedifference between the GM and WM means, dividedby 4, or the difference of the CSF and GM means,divided by 4, respectively.
iv. Finally, ROIs of each of the 30 ‘‘artificial’’ imageswere filled by randomly extracting voxel valuesfrom each of the four different intensity (Gaussian)distributions (Fig. 1- bottom), creating a total of 120‘‘artificial’’ T1-W images.
WM Lesions and Segmentation-Based
Brain Volume Measurements
At this stage, brain volume measurements were obtainedusing a segmentation-based algorithm (SIENAX) to get val-ues of normalized brain volume (NBV), normalized whitematter volume (NWMV) and normalized gray matter vol-ume (NGMV) from the ‘‘original’’ 5 T1-W images of healthycontrols, as well as from the 120 ‘‘artificial’’ images withvarious lesion size, load, and intensities. Each ‘‘original’’T1-W image was then compared to the corresponding 24‘‘artificial’’ images derived from it, to obtain changes inNBV, NWMV, and NGMV between the two images.
r Battaglini et al. r
r 2 r
WM Lesions and Registration-Based Brain
Volume Measurements
Brain volume measurements were also performed usinga linear registration-based algorithm (SIENA), able toobtain values of percentage brain volume change (PBVC)in two subsequent MR scans. In this two-time pointapproach, each ‘‘original’’ T1-W image of each healthycontrol was used as the first time point, and each of thecorresponding 24 ‘‘artificial’’ images, containing the above-described variety of lesion load and intensity, was used asthe follow-up scan.
‘‘Masked-Out’’ or ‘‘Refilled’’ WM Lesions
and Segmentation-Based Brain
Volume Measurements
Once the error due to lesion misclassification duringbrain volume measurements was assessed and quanti-
fied, possible strategies for minimizing this error weretested. Two ‘‘adjusted’’ T1-W images were created fromeach of the 30 ‘‘artificial’’ images with a binarized ROIof known and wide range (6, 12, 18, 24, 30, and 60 cm3)for a total of 60 additional ‘‘adjusted’’ T1-W images. Thefirst set of 30 ‘‘adjusted’’ T1-W images was obtained bysimply masking out the ROIs from the original T1-Wimages. The second set was created by refilling eachtwo-dimensional lesion with intensities derived from ahistogram that was matched closely to the histogram ofthe WM surrounding the lesion, obtained using a non-uniformly sampled histogram. The latter method waschosen since there may be only a small number of vox-els immediately neighboring the lesions, and so a non-uniformly sampled histogram is better adapted to theavailable data. No ‘‘a-priori’’ choice of intensity distribu-tion was imposed.
The following steps provide details of how the ROIswere refilled:
Figure 1.
Illustrative example of the creation of four different Gaussian in-
tensity distributions (CSF, CSF/GM, GM, and GM/WM) from the
histogram intensity of an ‘‘original’’ image (top). The binarized
regions of interest of the ‘‘artificial’’ images (previously created
from the ‘‘original’’ image and a given lesion mask, see methods
for details) were then filled by randomly extracting voxel values
from each of the four different Gaussian intensity distributions
(Fig. 1- bottom).
r White Matter Lesions and Brain Volume Measurements r
r 3 r
i. An ROI (RL) was selected by using 2-D dilation anddefined as the ROI comprising the voxels that areimmediate neighbors of the binarized lesion mask(L) and belong to the WM. From RL, the number ofvoxels (NR) and their mean intensity (MR) were cal-culated. The intensity histogram of RL was then con-structed with the number of bins (nbins) equal to 10if NR was bigger than 40 and equal to round (NR/4)if lower. The bins were all of equal width. Finally,the fraction of voxels of RL belonging to the ith binwas calculated: fRi ¼ NRi/NR, where NRi is the num-ber of voxels of RL falling in the ith bin.
ii. Because we wanted the refilled intensities in L tovary smoothly at the boundary, L was divided intotwo additional binarized masks: the border voxels ofL (dL, refilled using the method described below inStep iii) and the inner voxels (Lin, obtained from L byexcluding the border voxels). The number of voxelsin Lin is denoted as NLin. To create a histogram for Linthat is well matched to the histogram of the voxels inRL, the same number of bins (nbins) were used andeach bin had the same proportion of entries.The number of voxels in Lin assigned to the ith bin
is denoted as NL-Bi. Initially we set NL-Bi to be the in-teger giving the smallest difference between fRi andfLi, where fLi is the fraction of voxels of Lin in the ithbin. However, this definition did not guarantee thatthe sum of NL-Bi was equal to NLin. The difference,Ndiff, is defined as
Ndiff ¼ NLin �Xi¼nbins
i¼1
NL�Bi
All the possible ways in which the Ndiff voxels couldbe rearranged into the nbins were then explored, andfor each of them a new fLi was calculated. Finally, a setofNL-Bi was chosen to minimize the function
Xi¼nbins
i¼1
ðfRi � fLiÞ2:
The nbins chosen previously were an arbitrarychoice, made without taking into account the lesionsize. To account for size, a non-uniform sampling ofthe histogram was obtained by dividing each bin intoan appropriate number of sub-bins. This wasachieved by applying the procedure described above(Step ii) to each of the previously defined equally-sized bins, substituting RL with RLi and NLin withNL-Bi. Thus, each bin was potentially divided intosub-bins, each of which can have a different numberof voxels falling in it.
We denote the range of intensities covered by thejth sub-bin of the ith bin as �Iij, which contains NBij
voxels. The intensities chosen for refilling voxels aredrawn from uniform distributions covering each �Iij.
iii. Finally, dL voxels were refilled with the mean valueof 8 in plane nearest neighboring voxels that belongto either RL or Lin. In addition, the mean of all thevoxel intensities used to refill L was constrainedto be equal to MR by simply adding an offset,(MR � ML), to the intensity of each voxel, where ML
is the mean voxel intensity in L.
At this stage, SIENAX was used to obtain NGMV from(i) the 5 ‘‘original’’ T1-W images, (ii) the 30 ‘‘adjusted’’ T1-W images where the lesions were masked out, and (iii) the30 ‘‘adjusted’’ T1-W images where the lesions were refilledwith the procedure described above.
PV Models’ Impact on Estimation of Volumes
in the Presence of WM Lesions
All the analyses described above were repeated usingtwo different PV estimation methods, as provided in twodifferent versions of FAST (FMRIB’s Automated Segmenta-tion Tool) [Zhang et al., 2001]: FAST version 3 (released inFSL-4.0); and FAST version 4 (released in FSL-4.1). Thiswas done to assess two things: how the size of the differ-ences in brain volume measurements, in the presence ofWM lesions, depends on the different PV classificationapproaches; and in addition, to test whether or not therefilling method affects the PV estimations to differentextents. The main difference between the partial volumemodeling used in FAST-3 and FAST-4 is that the MarkovRandom Field (MRF) is applied to the partial volume frac-tions (i.e., WM, GM and CSF) in FAST-3, but it is appliedto the mixel-type in FAST-4. The mixel-type represents theclassification of the mixture present in each voxel (e.g.,pure WM, or a mixture of GM and WM, etc.) and apply-ing the MRF to the mixel-type makes the assumption thatthe same mixture of tissues will be spatially adjacent,rather than assuming that the partial volume fractions willbe similar between spatially adjacent voxels. A conse-quence of this is that the borders appear sharper in theFAST-4 version, as a pure tissue type (partial volume frac-tion of 1.0) is more likely to occur in one voxel away froma boundary voxel. This is mainly due to the fact that inthe FAST-3 version, the MRF on the partial volume frac-tion tends to blur out the boundaries, biasing voxels thatactually contain pure tissue to have lower partial volumefractions in order to be similar to their neighboring(boundary) voxels. However, the effect of these differencesin partial volume modeling in the presence of WM lesionsis difficult to assess theoretically, which is why this empir-ical study was performed.
Statistical Analysis
Statistical analysis was performed using the R software(www.r-project.org). A within-within analysis of variance(ANOVA) of the values of NBV, NWMV and NGMV and
r Battaglini et al. r
r 4 r
PBVC was performed using both lesion load and the typeof lesion intensity distribution as factors. These analyseswere followed by a pair-wise post-hoc comparison usingTukey’s honestly significant difference procedure.
A linear regression was performed to evaluate thedependence of NGMV on lesion load in ‘‘masked’’and ‘‘refilled’’ images. Data were considered significant ata P-value <0.05.
RESULTS
Preliminary Test for the Use of ‘‘Artificial’’
Images in SIENAx and SIENA
As preliminary step, we assessed whether the use of‘‘artificial’’ images, which are identical to ‘‘original’’ imagesfor the vast majority of voxels, did not cause unexpectedor unwanted behavior of the software in both SIENAx andSIENA measurements.
We first tested if the skull-finding (used as scaling fac-tor) could be altered when artificial lesions were inserted.This was done by calculating the coefficient of variation(CV) for all the scaling factors referring to the ‘‘artificial’’images related to the image of each healthy subject. Wefound that mean of the CV was 0.48, indicating a verysmall dispersion of the data within the same subject. Inaddition, the mean scaling factor for all the ‘‘artificial’’images was 1.34 (range 1.24–1.44), with a maximum varia-tion of �8%.
We then tested the performance of the SIENA methodby analyzing five pairs of identical images. The PBVC val-ues obtained from this analysis was equal to 0%, rulingout possible errors resulting from this approach.
Influence of WM Lesions on Segmentation-Based
Brain Volume Measurements
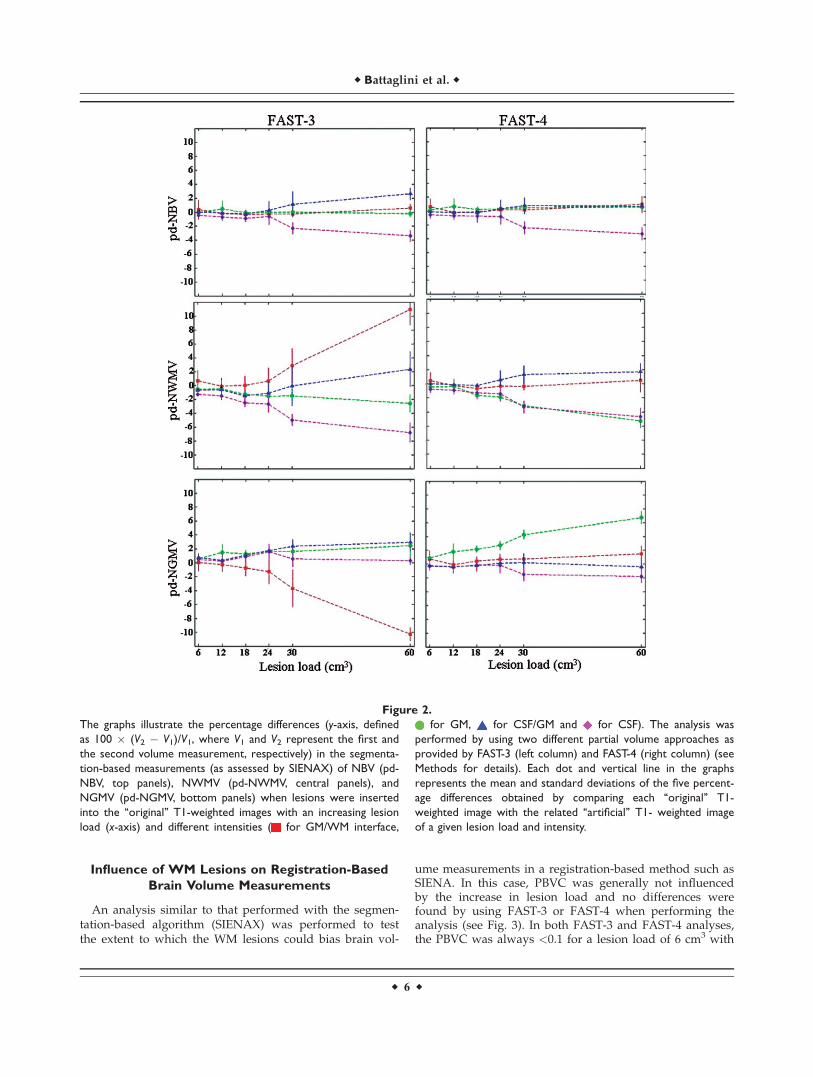
The extent to which the WM lesions may bias brain vol-ume measurements in a segmentation method was assessedby comparing the SIENAX results of each ‘‘original’’ T1-Wimage and the corresponding ‘‘artificial’’ images with dif-ferent WM lesion load and lesion intensities, thus obtainingthe pd-NBV, pd-NWMV, and pd-NGMV (see Fig. 2).
When FAST-3 was used for the analysis, the resultsshowed:
• NBV measures were 1664 � 19 cm3 in the ‘‘original’’T1-W images and were generally not influenced by theincrease in lesion load. When the lesion load was6 cm3, the values of differences in NBV for the diffe-rent intensity filling models were: GM/WM = 6.15 �23.3 cm3, GM = �0.33 � 6.6 cm3, CSF/GM = 0.33 �3.3 cm3, CSF = �7.15 � 5.0 cm3. The values of differen-ces in NBV decreased significantly (P < 0.001) withhigh lesion load only when the lesion intensity wassimilar to that of CSF (differences in NBV: �56.1 �13.6 cm3 for lesion load of 60 cm3).
• NWMV measures were 858 � 38 cm3 in the ‘‘original’’T1-W images. When the lesion load was 6 cm3, the val-ues of differences in NWMV for the different intensityfilling models were: GM/WM = 5.83 � 12.9 cm3, GM =�4.8 � 4.3 cm3, CSF/GM = �5.8 � 1.7 cm3, CSF = �11.6� 2.6 cm3. The values of differences in NWMV appearedto increase significantly (P< 0.001) with high lesion loadwhen the lesion intensity was similar to that of the GM/WM interface (differences in NWMV: 93.6 � 18.9 cm3
for lesion load of 60 cm3). By contrast, they decreasedwith high lesion load (P < 0.001) when the lesion inten-sity was similar to that of the CSF (NWMV:�58.3� 11.8 cm3
for lesion load of 60 cm3).• NGMV measures were 805 � 37 cm3 in the ‘‘original’’T1-W images. When the lesion load was 6 cm3, thevalues of differences in NGMV for the different inten-sity filling models were: GM/WM = 0.5 � 10.4 cm3,GM = 4.4 � 4.8 cm3, CSF/GM = 6.1 � 4.0 cm3, CSF =3.9 � 4.0 cm3. The values of differences in NGMVprogressively decreased with increasing lesion load(P < 0.001) only when the lesion intensity was similarto that of the GM/WM interface (differences inNGMV: �82.7 � 4.8 cm3 for lesion load of 60 cm3).
When FAST-4 was used for the analysis, the resultsshowed:
• NBV measures were 1,555 � 16 cm3 in the ‘‘original’’ T1-W images and were generally not influenced by theincrease in lesion load. When the lesion load was 6 cm3,the values of differences in NBV for the different intensityfilling models were: GM/WM = 9.0 � 18.7 cm3, GM¼ 2.6� 6.2 cm3, CSF/GM¼ �1.5� 3.11 cm3, CSF¼ �8.8� 7.8 cm3.The values of differences in NBV decreased significantly(P < 0.001) with high lesion load only when the lesionintensity was similar to that of CSF (differences in NBV:�51.3� 14.5 cm3 for lesion load of 60 cm3).
• NWMVmeasures were 802� 17 cm3 in the ‘‘original’’ T1-W images. When the lesion load was 6 cm3, the values ofdifferences in NWMV for the different intensity fillingmodels were: GM/WM ¼ 3.3 � 9.6 cm3, GM ¼ �3.92 �3.2 cm3, CSF/GM ¼ 0.0 � 1.6 cm3, CSF ¼ �6.3 � 4.0 cm3.The values of differences in NWMV decreased with highlesion load (P< 0.001) when the lesion intensity was simi-lar to that of GM (differences in NWMV: �42.4 � 7.7 cm3
for lesion load of 60 cm3) or CSF (differences in NWMV:�37.5� 9.7 cm3 for lesion load of 60 cm3).
• NGMV measures were 753 � 19 cm3 in the ‘‘original’’T1-W images. When the lesion load was 6 cm3, thevalues of differences in NGMV for the different inten-sity filling models were: GM/WM ¼ 5.7 � 9.0 cm3,GM ¼ 6.6 � 3.0 cm3, CSF/GM ¼ �1.7 � 1.6 cm3, CSF¼ �2.4 � 3.8 cm3. The values of differences in NGMVprogressively increased with increasing lesion load(P < 0.001) only when the lesion intensity was similarto that of the GM (differences in NGMV: 50.8 �6.8 cm3 for lesion load of 60 cm3).
r White Matter Lesions and Brain Volume Measurements r
r 5 r
Influence of WM Lesions on Registration-Based
Brain Volume Measurements
An analysis similar to that performed with the segmen-tation-based algorithm (SIENAX) was performed to testthe extent to which the WM lesions could bias brain vol-
ume measurements in a registration-based method such asSIENA. In this case, PBVC was generally not influencedby the increase in lesion load and no differences werefound by using FAST-3 or FAST-4 when performing theanalysis (see Fig. 3). In both FAST-3 and FAST-4 analyses,the PBVC was always <0.1 for a lesion load of 6 cm3 with
Figure 2.
The graphs illustrate the percentage differences (y-axis, defined
as 100 � (V2 � V1)/V1, where V1 and V2 represent the first and
the second volume measurement, respectively) in the segmenta-
tion-based measurements (as assessed by SIENAX) of NBV (pd-
NBV, top panels), NWMV (pd-NWMV, central panels), and
NGMV (pd-NGMV, bottom panels) when lesions were inserted
into the ‘‘original’’ T1-weighted images with an increasing lesion
load (x-axis) and different intensities ( for GM/WM interface,
for GM, for CSF/GM and for CSF). The analysis was
performed by using two different partial volume approaches as
provided by FAST-3 (left column) and FAST-4 (right column) (see
Methods for details). Each dot and vertical line in the graphs
represents the mean and standard deviations of the five percent-
age differences obtained by comparing each ‘‘original’’ T1-
weighted image with the related ‘‘artificial’’ T1- weighted image
of a given lesion load and intensity.
r Battaglini et al. r
r 6 r
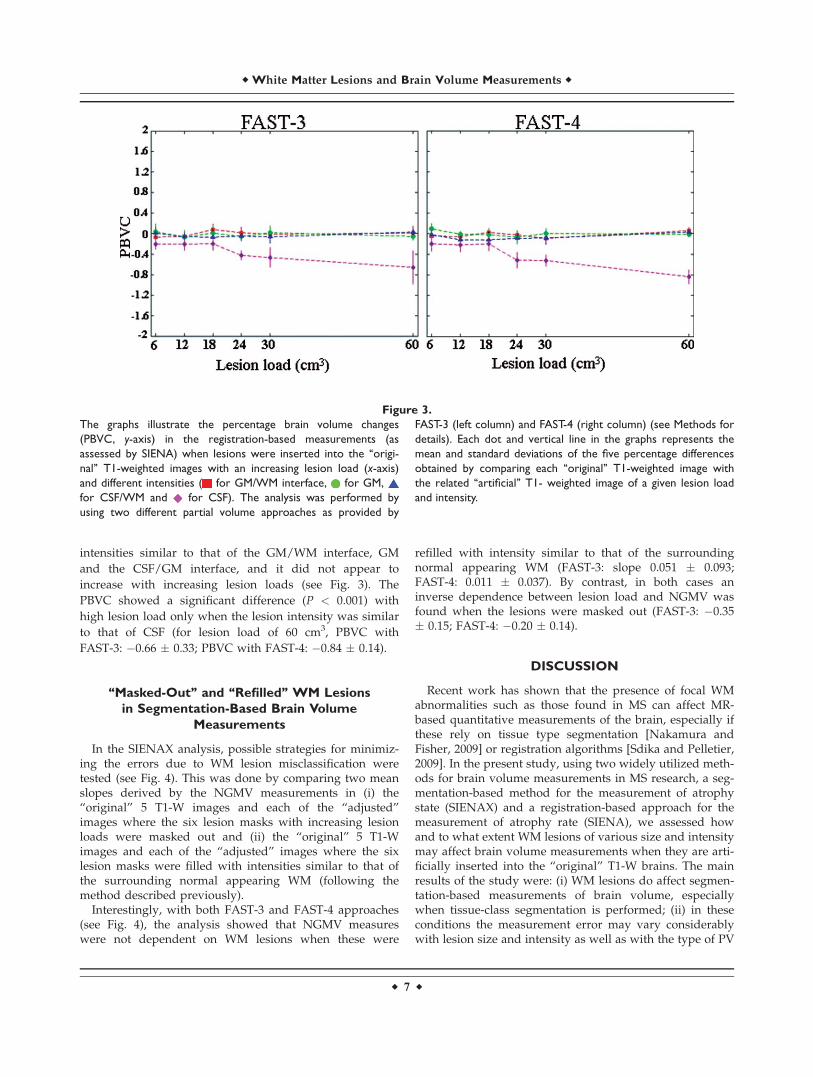
intensities similar to that of the GM/WM interface, GM
and the CSF/GM interface, and it did not appear to
increase with increasing lesion loads (see Fig. 3). The
PBVC showed a significant difference (P < 0.001) with
high lesion load only when the lesion intensity was similar
to that of CSF (for lesion load of 60 cm3, PBVC with
FAST-3: �0.66 � 0.33; PBVC with FAST-4: �0.84 � 0.14).
‘‘Masked-Out’’ and ‘‘Refilled’’ WM Lesions
in Segmentation-Based Brain Volume
Measurements
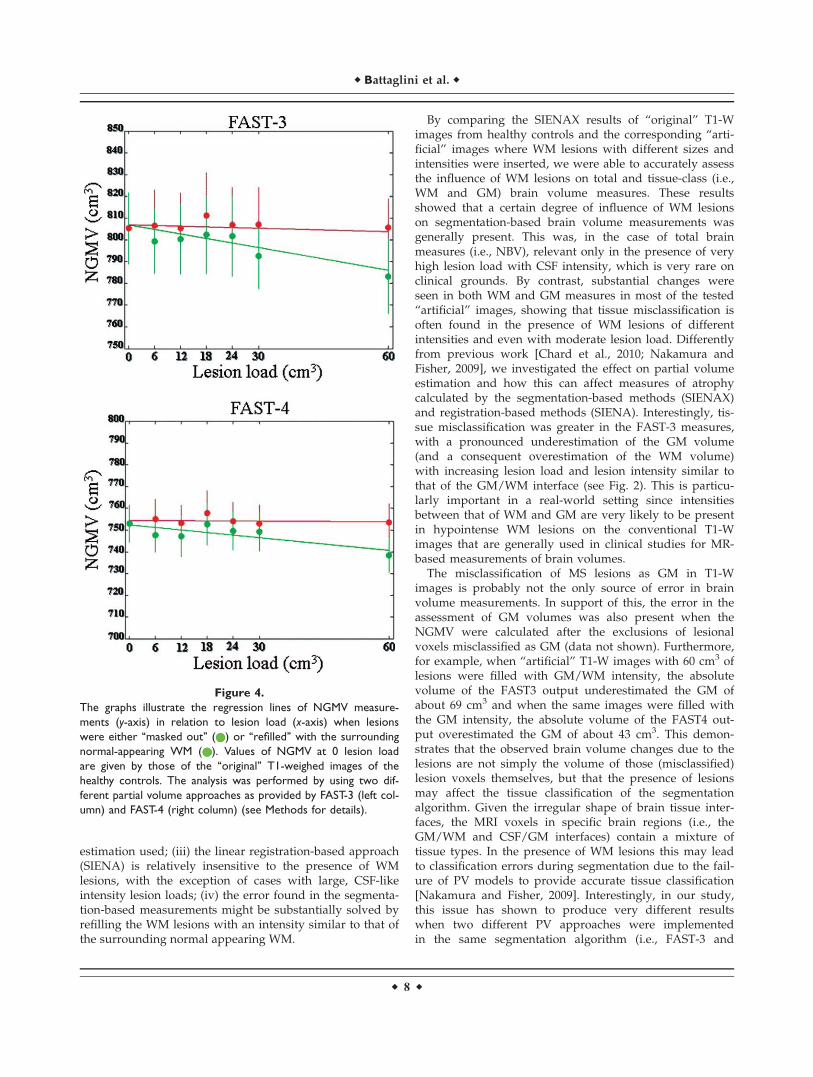
In the SIENAX analysis, possible strategies for minimiz-ing the errors due to WM lesion misclassification weretested (see Fig. 4). This was done by comparing two meanslopes derived by the NGMV measurements in (i) the‘‘original’’ 5 T1-W images and each of the ‘‘adjusted’’images where the six lesion masks with increasing lesionloads were masked out and (ii) the ‘‘original’’ 5 T1-Wimages and each of the ‘‘adjusted’’ images where the sixlesion masks were filled with intensities similar to that ofthe surrounding normal appearing WM (following themethod described previously).
Interestingly, with both FAST-3 and FAST-4 approaches(see Fig. 4), the analysis showed that NGMV measureswere not dependent on WM lesions when these were
refilled with intensity similar to that of the surroundingnormal appearing WM (FAST-3: slope 0.051 � 0.093;FAST-4: 0.011 � 0.037). By contrast, in both cases aninverse dependence between lesion load and NGMV wasfound when the lesions were masked out (FAST-3: �0.35� 0.15; FAST-4: �0.20 � 0.14).
DISCUSSION
Recent work has shown that the presence of focal WMabnormalities such as those found in MS can affect MR-based quantitative measurements of the brain, especially ifthese rely on tissue type segmentation [Nakamura andFisher, 2009] or registration algorithms [Sdika and Pelletier,2009]. In the present study, using two widely utilized meth-ods for brain volume measurements in MS research, a seg-mentation-based method for the measurement of atrophystate (SIENAX) and a registration-based approach for themeasurement of atrophy rate (SIENA), we assessed howand to what extent WM lesions of various size and intensitymay affect brain volume measurements when they are arti-ficially inserted into the ‘‘original’’ T1-W brains. The mainresults of the study were: (i) WM lesions do affect segmen-tation-based measurements of brain volume, especiallywhen tissue-class segmentation is performed; (ii) in theseconditions the measurement error may vary considerablywith lesion size and intensity as well as with the type of PV
Figure 3.
The graphs illustrate the percentage brain volume changes
(PBVC, y-axis) in the registration-based measurements (as
assessed by SIENA) when lesions were inserted into the ‘‘origi-
nal’’ T1-weighted images with an increasing lesion load (x-axis)
and different intensities ( for GM/WM interface, for GM,
for CSF/WM and for CSF). The analysis was performed by
using two different partial volume approaches as provided by
FAST-3 (left column) and FAST-4 (right column) (see Methods for
details). Each dot and vertical line in the graphs represents the
mean and standard deviations of the five percentage differences
obtained by comparing each ‘‘original’’ T1-weighted image with
the related ‘‘artificial’’ T1- weighted image of a given lesion load
and intensity.
r White Matter Lesions and Brain Volume Measurements r
r 7 r
estimation used; (iii) the linear registration-based approach(SIENA) is relatively insensitive to the presence of WMlesions, with the exception of cases with large, CSF-likeintensity lesion loads; (iv) the error found in the segmenta-tion-based measurements might be substantially solved byrefilling the WM lesions with an intensity similar to that ofthe surrounding normal appearing WM.
By comparing the SIENAX results of ‘‘original’’ T1-Wimages from healthy controls and the corresponding ‘‘arti-ficial’’ images where WM lesions with different sizes andintensities were inserted, we were able to accurately assessthe influence of WM lesions on total and tissue-class (i.e.,WM and GM) brain volume measures. These resultsshowed that a certain degree of influence of WM lesionson segmentation-based brain volume measurements wasgenerally present. This was, in the case of total brainmeasures (i.e., NBV), relevant only in the presence of veryhigh lesion load with CSF intensity, which is very rare onclinical grounds. By contrast, substantial changes wereseen in both WM and GM measures in most of the tested‘‘artificial’’ images, showing that tissue misclassification isoften found in the presence of WM lesions of differentintensities and even with moderate lesion load. Differentlyfrom previous work [Chard et al., 2010; Nakamura andFisher, 2009], we investigated the effect on partial volumeestimation and how this can affect measures of atrophycalculated by the segmentation-based methods (SIENAX)and registration-based methods (SIENA). Interestingly, tis-sue misclassification was greater in the FAST-3 measures,with a pronounced underestimation of the GM volume(and a consequent overestimation of the WM volume)with increasing lesion load and lesion intensity similar tothat of the GM/WM interface (see Fig. 2). This is particu-larly important in a real-world setting since intensitiesbetween that of WM and GM are very likely to be presentin hypointense WM lesions on the conventional T1-Wimages that are generally used in clinical studies for MR-based measurements of brain volumes.
The misclassification of MS lesions as GM in T1-Wimages is probably not the only source of error in brainvolume measurements. In support of this, the error in theassessment of GM volumes was also present when theNGMV were calculated after the exclusions of lesionalvoxels misclassified as GM (data not shown). Furthermore,for example, when ‘‘artificial’’ T1-W images with 60 cm3 oflesions were filled with GM/WM intensity, the absolutevolume of the FAST3 output underestimated the GM ofabout 69 cm3 and when the same images were filled withthe GM intensity, the absolute volume of the FAST4 out-put overestimated the GM of about 43 cm3. This demon-strates that the observed brain volume changes due to thelesions are not simply the volume of those (misclassified)lesion voxels themselves, but that the presence of lesionsmay affect the tissue classification of the segmentationalgorithm. Given the irregular shape of brain tissue inter-faces, the MRI voxels in specific brain regions (i.e., theGM/WM and CSF/GM interfaces) contain a mixture oftissue types. In the presence of WM lesions this may leadto classification errors during segmentation due to the fail-ure of PV models to provide accurate tissue classification[Nakamura and Fisher, 2009]. Interestingly, in our study,this issue has shown to produce very different resultswhen two different PV approaches were implementedin the same segmentation algorithm (i.e., FAST-3 and
Figure 4.
The graphs illustrate the regression lines of NGMV measure-
ments (y-axis) in relation to lesion load (x-axis) when lesions
were either ‘‘masked out’’ ( ) or ‘‘refilled’’ with the surrounding
normal-appearing WM ( ). Values of NGMV at 0 lesion load
are given by those of the ‘‘original’’ T1-weighed images of the
healthy controls. The analysis was performed by using two dif-
ferent partial volume approaches as provided by FAST-3 (left col-
umn) and FAST-4 (right column) (see Methods for details).
r Battaglini et al. r
r 8 r
FAST-4, see Fig. 2). Indeed, the influence of WM lesionsand the consequent error in brain volume measurementsappeared much lower in the FAST-4 analyses, probablydue to the use of a mixel-type MRF in its PV model (seeMethods for details). The mixel-type represents the classifi-cation of the mixture present in each voxel, which inFAST-4 included a six-tissue-class PV modeling (i.e., pureWM, WM/GM, pure GM, GM/CSF, pure CSF and WM/CSF) rather than the three-tissue-class approach of FAST-3and other widely used segmentation algorithms [Ash-burner and Friston, 2005; Nakamura and Fisher, 2009].Thus, although it is not possible to generalize from data inthis study, a mixel-type PV modeling such as that used inFAST-4 seems to be the best approach in presence of WMlesions such as those found in MS brains.
In the present study we also tested the extent to whichthe WM lesions could bias a registration-based method forglobal measurement of brain volume changes, such asSIENA. Results showed that PBVC measures were insensi-tive to increases in lesion load and to different intensityfilling models, independently of PV modeling used, withthe exception of the CSF intensity-filling model. This isparticularly interesting as it is very similar to what wasfound in the segmentation-based analysis of global brainvolume measurements. Taken together, these findings sug-gest that when the WM and GM segmentation is notattempted, the error due to the presence of WM lesions islimited to CSF misclassification that, on clinical grounds,might be present only in T1-W black holes exhibitingextreme tissue loss [Barkhof and van Walderveen, 1999].Finally, it is worth noting that the present data suggestthat the linear registration methods do not seem to sufferfrom the same problems encountered by the non-rigidregistration approaches in the presence of WM lesions ofMS brain images [Sdika and Pelletier, 2009].
Once the error in brain volume measurements due toWM lesions was quantified, possible strategies for mini-mizing this error were tested. Our results showed that, inthe SIENAX analysis, the errors due to GM misclassifica-tion in the presence of WM lesions could not be correctedby simply masking the WM lesions out, an approachwidely used in clinical studies [Chard et al., 2002]. By con-trast, the refilling of the lesions with intensities that matchtheir surrounding normal-appearing WM appeared tosolve most of the issues related to GM misclassification.This refilling used a methodological approach similar tothat previously reported by Sdika and Pelletier [2009]. Thepresence of similar results with different PV modelingmethods (similar slopes were found with both FAST-3 andFAST-4 analyses) adds further support to this statement. Itmust be stressed here that the use of ‘‘artificial’’ T1-Wimages obtained from T1-W images of healthy controlsmay have created an easier scenario than the one thatneeds to be faced in routine MR images of MS brains. Cer-tainly, for example, the normal-appearing WM of MSpatients might not be normal, especially in perilesionalregions [Vrenken et al., 2006]. In this case, however, the
enlargement of the surrounding WM area beyond the per-ilesional ‘‘dirty’’ WM, which could be easily done with ournon-uniformly sampled method, may help to solve or min-imize the problem.
In conclusion, the results of this study show that thepresence of WM lesions does not bias longitudinal, linear-registration-based measurements of global brain atrophy,where tissue-class classification is not required. By con-trast, WM lesions may significantly affect GM measure-ments, especially when their intensity is between that ofWM and GM, a condition that is very likely to occur inthe hypointense WM lesions found on the conventionalT1-W images that are used in clinical settings. However,the extent to which the presence of WM lesions may affecttissue-class measures is clearly driven by the PV modelingused by the segmentation algorithm. The use of both amixel-type PV model and the refilling of the lesions withthe surrounding normal-appearing WM seem to solve theproblems created by the presence of WM lesions and pro-vide accurate tissue-class measurements.
ACKNOWLEDGMENTS
The authors thank Dr. Antonio Giorgio (Dept. of Neuro-logical Sciences, University of Siena) for thoughtful discus-sion. The authors are grateful to Arlene Cohen for revisingthe manuscript language.
REFERENCES
Ashburner J, Friston KJ (2005): Unified segmentation. Neuroimage26:839–851.
Barkhof F, van Walderveen M (1999): Characterization of tissuedamage in multiple sclerosis by nuclear magnetic resonance.Philos Trans R Soc Lond B Biol Sci 354:1675–1686.
Battaglini M, Giorgio A, Stromillo ML, Bartolozzi ML, Guidi L,Federico A, De Stefano N (2009): Voxel-wise assessment ofprogression of regional brain atrophy in relapsing-remittingmultiple sclerosis. J Neurol Sci 282:55–60
Bendfeldt K, Kuster P, Traud S, Egger H, Winklhofer S, Mueller-Lenke N, Naegelin Y, Gass A, Kappos L, Matthews PM, Nich-ols TE, Radue EW, Borgwardt SJ (2009): Association of re-gional gray matter volume loss and progression of whitematter lesions in multiple sclerosis—A longitudinal voxel-based morphometry study. Neuroimage 45:60–67.
Chard DT, Griffin CM, McLean MA, Kapeller P, Kapoor R,Thompson AJ, Miller DH (2002): Brain metabolite changes incortical grey and normal-appearing white matter in clinicallyearly relapsing-remitting multiple sclerosis. Brain 125 (Part10):2342–2352.
Chard DT, Griffin CM, Rashid W, Davies GR, Altmann DR,Kapoor R, Barker GJ, Thompson AJ, Miller DH (2004): Progres-sive grey matter atrophy in clinically early relapsing-remittingmultiple sclerosis. Mult Scler 10:387–391.
Chard DT, Jackson JS, Miller DH, Wheeler-Kingshott CA (2010):Reducing the impact of white matter lesions on automatedmeasures of brain gray and white matter volumes. J MagnReson Imaging 32:223–228.
r White Matter Lesions and Brain Volume Measurements r
r 9 r
Chen JT, Narayanan S, Collins DL, Smith SM, Matthews PM,Arnold DL (2004): Relating neocortical pathology to disabilityprogression in multiple sclerosis using MRI. Neuroimage23:1168–1175.
De Stefano N, Matthews PM, Filippi M, Agosta F, De Luca M,Bartolozzi ML, Guidi L, Ghezzi A, Montanari E, Cifelli A, Fed-erico A, Smith SM (2003): Evidence of early cortical atrophy inMS: Relevance to white matter changes and disability. Neurology60:1157–1162.
Nakamura K, Fisher E (2009): Segmentation of brain magnetic res-onance images for measurement of gray matter atrophy inmultiple sclerosis patients. Neuroimage 44:769–776.
Niessen WJ, Vincken KL, Weickert J, Haar Romeny BM, ViergeverMA (1999): Multiscale segmentation of three-dimensional MRbrain images. Int Comput Vis 31:185–202.
Santago P, Gage HD (1995): Statistical models of partial volumeeffect. IEEE Trans Image Process 4:1531–1540.
Sdika M, Pelletier D (2009): Nonrigid registration of multiplesclerosis brain images using lesion inpainting for mor-
phometry or lesion mapping. Hum Brain Mapp 30:1060–1067.
Smith SM, De Stefano N, Jenkinson M, Matthews PM (2001): Nor-malized accurate measurement of longitudinal brain change. JComput Assist Tomogr 25:466–475.
Smith SM, Zhang Y, Jenkinson M, Chen J, Matthews PM, FedericoA, De Stefano N (2002): Accurate, robust, and automated lon-gitudinal and cross-sectional brain change analysis. Neuro-image 17:479–489.
Van Leemput K, Maes F, Vandermeulen D, Suetens P (2003): Aunifying framework for partial volume segmentation of brainMR images. IEEE Trans Med Imaging 22:105–119.
Vrenken H, Geurts JJ, Knol DL, Polman CH, Castelijns JA, Pou-wels PJ, Barkhof F (2006): Normal-appearing white matterchanges vary with distance to lesions in multiple sclerosis.AJNR Am J Neuroradiol 27:2005–2011.
Zhang Y, Brady M, Smith S (2001): Segmentation of brain MR imagesthrough a hidden Markov random field model and the expecta-tion-maximization algorithm. IEEE Trans Med Imaging 20:45–57.
r Battaglini et al. r
r 10 r