Embed Size (px)
Citation preview
International Journal of Economics, Finance and Management Sciences 2013; 1(1) : 9-20 Published online February 20, 2013 (http://www.sciencepublishinggroup.com/j/ijefm) doi: 10.11648/j. ijefm.20130101.12
Evaluating a project finance SPV: combining operating leverage with debt service, shadow dividends and discounted cash flows
Roberto Moro Visconti
Dept. of Business Management, Università Cattolica del Sacro Cuore, Milan, Italy
Email address: [email protected] (R. M. Visconti)
To cite this article: Roberto Moro Visconti. Evaluating a Project Finance SPV: Combining Operating Leverage with Debt Service, Shadow Dividends and Discounted Cash Flows, International Journal of Economics, Finance and Management Sciences. Vol. 1, No. 1, 2013, pp. 9-20. doi: 10.11648/j.ijefm.20130101.12
Abstract: Project finance (PF) investments have consistently grown in the last years, especially if they concern infrastructural Public – Private Partnerships. PF is a long termed and capital intensive investment, guaranteed by expected cash flows, rather than the assets of the project sponsor. Private entities, normally created as ad hoc Special Purpose Vehicles, are typically highly leveraged with non-recourse loans. Since the shareholders may be likely to sell off their stake well before the expiring date of the concession, a professional evaluation of the SPV at different stages of the project’s life seems increasingly important. Innovative considerations about the impact of cash generating EBITDA are linked to operating leverage changes, following continuous remixing of fixed and variable costs, Debt service and shadow dividends payout are also critically investigated, analyzing their impact on leverage, risk and valuation. Fair appraisals fuel and keep alive a still infant secondary market, where investment funds and private equity intermediaries start having an active role. Being PF a cash flow based investment, DCF evaluation techniques are generally used; even if the method may seem straightforward, several awkward factors interact - and sensitivity to different parameters, such as inflation or interest rates, greatly matters. To the extent that it can be professionally managed by specialized agents, risk sharing or transmission is not a zero sum game, so positively affecting both the equity and the enterprise value.
Keywords: Infrastructural Investments, PPP, Leverage, EBITDA, Liquidity, Business Plan, Subordinated Debt, Risk Matrix, Cost Of Capital, Secondary Market
1. Introduction
A project financing (PF) structure usually involves a number of equity investors, known as sponsors, as well as a syndicate of banks that provide loans to the operation. The loans are most commonly non-recourse, paid entirely from project cash flow, rather than from the general assets or creditworthiness of the project sponsors.
Generally, a private entity such as a Special Purpose Vehicle (SPV) is a legally independent project company created for each project by the concessionaire, thereby shielding other assets owned by its sponsors from the detrimental effects of a project failure. As a SPV, the project company has no assets other than the project and in public healthcare investments; typically the property of the hospital is transferred to the public commissioner since the beginning. Capital contribution commitments (limited
recourse) by the owners of the project company are sometimes necessary to ensure that the project is financially sound. No recourse, no personal risk for the private entity shareholders.
PF is typically more complicated than alternative financing methods.
Risk transfer and sharing from the public to the private part is a key element: a principal / agent optimal risk allocation and co-parenting are the core “philosophy” of project finance. Risk transfer is deeply involved with the allocation of risks associated with the operation of a PF contract according to the principle that it should lie with the party best able to manage it.
Value for Money1 for the public part has to take into account not only an economic and financial comparison with alternative financial packages and instruments, but
1Seehttp://www.hm-treasury.gov.uk/d/vfm_assessmentguidance061006opt.pdf.
10 Roberto Moro Visconti: Evaluating a project finance SPV: combining operating leverage with debt service, shadow dividends and discounted cash flows
also parameters, considered in [1], such as: • project efficiency (optimal use of assets - facilities
during the concession life …) and (financial and economic) sustainability;
• multi-benefit considerations (level of tangible and intangible social benefits to the end users and the community brought by the new hospital …);
• effective risk transfers to the private counterpart (considering, in particular, the real value of the construction risk transfer, often underestimated).
As [2] point out, "value for money" in a PF investment crucially depends on performance monitoring to provide incentives for improvement and to ensure that service delivery is in accordance with the output specification. However, the effectiveness of performance monitoring and output specification cannot be fully assessed until PF investments become operational. There is a need to examine the role of the performance monitoring mechanism in ensuring that "value for money" is achieved throughout the delivery of services (see also [3]).
Valuation of PF investment vehicles is an increasingly strategic topic, since it may contribute to the birth of a liquid secondary market, where the SPV initial shareholders may sell off their stakes.
The paper is structured as follows: after a brief industry analysis, a typical economic and financial plan of a PF SPV is illustrated, with graphical links between the balance sheet, the income statement and the cash flow statement. An original analysis of the interacting link between operating and financial leverage is then described, followed by the description of key investment ratios. “Shadow” dividends are consequently examined, together with leverage and debt service critical aspects, concerning also standard corporate governance issues, which are analyzed considering the particular framework of PF investments. Risk is eventually examined, considering its not negligible impact on market evaluation patterns (surveyed in [4]).
The research method follows an interdisciplinary “accounting & finance” pattern, starting from an integrated business plan, where the balance sheet of the SPV is linked to the profit & loss and to the cash-flow statement; a further analysis of the link between economic (operating) and financial variables is then conducted, using EBITDA as a key economic/financial parameter and considering the impact of a changing mix of fixed and variable operating costs. Expected cash flows deriving from profit & loss forecasts are then analyzed considering both their debt service capacity and residual ability to remunerate shareholders, so shifting from Enterprise to Equity Value considerations.
2. Recent Market Trends
According to Thomson Reuters 2 “Global Project
2http://online.thomsonreuters.com/DealsIntelligence/Content/Files/4Q10_Project_Finance_Review.pdf.
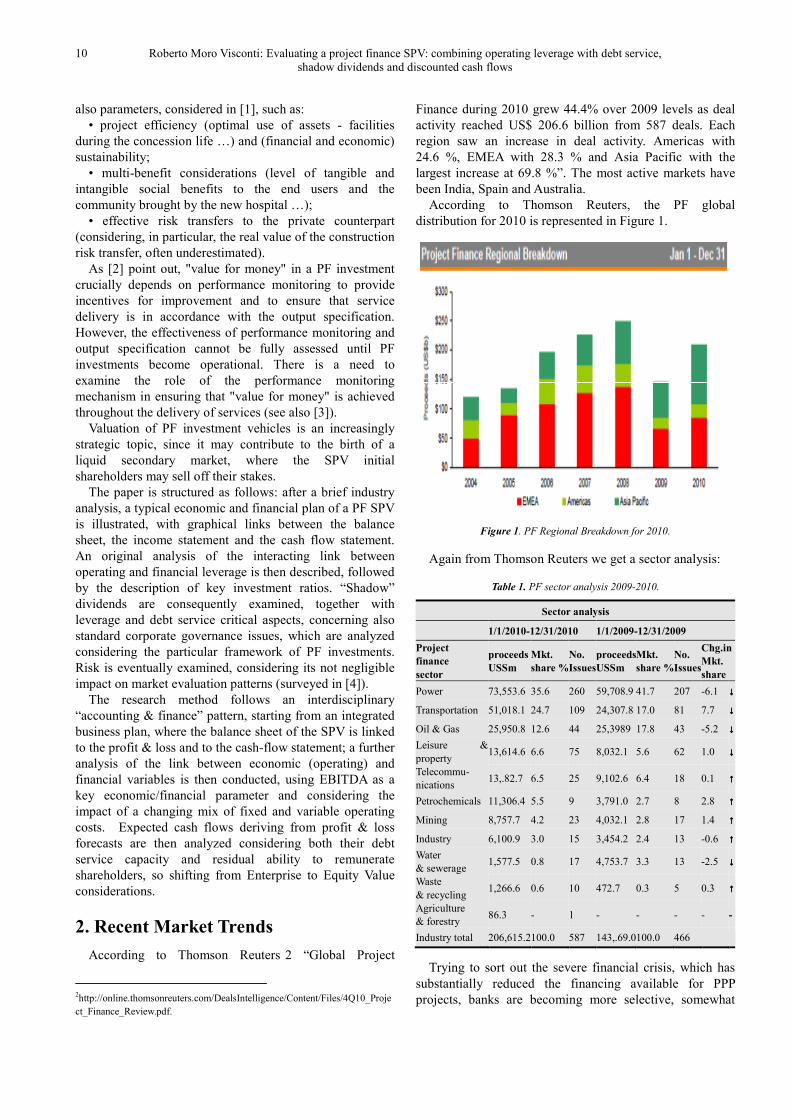
Finance during 2010 grew 44.4% over 2009 levels as deal activity reached US$ 206.6 billion from 587 deals. Each region saw an increase in deal activity. Americas with 24.6 %, EMEA with 28.3 % and Asia Pacific with the largest increase at 69.8 %”. The most active markets have been India, Spain and Australia.
According to Thomson Reuters, the PF global distribution for 2010 is represented in Figure 1.
Figure 1. PF Regional Breakdown for 2010.
Again from Thomson Reuters we get a sector analysis:
Table 1. PF sector analysis 2009-2010.
Sector analysis
1/1/2010-12/31/2010 1/1/2009-12/31/2009
Project
finance
sector
proceeds
USSm
Mkt.
share %
No.
Issues
proceeds
USSm
Mkt.
share %
No.
Issues
Chg.in
Mkt.
share
Power 73,553.6 35.6 260 59,708.9 41.7 207 -6.1 ↓↓↓↓
Transportation 51,018.1 24.7 109 24,307.8 17.0 81 7.7 ↓↓↓↓
Oil & Gas 25,950.8 12.6 44 25,3989 17.8 43 -5.2 ↓↓↓↓
Leisure & property
13,614.6 6.6 75 8,032.1 5.6 62 1.0 ↓↓↓↓
Telecommu- nications
13,.82.7 6.5 25 9,102.6 6.4 18 0.1 ↑↑↑↑
Petrochemicals 11,306.4 5.5 9 3,791.0 2.7 8 2.8 ↑↑↑↑
Mining 8,757.7 4.2 23 4,032.1 2.8 17 1.4 ↑↑↑↑
Industry 6,100.9 3.0 15 3,454.2 2.4 13 -0.6 ↑↑↑↑
Water & sewerage
1,577.5 0.8 17 4,753.7 3.3 13 -2.5 ↓↓↓↓
Waste & recycling
1,266.6 0.6 10 472.7 0.3 5 0.3 ↑↑↑↑
Agriculture & forestry
86.3 - 1 - - - - -
Industry total 206,615.2100.0 587 143,.69.0100.0 466
Trying to sort out the severe financial crisis, which has substantially reduced the financing available for PPP projects, banks are becoming more selective, somewhat
International Journal of Economics, Finance and Management Sciences 2013, 1(1): 9-20 11
concentrating on their long-terms customers. Bank spreads have increased substantially in 2008 – 2009 from pre crisis levels, while now spreads are mildly reducing; the increase in rates has partially been offset by the reduction in base rates, decided by Central banks to ease economic recovery.
In EU countries where Eurostat rules apply, public budget constraints strongly favor compliant PF investments. New markets for PF infrastructural investments are also opening up in developing countries, with strong potential for induced economic growth.
3. The Economic and Financial Plan of
the SPV
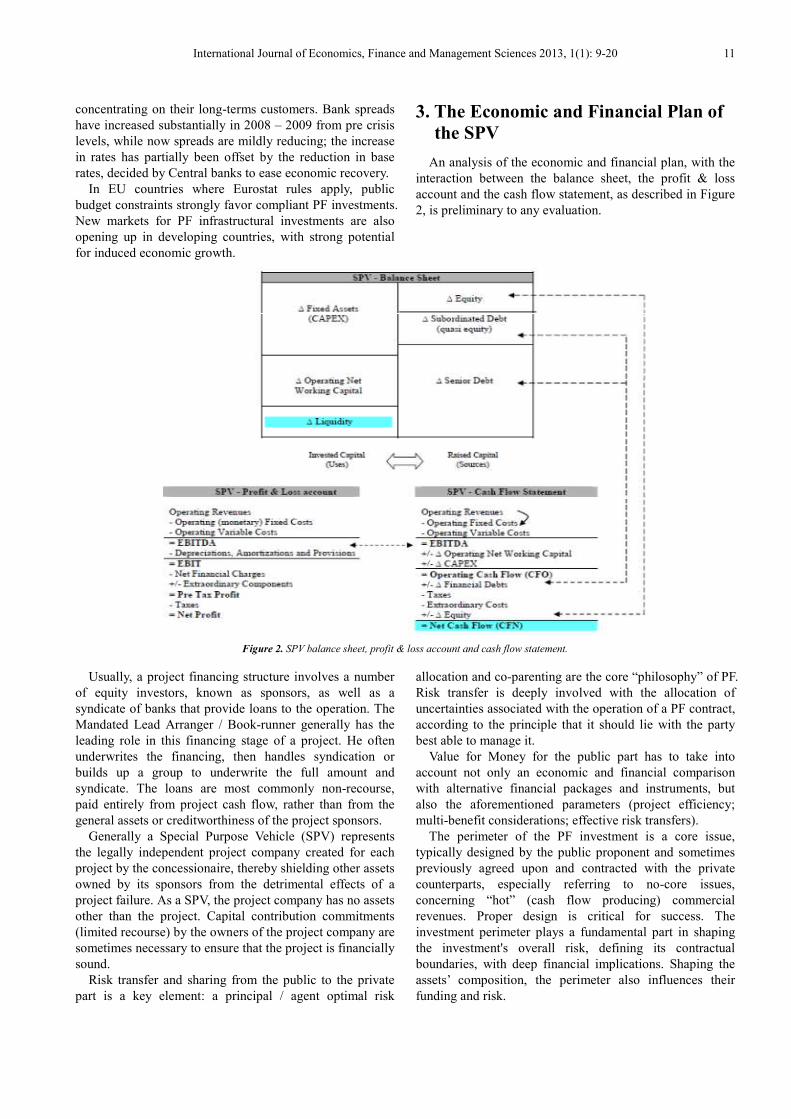
An analysis of the economic and financial plan, with the interaction between the balance sheet, the profit & loss account and the cash flow statement, as described in Figure 2, is preliminary to any evaluation.
Figure 2. SPV balance sheet, profit & loss account and cash flow statement.
Usually, a project financing structure involves a number of equity investors, known as sponsors, as well as a syndicate of banks that provide loans to the operation. The Mandated Lead Arranger / Book-runner generally has the leading role in this financing stage of a project. He often underwrites the financing, then handles syndication or builds up a group to underwrite the full amount and syndicate. The loans are most commonly non-recourse, paid entirely from project cash flow, rather than from the general assets or creditworthiness of the project sponsors.
Generally a Special Purpose Vehicle (SPV) represents the legally independent project company created for each project by the concessionaire, thereby shielding other assets owned by its sponsors from the detrimental effects of a project failure. As a SPV, the project company has no assets other than the project. Capital contribution commitments (limited recourse) by the owners of the project company are sometimes necessary to ensure that the project is financially sound.
Risk transfer and sharing from the public to the private part is a key element: a principal / agent optimal risk
allocation and co-parenting are the core “philosophy” of PF. Risk transfer is deeply involved with the allocation of uncertainties associated with the operation of a PF contract, according to the principle that it should lie with the party best able to manage it.
Value for Money for the public part has to take into account not only an economic and financial comparison with alternative financial packages and instruments, but also the aforementioned parameters (project efficiency; multi-benefit considerations; effective risk transfers).
The perimeter of the PF investment is a core issue, typically designed by the public proponent and sometimes previously agreed upon and contracted with the private counterparts, especially referring to no-core issues, concerning “hot” (cash flow producing) commercial revenues. Proper design is critical for success. The investment perimeter plays a fundamental part in shaping the investment's overall risk, defining its contractual boundaries, with deep financial implications. Shaping the assets’ composition, the perimeter also influences their funding and risk.
12 Roberto Moro Visconti: Evaluating a project finance SPV: combining operating leverage with debt service, shadow dividends and discounted cash flows
The investment framework represents the backbone of the business model, together with its “hot / cold revenues blending”, which combines “hot” (risky) returns with contractually agreed “cold” revenues, where the market risk is predominantly kept within the public counterpart.
The PF balance sheet is an evolving structure across the investment horizon and the assets undergo a continuous remix, progressively decreasing their fixed component, in favor of growing current assets, mainly produced during the management phase.
Even raised capital typically changes, with a trendy leverage decrease, following debt reimbursement and capital accumulation of retained earnings. The whole balance sheet so becomes progressively less risky and so matters for valuation, depending on its timely occurrence.
The PF investment is so typically divided in different phases, with a core distinction between the construction and the management period; the former is sometimes preceded by a preliminary project, whereas the latter has to be long enough to allow the private part reaching its financial and economic breakeven, especially if the infrastructure is freely attributed since its completion to the public part.
4. The Interactive Link between
Operating and Financial Leverage
The main risks to which the SPV in project financing is subject are operating and financial risk. The operating leverage is a measure of how revenue change (∆ Sales) is translated into operating income (∆EBIT). It is a measure of how risky (volatile) a company's operating income is:
(
/ / )
E B I TO p e r a t in g L e v e r a g e
S A L E S
E B I T D A
D e p r e c ia t io n A m o r t i z a t io n s p r o v i s io n s
S A L E S
∆− =∆
=∆+
∆
The factors that influence the operating revenue are: • revenue volumes and margins; • variable costs; • fixed costs. From figure 1., it may be acknowledged that EBITDA,
being both an economic and financial margin, is a key parameter of both the profit & loss account and the cash flow statement.
The fixed/variable revenues and costs mix strongly depends on the company's business model and allows evaluating the degree of translation of an increase of revenues on the EBIT. In our case, the SPV typically has a limited revenues growth potential, since commercial income normally can be exploited up to a physical and contractual limit, but it also has a fairly stable, mildly volatile, cost structure.
Fixed revenues guarantee a valuable minimum revenue
level, appreciated by lending institutions. Contracts envisaging a guaranteed minimum produce fixed revenues for the private concessionaire (with specular fixed costs for the public counterpart); this lack of flexibility produces a risk transfer from the private to the public entity that should be carefully considered and agreed on.
An example of the main operating revenues and costs, according to their level of flexibility and resilience, is represented in Table 2.
Table 2. Fixed and variable revenues and costs.
Fixed operating revenues
Public grant deferred revenues 3 ;
availability payment 4 ; fixed revenues
from no-core services; fixed commercial
revenues
+Variable operating revenues variable revenues from no-core services; variable commercial (tariff) revenues
-Fixed operating monetary costs
Insurances, staff costs, financial fees, private entities managing costs, sundry fixed costs
-Variable operating cost variable costs from no-core services 5 ; variable commercial (tariff) costs6
=EBITDA [Earning Before Interests, Taxes, Depreciations, Amortizations]
-Fixed operating costs Depreciations, amortizations and provisions
=EBIT [Earning Before Interests, Taxes]
The level of EBIT is important in order to ascertain whether and when the SPV can reach an operating break even point - minimum acceptable rate of return - this event being a matter of survival.
Residual Value at Risk (VAR) for the SPV has to take into account the difference between construction costs and variable incomes and costs, i.e. the part of the building costs which the SPV is not sure to cover7:
Cumulated construction costs - fixed revenues + fixed costs = operating amount to be covered.
The SPV has to reach a minimum critical mass in order to guarantee its sustainability; in such an effort, the growth risk factor - so important in start up scenarios - should not be so important and limited to marginal hot revenues, since predominant cold revenues should come soon and demand risk is external.
If the availability payment increases, fixed revenues go up, considering also that it is not subject to pass through
3The public grant partially covers the cost of the investment; the SPV cashes
the grant in installments, according to the work in progress and then defers it in constant arrays till the end of the concession. For an analysis of the accounting problems, see IAS 20 par. 12.
4A (small) part of the availability payment is paid to the SPV subject to a quality control of the services rendered and so can be variable.
5Some of these costs may be fixed. 6Only if there are no pass-through contracts with third parties. 7Considering: - variable revenues + variable costs + negative interests +
extraordinary costs + taxes.
International Journal of Economics, Finance and Management Sciences 2013, 1(1): 9-20 13
repayments to the SPV’s suppliers and for this reason the whole marginality belongs to the SPV. Marginal economic returns and cash flows of each service rendered are to be carefully monitored, considering also their inter-temporal volatility, from which risk can be inferred. For any given level of sales and profit, the higher the fixed costs, the more the operating leverage grows.
In project financing, the SPV often relies (with a "pass through" agreement) on third parties (sub-contractors) for the management of non-core services and commercial areas, receiving in return a percentage of revenues. In this case, the pass through contract increases the variable cost of the SPV, with an impact on EBIT, smoothing operating leverage: in other words, any change in revenues causes a smaller change in the EBIT - good news if revenues decrease and vice versa. With pass through, there is also a transmission of risk, aimed at having a positive impact on the value chain.
Even with pass through agreements - typically, Design & Construction or Operation & Maintenance - some risks should conveniently be retained within the SPV, in order to represent a permanent incentive to its efficiency, as shown in [5]. The private partners are tied together with back to
back “contracts within the contract” which subdivide and replicate the obligations of the main contract. A Coasian nexus of contracts links the SPV with its subcontractors and cash flow sharing is the common propellant behind survival and growth.
Scalability is, broadly speaking, the ability of a business model to generate incremental demand (additional revenues) economically, i.e. without significantly increasing costs. In the presence of a scalable business, the operating leverage works as a multiplier of the EBIT.
The interactive link between operating and financial leverage is evidenced also – mainly – by the impact of changing operating leverage on cash flows. Since cash flow analysis starts from EBIT (or EBITDA), it automatically takes into account the new EBIT which derives from a change in operating revenues filtered by the mix fixed / floating costs.
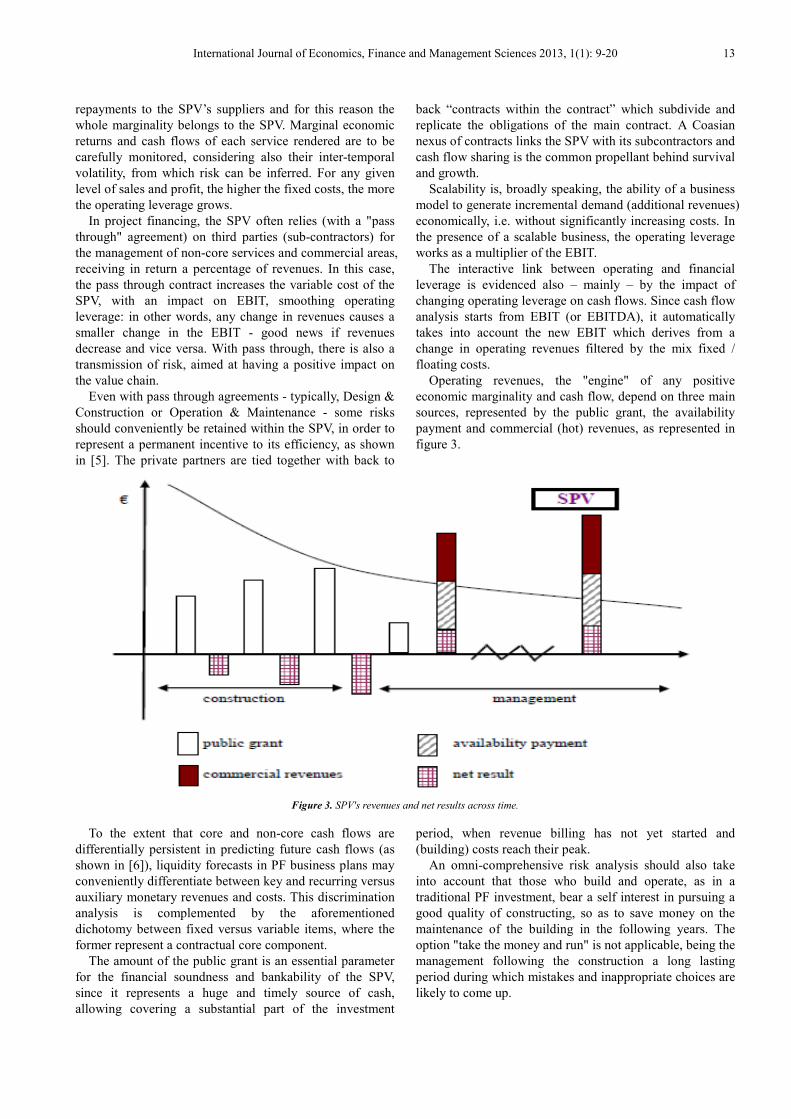
Operating revenues, the "engine" of any positive economic marginality and cash flow, depend on three main sources, represented by the public grant, the availability payment and commercial (hot) revenues, as represented in figure 3.
Figure 3. SPV's revenues and net results across time.
To the extent that core and non-core cash flows are differentially persistent in predicting future cash flows (as shown in [6]), liquidity forecasts in PF business plans may conveniently differentiate between key and recurring versus auxiliary monetary revenues and costs. This discrimination analysis is complemented by the aforementioned dichotomy between fixed versus variable items, where the former represent a contractual core component.
The amount of the public grant is an essential parameter for the financial soundness and bankability of the SPV, since it represents a huge and timely source of cash, allowing covering a substantial part of the investment
period, when revenue billing has not yet started and (building) costs reach their peak.
An omni-comprehensive risk analysis should also take into account that those who build and operate, as in a traditional PF investment, bear a self interest in pursuing a good quality of constructing, so as to save money on the maintenance of the building in the following years. The option "take the money and run" is not applicable, being the management following the construction a long lasting period during which mistakes and inappropriate choices are likely to come up.
14 Roberto Moro Visconti: Evaluating a project finance SPV: combining operating leverage with debt service, shadow dividends and discounted cash flows
5. Key Investment Ratios
The feasibility of the project is based upon key economic and financial ratios, such as the debt to equity leverage, or other parameters pivoting around the operating cash flow (FCO). The Net Present Value (NPV) of the project is obtained as usual, discounting FCO at its appropriate Weighted Average Cost of Capital (WACC), with a terminal value wherever applicable. NPV for equityholders is alternatively calculated discounting net cash flows to equity (FCE) at the prevailing cost of equity.
Internal Rates of Return of either the project or equity are the yardstick interest rate that resets the NPV of the project or, alternatively, of the equity. IRRproject constantly has to be compared with WACC: if the latter exceeds the former, bypassing sustainable financial break even,
problems of bankability arise and if they are not ephemeral, cash burn outs may occur.
Other complementary ratios – such as leverage or the cover ratio - are also traditionally considered; leverage, infrequently exceeding the 80:20 ratio, especially after the big recession, is given by the ratio of debt to equity (with subordinated debt sometimes considered in the denominator, as a quasi equity component), whereas the debt service cover ratio is given by the ratio of operating cash available for debt servicing to interest and principal payments.
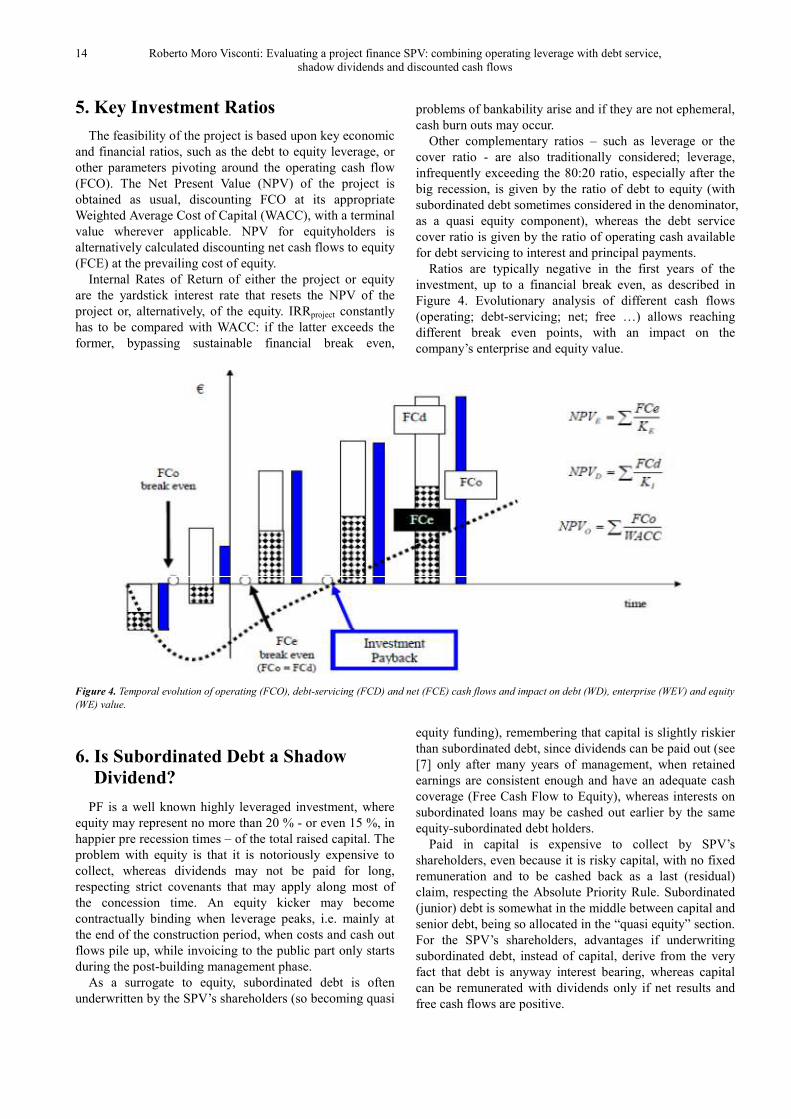
Ratios are typically negative in the first years of the investment, up to a financial break even, as described in Figure 4. Evolutionary analysis of different cash flows (operating; debt-servicing; net; free …) allows reaching different break even points, with an impact on the company’s enterprise and equity value.
Figure 4. Temporal evolution of operating (FCO), debt-servicing (FCD) and net (FCE) cash flows and impact on debt (WD), enterprise (WEV) and equity
(WE) value.
6. Is Subordinated Debt a Shadow
Dividend?
PF is a well known highly leveraged investment, where equity may represent no more than 20 % - or even 15 %, in happier pre recession times – of the total raised capital. The problem with equity is that it is notoriously expensive to collect, whereas dividends may not be paid for long, respecting strict covenants that may apply along most of the concession time. An equity kicker may become contractually binding when leverage peaks, i.e. mainly at the end of the construction period, when costs and cash out flows pile up, while invoicing to the public part only starts during the post-building management phase.
As a surrogate to equity, subordinated debt is often underwritten by the SPV’s shareholders (so becoming quasi
equity funding), remembering that capital is slightly riskier than subordinated debt, since dividends can be paid out (see [7] only after many years of management, when retained earnings are consistent enough and have an adequate cash coverage (Free Cash Flow to Equity), whereas interests on subordinated loans may be cashed out earlier by the same equity-subordinated debt holders.
Paid in capital is expensive to collect by SPV’s shareholders, even because it is risky capital, with no fixed remuneration and to be cashed back as a last (residual) claim, respecting the Absolute Priority Rule. Subordinated (junior) debt is somewhat in the middle between capital and senior debt, being so allocated in the “quasi equity” section. For the SPV’s shareholders, advantages if underwriting subordinated debt, instead of capital, derive from the very fact that debt is anyway interest bearing, whereas capital can be remunerated with dividends only if net results and free cash flows are positive.
International Journal of Economics, Finance and Management Sciences 2013, 1(1): 9-20 15
It is so convenient, for the SPV, to minimize its outstanding capital, maximizing senior debt and using subordinated debt as a cushion to balance the debt/equity ratio, so keeping leverage under control. While the issue mainly concerns the SPV and its banks, the public part has also an indirect - but not trivial - interest in securing that the SPV is financially sound.
And since senior debt commands a priority over subordinated debt in repayment of both interests and principal, its market price is slightly lower (by some 30-50 basis point or even more, according to prevalent market conditions…).
The higher the spread of the subordinated debt, the higher the cost of quasi equity; being subordinated debt typically issued by the SPV's shareholders - even if the underwritten amounts may be asymmetric if compared to the subscribed capital - interest rates paid by the SPV to the subordinated debtholders compete with dividends paid to the SPV's shareholders, as an alternative form of remuneration.
The differences between the return (cost) of quasi equity versus the return (cost) of equity concern not only the abovementioned possible asymmetric underwriting, but also their timing, since interests on debt start to be paid before dividends and subordinated debt is reimbursed after senior debt but before capital - so the present value of subordinated debt interests and repayment is, ceteris paribus, higher than that of dividends and paid back capital. The present value is higher also due to a lower discount factor, since subordinated debt is a fixed claim whereas risky capital remuneration and reimbursement is conditional upon the SPV's performance.
Furthermore, to the extent that interest rates on subordinated debt are fiscally neutral (being deductible costs for the SPV and taxable incomes for its debtholders, with symmetric tax rates) whereas dividends come up to the SPV's shareholders net of taxes and are (slightly) taxed even when perceived by its shareholders, there is a further (small) element which favors subordinated debt and its service.
The differential tax treatment of dividends to shareholders versus interests paid to debtholders at the corporate level may matter, influencing the capital structure and the leverage mix of the SPV. As a matter of fact, as indicated above, interest expense is deductible from corporate income, whereas dividends are not and may be taxed twice, since they derive form net (of tax) income at the source level, whereas some (mild) form of further taxation often takes place also within the recipient shareholders.
The cost of collecting equity may be estimated with the Capital Assets Pricing Model or, alternatively, using Gordon’s Dividend Discount Model; in such a case, dividends are not paid for the first 10-15 years (till there is a significant cumulated Free Cash Flow to Equity) and then there is a finite time horizon, equivalent to the extension of the public concession.
7. The Paradox of Leverage: is Risk
Mitigated by Milder Governance
Problems?
If you were a bank, would you finance a project with 80-20 debt / equity ratio, knowing that the assets - mainly consisting of capitalized construction costs - are not suitable collateral and that a ring fence mechanism protects the SPV's shareholders?
Addressed this way, the question is tricky and would unavoidably bring to a negative answer. The green light to bankability has to take into account the abovementioned paradox, considering also other issues that have to make the difference: relatively stable and growing cash inflows are the key parameter to modify an otherwise negative judgment. And since operating cash flows mainly consist of positive economic margins, relying on a positive and sustainable operating leverage is the true key of bankability.
Enterprise value is normally estimated discounting operating cash flows at their appropriate WACC, according to the standard proposition I of Modigliani & Miller about optimal capital structure, possibly corrected introducing both taxation and agency costs of (risky) debt.
WACC is the minimum return that a company must earn on existing assets to satisfy its creditors, owners, and other providers of sources of capital, consisting of a calculation of a firm's cost of capital in which each category of underwriters is proportionately weighted.
The standard agency problems of debt concern the conflict of interests between a potential lender (the principal), who has the money but is not the entrepreneur, and a potential borrower (the agent), a manager with business ideas who lacks the money to finance them. The principal can become a shareholder, so sharing risk and rewards with the agent, or a lender, entitled to receive a fixed claim. Agency theory explains the mismatch of resources and abilities that can affect both the principal and the agent: since they need each other, incentives for reaching a compromise are typically strong. For a PF application, see [8].
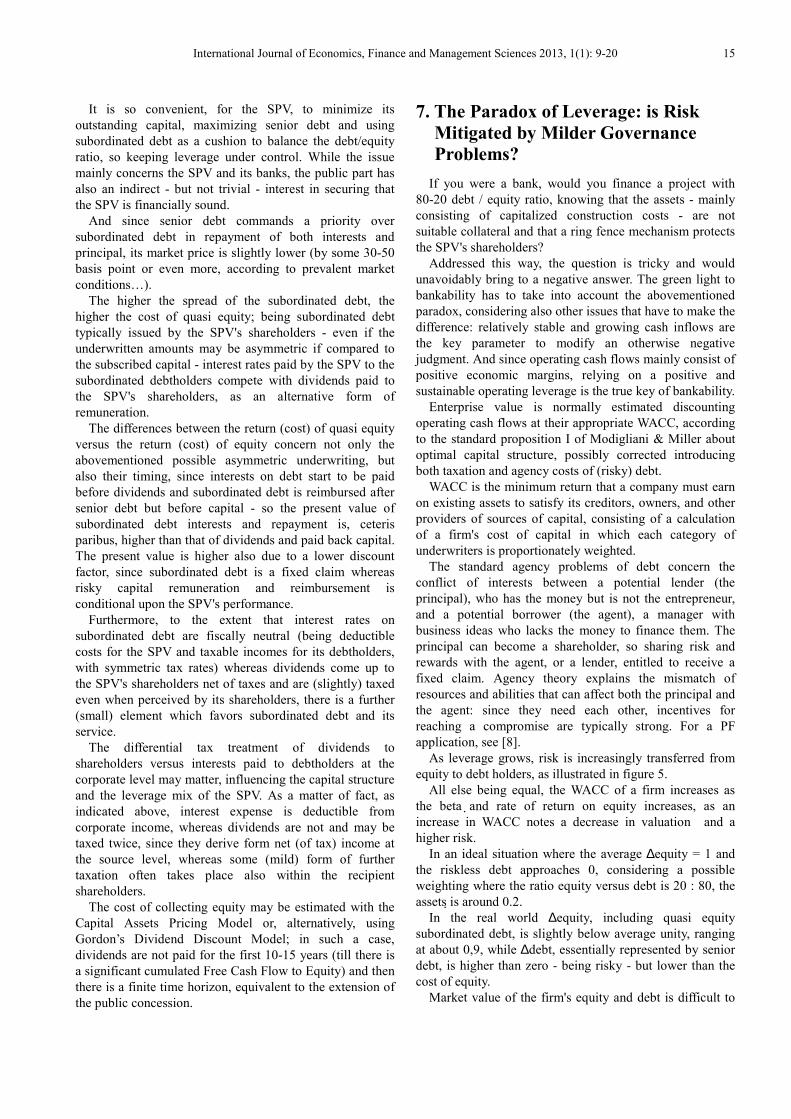
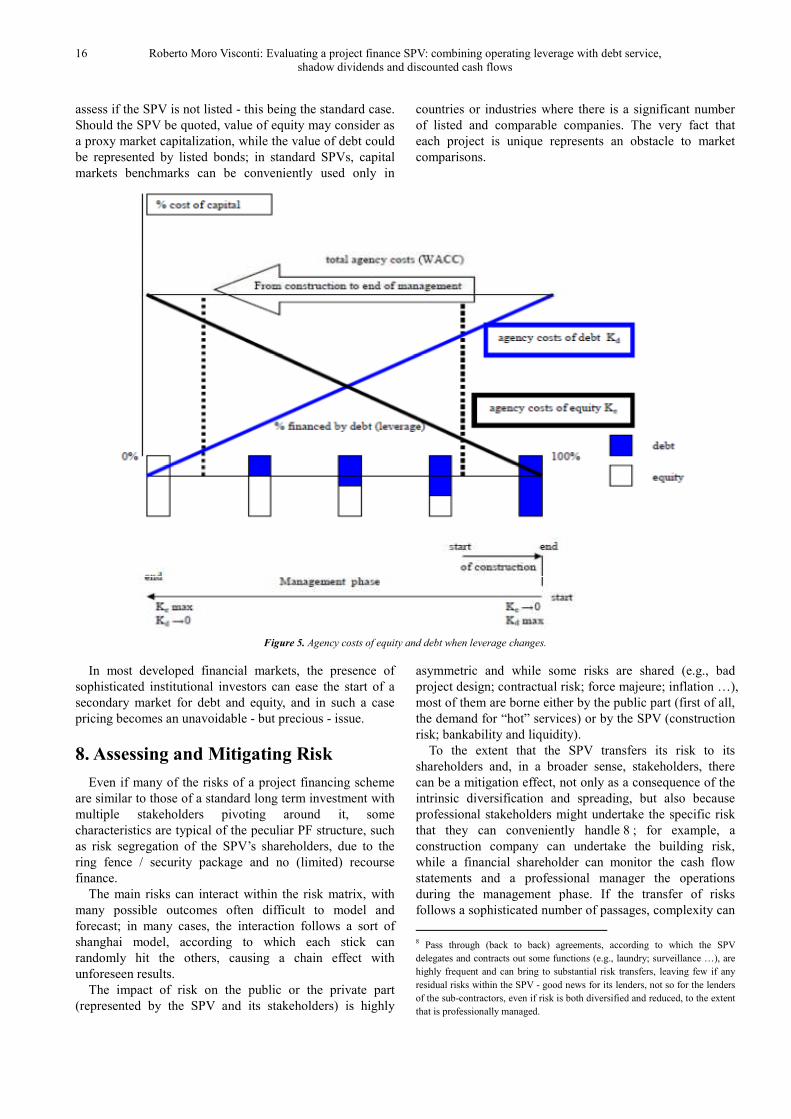
As leverage grows, risk is increasingly transferred from equity to debt holders, as illustrated in figure 5.
All else being equal, the WACC of a firm increases as the beta and rate of return on equity increases, as an increase in WACC notes a decrease in valuation and a higher risk.
In an ideal situation where the average ∆equity = 1 and the riskless debt approaches 0, considering a possible weighting where the ratio equity versus debt is 20 : 80, the assets is around 0.2.
In the real world ∆equity, including quasi equity subordinated debt, is slightly below average unity, ranging at about 0,9, while ∆debt, essentially represented by senior debt, is higher than zero - being risky - but lower than the cost of equity.
Market value of the firm's equity and debt is difficult to
16 Roberto Moro Visconti: Evaluating a project finance SPV: combining operating leverage with debt service, shadow dividends and discounted cash flows
assess if the SPV is not listed - this being the standard case. Should the SPV be quoted, value of equity may consider as a proxy market capitalization, while the value of debt could be represented by listed bonds; in standard SPVs, capital markets benchmarks can be conveniently used only in
countries or industries where there is a significant number of listed and comparable companies. The very fact that each project is unique represents an obstacle to market comparisons.
Figure 5. Agency costs of equity and debt when leverage changes.
In most developed financial markets, the presence of sophisticated institutional investors can ease the start of a secondary market for debt and equity, and in such a case pricing becomes an unavoidable - but precious - issue.
8. Assessing and Mitigating Risk
Even if many of the risks of a project financing scheme are similar to those of a standard long term investment with multiple stakeholders pivoting around it, some characteristics are typical of the peculiar PF structure, such as risk segregation of the SPV’s shareholders, due to the ring fence / security package and no (limited) recourse finance.
The main risks can interact within the risk matrix, with many possible outcomes often difficult to model and forecast; in many cases, the interaction follows a sort of shanghai model, according to which each stick can randomly hit the others, causing a chain effect with unforeseen results.
The impact of risk on the public or the private part (represented by the SPV and its stakeholders) is highly
asymmetric and while some risks are shared (e.g., bad project design; contractual risk; force majeure; inflation …), most of them are borne either by the public part (first of all, the demand for “hot” services) or by the SPV (construction risk; bankability and liquidity).
To the extent that the SPV transfers its risk to its shareholders and, in a broader sense, stakeholders, there can be a mitigation effect, not only as a consequence of the intrinsic diversification and spreading, but also because professional stakeholders might undertake the specific risk that they can conveniently handle 8 ; for example, a construction company can undertake the building risk, while a financial shareholder can monitor the cash flow statements and a professional manager the operations during the management phase. If the transfer of risks follows a sophisticated number of passages, complexity can
8 Pass through (back to back) agreements, according to which the SPV delegates and contracts out some functions (e.g., laundry; surveillance …), are highly frequent and can bring to substantial risk transfers, leaving few if any residual risks within the SPV - good news for its lenders, not so for the lenders of the sub-contractors, even if risk is both diversified and reduced, to the extent that is professionally managed.
International Journal of Economics, Finance and Management Sciences 2013, 1(1): 9-20 17
itself become a risky problem, hiding information asymmetries (see [9])9 and difficulties of coordination and problem detection.
PF investments are frequently perceived by the private part as mildly less risky than other long term investments10, as shown in [10], especially if they are mainly driven by expected predominant cold revenues - and as a consequence EBIT volatility is lower than in other businesses; this is due to the fact that the main market risk is often borne by the public part.
Interactions between different risk factors can take place and be identified using either sensitivity analyses [11]11, changing one parameter at a time (e.g., impact of a decrease in the availability payment 12 on the overall economic and financial plan, from sustainability to bankability and profitability …) or more complex what-if scenario analyses, where different parameters change simultaneously, producing possible future events by considering alternative outcomes13.
Risk mitigation is a key issue that makes everybody happy, both from the public and the private side; the problem is that it is much easier to say than to do; among the main devices, the following are the most used and effective:
• specialization of the agent which professionally deals with a specific risk;
• risk sharing among different subjects (e.g., multiple shareholders of the SPV);
• insurance, somewhat expensive and in many cases not possible (examples include construction risk but not market risks, traditionally not insurable);
• putting quality first; good construction, maintenance and management can substantially decrease risks and related costs.
Being the PF investment traditionally timed in different phases, concerning the project, the construction and the management, an analysis of the risks, in particular during
9 According to the seminal paper of Leland and Pyle, when the owners of a firm or project have private information about the project, the amount of their own funds invested in the project will be interpreted as a signal of its quality. In equilibrium, the higher the quality of the project, the greater the amount of equity that will be retained by the owner, and the higher will be the market valuation of the firm. 10 In PF, longer maturity loans are not necessarily perceived by lenders as being riskier than shorter-term credits. This contrasts with other types of debt, where credit risk is found instead to increase with maturity ceteris paribus. A number of peculiar features of project finance structures, such as high leverage, non-recourse debt, long-term political risk guarantees and the timing of project cash flows, might underlie this finding. 11 Sensitivity analysis is a means of gauging the impact of individual risks on a financing. Key risks can occur in three time periods: - Feasibility, engineering and construction phase; - Start up phase (usually through completion); - Operating phase (post completion). 12 Payments to cover construction, building maintenance, lifecycle repair and renewal and project financing should conveniently be made on an availability and performance basis, so as to stimulate the concessionaire to maintain a high quality profile along all the useful life of the project. 13 Given the uncertainty inherent in project forecasting and valuation, analysts will wish to assess the sensitivity of project NPV to the various inputs (i.e. assumptions) to the Discounted Cash Flow (DCF) model.
the latter two phases, is important in order to detect the overall hazard of the project.
The risk matrix identifies the following main categories of uncertainties:
• Risks concerning the construction site • Risks of planning - engineering - construction • Financial Risks • Governance - sponsor Risk • Operating and Performance Risks • Market Risks • Network and interface risks • Procedural, contractual and legislative risks • Macroeconomic - systemic risks. References about risk factors in PF investments may be
found in [12], [13], [14] and [15]. Being PF a long termed investment, of some 20-30 years,
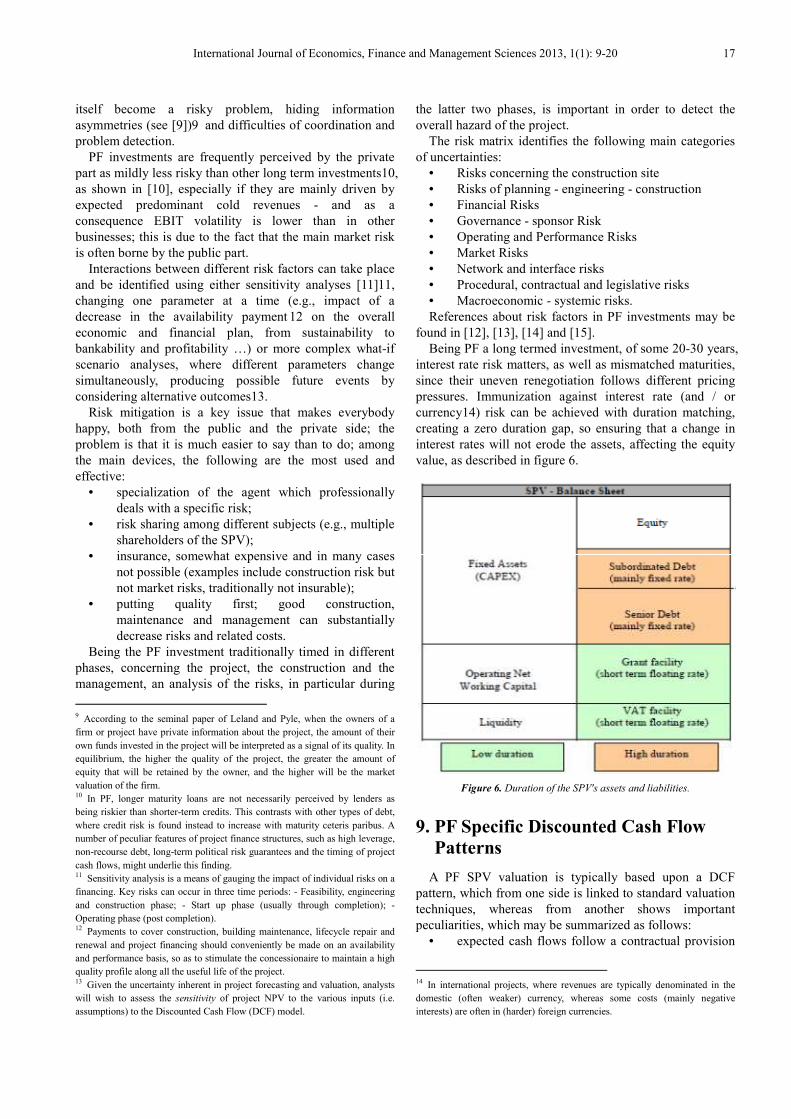
interest rate risk matters, as well as mismatched maturities, since their uneven renegotiation follows different pricing pressures. Immunization against interest rate (and / or currency14) risk can be achieved with duration matching, creating a zero duration gap, so ensuring that a change in interest rates will not erode the assets, affecting the equity value, as described in figure 6.
Figure 6. Duration of the SPV's assets and liabilities.
9. PF Specific Discounted Cash Flow
Patterns
A PF SPV valuation is typically based upon a DCF pattern, which from one side is linked to standard valuation techniques, whereas from another shows important peculiarities, which may be summarized as follows:
• expected cash flows follow a contractual provision
14 In international projects, where revenues are typically denominated in the domestic (often weaker) currency, whereas some costs (mainly negative interests) are often in (harder) foreign currencies.
18 Roberto Moro Visconti: Evaluating a project finance SPV: combining operating leverage with debt service, shadow dividends and discounted cash flows
(typically, from 15-20 up to 30 years) and the investment timesheet can be scheduled from beginning, so minimizing many uncertain features about durability and termination which may disturb DCF valuations, often up to the point of making them senseless;
• cash flows follow a timely segmentation, especially between the construction and the management phase, as shown in Figures 3, 4 and 5.
• terminal value is typically limited (being the investment discounted across a long time value) or worthless for the SPV, especially under Build, Operate and (free) Transfer PF agreements; whenever contractual transfer is not for free, its amount has to be properly discounted;
• senior debt is typically fully paid back (amortizing capital reimbursements or, less likely, with bullet repayments) before subordinated debt and both tend to expire some years before legal termination of the PF;
• the asset structure also influences cash flows, with remixing trends according to which the initial presence of heavy fixed assets, representing the investment, is progressively softened by depreciations and growing amounts of working capital;
• asset &liability management interactions and mismatched maturities, such as those described in Figure 6, impact on cash flows and on their volatility, sensitive to market interest rate changes;
• operating leverage and economic/financial parameters such as EBITDA, are influenced by contractual cold / hot revenues, synthesized in Table 2; cold PF investments are traditionally less risky but also show less scalable upside potential;
• EBITDA (and its embedded cash component) is naturally linked to Enterprise Value by the EV / EBITDA ratio, a capital structure neutral 15 valuation multiple traditionally used in finance to measure the value of a company; the reciprocate multiple EBITDA/EV is used as a measure of cash return on investment; even cash flows may be directly compared to Enterprise Value or Market Capitalization;
• the ratio EBITDA/negative interests is the economic multiplier of debt servicing, since cash generated by the profit & loss account should exceed (typically by at least 4-5 times) the liquidity absorbed by financial charges; even this ratio changes across time and is typically minimized when financial leverage peaks, at the end of the construction phase;
• risk is conventionally embedded in discounting
15 While EBITDA is accounted for before debt service (like unlevered Operating Cash Flow), Enterprise Value is the sum (expressed in market terms) of Net Financial Debts and Equity, so being irrespective of their proportion, expressed by financial leverage.
factors reported in the DCF denominator, which depend on several interacting variables, starting from the cash flow expected volatility;
• in PF, cash flow segregation is contractually envisaged in the agreements between the private entity and its lenders, and so it allows avoiding most conflicts between equity and debt holders.
• presence of secondary markets for debt and equity makes the investment more liquid and intrinsically less risky.
All these interacting features show why PF is a cash flow based investment and consequently why DCF is the leading - often unique – method for the evaluation of a SPV.
A peculiar, albeit rather common, pattern, is represented by international PF investments, where there is a typical mismatch between assets and liabilities, which are (at least partially) denominated in different currencies.
While assets are typically denominated in the local currency of the (foreign) investment, at least some of the liabilities are denominated in the currency of the SPV’s shareholders: this may be for instance the case of equity (apart from retained earnings, which may be denominated in the local currency) and, especially, of subordinated and/or senior debt, to the extent that sponsoring banks and debtholders belong to the country of origin of the SPV’s shareholders; this happens in particular when less developed countries host the investment, whereas hard currency countries originate most of the investment backers, in the form of equityholders and/or debtholders.
This uneven balance sheet structure, threatened by a currency mismatch (particularly evident if the weak currency is not pegged to the stronger one), is due to have cash flow implications, if costs and revenues are not perfectly synchronized, being influenced by different exchange rate fluctuations.
While revenues are typically denominated in the local currency of the investment and most of the operating costs (workforce, pass-through contracts, etc.) are also local, some or even most financial expenses, such as negative interests, may be denominated in a (harder) foreign currency.
In absence of any (expensive and rarely optimal) currency hedging, currency mismatches may impact on cash flows, with alternative outcomes, positive or negative (and often at least partially, self compensating); the likely result is typically represented by an ideal zero sum game, where it is difficult – on average – to guess if the outcome is a loss or a revenue; the only conclusion is that cash flow volatility is likely to increase and, with it, its intrinsic risk, so decreasing its discounted present value: more volatile expected cash flows naturally bring to lower DCFs, so impacting on valuation.
Currency rate mismatches are also linked, through arbitrage parities such as Purchasing Power Parity, or Interest Rate Parity, to interest and inflation rate fluctuations. The risk profile of international PF investments is also concerned by country risk, which may
International Journal of Economics, Finance and Management Sciences 2013, 1(1): 9-20 19
affect the repatriation of funds (especially dividends). While operating (unlevered) DCF valuations bring to an
Enterprise Value estimate, net cash flow discounting represents Free Cash Flow for shareholders, possibly the best estimate of Equity Value; residual value apportionment to equityholders, after debt service, considers not only their participation stakes, but also their (subordinated) quasi-equity debt underwriting.
Cash flow waterfalls ensure that each liquidity inflow is apportioned with the correct hierarchical seniority, following an absolute priority rule according to which contractual debt service precedes residual free cash flow to equity. This is particularly important in cash-flow based investments such as PF, reducing managerial discretion with proper debt monitoring and servicing, sometimes requiring the presence of debt service reserve accounts, in the form of an accumulated and segregated “reservoir” of liquidity for debtholders, again especially in the construction years, when leverage peaks, as shown in Figure 4.
10. Concluding Remarks
Private entities investing in PF initiatives are structurally highly leveraged, especially in the first years of their life, looking somewhat like Leveraged Buy Out companies. Their levered equity may command a market premium on unlevered comparables, however bearing higher risk.
The evaluation of project financing SPVs has to take into consideration their (highly) leveraged profile, with its pros and cons, from deductibility of negative interest rates to increasing costs of bankruptcy: if the interest rate tax shield is a typical argument in favor of the leverage, conversely risk of default is a topic against excessive debt. Insolvency costs are already embedded in the financial plan and incorporated in rate spreads, even if external shocks or unplanned events may undermine any forecast, up to the point of bypassing financial sustainability.
Negative results may bring the company either to equity or cash burn out, which may be accounted for in the evaluation, together with its (limited) statistical possibility of occurrence.
PF is an infrastructural investment with extended duration and long and complex gestation process, substantially illiquid due to its lumpiness and indivisibility, capital intensive, highly leveraged and difficult to evaluate - all characteristics that make the investment intrinsically risky. When complexity grows, risk increases and supervision becomes more important; bank monitoring is a typical corporate governance feature of leveraged companies.
In many countries, especially those with high public debt, limitations upon the public funds due to constraints fixed by the EU Growth and Stability Pact have led governments, pushed by an increasing demand in public investments, to invite private entities to enter into long-term PPP contractual agreements [16] for the financing, construction
and/or operation of capital intensive infrastructural projects, as shown in [17].
For the public procurer, value-for-money is a key parameter in orienting the choice towards project financing or elsewhere, while for the private project sponsors, such ventures are characterized by low equity in the SPV and reliance on direct revenues to both cover operating and capital costs, and service external debt finance.
No wonder that in such a context, risk is a complex and core issue, to be analyzed from the different perspectives of the public and private sector entities, with the banking institutions representing the major cash supplier - not a secondary partner:
• for the public entity, ex ante risks such as value for money comparisons, technical choices such as selection of location and planning and ex post monitoring of quality and costs, during the management phase; core market risk is also entirely borne by the public part;
• for the SPV, profitability for equityholders (NPVequity; IRRequity), after having properly served the debt, considering also inflation risk, as shown in [18];
• for the lending institutions, proper debt service, i.e. … getting lent money back!
Future research may conveniently concentrate on innovative evaluation issues, coordinating appropriate DCF technicalities and fallacies ([19], [20], [21], [22]) with proper risk assessing in multivariate scenarios, with a constant adaptation to infrastructural investment patterns ([23], [24], [25], [26], [27]) whose flexibility is often complex to assess and properly model.
References
[1] LI B., AKINTOYE A., HARDCASTLE C., (2001), Risk Analysis and Allocation in Public Private Partnerships Projects, 17th Arcom Annual Conference, Salford, vol 2., pp. 895-904.
[2] ROBINSON H.S., SCOTT J., (2009), Service Delivery and Performance Monitoring, PFI/PPP projects, Construction Management & Economics, Vol. 27 Issue 2, pp. 181-197, February.
[3] McKENZIE R., (2008), Strategies to Improve Value for Money in Financing Public Private Partnership, Public Infrastructure Bulletin, vol. 1: Iss. 7, Article 2.
[4] Damodaran A., (2006) Valuation approaches and metrics: a survey of the theory and evidence. Working paper (November).www.stern.nyu.edu/~adamodar/pdfiles/papers/valuesurvey.pdf.
[5] MARTY F., VOISIN A., (2007), Partnership contracts, project finance and information asymmetries: from competition for the contract to competition within the contract?, www.oecd.org/dataoecd/32/13/41767913.pdf.
[6] Hollie D., Cheng, C. (2008), Do core and non-core cash flows from operations persist differentially in predicting future cash flows? Review of Quantitative Finance & Accounting, vol. 31, n. 1.

20 Roberto Moro Visconti: Evaluating a project finance SPV: combining operating leverage with debt service, shadow dividends and discounted cash flows
[7] MAGNI C.A., Velez-Pareja I., (2009), Potential Dividends versus Actual Cash Flows in Firm Valuation. Journal of Applied Finance, Vol. 15, No. 7, pp. 51-66.
[8] FARRELL L.M., (2003), Principal-agency risk in project finance, International Journal of Project Management, 21, 547-561.
[9] LELAND H., PYLE H., (1977), Informational Asymmetries, Financial Structure, and Financial Intermediation, Journal of Finance, Vol. 32, No. 2, May: 371-387.
[10] SORGE M., GADANECZ B., (2004), The Term Structure of Credit Spreads in Project Finance, Bank for International Settlements (BIS), Working Paper, No. 159, August.
[11] Borgonovo E., Peccati L., Gatti S., (2010), What Drives Value Creation in Investment Projects? An Application of Sensitivity Analysis to Project Finance Transactions European Journal of Operational Research, Volume 205, Issue 1, August 2010, Pages 227-236.
[12] BACKHAUS K., WERTH SCHULTE H., (2006), Identification of Key Risk Factors in Project Finance: A project type - Based Simulation Approach, Journal of Structured Finance, Winter, 71.
[13] BAIN R., PLANTAGIE J.W., (2007), The Anatomy of Construction Risk: Lessons From a Millennium of PPP Experience, Infrastructure Finance, Standard & Poor's Research Report, April 5.
[14] MORO VISCONTI R., (2010), The Risk Matrix of Project Finance in the Healthcare Sector (September). http://ssrn.com/abstract=1417289.
[15] GRIMSEY D., LEWIS M.K., (2002), Evaluating the risks of public private partnerships for infrastructure projects, International Journal of Project Management, 20, 107-118.
[16] AKINTOYE A., BECK M., (2009), Policy, Finance & Management for Public Private Partnership, Wiley-Blackwell, London.
[17] ESTY B.C., (2002), Returns on Project-Financed Investments: Evolution and Managerial Implications, Journal of Applied Corporate Finance, Spring, pp. 71-86.
[18] MORO VISCONTI R., (2012), Inflation Risk Management in Project Finance Investments, International Journal of Finance and Accounting, vol. 1, n. 6, November.
[19] THAM J., Velez-Pareja I., (2004), Top 9 (Unnecessary and Avoidable) Mistakes in Cash Flow Valuation (January 29). http://ssrn.com/abstract=496083.
[20] Cheremushkin S.V., (2011), How to Avoid Mistakes n Valuation: Guidelines for Practitioners. http://ssrn.com/abstract=1785050.
[21] Fernández P., (2007),Valuing companies by cash flow discounting: ten methods and nine theories, Managerial Finance, Vol. 33 Iss 11.
[22] Marafie F. A., (2011), Most Common Errors When Valuing a Business. http://ssrn.com/abstract=1851768.
[23] Garvin M.J., Cheah, C.Y.J. (2004) Valuation Techniques for Infrastructure Investment Decisions. Construction Management and Economics, Vol. 22, No. 4, pp. 373-383.
[24] Bitsch F., Buchner A., Kaserer, C., (2010), Risk, Return and Cash Flow Characteristics of Infrastructure Fund Investments. EIB Papers, Vol. 15, No. 1, pp. 106-136, http://ssrn.com/abstract=1992961.
[25] Ègert B., Kozluk, T. Sutherland, D. (2009). Infrastructure Investment: Links to Growth and the Role of Public Policies. OECD Economics Department Working Paper No.686.
[26] Helm D., (2009), Infrastructure Investment, the Cost of Capital, and Regulation: an Assessment. Oxford Review of Economic Policy, (25:3), pp. 307-326.
[27] Inderst G., (2010). Infrastructure as an asset class, EIB Papers Vol. 15, No. 1, pp. 70-105.