Embed Size (px)
Citation preview
Evaluating a Continuous Improvement Initiative using Stakeholder Value Mapping
by
Benjamin H. Lathrop
B.S. Chemical Engineering, University of Wisconsin-Madison (2000)
Submitted to the Sloan School of Management and the Department of Chemical Engineeringin Partial Fulfillment of the Requirements of
Master of Business Administrationand
Master of Science in Chemical Engineering
In Conjunction with the Leaders for Manufacturing Program at theMassachusetts Institute of Technology June 2006
C 2006 Massachusetts Institute of Technology. All rights reserved.
Signature of Author .................... ........................ ...... ........ :So' Schoo ......Sloan School of Mha ement
Department of Chemical EngineeringMay 11, 2006
Certified by ............................................. ..................lire ry0. McRae, Thesis Reader
Bayer Professor of Chemical Engineering
Certified by.............................................. /.v. .......... .. T..... . .... .....Debor S.Nightigale, Thesis Advisor,
Professor of Aeronautics and Astr nacs afiid~Engifieering.System. /
C ertified by ........................................................ .,,..... . . ........JoeYiCu(che-Gersfienfeld, Thesi'Advisor
Professor of Engizieering Systems
Accepted by.....................................................William Deen, Graduate Committee Chairman
Department of Chemical Engineering
Accepted by............................ ..... .~-.. ... ..-.....-Acceptedb
Debbie Berecnman, Executive Director or Masters rrogramSloan School of Management
ARCHIVES
MASSACHUSETS INSOF TECHNOLOGY
AUG 3 1 2006
LIBRARIES
m__

Evaluating a Continuous Improvement Initiative using Stakeholder Value Mapping
By
Benjamin H. Lathrop
Submitted to the Sloan School of Management and Department of ChemicalEngineering on May 11, 2006 in Partial Fulfillment of the Requirements
for the Degrees of Master of Business Administration andMaster of Science in Chemical Engineering
Abstract
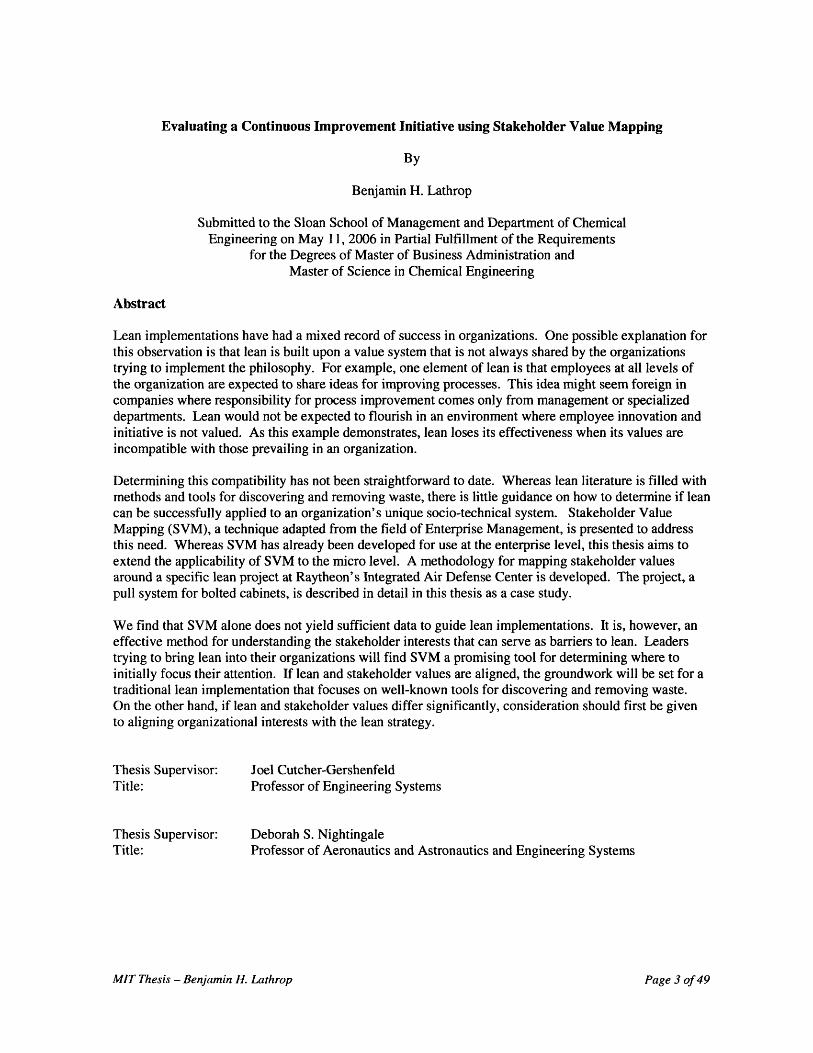
Lean implementations have had a mixed record of success in organizations. One possible explanation forthis observation is that lean is built upon a value system that is not always shared by the organizationstrying to implement the philosophy. For example, one element of lean is that employees at all levels ofthe organization are expected to share ideas for improving processes. This idea might seem foreign incompanies where responsibility for process improvement comes only from management or specializeddepartments. Lean would not be expected to flourish in an environment where employee innovation andinitiative is not valued. As this example demonstrates, lean loses its effectiveness when its values areincompatible with those prevailing in an organization.
Determining this compatibility has not been straightforward to date. Whereas lean literature is filled withmethods and tools for discovering and removing waste, there is little guidance on how to determine if leancan be successfully applied to an organization's unique socio-technical system. Stakeholder ValueMapping (SVM), a technique adapted from the field of Enterprise Management, is presented to addressthis need. Whereas SVM has already been developed for use at the enterprise level, this thesis aims toextend the applicability of SVM to the micro level. A methodology for mapping stakeholder valuesaround a specific lean project at Raytheon's Integrated Air Defense Center is developed. The project, apull system for bolted cabinets, is described in detail in this thesis as a case study.
We find that SVM alone does not yield sufficient data to guide lean implementations. It is, however, aneffective method for understanding the stakeholder interests that can serve as barriers to lean. Leaderstrying to bring lean into their organizations will find SVM a promising tool for determining where toinitially focus their attention. If lean and stakeholder values are aligned, the groundwork will be set for atraditional lean implementation that focuses on well-known tools for discovering and removing waste.On the other hand, if lean and stakeholder values differ significantly, consideration should first be givento aligning organizational interests with the lean strategy.
Thesis Supervisor: Joel Cutcher-GershenfeldTitle: Professor of Engineering Systems
Thesis Supervisor: Deborah S. NightingaleTitle: Professor of Aeronautics and Astronautics and Engineering Systems
MIT Thesis - Benjamin H. Lathrop Page 3 of 49
The author wishes to acknowledge the Leaders for Manufacturing(LFM) Program at MIT for its support of this work.
He also thanks Raytheon Company for sponsoring his research through its partnership withthe LFM program. Many Raytheon employees made this thesis possible by generously sharing
their time and knowledge. In particular, Roger Hinman and Mark Recco deserve specialrecognition as his project supervisor and project champion, respectively.
The author also wishes to thank professors Deborah Nightingale and Joel Cutcher-Gershenfeld whoadvised the author throughout the thesis work. Their time and guidance was invaluable. He also thanks
Professor Gregory McRae, who served as his thesis reader.
Finally, he would like to thank his wife Wendy for her support and love during twowonderful years in Cambridge and his son Austin for making dad laugh when he needed it.
MIT Thesis - Benjamin H. Lathrop Page 4 of49
Table of Contents
1 INTRODUCTION ................................................................................................................................. 6
1.1 ORGANIZATION OF THE THESIS .............................. ............ ............. .......................... 6
2 PROJECT SETTING AND MOTIVATION ....................................................................................... 8
2.1 RAYTHEON COM PANY ..................................................................... .................................................. 82.2 INTEGRATED DEFENSE SYSTEMS............................................... .. . .. ............................ 82.3 INTEGRATED AIR DEFENSE CENTER......................................................................... ... ....................... 9
2.4 RAYTHEON SIX SIGMA AND CONTINUOUS IMPROVEMENT ................................................................... 10
2.5 PROJECT MOTIVATION ........................................................ ... ................................... 11
3 M ETH O DS ...................................................................................................................................................... 13
3.1 VALUE STREAM MAPPING............................................................... 133.2 STAKEHOLDER VALUE M APPING .................................... ......................... .. ........................... 14
4 CASE STUD Y .................................................................................................................................................. 18
4.1 CONCEPTION OF BOLTED CABINET PULL SYSTEM............................................. 184.2 BOLTED CABINET PULL SYSTEM PROJECT TEAM .............................................................. 194.3 BOLTED CABINET PULL SYSTEM DESIGN...........................................................................20
4.4 BOLTED CABINET PULL SYSTEM IMPLEMENTATION ................................................................ 214.5 DRIVE FOR IMPROVED SHORT-TERM FINANCIAL PERFORMANCE.........................................................22
4.6 V IOLATIONS OF LEAN PRINCIPLES .................................................................... ................................. 24
4.7 BOLTED CABINET PULL SYSTEM RESULTS ............................. .............................. 26
5 ANALYSIS OF STAKEHOLDER VALUE DATA ....................................................... 28
5.1 D ATA A N A LY SIS ....................................................................................................................................... 285.2 THOUGHTS ON STAKEHOLDER VALUE MAPPING TOOL......................................................33
6 ORGANIZATION AND CHANGE ............................................................................................................... 35
6.1 STRATEGIC PERSPECTIVE ........................... ......................... .. ............ ......................... 356.2 POLITICAL PERSPECTIVE ........................................................................................................................... 37
6.3 CULTURAL PERSPECTIVE............................................... .. .............. ...................... 39
7 CONCLUSIONS ................................................................................................. ........................................ 41
8 BIBLIOGRAPHY ................................................................................................ ....................................... 42
9 AUTHOR'S BIOGRAPHY ........................................................................................................................ 43
10 APPENDIX ...................................................................................................................................................... 44
10.1 EXHIBIT 1 - CURRENT STATE VALUE STREAM MAP FOR BOLTED CABINET LINE ..................................... 4410.2 EXHIBIT 2 - STAKEHOLDER VALUE MAPPING INTERVIEW PROTOCOL .............................................. 45
10.3 EXHIBIT 3 - STAKEHOLDER VALUE DATA COLLECTION FORM (VER. 1) ..................................... ... 4610.4 EXHIBIT 4 - STAKEHOLDER VALUE DATA COLLECTION FORM (VER. 2) ..................................... ... 4810.5 EXHIBIT 5 - EXCERPT OF THE PULL SYSTEM IMPLEMENTATION PLAN ............................................. 49
MIT Thesis 'Benjamin H. Lathrop Page 5 of 49
1 Introduction
An underscoring theme of this thesis is that lean implementations can only be successful when an
organization's prevailing values are consistent with the values underlying lean'. Determining
compatibility between lean and organizations is not straightforward. Whereas lean literature is filled with
methods and tools for discovering and removing waste2, there is little guidance on how to determine if
lean can be successfully applied to an organization's unique socio-technical system. Stakeholder Value
Mapping (SVM), a technique adapted from the field of Enterprise Management 3, is presented to address
this need. Whereas SVM has been used in recent years at the macro level to determine if enterprise
stakeholders are aligned around common goals and values, this thesis aims to extend the applicability of
SVM to the critically important micro level where lean often hits the greatest barriers to successful
implementation4.
1.1 Organization of the Thesis
The thesis consists of eight chapters as described below:
Chapter 2, Project Setting and Motivation, provides a brief overview of Raytheon Company and its
organizational structure down to the group level in which the project took place. Raytheon Six Sigma and
Continuous Improvement initiatives are also detailed because of their high relevance to the thesis topic.
Chapter 2 ends with the motivating factors for conducting this work.
Chapter 3, Methods, discusses the formalized approaches used in this work. Value Stream Mapping is
discussed because it triggered many of the continuous improvement projects being pursued by the Metal
Fabrication group. Section 4.2 describes the novel application of Stakeholder Value Mapping developed
during this work.
i For an excellent description of lean principles, the author suggests The Hitchhiker's Guide to Lean: Lessons fromthe Road, co-authored by Jamie Flinchbaugh (LFM '98) and Andy Carlino.
2 One well known work which influenced the author is Lean Thinking by James Womack and Daniel Jones.3 The author recommends Lean Enterprise Value by Murman,Allen, Bozdogan, Cutcher-Gershenfeld, McManus,
Nightingale, Rebentisch, Shields, Stahl, Walton, Warmkessel, Weiss, Widnall.4 In related work, Shinkle, Gooding, and Smith discuss Lean Management Systems in their work Transforming
Strategy into Success: How to Implement a Lean Management System. Whereas this book focuses primarily onmanagement systems, many of the concepts are compatible with the focus of this thesis, namely leanimplementations at the group level.
MIT Thesis - Benjamin H. Lathrop Page 6 of 49
Chapter 4, Case Study, illustrates how a lean project was conducted at Raytheon's Integrated Air
Defense Center. The details of a pull system design and implementation are first laid out. Factors that
helped and hindered the success of the project are highlighted.
Chapter 5, Analysis of Stakeholder Data, discusses the results of the Stakeholder Value Mapping
methodology described in Section 4.2. This chapter is divided into two sections. The first section covers
the quantitative analysis of the stakeholder value data while the second section reviews the usefulness of
this method as a management tool. Recommendations for improving the methodology are also provided.
Chapter 6, Organization and Change, covers how the Three Lenses framework was used to evaluate
those parts of the Raytheon organization that most affected the implementation of the pull project.
Chapter 7, Conclusions, highlights the key points of the thesis.
MIT Thesis - Benjamin H. Lathrop Page 7 of 49
2 Project Setting and Motivation
This thesis work was made possible through MIT's Leaders for Manufacturing (LFM) Program and took
place from June to December, 2005, at Raytheon's Integrated Air Defense Center (IADC) in Andover,
Massachusetts. This section will discuss the project setting, starting with a brief introduction of Raytheon
Company and continuing stepwise down into smaller and smaller business segments of the organization.
Next, a review of the Continuous Improvement and Raytheon Six Sigma initiatives is presented. These
programs spawned the project that was studied during the six month research effort. The end of this
chapter describes the motivation behind the project. The project itself is described in detail as a case
study in Section 5.
2.1 Raytheon Company
Raytheon Company is an industry leader in providing integrated mission systems for defense and non-
defense customers. Its seven Business Units provide a broad range of products and services in defense
and government electronics, space, information technology, technical services, and business aviation and
special mission aircraft. Headquartered in Waltham, Massachusetts, its CEO Bill Swanson leads 80,000
employees worldwide. 2004 revenues were $20.2 billion.5
2.2 Integrated Defense Systems
This thesis work was conducted within Integrated Defense Systems (IDS), one of Raytheon's seven
Business Units. IDS is Raytheon's leader in mission systems integration and has a strong international
and domestic customer base. It provides products and services for air and missile defense as well as naval
and maritime war fighting solutions. Major customers include the U.S. Missile Defense Agency and the
U.S. armed forces. In 2005, IDS generated approximately $3.5 billion in revenues and employed more
than 12,700 people. Organizationally, the IDS business unit is further broken down into six Business
Areas and two Collaborative Operations groups. Headquarters are in Tewksbury, Massachusetts.6
5 Source: Raytheon website, http://www.raytheon.com/about/6 Source: Raytheon website, http://www.raytheon.com/businesses/rids/about/index.html
MIT Thesis - Benjamin H. Lathrop Page 8 of 49
2.3 Integrated Air Defense Center
The Integrated Air Defense Center (IADC) is the name of the IDS Business Area located in Andover,
Massachusetts. This site consists of manufacturing and support services that serve the Department of
Defense (DoD) by providing total air and missile defense systems solutions and integration efforts. A
number of key programs are served by the IADC, including the well known Patriot Air & Missile
Defense System.7
Research was primarily conducted within two groups of the IADC: the Metal Fabrication group and the
In-Service Radar (ISR) group. The Metal Fabrication group is an in-house provider of metal components
for defense systems. Its capabilities include machining, milling, drilling, welding, assembly, painting and
chromating. Approximately 180 highly skilled union employees are supported by about 50 support
employees.
ISR is one of Metal Fabrication's clients and is physically located about one hundred feet away from the
Metal Fabrication area. Importantly, however, the two groups are managed independently until their
organizations are connected at the vice-president level, or two levels above the group level.
Communication between the two groups is primarily directed through operations managers, project
managers, and value stream managers.
While Metal Fabrication supplies dozens of parts to ISR, this research focuses only on the bolted cabinet
product line for reasons explained in section 2.5. Bolted cabinets are a new method for housing
electronics, cooling systems, and power supplies for defense systems. Until recently, all such enclosures
were of welded construction. Starting in 2004, however, three types of cabinets have been transitioned to
bolted construction for cost, quality, and aesthetic reasons. These are the Driver, 45 kV, and 17 kV
cabinets which will be referenced throughout the thesis. Another bolted cabinet, the RFM, was
introduced into production just after the conclusion of this research.
It is important to note that the bolted cabinet line is low volume, high complexity work. This is
characteristic of the defense sector and different than many early applications of lean principles.
7 Source: Raytheon website, http://www.raytheon.com/businesses/rids/businesses/Integrated_Air_Defense/index.html
MIT Thesis - Benjamin H. Lathrop Page 9 of 49
2.4 Raytheon Six Sigma and Continuous Improvement
In recent years, the US government has demanded defense contractors to adopt commercial practices to
become more productive and accountable. As a result, the Raytheon Six Sigma (R6a) program was
established throughout Raytheon Company in 1998.8 Really a hybrid of Six Sigma statistical tools and
lean principles, this aggressive initiative strives to establish a company-wide culture of process
improvement that will make the company more competitive. In the same vain, a Continuous
Improvement initiative was recently started locally within the IADC. Synonymous with lean, Continuous
Improvement has caught on quickly as each work group is rated annually on the progress they have made
in lean metrics. The IADC in aggregate measures its success by how well it does in the Northeast Shingo
Prize for Excellence in Manufacturing. In its inaugural year being evaluated by the Shingo Prize Board of
Evaluators, the IADC won a silver medal. 9 It plans to build on this success and win a gold or platinum
medal in 2006.
A Lean Office started up in the first half of 2005. With about a half dozen employees, the Lean Office is
staffed primarily by lean experts. The philosophy is that lean improvements have to be driven by teams
within the business units to be successful. As such, the Lean Office assists as knowledge experts and
internal consultants on projects, but the day to day project leadership resides closer to the shop floor at the
group level.
The Lean Office is responsible for stewarding progress in lean initiatives and assessing how each work
cell is performing using the Manufacturing Excellence Model (MEM). MEM is essentially a list of lean
capabilities in which each work group gets graded. Because employees and managers set annual goals to
improve MEM scores in their divisions, a lot of effort is made to meet these goals. A second
responsibility for the Lean Office is writing the application for the aforementioned Shingo Prize for
Manufacturing Excellence. The application is itself a major undertaking which consumes the effort of the
Lean Office for at least several weeks each year.
In addition to the Lean Office, Raytheon Integrated Defense Systems recently established a Lean
Enterprise website. Here, all employees can easily access information about lean and related topics. For
8 The author referred to Padmaja Vanka's thesis (LFM '04) to learn about the evolution of lean within RaytheonCompany.
9 Source: Raytheon website, http://www.raytheon.com/feature/shingo/
MIT Thesis - Benjamin H. Lathrop Page 10 of 49
example, there are links to the Shingo Award and Manufacturing Excellence Model websites.
Information about lean tools and completed improvement projects are also documented in this portal.
Additionally, the organization uses outside consultants to provide lean training to its employees. At the
IADC, the Greater Boston Manufacturing Partnership (GBMP) works closely with the lean office to
provide training on several subjects from general Continuous Improvement (an introductory course on
lean concepts) to more directed offerings such as specific lean tools (e.g. classes on pull systems, jidoka,
or 5s).
The rationale for using outsiders to provide lean training is twofold. First, Raytheon managers believe
employees will take the training more seriously if provided by external consultants. Second, Raytheon
wants to introduce new ideas into the plant from people who have outsider perspectives.
2.5 Project Motivation
The success of lean ideas in organizations has been mixed to date. Some organizations are able to adopt
the lean management philosophy quickly and achieve immediate benefits. Others try but fail ever to see
any benefit. The purpose of this thesis work was to develop a new methodology, Stakeholder Value
Mapping, which could be used to determine to what degree the business environment supported lean. In
the future, it is hoped that this methodology can be used a priori lean implementations. Company leaders
would be able to better assess if lean makes sense in their environment before having to commit
significant resources in an implementation phase.
The Bolted Cabinet line within IADC's Metal Fabrication group seemed to provide an excellent
environment for testing the new methodology. When this work started, a targeted transformation of the
Bolted Cabinet value stream had just been initiated and more than twenty continuous improvement
projects to improve the line were started. Setup reduction, standardized work, workplace organization
(similar to 5S), and error proofing projects, among others, were all ramping up upon the author's arrival.
Here was an environment where lean was being pursued at full speed. Stakeholder Value Mapping could
be tested in parallel and the results compared to the actual implementation results observed during the
internship.
MIT Thesis - Benjamin H. Lathrop Page II of49
The advantages of studying the bolted cabinet line over other potential areas were several. First, the
bolted cabinet line had been performing far below expectations in terms of cost and delivery since its
introduction less than a year before the author's arrival. The fact that the bolted cabinet line had existed
for less than a year meant that traditional firefighting had already improved the manufacturing system to
some semblance of stability, yet there were still large sources of waste for which lean was well suited to
remedy. In lean literature, it is commonly stated that the benefit of lean is realized over a long time
framelo, yet expectations were high in the Metal Fabrication area that significant improvements would be
realized within months due to the poor initial condition of the manufacturing system. If this turned out to
be the case, the author would be present during his six month internship to observe some of the realized
benefits.
Second, the bolted cabinet value stream cut across company and division boundaries, but the interactions
were not so complex that it could not be studied within a six month period. This fact allowed the author
to study the effects that various management philosophies have on each other. Could a lean
implementation in an isolated part of a product's value stream generate benefits if the remainder of the
value stream did not follow lean concepts? This seemed to be an important area for investigation.
And finally, one continuous improvement project, a pull system design and implementation for the bolted
cabinet value stream, had been identified but not yet begun. This provided an opportunity for the author
to lead a continuous improvement project firsthand and to learn what social and technical factors
determine the success of change initiatives. This is the subject of section 5, a case study of the pull
system project.
10 Womack and Jones cite it takes five years to achieve the full benefits (page 98 in Lean Thinking)
MIT Thesis - Benjamin H. Lathrop Page 12 of 49
3 Methods
This chapter compares two methods used during this thesis work. Value Stream Mapping, the topic of
section 3.1, was used to map out the physical and information flows of the bolted cabinet manufacturing
system. The bolted cabinet pull project was established as a direct result of the Value Stream Mapping
activity. Section 3.2 focuses on Stakeholder Value Mapping and is a nice contrast to section 3.1.
Whereas Value Stream Mapping is concerned with physical and information flows in a production
system, Stakeholder Value Mapping is more concerned with determining the cultural, political, and
organizational realities that are critical but often overlooked aspects of successful project
implementation." Since the tactical use of Stakeholder Value Mapping is a novel innovation developed
during this internship, section 3.2 provides a detailed explanation of how it was used during this thesis
work.
3.1 Value Stream Mapping
Value Stream Mapping is a tool used to understand the flow of material and information as a product or
service makes its way through the value stream. 12 As used by Raytheon and many other organizations,
the purpose of value stream mapping is to identify waste. Countermeasures or projects are then identified
to eliminate the waste in the spirit of continuous improvement.
Exhibit I in the appendix shows the current state value stream map for the bolted cabinet line in April
2005. The top half of the map shows information flow throughout the value stream, including planning
and ordering information flows. The bottom half of the map contains operating data for each of the
processing steps leading from the suppliers to the customers. This portion of the map thus focuses on the
material flow from raw material to finished product. Opportunities for improvement are shown
throughout the map represented by starbursts. These starbursts are often used to generate improvement
projects.
The next step in value stream mapping is generating a future state map and possibly a target state map.
The future state map depicts the ideal material and information flows for a waste-less system. For
1" In related work, see Ignaccio Grossi's thesis (SDM '02), "Stakeholder Analysis in the Context of the LeanEnterprise". As opposed to this work, Ignaccio describes stakeholder analysis at the enterprise level.
2 Source: Wikipedia Dictionary. "Value Stream Mapping" dictionary entry.
MIT Thesis - Benjamin H. Lathrop Page 13 of49
example, a future state map might show how the manufacturing system would look if all the improvement
projects spawned from the current state map were realized. The target state map, on the other hand, is a
vision for the more foreseeable future. It is a map of how the system might look in a six month timeframe
after the more immediate improvement projects are completed.
Most of the improvement projects that were initiated just prior to the author's arrival in Metal Fabrication
resulted from the April, 2005 value stream mapping event. The author participated in another value
stream mapping event for the In-Service Radar (ISR) group, Metal Fabrication's customer for the Bolted
Cabinet line.
3.2 Stakeholder Value Mapping
Whereas Value Stream Mapping is useful in determining the technical and physical realities of
manufacturing systems, Stakeholder Value Mapping as used in this thesis is used to determine the cultural
and organizational realities that are critical but often overlooked aspects of successful project
implementation. The nature of stakeholder interests is that there will be points in common and points in
conflict. As such, by identifying and measuring key project stakeholder interests, one is able to reveal
potential drivers and barriers for successful project implementation.
The author developed the following protocol for mapping stakeholder value around the Bolted Cabinet
Pull Project. First, key stakeholder groups were identified. Metal Fabrication's managers clearly held a
stake in the project because they committed the human and financial resources that made the project
possible. Floor operators would also be impacted by the project because of changes in the manufacturing
system. Similarly, the production control and operations groups would be affected because a pull project
would change how they coordinate production and logistics. Because it was looking for early lean
success stories in order to sell lean to other areas of IADC, the Lean Office also had a significant interest
in the project. The last stakeholder group looked at was the internal customer, In-Service Radar (ISR).
Changes in ISR's floorspace would be needed to implement the pull plan and additional cooperation
would be needed to adhere to new demand-based run rules for obtaining bolted cabinets. Note that other
stakeholder groups could have been included, such as Metal Fabrication's suppliers, but the stakeholder
groups targeted were limited to the ones most instrumental to the project's success. This phase of the
protocol, identifying key stakeholders, lasted approximately two months in total as the author familiarized
MIT Thesis - Benjamin H. Lathrop Page 14 of49
himself with the organization.' 3 The author also spent this time in a floor leadership role ramping up the
Bolted Cabinet Pull Project, which is discussed in detail in Chapter 4.
Once stakeholder groups were identified, an initial round of interviews was held to collect information
about what mattered most to these groups. Exhibit 2 of the Appendix contains the interview protocol
used during this step. The purpose of these interviews was to develop a large list of values for each group
while at the same time trying to get a sense of which values were most important. This step could be
described as having a brainstorming objective with the goal of articulating the many hidden motivations
and priorities held by each stakeholder group. One setback occurred at this stage. It became apparent that
the union labor force would not be allowed to participate in the interviews. Raytheon and the union were
in the midst of contract negotiations and were sensitive to anything that might interfere with their
successful completion.
All in all, nine stakeholders were interviewed in this initial round during a one week period and valuable
insights were already gained. For example, various concerns along the lines of communication were
identified. One stakeholder felt that there were a "yo-yo of priorities" coming from the Metal Fabrication
group, suggesting either a lack of strategy anchoring the group's actions or a degree of ineffectiveness in
communication the strategy. Another stakeholder felt that it was difficult to "see the whole picture" in the
organization despite being in a leadership position. A lot of his understanding about the business
occurred from "hearing through the grapevine", i.e. taking part in informal conversations with colleagues
throughout the organization and then trying to make sense of the information. Two members of the In-
Service Radar group made similar comments about determining who their appropriate points-of-contact
were in the Metal Fabrication group. One senior member said that it took "tribal knowledge" to know
who to contact for which problems. Another employee with less experience in the group said that he was
"figuring it out along the way". Information gleamed from these interviews already hinted at some
changes that could improve organizational effectiveness.
The next step in developing Stakeholder Value Maps was the gathering of quantitative data around two
aspects of value: importance and delivery. Two approaches were taken at this point. The author first
tried to inquire about importance and delivery for every single value identified during the first round of
interviews. Since the list of values was two pages long (see Exhibit 3 in the Appendix), some
stakeholders found it difficult to differentiate amongst the multitude of listed values. In other cases, the
" For someone already situated in an organization, identifying the key project stakeholder groups should beconsiderably easier and should take very little time to complete.
MIT Thesis - Benjamin H. Lathrop Page 15 of49
stakeholders were either discouraged by the number of responses required of them or were simply too
busy to be bothered with what they deemed a tedious task of negligible personal benefit. A second
approach was adapted to mitigate these concerns. Values were aggregated down to a much more
manageable eleven categories of values (see Exhibit 4 in the Appendix). What was lost in data fidelity
was gained in ease of use. Stakeholders were now universally willing to fill out the data collection form.
The result was a list of values that were rated on a scale of 1-7 ("not important/delivered at all" to
"extremely important/delivered extremely well") for both Importance and Delivery. Importance is
defined as how important the value is to the stakeholder filling out the form. Delivery is defined as how
the stakeholder perceived the value was being delivered.
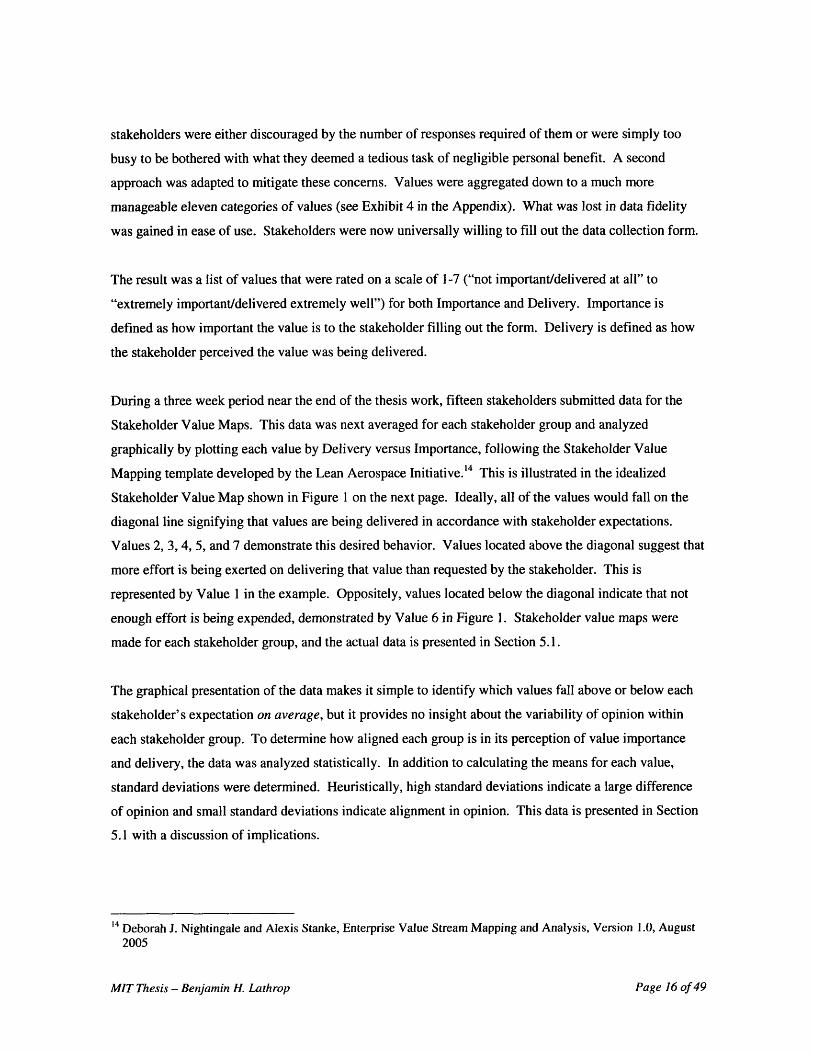
During a three week period near the end of the thesis work, fifteen stakeholders submitted data for the
Stakeholder Value Maps. This data was next averaged for each stakeholder group and analyzed
graphically by plotting each value by Delivery versus Importance, following the Stakeholder Value
Mapping template developed by the Lean Aerospace Initiative.' 4 This is illustrated in the idealized
Stakeholder Value Map shown in Figure 1 on the next page. Ideally, all of the values would fall on the
diagonal line signifying that values are being delivered in accordance with stakeholder expectations.
Values 2, 3, 4, 5, and 7 demonstrate this desired behavior. Values located above the diagonal suggest that
more effort is being exerted on delivering that value than requested by the stakeholder. This is
represented by Value 1 in the example. Oppositely, values located below the diagonal indicate that not
enough effort is being expended, demonstrated by Value 6 in Figure 1. Stakeholder value maps were
made for each stakeholder group, and the actual data is presented in Section 5.1.
The graphical presentation of the data makes it simple to identify which values fall above or below each
stakeholder' s expectation on average, but it provides no insight about the variability of opinion within
each stakeholder group. To determine how aligned each group is in its perception of value importance
and delivery, the data was analyzed statistically. In addition to calculating the means for each value,
standard deviations were determined. Heuristically, high standard deviations indicate a large difference
of opinion and small standard deviations indicate alignment in opinion. This data is presented in Section
5.1 with a discussion of implications.
14 Deborah J. Nightingale and Alexis Stanke, Enterprise Value Stream Mapping and Analysis, Version 1.0, August2005
MIT Thesis - Benjamin H. Lathrop Page 16 of 49
Stakeholder Value Map
0 1 2 3 4 5 6 7
Importance
Figure 1. Idealized Stakeholder Value Map
MIT Thesis - Benjamin H. Lathrop Page 17 of49
4 Case Study
This chapter illustrates one example of a lean implementation project at Raytheon's Integrated Air
Defense Center. The case describes the bolted cabinet pull system project from conception to
implementation.
4.1 Conception of Bolted Cabinet Pull System
As described in Section 3.1, value stream mapping was used to identify opportunities for improving the
bolted cabinet line. The team that analyzed the value stream noted several things:
* Metal Fabrication was not producing bolted cabinets within customer takt time, resulting in
delivery delays.
* Bolted cabinets were being built in batch production, driving work-in-process (WIP) levels
higher and increasing lead time and cycle time.
* Decisions about Metal Fabrication's production priorities were being driven by MRP-derived
plans instead of actual customer needs, leading some products to be severely delinquent while
others were produced ahead of schedule.
* Cycle times varied considerably due to quality issues and corresponding rework.
* Management oversight and engineering support costs were high due in part to the complexity
and instability of the manufacturing process. The immaturity of the process also likely
contributed to some of the early inefficiencies in the manufacturing system.
The factors listed above contributed to the bolted cabinet line running several million dollars over budget
when the author joined the Metal Fabrication group. Of the several continuous improvement projects that
were initiated to reduce process waste, this chapter focuses solely on the pull system project which the
author helped lead.
The vision for the project was to control bolted cabinet production such that new cabinets would only be
manufactured when customers consumed existing cabinets from finished goods inventory. Conceptually,
the pull system would cascade upstream from the customer all the way back to the raw material supplier.
As such, the project would cross two organizational boundaries, one internal boundary between the In-
MIT Thesis - Benjamin H. Lathrop Page 18 of 49
Service Radar (ISR) group and the Metal Fabrication group and one external boundary between Metal
Fabrication and its supplier of aluminum raw material.
Such a system would benefit the plant because the amount of work-in-process (WIP) and finished goods
inventory would be reduced and controlled. In addition, production scheduling would be much easier
using a pull system. With pull, responsibility for production scheduling is placed largely in the hands of
operators using simple run rules. Experts with deep functional knowledge of MRP systems, while still
important, would no longer need to focus so much of their time on day to day operations. Instead, they
would be freed to devote more of their energy to intermediate and long term production activities, such as
planning for new product introductions to the factory floor. Other benefits expected by the team were a
reduction in manufacturing support costs and a step-change improvement in on-time deliveries.
4.2 Bolted Cabinet Pull System Project Team
Two individuals, the author and an operations manager, were given responsibility from the Metal
Fabrication group manager to lead the pull system project. Besides the two project leaders, input on the
pull system design came from several sources. The lean office shared their knowledge of best practices
for pull systems and asked an outside consultant to review the design. Stakeholders from the In-Service
Radar group and the aluminum supplier were involved in the parts of the design that affected them
directly. Floor employees were asked to provide input and offer suggestions on how to improve the pull
plan. In summary, the general approach in formulating and implementing the pull system was to bring in
stakeholders and knowledge experts at different times during the process to influence the design.
After a month of primarily technical analysis, an initial design and implementation plan was completed
for the bolted cabinet pull system. The design is represented schematically in Figure 2 on the next page.
The drawing shows the material flow (from left to right) and the information flow (from right to left) for
producing bolted cabinets under the new plan. A portion of the implementation plan is shown in Exhibit
5 of the Appendix for illustrative purposes. The plan was organized by grouping all of the specific
activities required for each work cell. Team members were assigned to each task and agreed to a target
completion date. For example, four tasks were required of the driver cell during a two month period.
MIT Thesis - Benjamin H. Lathrop Page 19 of49
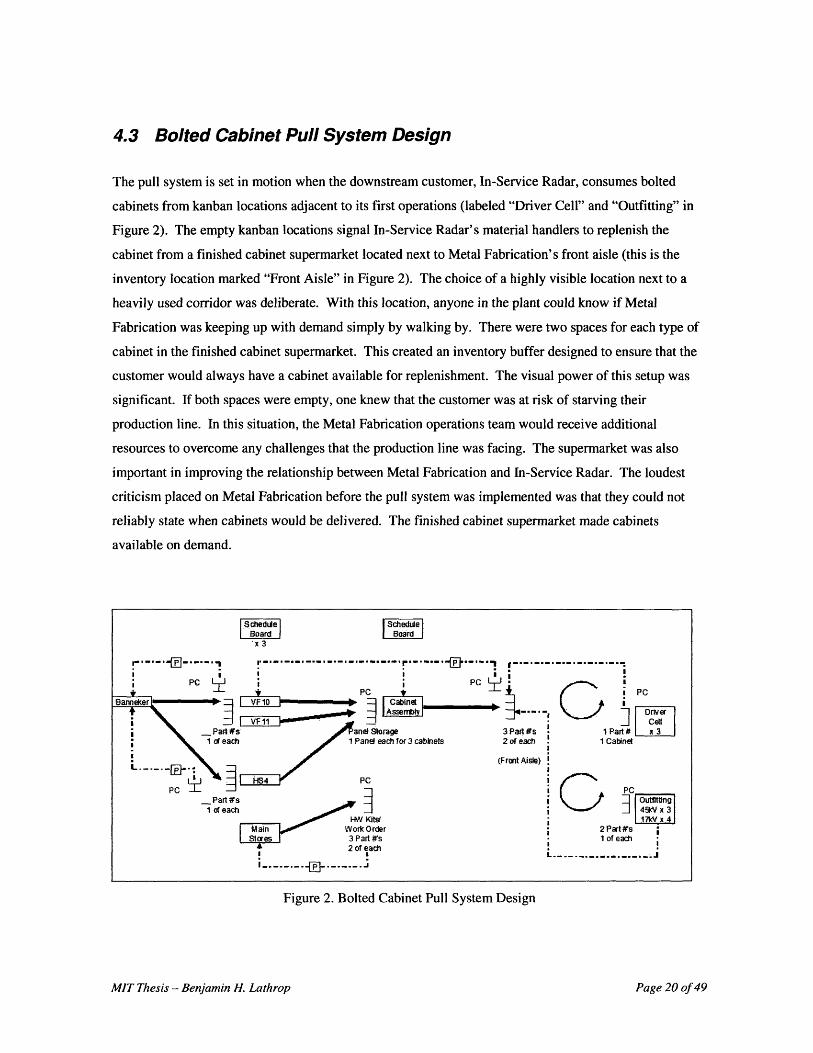
4.3 Bolted Cabinet Pull System Design
The pull system is set in motion when the downstream customer, In-Service Radar, consumes bolted
cabinets from kanban locations adjacent to its first operations (labeled "Driver Cell" and "Outfitting" in
Figure 2). The empty kanban locations signal In-Service Radar's material handlers to replenish the
cabinet from a finished cabinet supermarket located next to Metal Fabrication's front aisle (this is the
inventory location marked "Front Aisle" in Figure 2). The choice of a highly visible location next to a
heavily used corridor was deliberate. With this location, anyone in the plant could know if Metal
Fabrication was keeping up with demand simply by walking by. There were two spaces for each type of
cabinet in the finished cabinet supermarket. This created an inventory buffer designed to ensure that the
customer would always have a cabinet available for replenishment. The visual power of this setup was
significant. If both spaces were empty, one knew that the customer was at risk of starving their
production line. In this situation, the Metal Fabrication operations team would receive additional
resources to overcome any challenges that the production line was facing. The supermarket was also
important in improving the relationship between Metal Fabrication and In-Service Radar. The loudest
criticism placed on Metal Fabrication before the pull system was implemented was that they could not
reliably state when cabinets would be delivered. The finished cabinet supermarket made cabinets
available on demand.
Figure 2. Bolted Cabinet Pull System Design
MIT Thesis - Benjamin H. Lathrop Page 20 of 49
Continuing with the description of the pull system depicted in Figure 2, orders are sent to two upstream
locations to start production on a new cabinet when In-Service Radar withdraws a cabinet from the
finished cabinet supermarket. The first order is sent to Cabinet Assembly. This is where machined
aluminum panels and hardware are bolted together to form finished cabinets. Finished machined panels
are located adjacent to Cabinet Assembly for process control purposes. The inventory buffer is designed
to allow Cabinet Assembly to produce a cabinet within takt time even if the next upstream process is
experiencing process delays. The second location where an order is sent from the finished cabinet
supermarket is Panel Fabrication (marked by machine names "VFIO", "VFI 1", and "HS4" in Figure 2).
At Panel Fabrication, raw aluminum slabs are machined, drilled, chromated, painted, and stenciled to
produce the finished panels used in Cabinet Assembly. Since several panels are required to build one
cabinet, the three machines are used in a way that minimizes setup times when switching between panels.
The cycle time for making cabinet panels is also within takt time. The rationale for breaking cabinet
production into two work sequences now becomes clear. Under the current manufacturing process, it
would be impossible to build a finished cabinet from raw aluminum slabs within customer takt time. The
process needed to be broken in half to ensure cabinets could be replenished by the time the customer
needed it.
The last part of the pull design is the linkage between Metal Fabrication and the raw aluminum slab
supplier. Aluminum slabs are stored in kanban locations in close proximity to Panel Fabrication.
Working with the aluminum supplier (labeled "Banneker" in Figure 2), the slabs now arrive stacked on
pallets in the precise order in which they are processed. Replenishment of this raw material is made using
a pull system; an order is made for a pallet of aluminum slabs when the previous pallet is consumed.
4.4 Bolted Cabinet Pull System Implementation
As mentioned in Section 4.2, the pull system design took approximately one month to complete through
the part-time effort of the author and the operations manager. If the project had been the full-time focus
of the team, it is plausible that the design could have been completed in a week or less. This section
describes the factors that impacted project implementations in the Metal Fabrication Group in general and
then talks about the factors that were specific to the pull project.
To put everything in context, Metal Fabrication was a busy and in some ways unstable place in 2005.
Section 2.5 discussed how the Bolted Cabinet value stream was going through a major transformation to
MIT Thesis - Benjamin H. Lathrop Page 21 of49
remove waste. More than twenty continuous improvement projects had been initiated to improve the line.
It was not unusual for an individual to be on two to six project teams in addition to working their normal
responsibilities. For this reason alone, progress on projects was in general slow. But there were several
other reasons why progress on projects was measured during this period. Unexpected manufacturing
problems would invariably arise and deservedly take the focus of employees until the problems were
resolved. Also, management focus on the Bolted Cabinet improvement projects, at first quite strong,
became weaker as the line improved and other parts of the plant experienced bigger problems. With less
management push, many employees focused on their more immediate daily deliverables and
responsibilities. Finally, coordinating twenty continuous improvement projects was difficult to achieve.
Different teams working on projects targeting the same work cell would plan changes that were
inconsistent with one another. For example, one team was assigned to reduce the amount of
manufacturing floor space needed for the group. They planned to sell and move equipment to save floor
space. Another team, working to improve product flow within the plant, was planning to move the same
equipment to different locations. The result was frustration and additional planning for both parties.
While the intentions were good, the logic for implementing the various improvement projects was poor.
A strategy that sequenced the projects in time, one project building on another, would have been more
appropriate. The benefits of such an approach would have been better employee focus and more
efficiency as projects would not have to compete for scarce resources or have the potential to undercut
one another.
Progress in implementing the pull system was slowed for many of the reasons described above, but there
were additional reasons specific to the project. One, which is described in detail in the next section, was
management discomfort with the plan once some of the project implications became clear. The other
reason was that one of the key employees driving the project, the operations manager, was temporarily
reassigned on a special project midway through project execution. For these reasons, the project was not
fully implemented by the time the author finished his six and a half month internship. The two kanban
systems linking In-Service Radar and the raw aluminum supplier with Metal Fabrication were fully
functioning, but the pull infrastructure within Metal Fabrication was never put into action.
4.5 Drive for Improved Short-Term Financial Performance
As mentioned in the previous section, a manager overseeing Metal Fabrication became uncomfortable
with the pull project once he understood one of its implications. Using the pull system, production of
MIT Thesis - Benjamin H. Lathrop Page 22 of 49
finished cabinets would be regulated by the demand of the next downstream organization, namely In-
Service Radar. This represented a direct conflict with the manager's plan to accelerate cabinet production
ahead of schedule. By doing this, the manager aimed to improve Metal Fabrication's financial
performance in two ways. First, producing more cabinets in a certain length of time reduces per-cabinet
costs by spreading the fixed costs (mainly engineering support in this case) among more cabinets.
Second, contractual terms allowed Metal Fabrication to get paid for cabinets as soon as they were
completed. Since the Bolted Cabinet line was over budget by several million dollars, any initiative with
the potential to close this gap significantly and quickly was very appealing to management. Whereas the
pull system had the potential to improve performance in the long term, management incentives were
primarily directed at short-term goals. A general description of one such incentive follows to demonstrate
this point.
Estimate at Completion (EAC) is a term expressing how much money is expected to be spent at the
completion of a contract. Recently, accurate EACs have become more important due to Sarbanes Oxley
rules that emphasize proper disclosures and compliance procedures. At Raytheon, program managers are
now evaluated on how well they meet or exceed program EACs. As reported by a senior manager,
"Incentives are very strong for being under EAC - you never want to be over EAC!" Generally speaking,
directors have performance goals to be below EAC by specific amounts. In this way, if a program
exceeds EAC, significant pressure is placed on the organization to improve short-term financial
performance even at the expense of long-term cost reduction initiatives. On the other hand, the
organization is much more willing to invest in long-term improvement projects if a program is on track to
meet its EAC goals. In this case, managers realize that they will need to improve current processes to
meet future EAC goals.
Because of the Bolted Cabinet line's performance, the manager overseeing Metal Fabrication would not
allow the pull project to proceed fully. Only the parts of the plan that did not impact production were
implemented, namely the interfaces with In-Service Radar and the raw aluminum supplier. Instead, a new
plan was introduced to produce six cabinets each month. Table I contrasts the accelerated schedule to the
production expected for one year using the pull system. During this one year period, the accelerated plan
would result in 19 additional cabinets being constructed.
MIT Thesis - Benjamin H. Lathrop Page 23 of49
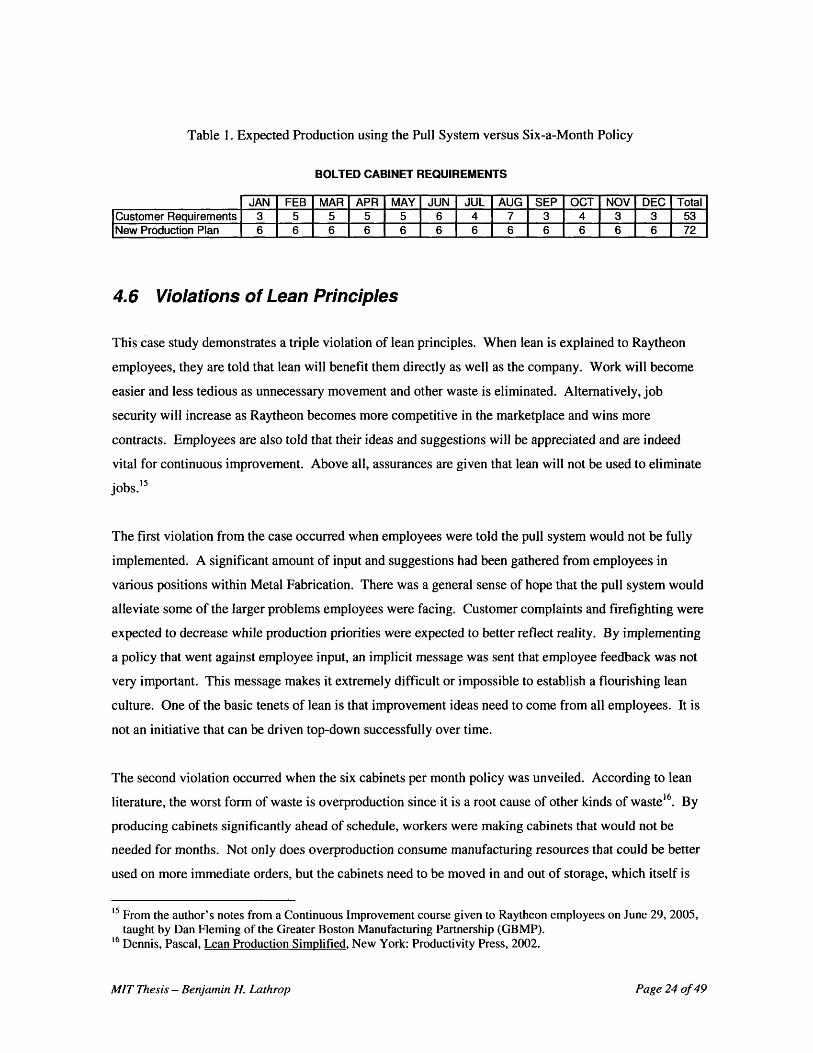
Table 1. Expected Production using the Pull System versus Six-a-Month Policy
BOLTED CABINET REQUIREMENTS
JAN FEB MAR APR MAY JUN JUL AUG SEP OCT NOV DEC T otalCustomer Requirements 3 5 5 5 5 6 4 7 3 4 3 3 53New Production Plan 6 6 6 6 6 6 6 6 6 6 6 6 72
4.6 Violations of Lean Principles
This case study demonstrates a triple violation of lean principles. When lean is explained to Raytheon
employees, they are told that lean will benefit them directly as well as the company. Work will become
easier and less tedious as unnecessary movement and other waste is eliminated. Alternatively, job
security will increase as Raytheon becomes more competitive in the marketplace and wins more
contracts. Employees are also told that their ideas and suggestions will be appreciated and are indeed
vital for continuous improvement. Above all, assurances are given that lean will not be used to eliminate
jobs."
The first violation from the case occurred when employees were told the pull system would not be fully
implemented. A significant amount of input and suggestions had been gathered from employees in
various positions within Metal Fabrication. There was a general sense of hope that the pull system would
alleviate some of the larger problems employees were facing. Customer complaints and firefighting were
expected to decrease while production priorities were expected to better reflect reality. By implementing
a policy that went against employee input, an implicit message was sent that employee feedback was not
very important. This message makes it extremely difficult or impossible to establish a flourishing lean
culture. One of the basic tenets of lean is that improvement ideas need to come from all employees. It is
not an initiative that can be driven top-down successfully over time.
The second violation occurred when the six cabinets per month policy was unveiled. According to lean
literature, the worst form of waste is overproduction since it is a root cause of other kinds of waste 6. By
producing cabinets significantly ahead of schedule, workers were making cabinets that would not be
needed for months. Not only does overproduction consume manufacturing resources that could be better
used on more immediate orders, but the cabinets need to be moved in and out of storage, which itself is
15 From the author's notes from a Continuous Improvement course given to Raytheon employees on June 29, 2005,taught by Dan Fleming of the Greater Boston Manufacturing Partnership (GBMP).
16 Dennis, Pascal, Lean Production Simplified, New York: Productivity Press, 2002.
MIT Thesis - Benjamin H. Lathrop Page 24 of49
costly. Transportation and storage also increases the opportunities for damaging the product.
Furthermore, it delays detection of defects that might only be found by the customer. The quicker defects
are identified, the easier it is to determine the root cause of the problem and the fewer products with
similar defects will have been built. On top of all this, employees were working costly overtime to build
cabinets that would not be needed for months.
Whereas the second violation discusses potential types of physical waste generated by the six cabinets per
month policy, the third violation concerns the human impact of the plan. By asking to build six cabinets a
month, employees were being stretched to their limits. It was clearly unacceptable to build less than the
six cabinet target, so employees would do everything in their means to complete cabinets by the end of
the month. At the same time, Metal Fabrication had to satisfy other customer commitments. This became
increasingly difficult as resources were diverted to the Bolted Cabinet line. The result was that employee
stress and effort increased significantly. With a large scale lean initiative being undertaken at the same
time, employees were observing that they were working harder (and not smarter) whereas they had been
told that lean would make work easier (or more efficient).
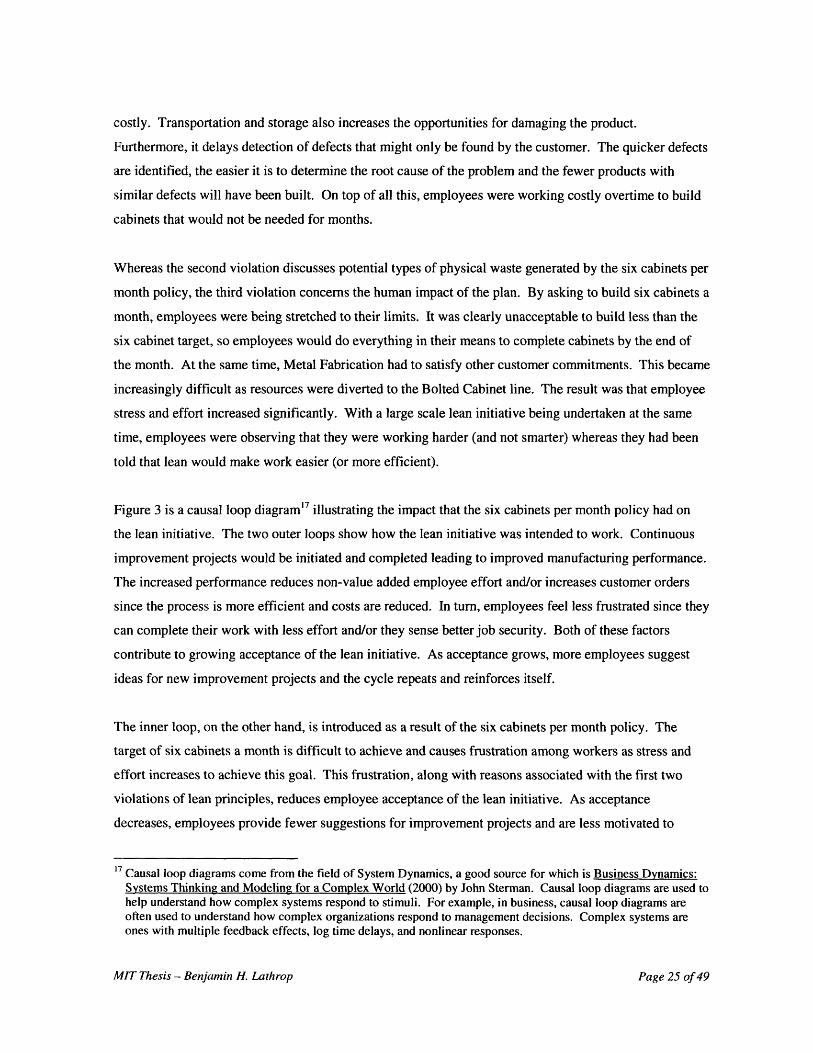
Figure 3 is a causal loop diagram'7 illustrating the impact that the six cabinets per month policy had on
the lean initiative. The two outer loops show how the lean initiative was intended to work. Continuous
improvement projects would be initiated and completed leading to improved manufacturing performance.
The increased performance reduces non-value added employee effort and/or increases customer orders
since the process is more efficient and costs are reduced. In turn, employees feel less frustrated since they
can complete their work with less effort and/or they sense better job security. Both of these factors
contribute to growing acceptance of the lean initiative. As acceptance grows, more employees suggest
ideas for new improvement projects and the cycle repeats and reinforces itself.
The inner loop, on the other hand, is introduced as a result of the six cabinets per month policy. The
target of six cabinets a month is difficult to achieve and causes frustration among workers as stress and
effort increases to achieve this goal. This frustration, along with reasons associated with the first two
violations of lean principles, reduces employee acceptance of the lean initiative. As acceptance
decreases, employees provide fewer suggestions for improvement projects and are less motivated to
17 Causal loop diagrams come from the field of System Dynamics, a good source for which is Business Dynamics:Systems Thinking and Modeling for a Complex World (2000) by John Sterman. Causal loop diagrams are used tohelp understand how complex systems respond to stimuli. For example, in business, causal loop diagrams areoften used to understand how complex organizations respond to management decisions. Complex systems areones with multiple feedback effects, log time delays, and nonlinear responses.
MIT Thesis - Benjamin H. Lathrop Page 25 of49
participate in waste reducing activities. Improvements to the manufacturing system become few and far
between. As employees see less impact from the lean initiative, they become even less willing to
participate. Eventually, a status quo is reached with changes driven only occasionally from the top-down.
Figure 3. Causal Loop Diagram Illustrating the Violation of Lean Principles' 8
4.7 Bolted Cabinet Pull System Results
Despite not being fully implemented, work associated with the pull system did yield tangible results. The
most significant benefits were associated with the linkages between Metal Fabrication and In-Service
Radar and between Metal Fabrication and its raw material supplier. Fully functioning pull systems were
established at both of these interfaces. On the raw material side, pallets were now received with
18 To interpret the diagram, the arrows indicate causal linkages and the plus and minus signs indicate whether thelinkage is positive or negative. For example, the box called "New production goals, which go beyond CustomerRequirements, set to fill manufacturing capability" is linked negatively to "Employee frustration reduced". Thisindicates that if the new production goals are set, then employee frustration will increase (because of the negativelinkage); alternatively, if the new production goals are eliminated, then employee frustration will decrease.
MIT Thesis - Benjamin H. Lathrop Page 26 of49
aluminum slabs stacked in the precise order in which they would be processed. Indeed, one piece flow
was implemented as a direct result of the pull system. Before, pallets of aluminum would come stacked
by SKU number and the same SKU would be processed in batches. Raw material and WIP inventories
were therefore higher under the old manufacturing system. Also, machining problems tended to impact
several pieces at a time under the old system because the problems would not be identified until after
entire batches were processed. With one piece flow, problems would be identified much sooner and the
consequences were smaller, typically being rework or scrapping of only one item. When asked how the
raw material pull system was working, Ed Driscoll, Machine Shop Operations Leader, said, "It's
fantastic! We're going to do the same thing in our other machining cell".19
At the interface between Metal Fabrication and In-Service Radar, the pull system helped to improve
customer satisfaction in several ways. The finished goods inventory improved service levels
dramatically. Before the inventory buffer was created, Metal Fabrication was constantly missing its
commitments for cabinet deliveries. Even worse, trust between the two groups had largely evaporated
because Metal Fabrication could not accurately forecast when cabinets would be delivered. Delivery
dates would often be updated three to four times as previously predicted delivery dates passed. As one
In-Service Radar manager explained before the pull system was implemented, "There is no confidence in
metal fab [fabrication] that they can meet commitments." Improvements in the stability of the
manufacturing process combined with the establishment of a finished goods inventory worked in tandem
to achieve 100% on-time cabinet deliveries after the finished goods supermarket was established and
stocked. A new program manager who worked in In-Service Radar in the past for many years was
"absolutely dumbfounded to learn that the Fab [metal fabrication] area has cabinets standing tall waiting
to be pulled by ISR. He lived for years always waiting for the cabinet to arrive."20
19 Field notes from November 22, 2005.20 Excerpt from email message by Roger Hinman to Ben Lathrop on May 8, 2006.
MIT Thesis - Benjamin H. Lathrop Page 27 of49
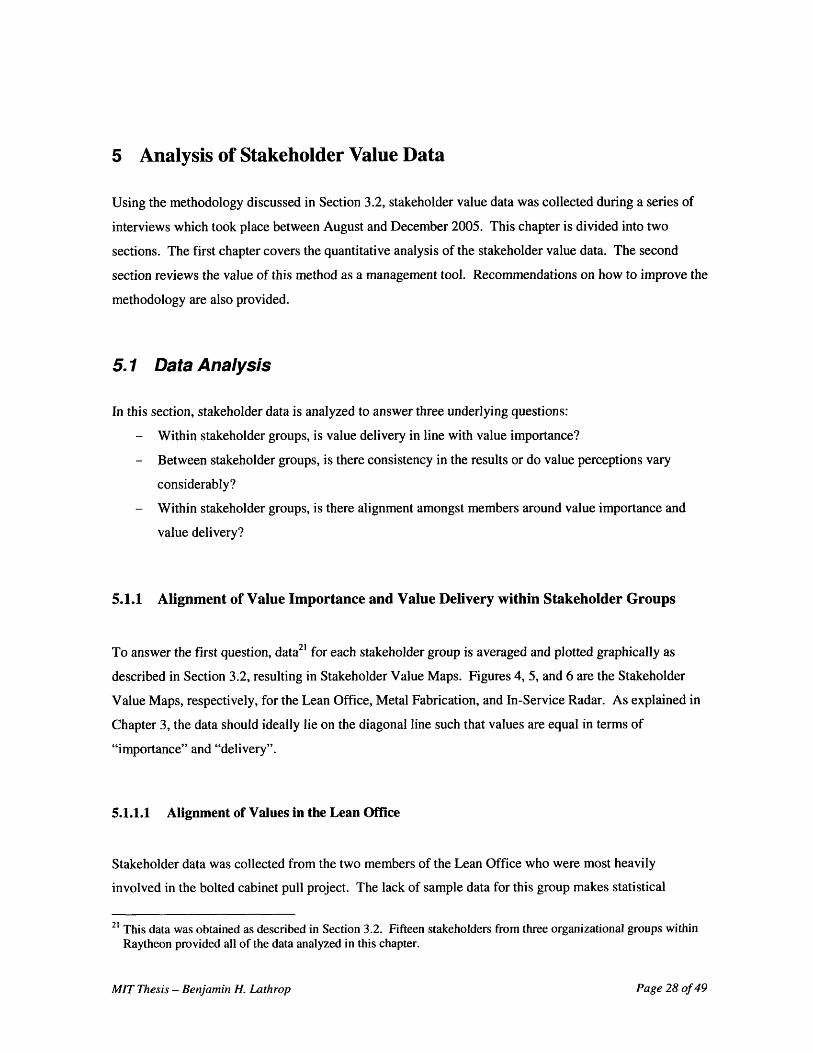
5 Analysis of Stakeholder Value Data
Using the methodology discussed in Section 3.2, stakeholder value data was collected during a series of
interviews which took place between August and December 2005. This chapter is divided into two
sections. The first chapter covers the quantitative analysis of the stakeholder value data. The second
section reviews the value of this method as a management tool. Recommendations on how to improve the
methodology are also provided.
5.1 Data Analysis
In this section, stakeholder data is analyzed to answer three underlying questions:
- Within stakeholder groups, is value delivery in line with value importance?
- Between stakeholder groups, is there consistency in the results or do value perceptions vary
considerably?
- Within stakeholder groups, is there alignment amongst members around value importance and
value delivery?
5.1.1 Alignment of Value Importance and Value Delivery within Stakeholder Groups
To answer the first question, data 21 for each stakeholder group is averaged and plotted graphically as
described in Section 3.2, resulting in Stakeholder Value Maps. Figures 4, 5, and 6 are the Stakeholder
Value Maps, respectively, for the Lean Office, Metal Fabrication, and In-Service Radar. As explained in
Chapter 3, the data should ideally lie on the diagonal line such that values are equal in terms of
"importance" and "delivery".
5.1.1.1 Alignment of Values in the Lean Office
Stakeholder data was collected from the two members of the Lean Office who were most heavily
involved in the bolted cabinet pull project. The lack of sample data for this group makes statistical
21 This data was obtained as described in Section 3.2. Fifteen stakeholders from three organizational groups withinRaytheon provided all of the data analyzed in this chapter.
MIT Thesis - Benjamin H. Lathrop Page 28 of 49
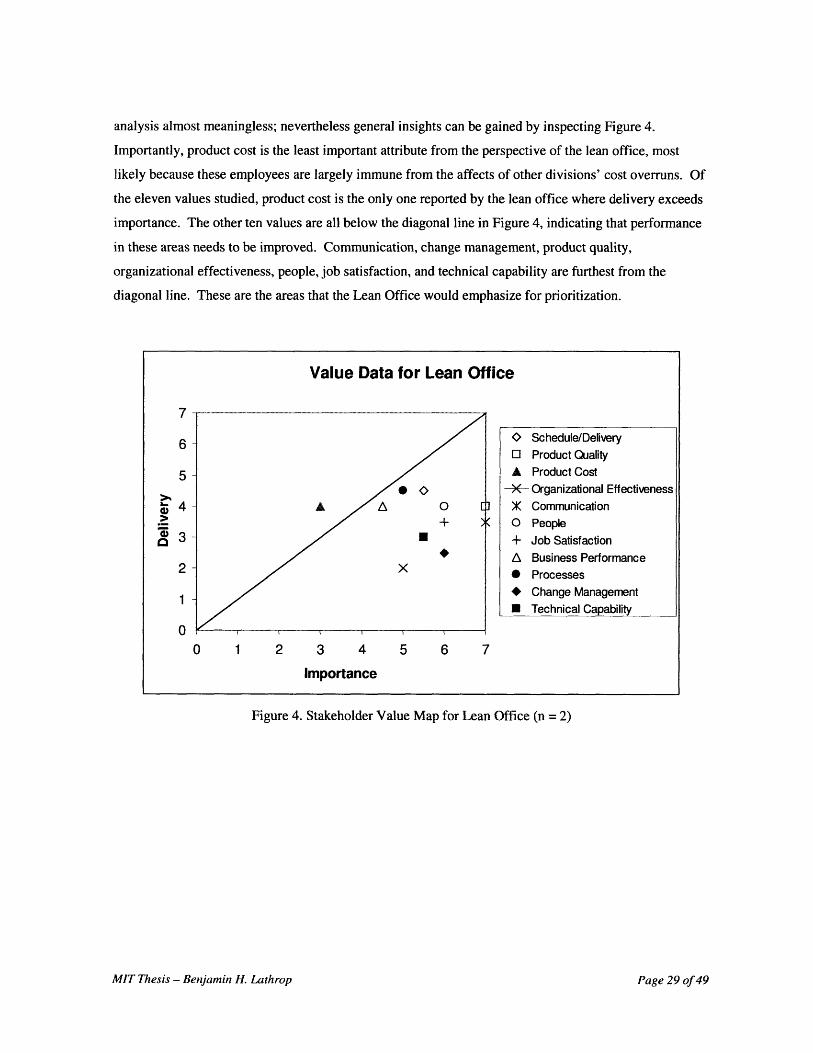
analysis almost meaningless; nevertheless general insights can be gained by inspecting Figure 4.
Importantly, product cost is the least important attribute from the perspective of the lean office, most
likely because these employees are largely immune from the affects of other divisions' cost overruns. Of
the eleven values studied, product cost is the only one reported by the lean office where delivery exceeds
importance. The other ten values are all below the diagonal line in Figure 4, indicating that performance
in these areas needs to be improved. Communication, change management, product quality,
organizational effectiveness, people, job satisfaction, and technical capability are furthest from the
diagonal line. These are the areas that the Lean Office would emphasize for prioritization.
Value Data for Lean Office
6
5
4
3
2
1
00 1 2 3 4 5 6 7
Importance
O Schedule/DeliveryO Product QualityA Product Cost
-X- Organizational Effectiveness)K CommunicationO People+ Job SatisfactionA Business Performance* Processes* Change ManagementI Technical Capability
Figure 4. Stakeholder Value Map for Lean Office (n = 2)
MIT Thesis - Benjamin H. Lathrop Page 29 of 49
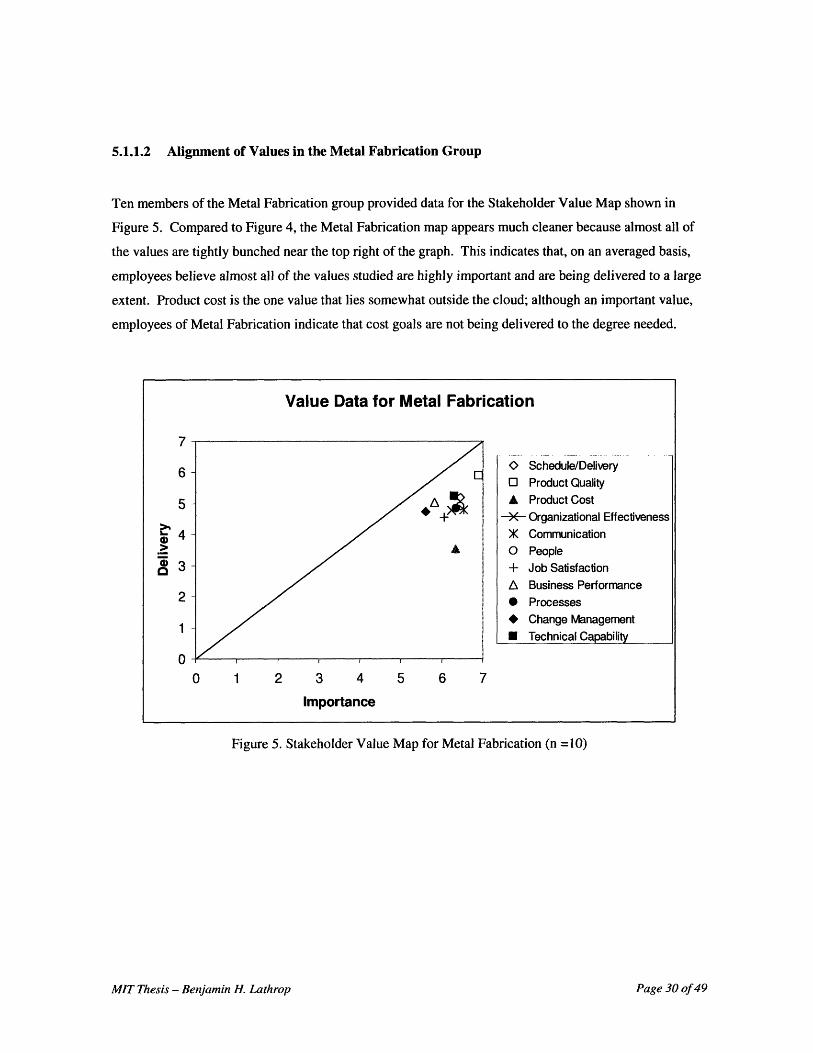
5.1.1.2 Alignment of Values in the Metal Fabrication Group
Ten members of the Metal Fabrication group provided data for the Stakeholder Value Map shown in
Figure 5. Compared to Figure 4, the Metal Fabrication map appears much cleaner because almost all of
the values are tightly bunched near the top right of the graph. This indicates that, on an averaged basis,
employees believe almost all of the values studied are highly important and are being delivered to a large
extent. Product cost is the one value that lies somewhat outside the cloud; although an important value,
employees of Metal Fabrication indicate that cost goals are not being delivered to the degree needed.
Value Data for Metal Fabrication
f
6
5
4
3
2
1
00 1 2 3 4 5 6 7
Importance
O Schedule/DeliveryO Product QualityA Product Cost
-X-- Organizational Effectiveness) CommunicationO People+ Job SatisfactionA Business Performance* Processes* Change Management* Technical Capability
Figure 5. Stakeholder Value Map for Metal Fabrication (n =10)
MIT Thesis - Benjamin H. Lathrop Page 30 of49
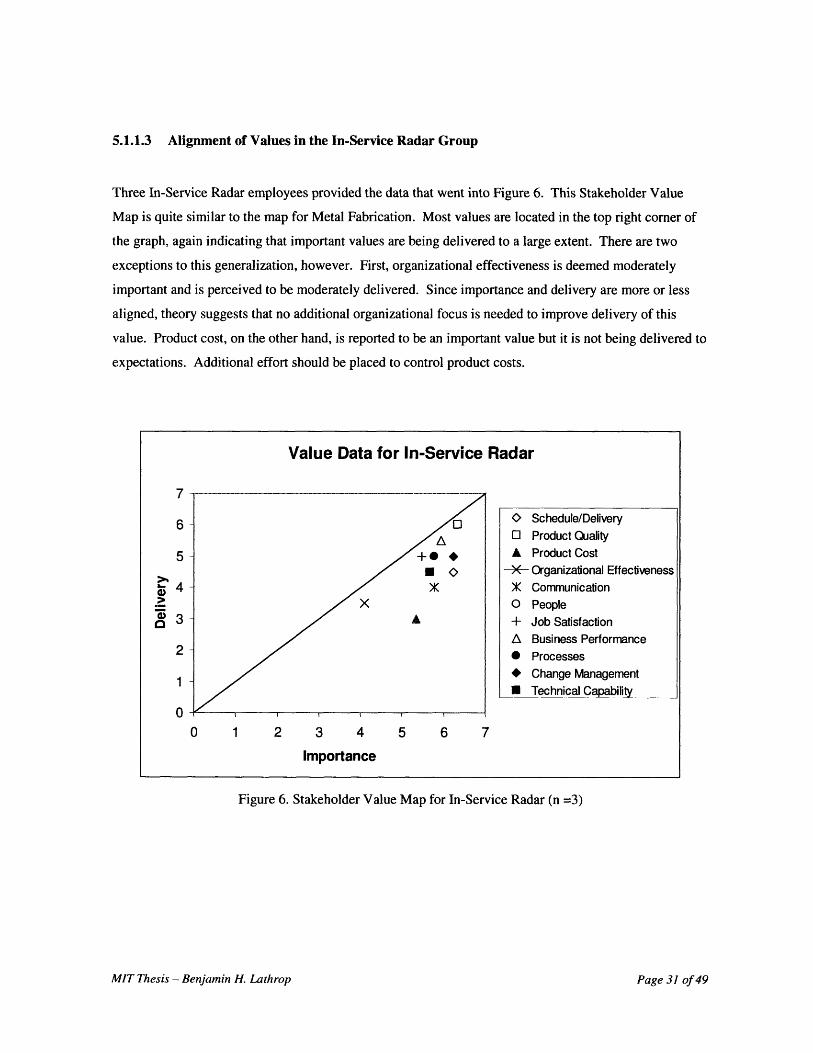
5.1.1.3 Alignment of Values in the In-Service Radar Group
Three In-Service Radar employees provided the data that went into Figure 6. This Stakeholder Value
Map is quite similar to the map for Metal Fabrication. Most values are located in the top right corner of
the graph, again indicating that important values are being delivered to a large extent. There are two
exceptions to this generalization, however. First, organizational effectiveness is deemed moderately
important and is perceived to be moderately delivered. Since importance and delivery are more or less
aligned, theory suggests that no additional organizational focus is needed to improve delivery of this
value. Product cost, on the other hand, is reported to be an important value but it is not being delivered to
expectations. Additional effort should be placed to control product costs.
Value Data for In-Service Radar
(
6
5
432
1
00 1 2 3 4 5 6 7
Importance
0 Schedule/DeliveryO Product QualityA Product Cost
-X- Organizational EffectivenessX CommunicationO People+ Job SatisfactionA Business Performance* Processes* Change ManagementN Technical Capability
Figure 6. Stakeholder Value Map for In-Service Radar (n =3)
MIT Thesis - Benjamin H. Lathrop Page 31 of49
5.1.2 Consistency of Value Maps between Stakeholder Groups
To answer the second question, Figures 4, 5, and 6 above are compared with one another. It becomes
immediately apparent that the Lean Office map is significantly different than those of Metal Fabrication
and In-Service Radar. Metal Fabrication and In-Service Radar, on the other hand, have relatively similar
value maps. Physical proximity could be a partial explanation to this finding. Metal Fabrication and In-
Service Radar are located about 100 feet apart, whereas the Lean Office is much more distant. Physical
proximity could facilitate informal communications between members of the two groups that could
contribute to value alignment. Organizational proximity is another potential explanation for why Metal
Fabrication and In-Service Radar share similar value perceptions while the Lean Office differs
significantly. In-Service Radar is Metal Fabrication's direct customer, and both groups are evaluated
primarily on operational metrics. Similar metrics imply similar goals and value prioritizations. Also, the
client-customer relationship entails formal communications where goals and values are agreed to. The
Lean Office, on the other hand, is not evaluated on traditional operational metrics. Lean Office personnel
often have different incentives than the groups they advise. Closing the incentives gap may be the key to
closing the gap in stakeholder values.
5.1.3 Alignment of Value Importance and Value Delivery amongst Stakeholder Members
The stakeholder value maps above make it simple to identify which values fall above or below each
stakeholder's expectations on average, but it provides no insight about the variability of opinion within
each stakeholder group. To determine how aligned each group is in its perception of value importance
and delivery, the data was analyzed by calculating standard deviations for each stakeholder group.
Heuristically, high standard deviations indicate a large difference of opinion, and small standard
deviations indicate alignment in opinion. Using this approach, we are able to answer the third question
posed at the beginning of this section.
Table 2 is a summary of standard deviations for each stakeholder group. Using an arbitrary cutoff point,
standard deviations above 1.5 are highlighted to make it easier to detect trends. In general, one sees that
there is more uncertainty in "Delivery" than "Importance". If this is indeed the case, it suggests that
priorities are communicated adequately to the group but feedback on performance is lacking. For areas
that have a high standard deviation in "Importance", a possible explanation is that the importance of that
MIT Thesis - Benjamin H. Lathrop Page 32 of49
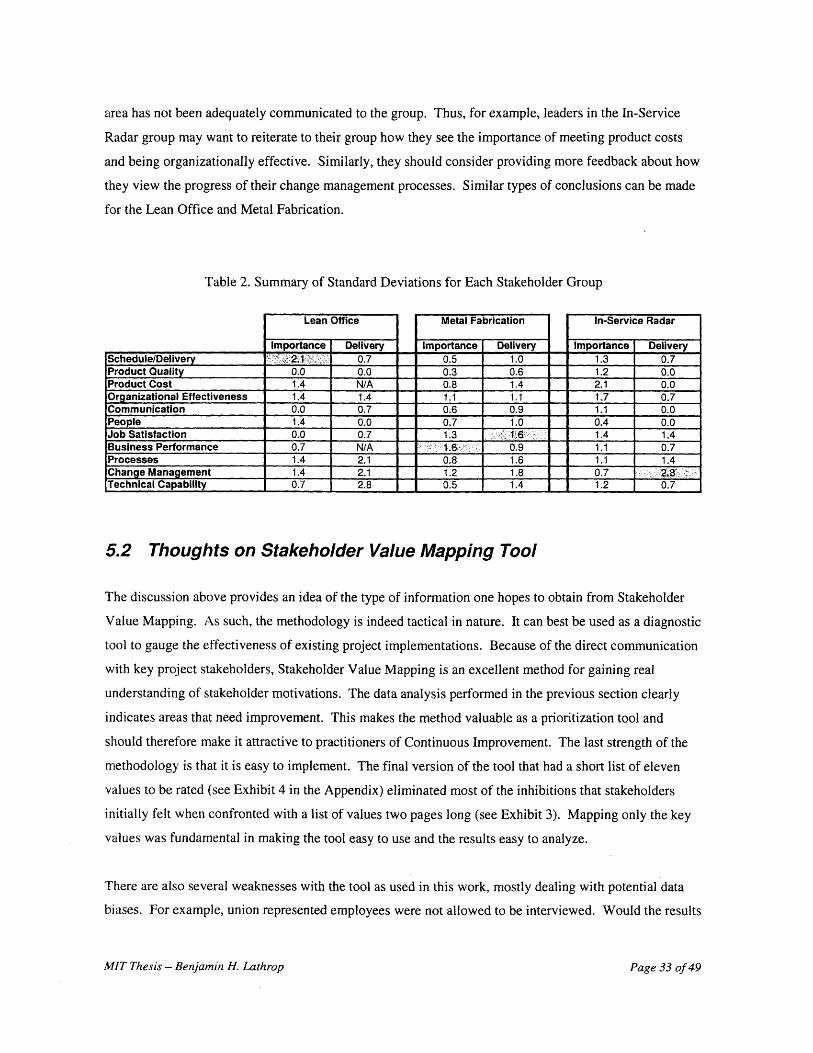
area has not been adequately communicated to the group. Thus, for example, leaders in the In-Service
Radar group may want to reiterate to their group how they see the importance of meeting product costs
and being organizationally effective. Similarly, they should consider providing more feedback about how
they view the progress of their change management processes. Similar types of conclusions can be made
for the Lean Office and Metal Fabrication.
Table 2. Summary of Standard Deviations for Each Stakeholder Group
Schedule/DeliveryProduct QualityProduct CostOrganizational EffectivenessCommunicationPeopleJob SatisfactionBusiness PerformanceProcesses
Change ManagementTechnical Capability
Lean Office
Importance Delivery2.1 0.70.0 0.01.4 N/A1.4 1.40.0 0.71.4 0.00.0 0.70.7 N/A1.4 2.11.4 2.10.7 2.8
Metal Fabrication
Importance Delivery0.5 1.00.3 0.60.8 1.41.1 1.10.6 0.90.7 1.01.3 16: ,.6 0.90.8 1.61.2 1.80.5 1.4
In-Service Radar
Importance Delivery1.3 0.71.2 0.02-.1 0.01.7 0.71.1 0.00.4 0.01.4 1.41.1 0.71.1 1.40.7 _ 821.2 0.7
5.2 Thoughts on Stakeholder Value Mapping Tool
The discussion above provides an idea of the type of information one hopes to obtain from Stakeholder
Value Mapping. As such, the methodology is indeed tactical in nature. It can best be used as a diagnostic
tool to gauge the effectiveness of existing project implementations. Because of the direct communication
with key project stakeholders, Stakeholder Value Mapping is an excellent method for gaining real
understanding of stakeholder motivations. The data analysis performed in the previous section clearly
indicates areas that need improvement. This makes the method valuable as a prioritization tool and
should therefore make it attractive to practitioners of Continuous Improvement. The last strength of the
methodology is that it is easy to implement. The final version of the tool that had a short list of eleven
values to be rated (see Exhibit 4 in the Appendix) eliminated most of the inhibitions that stakeholders
initially felt when confronted with a list of values two pages long (see Exhibit 3). Mapping only the key
values was fundamental in making the tool easy to use and the results easy to analyze.
There are also several weaknesses with the tool as used in this work, mostly dealing with potential data
biases. For example, union represented employees were not allowed to be interviewed. Would the results
MIT Thesis - Benjamin H. Lathrop Page 33 of 49
have changed if this key stakeholder group had been included? Another indication that data bias may
have existed is that most of the values were deemed highly important by the Metal Fabrication and In-
Service Radar groups. Is this a true reflection of these stakeholders' value perceptions, or were these
groups somehow biased toward indicating that all values were important? Another bias problem has to do
with sample size. Only two and three individuals were interviewed from the Lean Office and In-Service
Radar group, respectively. Any sort of meaningful statistical analysis is impossible with such a small
sample size. Also, stakeholders used different rating techniques when filling out the survey. Some
people used significant digits to refine their ratings whereas others used either whole number or half
number increments. In addition, the timing of the interviews varied during a three week period, possibly
impacting the results. Last, the list of values may have been incomplete. There could very well have
been other important dimensions not captured in the list of values examined.
Other issues exist dealing with the practical implementation aspects of the methodology. It has already
been stated that stakeholders resisted being interviewed when they were asked to rate very specific values.
There is a problem, though, when stakeholders are asked to rate a short list of general values (e.g.
organizational effectiveness). The difficulty arises because different stakeholders understand the values
differently. A shorter list enables the methodology to be implemented because surveys take less time and
stakeholder participation increases, but the results become more obscure.
A second practical issue is: Who is the ideal person to use the tool? As an outsider working inside the
organization, the author was able to survey stakeholders without them bearing much risk. The situation
could be much different if a company insider used the tool. Imagine, for example, if the manager
overseeing Metal Fabrication interviewed his direct reports to collect data for the tool. Respondents
would likely be more cautious in responding to any question that the manager might interpret as personal
criticism. Other candidates for using the tool are members of the front-line workforce. One immediate
benefit would be front-line workers' more active engagement in Continuous Improvement than has
happened in the past, a necessary element for lean to succeed. Front-line workers would also be quite
familiar with many of the key stakeholders, although they might not have the same system-wide view as
someone in a management role. Perhaps the most effective arrangement would be a manager and a front-
line employee in each area working together to collect the stakeholder data.
MIT Thesis - Benjamin H. Lathrop Page 34 of49
6 Organization and Change
This section evaluates the organization using the Three Lenses framework.22 The emphasis of this section
is on evaluating those parts of the organization that most affected the implementation of the pull project.
By complementing the analysis using the Three Lenses framework with the results of Stakeholder Value
Mapping (VSM), one is able to achieve greater insight into the organization as it currently stands and how
it might be.
6.1 Strategic Perspective
As a company, Raytheon states its strategy with the following four points23:
* Grow our position in core defense markets through a focus on key strategic pursuits, Mission
Support, technology and Mission Assurance.
* Use the Strategic Business Areas to leverage domain knowledge of core defense markets
across the company to achieve growth and to expand our Mission Systems Integration
opportunities.
* Establish the Beechcraft@ and Hawker@ brands as the industry standard for quality, service
and support.
* Be a Customer Focused company based on:
- Performance - Promises made, promises kept.
- Relationships - Listen, anticipate, respond and follow through with our customers,
partners and each other.
- Solutions - Develop and provide superior customer solutions.
At the work cell level, company strategy did not seem to guide employee actions. Some IADC
employees would likely be unaware that Beechcraft@ and Hawker@ are Raytheon brands and would be
hard pressed to explain how they could contribute to making them the industry standard. Of the four
points composing company strategy, the two elements that were most frequently communicated at the
IADC were Mission Assurance and being a Customer Focused company. Mission Assurance essentially
means making sure that Raytheon products work as designed every time they are used. The phrase "No
Doubt" is almost always used in conjunction with Mission Assurance, implying that the "war-fighter"
22 Carroll, John S. "Introduction to Organization Analysis: the Three Lenses"23 The four bullet points are taken directly from Raytheon's website: http://www.raytheon.com/about/vsgv/
MIT Thesis - Benjamin H. Lathrop Page 35 of49
(i.e. customer) has total confidence that the Raytheon systems they use will work each and every time
they are needed. Being a Customer Focused company was interpreted by many IADC employees as
providing three things: on-time delivery, low cost products, and perfect quality. All three of these goals
seemed to have equal weight with employees, although some would argue that quality was most
important, followed by both cost and service.
Strategic initiatives targeting lower levels of the organization existed as well, although the lower one went
organizationally, the more tacit the strategy would be. At the IADC, the main strategies were a reiteration
of Mission Assurance and the implementation of a lean initiative where the goal was to reduce waste and
otherwise make processes more efficient. Stakeholder Value Mapping (SVM) showed that group level
strategies were not always communicated effectively (see Section 5.1.3), supporting the idea that
strategies somehow became more blurred the lower one went into the organization.
The bolted cabinet pull project was well aligned with both corporate level and IADC goals. The project
aimed to improve on-time delivery of cabinets and lower their costs. In addition, communication with
key stakeholders throughout the project to get buy-in instead of "pushing" the project was an intentional
project strategy; this was in line with strategies around Relationships and lean.
Organizationally, Raytheon is first broken down into Business Units and then Business Areas (or
"Mission Centers"), which tend to be the names of specific plants. For example, the Andover plant is the
Integrated Air Defense Center (IADC). It was harder to understand the exact structure of the organization
at the lower levels. Since no up-to-date organization charts existed for the IADC during the internship24,
the following understanding of the organizational structure was constructed through employee interviews.
Within each Mission Center are Directorates, or collections of work groups that are run by Directors.
Directors may oversee work groups that are closely related to each other, but this is not always the case.
The main purpose of Directorates seems to be to divide Mission Centers into more manageable groupings.
Below Directorates are Centers of Excellence (COE) and Programs. Metal Fabrication, for example, is a
COE that specializes in metal processes. Similarly, AEGIS is the Program that uses bolted cabinets; the
program is essentially designed to manage and fulfill obligations associated with a particular contract.
COEs and Programs are composed of work cells, teams, and individual contributors. Besides the building
blocks described above, there are support functions such as manufacturing engineering, integrated supply
up-to-aate organizaton cnarts exlstea ror me corporate ana aivisional leaaersnmp teams out lad not extena aownto the group level. Frequent organizational changes and leadership moves made it difficult to maintain updatedcharts.
MIT Thesis - Benjamin H. Lathrop
~T~_ L_ ~_I_ _~~__~~f__rl_ ~ _1__.~_ _~·~.L_~ C_.~ rL.~ ___~~_~~_L_ _~_~ ~f~~·_I_~~_ll__ ~_~~_I~I_ r__~~~_ L~~r ~·_I ~__I _~~~_~_~ ~_~~.i
Page 36 of49
chain, and finance. Raytheon organizes its employees through a matrix structure so that employees report
both to a functional leader and to a business leader. For example, John Doe might report both to Metal
Fabrication (the business) and to process design (the function).
In the context of VSM, the matrix design and organizational structure at the lower levels of the company
made it difficult to determine all of the stakeholders for the pull project. The confusion extended to
employees as well. Some employees interviewed during the project found it difficult to explain their
responsibilities and loyalties when conflicts arose between their functional and business organizations.
The vertical organizational tiers presented additional difficulties in implementing the project. The pull
system had vast support at the Metal Fabrication and In-Service Radar group level, but managers
overseeing these areas resisted the plan for political reasons described in the next section. The point here
is that the strategic design of the organization, due to its matrix structure and vertical hierarchy, creates a
situation where many powerful stakeholders can influence the success of a project. What this means in
practice is that projects need to be championed from a powerful individual high up in the company to
have a high probability of success. Projects championed at the work group level simply do not have the
clout to overcome resistance from more senior managers, and most lower-level employees lack the
organizational visibility to successfully manage the political currents that run through the company.
6.2 Political Perspective
The political lens focuses on understanding the different interests and goals that guide individuals,
groups, and departments both within and outside of the organization that have a stake in the project. The
main stakeholders for the pull project were union employees in Metal Fabrication and In-Service Radar,
middle managers in charge of these groups, the two co-leaders of the project, the lean office, the outside
supplier of aluminum raw material, and the director with responsibility over Metal Fabrication. Figure 1
is a map of these stakeholders showing both their connection to the project and whether or not they were
for or against it (plusses = for, minuses = against). Arrows indicate when the author's impression of
stakeholder interests changed over time. For example, the director overseeing Metal Fabrication initially
seemed to be in support since he signed a Performance Management Goal Agreement outlining the
project. As it turned out, the director halted project implementation halfway through the internship for
reasons explained in Chapter 4.
MIT Thesis - Benjamin H. Lathrop Page 37 of 49
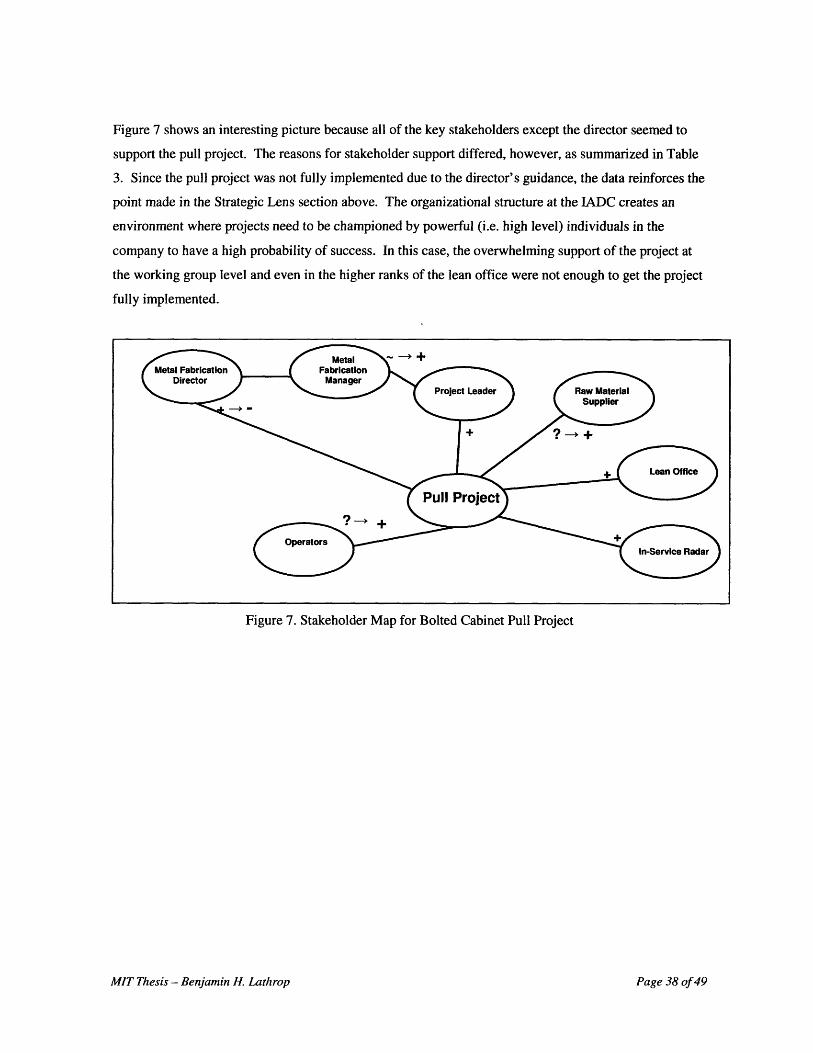
Figure 7 shows an interesting picture because all of the key stakeholders except the director seemed to
support the pull project. The reasons for stakeholder support differed, however, as summarized in Table
3. Since the pull project was not fully implemented due to the director's guidance, the data reinforces the
point made in the Strategic Lens section above. The organizational structure at the IADC creates an
environment where projects need to be championed by powerful (i.e. high level) individuals in the
company to have a high probability of success. In this case, the overwhelming support of the project at
the working group level and even in the higher ranks of the lean office were not enough to get the project
fully implemented.
Figure 7. Stakeholder Map for Bolted Cabinet Pull Project
MIT Thesis - Benjamin H. Lathrop Page 38 of49
Table 3. Summary of Stakeholder Interests in the Bolted Cabinet Pull Project
6.3 Cultural Perspective
The culture at the Integrated Air Defense Center is in the midst of change. Traditionally, many
employees expected to be told exactly what to do by their superiors; this is especially true for the union
workforce. Now, with lean being championed throughout the company, behaviors are gradually
changing. Employees are being told that they should take the initiative and speak up when they see
something being done wrong or if they have ideas on how to improve processes. With the Raytheon Six
Sigma initiative now in its seventh year, the importance of data in decision-making has also become more
important.
Because of the changing cultural climate, some employees were more receptive to the pull project than
others. Upper management and new employees seemed especially open to the lean initiative. Middle
managers and employees with long tenures at the company tended to be less warm to the change. There
were of course many exceptions to these broad generalizations.
MIT Thesis - Benjamin H. Lathrop
Stakeholder Stands to Gain or Lose
Metal Fabrication Director Loses ability to produce cabinets faster than cabinet demand. Thedirector preferred to implement a plan that would reduce per-cabinetcosts by accelerating the production schedule. Fixed costs would bespread among more units, thereby lowering per-cabinet costs usingstandard accounting procedures.
Metal Fabrication Manager Gains ability to meet new lean metrics that each work group iscommitted to achieve. In addition, by leveling production of boltedcabinets, Metal Fabrication will be better able to satisfy deliverycommitments to customers other than In-Service Radar. Several long-term benefits are also likely.
Project Leader Gains credibility as an effective leader and also fulfills a personal desireto introduce world class manufacturing techniques to Metal Fabrication.
Raw Material Supplier Gains perception of being a collaborative business partner.
Lean Office Gains a highly visible example of lean principles in action that can beshowcased to other departments.
In-Service Radar Gains better service levels for cabinet deliveries, which in turn makes iteasier for ISR to satisfy end-customer commitments.
Operators Gains benefits from project side effects such as level scheduling andvisual management that make work more enjoyable and predictable.
Page 39 of 49
Middle management's deep-seated norms of top-down leadership were often apparent despite the fact that
they committed themselves to the lean initiative. Some of my peers called this a "whips and chains"
management style. To illustrate, several middle managers said on different occasions: "I don't care what
it takes, just get it done". The manner in which this was said made it clear that no excuses would be
accepted if the task was not completed. This behavior was counterproductive in creating an environment
of openness and personal initiative that other parts of the organization were trying to foster.
In the context of the pull project, the culture of strict adherence to management instructions was
evident. For example, after parts of the pull project were terminated in favor of a plan to
accelerate cabinet production, shop floor employees asked their managers where the cabinets
should be stored since the customer would not need them right away. Instead of an answer, the
employees were told "not to worry about it". The employees did not question the matter further
and proceeded to accelerate production with no plan for storage. In the transition between
traditional and lean management cultures, the traditional culture is currently dominant.
MIT Thesis - Benjamin H. Lathrop Page 40 of49
7 Conclusions
This thesis explores the idea that lean implementations can only be successful when an organization's
prevailing values are consistent with the values of lean itself. Straightforward methods for determining
compatibility between lean and organizations are hard to come by, although Stakeholder Value Mapping
(SVM) is a technique from the field of Enterprise Management that comes close. This thesis
demonstrated the use of SVM at the micro level. Stakeholder values were mapped around a specific lean
project at Raytheon's Integrated Air Defense Center. The project, a pull system for a line of sophisticated
bolted cabinets, was described in detail as a case study. Insights from the pull project, the results of
SVM, and the use of the Three Lenses framework all provide support for the idea that organizational
values need to be compatible with the values underpinning lean.
The implications for Raytheon's lean initiative are not immediately dour even though signs of value
misalignment are evident. Activities already in progress need to stay on track, such as the work coming
out of the Lean Office which is helping to transform the culture at the shop floor level. New initiatives
can also be started to align stakeholder incentives across the organization. Stakeholder value mapping
uncovered a difference in value perceptions between the Lean Office and the Metal Fabrication and In-
Service Radar groups. Common incentives should be considered for all three groups to gain better value
alignment. When stakeholder incentives are aligned in accordance with lean thinking throughout the
value stream, a lean transformation is more likely to succeed.
In a more general sense, this thesis argues that it is not appropriate to begin lean initiatives without first
considering the organizational, political, and cultural implications. Instead of kicking off with a mapping
of material and information flows (i.e. Value Stream Mapping), companies should first understand
whether organizational values are aligned with those of lean through Stakeholder Value Mapping (SVM).
While SVM alone does not yield sufficient data to guide an implementation, it is an effective method for
understanding the stakeholder interests that can serve as barriers to lean. Leaders trying to bring lean into
their organizations will find SVM a promising tool for determining where to initially focus their attention.
If lean and stakeholder values are aligned, the groundwork will be set for a traditional lean
implementation that focuses on well-known tools for discovering and removing waste. On the other
hand, if lean and stakeholder values differ significantly, consideration should first be given to aligning
organizational interests with the lean strategy.
MIT Thesis - Benjamin H. Lathrop Page 41 of 49
8 Bibliography
Carroll, John S. "Introduction to Organizational Analysis: The Three Lenses." MIT Sloan School ofManagement Working Paper, 1-13. MIT Document Service, Revised July 2002
Flinchbaugh, Jamie and Andy Carlino, The Hitchhiker's Guide to Lean: Lessons from the Road, USA,Society of Manufacturing Engineers, 2006
Grossi, Ignaccio, "Stakeholder Analysis in the Context of the Lean Enterprise," Masters Thesis, MITSystems Design and Management Program, March 2003.
Murman, Earll, Thomas Allen, Kirkor Bozdogan, Joel Cutcher-Gershenfeld, Hugh McManus, DeborahNightingale, Eric Rebentisch, Tom Shields, Fred Stahl, Myles Walton, Joyce Warmkessel, StanleyWeiss, and Sheila Widnall, Lean Enterprise Value: Insights from MIT's Lean Aerospace Initiative,New York: Palgrave/Macmillan, 2002.
Nightingale, Deborah J. and Alexis Stanke, "Enterprise Value Stream Mapping and Analysis", Version1.0, August 2005
Pascal, Dennis, Lean Production Simplified, New York: Productivity Press, 2002.
Raytheon Company Website. 2006. < http://www.raytheon.com/about/>.
Raytheon Company Website. 2006. <http://www.raytheon.com/about/vsgv/>
Raytheon Company Website. 2006. < http://www.raytheon.com/businesses/rids/about/index.html>.
Raytheon Company Website. 2006. <http://www.raytheon.com/businesses/rids/businesses/IntegratedAir_Defense/index.html>
Raytheon Company Website. 2006. < http://www.raytheon.com/feature/shingo/>.
Rother, Mike and John Shook, Learning to See, Brookline: The Lean Enterprise Institute, 2003.
Shinkle, George, Reb Gooding, and Mike Smith, Transforming Strategy into Success: How to Implementa Lean Management System, New York, Productivity Press, 2004.
Sterman, John, Business Dynamics: Systems Thinking and Modeling for a Complex World,Irwin/McGraw Hill, 2000.
Vanka, Padmaja, "Line Coordination in a Rapid Change, High Volume Environment," Masters Thesis,MIT Leaders for Manufacturing Program, June 2004.
Wikimedia Foundation. "Value Stream Mapping." Wikipedia Dictionary. January 2006.<http://en.wikipedia.org/wiki/Value StreamMapping>.
Womack, James P. and Daniel T. Jones, Lean Thinking, New York: Free Press, 2003.
MIT Thesis - Benjamin H. Lathrop Page 42 of 49
9 Author's Biography
Born in Chicago, Illinois, the author shortly thereafter moved with his family to Cincinnati, Ohio wherehe spent most of his childhood years. His family moved again in 1990, this time overseas to a smallmunicipality located north of the Arctic Circle called Tromsdalen, Norway. His knowledge ofScandinavian culture and history proved useful for one of his two undergraduate degrees received fromthe University of Wisconsin-Madison. In 2000, the author graduated with a BS Chemical Engineeringdegree and an additional major in Scandinavian Studies. From 1998 to 1999, he worked at Dow Chemicalin the co-op engineering program, completing three assignments in technical service and development,operations, and R&D roles. From 2000 to 2004, he worked at ExxonMobil Research and EngineeringCompany as a process engineer first in the Catalytic Cracking Section and then in the Lubricant andSpecialties Section. His main responsibilities included troubleshooting catalytic cracking and lubehydroprocessing units, optimizing process conditions, and developing technical proposals in support ofExxonMobil licensing efforts.
In 2004, he joined the Leaders for Manufacturing (LFM) program at MIT for his MBA and MS ChemicalEngineering degrees, where this thesis was completed in 2006. Upon graduation from MIT in June 2006,the author will be joining Honeywell as a Project Manager for the Aerospace business in Phoenix,Arizona. The author can be reached at his permanent email address - [email protected].
MIT Thesis - Benjamin H. Lathrop Page 43 of49
10 Appendix
10.1 Exhibit 1 - Current State Value Stream Map for BoltedCabinet Line25
WL#T STIAE VSU-ApIUUnf
IuuI y r *5r-------------44-1s.·- A> $LJ-
--- --.
I Ž#~4KW
21U [..2~
7 $Y I "
bpGs·lZo LI CII]
I P I t -
C I °° ~o o o o o o dooI---4--M----~u--sit--- - --------------U - "Inin
,2
s.r4 el d _
FT
Ž -f
s--j;C ~
---.- --- +-
SExhibit I is intentionally blurry. It is meant as a general illustration of what a value stream map lookslike and not as a specific example to be studied in detail. A good source on Value Stream Mapping isLearning to See by Mike Rother and John Shook.
MIT Thesis - Bern.amin H. LathropPage 44 of 49
_ " -
~;cJc~S~."~h/%
f ;
- "
"r'C~ti
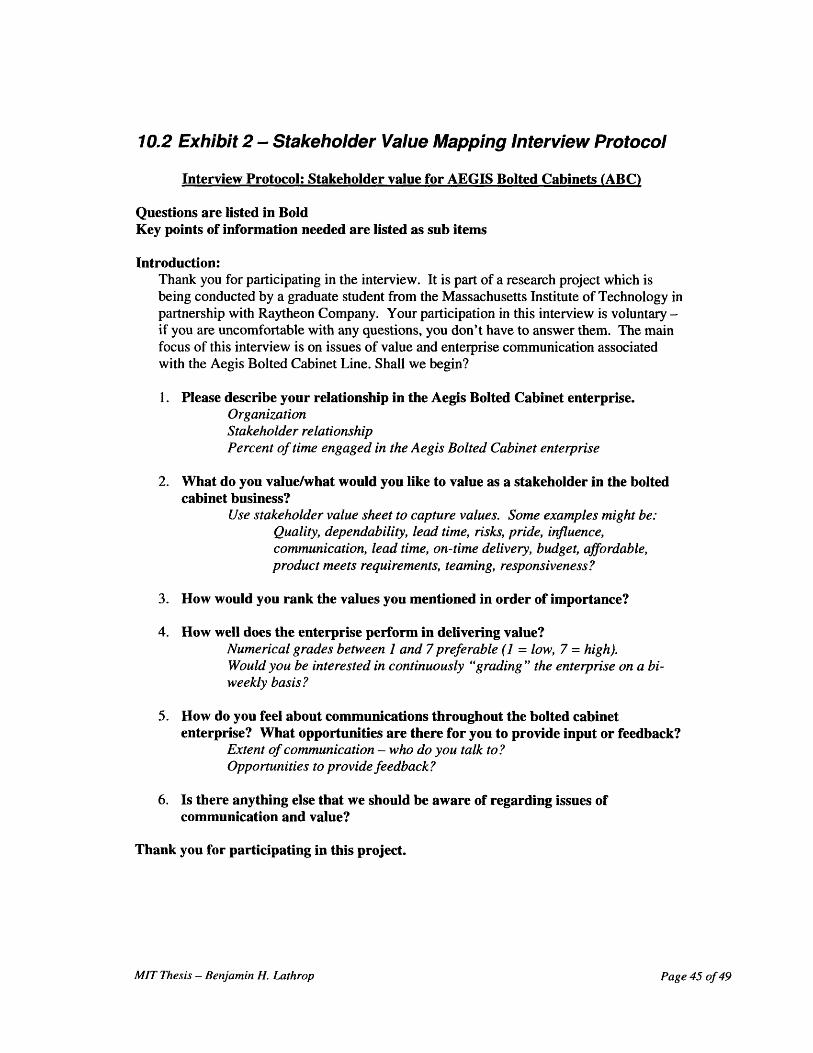
10.2 Exhibit 2 - Stakeholder Value Mapping Interview Protocol
Interview Protocol: Stakeholder value for AEGIS Bolted Cabinets (ABC)
Questions are listed in BoldKey points of information needed are listed as sub items
Introduction:Thank you for participating in the interview. It is part of a research project which isbeing conducted by a graduate student from the Massachusetts Institute of Technology inpartnership with Raytheon Company. Your participation in this interview is voluntary -if you are uncomfortable with any questions, you don't have to answer them. The mainfocus of this interview is on issues of value and enterprise communication associatedwith the Aegis Bolted Cabinet Line. Shall we begin?
1. Please describe your relationship in the Aegis Bolted Cabinet enterprise.OrganizationStakeholder relationshipPercent of time engaged in the Aegis Bolted Cabinet enterprise
2. What do you value/what would you like to value as a stakeholder in the boltedcabinet business?
Use stakeholder value sheet to capture values. Some examples might be:Quality, dependability, lead time, risks, pride, influence,communication, lead time, on-time delivery, budget, affordable,product meets requirements, teaming, responsiveness?
3. How would you rank the values you mentioned in order of importance?
4. How well does the enterprise perform in delivering value?Numerical grades between 1 and 7 preferable (1 = low, 7 = high).Would you be interested in continuously "grading " the enterprise on a bi-weekly basis?
5. How do you feel about communications throughout the bolted cabinetenterprise? What opportunities are there for you to provide input or feedback?
Extent of communication - who do you talk to?Opportunities to provide feedback?
6. Is there anything else that we should be aware of regarding issues ofcommunication and value?
Thank you for participating in this project.
MIT Thesis - Benjamin H. Lathrop Page 45 of49
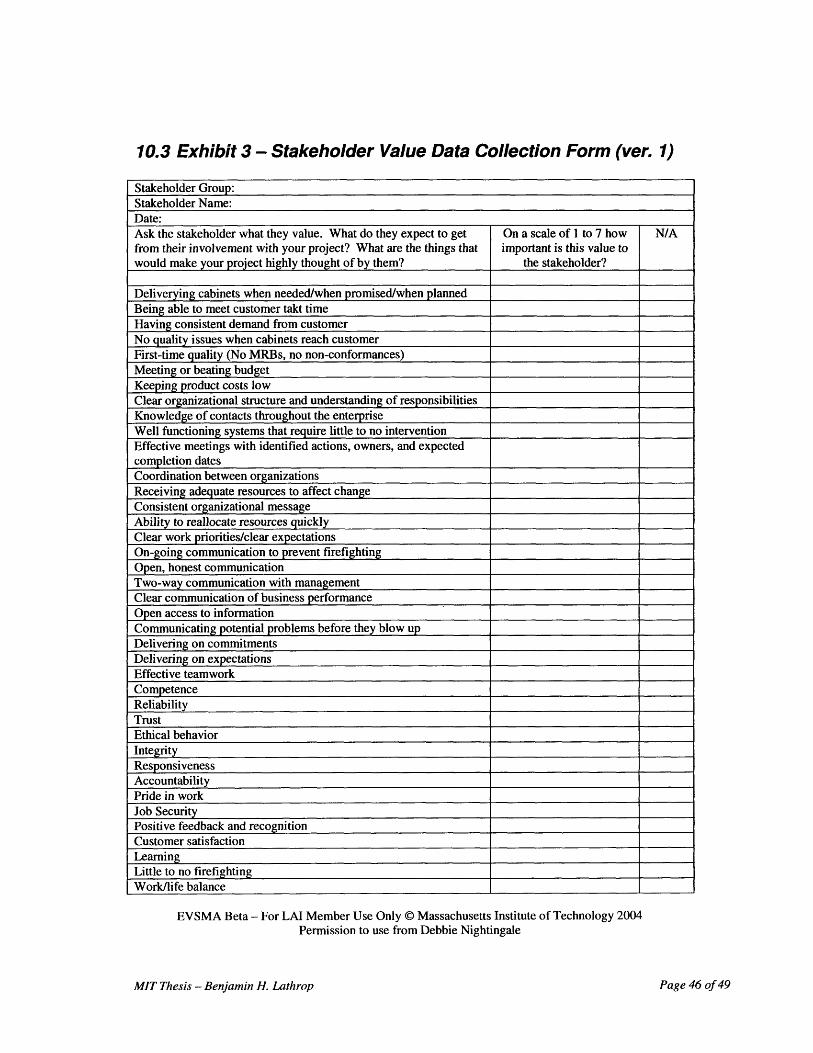
10.3 Exhibit 3 - Stakeholder Value Data Collection Form (ver. 1)
Stakeholder Group:Stakeholder Name:Date:Ask the stakeholder what they value. What do they expect to get On a scale of I to 7 how N/Afrom their involvement with your project? What are the things that important is this value towould make your project highly thought of by them? the stakeholder?
Deliverying cabinets when needed/when promised/when plannedBeing able to meet customer takt timeHaving consistent demand from customerNo quality issues when cabinets reach customerFirst-time quality (No MRBs, no non-conformances)Meeting or beating budgetKeeping product costs lowClear organizational structure and understanding of responsibilitiesKnowledge of contacts throughout the enterpriseWell functioning systems that require little to no interventionEffective meetings with identified actions, owners, and expectedcompletion datesCoordination between organizationsReceiving adequate resources to affect changeConsistent organizational messageAbility to reallocate resources quicklyClear work priorities/clear expectationsOn-going communication to prevent firefightingOpen, honest communicationTwo-way communication with managementClear communication of business performanceOpen access to informationCommunicating potential problems before they blow upDelivering on commitmentsDelivering on expectationsEffective teamworkCompetenceReliabilityTrustEthical behaviorIntegrityResponsivenessAccountabilityPride in workJob SecurityPositive feedback and recognitionCustomer satisfactionLearningLittle to no firefightingWork/life balance
EVSMA Beta - For LAI Member Use Only © Massachusetts Institute of Technology 2004Permission to use from Debbie Nightingale
MIT Thesis - Benjamin H. Lathrop Page 46 of 49
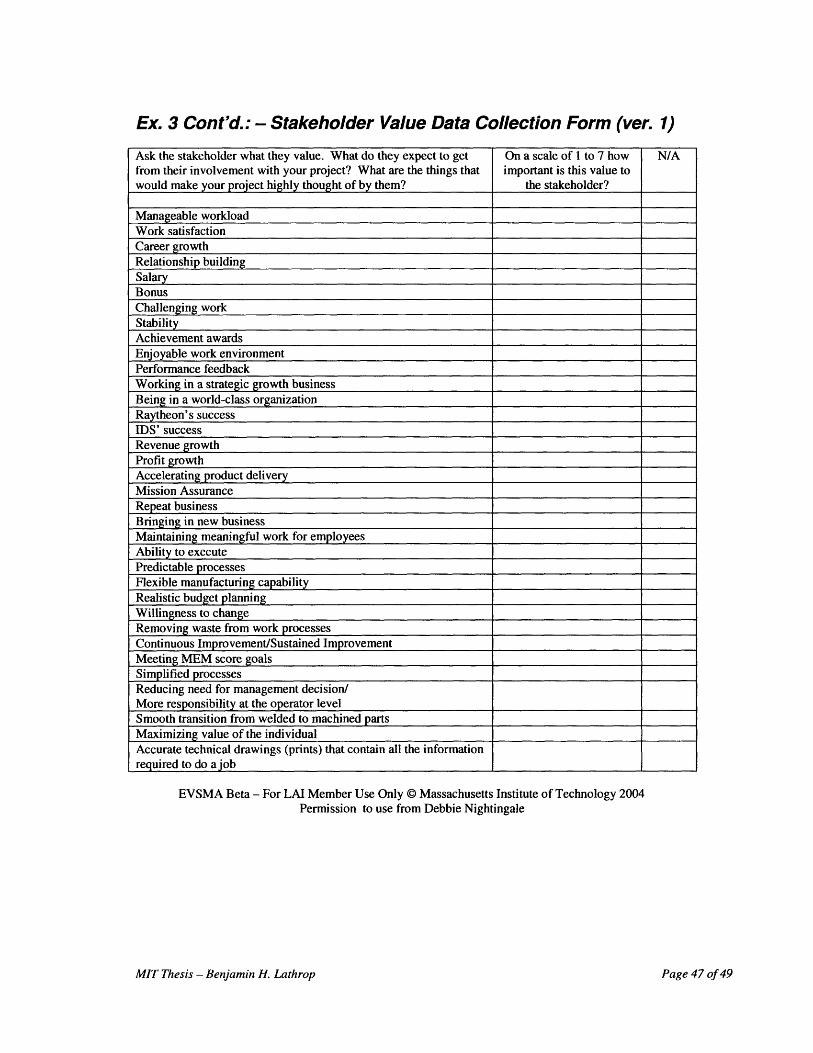
Ex. 3 Cont'd.: - Stakeholder Value Data Collection Form (ver. 1)
Ask the stakeholder what they value. What do they expect to get On a scale of 1 to 7 how N/Afrom their involvement with your project? What are the things that important is this value towould make your project highly thought of by them? the stakeholder?
Manageable workloadWork satisfactionCareer growthRelationship buildingSalaryBonusChallenging workStabilityAchievement awardsEnjoyable work environmentPerformance feedbackWorking in a strategic growth businessBeing in a world-class organizationRaytheon's successIDS' successRevenue growthProfit growthAccelerating product deliveryMission AssuranceRepeat businessBringing in new businessMaintaining meaningful work for employeesAbility to executePredictable processesFlexible manufacturing capabilityRealistic budget planningWillingness to changeRemoving waste from work processesContinuous Improvement/Sustained ImprovementMeeting MEM score goalsSimplified processesReducing need for management decision/More responsibility at the operator levelSmooth transition from welded to machined partsMaximizing value of the individualAccurate technical drawings (prints) that contain all the informationrequired to do a job
EVSMA Beta - For LAI Member Use Only @ Massachusetts Institute of Technology 2004Permission to use from Debbie Nightingale
MIT Thesis - Benjamin H. Lathrop Page 47 of 49
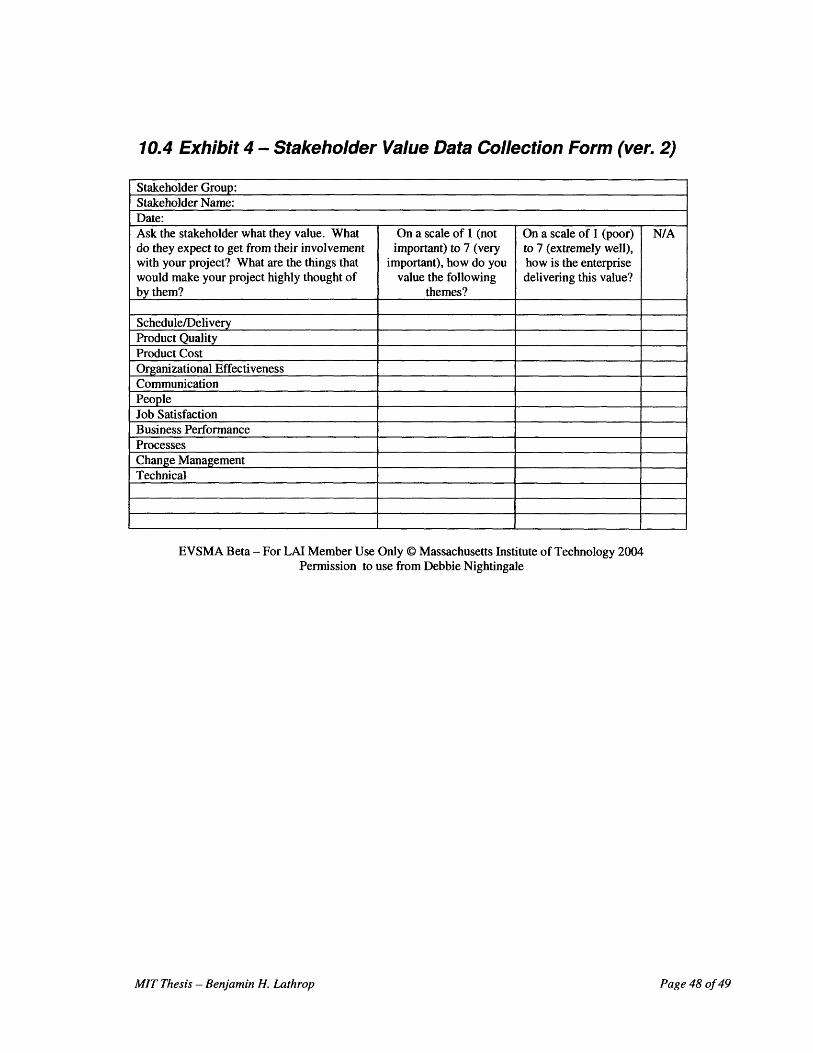
10.4 Exhibit 4 - Stakeholder Value Data Collection Form (ver. 2)
Stakeholder Group:Stakeholder Name:Date:Ask the stakeholder what they value. Whatdo they expect to get from their involvementwith your project? What are the things thatwould make your project highly thought ofby them?
Schedule/DeliveryProduct QualityProduct CostOrganizational EffectivenessCommunicationPeopleJob SatisfactionBusiness PerformanceProcessesChange ManagementTechnical
On a scale of 1 (notimportant) to 7 (very
important), how do youvalue the following
themes?
On a scale of I (poor)to 7 (extremely well),how is the enterprisedelivering this value?
N/A
EVSMA Beta - For LAI Member Use Only © Massachusetts Institute of Technology 2004Permission to use from Debbie Nightingale
MIT Thesis - Benjamin H. Lathrop Page 48 of 49
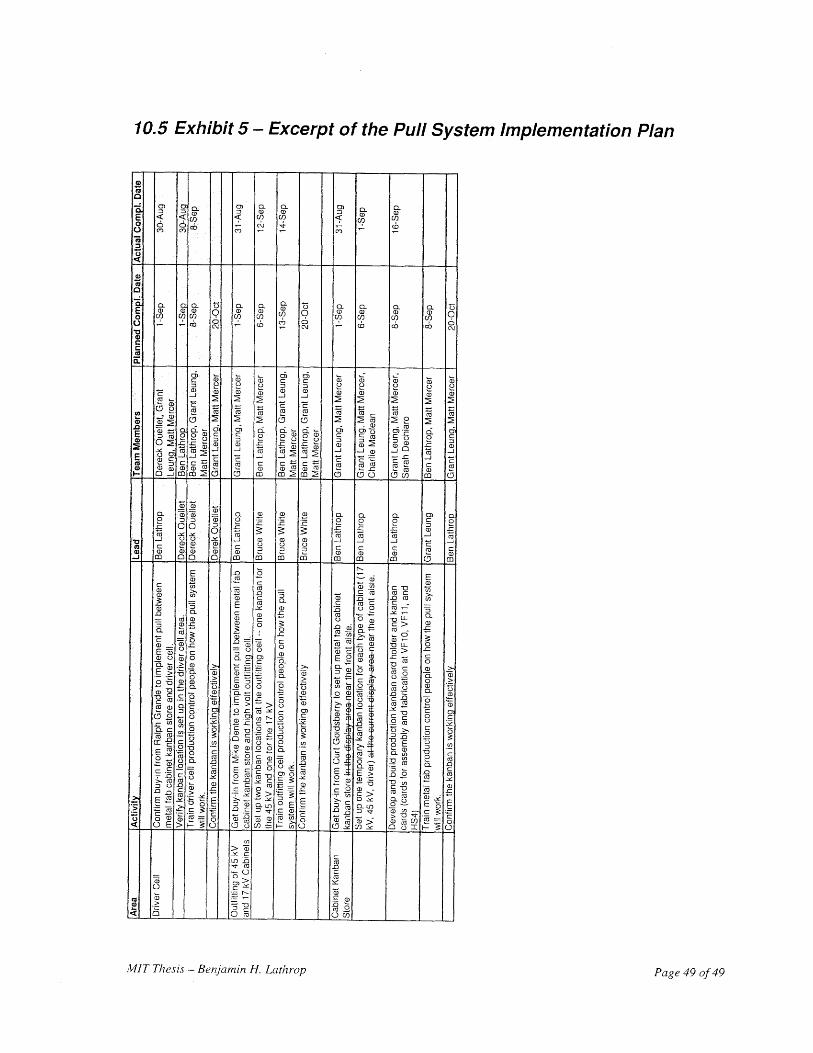
10.5 Exhibit 5 - Excerpt of the Pull System Implementation Plan
MIT Thesis - Benjamin H. Lathrop Page 49 of 49