Embed Size (px)
Citation preview
Evaluating 3D-Visualisation of Code Structures in the Context of ReverseEngineering
Alexander Fronk ∗
Software Technology, University of Dortmund, GermanyDietmar Gude, Gerhard Rinkenauer
Leibniz Research Centre for Working Environment and Human Factors, University of Dortmund, Germany
Abstract
In reverse engineering it is a common approach to gener-ate UML diagrams from code, capturing technical detailsas well as structural static relations between, e.g., packagesand classes. It can be observed, however, that it is hardto depict large object-oriented systems in such a way thatparticulary unknown legacy code can be visually exploredto comprehend it for effective maintenance. Our contribu-tion to this task is to use relation-specific geometric arrange-ments in three-dimensional space. 3D space allows to dis-play a large amount of data with optimal visual ingress, andusing specific layout algorithms optimises space utilisationwith respect to both exploration and interpretation of thecode structures displayed. So far, we have developed a re-verse engineering tool, VisMOOS, supporting these ideas bymeans of 3D relation diagrams, and in the next step, boththe concepts and the tool require for empirical studies toevaluate their effectiveness for understanding unknown codestructures. In this project there are three different partnersinvolved: the Chair for Software Technology of the Univer-sity of Dortmund, the Leibniz Research Centre for WorkingEnvironment and Human Factors, and an industrial softwaredeveloping company. Although we have different interests inthe project, we follow the same goal: How can we empiricallyprove the effectiveness of our 3D relation diagram? In thisarticle, we report on both 3D relation diagrams and how weare designing and conducting experiments to evaluate them.
1 Underlying Theory and Concepts
In reverse engineering, code structures are usually visu-alised using UML diagrams within a tool, for example, likeOMONDO. One of the drawbacks of such diagrams heav-ily under discussion is scalability: large software systemsare hard to depict as one single UML package and class dia-gram. More seriously, these diagrams need to be split up intomany separate ones or into arbitrary hierarchies such thatimportant information might be lost or simply overseen.
Reverse engineering is not a stand-alone task. It aims atvisualising code such that the diagrams generated can beused for, e.g., maintaining a software system (cf. [Lano andHaughton 1993; Bax ]). Clearly, maintenance tasks requireto understand the system in detail which is a non-trivialmatter particularly for large and unknown legacy code (cf.[Mayrhauser and Vans 1993]). The diagrams generated bya reverse engineering tool must thus allow the observer togather the information needed and to interpret his/her find-ings correctly such that maintenance tasks can be carriedout both efficiently and effectively.
∗e-mail: [email protected]
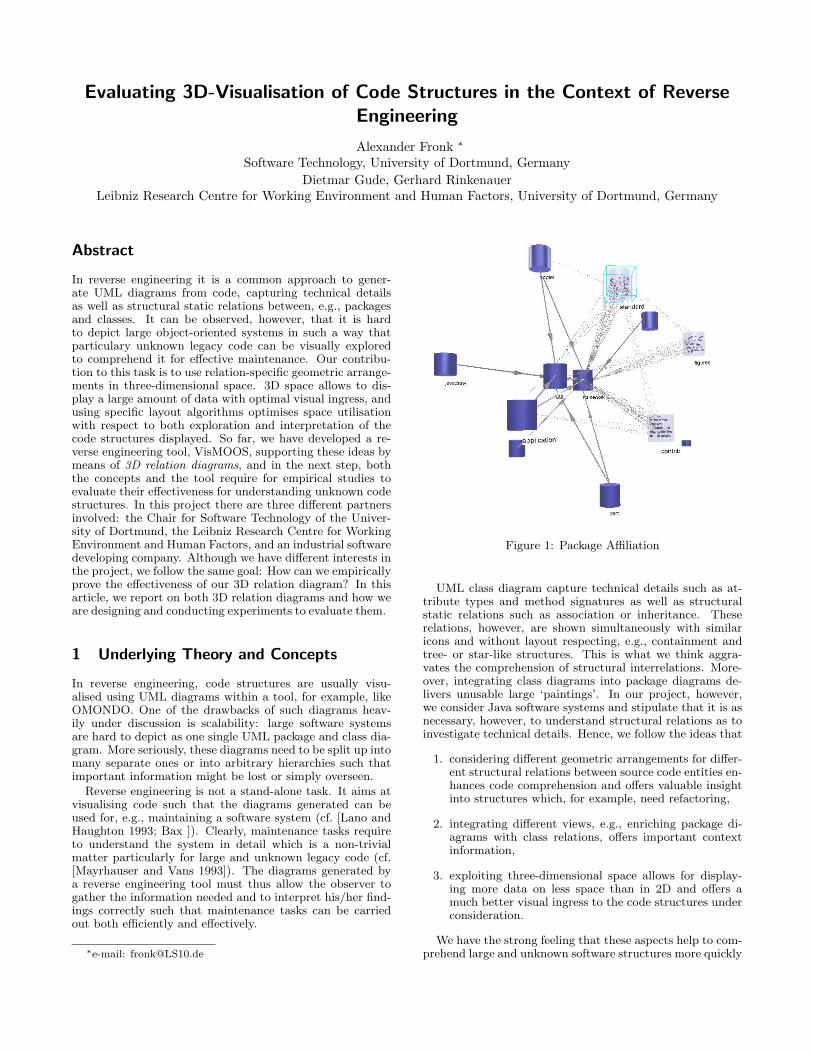
Figure 1: Package Affiliation
UML class diagram capture technical details such as at-tribute types and method signatures as well as structuralstatic relations such as association or inheritance. Theserelations, however, are shown simultaneously with similaricons and without layout respecting, e.g., containment andtree- or star-like structures. This is what we think aggra-vates the comprehension of structural interrelations. More-over, integrating class diagrams into package diagrams de-livers unusable large ‘paintings’. In our project, however,we consider Java software systems and stipulate that it is asnecessary, however, to understand structural relations as toinvestigate technical details. Hence, we follow the ideas that
1. considering different geometric arrangements for differ-ent structural relations between source code entities en-hances code comprehension and offers valuable insightinto structures which, for example, need refactoring,
2. integrating different views, e.g., enriching package di-agrams with class relations, offers important contextinformation,
3. exploiting three-dimensional space allows for display-ing more data on less space than in 2D and offers amuch better visual ingress to the code structures underconsideration.
We have the strong feeling that these aspects help to com-prehend large and unknown software structures more quickly
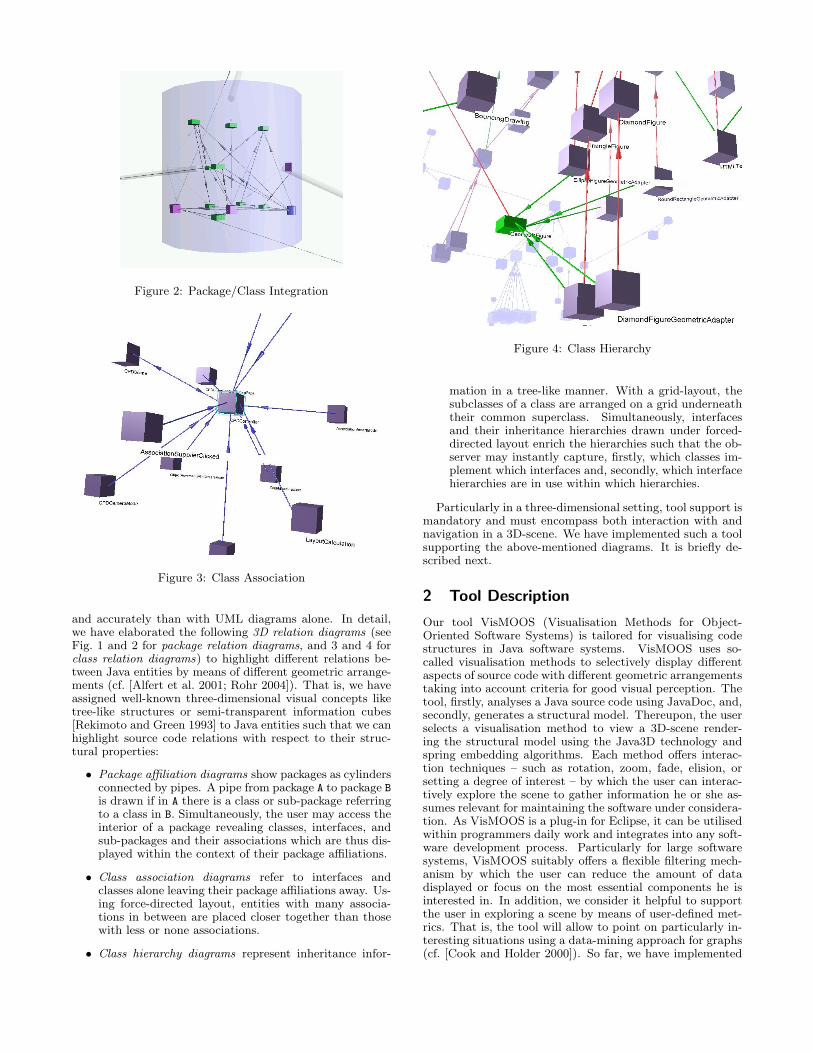
Figure 2: Package/Class Integration
Figure 3: Class Association
and accurately than with UML diagrams alone. In detail,we have elaborated the following 3D relation diagrams (seeFig. 1 and 2 for package relation diagrams, and 3 and 4 forclass relation diagrams) to highlight different relations be-tween Java entities by means of different geometric arrange-ments (cf. [Alfert et al. 2001; Rohr 2004]). That is, we haveassigned well-known three-dimensional visual concepts liketree-like structures or semi-transparent information cubes[Rekimoto and Green 1993] to Java entities such that we canhighlight source code relations with respect to their struc-tural properties:
• Package affiliation diagrams show packages as cylindersconnected by pipes. A pipe from package A to package Bis drawn if in A there is a class or sub-package referringto a class in B. Simultaneously, the user may access theinterior of a package revealing classes, interfaces, andsub-packages and their associations which are thus dis-played within the context of their package affiliations.
• Class association diagrams refer to interfaces andclasses alone leaving their package affiliations away. Us-ing force-directed layout, entities with many associa-tions in between are placed closer together than thosewith less or none associations.
• Class hierarchy diagrams represent inheritance infor-
Figure 4: Class Hierarchy
mation in a tree-like manner. With a grid-layout, thesubclasses of a class are arranged on a grid underneaththeir common superclass. Simultaneously, interfacesand their inheritance hierarchies drawn under forced-directed layout enrich the hierarchies such that the ob-server may instantly capture, firstly, which classes im-plement which interfaces and, secondly, which interfacehierarchies are in use within which hierarchies.
Particularly in a three-dimensional setting, tool support ismandatory and must encompass both interaction with andnavigation in a 3D-scene. We have implemented such a toolsupporting the above-mentioned diagrams. It is briefly de-scribed next.
2 Tool Description
Our tool VisMOOS (Visualisation Methods for Object-Oriented Software Systems) is tailored for visualising codestructures in Java software systems. VisMOOS uses so-called visualisation methods to selectively display differentaspects of source code with different geometric arrangementstaking into account criteria for good visual perception. Thetool, firstly, analyses a Java source code using JavaDoc, and,secondly, generates a structural model. Thereupon, the userselects a visualisation method to view a 3D-scene render-ing the structural model using the Java3D technology andspring embedding algorithms. Each method offers interac-tion techniques – such as rotation, zoom, fade, elision, orsetting a degree of interest – by which the user can interac-tively explore the scene to gather information he or she as-sumes relevant for maintaining the software under considera-tion. As VisMOOS is a plug-in for Eclipse, it can be utilisedwithin programmers daily work and integrates into any soft-ware development process. Particularly for large softwaresystems, VisMOOS suitably offers a flexible filtering mech-anism by which the user can reduce the amount of datadisplayed or focus on the most essential components he isinterested in. In addition, we consider it helpful to supportthe user in exploring a scene by means of user-defined met-rics. That is, the tool will allow to point on particularly in-teresting situations using a data-mining approach for graphs(cf. [Cook and Holder 2000]). So far, we have implemented
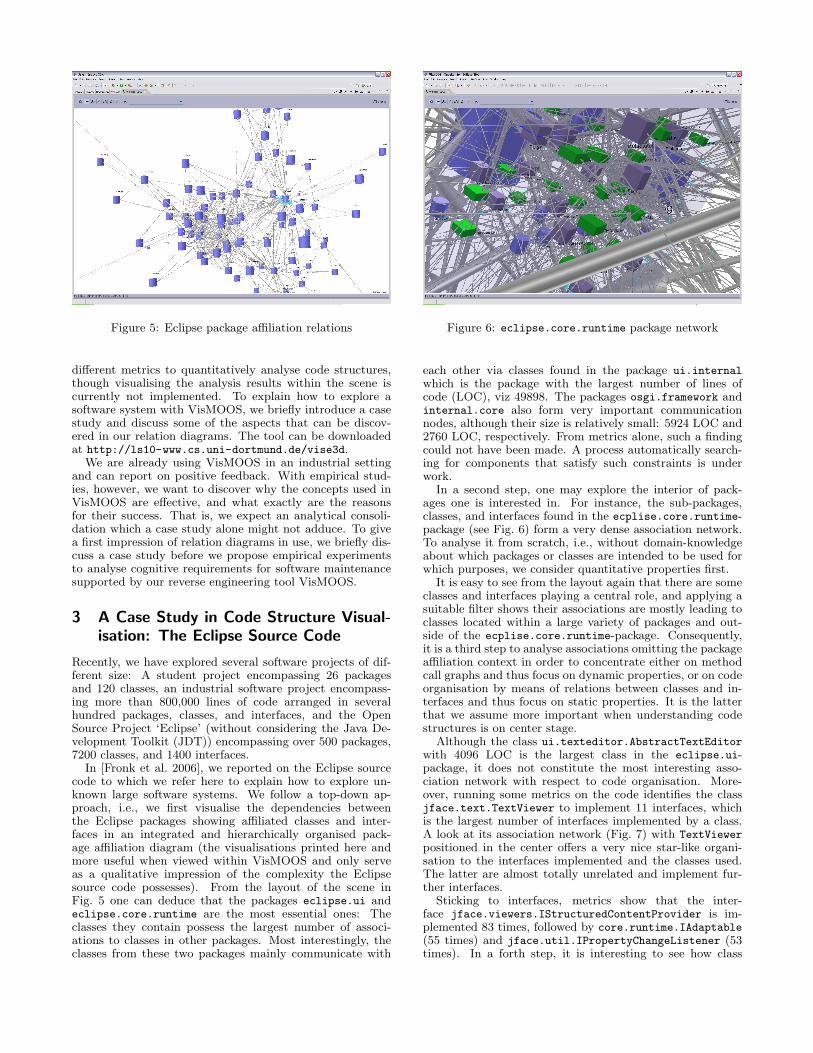
Figure 5: Eclipse package affiliation relations
different metrics to quantitatively analyse code structures,though visualising the analysis results within the scene iscurrently not implemented. To explain how to explore asoftware system with VisMOOS, we briefly introduce a casestudy and discuss some of the aspects that can be discov-ered in our relation diagrams. The tool can be downloadedat http://ls10-www.cs.uni-dortmund.de/vise3d.
We are already using VisMOOS in an industrial settingand can report on positive feedback. With empirical stud-ies, however, we want to discover why the concepts used inVisMOOS are effective, and what exactly are the reasonsfor their success. That is, we expect an analytical consoli-dation which a case study alone might not adduce. To givea first impression of relation diagrams in use, we briefly dis-cuss a case study before we propose empirical experimentsto analyse cognitive requirements for software maintenancesupported by our reverse engineering tool VisMOOS.
3 A Case Study in Code Structure Visual-isation: The Eclipse Source Code
Recently, we have explored several software projects of dif-ferent size: A student project encompassing 26 packagesand 120 classes, an industrial software project encompass-ing more than 800,000 lines of code arranged in severalhundred packages, classes, and interfaces, and the OpenSource Project ‘Eclipse’ (without considering the Java De-velopment Toolkit (JDT)) encompassing over 500 packages,7200 classes, and 1400 interfaces.
In [Fronk et al. 2006], we reported on the Eclipse sourcecode to which we refer here to explain how to explore un-known large software systems. We follow a top-down ap-proach, i.e., we first visualise the dependencies betweenthe Eclipse packages showing affiliated classes and inter-faces in an integrated and hierarchically organised pack-age affiliation diagram (the visualisations printed here andmore useful when viewed within VisMOOS and only serveas a qualitative impression of the complexity the Eclipsesource code possesses). From the layout of the scene inFig. 5 one can deduce that the packages eclipse.ui andeclipse.core.runtime are the most essential ones: Theclasses they contain possess the largest number of associ-ations to classes in other packages. Most interestingly, theclasses from these two packages mainly communicate with
Figure 6: eclipse.core.runtime package network
each other via classes found in the package ui.internalwhich is the package with the largest number of lines ofcode (LOC), viz 49898. The packages osgi.framework andinternal.core also form very important communicationnodes, although their size is relatively small: 5924 LOC and2760 LOC, respectively. From metrics alone, such a findingcould not have been made. A process automatically search-ing for components that satisfy such constraints is underwork.
In a second step, one may explore the interior of pack-ages one is interested in. For instance, the sub-packages,classes, and interfaces found in the ecplise.core.runtime-package (see Fig. 6) form a very dense association network.To analyse it from scratch, i.e., without domain-knowledgeabout which packages or classes are intended to be used forwhich purposes, we consider quantitative properties first.
It is easy to see from the layout again that there are someclasses and interfaces playing a central role, and applying asuitable filter shows their associations are mostly leading toclasses located within a large variety of packages and out-side of the ecplise.core.runtime-package. Consequently,it is a third step to analyse associations omitting the packageaffiliation context in order to concentrate either on methodcall graphs and thus focus on dynamic properties, or on codeorganisation by means of relations between classes and in-terfaces and thus focus on static properties. It is the latterthat we assume more important when understanding codestructures is on center stage.
Although the class ui.texteditor.AbstractTextEditorwith 4096 LOC is the largest class in the eclipse.ui-package, it does not constitute the most interesting asso-ciation network with respect to code organisation. More-over, running some metrics on the code identifies the classjface.text.TextViewer to implement 11 interfaces, whichis the largest number of interfaces implemented by a class.A look at its association network (Fig. 7) with TextViewerpositioned in the center offers a very nice star-like organi-sation to the interfaces implemented and the classes used.The latter are almost totally unrelated and implement fur-ther interfaces.
Sticking to interfaces, metrics show that the inter-face jface.viewers.IStructuredContentProvider is im-plemented 83 times, followed by core.runtime.IAdaptable(55 times) and jface.util.IPropertyChangeListener (53times). In a forth step, it is interesting to see how class
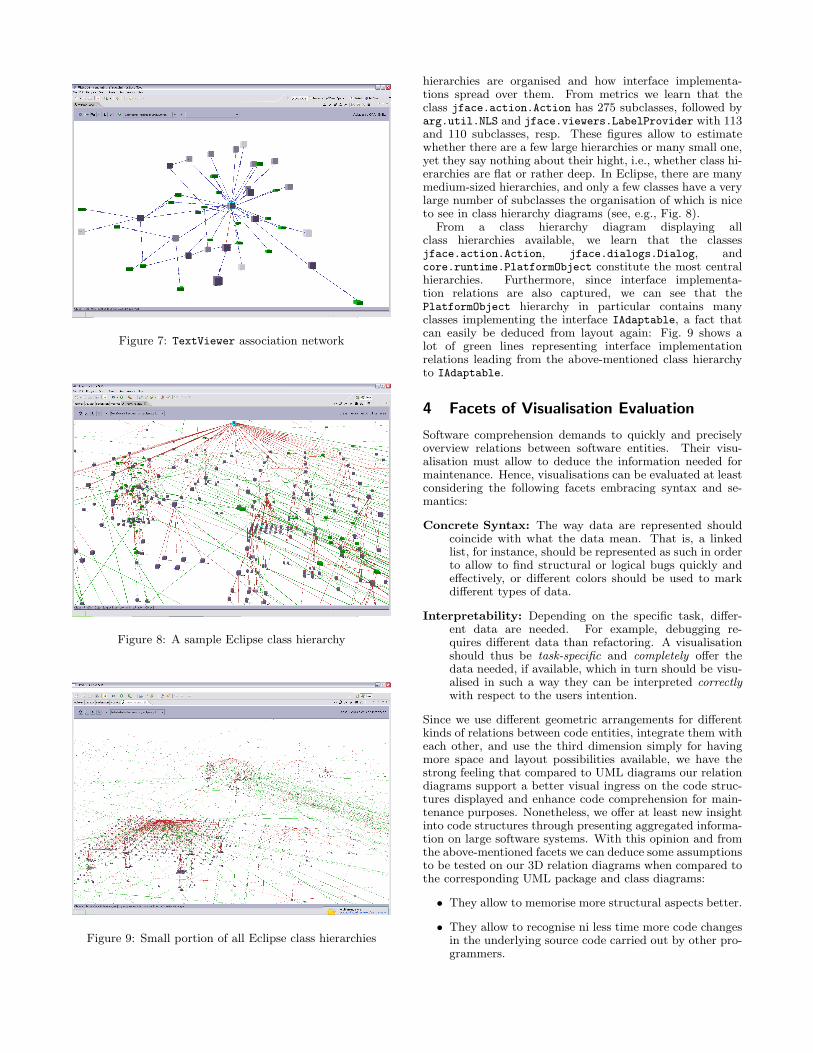
Figure 7: TextViewer association network
Figure 8: A sample Eclipse class hierarchy
Figure 9: Small portion of all Eclipse class hierarchies
hierarchies are organised and how interface implementa-tions spread over them. From metrics we learn that theclass jface.action.Action has 275 subclasses, followed byarg.util.NLS and jface.viewers.LabelProvider with 113and 110 subclasses, resp. These figures allow to estimatewhether there are a few large hierarchies or many small one,yet they say nothing about their hight, i.e., whether class hi-erarchies are flat or rather deep. In Eclipse, there are manymedium-sized hierarchies, and only a few classes have a verylarge number of subclasses the organisation of which is niceto see in class hierarchy diagrams (see, e.g., Fig. 8).
From a class hierarchy diagram displaying allclass hierarchies available, we learn that the classesjface.action.Action, jface.dialogs.Dialog, andcore.runtime.PlatformObject constitute the most centralhierarchies. Furthermore, since interface implementa-tion relations are also captured, we can see that thePlatformObject hierarchy in particular contains manyclasses implementing the interface IAdaptable, a fact thatcan easily be deduced from layout again: Fig. 9 shows alot of green lines representing interface implementationrelations leading from the above-mentioned class hierarchyto IAdaptable.
4 Facets of Visualisation Evaluation
Software comprehension demands to quickly and preciselyoverview relations between software entities. Their visu-alisation must allow to deduce the information needed formaintenance. Hence, visualisations can be evaluated at leastconsidering the following facets embracing syntax and se-mantics:
Concrete Syntax: The way data are represented shouldcoincide with what the data mean. That is, a linkedlist, for instance, should be represented as such in orderto allow to find structural or logical bugs quickly andeffectively, or different colors should be used to markdifferent types of data.
Interpretability: Depending on the specific task, differ-ent data are needed. For example, debugging re-quires different data than refactoring. A visualisationshould thus be task-specific and completely offer thedata needed, if available, which in turn should be visu-alised in such a way they can be interpreted correctlywith respect to the users intention.
Since we use different geometric arrangements for differentkinds of relations between code entities, integrate them witheach other, and use the third dimension simply for havingmore space and layout possibilities available, we have thestrong feeling that compared to UML diagrams our relationdiagrams support a better visual ingress on the code struc-tures displayed and enhance code comprehension for main-tenance purposes. Nonetheless, we offer at least new insightinto code structures through presenting aggregated informa-tion on large software systems. With this opinion and fromthe above-mentioned facets we can deduce some assumptionsto be tested on our 3D relation diagrams when compared tothe corresponding UML package and class diagrams:
• They allow to memorise more structural aspects better.
• They allow to recognise ni less time more code changesin the underlying source code carried out by other pro-grammers.
• They allow to find and recover specific structures moreeasily and more accurately.
• They allow to qualitatively assess code structures moreaccurately.
• They allow to quantitatively assess code structuresmore precisely.
We are planning to conduct a two-step evaluation process(cf. [Dumas and Redish 1999]). In the first step, the assump-tions will be evaluated within a preliminary survey to checkwhether or not they hold. Simultaneously, we expect to ob-tain indices about what proves them true or wrong. Thatis, the first step will also be a hypotheses-generating studyhelping to formulate precise hypotheses such as, e.g.:
• The larger the underlying source code, the more 3Drelation diagrams are superior to UML diagrams.
• Colors support structure memorisation.
• Layout is responsible for structure recognition.
• 3D-space enhances overview on large sets of data.
• The features offered by VisMOOS support code assess-ment.
In a second step, continuative experiments will empiricallytest such and other hypotheses to definitively discover thereasons why and not or where and where not 3D relationdiagrams work. Currently, we are designing the first step onwhich we report in the remainder of this paper.
5 Preliminary Study: Design and Conduc-tion
We are currently recruiting students from both Bachelor andMaster Programs of Computer Science at the University ofDortmund. They possess different skills in reading UMLdiagrams and none in reading 3D relation diagrams. Bothgroups will encompass about 10 students, i.e., there will beabout 20 students available. Before we let them participatethe experiments, a short briefing will introduce them intoreading both UML and 3D relation diagrams. Then, thestudents are arbitrarily divided into two groups. In eachexperiment, one of the groups will deal with a UML diagramand the other with a 3D relation diagram to fulfill a giventask. The diagram assignment will be switched from time totime such that each student will face either diagram type.Both groups are tool supported: the UML group will useOMONDO, and the 3D group will use VisMOOS, such thatboth groups rely on the Eclipse environment. The groupsare not allowed to use the search-feature of either tool butto navigate through the diagrams manually.
We are planning to conduct the following experiments:
• A complex diagram is given to the students. They areasked to look at it for 10 minutes and to gather as much‘knowledge’ as possible. We do not tell them on whatthey should concentrate. After this phase, there willbe a 20 minutes break in which the students are shownsome part of a relaxing movie. After that, they areasked to write down what they remember. We expectthe UML group to remember technical details in partic-ular, whereas the 3D group should memorise structuralconspicuities. With this experiment, we want to as-sess the quality of our visualisation w.r.t. productivitythrough commemoration aid.
• Each group is given a complex diagram. They are askedto look at it for 10 minutes. Then, the groups are givena set of diagrams showing similar situations. However,only one diagram is equivalent to the first one exceptfor some subtle changes in the relations between theentities shown. The task is to find this diagram. Thisexperiment aims at structure recognition. We expectthe 3D group to appoint the correct diagram in lesstime with a smaller error rate.
• Each group is given a complex diagram. They are askedto look at it for 10 minutes. Then, each group is givena list of entities (packages, classes, and interfaces) andasked to describe the relations between them within5 minutes times. This experiment aims at orientationwithin the code. We expect the 3D group to give moreaccurate answers in less time.
• Each group is given a class diagram. The task is toassess within 5 minutes time the effect the deletion ofa certain method from a specific class will have on thethe source code visualised. This experiment aims atassessing the relevance of classes in their associationcontext.
• Each group is given a set of three times three dia-grams showing three different views on three differentprojects. The task is to collate within 5 minutes thethree views belonging to the same project. This exper-iment aims at evaluating the qualitative assessment ofcode structures. We expect the UML group not to passthis test if package and class names are deleted fromthe diagrams, whereas the 3D group is then still ableto fulfill the task. In case the names are not deletedfrom the diagram, the UML group may finish this taskslightly faster.
• Each group is asked to add a new feature into theproduct visualised through a class diagram containingclasses, abstract classes, and interfaces. The task is toassess within 3 minutes the cost of this code change byestimating the number of classes and interfaces affectedby the change and to propose a change strategy (whichclass to adapt first to what, and so on). We expectthe 3D group to give more precise answers and proposebetter change strategies.
From these experiments we are expecting initial empiricalhints on the quality and effectiveness of our approach ad-dressing the enhancement of code comprehension for main-tenance purposes, and whether VisMOOS is supposed to bea useful reverse engineering tool. Nonetheless, since we al-ready use the tool in an industrial setting, we can alreadyreport on positive feedback and hope to corroborate it inthis ongoing study.
References
Alfert, K., Fronk, A., and Engelen, F. 2001. Expe-riences in 3-dimensional visualization of Java class rela-tions. Transactions of the SDPS: Journal of IntegratedDesign and Process Science 5, 3 (Sept.), 91–106.
Cook, D. J., and Holder, L. 2000. Graph-based datamining. Intelligent Systems and Their Applications 15, 2(Mar.), 32–41.

Dumas, J., and Redish, J. C. 1999. A Practical Guide toUsability Testing. Intellect Books.
Fronk, A., Bruckhoff, A., and Kern, M. 2006. 3d vi-sualisation of code structures in java software systems. InProceedings of the ACM Symposium on Software Visuali-sation, ACM SIGGRAPH, 145–146.
Lano, K., and Haughton, H. 1993. Reverse Engineer-ing and Software Maintenance: A Practical Approach.McGraw-Hill, Inc.
Mayrhauser, A., and Vans, A. M. 1993. From codeunderstanding needs to reverse engineering toolcapabili-ties. In Proceedings of the 6th International Workshop onComputer-Aided Software Engineering, 230–239.
Rekimoto, J., and Green, M. 1993. The InformationCube: Using Transparency in 3D Information Visualiza-tion. In Proceedings of the Third Annual Workshop onInformation Technologies & Systems, 125 – 132.
Rohr, O. 2004. Auswahl und Konstruktion von dreidimen-sionalen Visualisierungsmethoden zur Exploration objek-torientierter Softwaresysteme. Master’s thesis, LehrstuhlSoftware-Technologie, Universitat Dortmund, Germany.In German.