Embed Size (px)
Citation preview

EVAAS®/Value‐Added Frequently Asked Questions
EVAAS®/Value-Added Frequently Asked Questions
www.houstonisd.org/ASPIRE Copyright 2015 Houston Independent School District
Value-Added (General) ............................................................................................................................. 1
What is value-added analysis? ............................................................................................................ 1
For which teachers, grades, and subjects are there EVAAS® data? ............................................. 1
What exams are used to calculate EVAAS®? .................................................................................... 1
What versions of the STAAR tests are used in the analysis? ......................................................... 2
How will changing the Norm-Referenced Test (NRT) from Stanford/Aprenda to Iowa/Logramos affect EVAAS® analysis? ....................................................................................................................... 2
What are the required test properties for EVAAS® to be able to use a test? ................................ 2
Why can’t kindergarten, 1st, and 2nd grade teachers receive EVAAS® reports? ........................ 3
Why can’t 3rd grade science and social studies teachers receive EVAAS® reports? ................. 3
What happened in the EVAAS® analysis with the off-grade testers (7th–8th grade math and Algebra I)? ............................................................................................................................................... 3
How are changes in the timing of the administration of the standardized tests handled? .......... 3
Does HISD use data from the first or second test administration? ................................................. 3
Does value-added analysis take into consideration the circumstances of individual students (i.e., socio-economics, demographics, etc.)? ..................................................................................... 4
What about students who are chronically absent? ........................................................................... 4
When a school provides twice the instructional time to students in a subject, is that accounted for in the analysis? ................................................................................................................................. 4
Is it possible for teachers and schools to show academic growth with all groups of students (e.g., gifted, special education, low achieving)? ................................................................................ 4
If a teacher has a few struggling students in the classroom, will that impact his/her EVAAS® analysis? .................................................................................................................................. 5
How are value-added scores adjusted for students testing in Spanish or transitioning from Spanish testing to English testing? ...................................................................................................... 5
What is the difference between the growth measure, the gain index, and the gain score? ....... 5
What does standard error mean on my report? ................................................................................. 5
What is the minimum number of students used to generate a teacher EVAAS® report? ........... 6
Why can’t my value-added analysis be recalculated? ...................................................................... 6
Value-Added (STAAR Grades 3–8, MRM Analysis) ............................................................................. 7
How is EVAAS® calculated for teachers of students who take STAAR 3–8 and/or Stanford/Aprenda? ................................................................................................................................. 7
STAAR 3–8 and the Norm Referenced Test (Stanford/Aprenda or Iowa/Logramos) are such different tests. How can EVAAS® compare these tests? ................................................................. 7
EVAAS®/Value‐Added Frequently Asked Questions
EVAAS®/Value-Added Frequently Asked Questions
www.houstonisd.org/ASPIRE Copyright 2015 Houston Independent School District
What is an NCE? What is its relative advantage? ............................................................................. 7
Are all NCEs the same, or are the ones used by EVAAS® different? ............................................ 8
How is EVAAS® calculated if a student’s testing history is incomplete? ....................................... 8
What is a “3-year average?” ................................................................................................................. 8
If the “3-year average” is a better measure, why isn’t that used for ASPIRE awards? ............... 9
How could our campus change from green to red when there were no dramatic differences in instructional practice? ............................................................................................................................ 9
Value-Added (EOCs, Grades 7–12, URM Analysis) ............................................................................. 9
How is EVAAS® calculated for teachers of students who take the end-of-course (EOC) exams?................................................................................................................................................................... 9
What are Predicted Scores, Observed Scores, and Teacher Effect (in EOC analysis)? ......... 10
Why doesn’t the Teacher Effect on my EVAAS® report equal the Predicted Score minus the Observed Score? ................................................................................................................................. 10
How can predictions be made on how a student will score on the EOC when the student has never taken that subject before? ........................................................................................................ 10
Can predicted scores be different for the campus and for the teacher? ...................................... 11
What does the teacher report for teachers of students who take EOC exams include? ........... 11
What is the minimum number of prior test scores a student must have to be included in the EOC analysis? ...................................................................................................................................... 11
Which EOCs receive EVAAS®? ......................................................................................................... 11
What is a “2-year average?” ............................................................................................................... 11
Why do elementary and middle school teachers have a 3-year average, but high school teachers only have a 2-year average? .............................................................................................. 12
Value-Added (Teachers of Both STAAR 3–8 and STAAR EOCs, Grades 6–8, Receiving Both MRM and URM Analysis) ........................................................................................................................ 12
What will happen to the reports of teachers who taught 6th, 7th, and 8th grade students who tested above grade level? ................................................................................................................... 12
Student Progress Versus Student Achievement ................................................................................. 12
What is the difference between student achievement and student progress or growth? ......... 12
Last year, 50% of my students passed the test, and this year 80% of my students passed, but my EVAAS® is NDD (or negative). Didn’t I show growth by having more students pass? ....... 13
My students earn a perfect score every year. How can EVAAS® show gain for me? ............... 13
EVAAS® Reports and Data Usage ........................................................................................................ 14
Which EVAAS® reports are public? ................................................................................................... 14

EVAAS®/Value‐Added Frequently Asked Questions
EVAAS®/Value-Added Frequently Asked Questions
www.houstonisd.org/ASPIRE Copyright 2015 Houston Independent School District
How do I get access to EVAAS® data? ............................................................................................. 14
How long has HISD been using EVAAS® data? .............................................................................. 14
Which reports are most useful as a starting place for teachers? .................................................. 14
How do I interpret the campus and teacher reports? ..................................................................... 14
Why are the estimates on my value-added report from the previous year different on last year’s archived report and this year’s report? ............................................................................................. 15
What does it mean when a teacher has a value-added teacher gain index that is negative versus a gain index that is lower than -1? ..................................................................................................... 15
Which students are included in the School or Campus Value-Added reports? .......................... 15
There used to be a Teacher Reflections report on my EVAAS® report I found on the ASPIRE portal, but it’s not there this year. Where can I find that? ............................................................... 16
Why are there different numbers of students used in my Teacher Value-Added report and my Teacher Diagnostic report? ................................................................................................................ 16
How are student projections determined? ........................................................................................ 16
How can student projections help us and the student? .................................................................. 16
Is there research on the impact an individual teacher has on student learning? ....................... 17
How can I show high EVAAS® last year but not this year, when I did nothing different? .......... 17
How can EVAAS® information help teachers improve teaching and learning? .......................... 17
What can I do to improve my EVAAS® score? ................................................................................ 17
EVAAS®, HISD, and the A&D System .................................................................................................. 18
What are the advantages of including EVAAS® data as part of the Teacher Appraisal and Development System? ........................................................................................................................ 18
Why is EVAAS® weighted so heavily for appraisal purposes? ...................................................... 18
Linkage Questions ................................................................................................................................... 19
Why is my linkage different from what I submitted in May? ........................................................... 19
EVAAS®/Value‐Added Frequently Asked Questions
EVAAS®/Value-Added Frequently Asked Questions www.houstonisd.org/ASPIRE
Copyright 2015 Houston Independent School District 1
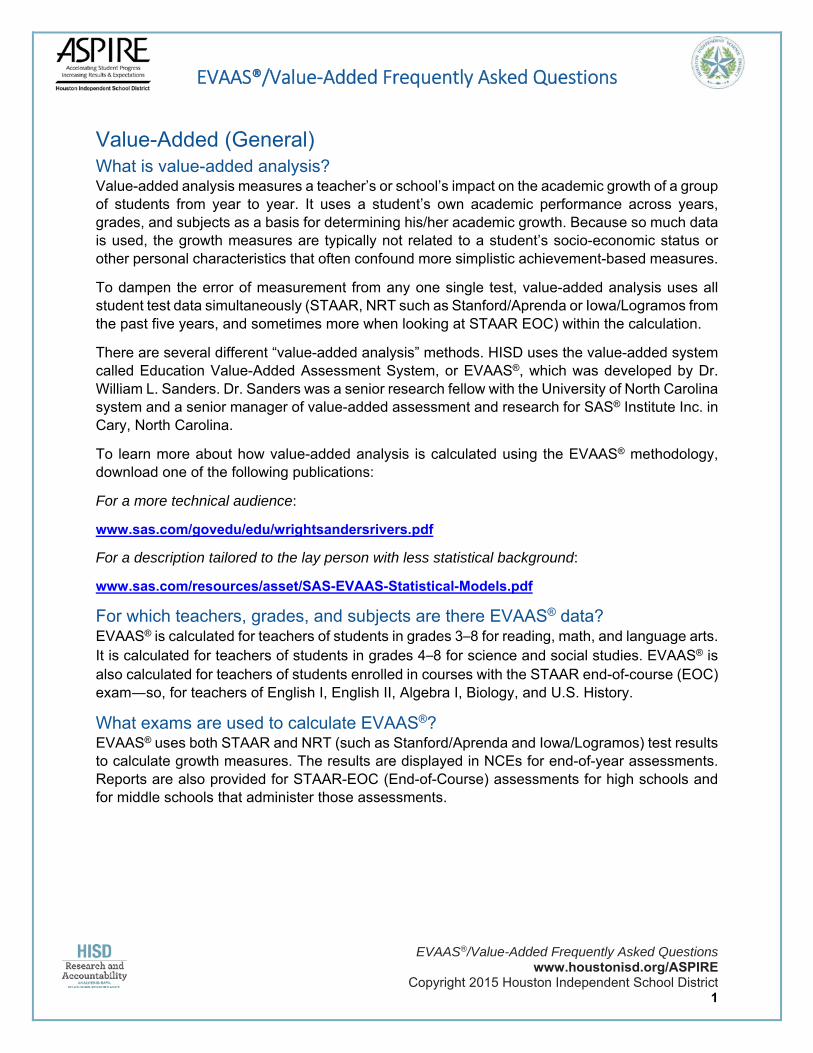
Value-Added (General) What is value-added analysis? Value-added analysis measures a teacher’s or school’s impact on the academic growth of a group of students from year to year. It uses a student’s own academic performance across years, grades, and subjects as a basis for determining his/her academic growth. Because so much data is used, the growth measures are typically not related to a student’s socio-economic status or other personal characteristics that often confound more simplistic achievement-based measures.
To dampen the error of measurement from any one single test, value-added analysis uses all student test data simultaneously (STAAR, NRT such as Stanford/Aprenda or Iowa/Logramos from the past five years, and sometimes more when looking at STAAR EOC) within the calculation.
There are several different “value-added analysis” methods. HISD uses the value-added system called Education Value-Added Assessment System, or EVAAS®, which was developed by Dr. William L. Sanders. Dr. Sanders was a senior research fellow with the University of North Carolina system and a senior manager of value-added assessment and research for SAS® Institute Inc. in Cary, North Carolina.
To learn more about how value-added analysis is calculated using the EVAAS® methodology, download one of the following publications:
For a more technical audience:
www.sas.com/govedu/edu/wrightsandersrivers.pdf
For a description tailored to the lay person with less statistical background:
www.sas.com/resources/asset/SAS-EVAAS-Statistical-Models.pdf
For which teachers, grades, and subjects are there EVAAS® data? EVAAS® is calculated for teachers of students in grades 3–8 for reading, math, and language arts. It is calculated for teachers of students in grades 4–8 for science and social studies. EVAAS® is also calculated for teachers of students enrolled in courses with the STAAR end-of-course (EOC) exam―so, for teachers of English I, English II, Algebra I, Biology, and U.S. History.
What exams are used to calculate EVAAS®? EVAAS® uses both STAAR and NRT (such as Stanford/Aprenda and Iowa/Logramos) test results to calculate growth measures. The results are displayed in NCEs for end-of-year assessments. Reports are also provided for STAAR-EOC (End-of-Course) assessments for high schools and for middle schools that administer those assessments.
EVAAS®/Value‐Added Frequently Asked Questions
EVAAS®/Value-Added Frequently Asked Questions www.houstonisd.org/ASPIRE
Copyright 2015 Houston Independent School District 2
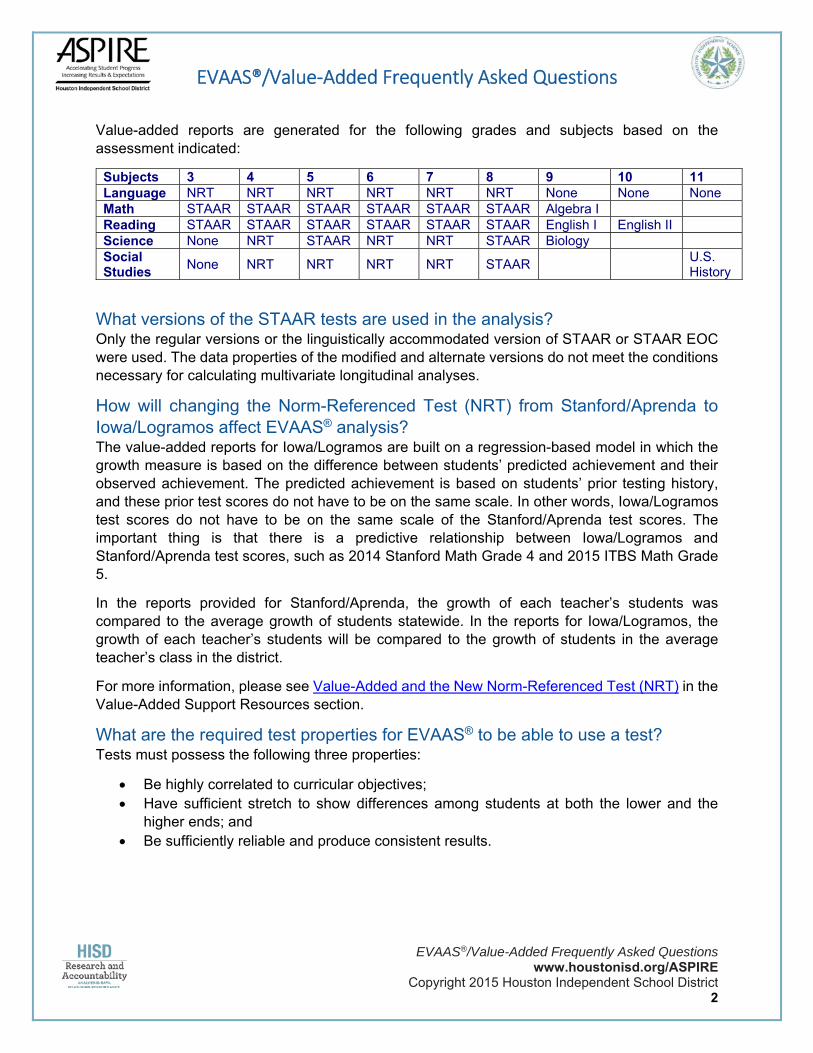
Value-added reports are generated for the following grades and subjects based on the assessment indicated:
Subjects 3 4 5 6 7 8 9 10 11 Language NRT NRT NRT NRT NRT NRT None None None Math STAAR STAAR STAAR STAAR STAAR STAAR Algebra I Reading STAAR STAAR STAAR STAAR STAAR STAAR English I English II Science None NRT STAAR NRT NRT STAAR Biology Social Studies
None NRT NRT NRT NRT STAAR U.S. History
What versions of the STAAR tests are used in the analysis? Only the regular versions or the linguistically accommodated version of STAAR or STAAR EOC were used. The data properties of the modified and alternate versions do not meet the conditions necessary for calculating multivariate longitudinal analyses.
How will changing the Norm-Referenced Test (NRT) from Stanford/Aprenda to Iowa/Logramos affect EVAAS® analysis? The value-added reports for Iowa/Logramos are built on a regression-based model in which the growth measure is based on the difference between students’ predicted achievement and their observed achievement. The predicted achievement is based on students’ prior testing history, and these prior test scores do not have to be on the same scale. In other words, Iowa/Logramos test scores do not have to be on the same scale of the Stanford/Aprenda test scores. The important thing is that there is a predictive relationship between Iowa/Logramos and Stanford/Aprenda test scores, such as 2014 Stanford Math Grade 4 and 2015 ITBS Math Grade 5.
In the reports provided for Stanford/Aprenda, the growth of each teacher’s students was compared to the average growth of students statewide. In the reports for Iowa/Logramos, the growth of each teacher’s students will be compared to the growth of students in the average teacher’s class in the district.
For more information, please see Value-Added and the New Norm-Referenced Test (NRT) in the Value-Added Support Resources section.
What are the required test properties for EVAAS® to be able to use a test? Tests must possess the following three properties:
Be highly correlated to curricular objectives; Have sufficient stretch to show differences among students at both the lower and the
higher ends; and Be sufficiently reliable and produce consistent results.

EVAAS®/Value‐Added Frequently Asked Questions
EVAAS®/Value-Added Frequently Asked Questions www.houstonisd.org/ASPIRE
Copyright 2015 Houston Independent School District 3
Why can’t kindergarten, 1st, and 2nd grade teachers receive EVAAS® reports? Value-added analysis is not available in kindergarten and 1st grade because the testing in these grades does not meet the minimum requirements for use in EVAAS® analysis. Second grade analysis is not available because no reliable baseline measures are available in kindergarten and 1st grade.
Why can’t 3rd grade science and social studies teachers receive EVAAS® reports? Although the NRT (Stanford/Aprenda or Iowa/Logramos) test on “environment” in 1st and 2nd grade, those “environment” test results do not correlate well enough to the NRT science and social studies tests which are administered separately in later grades to be able to use these results in the analysis.
What happened in the EVAAS® analysis with the off-grade testers (7th–8th grade math and Algebra I)? Starting in 2012, there were differences in the test population of 7th and 8th grade math students. Many accelerated 7th grade students actually tested at the 8th grade level, essentially making them function within the analysis as 8th grade math students with no prior consecutive testing history in math. This means they carry less weight in the analysis of 8th grade math, and the 7th grade math analysis lost a significant number of his/her students. At the same time, many high-achieving 8th graders were also removed from the analysis at 8th grade because they switched to Algebra I and took the EOC exam, instead of the 8th grade math STAAR exam. Campuses are still able to receive analyses for 7th and 8th grade math using the MRM and for Algebra I using the URM. Modifications were made for teachers of these students to ensure that they could also receive the appropriate analyses (see page 13).
How are changes in the timing of the administration of the standardized tests handled? HISD provides EVAAS® with the NRT (like Stanford or Iowa) data and the state test (like STAAR) data every year. In creating the new NCE distribution, the scores are statistically adjusted to account for an earlier administration (if any) based on the previous year’s relationship between the NRT and state test data.
Does HISD use data from the first or second test administration? HISD uses data from a student’s first test administration for EVAAS® analysis. Using the student’s first test administration provides a fairer comparison to ensure a more valid value-added measure. Using the second test administration would create statistical errors. Additionally, many students who do not score well on the first test administration receive intensive intervention between the first and second test administration. This would create an unfair advantage and bias within the data.

EVAAS®/Value‐Added Frequently Asked Questions
EVAAS®/Value-Added Frequently Asked Questions www.houstonisd.org/ASPIRE
Copyright 2015 Houston Independent School District 4
Does value-added analysis take into consideration the circumstances of individual students (i.e., socio-economics, demographics, etc.)? At the student level, by including all of a student’s testing history, each student serves as his/her own “control” in value-added analysis. This means that the EVAAS® analysis measures students’ progress over time and compares the group’s performance in the most recent year to their own prior performance. This also accounts for extenuating circumstances that might affect measurement from any one single test.
EVAAS® uses all student test data simultaneously within the calculation, which minimizes measurement error. Therefore, to the extent that socio-economic status or demographic influences persist over time, they are already represented within the student’s own data that is used to measure the growth in his/her academic achievement from one year to the next. This means there is no need to adjust for these influences. This has been confirmed through research by other leading experts in the field who are independent from EVAAS® researchers.
What about students who are chronically absent? It is important for the district, schools, and teachers to be responsible toward all students and to be held accountable to get students to come to class in whatever way they can. In HISD, the policy decision was made to not include student absence/attendance in the calculations or in the student-teacher linkage process because we are all accountable for all students enrolled in our district.
When a school provides twice the instructional time to students in a subject, is that accounted for in the analysis? EVAAS® reporting takes into account the percentage of instructional time that each instructor has for each student in a particular subject/grade/year. Through the student-teacher linkage system on the ASPIRE portal each spring, teachers are asked to assign percentage of instruction to their students. If a teacher is the only one responsible for teaching a particular student, the teacher is “credited” with 100% of the instruction. If two or more teachers share instruction of a student, each teacher is “credited” with the appropriate percentage of instruction (for example, 50% of instruction each).
In terms of the length of time (one hour versus two hours, for example), however, that is ultimately a policy decision by the schools (how much time is allocated for each subject). The analysis does not take into account the length of time for each block, based on the assumption that all schools are making instructional decisions to best serve the needs of their students.
Is it possible for teachers and schools to show academic growth with all groups of students (e.g., gifted, special education, low achieving)? Yes, it is possible for teachers and schools to facilitate high levels of value-added progress with all groups of students. EVAAS® is sensitive to individual students’ achievement levels. It measures student growth from the end of one year to the end of the next year, regardless of whether a student performs above, at, or below grade level. Keep in mind that each student serves as his/ own “control” in value-added analysis. This means that the EVAAS® analysis measures a student’s progress over time and compares that student’s performance in the most recent year to his/her own prior performance.
EVAAS®/Value‐Added Frequently Asked Questions
EVAAS®/Value-Added Frequently Asked Questions www.houstonisd.org/ASPIRE
Copyright 2015 Houston Independent School District 5
If a teacher has a few struggling students in the classroom, will that impact his/her EVAAS® analysis? The EVAAS® methodology used in HISD uses students’ own individual performance as the basis for assessing academic growth from year to year. It measures student growth from the end of one year to the end of the next year, regardless of whether the student performs above, at, or below grade level. Each student serves as his/her own “control” in value-added analysis. The EVAAS® analysis measures student progress over time and compares their performance in the most recent year to their own prior performance. So, if students have been “struggling” (or lower performing) for several years, those students would not necessarily adversely affect a teacher’s EVAAS® analysis. On the other hand, if students had historically performed well and had just begun struggling this year, those students would likely impact the EVAAS® analysis for the teacher.
How are value-added scores adjusted for students testing in Spanish or transitioning from Spanish testing to English testing? All Spanish scores are “mapped” to an English scale. To make these adjustments, EVAAS® uses as much student data and information as possible, including NRT (like Stanford) and state (like STAAR) test data to create relationships between all students’ previous and current test scores. By doing this, the information tells us what students would have likely scored had they taken the test in English. The scales for the “Spanish to English” students can then be adjusted so that their progress is equivalent to that of the “English to English” students.
A more complete explanation can be found on the ASPIRE portal in the Value-Added Resources section, here.
What is the difference between the growth measure, the gain index, and the gain score? A growth measure is a conservative estimate of students’ academic progress. For grades 3–8, it is expressed in state NCEs using the current year distribution. For EOCs, it is expressed in scale score units specific to the scale of the test.
The gain index is the growth measure divided by the standard error. A positive gain indicates that the district, school, or teacher made more progress than the state average, whereas a negative gain indicates that less progress was made than the state average. The gain score (found on ASPIRE award notices) is used interchangeably with “gain index.”
What does standard error mean on my report? Standard error is a measure of uncertainty. Larger standard errors mean there is more uncertainty about your influence on your students’ academic progress. Standard error is influenced by the number of total students in your analysis and how many scores each student has across years and subjects. If all other variables are the same, teachers with fewer students will have larger standard errors. Additionally, claiming a small percentage of instructional time for a student group effectively reduces the number of students in the analysis.
EVAAS®/Value‐Added Frequently Asked Questions
EVAAS®/Value-Added Frequently Asked Questions www.houstonisd.org/ASPIRE
Copyright 2015 Houston Independent School District 6
This makes sense from a practical standpoint. If you were going to buy a 10-pound bag of potatoes, but weren’t sure of the quality, would you prefer to test only one potato, or more? If you tested only one potato, you would be more uncertain of the quality of the bag (higher standard error). If you tested 30 potatoes, you would be more certain (less uncertain) of the quality of the bag (lower standard error). However, regardless of whether you tested one potato or 30 potatoes, you would still be pretty sure the bag was full of potatoes, and not tennis shoes!
Accounting for the standard error helps to protect teachers from being identified as “ineffective” or as “effective” when more information is needed to determine the teacher effect. This also gives us more certainty when a teacher is classified as “effective” or as “ineffective.”
What is the minimum number of students used to generate a teacher EVAAS® report? In order to receive a value-added report, teachers must have linked a minimum of seven "effective" students per subject and grade level. An "effective" student is defined as one tested student (tested on the “regular” or “L” version of the STAAR) claimed at 100% time for the full school year. There are many ways a teacher might reach the minimum threshold of seven effective students. For example, a teacher might link seven tested students at 100% time for the whole school year, or 14 tested students at 50% time for the whole school year, or 70 tested students at 20% time for half of the school year.
Why can’t my value-added analysis be recalculated? EVAAS® uses all of the data simultaneously in a complicated data array to construct a multivariate response model (MRM) for grades 3–8 or a univariate response model (URM) for end-of-course (EOC) exams. MRM is a layered multivariate longitudinal linear mixed model that produces an estimate of value-added growth that minimizes selection bias and errors associated with measurement. Like the MRM, the URM uses all available test data, but it not longitudinal. These analyses employ sophisticated software and many layers of calculations. Once completed, any re-analysis can only occur at the system level. What this means is that if we change information for one teacher, we would have to re-run the analysis for the entire district, which has two effects: one, this would be very costly for the district, as the analysis itself would have to be paid for again; and two, this re-analysis has the potential to change all other teachers’ reports.
During the teacher linkage period, a heavy emphasis is placed upon correct and appropriate linkage and the importance of the linkages provided. HISD’s Research department offers a number of work group opportunities during the linkage period in the spring to assist teachers, campus support team members, and principals in ensuring the most accurate linkages are provided. As long as a student is linked to your class for any time in the year, he/she will be included in the analysis if he/she tested in that subject. The value-added analysis that is calculated reflects the students linked at the percentages for which those students were linked.

EVAAS®/Value‐Added Frequently Asked Questions
EVAAS®/Value-Added Frequently Asked Questions www.houstonisd.org/ASPIRE
Copyright 2015 Houston Independent School District 7
Value-Added (STAAR Grades 3–8, MRM Analysis) How is EVAAS® calculated for teachers of students who take STAAR 3–8 and/or Stanford/Aprenda? EVAAS® uses a multivariate response model (MRM), which is a “multivariate, longitudinal, linear mixed model.” It has been used in grades 3–11 for TAKS, STAAR 3–8, and Stanford/Aprenda data since the district adopted EVAAS®, and is still mostly used for grades 3–8 for STAAR and Stanford/Aprenda. It is the preferred approach when the test data meet certain required conditions.
For subjects that are tested in consecutive grades (e.g., 4th and 5th grade reading), a mean gain score is calculated for the most recent year using a statistical model that uses all student test scores. This gain indicates whether the students’ average achievement increased, decreased, or remained about the same relative to the state distribution for that grade and subject. These analyses are done specifically for each grade and subject (e.g., 3rd grade reading, 4th grade reading, etc.).
In previous years, the teacher gain index was calculated based on a comparison of the teacher’s growth measure to the average growth of students districtwide. Beginning in 2013, the index is calculated based on a comparison of the teacher’s growth measure to the growth standard, which represents the average growth of students statewide.
STAAR 3–8 and the Norm Referenced Test (Stanford/Aprenda or Iowa/Logramos) are such different tests. How can EVAAS® compare these tests? State test data from STAAR and the NRT (Stanford/Aprenda at this time) are converted to normal curve equivalent (NCE) scores and anchored to the current state test distribution each year. This enables value-added scores to be tied to a stable and consistent scale.
What is an NCE? What is its relative advantage? The normal curve equivalent, or NCE, is a way of measuring where a score falls along the normal curve. The NCE values displayed in the EVAAS® reports run from 1 to 9. They are similar to percentile ranks in that they indicate an individual student’s rank, or how many students out of a hundred had a lower score. NCE scores have a major advantage over percentile rank scores in that they can be averaged. That is an important characteristic when studying overall school performance and, in particular, in measuring school‐wide gains and losses in student achievement.
In a normally distributed population, if all students were to make exactly one year of progress after one year of instruction, then their NCE scores would remain exactly the same and their NCE gain would be zero, even if the difference in their raw scores (i.e. the number of questions they answered correctly) or scale scores were not zero. When a group of students makes more than a year’s progress in that time, the value-added report will display a positive gain expressed in NCEs, which means that those students have learned more, or at least have made more progress in the areas tested, than their peers statewide. Other students, while making progress in their skills, may progress more slowly than the general population and will show a net loss in their NCE ranks, which will display as a negative gain expressed in NCEs on the value-added report.

EVAAS®/Value‐Added Frequently Asked Questions
EVAAS®/Value-Added Frequently Asked Questions www.houstonisd.org/ASPIRE
Copyright 2015 Houston Independent School District 8
Are all NCEs the same, or are the ones used by EVAAS® different? No, not all NCEs are the same. NCEs are a statistical construct that have meaning only to the population for which they were constructed. Starting in 2012, EVAAS® maps HISD’s annual state test data and NRT (Stanford/Aprenda) distributions onto the current state distribution as a standard. In other words, the scale scores for STAAR tests in 2012 are mapped to NCEs using the state distribution in 2013. The NRT (Stanford/Aprenda) scale scores are mapped to state-based NCEs using the relationship of STAAR and NRT tests where those tests are administered in the same subject and grade.
How is EVAAS® calculated if a student’s testing history is incomplete? A common problem with using test scores is missing data. There are many reasons for this. For example, a student could move into the school district this year, a record could be lost, or a student could be sick on test day. The EVAAS® MRM uses the correlations among all scores across years, grades, and subjects in the data we have to estimate the average achievement of the population of students served by a school or teacher in each grade and subject each year as if there were no missing data.
Students who have no standardized test scores for the year in which the analysis are conducted are not included the teachers’ EVAAS® calculation for that year. However, if a student has one or more test scores for the year in which analyses are conducted (for example, the student has math test data, but is missing reading data), the method described above can be used.
The EVAAS® methodology uses up to five years of a student’s testing history to calculate the correlation between current and previous scores.
For more information, as well as an example, please visit this page on the SAS® website.
What is a “3-year average?” The “3-year average” on the teacher reports is the average across three years of value-added growth. With multiple subjects, grades, or years of data, there is more certainty about the effectiveness of a district, school, or teacher. Accordingly, the standard error for either the teacher composite or the multi-year index is typically smaller than those for an individual subject/grade/year. As a result, teacher composite and multi-year index values may differ from the simple average of single-year measures.
A “3-year average” will be more stable, given that we have more information across time, as well as that the standard error is smaller. “Stability” indicates the extent to which teacher estimates remain at the same level over time―not at the exact same index or gain number. EVAAS® researched the stability of teacher estimates and found that teachers identified as highly effective after their first three years of teaching were extremely likely to remain highly effective three years into the future. Furthermore, approximately half of teachers identified as ineffective based on three-year estimates will have improved in three years and be identified as average or above average in terms of their effectiveness. Please note this study has not yet been published.

EVAAS®/Value‐Added Frequently Asked Questions
EVAAS®/Value-Added Frequently Asked Questions www.houstonisd.org/ASPIRE
Copyright 2015 Houston Independent School District 9
If the “3-year average” is a better measure, why isn’t that used for ASPIRE awards? ASPIRE awards are calculated using single-year data because we are awarding teachers for student growth in a given year. In addition, the single-year data allows for adjustments to be made to what subject(s) a teacher is responsible for teaching and awards what they were doing in that single year. As an example, a teacher may have been teaching 4th grade reading and 4th grade math in year one. When value-added analyses were reviewed, the teacher and principal decided that the teacher’s reading growth was fantastic, but that the math growth was not. When the award was calculated for year one, it was based on both reading and math EVAAS®. A decision might be made to make the teacher a 4th grade reading only teacher in year two. In year two, shouldn’t that teacher be awarded for just reading? This is why we use single-year estimates for ASPIRE awards.
How could our campus change from green to red when there were no dramatic differences in instructional practice? From 2007–2011, HISD has used a “base year” approach to measuring growth with respect to the state distribution in 2006. The transition from TAKS to STAAR, as well as wanting an approach that would be more similar to the analysis that measures growth on EOCs, provided the impetus for HISD to move to an “intra-year” approach in 2012. HISD growth is now measured with respect to the state in the current year rather than to a single snapshot in time (which was how the state performed in 2006). For years, HISD has been increasing annually in growth compared to how the state did in 2006. However, for years the state has been increasing annually as well. We expected to see changes in the new reports, and as part of that, far more “red” across the district.
Transitioning to a new, more rigorous test with more stretch (STAAR) is also challenging in and of itself, and some of the changes are due to this alone, even if the district had not updated to a new growth standard.
Value-Added (EOCs, Grades 7–12, URM Analysis) How is EVAAS® calculated for teachers of students who take the end-of-course (EOC) exams? EVAAS® uses a univariate response model (URM), which is similar to what is called an “analysis of covariance (ANCOVA)” in statistics: student scores in a particular subject/grade/year serve as the “response” or “dependent” variable and these students’ prior scores in multiple subjects/grades/years serve as the “covariates” (predictor variables or independent variables). This model is used when test data do not meet the requirements for MRM analysis (consecutive grade/subject testing). The URM model is similar to the model that EVAAS® has been using to provide student projection scores (e.g., SAT and PSAT projections). EVAAS® has been using the URM for STAAR end-of-course (EOC) exams (e.g., Algebra I, Biology, etc.). The relationships between any previous grade/subject scores and the EOC are used to mathematically “predict” performance on the EOC. The growth measure is the difference between the predicted and the actual scores for the EOC students.
EVAAS®/Value‐Added Frequently Asked Questions
EVAAS®/Value-Added Frequently Asked Questions www.houstonisd.org/ASPIRE
Copyright 2015 Houston Independent School District 10
The EVAAS® Growth Measure, also called the School Effect, is the Observed Score minus the Predicted Score. The Growth Measure is divided by the Standard Error to calculate the teacher index, or teacher gain score. Beginning in 2013, EVAAS® has been able to use data from a consortium of participating Texas school districts that allowed it to increase the distribution of scale scores and create a new reference group that includes multiple Texas districts. This allows HISD to compare itself to a larger growth standard that includes more students, teachers, and schools than just those found in HISD.
What are Predicted Scores, Observed Scores, and Teacher Effect (in EOC analysis)? The predicted score is what the analysis predicts that a group of students will receive based on all of their previous testing history. Previous testing history includes all subjects, grade levels, and tests; so it could include STAAR grades 3–8 reading, math, science, and/or social studies, prior EOC assessments (if any), and NRT (such as Stanford/Aprenda or Iowa/Logramos) grades 1-8 reading, language arts, math, science, and/or social studies. For subject/grades that test in both STAAR and NRT, only the STAAR testing is used. Currently, the model uses up to five years of data, but moving forward, all data available will be used.
The Observed or Actual Score is the average of just the scores on the specific EOC test that the analysis is measuring.
The Teacher Effect is a function of the difference between the Predicted Score and the Observed Score.
Why doesn’t the Teacher Effect on my EVAAS® report equal the Predicted Score minus the Observed Score? EVAAS® uses shrinkage estimation to protect schools and teachers, particularly those who serve small numbers of students, from the effects of outliers and other anomalies on the tests. You wouldn’t want this year’s performance to be compared to a student’s “lucky bubbling” from the previous year any more than you would want a student’s bad experience right before testing day for your class to influence your growth directly. In this protective stage of the analysis, students’ scores are assumed to be closer to the middle until the evidence pulls them away, either above or below average.
More information on shrinkage estimation is available here, on page 4.
How can predictions be made on how a student will score on the EOC when the student has never taken that subject before? EVAAS® exploits the relationships that exist between all tests in order to make a robust prediction of student growth expectations. There is a relationship between how a student does on one subject and how that students does on the other subjects. These relationships will be different strengths; for instance, it is likely that there is a stronger relationship between Algebra I and 8th grade math than between Algebra I and 7th grade social studies. However, the relationship is still there and is used by the analysis to make the best prediction of expected student growth.
EVAAS®/Value‐Added Frequently Asked Questions
EVAAS®/Value-Added Frequently Asked Questions www.houstonisd.org/ASPIRE
Copyright 2015 Houston Independent School District 11
Can predicted scores be different for the campus and for the teacher? Yes, predicted scores are different for the campus than they are for the teacher, even if the teacher is the only one on the campus who teaches a particular EOC. This is due to the fact that the analysis model for campuses is different from the analysis model for teachers. A predicted score is generated in the teacher analysis given the “average teacher” experience where all HISD EOC teachers of a particular subject are the unit of analysis. For campuses, however, a predicted score is generated in the school analysis given the “average school experience” where all campuses that offer a particular EOC are the unit of analysis.
What does the teacher report for teachers of students who take EOC exams include? The end-of-course teacher report, or URM report, is very similar to the grade 3‒8 MRM report. The subjects are reported separately and the reports include the number of students used in the analysis. Unlike the MRM report, the URM report displays the average student score and the average predicted score. These report scores are displayed in actual test scale units, not in Normal Curve Equivalent (NCE) units.
What is the minimum number of prior test scores a student must have to be included in the EOC analysis? A student must have at least three prior test scores from any grade and subject to be included.
Which EOCs receive EVAAS®? For the 2013–2014 school year, the following EOCs were used for EVAAS® analysis: Algebra I; English I; English II; Biology; U.S. History. In 2011–2012 and 2012–2013, additional EOC exams were used; however, the state of Texas voted to reduce the number of EOC exams required. EVAAS® uses the five exams that are required by the state.
What is a “2-year average?” The “2-year average” on the teacher reports is the average across two years of value-added growth. With multiple subjects and/or years of data, there is more certainty about the effectiveness of a district, school, or teacher. Accordingly, the standard error for either the teacher composite or the multi-year measure is typically smaller than those for an individual subject/year. As a result, teacher composite and multi-year index values may differ from the simple average of single-year measures.
A “2-year average” will be more stable, given that we have more information across time, as well as that the standard error is smaller. “Stability” indicates the extent to which teacher estimates remain at the same level over time―not at the exact same index or gain number. EVAAS® recently researched the stability of teacher estimates and found that teachers identified as highly effective after their first three years of teaching were extremely likely to remain highly effective three years into the future. Furthermore, approximately half of teachers identified as ineffective based on three-year estimates will have improved in three years and be identified as average or above average in terms of their effectiveness. Please note this study has not yet been published.
EVAAS®/Value‐Added Frequently Asked Questions
EVAAS®/Value-Added Frequently Asked Questions www.houstonisd.org/ASPIRE
Copyright 2015 Houston Independent School District 12
Why do elementary and middle school teachers have a 3-year average, but high school teachers only have a 2-year average? In 2012, the growth measures for the end-of-course subjects were generated based on the district distribution; in 2013, a larger distribution was used. This larger reference group includes multiple Texas districts, and is referred to as the Texas Consortium of Schools. Because the distribution changed from 2012 to 2013, we can only calculate a 2-year average at this time. For the 2015 analyses, a 3-year average will be able to be calculated.
Value-Added (Teachers of Both STAAR 3–8 and STAAR EOCs, Grades 6–8, Receiving Both MRM and URM Analysis) What will happen to the reports of teachers who taught 6th, 7th, and 8th grade students who tested above grade level? At the campus level, high numbers of students who tested above grade level led to no EVAAS® report being possible for some campuses in 7th grade math. While the students who are included in these reports are still in the 8th grade report, teachers of only these students would also not have received value-added reports using the multivariate response model (MRM) methodology, because their classes do not have the required number of students with at least one prior consecutive math test score.
The district requested that EVAAS® calculate the value-added results for these teachers using the same methodology as is used for teachers of end-of-course (EOC) subjects, which is the univariate response model (URM). The URM does not require consecutive grade-level testing. If a teacher had at least seven tested students at a given grade and subject, but those students were “off-grade,” the teacher can now receive an EVAAS® report using the URM instead, for just that grade and subject. The teacher gain index will be based on a combination of all of their grades in that subject as it is usually done, but it is composited across analysis methodologies in addition to being cumulative for all of their grades taught.
Student Progress Versus Student Achievement What is the difference between student achievement and student progress or growth? In education, the words “achievement” and “progress” are often used interchangeably. However, their meanings are very different.
Achievement is measured by the students’ performance at a single point in time and how well those students perform against a standard. Achievement has typically been measured by students’ performance on state tests (such as STAAR)―how well students perform in relation to state standards. Achievement measures a student’s performance at a single point in time. It compares the students’ performance to a set standard, and is critical to ensuring a student’s future academic success.
EVAAS®/Value‐Added Frequently Asked Questions
EVAAS®/Value-Added Frequently Asked Questions www.houstonisd.org/ASPIRE
Copyright 2015 Houston Independent School District 13
Progress is measured by how much gain or growth students make over time (i.e., year to year). If a student’s achievement level is measured annually using state tests (like STAAR) or nationally normed tests (like Stanford or Iowa), the student’s progress, or growth, can be measured. Progress is measured over time―at least two points in time. It compares students’ performance to their own prior performance, and is critical to ensuring a student’s future academic success.
Using both student progress and student achievement provides us with a more complete picture of student learning.
Last year, 50% of my students passed the test, and this year 80% of my students passed, but my EVAAS® is NDD (or negative). Didn’t I show growth by having more students pass? Not necessarily, no. Remember that passing percentages are an indication of how many students met the minimum standard, and are a measure of student achievement. EVAAS® is a measure of student growth. Student growth is estimated by comparing a student’s current performance to his/her own prior performance. So, just because more kids passed does not mean those kids grew as much, or even at all! It all depends on how those kids did, compared to themselves, from year to year.
Think of it this way. The standard for height for the grade and subject I teach is 4 feet 3 inches. If I got a classroom of students who all measured 4 feet tall at the beginning of the school year, and at the end of the school year they measured 4 feet 2 inches tall, they all failed to meet the standard, right? So, I had a 0% passing rate! The next year, I got a classroom of students who all measured 4 feet 6 inches at the beginning of the school year, and at the end of the school year, they measured 4 feet 4 inches. Every one of my kids met the standard, so I had a 100% passing rate. But who grew more over the course of the school year: the kids who failed to meet the standard, but increased in height by 2 inches each, or the kids who met the standard but decreased in height by 2 inches each?
Remember that EVAAS® is a measure of student growth―how much a child grows and changes/improves over time.
My students earn a perfect score every year. How can EVAAS® show gain for me? It is important to understand that EVAAS® is not calculated at the individual student level due to the large amount of measurement error associated with any one student’s test score. EVAAS® analysis compares a group of students’ average normal curve equivalent (NCE) this year to their average NCE from the prior year (see FAQ “What is an NCE?”). In addition, the proportion of students who actually score a perfect score two years in a row on the state test (STAAR) and/or the norm-referenced test (like Stanford or Iowa) is minimal.
EVAAS®/Value‐Added Frequently Asked Questions
EVAAS®/Value-Added Frequently Asked Questions www.houstonisd.org/ASPIRE
Copyright 2015 Houston Independent School District 14
EVAAS® Reports and Data Usage Which EVAAS® reports are public? All district and campus value-added reports and scatter plots are made public, but not lower levels, like individual teachers and students, or diagnostic reports which are for instructional use.
How do I get access to EVAAS® data? District and campus value-added reports are available to the public through the ASPIRE portal. Access to student value-added data for campus educators is determined by each campus principal.
How long has HISD been using EVAAS® data? HISD has been using value-added data since 2007 and has been providing ongoing professional development and support in the use of value-added information in our school improvement efforts to evaluate program quality and inform instruction. In addition, since 2007, the district has been using campus-and teacher-level value added data to award performance bonuses to teachers, administrators, and other campus-based staff through the ASPIRE Award Program. The HISD Board of Education has approved including value-added as one of 34 performance measures in its teacher evaluation system.
Which reports are most useful as a starting place for teachers? Teachers should start with their own individual reports, which include the Value-Added and Diagnostic reports for the subjects and grades that they taught. Teachers also have the ability to look at individual students, as long as those students are enrolled at their campus, so that the teacher can use the Student Projection reports to inform instruction of their current students.
How do I interpret the campus and teacher reports? HISD has been working in partnership with EVAAS® to create online professional development to continue to build teacher and administrator understanding of EVAAS® data and the various reports to inform instruction. At this time, the following training modules are available by logging on to the EVAAS® site (https://hisd.sas.com/) and clicking on e-Learning (upper right side of the screen):
District/School Value-Added―Gain Model District/School Value-Added―Predictive Methodology Teacher Value-Added and Diagnostics District/School Diagnostics Student Reports (includes Student Projections) Decision Dashboard Teacher Reports for Admins Student Search and Custom Student Reports Discussing the EVAAS® Teacher Reports

EVAAS®/Value‐Added Frequently Asked Questions
EVAAS®/Value-Added Frequently Asked Questions www.houstonisd.org/ASPIRE
Copyright 2015 Houston Independent School District 15
Over the course of the current school year (2014–2015), the following training modules will be added:
Projection Summaries Scatterplots School Search
In addition to being available on the e-Learning page, the appropriate training module is often available on the specific page to which it pertains.
Why are the estimates on my value-added report from the previous year different on last year’s archived report and this year’s report? Each year, value-added information becomes more robust as more longitudinal data is included in the value-added analysis. In statistical terms, “robust” means resistant to errors in the results. Adjustments are made to historical value-added data to ensure a fair comparison from one year to the next. That means that the current value-added reports may reflect different numbers for previous years than when it was originally reported.
Please note that data for the teacher appraisal and development system and for the ASPIRE awards are based on the data available at the time they are calculated. What this means is that if your gain index for 2013 was originally reported as 0.9 and you did not receive an ASPIRE award for the individual teacher component, but on your 2014 report the 2013 gain index is now reported as a 1.0, your 2013 ASPIRE award will not be re-calculated, and your 2013 appraisal will not be re-evaluated.
What does it mean when a teacher has a value-added teacher gain index that is negative versus a gain index that is lower than -1? When a teacher gain index is between -1 and +0.99, this indicates that the progress made by the teacher’s students was not detectably different (NDD) from the state as a whole. This indicates that, when compared to the state distribution, the teacher effectiveness level was average, or about the same as most other teachers in the state. A teacher gain index less than -1 means that, on average, students taught by the teacher made less progress than other students state-wide.
Which students are included in the School or Campus Value-Added reports? All students who tested on a campus in the 2013–2014 year are used to calculate the 2014 value-added estimates for the campus. On School Diagnostic reports, some students don’t have enough data to be included in an achievement group. For tests and subjects analyzed with MRM, students must have a score in the selected subject in the most recent year and the previous year to be included. For tests and subjects analyzed with URM, students must have a predicted score to be included. Students with fewer than three prior test scores across grades and subjects will not have a predicted score.
EVAAS®/Value‐Added Frequently Asked Questions
EVAAS®/Value-Added Frequently Asked Questions www.houstonisd.org/ASPIRE
Copyright 2015 Houston Independent School District 16
There used to be a Teacher Reflections report on my EVAAS® report I found on the ASPIRE portal, but it’s not there this year. Where can I find that? The reports available on the ASPIRE portal are primarily for archival purposes. Teachers should log into EVAAS to view a fully interactive report, which provides a plethora of additional information, including student data, teacher diagnostic reports, distributions of teachers, and more. We strongly encourage all users to access their value-added reports via the EVAAS site, as many new features have been added to the reporting. The teacher reports are more dynamic and bring together seamless navigation with collaborative information on one page. Teacher Reports can be used to support teachers' growth as practitioners and facilitate professional dialogue.
To do so, go to https://hisd.sas.com/ and follow the instructions for logging on to the EVAAS® site. Under the “Reports” link in the upper left-hand corner, look for the “Teacher Effectiveness Reports” to see your enhanced teacher and diagnostic (or “reflection”) reports.
Why are there different numbers of students used in my Teacher Value-Added report and my Teacher Diagnostic report? A teacher’s value-added report includes all of the students for whom the teacher was linked for any portion of instructional time (through the ASPIRE portal during the Linkage and Verification period) and who have a test record in that subject for that year. However, some students don’t have enough data to be included in an achievement group on the Diagnostic report. For tests and subjects analyzed with MRM, students in the Diagnostic report must have a test score for this subject in this year and in the prior year for this subject. If a student does not have a test score for both this year and the prior year in the subject measured, that student’s results are not shown in the Teacher Diagnostic report. For tests and subjects analyzed with URM, students must have a predicted score to be included. Students with fewer than three prior test scores across grades and subjects will not have a predicted score. The Teacher Diagnostic report is most often a subset of the total number of students used in the Teacher Value-Added report. Viewing your report on the EVAAS site allows you to see which students were used in the diagnostic analysis.
How are student projections determined? EVAAS® considers prior test scores for the student across years, grades, and subjects to generate each projection. A natural relationship exists among subjects; EVAAS® takes advantage of these relationships to generate more reliable student projections. A minimum of three prior scores (across grades and subjects) is required for a student to have a projection. EVAAS® then looks at how students with similar testing histories performed to determine the expected performance of the student. The projected district percentile shows what the student is most likely to score on the assessment if the student makes average progress between now and the time the test is administered.
How can student projections help us and the student? The projections show the probability of the student reaching each of the state performance levels, or the student’s probability of reaching meaningful scores on the selected test. This can help us to determine which students need additional support, to prepare targeted interventions for at-risk students, and to ensure that students are placed into appropriate courses.
EVAAS®/Value‐Added Frequently Asked Questions
EVAAS®/Value-Added Frequently Asked Questions www.houstonisd.org/ASPIRE
Copyright 2015 Houston Independent School District 17
Is there research on the impact an individual teacher has on student learning? There is indisputable research that shows that teachers matter most when it comes to student achievement. Specific research has been conducted to better understand exactly how much impact teachers can have on students. Some key findings:
Students who had very effective teachers for three years in a row were able to improve their performance on standardized tests by more than 50 percent in comparison to students who had three ineffective teachers in a row (Sanders and Rivers, 1996). A similar study conducted in Dallas ISD using a different student assessment and value-added methodology found similar results.
A teacher’s impact on student learning lasts up to four years (Sanders, 2005). As teacher effectiveness levels increase, lower-achieving students are the first to benefit
(Sanders and Rivers, 1996). If a student has an ineffective teacher for two years, this decrease in progress cannot be
made up (Rivers, 1999).
How can I show high EVAAS® last year but not this year, when I did nothing different? EVAAS® analysis estimates the influence the curriculum and instruction had on a specific set of students during a given year. If your results change from one year to the next with a different student group, consider these questions:
1. Could the curriculum and instruction have been better suited to the needs of the student group I had this year?
2. Did any other changes on the campus influence students’ academic growth? Things like scheduling changes, instructional support, intervention, and student population can all influence the students’ academic growth.
How can EVAAS® information help teachers improve teaching and learning? In combination with formative diagnostic data, value-added information allows educators to assess their impact on student learning and can help initiate conversations about the effectiveness of curriculum, instructional practices and programs. Value-added information also allows educators to better identify what is working well and areas for improvement to help individual students and groups of students. Above and beyond the summary information, diagnostic information is provided through the EVAAS site that is appropriate for educators.
What can I do to improve my EVAAS® score? Evidence shows that when teachers and schools collaboratively focus on students as individuals and provide the targeted curriculum and instruction that meet each student’s learning needs, student progress accelerates. Measuring intra-year progress and using that information in formative ways to ensure that all students are making progress is critical. Involving students in the process of setting instructional targets and measuring their growth also has been proven effective. Using value-added and other supportive data sources can help HISD educators target areas for professional growth. Finally, working collaboratively with colleagues on instructional practices and engaging targeted professional development are essential.
EVAAS®/Value‐Added Frequently Asked Questions
EVAAS®/Value-Added Frequently Asked Questions www.houstonisd.org/ASPIRE
Copyright 2015 Houston Independent School District 18
EVAAS®, HISD, and the A&D System What are the advantages of including EVAAS® data as part of the Teacher Appraisal and Development System? Nothing matters more to student success than teachers. Having great teachers in the classroom is one of the single most important things we can do at HISD for meeting the needs of our students and preparing them to graduate on time and to be successful in college, careers, and life. EVAAS® data measure how well schools and teachers are doing in accelerating the academic progress of their students. EVAAS® data, when used with other measures, provide a more complete picture of performance.
Why is EVAAS® weighted so heavily for appraisal purposes? In accordance with state law, HISD’s new teacher-evaluation system was developed at the campus level through the Shared Decision Making committees and at the district level through the District Advisory Committee. Taking into account recommendations from these committees, working groups that included teachers and administrators came up with proposals for the numbers used in appraisals.
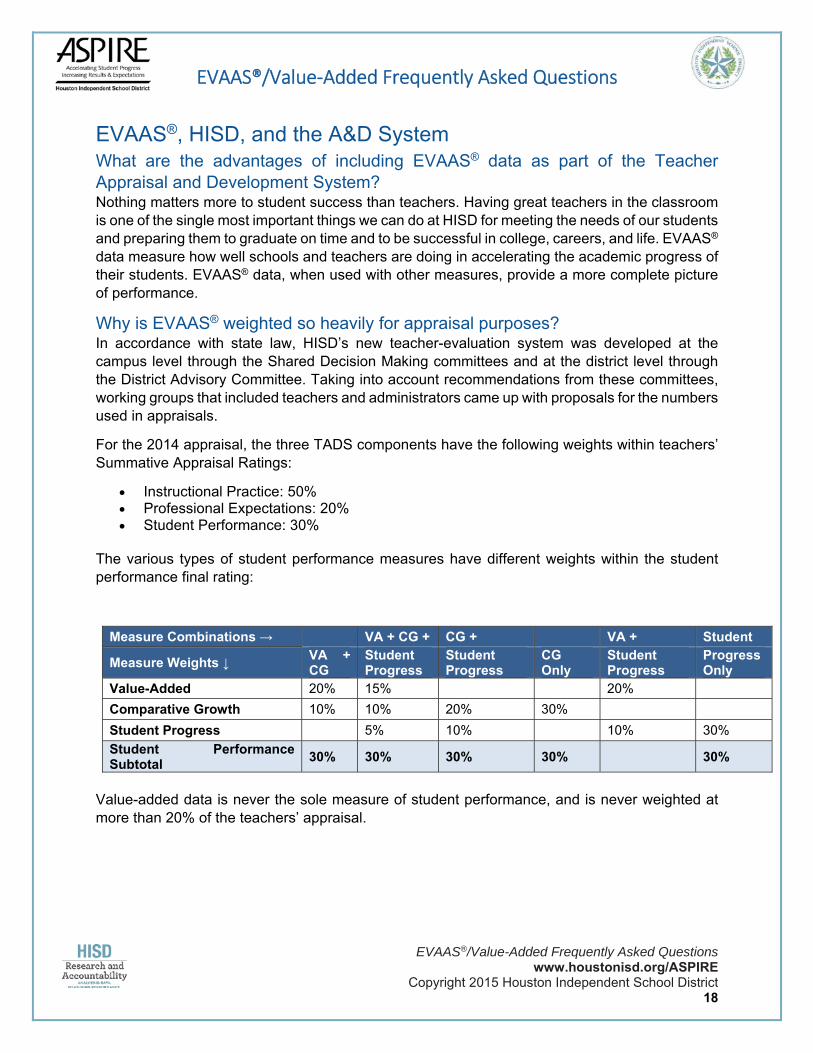
For the 2014 appraisal, the three TADS components have the following weights within teachers’ Summative Appraisal Ratings:
Instructional Practice: 50% Professional Expectations: 20% Student Performance: 30%
The various types of student performance measures have different weights within the student performance final rating:
Measure Combinations → VA + CG + CG + VA + Student
Measure Weights ↓ VA + CG
Student Progress
Student Progress
CG Only
Student Progress
Progress Only
Value-Added 20% 15% 20%
Comparative Growth 10% 10% 20% 30%
Student Progress 5% 10% 10% 30%
Student Performance Subtotal
30% 30% 30% 30% 30%
Value-added data is never the sole measure of student performance, and is never weighted at more than 20% of the teachers’ appraisal.
EVAAS®/Value‐Added Frequently Asked Questions
EVAAS®/Value-Added Frequently Asked Questions www.houstonisd.org/ASPIRE
Copyright 2015 Houston Independent School District 19
Linkage Questions Why is my linkage different from what I submitted in May? Your campus support team, including your principal, has a duty to ensure that the final linkages that are submitted to EVAAS® for value-added analysis and used for other growth analysis measures are as accurate as possible. This means that sometimes the linkages you provide have to be changed. For example, if a student was inadvertently left off of a teacher’s roster, the campus support team has a duty to ensure all students at the campus appear on the correct rosters for the correct months. Conversely, if instruction was shared and one or more of your students were claimed by two or more teachers, your campus support team had a duty to correct those percentages. If any students are claimed for more than 100%, this must be corrected. If not, a mathematical calculation will automatically reduce the percent amounts proportionally before the data is sent to EVAAS®. For instance, if three teachers claim the same student for the same subject at 100% time, the mathematical calculation gives each of the three teachers 33.3% of that student.
HISD makes every effort to ensure that teachers have all of the required information to provide the best student linkages for their students. During the Teacher Linkage Period, a heavy emphasis is placed upon correct and appropriate linkage and the importance of the linkages provided. HISD’s Research department offers a number of work group opportunities during the linkage period in the spring to assist teachers, campus support team members, and principals in ensuring the most accurate linkages are provided. As long as a student is linked to your class for any time in the year, he/she will be included in the analysis if he/she tested in that subject. The value-added analysis that is calculated reflects the students linked at the percentages for which those students were linked.