Embed Size (px)
Citation preview

中国电动汽车推广的能源和环境影响Energy and Environmental Impacts of
Vehicle Electrification in China
Ye Wu School of Environment, Tsinghua University
March 21, 2013, Macao, China

Background
0
500
1000
1500
2000
2500
3000
1985 1990 1995 2000 2005Year
GD
P ($
)
The boost of economy
0
200
400
600
800
1000
1200
1400
1600
1800
2000
1985 1990 1992 1994 1996 1998 2000 2002 2004
Priv
ate
& N
on-P
rivat
e(10
000
Uni
ts)
0
500
1000
1500
2000
2500
3000
3500
Tota
l(10
000
Uni
ts)
Private Non-Private Total
0
5
10
15
20
25
30
1985 1990 1995 2000 2005Year
Veh
icle
per
100
0 pe
ople
(Uni
t)
Total auto population
Autos per 1000 people
-5000
0
5000
10000
15000
20000
25000
30000
35000
1991 1993 1995 1997 1999 2001 2003 2005
消耗
进口
Total consumption (10,000 tons)
Imported petroleum (10,000 tons)
-5000
0
5000
10000
15000
20000
25000
30000
35000
1991 1993 1995 1997 1999 2001 2003 2005
消耗
进口
Total consumption (10,000 tons)
Imported petroleum (10,000 tons)
Petroleum consumption
The rapid increase in vehicle population in China has been severely taxing the energy and material resources, and also posing a challenge to the mitigation of CO2 and urban criteria air pollutants.

Scenario Unit High Mid Low
Saturation Vehicles/1000 persons 600 500 400
2030 Stock million 528 471 407
Total automobile population will continue to increase rapidly, and will reach 210-240 million units in 2020, and 410-530 million units in 2030!
No matter which growth scenario, China will become the leading country in automobile population within the next 15 years.
Projection of China’s Vehicle Stock through 2030
0
20
40
60
80
100
120
140
160
180
200
0 10 20 30 40 50 60 70
GDP per capita(1000 RMB Yuan)
LDPV
ow
ners
hip(
per 1
000
peop
le)
Beijing
Tianjin
Hebei
Shanghai
Jiangsu
Zhejiang
Guangdong
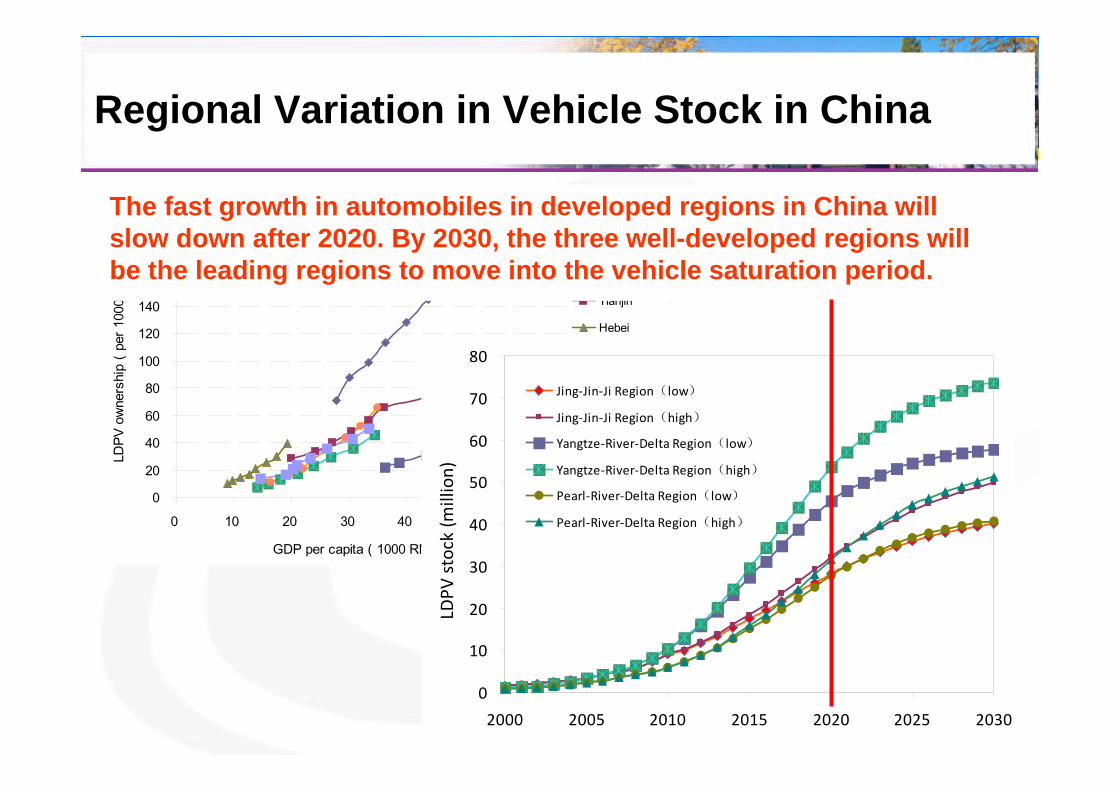
The fast growth in automobiles in developed regions in China will slow down after 2020. By 2030, the three well-developed regions will be the leading regions to move into the vehicle saturation period.
Regional Variation in Vehicle Stock in China
0
10
20
30
40
50
60
70
80
2000 2005 2010 2015 2020 2025 2030
LDPV
stock (m
illion)
Jing‐Jin‐Ji Region(low)
Jing‐Jin‐Ji Region(high)
Yangtze‐River‐Delta Region(low)
Yangtze‐River‐Delta Region(high)
Pearl‐River‐Delta Region(low)
Pearl‐River‐Delta Region(high)

The Challenges We Are Facing
Short of crude oil resources and energy safety issueDependence in imported oil: NOW IS 57%Fuel economy
Climate change and global warmingCO2
CH4 and N2OBC…
Urban air pollution and urban mobility and sustainabilityCO, HC, NOX
PM2.5
EC/OCPAHS/HCHO…

The Challenges We Are Facing
Without penetration of advanced propulsion/fuel systems, oil consumption will reach as high as 0.67-1.19 billion tons, and trigger a much higher dependence with imported oil !

The new National Ambient Air Quality Standard tightens NO2 and PM10, and add two new items: 8-hour O3 and PM2.5. All these three air pollutants have a strong link with vehicles.
The Challenges We Are Facing

HEV/PHEV/EV Demonstration in China
By 2010, 25 cities:
3950 EVs,
7145 HEVs
800 PHEVs
11895 in Total

3 charging stations available as of Dec 20121 only for visiting/demo
1 only for Asian games service (only fast charging)
1 for bus 801 route (located in College-city)
College-city charging/swapping station (serving 2 years by local traffic committee)
Battery swapping:7-8 minutes (10 modules), semi-automatic operation, 10 battery modules each and 80-90 minutes full charging (AC,21kW),vehicle/battery ratio 1:1.5 in ideal condition;
Fast charging: 3 DC charging plots (max 400 kW), 70-90 minutes full charging.
Racetrack demo stationSupported by Southern Grid and Israel
Battery swapping applied
AC slow charging plot: 6-7 hours for full charging
Current status of charging infrastructure in 25 demo cities: 1) Guangzhou
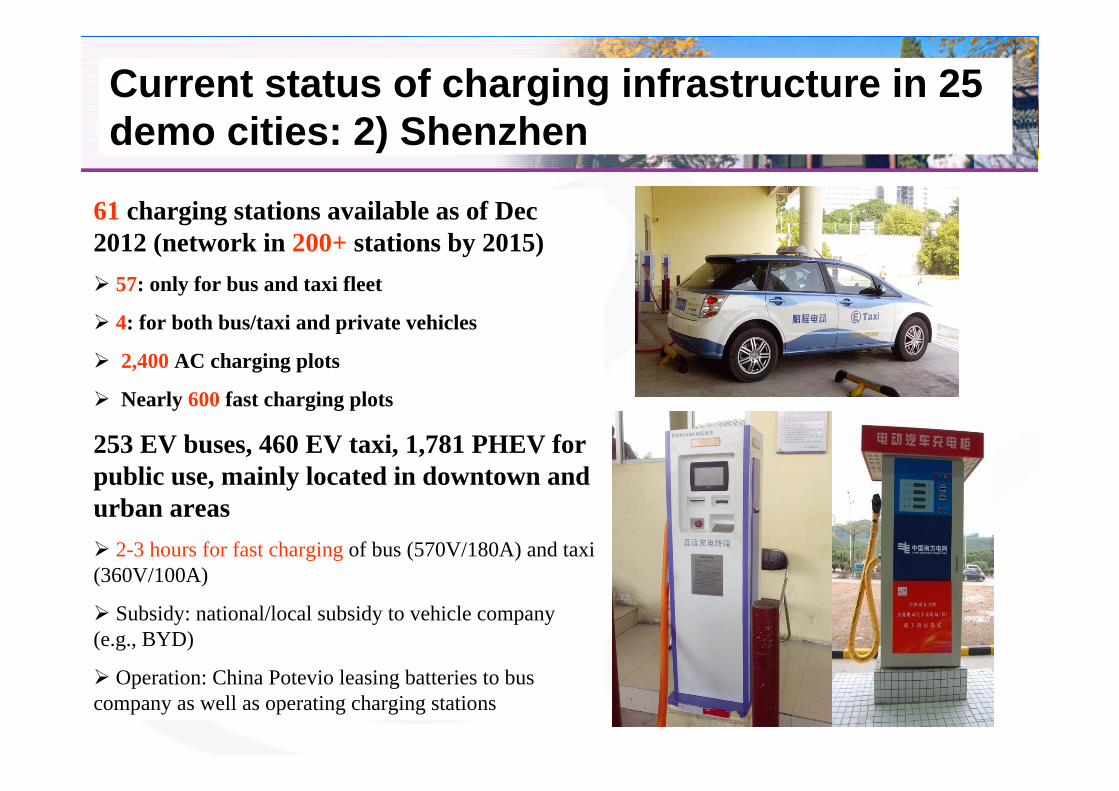
61 charging stations available as of Dec 2012 (network in 200+ stations by 2015)
57: only for bus and taxi fleet
4: for both bus/taxi and private vehicles
2,400 AC charging plots
Nearly 600 fast charging plots
253 EV buses, 460 EV taxi, 1,781 PHEV for public use, mainly located in downtown and urban areas
2-3 hours for fast charging of bus (570V/180A) and taxi (360V/100A)
Subsidy: national/local subsidy to vehicle company (e.g., BYD)
Operation: China Potevio leasing batteries to bus company as well as operating charging stations
Current status of charging infrastructure in 25 demo cities: 2) Shenzhen

Fuel Cycle
Well to Pump
Pump to W
heels
Fuel Cycle
Well to Pump
Pump to W
heels
Fuel Cycle
Well to Pump
Pump to W
heels
PetroleumGasoline
Diesel
CoalNG
NuclearBiomass
Hydro, Solar, etc.
Electricity
The Boundary of LCA Analysis for Electric Vehicles: Fuel Cycle

Electricity Generation Mix in China in 2009
0%
20%
40%
60%
80%
100%
National NorthChina
NortheastChina
East China CentralChina
NorthwestChina
SouthChina
Gen
erat
ion
mix
coal oil gas hydro nuclear wind others
14,000
7,000
1,400
全年用电量
(亿千万时)
14,000
7,000
1,400
全年用电量
(亿千万时)

Electricity Generation Mix Forecast by Region in 2030
2.2%
5.3% 4.5% 1.5%
86.5%
Yangtze‐River‐Delta Region
60.2%
3.0%5.0%
28.7%
3.1%
Pearl‐River‐Delta Region
82.5%
1.5%
8.5%3.5%4.0%
6.0%5.5%
11.5%
9.5%
67.5%
5.0%
26.5%
9.0%
3.5%
56.0% 41.0%
11.0%
12.0%
29.0%7.0%
7 . 0 %2 9 . 0 %
1 2 . 0 %
1 1 . 0 %
4 1 . 0 %
Coal NG Hydro Nuclear Others
a) 2010 b) 2030(conservative)
c) 2030(aggressive)
94.8%
4.0%0.4%0.8%
Jing‐Jin‐JiRegion
3.0%
0.4% 3.5% 2.1%
91.0% 76.0%
12.0%6.5%
5.0%

LDPV (on-road fuel economy)
0
10
20
30
40
50
60
70
7.0
7.1
7.2
7.3
7.4
7.5
7.6
7.7
Top10 Top20 Top30 Top40 Top50 Top60LD
PV m
arke
t sha
re(
%)
LDPV
fuel
eco
nom
y (L
/100
km)
LDPV sales ranking
Fuel economy and market share of China Top 60 LDPV in 2010
LDPV market share LDPV fuel economy
LDPV (lab-test fuel economy)
Fuel Economy of GV, HEV, PHEV and EV
HEV (fuel economy)PHEV and EV (fuel economy)

Well-to-Wheels Petroleum Use of HEV/PHEV/EV
HEV can achieve 30% reduction in petroleum use relative to ICEV; while PHEV50 can achieve 50% reduction, and EV almost eliminates the petroleum use.In this study, we use a FE rate of 140% for HEV, 280% for CD mode and 120% for CS mode for PHEV50 (AER= 50 km), and 375% for EV relative to ICEV. For ICEV, FE values are 8.5, 7.3 and 6.4 L/100 km for 2010, 2020, and 2030, respectively.
0
500
1000
1500
2000
2500
3000
3500
ICEV
HEV
PHEV
50 EV
ICEV
HEV
PHEV
50 EV
ICEV
HEV
PHEV
50 EV
ICEV
HEV
PHEV
50 EV
ICEV
HEV
PHEV
50 EV
2010 2015 2020 2025 2030
Petroleum use (kJ/km
)
WTT TTWa) Jing‐Jin‐Ji Region

Well-to-Wheels Fossil Energy Use of HEV/PHEV/EV
The WTW fossil energy use reduction benefit is less than that of petroleum use for PHEV/EV.
In those regions that already have a sizeable proportion of clean electric energy (e.g., Pearl-River-Delta region) will have considerable reduction benefit with promotion of EV compared to HEV.
0
500
1000
1500
2000
2500
3000
3500
4000
ICEV
HEV
PHEV
50 EV
ICEV
HEV
PHEV
50 EV
ICEV
HEV
PHEV
50 EV
ICEV
HEV
PHEV
50 EV
ICEV
HEV
PHEV
50 EV
2010 2015 2020 2025 2030
Fossil fuel use (kJ/km
)
WTT TTWa) Jing‐Jin‐Ji Region
0
500
1000
1500
2000
2500
3000
3500
4000
ICEV
HEV
PHEV
50 EV
ICEV
HEV
PHEV
50 EV
ICEV
HEV
PHEV
50 EV
ICEV
HEV
PHEV
50 EV
ICEV
HEV
PHEV
50 EV
2010 2015 2020 2025 2030
Fossil fuel use (kJ/km
)
WTT TTWc) Pearl‐River‐Delta Region
0
500
1000
1500
2000
2500
3000
3500
4000
ICEV
HEV
PHEV
50 EV
ICEV
HEV
PHEV
50 EV
ICEV
HEV
PHEV
50 EV
ICEV
HEV
PHEV
50 EV
ICEV
HEV
PHEV
50 EV
2010 2015 2020 2025 2030
Fossil fuel use (kJ/km
)
WTT TTWb) Yangtze‐River‐Delta Region

Well-to-Wheels CO2 Emissions of HEV/PHEV/EV
The WTW CO2 reduction benefit is much less for PHEV/EV for those regions (e.g., Jing-Jin-Ji region) with dominant coal-fired power plants. However, in those regions that already have a sizeable proportion of clean electric energy (e.g., Pearl-River-Delta region) will relieve the overall CO2burden substantially with promotion of PHEV and EV in the future.
0
50
100
150
200
250
300
ICEV
HEV
PHEV
50 EV
ICEV
HEV
PHEV
50 EV
ICEV
HEV
PHEV
50 EV
ICEV
HEV
PHEV
50 EV
ICEV
HEV
PHEV
50 EV
2010 2015 2020 2025 2030
CO2 em
ission
s (g/km)
WTT TTWc) Pearl‐River‐Delta Region
0
50
100
150
200
250
300
ICEV
HEV
PHEV
50 EV
ICEV
HEV
PHEV
50 EV
ICEV
HEV
PHEV
50 EV
ICEV
HEV
PHEV
50 EV
ICEV
HEV
PHEV
50 EV
2010 2015 2020 2025 2030
CO2 em
ission
s (g/km)
WTT TTWa) Jing‐Jin‐Ji Region
300
0
50
100
150
200
250
300
ICEV
HEV
PHEV
50 EV
ICEV
HEV
PHEV
50 EV
ICEV
HEV
PHEV
50 EV
ICEV
HEV
PHEV
50 EV
ICEV
HEV
PHEV
50 EV
2010 2015 2020 2025 2030
CO2 em
ission
s (g/km)
WTT TTWb) Yangtze‐River‐Delta Region
0.0
0.1
0.2
0.3
0.4
ICEV
HEV
PHEV
50 EV
ICEV
HEV
PHEV
50 EV
ICEV
HEV
PHEV
50 EV
ICEV
HEV
PHEV
50 EV
2015 2020 2025 2030
VO
C e
mis
sion
s (g/
km)
TTW
WTT
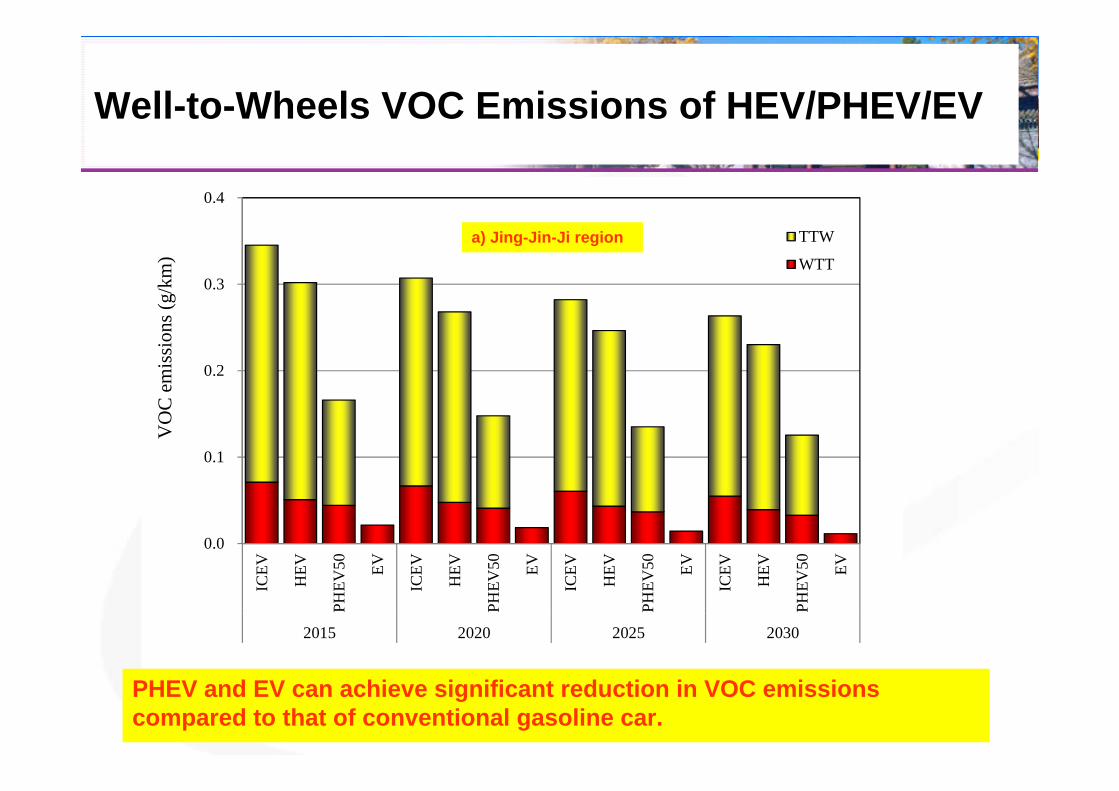
a) Jing-Jin-Ji region
PHEV and EV can achieve significant reduction in VOC emissions compared to that of conventional gasoline car.
Well-to-Wheels VOC Emissions of HEV/PHEV/EV

0.0
0.1
0.2
0.3
0.4
0.5
0.6
0.7
ICEV
(Dom
estic
…
ICEV
HEV
PHEV
50 EV
ICEV
(Dom
estic
…
ICEV
HEV
PHEV
50 EV
ICEV
(Dom
estic
…
ICEV
HEV
PHEV
50 EV
ICEV
(Dom
estic
…
ICEV
HEV
PHEV
50 EV2015 2020 2025 2030
NO
x em
issi
ons (
g/km
)
TTW
WTT
0.0
0.1
0.2
0.3
0.4
ICEV
(Dom
estic
…
ICEV
HEV
PHEV
50 EV
ICEV
(Dom
estic
…
ICEV
HEV
PHEV
50 EV
ICEV
(Dom
estic
…
ICEV
HEV
PHEV
50 EV
ICEV
(Dom
estic
…
ICEV
HEV
PHEV
50 EV
2015 2020 2025 2030
NO
x em
issi
ons (
g/km
)
TTW
WTT
a) Jing-Jin-Ji region b) Pearl River Delta region
EV might have higher NOX emissions than its gasoline counterpart, especially in those regions will high coal power generation mix (e.g., in Northern China).However, with rapid installation of SCR in coal power plants in the next decade, NOX emission from EV will decrease faster than that of gasoline car. In Pearl-river delta region with more clean power, EV might achieve reduction in NOX in ~2020.
Well-to-Wheels NOX Emissions of HEV/PHEV/EV

The Boundary of LCA Analysis for Electric Vehicles: Vehicle Material Cycle
车辆材料周期车辆材料周期

Energy Use of Key Materials by Major Process: Lithium and Copper as an Example

Life-Cycle Fossil Energy Use of HEV/PHEV/EV: Well-to-Tank, Tank-to-Wheels Plus Vehicle Cycle