Embed Size (px)
Citation preview
doi:10.1016/S0016-7037(03)00131-5
Eutrophication and carbon sources in Chesapeake Bay over the last 2700 yr: Humanimpacts in context
JOHN F. BRATTON,1,* STEVEN M. COLMAN,1 and ROBERT R. SEAL, II2
1U.S. Geological Survey, 384 Woods Hole Rd., Woods Hole, MA 02543, USA2U.S. Geological Survey, 12201 Sunrise Valley Dr., Reston, VA 21092, USA
(Received January 23, 2002;accepted in revised form January 23, 2003)
Abstract—To compare natural variability and trends in a developed estuary with human-influenced patterns,stable isotope ratios (�13C and �15N) were measured in sediments from five piston cores collected inChesapeake Bay. Mixing of terrestrial and algal carbon sources primarily controls patterns of�13Corg profiles,so this proxy shows changes in estuary productivity and in delivery of terrestrial carbon to the bay. Analysesof �15N show periods when oxygen depletion allowed intense denitrification and nutrient recycling to developin the seasonally stratified water column, in addition to recycling taking place in surficial sediments. Theseconditions produced15N-enriched (heavy) nitrogen in algal biomass, and ultimately in sediment. A pro-nounced increasing trend in�15N of �4‰ started in about A.D. 1750 to 1800 at all core sites, indicatinggreater eutrophication in the bay and summer oxygen depletion since that time. The timing of the changecorrelates with the advent of widespread land clearing and tillage in the watershed, and associated increasesin erosion and sedimentation. Isotope data show that the region has experienced up to 13 wet-dry cycles in thelast 2700 yr. Relative sea-level rise and basin infilling have produced a net freshening trend overprinted withcyclic climatic variability. Isotope data also constrain the relative position of the spring productivity maximumin Chesapeake Bay and distinguish local anomalies from sustained changes impacting large regions of the bay.This approach to reconstructing environmental history should be generally applicable to studies of otherestuaries and coastal embayments impacted by watershed development.Published by Elsevier Ltd
1. INTRODUCTION
Chesapeake Bay is the largest estuary in North America andamong the most productive in the world. Mean summer pro-ductivity in the mesohaline Chesapeake can exceed 4 g C m�2
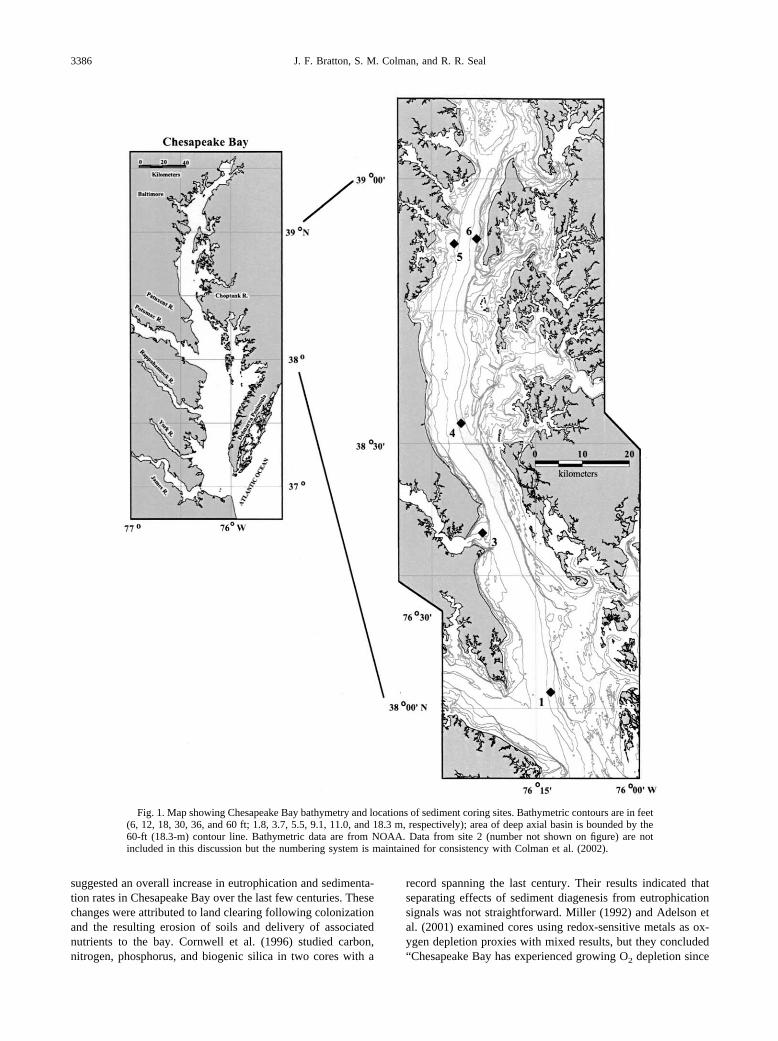
d�1 (Malone, 1991). Average spring rates of carbon depositioncalculated from chlorophyll-a measurements of sediment trapmaterial range from 0.1 to 1.3 g C m�2 d�1, representing 40 to60% of total annual primary productivity (Boynton et al.,1993). The average depth of the bay is 8 m but an axial channel,a remnant of the glacial lowstand valley of the SusquehannaRiver, runs down the center of the bay reaching depths of up to54 m (Fig. 1). The estuary is well mixed during the wintermonths, but typically becomes stratified from May thoughSeptember. A pycnocline develops at a depth of 10 to 15 m, justbelow the break in slope at the edge of the axial channel.
Officer et al. (1984) demonstrated that summer oxygen de-pletion in Chesapeake Bay was a result of stratification andsubpycnocline respiration of organic matter. Officer et al.(1984) were also among the first to identify a multi-decadaltrend of increasing oxygen depletion (quantified as volume ofwater with � 0.5 mL L�1 O2) in Chesapeake subpycnoclinewaters. They warned of possible widespread mortality ofbenthic organisms, including oysters and crabs, if the trendcontinued (but see also Seliger et al., 1985).
Intense monitoring since the early 1980s has shown thatduring a typical summer, low dissolved oxygen conditions (�3mg L�1) develop in 15 to 20% of the total volume of Chesa-peake Bay (11–15 km3 of low-oxygen water). Most interannual
variability in summer oxygen depletion is correlated with vari-ation in river discharge from December through March (Boy-nton et al., 1993), especially variation in discharge from theSusquehanna River that typically accounts for 60% of the totalfreshwater input to Chesapeake Bay. Higher spring dischargedelivers more nutrients to the bay, producing more biomass inspring algal blooms. As this biomass sinks, it decomposes andconsumes oxygen that cannot be replaced due to water-columnstratification during the spring and summer.
It has been generally assumed that eutrophication caused byhuman activities has played a significant role in the develop-ment and increasing severity of summer oxygen depletion inthe Chesapeake (e.g., Cooper and Brush, 1991). Increasednutrient delivery related to agricultural development of thewatershed and wastewater disposal practices is believed to havecaused greater production of algal biomass in the estuary,which in turn has fueled oxygen depletion through decompo-sition. The relative importance of natural variability and cli-matic control of the system, however, has not been well con-strained. Regular and systematic measurement of water qualityindicators in the bay only began in the 1950s, so longer-termtrends in nutrient loading, algal blooms, and dissolved oxygenare unknown. Many studies have quantified processes related tooxygen depletion in the modern Chesapeake Bay includingBoynton et al. (1993, 1995), Kemp et al. (1990, 1992), andCowan and Boynton (1996).
While depletion of oxygen in the modern water column wasbeing investigated, parallel efforts began to explore its histor-ical context. This was done using long-term data sets andexamination of pollen, diatoms, and geochemistry in shortsediment cores (Brush, 1984; Cooper and Brush, 1991, 1993;Cooper, 1995; Harding and Perry, 1997). Sediment core results
* Author to whom correspondence should be addressed([email protected]).
Pergamon
Geochimica et Cosmochimica Acta, Vol. 67, No. 18, pp. 3385–3402, 2003Published by Elsevier Ltd
Printed in the USA. All rights reserved0016-7037/03 $30.00� .00
3385
suggested an overall increase in eutrophication and sedimenta-tion rates in Chesapeake Bay over the last few centuries. Thesechanges were attributed to land clearing following colonizationand the resulting erosion of soils and delivery of associatednutrients to the bay. Cornwell et al. (1996) studied carbon,nitrogen, phosphorus, and biogenic silica in two cores with a
record spanning the last century. Their results indicated thatseparating effects of sediment diagenesis from eutrophicationsignals was not straightforward. Miller (1992) and Adelson etal. (2001) examined cores using redox-sensitive metals as ox-ygen depletion proxies with mixed results, but they concluded“Chesapeake Bay has experienced growing O2 depletion since
Fig. 1. Map showing Chesapeake Bay bathymetry and locations of sediment coring sites. Bathymetric contours are in feet(6, 12, 18, 30, 36, and 60 ft; 1.8, 3.7, 5.5, 9.1, 11.0, and 18.3 m, respectively); area of deep axial basin is bounded by the60-ft (18.3-m) contour line. Bathymetric data are from NOAA. Data from site 2 (number not shown on figure) are notincluded in this discussion but the numbering system is maintained for consistency with Colman et al. (2002).
3386 J. F. Bratton, S. M. Colman, and R. R. Seal
the first half of the 20th century, but especially after 1960.”Zimmerman and Canuel (2000, 2002) measured organic bi-omarkers in cores from the mesohaline (5–20‰ salinity) Ches-apeake and showed overall trends of increasing productivity,and specific trends of increasing importance of bacteria anddinoflagellates relative to diatoms in the bay since the early1900s. They also duplicated stable isotope analyses on parts oftwo cores discussed here. Cronin et al. (2000) reported benthicmicrofossil evidence linking Chesapeake salinity over the last550 yr with droughts and wet periods recorded in cypress treerings (Stahle et al., 1998).
Most previous studies of stable isotopes of carbon and ni-trogen in Chesapeake Bay and nearby Delaware Bay have beenlimited to samples from the water column and surface sedi-ments (Hunt, 1966; Sigleo and Macko, 1985; Cifuentes et al.,1988; Montoya et al., 1990, 1991; Fogel et al., 1992). Theseinvestigations have been critical to developing an understand-ing of the modern system, but they have not explored the longertime record. Understanding how the biogeochemistry of theChesapeake has evolved in response to Holocene sea-level rise,climate change, and human modification of the watershed iscritical to determining the best practices for management of thissystem and other developed estuaries.
The study described here examines carbon and nitrogenisotopes from sediments deposited in northern Chesapeake Bayover the last 2700 yr. These data allow human-induced changesto the ecosystem to be put in a sufficiently long predisturbancecontext to reveal natural extremes and cycles of variability, aswell as trends lasting longer than 300 yr. In addition, theyprovide time-averaged baseline information that can be inte-grated with modern monitoring programs to detect expectedrecovery of the system as nutrient loading is reduced.
2. METHODS
Sediment cores were collected in 1996 and 1998 at the locations anddepths shown in Figure 1 and in Table 1. Cores were collected from theR/V Discovery with a piston corer capable of penetrating and recover-ing up to 4.5 m of sediment. Coring operations and the physicalproperties of the sediments are described in more detail by Kerhin et al.(1998), Cronin et al. (2000), and Baucom et al. (2001). Cores werecollected in 1.5-m lengths of polycarbonate liner that were immediatelycapped after being removed from the piston corer. Sediments consistedof dark gray to black estuarine silty clay with varying amounts of finesand and shells (especially shells of the opportunistic bivalve Mulinialateralis). Cores from shallow-water locations above the seasonal py-cnocline were coarser grained (up to �15% fine sand and up to 90%silt) and more bioturbated than cores from the deep axial channel.Water content of sediment was consistently 50 to 70 wt.%. The upperportions of some cores were color-banded; X-ray images showedlaminations throughout indicating a lack of bioturbation.
Refrigerated cores were split lengthwise and bulk-sampled in either
2- or 3-cm slices. Subsamples for geochemical analysis were eithercollected from discrete depths immediately before bulk sampling, orwere split later from bulk samples. Spacing of analyzed samples wasbetween 3 and 10 cm, but was consistent within each core. Sampleswere dried at 60°C and crushed with a mortar and pestle. Subsamplesfor carbon and nitrogen isotope analyses were acidified with 10% HClto remove any carbonate, dried again, and homogenized. Nitrogenisotope analyses of five pairs of acidified and non-acidified subsamplesselected at random showed no statistically significant difference be-tween them. Tests of benthic foraminifera were picked from uncrushedand unacidified sample splits from two cores.
Carbon and nitrogen, bulk and isotopic compositions were deter-mined using a Carlo Erba NC2500 elemental analyzer coupled to aFinnigan Delta Plus isotope ratio mass spectrometer at the USGSfacilities in Reston, Virginia. Total organic carbon (TOC) and totalnitrogen (TN) determinations were calibrated using a marine sedimentstandard, the National Research Council of Canada Certified ReferenceMaterial PACS-2, with values of 3.32 mass percent C and 0.27 masspercent N. Carbon isotope compositions were measured on CO2 and arereported in the �-notation, as permil (‰) relative to Vienna-Pee Deebelemnite (VPDB). The �13C values are calibrated on a scale definedby USGS-24 (graphite) with �13C � �15.9‰. Analytical precision isestimated to be �0.2‰ (1�). Nitrogen isotope compositions weremade on N2 and are reported in the �-notation, as permil (‰) relativeto atmospheric N2. The 15N values are calibrated on a scale defined byan internal laboratory reference material G-3646 (acetanilide) with�15N � �1.7 � 0.1‰, which in turn, is referenced to a scale definedby IAEA-N1 (ammonium sulfate) with �15N � 0.43‰ and USGS-32(potassium nitrate) with �15N � 180‰. Analytical precision is esti-mated to be �0.2‰ (1�).
Carbonate �13C of foraminifera from two cores (sites 1 and 4) wasdetermined by reacting one to three individual tests from each produc-tive interval in a Kiel device and measuring isotope ratios of evolvedCO2 with a Finnigan MAT252 mass spectrometer operated by thePaleoceanography Research Group at the Woods Hole OceanographicInstitution. Results are reported relative to the Pee Dee belemnitestandard (PDB). Calibration and precision of this instrument are de-scribed in Ostermann and Curry (2000).
Exceptional geochronological resolution, as detailed in Colman et al.(2002), was developed for these core sites using a suite of complemen-tary techniques including multi-fraction radiocarbon analysis of � 70samples, pollen stratigraphy, 210Pb and 137Cs measurements, and pa-leomagnetic correlation. Age uncertainty is ��50 to 200 yr in theolder part of the record, and �5 to 40 yr in the last few centuries.Comparison of rates of accumulation among sites indicates large spatialvariability of sedimentation rates in the bay, especially in relativelyshallow-water environments. Shallow sites examined typically havelower sedimentation rates than deep sites. Modern rates for all sitesrange from 0.05 to 1.8 cm yr�1 at sites 4 and 6, respectively. Deep-water, axial-channel sites 1 and 6 differ in modern rates of accumula-tion by a factor of 2. The same two sites show increases of 3.6 and 4.2times, respectively, in the last 200 to 300 yr, attributed to erosionassociated with increases in agriculture and land clearing in the water-shed following colonization. To avoid areas of the modern ChesapeakeBay floor that are erosional, core sites that contained � 5 m ofHolocene sediment were selected using geophysical survey data.
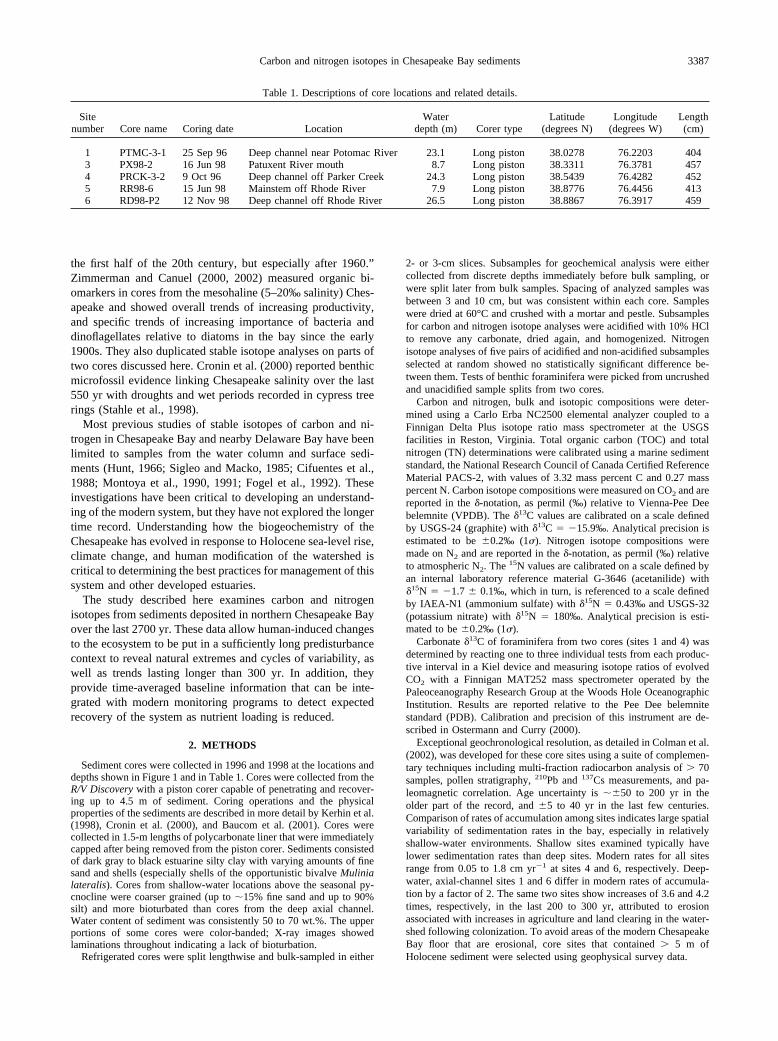
Table 1. Descriptions of core locations and related details.
Sitenumber Core name Coring date Location
Waterdepth (m) Corer type
Latitude(degrees N)
Longitude(degrees W)
Length(cm)
1 PTMC-3-1 25 Sep 96 Deep channel near Potomac River 23.1 Long piston 38.0278 76.2203 4043 PX98-2 16 Jun 98 Patuxent River mouth 8.7 Long piston 38.3311 76.3781 4574 PRCK-3-2 9 Oct 96 Deep channel off Parker Creek 24.3 Long piston 38.5439 76.4282 4525 RR98-6 15 Jun 98 Mainstem off Rhode River 7.9 Long piston 38.8776 76.4456 4136 RD98-P2 12 Nov 98 Deep channel off Rhode River 26.5 Long piston 38.8867 76.3917 459
3387Carbon and nitrogen isotopes in Chesapeake Bay sediments
3. RESULTS
3.1. Nitrogen
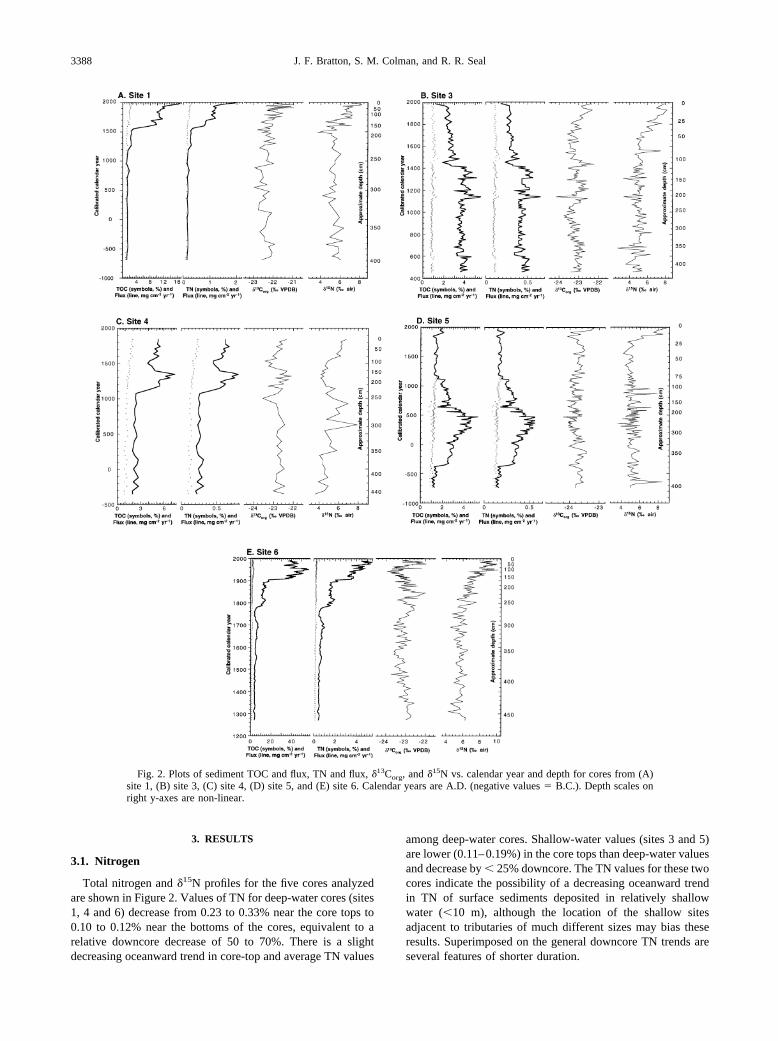
Total nitrogen and �15N profiles for the five cores analyzedare shown in Figure 2. Values of TN for deep-water cores (sites1, 4 and 6) decrease from 0.23 to 0.33% near the core tops to0.10 to 0.12% near the bottoms of the cores, equivalent to arelative downcore decrease of 50 to 70%. There is a slightdecreasing oceanward trend in core-top and average TN values
among deep-water cores. Shallow-water values (sites 3 and 5)are lower (0.11–0.19%) in the core tops than deep-water valuesand decrease by � 25% downcore. The TN values for these twocores indicate the possibility of a decreasing oceanward trendin TN of surface sediments deposited in relatively shallowwater (�10 m), although the location of the shallow sitesadjacent to tributaries of much different sizes may bias theseresults. Superimposed on the general downcore TN trends areseveral features of shorter duration.
Fig. 2. Plots of sediment TOC and flux, TN and flux, �13Corg, and �15N vs. calendar year and depth for cores from (A)site 1, (B) site 3, (C) site 4, (D) site 5, and (E) site 6. Calendar years are A.D. (negative values � B.C.). Depth scales onright y-axes are non-linear.
3388 J. F. Bratton, S. M. Colman, and R. R. Seal
Fluxes of TN (Fig. 2) range from 0.1 to 5.5 mg cm�2 yr�1
across all cores and depths. As with TN values, TN fluxes arehighest in the upper parts of the deep-water cores (sites 1, 4,and 6). The fluxes peak in the middle of the shallow-watercores (A.D. 1350 at site 3 and A.D. 400 at site 5), with fluxesdecreasing toward the core tops. Because flux calculations area function of sedimentation rates and diagenesis, it is probablymore appropriate to consider the rates calculated for these coresas burial or preservation rates rather than true fluxes from thewater column to sediment. Stated another way, this means thatthe different modern fluxes at site 5 vs. site 6 (0.15 vs. 5.0 mgcm�2 yr�1), for example, probably do not indicate a true33-fold difference in TN fluxes at the two sites. Rather, therapid sedimentation rate and summer anoxia at site 6 preservemore of the TN that reaches the sediment surface at this sitethan at site 5.
Like TN results, �15N profiles (Fig. 2) show consistentpatterns when the cores are grouped by water depth. Measure-ments in cores from sites 3 and 5 collected above the seasonalpycnocline decrease from �8‰ at the tops of the cores to 5‰at sediment depths of 50 cm. Average values remain at �5‰to the bottoms of the cores. Values of �15N from the tops ofdeep-water cores (sites 1, 4, and 6) start near the shallow-waterrange (8 � 1.5‰) but decrease more gradually than in shallow-water cores due to higher sedimentation rates. There is nodiscernible oceanward trend in �15N data in either shallow-water or deep-water cores.
3.2. Carbon
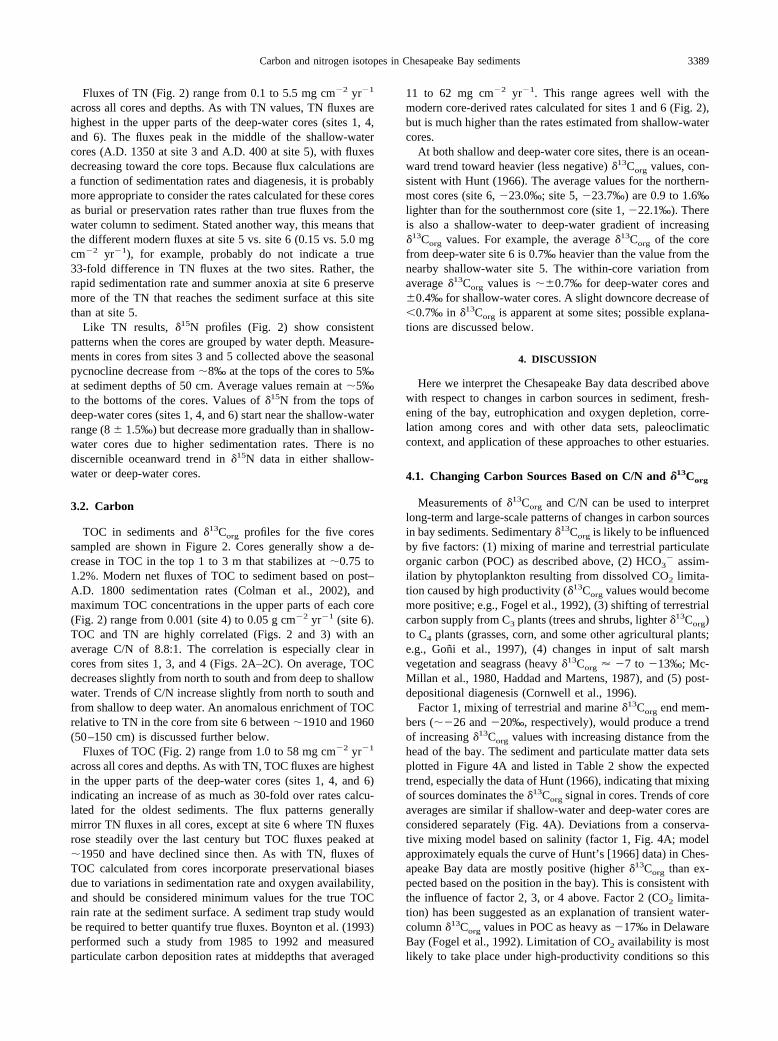
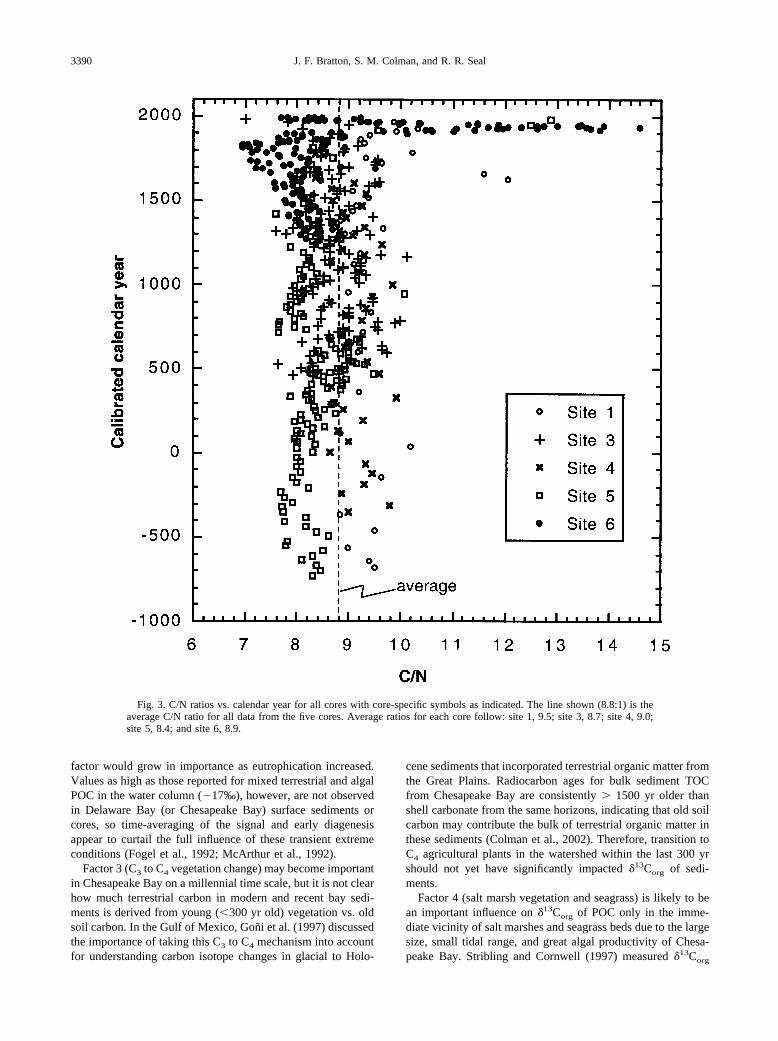
TOC in sediments and �13Corg profiles for the five coressampled are shown in Figure 2. Cores generally show a de-crease in TOC in the top 1 to 3 m that stabilizes at �0.75 to1.2%. Modern net fluxes of TOC to sediment based on post–A.D. 1800 sedimentation rates (Colman et al., 2002), andmaximum TOC concentrations in the upper parts of each core(Fig. 2) range from 0.001 (site 4) to 0.05 g cm�2 yr�1 (site 6).TOC and TN are highly correlated (Figs. 2 and 3) with anaverage C/N of 8.8:1. The correlation is especially clear incores from sites 1, 3, and 4 (Figs. 2A–2C). On average, TOCdecreases slightly from north to south and from deep to shallowwater. Trends of C/N increase slightly from north to south andfrom shallow to deep water. An anomalous enrichment of TOCrelative to TN in the core from site 6 between �1910 and 1960(50–150 cm) is discussed further below.
Fluxes of TOC (Fig. 2) range from 1.0 to 58 mg cm�2 yr�1
across all cores and depths. As with TN, TOC fluxes are highestin the upper parts of the deep-water cores (sites 1, 4, and 6)indicating an increase of as much as 30-fold over rates calcu-lated for the oldest sediments. The flux patterns generallymirror TN fluxes in all cores, except at site 6 where TN fluxesrose steadily over the last century but TOC fluxes peaked at�1950 and have declined since then. As with TN, fluxes ofTOC calculated from cores incorporate preservational biasesdue to variations in sedimentation rate and oxygen availability,and should be considered minimum values for the true TOCrain rate at the sediment surface. A sediment trap study wouldbe required to better quantify true fluxes. Boynton et al. (1993)performed such a study from 1985 to 1992 and measuredparticulate carbon deposition rates at middepths that averaged
11 to 62 mg cm�2 yr�1. This range agrees well with themodern core-derived rates calculated for sites 1 and 6 (Fig. 2),but is much higher than the rates estimated from shallow-watercores.
At both shallow and deep-water core sites, there is an ocean-ward trend toward heavier (less negative) �13Corg values, con-sistent with Hunt (1966). The average values for the northern-most cores (site 6, �23.0‰; site 5, �23.7‰) are 0.9 to 1.6‰lighter than for the southernmost core (site 1, �22.1‰). Thereis also a shallow-water to deep-water gradient of increasing�13Corg values. For example, the average �13Corg of the corefrom deep-water site 6 is 0.7‰ heavier than the value from thenearby shallow-water site 5. The within-core variation fromaverage �13Corg values is ��0.7‰ for deep-water cores and�0.4‰ for shallow-water cores. A slight downcore decrease of�0.7‰ in �13Corg is apparent at some sites; possible explana-tions are discussed below.
4. DISCUSSION
Here we interpret the Chesapeake Bay data described abovewith respect to changes in carbon sources in sediment, fresh-ening of the bay, eutrophication and oxygen depletion, corre-lation among cores and with other data sets, paleoclimaticcontext, and application of these approaches to other estuaries.
4.1. Changing Carbon Sources Based on C/N and �13Corg
Measurements of �13Corg and C/N can be used to interpretlong-term and large-scale patterns of changes in carbon sourcesin bay sediments. Sedimentary �13Corg is likely to be influencedby five factors: (1) mixing of marine and terrestrial particulateorganic carbon (POC) as described above, (2) HCO3
� assim-ilation by phytoplankton resulting from dissolved CO2 limita-tion caused by high productivity (�13Corg values would becomemore positive; e.g., Fogel et al., 1992), (3) shifting of terrestrialcarbon supply from C3 plants (trees and shrubs, lighter �13Corg)to C4 plants (grasses, corn, and some other agricultural plants;e.g., Goni et al., 1997), (4) changes in input of salt marshvegetation and seagrass (heavy �13Corg � �7 to �13‰; Mc-Millan et al., 1980, Haddad and Martens, 1987), and (5) post-depositional diagenesis (Cornwell et al., 1996).
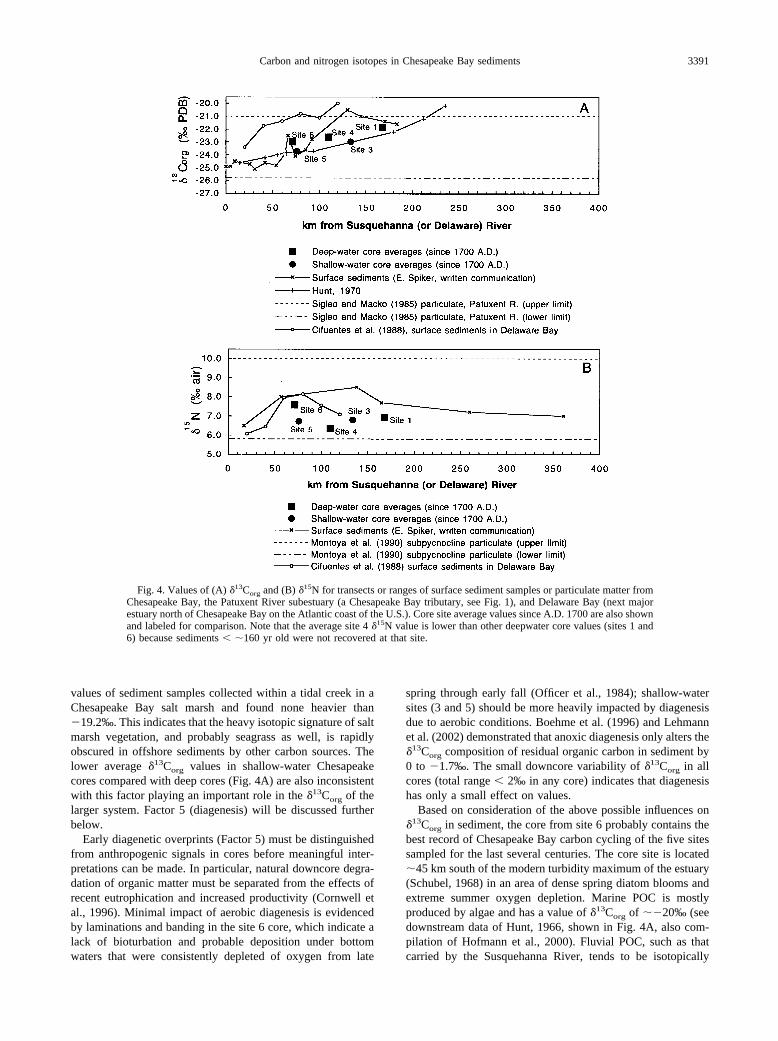
Factor 1, mixing of terrestrial and marine �13Corg end mem-bers (��26 and �20‰, respectively), would produce a trendof increasing �13Corg values with increasing distance from thehead of the bay. The sediment and particulate matter data setsplotted in Figure 4A and listed in Table 2 show the expectedtrend, especially the data of Hunt (1966), indicating that mixingof sources dominates the �13Corg signal in cores. Trends of coreaverages are similar if shallow-water and deep-water cores areconsidered separately (Fig. 4A). Deviations from a conserva-tive mixing model based on salinity (factor 1, Fig. 4A; modelapproximately equals the curve of Hunt’s [1966] data) in Ches-apeake Bay data are mostly positive (higher �13Corg than ex-pected based on the position in the bay). This is consistent withthe influence of factor 2, 3, or 4 above. Factor 2 (CO2 limita-tion) has been suggested as an explanation of transient water-column �13Corg values in POC as heavy as �17‰ in DelawareBay (Fogel et al., 1992). Limitation of CO2 availability is mostlikely to take place under high-productivity conditions so this
3389Carbon and nitrogen isotopes in Chesapeake Bay sediments
factor would grow in importance as eutrophication increased.Values as high as those reported for mixed terrestrial and algalPOC in the water column (�17‰), however, are not observedin Delaware Bay (or Chesapeake Bay) surface sediments orcores, so time-averaging of the signal and early diagenesisappear to curtail the full influence of these transient extremeconditions (Fogel et al., 1992; McArthur et al., 1992).
Factor 3 (C3 to C4 vegetation change) may become importantin Chesapeake Bay on a millennial time scale, but it is not clearhow much terrestrial carbon in modern and recent bay sedi-ments is derived from young (�300 yr old) vegetation vs. oldsoil carbon. In the Gulf of Mexico, Goni et al. (1997) discussedthe importance of taking this C3 to C4 mechanism into accountfor understanding carbon isotope changes in glacial to Holo-
cene sediments that incorporated terrestrial organic matter fromthe Great Plains. Radiocarbon ages for bulk sediment TOCfrom Chesapeake Bay are consistently � 1500 yr older thanshell carbonate from the same horizons, indicating that old soilcarbon may contribute the bulk of terrestrial organic matter inthese sediments (Colman et al., 2002). Therefore, transition toC4 agricultural plants in the watershed within the last 300 yrshould not yet have significantly impacted �13Corg of sedi-ments.
Factor 4 (salt marsh vegetation and seagrass) is likely to bean important influence on �13Corg of POC only in the imme-diate vicinity of salt marshes and seagrass beds due to the largesize, small tidal range, and great algal productivity of Chesa-peake Bay. Stribling and Cornwell (1997) measured �13Corg
Fig. 3. C/N ratios vs. calendar year for all cores with core-specific symbols as indicated. The line shown (8.8:1) is theaverage C/N ratio for all data from the five cores. Average ratios for each core follow: site 1, 9.5; site 3, 8.7; site 4, 9.0;site 5, 8.4; and site 6, 8.9.
3390 J. F. Bratton, S. M. Colman, and R. R. Seal
values of sediment samples collected within a tidal creek in aChesapeake Bay salt marsh and found none heavier than�19.2‰. This indicates that the heavy isotopic signature of saltmarsh vegetation, and probably seagrass as well, is rapidlyobscured in offshore sediments by other carbon sources. Thelower average �13Corg values in shallow-water Chesapeakecores compared with deep cores (Fig. 4A) are also inconsistentwith this factor playing an important role in the �13Corg of thelarger system. Factor 5 (diagenesis) will be discussed furtherbelow.
Early diagenetic overprints (Factor 5) must be distinguishedfrom anthropogenic signals in cores before meaningful inter-pretations can be made. In particular, natural downcore degra-dation of organic matter must be separated from the effects ofrecent eutrophication and increased productivity (Cornwell etal., 1996). Minimal impact of aerobic diagenesis is evidencedby laminations and banding in the site 6 core, which indicate alack of bioturbation and probable deposition under bottomwaters that were consistently depleted of oxygen from late
spring through early fall (Officer et al., 1984); shallow-watersites (3 and 5) should be more heavily impacted by diagenesisdue to aerobic conditions. Boehme et al. (1996) and Lehmannet al. (2002) demonstrated that anoxic diagenesis only alters the�13Corg composition of residual organic carbon in sediment by0 to �1.7‰. The small downcore variability of �13Corg in allcores (total range � 2‰ in any core) indicates that diagenesishas only a small effect on values.
Based on consideration of the above possible influences on�13Corg in sediment, the core from site 6 probably contains thebest record of Chesapeake Bay carbon cycling of the five sitessampled for the last several centuries. The core site is located�45 km south of the modern turbidity maximum of the estuary(Schubel, 1968) in an area of dense spring diatom blooms andextreme summer oxygen depletion. Marine POC is mostlyproduced by algae and has a value of �13Corg of ��20‰ (seedownstream data of Hunt, 1966, shown in Fig. 4A, also com-pilation of Hofmann et al., 2000). Fluvial POC, such as thatcarried by the Susquehanna River, tends to be isotopically
Fig. 4. Values of (A) �13Corg and (B) �15N for transects or ranges of surface sediment samples or particulate matter fromChesapeake Bay, the Patuxent River subestuary (a Chesapeake Bay tributary, see Fig. 1), and Delaware Bay (next majorestuary north of Chesapeake Bay on the Atlantic coast of the U.S.). Core site average values since A.D. 1700 are also shownand labeled for comparison. Note that the average site 4 �15N value is lower than other deepwater core values (sites 1 and6) because sediments � �160 yr old were not recovered at that site.
3391Carbon and nitrogen isotopes in Chesapeake Bay sediments
lighter due to incorporation of terrestrial plant material and hasa value of �13Corg � �25‰ (see upstream data of Hunt, 1966,shown in Fig. 4A; also Onstad et al., 2000). Sediment sampling
across an estuarine or coastal gradient should produce �13Corg
measurements that increase in an oceanward direction and spanthis range (Cifuentes et al., 1988; Lucotte, 1989; Fig. 4A).
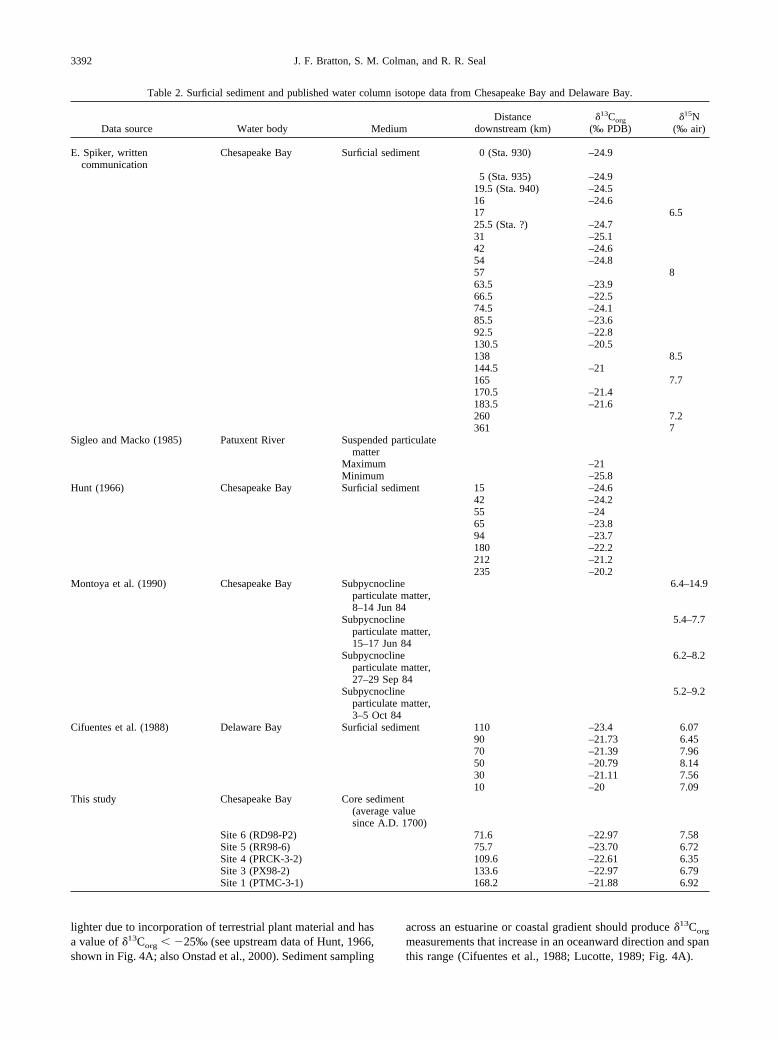
Table 2. Surficial sediment and published water column isotope data from Chesapeake Bay and Delaware Bay.
Data source Water body MediumDistance
downstream (km)�13Corg
(‰ PDB)�15N
(‰ air)
E. Spiker, writtencommunication
Chesapeake Bay Surficial sediment 0 (Sta. 930) –24.9
5 (Sta. 935) –24.919.5 (Sta. 940) –24.516 –24.617 6.525.5 (Sta. ?) –24.731 –25.142 –24.654 –24.857 863.5 –23.966.5 –22.574.5 –24.185.5 –23.692.5 –22.8130.5 –20.5138 8.5144.5 –21165 7.7170.5 –21.4183.5 –21.6260 7.2361 7
Sigleo and Macko (1985) Patuxent River Suspended particulatematter
Maximum –21Minimum –25.8
Hunt (1966) Chesapeake Bay Surficial sediment 15 –24.642 –24.255 –2465 –23.894 –23.7180 –22.2212 –21.2235 –20.2
Montoya et al. (1990) Chesapeake Bay Subpycnoclineparticulate matter,8–14 Jun 84
6.4–14.9
Subpycnoclineparticulate matter,15–17 Jun 84
5.4–7.7
Subpycnoclineparticulate matter,27–29 Sep 84
6.2–8.2
Subpycnoclineparticulate matter,3–5 Oct 84
5.2–9.2
Cifuentes et al. (1988) Delaware Bay Surficial sediment 110 –23.4 6.0790 –21.73 6.4570 –21.39 7.9650 –20.79 8.1430 –21.11 7.5610 –20 7.09
This study Chesapeake Bay Core sediment(average valuesince A.D. 1700)
Site 6 (RD98-P2) 71.6 –22.97 7.58Site 5 (RR98-6) 75.7 –23.70 6.72Site 4 (PRCK-3-2) 109.6 –22.61 6.35Site 3 (PX98-2) 133.6 –22.97 6.79Site 1 (PTMC-3-1) 168.2 –21.88 6.92
3392 J. F. Bratton, S. M. Colman, and R. R. Seal
Given the terrestrial and algal sources of organic matter inChesapeake Bay, the trends in C/N of oceanward and basin-ward (offshore) increases described above are enigmatic. Thetrends are inconsistent with the expected pattern of decreasedcontribution of terrestrial organic matter (high C/N) and alarger percentage of algal biomass (low C/N) with increaseddistance from shore or downstream. This suggests (1) differenttransport, deposition, and especially diagenetic pathways forthe two pools of organic matter, (2) differences between shal-low and deep sites, or (3) local influence of detrital matter fromtributaries, especially impact of the Potomac River on site 1.The trends in �13Corg data indicate that it may be a morereliable proxy than C/N for distinguishing carbon sources in anestuarine setting such as Chesapeake Bay.
Values of C/N that deviate by � �1.5 from the average ratiodescribed above are the result of unusually high TOC valuesbut TN values consistent with the rest of the data set. Inparticular, the site 6 core has anomalously high TOC valuesbetween �1920 and 1970 that also produce high C/N values(up to 15:1; Fig. 3) and low �13Corg over this interval, indicat-ing unusually high influx of terrestrial organic matter, a de-crease in phytoplankton productivity, or more rapid degrada-tion of N-rich compounds (proteins) than C-rich compounds(lipids and carbohydrates) during this time (Lehmann et al.,2002). Since �13Corg data discussed above and productivitydata presented by Colman and Bratton (2003) do not indicatemajor changes in terrestrial influx or decreases in productivityover this time, it is more likely that differential diagenesis of Cand N produce the C/N patterns (Lehmann et al., 2002). Thehigh-C/low-N interval at site 6 (Fig. 3) is probably the result ofthe advent of three large reservoirs formed by dams constructedon the lower Susquehanna River between 1910 and 1931.
The �13Corg and C/N pattern could be explained by the factthat dredging and construction activities during dam buildingmobilized unusually large quantities of terrestrial OM in dis-turbed fluvial sediments, which were subsequently transportedand deposited at site 6 over the next several decades. Alterna-tively, trapping of inorganic silt in Susquehanna reservoirscould have caused relative enrichment (less dilution) of TOC insediments deposited downstream of the dams. Longer residencetime of terrestrial organic matter in reservoirs, rather thantransport in the undammed river, would produce greater deg-radation before ultimate deposition in the estuary. This wouldlikely yield N-depleted (high C/N) organic matter (Lehmann etal., 2002) in proximal sediments of northern Chesapeake Bay.The return to more typical C/N values at site 6 and lower TOCby �1970 is consistent with decreasing sediment trappingefficiency of the dams as their reservoirs filled with sediments(Langland and Hainly, 1997), and generally wetter recent cli-mate conditions (Cronin et al., 2000).
4.2. Possible Long-Term Freshening Based on�13Ccarbonate
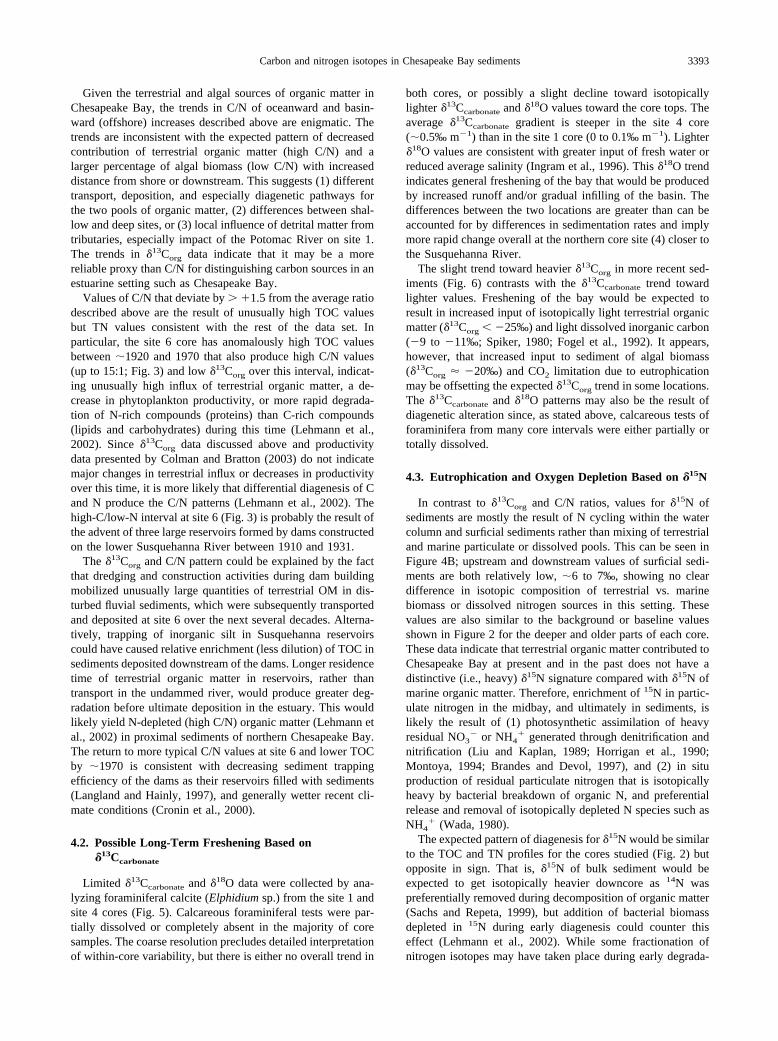
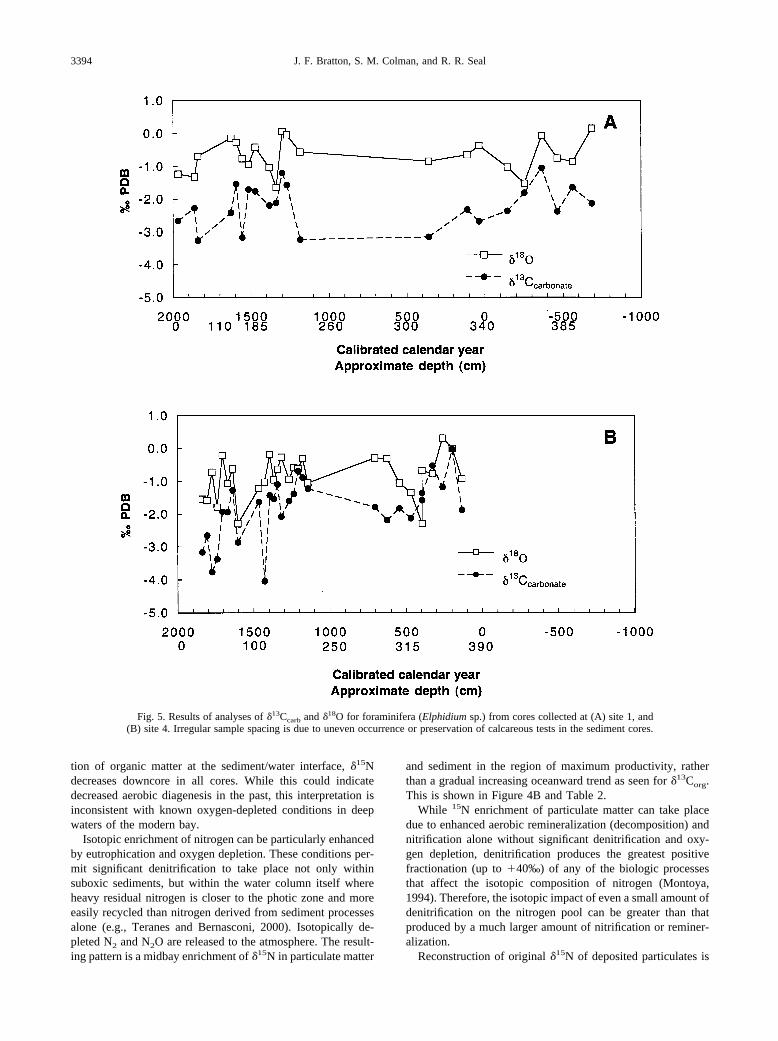
Limited �13Ccarbonate and �18O data were collected by ana-lyzing foraminiferal calcite (Elphidium sp.) from the site 1 andsite 4 cores (Fig. 5). Calcareous foraminiferal tests were par-tially dissolved or completely absent in the majority of coresamples. The coarse resolution precludes detailed interpretationof within-core variability, but there is either no overall trend in
both cores, or possibly a slight decline toward isotopicallylighter �13Ccarbonate and �18O values toward the core tops. Theaverage �13Ccarbonate gradient is steeper in the site 4 core(�0.5‰ m�1) than in the site 1 core (0 to 0.1‰ m�1). Lighter�18O values are consistent with greater input of fresh water orreduced average salinity (Ingram et al., 1996). This �18O trendindicates general freshening of the bay that would be producedby increased runoff and/or gradual infilling of the basin. Thedifferences between the two locations are greater than can beaccounted for by differences in sedimentation rates and implymore rapid change overall at the northern core site (4) closer tothe Susquehanna River.
The slight trend toward heavier �13Corg in more recent sed-iments (Fig. 6) contrasts with the �13Ccarbonate trend towardlighter values. Freshening of the bay would be expected toresult in increased input of isotopically light terrestrial organicmatter (�13Corg � �25‰) and light dissolved inorganic carbon(�9 to �11‰; Spiker, 1980; Fogel et al., 1992). It appears,however, that increased input to sediment of algal biomass(�13Corg � �20‰) and CO2 limitation due to eutrophicationmay be offsetting the expected �13Corg trend in some locations.The �13Ccarbonate and �18O patterns may also be the result ofdiagenetic alteration since, as stated above, calcareous tests offoraminifera from many core intervals were either partially ortotally dissolved.
4.3. Eutrophication and Oxygen Depletion Based on �15N
In contrast to �13Corg and C/N ratios, values for �15N ofsediments are mostly the result of N cycling within the watercolumn and surficial sediments rather than mixing of terrestrialand marine particulate or dissolved pools. This can be seen inFigure 4B; upstream and downstream values of surficial sedi-ments are both relatively low, �6 to 7‰, showing no cleardifference in isotopic composition of terrestrial vs. marinebiomass or dissolved nitrogen sources in this setting. Thesevalues are also similar to the background or baseline valuesshown in Figure 2 for the deeper and older parts of each core.These data indicate that terrestrial organic matter contributed toChesapeake Bay at present and in the past does not have adistinctive (i.e., heavy) �15N signature compared with �15N ofmarine organic matter. Therefore, enrichment of 15N in partic-ulate nitrogen in the midbay, and ultimately in sediments, islikely the result of (1) photosynthetic assimilation of heavyresidual NO3
� or NH4� generated through denitrification and
nitrification (Liu and Kaplan, 1989; Horrigan et al., 1990;Montoya, 1994; Brandes and Devol, 1997), and (2) in situproduction of residual particulate nitrogen that is isotopicallyheavy by bacterial breakdown of organic N, and preferentialrelease and removal of isotopically depleted N species such asNH4
� (Wada, 1980).The expected pattern of diagenesis for �15N would be similar
to the TOC and TN profiles for the cores studied (Fig. 2) butopposite in sign. That is, �15N of bulk sediment would beexpected to get isotopically heavier downcore as 14N waspreferentially removed during decomposition of organic matter(Sachs and Repeta, 1999), but addition of bacterial biomassdepleted in 15N during early diagenesis could counter thiseffect (Lehmann et al., 2002). While some fractionation ofnitrogen isotopes may have taken place during early degrada-
3393Carbon and nitrogen isotopes in Chesapeake Bay sediments
tion of organic matter at the sediment/water interface, �15Ndecreases downcore in all cores. While this could indicatedecreased aerobic diagenesis in the past, this interpretation isinconsistent with known oxygen-depleted conditions in deepwaters of the modern bay.
Isotopic enrichment of nitrogen can be particularly enhancedby eutrophication and oxygen depletion. These conditions per-mit significant denitrification to take place not only withinsuboxic sediments, but within the water column itself whereheavy residual nitrogen is closer to the photic zone and moreeasily recycled than nitrogen derived from sediment processesalone (e.g., Teranes and Bernasconi, 2000). Isotopically de-pleted N2 and N2O are released to the atmosphere. The result-ing pattern is a midbay enrichment of �15N in particulate matter
and sediment in the region of maximum productivity, ratherthan a gradual increasing oceanward trend as seen for �13Corg.This is shown in Figure 4B and Table 2.
While 15N enrichment of particulate matter can take placedue to enhanced aerobic remineralization (decomposition) andnitrification alone without significant denitrification and oxy-gen depletion, denitrification produces the greatest positivefractionation (up to �40‰) of any of the biologic processesthat affect the isotopic composition of nitrogen (Montoya,1994). Therefore, the isotopic impact of even a small amount ofdenitrification on the nitrogen pool can be greater than thatproduced by a much larger amount of nitrification or reminer-alization.
Reconstruction of original �15N of deposited particulates is
Fig. 5. Results of analyses of �13Ccarb and �18O for foraminifera (Elphidium sp.) from cores collected at (A) site 1, and(B) site 4. Irregular sample spacing is due to uneven occurrence or preservation of calcareous tests in the sediment cores.
3394 J. F. Bratton, S. M. Colman, and R. R. Seal
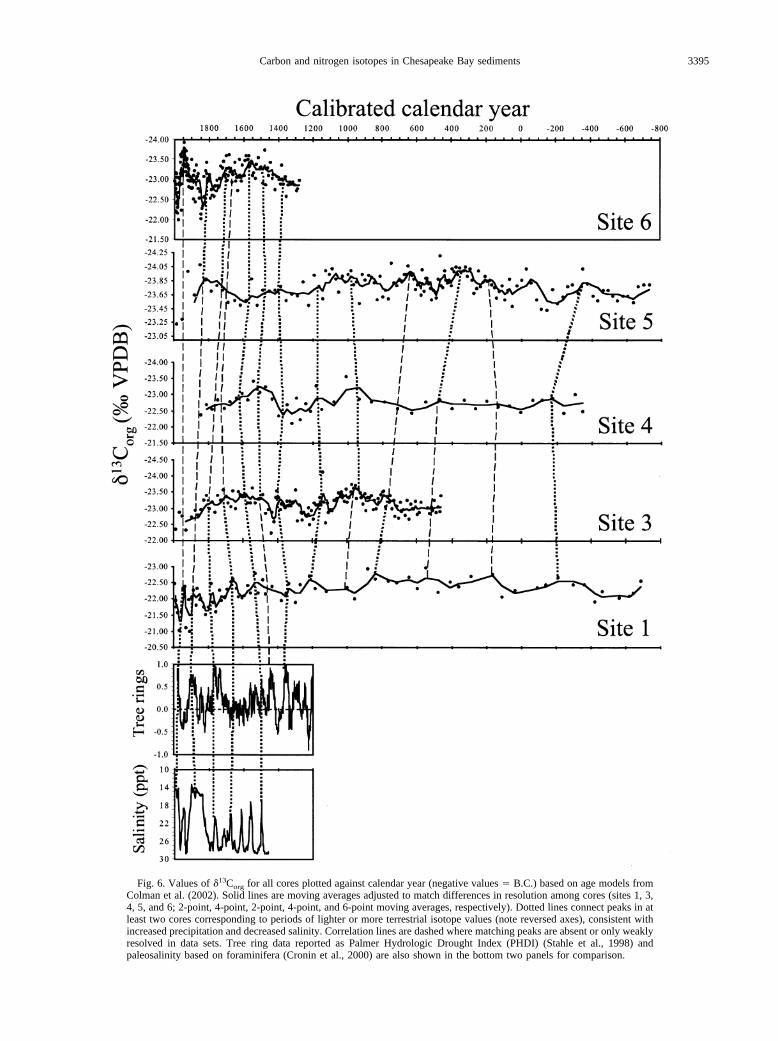
Fig. 6. Values of �13Corg for all cores plotted against calendar year (negative values � B.C.) based on age models fromColman et al. (2002). Solid lines are moving averages adjusted to match differences in resolution among cores (sites 1, 3,4, 5, and 6; 2-point, 4-point, 2-point, 4-point, and 6-point moving averages, respectively). Dotted lines connect peaks in atleast two cores corresponding to periods of lighter or more terrestrial isotope values (note reversed axes), consistent withincreased precipitation and decreased salinity. Correlation lines are dashed where matching peaks are absent or only weaklyresolved in data sets. Tree ring data reported as Palmer Hydrologic Drought Index (PHDI) (Stahle et al., 1998) andpaleosalinity based on foraminifera (Cronin et al., 2000) are also shown in the bottom two panels for comparison.
3395Carbon and nitrogen isotopes in Chesapeake Bay sediments
easiest for anoxic sediments. This is because aerobic diagenesiscan both significantly enrich and slightly deplete �15N of re-sidual organic matter, while anoxic diagenesis consistentlydepletes �15N by � �3‰ (Sachs and Repeta, 1999; Lehmannet al., 2002). Increasing severity in terms of time, space, andconcentration of oxygen depletion in subpycnocline waters andsediments of Chesapeake Bay since at least 1950 (Officer et al.,1984) would promote less aerobic decomposition over this timeperiod rather than more. Therefore, the observed trend ofheavier �15N since 1950 (and, by extrapolation, before) musthave been produced by a mechanism other than enhancedaerobic decomposition (or sediment nitrification), at leastwithin the deep parts of the bay. Trends such as increasingventilation and bioturbation, and decreasing sedimentationrates that would enhance decomposition and nitrification in thewater column, or denitrification within sediments, have notbeen observed in Chesapeake Bay. On the contrary, benthicforaminifera tolerant of low-oxygen conditions in bottom waterappeared in Chesapeake Bay in the late 1600s, and have gen-erally increased in abundance since then (Karlsen et al., 2000).This indicates that changes in water column processes probablyplayed a major role in producing the observed �15N change,rather than changes in sediment processes alone.
North-south transects (Fig. 4B) of surface sediments in Del-aware Bay (Cifuentes et al., 1988) and suspended particulatesin Chesapeake Bay (Montoya et al., 1990, 1991) showed mid-bay peaks in �15N of up to 8.14‰ 60 to 80 km south of theDelaware River, and 15.0‰ 110 km south of the SusquehannaRiver, respectively. Data from Chesapeake Bay surface sedi-ments (E. Spiker, written communication) show a peak of 8.5‰140 km south of the Susquehanna River (near site 4) in thesame region as the water column peak in POC (Montoya et al.,1990, 1991). Sediment values are 1 to 2‰ lower to the northand south in both bays.
It is likely that eutrophication of the bay is the result of inputof excess nitrogen from human sources (e.g., eroded soil,fertilizer, wastewater, and atmospheric deposition), includingseveral with heavy �15N (Teranes and Bernasconi, 2000). Theproximal input of isotopically heavy dissolved nitrogen fromwastewater treatment plants in Baltimore and Washington,D.C. in particular would be expected to affect the �15N oforganic matter in the northern bay, especially at sites 1 and 6.However, the spatial pattern (midbay maximum [near site 4] vs.upstream or tributary mouth maximum) and the magnitude ofthe �15N enrichment observed in suspended particulates andsediments indicates that the enrichment was probably producedin situ, rather than resulting from input of allochthonous �15N-enriched nitrate, ammonium, or particulates (Montoya et al.,1990, 1991; Montoya, 1994; Zimmerman and Canuel, 2002).Boynton et al. (1995) estimated that denitrification removes26% of the annual input of nitrogen to Chesapeake Bay from allsources, so it is not unreasonable to expect this mechanism toimpart an enriched isotopic signature to sedimentary TN. Fur-ther sampling of tributary sediments for �15N analysis, how-ever, especially those tributaries that receive significant munic-ipal and industrial wastewater effluent (e.g., the Potomac),would be necessary to completely rule out contribution ofallochthonous �15N-enriched sources to the midbay enrich-ment.
Furthermore, the �15N enrichment probably was not pro-
duced from variable nitrate utilization, as is observed in theopen ocean (e.g., Altabet and Francois, 1994), since the estuaryis always nitrate limited. The situation in Chesapeake Bay ismore analogous to settings where the oxygen minimum zoneimpinges on the seafloor, such as the eastern tropical northPacific (Ganeshram et al., 2000) or the Arabian Sea (Altabet etal., 1999), and significant denitrification in the suboxic watercolumn takes place.
4.4. Correlation of �13Corg and �15N Patterns AmongCores
Figure 6 shows �13Corg profiles for the five cores plottedagainst calendar year (age models from Colman et al., 2002)spanning the last 2700 yr. The age of the base of the core fromsite 6 is only �750 yr; this is significantly younger than othercores due to the high sedimentation rate at this location. Smalloffsets and mismatches in curves are due to uncertainties in theage models, uneven recovery of shallowest sediments in dif-ferent cores, irregular sedimentation rates, and lower resolutionin cores from sites 1, 4 and 5. If it is assumed that lighter�13Corg indicates primarily greater input of terrestrial organicmatter due to wetter climate conditions and more river dis-charge, the profiles show �5 to 13 wet periods (wet peaksconnected by dashed lines in Fig. 6) over the last 2700 yr.Cycles are not numbered to avoid confusion with the high-resolution scheme of Cronin et al. (2000), which covered aboutone fifth of the time scale examined here (550 vs. 2700 yr).
Significant wet periods (longer or more intense) distin-guished by lower �13Corg (peaks on Fig. 6 due to reversed axes)are centered on the following years: A.D. 1935, 1800, 1560,and 970; and 300 B.C. Similarly noteworthy dry periods arecentered on A.D. 1960, 1820, 1610, 1250, 1080, 300, 50; and600 B.C. The dry period at �1600 may correlate with theJamestown and Roanoke Island droughts of 1587 to 1589 and1606 to 1612, respectively, as discussed by Stahle et al. (1998)and Cronin et al. (2000). The droughts of the 1950s and 1960swere followed by three decades of generally higher river dis-charge to the bay. This transition period from dry to wetcorresponded with a period of heightened public awareness ofdegraded conditions in the bay and reports of increasing sum-mer oxygen depletion (Officer et al., 1984). As discussedabove, a slight trend toward heavier �13Corg in some cores insediments deposited since around A.D. 1750 to 1800 may bethe result of eutrophication, which would increase both algalinput to sediment and CO2 limitation.
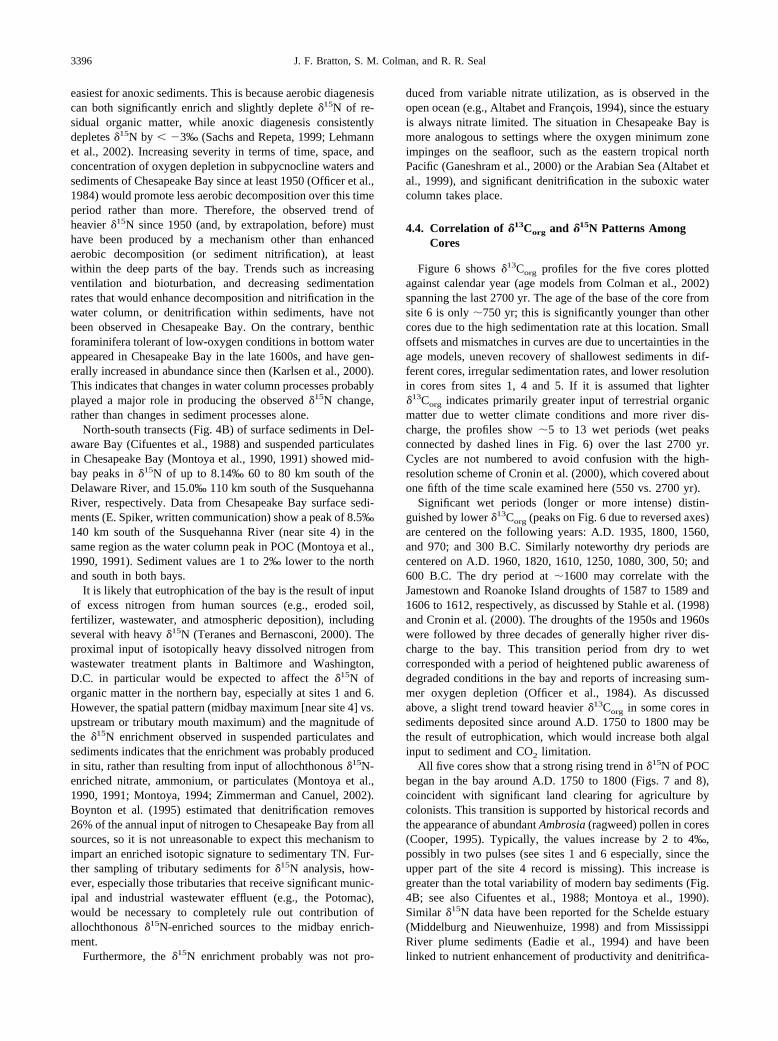
All five cores show that a strong rising trend in �15N of POCbegan in the bay around A.D. 1750 to 1800 (Figs. 7 and 8),coincident with significant land clearing for agriculture bycolonists. This transition is supported by historical records andthe appearance of abundant Ambrosia (ragweed) pollen in cores(Cooper, 1995). Typically, the values increase by 2 to 4‰,possibly in two pulses (see sites 1 and 6 especially, since theupper part of the site 4 record is missing). This increase isgreater than the total variability of modern bay sediments (Fig.4B; see also Cifuentes et al., 1988; Montoya et al., 1990).Similar �15N data have been reported for the Schelde estuary(Middelburg and Nieuwenhuize, 1998) and from MississippiRiver plume sediments (Eadie et al., 1994) and have beenlinked to nutrient enhancement of productivity and denitrifica-
3396 J. F. Bratton, S. M. Colman, and R. R. Seal
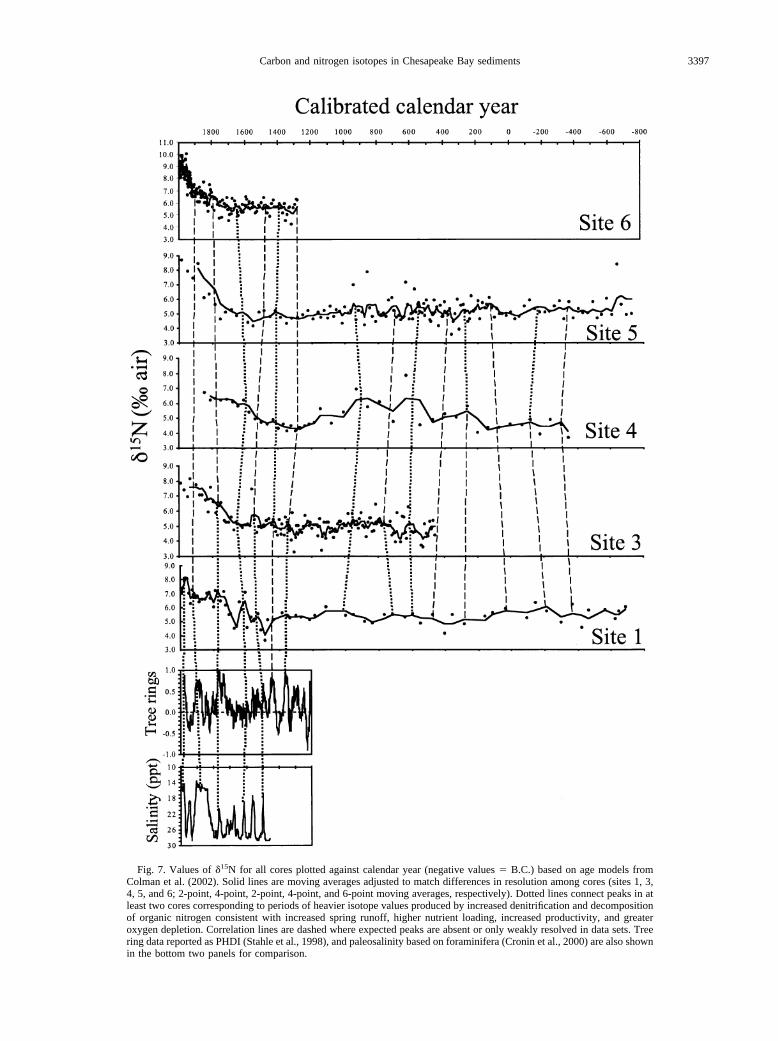
Fig. 7. Values of �15N for all cores plotted against calendar year (negative values � B.C.) based on age models fromColman et al. (2002). Solid lines are moving averages adjusted to match differences in resolution among cores (sites 1, 3,4, 5, and 6; 2-point, 4-point, 2-point, 4-point, and 6-point moving averages, respectively). Dotted lines connect peaks in atleast two cores corresponding to periods of heavier isotope values produced by increased denitrification and decompositionof organic nitrogen consistent with increased spring runoff, higher nutrient loading, increased productivity, and greateroxygen depletion. Correlation lines are dashed where expected peaks are absent or only weakly resolved in data sets. Treering data reported as PHDI (Stahle et al., 1998), and paleosalinity based on foraminifera (Cronin et al., 2000) are also shownin the bottom two panels for comparison.
3397Carbon and nitrogen isotopes in Chesapeake Bay sediments
tion, rather than heavy �15N signatures associated with chang-ing nitrogen sources.
The Chesapeake increase suggests that the magnitude of thechange in nitrogen fractionation in the mesohaline bay between1750 to 1800 and the present (Fig. 8) was greater than themagnitude of the modern difference between the �15N maxi-mum area, characterized by large algal blooms, and zones welloutside of the bloom region (Fig. 4B). This indicates that atleast the entire northern bay (Maryland portion) has experi-enced significant eutrophication and increases in both intensityand extent of algal blooms relative to background conditionsbefore 1750. The pattern is consistent from core to core despitesedimentation rates that vary by � 1 order of magnitudeindicating that the trend cannot be diagenetic. The observed�15N increase indicates an increase in denitrification, followingthe reasoning above. Such an increase would have initiallytaken place within sediments under an oxygenated water col-umn, but the marked, sustained, and increasing enrichment is
best explained by the development of oxygen depletion withinthe water column.
Water-column anoxia may be necessary to allow nitrogenfrom spring blooms to fuel productivity throughout the sum-mer, as has been demonstrated for Chesapeake Bay (Baird etal., 1995). This guarantees that isotopically heavy nitrogenproduced by denitrification and other mechanisms can be in-corporated into biomass and deposited in sediment in particu-late form. Therefore, the conclusion most consistent with the�15N data (Fig. 8) is that significant and consistent depletion ofoxygen during the summer in Chesapeake Bay waters began atthe same time as, and was likely caused by, agricultural devel-opment of the watershed. The signal is unprecedented in the2700-yr data set; there is also no obvious break in the enrich-ment trend between the modern conditions (summer anoxia)and the beginning of the trend 250 yr ago that would indicatea change in mechanism for the �15N enrichment. Significantnutrient inputs from wastewater discharge and application of
Fig. 8. Composite plot of all �15N data from all cores (n � 549) showing the transition from �2500 yr of nearly constantor slightly decreasing average values to 15N-enriched values after about A.D. 1750 to 1800 This pattern is consistent withanthropogenic eutrophication, increased denitrification, and increased oxygen depletion. Negative calendar years are B.C.The curve shown is a locally weighted least squared error fit to the data.
3398 J. F. Bratton, S. M. Colman, and R. R. Seal
inorganic fertilizer in the last century (Zimmerman and Canuel,2000) are likely to have exacerbated, rather than initiated, theproblem.
Superimposed on the �15N trends are shorter fluctuationssimilar to those seen in �13Corg profiles but not as clearlydeveloped (Figs. 6 and 7, especially high-resolution cores fromsites 3 and 6). Decadal to centennial wet-dry cycles shouldaffect �15N as well as �13Corg because delivery of more nutri-ents to the estuary during wetter intervals would be expected toproduce heavier �15N values in areas impacted by more intenseand widespread algal blooms and denitrification. Dry periodsshould produce the opposite effects. Except for a few �15N datapoints � 6‰ between A.D. 500 and 1000 in cores from sites 3,4, and 5 (Figs. 7 and 8), there is no evidence of significantdenitrification and associated oxygen depletion in any corebefore �1750. These few anomalous points may represent brief
periods of natural precolonial oxygen depletion in the bay dueto unusually wet spring conditions. Alternatively, they could beproducts of diagenesis or analytical artifacts.
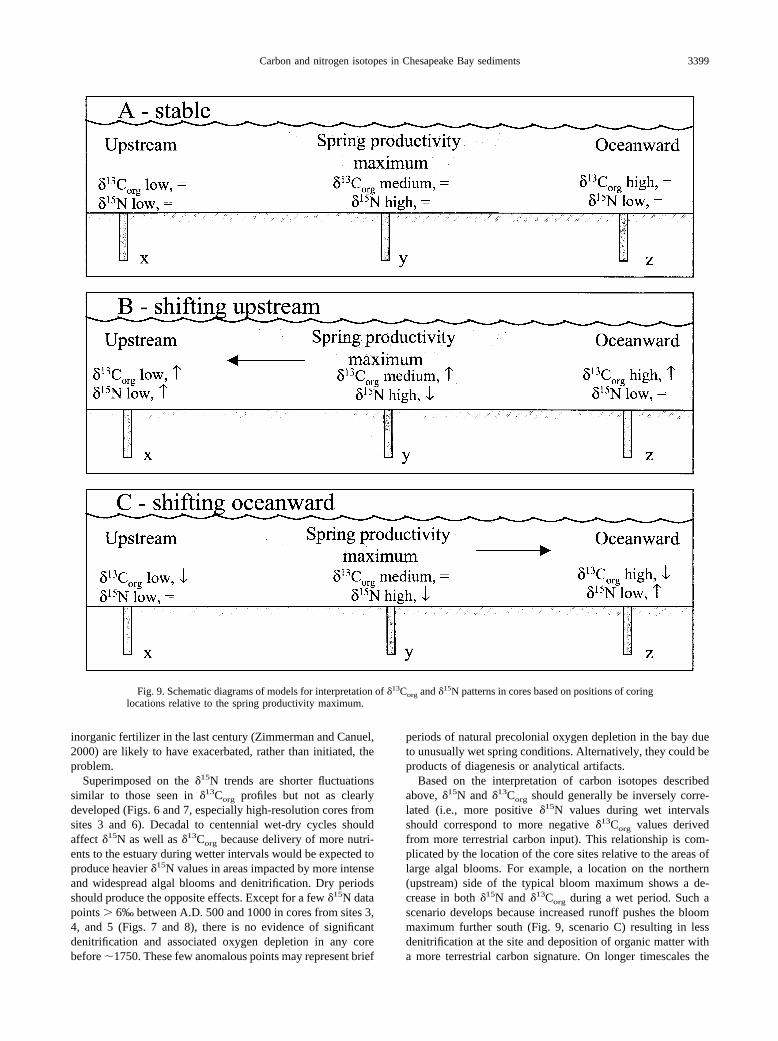
Based on the interpretation of carbon isotopes describedabove, �15N and �13Corg should generally be inversely corre-lated (i.e., more positive �15N values during wet intervalsshould correspond to more negative �13Corg values derivedfrom more terrestrial carbon input). This relationship is com-plicated by the location of the core sites relative to the areas oflarge algal blooms. For example, a location on the northern(upstream) side of the typical bloom maximum shows a de-crease in both �15N and �13Corg during a wet period. Such ascenario develops because increased runoff pushes the bloommaximum further south (Fig. 9, scenario C) resulting in lessdenitrification at the site and deposition of organic matter witha more terrestrial carbon signature. On longer timescales the
Fig. 9. Schematic diagrams of models for interpretation of �13Corg and �15N patterns in cores based on positions of coringlocations relative to the spring productivity maximum.
3399Carbon and nitrogen isotopes in Chesapeake Bay sediments
same pattern could be produced by infilling of the basin, basinuplift, reforestation, or falling sea level. The opposite situationis produced by a dry period (Fig. 9, scenario B) resulting inmigration of the bloom maximum upstream and decreased sizeof the bloom due to lower nutrient flux to the bay. The steadystate situation corresponds to scenario A in Figure 9.
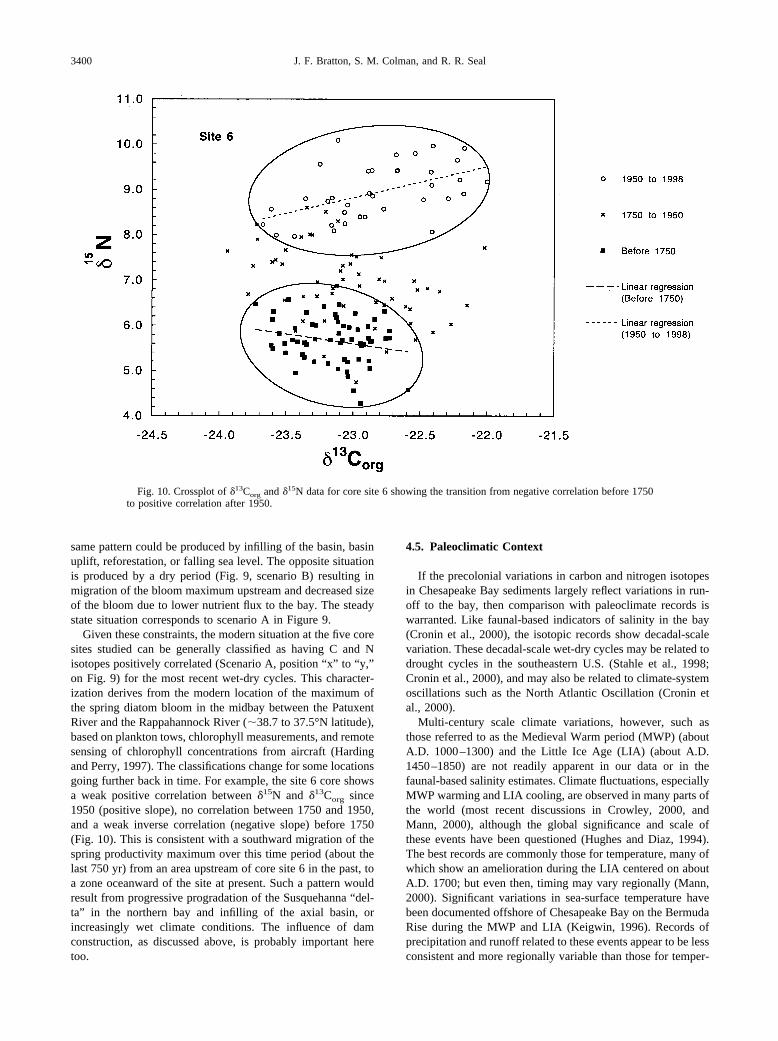
Given these constraints, the modern situation at the five coresites studied can be generally classified as having C and Nisotopes positively correlated (Scenario A, position “x” to “y,”on Fig. 9) for the most recent wet-dry cycles. This character-ization derives from the modern location of the maximum ofthe spring diatom bloom in the midbay between the PatuxentRiver and the Rappahannock River (�38.7 to 37.5°N latitude),based on plankton tows, chlorophyll measurements, and remotesensing of chlorophyll concentrations from aircraft (Hardingand Perry, 1997). The classifications change for some locationsgoing further back in time. For example, the site 6 core showsa weak positive correlation between �15N and �13Corg since1950 (positive slope), no correlation between 1750 and 1950,and a weak inverse correlation (negative slope) before 1750(Fig. 10). This is consistent with a southward migration of thespring productivity maximum over this time period (about thelast 750 yr) from an area upstream of core site 6 in the past, toa zone oceanward of the site at present. Such a pattern wouldresult from progressive progradation of the Susquehanna “del-ta” in the northern bay and infilling of the axial basin, orincreasingly wet climate conditions. The influence of damconstruction, as discussed above, is probably important heretoo.
4.5. Paleoclimatic Context
If the precolonial variations in carbon and nitrogen isotopesin Chesapeake Bay sediments largely reflect variations in run-off to the bay, then comparison with paleoclimate records iswarranted. Like faunal-based indicators of salinity in the bay(Cronin et al., 2000), the isotopic records show decadal-scalevariation. These decadal-scale wet-dry cycles may be related todrought cycles in the southeastern U.S. (Stahle et al., 1998;Cronin et al., 2000), and may also be related to climate-systemoscillations such as the North Atlantic Oscillation (Cronin etal., 2000).
Multi-century scale climate variations, however, such asthose referred to as the Medieval Warm period (MWP) (aboutA.D. 1000–1300) and the Little Ice Age (LIA) (about A.D.1450–1850) are not readily apparent in our data or in thefaunal-based salinity estimates. Climate fluctuations, especiallyMWP warming and LIA cooling, are observed in many parts ofthe world (most recent discussions in Crowley, 2000, andMann, 2000), although the global significance and scale ofthese events have been questioned (Hughes and Diaz, 1994).The best records are commonly those for temperature, many ofwhich show an amelioration during the LIA centered on aboutA.D. 1700; but even then, timing may vary regionally (Mann,2000). Significant variations in sea-surface temperature havebeen documented offshore of Chesapeake Bay on the BermudaRise during the MWP and LIA (Keigwin, 1996). Records ofprecipitation and runoff related to these events appear to be lessconsistent and more regionally variable than those for temper-
Fig. 10. Crossplot of �13Corg and �15N data for core site 6 showing the transition from negative correlation before 1750to positive correlation after 1950.
3400 J. F. Bratton, S. M. Colman, and R. R. Seal
ature (Crowley and North, 1991). It may be that century-scalevariations in moisture conditions in the Chesapeake Bay wa-tershed were minor, such that the most apparent system re-sponse was to decadal scale drought patterns. Since about A.D.1750 to 1800, any climatic signals that are present have beenheavily overprinted by anthropogenic effects, decreasing thelikelihood of detecting any subtle signals. That said, attributionof significant forcing of postcolonial changes in ChesapeakeBay conditions to amelioration of LIA climate is unwarranted,since the magnitude of recent changes is unprecedented overthe 2500 yr of the core record where climate alone drove thesystem.
4.6. Application to Other Estuaries
These data provide time-averaged baseline information thatcan be integrated with modern monitoring programs to detectexpected recovery of the system as nutrient loading is reduced.For example, reversal of eutrophication should result in shrink-age of the area of surficial sediments with elevated �15N, anddecreasing �15N values in the center of the region of maximumproductivity. Values of �13C should also decrease as autoch-thonous organic matter input decreases.
The length and resolution of the water quality data set thatexists for Chesapeake Bay is among the best available for anyestuary in the world, but the data presented here put it into amuch larger time and space context. This approach could beproductively applied to assess the health of other developedestuaries relative to their pristine conditions and relative todifferent climatic regimes, especially where historical waterquality data are limited or absent. This should lead to betterunderstanding of general biogeochemical evolution of estuariesand their role in global C and N cycling, as well as improvedability to design effective management and remediation strat-egies for degraded estuarine ecosystems and resources.
Acknowledgments—We thank Thomas Cronin for supplying samplesand paleosalinity data, and David Stahle for use of tree ring data. Weappreciate the analytical contributions of Pattie Baucom, GregoryWandless, Adam Johnson, Dorinda Ostermann, William Curry, JasonYonehiro, and Theresa Barber. We also thank Richard Younger, cap-tain of R/V Discovery (now R/V Kerhin); Jeffrey Halka; Ellen Mecray;Andrew Zimmerman; and Alex Karlsen for valuable contributionsduring coring and sampling operations. Daniel McCorkle, StevenPetsch, Peter Swarzenski, Simon Sheppard, and four anonymous re-viewers provided helpful comments on drafts of this manuscript. Anyuse of trade, product, or firm names is for descriptive purposes only anddoes not imply endorsement by the U.S. government.
Associate editor: S. M. F. Sheppard
REFERENCES
Adelson J. M., Helz G. R., and Miller C. V. (2001) Reconstructing therise of recent coastal anoxia; molybdenum in Chesapeake Bay sed-iments. Geochim. Cosmochim. Acta 65, 237–252.
Altabet M. A. and Francois R. (1994) Sedimentary nitrogen isotopicratio records surface ocean nitrate utilization. Glob. Biogeochem.Cycles 8, 103–116.
Altabet M. A., Murray D. W., and Prell W. L. (1999) Climaticallylinked oscillations in Arabian Sea denitrification over the past 1 m.y.; implications for the marine N cycle. Paleoceanography 14,732–743.
Baird D., Ulanowicz R. E., and Boynton W. R. (1995) Seasonalnitrogen dynamics in Chesapeake Bay: A network approach. Estuar.Coast. Shelf Sci. 41, 137–162.
Baucom P. C., Bratton J. F., Colman S. M., Moore J. M., King J., HeilC., and Seal R. (2001) Selected Data for Sediment Cores Collectedin Chesapeake Bay in 1996 and 1998. USGS Open-File Report01-194.
Boehme S. E., Blair N. E., Chanton J. P., and Martens C. S. (1996) Amass balance of 13C and 12C in an organic-rich methane-producingmarine sediment. Geochim. Cosmochim. Acta 60, 3835–3848.
Boynton W. R., Kemp W. M., Barnes J. M., Matteson L. L., RohlandF. M., Jasinski D. A., and Kimble H. L. (1993) Chesapeake BayWater Quality Monitoring Program, Level One Data Report #10,Part 1: Interpretive Report.
Boynton W. R., Garber J. H., Summers R., and Kemp W. M. (1995)Input, transformations, and transport of nitrogen and phosphorus inChesapeake Bay and selected tributaries. Estuaries 18, 285–314.
Brandes J. A. and Devol A. H. (1997) Isotopic fractionation of oxygenand nitrogen in coastal marine sediments. Geochim. Cosmochim.Acta 61, 1793–1801.
Brush G. S. (1984) Stratigraphic evidence of eutrophication in anestuary. Wat. Res. Res. 20, 531–541.
Cifuentes L. A., Sharp J. H., and Fogel M. L. (1988) Stable carbon andnitrogen isotope biogeochemistry in the Delaware estuary. Limnol.Oceanogr. 33, 1102–1115.
Colman S. M. and Bratton J. F. (2003) Anthropogenically inducedchanges in sediment and biogenic silica fluxes in Chesapeake Bay.Geology 31, 71–74.
Colman S. M., Baucom P. C., Bratton J. F., Cronin T. M., McGeehinJ. P., Willard D., Zimmerman A. R., and Vogt P. R. (2002) Radio-carbon dating, chronologic framework, and changes in accumulationrates of Holocene estuarine sediments from Chesapeake Bay. Quat.Res. 57, 58–70.
Cooper S. R. (1995) Chesapeake Bay watershed historical land use:Impact on water quality and diatom communities. Ecol. Appl. 5,703–723.
Cooper S. R. and Brush G. S. (1991) Long-term history of ChesapeakeBay anoxia. Science 254, 992–996.
Cooper S. R. and Brush G. S. (1993) A 2,500-year history of anoxiaand eutrophication in Chesapeake Bay. Estuaries 16, 617–626.
Cornwell J. C., Conley D. J., Owens M., and Stevenson J. C. (1996) Asediment chronology of the eutrophication of Chesapeake Bay. Es-tuaries 19, 488–499.
Cowan J. L. W. and Boynton W. R. (1996) Sediment-water oxygen andnutrient exchanges along the longitudinal axis of Chesapeake Bay:Seasonal patterns, controlling factors and ecological significance.Estuaries 19, 562–580.
Cronin T., Willard D., Karlsen A., Ishman S., Verardo S., McGeehin J.,Kerhin R., Holmes C., Colman S., and Zimmerman A. (2000)Climatic variability in the eastern United States over the past mil-lennium from Chesapeake Bay sediments. Geology 28, 3–6.
Crowley T. J. (2000) Causes of climate change over the past 1000years. Science 289, 270–277.
Crowley T. J. and North G. R. (1991) Paleoclimatology. OxfordUniversity Press, New York.
Eadie B. J., McKee B. A., Lansing M. B., Robbins J. A., Metz S., andTrefry J. H. (1994) Records of nutrient-enhanced coastal oceanproductivity in sediments from the Louisiana Continental Shelf.Estuaries 17, 754–765.
Fogel M. L., Cifuentes L. A., Velinsky D. J., and Sharp J. H. (1992)Relationship of carbon availability in estuarine phytoplankton toisotopic composition. Mar. Ecol. Prog. Ser. 82, 291–300.
Ganeshram R. S., Pedersen T. F., Calvert S. E., McNeill G. W., andFontugne M. R. (2000) Glacial-interglacial variability in denitrifica-tion in the world’s oceans; causes and consequences. Paleoceanog-raphy 15, 361–376.
Goni M. A., Ruttenberg K. C., and Eglinton T. I. (1997) Sources andcontributions of terrigenous organic carbon to surface sediments inthe Gulf of Mexico. Nature 389, 275–278.
Haddad R. I. and Martens C. S. (1987) Biogeochemical cycling in anorganic-rich coastal marine basin; 9, sources and accumulation ratesof vascular plant-derived organic material. Geochim. Cosmochim.Acta 51, 2991–3001.
3401Carbon and nitrogen isotopes in Chesapeake Bay sediments
Harding L. W. Jr. and Perry E. S. (1997) Long-term increase ofphytoplankton biomass in Chesapeake Bay, 1950-1994. Mar. Ecol.Prog. Ser. 157, 39–52.
Hofmann M., Wolf-Gladrow D. A., Takahashi T., Sutherland S. C., SixK. D., and Maier-Reimer E. (2000) Stable carbon isotope distribu-tion of particulate organic matter in the ocean: A model study. Mar.Chem. 72, 131–150.
Horrigan S. G., Montoya J. P., Nevins J. L., and McCarthy J. J. (1990)Natural isotopic composition of dissolved inorganic nitrogen in theChesapeake Bay. Estuar. Coast. Shelf Sci. 30, 393–410.
Hughes M. K. and Diaz H. F. (1994) Was there a “Medieval WarmPeriod” and if so, where and when? Clim. Change 26, 109–142.
Hunt J. M. (1966) The significance of carbon isotope variations inmarine sediment. In Advances in Organic Geochemistry: 2nd Inter-national Congress on Organic Geochemistry, pp. 27–36.
Ingram B. L., Conrad M. E., and Ingle J. C. (1996) Stable isotope andsalinity systematics in estuarine waters and carbonates: San Fran-cisco Bay. Geochim. Cosmochim. Acta 60, 455–467.
Karlsen A. W., Cronin T. M., Ishman S. E., Willard D. A., HolmesC. W., Marot M., and Kerhin R. (2000) Historical trends in Chesa-peake Bay dissolved oxygen based on benthic Foraminifera fromsediment cores. Estuaries 23, 488–508.
Keigwin L. D. (1996) The Little Ice Age and Medieval Warm Periodin the Sargasso Sea. Science 274, 1504–1508.
Kemp W. M., Sampou P., Caffrey J., Mayer M., Henriksen K., andBoynton W. R. (1990) Ammonium recycling versus denitrification inChesapeake Bay sediments. Limnol. Oceanogr. 35, 1545–1563.
Kemp W. M., Sampou P. A., Garber J., Tuttle J., and Boynton W. R.(1992) Seasonal depletion of oxygen from bottom waters of Chesa-peake Bay: Roles of benthic and planktonic respiration and physicalexchange processes. Mar. Ecol. Prog. Ser. 85, 137–152.
Kerhin R. T., Williams C., and Cronin T. M. (1998) Lithologic De-scriptions of Piston Cores from Chesapeake Bay, Maryland. Open-File Report, U.S. Geological Survey, OF 98-0787.
Langland M. J, Hainly R. A. (1997) Changes in Bottom Surface-Elevations in Three Reservoirs on the Lower Susquehanna River,Pennsylvania and Maryland, Following the January 1996 Flood—Implications for Nutrient and Sediment Loads to Chesapeake Bay.USGS Water-Res. Invest. Report 97-4138.
Lehmann M. F., Bernasconi S. M., Barbieri A., and McKenzie J. A.(2002) Preservation of organic matter and alteration of its carbon andnitrogen isotope composition during simulated and in situ earlysedimentary diagenesis. Geochim. Cosmochim. Acta 66, 3573–3584.
Liu K.-K. and Kaplan I. R. (1989) The eastern tropical Pacific as asource of 15N-enriched seawater off southern California. Limnol.Oceanogr. 34, 820–830.
Lucotte M. (1989) Organic carbon isotope ratios and implications forthe maximum turbidity zone of the St. Lawrence upper estuary.Estuar. Coast. Shelf Sci. 29, 293–304.
Malone T. C. (1991) River flow, phytoplankton production and oxygendepletion in Chesapeake Bay. Modern and Ancient Continental ShelfAnoxia. Geol. Soc. Spec. Pub. 58, 83–93.
Mann M. E. (2000) Lessons for a new millennium. Science 289,253–254.
McArthur J. M., Tyson R. V., Thomson J., and Mattey D. (1992) Earlydiagenesis of marine organic matter: Alteration of the carbon isoto-pic composition. Mar. Geol. 105, 51–61.
McMillan C., Parker P. L., and Fry B. (1980) 13C/12C ratios in sea-grasses. Aquat. Bot. 9, 237–249.
Middelburg J. J. and Nieuwenhuize J. (1998) Carbon and nitrogenstable isotopes in suspended matter and sediments from the ScheldeEstuary. Mar. Chem. 60, 217–225.
Miller C. V. (1992) Sedimentary Molybdenum; a Geochemical Indica-tor of Anoxia in Chesapeake Bay. Ph.D. dissertation, Department ofChemistry, University of Maryland–College Park.
Montoya J. P. (1994) Nitrogen isotope fractionation in the modernocean: Implications for the sedimentary record. In Carbon Cycling inthe Glacial Ocean: Constraints on the Ocean’s Role in GlobalChange (eds. R. Zahn, T. F. Pedersen, M. A. Kaminski, and L.Labeyrie), pp. 259–279. Springer-Verlag, Berlin, Germany.
Montoya J. P., Horrigan S. G., and McCarthy J. J. (1990) Naturalabundance of 15N in particulate nitrogen and zooplankton in theChesapeake Bay. Mar. Ecol. Prog. Ser. 65, 35–61.
Montoya J. P., Horrigan S. G., and McCarthy J. J. (1991) Rapid,storm-induced changes in the natural abundance of 15N in a plank-tonic ecosystem, Chesapeake Bay, USA. Geochim. Cosmochim. Acta55, 3627–3638.
Officer C. B., Biggs R. B., Taft J. L., Cronin L. E., Tyler M. A., andBoynton W. R. (1984) Chesapeake Bay anoxia; origin, development,and significance. Science 223, 22–27.
Onstad G. D., Canfield D. E., Quay P. D., and Hedges J. I. (2000)Sources of particulate organic matter in rivers from the continentalUSA: Lignin phenol and stable carbon isotope compositions.Geochim. Cosmochim. Acta 64, 3539–3546.
Ostermann D. R. and Curry W. B. (2000) Calibration of stable isotopicdata: An enriched �18O standard used for source gas mixing detec-tion and correction. Paleoceanography 15, 353–360.
Sachs J. P. and Repeta D. J. (1999) Oligotrophy and nitrogen fixationduring eastern Mediterranean sapropel events. Science 286, 2485–2488.
Schubel J. R. (1968) Turbidity maximum of northern Chesapeake Bay.Science 161, 1013–1015.
Seliger H. H., Boggs J. A., and Biggley W. H. (1985) Catastrophicanoxia in the Chesapeake Bay in 1984. Science 228, 70–73.
Sigleo A. C. and Macko S. A. (1985) Stable isotope and amino acidcomposition of estuarine dissolved colloidal material. In Marine andEstuarine Geochemistry (eds. A. C. Sigleo and A. Hattori), pp.29–46. Lewis.
Spiker E. C. (1980) The behavior of 14C and 13C in estuarine water:Effects of in situ CO2 production and atmospheric exchange. Radio-carbon 22, 647–654.
Stahle D. W., Cleaveland M. K., Blanton D. B., Therrell M. D., andGay D. A. (1998) The lost colony and Jamestown droughts. Science280, 564–567.
Stribling J. M. and Cornwell J. C. (1997) Identification of importantprimary producers in a Chesapeake Bay tidal creek system usingstable isotopes of carbon and sulfur. Estuaries 20, 77–85.
Teranes J. L. and Bernasconi S. M. (2000) The record of nitrateutilization and productivity limitation provided by �15N values inlake organic matter—A study of sediment trap and core sedimentsfrom Baldeggersee, Switzerland. Limnol. Oceanogr. 45, 801–813.
Wada, E. (1980) Nitrogen isotope fractionation and its significance inbiogeochemical processes occurring in marine environments. In Iso-tope Marine Chemistry (eds. E. Goldberg, Y. Horibe, and K. Saru-hashi), pp. 375–398. Uchida Rokakuho.
Zimmerman A. R. and Canuel E. A. (2000) A geochemical record ofeutrophication and anoxia in Chesapeake Bay sediments; anthropo-genic influence on organic matter composition. Mar. Chem. 69,117–137.
Zimmerman A. R. and Canuel E. A. (2002) Sediment geochemicalrecords of eutrophication in the mesohaline Chesapeake Bay. Lim-nol. Oceanogr. 47, 1084–1093.
3402 J. F. Bratton, S. M. Colman, and R. R. Seal