Embed Size (px)
Citation preview
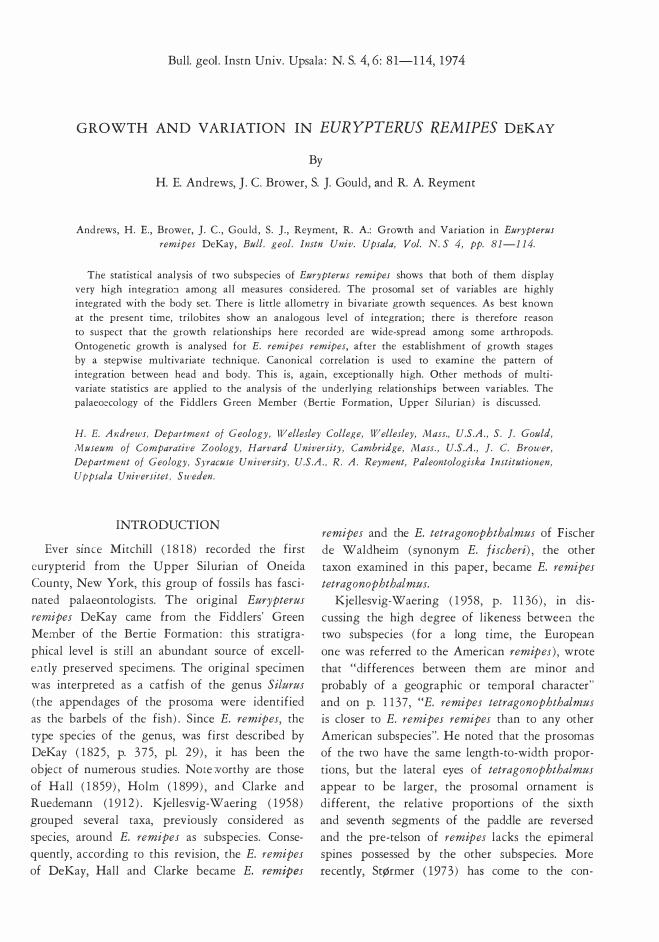
Bull. geo!. Instn Univ. Upsala: N. S. 4, 6: 81-114, 1974
GROWTH AND VARIATION IN EURYPTERUS REMIPES DEKAY
By
H. E. Andrews, ]. C. Brower, S. ]. Gould, and R. A. Reyment
Andrews, H. E. , Brower, ]. C ., G ou ld, S . ]., Reyment, R. A.: Grow th and Variation in EurypteruJ
remipes DeKay, Bull. geo!. Instn Univ. Upsala, Vol. N. S 4, pp. 81-114.
Th e statistic al analysis of two subspec ies of Eurypterus remipes shows that both of them display
v ery high integratio:� among all measures c onsidered. The prosomal set of variables are highly
integrated with the b ody set. There is little allometry in bivariate growth seque nces. As best known
at the present time, trilobites show an analogous leve! of integration; there is therefore reason
to suspec t that the gr owth relationships here rec orded are w ide-spread among some arthropods.
Ontogenetic growth is a nalysed for E. remipes remipes, after the establishment of grow th stages
b y a stepwise m ultiv ariate technique. Canonic al c orrelation is used to examine the pattern of
integration between head and body. This is, again, exceptionally high. Other methods of multi
variate statistic s are applied to the analysis of the underlying relationships between variables. The
palaeoec olog y of the Fiddlers Green Member (Bertie Formation, Upper Silurian) is discussed.
H. E. Andrews, Department of Geology, \'(/ ellesley Colle�;e, \'(/ ellesley, Mass., U.S.A., S. ]. Gould,
Museum of Comparative Zoology, Harvard University, Cambridge, Mass., U.S.A., ]. C. Brower,
Department of Geology, Syracuse University, U.S.A., R. A. Reyment, Paleontologiska Institutionen,
Uppsala Unit;ersitet. Su,eden.
INTRODUCTION
Ever smce Mitchill (1818) recorded the first
eurypterid from the Upper Silurian of Oneida
County, New York, this group of fossils has fasci
nated palaeonrologists. The original Eurypterus
remipes DeKay came from the Fiddlers' Green
Member of the Bertie Formation: this stratigra
phical leve! is still an abundant source of excell
e:uly preserved specimens. The original specimen
was imerpreted as a catfish of the genus Silurus
(the appendages of the prosoma were identified
as the barbels of the fish) . Since E. remipes, the
type species of the genus, was first described by
DeKay (1825 , p. 375, pl. 29) , it has been the
object of numerous studies. Note-:vorthy are those
of Hall (1859) , Holm (1899) , and Clarke and
Ruedemann (1912) . Kjellesvig-Waering (1958)
grouped several taxa, previously considered as
species, around E. remipes as subspecies. Conse
quently, according ro this revision, the E. remipes
of DeKay, Hall and Clarke became E. remipes
remipes and the E. tetragonophthalmus of Fischer
de Waldheim ( synonym E. fischeri) , the other
taxon examined in this paper, became E. remipes
tetragonophthalmus.
Kjellesvig-Waering (1958, p. 1136 ) , in dis
cussing the high degree of likeness between the
two subspecies (for a long time, the European
one was referred to the American remipes) , wrote
that "differences between them are minor and
probably of a geographic or tempora! character"
and on p. 1137, "E. remipes tetragonophthalmus
is doser to E. remipes remipes than to any other
American subspecies". He noted that the prosomas
of the two have the same length-to-width propor
tions, but the lateral eyes of tetragonopbthalmus
appear to be larger, the prosomal ornament is
different, the relative proportions of the sixth
and sevemh segments of the paddle are reversed
and the pre-telson of remipes lacks the epimeral
spines possessed by the other subspecies. More
recently, StØrmer ( 1973) has come to the con-

82 H. E. Andrews, ]. C. Brower, S. ]. Gould, and R . A. R eyment
dusion that differences in the paddles of the
European and American forms are great enough
to warrant generic separation and has therefore
made tetragonophthalmus the type of his new
genus, Baltoeurypterus. Kjellesvig-Waering has
informed us that he is in agreement with StØnner.
We have Iooked into the grounds for this genus
and Gould and Reyment think that such slight
differences can hardly be of more than minor
taxonomic importance. There is a distinct danger
that we have here a case of the "key character
concept" . That is, a certain character is defined as
being of "generic" value ( rather than "specific"
or "varietal") and then one is forced to honour
every variation in this character with a high-leve!
taxonomic designation. The variational patterns
of the European and American eurypterids are
very dose indeed. Future study may bring to light
more substantial differences, bur until then, we have
chosen a conservative approach by retaining both
taxa as subspecies of Eurypterus remipes.
As far as we know, this is the first detailed
statistical study of a eurypterid to appear. Indeed,
Kjellesvig-Waering (1958) observed that the
variability of the eurypterids had yet to be studied.
Qualitative observations occur scattered through
out the literature, the most comprehensive being
those of Clarke and Ruedemann (1912); most of
the growth changes they noted in their qualitative
appraisal of E. remipes remipes show up dearly
in our statistical study.
The purposes of this work are to study the
ontogeny and variation of two dosely related
eurypterids, to contrast and compare the results
obtained, and to attempt a palaeoecological analy
sis for E. remipes remipes.
Befare making any general statements about the
nature of functional integration in eurypterids, we
must know whether the patterns discovered in one
species can be detected in related taxa. Thus,
Brower and Reyment were pleased to learn that
Andrews and Gould had done an independent
mu!tivariate analysis of a European eurypterid.
Because the two groups worked in complete in
dependence and used different measures and
methods, a set of similar results would seem all
the more compelling. The similarity is striking
indeed: the extreme intensity of integration among
nearly all measures is also the primary condusion
of Andrews' and Gould's work. Moreover, the few
multivariate studies of trilobites that we know
(Eldredge, 1972, in particular, and references
therein) have independently discovered the exi
stence of very high correlations and little allometry
in omogenetic series. W e feel that we may there
fore be stat ing a quite general principle of growth
in certain arthropods. Ostracods display a much lower leve! of integration (Reyment, 1960, 1963,
1966) .
Gould and Andrews studied a collection of
eurypterids from the upper Silurian of the Baltic
island Saaremaa, Estonian S.S.R. The collection
was made in 1930 by W. Patten (who used them to help argue his case for an arthropod origin of
the vertebrates) . Several hundred excellent speci
mens, ranging fro:n l to 30 cm in length, are
in the Museum of Comparative Zoology, Harvard
University. The analysis was made on 44 specimens
evenly spanning the entire range of size; all had
complete prosomas as well as the first segment of
the mesosoma and seem to be preserved without
distortion.
The material studied by Brower and Reyment
comes from collections at Colgate University,
Hamilton, N.Y. and Syracuse University, Syracuse,
N.Y.
ACKNOWLEDGMENTS
Brower and Reyment are indebted to Colgate
University for giving them access to a magnificient
collection of E. remipes remipes and, in particular,
to Professor Robert M. Linsley of the Geology
Department for giving us a set of prosomal
measurements on the Colgate specimens. A great
deal of the basic work on the material of E. remi
pes remipes was carried out as a dass project
by the following students at Syracuse University:
Maurice Cucci, John Douglas, Duane Eppler, Susan
Siwek, John Kennedy, and Ghan Shyam Srivastava.
Acknowledgment is made in the text for the resu!ts
obtained by them.
Measurements on the Syracuse University E. re
mipes remipes prosomas and Limulus polyphemus

Growtb and V ariation in Eurypterus remipes DeKay 83
were made by Edna S. Kaneshiro (1962, un
published Master's thesis) who also did much pre
liminary processing of these data.
The Syracuse University specimens were collec
ted by Adawia Alousi, Nora Kula, Sachiko Naka
gawa, E. S. Kaneshiro, Ralph W atson, J. L. Craft
and the writers. We thank Robert M. Linsley, Erik N. Kjelles
vig-Waering (Amoco International Oil Co., Chi
cago, Illinois, USA), C. D. Waterston (Royal
Scottish Museum, Edinburgh) and D. F. Merriam
(Syracuse University) for reviewing the manuscript and making helpful suggestions for im
provement.
The identifications of most of the species occur
ring with Eurypterus remipes remipes were kindly
made by Professor John W. Wells of Cornell
University (lthaca, New York) , Dr. Erik Kjel
lesvig-Waering, and Professor Robert M. Linsley.
The text figures were drawn by Mrs. Dagmar
Engstrom and the manuscript typed by Mrs. Eva
Eklind, both of the Palaeontological Department,
Uppsala University. The Syracuse University and
Uppsala University Computer Centers provided
computer time; James Wilson of the Syracuse
Computer Center aided in APL programming.
Reyment's contribution to the study was made
while he was a Visiting Professor at Syracuse
University, autumn, 1972 , in part sponsored by
the Mobil Oil Company.
COMPUTER PROGRAMS USED FOR THE
ANALYSIS OF E. REMIPES
The computations on E. r. remipes were made
using standard APL procedures and programs
developed by Brower, Reymeot and Wilson. The
multivariate analyses were made with BMD
FORTRAN programs (Dixon, 1970) and FOR
TRAN programs of Blackith and Reymeot (1971) .
Reference is also made tO Veldman (1967) for
a program for squared distance coefficients and
average linkage duster analysis. The computa
tions on E. r. tetragonophthalmus were made with
COV AP, a FOR TRAN program (Manson and
Imbrie, 1964; Gould, 1967) .
ANALYSIS OF EURYPTERUS REMIPES
TETRAGONOPHTHALMUS
By
Harold E. Andrews and Stephen Jay Gould
Twenty seven measurements were made on each
specimen. We attempted to establish a well-spaced
grid of general lengths, widths and diagonals;
allometric changes produced by gradients of diffe
rential growth (Huxley, 193 2 ; Gould, 1966) should
have a multivariate expression in the clustering
of dimensions expressing a gradient. W e also
constructed a set of measures for anatomical fea
tures of particular interest ( the eyes and the first
mesosomal segment) .
We analyzed our 44 X 2 7 matrix with COV AP
for R and Q mode principal components factor
analysis with options for varimax and oblique
rotations. As these techniques assume a linear
relationship between pairs of variables, we trans
formed all measures tO their logarithms before
the analysis. About the only allometric relation
ship consistently found in arthropods is the nega
tive differential growth of the eyes . Bivariate
plots show that the Saaremaa eurypterids are no
exception to this general trend.
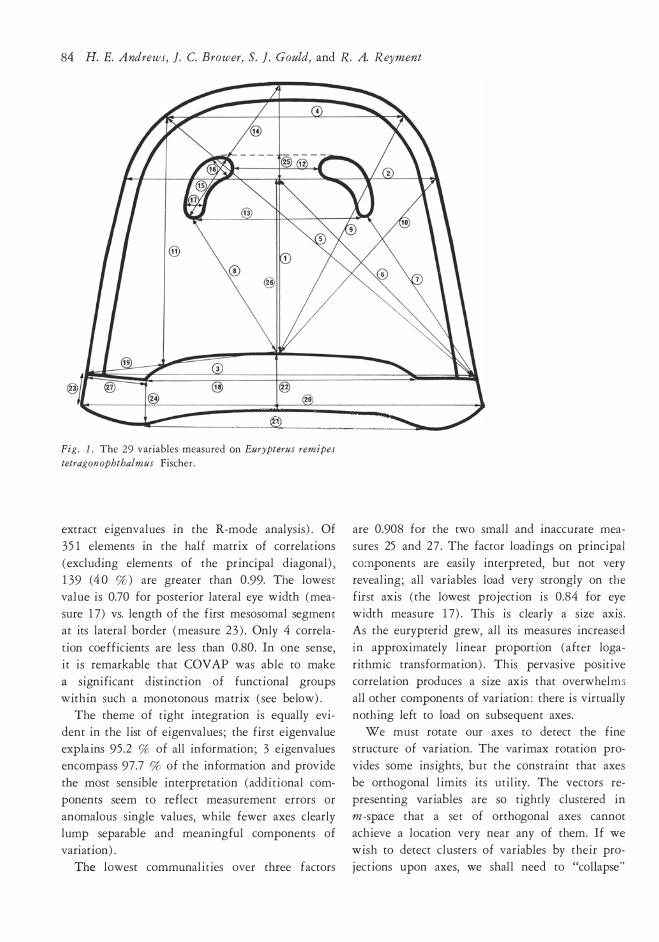
The variables are listed in the explanation to
Fig. l, the illustration of the variables measured.
Differential allometric relationships found are: Eye
length (measure 15 ) vs. prosoma length (measure
1):
EL= 0.64 PL0-73, at r = 0.977,
while for eye width (measure 16) vs. prosoma
length
EW = 0.46 PL0-62, at r = 0.907. Virtually all other bivariate relations are isometric;
for prosoma width (measure 2) vs. prosoma length, for example,
PW = 1.36 PL0·99, at r = 0.998. Because the logarithmic transformation of the
power function is a standard linear equation, ope
ration on logarithms of original data removes the
potential dilemma of non-linearity due to allo
metric power functions.
The first evidence of extremely high integra
tion comes from the correlation matrix (used to
84 H. E. Andrews, ]. C. Brower, S. ]. Gould, and R. A. Reyment
Fig. l. The 29 v ariables measured on Eurypterus remipes
tetragon ophthalmus Fisc her .
extract eigenvalues in the R-mode analysis) . Of
351 elements in the half matrix of correlarions
( excluding elements of the principal diagonal) ,
139 ( 4 0 % ) are greater than 0.99. The lowesr
value is 0.70 for posterior lateral eye width (mea
sure 17) vs. length of the first mesosomal segment
at its lateral border (measure 2 3 ) . Only 4 correla
rion coefficients are less than 0.80. In one sense,
it is remarkable that COV AP was able to make
a significant distinction of functional groups
within such a monotonous matrix (see below) .
The theme of right integration is equally evi
dent in the list of eigenvalues ; the first eigenvalue
explains 95 .2 % of all information; 3 eigenvalues
encompass 97.7 % of the information and provide
the most sensible interpretation (addirional com
ponents seem to reflect measurement errors or
anomalous single values, while fewer axes clearly
Jump separable and meaningful components of
variation) .
The lowest communaliries over three factors
are 0.908 for the rwo small and inaccurate mea
sures 25 and 27 . The factor loadings on principal
components are easily interpreted, bur not very
revealing; all variables load very strongly on the
first axis (the lowest projection is 0.84 for eye
width measure 17) . This is clearly a size axis .
As the eurypterid grew, all its measures increased
in approximately linear proportion (after loga
rithmic transformation) . This pervasive positive
correlation produces a size axis that overwhelms
all other components of variation: there is virrually
nothing left to load on subsequent axes.
We must rotate our axes to detect the fine
srructure of variation. The varimax rotation pro
vides some insights, bur the consrraint that axes
be orthogonal limits its urility. The vectors re
presenting variables are so tightly clusrered in
m-space that a ser of orthogonal axes cannot
achieve a location very near any of them. If we
wish to detect clusters of variables by their pro
jecrions upon axes, we shall need to "collapse"
Growth and V ariation in Eurypterus remipes DeKay 85
Table l. Triaxial obli que fac tor soluti on for the
Saarem aa eurypterids; rec ordered oblique projec tion
m atrix.
Measure
num ber 2 1 1 7 23
2 1 1 .000 0.000 0.000
18 0.980 0.02 5 0.004
26 0.933 - 0.0 13 0.089
20 0.9 18 0.06 1 0.043
3 0 .906 0 .075 0.044
1 2 0 .900 0.074 0 .050
19 0.889 0.083 0 .052
lO 0.886 0.047 0.08 1
2 0 .886 0.08 1 0.060
13 O.R8 5 0. 1 02 0.040
4 O.RR2 0 .05/l 0 .085
7 0.880 -0.006 0. 1 4 1
6 0.874 0 .052 0. 1 00
5 0 .869 0 .07 1 0.089
1 1 0.849 0.045 0 . 131
1 4 0. 838 0. 1 0 5 0 .087 l 0.835 0.073 0 . 1 24
9 0.833 0. 1 1 5 0 .084 8 0.82/l 0.074 0. 1 2 7
2 5 0 .792 0. 1 57 0.042
1 5 0 .747 0 .288 0.004
22 0.482 0 . 131 0.42 5
1 7 0 .000 1 .000 0.000 16 0 .07 7 0. 7 7 0 0. 1 8 5
2 7 0.248 0.404 0.392
23 0.000 0.000 1 .000
24 0 .064 0.449 0 .5 69
See Fig. l for t he m eanings of the m easure num bers.
our reference space and use an oblique solution
with non-orthogonal axes placed within the vector
swarm itself. COV AP performs an oblique rota
tion using actual vectors (at extreme positions in
the swarm) as reference axes.
Table l presents a triaxial oblique solution for
the Saaremaa eurypterids ; each variable is grouped
with the reference vector of its strongest pro
jection. The three groups now have a ready and
interesting interpretation.
The first and major duster indudes all the
general dimensions of the length-width-diagonal
grid ; it is this system's expression of a size factor. Nonetheless , there is an interesting stratification
within it, reflecting same degree of differentiation.
The reference axis itself is a width - the most
posterior width, measure 21 ( the choice of refe
rence axis is of no particular significance in itself).
Now, of the 10 highest projections upon the
reference axis, 8 are widths - and this indudes
all the width measures. (The exceptions are length
measure 26 and diagonal 10). Moreover, of the
first 5 widths, four are posterior widths; the latter
three are anterior widths. The remaining 11 vari
ables are all diagonal or length measures ; the
diagonals tend to come first ( 4 of the first 5).
Thus, we see a stratification of this tight duster
into four poorly defined but dear aggregations: posterior widths, anterior widths, diagonals and
lengths. There is same tendency for measures of
a single direction and place to sort together; this
must reflect same slight differentiation (by di
rectional gradients or local effects) within the
pervasive isometry of integration.
The second axis indudes the two eye widths
and the unsatisfactory measure of prosomal end
width (measure 27 - its projections are low
and nearly equal on all three axes ; its placement
with one of the three demands no special ex
planation) . Eye length (measure 15), though it
groups with the general measures, has the highest
projection upon the second axis of any variable
outside the duster of the second axis itself. W e
repeat that the separate sorting of eye measures
is not, per se, a result of its negative allometry
to general size; for a logarithmic transformation
was applied to the raw data. The eye shows a
partial independence of general size that is re
flected in its correlation with measures of the first
group (not in the form of its linear regression) .
The majority of correlation coefficients lower
than 0.9 are between measures of eye width and
variables linked with the first axis.
The third axis encompasses the length (but not
the widths) of the first mesosomal segment ( the
third length, measure 22, could just as well group
with this axis as with the first; its projections
are nearly equal) . The width measures for this
segment are all firmly allied with the first (gene
ral) group. This separation is very revealing: since
the width of the first segment is "moulded" as
a continuous connection with the prosoma (Fig.
86 H. E. Andrews, ]. C. Brower, S. ]. Gould, and R. A. Reyment
0.68 @
o. 67 r-
[ @ � @
@
O. 66 r-N
@ @ @) @!l �
a:: o 1-u et
� @� @ 21 [j]
lJ._ o. 65 r- @ �
� 9 � rn�
[j]] � [Q!J
o. 63 r- � æ) @] �!!il
� �
o. 62 r��------�------�------,-1----,-l ----,-l----,l-----,-
0.62 0.63 0.64 0.65 0.65 0.66 0.67 0.68 FACTOR 1
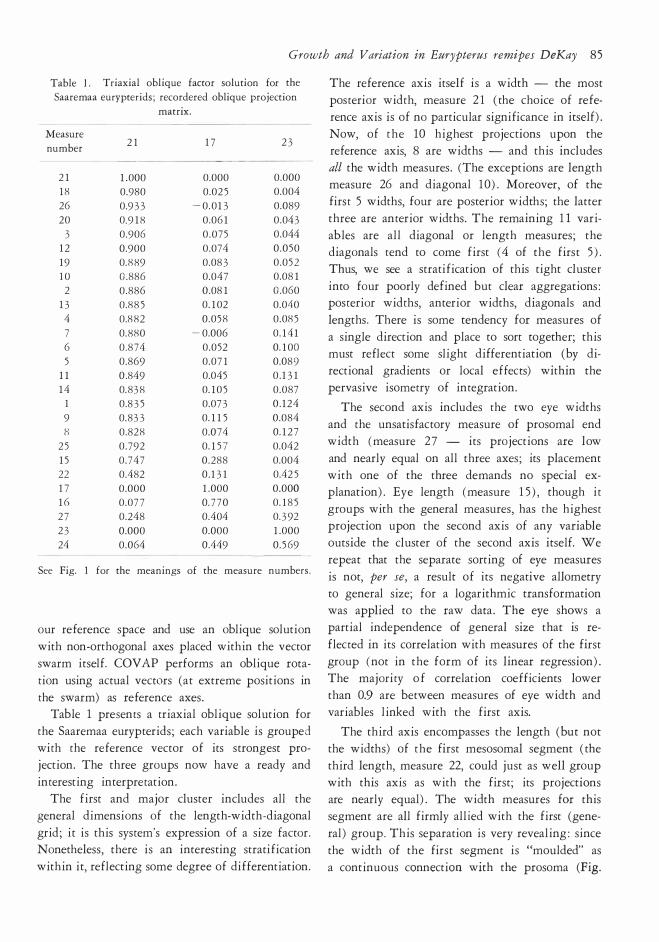
Fig. 2. Plot of all spec imens o f Eurypterus remipes sure l greater than 20 mm; c irc les repr esent spec imens
tetragonophthalmus Fisc he r against t he first two van - with measure l less than 20 mm.
max axes. The squares represent spec imens with mea-
1) , its contra! evidently Iies with the general factor determining prosomal size. But its lengths are
potentially independent of this contra!, since
posterior extension (or curtailment) of the seg
ment does not disrupt the continuity of its lateral
margins with the prosoma.
Thus, each of the three axes has an interesting
biological interpretation: general prosomal size
(with directional gradients and local effects within
it) , eye size, and mesosomal lengths (but not widths) .
The Q-mode analysis i s of less interest, but it
does display o ne significant point. COV AP nor-
malizes all samples (individual specimens m this
case) befare the analysis by dividing each element
by the vector length of its sample. This has the
effect of scaling all specimens to a common size.
The first eigenvector encompasses an overwhel
ming 99.9 percent of all information: the speci
mens are morphometrically very similar to one
another indeed!
Fig. 2 shows a plot of all specimens against
the first two varimax axes. There is a clear separa
tion by size into groups for small and large speci
mens. This would be of no particular interest if
size had remained as an explicit variable in the
Growth and V ariation in Eurypterus remipes DeKay 87
analysis. Bur normalization has removed size per
se. lf the plots still show separation by size, this
must reflect the differences in shape rhat correlate
to it. Despite the overwhelming similarity of
shape among all samples, we can still detect a
small allometric componenr (due primarily to the
negative allometry of eye size) .
Both R and Q analyses Iead u s to the same
conclusion. The integrarion of variables is ex
ceedingly srrong; it dwarfs that of any comparable
ser (of measures and ontogenetic range in size)
known to us either from aur own experiences or
from the literature. We do not doubt that it reflects a general principle of arthropod growth.
Nonetheless, multivariare methods can still detect
small bur clearly significanr (statistically and bio
logically) distinctions wirhin rhis pervasive system
of integrarion. In the R made, eye size and first
segment Iengths gain separate expression, while
the general duster srrarifies by directional gra
dients and local influences. In the Q made, allo
metric consequences of increasing size separate
large and small specimens by their shape.
ANALYSIS OF EURYPTERUS REMIPES
REMI PES
by
James C. Brower and Richard A. Reyment
P ALAE OE COLOGY
Speculation on the palaeoecology of eurypterids
has been rife. Kjellesvig-Waering (1958) con
cluded thar eurypterids of the genus Eurypterus
preferred calcareous muds, high in magnesium,
and he referred to these sediments as waterlimes.
This terminology and inrerpretation derives from
views on the chemistry of the Fiddlers Green
member of the Bertie Formation, the type horizon
for E. r. remipes.
Previous work on the palaeoecology of eurypte
rids is vast, confusing, and aften conflicting; we
have no intention of reviewing the Iirerature.
Good summaries are available in Caster and Kjel
Iesvig-Waering (1964) , Kjellesvig-Waering (1964) ,
Brooks ( 1 957 , an annotated bibliography), StØr
mer (1934, pp. 58-69) , and Clarke and Ruede-
mann (1912, pp. 71-113) . These discussions 111-
dicate that euryprerids occur in sediments of nor
mal marine salinity that were deposited at various
depths, and in brackish and hypersaline environ
ments near, and perhaps in, the intertidal zone.
Same euryprerids may have lived in fresh-warer
environments although we are not convinced by
the river hypothesis of O'Connell (1916).
Our specimens come from the Fiddlers Green
Member of the Upper Silurian Bertie Formation
from the well-known Passage Gulf occurrence on Spohn Road, in Passage Gulf, 0.3 miles south of
the junction wirh Brewer Road, about l.S miles
southeasr of Elizabethtown, Millers Mills 7 1/2'
Quadrangle, New York (see Rickard, 1962, 1969
for reviews of the srratigraphy) . Depositional en
vironments of the sequence are summarized by
Treesh (1972) and Leurze (1964).
Eurypterids are numerous in several thin beds
in the uppermost metre of the Fiddlers Green
member. A prominent mud-cracked zone occurs
above the euryprerid beds. The Fiddlers Green
is a thinly laminated, at least partly clastic, high
magnesium rock. The associated materials include
detrital quartz, clay minerals, and organic matter.
The organic matter is concentrated in certain beds
which could represenr algal mars. The grain frac
tion of typical Fiddlers Green sediment contains
silt-sized quartz, dolomite, calcite and, or, high
magnesium calcire. The matrix consists of a mix
ture of clay minerals, organic matter, calcite, high
magnesium calcite and perhaps dolomite. The
most common sedimentary structures are fine !ami
nations, mudcracks, and crossbedding, Graded
bedding, scour-and-fill structures, and current
ripples are also present. The fine laminarion de
monstrates that most sediment has not been re
worked by burrowing organisms. A few extensively
burrowed beds are known, bur eurypterids are not
found in them. The fauna associated with Euryp
terus remipes remipes includes the eurypterids
Acutiramus macrophthalmus (Hall) , Pterygotus
juvenis Clarke & Ruedemann, and Dolichopterus
herkimerensis Caster & Kjellesvig-Waering, scor
pions, leperditid ostracodes, T etrameroceras accola
(Ruedemann), "Gomphoceras" ruedemanni Feer
ste, a species of gastropod, a phyllocarid, plants,
88 H. E. Andrews, ]. C. Brower, S. ]. Gould, and R. A. Reyment
and several burrows, tracks and trails constructed
by unknown organisms and fragments of black
material. Although these have not been analyzed,
they appear to be carbonaceous and might be remains of algal mats.
The fact that the eurypterids are restricted
almost entirely to the upper part of the member
suggests that the rock at this leve! could reflect,
in its chemical composition, favourable ecological
conditions for them. The chemical variability of
the sediment at the Passage Gulf exposure was
therefore studied. Seventeen samples were taken
at half-metre intervals beginning at the contact
between the Bertie Formation and the underlying
Camillus Formation. The samples were analysed
by atomic absorption spectrophotometry by Mauri
ce Cucci and John Douglas. Taking the standard
precautions against interference, they determined
nickel, manganese, iron, copper, sodium and zinc
on a Perkin-Elmer Model 403 atomic absorption
spectrophotometer and magnesium and calcium
on a Phillips Unicam SP-90.
The elements, with the exception of iron, show
little variation . Most of the elements are present
in very small amounts, particularly copper. The
strata rich in eurypterids at the top of the section
(about l m from the top) do not show any
remarkable differences from the other strata of
the sequence. The topmost bed of the section has
a calcium to magnesium ratio very different from
all the other samples, probably due to its partial
absorption into the soil profile. The occurrence
of eurypterids is not correlated with any of the elements considered in this investigation.
The Fiddlers Green member consists on the
average of 23 % calcium (range 20.4 %-30.9%)
and 8.2 % magnesium (0.69 %-10.6 %) . If
the anomalous topmost sample is excluded, the
ranges are, for calcium, 20.4 %-24.8 %, and for
magnesium 7.0 %-1 0.6 %. The rock is hardly
a pure dolomite but rather a magnesium-rich ar
gillaceous limestone. Other values are: copper
(0 .0456 %-0.0069 %) , iron (0.39 %-0. 1 3 %),
sodium (0.028 %-0.02 1 %) , manganese (0.022%
-0.0'13 %) , and zinc (0.0037 %-0.0016 %) .
The habitats ranged from shallow water subtidal
lagoonal to supertidal flats (denoted by the mud-
cracks) . Eurypterids lived in the subtidal areas
where mudcracks are lacking. The environment
probably tended to be hypersaline, as indicated
by several factors such as the lack of normal marine
organisms (all groups found could have tolerated
hypersalinity which is consistent with the low
fauna! diversity); the association of the unit with
known evaporites - certainly the gypsum and per
haps the dolomite. The lagoons seem to have
been similar to those associated with the sebkhas
of the Persian Gulf (Friedman and Sanders, 1967,
pp. 284-286; Sugden, 1963 ; Illing, Wells and
Taylor, 1965) .
The dolomite is primary, penecontemporaneous,
or both. This is indicated by several lines of evi
dence. The grain fraction commonly bears rounded
sand and silt-sized quartz. Sedimentary structures,
such as crossbedding, indicate that these grains
were transported. The origin of such grains must
predate their deposition. It is possible they were
transported by wind into the lagoons. Dolomite of
other beds exhibits most!y euhedral dolomite
rhombs; abraded grains are lacking. Virtually all
the dolomites are finely laminated. This indicate>
that the material was either originally deposited
as aragonite, or perhaps high magnesium calcite,
and dolomitized soon after deposition (for ex
ample, see Skinner, 1963 ; von der Borch, 1965;
Illing, Wells and Taylor, 1965) .
In summary, we believe that the Fiddlers Green
is a primary or penecontemporaneous do.Jomite,
which formed in environments ranging from the
supertidal to the shallow subtidal zone. Quiet
water conditions prevailed in the subtidal lagoons
inhabited by the eurypterids, as witnessed by the
fine-grained clastic sediment with a silt-sized
grain fraction and a clay-sized matrix. The waters
were probably somewhat hypersaline.
It is possible that the occurrences represent
mass deaths of eurypterids living near the shore.
The fact that the assemblages consist of moul
ted carapaces, adults, and individuals of all growth
stages, showing appendages, argues for this m
terpretation. This could be analogous to the
mass mortality of crustaceans in the modern in
tertidal environment as a result of sudden, heavy
storms. After a sudden storm had struck south-
Growth and Variation in Eurypterus remipes DeKay 89
western Denmark (Ho Bay) on June 13th, 1971,
Reyment observed great numbers of dead, largely
juvenile crabs spread widely just below the high
tide line. R. M. Linsley has drawn our attention
to two specimens in the Colgate collection which
demonstrate the interment of the eurypterids. One
is completely disarticulated, but all the segments
are aligned and all the appendages are preserved,
thus evidencing the absence of post-mortem distur
bances by currents and scavengers . The second
specimen is oriented upside down on the bedding
plane, with its telson penetrating the underlying
sediment. It seems to have been buried while in the act of righting itself.
The eurypterids seem to have been rapidly
buried in a catastrophic fashion, which is indicated
in several ways. The complete preservation of
same entire specimens with all appendages and
their eye integuments intact (see later discussion) which apparently represent dead individuals.
These views conflict with those of Clarke and
Ruedemann (1912, p. 2 5) and StØrmer (1934,
p. 57) . We also point to the lack of any traces
of scavenging activity. Dead Limulus are scavenged
almost immediately by crabs, shrimp, microbes,
and other creatures.
Same of the eurypterids are obviously moults.
These include the loose prosomas, aften with the
first abdominal segment attached, the loose seg
ments, isolated telsons, and pieces of appendages.
Probably the complete or nearly complete speci
mens with damaged eyes are also moults.
Inferred made of life
Turning to the living habits of Eurypterus remt
pes remipes, we follow the ideas of Clarke and
Ruedemann (1912, pp . 71-85) and StØrmer
(1934, pp. 58-67) in general outline. The pre
sence of well developed walking legs shows that
the animals spent same of their lives crawling
along and digging in the bortom ; this is dso
consistent with the general body shape, size and
position of the eyes, and the Limu!us-like telson.
The paddle appendages may have served in both
grubbing and swimming, as do similar legs in the crabs, Platyonichus ocellatus and Callinectes hasta
tus (Clarke and Ruedemann, 1912, pp. 71, 75 ,
76) . When swimming, the paddle appendages
could have functioned as paddles, as suggested by
Clarke and Ruedemann, or as guide planes, as
proposed by StØnner (1934) (in Norwegian, StØr
mer uses the term svømmefØtter) . Most authors
have assumed that Eurypterus was either predatory,
and ate worms, small arthropods, "soft-shelled"
pelecypods, etc., such as does Limulus, or that
the animals were scavengers. The food could have
been raken from the surface or grubbed from within
the sediment. In the case of E. remipes remipes,
"soft-shelled" pelecypods are lacking in the sedi
ment, but the large leperditid ostracods could
have provided a comparable diet. Tracks, trails,
and burrows testify to the presence of "worms"
and other soft-bodied creatures. Such feeding
habits are consistent with the nature of the leg
bases and the small chelicerae of E. remipes
remipes. E. remipes remipes was a flat-bodied
form. It probably spent much time resting on the
bortom, covered by a thin layer of sediment, like
flounders, skates, and rays of the present day.
STATISTICAL RECOGNITION OF MOU LT STAGES
lntroduction
In arthropods, such as many ostracods, the moult
stages are discrete and these can be easily deter
mined by direct inspection of size-frequency
graphs, bivariate scatterplots, scatterplots of princi
pal component scores, scatterplots of principal
coordinates, etc. Examples of such discrete moult
stages include trilobites: Hunt ( 1967), Ro bison (1967) and Whittington (1957, figs. 20, 21);
ostracods: Reyment (1960, 1963) . Not all arthro
pods moult with such distances between stages
and for these, the moult stages are therefore not
clearly discontinuous. Both the living Limulus and
Eurypterus remipes remipes are cases in point;
although several of the larger moult stages are in
fact discontinuous, the smaller stages tend to inter
grade. In such examples, the selection and identi
fication of moult stages may become subjective.
Any procedure for the selection of moult srages
must be operational and applicable by the average
non-mathematical palaeontologist. Therefore, it
90 H. E. Andrews, ]. C. Brower, S. ]. Gould, and R . A. Reyment
G
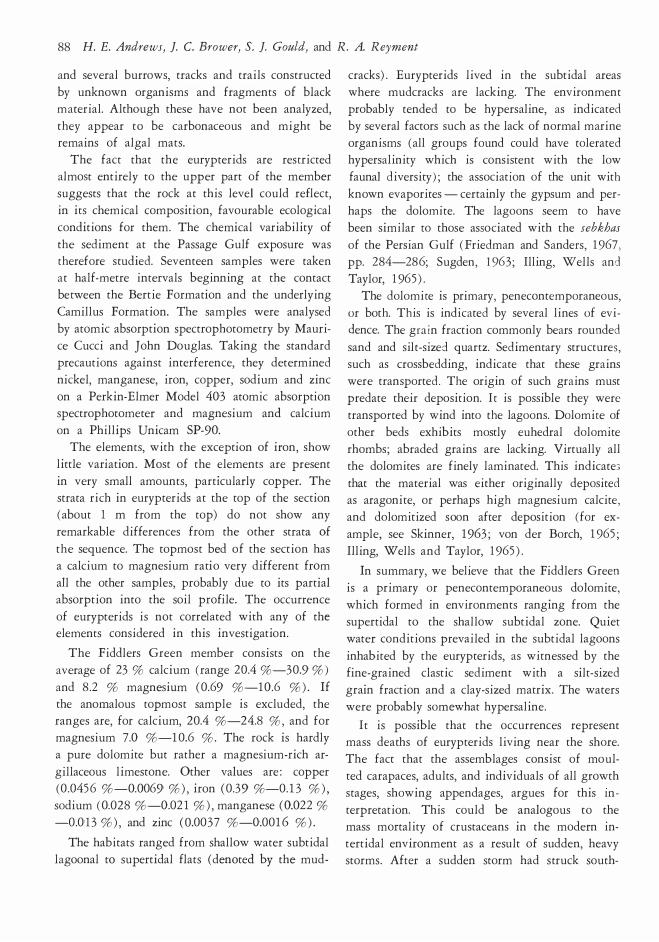
width �l Fig. 3. Variables m easured on the prosom a of Euryp
terus remipes remipes DeKay (above) and Limulus po
lyphemus (below) .
seems that the methodology should begin with simple graphics and be followed by univariate,
bivariate and then multivariate statistics (cf. Rey
ment, 1 97 1 ) .
The following samples were examined in this
study ( see Fig. 3 for measurements) :
l. E . remipes remipes. Colgate collection, 1 2 7
prosomas, measured b y Colgate University stu
dents. 2. Limulus polyphemus. A total of 2 33 spe
eimens; measurements were made, and the pre
liminary moult stages defined, by Kaneshiro
( 1 962 ) . The animals were obtained from North Falmouth, Mass. , USA and from the supply room
at the Marine Biological Laboratory at Wood's
Hole, Cape Cod, Mass., USA. Most of the following discussion is based on
the first sample. We have checked Kaneshiro's
work on Limulus polyphemus and Eurypterus re
mipes remipes, same of which is included for
comparative purposes.
Most of the eurypterids are preserved with the dorsal side uppermost, which means that few
specimens could be sexed. The measurements were
thus made on the dorsal side and these have
been pooled into a s ingle group comprising im
mature individuals and adult males and females .
Inspection of the univariate and bivariate plots
of all variables failed to disclose significant sec
ondary sexual dimorphism in these dimensions.
Moult stages recognized on single variables
In the first phase, moult stages were selected by
trial and error using histograms for prosomal length in Eurypterus and Limulus in connexion with
which, we attempted to maximize the between
groups variances in relation to the within groups variances. Several frequency graphs were plotted
using various dass widths and end-points. Nu
merous groupings were tried for both Eurypterus
and Limulus. Such a method was necessary because
the moult stages, with a few exceptions, do not fall into discrete groups. The moult stages finally
inferred with respect to length are shown in Figures 4a and 4c; these are mutually exclusive
and there is no overlap. The pertinent statistics
for Eurypterus remipes remipes and Limulus
polyphemus are listed in Tables 2, 3, 4, 5 .
The data on L. polyphemus are incomplete. Moult stages I through VII are relatively conti
nuous (Fig. 4c) . The wide gaps between Stages
VII, "VIII", and "IX" suggest that there are
several missing stages, not represented in the
data.
Student's t tests were performed between adjacent moult stages for both the limulid and eurypterid data. In all cases, these are significantly
different. Most of the probabilities of larger values
of t are less than 0.00 1 , which indicates that the null hypothesis may be rejected with a very
minimal risk of O.l %. In the second phase, we examined the moulr
stages inferred above with respect to the univariate
distriburion of prosomal width for Limulus and
Growth and Variation tn Eurypterus remipes DeKay 91
40
30
JO
20
10
E remipes remipes
Colgale collection
IV 29
@ f'rosomo l�ngth (mm)
E remipes rem1pes Colgole collectlon
IV 29
@ Post�rior widlh of ptosomo (mm) 10
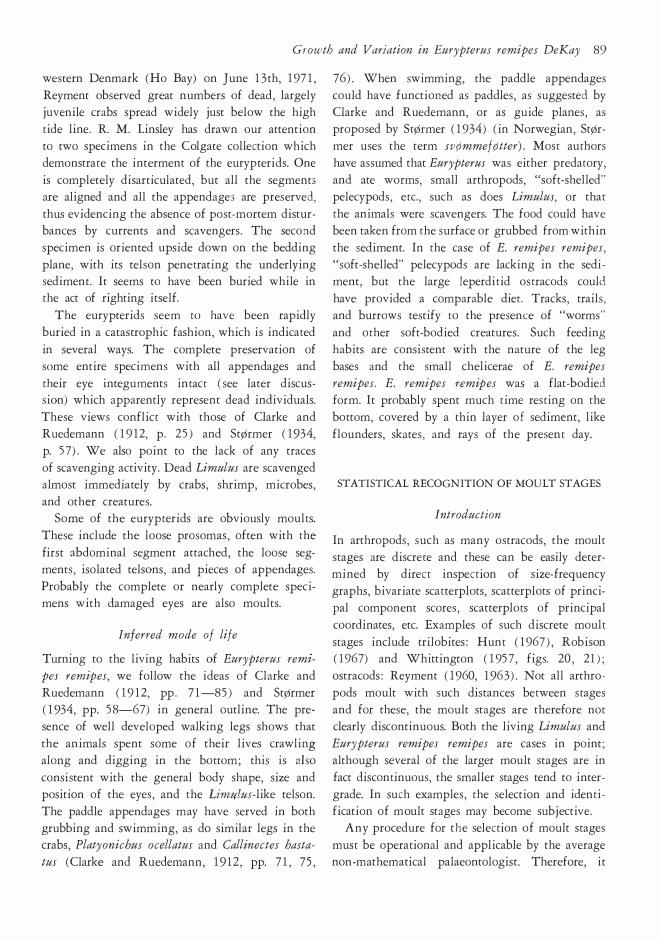
Fig. 4. Size fr equency gr aphs for E. r. remipes and Li
mulus polyphemus. The endpoints for the m oult stages
ar e the m aximum an d m in im um values for that m oult
stage. The dashed ver tical line is Iocated at the m ean
of the m oult stage and the height of the peak denotes
posterior width of the prosoma in Eurypterus
(Figs. 4b, d) . The moult stages now begin to over
lap, as indicated by the stippled parts of the fig
ures. For the eurypterids, 14 out of 127 specimens
overlap to the ex tent of 11.0 %. The same Limu
lus values include 2 5 out of 2 3 3 specimens and
an overlap of 10.7 %. In general, one would
expect the degree of this overlap to be inversely
proportional to the correlation coefficient between
the two variables. The amount of overlap should
decrease as the correlation increa�es . For E. remi
pes remipes, the correlation coefficient for prosa
mal length versus posterior width of the prosoma
is 0.987 and we see 11 % overlap in the width of the prosoma for the moult stages defined
relative to the length of the prosoma. This idea
80 10 ••
�50 � "' I� 20
lO
80 10
;:-;60 � 50 �40 � 30
20 10
16 Ill ••
16
VI "
L i mulus polyphemus Folmouth, Cape Cod
Prosomo length (mm)
Limulus polyphemus Falmoulh, C ape Cod
o w � � �� � ,.w��um����m•m•mm=M Prosoma width (�,�m)
d th e num ber of specim ens in th at stage. Rom an num er als
stand for the num ber of the m oult stage, Ar abic nu
m er als show the num ber of spec im ens in the m oult
s tage. Over lapping ar eas ar e stippled.
i s discussed further in the subsequenr section on discriminant analysis of two or more variables.
As for the prosomal length, t tests were per
formed on the prosomal widths for the adjacent
moult stages. The t values, though highly signi
ficant, are slightly lower than those calculated for
equiva!ent moult stages based on prosomal length; this ref!ects the amount of overlap for the prosa
mal widths, whereas moult stages are mutually exclusive for prosomal length . The probabilities
of higher t values are still mostly less than 0.001
for the prosomal widths.
Comparison of frequency distributions for Limulus and Eurypterus. The frequency graphs for lim
ulids are right-skewed; young specimens predo-

92 H. E. Andrews, ]. C. Brower, S. ]. Goulcl, and R. A. Reyment
Table 2. Basic statistics for the m oult stages of Euryp- Table 4. Ba sic statistics for the m oult stages of Limulus
terus remipes remipes, DeKay (Colgate collection) . polyphemus. Data m odified fr om Kaneshir o ( 1 962 ) .
Stag c
I l
I l l
IV
V
VI VII
VIII
IX
Il
I I I
IV
V VI
VII
VIII
IX
Me asur emen ts in mm .
Me an �- Std. dev. ! Num ber of
spe cim ens
Len gth of prosom a
7 .2 9 .2
1 2 . 7
1 6 . 7
20 . 7
2 5 .3
31 . 1
4Ul
50 . 5
0 .07
0 .73
0 . 7 5 1 . 1 8
0.80
1 . 1 0
1 .6 5
1 . 84
2.33
2
1 7
13
29
22
14
23
5
2
Posr er ior width o f pro soma
9 .4 1 1 . 6
1 6 .8
2 1 .6
26 .9 32 9
40.8
54 .8
60.6
0 . 7 1
1 .45
1 . 1 0
2 .00 1 .68
1 .83
3.47
2 . 29
1. 70
2
1 7
1 3 2 9
2 2
14
23
5 2
Var iable
Pr osom al length
Pr osom al w idth
St age Mean
Num
ber of Std. dc v.
speci-
8 .9mm Il 14 .6 mm 1 . 1 4 mm Ill 1 8 .9 mm 0.82 mm IV 26.5 mm 1 . 7 6 mm
V 36.0 mm 2 .30 mm
VI 44.8 mm 1 . 79 mm VII 53.8mm 2 . 1 9mm
" VI II" 1 20.3 mm 1 1 .30 mm
" IX" 1 89 . 1 mm 1 1 .20 mm
1 2 .0 mm
men s
l 76
50 6
30
45
7
1 1
7
I l
Il l
IV
1 9 .3 mm 1 .69 mm 76
24 .5 mm 1 . 1 8 mm 50
33.6 mm 2 .47 mm 6
V 44.3 mm 3.31 mm 30 VI 54 .3 mm 3.45 mm 45 VII 68.3 mm 6.31 mm 7
" VIII" 147 .0mm 13. 1 0mm 1. 1
" IX" 225 . 0 mm 9 .30 mm 7
Table 3. Euryptertts remipes remipes: com parison of obser ved m oult stage m eans wir h predicted values, a ssum ing that the animals m oulted each tim e the volume was doubled.
Var iable
Pr osom a length
Stage I l
I l l
J V
V
VI
VII
VIII
Poster ior w idth of pr osom a
Stage Il
Ill
IV
V VI
VII
VIII
Moulr
stage
mean
9 .2mm
1 2 . 7 mm
16 . 7 mm
20 . 7 mm
2 5 .3 mm
3 1 . 1 mm
4 1 .8 mm
1 1 .6 mm
1 6 .8 mm
i 2 1 .6 mm
26 .9 mm
32 .9 m m
40.8 mm
54 .8 mm
l Pr edicted va- 1 Moult l ue, i.e., �ean l
Student' s Degrees Prababilir y of t va lue
stage of pr evwu s of w ir h gr eater m agnitude std. dev. m oult stage frec dom
X 1 . 26 --�----
0 .73 mm 9 .0mm 0.22 1 6 abo ve 0 . 50
0 . 7 5 mm 1 1 .6 mm 1 .45 12 betw een 0 .20 and 0 . 1 0
1 . 18 mm 1 6 .0 mm 0.62 2H above 0. 5 0 0 .80mm 21. 1mm -0.47 2 1 above 0. 50 1 . 1 0 mm 26 . 1 mm - 0.73 13 betw een 0 . 50 and 0.40 1 .65 mm 3 1 .8 mm - 0.45 22 above 0 . 50 1 . 84 mm 39.2 mm 1 .30 4 betw een 0.40 and 0 .20
1 .45 mm 1 1 .8 mm - 0. 1 2 1 6 above 0 . 5 0 1 . 1 0 mm 14 . 7 mm 1 . 8 5 1 2 between O.l O and 0 .05 2 .00mm j 2 1 .2 mm 0 .20 28 above 0 . 50 1 .68 mm 1 27 . 2 mm - 0. 1 6 2 1 above 0. 50
l 33.9 mm - 0. 5 1 1 3 above 0 . 50 1 .83 mm l 3.47 mm 4 1 . 5 mm - 0.2 1 22 above 0. 5 0 2 . 29 mm 5 1 .3 mm 1 .37 4 betw een 0.40 and 0 .20
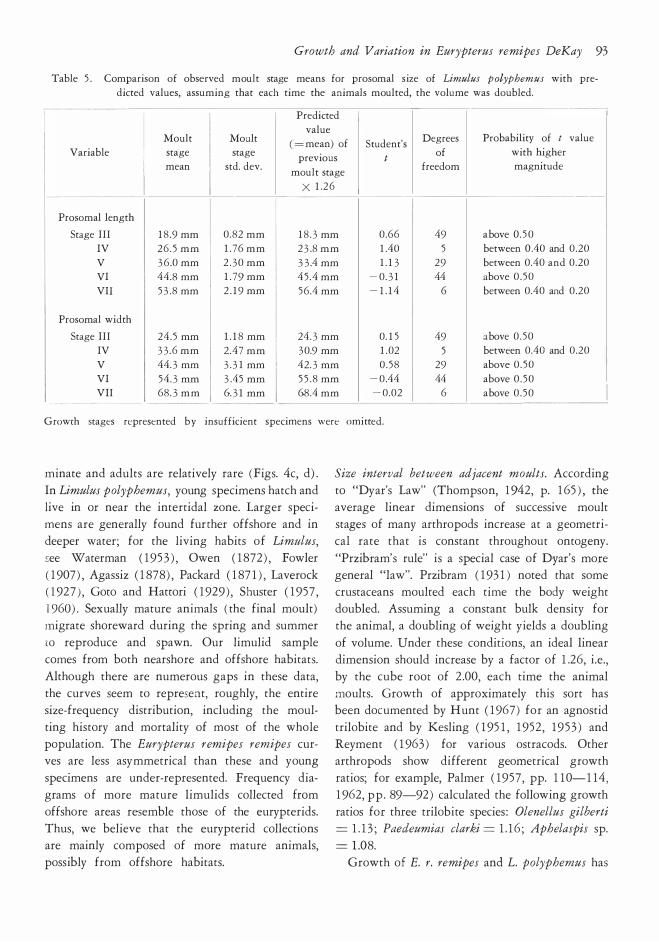
Growth and V ariation in Eurypterus remipes DeKay 93
Table 5 . Com parison of observed m oult stage m eans for prosom al s ize of Limulus p olyphemus with pre
dicted values, assum ing that each tim e the anim als m oulted, the volum e was doubled.
1 - Predicted l value
Variable
Moult
stage
m ean
Moult
stage
std. dev.
=m ean) of Srudenr's Degrees
of
p robability of t value
with higher m agnitude
previous t freedom
m oult stage
X 1 .2 6 l -
Prosom al length
Stage Ill 1 8 .9 mm 0.82 mm 1 8 .3 mm 0.66 49 a bove 0. 5 0
IV 26 . 5 mm 1 . 76 mm 23.8 mm 1 .40 5 b etween 0.40 and 0 .20
etween 0.40 and 0 .20
bove 0 . 50 V 36.0 mm 2 .30 mm 33.4 mm 1 . 1 3 l 29 b
VI 44.S mm 1 . 79 mm 45 .4 mm - 0.31 l 44 a VII 53.8 mm 2 . 1 9 mm 56.4 mm - 1 . 1 4 6 b etween 0.40 and 0 .20
Prosom al width
Stage Ill 24 . 5 mm 1 . 1 8mm 24.3 mm 0. 1 5 49 a bove 0 . 50
IV 33.6 mm 2 .47 mm 30.9 mm 1 .02 5 b etween 0.40 and 0 .20
bove 0 . 50 V 44.3 mm 3.31 mm 42.3 mm 0 . 58 29 a
VI 54 .3 mm 3.45 mm 5 5 . 8 mm - 0.44 l 44 a bove 0 . 50 VII 68 .3 mm 6.31 mm 68.4 mm - 0.02 6 a bove 0 . 50
Growth stages represented by insufficient specimens were omitted.
minate and adults are relatively rare (Figs. 4c, d) .
In Limulus polyphemus, young specimens hatch and live in or near the intertidal zone. Larger speci
mens are generally found furrher offshore and in
deeper water; for the Jiving habits of Limttlus,
see Waterman ( 195 3 ) , Owen ( 1 872 ) , Fowler
( 1 907) , Agassiz ( 1 878) , Packard ( 1 87 1 ) , Laverock ( 1 92 7 ) , Goto and Hattori ( 1929) , Shuster ( 1957 ,
1 960) . Sexually mattue animals ( the final moult) migrate shoreward during the spring and summer
to reproduce and spawn. Our limulid sample
comes from both nearshore and offshore habitats.
Although there are numerous gaps in these data,
the curves seem to represent, roughly, the entire
size-frequency distribution, including the moul
ting history and morrality of most of the whole
population. The Eurypterus remipes remipes curves are less asymmetrical than these and young
specimens are under-represented. Frequency dia
grams of more mature limulids collected from
offshore areas resemble those of the eurypterids.
Thus, we believe that the eurypterid collections are mainly composed of more mature animals,
possibly from offshore habitats.
Size interval between adjacent moults. According to "Dyar's Law" (Thompson, 1 942, p. 1 65 ) , the
average linear dimensions of successive moult
stages of many arthropods increase at a geometri
ca! rate that is constant throughout ontogeny.
"Przibram's rule" is a special case of Dyar's more general "law". Przibram ( 1 93 1 ) noted that same crustaceans moulted each time the body weight doubled. Assuming a constant bulk density for
the animal, a doubling of weight yields a doubling
of volume. Under these conditions, an ideal linear dimension should increase by a factor of 1 .26, i .e. , by the cube rom of 2 .00, each time the animal
moults. Growth of approximately this sort has been documented by Hunt ( 1 967) for an agnostid
trilobite and by Kesling ( 1 95 1 , 1 952 , 1 9 5 3 ) and
Reyment ( 1 963) for various ostracods. Other
arthropods show different geometrical growth
ratios; for example, Palmer ( 1957 , pp. 1 10-1 14 ,
1 962, pp . 89-92) calculated the following growth
ratios for three trilobite species: Olenellus gilberti
= 1 . 1 3 ; Paedeumias clarki = 1 . 1 6 ; Aphelaspis sp.
= 1 .08.
Growth of E. r. remipes and L. polyphemus has
94 H. E. Andrews, ]. C. Brower, S. ]. Gould, and R . A. Reyment
E E
o
60
50
40
� 20 o li:_
· · ti ' '
E. r e m i pes r e m i pes
C o l g e t e c o l l ec t i o n
.<>
.9"· ·
. . ·o· · · · · ·
.o
0 o��--�II--7.1I�I --!IV�-L--�V�I --V�I I---VLII_I �IX
70
60 E E � 50 o V\ e a_ .. 4 0
L
o :!: 30 "O
·� o 20 � V\ o a_ 1 0
@> o
o
M o u l t s t a g e n u m b er
a
E. r e m i p e s re m i p e s
C o l g a t e c o l l e c t i o n
Il I l l IV V VI VI l Vlll IX M o u l t s t e g e n u m b e r
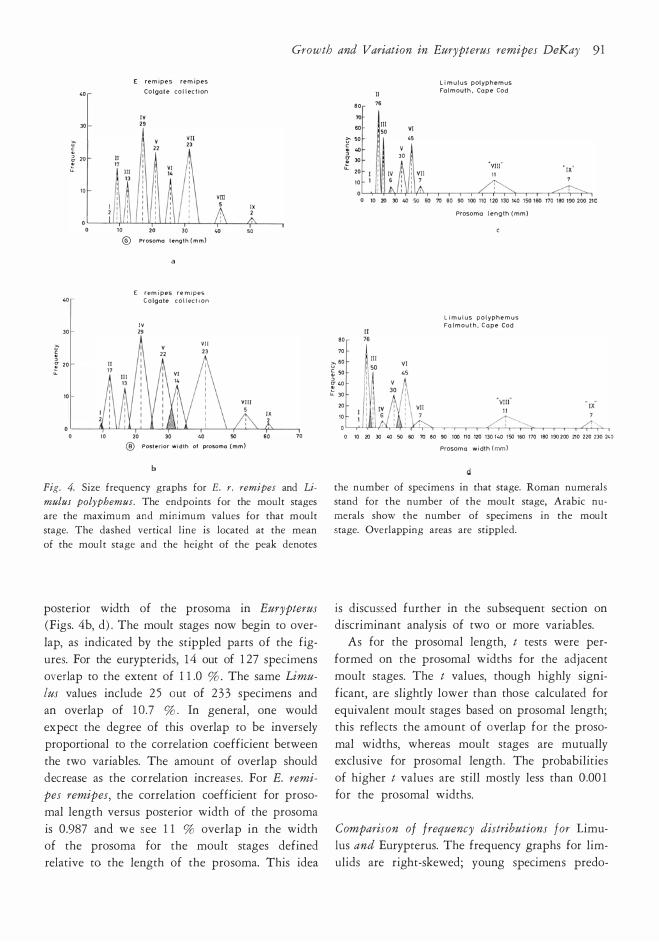
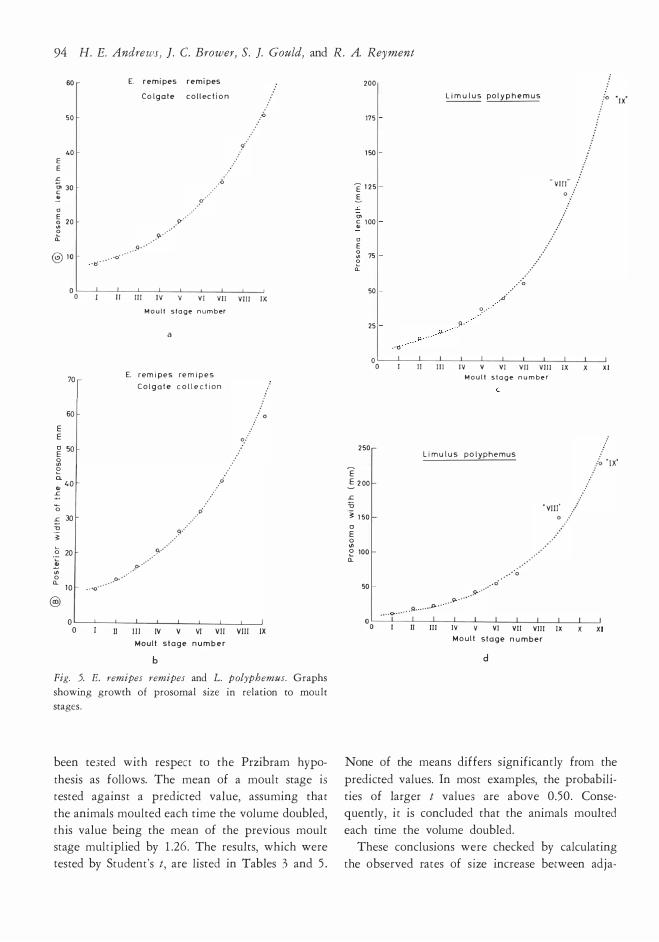
b Fig. 5. E. remipes remipes and L. polyphemus. Graphs
showing growth of prosom al size in relation to m oult
stages .
been te3tecl with respect to the Przibram hypo
thesis as follows. The mean of a moult stage is tested against a preclictecl value, assuming that
the animals moulted each time the volume doublecl, this value being the mean of the previous moult stage multiplied by 1 .26 . The results, which were tested by Student's t, are listecl in Tables 3 and 5 .
200
175
1 50
'E 1 2 5 .s "' c 1 00 �
o E � 75 o li:_
50
25
L i m u l u s p o l y p h e m u s
. . • · · ·'o
"'
�-··
� ·
· ·Ø 0o��--���--�I I�I--�IV�-L--�V�I --V�I�I �VLI I�I �IX __ -L __ �X I
2 50
E � 2 00
L "O � 1 50 o E o V\ o 100 å:.
50
M o u l l s l a g e n u m b e r
L i m u l u s p o l y p h e m u s
. . · ·o
. . o·
.,..
. . �· · · · ø. · · · · · ·Q. · · ·
Il Ill IV VI VI I VI I I IX M o u l t s t e g e n u m b e r
d
None of the means differs significantly from the
preclictecl values. In most examples, the probabili
ties of larger t values are above 0 .50 . Consequently, it is concludecl that the animals moultecl
each time the volume doublecl. These conclusions were checkecl by calculating
the observed rates of s ize increase between aclja-
Growth and V ariation in Eurypterus remipes DeKay 95
Table 6. Regression statistics for the growth of instars
in Limulus polyphemus and Eurypterus remipes remipes.
Independent variable Dependent Std . esti-
X variable Initial m ate of
( =m oult stage y Slope inter- error for
num ber) (logarithm s) cept slope
E. remipes remipes prosom al length 0. 1 05 0 . 772 0.002 56 E . remipes remipes prosom al width 0 . 1 04 0 .89 1 0 .00362
Limulus polyphemus prosom al length 0 . 1 29 0 .879 0.00424
Limulus polyphemus prosom al width 0 . 1 24 1 .000 0 .00384
cent moult stag es, i.e., (mean of moult stage) /
(mean of previous moult stage) , for Limulus and
E. remipes remipes. These growth indices are for E. remipes remipes, 1 .27 , for Limulus polyphemus,
1 .29. Neither differs significantly from the ideal
value of 1 .26.
Least squares regression analyses were performed
for development of the prosomal size parameters versus the moult stage numbers. The prosomal
size measures were represenred by average values
for particular moult stages. The graphs are illustrated in Fig. 5 ; the regression details are listed in
Table 6. In all cases, prosomal lengths and widths
grew geometrically with respect to moult stages; as previously noted, the rate of increase of prosa
mal size does not differ significantly from a factor
of 1 .26 times the prosomal size of the previous
moult. The analysis of variance of regression shows that the best fit equations are of the form ( see
data in Table 6) log Y = a + bX, where Y =
the prosomal size parameter, X = moult stage
number; a = log Y when X = O, i .e. the initial
intercept, and b = slope on semi-logarithmic plot. The curvilinear relationship between the two
variables implies that growth rates of the prosomal
size measures increased throughout ontogeny with respect to moult stages.
For Limulus polyphemus, the situation is more complex. As previously menrioned, there are seve
ral missing moult stages between VII and "VIII"
and "IX". Consequently, equations were fitted to
the complete data sets for moult stages I through VII. These were then used to predict the "best"
moult stages for the observed Stages "VIII" and
"IX"; the "best fit stages" are IX and XI, re-
spectively. Following this, curves were fitted to
observed Stages I thraugh VII and the predicted
Stages IX and XI.
Numerous observations indicate that Limultt.r
polyphemus does not attain sexual maturity unril
the last moulr. The smallest eurypterid with genital
appendages that we have seen is a female from
Stage V in the Syracuse callection, which suggests
that E. remipes remipes became sexually mature
lang befare the J iving Limulus. In sexing aur
eurypterids, we have used the criteria summarized
by Kjellesvig-Waering ( 1 958 ) and StØnner and
Kjellesvig-Waering ( 1 969) .
Moult stages recognized on multivariate data
The mault stages were initially base:.! on the length of the prosoma (G) ; these moult stages
are mutually exclusive and there is no overlap between adjacent stages. When examined with respect to the width of the prosoma (Limulus) , or
posterior width of the prosoma (B) (Eurypterus) ,
the adjacent mault stages overlap to the extent
of about 1 1 % of the total number of individuals. W e may also investigate the num ber of mis
idenrifications ( "misclassifications" of same statis
ticians) with respect to the joinr distribution of two or more variables. This was done with the
BMD 07M computer program for generalized and
stepwise discriminant analysis (Dixon, 1 970, pp.
2 14a-2 14t) for the Colgate collectian.
The variables are entered into the discriminant analysis in stepwise order. The first variable maximizes the between-groups variance with re
spect to the paoled within-groups variance in the
form of a one way analysis of variance. The
second variable entered is the one that maximize3
the between-group differences, acting in conjunc
tion with the first variable. The process continues until all variables that make a significant conrri
bution to between-group differences have been enrered. The F-ratio is ca]culated for the differen
ces between all the groups. An F-ratio array with
constant degrees of freedom reflecting the "distances" between groups is constructed for all passibJe
pairs of groups. Two group discriminant functions are calculated for all groups. For example, the
first group is tested against all other groups
96 H. E. Andrews, ]. C. Brower, S. ]. Gould, and R . A . Reyment
VA R I A BLE B
69 . 75 -
6 5 . 2 5 -
6 0 . 7 5 -
56 . 25 -
51 . 75 �
4 7 . 25 �
42 . 75 1-
3 8 . 2 5 1-
33 . 75 �
2 9 . 2 5 r-
24 . 7 5 -
\
\
\ �\,
\ \ 1 1 1 1 1 2 1 1 1 1 1 1
1 1 2 \ 1 1 \ 1 1 \ � \ 1 \ 1 \ \ 1 1
\ 1 1 1 � 1 1 \ 1 \ � 1 2\2::: 2 \ \
1 � \ 1 1 1 \
\ \
\ \ \
\ \ \ \
\ \
\ \
\ \
\ \
20 . 25 -\ \ 1 1 1 � : 2: \ � \ \ 23 1 32 \ \ 1 2 \1 1 1 2 1 \ 1 5 .7 5 - � \ 2 2 1 1 \ \ 4 : 1 \1
1 1 . 25 _, \ 4 1 1 1 \ \ 1 � 1 \ 6 . 75 -
1 \ \
l \ l l l l l 4 . 50 1 4 . 50 24 . 50
V A R I A B L E G 34 . 50 44 . 50 54 . 50
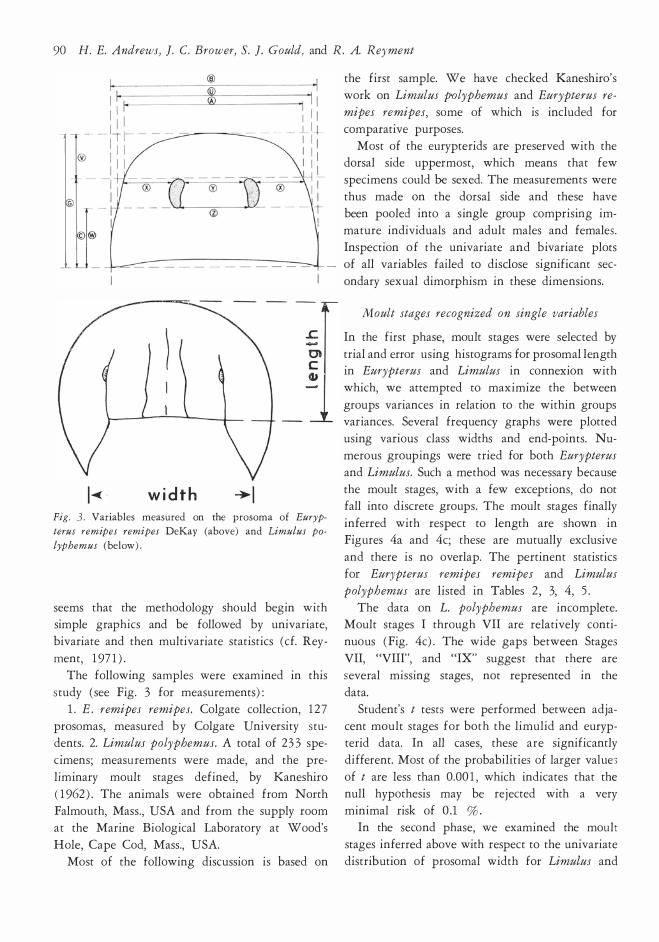
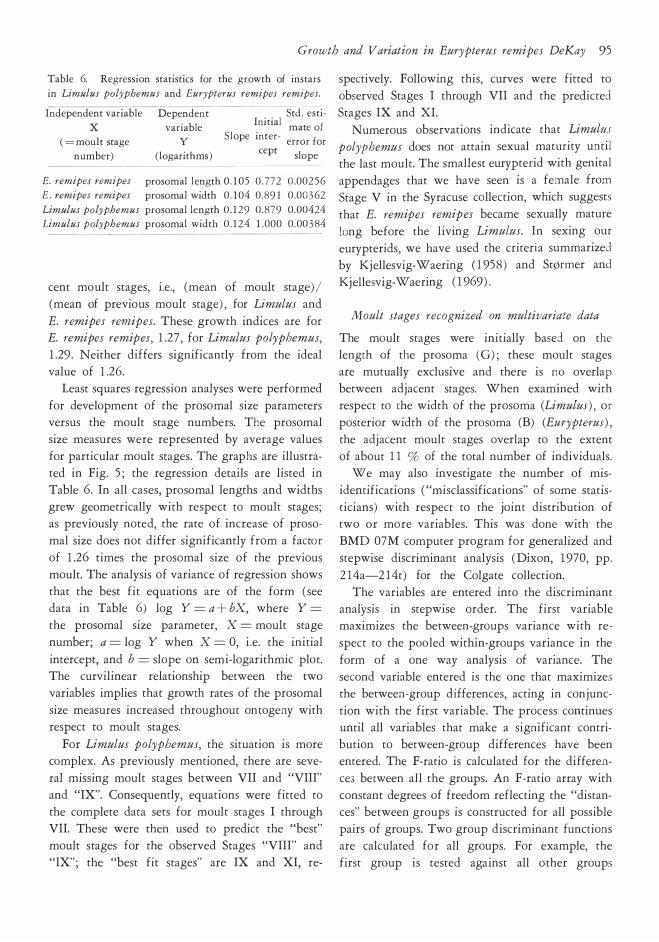
Fig. 6 . Bivariate graph for the variable s B and G of
E. remipes remipes (Colgate colle ctio:-�) show ing the m oult
stage s Sc!bd ivide d by the dashe d l ine s. The Roman nu-
pooled together, then the ,;econd group is similarly
tested and so on. Finally, each individual is placed
in the group with which it has the highest probability of membership. This is summarized in an
identification array showing the group assignments
of all individuals. Lastly, canonical variables are
computed with a plot of the scores for the first
two canonical variables . These illustrate, graphically, the relationships between the various groups
and individuals. In the first stage, two variables, prosomal length
(G) and posterior width of the prosoma (B) ,
were investigated. The groups used were the
moult stages established on prosomal length. A
graph of these two variables is depicted in Fig. 6. The program first entered length, thus indicating
that this variable is associated with most of the
me rals de note m oult stage s, the Arabic nume rals the
num be r of spe cime ns at a particular plotting point .
differences between growth stages ( this was ex
pected as the moult stages were based upon length ) . The posterior width of the prosoma was
also entered, which indicates that this variable
makes some contribution to between-group dif
ferences.
The discriminant functions only misidentified
two specimens. A Stage Il animal with a relatively
narrow prosoma was placed in S tage I and one Stage VII individual was assigned to Stage VI,
that is , two out of 1 2 7 individuals, relative to the
moult stages defined on prosomal length alone.
Inasmuch as there are only two variables, there is only ane canonical variate, which 1s :
y = 0. 1 1 B + 0.73 G.
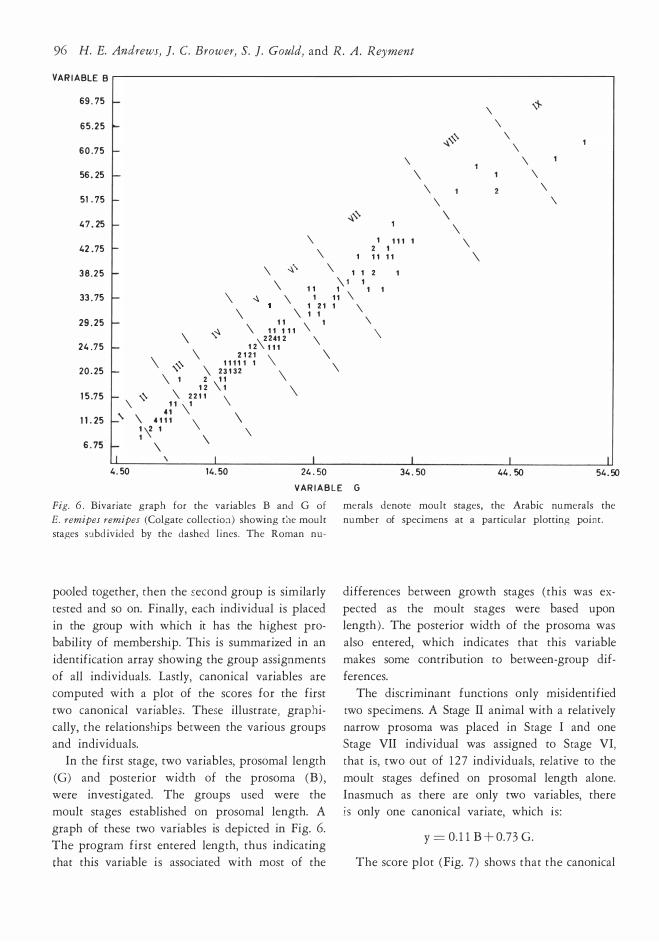
The score plot (Fig. 7 ) shows that the canonical
Growth and V ariation in Eurypterus remipes DeKay 97
-14 - 1 2 - 10 -8 - 6 - 4 - 2 o 2 4 6 8 10 1 2 14 16 18 20 22 24 26 C a n o n i c a l vari a b l e
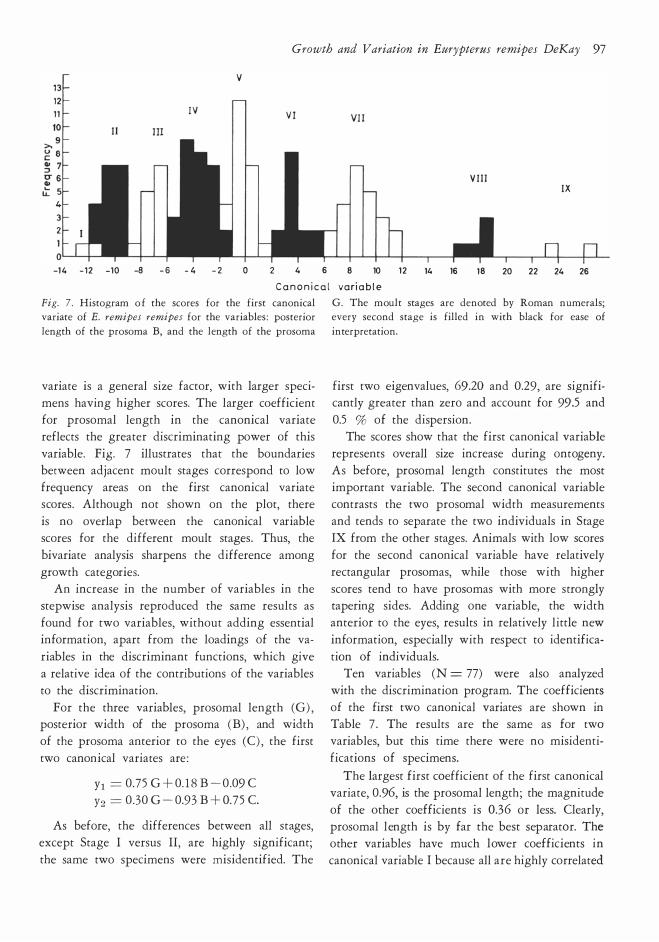
Fig. 7 . Histogram o f the scores for the first canonical variate of E. remipes remipes for the variables : posterior
length of the prosom a B, and the length of the prosom a
variate is a general size factor, with larger speci
mens having higher scores. The larger coefficient
for prosomal length in the canonical variate reflects the greater discriminating power of this
variable. Fig. 7 illustrates that the boundaries between adjacent moult stages correspond to low
frequency areas on the first canonical variate scores . Although not shown on the plot, there
is no overlap between the canonical variable scores for the different moult stages . Thus, the
bivariate analysis sharpens the difference among
growth categories. An increase in the number of variables in the
stepwise analysis reproduced the same results as
found for two variables, without adding essential information, apart from the loadings of the va
riables in the discriminant functions, which give
a relative idea of the contributions of the variables
to the discrimination.
For the three variables, prosomal length (G) , posterior width of the prosoma (B) , and width
of the prosoma anterior to the eyes (C) , the first
two canonical variates are :
y1 = 0.75 G + 0. 1 8 B - 0.09 C
Y2 = 0 .30 G - 0.93 B + 0.75 C.
As before, the differences between all stages, except Stage I versus Il, are highly significant;
the same two specimens were misidentified. The
G. The m oult stages are denoted by Rom an num erals;
every second stage is filled in with black for ease of
interpretation.
first two eigenvalues, 69.20 and 0.29, are significantly greater than zero and account for 99.5 and
0.5 % of the dispersion.
The scores show that the first canonical variable
represents overall size increase during ontogeny.
As before, prosomal length constitutes the most
important variable. The second canonical variable
contrasts the two prosomal width measurements
and tends to separate the two individuals in Stage
IX from the other stages. Animals with low scores
for the second canonical variable have relatively
rectangular prosomas, while those with higher
scores tend to have prosomas with more strongly rapering sides. Adding one variable, the width anterior to the eyes, results in relatively l ittle new
information, especially with respect to identifica
tion of individuals.
Ten variables (N = 77) were also analyzed
with the discrimination program. The coefficients
of the first two canonical variates are shown in Table 7. The results are the same as for two variables, but this time there were no misidenti
fications of specimens.
The !argest first coefficient of the first canonical
variate, 0.96, is the prosomal length; the magnitude
of the other coefficients is 0.36 or less. Clearly,
prosomal length is by far the best separator. The
other variables have much lower coefficients in
canonical variable I because all are highly correlated
98 H. E. Andrews, ]. C. Brower, S. ]. Gould, and R. A. Reyment
Table 7 . Canonical variables for E. remipes remipes
Variable
--- -- -- -A Prosom al width anterior
to the eyes
B Posterior width of the
prosom a
C Length from posterior
margin of prosom a to
anterior of eyes
G Total length of prosom a
U Prosomal width poste-
rior to the eyes
V Length from eyes to an-
terior m argin of prosom a
W Length from posterior
m argin of prosom a to
posterior m argin of eyes
X Distance from eyes to
lateral m argin of pro-
som a
Y Anterior distance be- 1 tween the eyes
Z Posterior distance be
tween the eyes
Percentage of trace
Colgate collection, N = 7 7 .
Canonical
variate
coefficients ----·---
li
l - 0.36 1 - 0.4 1
0. 3 5 ' 0 . 59 i
- o.J 0.05 3 1 0.96 1 - o. n
l 0 . 1 2 - 0. 1 3
- 0. 1 2 - 0.98
0. 1 4 0 .7 1
- 0. 1 3 1 . 3 1
0 .24 - 0. 1 9
- 0.22 1 - 0.44
98 % l 1 .2-%
l
Stepwise
order of
entry into
the discri-m inant
analysis
5
2
4
9
7
8
6
3
1 0
with the prosomal length; the pertinent correla
tion coefficients range from 0.94 to 0.98. Conse
quently, most of the information carried by these
variables is redundant - they could be predicted with reasonable accuracy, solely from length of
the prosoma.
The second canonical variable is a complex
shape factor that separates the two Stage IX ani
mals from the rest. The variables involved are
prosomal widths, A and B, and a whole series of variables that deal with eye size, shape, and posi
tion, V, W, X and Z. These changes in shape
are discussed in detail in subsequent sections on the
regression analysis of the prosoma.
Summary
In both Eurypterus remipes remipes and Limulus
polyphemus, moult stages are not discrete and
their identification is best accomplished by a trial and error procedure. lnitially, we based the
moult stages upon the length of the prosoma.
Nine moult stages were identified for E. remipes
and for Limulus polyphemus.
The moult stages, defined by prosomal length, were then examined with respect to prosomal
width. The adjacent moult stages begin to overlap, and the overlap percentage includes about
1 1 % of all individuals for both Limulus and Eurypterus. The low percentage of overlap partial
ly reflects the high correlation between the two
variables, 0.987 for. E. remipes remipes. In general, overlap of this type should decrease as the corre
lation between the two variables increases, although
same overlap could exist, even with perfect corre
lation. The distributions of the two variables are also important in dictating the amount of overlap.
Student's t-tests between adjacent moult stages
show that they differ significantly with respect to both length and width. Both Limulus poly
phemus and E. remipes remipes moulted each
time the body volume doubled. Growth in size relative to moult number was geometric in both
the limulids and eurypterids . The size-frequency
distributions of E. remipes remipes resemble those of living Limulus polyphemus from offshore
habitats. Palaeoecological analysis also suggests
that the eurypterids l ived in environments below
the intertidal zone.
All prosomal variables of E. remipes remipes are
highly correlated, the correlations ranging from
0.99 to 0.94; therefore, adding new variables to the discriminant analysis produces l ittle new
information about differences between moult
stages. When dealing with highly correlated
variables in arthropods, satisfactory identifications
of growth stages can be made on a s ingle variable indicative of overall size. For 1 2 7 eurypterids, the best multivariate identifications of the moult
stages only improve the identification based on
Growth and V ariation in Eurypterus remipes DeKay 99
c
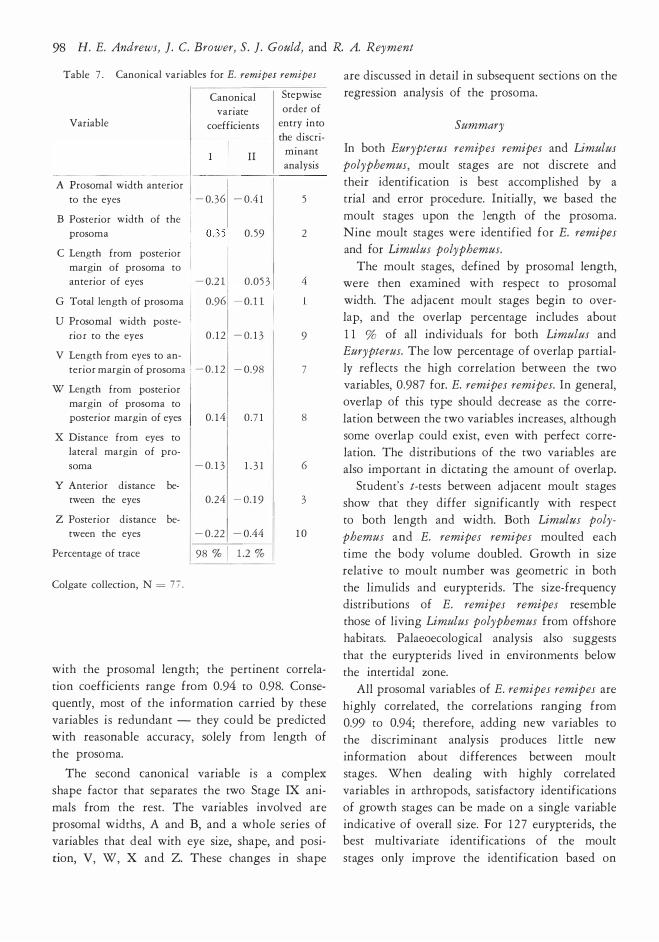
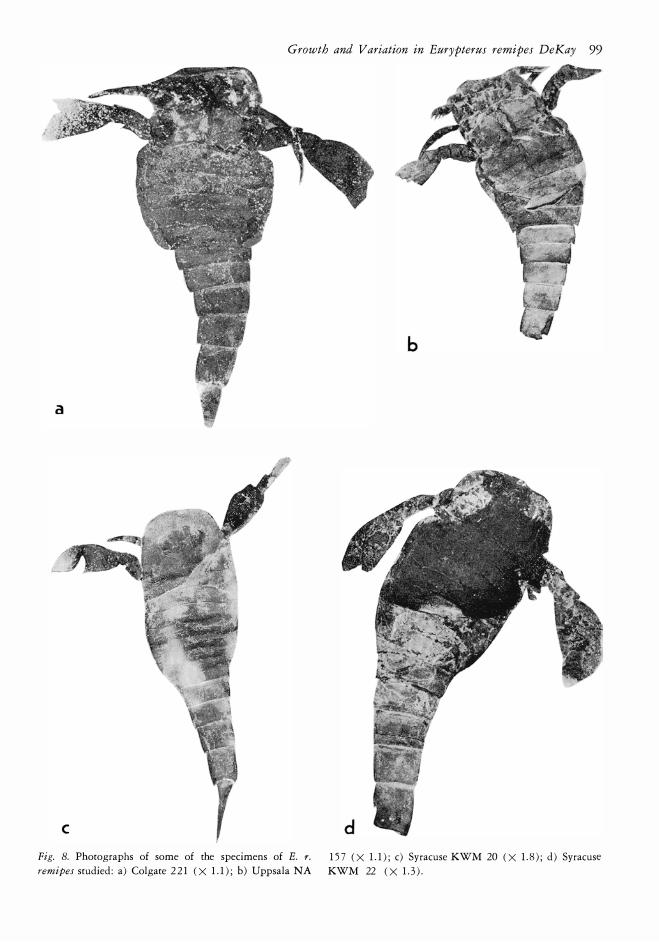
Fig. 8. Photographs of some of the specimens of E. r. remipes studied : a) Colgate 2 2 1 ( X 1 . 1 ) ; b) Uppsala NA
1 5 7 ( X 1 . 1 ) ; c) Syracuse KWM 20 ( X 1 . 8 ) ; d) Syracuse
KWM 22 ( X 1 . 3 ) .
100 H. E. Andrews, ]. C. Brower, S. ]. Gould, and R . A . R eyment
VA R I A B L E A
64 . 50 -
60 . 00 -
55 . 50 -
51 . 0 0 -
4 6 . 50 -
4 2 . 00 -
37. 50 �
33 . 00 -
2 8 . 50 � 24. 00 �
1 9 . 50 r-
1 5 . 00 � .1 ·
1 0 . 0 0 r- . - ·2 , • , .3 1
. · i 1 6 . 00 �
lL 4 . 50
1 _,.,. 1 z. · ·i 1 1 . . · 1 Z 3 1 1 1-Z'I 1 - � ·i 1 1 . ·fl
_, . . . 1 ".. z
. · · 2 , ,
l 1 4 . 50
, . . · ' 2 z ,. 1
l 24. 50
, _ . ·
1 z . . . . · , _, . . , ,
, .
1 1
l 34. 50
_ _ , . . ·
l l 44 . 50 5 4 . 50
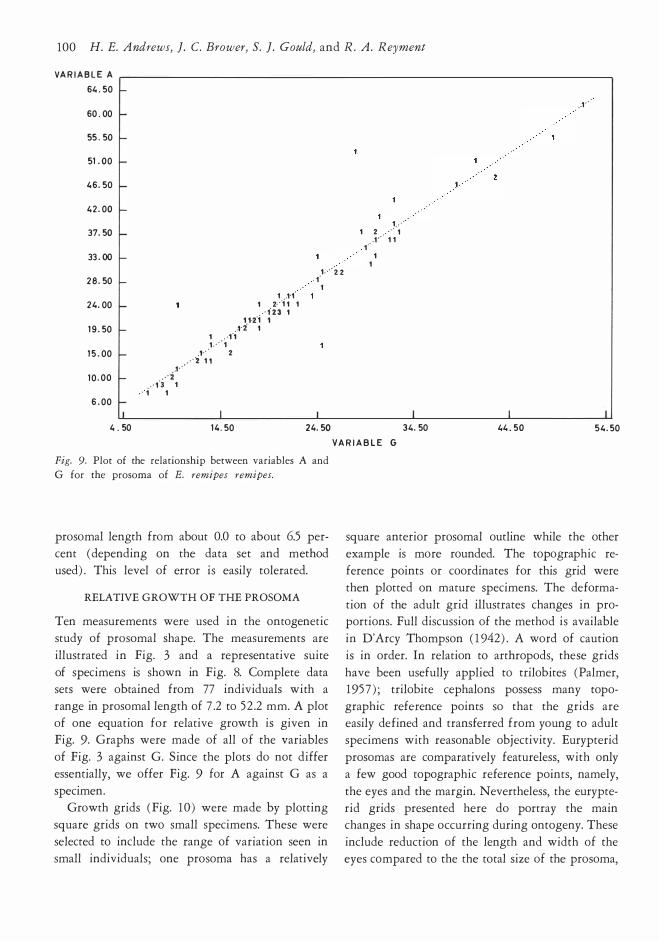
V A R I A B L E G Fig. 9. Plot of the relationship between variables A and
G for the prosoma of E. remipes remipes.
prosomal length from about 0.0 to about 6.5 per
cent ( depending on the data set and method
used) . This lev el of er ror is easily tolerated.
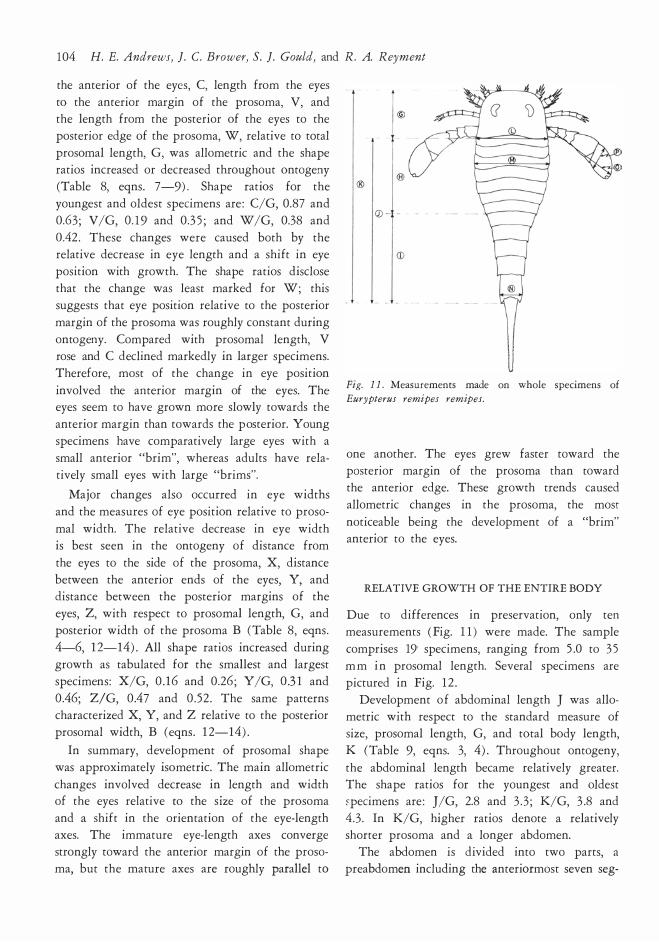
RELATIVE GROWTH OF THE PROSOMA
Ten measurements were used in the ontogenetic
study of prosomal shape. The measurements are
illustrated in Fig. 3 and a representative suite
of specimens is shown in Fig. 8. Complete data sets were obtained from 77 individuals with a
range in prosomal length of 7 .2 to 5 2 .2 mm. A plot
of one equation for relative growth is given in Fig. 9. Graphs were made of all of the variables
of Fig. 3 against G. Since the plots do not differ
essentially, we offer Fig. 9 for A against G as a
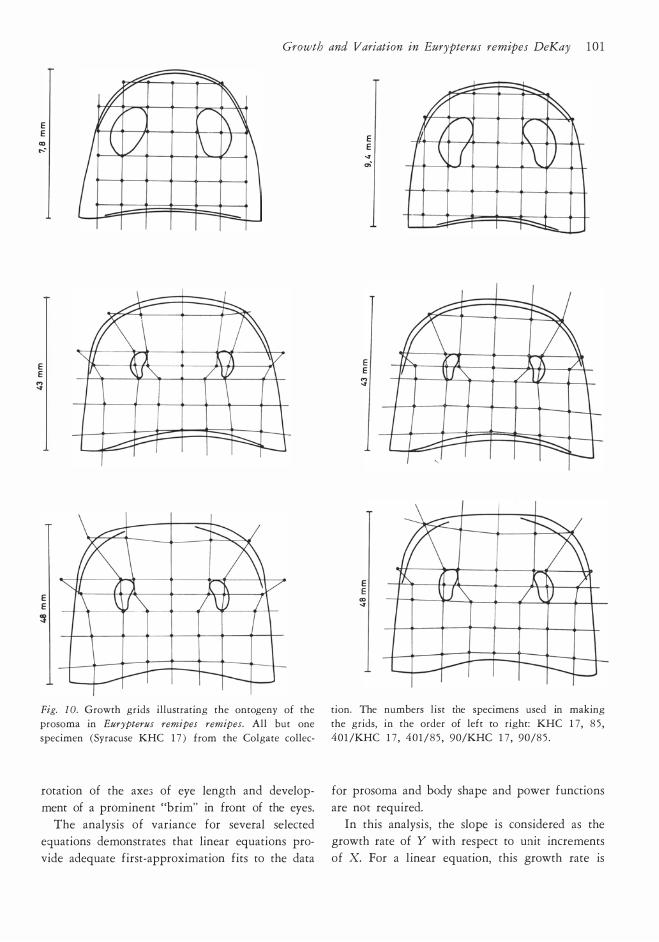
specimen. Growth grids (Fig. 10 ) were made by plotting
square grids on two small specimens. These were
selected to include the range of variation seen in
small individuals; one prosoma has a relatively
square anterior prosomal outline while the other
example is more rounded. The topographic re
ference points or coordinates for this grid were
then plotted on marure specimens. The deforma
tion of the adult grid illustrates changes in proporrions. Full discussion of the method is available
in D'Arcy Thompson ( 1 942) . A word of caution
is in order. In relation to arthropods, these grids
have been usefully applied to trilobites (Palmer, 195 7 ) ; trilobite cephalons possess many topo
graphic reference points so that the grids are easily defined and transferred from young to adult
specimens with reasonable objectivity. Eurypterid
prosomas are comparatively featureless, with only
a few good topographic reference points, namely,
the eyes and the margin. Nevertheless, the eurypte
rid grids presented here do portray the main changes in shape occurring during ontogeny. These
include reduction of the length and width of the eyes compared to the the total size of the prosoma,
Growth and Variation in Eurypterus remipes DeKay 1 0 1
E E
CD ....
E E
T E E �
Fig. l O. Growth grids illustrating the ontogeny of the
prosoma in Eurypterus remipes remipes. All but one
specimen (Syracuse KHC 1 7 ) from the Colgate collec-
rotation of the axe3 of eye length and develop
ment of a prominent "brim" in front of the eyes.
The analysis of variance for several selected equations demonstrates that linear equations pro
vide adequate first-approximation fits to the data
E E
� ."·
E E
.., �
E E
"' �
/: V
/; l l \ l
�-.....
� V [\ -' !\ ( \ u \
-.::::::t:::::..._ -
tion. The numbers list the specimens used in making
the grids, in the order of left to right: KHC 1 7, 8 5 ,
401 /KHC 1 7 , 40 1/85 , 90/KHC 1 7 , 90/8 5 .
for prosoma and body shape and power functions
are not required. In this analysis, the slope is considered as the
growth rate of Y with respect to unit increments
of X. For a linear equation, this growth rate is
102 H. E. Andrews, }. C. Brower, S. }. Gould, and R. A . Reyment
constant throughout ontogeny. The initial inter
cept, a, i.e., Y when X = O, is a location parameter
for the line. Regardless of the growth rate, if
the intercept is zero, development is isometric
and the shape of the two dimensions remains
constant throughout ontogeny. If a finite initial
intercept is introduced, growth becomes allometric
and the shape changes. The amount and nature
of the shape changes depends on the signs of
the growth rate and initial intercept and the
magnitude of the growth rate compared to the in
tercept. The growth rate and intercept interact
to produce the dunges in shape described by
the equation. Here, the shape changes are ex
pressed as shape ratios, calculated for the smallest
and !argest specimens : Shape ratio = (Y predicted
from the equation) / (X observed) .
In the eurypterids examined here, all the slopes
or growth rates are positive. With a negative
initial intercept and a positive growth rate, the
above shape ratio (Y /X) increases with growth.
With a positive initial intercept, the shape ratio
declines in larger animals. A useful account of
these relationships is given in Gould ( 1 972 ) .
The following discussion emphasizes the smal
lest and !argest observed values of the independent
variable, X, and the corresponding predicted or
equation figures for the dependent variable, Y.
Hopefully, this approach shows the ontogeny of
the "average" individual. Two-dimensional shape
changes are depicted by the ratios of Y (predicted) /
X ( observed) .
Proportions of the prosoma
The development of prosomal widths A, B and U
with respect to length was nearly isometric and
shape remained roughly constant throughout onto
geny (Table 8, equations 1-3 ) . The U/G ratio
was stabilized at 1 .2 , regardless of age and size. The
quotient A/G increased slightly from 1 . 1 to 1 .2 ,
while B/G declined from 1 .4 to 1 . 3 . These differen
tials ref!ect a slight shift of prosomal shape with
progressive age. Young specimens aften show
prominent rounding of the anterior part of the
prosoma, which begins just posterior to the eyes.
Consequently, the prosomal width anterior to the
eyes A is often less than the width posterior to
the eyes U. Many adult specimens have more
equal prosomal widths at the anterior and poste
rior eye levels, which produces a more subquadrate
outline of the prosoma. Both types of individuals
can be seen at all ages. However, subquadrate
specimens predominate among adults while most
juvenile prosomas are rounded. Regardless of age,
the prosoma is widest at its posterior margin
and tapers toward the anterior.
The differential growth patterns of prosomal
widths are best illustrated by the ontogeny of
widths in the area of the eyes, A and U, relative
to the posterior width, B (Table 8, equations 1 0,
1 1 ) . The A/B ratio increased from 0.83 to 0 .93
while the U/B ratio increased slightly from 0.9 1
to 0.96. The growth rates for A and U were
almost the same, 0.94 or 0.95 mm per l mm in
crease in posterior width B, bue A has a greater
negative initial intercept.
Ontogeny of eyes relative to prosoma
During growth of the prosoma, the main shape
changes occurred in the size and position of the
eyes. Due to their smallness and curved outline,
the eyes could not be measured with accuracy.
Approximate measures of eye size can be obtained
by the subtractions C - W; for the length and
[A - (Y + 2 X) ] /2 for width.
The most important omogenetic trend is a
decrease in eye size relative to prosomal size.
Small specimens, distributed over the prosomal
length interval of 7 .O to 8.0 mm, have eyes rang ing
from about 2 . 5 to 3.0 mm in length and 1 . 5 to
2 .0 mm in width. The same values for the !argest
available adult are at a prosomal length of 40.4
mm; eye length, 7.9 mm; eye width, 3.5 and 3.7
mm. The juvenile eye length is alm ost 3 7 % of
the prosomal length; the equivalent value for
large specimens is only 20 %. The absolute size
of the eyes increased throughout growth, although
the size of the prosoma increased relatively more
rapidly. (This was detected qualitatively by Clarke
and Ruedemann ( 191 2 ) ) . E. remipes tetragonoph
thalmus shows the same trend.
The decline of relative eye length also affected
the overall geometry of the prosoma. Ontogeny
of length from the posterior prosomal margin to
c:: o .... ·- "' - ..c g 8 O' :> � c::
Growth and Variation in Eurypterus remipes DeKay 103
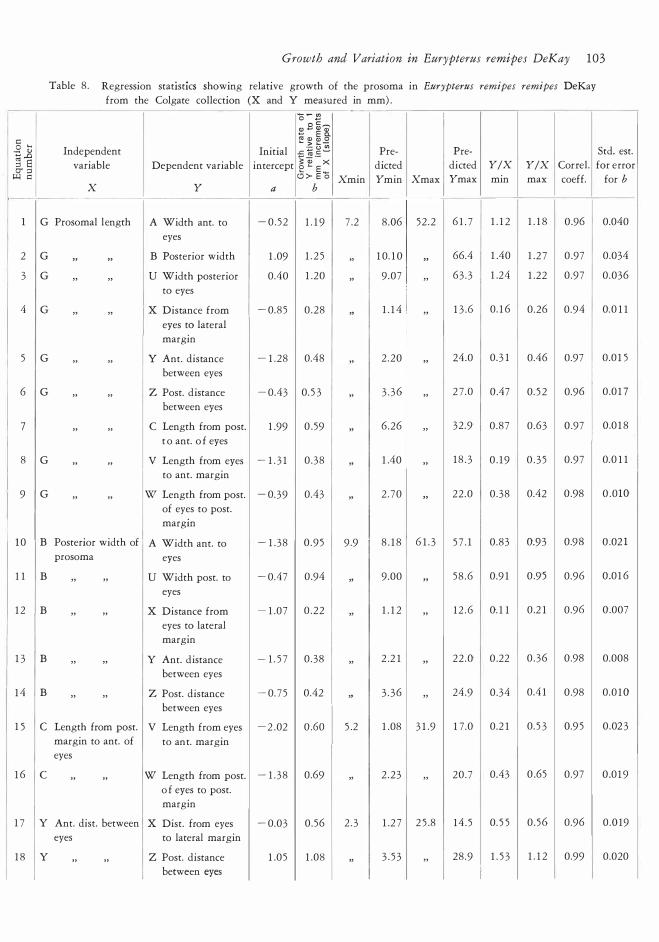
Table 8 . Regression statlsttcs showing relative growth of the prosoma in Eurypterus remipes remipes DeKay
from the Colgate collection (X and Y meamred in mm) .
Independent Initial variable Dependent variable intercept
X y a
- - "' o -Q) .e ai � - E c. � � f � -= � -� � � e E x O >- E b
b X min
l
Pre- Pre-
dicted dicted Y/X Y/X Correl.
Y min X max Y max min max coeff.
Std. est.
for er ror
for b
��-- --
l G Prosomal length A Width ant. to - 0 . 52 1 . 1 9 7 .2 8 .06 52 . 2 6 1 . 7 1 . 1 2 1 . 1 8 0.96 0.040
eyes
2 G " " B Posterior width 1 .09 1 . 2 5 ' 1 0. 1 0 " 66.4 1 .40 1 .2 7 0.97 0.034
3 G " " U Width posterior 0.40 1 .20 ' 9 .07 " 63 . 3 1 .24 1 .22 0 .97 0 .036
to eyes
4 G " " X Distance from - 0.85 0 . 28 ' 1 . 1 4 " 1 3 .6 0. 1 6 0 .26 0 .94 0.0 1 1
eyes to lateral
margin
5 G " " Y Ant. distance - 1 .28 0.48 ' 2 . 20 " 24.0 0. 3 1 0.46 0.97 0 .0 1 5
between eyes
6 G " " Z Post. distance - 0.43 0. 5 3 ' 3 . 3 6 " 2 7 .0 0.47 0. 5 2 0.96 0 .0 1 7
between eyes
7 " " c Length from post. 1 .99 0 .59 ' 6 .26 " 32 .9 0 .87 0 .63 0.97 0.0 1 8
t o ant. o f eyes
8 G " " V Length from eyes - 1 . 3 1 0 . 38 ' 1 .40 " 1 8 . 3 0 . 1 9 0 . 3 5 0 .97 0.0 1 1
to ant. margin
9 G " " w Length from post. - 0. 39 0 .43 ' 2 . 70 " 22 .0 0 . 38 0.42 0.98 0 .010
of eyes to post.
margin
l O B Posterior width of A Width ant. to - 1 . 38 0 . 9 5 9 . 9 8 . 1 8 6 1 . 3 5 7 . 1 0 .83 0.93 0.98 0.02 1
prosoma eyes
1 1 B " " u Width post. to - 0.47 0.94 ' 9.00 " 58 .6 0.9 1 0.95 0 .96 0.0 1 6
eyes
1 2 B " " X Distance from - 1 .07 0 . 22 ' 1 . 1 2 " 1 2 . 6 0. 1 1 0.2 1 0.96 0.007
eyes to lateral
margin
1 3 B " " y Ant. distance - 1 . 5 7 0 . 38 ' 2 .2 1 " 22 .0 0.22 0 . 36 0.98 0.008
between eyes
1 4 B " " Z Post. distance - 0. 7 5 0.42 ' 3 . 3 6 " 24.9 0 .34 0.4 1 0.98 0.0 1 0
between eyes
0.60 l 1 5 c Length from post. V Length from eyes - 2 .02 5 .
margin to ant. of to ant. margin
1 .08 3 1 .9 1 7 .0 0 .2 1 0 . 5 3 0.9 5 0 .02 3 2
eyes
1 6 c " " w Length from post. - 1 . 3 8 0.69 ' 2 . 2 3 " 20 . 7 0.43 0 .65 0 .97 0.0 1 9
o f eyes to post.
margin
1 7 y Ant. dist. between X Dist. from eyes - 0.03 0 . 56 2 . 3 1 .2 7 2 5 .8 14 . 5 0 . 5 5 0 . 56 0.96 0 .019
eyes to lateral margin
1 8 y " " Z Post. distance 1 .05 1 .08 ' 3 . 5 3 " 28 .9 1 . 5 3 1 . 1 2 0.99 0.020
l between eyes l l
l
104 H. E. Andrews, ]. C. Brower, S. ]. Gould, and R. A. Reyment
the anterior of the eyes, C, length from the eyes
to the anterior margin of the prosoma, V, and the length from the posterior of the eyes to the
posterior edge of the prosoma, W, relative tO tOtal
prosomal length, G, was allometric and the shape ratios increased or decreased throughout ontageny (Table 8, eqns. 7-9) . Shape ratios for the
youngest and oldest specimens are : C/G, 0.87 and
0.63 ; V /G, 0. 1 9 and 0 .3 5 ; and W /G, 0.38 and
0.42 . These changes were caused both by the relative decrease in eye length and a shift in eye
position with growth. The shape ratios disclose
that the change was !east marked for W; this
suggests that eye position relative to the posterior
margin of the prosoma was roughly constant during
ontogeny. Compared with prosomal length, V
rose and C declined markedly in larger specimens.
Therefore, most of the change in eye position
involved the anterior margin of the eyes. The eyes seem to have grown more slowly tawards the
anterior margin than towards the posterior. Young
specimens have comparatively large eyes with a
small anterior "brim", whereas adults have rela
tively small eyes with large "brims".
Major changes also occurred in eye widths
and the measures of eye position relative to proso
mal width. The relative decrease in eye width
is best seen in the ontogeny of distance from
the eyes to the side of the prosoma, X, distance
between the anterior ends of the eyes, Y, and distance between the posterior margins of the
eyes, Z, with respect to prosomal length, G, and
posterior width of the prosoma B (Table 8 , eqns .
4-6, 1 2-14) . All shape ratios increased during
growth as tabulated for the smallest and !argest
specimens: X/G, 0 . 16 and 0.26; Y/G, 0.3 1 and
0.46; Z/G, 0 .47 and 0 . 52 . The same patterns characterized X, Y, and Z relative to the posterior
prosomal width, B (eqns . 1 2-14) .
In summary, development of prosomal shape
was approximately isometric. The main allometric
changes involved decrease in length and width of the eyes relative to the s ize of the prosoma
and a shift in the orientation of the eye-length
axes. The immature eye-length axes converge strongly taward the anterior margin of the proso
ma, but the mature axes are roughly parallel to
1 i ® :
® ®
Q)
CD
Fig. 1 1 . Measurements made on whole specimens of Eurypterus remipes remipes.
one another. The eyes grew faster taward the
posterior margin of the prosoma than wward the anterior edge. These growth trends caused
allometric changes in the prosoma, the most
noticeable being the development of a "brim" anterior to the eyes.
RELATIVE GROWTH OF THE ENTIRE BODY
Due to differences in preservation, only ten
measurements ( Fig. 1 1 ) were made. The sample
comprises 19 specimens, ranging from 5 .0 to 3 5
m m i n prosomal length. Several specimens are
pictured in Fig. 1 2 .
Development o f abdominal length J was allo
metric with respect to the standard measure of
size, prosomal length, G, and total body length, K (Table 9, eqns. 3, 4) . Throughout ontogeny,
the abdominal length became relatively greater. The shape ratios for the youngest and oldest Epecimens are : J/G, 2.8 and 3 . 3 ; K/G, 3 .8 and
4 .3 . In K/G, higher ratios denote a relatively shorter prosoma and a longer abdomen.
The abdomen is divided into two parts, a
preabdomen including the anteriormost seven seg-

Growth and Variation m Eurypterus remipes DeKay 105
a Fig. 12 . Eurypterus remipes remipes DeKay. a) a young
individual (Colgate 1 2 1 ) ; b) a large specimen (Syracuse
® 60 o
o 50 o
0 0
40
I o o
LU 30 _J (IJ o o o <( a: <( 2 0 > o
o
1 0 o
o o 10 2 0 3 0 4 0 ® V A R I A B L E G
Fig. 1 3 . Plots for the pairs of variables H against G,
and I against H (see Fig. 1 1 ) for Colgate E. remipes
b KWM 1 8) - the left tip of the paddle and the telson
are broken.
(i) 70
60 o
50 o
40 o
w -' • (IJ <( 30 o a: <( o >
o 20
o
1 0 o
o o 20 40 60
VA R I A B L E H ® remipes to show bivariate relationships in whole in
dividuals.
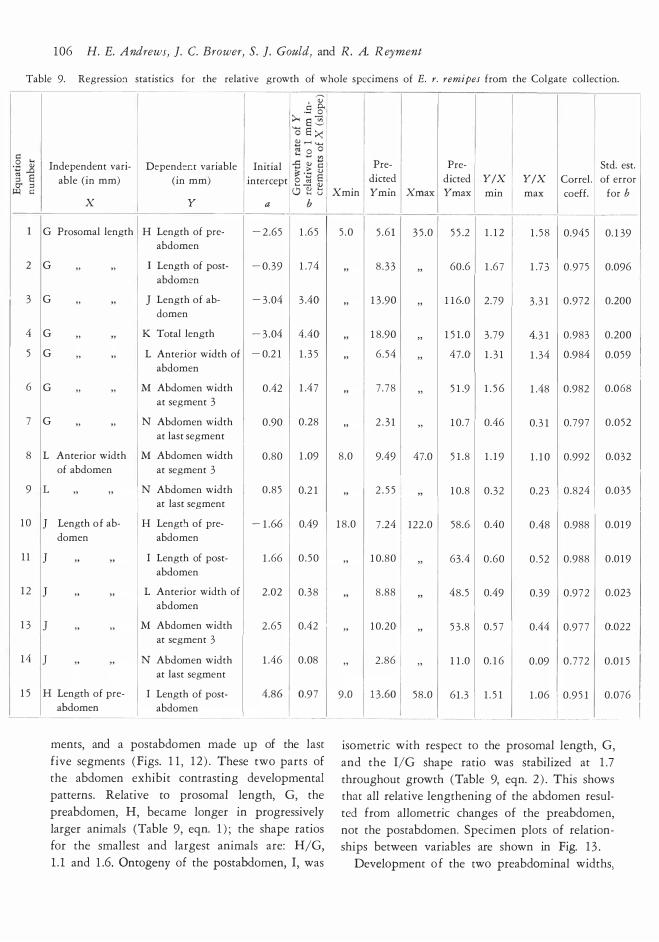
1 06 H. E. AndrewJ, ]. C. Brower, S. ]. Gould, and R . A. R eyment
Table 9. Regression statistics for the relative growth of whole spccimens of E. r. remipes from the Colgate collection.
Independent vari
able (in mm) Depender:! variable
(in mm)
C: 15. ' ·- o l · ;;.. a 3 ' l o a ><
intercept 8 ] 5 l -
d
l l l Pre- l Std. est. Y/X Y/X Correl . of error
X y
Initial � � ] ] l
a 1 0 ; ti l Xmin
·�-;----
Pre
di ete
Ym In dicted l
Xm�-�max min l max coeff. for b l i - ---·-
G Prosomal length H Length of preabdomen
- 2 .65 1 .65 l 5 . 0 5 . 6 l 3 5 .0 5 5 .2 1 . 1 2 i l 1 . 5 8 0 .945 0. 1 39
2 G
3 G
4 G 5 G
6 G
7 G
Length of post
abdomen
] Length of ab
domen
K Total length
L Anterior width of
abdomen
M Abdomen width
at segment 3
N Abdomen width
at last segment
8 L Anterior width M Abdomen width
9 I L l of abdomen at segment 3
N Abdomen width at last segment
- 0.39 1 . 74
- 3 .04 3 .40
- 3 .04 4.40
- 0.2 1 1 . 3 5
0.42 1 .4 7
0.90 0 .28
0 .80 1 .09
0 .85 0 .2 1
8 .0
8 . 3
1 3 .9
1 8 .9
6 . 5
3
o
o 4
7 . 7 8
2 . 3 1
"
"
"
"
60.6 1 .6 7
1 1 6 .0 2 .79
1 5 1 . 0 3 . 79
47 .0 1 . 3 1
5 1 .9 1 . 5 6
1 0. 7 0.46
9.49 47.0 5 1 .8 1 . 1 9
2 . 5 5 1 0.8 0 . 32
l 1 . 7 3 0 .975 0.096 ' l
3 . 3 1 0 .972 0.200
4. 3 1 0 .983 0 .200
1 . 34 0.984 0.059
1 .48 0 .982 0 .068
0. 3 1 0. 797 0 .052
1 . 1 0 0.992 0.032
0 .2 3 ! 0.824 1 0.0 3 5
l O J Length o f ab
domen
H Length of pre
abdomen - 1 .66 0.49 1 8 .0 7 .24 122 .0 58 .6 0.40 OAS 0.988 0 .0 19
1 1 J 1 2 J
1 3 i J l i
1 4 l ; i
I Length of post
abdomen
L Anterior width of
abdomen
M Abdomen width
at segment 3
N Abdomen width
at last segment
1 .66 0 . 50
2 .02 0. 3 8
2 .65 0.42
1 .46 0 .08
1 5 ·� H Length of pre
abdomen l I Length of post
abdomen 4 .86 1
----- -
ments, and a postabdomen made up of the last
five segments (Figs. 1 1 , 1 2 ) . These two parts of the abdomen exhibit conrrasting developmental
patterns . Relative to prosomal length, G, the
preabdomen, H, became langer in progressively
larger animals (Table 9, eqn. l ) ; the shape ratios for the smallest and !argest animals are: H/G,
1 . 1 and 1 .6. Onrogeny of the postabdomen, I, was
1 0.80 63 .4 0 .60 0 . 52 0 .988 0.0 19
8 .88 i 48 . 5 0.49 0.39 0.972 0 .023
1 0.20 5 3 .8 0. 5 7 0.44 0.97 7 0 .022
2 . 86 1 1 .0 0. 1 6 0 .09 0 . 7 72 0 .0 1 5
58 . 0 6 1 . 3 ! 1 . 5 1 1 .06 0.9 5 1 0 .076
--�_!___ __ ----�--�---
isometric with respect to the prosomal length, G,
and the I/G shape ratio was stabilized at 1 .7
throughout growth (Table 9, eqn. 2 ) . This shows that all relative lengthening of the abdomen resul
ted from allometric changes of the preabdomen,
not the postabdomen. Specimen plots of relationships between variables are shown in Fig. 1 3 .
Development o f the two preabdominal widths,
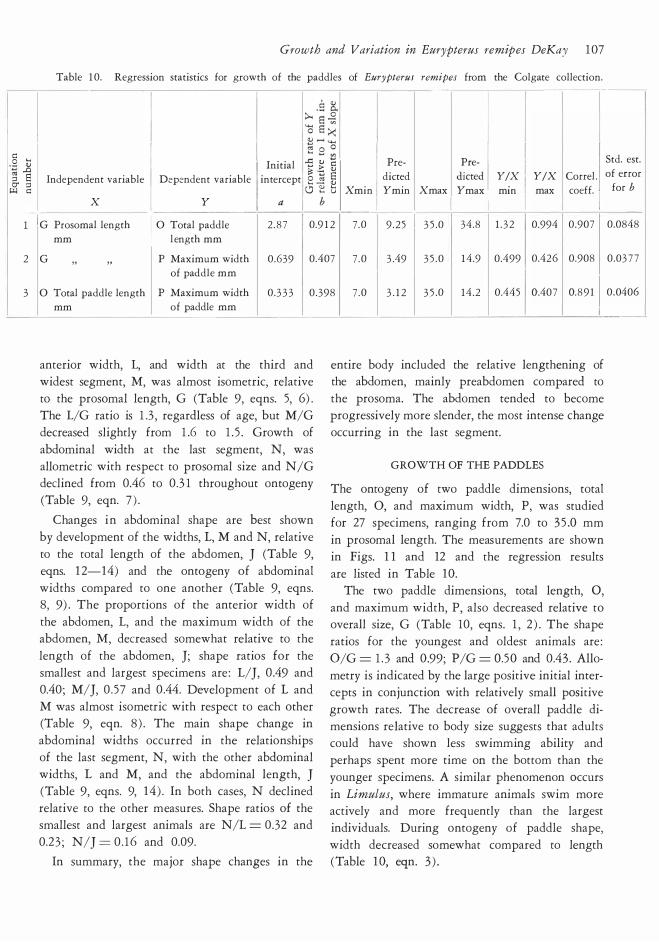
Growth and Variation in Eurypterus remipes DeKay 1 07
Table 1 0. Regression statistics for growth of the paddles of Eurypteru.r remipes from the Colgate collection. ---1
c o ....
l ·c 15 � E r::r :::> � c Independent variable
X l
J G Prosomal length
mm
· l Initial � -� 2 l Dependent variable intercept 8 � � l e":) """ u
y l a j b
l O Total paddle 2 . 8 7 0.9 1 2
l ength mm
p re-
Xmin Ymin l dicted
7 .0 9 . 25
di�� � Y/X l Y/X Correl .
X max Ymax mm max coeff.
l l
p
l 3 5 .0 34 .8 1 . 3 2 0.994 0 .907
2 G P Maximum width 0 .639" 0 .407 7 . 0 3 .49 3 5 . 0 1 4 .9 0.499 0.426 0.908
of paddle mm
3 O Total paddle length P Maximum width 0 . 3 3 3 0 .398 7 .0 3 . 1 2 3 5 .0 14 .2 l 0.445 0.407 0.8 9 1 l mm of paddle mm
-- --
anterior width, L, and width at the third and
widest segment, M, was almost isometric, relative
to the prosomal length, G (Table 9, eqns. 5, 6) .
The L/G ratio is 1 .3 , regardless of age, but M/G
decreased slight!y from 1 .6 to 1 . 5 . Growth of
abdominal width at the last segment, N, was
allometric with respect to prosomal size and N/G declined from 0.46 to 0 .3 1 throughout ontogeny
(Table 9, eqn. 7 ) .
Changes i n abdominal shape are best shown
by development of the widths, L, M and N, relative
to the total length of the abdomen, J (Table 9,
eqns. 1 2-14) and the ontogeny of abdominal
widths compared to one another (Table 9, eqns. 8, 9) . The proportions of the anterior width of
the abdomen, L, and the maximum width of the
abdomen, M, decreased somewhat relative to the
length of the abdomen, J; shape ratios for the
smallest and !argest specimens are : L/J, 0.49 and
0.40 ; M/J, 0 . 57 and 0 .44. Development of L and
M was almost isometric with respect to each other
(Table 9, eqn. 8 ) . The main shape change in
abdominal widths occurred in the relationships
of the last segment, N, with the other abdominal
widths, L and M, and the abdominal length, J
(Table 9, eqns. 9, 14 ) . In both cases, N declined
relative to the other measures. Shape ratios of the
smallest and !argest animals are N/L = 0 .32 and
0.2 3 ; N/J = 0 . 16 and 0.09.
In summary, the major shape changes in the
l
entire body included the relative lengthening of the abdomen, mainly preabdomen compared to
the prosoma. The abdomen tended to become
progressively more slender, the most intense change
occurring in the last segment.
GROWTH OF THE PADDLES
The ontogeny of two padd!e dimensions, total
length, O, and maximum width, P, was smdied
for 27 specimens, ranging from 7.0 to 3 5 .0 mm
in prosomal length. The measurements are shown in Figs. 1 1 and 12 and the regression results
are listed in Table 10. The two paddle dimensions, total length, O,
and maximum width, P, also decreased relative to overall size, G (Table 10, eqns. l, 2 ) . The shape
ratios for the youngest and oldest animals are :
0/G = 1 . 3 and 0.99; P/G = 0.5 0 and 0.43 . Allo
metry is indicated by the large positive initial intercepts in conjunction with relatively small positive
growth rates. The decrease of overall paddle di
mensions relative to body size suggests that adults could have shown less swimming ability and
perhaps spent more time on the bortom than the
younger specimens. A similar phenomenon occurs
in Limulus, where immature animals swim more actively and more frequently than the !argest
individuals. During ontogeny of padd!e shape,
width decreased somewhat compared to length (Table 1 0, eqn. 3 ) .
Std. est.
of error for b
0.0848
0 .03 7 7
0 .0406

108 H. E . Andrews, ]. C . Brower, S . ]. Gould, and R. A. R eyment
INTEGRATION BETWEEN THE BODY
AND PROSOMA
The intuitively most satisfying model for studying
the strength of correlation between two sets of
variables is that of canonical correlation. Although
this method is one of the older ones, it has not
been widely applied, as the main interpretations
of the analysis Iie with the sizes of coefficients
of the pairs of equations for each set and it has
in practice turned out to be difficult to judge the significance of these (cf. Blackith and Rey
ment, 1 97 1 ) .
Recently, psychometricians have succeeded in deepening the theoretical background of canonical
correlation analysis with an improved means of
interpreting the roles of the elements. These im
provements have been made in the light of ex
perience arising of recent years in developing the
statistical foundations of factor analysis.
Five of the variables were judged as response
variables and two of them as predictors, for a
total number of 2 7 individuals from the Syracuse
and Colgate collections. The predictor set com
prises the width of the prosoma at its base L and
the length of the prosoma G, in that order. The response variables are the width at the base of the
third segment M, the width at the base of the
last segment N, the length of the paddle O, the
width of the paddle P, the length from the prosoma
to the base of the seventh segment H. The loca
tions of these measures are illustrated in Fig. 1 1 .
We shall first consider the matrix of correlations for the seven variables considered together.
It is :
L G M N o p H
L 1 .00 0.96 ; 0.99 0.96 0 .85 0 .89 0.93 R21 G 0 .96 1 .00 • 0.95 0 .95 0 .79 0.9 1 0 .91
M 0.99 0 .95 : 1 .00 0.96 0 .83 0 .88 0 .93 N 0.96 0 .95
:0 .96 1 .00 0 .7 1 0 .83 0 .88
o 0 .85 0 .79 0 .83 0. 7 1 1 .00 0 .85 0 .83
R21 p 0.89 0.9 1 0 .88 0 .83 0 .85 1 .00 0.89 H 0 .93 0.9 1 0 .93 0 .88 0 .83 0 .89 1 .00
With such high correlations, it is to be ex
pected that most of the variation will Iie with the
first pair of canonical variates. The dashed lines in the correlation matrix
denote its partitioning into four submatrices ( for
Table 1 1 . Vector loadings for the first canonical
correlation for Eurypterus remipes remipes.
Response l Variable Predictor
Variable weightings weightings
Un-Adjusted l Un-
adjusted adjusted Adjusted
M 0. 5 6 1 .00 L - 1 . 1 3 0.93
N 0 .26 0.96 G 2 . 1 4 0 .93
o 0. 1 6 0.8 5
p 0.00 0.90 l CORRELATION = 0.95 H 0.02 0.93
---· --
producing the characteristic equation required
for finding the correlations between sets) . Submatrices R1 1 and R2 2 contain the correla
tions for the two sets, predictors and responses,
respectively. Submatrices R1 2 and R2 1 contain
the correlations linking the variables across the
two sets. The purpose of this analysis is to present these interrelationship in paired linear combina
tions of the variables . The rank of the smaller
of the submatrices R1 1 and R2 2 determines the
number of paired combinations. We shall begin the analysis of the 27 indi
viduals by briefly considering the direct rela
tionships between the elements of the cross-cor
relation matrices. Practically all ·of the variation
in the negative definite matrix R1 2 resides in one eigenvalue. Only the first eigenvalue is significant (Bartlett's test yields x i o= 5 3 .3 ) . In effect,
virtually all of the information contained in the
observations is localized to the first eigenvalue
and its associated vectors.
A comparison of the raw loadings and the
improved "factorial" estimates is presented in Table 1 1 . It will be seen that the raw loadings (unadjusted) are meaningless. If only these were
available for interpretation, the analysis would
be rejected out of hand by any quantitative biolo
gist, for they are at complete variance with all other information. For example, we have the
completely misleading zero coefficients for P and
H. The adjusted coefficients give, however, a completely different picture. All weights are roughly the same and, with the canonical correla-

Growth and V ariation in Eurypterus remipes DeKay 1 09
o . 2oo .-��������--������������������� • '
o . 1 6 5
o . 130 r-
0 . 0 95
0 . 06 0
o . 0 25
- o . 010
- 0 . 045 . " 15 . o 17 •"
16. 2 •'
- 0 . 080 r-13 .
- o . 1 1 5 f-
6 . . 21 . • 7
20 .
• '
"
22 .
·"
27 .
• '
- o . 1 50 '-------'-' -'--��-'--��-'-��l__�___jL__�___J.'��__L��_j_��_L��_j - 0 . 1 90 - 0 . 1 4 6 - 0 . 1 0 2 - 0 . 0 5 8 - 0 . 0 1 4 0 . 030 0 . 074 o. 1 1 8 o . 1 62 0 . 206 0 . 250
F l RST VA R lATE
Fig. 14. Plot of the scores for the canonical variates
of the first canonical correlation for E. r. remipes. The
points fall ing in the up per part of the plot (points l ,
tion o f 0.95 , the exceptionally high imegration
between body and head is manifest.
Another instructive result arising from the
adjusted weightings is the equal contributions of
the predictor variables L and G. In the unadjusted coefficients they are in a negative relationship
which is misleading.
The "transformed canonical scores" for the
two sets of vectors were plorted (Fig. 14) . The most obvious thing arising from this plot is the spread of the values, according to size, across the field, with the smallest falling in the bortom left quadrant and the !argest in the upper right
quadrant. As a result of the high level of integra
tion, both axes reflect size variation, although the
horizontal axis also includes a shape-differentiating element over part of the field ( i .e. among more
mature specimens) .
A redundancy analysis can hardly be expected to furnish any surprises. All variables correlate
highly with the original data (0 .88 L, 0.88 G) and (0.95 M, 0.91 N, 0 .81 O, 0.85 P, 0.89 H) . The
4, 5, 22) are the !argest specimens of the sample, those
falling in the lower corner (points 2 5 , 1 3 and 3) are
the smallest individuals.
redundancy coefficients are 0.77 for predictors and
responses alike, and also for both total coefficients
of redundancy.
There is virtually nothing left over for the
second canonical correlation, which is a low 0.14. The raw vector elements give high and apparently meaningful loadings, but these are artifacts. All
of the adjusted coefficients are dose to zero, with only the length of the paddle approaching a mea
ningful leve!. This variable was the most difficult
of all to measure, and we suspect that its high coefficient is a reflection of measurement error.
R AND Q MODE ANALYSES
The same seven prosomal and abdominal measure
ments as used in the canonical correlation as well as the full set of prosomal measures were subjec
ted to an R-mode principal components analysis.
Although we consider the canonical correlation model to be more appropriate to the biological problem at hand, it is well known, that an in toto
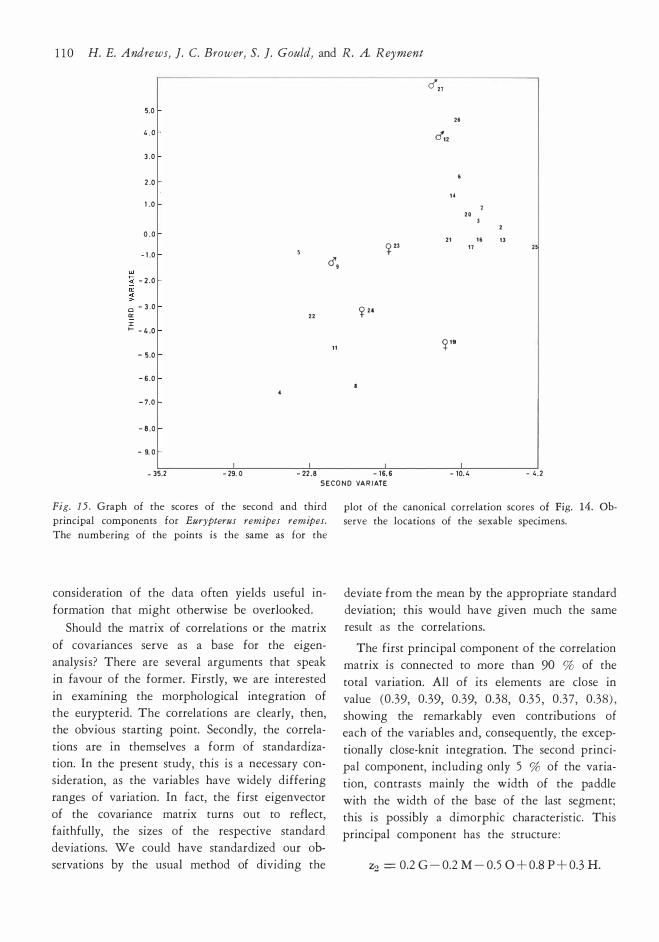
1 1 0 H. E. Andrews, ]. C. Brower, S. ]. Gould, and R . A. R eyment
5.0
4 . 0
3 . 0
2 .0
1 . 0
o . o
- 1 .0
- 2 . 0
o - 3 . 0
Q: r ,__ - 4 .o
- 5 . 0
- 6 . 0
- 7. 0
- e .o
- 9. 0
- 35.2
22
l l - 29. o - 22 . 8
a"
"
- 1 6. 6
"
14
20
21 17
- 10. 4
1 6 1 3
- 4 . 2
S E CO N O VA R I ATE
Fig. 1 5 . Graph of the scores of the secood and third
priocipal compooencs for Eurypterus remipes remipes.
The oumberiog of the poiots is the same as for the
consideration of the data often yields useful in
formation that might otherwise be overlooked.
Should the matrix of correlations or the matrix
of covariances serve as a base for the eigenanalysi s ? There are several arguments that speak
in favour of the former. Firstly, we are interested
in examining the morphological integration of the eurypterid. The correlations are clearly, then, the obvious starting point. Secondly, the correla
tions are in themselves a form of standardization. In the present study, this is a necessary consideration, as the variables have widely differing
ranges of variation. In fact, the first eigenvector
of the covariance matrix turns out to ref!ect, faithfully, the sizes of the respective standard
deviations. W e could have standardized our observations by the usual method of dividing the
plot of the canooical correlation scores of Fig. 14. Ohserve the locations of the sexable specimeos.
deviate from the mean by the appropriate standard deviation; this would have given much the same
result as the correlations.
The first principal component of the correlation
matrix is connected to more than 90 % of the
total variation. All of its elements are dose in
value (0 .39, 0 .39, 0 . 39, 0.38, 0.3 5 , 0.37 , 0 .38) , showing the remarkably even contriburions of each of the variables and, consequently, the excep
tionally close-knit integration. The second principal component, including only 5 % of the varia
tion, comrasts mainly the width of the paddle
with the width of the base of the last segment;
this is possibly a dimorphic characteristic. This
principal componem has the structure :
Z2 = 0.2 G - 0.2 M - 0.5 0 + 0.8 P + 0.3 H.
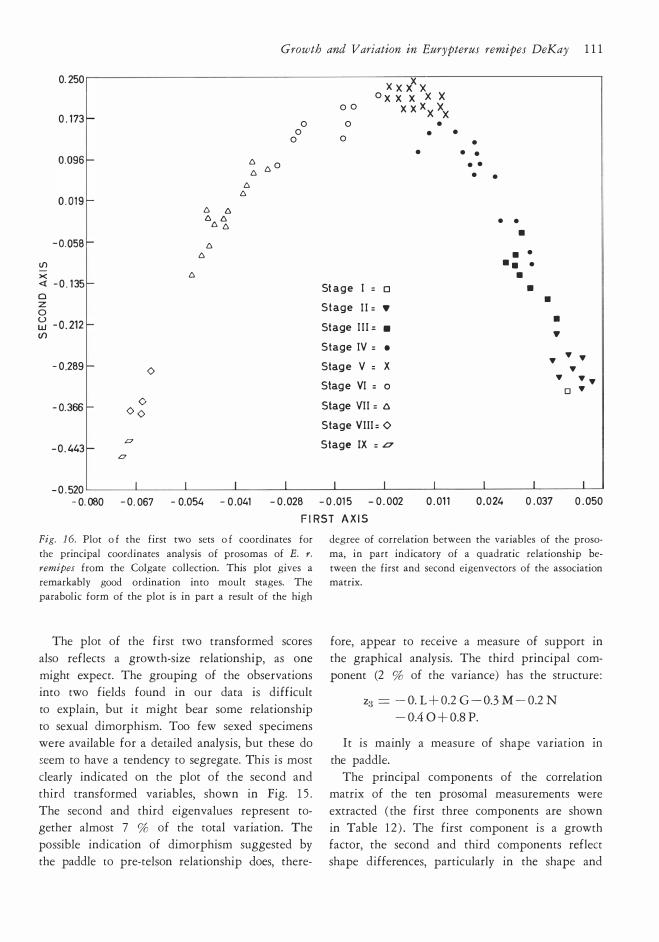
Growth and V ariation in Eurypterus remipes DeKay 1 1 1
0. 250 x x l x 0 X X X X X
o o X X X X XX 0 . 1 73 -
o o • o • •
o o • • • •
0.096 - l:. l:. O • •
l:. • • l:.
l:. 0 . 0 1 9 -
l:. l:. l:. l:.
l:. t:; • • •
- 0. 058 - l:. l:. • •
IJ) • • • >< l:. • <l: - 0 . 1 35 - St a g e l ; o • o • z St age I l ; • o u
- 0 . 21 2 r-•
w St age I l l = • C/) •
Stage IV ; • • •
- 0.289 - Stag e V ; X • <> •
• • • Stag e VI ; o o •
- 0.366 -<> Stage VIl ; o <> o
Stage VI ll ; <> a Stage IX ; L7 - 0 . 443 r- L7
- 0 . 520 l l l l l l l l l l - 0. 080 - 0 . 067 - 0.054 - 0 .041 - 0 . 028 - 0 .01 5 - 0 . 002 0 . 01 1 0 . 0 24 0 . 037 0 . 050
F I RST A X I S Fig. 1 6. Plot o f the first two sees o f coordinates for
the principal coordinates analysis of prosomas of E. r. remipes from the Colgate collection. This plot gives a
remarkably good ordination into moult stages. The
parabolic form of the plot is in part a result of the high
The plot of the first two transformed scores
also reflecrs a growth-size relationship, as one
might expect. The grouping of the observations
inro two fields found in our data is difficult
to explain, bur it might bear some relationship
to sexual dimorphism. Too few sexed specimens were available for a detailed analysis, bur these do seem to have a tendency to segregate. This is most
clearly indicated on the plot of the second and
third transformed variables, shown in Fig. 1 5 .
The second and third eigenvalues represenr together almost 7 % of the total variation. The
possible indication of dimorphism suggested by
the paddle to pre-telson relationship does, there-
degree of correlation between the variables of the proso
ma, in part indicatory of a quadratic relationship be
tween the first and second eigenvecrors of the association
matrix.
fore, appear to rece1ve a measure of support in
the graphical analysis. The third principal com
ponenr (2 % of the variance) has the structure :
z3 = - 0. L + 0.2 G - 0.3 M - 0.2 N
- 0.4 0 + 0.8 P.
It is mainly a measure of shape variation m
the paddle.
The principal componenrs of the correlation matrix of the ten prosomal measurements were
extracted ( the first three componenrs are shown
in Table 1 2 ) . The first componenr is a growth facror, the second and third componenrs reflect shape differences, particularly in the shape and
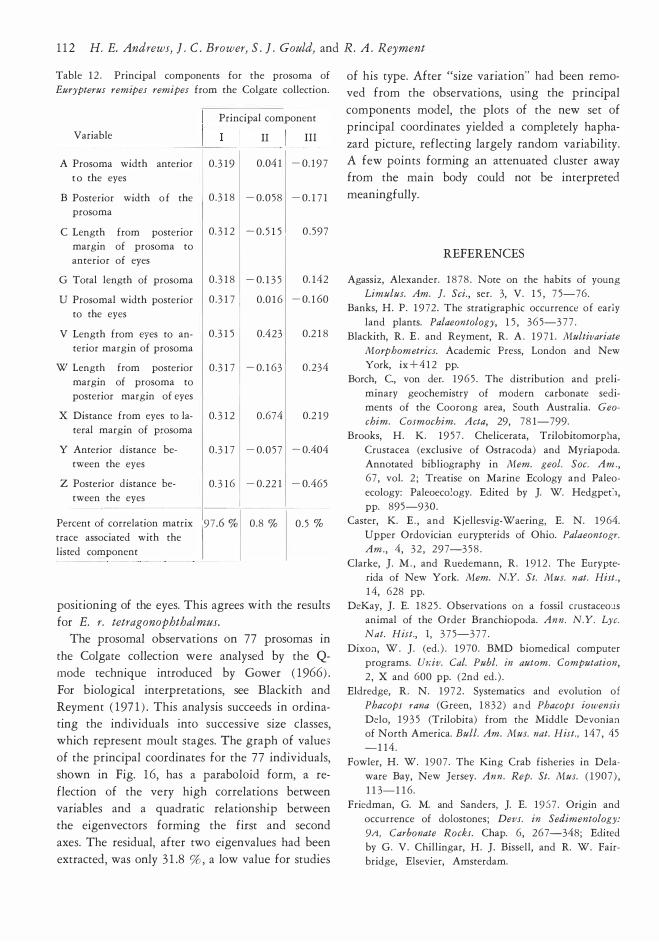
1 1 2 H. E. Andrews, ] . C . Brower, S . ] . Gould, and R. A . Reyment
Table 1 2 . Principal components for the prosoma of
Eurypterus remipes remipes from the Colgate collection.
Principal component
Variable
A Prosoma width anterior 0 . 3 1 9
t o the eyes
Il III
0.04 1 - 0. 1 9 7
B Posterior width o f the 1 0 .3 1 8 - 0.058 - 0. 1 7 1 prosoma
C Length from posterior
margin of prosoma to
anterior of eyes
G Total length of prosoma
U Prosomal width posterior
to the eyes
V Length from eyes to an
terior margin of prosoma
W Length from posterior
margin of prosoma to
posterior margin of eyes
X Distance from eyes to la
teral margin of prosoma
Y Anterior distance be
tween the eyes
Z Posterior distance be
tween the eyes
0. 3 1 2
0 . 3 1 8
0 . 3 1 7
0 . 3 1 5
0 .3 1 7
0. 3 1 2
0 . 3 1 7
0. 3 1 6
- 0. 5 1 5 0 . 597
- 0. 1 3 5 0. 142
0 .0 1 6 - 0. 1 60
0.423 0.2 1 8
- 0. 1 63 0 .234
0 .674 0.2 1 9
- 0.0 57 - 0.404
- 0.22 1 - 0.465
-------- 1 --------� -Percent of correlation matrix
trace associated with the
listed component
0 .8 % 0 .5 %
positioning of the eyes. This agrees with the results
for E. r. tetragonophthalmus.
The prosomal observations on 77 prosomas in
the Colgate collection were analysed by the Q
mode technique introduced by Gower ( 1 966) .
For biological interpretations, see Blackith and
Reyment ( 1 97 1 ) . This analysis succeeds in ordinating the individuals into successive size classes, which represent moult stages. The graph of value3
of the principal coordinates for the 77 individuals,
shown in Fig. 1 6, has a paraboloid form, a re
flection of the very high correlations between variables and a quadratic relationship between
the eigenvectors forming the first and second
axes. The residual, after two eigenvalues had been
extracted, was only 3 1 .8 % , a low value for stud i es
of his type. After "size variation" had been removed from the observations, using the principal
components model, the plots of the new set of
principal coordinates yielded a completely hapha
zard picture, reflecting largely random variability. A few points forming an attenuated duster away from the main body could not be interpreted
meaningfully.
REFERENCES
Agassiz, Alexander. 1 8 78 . Note on the habits of young
Limulus. Am. ]. Sei. , ser. 3, V. 1 5 , 7 5-76.
Banks, H. P . 1 972 . The stratigraphic occurrence of early
land plants. Palaeontology, 1 5 , 365-3 7 7 .
Blackith, R. E . and Reyment, R. A . 1 9 7 1 . Multivariate
Morphometrics. Academic Press, London and New
York, ix + 4 1 2 pp.
Borch, C., von der. 1 965 . The distribution and preli
minary geochemistry of modern carbonate sedi
ments of the Coorong area, South Australia. Geo
chim. Cosmochim. A cta, 29, 78 1-799.
Brooks, H. K. 1 9 5 7 . Chelicerata, Trilobitomorpha,
Crustacea (exclusive of Ostracoda) and Myriapoda.
Annotated bibliography in Mem. geol. Soc. Am. ,
67 , vol. 2 ; Treatise on Marine Ecology and Paleo
ecology: Paleoeco�ogy. Edited by ]. W. Hedgpet:1,
pp. 895-930 .
Caster, K. E . , and Kjellesvig-Waering, E. N. 1964.
Upper Ordovician eurypterids of Ohio. Palaeontogr.
Am. , 4, 3 2 , 297-3 5 8 .
Clarke, ]. M . , and Ruedemann, R. 1 9 1 2 . The Eurypte
rida of New York. Mem. N.Y. St. Mus. nat. Hist. ,
1 4, 628 pp.
DeKay, ]. E. 1 8 2 5 . Observations on a fossil crustaceo·Js
animal of the Order Branchiopoda. Ann. N. Y. Lye.
Nat. Hist., l, 3 7 5-3 7 7 .
Dixoa, W . ]. (ed. ) . 1 970 . BMD biomedical computer
programs. Ur:iv. Cal. Publ. in autom. Computation,
2 , X and 600 pp. (2nd ed . ) .
Eldredge, R. N. 1 972 . Systematics and evolution o f
Phacops rana (Green, 1 8 32 ) and Phacops iowensis
Delo, 1 9 3 5 (Trilobita) from the Middle Devonian of North America. Bull. Am. Mus. nat. Hist., 147 , 45
-1 14 .
Fowler, H. W. 1907 . The King Crab fisheries in Dela
ware Bay, New Jersey. Ann. Rep. St. Mus. ( 1 907 ) ,
1 1 3-1 1 6.
Friedman, G. M. and Sanders, ]. E. 1 957 . Origin and
occurrence of dolostones ; Devs. in Sedimentology:
9/i, Carbonate Rocks. Chap. 6 , 267-348; Edited
by G. V. Chillingar, H. ]. Bissell, and R. W. Fair
bridge, Elsevier, Amsterdam.
Growth and V ariation in Eurypterus remipes DeKay 1 1 3
Goto, S . and Hattori, O . 1929 . Notes on the spawning
habits and growth stages of the Japanese King Crab.
Int. Congr. Zool., Budapest, 2, 1 147-1 1 5 5 .
Gould, S . ] . 1 966. Allometry and size i n ontogeny and
phylogeny. Biol. Rev., 4 1 , 5 87-640.
1967 . Evolutionary patterns in pelycosaurian repti
Ies: a factor-analytic study. Evolution, 2 1 , 3 8 5-40 1 .
1972 . Allometric fallacies and the evolution of
Gryphaea: a new interpretation based on White' s
criterion of geometric similarity. Evolutionary Biol. ,
6, 9 1-1 1 8 .
Gower, ] . C. Some distance properties o f latent root
and vector methods used in multivariate analysis. Biometrika, 5 3 , 325-338 .
Hall, ] . 1 859 . Descriptions and figures of the organic
remains of the lower Helderberg Group and the
Oriskany Sandstone. Bull. geo/. Surv. N. Y., 3 , 5 32
p p .
Hayami, I . and Matsukuma, A . 1 970. Variation o f bi
variate characters from the standpoint of allometry.
Palaeontology, 1 3 , 5 88-605 .
Hunt, A. S. 1967 . Growth, variation and instar deve
lopment of an agnostid trilobite. ]. Paleont. , 4 1 , 203
-208.
Huxley, ] . S . 1 932 . Problems of Relative Growth, Lon
don, MacVeagh, 2 7 6 pp.
Illing, L V., Wells, A. ] . and Taylor, ] . C. M. 1 965 .
Penecontemporary dolomite in the Persian Gulf. In Spee. Publ. Soc. econ . Paleont. Miner. No. 1 3 :
Dolomitization and limestone diagenesis, 89-1 1 1 .
Edited by L C . Pray and R . C . Murray.
Imbrie, ] . 1 9 5 6. Biometrical methods in the study of
invertebrate fossils. Bull. Am. Mus. nal. Hist. , 1 08,
2 1 1-2 5 2 .
Kaneshiro, E . S . 1 9 6 2 . Growth patterns in Eurypterus
remipes remipes DeKay 1 8 2 5 . Unpublished MST
thesis, Division of Sei. Educ. Syracuse Univ., N.Y.,
37 pp.
Kjellesvig-Waering, E. N. 1 9 5 8 . The genera, species
and subspecies of the family Eurypteridae, Burmei
ster, 1 845 . ]. Palaeont. , 36, 1 1 07-1 148 .
1961 . The Silurian Eurypterida of the Welsh Borderland. ]. Paleont. , 3 5 , 7 8 5-8 3 5 .
Kesling, R . V. 1 9 5 1 . The morphology o f ostracod moult
stages . Illinois biol. lvionogr., 2 1 , 324 pp.
1 9 5 2 . Doubling in size of ostracod carapaces in each
moult stage. ]. Paleont., 2 6, 7 72-780.
1 9 5 3 . A slide rule for the determination of instars
in ostracod species. Contr. Mus. Paleont., Univ.
Mich . , 1 1 , 9 7-1 09.
laverock, W. S . 1 927 . On the casting of the shell in
Limulus. Proc. and Trans. biol. Soc . Liverpool, 4 1 ,
1 3-1 6.
leutze, W. P. 1964. The Salina Group. Guidebook, NY
geo/. Soc . Ann. Meet. ( 1 964) , 5 7-65 .
Lockwood, S . 1 8 7 0 . The horse-foot crab. A m . Nat. , 4 ,
2 54-2 74.
Manson, V. and Imbrie, ] . 1 964. FORTRAN program
for factor and vector analysis of geologic data
using an IBM 7090 or 7094/ 1401 computer system.
Comput. Contr. geo/. Surv. Kans. , 1 3 , 1-47 .
Mitchill, S . L 1 8 1 8 . An account of the impressions
of a fish in the rocks of Oneida County, New York.
Am. mon., 3, 2 9 1 .
O'Connell, M. 1 9 1 6. The habitat o f the Eurypterida.
Bull, Soc. nat. Sei. Buffalo, 1 1 , 2 7 7 pp.
Owen, R. 1 8 72 . On the anatomy of the American king
crab, Limulus polyphemus. Trans. Linn. Soc., 28 .
Packard, A. S . 1 8 7 1 . The embryology of Limulus po
lyph emus. Am. Nat. , 4, 498-502.
Palmer, A. R. 1 9 5 7 . Ontogenetic development of two
olenellid trilobites. ]. Paleont., 3 1 , 1 05-128 .
1 962 . Comparative ontogeny of some opisthopa·
rian, gonatoparian and proparian Upper Cambrian
trilobites. ]. Paleont., 36 , 8 7-96.
Przibram, H. 1 9 3 1 . Connecting laws of animal morpho
logy. Four Iectures held at the University of London
March, 1929 . Lond. 1 Jniv. Press, 62 pp.
Reyment, R. A. 1 960. Studies on Upper Cretaceous and
Lower Tertiary Ostracoda: Part I, Senonian and
Maestrichtian Ostracoda. Stockh. Contr. Geo/. , 7,
2 3 8 pp.
1 963 . Srudies on Nigerian Upper Cretaceous and
Lower Tertiary Ostracoda: Part 2 , Danian, Paleocene
and Eocene Ostracoda. Stockh. Contr. Geo/., 1 0,
286 pp.
1 9 7 1 . Introduction to Quantitative Paleoecology. EI
sevier, Amsterdam, 242 pp.
Rickard, L V. 1 962. late Cayugan (Upper Silurian)
and Helderbergian (Lower Devonian) stratigraphy
in New York. Bull. N.Y. St. Mus. , Sei. Serv. , 386 ,
15 7 pp.
1 969. Stratigraphy of the Upper Silurian Salina
Group: New York, Pennsylvania, Ohio, Ontario.
Chart. Series, N.Y. St. Mus., Sei. Serv. , 1 2 , 52 pp.
Robison, R. A. 1 967 . The ontogeny of Bathyriscus
fimbriatus and its bearing on affinities of corynexa
chid trilobites. ]. Paleont., 4 1 , 2 1 3-2 3 1 .
Shuster, C. N . 1 9 5 7 . Xiphosura (with especial reference
to Limulus polyphemus) . Annotated Bibliography in
Mem. geo/. Soc. Am. No. 67 : I , Treatise on Marine
Ecology and Paleoecology (Edited by ]. W. Hedg
peth) , 1 1 7 1- 1 1 7 3 .
1 960. Xiphosura. In Encyclopedia o f Scien ce and
Techn ology. McGraw-Hill, 14, 5 63-5 67 .
Skinner, H . C. W. 1963 . Precipitation of calcian dolo
mites and magnesian calcites in the southeast of
South Australia. Am. ]. Sei. , 2 6 1 , 449-472 .
Sokal, R. R. and Rohlf, F. ]. 1 969. Biometry. W. H.
Freeman, San Francisco, xxi and 776 pp.

1 14 H. E. Andrews, ]. C. Brower, S. ]. Gould, and R. A. Reyment
Størmer, l. 1 9 34 . Merostomata from the Downtonian
sandstone of Ringerike, Norway. Skr. norske Viden
sk.-Akad. , Mat.-Naturv. KL 1 9 3 3 , 1 2 5 pp.
1 9 7 3 . Arthropods from the Lower Devonian (Lower
Emsian) of Alken an der Mose!, Germany. Part
3 , Eurypterida, Hughmilleriidae. Seneken berg. leth . ,
54, 1 1 9-20 5 .
StØrmer, l . and Kjellesvig-Waering, E . N . 1 969. Sexual
dimorphism in Eurypterida. In Sexual Dimorphism
in Fossil Metazoa and Taxonomie Implieations (Ed .
G. E. G. Westermann) . Symposium of Int. Pal.
(Union Prague, 1 968) . E. Schweizerbart-sche Verlagsbuchhandlung, Stuttgart.
Sugden, W. 1 963 . The hydrology of the Persian Gulf
and its significance in respect to evaporite deposi
tion. Am. ]. Sei., 2 6 1 , 741-7 5 5 .
Thompson, D. W . 1 942. O n Gro wth and Form. Mac
Millan, London & New York, 1 1 1 6 pp.
Treesh, M. 1972 . Sedimentology and stratigraphy ot
the Salina Group (Upper Silurian) in east-central
New Yo�k. Guidebook, 44th Ann. Meet. geol. Soe.
N.Y. , B-0-B-22 .
Veldman, D. J . 1 967 . FORTRAN Programming for
the Behavorial Seienees. Holt, Rinehart & Winston,
N.Y., London, 406 pp.
Waterman, T. H. 1 9 5 3 . Xiphosura from Xuong-Ha.
Am. Sei. , 4 1 , 292-302.
Wells, A. ]. 1 962 . Recent dolomite from the Persian
Gulf. Nature, 274-2 7 5 .
Whittington, H. B . 1 9 5 7 . The ontogeny o f trilobites.
Biol. Rev., 32 , 42 1-469.
Printed by Ekenas Tryckeri Ab, Ekenas, Finland March 1 5 th, 1 974

![yp ological - UMasspeople.umass.edu/bhatt/papers/others/deo-sharma.pdf · yp ological V ariation in the Ergativ e Morphology of Indo-Ary an Languages Ash wini Deo [adeo@stanford.edu]](https://img.pdfslide.us/doc/110x75/5e65e585e06131514964bb2d/yp-ological-yp-ological-v-ariation-in-the-ergativ-e-morphology-of-indo-ary-an.jpg)