Embed Size (px)
Citation preview

ASX|SEH
Euroz Investor Conference
March 2017
sinogasenergy.com
Fuelling China’s Clean Energy Future

ASX|SEH
Unique and Compelling Value Proposition
sinogasenergy.com 21. Based on RISC’s base-case development of Reserves, at the wellhead, not including
transportation to city-gate. To be read in conjunction with Resource Statement on slide 24.
World scale, low cost resource• 5.3 tcf gross discovered resources - 2.1 tcf 2P & 3.2 tcf 2C• ~US$1.20 /mcf full-cycle cost1
Well positioned in attractive China gas market• Robust pricing and ready access to infrastructure• Supportive government policy
Full cycle E&P with clear monetisation strategy• Strong production outlook• ODP process well underway
Robust financial position• Self-funding underlying business• Built-in liquidity to fund growth
Track record in China• Established partnerships and relationships• Experienced management team
ASX|SEH
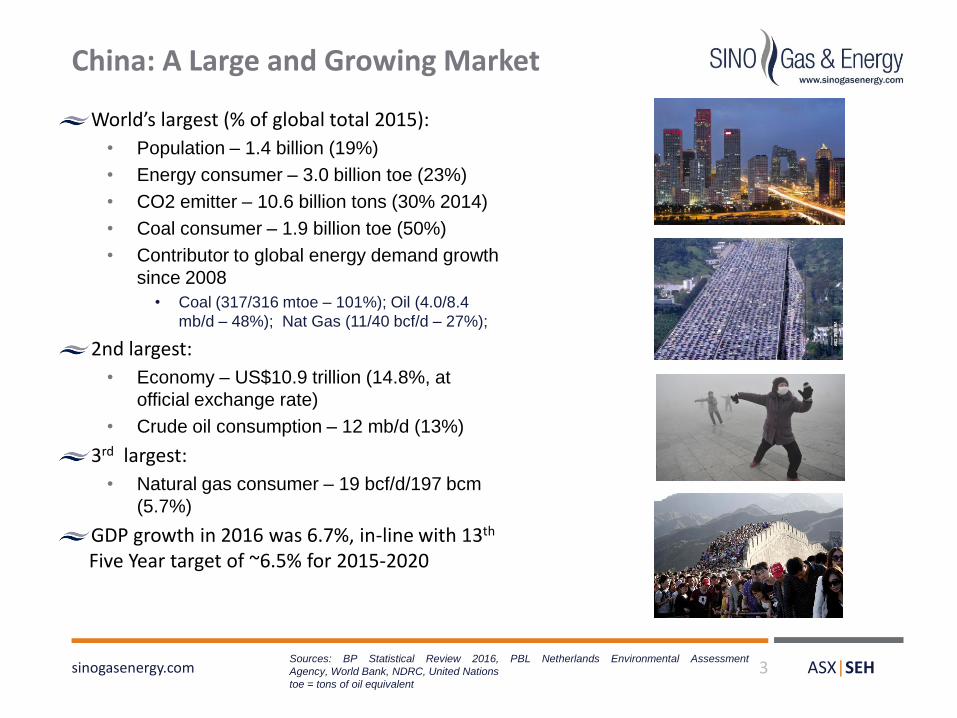
China: A Large and Growing Market
World’s largest (% of global total 2015):
• Population – 1.4 billion (19%)
• Energy consumer – 3.0 billion toe (23%)
• CO2 emitter – 10.6 billion tons (30% 2014)
• Coal consumer – 1.9 billion toe (50%)
• Contributor to global energy demand growth
since 2008
• Coal (317/316 mtoe – 101%); Oil (4.0/8.4
mb/d – 48%); Nat Gas (11/40 bcf/d – 27%);
2nd largest:
• Economy – US$10.9 trillion (14.8%, at
official exchange rate)
• Crude oil consumption – 12 mb/d (13%)
3rd largest:
• Natural gas consumer – 19 bcf/d/197 bcm
(5.7%)
GDP growth in 2016 was 6.7%, in-line with 13th
Five Year target of ~6.5% for 2015-2020
sinogasenergy.com 3Sources: BP Statistical Review 2016, PBL Netherlands Environmental Assessment
Agency, World Bank, NDRC, United Nations
toe = tons of oil equivalent
ASX|SEH
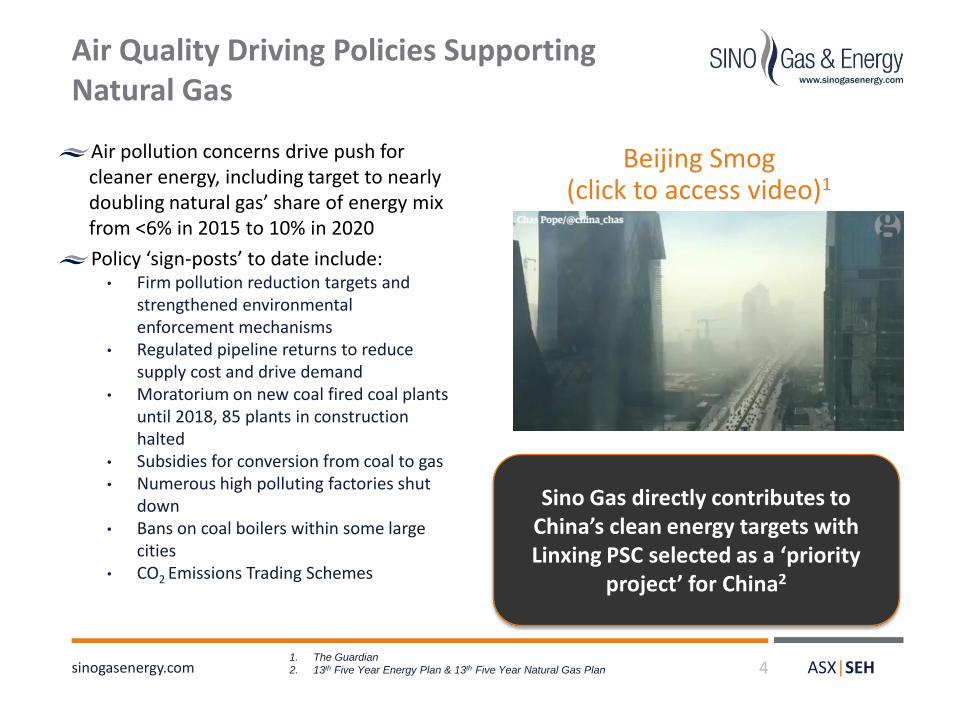
Air Quality Driving Policies Supporting Natural Gas
Beijing Smog (click to access video)1
sinogasenergy.com 41. The Guardian
2. 13th Five Year Energy Plan & 13th Five Year Natural Gas Plan
Air pollution concerns drive push for cleaner energy, including target to nearly doubling natural gas’ share of energy mix from <6% in 2015 to 10% in 2020
Policy ‘sign-posts’ to date include:• Firm pollution reduction targets and
strengthened environmental enforcement mechanisms
• Regulated pipeline returns to reduce supply cost and drive demand
• Moratorium on new coal fired coal plants until 2018, 85 plants in construction halted
• Subsidies for conversion from coal to gas• Numerous high polluting factories shut
down• Bans on coal boilers within some large
cities• CO2 Emissions Trading Schemes
Sino Gas directly contributes to China’s clean energy targets with Linxing PSC selected as a ‘priority
project’ for China2
ASX|SEH
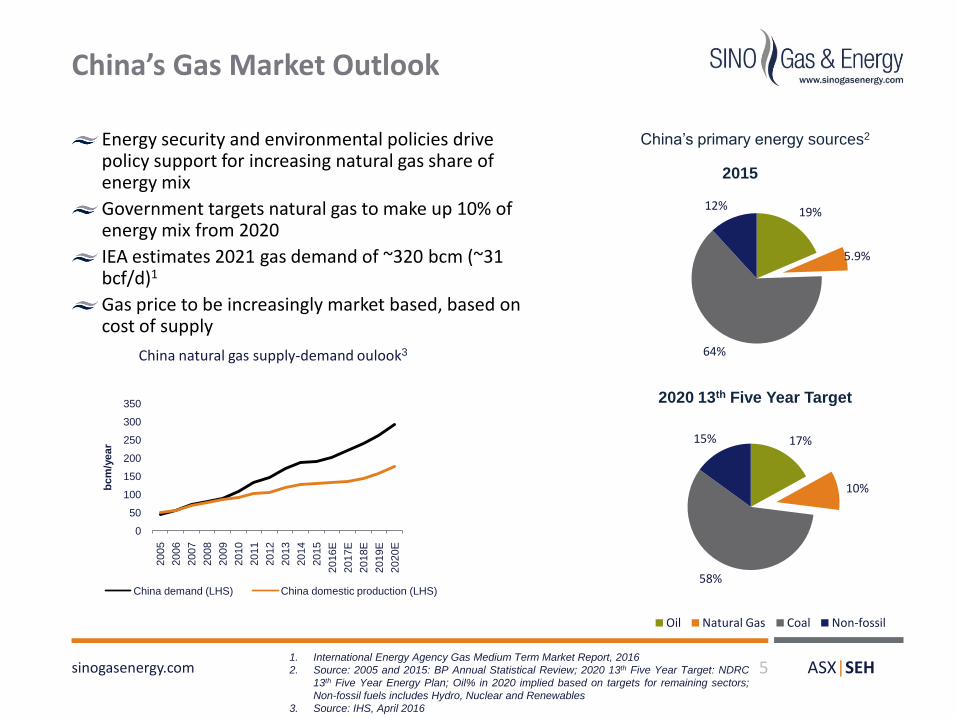
Energy security and environmental policies drive policy support for increasing natural gas share of energy mix
Government targets natural gas to make up 10% of energy mix from 2020
IEA estimates 2021 gas demand of ~320 bcm (~31 bcf/d)1
Gas price to be increasingly market based, based on cost of supply
China’s Gas Market Outlook
sinogasenergy.com 5
0
50
100
150
200
250
300
350
2005
2006
2007
2008
2009
2010
2011
2012
2013
2014
2015
2016E
2017E
2018E
2019E
2020E
bc
m/y
ear
China demand (LHS) China domestic production (LHS)
China natural gas supply-demand oulook3
1. International Energy Agency Gas Medium Term Market Report, 2016
2. Source: 2005 and 2015: BP Annual Statistical Review; 2020 13th Five Year Target: NDRC
13th Five Year Energy Plan; Oil% in 2020 implied based on targets for remaining sectors;
Non-fossil fuels includes Hydro, Nuclear and Renewables
3. Source: IHS, April 2016
17%
10%
58%
15%
19%
5.9%
64%
12%
2015
2020 13th Five Year Target
China’s primary energy sources2
Oil Natural Gas Coal Non-fossil

ASX|SEH
Operating in China: A Well Established & Favourable Regime
sinogasenergy.com 6
China ranks favorably on government
take, Profit/Investment ratio1
0%
20%
40%
60%
80%
100%
0.0x
0.5x
1.0x
1.5x
2.0x
P/I Ratio (LHS) Overall Government take (RHS)
World’s 5th/6th largest oil/gas
producer
>20 international private upstream
companies
Globally attractive
government take, profitability
Long-term government
plans and policies
Well developed, competitive
service industry
ChAFTA2
highlights importance of
trade relationship
1. Source: Goldman Sachs Global Investment Research, May 2015; P/I ratio defined as NPV10
generated per dollar of invested capital
2. China-Australia Free Trade Agreement
ASX|SEH
Company Snapshot
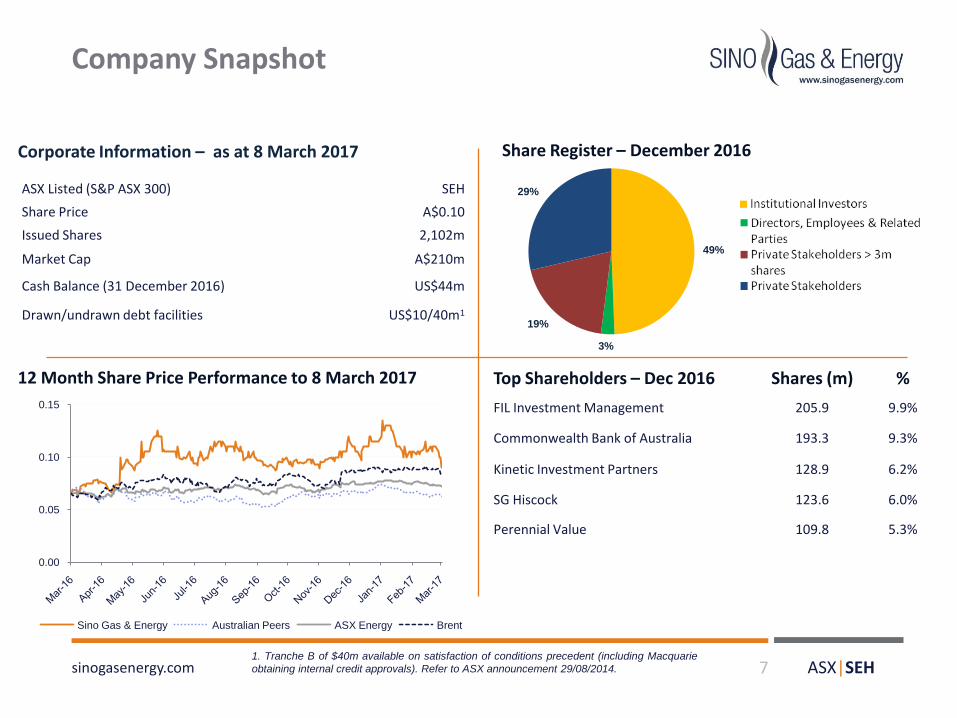
sinogasenergy.com 7
ASX Listed (S&P ASX 300) SEH
Share Price A$0.10
Issued Shares 2,102m
Market Cap A$210m
Cash Balance (31 December 2016) US$44m
Drawn/undrawn debt facilities US$10/40m1
12 Month Share Price Performance to 8 March 2017
Corporate Information – as at 8 March 2017 Share Register – December 2016
Top Shareholders – Dec 2016 Shares (m) %
FIL Investment Management 205.9 9.9%
Commonwealth Bank of Australia 193.3 9.3%
Kinetic Investment Partners 128.9 6.2%
SG Hiscock 123.6 6.0%
Perennial Value 109.8 5.3%
1. Tranche B of $40m available on satisfaction of conditions precedent (including Macquarie
obtaining internal credit approvals). Refer to ASX announcement 29/08/2014.
49%
3%
19%
29%
0.00
0.05
0.10
0.15
Sino Gas & Energy Australian Peers ASX Energy Brent
ASX|SEH
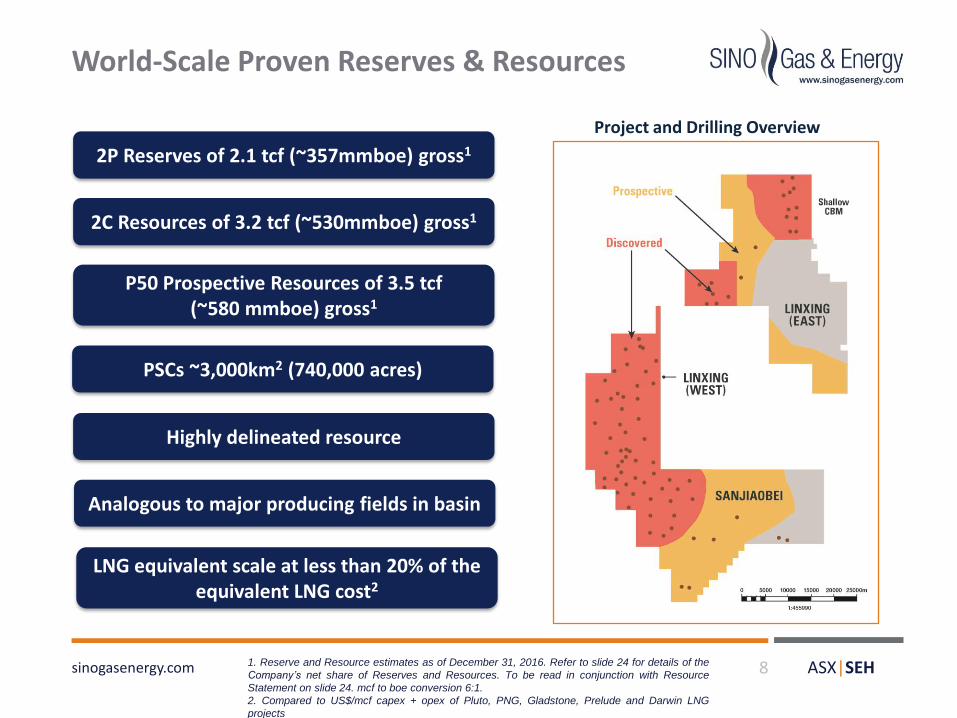
World-Scale Proven Reserves & Resources
sinogasenergy.com 8
Project and Drilling Overview
2P Reserves of 2.1 tcf (~357mmboe) gross1
P50 Prospective Resources of 3.5 tcf(~580 mmboe) gross1
2C Resources of 3.2 tcf (~530mmboe) gross1
PSCs ~3,000km2 (740,000 acres)
Highly delineated resource
Analogous to major producing fields in basin
1. Reserve and Resource estimates as of December 31, 2016. Refer to slide 24 for details of the
Company’s net share of Reserves and Resources. To be read in conjunction with Resource
Statement on slide 24. mcf to boe conversion 6:1.
2. Compared to US$/mcf capex + opex of Pluto, PNG, Gladstone, Prelude and Darwin LNG
projects
LNG equivalent scale at less than 20% of the equivalent LNG cost2
ASX|SEH
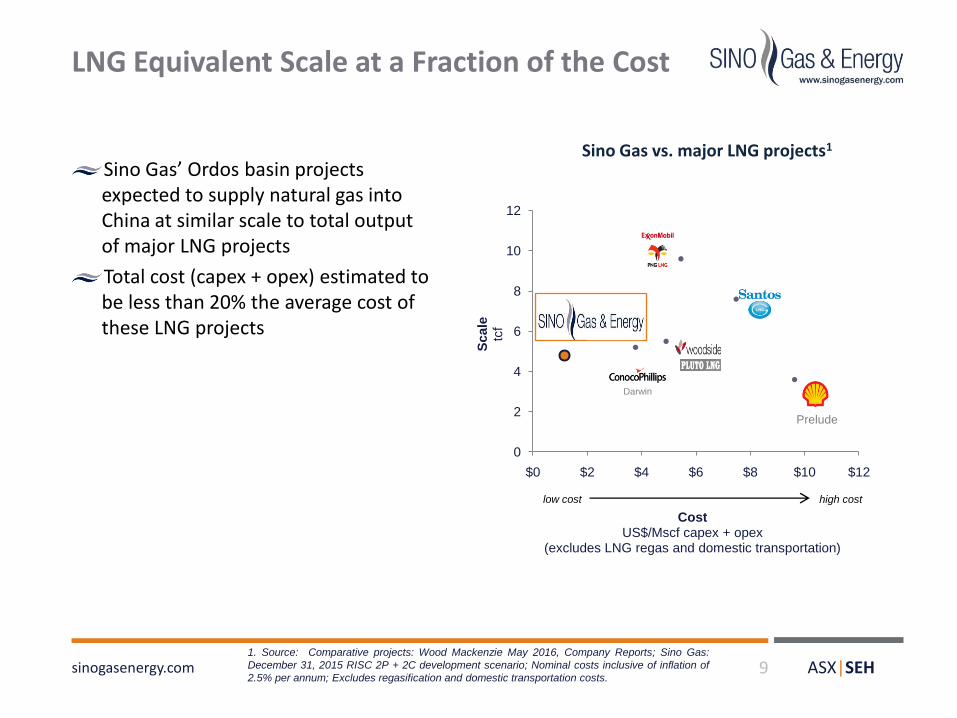
LNG Equivalent Scale at a Fraction of the Cost
sinogasenergy.com 9
Sino Gas’ Ordos basin projects expected to supply natural gas into China at similar scale to total output of major LNG projects
Total cost (capex + opex) estimated to be less than 20% the average cost of these LNG projects
Sino Gas vs. major LNG projects1
1. Source: Comparative projects: Wood Mackenzie May 2016, Company Reports; Sino Gas:
December 31, 2015 RISC 2P + 2C development scenario; Nominal costs inclusive of inflation of
2.5% per annum; Excludes regasification and domestic transportation costs.
0
2
4
6
8
10
12
$0 $2 $4 $6 $8 $10 $12S
cale
tc
f
CostUS$/Mscf capex + opex
(excludes LNG regas and domestic transportation)
Prelude
Darwin
low cost high cost

ASX|SEH
Low Cost Competitive Advantage
Significant cost advantage –estimated wellhead (excluding transportation) capex + opex of ~US$1.20/mcf2
Low cost drivers:• Simple vertical well
development, limited fraccing
• Moderate reservoir depths (~1,200-2,000m)
• Stacked reservoirs drive high per well ultimate recoveries
• High quality gas (~95% methane)
• Proximity to pipeline infrastructure
• Well developed service sector
Imports, CBM and shale expected to remain at the high end of the cost curve
sinogasenergy.com 101. Source: IHS, China’s Natural Gas Supply and Cost Outlooks, August 2016, assumes oil price
in 2020 of US$72.60/bbl, inclusive of transportation to city-gate
2. Based on RISC’s base-case development of Reserves, Contingent & Prospective Resources
at the wellhead, not including transportation to city-gate. To be read in conjunction with Resource
Statement on slide 24.
CB
M
LN
G
Shale
Conven-
tional
Ord
os
Basin
Sino Gas
Pip
elin
e
import
s
Weighted average city-gate price (current)
2016 total
demand
China 2020E City-Gate Supply Cost Curve
(including transportation)1

ASX|SEH
Low Risk Reservoir, Proven Deliverability
~1,000m gross gas bearing section
Stacked reservoir units – up to 16 sands per well
Analogous to other major producing fields in Ordos Basin –Changbei (Shell), Sulige (CNPC), South Sulige (Total)
Technology application driving year over year productivity improvements
• Average pilot well brought onstream in 2016 tested ~1 MMScf/d
• 2016 exploration well on Linxing (East) highest vertical test on PSCs to date (2.7 MMscf/d)
sinogasenergy.com 11
0.0
0.5
1.0
1.5
2.0
2.5
3.0
3.5
Upper Zone
Mid-Upper Zone
Middle Zone
Mid-Lower Zone
Lower ZoneM
illio
n c
ub
ic f
eet
per
day
(MM
scf)
Average Max
1. Test data standardised to standard operating pressure of 200 PSI. As of December 31, 2016
ASX|SEH
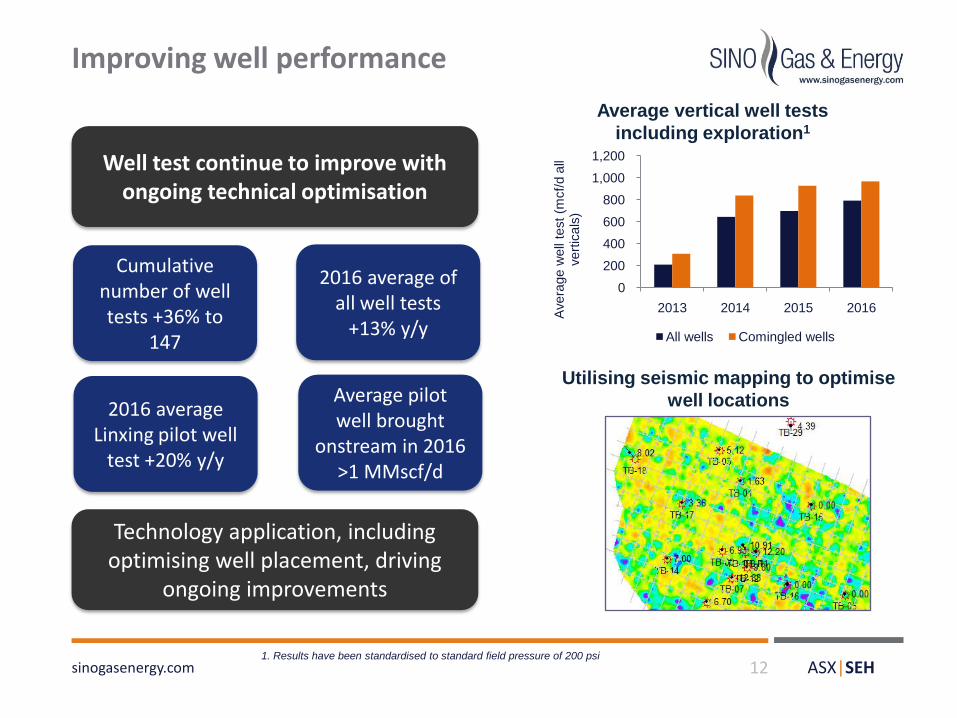
Improving well performance
sinogasenergy.com 12
Average vertical well tests
including exploration1
Utilising seismic mapping to optimise
well locations
Cumulative number of well tests +36% to
147
2016 average of all well tests
+13% y/y
2016 average Linxing pilot well
test +20% y/y
Average pilot well brought
onstream in 2016 >1 MMscf/d
Well test continue to improve with ongoing technical optimisation
0
200
400
600
800
1,000
1,200
2013 2014 2015 2016
Avera
ge w
ell
test
(mcf/
d a
ll vert
icals
)
All wells Comingled wells
Technology application, including optimising well placement, driving
ongoing improvements
1. Results have been standardised to standard field pressure of 200 psi
ASX|SEH
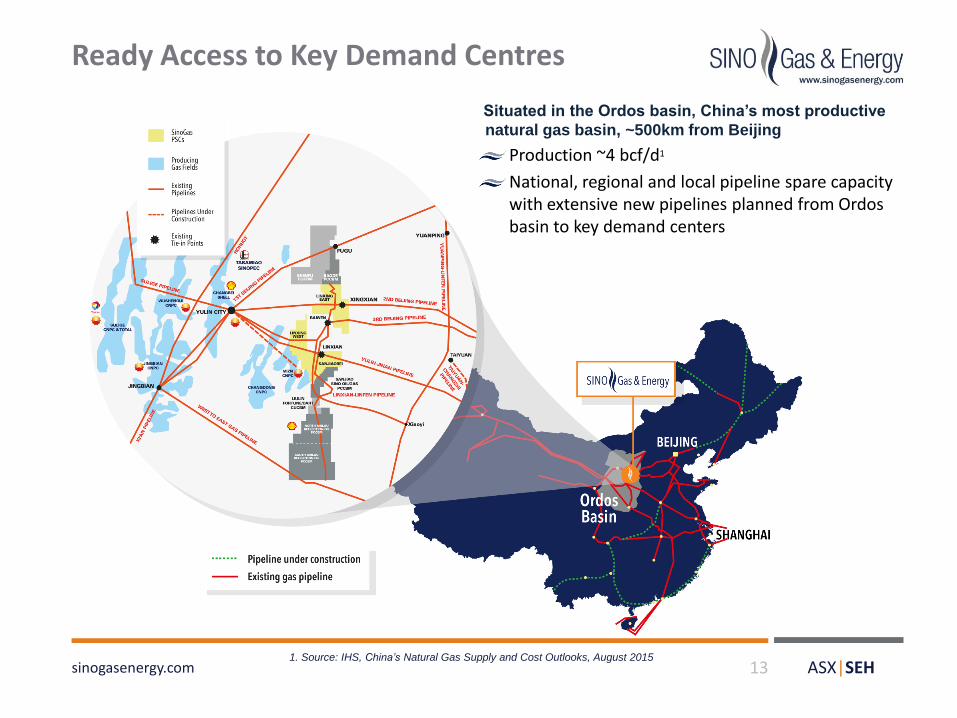
Ready Access to Key Demand Centres
sinogasenergy.com 131. Source: IHS, China’s Natural Gas Supply and Cost Outlooks, August 2015
Situated in the Ordos basin, China’s most productive
natural gas basin, ~500km from Beijing
Production ~4 bcf/d1
National, regional and local pipeline spare capacity with extensive new pipelines planned from Ordos basin to key demand centers

ASX|SEH
2017 Work Program
sinogasenergy.com 14
Key Objectives: Generate cash flow, drive future production, complete ODP1
2017 installed capacity
~45 MMScf/d
Complete ODP processes
Stable and reliable production and
revenue
Selective exploration
Well funded to complete program
30-35 wells planned
Full year average production est. 18-23 MMscf/d
2017 Work Program Key Activities
1. For additional details, refer to ASX Announcement released on 24January 2017
ASX|SEH
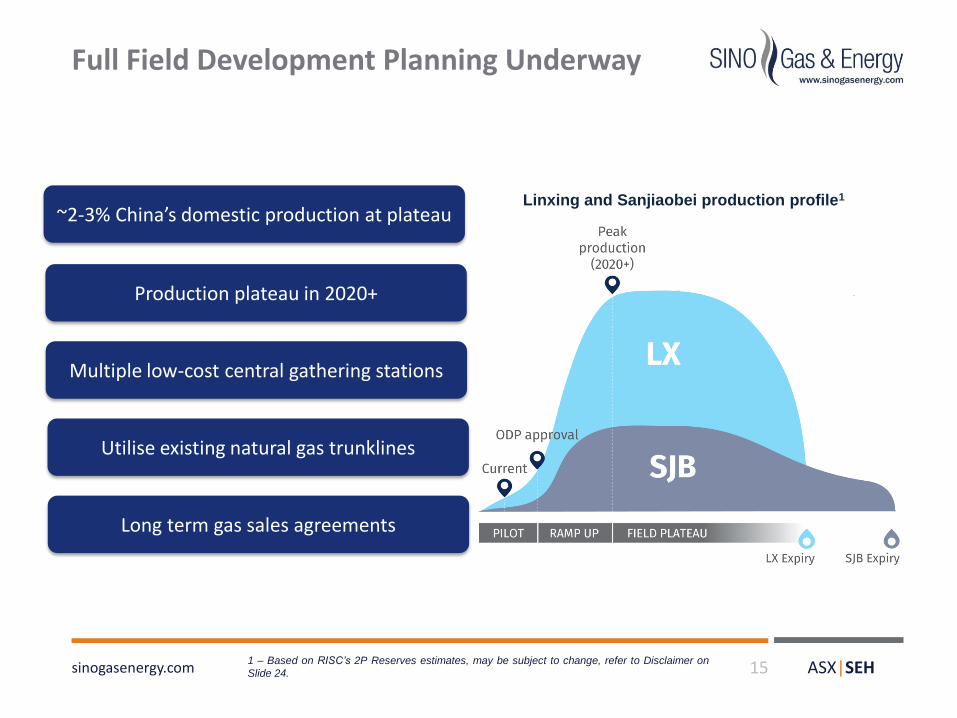
Full Field Development Planning Underway
sinogasenergy.com 151 – Based on RISC’s 2P Reserves estimates, may be subject to change, refer to Disclaimer on
Slide 24.
Linxing and Sanjiaobei production profile1
~2-3% China’s domestic production at plateau
Production plateau in 2020+
Multiple low-cost central gathering stations
Utilise existing natural gas trunklines
Long term gas sales agreements

ASX|SEH
Pilot production
Compile geological and reservoir engineering
Optimise according to final CRR
SOE audit and revise
Full field development plan
Economic analysis
SGE review and revise
Submit ODP to SOE
Environmental Impact Assessment
JMC review and revise
SOE audit
NDRC ODP Approval
Full field development commences
Overall Development Plan Process
sinogasenergy.com 16
LegendCompleted/in progressYet to be completed
Strategic 2017 objective is completion of ODP processes
ODP progressing in close cooperation with SOE partners
Five Year Energy Plan provides impetus to accelerate ODP
Pre-ODP pilot production provides early cash flow
ASX|SEH
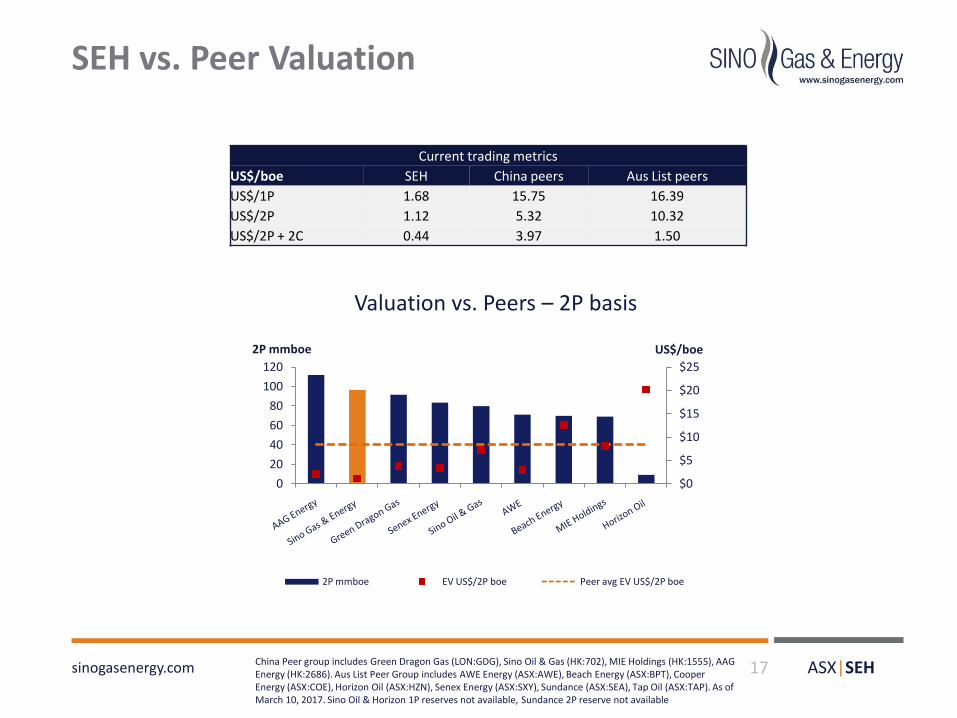
SEH vs. Peer Valuation
Current trading metrics
US$/boe SEH China peers Aus List peers
US$/1P 1.68 15.75 16.39
US$/2P 1.12 5.32 10.32
US$/2P + 2C 0.44 3.97 1.50
China Peer group includes Green Dragon Gas (LON:GDG), Sino Oil & Gas (HK:702), MIE Holdings (HK:1555), AAG Energy (HK:2686). Aus List Peer Group includes AWE Energy (ASX:AWE), Beach Energy (ASX:BPT), Cooper Energy (ASX:COE), Horizon Oil (ASX:HZN), Senex Energy (ASX:SXY), Sundance (ASX:SEA), Tap Oil (ASX:TAP). As of March 10, 2017. Sino Oil & Horizon 1P reserves not available, Sundance 2P reserve not available
Valuation vs. Peers – 2P basis
17sinogasenergy.com
$0
$5
$10
$15
$20
$25
0
20
40
60
80
100
120
US$/boe2P mmboe
2P mmboe EV US$/2P boe Peer avg EV US$/2P boe

ASX|SEH
2017 Priorities
sinogasenergy.com 18
Operational
Technical
• Secure additional gas sales agreements
• Receive Sanjiaobei gas sales proceeds
• Submission of the first ODP in 2017 with approval in
late 2017/early 2018
• Target average production 18-23 MMscf/d
• Further well productivity and cost optimisation
• Install new CGS on Linxing (West) North and tie-in
Linxing (East) exploration wells to third party facility
• Maintain safety record
Announced increase in reserves & resources
• Prepare full field development plan
• Targeted additional exploration
• Prudently manage activity and spend to maintain strong
liquidity
Key Objectives• Maximise production, revenue, technical data collection
• Install additional processing capacity
• Complete ODP processes
Regulatory
Commercial
Financial
ASX|SEH
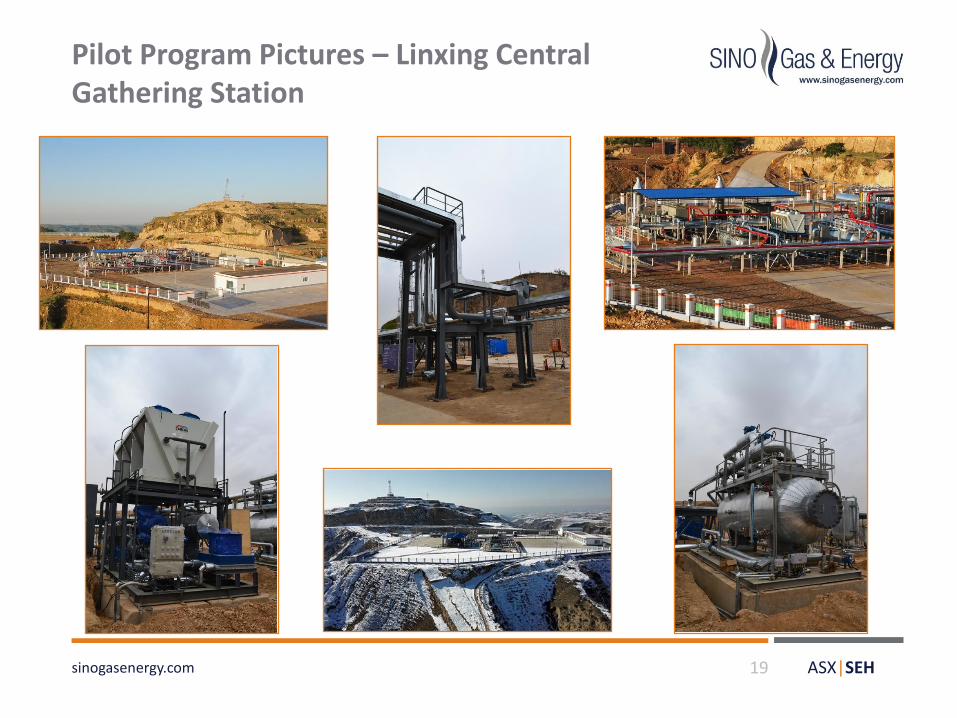
Pilot Program Pictures – Linxing Central Gathering Station
sinogasenergy.com 19
ASX|SEH
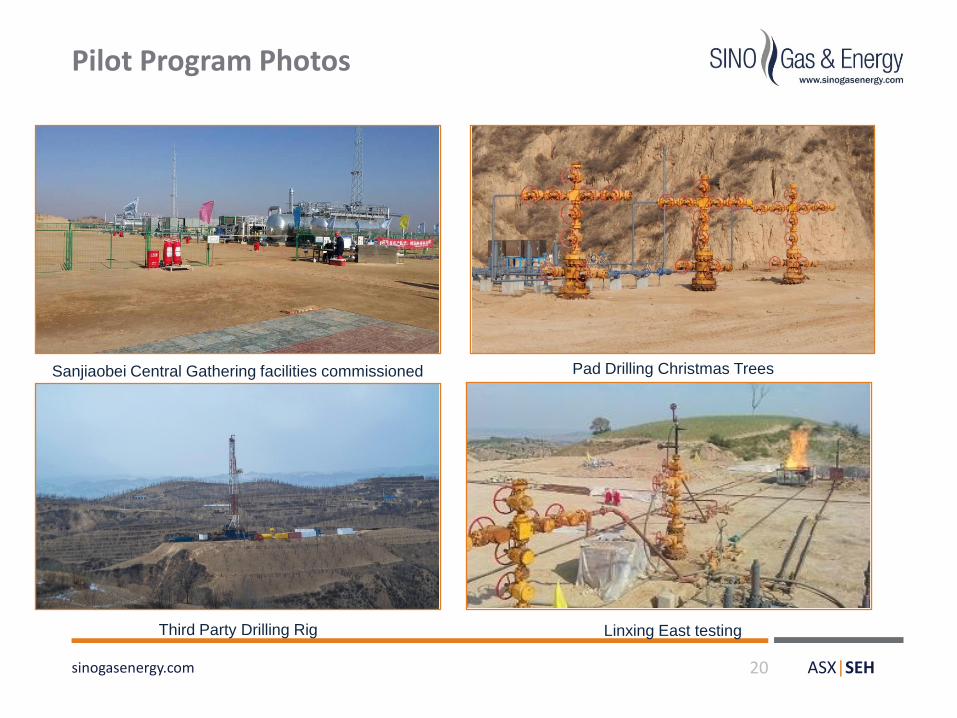
Pilot Program Photos
sinogasenergy.com 20
Sanjiaobei Central Gathering facilities commissioned
Linxing East testing
Pad Drilling Christmas Trees
Third Party Drilling Rig

ASX|SEH
Thank You
Investor Relations+86 10 8458 30011300 746 642 (local call within Australia)[email protected]
sinogasenergy.com

ASX|SEH
Disclaimer
Sino Gas & Energy Holdings Limited (ASX:SEH, “Sino Gas”, “the Company”) holds a 49% interest in Sino Gas & Energy Limited (“SGE”) through a strategic partnership with China New Energy Mining Limited (“CNEML”) to develop two blocks held under Production Sharing Contracts (PSCs) with CNPC and CUCBM. SGE has been established in Beijing since 2005 and is the operator of the Sanjiaobei and Linxing PSCs in Shanxi province.
Certain statements included in this release constitute forward looking information. This information is based upon a number of estimates and assumptions made on a reasonable basis by the Company in light of its experience, current conditions and expectations of future developments, as well as other factors that the Company believes are appropriate in the circumstances. While these estimates and assumptions are considered reasonable, they are inherently subject to business, economic, competitive, political and social uncertainties and contingencies.
Many factors could cause the Company’s actual results to differ materially from those expressed or implied in any forward-looking information provided by the Company, or on behalf of, the Company. Such factors include, among other things, risks relating to additional funding requirements, gas prices, exploration, acquisition, development and operating risks, competition, production risks, regulatory restrictions, including environmental regulation and liability and potentialtitle disputes. Forward-looking information is no guarantee of future performance and, accordingly, investors are cautioned not to put undue reliance on forward-looking information due to the inherent uncertainty therein. Forward-looking information is made as at the date of this release and the Company disclaims any intent or obligation to update publicly such forward-looking information, whether as a result of new information, future events or results or otherwise.
The purpose of this presentation is to provide general information about the Company. No representation or warranty, express or implied, is made by the Company that the material contained in this presentation will be achieved or prove to be correct. Except for statutory liability which cannot be excluded, each of the Company, its officers, employees and advisers expressly disclaims any responsibility for the accuracy or completeness of the material contained in this presentation and excludes all liability whatsoever (including in negligence) for any loss or damage which may be suffered by any person as a consequence of any information in this presentation or any error or omission therefrom.
This presentation should be read in conjunction with the Annual Financial Report as at 31 December 2015, the half year financial statements together with any ASX announcements made by the Company in accordance with its continuous disclosure obligations arising under the Corporations Act 2001 (Cth).
sinogasenergy.com 22

ASX|SEH
The statements of resources in this release have been independently determined to Society of Petroleum Engineers (SPE) Petroleum Resource
Management Systems (PRMS) standards by internationally recognised oil and gas consultants RISC (announced 6 March 2017) using probabilistic and
deterministic estimation methods. These statements were not prepared to comply with the China Petroleum Reserves Office (PRO-2005) standards or the
U.S. Securities and Exchange Commission regulations and have not been verified by SGE’s PSC partners CNPC and CUCBM.
All resource figures quoted are unrisked mid-case unless otherwise noted. Sino Gas’ attributable net Reserves & Resources assumes PSC partner back-in
upon ODP approval (i.e. CUCBM take their entitlement of 30% interest in Linxing PSC and CNPC take their entitlement to 51% in the Sanjiaobei PSC) and
CBM Energy’s option to acquire an interest of 5.25% in the Linxing PSC (by paying 7.5% of back costs) is exercised. Reserves & Resources are net of 4%
in-field fuel for field compression and field operations. Reference point is defined to be at the field gate. No material changes have occurred in the
assumptions and subsequent work program exploration and appraisal results have been in line with expectations.
Information on the Resources in this release is based on an independent evaluation conducted by RISC Operations Pty Ltd (RISC), a leading independent
petroleum advisory firm. The evaluation was carried out by RISC under the supervision of Mr Peter Stephenson, RISC Partner, in accordance with the SPE-
PRMS guidelines. Mr Stephenson has a M.Eng in Petroleum Engineering and 30 years of experience in the oil and gas industry. Mr. Stephenson is a
member of the SPE and MIChemE and is a qualified petroleum reserves and resources evaluator (QPPRE) as defined by ASX listing rules. Mr Stephenson
consents to the form and context in which the estimated reserves and resources and the supporting information are presented in this announcement. RISC is
independent with respect to Sino Gas in accordance with the Valmin Code, ASX listing rules and ASIC requirements.
Resources Statement
sinogasenergy.com 23
Sino Gas’ Attributable Net Reserves & Resources as at 31 December 2016
SEH Attributable Net Reserves & Resources
1P Reserves
(Bcf)
2P Reserves
(Bcf)
3PReserves
(Bcf)
2C Contingent Resources
(bcf)
P50Prospective Resources
(bcf)1
31 December 2016
(Announced 6 March 2017)385 579 778 899 821
31 December 2015
(Announced 10 March 2016)362 552 751 814 733
Total 2016 Change (+/-%) +5% (2P) +10% +12%
Gross Project
31 December 20161,377 2,147 2,951 3,171 3,499
Note 1. The estimated quantities of petroleum that may potentially be recovered by the application of future development project(s) relate to undiscovered accumulations. These
estimates have both an associated risk of discovery and a risk of development. Further exploration and appraisal is required to determine the existence of a significant quantity of
potentially moveable hydrocarbons. The probability of development of the contingent area is estimated to be 90%, with the additional probability of geological success assigned to
prospective resources estimated to be 60-80%.