Embed Size (px)
Citation preview
8/9/2019 Eurostat - Statistics in focus 89/2008 - Short-term business statistics: recent and future euro area countries
http://slidepdf.com/reader/full/eurostat-statistics-in-focus-892008-short-term-business-statistics-recent 1/8
Statist ics in focusIndustry, trade and services
Author: Isabelle REMOND-TIEDREZ89/2008
Short-term business statistics:recent and future euro area countries
This publication focuses on short-termbusiness statistics in the three countries thatmost recently joined the euro area, Slovenia,Cyprus and Malta, as well as Slovakia whichwill join in January 2009. It presents output andemployment from 2000 to 2008, as well as ashorter series for industrial prices. Data with amore detailed activity analysis is available onEurostat's website, as is data for the other EUand euro area Member States.
All four countries have generally recordedfaster output and employment growth than theeuro area average. Slovakia and to a lesserextent Slovenia have recorded particularlystrong industrial output growth in recent years.Across all of the services activities covered by
short-term business statistics, turnover growthsince 2000 has generally been stronger inCyprus, Slovenia and Slovakia than in the euroarea as a whole, with a more mixeddevelopment in Malta.
In January 2007 the euro area expanded to includeSlovenia, the first country from among the MemberStates that joined the EU in 2004. In January 2008Cyprus and Malta followed this path, bringing theeuro area to 15 countries (EA-15). Prior to joiningthe euro area a country's currency must be in theExchange Rate Mechanism for at least two years:currently the ERM includes the currencies ofDenmark, the Baltic Member States and Slovakia.In July 2008, the exchange rate between theSlovak Koruna and the euro was fixed andSlovakia will join the euro area in January 2009.
Slovenia, Cyprus and Malta collectively accountedfor 0.7 % of the euro area’s value added (2005data); their share of employment was higher(1.1 %). Slovakia's value added was equivalent to
0.4 % of the euro area total and its employmentequivalent to 1.1 %. All of these countries showsome specialisations relative to the euro area:Slovenia and Slovakia in manufacturing as well aselectricity, gas and water supply; Cyprus inconstruction and most services activities; Malta inhotels and restaurants as well as transport andcommunications.
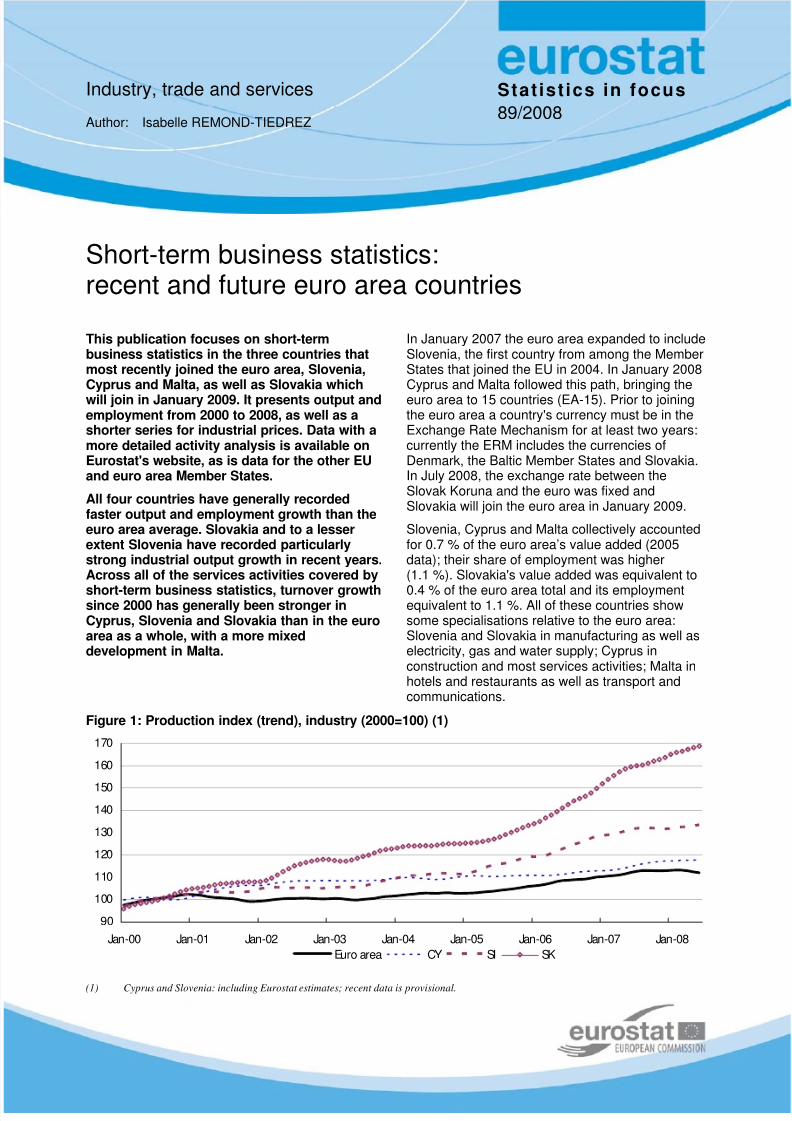
Figure 1: Production index (trend), industry (2000=100) (1)
90
100
110
120
130
140
150
160
170
Jan-00 Jan-01 Jan-02 Jan-03 Jan-04 Jan-05 Jan-06 Jan-07 Jan-08
Euro area CY SI SK
(1) Cyprus and Slovenia: including Eurostat estimates; recent data is provisional.
8/9/2019 Eurostat - Statistics in focus 89/2008 - Short-term business statistics: recent and future euro area countries
http://slidepdf.com/reader/full/eurostat-statistics-in-focus-892008-short-term-business-statistics-recent 2/8
2 89/2008 — Statistics in focus
Industry
All four of the countries presented here arerelatively small, and their economies can be easilyinfluenced by external shocks; some of the timeseries may therefore be quite volatile.
Figure 1 shows the development in industrialoutput since the beginning of 2000. Output hasgrown particularly strongly in Slovakia, with highgrowth during 2002, and a further acceleration in
the middle of 2005. Slovenia recorded anacceleration in industrial output growth early in2005 although output stabilised during the mostrecent 12 month period. Output in Cyprus grew
moderately throughout the period, avoiding theoverall euro area downturn during 2001, andshowing relatively stable output in the first half of2008 compared with the latest downturn recordedin the euro area as a whole.
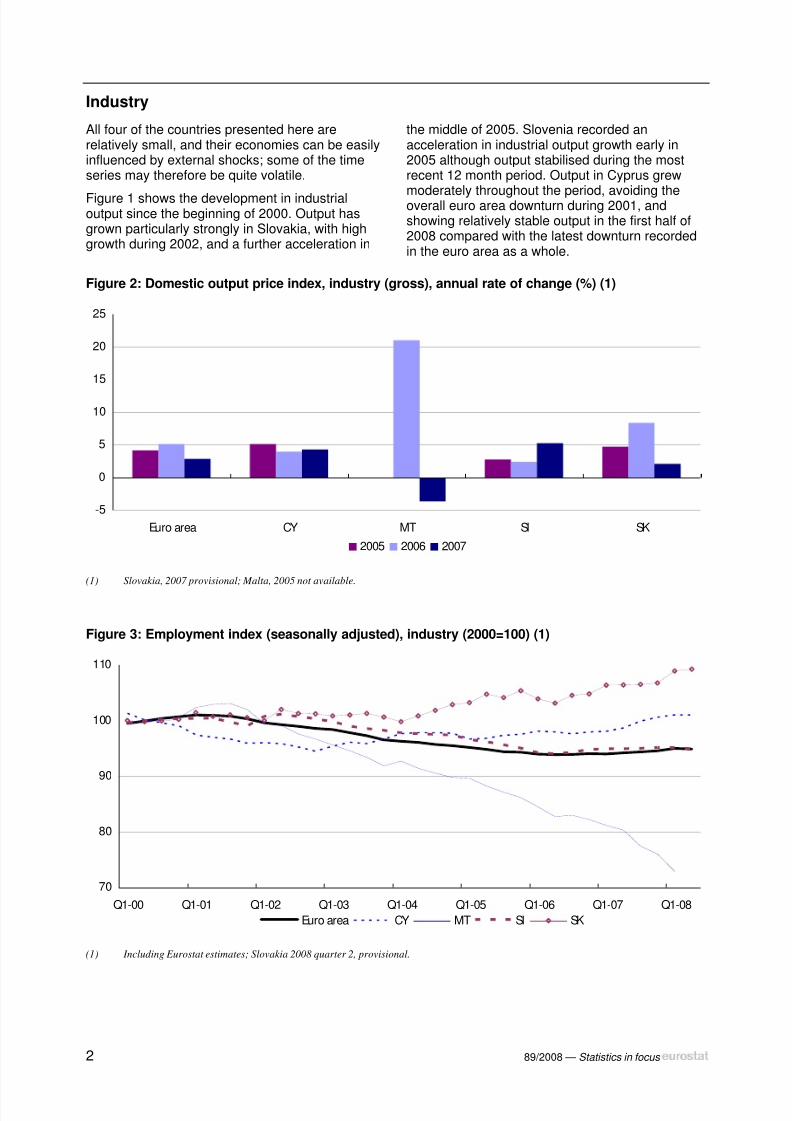
Figure 2: Domestic output price index, industry (gross), annual rate of change (%) (1)
-5
0
5
10
15
20
25
Euro area CY MT SI SK
2005 2006 2007 (1) Slovakia, 2007 provisional; Malta, 2005 not available.
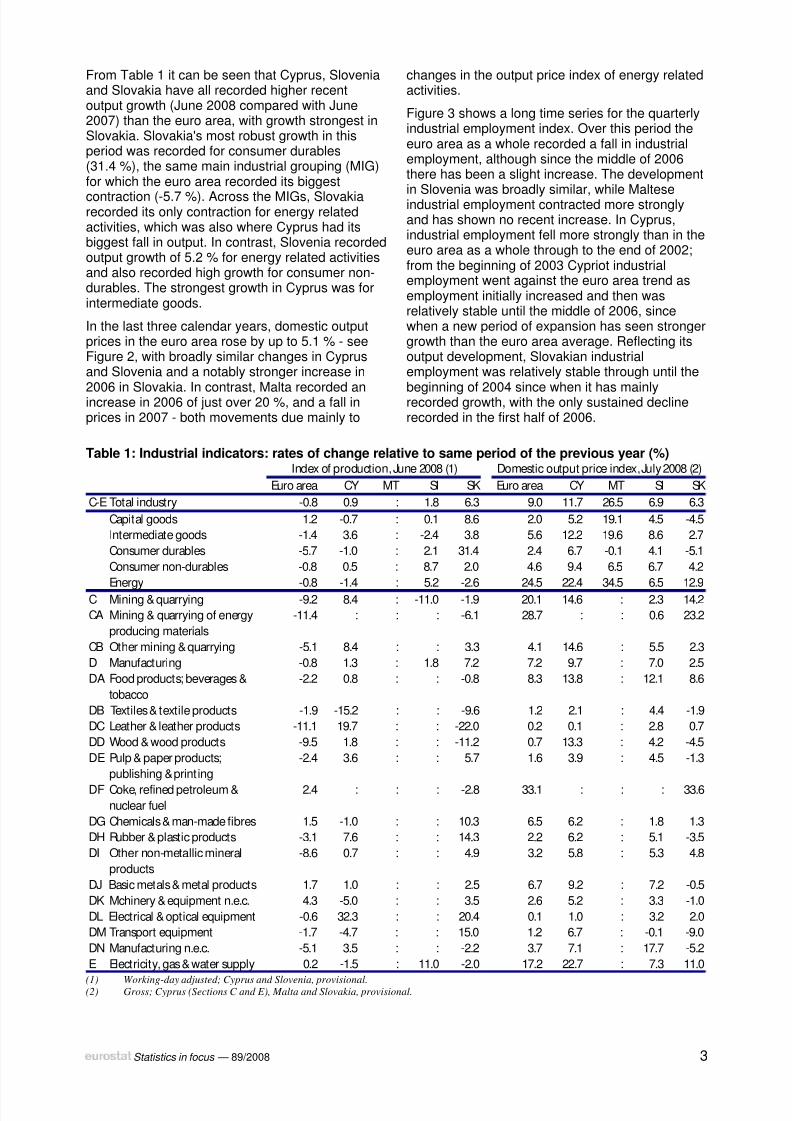
Figure 3: Employment index (seasonally adjusted), industry (2000=100) (1)
70
80
90
100
110
Q1-00 Q1-01 Q1-02 Q1-03 Q1-04 Q1-05 Q1-06 Q1-07 Q1-08
Euro area CY MT SI SK (1) Including Eurostat estimates; Slovakia 2008 quarter 2, provisional.
8/9/2019 Eurostat - Statistics in focus 89/2008 - Short-term business statistics: recent and future euro area countries
http://slidepdf.com/reader/full/eurostat-statistics-in-focus-892008-short-term-business-statistics-recent 3/8
Statistics in focus — 89/2008 3
From Table 1 it can be seen that Cyprus, Sloveniaand Slovakia have all recorded higher recentoutput growth (June 2008 compared with June2007) than the euro area, with growth strongest inSlovakia. Slovakia's most robust growth in thisperiod was recorded for consumer durables(31.4 %), the same main industrial grouping (MIG)for which the euro area recorded its biggest
contraction (-5.7 %). Across the MIGs, Slovakiarecorded its only contraction for energy relatedactivities, which was also where Cyprus had itsbiggest fall in output. In contrast, Slovenia recordedoutput growth of 5.2 % for energy related activitiesand also recorded high growth for consumer non-durables. The strongest growth in Cyprus was forintermediate goods.
In the last three calendar years, domestic outputprices in the euro area rose by up to 5.1 % - seeFigure 2, with broadly similar changes in Cyprusand Slovenia and a notably stronger increase in
2006 in Slovakia. In contrast, Malta recorded anincrease in 2006 of just over 20 %, and a fall inprices in 2007 - both movements due mainly to
changes in the output price index of energy relatedactivities.
Figure 3 shows a long time series for the quarterlyindustrial employment index. Over this period theeuro area as a whole recorded a fall in industrialemployment, although since the middle of 2006there has been a slight increase. The development
in Slovenia was broadly similar, while Malteseindustrial employment contracted more stronglyand has shown no recent increase. In Cyprus,industrial employment fell more strongly than in theeuro area as a whole through to the end of 2002;from the beginning of 2003 Cypriot industrialemployment went against the euro area trend asemployment initially increased and then wasrelatively stable until the middle of 2006, sincewhen a new period of expansion has seen strongergrowth than the euro area average. Reflecting itsoutput development, Slovakian industrialemployment was relatively stable through until the
beginning of 2004 since when it has mainlyrecorded growth, with the only sustained declinerecorded in the first half of 2006.
Table 1: Industrial indicators: rates of change relative to same period of the previous year (%)
Euro area CY MT SI SK Euro area CY MT SI SK
C-E Total industry -0.8 0.9 : 1.8 6.3 9.0 11.7 26.5 6.9 6.3
Capital goods 1.2 -0.7 : 0.1 8.6 2.0 5.2 19.1 4.5 -4.5
Intermediate goods -1.4 3.6 : -2.4 3.8 5.6 12.2 19.6 8.6 2.7
Consumer durables -5.7 -1.0 : 2.1 31.4 2.4 6.7 -0.1 4.1 -5.1
Consumer non-durables -0.8 0.5 : 8.7 2.0 4.6 9.4 6.5 6.7 4.2
Energy -0.8 -1.4 : 5.2 -2.6 24.5 22.4 34.5 6.5 12.9
C Mining & quarrying -9.2 8.4 : -11.0 -1.9 20.1 14.6 : 2.3 14.2
CA Mining & quarrying of energy
producing materials
-11.4 : : : -6.1 28.7 : : 0.6 23.2
CB Other mining & quarrying -5.1 8.4 : : 3.3 4.1 14.6 : 5.5 2.3
D Manufacturing -0.8 1.3 : 1.8 7.2 7.2 9.7 : 7.0 2.5
DA Food products; beverages &
tobacco
-2.2 0.8 : : -0.8 8.3 13.8 : 12.1 8.6
DB Textiles & textile products -1.9 -15.2 : : -9.6 1.2 2.1 : 4.4 -1.9
DC Leather & leather products -11.1 19.7 : : -22.0 0.2 0.1 : 2.8 0.7
DD Wood & wood products -9.5 1.8 : : -11.2 0.7 13.3 : 4.2 -4.5
DE Pulp & paper products;
publishing & printing
-2.4 3.6 : : 5.7 1.6 3.9 : 4.5 -1.3
DF Coke, refined petroleum &
nuclear fuel
2.4 : : : -2.8 33.1 : : : 33.6
DG Chemicals & man-made fibres 1.5 -1.0 : : 10.3 6.5 6.2 : 1.8 1.3
DH Rubber & plastic products -3.1 7.6 : : 14.3 2.2 6.2 : 5.1 -3.5
DI Other non-metallic mineral
products
-8.6 0.7 : : 4.9 3.2 5.8 : 5.3 4.8
DJ Basic metals & metal products 1.7 1.0 : : 2.5 6.7 9.2 : 7.2 -0.5
DK Mchinery & equipment n.e.c. 4.3 -5.0 : : 3.5 2.6 5.2 : 3.3 -1.0
DL Electrical & optical equipment -0.6 32.3 : : 20.4 0.1 1.0 : 3.2 2.0
DM Transport equipment -1.7 -4.7 : : 15.0 1.2 6.7 : -0.1 -9.0
DN Manufacturing n.e.c. -5.1 3.5 : : -2.2 3.7 7.1 : 17.7 -5.2
E Electricity, gas & water supply 0.2 -1.5 : 11.0 -2.0 17.2 22.7 : 7.3 11.0
Index of production, June 2008 (1) Domestic output price index, July 2008 (2)
(1) Working-day adjusted; Cyprus and Slovenia, provisional.(2) Gross; Cyprus (Sections C and E), Malta and Slovakia, provisional.
8/9/2019 Eurostat - Statistics in focus 89/2008 - Short-term business statistics: recent and future euro area countries
http://slidepdf.com/reader/full/eurostat-statistics-in-focus-892008-short-term-business-statistics-recent 4/8
4 89/2008 — Statistics in focus
Construction
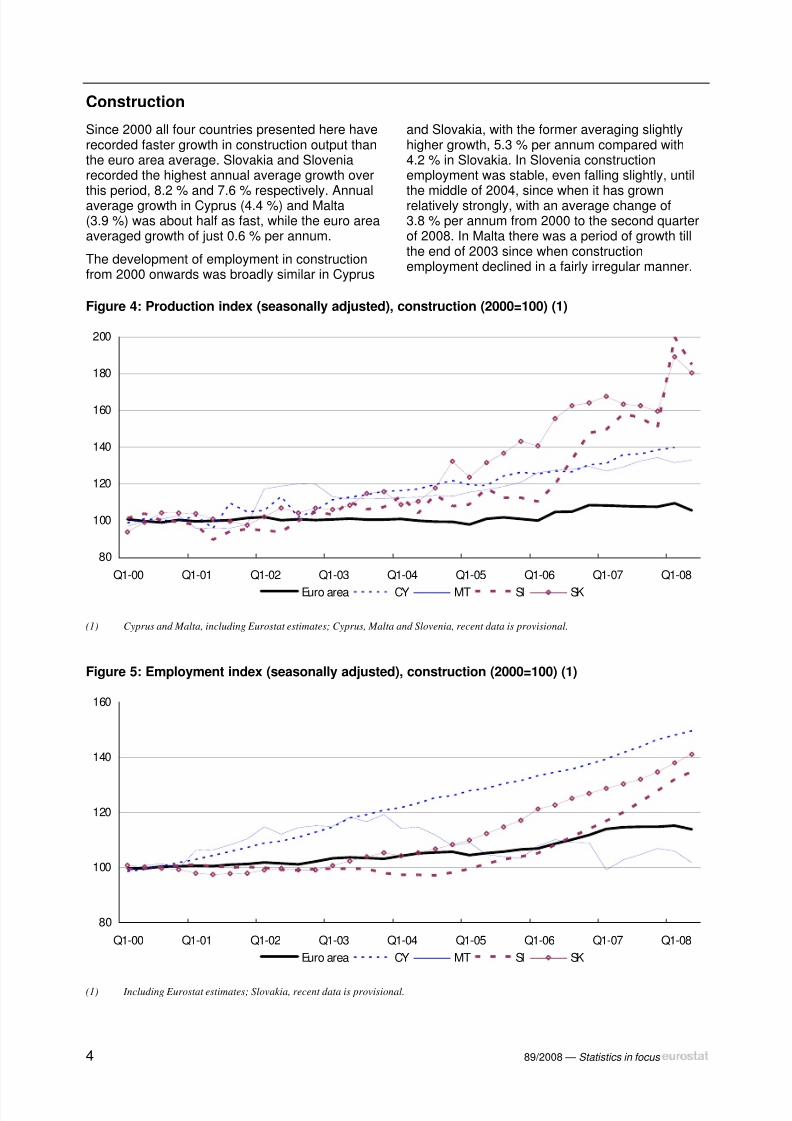
Since 2000 all four countries presented here haverecorded faster growth in construction output thanthe euro area average. Slovakia and Sloveniarecorded the highest annual average growth over
this period, 8.2 % and 7.6 % respectively. Annualaverage growth in Cyprus (4.4 %) and Malta(3.9 %) was about half as fast, while the euro areaaveraged growth of just 0.6 % per annum.
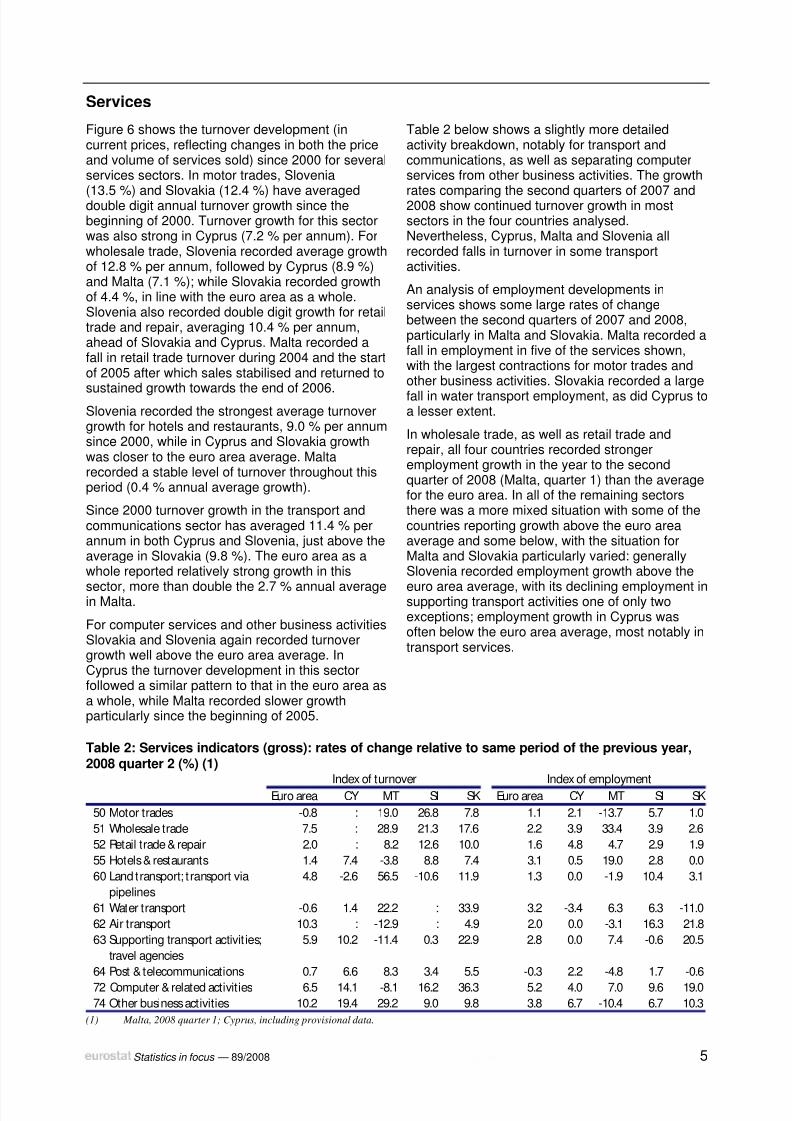
The development of employment in constructionfrom 2000 onwards was broadly similar in Cyprus
and Slovakia, with the former averaging slightlyhigher growth, 5.3 % per annum compared with4.2 % in Slovakia. In Slovenia constructionemployment was stable, even falling slightly, until
the middle of 2004, since when it has grownrelatively strongly, with an average change of3.8 % per annum from 2000 to the second quarterof 2008. In Malta there was a period of growth tillthe end of 2003 since when constructionemployment declined in a fairly irregular manner.
Figure 4: Production index (seasonally adjusted), construction (2000=100) (1)
80
100
120
140
160
180
200
Q1-00 Q1-01 Q1-02 Q1-03 Q1-04 Q1-05 Q1-06 Q1-07 Q1-08
Euro area CY MT SI SK (1) Cyprus and Malta, including Eurostat estimates; Cyprus, Malta and Slovenia, recent data is provisional.
Figure 5: Employment index (seasonally adjusted), construction (2000=100) (1)
80
100
120
140
160
Q1-00 Q1-01 Q1-02 Q1-03 Q1-04 Q1-05 Q1-06 Q1-07 Q1-08
Euro area CY MT SI SK (1) Including Eurostat estimates; Slovakia, recent data is provisional.
8/9/2019 Eurostat - Statistics in focus 89/2008 - Short-term business statistics: recent and future euro area countries
http://slidepdf.com/reader/full/eurostat-statistics-in-focus-892008-short-term-business-statistics-recent 5/8
Statistics in focus — 89/2008 5
Services
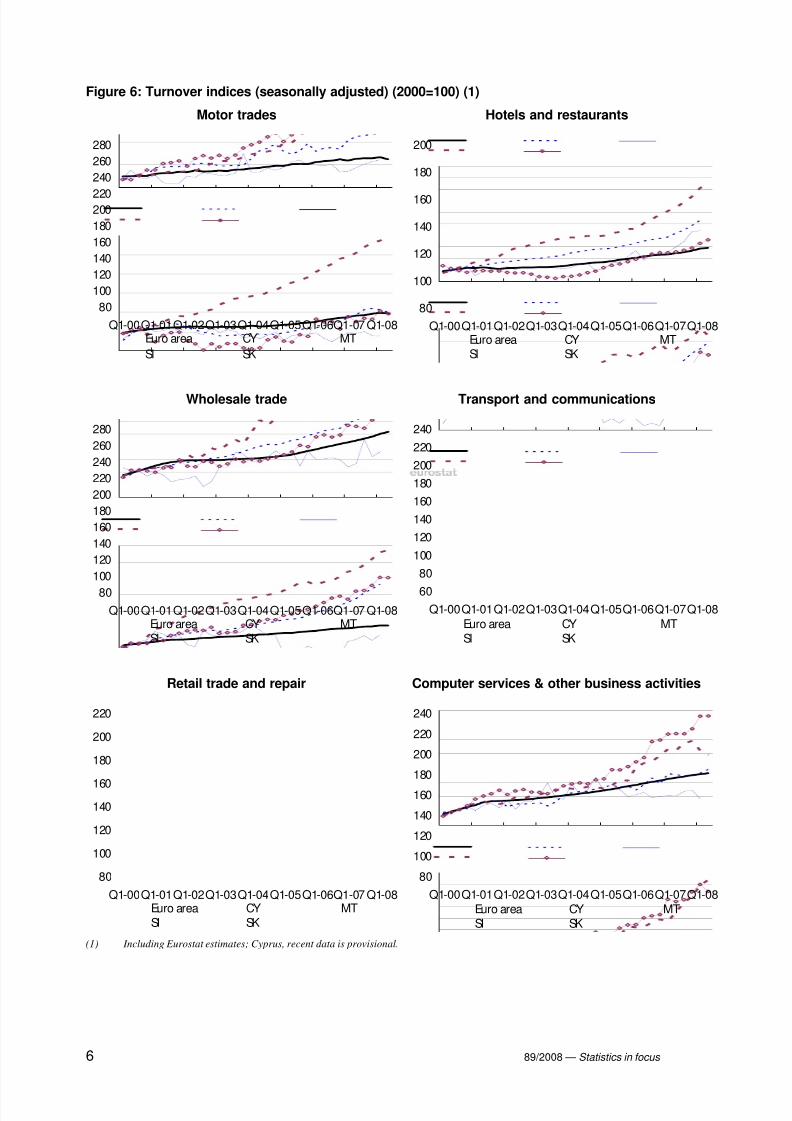
Figure 6 shows the turnover development (incurrent prices, reflecting changes in both the priceand volume of services sold) since 2000 for severalservices sectors. In motor trades, Slovenia
(13.5 %) and Slovakia (12.4 %) have averageddouble digit annual turnover growth since thebeginning of 2000. Turnover growth for this sectorwas also strong in Cyprus (7.2 % per annum). Forwholesale trade, Slovenia recorded average growthof 12.8 % per annum, followed by Cyprus (8.9 %)and Malta (7.1 %); while Slovakia recorded growthof 4.4 %, in line with the euro area as a whole.Slovenia also recorded double digit growth for retailtrade and repair, averaging 10.4 % per annum,ahead of Slovakia and Cyprus. Malta recorded afall in retail trade turnover during 2004 and the startof 2005 after which sales stabilised and returned to
sustained growth towards the end of 2006.Slovenia recorded the strongest average turnovergrowth for hotels and restaurants, 9.0 % per annumsince 2000, while in Cyprus and Slovakia growthwas closer to the euro area average. Maltarecorded a stable level of turnover throughout thisperiod (0.4 % annual average growth).
Since 2000 turnover growth in the transport andcommunications sector has averaged 11.4 % perannum in both Cyprus and Slovenia, just above theaverage in Slovakia (9.8 %). The euro area as awhole reported relatively strong growth in this
sector, more than double the 2.7 % annual averagein Malta.
For computer services and other business activitiesSlovakia and Slovenia again recorded turnovergrowth well above the euro area average. InCyprus the turnover development in this sectorfollowed a similar pattern to that in the euro area asa whole, while Malta recorded slower growthparticularly since the beginning of 2005.
Table 2 below shows a slightly more detailedactivity breakdown, notably for transport andcommunications, as well as separating computerservices from other business activities. The growth
rates comparing the second quarters of 2007 and2008 show continued turnover growth in mostsectors in the four countries analysed.Nevertheless, Cyprus, Malta and Slovenia allrecorded falls in turnover in some transportactivities.
An analysis of employment developments inservices shows some large rates of changebetween the second quarters of 2007 and 2008,particularly in Malta and Slovakia. Malta recorded afall in employment in five of the services shown,with the largest contractions for motor trades andother business activities. Slovakia recorded a large
fall in water transport employment, as did Cyprus toa lesser extent.
In wholesale trade, as well as retail trade andrepair, all four countries recorded strongeremployment growth in the year to the secondquarter of 2008 (Malta, quarter 1) than the averagefor the euro area. In all of the remaining sectorsthere was a more mixed situation with some of thecountries reporting growth above the euro areaaverage and some below, with the situation forMalta and Slovakia particularly varied: generallySlovenia recorded employment growth above the
euro area average, with its declining employment insupporting transport activities one of only twoexceptions; employment growth in Cyprus wasoften below the euro area average, most notably intransport services.
Table 2: Services indicators (gross): rates of change relative to same period of the previous year,2008 quarter 2 (%) (1)
Euro area CY MT SI SK Euro area CY MT SI SK
50 Motor trades -0.8 : 19.0 26.8 7.8 1.1 2.1 -13.7 5.7 1.0
51 Wholesale trade 7.5 : 28.9 21.3 17.6 2.2 3.9 33.4 3.9 2.6
52 Retail trade & repair 2.0 : 8.2 12.6 10.0 1.6 4.8 4.7 2.9 1.9
55 Hotels & restaurants 1.4 7.4 -3.8 8.8 7.4 3.1 0.5 19.0 2.8 0.0
60 Land transport; t ransport via
pipelines
4.8 -2.6 56.5 -10.6 11.9 1.3 0.0 -1.9 10.4 3.1
61 Water transport -0.6 1.4 22.2 : 33.9 3.2 -3.4 6.3 6.3 -11.0
62 Air transport 10.3 : -12.9 : 4.9 2.0 0.0 -3.1 16.3 21.8
63 Supporting transport activit ies;
travel agencies
5.9 10.2 -11.4 0.3 22.9 2.8 0.0 7.4 -0.6 20.5
64 Post & telecommunications 0.7 6.6 8.3 3.4 5.5 -0.3 2.2 -4.8 1.7 -0.6
72 Computer & related activities 6.5 14.1 -8.1 16.2 36.3 5.2 4.0 7.0 9.6 19.0
74 Other business activities 10.2 19.4 29.2 9.0 9.8 3.8 6.7 -10.4 6.7 10.3
Index of turnover Index of employment
(1) Malta, 2008 quarter 1; Cyprus, including provisional data.
8/9/2019 Eurostat - Statistics in focus 89/2008 - Short-term business statistics: recent and future euro area countries
http://slidepdf.com/reader/full/eurostat-statistics-in-focus-892008-short-term-business-statistics-recent 6/8
6 89/2008 — Statistics in focus
Figure 6: Turnover indices (seasonally adjusted) (2000=100) (1)
Motor trades
80
100
120
140
160
180
200220
240
260
280
Q1-00Q1-01Q1-02Q1-03Q1-04Q1-05Q1-06Q1-07 Q1-08Euro area CY MT
SI SK
Wholesale trade
80
100
120
140
160
180
200
220
240
260
280
Q1-00Q1-01Q1-02Q1-03Q1-04Q1-05Q1-06Q1-07 Q1-08Euro area CY MT
SI SK
Retail trade and repair
80
100
120
140
160
180
200
220
Q1-00Q1-01Q1-02Q1-03Q1-04Q1-05Q1-06Q1-07 Q1-08Euro area CY MT
SI SK
Hotels and restaurants
80
100
120
140
160
180
200
Q1-00Q1-01Q1-02Q1-03Q1-04Q1-05Q1-06Q1-07Q1-08Euro area CY MTSI SK
Transport and communications
60
80
100
120
140
160
180
200
220
240
Q1-00Q1-01Q1-02Q1-03Q1-04Q1-05Q1-06Q1-07Q1-08
Euro area CY MT
SI SK
Computer services & other business activities
80
100
120
140
160
180
200
220
240
Q1-00Q1-01Q1-02Q1-03Q1-04Q1-05Q1-06Q1-07Q1-08
Euro area CY MT
SI SK
(1) Including Eurostat estimates; Cyprus, recent data is provisional.
8/9/2019 Eurostat - Statistics in focus 89/2008 - Short-term business statistics: recent and future euro area countries
http://slidepdf.com/reader/full/eurostat-statistics-in-focus-892008-short-term-business-statistics-recent 7/8
Statistics in focus — 89/2008 7
METHODOLOGICAL NOTES
The source for most of the data presented in thispublication is Eurostat's short-term business statistics(STS); Maltese producer price indices are available as anews release from the website of the Maltese statisticaloffice (http://www.nso.gov.mt/).
DefinitionsThe definitions of short-term statistics variables are laiddown in Commission Regulation (EC) No 1503/2006 of28 September 2006 (
1).
The output price index (or producer price index) showsmonthly price changes in industrial activities, which canbe an indicator of inflationary pressure before it reachesthe consumer. Output price indices are compiled for thedomestic and the non-domestic market. The basic priceexcludes all duties and taxes on the goods and servicesinvoiced by the unit including VAT invoiced by the unitvis-à-vis its customer and similar deductible taxes
directly linked to turnover; subsidies on productsreceived by the producer should be included.
The production index is a business cycle indicatorshowing the output and activity of industry. The indexprovides a measure of the volume trend in value addedat factor cost over a given reference period.
Employment is an important short-term indicator inmonitoring the economy. The employment index isbased on the number of persons employed, defined asthe total number of persons who work in the observationunit (inclusive of working proprietors, partners workingregularly in the unit and unpaid family workers), as wellas persons who work outside the unit who belong to it
and are paid by it (e.g. sales representatives, deliverypersonnel, repair and maintenance teams). It includespersons absent for a short period (e.g. sick leave, paidleave or special leave), and also those on strike, but notthose absent for an indefinite period. It also includespart-time workers who are regarded as such under thelaws of the country concerned and who are on thepayroll, as well as seasonal workers, apprentices andhome workers on the payroll. Note that Member Statesmay use an index of (paid) employees to approximatethe index of the number of persons employed.
The objective of the services turnover index is to showthe evolution of the market. Turnover comprises thetotals invoiced by the observation unit during the
reference period. This corresponds to market sales ofservices supplied to third parties. It includes all dutiesand taxes on the services invoiced by the unit with theexception of the VAT invoiced by the unit vis-à-vis itscustomer and other similar deductible taxes directlylinked to turnover. The turnover index is compiled incurrent prices, and so reflects volume and price changes.
(1) Official Journal No L 281, of 12 October 2006.
ClassificationsThe classification of activities used in this publication isNACE Rev. 1.1 (
2). The classification by the main
industrial groupings (MIGs) (3) is a specific activity
aggregation starting from the Group level of NACE
Rev. 1.1.
Decomposition - forms of indicesThe basic form of an index is its gross (also known asunadjusted) form. To facilitate analysis this may beadjusted in a number of ways. The production index inthis publication has been adjusted for working dayeffects, in other words to adjust for the impact ofcalendar effects (such as weekdays/weekends, officialholidays, leap years) on the index. The production,employment and turnover indices have been adjusted toaccount for seasonal effects. Seasonal adjustment aimsto take account of the impact of the known seasonal
factors that have been observed in the past. If thenational statistical office providing the data does theseasonal adjustment, these series are used. If noseasonally adjusted series are supplied, Eurostatperform the seasonal adjustment.
Geographical codesEA-15 Euro area of 15 Member States (Belgium,
Germany, Greece, Ireland, Spain, France,Italy, Cyprus, Luxembourg, Malta, theNetherlands, Austria, Portugal, Sloveniaand Finland)
CY CyprusMT MaltaSI SloveniaSK Slovakia
Abbreviations and symbolsERM Exchange rate mechanismMIG(s) Main industrial grouping(s)NACE Statistical classification of economic
activities in the European CommunitySTS Short-term statistics
: not available (in tables)
For more information:
(2) Commission Regulation (EC) No 29/2002 of 19 December 2001.
Official Journal No L 6, of 10 January 2002.
(3) Commission Regulation No 586/2001 of 26 March 2001. Official
Journal No L 86, of 27 March 2001.
8/9/2019 Eurostat - Statistics in focus 89/2008 - Short-term business statistics: recent and future euro area countries
http://slidepdf.com/reader/full/eurostat-statistics-in-focus-892008-short-term-business-statistics-recent 8/8
Further information
Data: Eurostat Website: http://ec.europa.eu/eurostat
Select your theme on the left side of the homepage and then ‘Data’ from the menu.
Data: Eurostat Website/Industry trade and services/Short term business statistics
Journalists can contact the media support service:
Bech Building Office A4/125 L - 2920 Luxembourg
Tel. (352) 4301 33408 Fax (352) 4301 35349
E-mail: [email protected]
European Statistical Data Support:
Eurostat set up with the members of the ‘European statistical system’ a network of
support centres, which will exist in nearly all Member States as well as in some EFTA
countries.
Their mission is to provide help and guidance to Internet users of European statistical
data.
Contact details for this support network can be found on our Internet site:
http://ec.europa.eu/eurostat/
A list of worldwide sales outlets is available at the:
Office for Official Publications of the European Communities.
2, rue Mercier
L - 2985 Luxembourg
URL: http://publications.europa.eu
E-mail: [email protected]
Manuscript completed on: 06.10.2008
Data extracted on: 04.09.2008ISSN 1977-0316
Catalogue number: KS-SF-08-089-EN-C
© European Communities, 2008