Embed Size (px)
Citation preview
-
This project has received funding from the European Union’s Seventh Framework Programme
for research, technological development and demonstration under grant agreement no 308908
Europe’s future
secure and sustainable
electricity infrastructure
e-Highway2050 project results
November 2015
-
3
Foreword
After 40 months of intense work, the project will be delivering its results by the end of 2015. On November the
3 rd and 4 th, the main fi ndings of the project are presented during the conference, offering a forum to discuss
the future implementation.
The present booklet summarises the key fi ndings of the project. For more details, please refer to the
deliverables available in the website www.e-highway2050.eu or contact: rte-e-highway2050 @ rte-france.com
I would like to thank all the partners of e-Highway2050 project for their commitment, and enthusiasm building this European vision, in particular ENTSO-E for the fruitful cooperation.
My special thanks are for the Work Package Leaders: Bjørn Bakken ( Sintef ), Thomas Anderski ( Amprion ),
Eric Peirano ( Technofi ), Rui Pestana ( REN ), Bernard De Clercq ( Elia ), Gianluigi Migliavacca ( RSE ),
Marc Czernie ( dena ), Patrick Panciatici ( RTE ), Mihai Paun ( ENTSO-E ) and Nathalie Grisey ( RTE ).
I also gratefully acknowledge the contributions of the experts from the e-Highway2050 consortium:
Brahim Betraoui, Didier Lasserre, Camille Pache, Eric Momot, Anne-Claire Léger, Claude Counan, Christian
Poumarède, Max Papon, Jean Maeght, Baptiste Seguinot, Sergeï Agapoff, Marie-Sophie Debry ( RTE ), Daniel
Huertas Hernando, Leif Warland, Til Kristian Vrana, Hossein Farahmand ( Sintef ), Thomas Butschen, Yvonne
Surmann, Christian Strotmann ( Amprion ), Serge Galant, Athanase Vaféas ( Technofi ), Nélio Machado, António
Pitarma, Ricardo Pereira, Jamila Madeira, João Moreira, Maria Rita Silva ( REN ), Dries Couckuyt, Peter Van
Roy, Fabian Georges, Clara Ruiz Prada, Vanessa Gombert, Reinhard Stornowski, Christian Paris, Nicolas
Bragard, Jacques Warichet ( Elia Group ), Angelo Labatte, Francesco Careri, Stefano Rossi, Alessandro Zani
( RSE ), Dragana Orlic, Dusan Vlaisavljevic ( EKC ), Hannes Seidl, Jakob Völker, Nadia Grimm, Julia Balanowski
( dena ), Mihai Marcolţ, Simona-Liliana Soare ( Transelectrica ), Tomáš Linhart, Karel Maslo ( ČEPS ), Marc
Emery, Christophe Dunand, Pablo Centeno López, Mathias Haller, Lisa Drössler, Thomas Nippert ( Swissgrid ),
Berardo Guzzi, Silvia Ibba, Silvia Moroni, Corrado Gadaleta, Pierluigi Di Cicco, Enrico Maria Carlini, Angelo
Ferrante, Chiara Vergine( TERNA ), Gareth Taylor, Mohammad Golshani, Amir Hessam Alikhanzadeh, Yaminid-
har Bhavanam ( Brunel ), Luis Olmos, Andrés Ramos, Michel Rivier, Lucas Sigris, Sara Lumbreras, Fernando
Báñez-Chicharro, Luis Rouco, Francisco Echavarren ( Comillas ), Maria Rosario Partidario, Rita Soares,
Margarida Monteiro, Nuno Oliveira ( IST ), Dirk van Hertem, Kenneth Bruninx, Diyun Huang, Erik Delarue,
Hakan Ergun, Kristof De Vos ( KU Leuven ), Domenico Villacci ( ENSIEL ), Kai Strunz, Markus Gronau, Alexander
Weber, Claudio Casimir Lucas Lorenz, Arnaud Dusch ( TU Berlin ), Jos Sijm, Frans Nieuwenhout, Adriaan
Vanderwelle, Özge Özdemir ( ECN ), Michal Bajor, Maciej Wilk, Robert Jankowski, Bogdan Sobczak ( IPE ),
Aura Caramizaru, Gunnar Lorenz, Franz Bauer, Claudia Weise ( Eurelectric ), Volker Wendt, Ernesto Zaccone
( Europacable ), Emanuela Giovannetti, Ivan Pineda ( EWEA ), Oliver Blank, Massimiliano Margarone, Jerker
Roos, Peter Lundberg, Bo Westman ( T & D Europe ), Gary Keane, Benjamin Hickman ( Pöyry ), Jonathan
Gaventa, Manon Dufour ( E3G ), Mariola Juszczuk, Marcin Małecki, Pawel Ziółek ( PSE ), Ric Eales, Clare
Twigger-Ross, William Sheate, Peter Phillips, Steven Forrest, Katya Brooks ( CEP ), Rasmus Munch Sørensen,
Niels Træholt Franck ( Energinet.dk ), Stephan Österbauer ( APG ), Katherine Elkington, Johan Setréus
( Svenska ), José Luís Fernández González ( REE ), Olaf Brenneisen ( TransnetBW ), Ioannis Kabouris ( Admie )
Finally, I would like to thank Patrick Van Hove ( EC DG Research & Innovation ) and Tomasz Jerzyniak
( EC DG Energy ) for their confi dence and for their support all along the project.
Gérald Sanchis
e-Highway2050 coordinator
rte-e-highway2050 @ rte-france.com

-
5
Contents
e-Highway2050 key fi ndings 7
Executive summary 8
1 Introduction 10
1.1 The Climate and Energy Union policy: preparing a low carbon economy 10
1.2 Impacts of the Climate and Energy Union policy on the European transmission grid 10
1.3 The e-Highway2050 project overview 11
2 The scenarios 12
2.1 Some contrasted decarbonised scenarios for 2050 12
2.2 Generation, demand and storage assumptions in the scenarios 14
2.3 Generation trajectories from today to 2050 16
3 The potential grid bottlenecks by 2050 18
3.1 Initial conditions: the starting grid 18
3.2 System simulations 19
3.3 The consequences of the bottlenecks 20
3.4 Potential solutions excluding transmission grid development 21
4 The power grid infrastructure suited for a low carbon economy by 2050 23
4.1 Grid architectures for 2050 24
4.2 Cost benefi t analysis 35
4.3 Going from 2030 to 2050 36
5 How to deploy and operate the resulting grid architectures ? 38
5.1 Which technology ? 38
5.2 Which regulatory framework? 40
5.3 How to operate the resulting power system 42
5.4 How to balance demand and generation 43
6 Outlook 45
List of the deliverables 46
Glossary 47
Footnotes 48
6 | e-Highway2050: Europe’s future secure and sustainable electricity infrastructure
Disclaimer
Various scenarios have been studied under the project. The purpose is to cover a wide range of possibilities,
not to identify a preferential one as only the costs and benefi ts of the transmission grid have been assessed.
The cost of the complete power system should include also generation, demand side management and ef-
fi ciency measures, storage and distribution network. This is out of the scope of the e-Highway2050 project.
The reinforcements of the transmission grid identifi ed by the project are related to signifi cant assumptions.
Much efforts were dedicated to the relevance of these assumptions. However, as for any prospective study,
some of them could for sure be discussed. In that perspective, the project is willing to make them as trans-
parent as possible and encourage stakeholders to consider them carefully. Especially, the grid architectures
defi ned by the project should not be re-used in documents or presentations without a reminder to the related
assumptions.
7
e-Highway2050 key fi ndings
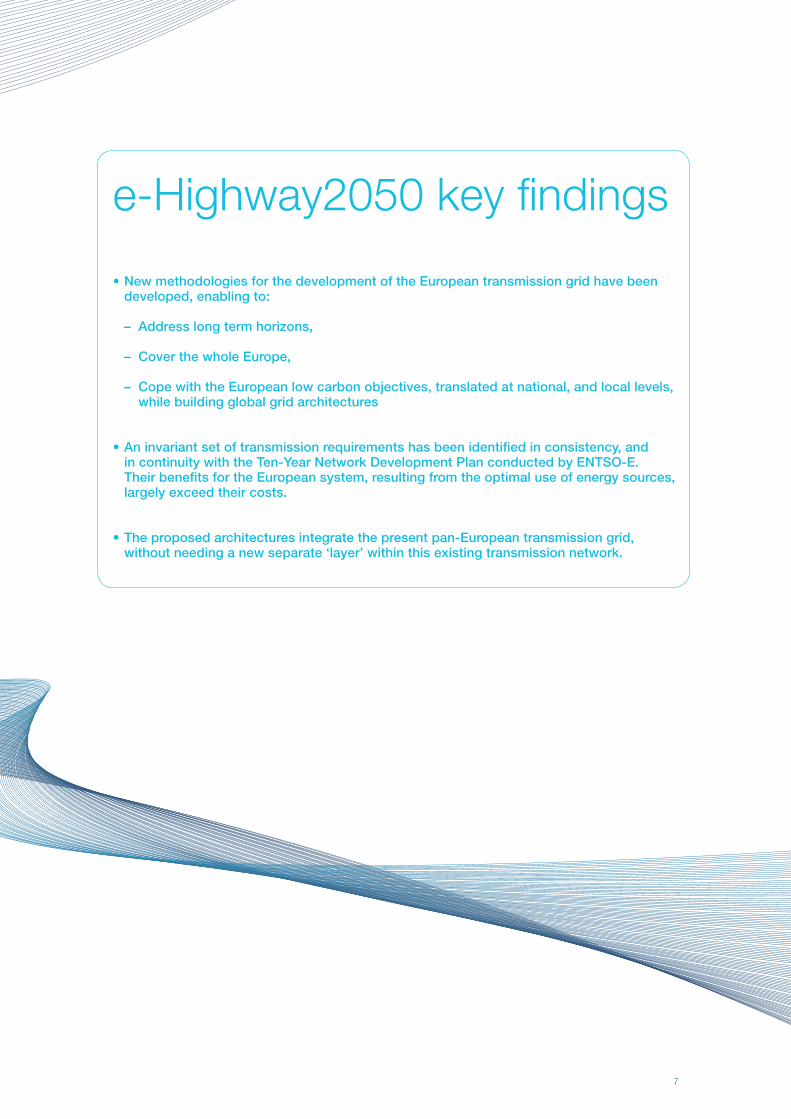
• New methodologies for the development of the European transmission grid have been developed, enabling to:
– Address long term horizons,
– Cover the whole Europe,
– Cope with the European low carbon objectives, translated at national, and local levels, while building global grid architectures
• An invariant set of transmission requirements has been identifi ed in consistency, and in continuity with the Ten-Year Network Development Plan conducted by ENTSO-E. Their benefi ts for the European system, resulting from the optimal use of energy sources, largely exceed their costs.
• The proposed architectures integrate the present pan-European transmission grid, without needing a new separate ‘layer’ within this existing transmission network.
8 | e-Highway2050: Europe’s future secure and sustainable electricity infrastructure
Executive summary
The European Commission, together with the member
states, has defi ned clear targets for the decarbonisation
of the European economy from 2020 up to 2050.
These low carbon trends for the European economy
have a direct impact on the design and upgrade of all
the European energy infrastructures, and especially on
the electricity transmission network due to its critical role
for the pan-European power system.
The European Network of Transmission System
Operators for Electricity ( ENTSO-E ) addresses the
developments of the pan-European electricity trans-
mission network until 2030 in the Ten-Year Network
Development Plan ( TYNDP ). Starting with the same
network confi guration for 2030, the e-Highway2050
research and innovation project goes until 2050: it
deals with the transition paths for the whole power
system, with a focus on the transmission network,
to support the European Union in reaching a low
carbon economy by 2050.
Novel network planning methodologies have there-
fore been developed to address such long-term
horizons and cover all the continent. They have been
used extensively to identify key network develop-
ments for Europe. The fi ve very contrasted energy
scenarios provide an envelope of the possible future
evolution of the European power system while
meeting the 2050 low carbon economy orientation.
The methodology relies on extensive numeri-
cal simulations of a model of the pan-European
transmission network ( made of approximately 100
regional and interconnected clusters ): these simula-
tions support an estimation of the benefi ts of grid
expansion, thanks to a modelling of both generation
and grid constraints. The robustness is guaranteed
by a Monte-Carlo approach covering probabilistically
various climatic years.
The simulations show that the 2030 network is not
suffi cient to face the 2050 energy scenarios. Indeed,
during signifi cant periods, grid congestions would
prevent some available generation to reach the
load. Especially, huge volumes of renewable energy
sources ( RES ) would be curtailed and compensated
by expensive thermal generation emitting CO2.
To tackle these issues, different architec-tures of the transmission grid have been developed and compared to assess their techno-economic effi ciency.

-
9
The results of the studies exhibit the following trends:
• An invariant set of transmission requirements
has been found: major “North – South” corridors
appear in all scenarios with several reinforce-
ments that connect the North of the pan-European
electricity system (North Sea, Scandinavia, UK,
Ireland), and southern countries (Spain and Italy),
to the central continental area (northern Germany,
Poland, Netherlands, Belgium and France);
• The network extension rate is driven by the in-
crease of generation capacities, especially renew-
able energy sources;
• The proposed architectures could be integrated in
the present grid, without introducing a separated
‘layer’ of transmission grid.
The costs of investment in grid expansion depend
on the scenarios. They lie between 100 and 400 bil-
lion €. However, the study demonstrates that the
benefi t for the European economy, resulting from an
optimal use of energy sources, would largely exceed
these costs in all cases. Indeed, up to 500 TWh of
RES curtailment and 200 mega tons of CO2 emis-
sions would be avoided annually.
To successfully realize and operate those future
transmission grids, key challenges have to be over-
come. The project has highlighted some of them in
the fi elds of technology, operation and governance.
10 | e-Highway2050: Europe’s future secure and sustainable electricity infrastructure
1 Introduction
1.1 The Climate and Energy Union policy:
preparing a low carbon economy
On March 27 th 2013, the Green Paper 1 published by
the European Commission ( EC ) framed an upgraded
policy environment within which Europe ought to
design its whole energy system from 2020 up to
the middle of the twenty-fi rst century ( 2050 ). Such
a long-term perspective had already been laid out
in 2011,2 and then continued through the Energy
Roadmap 2050 3 and the Transport White Paper.4
More over, each of these key policy papers had
witnessed a parent European Parliament Resolution,5
aimed at converging on a “low carbon” vision for the
European economy by 2050.
An intermediate 2030 framework was then proposed,
refi ned and fi nalised by the EC and the Member
States ( MS ) in January 2014, assuming that:
• The EU28 is making signifi cant progress towards
meeting its existing climate and energy intermedi-
ate targets for 2020;
• The 2050 perspectives are still plausible in
terms of reducing greenhouse gas emissions by
80 – 95 % below 1990 levels by 2050.
Since October 2014 there has been a renewed inte-
grated climate and energy policy frame work available
in Europe to reach a set of 2030 targets. It involves
a clear regulatory framework for investors and pro-
poses a more coordinated approach among Member
States: this is the Energy Union strategy. This
renewed policy framework aims at strengthening the
plausibility of the 2030 targets as agreed by the EU
leaders. It puts forward fi ve mutually-reinforcing and
closely intertwined dimensions:
> Energy security, solidarity and trust;
> A fully integrated European energy market;
> Energy effi ciency contributing to moderation of
demand;
> Decarbonising the economy;
> Research, innovation and competitiveness.
These dimensions support the three pillars of energy
security, sustainability and competitiveness.
1.2 Impacts of the Climate and Energy Union policy
on the European transmission grid
The 2030 targets and 2050 long term goals have a
direct impact on European energy infrastructures,
and more specifi cally on the pan-European electrical
power system. This is directly refl ected in the 10 %
interconnection target adopted by the Council in
October 2014 and presented by the European Com-
mission in February 2015 6. The Ten-Year Network
Development Plan ( TYNDP ) prepared by the Euro-
pean Network of Transmission System Operators for
Electricity ( ENTSO-E ) addresses the development of
the pan-European electricity transmission network
from now on until 2030.
But what about longer term horizons and the transi-
tion paths to support the European Union in reaching
a low carbon economy by 2050 ?
This is the question addressed by the e-High-
way2050 project.
This research project, supported by the European
Commission under the Seventh Framework Pro-
gramme, began in September 2012 and lasted for
forty months. It was carried out by a large consor-
tium of TSOs, industrial associations, academics,
consultants and one NGO.
11
1.3 The e-Highway2050 project overview
The main results of the e-Highway2050 project are
summarised in the present report.
The project had two overarching goals:
• to develop novel planning methodologies of the
pan-European electricity transmission network,
able to address very long-term horizons;
• to implement the prototype methodology in order
to provide a fi rst version of an expansion plan for
the pan-European electricity transmission network,
going from 2030 ( the time horizon of the TYNDP )
up to 2050, thus in line with the European energy
policy pillars in view of decarbonising the Euro-
pean economy.
This report summarises the following key results:
• The fi ve scenarios to reach long term EU decar-
bonisation orientations which have been created
to frame the whole research and development
project ( Section 2 );
• The critical issues for the transmission grid under
these scenarios identifi ed thanks to advanced
numerical simulations ( Section 3 );
• The major “electricity highways” 7 which have been
identifi ed to support any of the above scenarios
when deployed at pan-European level ( Section 4 );
• The key technological, regulatory, governance and
operational challenges raised ( Section 5 ).
Finally, outlook is presented in Section 6.
Additional work and more details are available in the
deliverables provided by the project ( see the full list
at the end of this report, and on the project’s web
site ).
e-Highway2050 partners
TSOs
Industry
Research institutes
Experts
12 | e-Highway2050: Europe’s future secure and sustainable electricity infrastructure
2 The scenarios
2.1 Some contrasted decarbonised scenarios for 2050
The scenarios presented hereafter are the outcome
of a sorting process implemented to select extreme
scenarios regarding their impact on the transmission
grid. They aim to explore a wide scope of plausible
and predictable challenges to be faced by the power
system. These challenges are driven by changes
in generation, demand, energy storage and level of
power exchanges. The e-Highway2050 scenarios are
neither predictions nor forecasts about the future:
the project consortium does not consider any of
them to represent the future, nor does it assume any
to be more likely than the others.
The fi ve challenging scenarios resulting from this
fi ltering process are summarised in Table 1, going
from a low to maximum RES generation contribution.
Each scenario covers different backgrounds in terms
of:
• Economy ( GDP, population growth, fuel costs );
• Technology ( maturity of carbon capture storage
( CCS ) );
• Policies ( incentives towards RES, energy effi ciency,
national / European energy independency );
• Social behaviour ( nuclear acceptance, preference
towards decentralised generation ).
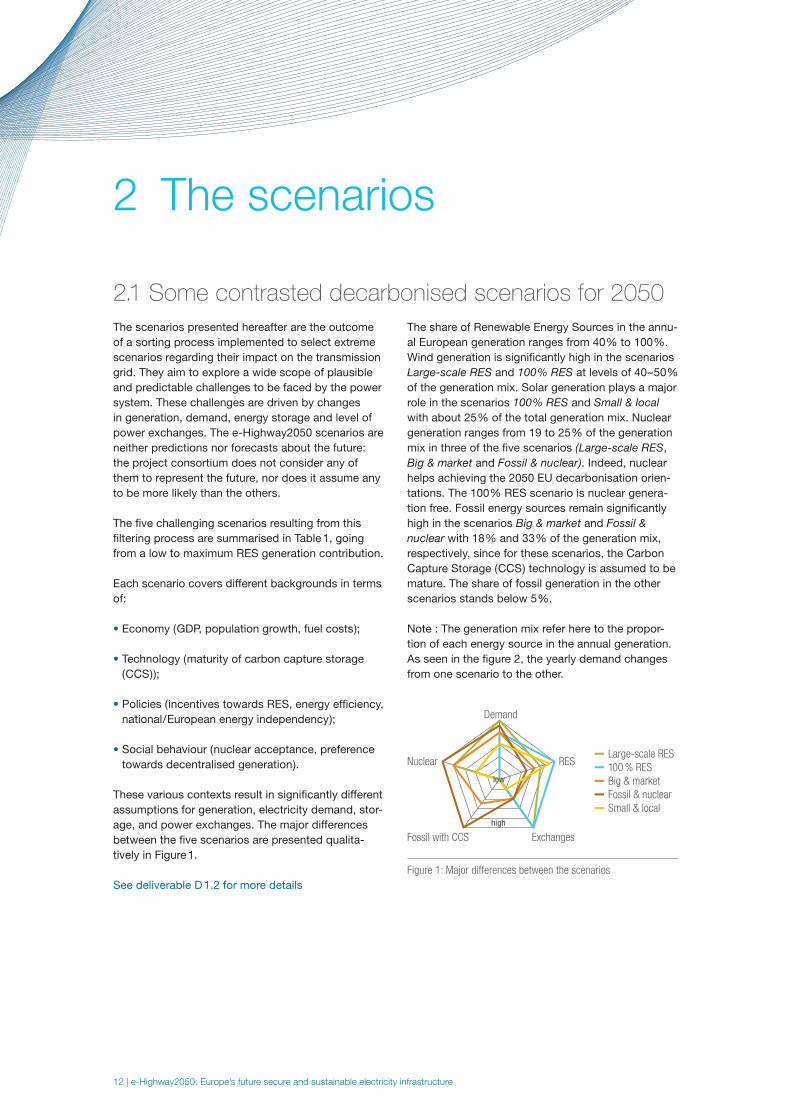
These various contexts result in signifi cantly different
assumptions for generation, electricity demand, stor-
age, and power exchanges. The major differences
between the fi ve scenarios are presented qualita-
tively in Figure 1.
See deliverable D 1.2 for more details
The share of Renewable Energy Sources in the annu-
al European generation ranges from 40 % to 100 %.
Wind generation is signifi cantly high in the scenarios
Large-scale RES and 100 % RES at levels of 40 – 50 %
of the generation mix. Solar generation plays a major
role in the scenarios 100 % RES and Small & local
with about 25 % of the total generation mix. Nuclear
generation ranges from 19 to 25 % of the generation
mix in three of the fi ve scenarios ( Large-scale RES,
Big & market and Fossil & nuclear ). Indeed, nuclear
helps achieving the 2050 EU decarbonisation orien-
tations. The 100 % RES scenario is nuclear genera-
tion free. Fossil energy sources remain signifi cantly
high in the scenarios Big & market and Fossil &
nuclear with 18 % and 33 % of the generation mix,
respectively, since for these scenarios, the Carbon
Capture Storage ( CCS ) technology is assumed to be
mature. The share of fossil generation in the other
scenarios stands below 5 %.
Note : The generation mix refer here to the propor-
tion of each energy source in the annual generation.
As seen in the fi gure 2, the yearly demand changes
from one scenario to the other.
Figure 1: Major differences between the scenarios
Large-scale RES
100 % RES
Big & market
Fossil & nuclear
Small & local
Demand
Nuclear
Fossil with CCS Exchanges
RES
low
high
-
13
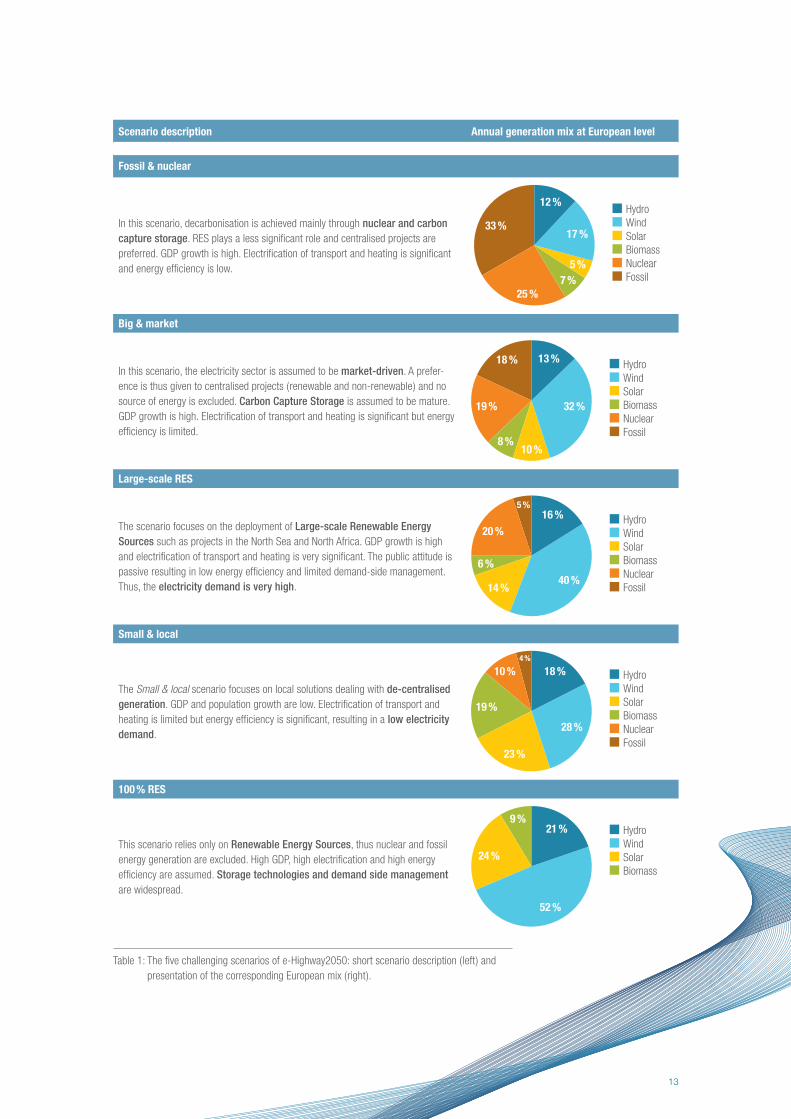
Table 1: The fi ve challenging scenarios of e-Highway2050: short scenario description ( left ) and
presentation of the corresponding European mix ( right ).
Scenario description Annual generation mix at European level
Fossil & nuclear
In this scenario, decarbonisation is achieved mainly through nuclear and carbon
capture storage. RES plays a less signifi cant role and centralised projects are
preferred. GDP growth is high. Electrifi cation of transport and heating is signifi cant
and energy effi ciency is low.
12 %
17 %
5 %
7 %
25 %
33 %
Hydro
Wind
Solar
Biomass
Nuclear
Fossil
Big & market
In this scenario, the electricity sector is assumed to be market-driven. A prefer-
ence is thus given to centralised projects ( renewable and non-renewable ) and no
source of energy is excluded. Carbon Capture Storage is assumed to be mature.
GDP growth is high. Electrifi cation of transport and heating is signifi cant but energy
effi ciency is limited.
13 %
32 %
10 %8 %
19 %
18 % Hydro
Wind
Solar
Biomass
Nuclear
Fossil
Large-scale RES
The scenario focuses on the deployment of Large-scale Renewable Energy
Sources such as projects in the North Sea and North Africa. GDP growth is high
and electrifi cation of transport and heating is very signifi cant. The public attitude is
passive resulting in low energy effi ciency and limited demand-side management.
Thus, the electricity demand is very high.
16 %
40 %
20 %
6 %
5 %
14 %
Hydro
Wind
Solar
Biomass
Nuclear
Fossil
Small & local
The Small & local scenario focuses on local solutions dealing with de-centralised
generation. GDP and population growth are low. Electrifi cation of transport and
heating is limited but energy effi ciency is signifi cant, resulting in a low electricity
demand.
18 %
28 %
23 %
4 %
19 %
10 % Hydro
Wind
Solar
Biomass
Nuclear
Fossil
100 % RES
This scenario relies only on Renewable Energy Sources, thus nuclear and fossil
energy generation are excluded. High GDP, high electrifi cation and high energy
effi ciency are assumed. Storage technologies and demand side management
are widespread.
21 %
52 %
24 %
9 %Hydro
Wind
Solar
Biomass
14 | e-Highway2050: Europe’s future secure and sustainable electricity infrastructure
2.2 Generation, demand and storage assumptions in
the scenarios
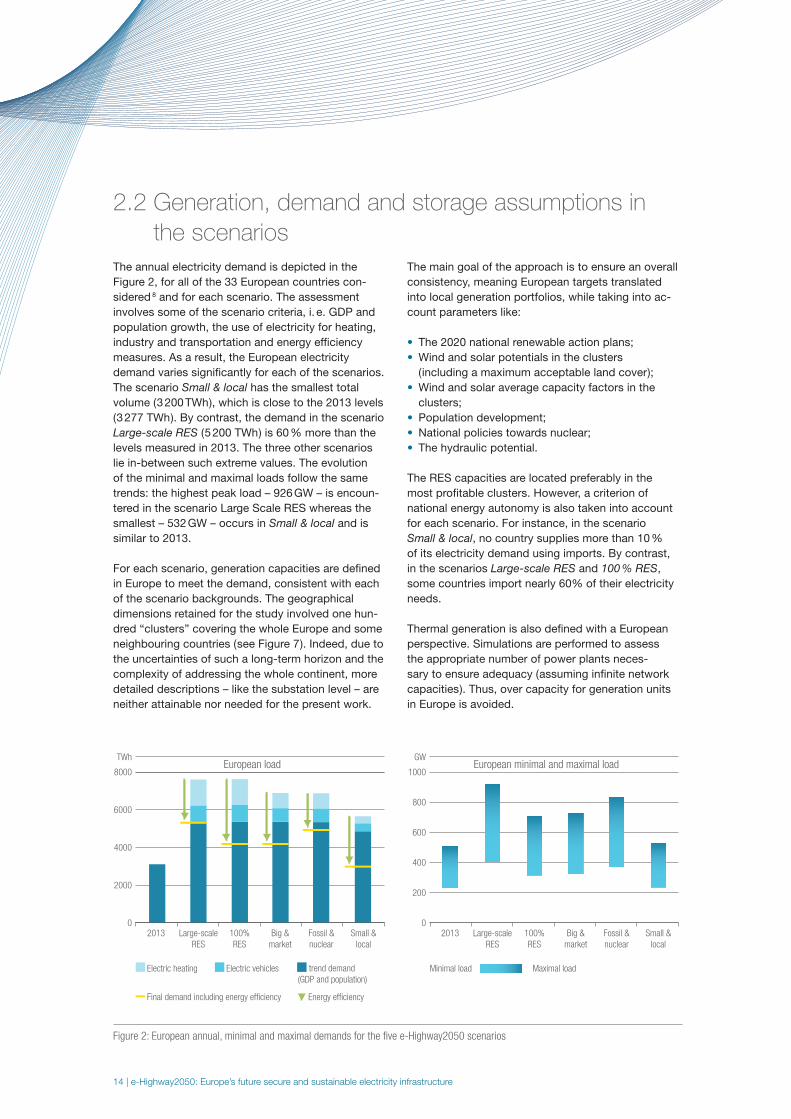
The annual electricity demand is depicted in the
Figure 2, for all of the 33 European countries con-
sidered 8 and for each scenario. The assessment
involves some of the scenario criteria, i. e. GDP and
population growth, the use of electricity for heating,
industry and transportation and energy effi ciency
measures. As a result, the European electricity
demand varies signifi cantly for each of the scenarios.
The scenario Small & local has the smallest total
volume ( 3 200 TWh ), which is close to the 2013 levels
( 3 277 TWh ). By contrast, the demand in the scenario
Large-scale RES ( 5 200 TWh ) is 60 % more than the
levels measured in 2013. The three other scenarios
lie in-between such extreme values. The evolution
of the minimal and maximal loads follow the same
trends: the highest peak load – 926 GW – is encoun-
tered in the scenario Large Scale RES whereas the
smallest – 532 GW – occurs in Small & local and is
similar to 2013.
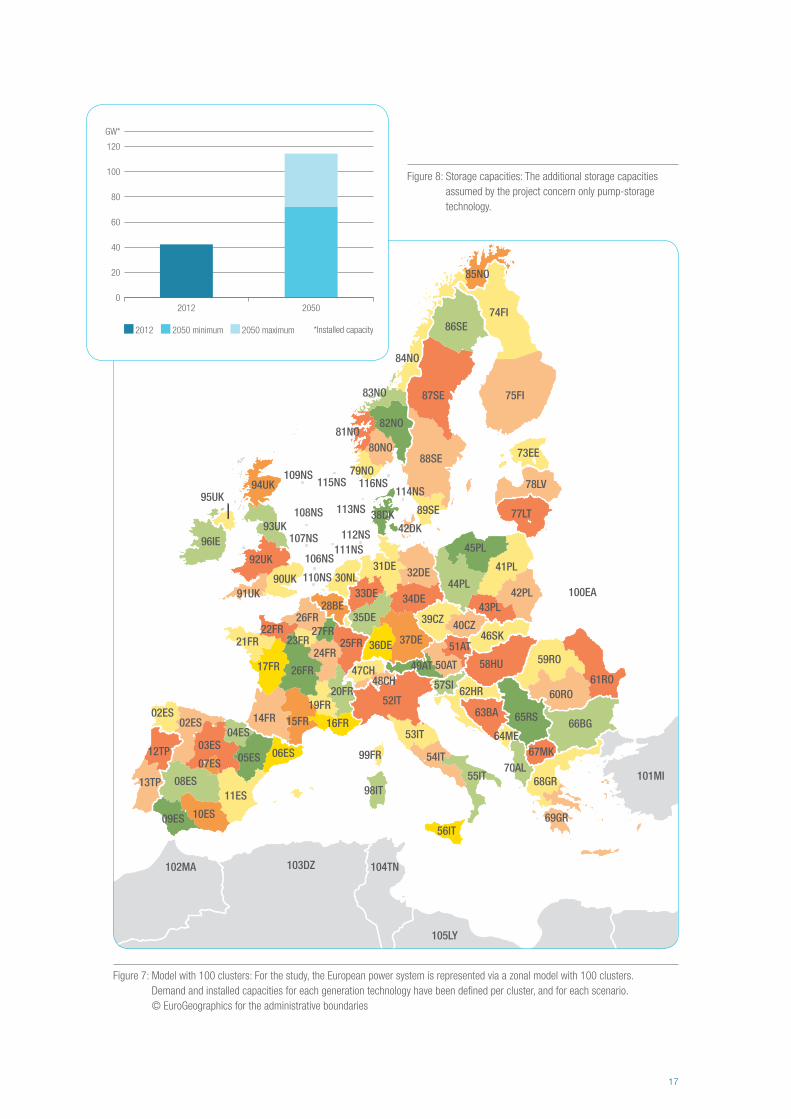
For each scenario, generation capacities are defi ned
in Europe to meet the demand, consistent with each
of the scenario backgrounds. The geographical
dimensions retained for the study involved one hun-
dred “clusters” covering the whole Europe and some
neighbouring countries ( see Figure 7 ). Indeed, due to
the uncertainties of such a long-term horizon and the
complexity of addressing the whole continent, more
detailed descriptions – like the substation level – are
neither attainable nor needed for the present work.
The main goal of the approach is to ensure an overall
consistency, meaning European targets translated
into local generation portfolios, while taking into ac-
count parameters like:
• The 2020 national renewable action plans;
• Wind and solar potentials in the clusters
( including a maximum acceptable land cover );
• Wind and solar average capacity factors in the
clusters;
• Population development;
• National policies towards nuclear;
• The hydraulic potential.
The RES capacities are located preferably in the
most profi table clusters. However, a criterion of
national energy autonomy is also taken into account
for each scenario. For instance, in the scenario
Small & local, no country supplies more than 10 %
of its electricity demand using imports. By contrast,
in the scenarios Large-scale RES and 100 % RES,
some countries import nearly 60% of their electricity
needs.
Thermal generation is also defi ned with a European
perspective. Simulations are performed to assess
the appropriate number of power plants neces-
sary to ensure adequacy ( assuming infi nite network
capacities ). Thus, over capacity for generation units
in Europe is avoided.
Figure 2: European annual, minimal and maximal demands for the fi ve e-Highway2050 scenarios
Electric heating
Final demand including energy efficiency
European load
Energy efficiency
Electric vehicles trend demand
(GDP and population)
Large-scale
RES
2013 100%
RES
Fossil &
nuclear
Big &
market
Small &
local
0
2000
4000
6000
8000
TWh
Minimal load
European minimal and maximal load
Maximal load
Large-scale
RES
2013 100%
RES
Fossil &
nuclear
Big &
market
Small &
local
0
200
400
600
1000
800
GW
15
The realisation of such top-down scenarios would
require a very high level of coordination within
Europe, thus differing signifi cantly from national
independent plans.
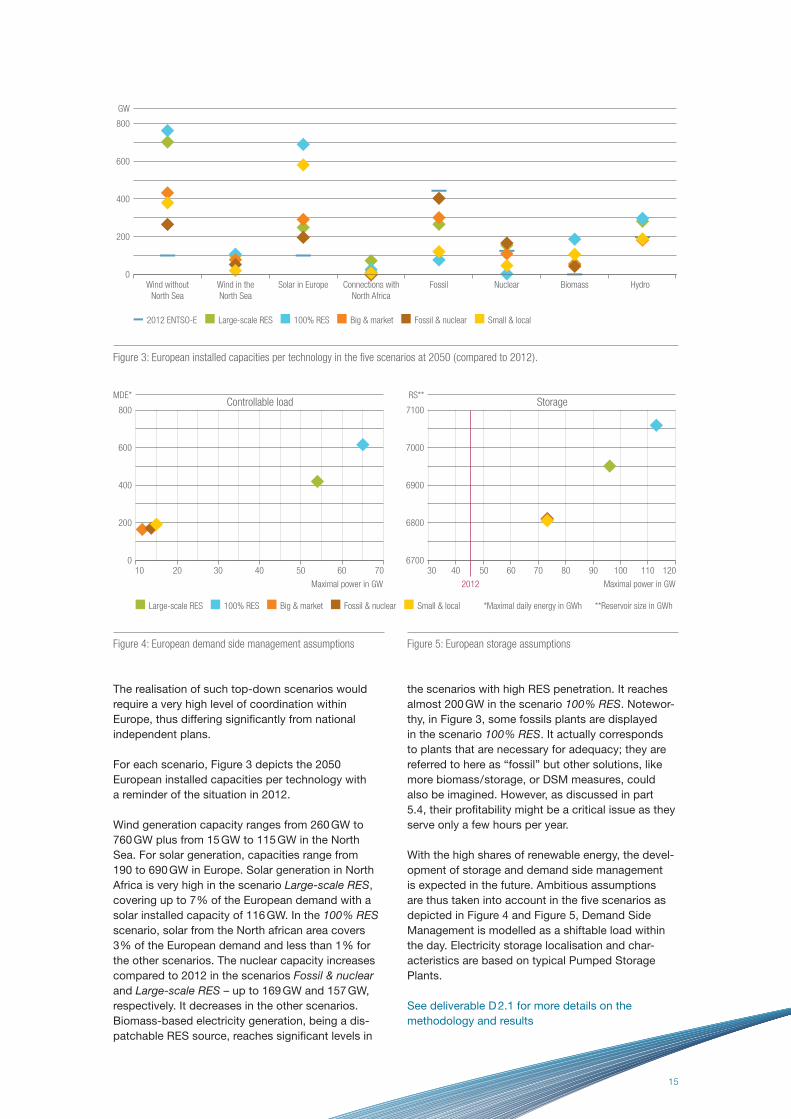
For each scenario, Figure 3 depicts the 2050
European installed capacities per technology with
a reminder of the situation in 2012.
Wind generation capacity ranges from 260 GW to
760 GW plus from 15 GW to 115 GW in the North
Sea. For solar generation, capacities range from
190 to 690 GW in Europe. Solar generation in North
Africa is very high in the scenario Large-scale RES,
covering up to 7 % of the European demand with a
solar installed capacity of 116 GW. In the 100 % RES
scenario, solar from the North african area covers
3 % of the European demand and less than 1 % for
the other scenarios. The nuclear capacity increases
compared to 2012 in the scenarios Fossil & nuclear
and Large-scale RES – up to 169 GW and 157 GW,
respectively. It decreases in the other scenarios.
Biomass-based electricity generation, being a dis-
patchable RES source, reaches signifi cant levels in
the scenarios with high RES penetration. It reaches
almost 200 GW in the scenario 100 % RES. Notewor-
thy, in Figure 3, some fossils plants are displayed
in the scenario 100 % RES. It actually corresponds
to plants that are necessary for adequacy; they are
referred to here as “fossil” but other solutions, like
more biomass / storage, or DSM measures, could
also be imagined. However, as discussed in part
5.4, their profi tability might be a critical issue as they
serve only a few hours per year.
With the high shares of renewable energy, the devel-
opment of storage and demand side management
is expected in the future. Ambitious assumptions
are thus taken into account in the fi ve scenarios as
depicted in Figure 4 and Figure 5, Demand Side
Management is modelled as a shiftable load within
the day. Electricity storage localisation and char-
acteristics are based on typical Pumped Storage
Plants.
See deliverable D 2.1 for more details on the
methodology and results
Figure 3: European installed capacities per technology in the fi ve scenarios at 2050 ( compared to 2012 ).
Figure 4: European demand side management assumptions Figure 5: European storage assumptions
Wind in the
North Sea
Wind without
North Sea
Connections with
North Africa
Solar in Europe Fossil Nuclear Biomass Hydro0
400
200
600
800
GW
2012 ENTSO-E Large-scale RES 100% RES Big & market Fossil & nuclear Small & local
2010 30 40 50 60 70
Maximal power in GW Maximal power in GW
*Maximal daily energy in GWh **Reservoir size in GWh
0
400
200
600
800
MDE*
40
2012
30 50 60 70 80 12090 100 1106700
6900
6800
7000
7100
RS**
Large-scale RES 100% RES Big & market Fossil & nuclear Small & local
Controllable load Storage
16 | e-Highway2050: Europe’s future secure and sustainable electricity infrastructure
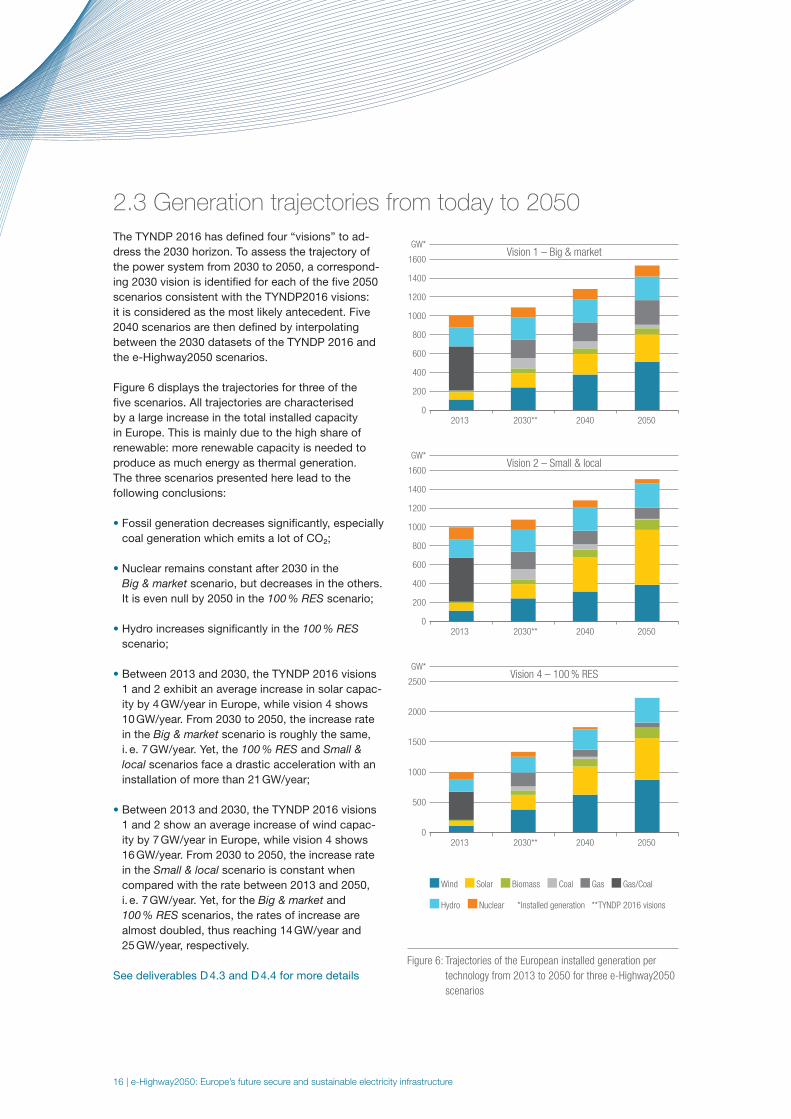
2.3 Generation trajectories from today to 2050
The TYNDP 2016 has defi ned four “visions” to ad-
dress the 2030 horizon. To assess the trajectory of
the power system from 2030 to 2050, a correspond-
ing 2030 vision is identifi ed for each of the fi ve 2050
scenarios consistent with the TYNDP2016 visions:
it is considered as the most likely antecedent. Five
2040 scenarios are then defi ned by interpolating
between the 2030 datasets of the TYNDP 2016 and
the e-Highway2050 scenarios.
Figure 6 displays the trajectories for three of the
fi ve scenarios. All trajectories are characterised
by a large increase in the total installed capacity
in Europe. This is mainly due to the high share of
renewable: more renewable capacity is needed to
produce as much energy as thermal generation.
The three scenarios presented here lead to the
following conclusions:
• Fossil generation decreases signifi cantly, especially
coal generation which emits a lot of CO₂;
• Nuclear remains constant after 2030 in the
Big & market scenario, but decreases in the others.
It is even null by 2050 in the 100 % RES scenario;
• Hydro increases signifi cantly in the 100 % RES
scenario;
• Between 2013 and 2030, the TYNDP 2016 visions
1 and 2 exhibit an average increase in solar capac-
ity by 4 GW/year in Europe, while vision 4 shows
10 GW/year. From 2030 to 2050, the increase rate
in the Big & market scenario is roughly the same,
i. e. 7 GW/year. Yet, the 100 % RES and Small &
local scenarios face a drastic acceleration with an
installation of more than 21 GW/year;
• Between 2013 and 2030, the TYNDP 2016 visions
1 and 2 show an average increase of wind capac-
ity by 7 GW/year in Europe, while vision 4 shows
16 GW/year. From 2030 to 2050, the increase rate
in the Small & local scenario is constant when
compared with the rate between 2013 and 2050,
i. e. 7 GW/year. Yet, for the Big & market and
100 % RES scenarios, the rates of increase are
almost doubled, thus reaching 14 GW/year and
25 GW/year, respectively.
See deliverables D 4.3 and D 4.4 for more details
Figure 6: Trajectories of the European installed generation per
technology from 2013 to 2050 for three e-Highway2050
scenarios
Vision 1 – Big & market
2013 2030** 2040 20500
600
1000
1400
1600
400
200
800
1200
GW*
Vision 2 – Small & local
0
600
1000
1400
1600
400
200
800
1200
GW*
2013 2030** 2040 2050
Vision 4 – 100 % RES
0
1000
1500
2500
500
2000
GW*
Wind
Hydro
2013 2030** 2040 2050
Solar Biomass Coal Gas/CoalGas
Nuclear *Installed generation **TYNDP 2016 visions
17
96IE
95UK94UK
93UK
109NS115NS 116NS
114NS
38DK42DK
30NL31DE
34DE
32DE44PL
45PL
41PL
42PL 100EA
43PL
46SK
58HU 59RO
60RO
61RO
66BG
101MI68GR
67MK
62HR
63BA 65RS
70AL
64ME
57SI
69GR
40CZ39CZ
50AT49AT47CH48CH
52IT
53IT
54IT
55IT
56IT
98IT
51AT
33DE28BE
26FR27FR
25FR24FR
26FR17FR
21FR22FR
23FR
14FR
03ES
07ES
02ES02ES
12TP
13TP 08ES
11ES
10ES09ES
05ES
04ES
06ES
15FR
19FR20FR
16FR
99FR
35DE
36DE 37DE
85NO
74FI
75FI
73EE
78LV
77LT
87SE
86SE
84NO
83NO
82NO81NO
80NO
79NO88SE
89SE108NS
107NS
106NS
113NS
112NS
111NS
110NS
92UK
90UK
91UK
102MA 103DZ 104TN
105LY
Figure 7: Model with 100 clusters: For the study, the European power system is represented via a zonal model with 100 clusters.
Demand and installed capacities for each generation technology have been defi ned per cluster, and for each scenario.
© EuroGeographics for the administrative boundaries
Figure 8: Storage capacities: The additional storage capacities
assumed by the project concern only pump-storage
technology.
2012
2012 20500
60
80
120
40
20
100
GW*
2050 minimum 2050 maximum *Installed capacity
18 | e-Highway2050: Europe’s future secure and sustainable electricity infrastructure
3 The potential grid
bottlenecks by 2050
The fi rst step of the analysis is to assess, based upon
the generation capacities and the demand foreseen
by 2050 in the different scenarios, whether the 2030
transmission grid could be appropriate without any new
investments or where congestions might occur. To do
so, an equivalent grid model is implemented allowing to
perform “system simulations” in order to pinpoint the im-
pacts of the grid limitations. The possibility to implement
non-grid solutions is then briefl y discussed
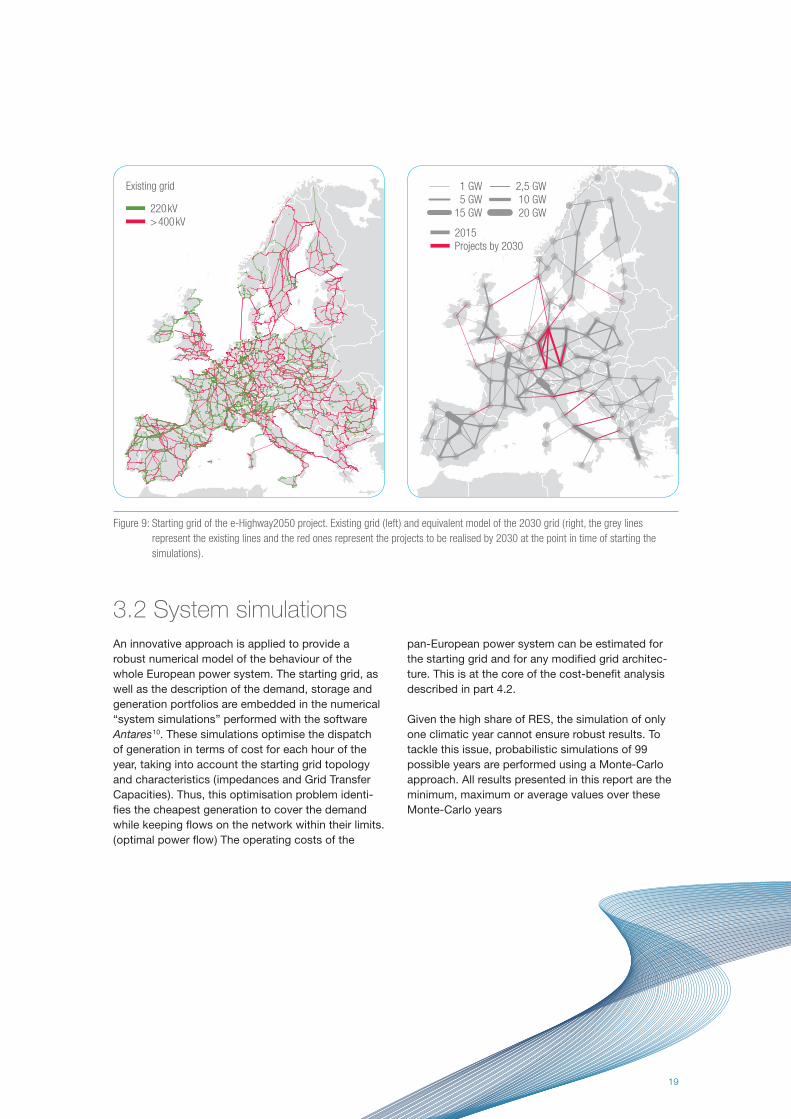
3.1 Initial conditions: the starting grid
The scope of the project covers the period
2030 – 2050, thus the starting grid, which represents
the initial conditions for the transmission grid, is set
with the following assumptions:
• the transmission network existing today will still
be in operation in 2050, i. e. the existing overhead
lines and cable links will have the same topology
and characteristics in 2050, even if they have been
refurbished;
• the transmission network developments for 2030,
foreseen by the TYNDP 2014,9 which include, for
example, major North-South HVDC corridors in
Germany ( see Figure 9 ) and some interconnections
with North Africa ( depending on the scenario ), will
all be completed.
Based on a detailed model of this transmission net-
work ( made of more than 8 000 nodes ), an equivalent
grid model of one hundred clusters is computed to
best match the fl ows occurring on the real grid. For
each line of this simplifi ed model, an equivalent im-
pedance and a Grid Transfer Capacity ( GTC ) is esti-
mated. This equivalent model provides the grid initial
conditions, i. e. the starting grid, for the simulations.
The detailed model and the starting grid are shown
in Figure 9. As can be seen on the right-side of the
graph below, the starting grid considered is already
well-developed, especially in continental Europe. It is
already a major step toward the electricity highways.
See deliverable D 2.2 for more details
-
19
3.2 System simulations
An innovative approach is applied to provide a
robust numerical model of the behaviour of the
whole European power system. The starting grid, as
well as the description of the demand, storage and
generation portfolios are embedded in the numerical
“system simulations” performed with the software
Antares 10. These simulations optimise the dispatch
of generation in terms of cost for each hour of the
year, taking into account the starting grid topology
and characteristics ( impedances and Grid Transfer
Capacities ). Thus, this optimisation problem identi-
fi es the cheapest generation to cover the demand
while keeping fl ows on the network within their limits.
( optimal power fl ow ) The operating costs of the
pan-European power system can be estimated for
the starting grid and for any modifi ed grid architec-
ture. This is at the core of the cost-benefi t analysis
described in part 4.2.
Given the high share of RES, the simulation of only
one climatic year cannot ensure robust results. To
tackle this issue, probabilistic simulations of 99
possible years are performed using a Monte-Carlo
approach. All results presented in this report are the
minimum, maximum or average values over these
Monte-Carlo years
220kV>400kV
Existing grid
Figure 9: Starting grid of the e-Highway2050 project. Existing grid ( left ) and equivalent model of the 2030 grid ( right, the grey lines
represent the existing lines and the red ones represent the projects to be realised by 2030 at the point in time of starting the
simulations ).
1 GW5 GW
15 GW
2,5 GW10 GW20 GW
2015Projects by 2030
20 | e-Highway2050: Europe’s future secure and sustainable electricity infrastructure
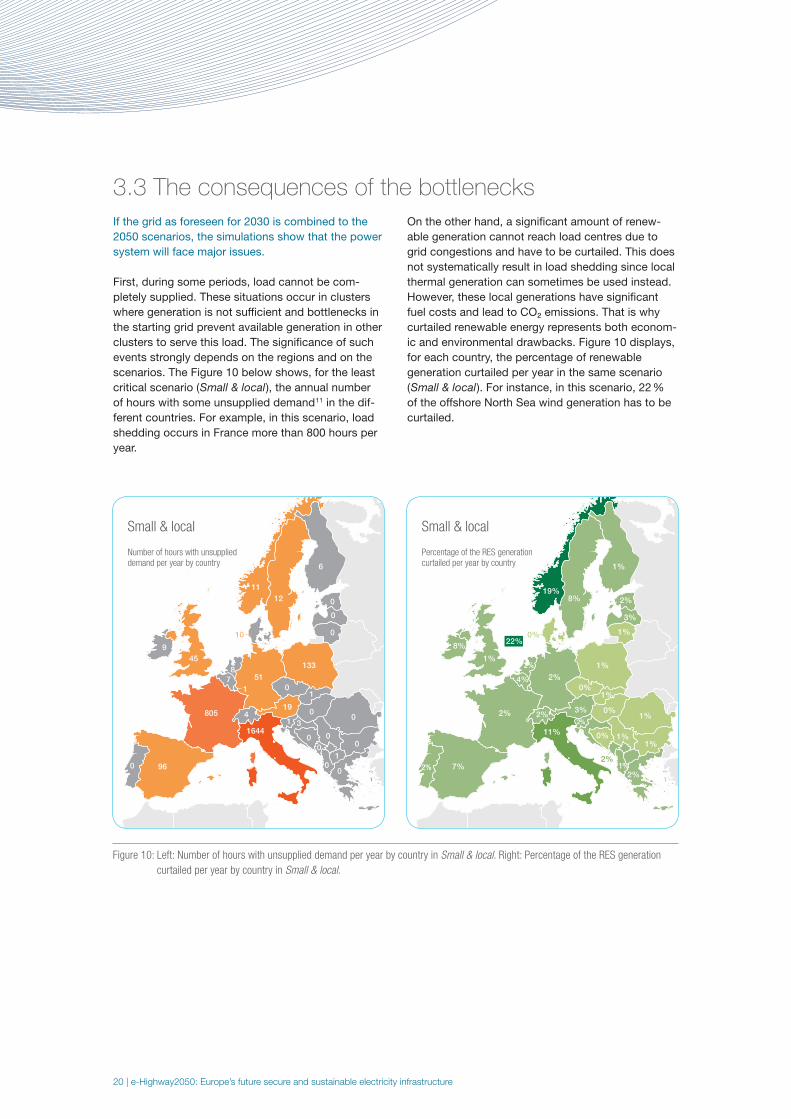
3.3 The consequences of the bottlenecks
If the grid as foreseen for 2030 is combined to the
2050 scenarios, the simulations show that the power
system will face major issues.
First, during some periods, load cannot be com-
pletely supplied. These situations occur in clusters
where generation is not suffi cient and bottlenecks in
the starting grid prevent available generation in other
clusters to serve this load. The signifi cance of such
events strongly depends on the regions and on the
scenarios. The Figure 10 below shows, for the least
critical scenario ( Small & local ), the annual number
of hours with some unsupplied demand 11 in the dif-
ferent countries. For example, in this scenario, load
shedding occurs in France more than 800 hours per
year.
On the other hand, a signifi cant amount of renew-
able generation cannot reach load centres due to
grid congestions and have to be curtailed. This does
not systematically result in load shedding since local
thermal generation can sometimes be used instead.
However, these local generations have signifi cant
fuel costs and lead to CO₂ emissions. That is why
curtailed renewable energy represents both econom-
ic and environmental drawbacks. Figure 10 displays,
for each country, the percentage of renewable
generation curtailed per year in the same scenario
( Small & local ). For instance, in this scenario, 22 %
of the offshore North Sea wind generation has to be
curtailed.
805
96
51
19
8
10
0
0
0
01
1 34
1
00
00
0
0
0
0
71
45
9
0
133
12
6
11
1644
Small & local
Number of hours with unsupplied demand per year by country
Figure 10: Left: Number of hours with unsupplied demand per year by country in Small & local. Right: Percentage of the RES generation
curtailed per year by country in Small & local.
2%
7%
2%
3%
2%
2%
0%
2%
3%
1%
0%1%
2%0%
0%
1%
1%
2%1%
1%
2%
4%
1%
8%
2%
1%
8%
1%
19%
22%
11%
Small & local
Percentage of the RES generation curtailed per year by country
21
3.4 Potential solutions excluding
transmission grid development
Several options to cope with the above transmis-
sion network bottlenecks are available: some are
discussed hereafter based on indicative qualitative
analyses but could be further investigated. Such
solutions could indeed be alternatives to the trans-
mission grid development ( which is the scope of the
e-Highway2050 project and is addressed in-depth
in Section 4 ). Let us mention generation, electricity
storage or Demand Side Management ( DSM ).
Invest in more thermal generation capacities where needed
Load shedding can be avoided by installing more
fossil-fuel peak power plants near these loads.
Based on the results of the numerical simulations
for the whole Europe, the capacity of such addi-
tional generation would be at least 60 GW in the less
severe scenario ( Small & local ) and at least 140 GW
in the most critical one ( 100 % RES ). Their respec-
tive contribution to yearly generation would then be
5 and 50 TWh. The cost of such additional genera-
tion would range between 5 and 25 billion Euros
per year 12. Despite these signifi cantly high costs,
more thermal generation would be unable to solve
the problem of RES spillage and would increase the
resulting CO₂ emissions.
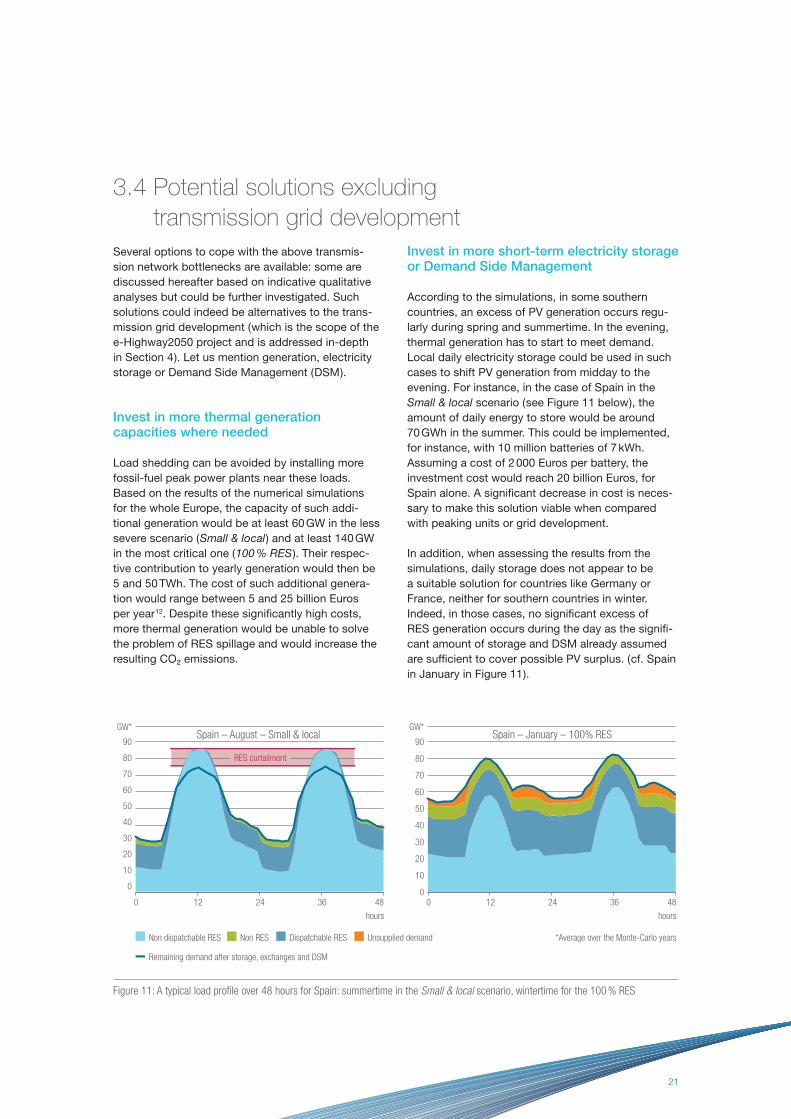
Invest in more short-term electricity storage or Demand Side Management
According to the simulations, in some southern
countries, an excess of PV generation occurs regu-
larly during spring and summertime. In the evening,
thermal generation has to start to meet demand.
Local daily electricity storage could be used in such
cases to shift PV generation from midday to the
evening. For instance, in the case of Spain in the
Small & local scenario ( see Figure 11 below ), the
amount of daily energy to store would be around
70 GWh in the summer. This could be implemented,
for instance, with 10 million batteries of 7 kWh.
Assuming a cost of 2 000 Euros per battery, the
investment cost would reach 20 billion Euros, for
Spain alone. A signifi cant decrease in cost is neces-
sary to make this solution viable when compared
with peaking units or grid development.
In addition, when assessing the results from the
simulations, daily storage does not appear to be
a suitable solution for countries like Germany or
France, neither for southern countries in winter.
Indeed, in those cases, no signifi cant excess of
RES generation occurs during the day as the signifi -
cant amount of storage and DSM already assumed
are suffi cient to cover possible PV surplus. ( cf. Spain
in January in Figure 11 ).
Figure 11: A typical load profi le over 48 hours for Spain: summertime in the Small & local scenario, wintertime for the 100 % RES
120 24 36 48
hours
120 24 36 48
hours
*Average over the Monte-Carlo years
0
40
20
60
90
80
30
10
50
70
GW*
0
40
20
60
90
30
10
50
80
70
GW*
Non dispatchable RES Dispatchable RES Unsupplied demand
Remaining demand after storage, exchanges and DSM
Non RES
Spain – August – Small & local Spain – January – 100% RES
RES curtailment
-
22 | e-Highway2050: Europe’s future secure and sustainable electricity infrastructure
Invest in more PV generation and storage
Load shedding occurs almost exclusively in the
evening in winter. At that time, more PV generation
cannot help or should be combined with electric-
ity storage. Considering the cost of storage and
PV generation and also the low PV load factor in
winter, the cost of this solution is extremely high.
For instance, in the 100% RES scenario, more
than 70 GWh of load are not supplied in the winter
evenings in Spain ( Figure 11 ). With a PV load fac-
tor around 11 % in winter, an increase of at least
30 GW 13 of PV would be necessary for an investment
cost of 42 b€ ( assuming 1.4 b€ / GW ) plus 20 b€ of
batteries for Spain only. This additional PV genera-
tion would be almost completely curtailed in summer
or even more storage should be considered.
Invest in more wind generation
In the case of Spain in the 100 % RES scenario
( Figure 11 ), load shedding occurs in winter for an
average of 4 GW. Delivering an average 4 GW would
require the development of at least 17 GW of wind
power.14 In this scenario, the installed wind capacity
in Spain is already 70 GW out of a potential estimat-
ed at 80 GW.15 Thus installing 17 GW of extra wind
power capacity seems unrealistic, at least for this
scenario. Moreover, assuming an investment cost
of 1 b€ / GW, it would cost at least 17 billion Euros
for Spain alone. In general, the RES capacities in
the e-Highway2050 scenarios are already extremely
ambitious, and the extra costs to further increase
them would be high.
e-Highway2050 focuses on transmission solutions
Additional studies could be performed to assess
the techno-economic effi ciency of the solutions
proposed above and also other options like for
instance Power to Gas. A combination of all the
solutions might even lead to more promising an-
swers to the system challenges. The e-Highway2050
project aims at only assessing grid solutions in
detail. Transmission grid development is expected
to be a very effi cient solution since it combines the
following assets:
• It can transport renewable energy from areas where
it is not needed to load centres. This is typically the
case for the North Sea offshore wind parks or for
RES generation in Scandinavia;
• It enables areas having very different load and
generation patterns to support each other. For
instance, southern countries can export PV
generation during the day to northern Europe and
during the night northern Europe can export wind
generation to southern consumption areas;
• It can smooth the RES fl uctuations between
European countries. For instance, France and
Germany may not encounter high winds during
the same periods.
-
23
4 The power grid
infrastructure suited for a low
carbon economy by 2050
Thanks to the electric system simulations described
above, several transmission grid architectures can be
compared to assess their techno-economic profi tability.
The purpose of the grid development process is to
fi nd an optimal solution between two extreme op-
tions:
• No further reinforcements are implemented be-
yond 2030. The grid investments are then minimal:
yet, the generation operating costs of the power
system are high since grid congestion can prevent
from using the cheapest generation units ( see the
simulation results shown in Section 3.3 ).
• Infi nite capacities are built between all the clusters
of the starting grid ( the so-called “copper plate”
assumption ). The grid investment is then virtu-
ally infi nite, but the operating costs of the power
system are minimal since the cheapest generation
units can always be used whatever their location
is.
For each scenario, a methodology is thus applied to
defi ne an effi cient grid architecture from a European
techno-economic perspective. It relies on iterative
simulations to assess the impact of different grid
architectures.
The granularity of the results presented here is not as
accurate as in a study that would tackle shorter time
horizons, using a full grid model ( like for instance
the TYNDP approach of ENTSO-E ).The clustering
approach enables focusing on transmission needs
between clusters only, thus being unable to detail the
needs for intra-cluster reinforcements. The priority
is therefore given to the detection of major electric
energy transmission issues, meaning long distance
and large capacity reinforcements ( often higher than
2 GW ), forgetting about the possible necessity of
smaller reinforcements. Quite often, more than one
route is possible to reach the same electric system
objective. As a result, it may be possible to identify
routes which differ from those suggested in the
study, but which fulfi l similar requirements.
The approach relies on estimated GTC as a result
the operational issues of the grid were not fully as-
sessed. Additional investment to ensure operability
might be necessary but their cost should be small in
comparison to the ones discussed here.
See deliverable D 2.3 for more details
-
24 | e-Highway2050: Europe’s future secure and sustainable electricity infrastructure
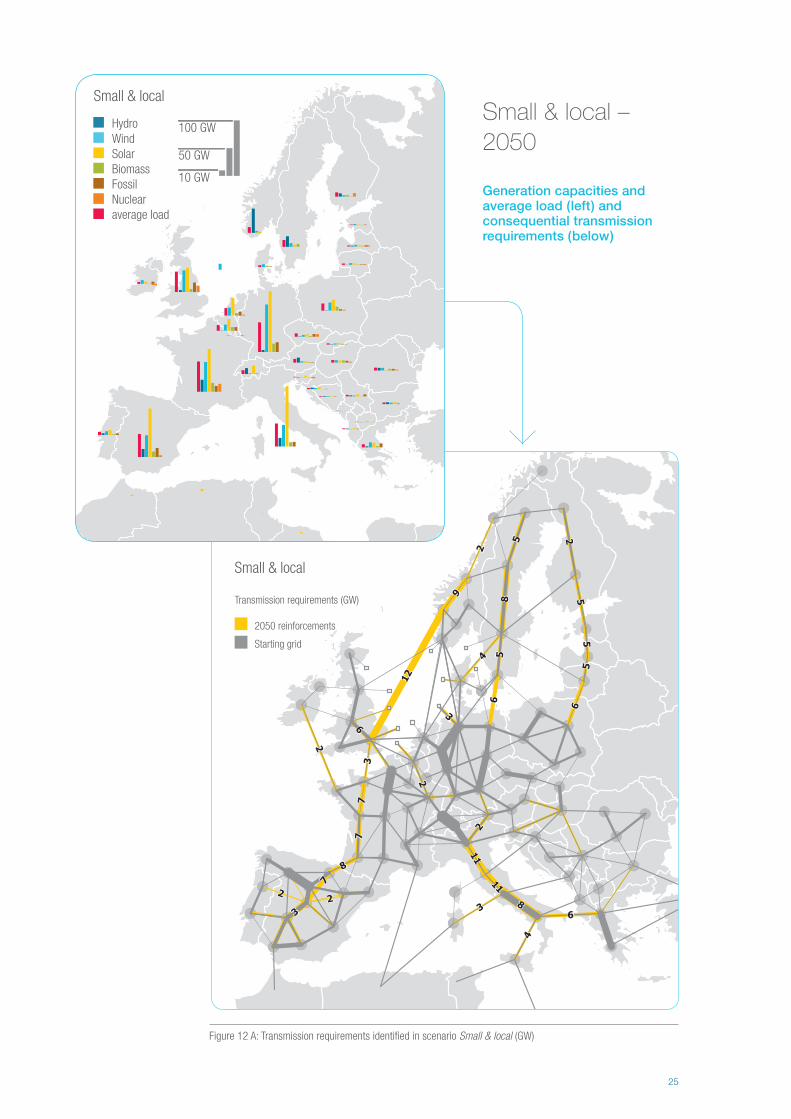
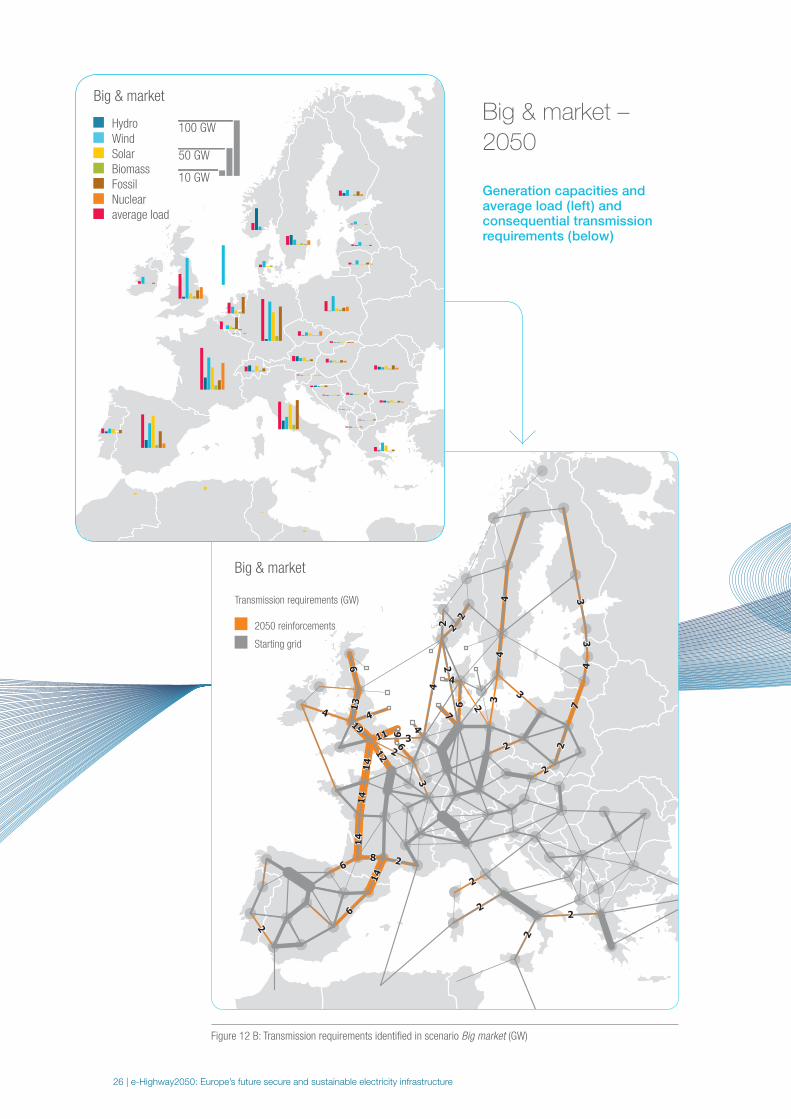
4.1 Grid architectures for 2050
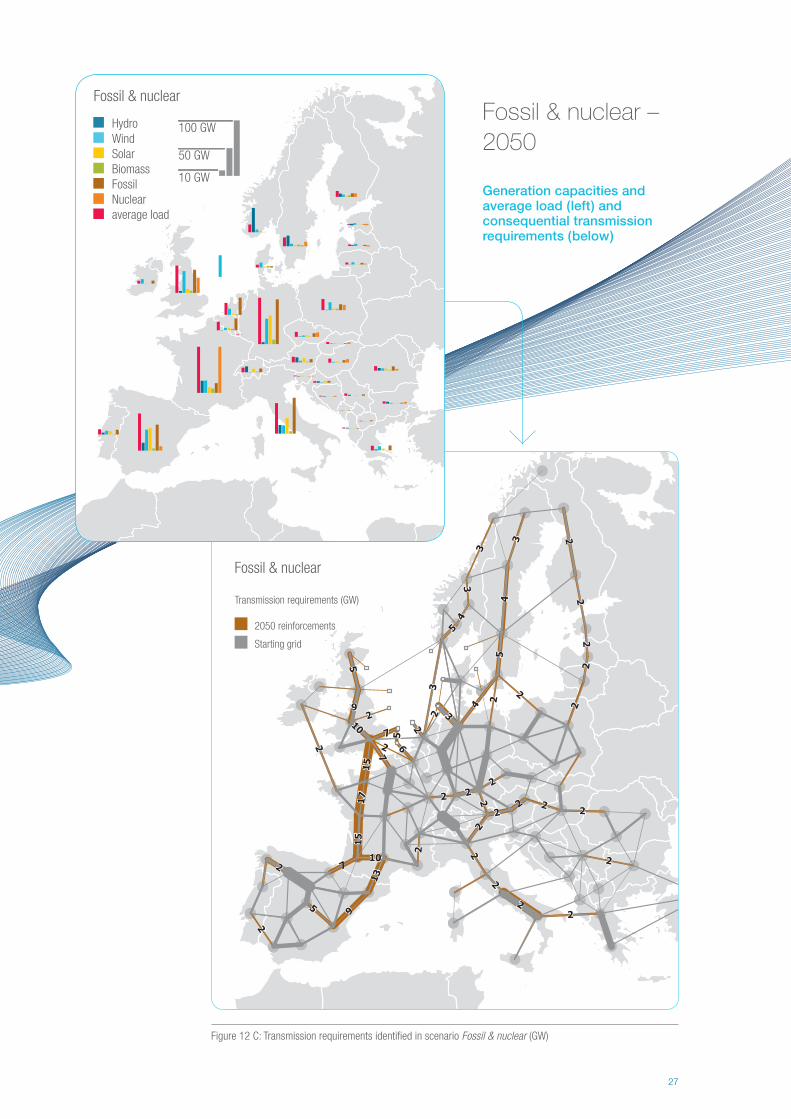
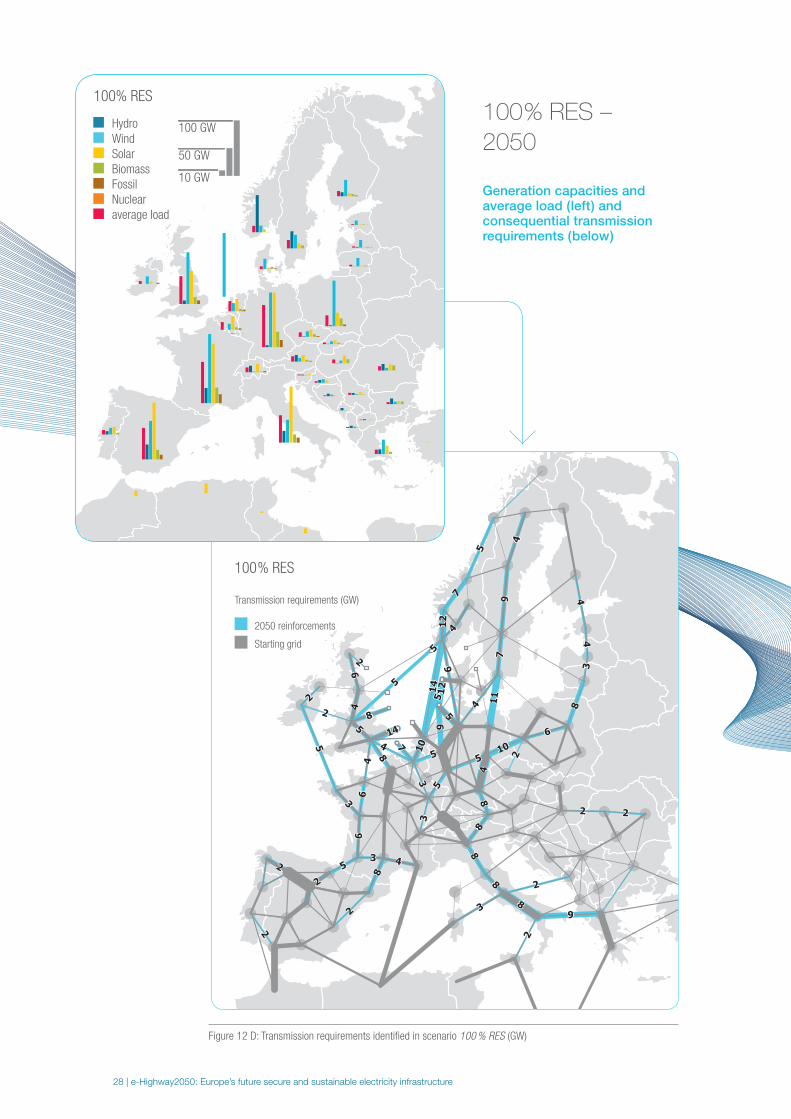
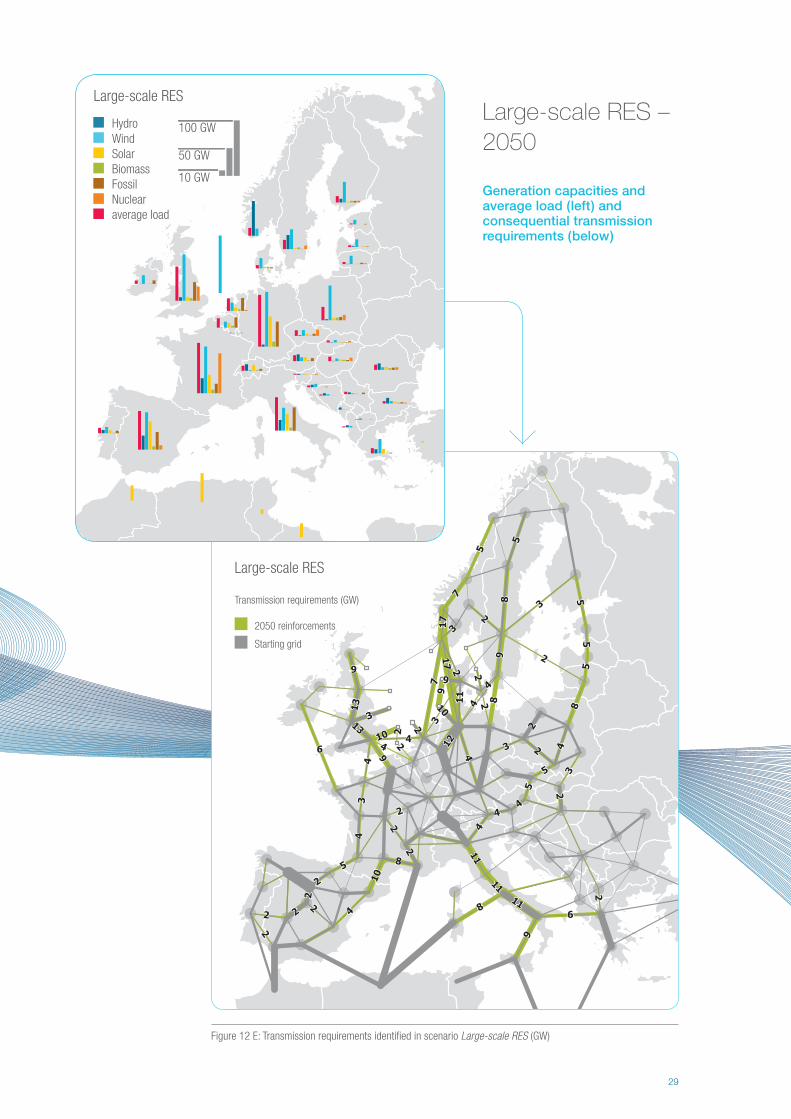
Figures 12 A to E provide an overview of the generation
installed capacity and the proposed new transmission
reinforcements in support of each of the fi ve scenarios.
At fi rst glance, the predominance of “North to South”
corridors appears clearly: all scenarios have several
reinforcements that connect the North of the pan-
European electricity system ( North Sea, Scandinavia,
UK, Ireland ), and southern countries ( like Spain and
Italy ), to the continental synchronous area ( northern
Germany, Poland, Netherlands, Belgium and France )
The scenarios 100 % RES and Large-scale RES
lead to greater transmission requirements ( size and
distance ) than the Small & local and Fossil fuel &
nuclear scenarios. Large-scale RES and 100 % RES
show the importance of major infrastructures in
the center of the continental system. This adds to
the peripheral network investments required by all
the scenarios: the volumes of renewables in both
scenarios, especially coming from the North Sea, are
such that all the corridors from these sources to the
major load centres need to be reinforced.
25
Figure 12 A: Transmission requirements identifi ed in scenario Small & local (GW)
Small & local
Transmission requirements (GW)
2050 reinforcements
Starting grid
10 GW
50 GW
100 GWHydro
Wind
Solar
Biomass
Fossil
Nuclear
average load
Small & local
Small & local –
2050
Generation capacities and average load ( left ) and consequential transmission requirements ( below )
Small & local
Transmission requirements (GW)
2050 reinforcements
Starting grid
26 | e-Highway2050: Europe’s future secure and sustainable electricity infrastructure
Figure 12 B: Transmission requirements identifi ed in scenario Big market (GW)
Big & market
Transmission requirements (GW)
2050 reinforcements
Starting grid
10 GW
50 GW
100 GWHydro
Wind
Solar
Biomass
Fossil
Nuclear
average load
Big & market
Big & market –
2050
Generation capacities and average load ( left ) and consequential transmission requirements ( below )
Big & market
Transmission requirements (GW)
2050 reinforcements
Starting grid
-
27
Figure 12 C: Transmission requirements identifi ed in scenario Fossil & nuclear (GW)
Fossil & nuclear
Transmission requirements (GW)
2050 reinforcements
Starting grid
10 GW
50 GW
100 GWHydro
Wind
Solar
Biomass
Fossil
Nuclear
average load
Fossil & nuclear
Fossil & nuclear –
2050
Generation capacities and average load ( left ) and consequential transmission requirements ( below )
Fossil & nuclear
Transmission requirements (GW)
2050 reinforcements
Starting grid
-
28 | e-Highway2050: Europe’s future secure and sustainable electricity infrastructure
Figure 12 D: Transmission requirements identifi ed in scenario 100 % RES (GW)
100% RES
Transmission requirements (GW)
2050 reinforcements
Starting grid
10 GW
50 GW
100 GWHydro
Wind
Solar
Biomass
Fossil
Nuclear
average load
100% RES
100 % RES –
2050
Generation capacities and average load ( left ) and consequential transmission requirements ( below )
100% RES
Transmission requirements (GW)
2050 reinforcements
Starting grid
29
Figure 12 E: Transmission requirements identifi ed in scenario Large-scale RES (GW)
Large-scale RES
Transmission requirements (GW)
2050 reinforcements
Starting grid
10 GW
50 GW
100 GWHydro
Wind
Solar
Biomass
Fossil
Nuclear
average load
Large-scale RES
Large-scale RES –
2050
Generation capacities and average load ( left ) and consequential transmission requirements ( below )
Large-scale RES
Transmission requirements (GW)
2050 reinforcements
Starting grid
30 | e-Highway2050: Europe’s future secure and sustainable electricity infrastructure
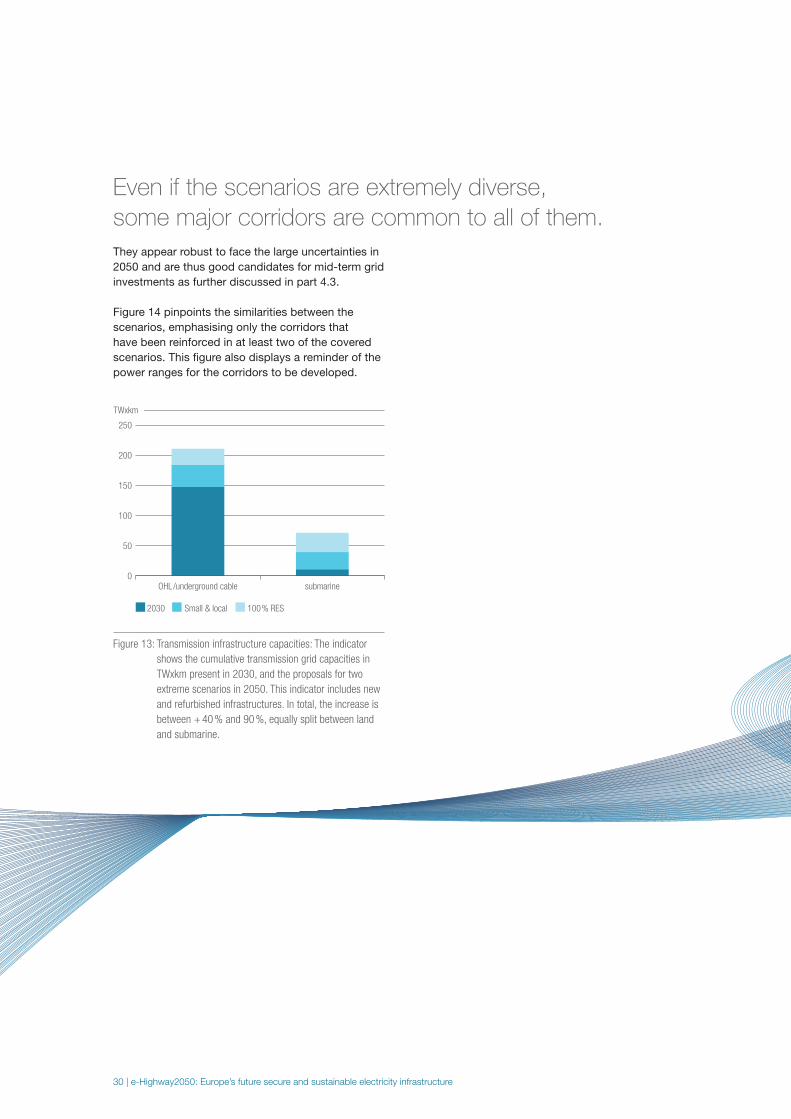
Even if the scenarios are extremely diverse,
some major corridors are common to all of them.
They appear robust to face the large uncertainties in
2050 and are thus good candidates for mid-term grid
investments as further discussed in part 4.3.
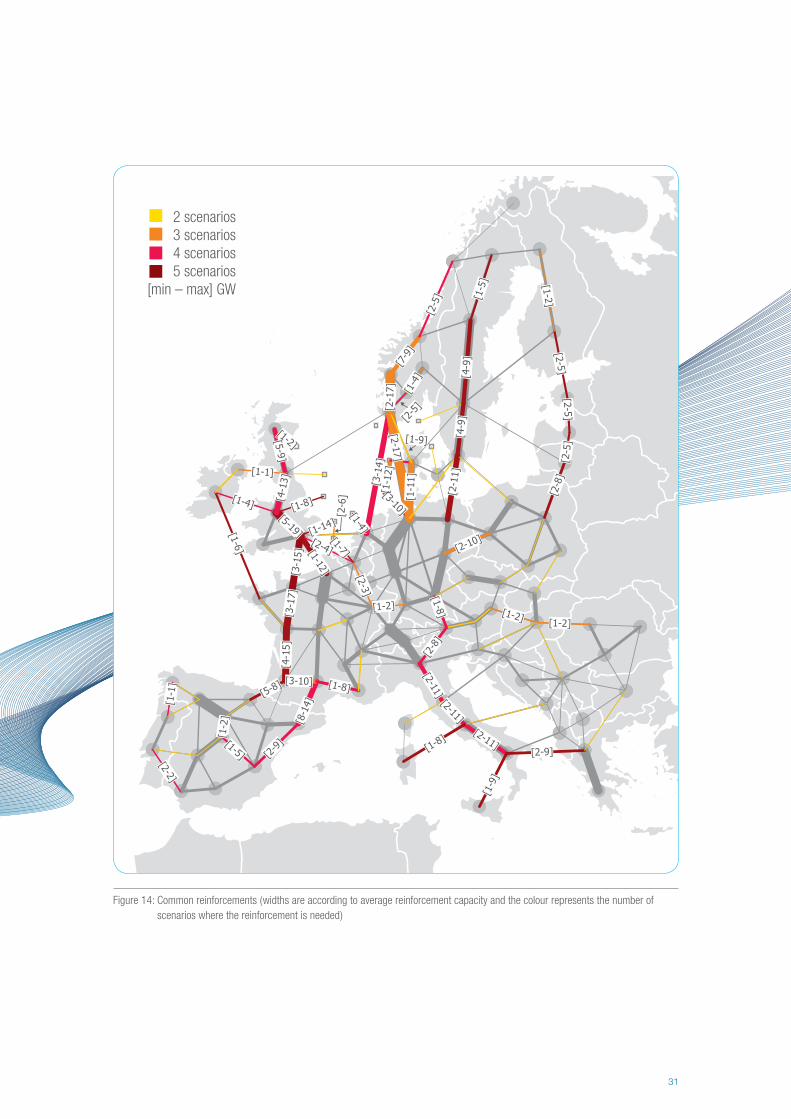
Figure 14 pinpoints the similarities between the
scenarios, emphasising only the corridors that
have been reinforced in at least two of the covered
scenarios. This fi gure also displays a reminder of the
power ranges for the corridors to be developed.
Figure 13: Transmission infrastructure capacities: The indicator
shows the cumulative transmission grid capacities in
TWxkm present in 2030, and the proposals for two
extreme scenarios in 2050. This indicator includes new
and refurbished infrastructures. In total, the increase is
between + 40 % and 90 %, equally split between land
and submarine.
2030
OHL/underground cable submarine
100% RESSmall & local
0
100
150
250
50
200
TWxkm
-
31
Figure 14: Common reinforcements ( widths are according to average reinforcement capacity and the colour represents the number of
scenarios where the reinforcement is needed )
2 scenarios3 scenarios4 scenarios5 scenarios
[min – max] GW
32 | e-Highway2050: Europe’s future secure and sustainable electricity infrastructure
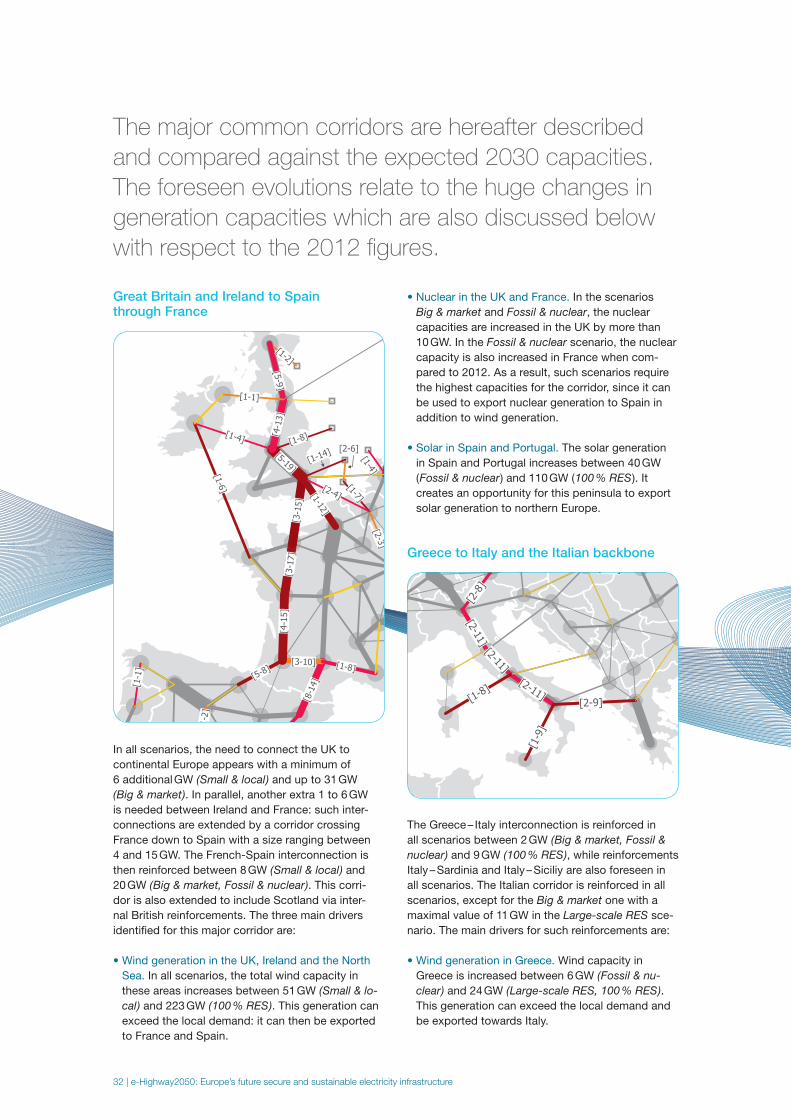
The major common corridors are hereafter described
and compared against the expected 2030 capacities.
The foreseen evolutions relate to the huge changes in
generation capacities which are also discussed below
with respect to the 2012 fi gures.
Great Britain and Ireland to Spain through France
In all scenarios, the need to connect the UK to
continental Europe appears with a minimum of
6 additional GW ( Small & local ) and up to 31 GW
( Big & market ). In parallel, another extra 1 to 6 GW
is needed between Ireland and France: such inter-
connections are extended by a corridor crossing
France down to Spain with a size ranging between
4 and 15 GW. The French-Spain interconnection is
then reinforced between 8 GW ( Small & local ) and
20 GW ( Big & market, Fossil & nuclear ). This corri-
dor is also extended to include Scotland via inter-
nal British reinforcements. The three main drivers
identifi ed for this major corridor are:
• Wind generation in the UK, Ireland and the North
Sea. In all scenarios, the total wind capacity in
these areas increases between 51 GW ( Small & lo-
cal ) and 223 GW ( 100 % RES ). This generation can
exceed the local demand: it can then be exported
to France and Spain.
• Nuclear in the UK and France. In the scenarios
Big & market and Fossil & nuclear, the nuclear
capacities are increased in the UK by more than
10 GW. In the Fossil & nuclear scenario, the nuclear
capacity is also increased in France when com-
pared to 2012. As a result, such scenarios require
the highest capacities for the corridor, since it can
be used to export nuclear generation to Spain in
addition to wind generation.
• Solar in Spain and Portugal. The solar generation
in Spain and Portugal increases between 40 GW
( Fossil & nuclear ) and 110 GW ( 100 % RES ). It
creates an opportunity for this peninsula to export
solar generation to northern Europe.
Greece to Italy and the Italian backbone
The Greece – Italy interconnection is reinforced in
all scenarios between 2 GW ( Big & market, Fossil &
nuclear ) and 9 GW ( 100 % RES ), while reinforcements
Italy – Sardinia and Italy – Siciliy are also foreseen in
all scenarios. The Italian corridor is reinforced in all
scenarios, except for the Big & market one with a
maximal value of 11 GW in the Large-scale RES sce-
nario. The main drivers for such reinforcements are:
• Wind generation in Greece. Wind capacity in
Greece is increased between 6 GW ( Fossil & nu-
clear ) and 24 GW ( Large-scale RES, 100 % RES ).
This generation can exceed the local demand and
be exported towards Italy.
-
33
• Solar generation in Italy. The solar generation in
Italy increases between 15 GW ( Fossil & nuclear )
and 96 GW ( Small & local ). Although it is mainly
located in the North of the country close to the
demand centres, signifi cant volumes still need to
be transported from the South to the North of the
country.
• Connection to North Africa. In the scenarios
Large-scale RES and 100 % RES, signifi cant
connections from Northern African Countries to
Italy are assumed ( 40 GW in Large-scale RES and
10 GW in 100 % RES ). The solar generation coming
from these countries need to cross Italy to reach
large electricity demand centres.
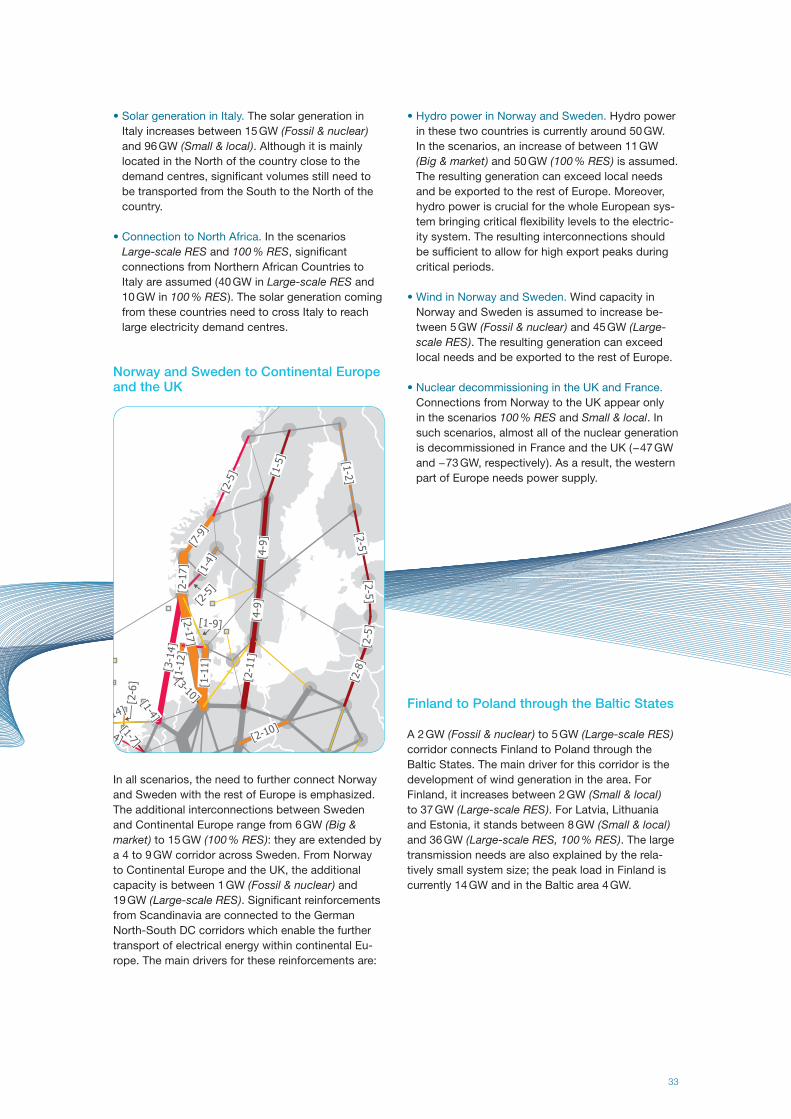
Norway and Sweden to Continental Europe and the UK
In all scenarios, the need to further connect Norway
and Sweden with the rest of Europe is emphasized.
The additional interconnections between Sweden
and Continental Europe range from 6 GW ( Big &
market ) to 15 GW ( 100 % RES ): they are extended by
a 4 to 9 GW corridor across Sweden. From Norway
to Continental Europe and the UK, the additional
capacity is between 1 GW ( Fossil & nuclear ) and
19 GW ( Large-scale RES ). Signifi cant reinforcements
from Scandinavia are connected to the German
North-South DC corridors which enable the further
transport of electrical energy within continental Eu-
rope. The main drivers for these reinforcements are:
• Hydro power in Norway and Sweden. Hydro power
in these two countries is currently around 50 GW.
In the scenarios, an increase of between 11 GW
( Big & market ) and 50 GW ( 100 % RES ) is assumed.
The resulting generation can exceed local needs
and be exported to the rest of Europe. Moreover,
hydro power is crucial for the whole European sys-
tem bringing critical fl exibility levels to the electric-
ity system. The resulting interconnections should
be suffi cient to allow for high export peaks during
critical periods.
• Wind in Norway and Sweden. Wind capacity in
Norway and Sweden is assumed to increase be-
tween 5 GW ( Fossil & nuclear ) and 45 GW ( Large-
scale RES ). The resulting generation can exceed
local needs and be exported to the rest of Europe.
• Nuclear decommissioning in the UK and France.
Connections from Norway to the UK appear only
in the scenarios 100 % RES and Small & local. In
such scenarios, almost all of the nuclear generation
is decommissioned in France and the UK ( − 47 GW
and − 73 GW, respectively ). As a result, the western
part of Europe needs power supply.
Finland to Poland through the Baltic States
A 2 GW ( Fossil & nuclear ) to 5 GW ( Large-scale RES )
corridor connects Finland to Poland through the
Baltic States. The main driver for this corridor is the
development of wind generation in the area. For
Finland, it increases between 2 GW ( Small & local )
to 37 GW ( Large-scale RES ). For Latvia, Lithuania
and Estonia, it stands between 8 GW ( Small & local )
and 36 GW ( Large-scale RES, 100 % RES ). The large
transmission needs are also explained by the rela-
tively small system size; the peak load in Finland is
currently 14 GW and in the Baltic area 4 GW.
34 | e-Highway2050: Europe’s future secure and sustainable electricity infrastructure
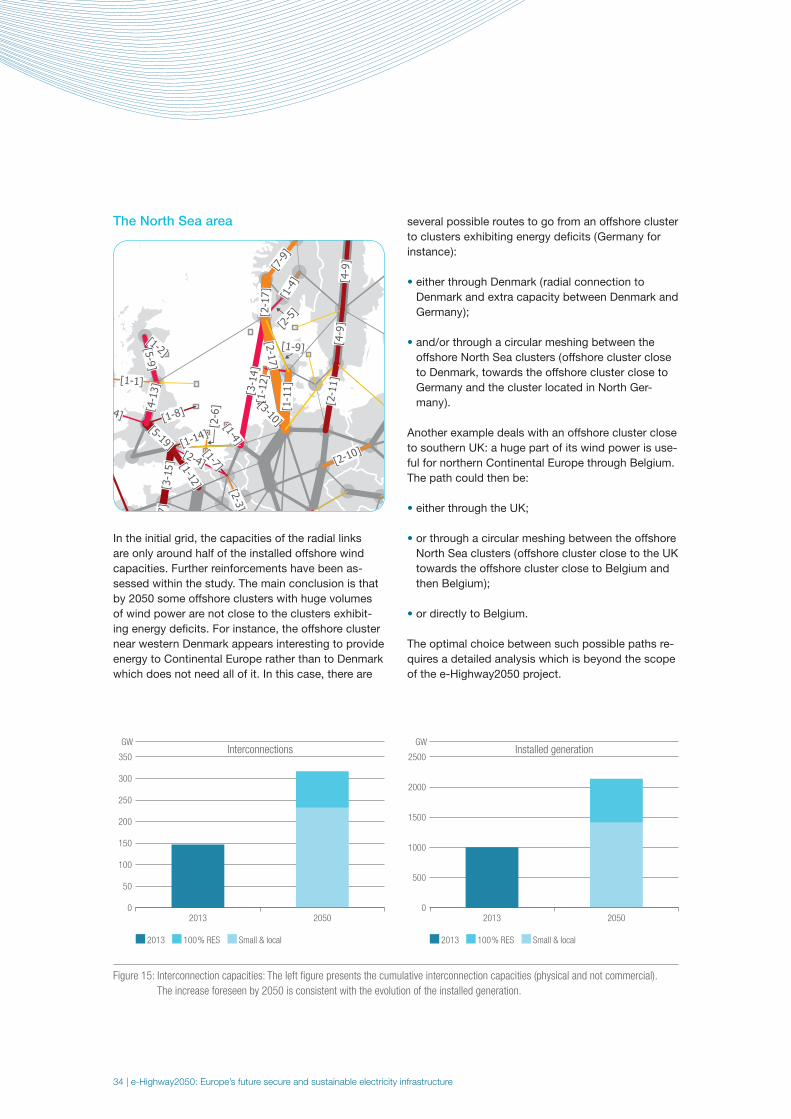
The North Sea area
In the initial grid, the capacities of the radial links
are only around half of the installed offshore wind
capacities. Further reinforcements have been as-
sessed within the study. The main conclusion is that
by 2050 some offshore clusters with huge volumes
of wind power are not close to the clusters exhibit-
ing energy defi cits. For instance, the offshore cluster
near western Denmark appears interesting to provide
energy to Continental Europe rather than to Denmark
which does not need all of it. In this case, there are
several possible routes to go from an offshore cluster
to clusters exhibiting energy defi cits ( Germany for
instance ):
• either through Denmark ( radial connection to
Denmark and extra capacity between Denmark and
Germany );
• and/or through a circular meshing between the
offshore North Sea clusters ( offshore cluster close
to Denmark, towards the offshore cluster close to
Germany and the cluster located in North Ger-
many ).
Another example deals with an offshore cluster close
to southern UK: a huge part of its wind power is use-
ful for northern Continental Europe through Belgium.
The path could then be:
• either through the UK;
• or through a circular meshing between the offshore
North Sea clusters ( offshore cluster close to the UK
towards the offshore cluster close to Belgium and
then Belgium );
• or directly to Belgium.
The optimal choice between such possible paths re-
quires a detailed analysis which is beyond the scope
of the e-Highway2050 project.
Figure 15: Interconnection capacities: The left fi gure presents the cumulative interconnection capacities (physical and not commercial).
The increase foreseen by 2050 is consistent with the evolution of the installed generation.
2013
2013 2050
100% RES Small & local
Interconnections
0
200
250
350
150
100
50
300
GW
2013
2013 2050
100% RES Small & local
Installed generation
0
1000
1500
2500
500
2000
GW
35
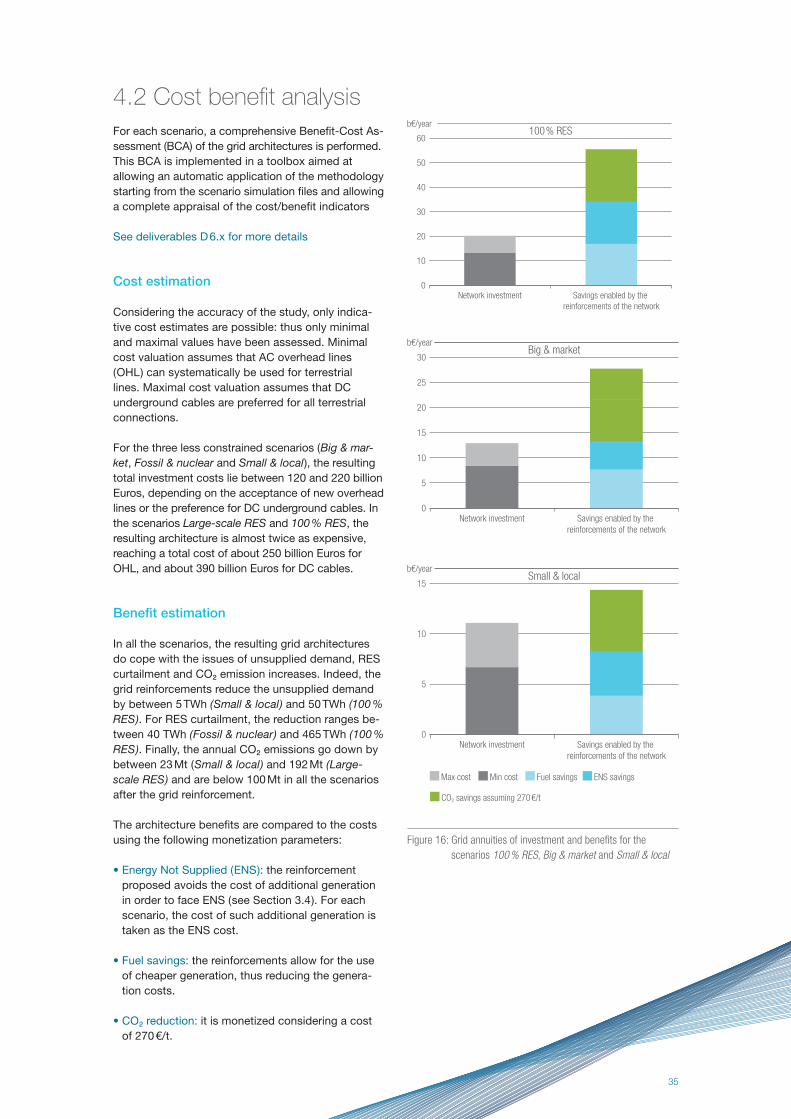
4.2 Cost benefi t analysis
For each scenario, a comprehensive Benefi t-Cost As-
sessment (BCA) of the grid architectures is performed.
This BCA is implemented in a toolbox aimed at
allowing an automatic application of the methodology
starting from the scenario simulation fi les and allowing
a complete appraisal of the cost/benefi t indicators
See deliverables D 6.x for more details
Cost estimation
Considering the accuracy of the study, only indica-
tive cost estimates are possible: thus only minimal
and maximal values have been assessed. Minimal
cost valuation assumes that AC overhead lines
( OHL ) can systematically be used for terrestrial
lines. Maximal cost valuation assumes that DC
underground cables are preferred for all terrestrial
connections.
For the three less constrained scenarios ( Big & mar-
ket, Fossil & nuclear and Small & local ), the resulting
total investment costs lie between 120 and 220 billion
Euros, depending on the acceptance of new overhead
lines or the preference for DC underground cables. In
the scenarios Large-scale RES and 100 % RES, the
resulting architecture is almost twice as expensive,
reaching a total cost of about 250 billion Euros for
OHL, and about 390 billion Euros for DC cables.
Benefi t estimation
In all the scenarios, the resulting grid architectures
do cope with the issues of unsupplied demand, RES
curtailment and CO₂ emission increases. Indeed, the
grid reinforcements reduce the unsupplied demand
by between 5 TWh ( Small & local ) and 50 TWh (100 %
RES ). For RES curtailment, the reduction ranges be-
tween 40 TWh ( Fossil & nuclear ) and 465 TWh ( 100 %
RES ). Finally, the annual CO₂ emissions go down by
between 23 Mt ( Small & local ) and 192 Mt ( Large-
scale RES ) and are below 100 Mt in all the scenarios
after the grid reinforcement.
The architecture benefi ts are compared to the costs
using the following monetization parameters:
• Energy Not Supplied ( ENS ): the reinforcement
proposed avoids the cost of additional generation
in order to face ENS ( see Section 3.4 ). For each
scenario, the cost of such additional generation is
taken as the ENS cost.
• Fuel savings: the reinforcements allow for the use
of cheaper generation, thus reducing the genera-
tion costs.
• CO₂ reduction: it is monetized considering a cost
of 270 €/t.
Figure 16: Grid annuities of investment and benefi ts for the
scenarios 100 % RES, Big & market and Small & local
Network investment Savings enabled by the
reinforcements of the network
100% RES
0
30
40
60
20
10
50
b€/year
Big & market
0
15
20
30
10
5
25
b€/year
Network investment Savings enabled by the
reinforcements of the network
Small & local
0
15
10
5
b€/year
Max cost
Network investment Savings enabled by the
reinforcements of the network
CO2 savings assuming 270€/t
Min cost Fuel savings ENS savings
36 | e-Highway2050: Europe’s future secure and sustainable electricity infrastructure
Depending upon the studied scenario, the annuities
of investment lie between 10 and 20 billion Euros
assuming a discount rate of 5 % whereas the annual
benefi ts lie between 14 and 55 billion Euros, with
the expected benefi ts largely exceeding the fore-
seen costs in all the scenarios ( see three of the fi ve
scenarios in Figure 16 ). Actually, for all the scenarios,
except the Small & local one, the investment costs
are even covered without considering the benefi ts
coming from CO₂ emissions.
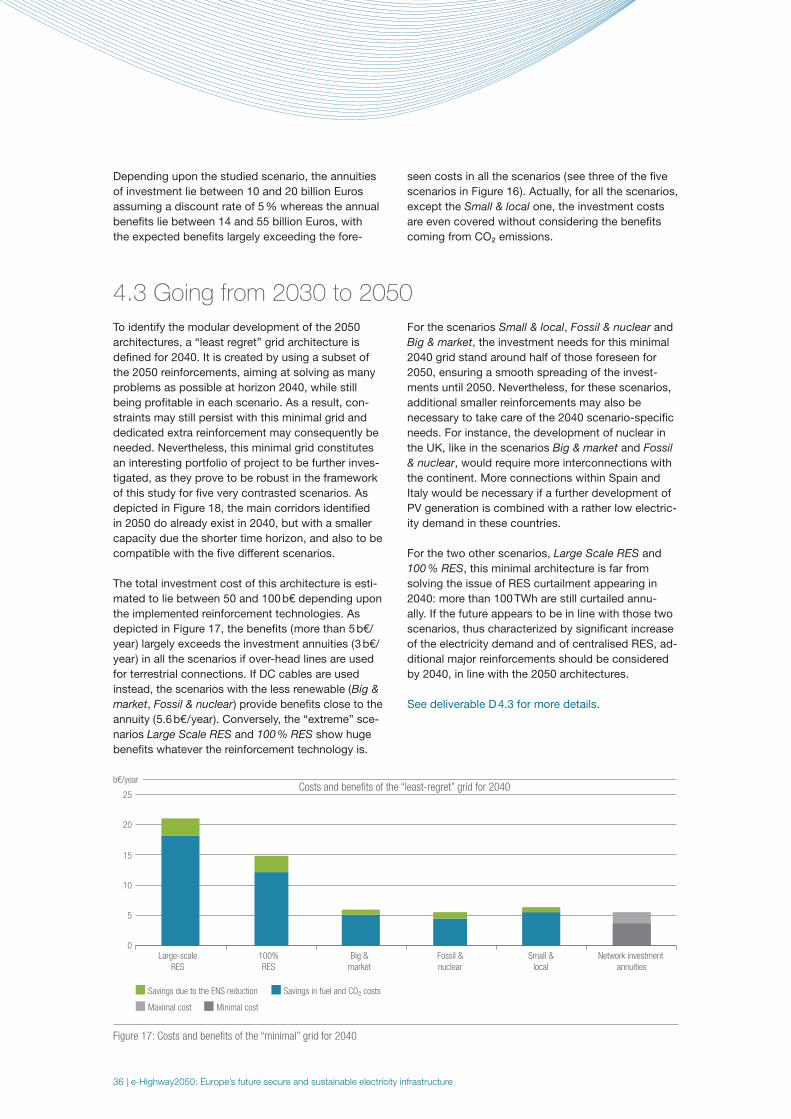
4.3 Going from 2030 to 2050
To identify the modular development of the 2050
architectures, a “least regret” grid architecture is
defi ned for 2040. It is created by using a subset of
the 2050 reinforcements, aiming at solving as many
problems as possible at horizon 2040, while still
being profi table in each scenario. As a result, con-
straints may still persist with this minimal grid and
dedicated extra reinforcement may consequently be
needed. Nevertheless, this minimal grid constitutes
an interesting portfolio of project to be further inves-
tigated, as they prove to be robust in the framework
of this study for fi ve very contrasted scenarios. As
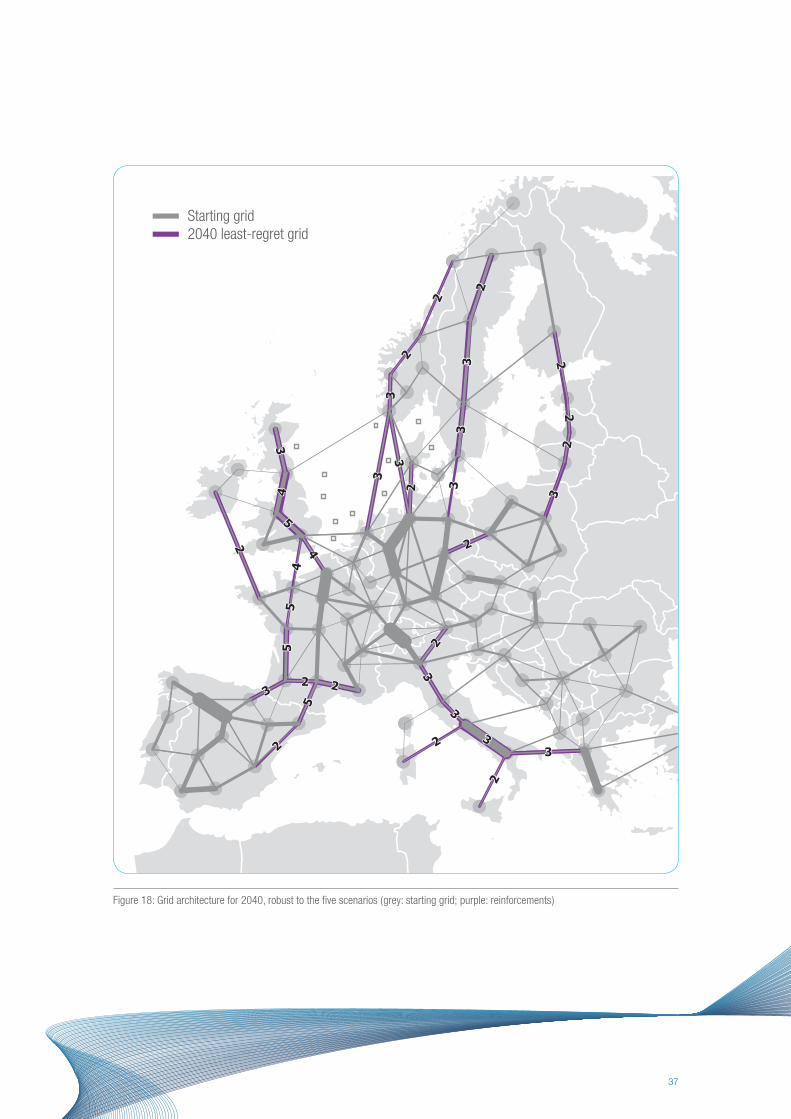
depicted in Figure 18, the main corridors identifi ed
in 2050 do already exist in 2040, but with a smaller
capacity due the shorter time horizon, and also to be
compatible with the fi ve different scenarios.
The total investment cost of this architecture is esti-
mated to lie between 50 and 100 b€ depending upon
the implemented reinforcement technologies. As
depicted in Figure 17, the benefi ts ( more than 5 b€/
year ) largely exceeds the investment annuities ( 3 b€/
year ) in all the scenarios if over-head lines are used
for terrestrial connections. If DC cables are used
instead, the scenarios with the less renewable ( Big &
market, Fossil & nuclear ) provide benefi ts close to the
annuity ( 5.6 b€ / year ). Conversely, the “extreme” sce-
narios Large Scale RES and 100 % RES show huge
benefi ts whatever the reinforcement technology is.
For the scenarios Small & local, Fossil & nuclear and
Big & market, the investment needs for this minimal
2040 grid stand around half of those foreseen for
2050, ensuring a smooth spreading of the invest-
ments until 2050. Nevertheless, for these scenarios,
additional smaller reinforcements may also be
necessary to take care of the 2040 scenario-specifi c
needs. For instance, the development of nuclear in
the UK, like in the scenarios Big & market and Fossil
& nuclear, would require more interconnections with
the continent. More connections within Spain and
Italy would be necessary if a further development of
PV generation is combined with a rather low electric-
ity demand in these countries.
For the two other scenarios, Large Scale RES and
100 % RES, this minimal architecture is far from
solving the issue of RES curtailment appearing in
2040: more than 100 TWh are still curtailed annu-
ally. If the future appears to be in line with those two
scenarios, thus characterized by signifi cant increase
of the electricity demand and of centralised RES, ad-
ditional major reinforcements should be considered
by 2040, in line with the 2050 architectures.
See deliverable D 4.3 for more details.
Figure 17: Costs and benefi ts of the “minimal” grid for 2040
Savings due to the ENS reduction
Costs and benefits of the “least-regret” grid for 2040
Large-scale
RES
100%
RES
Fossil &
nuclear
Small &
local
Network investment
annuities
Big &
market
Maximal cost Minimal cost
Savings in fuel and CO2 costs
0
10
5
15
20
25
b€/year
-
37
Figure 18: Grid architecture for 2040, robust to the fi ve scenarios ( grey: starting grid; purple: reinforcements )
Starting grid2040 least-regret grid
Starting grid2040 least-regret grid
38 | e-Highway2050: Europe’s future secure and sustainable electricity infrastructure
5 How to deploy and
operate the resulting
grid architectures ?
5.1 Which technology ?
The cooperation in the e-highway2050 consortium
between TSOs and manufacturers (T & D Europe and
Europacable) has allowed the identifi cation of tech-
nological needs, beyond what is today commercially
available, keeping in mind that the cluster approach
prevents from addressing specifi c requirements for a
given reinforcement. An available technology option16
herein means either an already implemented solution
in a transmission system in some other part of the
world, or a solution under development with an ex-
pected deployment under short-term time horizons17.
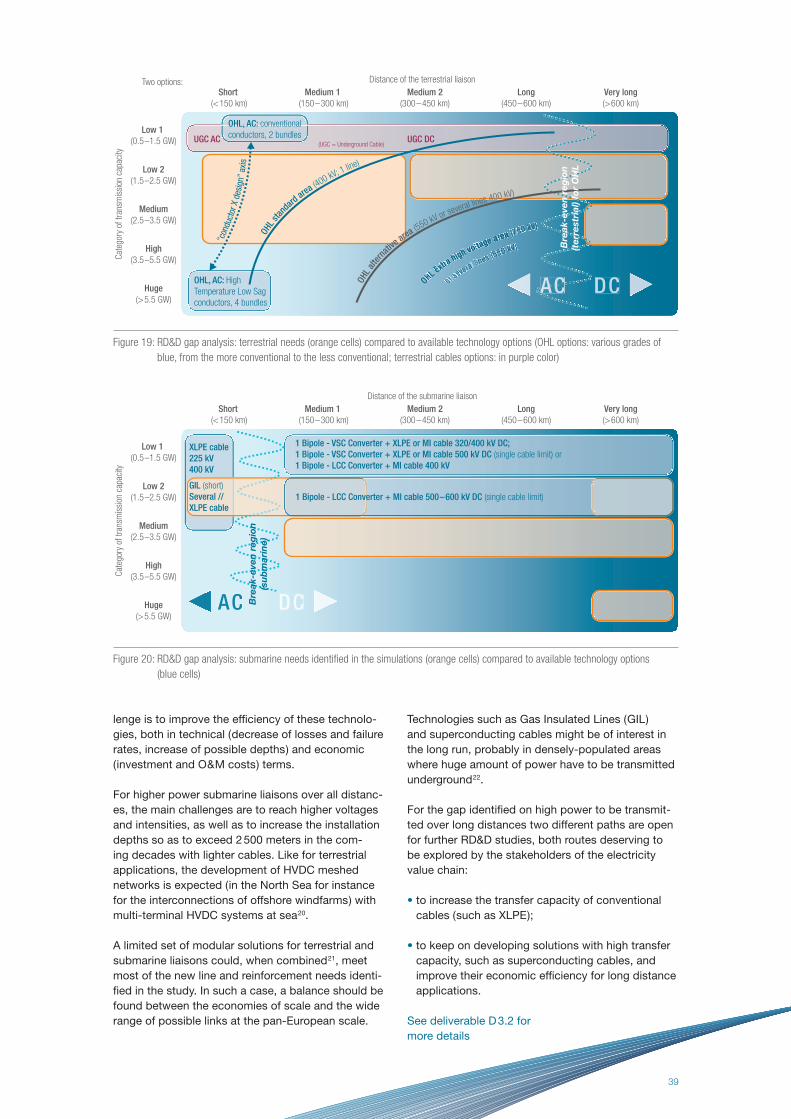
Figure 19 and Figure 20 depict the various gaps be-
tween the not yet covered areas by available techno-
logical options and the new lines and reinforcement
needs ( orange cells ) in a two-dimensional space, i. e.
power and distance. The orange cells in both fi gures
pinpoint the new lines and reinforcement needs com-
ing out from the grid architectures presented in sec-
tion 4. The light blue areas cover overhead line ( OHL )
technologies, whereas the dark blue ones stand for
solutions under development. The purple colour in
Figure 19 is dedicated to underground cable ( UGC )
solutions. The available technologies and the ones
under development have been mapped with the
list of technologies available in the e-Highway2050
database ( see deliverable D 3.1).
For terrestrial HVAC applications, in addition to the
widespread technologies for 400 kV OHL ( conven-
tional conductors and reduced number of bundles ),
the following options are of interest:
• HVAC overhead lines with different designs
( number of circuits ), various conductor types ( high
temperature low sag ) and more bundles so as to
reach higher power over short distances,
• HVAC XLPE underground cables 18, in order to
provide partial undergrounding solutions which will
complement overhead lines in sensitive areas or
areas where public acceptance of OHL is low,
• HVAC OHL consisting of several lines for very high
power and short to medium distances ( interest for
such solutions strongly relies upon the maximum
capacity of one line which is acceptable from the
TSO point of view, cf. N-1 security criteria in case
of a contingency )
For terrestrial HVDC applications, underground
cables have proven their reliability and attractive-
ness for long distance power transmission and are
now being seen as a solution for future long distance
transmission based on the experience gained from
long HVDC submarine cable links.
In the longer term, other options might be of
interest:
• higher voltage AC lines – typically 550 kV – when
addressing longer distances at medium power
( where several 400 kV lines could also provide an
acceptable solution ),
• with high power VSC converters, and more spe-
cifi cally switchgear equipment becoming mature
and gaining market experience, meshed HVDC
networks could become possible, thus creating
local meshed HVDC networks in Europe. HVDC
meshed networks could be implemented with OHL
technologies but also with HVDC cables over long
distances 19.
For submarine transmission network development,
there are today available technologies for all dis-
tances up to medium power, cf. Figure 20. The chal-
39
lenge is to improve the effi ciency of these technolo-
gies, both in technical ( decrease of losses and failure
rates, increase of possible depths ) and economic
( investment and O & M costs ) terms.
For higher power submarine liaisons over all distanc-
es, the main challenges are to reach higher voltages
and intensities, as well as to increase the installation
depths so as to exceed 2 500 meters in the com-
ing decades with lighter cables. Like for terrestrial
applications, the development of HVDC meshed
networks is expected ( in the North Sea for instance
for the interconnections of offshore windfarms ) with
multi-terminal HVDC systems at sea 20.
A limited set of modular solutions for terrestrial and
submarine liaisons could, when combined 21, meet
most of the new line and reinforcement needs identi-
fi ed in the study. In such a case, a balance should be
found between the economies of scale and the wide
range of possible links at the pan-European scale.
Technologies such as Gas Insulated Lines ( GIL )
and superconducting cables might be of interest in
the long run, probably in densely-populated areas
where huge amount of power have to be transmitted
underground 22.
For the gap identifi ed on high power to be transmit-
ted over long distances two different paths are open
for further RD&D studies, both routes deserving to
be explored by the stakeholders of the electricity
value chain:
• to increase the transfer capacity of conventional
cables ( such as XLPE );
• to keep on developing solutions with high transfer
capacity, such as superconducting cables, and
improve their economic effi ciency for long distance
applications.
See deliverable D 3.2 for
more details
Figure 20: RD&D gap analysis: submarine needs identifi ed in the simulations (orange cells) compared to available technology options
(blue cells)
Figure 19: RD&D gap analysis: terrestrial needs (orange cells) compared to available technology options (OHL options: various grades of
blue, from the more conventional to the less conventional; terrestrial cables options: in purple color)
Cat
egor
y of
tra
nsm
issi
on c
apac
ity
Low 1
(0.5–1.5 GW)
Short
(<150 km)
Distance of the terrestrial liaison
Medium 1
(150–300 km)
Medium 2
(300–450 km)
Long
(450–600 km)
Very long
(>600 km)
Low 2
(1.5–2.5 GW)
Medium
(2.5–3.5 GW)
High
(3.5–5.5 GW)
Huge
(>5.5 GW)
OHL
stan
dard
area (400 kV; 1 line)
Two options:
UGC AC(UGC = Underground Cable)
UGC DC
OHL, AC: High
Temperature Low Sag
conductors, 4 bundles
DCACACOHL Extra high vvoltaagge aarea (750 kVVkk ))VVV
orsev
erraal linees ((5550 kVkk )VV
OHL
alte
rnat
ive area (5
50 kV or several lines 400 kV)
Bre
ak-e
ven
reg
ion
(ter
rest
rial
) for
OH
L
OHL, AC: conventional
conductors, 2 bundles
“con
duct
or X
des
ign”
axi
s
Cat
egor
y of
tra
nsm
issi
on c
apac
ity
Low 1
(0.5–1.5 GW)
Short
(<150 km)
Distance of the submarine liaison
Medium 1
(150–300 km)
Medium 2
(300–450 km)
Long
(450–600 km)
Very long
(>600 km)
Low 2
(1.5–2.5 GW)
Medium
(2.5–3.5 GW)
High
(3.5–5.5 GW)
Huge
(>5.5 GW)AC DC
XLPE cable
225 kV
400 kV
GIL (short)
Several //
XLPE cable
1 Bipole - VSC Converter + XLPE or MI cable 320/400 kV DC;
1 Bipole - VSC Converter + XLPE or MI cable 500 kV DC (single cable limit) or
1 Bipole - LCC Converter + MI cable 400 kV
1 Bipole - LCC Converter + MI cable 500–600 kV DC (single cable limit)
Bre
ak-e
ven
reg
ion
(su
bm
arin
e)
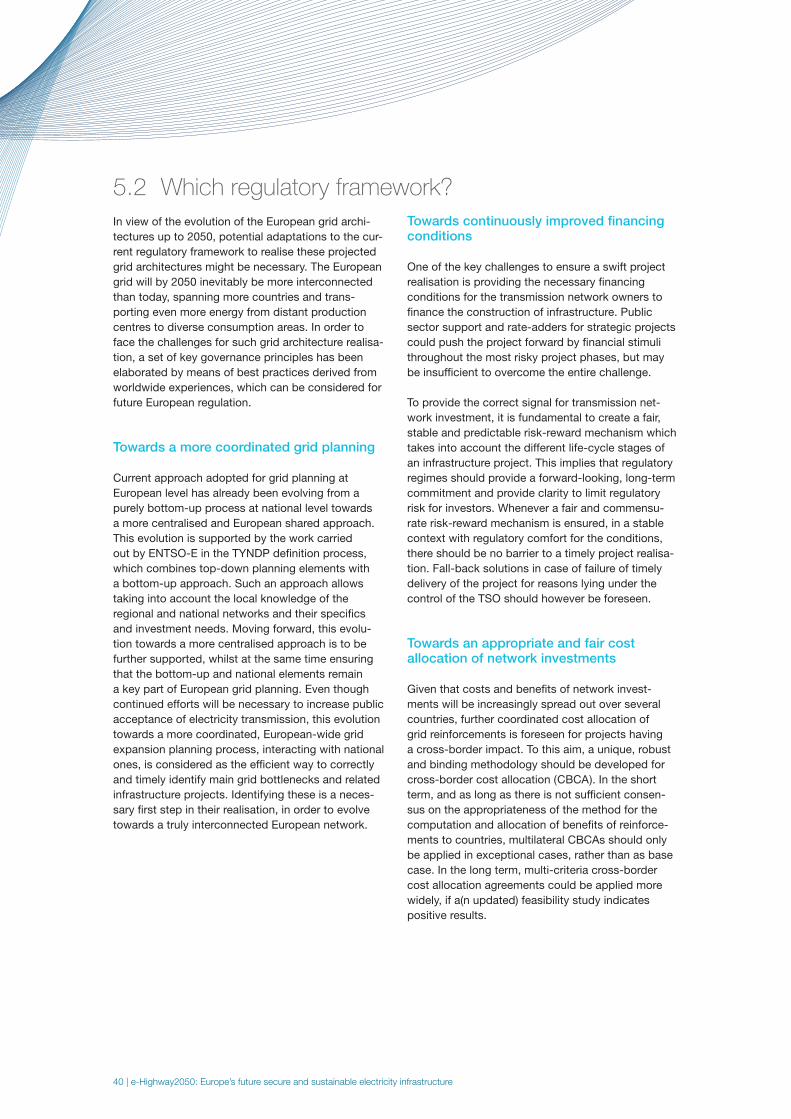
40 | e-Highway2050: Europe’s future secure and sustainable electricity infrastructure
5.2 Which regulatory framework?
In view of the evolution of the European grid archi-
tectures up to 2050, potential adaptations to the cur-
rent regulatory framework to realise these projected
grid architectures might be necessary. The European
grid will by 2050 inevitably be more interconnected
than today, spanning more countries and trans-
porting even more energy from distant production
centres to diverse consumption areas. In order to
face the challenges for such grid architecture realisa-
tion, a set of key governance principles has been
elaborated by means of best practices derived from
worldwide experiences, which can be considered for
future European regulation.
Towards a more coordinated grid planning
Current approach adopted for grid planning at
European level has already been evolving from a
purely bottom-up process at national level towards
a more centralised and European shared approach.
This evolution is supported by the work carried
out by ENTSO-E in the TYNDP defi nition process,
which combines top-down planning elements with
a bottom-up approach. Such an approach allows
taking into account the local knowledge of the
regional and national networks and their specifi cs
and investment needs. Moving forward, this evolu-
tion towards a more centralised approach is to be
further supported, whilst at the same time ensuring
that the bottom-up and national elements remain
a key part of European grid planning. Even though
continued efforts will be necessary to increase public
acceptance of electricity transmission, this evolution
towards a more coordinated, European-wide grid
expansion planning process, interacting with national
ones, is considered as the effi cient way to correctly
and timely identify main grid bottlenecks and related
infrastructure projects. Identifying these is a neces-
sary fi rst step in their realisation, in order to evolve
towards a truly interconnected European network.
Towards continuously improved fi nancing conditions
One of the key challenges to ensure a swift project
realisation is providing the necessary fi nancing
conditions for the transmission network owners to
fi nance the construction of infrastructure. Public
sector support and rate-adders for strategic projects
could push the project forward by fi nancial stimuli
throughout the most risky project phases, but may
be insuffi cient to overcome the entire challenge.
To provide the correct signal for transmission net-
work investment, it is fundamental to create a fair,
stable and predictable risk-reward mechanism which
takes into account the different life-cycle stages of
an infrastructure project. This implies that regulatory
regimes should provide a forward-looking, long-term
commitment and provide clarity to limit regulatory
risk for investors. Whenever a fair and commensu-
rate risk-reward mechanism is ensured, in a stable
context with regulatory comfort for the conditions,
there should be no barrier to a timely project realisa-
tion. Fall-back solutions in case of failure of timely
delivery of the project for reasons lying under the
control of the TSO should however be foreseen.
Towards an appropriate and fair cost allocation of network investments
Given that costs and benefi ts of network invest-
ments will be increasingly spread out over several
countries, further coordinated cost allocation of
grid reinforcements is foreseen for projects having
a cross-border impact. To this aim, a unique, robust
and binding methodology should be developed for
cross-border cost allocation ( CBCA ). In the short
term, and as long as there is not suffi cient consen-
sus on the appropriateness of the method for the
computation and allocation of benefi ts of reinforce-
ments to countries, multilateral CBCAs should only
be applied in exceptional cases, rather than as base
case. In the long term, multi-criteria cross-border
cost allocation agreements could be applied more
widely, if a(n updated) feasibility study indicates
positive results.
-
41
Furthermore, the higher complexity of electricity
systems by 2050, characterized by higher shares of
RES, more variable electricity demand (electric vehi-
cles, heat pumps), imply a higher diversity of costs
and benefi ts that network users incur on the system.
Since network charging structures currently often
take a typical average situation as point of departure,
increasing gaps between network charges and true
costs of network users for the grid are observed.
This results in a lack of incentives to generators and
loads for optimal use of the network in many mem-
ber states. Consequently, network costs could be
allocated as far as possible by applying the “benefi -
ciary pays” principle, which is theoretically the most
appropriate, but could be diffi cult to implement.
In any case, the future mechanism should provide
effi cient economic signals to all network users,
both generation and demand. Likewise, when RES
becomes a mainstream technology, RES network
costs should no longer be socialized through priority
access or dispatch, but allocated to RES facilities
that benefi t from them. Cost components that can-
not be indisputably allocated to a specifi c ( group of )
stakeholder( s ) and reliability network costs ( ‘N-1’
costs ) should however remain to be socialized.
Towards a more coordinated system operation
As for system operation aspects, further coordi-
nation between actors and integration of market
mechanisms needs to take place. First and foremost,
there is a clear need to complete the internal energy
market and to ensure regional market integration in
all time-frames ( forward, day-ahead, intra-day and
real-time ). The recent implementation of the fl ow-
based mechanism serves as an example for the
future in that regard. Related to that is the bidding
zone confi guration, which should be, as long as
zonal transmission capacity allocation is pursued,
confi gured in a way which corresponds to real net-
work bottlenecks.
Furthermore, it will be crucial to incentivise market
actors to ensure correct and rational behaviour
in order to tackle ever-increasing system security
aspects. Well-designed balancing markets are a key
requirement and electricity markets should contain a
well-defi ned resource adequacy objective. These ob-
jectives should be defi ned on a more regional basis.
If they lead to the elaboration of capacity markets,
then they should be deployed in a way compatible
with the European wide energy market. In addition,
and to deal with the high share of renewable genera-
tion, further regional security monitoring and control
mechanisms closer to real-time over larger geo-
graphical areas are put forward. Finally, integrated
systems will require further information exchange
and harmonization of procedures by means of com-
mon tools, data and processes among TSOs to deal
with the variable and uncertain cross-border power
fl ows.
See deliverable D 5.1 for more details
42 | e-Highway2050: Europe’s future secure and sustainable electricity infrastructure
5.3 How to operate the resulting power system
System operation will be challenged in the future by
the major changes expected in the European electri-
cal system. Three main sources of change are identi-
fi ed, each having a potential impact on the different
operating issues:
• The increasing penetration of renewable energy
sources: RES behave radically differently than
traditional plants ( small power electronics device
vs. large synchronous generator ). In four of the fi ve
e-Highway2050 scenarios, during some hours, they
are the only generating units connected to the grid,
supplying entirely the European load.
• The increasing power exchanges: All the e-High-
way2050 scenarios show signifi cant European
power fl ows on the transmission grid.
• The increasing number of connections realized
with HVDC: HVDC behaves very differently than AC
lines. Today, a few DC lines exist in the European
system to connect non-synchronous areas and
only one DC link is implemented in parallel to AC
lines. In e-Highway2050 scenarios, at least 50 GW
of more HVDC are foreseen in addition to the 2030
projects of the TYNDP.
Power fl ows control
In comparison to fl ows on AC lines, which are de-
termined by Kirchhoff’s laws and the topology of the
system, HVDC lines are connected via power elec-
tronics ( PE ) and can be actively set by TSOs. The
advantage is a better control and a greater fl exibility.
The drawback is that HVDC are not responding
“naturally” to the variations or contingencies affect-
ing the power system and thus effi cient coordinated
control rules have to be implemented by TSOs.
Within the project, load fl ows simulations of the full
transmission network of the continental synchro-
nous area were performed for each scenario for two
snapshots: winter peak and summer offpeak. The
model was built from ENTSO-E 2030 grid with the
inclusion of the 2050 inter-cluster reinforcements.
For terrestrial reinforcements, two strategies were
compared: AC and DC. A security study, comparing
“N-1” and “N” situation, was then performed. In the
simulations performed with AC reinforcements, the
architectures are robust but with DC reinforcements,
overloads appeared when fi xed setting points were
assumed. It highlights the need for smarter control
rules of HVDC.
Voltage control
TSOs have to operate the system within secure volt-
age limits. The drastic change in the power system
expected by 2050 will probably need adaptations in
the reactive power compensation means. To assess
these issues, AC load fl ows were tested within the
project. For the two most extreme scenarios, Large
Scale RES and 100 % RES, no convergence could be
found. The reason is that existing methodologies and
tools are inadequate to easily study such different
network confi gurations. In parallel, in the R & D part
of the project ( see deliverable D 8.5 ), an innovative
algorithm has been developed to tackle these prob-
lems by automatically adapting the reactive power
compensations. It could be applied in future studies.
Today, traditional plants are the main contributors
to voltage control and their modeling in simulation
tools are mature and quite realistic. This is not the
case for wind and solar generators which are not
systematically taking part to reactive power con-
trol and voltage support although it is technically
feasible. Without this participation, the situation will
no longer be manageable with more RES. This has to
be anticipated in network codes and simulation tools
should be adapted. HVDC converters also offer new
possibilities for voltage control.
Dynamic stability and protection schemes
Traditional plants are synchronous generators; their
behavior is well known by TSOs. On the contrary,
HVDC, wind turbines and solar panels are connected
to the AC grid via power electronics. Their dynamic
behavior is completely different. Preliminary studies
were conducted within the project but research is
still needed to fully assess the impact of their in-
creasing penetration. The “Migrate” research project
funded by the EC will start working on this topic in
2016.
See deliverables D 2.4 and D 4.1 for more details
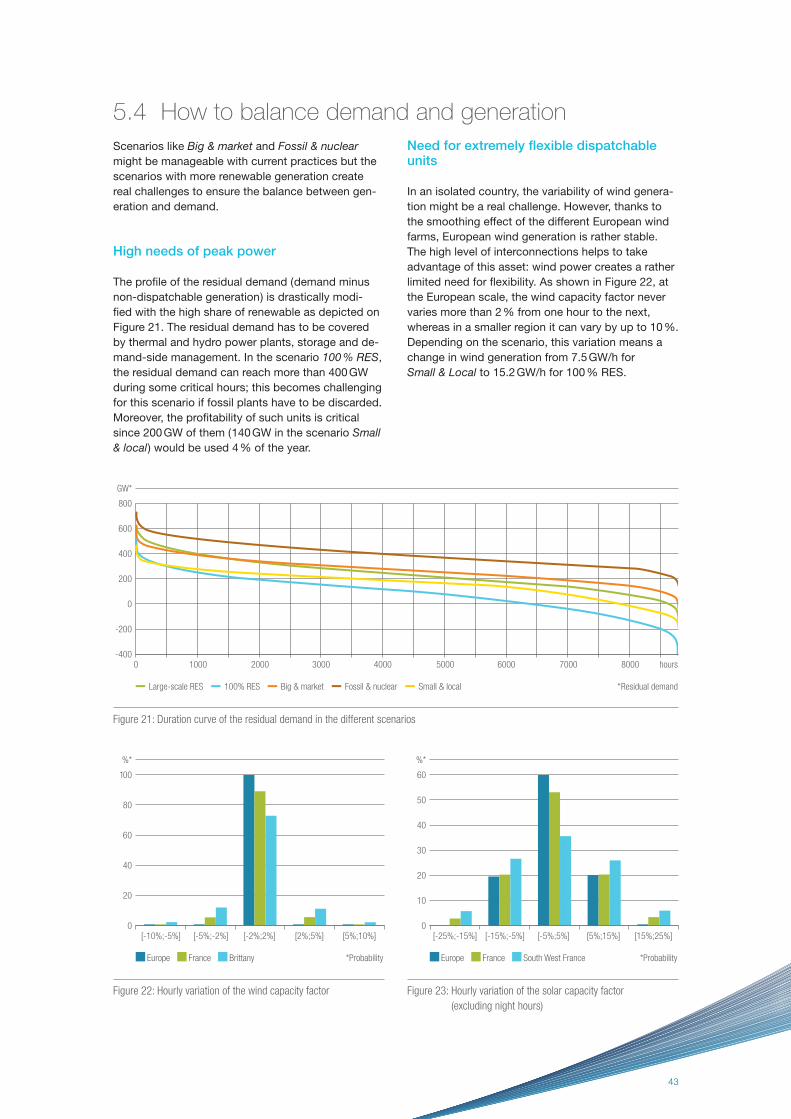
43
5.4 How to balance demand and generation
Scenarios like Big & market and Fossil & nuclear
might be manageable with current practices but the
scenarios with more renewable generation create
real challenges to ensure the balance between gen-
eration and demand.
High needs of peak power
The profi le of the residual demand ( demand minus
non-dispatchable generation ) is drastically modi-
fi ed with the high share of renewable as depicted on
Figure 21. The residual demand has to be covered
by thermal and hydro power plants, storage and de-
mand-side management. In the scenario 100 % RES,
the residual demand can reach more than 400 GW
during some critical hours; this becomes challenging
for this scenario if fossil plants have to be discarded.
Moreover, the profi tability of such units is critical
since 200 GW of them ( 140 GW in the scenario Small
& local ) would be used 4 % of the year.
Need for extremely fl exible dispatchable units
In an isolated country, the variability of wind genera-
tion might be a real challenge. However, thanks to
the smoothing effect of the different European wind
farms, European wind generation is rather stable.
The high level of interconnections helps to take
advantage of this asset: wind power creates a rather
limited need for fl exibility. As shown in Figure 22, at
the European scale, the wind capacity factor never
varies more than 2 % from one hour to the next,
whereas in a smaller region it can vary by up to 10 %.
Depending on the scenario, this variation means a
change in wind generation from 7.5 GW/h for
Small & Local to 15.2 GW/h for 100 % RES.
Figure 21: Duration curve of the residual demand in the different scenarios
0 2000 3000 4000 5000 6000 7000 8000 hours1000-400
400
200
-200
0
600
800
GW*
Large-scale RES 100% RES Big & market Fossil & nuclear Small & local *Residual demand
Figure 22: Hourly variation of the wind capacity factor Figure 23: Hourly variation of the solar capacity factor
(excluding night hours)
Europe France
[-5%;-2%][-10%;-5%] [-2%;2%] [5%;10%][2%;5%]0
20
40
60
100
80
%*
Brittany *Probability Europe France
[-15%;-5%][-25%;-15%] [-5%;5%] [15%;25%][5%;15%]0
20
10
30
40
60
50
%*
South West France *Probability
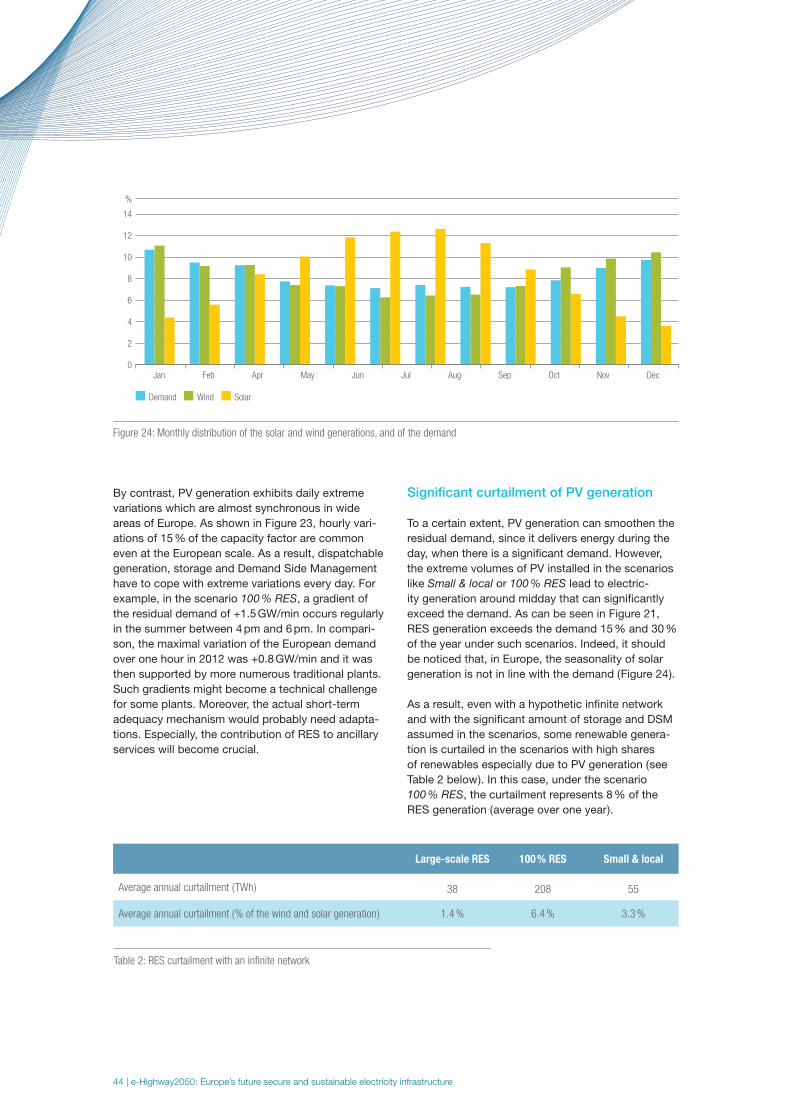
44 | e-Highway2050: Europe’s future secure and sustainable electricity infrastructure
By contrast, PV generation exhibits daily extreme
variations which are almost synchronous in wide
areas of Europe. As shown in Figure 23, hourly vari-
ations of 15 % of the capacity factor are common
even at the European scale. As a result, dispatchable
generation, storage and Demand Side Management
have to cope with extreme variations every day. For
example, in the scenario 100 % RES, a gradient of
the residual demand of +1.5 GW/min occurs regularly
in the summer between 4 pm and 6 pm. In compari-
son, the maximal variation of the European demand
over one hour in 2012 was +0.8 GW/min and it was
then supported by more numerous traditional plants.
Such gradients might become a technical challenge
for some plants. Moreover, the actual short-term
adequacy mechanism would probably need adapta-
tions. Especially, the contribution of RES to ancillary
services will become crucial.
Signifi cant curtailment of PV generation
To a certain extent, PV generation can smoothen the
residual demand, since it delivers energy during the
day, when there is a signifi cant demand. However,
the extreme volumes of PV installed in the scenarios
like Small & local or 100 % RES lead to electric-
ity generation around midday that can signifi cantly
exceed the demand. As can be seen in Figure 21,
RES generation exceeds the demand 15 % and 30 %
of the year under such scenarios. Indeed, it should
be noticed that, in Europe, the seasonality of solar
generation is not in line with the demand ( Figure 24 ).
As a result, even with a hypothetic infi nite network
and with the signifi cant amount of storage and DSM
assumed in the scenarios, some renewable genera-
tion is curtailed in the scenarios with high shares
of renewables especially due to PV generation ( see
Table 2 below ). In this case, under the scenario
100 % RES, the curtailment represents 8 % of the
RES generation ( average over one year ).
Figure 24: Monthly distribution of the solar and wind generations, and of the demand
Jan Feb Apr May Jun Jul Aug Sep Oct Nov Dec0
6
10
14
4
2
8
12
%
Demand Wind Solar
Table 2: RES curtailment with an infi nite network
Large-scale RES 100 % RES Small & local
Average annual curtailment ( TWh ) 38 208 55
Average annual curtailment ( % of the wind and solar generation ) 1.4 % 6.4 % 3.3 %
-
45
6 Outlook
The e-highway2050 consortium has developed new
methodologies which allow the power system stake-
holders and policy makers to anticipate the future trans-
mission network development needs in line with the
long term decarbonisation goals set at European level.
This methodology gives an initial, yet reliable, indica-
tion of the main challenges that transmission system
operators will face.
A signifi cant number of assumptions were necessary
to perform the e-Highway2050 study. Even though
the solid methodology and the consideration of vari-
ous scenarios ensure the relevance of the results,
further studies could for sure be performed with
different assumptions. Some suggestions for these
further studies are:
• More detailed studies with a closer time horizon
before deciding any investment. Indeed, a profi t-
able reinforcement in 2050 or even in 2040 may be
useless before.
• A detailed study of the North Sea area which was
simplifi ed in the e-Highway2050 study
• Deeper assessment of alternative solutions to
the expansion of the transmission grid
• The interactions with the gas network and the
Power to Gas technology
For future studies, the e-Highway2050 results and methodologies can provide an excellent starting point. They will feed in the refl ections on future releases of the TYNDP conducted by ENTSO-E.
The innovative methodologies applied to the core
study of the project rely partially on expert as-
sessment and could be further improved by more
optimization-based approaches. The R & D part of
the e-Highway2050 project has worked in parallel on
this topic and developed promising prototypes ( not
described in this report, see deliverables D.8.xx ).
The proposed method requires massive comput-
ing power and formal well defi ned approximations
which were assessed during the project. Further
work on these optimization-based approaches will
be required to make them available for TSOs in the
coming years.
The operability of the European power system, as
described in the e-Highway2050 scenarios, is a
critical issue. Preliminary analyses were conducted
within project but further research is essential to
anticipate the upcoming challenges.
46 | e-Highway2050: Europe’s future secure and sustainable electricity infrastructure
List of the deliverables
D 1.1 Review of useful studies, policies and codes
D 1.2 Structuring of uncertainties, options and
boundary conditions for the implementation
of EHS
D 2.1 Data sets of scenarios developed for 2050
D 2.2 European cluster model of the pan-European
transmission grid
D 2.3 System simulations analysis and overlay-grid
development
D 2.4 Contingency analyses of grid architectures
and corrective measurements
D 3.1 Technology assessment from 2030 to 2050
D 3.2 Technology innovation needs
D 4.1 Operational validation of the grid reinforce-
ments by 2050
D 4.2 Environmental validation of the grid reinforce-
ments for 2050
D 4.3 Data sets of scenarios and intermediate grid
architectures for 2040
D 4.4 Modular development plan
D 5.1 Roadmap for implementing the target govern-
ance model and an initial policy proposal
D 6.1 A comprehensive cost benefi t approach
for analysing pan-European transmission
highways deployment
D 6.2 A toolbox supporting a pan-European
technical evaluation of costs and benefi ts
D 6.3 Modular plan over 2020 – 2050 for the
European transmission system
D 8.1 High-level defi nition of a new methodology
for long-term grid planning
D 8.2 Enhanced methodology for demand/genera-
tion scenarios
D 8.3 Enhanced methodology to defi ne optimal grid
architectures for 2050
D 8.4 Enhanced methodology to defi ne the optimal
modular plan to reach 2050 grid architectures
D 8.5 Enhanced methodology to assess the
robustness of a grid architecture
D 8.6 Detailed enhanced methodology for
long-term grid planning
D 8.7 Recommendations about critical aspects in
long-term planning methodologies
-
47
Glossary
CCS Carbon Capture Storage
Cluster Area /zone in Europe. Europe is splitted in around one hundred clusters
for the e-Highway2050 study.
Curtailment RES generation available but not used. Also called spillage or dump-energy.
DSM Demand Side Management
EC European Commission
Energy mix Proportion of the different energy sources in the annual electricity generation
ENS Energy not supplied due to lack of generation and/or grid congestions.
Also called load curtailment or unsupplied demand.
ENTSO-E European network of transmission system operators for electricity
Grid architecture Set of transmission lines composed by the starting grid plus the reinforcements
GTC Grid Transfer Capacity
HVAC High Voltage Alternative Current
HVDC High Voltage Direct Current
OHL Over-Head-Lines
PE Power Electronics
R & D Research and Development
Reinforcement New lines or upgraded existing ones
RES Renewable Energy Sources
Starting grid Grid considered as the starting point of the study. It is composed of existing lines
plus those foreseen by 2030 in the TYNDP 2014.
TSO Transmission System Operator
TYNDP Ten-Year Network Development Plan
48 | e-Highway2050: Europe’s future secure and sustainable electricity infrastructure
Footnotes
1 European Commission, “Green paper A 2030 framework for
climate and energy policies”, COM( 2013 ) 169 fi nal, March 27
2013
2 European Commission “A Roadmap for moving to a competi-
tive low carbon economy in 2050”, COM( 2011 ) 112 fi nal,
Brussels, 8.3.2011
3 European Commission, Communication “Energy Roadmap
2050”, COM( 2011 ) 885 fi nal, Brussels, 15/12/2011
4 European Commission, “White Paper: Roadmap to a Single
European Transport Area – Towards a competitive and resource
effi cient transport system”, COM( 2011 ) 144 fi nal, Brussels,
28.3.2011
5 European Parliament Resolution on a Roadmap for moving to a
competitive low carbon economy in 2050
http://www.europarl.europa.eu/sides/getDoc.
do?type=TA&reference=P7-TA-2012 0086&language=EN&rin
g=A7-2012-0033
European Parliament Resolution on the White Paper on a
Single European Transport Area
http://www.europarl.europa.eu/sides/getDoc.
do?type=TA&reference=P7-TA-2011- 0584&language=EN&ri
ng=A7-2011-0425
European Parliament Resolution on the Energy Road-
map 2050, http://www.europarl.europa.eu/sides/getDoc.
do?type=TA&reference=P7-TA-2013- 0088&language=EN&ri
ng=A7-2013-0035
6 European Commission: “Achieving the 10 % Interconnec-
tion Target. Making Europe’s electricity grid fi t for 2020”,
COM( 2015 ) 82 fi nal, Brussels, 25.02.2015
7 Electricity Highways are defi ned as one of the 12 energy
infrastructure priority corridors and areas in the Regulation on
“Guidelines for trans-European energy infrastructures” (TEN-E
regulation).
TEN-E regulation defi nes the Electricity Highway as “Any physi-
cal equipment designed to allow transport of electricity on the
high and extra-high voltage level, in view of connecting large
amounts of electricity generation or storage located in one or
several Member States or third countries with large-scale elec-
tricity consumption in one or several other Member States”.
ENTSO-E TSOs defi ned the Electricity Highway as follows:
An Electricity Highway is any infrastructure designed to allow
transport of electricity in view of connecting large amounts of
generation or storage with large scale consumption crossing
European regions.
In detail, an Electricity Highway:
– Would be AC, DC or hybrid technology, both on-shore and
off-shore grid at extra high voltage level and would not be a
precise standardised technology;
– Would enable a signifi cant increase in the capacity to trans-
mit electricity across Europe;
– Would be developed and integrated with the present electric-
ity transmission infrastructure;
– Would involve a co-operation between control centres and
the RSCI’s going beyond today’s implemented and envisaged
processes;
– Would cover one or more Member States or Third Countries.
8 Albania, Austria, Bosnia and Herzegovina, Belgium, Bulgaria,
Switzerland, Czech Republic, Germany, Denmark, Estonia,
Spain, Finland, France, United-Kingdom, Greece, Croatia, Hun-
gary, Ireland, Italy, Lithuania, Luxembourg, Latvia, Montenegro,
FYROM, Netherlands, Norway, Poland, Portugal, Romania,
Serbia, Sweden, Slovenia, Slovakia.
9 The list of projects considered is not exactly the fi nal one of
the TYNDP 2014. Indeed, TYNDP 2014 was completed after
the commencement of the e-Highway2050 project. The main
discrepancies are given in the appendix of Deliverable 2.3.

49
10 https://antares.rte-france.com
11 This indicator does not give an idea of the amount of unsup-
plied demand. In the Small & local scenario, the related unsup-
plied demand is 5 TWh in Europe.
12 Considering a typical OCGT investment cost of 0.7b € / GW plus
fuel and CO2 costs
13 Estimation based on the average solar/wind generation in
Spain. This reasoning is based on average values and is thus
extremely simplifi ed, in reality, much more power would be
required to cover periods with low solar/wind generation.
14 Estimation based on the average solar/wind generation in
Spain. This reasoning is based on average values and is thus
extremely simplifi ed, in reality, much more power would be
required to cover periods with low solar/wind generation.
15 Estimation made by the partners of the project.
16 The granularity of the technology perspective covers only the
main technology families ( each specifi c technology implemen-
tation requires detailed and local studies which are beyond the
scope of the present project ).
17 Technology option with a low maturity level ( such as long
distance superconducting cable ) is not considered as an
“available” technological option.
18 The capacity of HVAC XLPE underground cables is likely to stay
in the range of 380 – 420 kV with an increase above 1,8 kA
and transmitted power exceeding 1 250 MW
19 HVDC underground cables could be installed over very long
distances: it would improve public acceptance but permitting
issues for large corridors would remain.
20 Interoperability of the HVDC systems ( VSC converters for
instance ) will be a key issue.
21 No consideration of public acceptance or rights-of-way is
made. Considerations are made only on the technological
standpoint and focus mainly on the availability / maturity of the
technology
22 These options have not been considered since suited for intra-
cluster applications

50 | e-Highway2050: Europe’s future secure and sustainable electricity infrastructure
Imprint
Publisher
RTE
Tour Initiale
1 terrasse Bellini
92919 La Defense
France
Design
DreiDreizehn Werbeagentur GmbH, Berlin
www.313.de

-
51

![The research leading to these results has received funding from the STANCE project1 within European Union’s Seventh Framework Programme [FP7/2007-2013] …](https://img.pdfslide.us/doc/110x75/5f676d6d68b3ed52c803dabf/-the-research-leading-to-these-results-has-received-funding-from-the-stance-project1.jpg)


![Inquiry Based Science Education The ESTABLISH project has received funding from the European Union’s Seventh Framework Programme [FP7/2007-2013] under](https://img.pdfslide.us/doc/110x75/56649e615503460f94b5cb43/inquiry-based-science-education-the-establish-project-has-received-funding.jpg)