Embed Size (px)
Citation preview
1
European Union Strategic Investment
Fund Implementation Plan
January 2014
To be read in conjunction with:-
The York, North Yorkshire and East Riding Strategic Economic Plan
2
Contents
Page
1 Introduction 3
2 Delivering European Structural Investment Funds
Priority 1 - Profitable and ambitious small and micro businesses
Priority 2 - A global leader in food manufacturing, agritech and biorenewables
Priority 3 - Inspired people
Priority 4 - Successful and distinctive places
Priority 5 - Well connected economy
4
5
12
19
28
33
3 Cross cutting issues 36
4 The Opt In Model 42
5 Access to finance 43
6 Resources and funding allocations 48
7 Governance and delivery 51
8 ANNEX 1 - Evidence for economic and investment strategy interventions 56
9 ANNEX 2 – Output calculations 82
3
1. Introduction
1.1. How this Plan fits in to our Strategic plan for Growth
This implementation plan sets out York, North Yorkshire and East Riding proposals for the use of European
Structural and Investment Funds 2014-2020. It is structured around our five Strategic Priorities (as set out in
the York, North Yorkshire and East Riding Strategic Economic Plan – our Plan for Growth) and for each explains
the rational for intervention, the types of activities that we intend to support, financing arrangements and the
outputs we expect to achieve.
Our Plan for Growth is in three parts – an overall Strategic Economic Plan, this European Structural and
Investment Fund Implementation Plan and the Local Growth Deal Implementation Plan. The Strategic
Economic Plan (SEP) is the overall strategy for our LEP area and sets out the strategic requirements needed to
guide European structural and investment funds locally.
1.2. The relationship between Strategic Priorities and Thematic Objectives
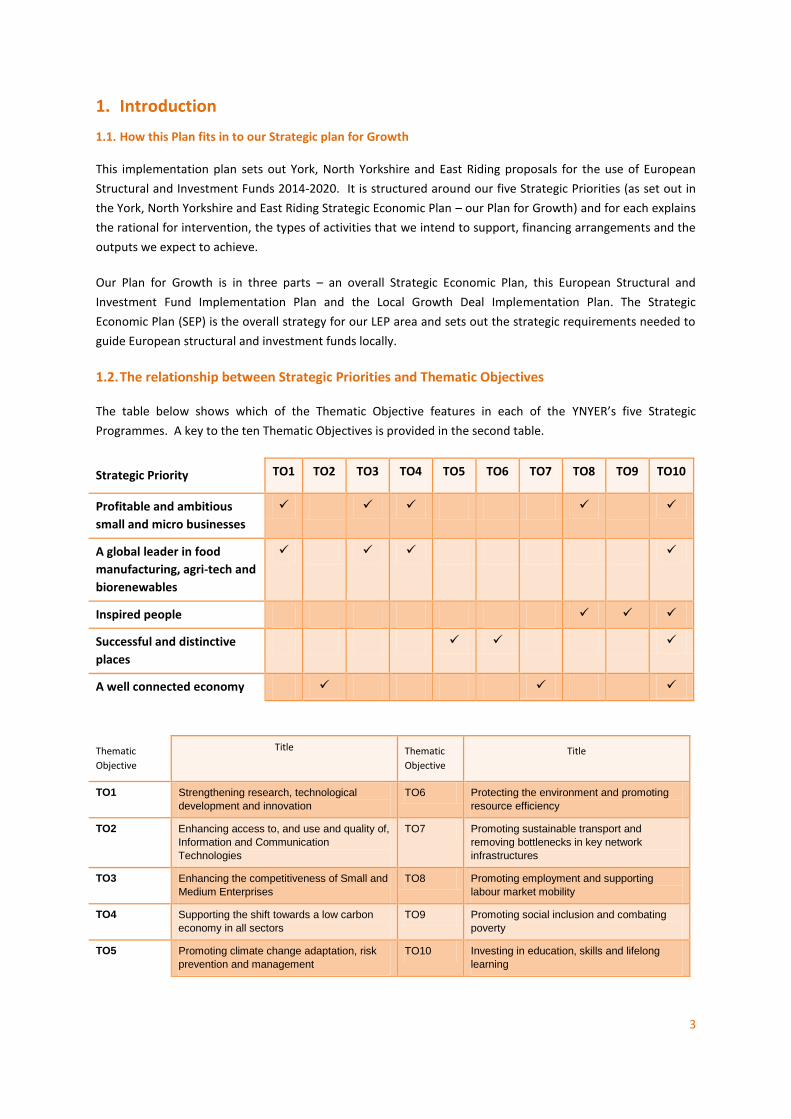
The table below shows which of the Thematic Objective features in each of the YNYER’s five Strategic
Programmes. A key to the ten Thematic Objectives is provided in the second table.
Strategic Priority TO1 TO2 TO3 TO4 TO5 TO6 TO7 TO8 TO9 TO10
Profitable and ambitious
small and micro businesses
A global leader in food
manufacturing, agri-tech and
biorenewables
Inspired people
Successful and distinctive
places
A well connected economy
Thematic
Objective
Title Thematic
Objective
Title
TO1 Strengthening research, technological
development and innovation
TO6 Protecting the environment and promoting
resource efficiency
TO2 Enhancing access to, and use and quality of,
Information and Communication
Technologies
TO7 Promoting sustainable transport and
removing bottlenecks in key network
infrastructures
TO3 Enhancing the competitiveness of Small and
Medium Enterprises
TO8 Promoting employment and supporting
labour market mobility
TO4 Supporting the shift towards a low carbon
economy in all sectors
TO9 Promoting social inclusion and combating
poverty
TO5 Promoting climate change adaptation, risk
prevention and management
TO10 Investing in education, skills and lifelong
learning
4
2. Delivering European Structural and Investment Funds
2.1. Overview of the Priorities
Our overall approach to delivery is to focus on specific, evidenced interventions that will enable economic
growth.
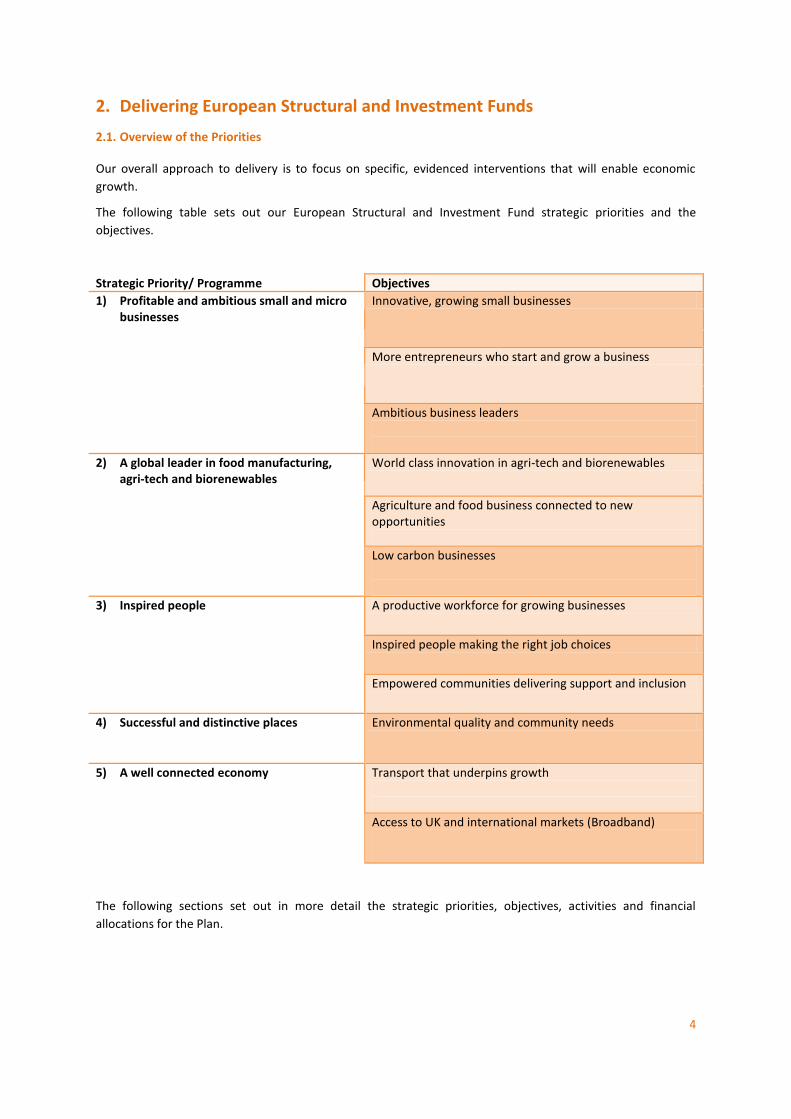
The following table sets out our European Structural and Investment Fund strategic priorities and the
objectives.
Strategic Priority/ Programme Objectives
1) Profitable and ambitious small and micro businesses
Innovative, growing small businesses
More entrepreneurs who start and grow a business
Ambitious business leaders
2) A global leader in food manufacturing, agri-tech and biorenewables
World class innovation in agri-tech and biorenewables
Agriculture and food business connected to new opportunities
Low carbon businesses
3) Inspired people A productive workforce for growing businesses
Inspired people making the right job choices
Empowered communities delivering support and inclusion
4) Successful and distinctive places
Environmental quality and community needs
5) A well connected economy
Transport that underpins growth
Access to UK and international markets (Broadband)
The following sections set out in more detail the strategic priorities, objectives, activities and financial
allocations for the Plan.
5
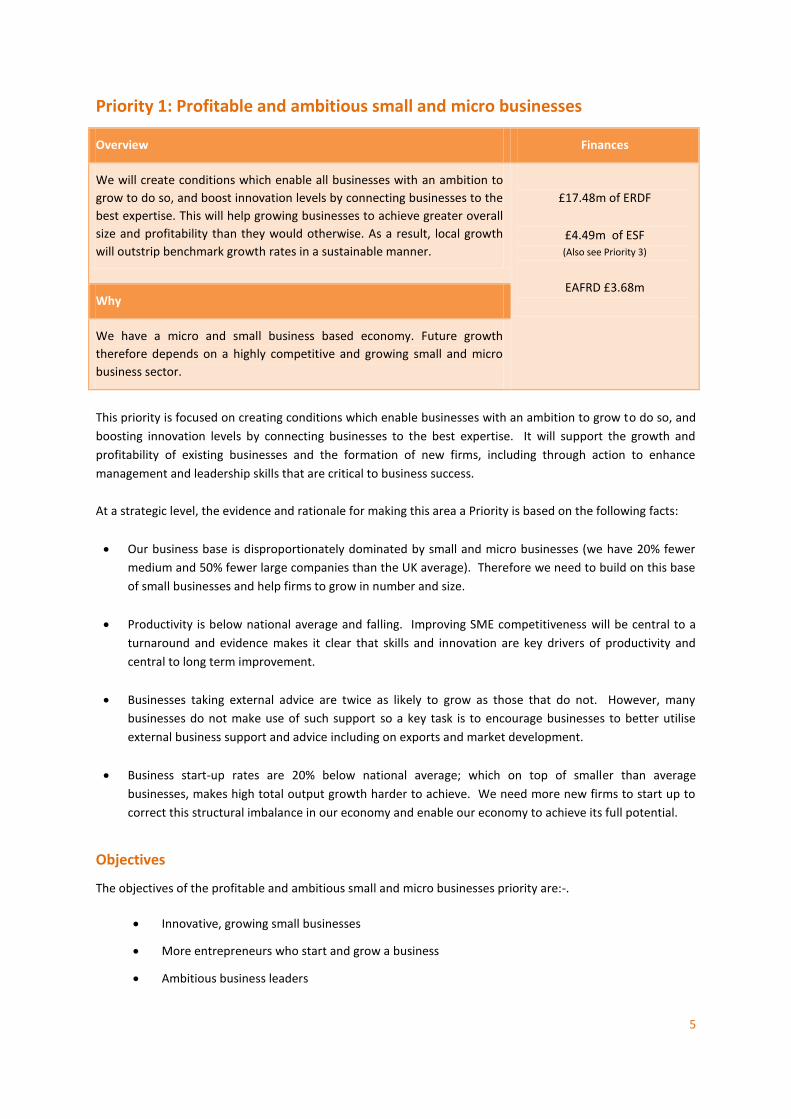
Priority 1: Profitable and ambitious small and micro businesses
Overview Finances
We will create conditions which enable all businesses with an ambition to
grow to do so, and boost innovation levels by connecting businesses to the
best expertise. This will help growing businesses to achieve greater overall
size and profitability than they would otherwise. As a result, local growth
will outstrip benchmark growth rates in a sustainable manner.
£17.48m of ERDF
£4.49m of ESF (Also see Priority 3)
EAFRD £3.68m
Why
We have a micro and small business based economy. Future growth
therefore depends on a highly competitive and growing small and micro
business sector.
This priority is focused on creating conditions which enable businesses with an ambition to grow to do so, and
boosting innovation levels by connecting businesses to the best expertise. It will support the growth and
profitability of existing businesses and the formation of new firms, including through action to enhance
management and leadership skills that are critical to business success.
At a strategic level, the evidence and rationale for making this area a Priority is based on the following facts:
Our business base is disproportionately dominated by small and micro businesses (we have 20% fewer
medium and 50% fewer large companies than the UK average). Therefore we need to build on this base
of small businesses and help firms to grow in number and size.
Productivity is below national average and falling. Improving SME competitiveness will be central to a
turnaround and evidence makes it clear that skills and innovation are key drivers of productivity and
central to long term improvement.
Businesses taking external advice are twice as likely to grow as those that do not. However, many
businesses do not make use of such support so a key task is to encourage businesses to better utilise
external business support and advice including on exports and market development.
Business start-up rates are 20% below national average; which on top of smaller than average
businesses, makes high total output growth harder to achieve. We need more new firms to start up to
correct this structural imbalance in our economy and enable our economy to achieve its full potential.
Objectives
The objectives of the profitable and ambitious small and micro businesses priority are:-.
Innovative, growing small businesses
More entrepreneurs who start and grow a business
Ambitious business leaders
6
Proposed Activities
Activities that we intend to take forward through this Strategic Priority are shown in the following table, along with the Thematic Objective to which each relates.
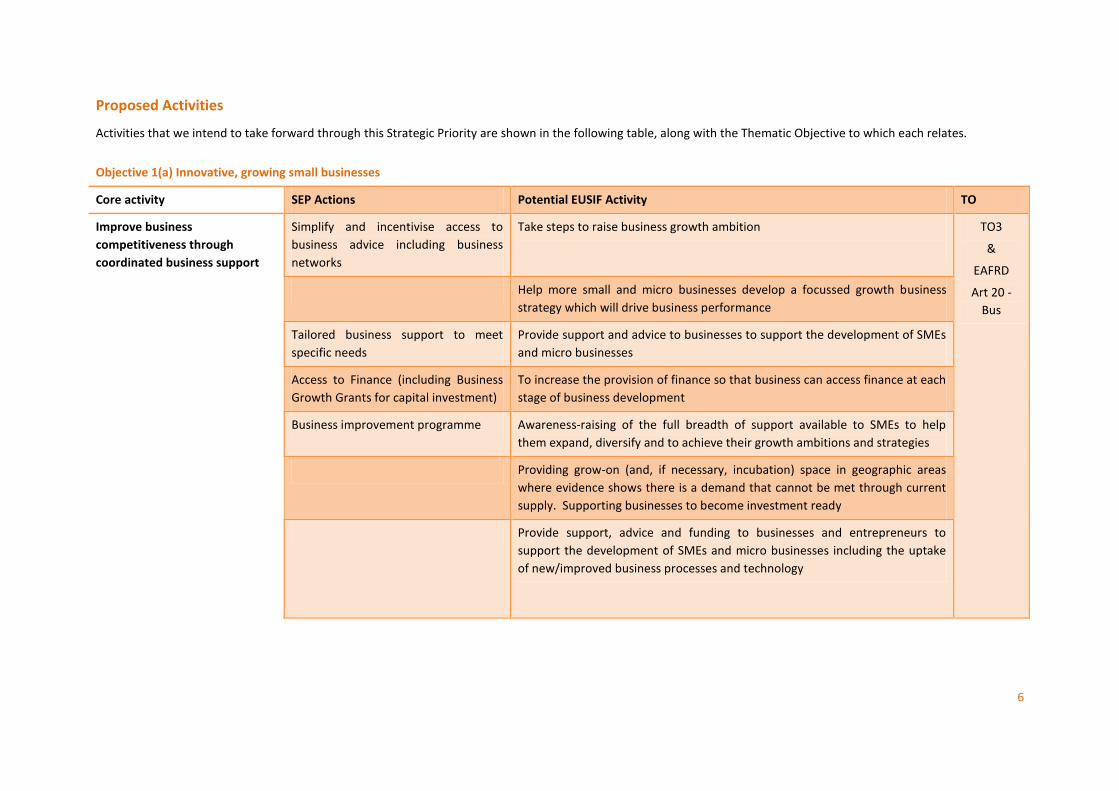
Objective 1(a) Innovative, growing small businesses
Core activity SEP Actions Potential EUSIF Activity TO
Improve business
competitiveness through
coordinated business support
Simplify and incentivise access to
business advice including business
networks
Take steps to raise business growth ambition
TO3
&
EAFRD
Art 20 -
Bus
Help more small and micro businesses develop a focussed growth business
strategy which will drive business performance
Tailored business support to meet
specific needs
Provide support and advice to businesses to support the development of SMEs
and micro businesses
Access to Finance (including Business
Growth Grants for capital investment)
To increase the provision of finance so that business can access finance at each
stage of business development
Business improvement programme Awareness-raising of the full breadth of support available to SMEs to help
them expand, diversify and to achieve their growth ambitions and strategies
Providing grow-on (and, if necessary, incubation) space in geographic areas
where evidence shows there is a demand that cannot be met through current
supply. Supporting businesses to become investment ready
Provide support, advice and funding to businesses and entrepreneurs to
support the development of SMEs and micro businesses including the uptake
of new/improved business processes and technology
7
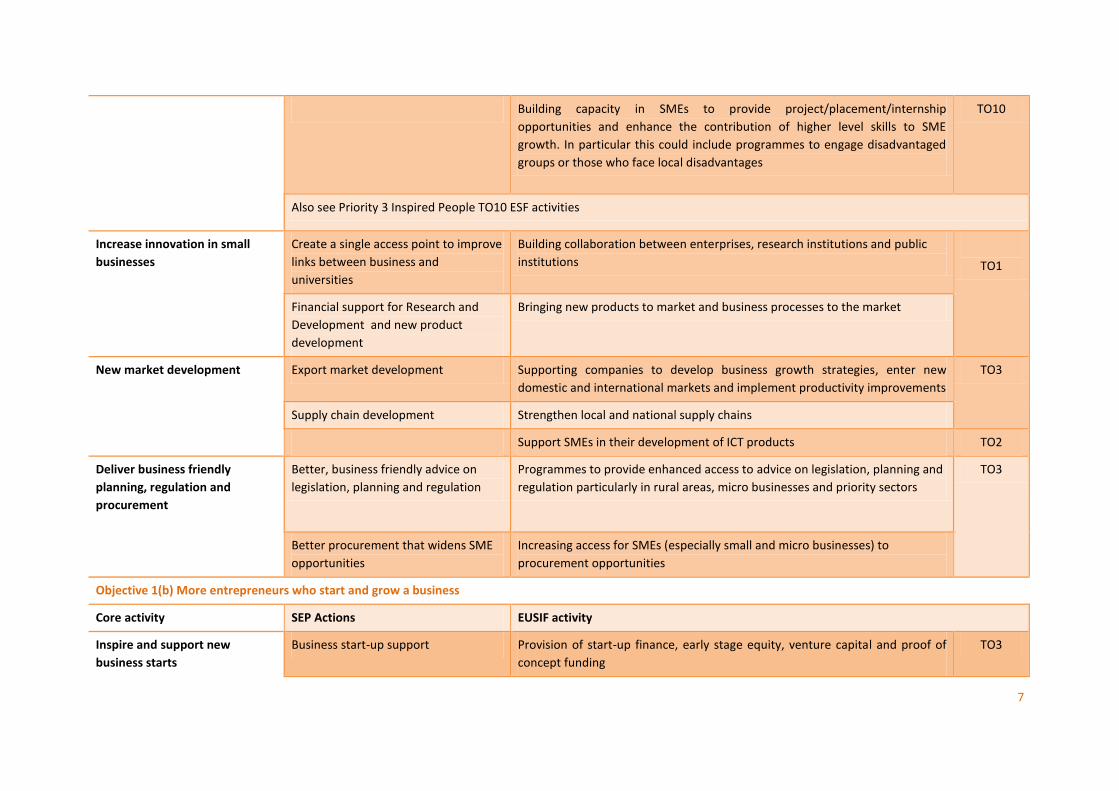
Building capacity in SMEs to provide project/placement/internship
opportunities and enhance the contribution of higher level skills to SME
growth. In particular this could include programmes to engage disadvantaged
groups or those who face local disadvantages
TO10
Also see Priority 3 Inspired People TO10 ESF activities
Increase innovation in small
businesses
Create a single access point to improve
links between business and
universities
Building collaboration between enterprises, research institutions and public
institutions
TO1
Financial support for Research and
Development and new product
development
Bringing new products to market and business processes to the market
New market development Export market development Supporting companies to develop business growth strategies, enter new
domestic and international markets and implement productivity improvements
TO3
Supply chain development Strengthen local and national supply chains
Support SMEs in their development of ICT products TO2
Deliver business friendly
planning, regulation and
procurement
Better, business friendly advice on
legislation, planning and regulation
Programmes to provide enhanced access to advice on legislation, planning and
regulation particularly in rural areas, micro businesses and priority sectors
TO3
Better procurement that widens SME
opportunities
Increasing access for SMEs (especially small and micro businesses) to
procurement opportunities
Objective 1(b) More entrepreneurs who start and grow a business
Core activity SEP Actions EUSIF activity
Inspire and support new
business starts
Business start-up support Provision of start-up finance, early stage equity, venture capital and proof of
concept funding
TO3
8
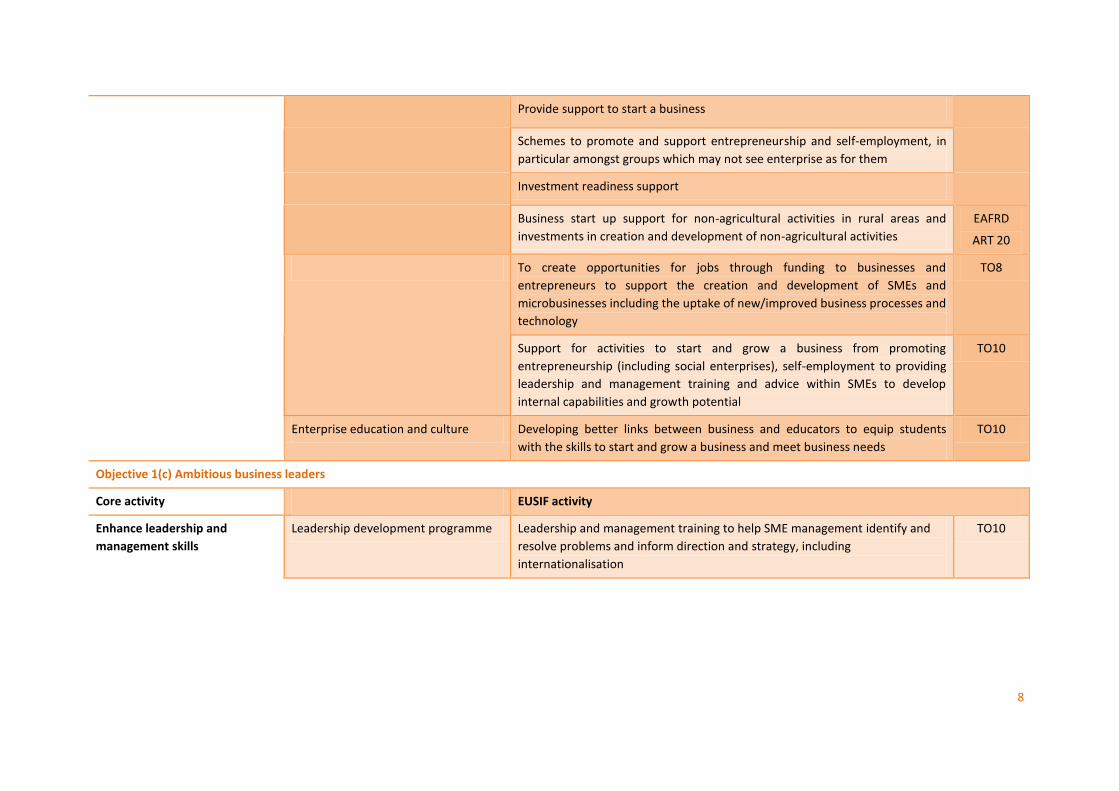
Provide support to start a business
Schemes to promote and support entrepreneurship and self-employment, in
particular amongst groups which may not see enterprise as for them
Investment readiness support
Business start up support for non-agricultural activities in rural areas and
investments in creation and development of non-agricultural activities
EAFRD
ART 20
To create opportunities for jobs through funding to businesses and
entrepreneurs to support the creation and development of SMEs and
microbusinesses including the uptake of new/improved business processes and
technology
TO8
Support for activities to start and grow a business from promoting
entrepreneurship (including social enterprises), self-employment to providing
leadership and management training and advice within SMEs to develop
internal capabilities and growth potential
TO10
Enterprise education and culture Developing better links between business and educators to equip students
with the skills to start and grow a business and meet business needs
TO10
Objective 1(c) Ambitious business leaders
Core activity EUSIF activity
Enhance leadership and
management skills
Leadership development programme Leadership and management training to help SME management identify and
resolve problems and inform direction and strategy, including
internationalisation
TO10

9
Core Activities Improve business competitiveness through co-ordinated business support - We will encourage realistic
growth ambitions within our business community by demonstrating how others have created a path to
success. The LEP will play a central role in coordinating and aligning the fragmented support network,
particularly via its online insight and introductions service www.businessinspiredgrowth.com We will link
interventions, so that for example mentoring and peer support are wrapped around the provision of finance
for growth. In particular we focus on the creation of value relationships, such as incentivising the take up of
support, whilst recognising that there’s little value in ‘free’. Typically we will encourage the provision of
specialist advice for established businesses, to further build value relationships and make the most of the
expertise within the business community to support growth. Tailored support will also extend to sectors with
specific needs such as the visitor economy and engineering. We will support people working as catalysts and
network enablers along with the provision of infrastructure that meets the needs of businesses, such as
physical Business Hubs. Support will be linked to resource efficiency and low carbon goals and cover areas
including marketing, finance, ICT, staffing and investment readiness. It will also include access to capital
finance through Business Growth Grants.
Increase innovation in small businesses – We will de-risk investment in R&D and make it easier for small
businesses to innovate. We have world class innovation assets in the region that we will utilise. However we
will also seek to use the University of York as a conduit to connect businesses to the best expertise across the
UK. We will create a single entry point, whereby a business wishing to innovate is helped to find and access
the very best expertise and support and supported in investing in developing new products and processes. We
also recognise that broadband is an enabling technology that can support long term competitiveness (see also
Priority 5). Where broadband has been rolled out we will help businesses make the most of it. Unleashing the
innovation and expertise in the region’s businesses and universities will play a key role in driving high value
growth.
New market development - Businesses looking to grow know they need a market for the goods and services
they provide. Where there is a need or opportunity to develop, test, establish or access these markets, which
require additional intervention, we will assist. Whilst many of these markets will be international, there
remain domestic opportunities to maximise, such as making the most of infrastructure such as roads and
tourism and recreational markets linked to long distance cycle paths and footpaths through our region and
promotional opportunities linked to events such as the Tour de France in Yorkshire.
Deliver customer friendly planning, regulation and procurement – The potential for the public sector to play a
stronger role in supporting the economic growth of the local business community is recognised by both public
and private sectors. The LEP will use our role as a bridge between these sectors to facilitate progress. Once
again, we will look to the business community to help the public sector understand where there are barriers to
growth or opportunities to support additional local growth, whilst making it easier for business to deal with
regulation. We will seek to encourage a positive, business friendly culture, including in planning, and explore
potential for free pre-application planning advice to businesses, customer care training, and simplified
planning regimes.
Inspire and support new business starts - A fundamental foundation of our economy is the high quality of life,
which attracts and retains entrepreneurs and business leaders. Recognising that self-employment is an
increasing trend, particularly amongst 25+ returnees to the area, we will ensure that we effectively support
those with a desire to establish their own business and instil an enterprising mindset in our young people.
10
Enhance leadership and management skills - As part of the overall principle of supporting linked
interventions, it is important that business people receiving support have the skills required to make the most
of this. Accordingly, both basic and specific business skills and higher level leadership and management skills
will be key elements on the path to growth.
Beneficiaries
The benefits/beneficiaries of the Profitable and ambitious small and micro businesses priority will be small
and medium sized enterprises across the LEP area, residents of the YNYER through increased employment and
skills development opportunities and the LEP area economy as a whole.
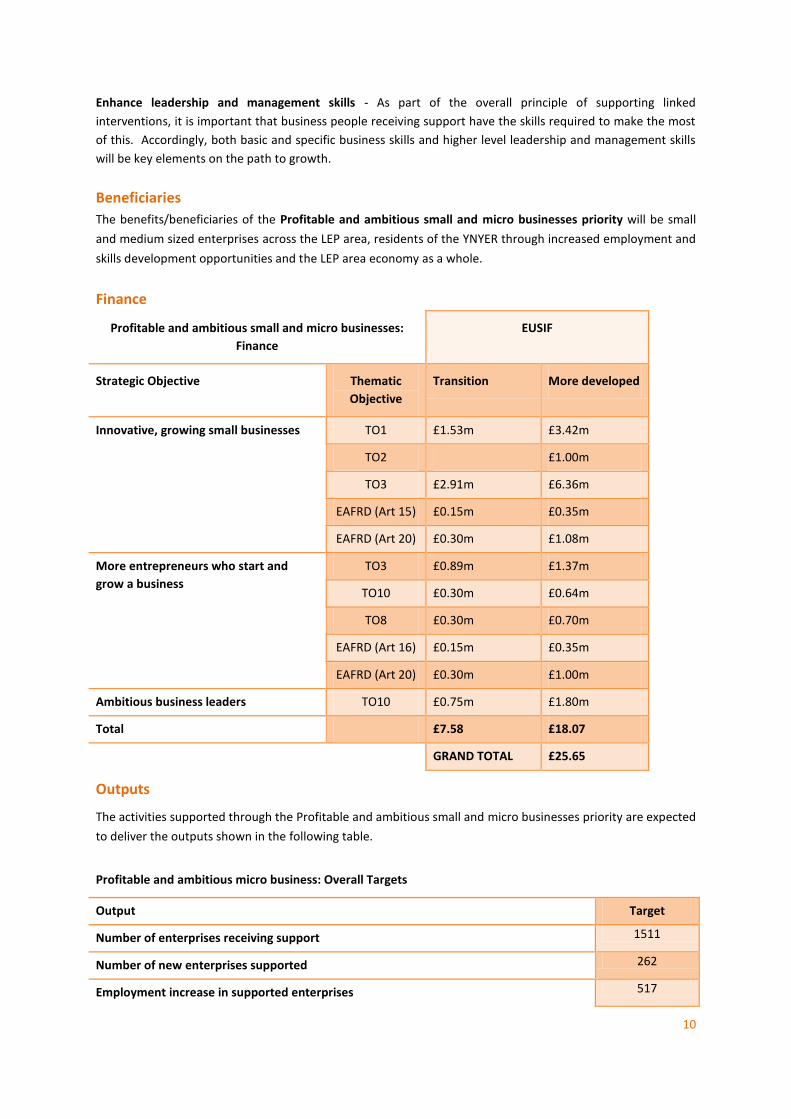
Finance
Profitable and ambitious small and micro businesses:
Finance
EUSIF
Strategic Objective Thematic
Objective
Transition More developed
Innovative, growing small businesses
TO1 £1.53m £3.42m
TO2 £1.00m
TO3 £2.91m £6.36m
EAFRD (Art 15) £0.15m £0.35m
EAFRD (Art 20) £0.30m £1.08m
More entrepreneurs who start and
grow a business
TO3 £0.89m £1.37m
TO10 £0.30m £0.64m
TO8 £0.30m £0.70m
EAFRD (Art 16) £0.15m £0.35m
EAFRD (Art 20) £0.30m £1.00m
Ambitious business leaders TO10 £0.75m £1.80m
Total £7.58 £18.07
GRAND TOTAL £25.65
Outputs
The activities supported through the Profitable and ambitious small and micro businesses priority are expected
to deliver the outputs shown in the following table.
Profitable and ambitious micro business: Overall Targets
Output Target
Number of enterprises receiving support 1511
Number of new enterprises supported 262
Employment increase in supported enterprises 517
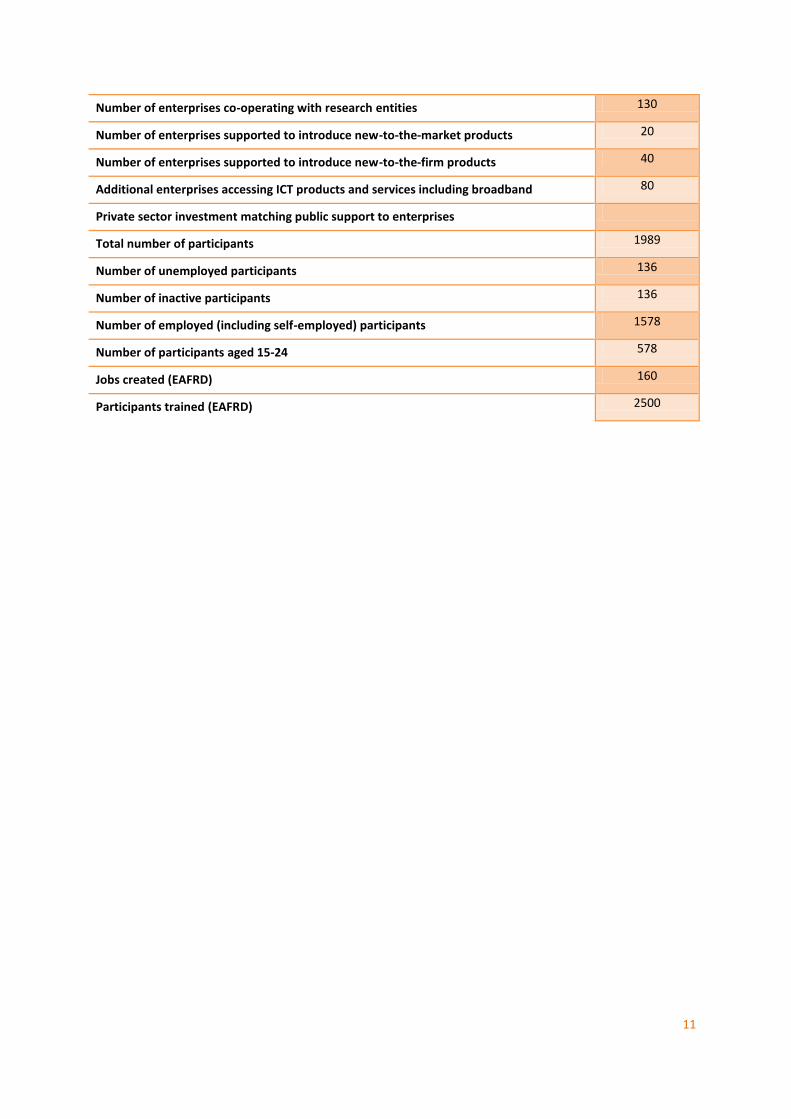
11
Number of enterprises co-operating with research entities 130
Number of enterprises supported to introduce new-to-the-market products 20
Number of enterprises supported to introduce new-to-the-firm products 40
Additional enterprises accessing ICT products and services including broadband 80
Private sector investment matching public support to enterprises
Total number of participants 1989
Number of unemployed participants 136
Number of inactive participants 136
Number of employed (including self-employed) participants 1578
Number of participants aged 15-24 578
Jobs created (EAFRD) 160
Participants trained (EAFRD) 2500

12
Priority 2: A global leader in food manufacturing, agritech and biorenewables
Overview Finances
We will drive growth and exports by building on our international
reputation and connections in these sectors of global significance. We
want to grow and cross fertilise two sectors in which we are internationally
recognised to make our area a global leader in both aspects of our bio-
economy.
£12.89m of ERDF
£1.45m of ESF (also see priority 3)
EAFRD £2.2m
Why
We have leading edge assets in the food manufacturing, agri-tech and bio-
renewables sectors (the ‘bio-economy’) with a worldwide reputation and
the potential to create thousands of new jobs.
This priority is focused on the growth of our most distinctive and disproportionately concentrated sector – the
bio-economy. We have world leading, high value assets and businesses in agri-tech and biorenewables as well
as a large number of local food and agricultural businesses that can be better connected to and benefit from
these strengths. Activity will help to further boost and utilise our R&D and innovation assets, support growth
of the sector and ensure businesses adopt and benefit from low carbon and resource efficiency measures.
At a strategic level, the evidence and rationale for making this area a priority is based on the following facts:
Across Europe the bio-economy sectors have a reported turnover of some 2 trillion Euros1 and the global
market for biochemicals has been predicted to increase tenfold.
The R&D base in York competes internationally in agri-tech and biorenewables. It is home to the
Biorenewables Development Centre and two internationally recognised research groupings at the
University of York, the Centre for Novel Agricultural Products and the Green Chemistry Centre of
Excellence. The Food and Environment Research Agency (FERA) at Sand Hutton complements these
resources.
Whilst the overall ‘bio-economy’ sector incorporates a number of different sectors – for instance agri-
tech, agriculture, food production and processing and biorenewables – there are strong connections
between these sector and advantages in developing them together.
Businesses are facing rising energy and resource bills and there are wider pressures and reasons to cut
carbon emissions. Encouraging efficient, low carbon business helps to meet European and national policy
goals and to achieve economic objectives.
Objectives
The objectives of the Global leader in food manufacturing, agritech and biorenewables priority are as shown
below.
World class innovation in agritech and biorenewables
1 Statistic taken from BioVale proposal consultation document, July 2013

13
Agriculture and food business connected to new opportunities
Low carbon businesses
14
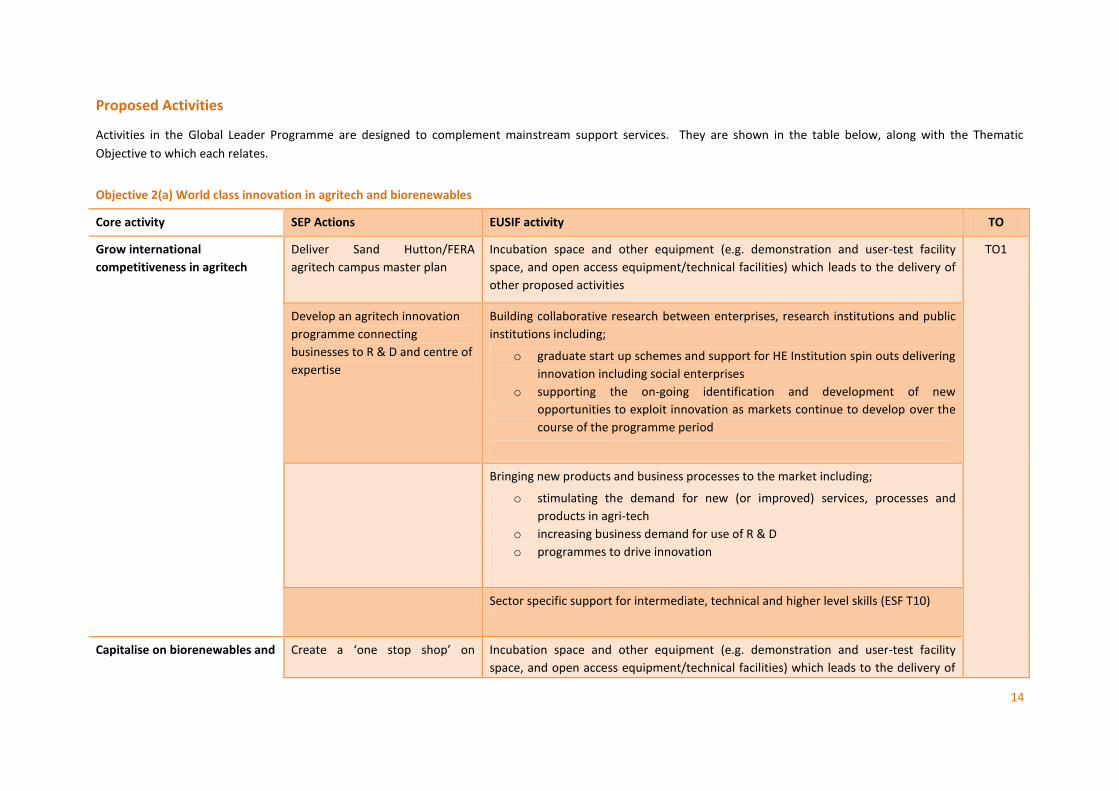
Proposed Activities
Activities in the Global Leader Programme are designed to complement mainstream support services. They are shown in the table below, along with the Thematic
Objective to which each relates.
Objective 2(a) World class innovation in agritech and biorenewables
Core activity SEP Actions EUSIF activity TO
Grow international
competitiveness in agritech
Deliver Sand Hutton/FERA
agritech campus master plan
Incubation space and other equipment (e.g. demonstration and user-test facility
space, and open access equipment/technical facilities) which leads to the delivery of
other proposed activities
TO1
Develop an agritech innovation
programme connecting
businesses to R & D and centre of
expertise
Building collaborative research between enterprises, research institutions and public
institutions including;
o graduate start up schemes and support for HE Institution spin outs delivering
innovation including social enterprises
o supporting the on-going identification and development of new
opportunities to exploit innovation as markets continue to develop over the
course of the programme period
Bringing new products and business processes to the market including;
o stimulating the demand for new (or improved) services, processes and
products in agri-tech
o increasing business demand for use of R & D
o programmes to drive innovation
Sector specific support for intermediate, technical and higher level skills (ESF T10)
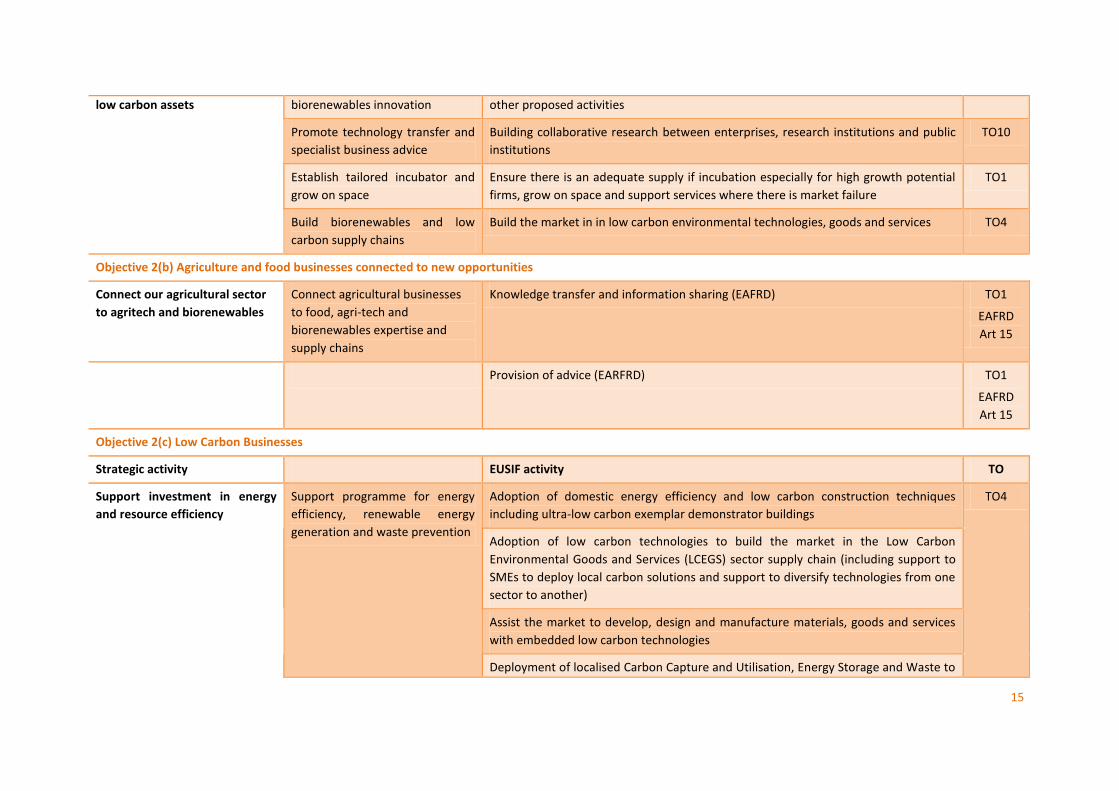
Capitalise on biorenewables and Create a ‘one stop shop’ on Incubation space and other equipment (e.g. demonstration and user-test facility
space, and open access equipment/technical facilities) which leads to the delivery of
15
low carbon assets
biorenewables innovation other proposed activities
Promote technology transfer and
specialist business advice
Building collaborative research between enterprises, research institutions and public
institutions
TO10
Establish tailored incubator and
grow on space
Ensure there is an adequate supply if incubation especially for high growth potential
firms, grow on space and support services where there is market failure
TO1
Build biorenewables and low
carbon supply chains
Build the market in in low carbon environmental technologies, goods and services TO4
Objective 2(b) Agriculture and food businesses connected to new opportunities
Connect our agricultural sector
to agritech and biorenewables
Connect agricultural businesses
to food, agri-tech and
biorenewables expertise and
supply chains
Knowledge transfer and information sharing (EAFRD) TO1
EAFRD
Art 15
Provision of advice (EARFRD) TO1
EAFRD
Art 15
Objective 2(c) Low Carbon Businesses
Strategic activity EUSIF activity TO
Support investment in energy
and resource efficiency
Support programme for energy
efficiency, renewable energy
generation and waste prevention
Adoption of domestic energy efficiency and low carbon construction techniques
including ultra-low carbon exemplar demonstrator buildings
TO4
Adoption of low carbon technologies to build the market in the Low Carbon
Environmental Goods and Services (LCEGS) sector supply chain (including support to
SMEs to deploy local carbon solutions and support to diversify technologies from one
sector to another)
Assist the market to develop, design and manufacture materials, goods and services
with embedded low carbon technologies
Deployment of localised Carbon Capture and Utilisation, Energy Storage and Waste to

16
Energy projects and infrastructure
Energy efficiency in enterprises including industrial processes designing out waste,
recovery of ‘waste’ heat energy and CHP
Moving to renewable and low carbon fuels to generate heat and power
Actions aligned to the Governments Waste Prevention Programme which drive low
carbon innovation in relation to waste and re-use
Building retrofit and energy efficiency especially whole building solutions and
exemplifying next phase technologies which are near to market
Skills/employment development for low carbon including via Higher Apprenticeships,
University Technical Colleges and placements /working with industry
TO10
Skills/employment for retrofitting and low carbon heating
Adaption skills for all sectors to support low carbon transition including eco-
innovation and skills to drive change
Help those without jobs and labour market entrants gain accredited low carbon
skills/employments
TO8
Also see Priority 3 Inspired People TO10 ESF activities
17
Core activities Grow our international competitiveness in Agritech - FERA at Sand Hutton is a key asset for agriculture and
related food and energy businesses. This world class facility sits at the heart of the UK agritech strategy and
has potential to double in size, creating 800 jobs and boosting the economy by £100m. It has an excellent case
to be at the core of the new national agritech ‘catalyst’ programme and to become an exemplar ‘catapult’
centre. Investment will build an innovation cluster around the FERA business, supporting investment in R&D,
technology transfer and creating major new business and export opportunities.
Capitalise on our biorenewables and low carbon assets – The BioVale Vision is for a Yorkshire and Humber
wide biorenewables based2 innovation cluster focused on centres of expertise in the University of York. This
would connect to low carbon and biomass developments at Drax, low carbon energy and chemicals in the
Humber, and expertise in other R&D institutions and universities. The proposal will make it easier for business
to access the world class innovation assets in the region and will promote technology transfer, build supply
chains and bridge gaps between sectors. We will develop an integrated bio-economy delivery plan in
collaboration with neighbouring LEP areas to drive the sector’s growth, incorporating all relevant parts of this
Priority.
Connect our agricultural sector to agritech and biorenewables expertise and opportunities – Growth of the
food manufacturing, agritech and the biorenewables sectors will create major supply chain and innovation
opportunities. These include those from investment in agri-innovation, potash mining, low carbon
transformation at Drax and offshore wind energy development. We will seek to ensure local SMEs, including
farms, are aware of supply chain opportunities and enhance their capacity to secure them. We will also exploit
opportunities for inward investment and reinvestment based on the supply chains of major investors.
Support investment in energy and resource efficiency – There is great potential to turn waste into a source of
renewable energy and an income stream, as well as to implement other energy saving, waste reduction and
energy microgeneration activities in farms and SMEs. However, market failures including access to finance
(barriers to market entry) and lack of awareness (imperfect information) are preventing take up. This
programme will open up grants, advice and other support that encourage small scale take up of low carbon
and sustainable technologies across the LEP area.
Beneficiaries The beneficiaries of the ‘global leader in food manufacturing, agri-tech and biorenewables’ will be YNYER
businesses within these sectors and their supply chain and residents in terms of employment.
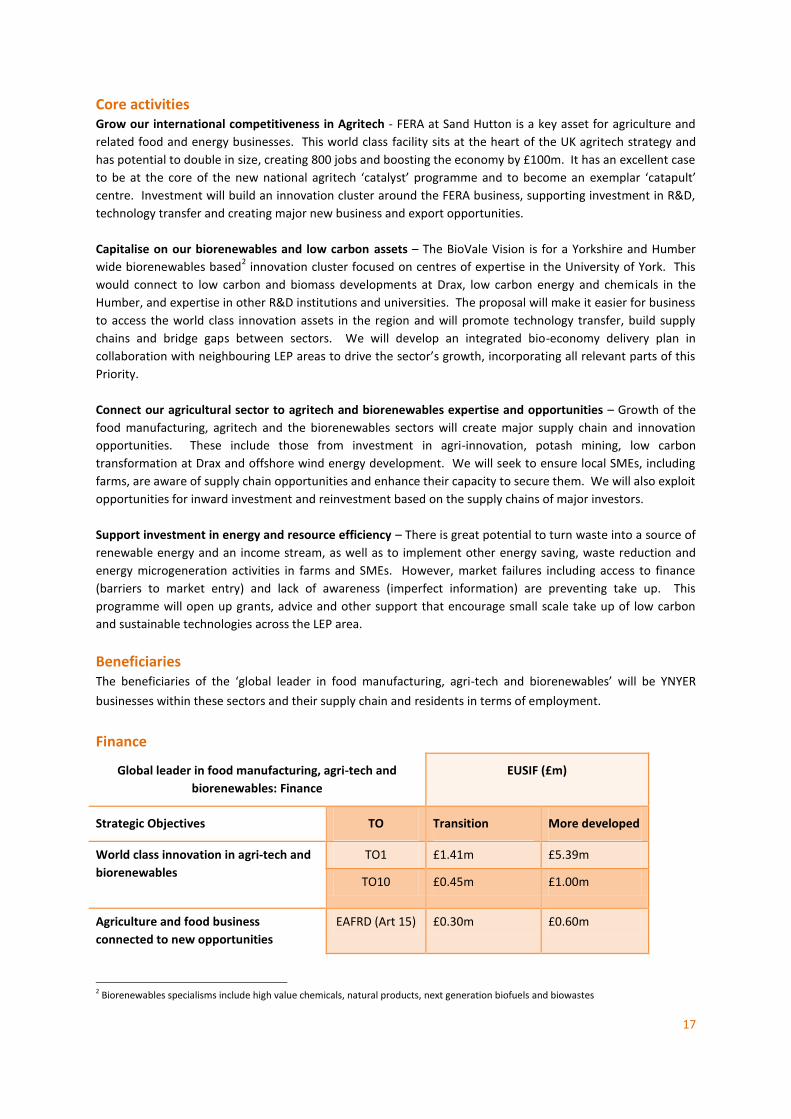
Finance
Global leader in food manufacturing, agri-tech and
biorenewables: Finance
EUSIF (£m)
Strategic Objectives TO Transition More developed
World class innovation in agri-tech and
biorenewables
TO1 £1.41m £5.39m
TO10 £0.45m £1.00m
Agriculture and food business
connected to new opportunities
EAFRD (Art 15) £0.30m £0.60m
2 Biorenewables specialisms include high value chemicals, natural products, next generation biofuels and biowastes
18
Low Carbon businesses
TO4 £1.64m £4.45m
EAFRD (Art 21) £0.30m £1.0m
Total £4.1m £12.44m
GRAND TOTAL £16.54m
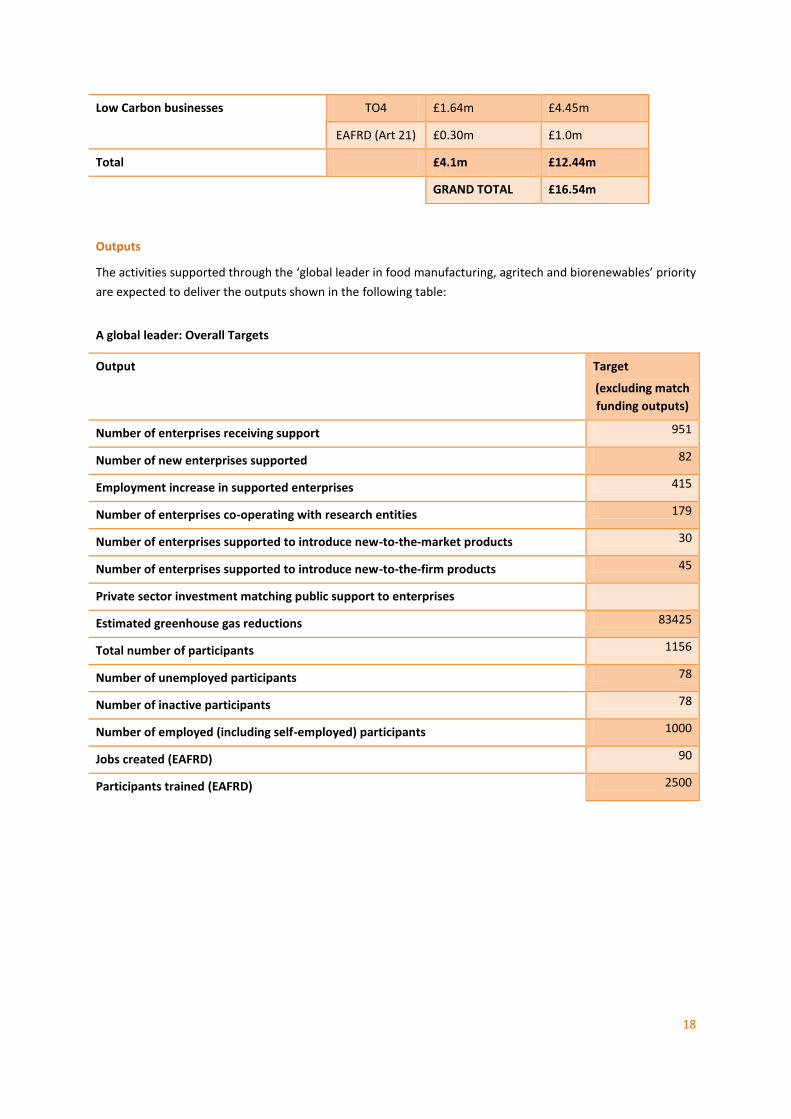
Outputs
The activities supported through the ‘global leader in food manufacturing, agritech and biorenewables’ priority
are expected to deliver the outputs shown in the following table:
A global leader: Overall Targets
Output Target
(excluding match
funding outputs)
Number of enterprises receiving support 951
Number of new enterprises supported 82
Employment increase in supported enterprises 415
Number of enterprises co-operating with research entities 179
Number of enterprises supported to introduce new-to-the-market products 30
Number of enterprises supported to introduce new-to-the-firm products 45
Private sector investment matching public support to enterprises
Estimated greenhouse gas reductions 83425
Total number of participants 1156
Number of unemployed participants 78
Number of inactive participants 78
Number of employed (including self-employed) participants 1000
Jobs created (EAFRD) 90
Participants trained (EAFRD) 2500
19
Priority 3: Inspired people
Overview Finances
We want to have one of the best workforces in the country, with ambitious and
enterprising young people, excellent employability skills and qualifications that
meet business needs now and in the future. Achieving that will drive business
growth and competitiveness and support employment and incomes
£33.27m of ESF
Why
Businesses need people with the right skills and qualities to flourish and grow. The
same skills help people to get jobs and progress in their careers. There is a strong
link between skills (especially higher level ones) and business productivity. On
average, businesses that invest in training perform far better than those that do
not. Likewise, people with better skills are far more likely to be employed and to
earn more. Skills are as vital to jobs and inclusion as to business success.
This priority is focused on the skills and attributes of our present and future workforce. It includes attainment
and qualifications, but also the employability and attitude skills that many employers see as crucial to success
and actively seek in new recruits. It includes sector specific needs as well as issues and skills that affect
employers across our economy.
At a strategic level, the evidence and rationale for making this area a priority is based on the following facts:
A highly skilled workforce is recognised as a key driver of productivity and one that also supports
enterprise and innovation. A fifth of UK economic growth is due to improvements in workforce skills.
Businesses that develop their skills do better. ‘Low training’ companies are between 2 and 2.5 times
more likely to go out of business as ‘high training’ companies.
People with better skills are more likely to be employed, to contribute more to productivity, and to earn
more. The earnings advantages associated with achieving higher qualifications are: Level 2 (+15%); Level
3 (+13%); Level 4 (+28%); Level 5 (+23%) – these are additive percentages3.
Whilst qualifications levels across most of the LEP area are above national average, they are not rising as
fast as nationally – so our advantage in this area will diminish unless we act. Additionally, there are
localised areas where skills levels are lower, most notably on the Yorkshire Coast.
Objectives The objectives of the ‘Inspired people’ Priority are as shown below.
A productive workforce for growing businesses
Inspired people making the right job choices
Empowered communities delivering support and inclusion
3 Statistics from “The Big Picture: skills and employment needs in a global context” presentation by Professor Mike Campbell OBE to LCR
skills network, June 28 2012
20
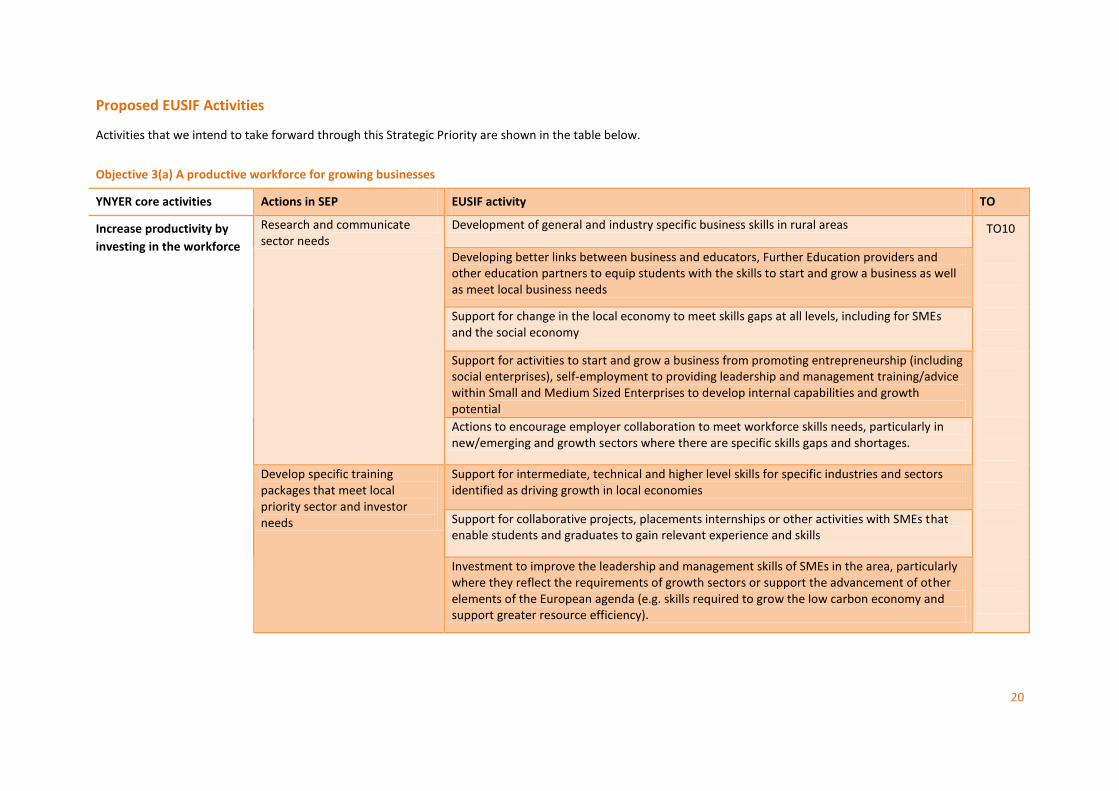
Proposed EUSIF Activities
Activities that we intend to take forward through this Strategic Priority are shown in the table below.
Objective 3(a) A productive workforce for growing businesses
YNYER core activities Actions in SEP EUSIF activity TO
Increase productivity by
investing in the workforce
Research and communicate sector needs
Development of general and industry specific business skills in rural areas TO10
Developing better links between business and educators, Further Education providers and other education partners to equip students with the skills to start and grow a business as well as meet local business needs
Support for change in the local economy to meet skills gaps at all levels, including for SMEs and the social economy
Support for activities to start and grow a business from promoting entrepreneurship (including social enterprises), self-employment to providing leadership and management training/advice within Small and Medium Sized Enterprises to develop internal capabilities and growth potential
Actions to encourage employer collaboration to meet workforce skills needs, particularly in new/emerging and growth sectors where there are specific skills gaps and shortages.
Develop specific training packages that meet local priority sector and investor needs
Support for intermediate, technical and higher level skills for specific industries and sectors identified as driving growth in local economies
Support for collaborative projects, placements internships or other activities with SMEs that enable students and graduates to gain relevant experience and skills
Investment to improve the leadership and management skills of SMEs in the area, particularly where they reflect the requirements of growth sectors or support the advancement of other elements of the European agenda (e.g. skills required to grow the low carbon economy and support greater resource efficiency).
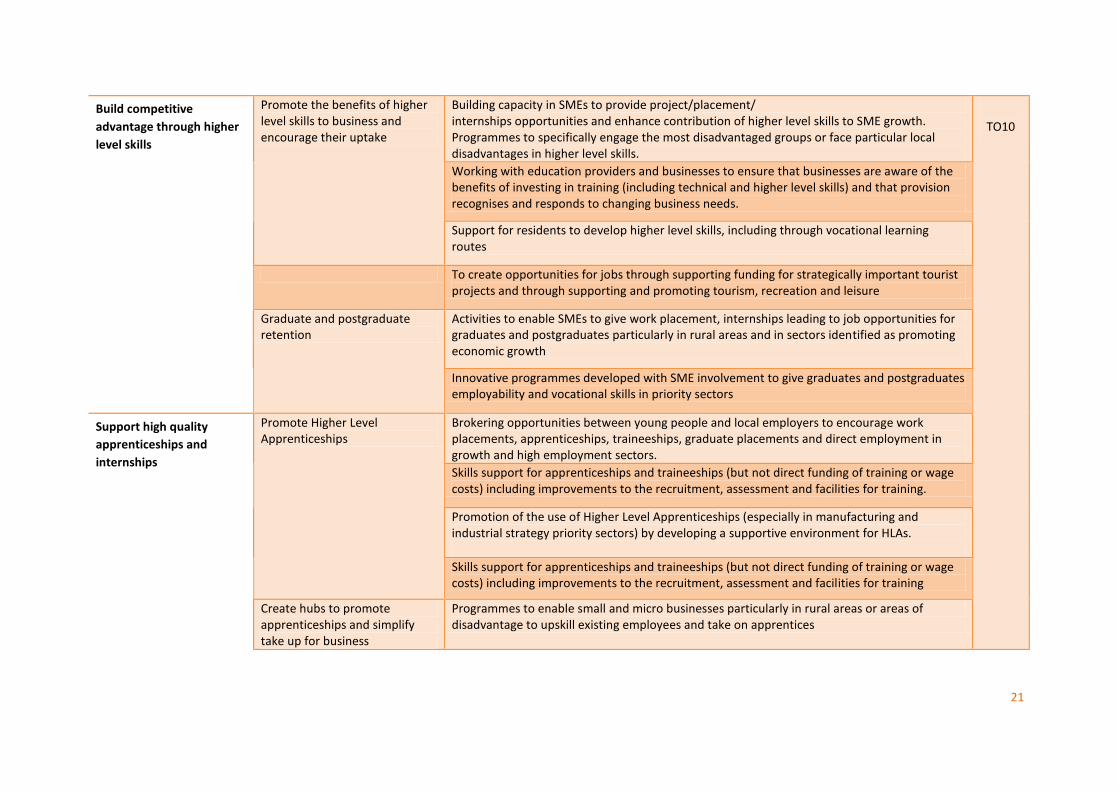
21
Build competitive
advantage through higher
level skills
Promote the benefits of higher level skills to business and encourage their uptake
Building capacity in SMEs to provide project/placement/ internships opportunities and enhance contribution of higher level skills to SME growth. Programmes to specifically engage the most disadvantaged groups or face particular local disadvantages in higher level skills.
TO10
Working with education providers and businesses to ensure that businesses are aware of the benefits of investing in training (including technical and higher level skills) and that provision recognises and responds to changing business needs.
Support for residents to develop higher level skills, including through vocational learning routes
To create opportunities for jobs through supporting funding for strategically important tourist projects and through supporting and promoting tourism, recreation and leisure
Graduate and postgraduate retention
Activities to enable SMEs to give work placement, internships leading to job opportunities for graduates and postgraduates particularly in rural areas and in sectors identified as promoting economic growth
Innovative programmes developed with SME involvement to give graduates and postgraduates employability and vocational skills in priority sectors
Support high quality
apprenticeships and
internships
Promote Higher Level Apprenticeships
Brokering opportunities between young people and local employers to encourage work placements, apprenticeships, traineeships, graduate placements and direct employment in growth and high employment sectors.
Skills support for apprenticeships and traineeships (but not direct funding of training or wage costs) including improvements to the recruitment, assessment and facilities for training.
Promotion of the use of Higher Level Apprenticeships (especially in manufacturing and industrial strategy priority sectors) by developing a supportive environment for HLAs.
Skills support for apprenticeships and traineeships (but not direct funding of training or wage costs) including improvements to the recruitment, assessment and facilities for training
Create hubs to promote apprenticeships and simplify take up for business
Programmes to enable small and micro businesses particularly in rural areas or areas of disadvantage to upskill existing employees and take on apprentices
22
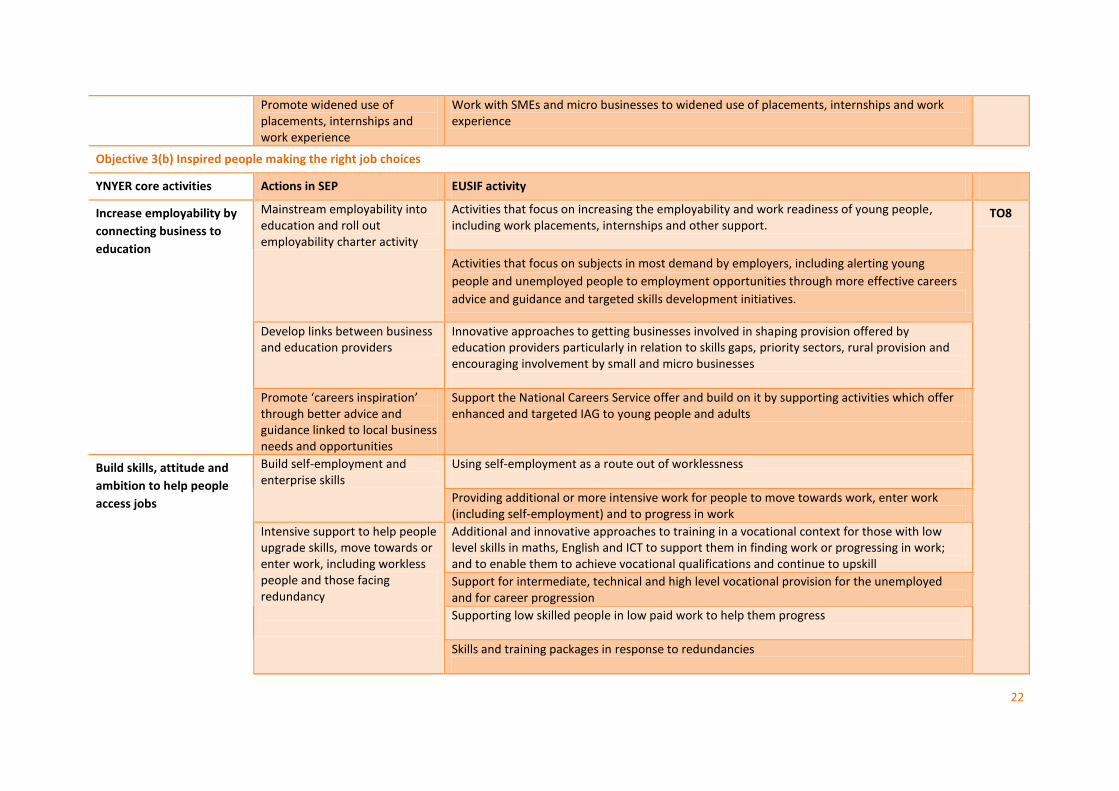
Promote widened use of placements, internships and work experience
Work with SMEs and micro businesses to widened use of placements, internships and work experience
Objective 3(b) Inspired people making the right job choices
YNYER core activities Actions in SEP EUSIF activity
Increase employability by
connecting business to
education
Mainstream employability into education and roll out employability charter activity
Activities that focus on increasing the employability and work readiness of young people, including work placements, internships and other support.
TO8
Activities that focus on subjects in most demand by employers, including alerting young
people and unemployed people to employment opportunities through more effective careers
advice and guidance and targeted skills development initiatives.
Develop links between business and education providers
Innovative approaches to getting businesses involved in shaping provision offered by education providers particularly in relation to skills gaps, priority sectors, rural provision and encouraging involvement by small and micro businesses
Promote ‘careers inspiration’ through better advice and guidance linked to local business needs and opportunities
Support the National Careers Service offer and build on it by supporting activities which offer enhanced and targeted IAG to young people and adults
Build skills, attitude and
ambition to help people
access jobs
Build self-employment and enterprise skills
Using self-employment as a route out of worklessness
Providing additional or more intensive work for people to move towards work, enter work (including self-employment) and to progress in work
Intensive support to help people upgrade skills, move towards or enter work, including workless people and those facing redundancy
Additional and innovative approaches to training in a vocational context for those with low level skills in maths, English and ICT to support them in finding work or progressing in work; and to enable them to achieve vocational qualifications and continue to upskill
Support for intermediate, technical and high level vocational provision for the unemployed and for career progression
Supporting low skilled people in low paid work to help them progress
Skills and training packages in response to redundancies
23
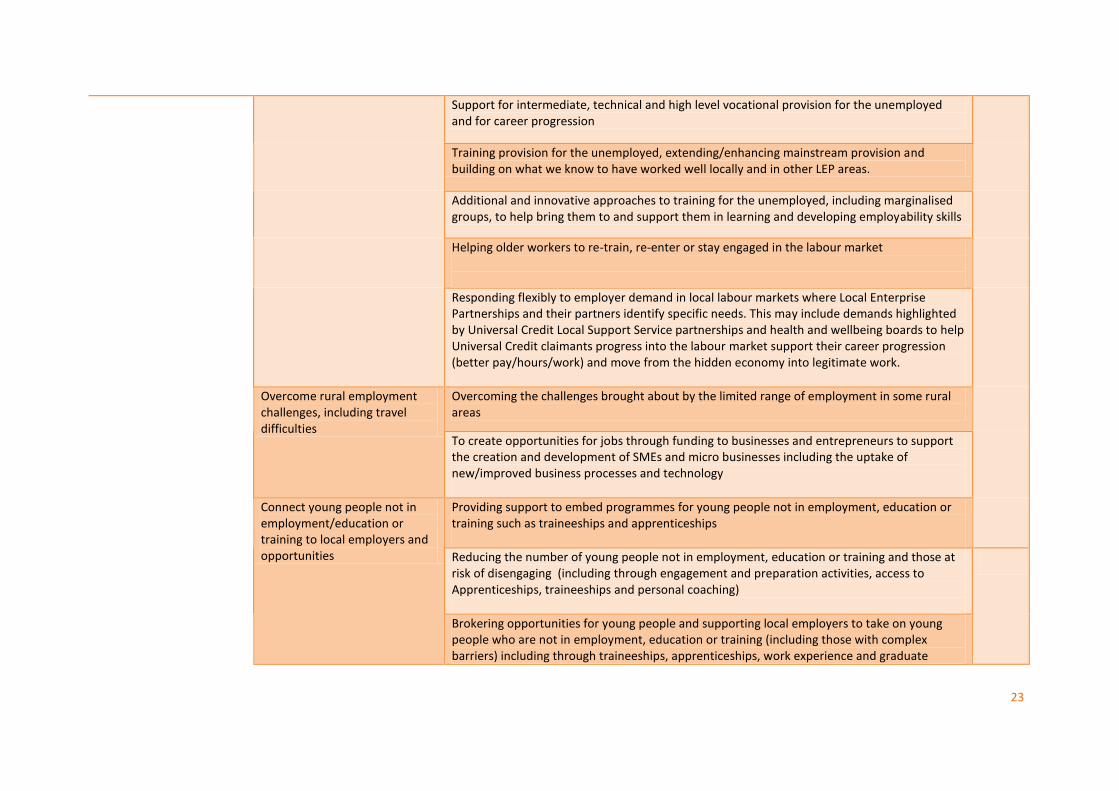
Support for intermediate, technical and high level vocational provision for the unemployed and for career progression
Training provision for the unemployed, extending/enhancing mainstream provision and building on what we know to have worked well locally and in other LEP areas.
Additional and innovative approaches to training for the unemployed, including marginalised groups, to help bring them to and support them in learning and developing employability skills
Helping older workers to re-train, re-enter or stay engaged in the labour market
Responding flexibly to employer demand in local labour markets where Local Enterprise Partnerships and their partners identify specific needs. This may include demands highlighted by Universal Credit Local Support Service partnerships and health and wellbeing boards to help Universal Credit claimants progress into the labour market support their career progression (better pay/hours/work) and move from the hidden economy into legitimate work.
Overcome rural employment challenges, including travel difficulties
Overcoming the challenges brought about by the limited range of employment in some rural areas
To create opportunities for jobs through funding to businesses and entrepreneurs to support the creation and development of SMEs and micro businesses including the uptake of new/improved business processes and technology
Connect young people not in employment/education or training to local employers and opportunities
Providing support to embed programmes for young people not in employment, education or training such as traineeships and apprenticeships
Reducing the number of young people not in employment, education or training and those at risk of disengaging (including through engagement and preparation activities, access to Apprenticeships, traineeships and personal coaching)
Brokering opportunities for young people and supporting local employers to take on young people who are not in employment, education or training (including those with complex barriers) including through traineeships, apprenticeships, work experience and graduate
24
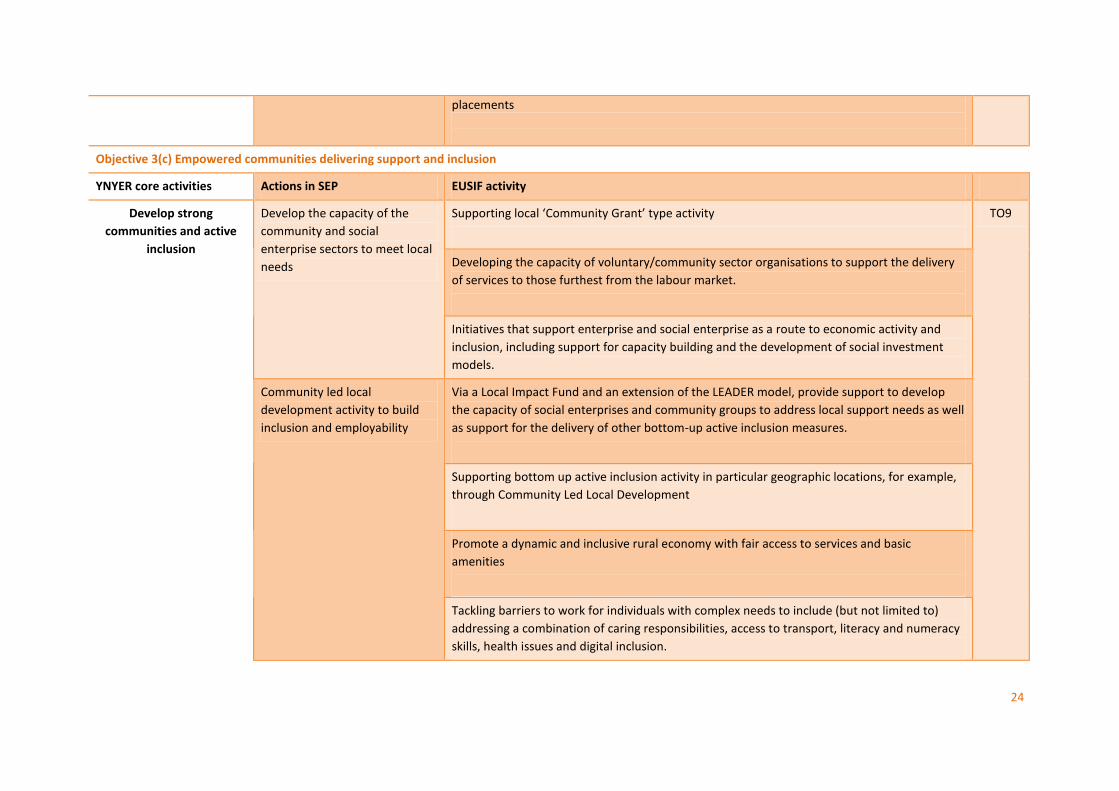
placements
Objective 3(c) Empowered communities delivering support and inclusion
YNYER core activities Actions in SEP EUSIF activity
Develop strong
communities and active
inclusion
Develop the capacity of the
community and social
enterprise sectors to meet local
needs
Supporting local ‘Community Grant’ type activity
TO9
Developing the capacity of voluntary/community sector organisations to support the delivery
of services to those furthest from the labour market.
Initiatives that support enterprise and social enterprise as a route to economic activity and
inclusion, including support for capacity building and the development of social investment
models.
Community led local
development activity to build
inclusion and employability
Via a Local Impact Fund and an extension of the LEADER model, provide support to develop
the capacity of social enterprises and community groups to address local support needs as well
as support for the delivery of other bottom-up active inclusion measures.
Supporting bottom up active inclusion activity in particular geographic locations, for example,
through Community Led Local Development
Promote a dynamic and inclusive rural economy with fair access to services and basic
amenities
Tackling barriers to work for individuals with complex needs to include (but not limited to)
addressing a combination of caring responsibilities, access to transport, literacy and numeracy
skills, health issues and digital inclusion.

25
Tailored support measures to target specific geographies or groups experiencing high rates of
social exclusion and poverty (e.g. troubled families and people with low levels of basic skills).
Tackling barriers to work in a holistic way, including through supporting early action before
problems become entrenched, outreach activities and access to locally provided services. This
may include addressing issues such as: caring responsibilities; debt and money management;
digital inclusion; reducing drug and alcohol dependency; educational attainment (particularly
lack of basic literacy and numeracy and ESOL); family, parenting and relationship intervention;
access to flexible and affordable childcare, health problems (including mental health);
homelessness; learning difficulties and disabilities ; life skills; offending: and access to
transport.
Activities that provide people with experience of a working environment to help them build
their skills and confidence, e.g. work experience placements.
Developing locally specific inclusion initiatives, including through Community Led Local
Development and community based learning approaches.
Activities that promote social
inclusion through delivering
environmental benefits
Supporting activities that are designed to promote social inclusion whilst also tackling
environmental issues such as environmental protection, waste recycling, energy efficiency,
and renewable energy
26
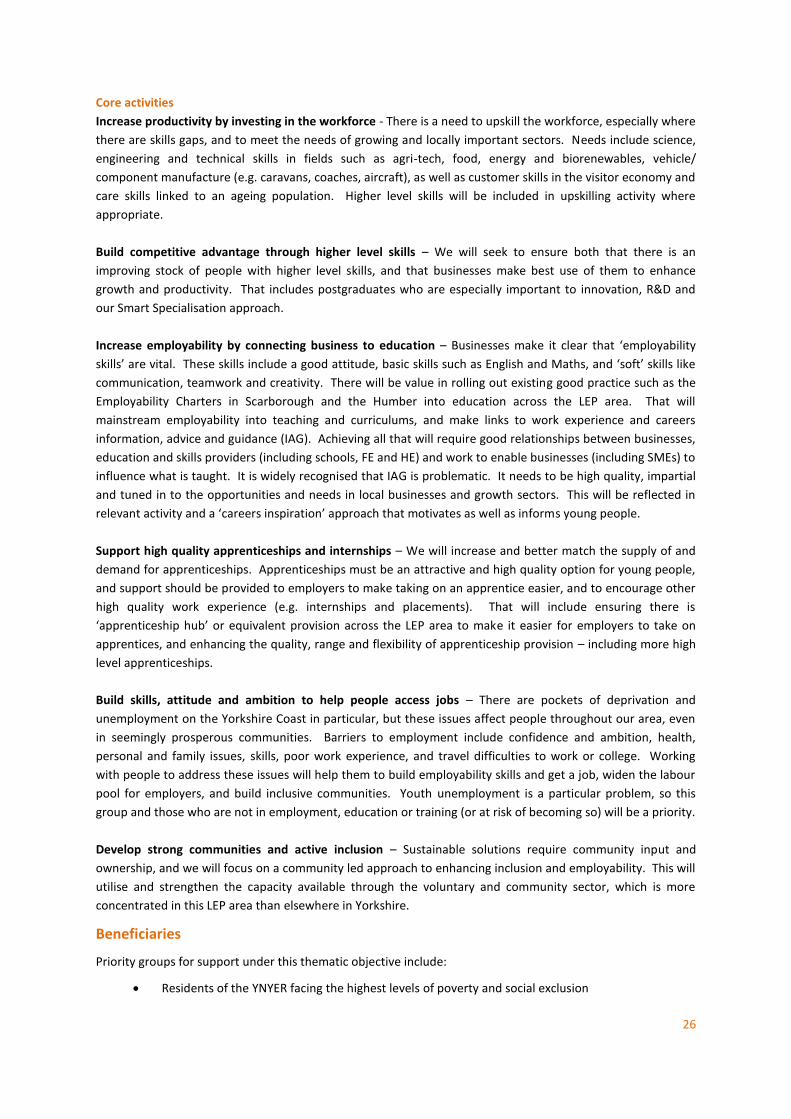
Core activities
Increase productivity by investing in the workforce - There is a need to upskill the workforce, especially where
there are skills gaps, and to meet the needs of growing and locally important sectors. Needs include science,
engineering and technical skills in fields such as agri-tech, food, energy and biorenewables, vehicle/
component manufacture (e.g. caravans, coaches, aircraft), as well as customer skills in the visitor economy and
care skills linked to an ageing population. Higher level skills will be included in upskilling activity where
appropriate.
Build competitive advantage through higher level skills – We will seek to ensure both that there is an
improving stock of people with higher level skills, and that businesses make best use of them to enhance
growth and productivity. That includes postgraduates who are especially important to innovation, R&D and
our Smart Specialisation approach.
Increase employability by connecting business to education – Businesses make it clear that ‘employability
skills’ are vital. These skills include a good attitude, basic skills such as English and Maths, and ‘soft’ skills like
communication, teamwork and creativity. There will be value in rolling out existing good practice such as the
Employability Charters in Scarborough and the Humber into education across the LEP area. That will
mainstream employability into teaching and curriculums, and make links to work experience and careers
information, advice and guidance (IAG). Achieving all that will require good relationships between businesses,
education and skills providers (including schools, FE and HE) and work to enable businesses (including SMEs) to
influence what is taught. It is widely recognised that IAG is problematic. It needs to be high quality, impartial
and tuned in to the opportunities and needs in local businesses and growth sectors. This will be reflected in
relevant activity and a ‘careers inspiration’ approach that motivates as well as informs young people.
Support high quality apprenticeships and internships – We will increase and better match the supply of and
demand for apprenticeships. Apprenticeships must be an attractive and high quality option for young people,
and support should be provided to employers to make taking on an apprentice easier, and to encourage other
high quality work experience (e.g. internships and placements). That will include ensuring there is
‘apprenticeship hub’ or equivalent provision across the LEP area to make it easier for employers to take on
apprentices, and enhancing the quality, range and flexibility of apprenticeship provision – including more high
level apprenticeships.
Build skills, attitude and ambition to help people access jobs – There are pockets of deprivation and
unemployment on the Yorkshire Coast in particular, but these issues affect people throughout our area, even
in seemingly prosperous communities. Barriers to employment include confidence and ambition, health,
personal and family issues, skills, poor work experience, and travel difficulties to work or college. Working
with people to address these issues will help them to build employability skills and get a job, widen the labour
pool for employers, and build inclusive communities. Youth unemployment is a particular problem, so this
group and those who are not in employment, education or training (or at risk of becoming so) will be a priority.
Develop strong communities and active inclusion – Sustainable solutions require community input and
ownership, and we will focus on a community led approach to enhancing inclusion and employability. This will
utilise and strengthen the capacity available through the voluntary and community sector, which is more
concentrated in this LEP area than elsewhere in Yorkshire.
Beneficiaries
Priority groups for support under this thematic objective include:
Residents of the YNYER facing the highest levels of poverty and social exclusion
27
Young people and adults facing multiple barriers to employment
Troubled families
Groups requiring additional support to transfer to Universal Credit
Voluntary and community sector organisations, including social enterprises
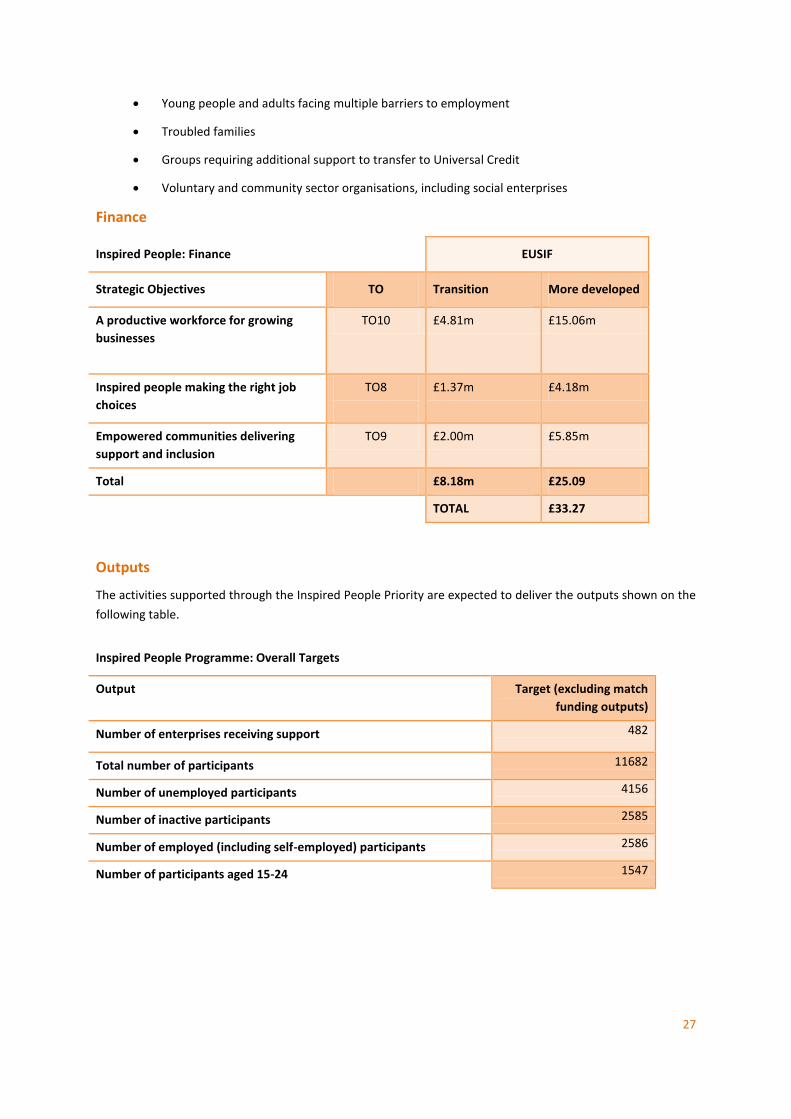
Finance
Inspired People: Finance EUSIF
Strategic Objectives TO Transition More developed
A productive workforce for growing
businesses
TO10 £4.81m £15.06m
Inspired people making the right job
choices
TO8
£1.37m £4.18m
Empowered communities delivering
support and inclusion
TO9 £2.00m £5.85m
Total £8.18m £25.09
TOTAL £33.27
Outputs
The activities supported through the Inspired People Priority are expected to deliver the outputs shown on the
following table.
Inspired People Programme: Overall Targets
Output Target (excluding match
funding outputs)
Number of enterprises receiving support 482
Total number of participants 11682
Number of unemployed participants 4156
Number of inactive participants 2585
Number of employed (including self-employed) participants 2586
Number of participants aged 15-24 1547
28
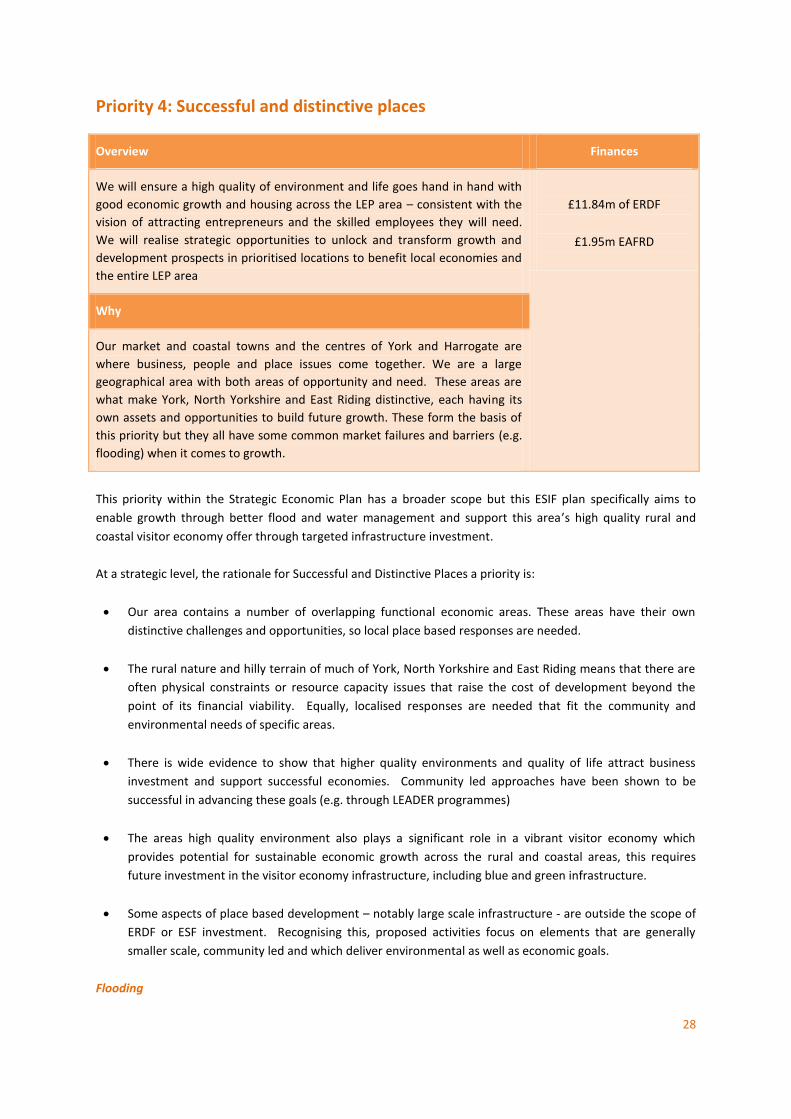
Priority 4: Successful and distinctive places
Overview Finances
We will ensure a high quality of environment and life goes hand in hand with
good economic growth and housing across the LEP area – consistent with the
vision of attracting entrepreneurs and the skilled employees they will need.
We will realise strategic opportunities to unlock and transform growth and
development prospects in prioritised locations to benefit local economies and
the entire LEP area
£11.84m of ERDF
£1.95m EAFRD
Why
Our market and coastal towns and the centres of York and Harrogate are
where business, people and place issues come together. We are a large
geographical area with both areas of opportunity and need. These areas are
what make York, North Yorkshire and East Riding distinctive, each having its
own assets and opportunities to build future growth. These form the basis of
this priority but they all have some common market failures and barriers (e.g.
flooding) when it comes to growth.
This priority within the Strategic Economic Plan has a broader scope but this ESIF plan specifically aims to
enable growth through better flood and water management and support this area’s high quality rural and
coastal visitor economy offer through targeted infrastructure investment.
At a strategic level, the rationale for Successful and Distinctive Places a priority is:
Our area contains a number of overlapping functional economic areas. These areas have their own
distinctive challenges and opportunities, so local place based responses are needed.
The rural nature and hilly terrain of much of York, North Yorkshire and East Riding means that there are
often physical constraints or resource capacity issues that raise the cost of development beyond the
point of its financial viability. Equally, localised responses are needed that fit the community and
environmental needs of specific areas.
There is wide evidence to show that higher quality environments and quality of life attract business
investment and support successful economies. Community led approaches have been shown to be
successful in advancing these goals (e.g. through LEADER programmes)
The areas high quality environment also plays a significant role in a vibrant visitor economy which
provides potential for sustainable economic growth across the rural and coastal areas, this requires
future investment in the visitor economy infrastructure, including blue and green infrastructure.
Some aspects of place based development – notably large scale infrastructure - are outside the scope of
ERDF or ESF investment. Recognising this, proposed activities focus on elements that are generally
smaller scale, community led and which deliver environmental as well as economic goals.
Flooding

29
The risk to businesses, and therefore to economic development, posed by flooding is a significant climate
change challenge for the UK. Flood damages in England have risen by around 60% over the past 25 years and
already exceed £1bn per annum in direct costs. Parts of the YNYER were very severely affected by the major
floods of 2007, and the tidal surge event in December 2013 with very significant and long lasting
consequences. Although difficult to accurately quantify, it is clear that the large-scale damages to stock and
loss of revenue for YNYER businesses ran into many millions of pounds. One man lost his life and many
thousands suffered stress, trauma, mental and physical health problems.
Therefore, there is a strong rationale for using a proportion of the resources available through this Strategic
Objective to support activities that will further strengthen the area’s resilience to flooding, in doing so
providing important stability to our businesses and unlocking growth opportunities on strategic employment
sites across the YNYER.
Objectives
The objective of this priority is:
Environmental quality and community needs
30
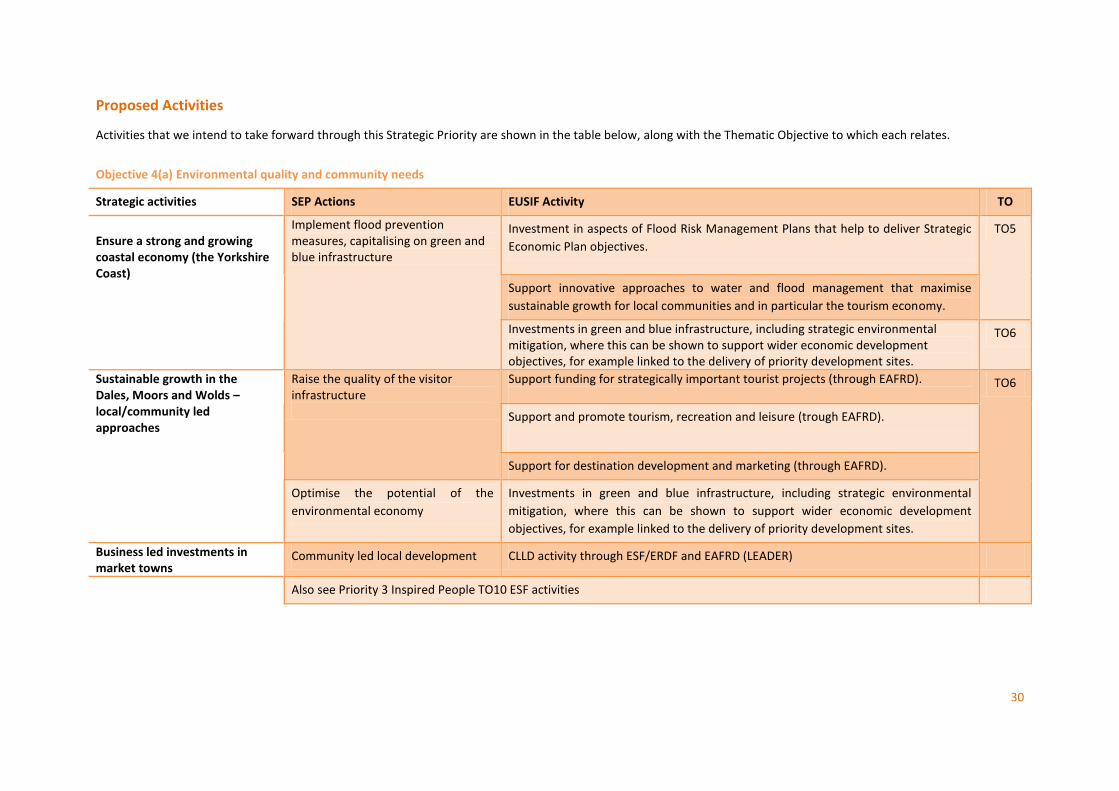
Proposed Activities
Activities that we intend to take forward through this Strategic Priority are shown in the table below, along with the Thematic Objective to which each relates.
Objective 4(a) Environmental quality and community needs
Strategic activities SEP Actions EUSIF Activity TO
Ensure a strong and growing coastal economy (the Yorkshire Coast)
Implement flood prevention measures, capitalising on green and blue infrastructure
Investment in aspects of Flood Risk Management Plans that help to deliver Strategic
Economic Plan objectives.
TO5
Support innovative approaches to water and flood management that maximise
sustainable growth for local communities and in particular the tourism economy.
Investments in green and blue infrastructure, including strategic environmental mitigation, where this can be shown to support wider economic development objectives, for example linked to the delivery of priority development sites.
TO6
Sustainable growth in the Dales, Moors and Wolds – local/community led approaches
Raise the quality of the visitor infrastructure
Support funding for strategically important tourist projects (through EAFRD).
TO6
Support and promote tourism, recreation and leisure (trough EAFRD).
Support for destination development and marketing (through EAFRD).
Optimise the potential of the
environmental economy
Investments in green and blue infrastructure, including strategic environmental
mitigation, where this can be shown to support wider economic development
objectives, for example linked to the delivery of priority development sites.
Business led investments in market towns
Community led local development CLLD activity through ESF/ERDF and EAFRD (LEADER)
Also see Priority 3 Inspired People TO10 ESF activities

31
Core Activities Ensure a strong and growing coastal economy – The Yorkshire Coast has one of the finest coastlines in Britain,
with famous seaside towns such as Scarborough, Bridlington, Whitby and Filey. All of these towns have seen
significant change over the years and have had to look towards raising the quality of their visitor offer whilst
also looking to new economic opportunities, such as offshore wind, potash mining and creative and digital
industries. There is a need to invest in the infrastructure to enable new employment and housing land to be
made available, new facilities exploit new growth opportunities, and improvements to raise the quality of the
coastal visitor offer. As well as on rivers, flood risks can be marked in areas close to the coast and to the
Humber estuary. We will respond to these pressures where they affect economic success and future
development, adopting a sustainable approach that fully utilises and takes account of green and blue
infrastructure.
Sustainable growth in the Dales, Moors and Wolds - We have significant rural upland areas covering the
Yorkshire Dales, North York Moors and Yorkshire Wolds, outstanding landscapes with small towns acting as
service hubs for jobs and visitors. But these are areas with future challenges where investment is needed to
ensure sustainable economic communities rather than large scale growth.
Business led investments in market towns – the LEP area has well over 30 market towns and these are pivotal
to our distinctive identity, quality of life and economic prospects. We will support local business led action
tuned to the needs of the market towns and communities they are based within, and designed to attract and
retain visitors and customers.
Beneficiaries
The beneficiaries of the activities delivered through this Strategic Priorities will be:
YNYER businesses and the overall economy through reduced flooding risks, amenity improvements
and biodiversity
The wider YNYER economy, through the creation of new employment and apprenticeship
opportunities
YNYER businesses, residents and the economy through the employment opportunities and
commercial benefits of transport infrastructure improvements
The YNYER environment
There will also be additional low carbon benefits through reduced the flows into the drainage system resulting
in less pumping.
32
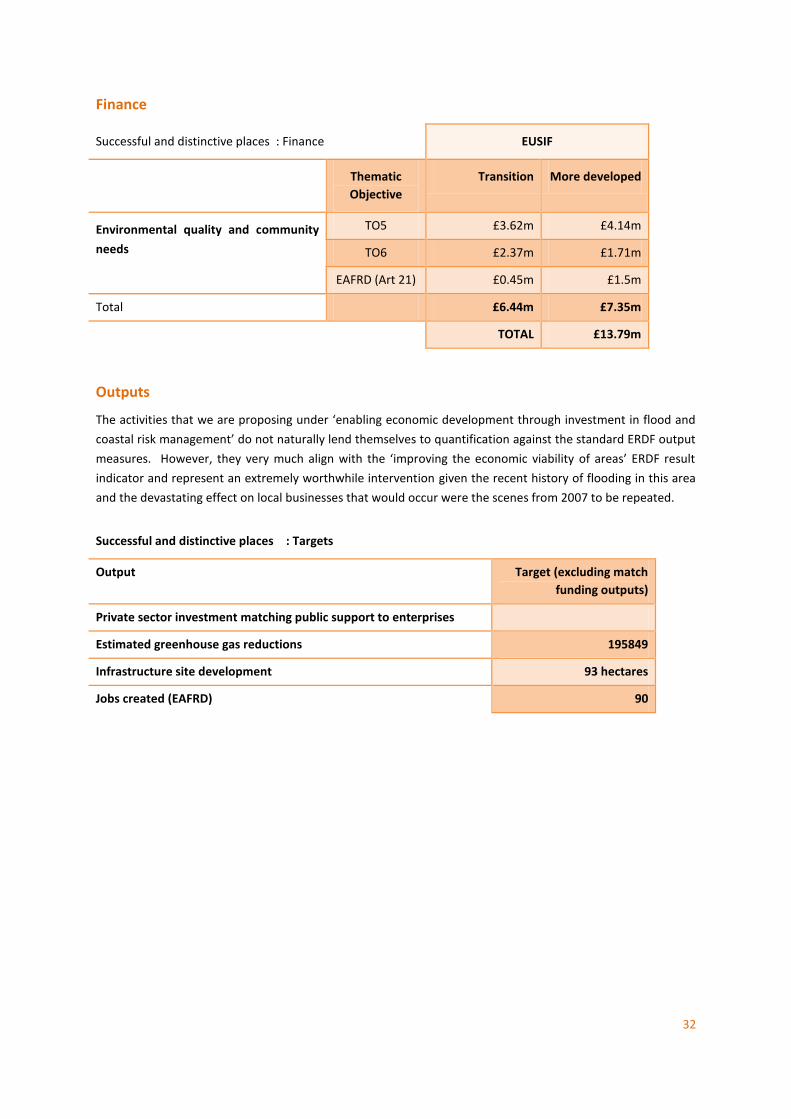
Finance
Successful and distinctive places : Finance EUSIF
Thematic
Objective
Transition More developed
Environmental quality and community
needs
TO5 £3.62m £4.14m
TO6 £2.37m £1.71m
EAFRD (Art 21) £0.45m £1.5m
Total £6.44m £7.35m
TOTAL £13.79m
Outputs
The activities that we are proposing under ‘enabling economic development through investment in flood and
coastal risk management’ do not naturally lend themselves to quantification against the standard ERDF output
measures. However, they very much align with the ‘improving the economic viability of areas’ ERDF result
indicator and represent an extremely worthwhile intervention given the recent history of flooding in this area
and the devastating effect on local businesses that would occur were the scenes from 2007 to be repeated.
Successful and distinctive places : Targets
Output Target (excluding match
funding outputs)
Private sector investment matching public support to enterprises
Estimated greenhouse gas reductions 195849
Infrastructure site development 93 hectares
Jobs created (EAFRD) 90
33
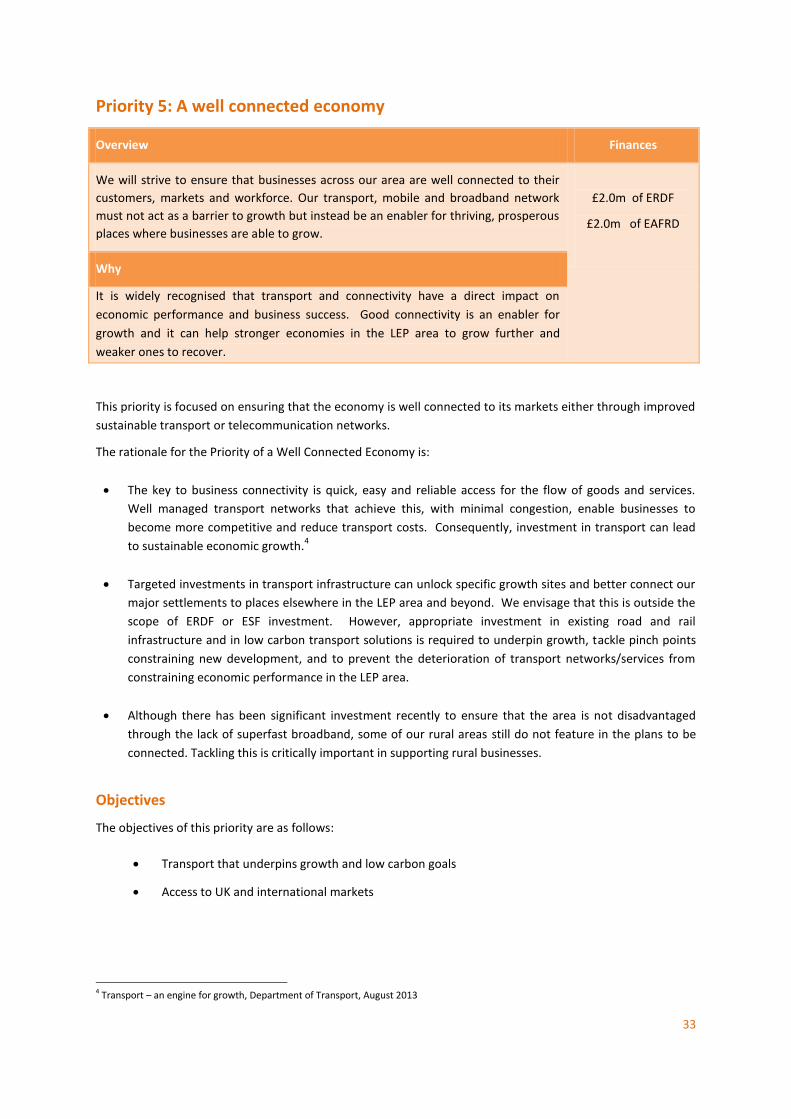
Priority 5: A well connected economy
Overview Finances
We will strive to ensure that businesses across our area are well connected to their
customers, markets and workforce. Our transport, mobile and broadband network
must not act as a barrier to growth but instead be an enabler for thriving, prosperous
places where businesses are able to grow.
£2.0m of ERDF
£2.0m of EAFRD
Why
It is widely recognised that transport and connectivity have a direct impact on
economic performance and business success. Good connectivity is an enabler for
growth and it can help stronger economies in the LEP area to grow further and
weaker ones to recover.
This priority is focused on ensuring that the economy is well connected to its markets either through improved
sustainable transport or telecommunication networks.
The rationale for the Priority of a Well Connected Economy is:
The key to business connectivity is quick, easy and reliable access for the flow of goods and services.
Well managed transport networks that achieve this, with minimal congestion, enable businesses to
become more competitive and reduce transport costs. Consequently, investment in transport can lead
to sustainable economic growth.4
Targeted investments in transport infrastructure can unlock specific growth sites and better connect our
major settlements to places elsewhere in the LEP area and beyond. We envisage that this is outside the
scope of ERDF or ESF investment. However, appropriate investment in existing road and rail
infrastructure and in low carbon transport solutions is required to underpin growth, tackle pinch points
constraining new development, and to prevent the deterioration of transport networks/services from
constraining economic performance in the LEP area.
Although there has been significant investment recently to ensure that the area is not disadvantaged
through the lack of superfast broadband, some of our rural areas still do not feature in the plans to be
connected. Tackling this is critically important in supporting rural businesses.
Objectives
The objectives of this priority are as follows:
Transport that underpins growth and low carbon goals
Access to UK and international markets
4 Transport – an engine for growth, Department of Transport, August 2013
34
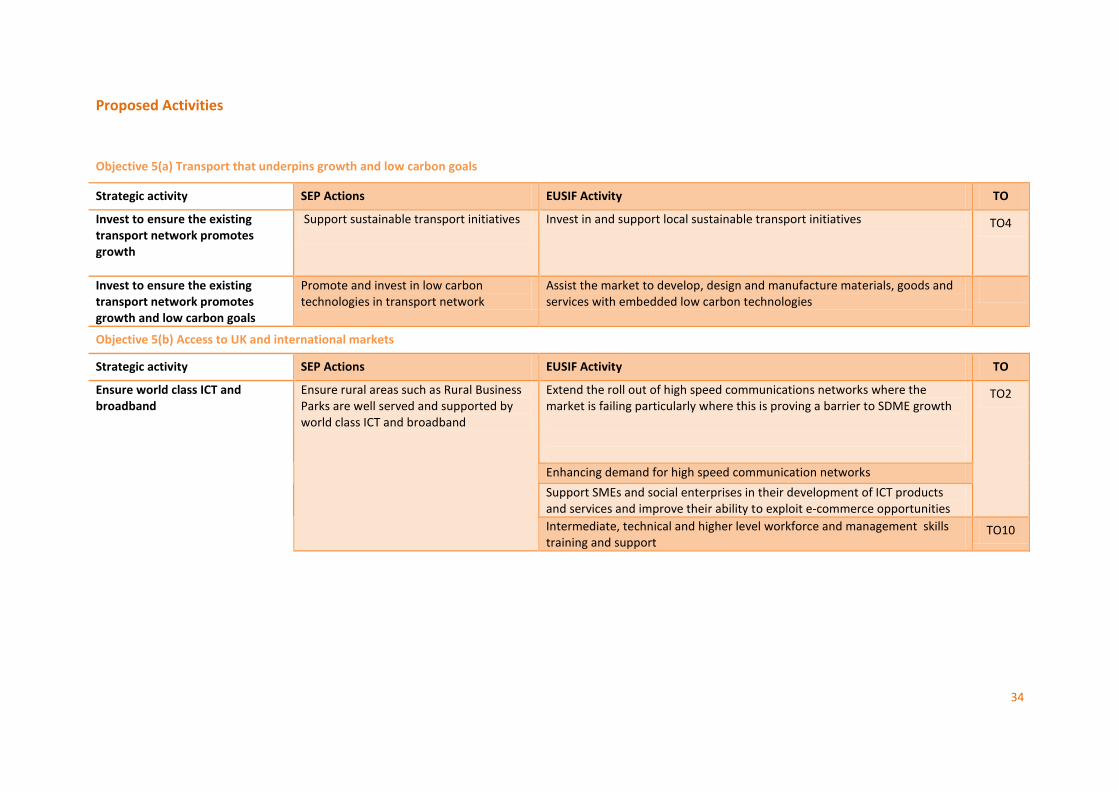
Proposed Activities
Objective 5(a) Transport that underpins growth and low carbon goals
Strategic activity SEP Actions EUSIF Activity TO
Invest to ensure the existing transport network promotes growth
Support sustainable transport initiatives
Invest in and support local sustainable transport initiatives TO4
Invest to ensure the existing transport network promotes growth and low carbon goals
Promote and invest in low carbon technologies in transport network
Assist the market to develop, design and manufacture materials, goods and services with embedded low carbon technologies
Objective 5(b) Access to UK and international markets
Strategic activity SEP Actions EUSIF Activity TO
Ensure world class ICT and broadband
Ensure rural areas such as Rural Business Parks are well served and supported by world class ICT and broadband
Extend the roll out of high speed communications networks where the market is failing particularly where this is proving a barrier to SDME growth
TO2
Enhancing demand for high speed communication networks
Support SMEs and social enterprises in their development of ICT products and services and improve their ability to exploit e-commerce opportunities
Intermediate, technical and higher level workforce and management skills training and support
TO10
35
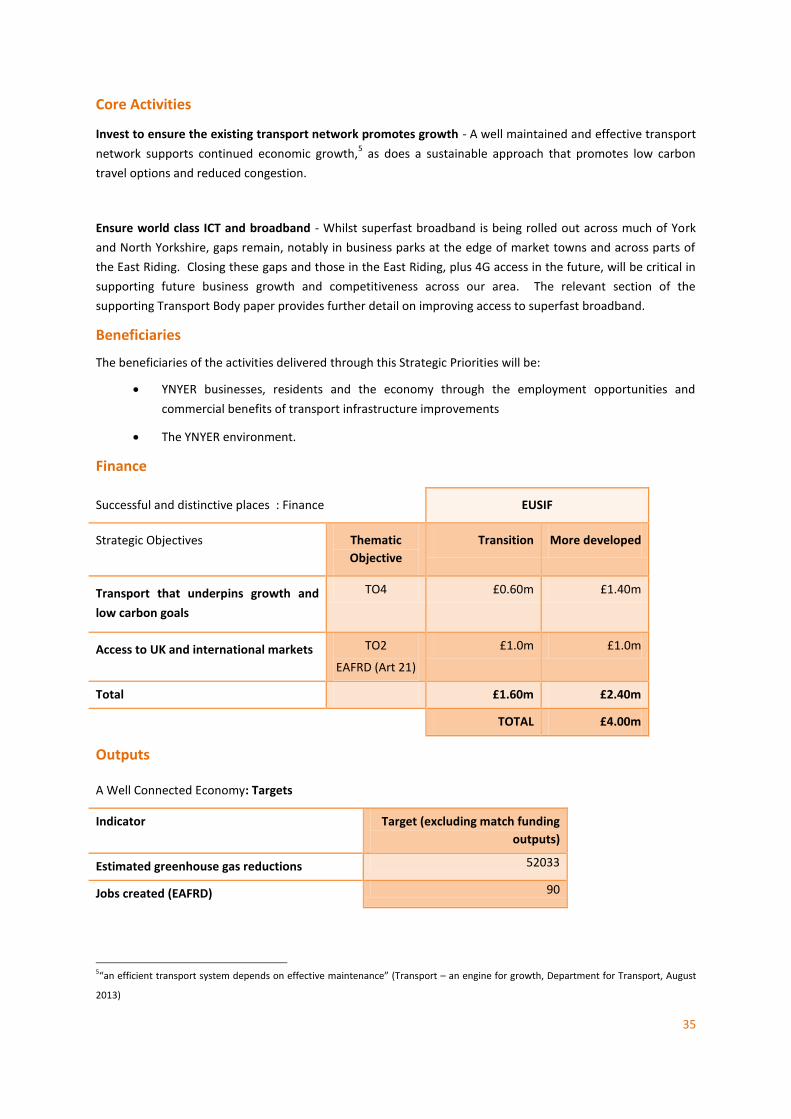
Core Activities
Invest to ensure the existing transport network promotes growth - A well maintained and effective transport
network supports continued economic growth,5 as does a sustainable approach that promotes low carbon
travel options and reduced congestion.
Ensure world class ICT and broadband - Whilst superfast broadband is being rolled out across much of York
and North Yorkshire, gaps remain, notably in business parks at the edge of market towns and across parts of
the East Riding. Closing these gaps and those in the East Riding, plus 4G access in the future, will be critical in
supporting future business growth and competitiveness across our area. The relevant section of the
supporting Transport Body paper provides further detail on improving access to superfast broadband.
Beneficiaries
The beneficiaries of the activities delivered through this Strategic Priorities will be:
YNYER businesses, residents and the economy through the employment opportunities and
commercial benefits of transport infrastructure improvements
The YNYER environment.
Finance
Successful and distinctive places : Finance EUSIF
Strategic Objectives Thematic
Objective
Transition More developed
Transport that underpins growth and
low carbon goals
TO4 £0.60m £1.40m
Access to UK and international markets TO2
EAFRD (Art 21)
£1.0m £1.0m
Total £1.60m £2.40m
TOTAL £4.00m
Outputs
A Well Connected Economy: Targets
Indicator Target (excluding match funding
outputs)
Estimated greenhouse gas reductions 52033
Jobs created (EAFRD) 90
5“an efficient transport system depends on effective maintenance” (Transport – an engine for growth, Department for Transport, August
2013)
36
3. Cross Cutting Issues – Sustainable Development and Low Carbon, Social
Inclusion and Equalities, Innovation and Community Led Local
Development
The Strategic Economic Plan and this Implementation Plan takes account of and contributes to the EU cross
cutting themes of sustainable development and equality, and the processes of social innovation and
community led local development. In this section we set out how these (and related) themes will be
proactively taken forward and implemented.
3.1. Our Approach A number of key issues cannot be framed within a single component of this Plan; to be meaningfully applied
they need to run right through it, affecting both the content of actions and the way they are delivered. Based
on partner engagement, evidence and guidance, we have identified four such themes:
Sustainable Development and Low Carbon
Social Inclusion and Equalities
Innovation – Social Innovation and Smart Specialisation
Community Led Local Development
3.2. Sustainable Development and Low Carbon Ambitions This theme incudes three elements:
integrating social, environmental and economic aspects of development to ensure that it contributes to
quality of life now and in the future
protecting and enhancing the environment
responding to climate change by both reducing carbon emissions and adapting to a changing climate – for
instance through flood prevention.
The LEP and the Strategic Economic Plan is committed to all three goals and will put in place actions and
mechanisms to take them forward in line with the UK Government’s principles for Sustainable Development6.
We will work with relevant partners and experts to put this into practice, including our three Local Nature
Partnerships, both National Park Authorities (covering the North York Moors and the Yorkshire Dales) and third
sector environmental organisations.
Content on sustainable development, including low carbon, is covered within each of the priorities of the
strategy. Over and above that content the following general principles and commitments apply to strategic
decision making and project development:
Contribute to the carbon reduction goals in the LEP area (and beyond), including through shifts in energy
generation and energy efficiency measures;
Consider and adopt ‘adaptation’ measures in response to a changing climate and related pressures,
including flood risk, coastal erosion and impacts on land use, health, habitats and industry;
Promote mechanisms such as resource efficiency which reduce environmental impacts and enhance
economic competitiveness;
6 These are: Living within environmental limits; Ensuring a strong, healthy and just society; Achieving a sustainable economy; using sound
science responsibly; and promoting good governance.

37
Value and where possible enhance ‘green and blue infrastructure’ such as habitats, water courses and
features, and important landscapes and the ‘ecosystems services’ they provide such as climate regulation,
amenity value and flood prevention;
Pursue supply chain development and procurement approaches that deliver environmental benefits, for
instance through the way in which use of local goods and services can reduce distances travelled and CO2
emissions;
Take opportunities to encourage sustainable and low carbon transport, for instance through promoting of
cycling, walking and public transport, and use of ICT and local services to avoid unnecessary or long
journeys;
Apply the polluter pays principle to all activities; and
Set demanding environmental standards for buildings and infrastructure – BREEAM ‘excellent’ for new
build, BREEAM ‘very good’ for refurbishment, and CEEQUAL ‘very good’ for infrastructure projects.
3.3. Social Inclusion and Equalities This theme includes two main strands: anti-discrimination policies in line with the Equality Act, 2010
7; and
wider strategic and project level activity to support social inclusion.
The LEP is committed to the three key elements under the Public Sector Equality Duty in relation to our
decision making and delivery, those being:
To eliminate unlawful discrimination
To advance equality of opportunity
To foster good relations
We will seek evidence on the economic and employment circumstances of different groups and use that
information in targeting of activity. Readily available evidence includes that on youth unemployment and that
is set out in the evidence section and has been used to inform priority setting.
More broadly, we will look to ensure that people from all groups and all areas across York, North Yorkshire and
East Riding benefit from economic growth and opportunities, and to narrow gaps between those who are most
and least disadvantaged8. That will include action to:
Support those who are unemployed to get a job, through improvement of skills and employability and
connection to opportunities;
Create more opportunities for local employment, through business growth and job creation, and
encouragement of apprenticeships and other mechanisms that help local people to access them;
Support community led development and third sector (‘civil society’) capacity to support social inclusion,
employment and wellbeing;
Ensure connections to the Health and Wellbeing boards that support economic activity and wellbeing; and
Ensure that the needs of social enterprise are covered in mainstream business support.
We have worked and consulted with Your Consortium and others in the third sector in the preparation of this
strategy and will continue and deepen working relationships as we move forward. That will for instance
7 The equality duty covers nine groups with protected characteristics: age, disability, gender reassignment, marriage and civil partnership,
pregnancy and maternity, race, religion or belief, sex and sexual orientation.
8 See for instance the report of the York Fairness Commission, 2012, for relevant principles and approaches
38
include ensuring that the sector is represented on the LEP area’s Skills and Employability Board, and
consideration of a place on the main LEP Board when its membership is reviewed.
3.4. Innovation – Social Innovation and Smart Specialisation Innovation, whether defined in strict technical terms or as the wider capacity to do things differently and
better, is vital to economic success and social progress. It is all the more important in an era of tight finances
where cost effectiveness and efficiency are paramount, and in a global market where innovation is crucial to
market share, profitability and growth. Reflecting this content, the LEP area will pursue innovation in three
main ways: social innovation, smart specialisation and wider business innovation.
Social innovation – is the process of finding and implementing new ways to tackle problems facing society or
groups within it, drawing on local communities and the third sector as well as businesses, individuals and
researchers. At this stage we are not proposing a specific social innovation project. However we will keep
opportunities to apply the concept under review, especially in relation to (ESF related) employability, inclusion,
health and wellbeing challenges, and to low carbon and climate change imperatives where community
engagement and exchange of ideas can help to develop new solutions.
Smart specialisation – is about making economic development effective through focusing it on the most
pronounced and concentrated R&D assets and sectoral strengths in our area. Our area’s stand out R&D and
sectoral strengths mirror each other and are in the area of agri-tech and biorenewables, and their wider
application within low carbon, food manufacturing and agricultural industry. It is singled out as Priority 2
within this strategy, with focus on application of sector specific innovation strengths.
Business innovation – Whilst sector focused innovation activity is a key priority, that will reach a small
proportion of our economy overall. The evidence section makes clear that there is a far wider ‘innovation
deficit’ within businesses across the region, and a second strand of innovation activity will address this without
undermining the more concentrated activity focused on agri-tech and biorenewables. This will cover the need
for innovation based on technical expertise and R&D, and more general application of new ideas and
approaches to improve products, services and business performance. This is a core activity within Priority 1 of
this strategy, linked to SME support and to connecting businesses to expertise across the UK.
3.5. Community Led Local Development Community Led Local Development (CLLD) is a specific, locally driven approach to development, often (but not
necessarily) linked to EU funding. It is defined as a sub-regional process which can “mobilise and involve local
communities to contribute to achieving the Europe 2020 Strategy goals of smart, sustainable and inclusive
growth”.
This approach has been operating across the LEP area through LEADER in rural areas, Fisheries Local Action
Groups (FLAGS) in coastal areas, and across our market towns through community led area partnerships and
town teams. In our experience CLLD can focus on and make a real difference to the economic growth of
smaller local areas.
The knowledge and lessons learned gained through these existing CLLD programmes in our LEP area (and
others) and the community led groups involved in it is valuable in informing how it can provide an effective
mechanism to stimulate growth in the future. One conclusion is that the CLLD approach has the potential to
benefit localities across the LEP area (e.g. market towns), not just the more remote and coastal areas where it
has generally been applied to date. Other lessons are that CLLD activity needs to be focused on clear local
priorities and link proposed activities to anticipated outcomes.
39
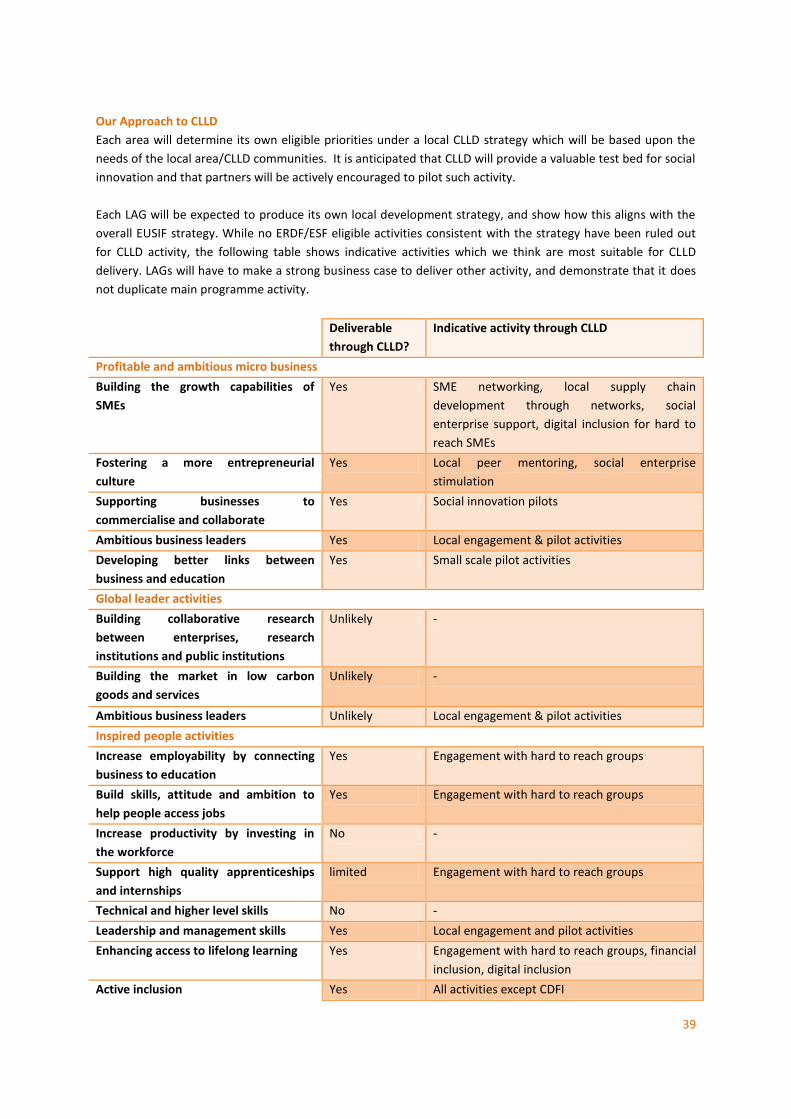
Our Approach to CLLD
Each area will determine its own eligible priorities under a local CLLD strategy which will be based upon the
needs of the local area/CLLD communities. It is anticipated that CLLD will provide a valuable test bed for social
innovation and that partners will be actively encouraged to pilot such activity.
Each LAG will be expected to produce its own local development strategy, and show how this aligns with the
overall EUSIF strategy. While no ERDF/ESF eligible activities consistent with the strategy have been ruled out
for CLLD activity, the following table shows indicative activities which we think are most suitable for CLLD
delivery. LAGs will have to make a strong business case to deliver other activity, and demonstrate that it does
not duplicate main programme activity.
Deliverable
through CLLD?
Indicative activity through CLLD
Profitable and ambitious micro business
Building the growth capabilities of
SMEs
Yes SME networking, local supply chain
development through networks, social
enterprise support, digital inclusion for hard to
reach SMEs
Fostering a more entrepreneurial
culture
Yes Local peer mentoring, social enterprise
stimulation
Supporting businesses to
commercialise and collaborate
Yes Social innovation pilots
Ambitious business leaders Yes Local engagement & pilot activities
Developing better links between
business and education
Yes Small scale pilot activities
Global leader activities
Building collaborative research
between enterprises, research
institutions and public institutions
Unlikely -
Building the market in low carbon
goods and services
Unlikely -
Ambitious business leaders Unlikely Local engagement & pilot activities
Inspired people activities
Increase employability by connecting
business to education
Yes Engagement with hard to reach groups
Build skills, attitude and ambition to
help people access jobs
Yes Engagement with hard to reach groups
Increase productivity by investing in
the workforce
No -
Support high quality apprenticeships
and internships
limited Engagement with hard to reach groups
Technical and higher level skills No -
Leadership and management skills Yes Local engagement and pilot activities
Enhancing access to lifelong learning Yes Engagement with hard to reach groups, financial
inclusion, digital inclusion
Active inclusion Yes All activities except CDFI
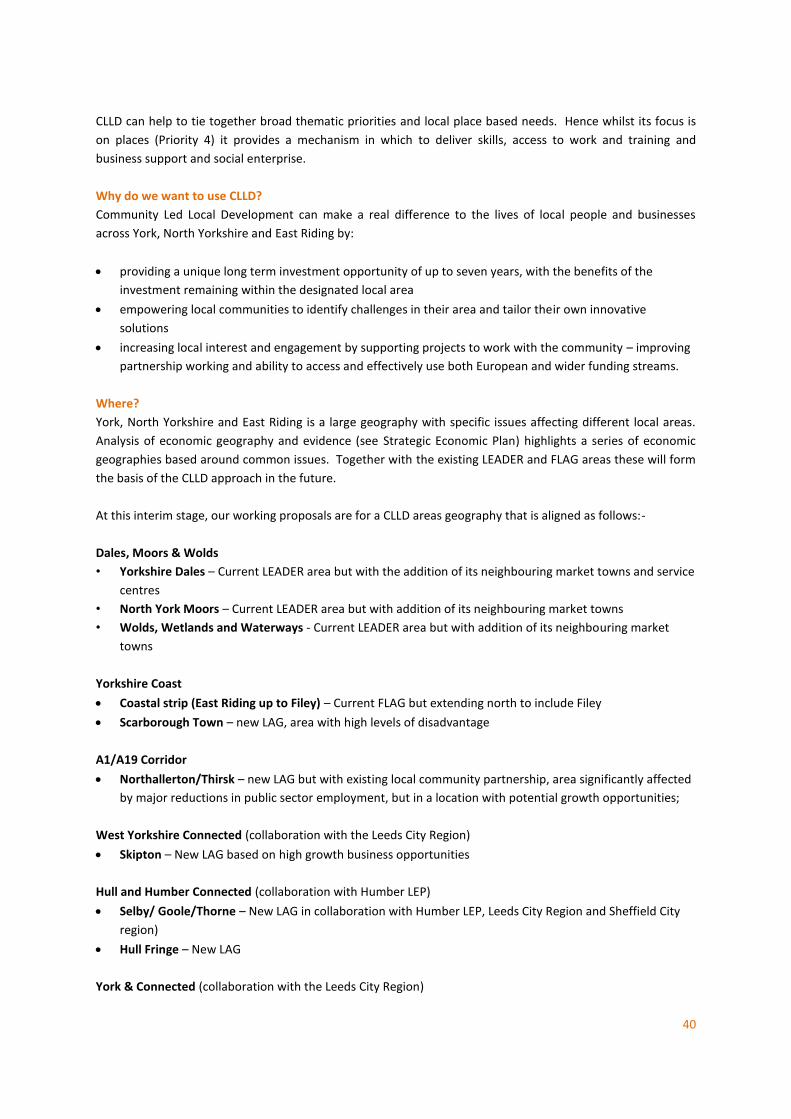
40
CLLD can help to tie together broad thematic priorities and local place based needs. Hence whilst its focus is
on places (Priority 4) it provides a mechanism in which to deliver skills, access to work and training and
business support and social enterprise.
Why do we want to use CLLD?
Community Led Local Development can make a real difference to the lives of local people and businesses
across York, North Yorkshire and East Riding by:
providing a unique long term investment opportunity of up to seven years, with the benefits of the
investment remaining within the designated local area
empowering local communities to identify challenges in their area and tailor their own innovative
solutions
increasing local interest and engagement by supporting projects to work with the community – improving
partnership working and ability to access and effectively use both European and wider funding streams.
Where?
York, North Yorkshire and East Riding is a large geography with specific issues affecting different local areas.
Analysis of economic geography and evidence (see Strategic Economic Plan) highlights a series of economic
geographies based around common issues. Together with the existing LEADER and FLAG areas these will form
the basis of the CLLD approach in the future.
At this interim stage, our working proposals are for a CLLD areas geography that is aligned as follows:-
Dales, Moors & Wolds
• Yorkshire Dales – Current LEADER area but with the addition of its neighbouring market towns and service
centres
• North York Moors – Current LEADER area but with addition of its neighbouring market towns
• Wolds, Wetlands and Waterways - Current LEADER area but with addition of its neighbouring market
towns
Yorkshire Coast
Coastal strip (East Riding up to Filey) – Current FLAG but extending north to include Filey
Scarborough Town – new LAG, area with high levels of disadvantage
A1/A19 Corridor
Northallerton/Thirsk – new LAG but with existing local community partnership, area significantly affected
by major reductions in public sector employment, but in a location with potential growth opportunities;
West Yorkshire Connected (collaboration with the Leeds City Region)
Skipton – New LAG based on high growth business opportunities
Hull and Humber Connected (collaboration with Humber LEP)
Selby/ Goole/Thorne – New LAG in collaboration with Humber LEP, Leeds City Region and Sheffield City
region)
Hull Fringe – New LAG
York & Connected (collaboration with the Leeds City Region)

41
York LAG
Delivery and collaboration
At this stage the potential Local Action Groups and areas suggested above need further refinement and
development locally. This will involve collaboration between key partners, stakeholders, including across local
boundaries and with and neighbouring LEPs. A process will be established to develop these proposals further,
with each area preparing a Local Development Strategy.
It is proposed that the maximum 5% (approx. £5m) of the YNYER ESIF allocation is attributed to CLLD
approach, with the level for each LAG area determined through the development of their Local Development
Strategies.
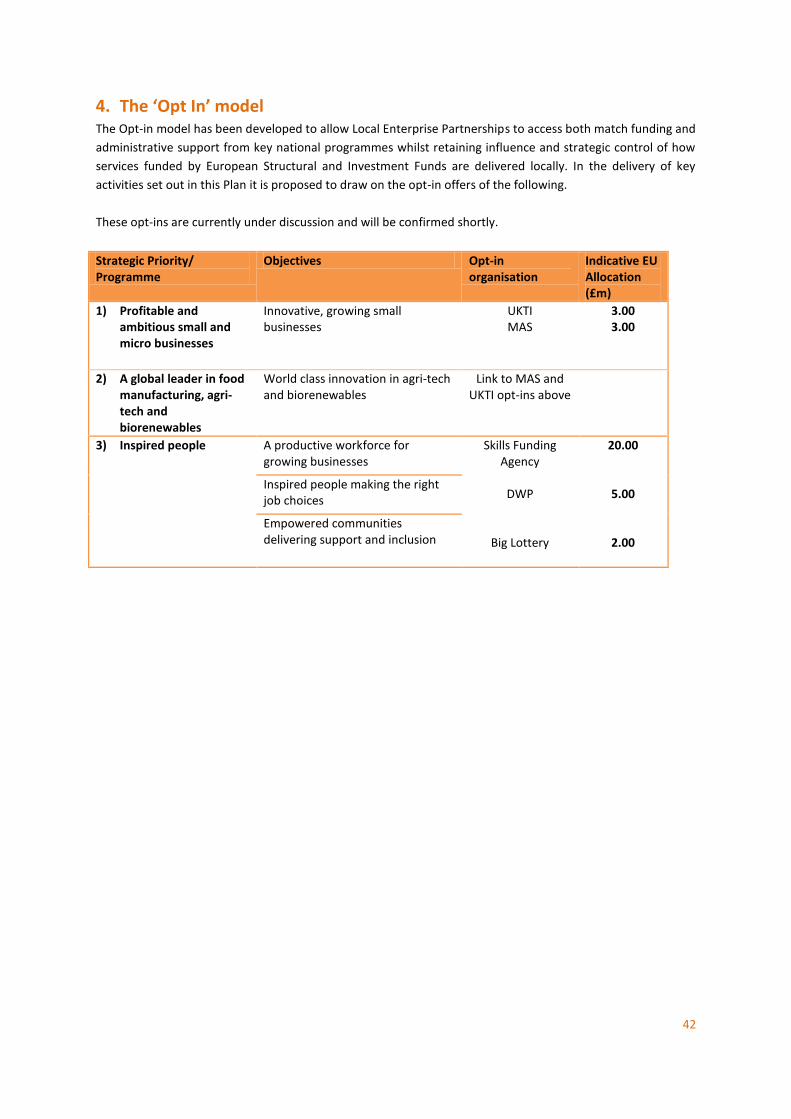
42
4. The ‘Opt In’ model The Opt-in model has been developed to allow Local Enterprise Partnerships to access both match funding and
administrative support from key national programmes whilst retaining influence and strategic control of how
services funded by European Structural and Investment Funds are delivered locally. In the delivery of key
activities set out in this Plan it is proposed to draw on the opt-in offers of the following.
These opt-ins are currently under discussion and will be confirmed shortly.
Strategic Priority/ Programme
Objectives Opt-in organisation
Indicative EU Allocation (£m)
1) Profitable and ambitious small and micro businesses
Innovative, growing small businesses
UKTI MAS
3.00 3.00
2) A global leader in food manufacturing, agri-tech and biorenewables
World class innovation in agri-tech and biorenewables
Link to MAS and UKTI opt-ins above
3) Inspired people A productive workforce for growing businesses
Skills Funding Agency
DWP
Big Lottery
20.00
5.00
2.00
Inspired people making the right job choices
Empowered communities delivering support and inclusion
43
5. Access to finance
The York, North Yorkshire and East Riding LEP and Humber LEP jointly commissioned Regeneris to look at the
potential for Financial Instruments and access to finance. The following provides the main outcomes of this
report.
5.1. Economic Prospects
The economic environment has changed substantially over the last 4-5 years within the region and across the
two LEP areas. Recession and a slow recovery have had an impact on most sectors of the economy, with SMEs
facing a tough operating environment. This has stimulated much stronger demand regionally for debt finance
as the traditional lenders have reduced their lending activities and dampened demand for all types of equity
investment as plans for start-up, expansion, restructuring or changes in ownership have been put on hold.
Anecdotal evidence suggests that demand for debt finance has certainly been stronger locally across the two
LEP areas, whilst the picture for equity finance is not yet clear.
There are signs of economic recovery, although this remains patchy and sluggish across the region and
amongst some sectors. Our research suggests that this is slowly feeding through into stronger business
confidence and, anecdotally, a stronger demand for start-up and expansion finance for early stage and
expansion activities but this uplift remains volatile. Our consultant’s recent consultations with fund managers
and intermediaries in the region (as part of another assignment) suggest a slow but steady improvement in
economic conditions and strengthening in demand for finance.
Whilst it is not possible to be precise at this stage about how this is playing out within the region, our
expectation is that this strengthening of demand has to date been stronger in the region’s larger urban areas.
5.2. Business Base and the Demand for Finance
The two LEPs account for a substantial part of the regional economy and its business base – between half and
two fifths of the business count. Whilst the picture is complicated, the analysis highlights a number of
important observations:
The business base in the YNYER LEP area has a slightly larger proportion of micro and small businesses
than the regional average given its rural character, whilst that in Humber is similar to the regional picture.
SMEs are a very important source of wealth creation, employment and growth in both areas.
The business base as a whole is less dynamic than for the region and UK as a whole in terms of start-ups
and subsequent growth, in large part reflecting the economic geography of the area (absence of very large
economic centres) and sectoral mix (over reliance on declining sectors and underrepresentation of faster
growing private sectors).
However, there are notable exceptions to this including a number of enterprise hot-spots. This includes
areas of North Yorkshire which have strong travel to work and trading relationships with larger
neighbouring urban areas (e.g. Harrogate and Richmond), as well as York itself.
Future business growth across the two LEP areas is likely to be broadly based as the economy emerges out
of recession, but with growth focused on professional services, retail and distribution. There are a number
of other sectors which provide good longer term opportunities for future growth, including renewable
energy (and the supply chain), chemicals, health technologies and logistics, culture and tourism.
Whilst the available evidence on the importance of the commercialisation of R&D as an economic driver is
only partial at this stage, the evidence suggests that the focus of some activity around the University of

44
York in particular and to a lesser extent the University of Hull. This will generate some demand for proof of
concept and seed funding.
A number of important sectors in the rural parts of the YNYER LEP area (e.g. farming and other land based
sector, agri-processing, tourism) continue to face challenges, especially around issues of business survival
and diversification.
5.3. Availability and Take-up of SME Finance
Much of the available data on the provision of finance to SMEs is only available at a national or regional level.
Although there is the need to be cautious, the available evidence suggests that:
SMEs in the region are less likely to seek term loan finance and also less likely to secure this finance where
they do seek it than for the UK as a whole (although they are more successful in securing with overdrafts)
The overall level of equity finance provided to SMEs is slightly less than the North West and North East
economies, allowing for variations in the size of their economies, and there is anecdotal evidence of a
greater reluctance on the part of SME owner managers to give up equity in return for new investment
There is less provision of early stage venture capital linked to the commercialisation of R&D and high tech
sectors, due mainly to a lack of major high sectors and commercialisation activity.
These observations are in practice due to a combination of demand and supply considerations, including the
role which the public sector plays (currently and historically) in the provision of SME finance. The Stage Two
report will examine the need for and supply of finance from SMEs in the two LEP areas in more detail,
including a more rigorous examination of the nature and strength of market failures.
The financial crisis and recession has, we believe, strengthened the market failure arguments for public sector
intervention in SME finance both generally across the region and within the two LEP areas. Irrespective of the
complex changes which have occurred over the past 3-4 years in demand for different types of finance at
different stage of SME development, the private sector is far less active in these market areas now. These
changes have manifested themselves in strong demand for the debt finance in particular provided by Finance
Yorkshire and local projects, whilst demand for expansion equity has been patchy.
An analysis of the take-up of SME finance from Finance Yorkshire within Humber and North Yorkshire areas
provides an important source of evidence of potential future demand. The highest investment rate (per VAT
registered business) is in Richmondshire, Harrogate and York (all above the regional average). This is in starkest
contrast to the level of investment in a number of the LEP local authorities, with minimal investments in
Ryedale, Scarborough, Hambleton, and North and North East Lincolnshire. Whilst this disparity is partly
explained by the differences in the mix and dynamism of the local economies and their businesses bases (and
their labour market and supply chain linkages to the major urban areas of West Yorkshire), it may also be due
in part to the fairly centralised delivery approach of Finance Yorkshire. This will be analysed in more detail in
Stage two.
On balance, the available evidence suggests that there is a strong need for finance amongst SMEs that is
unmet due to market failure, covering all stages of business development and most types of finance. Finance
Yorkshire and other local projects are going someway to addressing this currently, but they are failing to
secure sufficient penetration in some areas and steps need to be taken to ensure suitable provision post-2014
Whilst we would not expect these needs and the associated market failures in the two LEP areas to be
fundamentally different to those in the region as a whole, there are some differences:
A proportionately higher demand for micro-finance from both start-up and micro-businesses in both LEP
areas due to the structure of the business base (including to some extent social and community
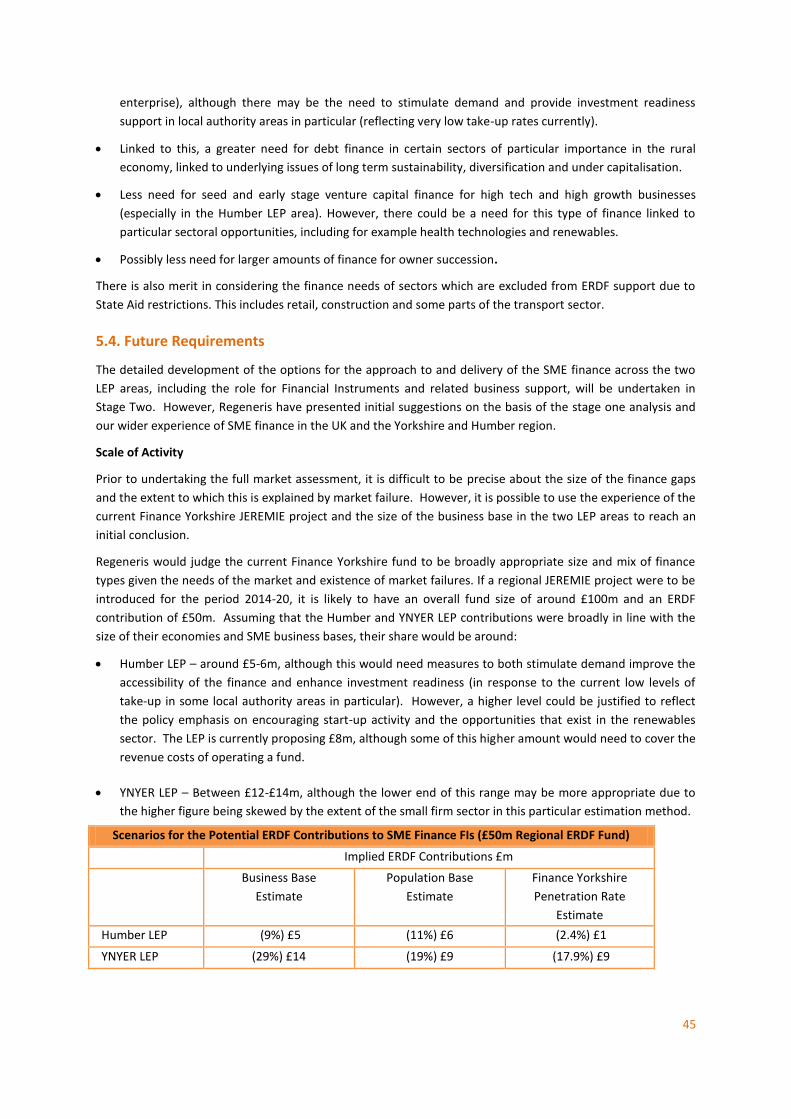
45
enterprise), although there may be the need to stimulate demand and provide investment readiness
support in local authority areas in particular (reflecting very low take-up rates currently).
Linked to this, a greater need for debt finance in certain sectors of particular importance in the rural
economy, linked to underlying issues of long term sustainability, diversification and under capitalisation.
Less need for seed and early stage venture capital finance for high tech and high growth businesses
(especially in the Humber LEP area). However, there could be a need for this type of finance linked to
particular sectoral opportunities, including for example health technologies and renewables.
Possibly less need for larger amounts of finance for owner succession.
There is also merit in considering the finance needs of sectors which are excluded from ERDF support due to
State Aid restrictions. This includes retail, construction and some parts of the transport sector.
5.4. Future Requirements
The detailed development of the options for the approach to and delivery of the SME finance across the two
LEP areas, including the role for Financial Instruments and related business support, will be undertaken in
Stage Two. However, Regeneris have presented initial suggestions on the basis of the stage one analysis and
our wider experience of SME finance in the UK and the Yorkshire and Humber region.
Scale of Activity
Prior to undertaking the full market assessment, it is difficult to be precise about the size of the finance gaps
and the extent to which this is explained by market failure. However, it is possible to use the experience of the
current Finance Yorkshire JEREMIE project and the size of the business base in the two LEP areas to reach an
initial conclusion.
Regeneris would judge the current Finance Yorkshire fund to be broadly appropriate size and mix of finance
types given the needs of the market and existence of market failures. If a regional JEREMIE project were to be
introduced for the period 2014-20, it is likely to have an overall fund size of around £100m and an ERDF
contribution of £50m. Assuming that the Humber and YNYER LEP contributions were broadly in line with the
size of their economies and SME business bases, their share would be around:
Humber LEP – around £5-6m, although this would need measures to both stimulate demand improve the
accessibility of the finance and enhance investment readiness (in response to the current low levels of
take-up in some local authority areas in particular). However, a higher level could be justified to reflect
the policy emphasis on encouraging start-up activity and the opportunities that exist in the renewables
sector. The LEP is currently proposing £8m, although some of this higher amount would need to cover the
revenue costs of operating a fund.
YNYER LEP – Between £12-£14m, although the lower end of this range may be more appropriate due to
the higher figure being skewed by the extent of the small firm sector in this particular estimation method.
Scenarios for the Potential ERDF Contributions to SME Finance FIs (£50m Regional ERDF Fund)
Implied ERDF Contributions £m
Business Base
Estimate
Population Base
Estimate
Finance Yorkshire
Penetration Rate
Estimate
Humber LEP (9%) £5 (11%) £6 (2.4%) £1
YNYER LEP (29%) £14 (19%) £9 (17.9%) £9

46
Mix of Finance and Needs of Different Types of SMEs
On balance our experts would suggest that the type of finance is split in the following way. The thrust of the
approach is provision of sizeable sums of finance into term debt finance and expansion equity (circa 70%).
Allocating this proportion of funding to these types of finance will be important in terms of addressing the
main area of demand, the underpinning funding mechanism (in particular the scale of term debt and the
stream of prepayments this generates) and the scope to generate legacy returns (in particular the level of
equity finance).
The proposed allocation to start-up and micro-finance reflects the high volume, lower value and high risk focus
of the activity. In the case of seed or early stage venture capital, whilst demand as a whole is likely to be less,
the average finance required will be relatively high and the risks significant.
Indicative Focus of SME Finance Provision for Humber and YNYER LEPs
Finance SME Focus Indicative Finance Offer Indicative
Proportion
of Finance
Micro Finance Finance for start-ups
and micro-business
Grant based finance for
start-ups and up to £20k
for micro-businesses
15%
Loan Finance Focus on traditional
term finance for SMEs
Repayable loans between
£20k and £200k
40%
Seed Finance Proof of concept and
early stage finance with
a focus on high tech
SMEs with the prospects
for fast growth
Equity and mezzanine
finance (possibility of
grant for POC activity)
15%
Expansion
Finance
Focus on larger
expanding SMEs
Mix of equity and
mezzanine financing
30%
There is also the need to consider the possible delivery of finance for social and community enterprises
through a CDFI approach.
5.5. Delivery Approaches
The initial suggestion for the approach to delivery is set our below:
Indicative Delivery Approaches
Finance Approach Advantages Disadvantages
Micro
Finance
Whilst there could be
a case for delivering
start-up and micro-
finance through a
regional JEREMIE
approach, there could
be greater merit in a
more localised delivery
approach
A localised approach
would ensure a more
tailored and targeted
approach
Higher local penetration
of finance where
required.
Potential for higher
delivery costs
through lack of
economies of scale;
Less scope to
secure the required
management and
delivery expertise

47
Regional
JEREMIE
Fund
Commissioning
provision through a
regional JEREMIE Fund
of Funds. Focus on
loan, early stage
venture capital and
expansion finance
Scale and critical mass
and shared delivery
costs
Scope to secure
necessary development
and financial expertise;
Integrated approach to
delivery of a range of
finance types; sharing of
substantial development
costs;
Tried and tested
approach and delivery
expertise available within
the region.
Loss of targeted
localised approach;
Loss of control and
ownership.
Whilst some partners may be tempted to adopt a sector based approach to an FI (for example, targeted at the
film or renewables sector), our experts’ advice is to target particular sectors within a fund of funds approach
rather than through the establishment of separate funds. Whilst fund managers will need to ensure
appropriate sector expertise in-house, it minimises the risk of very costly delivery from setting up and running
small sector specific funds.

48
6. Resources and Funding Allocations
6.1. Overview - influence and resources Making the impact we seek requires a mixture of investment and influence. Both can be mechanisms for
getting new or different things delivered, and it is important to make the most of both routes.
The influencing role of the strategy, the LEP board and senior partners is pivotal. Making the case for our area
to national decision makers, showing what we can deliver, and changing how things are done nationally and
how far they are delegated locally can have a real impact.
Where influence or new approaches are not enough on their own to effect the progress we seek, we will use
the whole array of available resources to do so. Those include existing public and private resources, new
private sector investments, and Government funds such as Regional Growth Fund and Growing Places.
The sections that follow set out our proposals for allocating EU Strategic Investment Funds (and not other
sources of funding). They match up the EU requirements and core themes for funding with the priorities and
activities in this Plan.
The table below sets out funding allocations at a strategic level for EU Strategic and Investment funds. It is
based on five ‘strategic priorities’, which correspond to the five Priorities in the strategy. Allocations are
further split between the relevant Objectives within this strategy. A detailed and separate spreadsheet
provides further detail on the spend profile allocations, including market failure based rationales, outputs and
sources of match funding.
6.2. Technical Assistance Based on guidance, our understanding is that Government will make an allocation of Technical Assistance for
ERDF and ESF available to LEPs to support the preparation and administration of the European Growth
Programme, and that this will be additional to the funding allocated to priorities in the following Table.
Allocations in the table are made on that assumption hence specific technical assistance figures are not
included.
Technical assistance will also be used to fulfil a secretariat role and to retain a strategic overview of the EU
Programmes, reporting to the LEP Board. It will also support delivery, intelligence and monitoring.
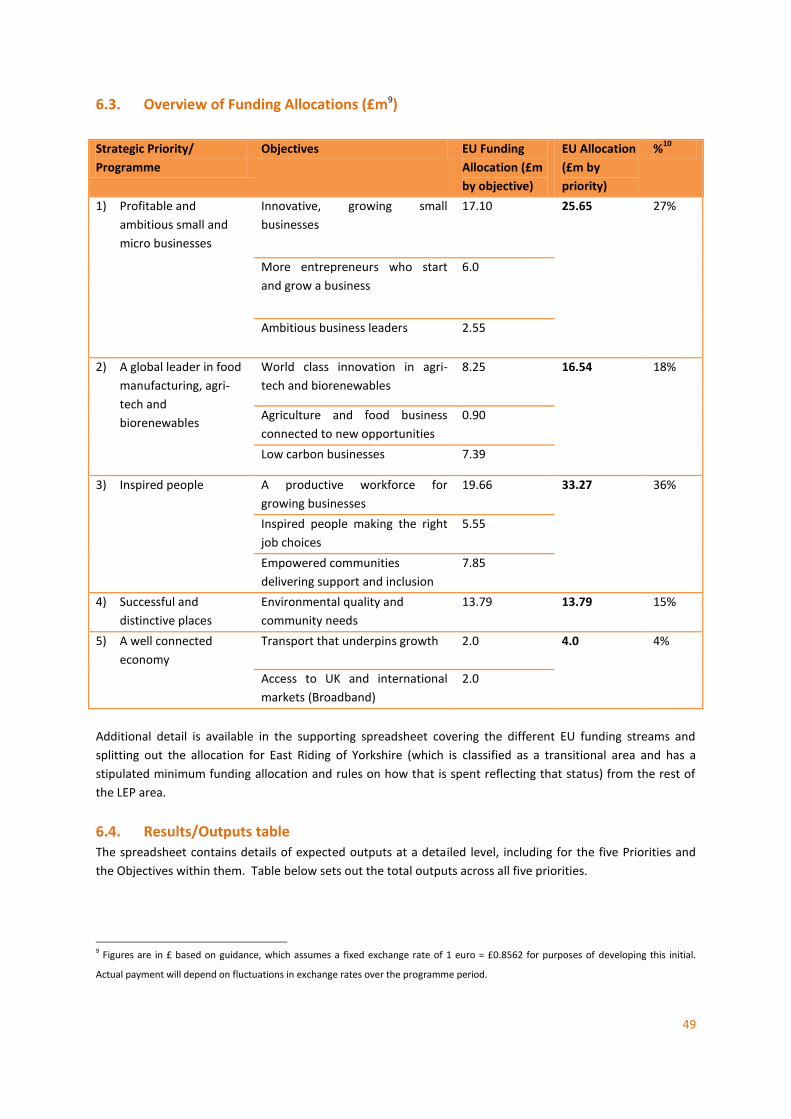
49
6.3. Overview of Funding Allocations (£m9)
Strategic Priority/
Programme
Objectives EU Funding
Allocation (£m
by objective)
EU Allocation
(£m by
priority)
%10
1) Profitable and
ambitious small and
micro businesses
Innovative, growing small
businesses
17.10 25.65 27%
More entrepreneurs who start
and grow a business
6.0
Ambitious business leaders 2.55
2) A global leader in food
manufacturing, agri-
tech and
biorenewables
World class innovation in agri-
tech and biorenewables
8.25 16.54 18%
Agriculture and food business
connected to new opportunities
0.90
Low carbon businesses 7.39
3) Inspired people A productive workforce for
growing businesses
19.66 33.27 36%
Inspired people making the right
job choices
5.55
Empowered communities
delivering support and inclusion
7.85
4) Successful and
distinctive places
Environmental quality and
community needs
13.79 13.79 15%
5) A well connected
economy
Transport that underpins growth 2.0 4.0 4%
Access to UK and international
markets (Broadband)
2.0
Additional detail is available in the supporting spreadsheet covering the different EU funding streams and
splitting out the allocation for East Riding of Yorkshire (which is classified as a transitional area and has a
stipulated minimum funding allocation and rules on how that is spent reflecting that status) from the rest of
the LEP area.
6.4. Results/Outputs table The spreadsheet contains details of expected outputs at a detailed level, including for the five Priorities and
the Objectives within them. Table below sets out the total outputs across all five priorities.
9 Figures are in £ based on guidance, which assumes a fixed exchange rate of 1 euro = £0.8562 for purposes of developing this initial.
Actual payment will depend on fluctuations in exchange rates over the programme period.
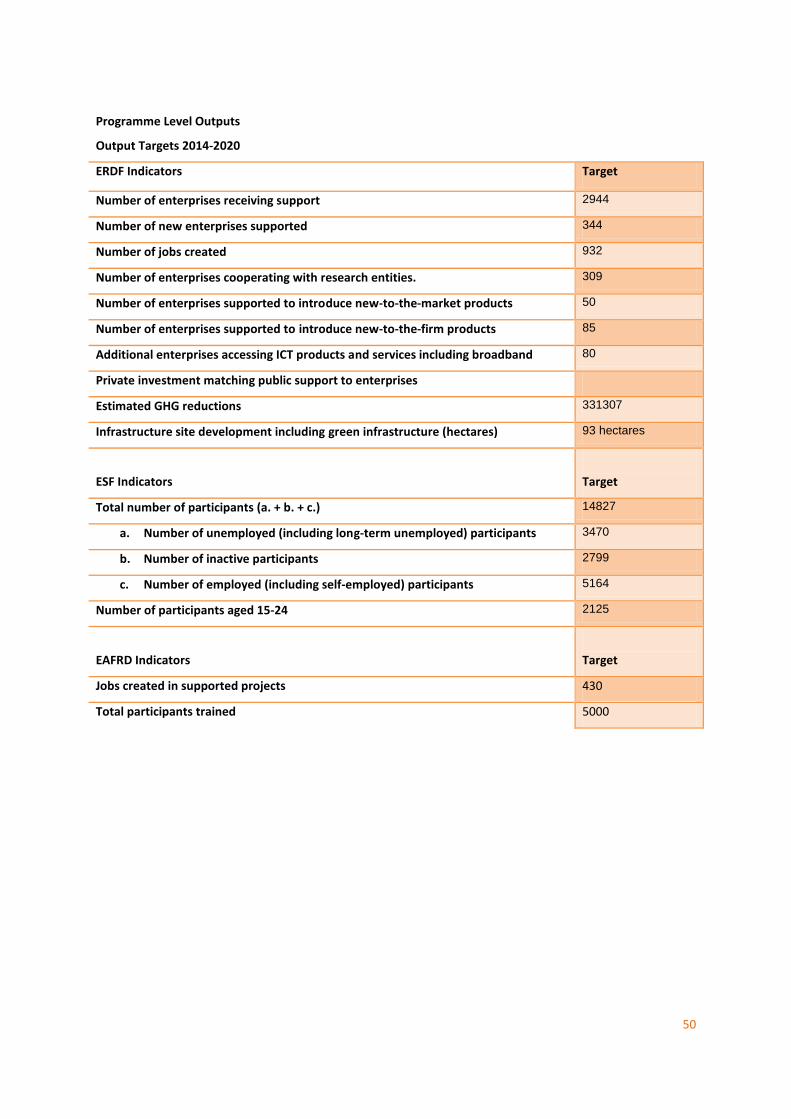
50
Programme Level Outputs
Output Targets 2014-2020
ERDF Indicators Target
Number of enterprises receiving support 2944
Number of new enterprises supported 344
Number of jobs created 932
Number of enterprises cooperating with research entities. 309
Number of enterprises supported to introduce new-to-the-market products 50
Number of enterprises supported to introduce new-to-the-firm products 85
Additional enterprises accessing ICT products and services including broadband 80
Private investment matching public support to enterprises
Estimated GHG reductions 331307
Infrastructure site development including green infrastructure (hectares) 93 hectares
ESF Indicators
Target
Total number of participants (a. + b. + c.) 14827
a. Number of unemployed (including long-term unemployed) participants 3470
b. Number of inactive participants 2799
c. Number of employed (including self-employed) participants 5164
Number of participants aged 15-24 2125
EAFRD Indicators
Target
Jobs created in supported projects 430
Total participants trained 5000

51
7. Governance & delivery (EUSIF specific)
This section sets out overall governance principles and particular details required for managing European
funding programmes. Further details on governance, business planning, prioritisation and appraisal
mechanisms are covered in the supporting Local Growth Deal Implementation Plan.
7.1. Partnership principles The York, North Yorkshire and East Riding LEP Board brings together businesses, universities and local
authorities and will take overall responsibility for the strategy and driving progress. Delivery will be through
collaboration:
Where businesses already have plans to grow we will let them get on with the job. We will only become
involved where we can help to remove barriers to delivery or to enhance the scale and pace of progress.
Where local partners have established shared goals and delivery mechanisms we will use these as a
foundation. We will concentrate on using our influence to ensure that priorities maximise economic
benefits and to secure resources for their implementation.
Where there are existing resources or organisations outside the LEP area that we can make good use of,
we will do so. That will involve collaborating with delivery organisations and neighbouring LEP areas
where they can cost effectively deliver for or with us.
The LEP will ensure the right skill sets exist and work with the most appropriate organisations to deliver
priorities.
Our preference is for using existing bodies to manage funds and day to day delivery where appropriate. The
role of the LEP and its governance structures will be to set the vision and outcomes which will guide allocation
of resources at a project level, and to ensure results meet expectations. The LEP Board will approve
investment funds at a strategic programme level and these programmes will then be managed through
Programme Board structures.
Several organisations who are delivering national programmes have offered a series of ‘Opt-Ins’. These allow
the LEP to benefit from the expertise and capacity of national providers whilst also providing match funding
required by EU funds. The LEP proposes to take advantage of the following opt-ins:
UK Trade & Investment
Manufacturing Advisory Service
Skills Funding Agency
Big Lottery
DWP
7.2. Governance The Strategic Economic Plan is owned and will be delivered by the region as a whole. The development of the
strategy involved a series of Task and Finish Groups of key regional players, with representatives from the
public, private and voluntary and community sectors, the higher education sector, skills and Local Strategic
Partnerships all of whom consulted widely within their constituent communities in order to develop a
consensus around priorities for action.
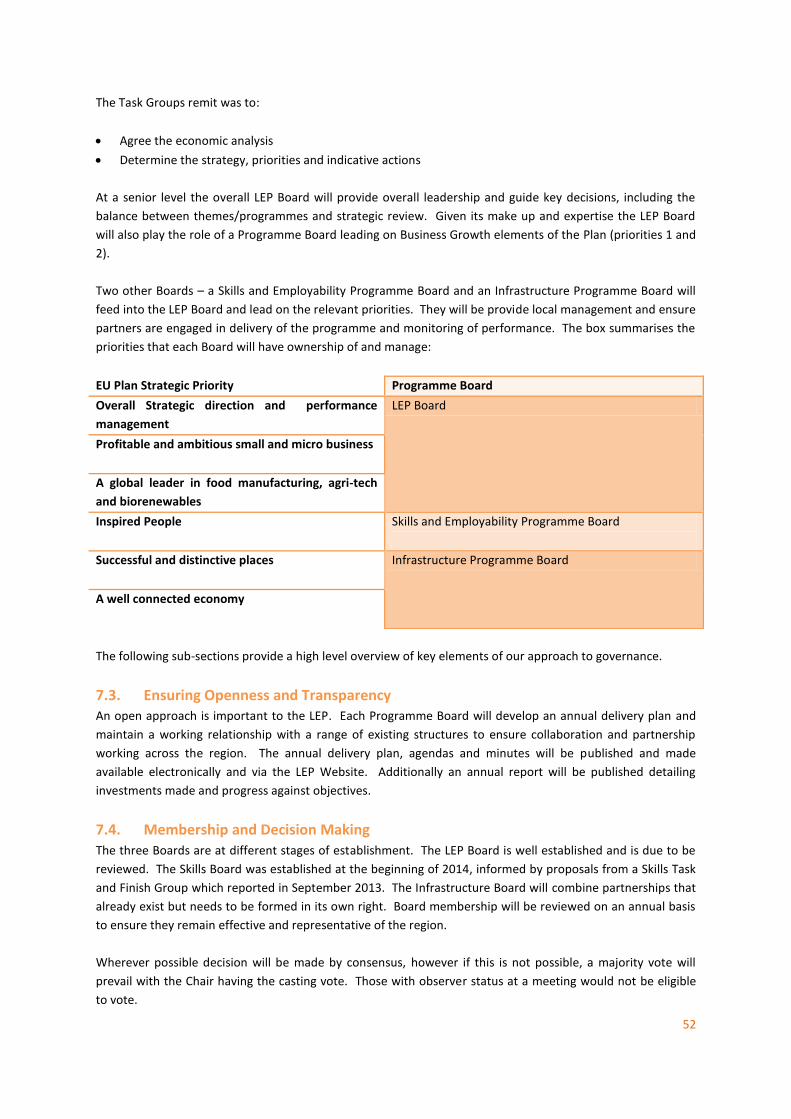
52
The Task Groups remit was to:
Agree the economic analysis
Determine the strategy, priorities and indicative actions
At a senior level the overall LEP Board will provide overall leadership and guide key decisions, including the
balance between themes/programmes and strategic review. Given its make up and expertise the LEP Board
will also play the role of a Programme Board leading on Business Growth elements of the Plan (priorities 1 and
2).
Two other Boards – a Skills and Employability Programme Board and an Infrastructure Programme Board will
feed into the LEP Board and lead on the relevant priorities. They will be provide local management and ensure
partners are engaged in delivery of the programme and monitoring of performance. The box summarises the
priorities that each Board will have ownership of and manage:
EU Plan Strategic Priority Programme Board
Overall Strategic direction and performance
management
LEP Board
Profitable and ambitious small and micro business
A global leader in food manufacturing, agri-tech
and biorenewables
Inspired People Skills and Employability Programme Board
Successful and distinctive places
Infrastructure Programme Board
A well connected economy
The following sub-sections provide a high level overview of key elements of our approach to governance.
7.3. Ensuring Openness and Transparency An open approach is important to the LEP. Each Programme Board will develop an annual delivery plan and
maintain a working relationship with a range of existing structures to ensure collaboration and partnership
working across the region. The annual delivery plan, agendas and minutes will be published and made
available electronically and via the LEP Website. Additionally an annual report will be published detailing
investments made and progress against objectives.
7.4. Membership and Decision Making The three Boards are at different stages of establishment. The LEP Board is well established and is due to be
reviewed. The Skills Board was established at the beginning of 2014, informed by proposals from a Skills Task
and Finish Group which reported in September 2013. The Infrastructure Board will combine partnerships that
already exist but needs to be formed in its own right. Board membership will be reviewed on an annual basis
to ensure they remain effective and representative of the region.
Wherever possible decision will be made by consensus, however if this is not possible, a majority vote will
prevail with the Chair having the casting vote. Those with observer status at a meeting would not be eligible
to vote.

53
7.5. Managing Conflict of Interest All members of the LEP Thematic-boards will be required to submit details of all entities in which they have an
interest and to publicly declare any vested interest or conflict of interest in any discussion or project which will
be discussed within LEP Business. Where appropriate, members will be asked to leave the room whilst
discussions and decisions are made.
7.6. Project Approval and Procurement Processes This EU Structural Investment Funds Investment Framework integrates a range of EU funds. These are:
• European Regional Development Fund (ERDF)
• European Social Fund (ESF)
• European Agricultural Fund for Rural Development (EAFRD) and
• European Fisheries Fund (EFF)
Wherever possible we will use an integrated approach, bringing different strands of funding together to
achieve greatest impact and value for money. We will develop and agree clear appraisal mechanisms for
strategic assessment of proposals seeking to use Single Local Growth Fund and/or European funds. These will
be objective and robust, but also as simple and streamlined as possible and proportionate to the sum of
money involved.
Role of the LEP
Our role will be to advise on and endorse proposals; projects will then be submitted to the National Managing
Authority, who will ensure eligibility and make final funding decisions. We will retain a close working
relationship with the Managing Authority to ensure applications are eligible and of a high quality.
Delivery of EU funded projects will be a five stage process:
LEP role Stage 1 LEP Publish the annual delivery plan and commission activity
Stage 2 Local Appraisal
Managing
Authority role
Stage 3 National Appraisal
Stage 4 Contracting
LEP role Stage 5 Monitoring & evaluation
Publication of opportunities The investment framework will be published along with an annual business plan detailing priority actions and
investments. Access to this information will be via a range of online and offline mechanisms and detailed in
the LEP communications plan.
Local Selection criteria All investments will need to demonstrate they are responding to local need, contribute to the strategic
priorities of the LEP and cross cutting themes, and deliver value for money. The procedure for selecting
operations may take a variety of forms. For example:
Open bidding: where an open invitation is published for applications for the support of LEP priorities; or

54
Limited bidding: where a limited number of project sponsors are identified and invited to bid for the support
of operations or sets of targets or outputs that meet a specified priority; or
Non-competitive selection: where a single project sponsor (or perhaps two or more) is either selected as
appearing to be the only suitable and capable vehicle for delivering the desired outcomes or outputs and they
are invited to submit an application for financial assistance.
The LEP will ensure that all processes and criteria take full account of the need to secure compliance with the
requirements of the Public Procurement Regulations (which implement EC Public Procurement Directives) or
the need for suitable competitive tendering where the Regulations do not apply. Principles and selection
criteria will include those based on:
Strategic fit
Market Failure
Additionally
Outcomes & Outputs
Value for Money
Contribution to Cross Cutting Themes
Evidence of Private sector involvement
Evidence of Match funding
Environmental Standards
Submitting to the Managing Authority Once approved by the LEP Programme Board, Technical Assistance will support applicants to develop a full
application for submission to the Managing Authority. The final decision on approval rests with the Managing
Authority and the contract for delivery will be between the Managing Authority and the Applicant.
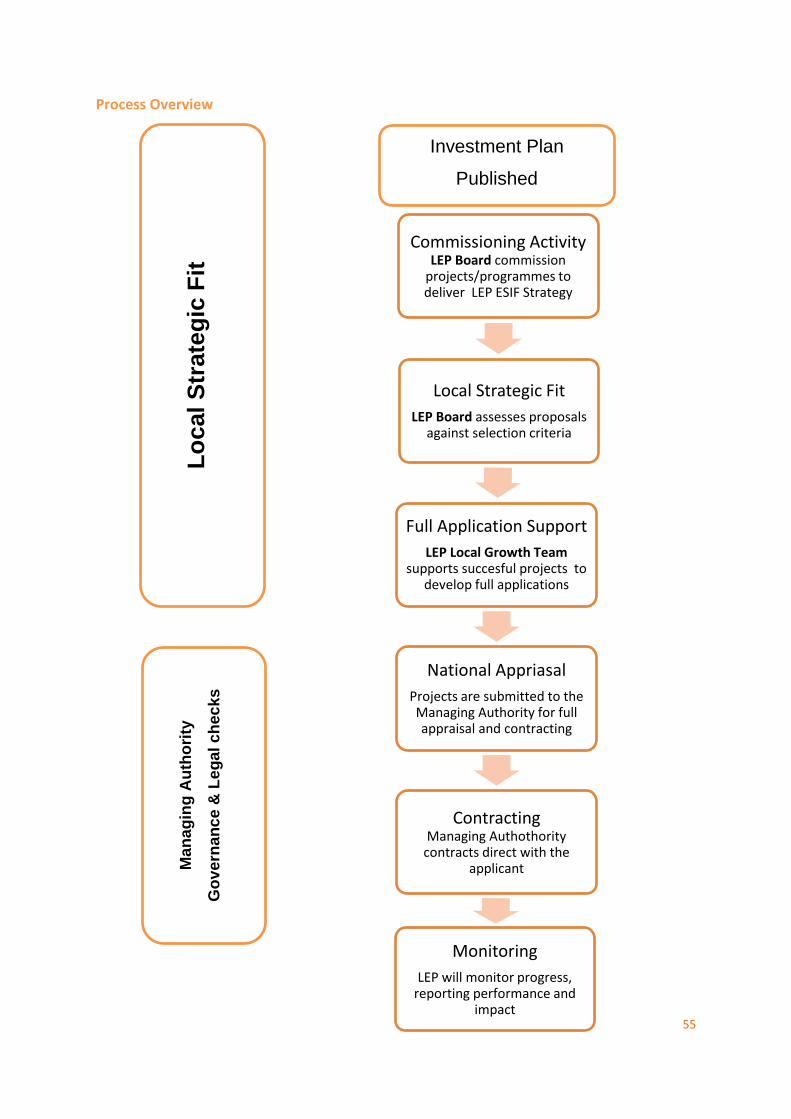
55
Process Overview
Lo
cal
Str
ate
gic
Fit
M
an
ag
ing
Au
tho
rity
Go
ve
rna
nc
e &
Le
ga
l c
hec
ks
Commissioning Activity LEP Board commission
projects/programmes to deliver LEP ESIF Strategy
Local Strategic Fit
LEP Board assesses proposals against selection criteria
Full Application Support
LEP Local Growth Team supports succesful projects to
develop full applications
National Appriasal
Projects are submitted to the Managing Authority for full appraisal and contracting
Contracting Managing Authothority
contracts direct with the applicant
Monitoring
LEP will monitor progress, reporting performance and
impact
Investment Plan
Published
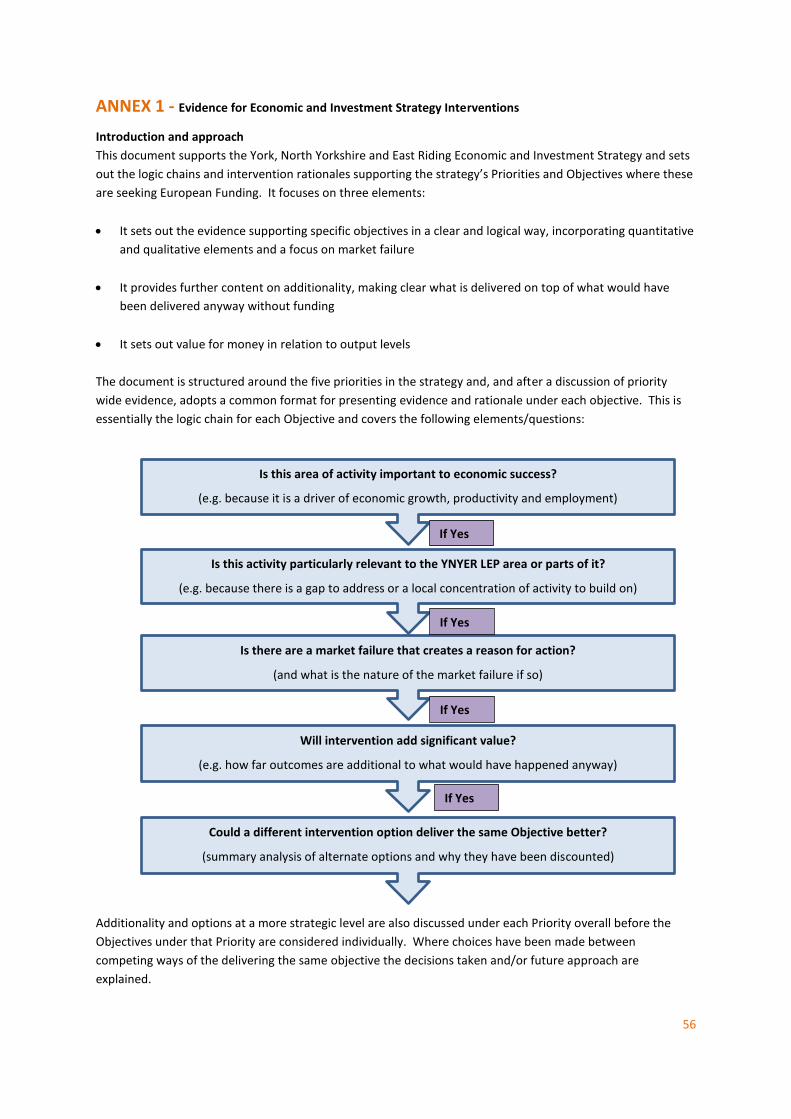
56
ANNEX 1 - Evidence for Economic and Investment Strategy Interventions
Introduction and approach
This document supports the York, North Yorkshire and East Riding Economic and Investment Strategy and sets
out the logic chains and intervention rationales supporting the strategy’s Priorities and Objectives where these
are seeking European Funding. It focuses on three elements:
It sets out the evidence supporting specific objectives in a clear and logical way, incorporating quantitative
and qualitative elements and a focus on market failure
It provides further content on additionality, making clear what is delivered on top of what would have
been delivered anyway without funding
It sets out value for money in relation to output levels
The document is structured around the five priorities in the strategy and, and after a discussion of priority
wide evidence, adopts a common format for presenting evidence and rationale under each objective. This is
essentially the logic chain for each Objective and covers the following elements/questions:
Additionality and options at a more strategic level are also discussed under each Priority overall before the
Objectives under that Priority are considered individually. Where choices have been made between
competing ways of the delivering the same objective the decisions taken and/or future approach are
explained.
Is this area of activity important to economic success?
(e.g. because it is a driver of economic growth, productivity and employment)
Is this activity particularly relevant to the YNYER LEP area or parts of it?
(e.g. because there is a gap to address or a local concentration of activity to build on)
Will intervention add significant value?
(e.g. how far outcomes are additional to what would have happened anyway)
Is there are a market failure that creates a reason for action?
(and what is the nature of the market failure if so)
If Yes
If Yes
If Yes
If Yes
Could a different intervention option deliver the same Objective better?
(summary analysis of alternate options and why they have been discounted)

57
The evidence to interventions analysis presented makes use of a variety of sources. These include qualitative
and quantitative information on LEP area performance, issues and opportunities, and independent national
evidence (often from BIS) around additionality and value for money benchmarks.
Table 1 indicates the Objectives that are covered under each priority and the core activities included under
each. It excludes those where no European funding is sought.
Table 1: Overview of Priorities and Objectives covered in this analysis
Priority Objectives
1) Profitable and ambitious small and micro businesses
Innovative, growing small businesses
More entrepreneurs who start and grow a business
Ambitious business leaders
2) A global leader in food manufacturing, agri-tech and biorenewables
World class innovation in agri-tech and biorenewables
Agriculture and food business connected to new opportunities
Low carbon businesses
3) Inspired People A productive workforce for growing businesses
Inspired people making the right job choices
Empowered communities delivering support and inclusion
4) Successful and distinctive places Environmental quality and community needs
5) A well connected economy Transport that underpins growth
Priority 1: Profitable and ambitious small and micro businesses
Priority Level Evidence and Intervention Logic
This priority is focused on creating conditions which enable businesses with an ambition to grow to do so, and
boosting innovation levels by connecting businesses to the best expertise. It will support the growth and
profitability of existing businesses and the formation of new firms, including through action to enhance
management and leadership skills that are critical to business success.
At a strategic level, the evidence and rationale for making this area a Priority is based on the following facts:
Our business base is disproportionately dominated by small and micro businesses (we have 20% fewer
medium and 50% fewer large companies than the UK average). Therefore we need to build on this base
of small businesses and help firms to grow in number and size.
Productivity is below national average and falling. Improving SME competitiveness will be central to a
turnaround, and evidence makes clear that skills and innovation are key drivers of productivity and
central to long term improvement.
Businesses taking external advice are twice as likely to grow as those that do not. However, many
businesses do not make use of such support, so a key task is to encourage businesses to better utilise
external business support and advice, including on exports and market development.
Business start-up rates are 20% below national average; which on top of smaller than average businesses,
makes high total output growth harder to achieve. We need more new firms to start up to correct this
structural imbalance in our economy and enable our economy to achieve its full potential.
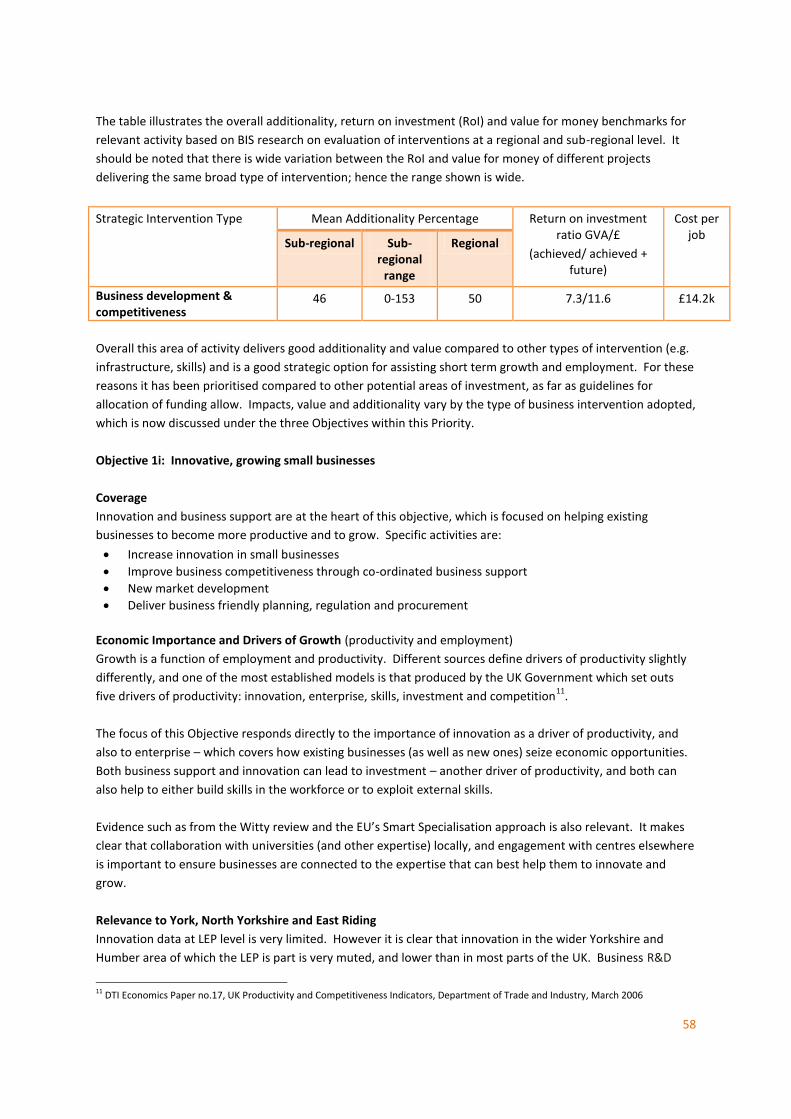
58
The table illustrates the overall additionality, return on investment (RoI) and value for money benchmarks for
relevant activity based on BIS research on evaluation of interventions at a regional and sub-regional level. It
should be noted that there is wide variation between the RoI and value for money of different projects
delivering the same broad type of intervention; hence the range shown is wide.
Strategic Intervention Type Mean Additionality Percentage Return on investment ratio GVA/£
(achieved/ achieved + future)
Cost per job
Sub-regional Sub-regional
range
Regional
Business development & competitiveness
46 0-153 50 7.3/11.6 £14.2k
Overall this area of activity delivers good additionality and value compared to other types of intervention (e.g.
infrastructure, skills) and is a good strategic option for assisting short term growth and employment. For these
reasons it has been prioritised compared to other potential areas of investment, as far as guidelines for
allocation of funding allow. Impacts, value and additionality vary by the type of business intervention adopted,
which is now discussed under the three Objectives within this Priority.
Objective 1i: Innovative, growing small businesses
Coverage
Innovation and business support are at the heart of this objective, which is focused on helping existing
businesses to become more productive and to grow. Specific activities are:
Increase innovation in small businesses
Improve business competitiveness through co-ordinated business support
New market development
Deliver business friendly planning, regulation and procurement
Economic Importance and Drivers of Growth (productivity and employment)
Growth is a function of employment and productivity. Different sources define drivers of productivity slightly
differently, and one of the most established models is that produced by the UK Government which set outs
five drivers of productivity: innovation, enterprise, skills, investment and competition11
.
The focus of this Objective responds directly to the importance of innovation as a driver of productivity, and
also to enterprise – which covers how existing businesses (as well as new ones) seize economic opportunities.
Both business support and innovation can lead to investment – another driver of productivity, and both can
also help to either build skills in the workforce or to exploit external skills.
Evidence such as from the Witty review and the EU’s Smart Specialisation approach is also relevant. It makes
clear that collaboration with universities (and other expertise) locally, and engagement with centres elsewhere
is important to ensure businesses are connected to the expertise that can best help them to innovate and
grow.
Relevance to York, North Yorkshire and East Riding
Innovation data at LEP level is very limited. However it is clear that innovation in the wider Yorkshire and
Humber area of which the LEP is part is very muted, and lower than in most parts of the UK. Business R&D
11 DTI Economics Paper no.17, UK Productivity and Competitiveness Indicators, Department of Trade and Industry, March 2006
59
investment in the region has been around 0.5% of GVA12
compared to 1.5% for England overall and it has had
less patents granted than all but two other English regions. Expenditure on external R&D and external
knowledge is also well below average.
The need to innovate more and the benefits that are likely to stem from it are clear. The comparatively low
number of universities within the LEP area is likely to heighten the need to better uptake external R&D and
that has informed the strategy’s approach of using the University of York as a conduit to HE expertise across
the UK. Additionally, contact with firms through business support and networks will steer them to external
sources of innovation support where they are relevant to the business, including through networking with and
learning from peers.
Economic indicators make clear that the LEP area also faces considerable challenges in terms of productivity.
Key points are that:
Productivity is significantly below England average across all three parts of the LEP area, just over 80% of
England average in North Yorkshire, and nearer to 90% in York and East Riding.
Productivity has declined consistently between 2005 and 2011 relative to England average. It is unclear
how much that is due to economic structure and lower value sectors compared to national average, or to
efficiency in the workplace. The decline has been particularly pronounced in York.
Productivity per worker is also well below national average and declining.
We know that businesses taking external advice are twice as likely to grow as those that do not. By assisting
businesses to operate more efficiently and to develop new capacities and markets, business support can play
an important role in boosting productivity. Within the LEP area, there is already a well-established approach in
place based on better connecting businesses to existing business support, for instance that provided through
business networks. Hence there are strong and pronounced local reasons for prioritising this activity.
Market Failure
Interventions can address a number of market failures act to prevent innovation, these include:
Positive externalities – over time there is potential for one firm’s R&D to become used by others who do
not bear the cost of the R&D activity.
Imperfect information and uncertainty – businesses can underestimate the value and importance of
innovation to their future profits, causing them to underinvest as a result. Furthermore there is
suboptimal awareness of the available R&D expertise and its applicability to businesses.
Market failures that apply to business support include:
Imperfect information and uncertainty – businesses can be unaware of or undervalue the benefits of
business support to productivity and competitiveness.
Barriers to entry – real or perceived difficulties in entering new markets, notably exports, can prevent
businesses from expanding their operations and reduce competition.
12 From BIS, Regional Performance Indicators, 2009 (data referred to spans from 1998-2007)
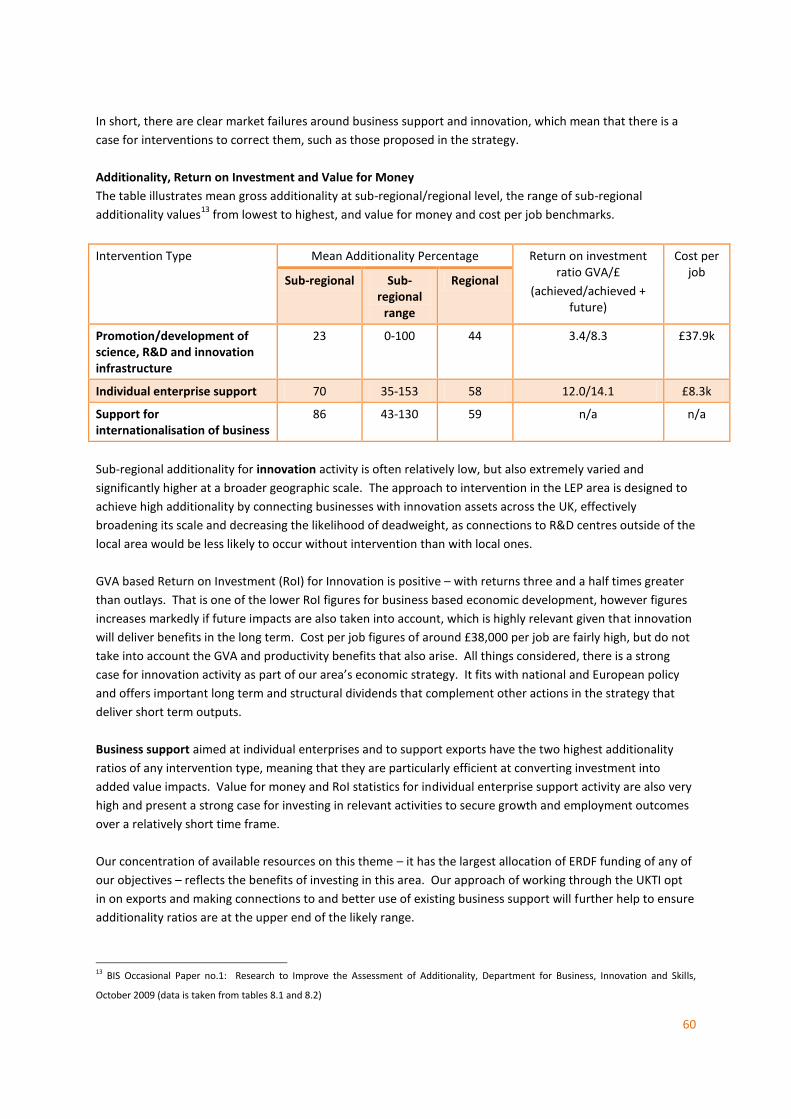
60
In short, there are clear market failures around business support and innovation, which mean that there is a
case for interventions to correct them, such as those proposed in the strategy.
Additionality, Return on Investment and Value for Money
The table illustrates mean gross additionality at sub-regional/regional level, the range of sub-regional
additionality values13
from lowest to highest, and value for money and cost per job benchmarks.
Intervention Type Mean Additionality Percentage Return on investment ratio GVA/£
(achieved/achieved + future)
Cost per job
Sub-regional Sub-
regional range
Regional
Promotion/development of science, R&D and innovation infrastructure
23 0-100 44 3.4/8.3 £37.9k
Individual enterprise support 70 35-153 58 12.0/14.1 £8.3k
Support for internationalisation of business
86 43-130 59 n/a n/a
Sub-regional additionality for innovation activity is often relatively low, but also extremely varied and
significantly higher at a broader geographic scale. The approach to intervention in the LEP area is designed to
achieve high additionality by connecting businesses with innovation assets across the UK, effectively
broadening its scale and decreasing the likelihood of deadweight, as connections to R&D centres outside of the
local area would be less likely to occur without intervention than with local ones.
GVA based Return on Investment (RoI) for Innovation is positive – with returns three and a half times greater
than outlays. That is one of the lower RoI figures for business based economic development, however figures
increases markedly if future impacts are also taken into account, which is highly relevant given that innovation
will deliver benefits in the long term. Cost per job figures of around £38,000 per job are fairly high, but do not
take into account the GVA and productivity benefits that also arise. All things considered, there is a strong
case for innovation activity as part of our area’s economic strategy. It fits with national and European policy
and offers important long term and structural dividends that complement other actions in the strategy that
deliver short term outputs.
Business support aimed at individual enterprises and to support exports have the two highest additionality
ratios of any intervention type, meaning that they are particularly efficient at converting investment into
added value impacts. Value for money and RoI statistics for individual enterprise support activity are also very
high and present a strong case for investing in relevant activities to secure growth and employment outcomes
over a relatively short time frame.
Our concentration of available resources on this theme – it has the largest allocation of ERDF funding of any of
our objectives – reflects the benefits of investing in this area. Our approach of working through the UKTI opt
in on exports and making connections to and better use of existing business support will further help to ensure
additionality ratios are at the upper end of the likely range.
13 BIS Occasional Paper no.1: Research to Improve the Assessment of Additionality, Department for Business, Innovation and Skills,
October 2009 (data is taken from tables 8.1 and 8.2)
61
Options analysis
Other potential approaches to innovation and the reasons they have not been included are summarised in the
table.
Alternative Options Reasons Discounted
Focus solely on connecting businesses to HE/R&D expertise within the LEP area
Would severely limit the expertise firms could draw upon, reducing impact and value for money
Fund experts to go into businesses and advise on innovation
Likely to be expensive, potential for limited range of R&D to be tapped
Create new business innovation hubs/centres Expensive and likelihood of duplication, reducing additionality and value for money
Leave it to the market Evidence suggests this is not working and innovation levels would remain low
Other potential approaches to business support and the reasons they have not been included are summarised
in the table.
Alternative Options Reasons Discounted
Focus on creating new business support infrastructure, specialist advisers and service, etc.
High cost, failure to capitalise on existing assets
Wholly sector focused approach Limited impact as most businesses are not in targeted sectors, and growth in SMEs is required across many sectors
No intervention - leave it to the market Low take up of support would mean productivity likely to remain low, with risk of further relative decline
In conclusion, the activities proposed have clear economic merit, local relevance, will deliver good value and
additionality, and lead to better outcomes than alternative course of action.
Objective 1ii: More entrepreneurs who start and grow a business
Coverage
This Objective supports the formation and growth of new businesses, and will help to correct the LEP area’s
relatively low business formation rates and to raise business stock levels. Specific activities are:
Inspire and support new business starts
Economic Importance and Drivers of Growth
Enterprise – focused on the creation and growth of businesses - is identified as one of five drivers of Growth14
.
Enterprise is important as economic output and employment are in part determined by the number of
businesses in a local area. Put simply, less businesses equals less growth. Along with closure/survival rates,
enterprise levels are a key long term factor affecting the number of businesses per head of population.
Relevance to York, North Yorkshire and East Riding
Business start up rates in the LEP area are almost a quarter (23%) lower than England average. That position
has deteriorated since 2003, when the gap was only 4%. Whilst survival rates for new starts are slightly above
average, these are insufficient to make up the difference in terms of net new enterprises that start up and
survive. Statistically:
In 2011, there were 43.8 new businesses per 10,000 people in the LEP area compared to 54.0 per 10,000
in England
14 DTI Economics Paper no.17, UK Productivity and Competitiveness Indicators, Department of Trade and Industry, March 2006
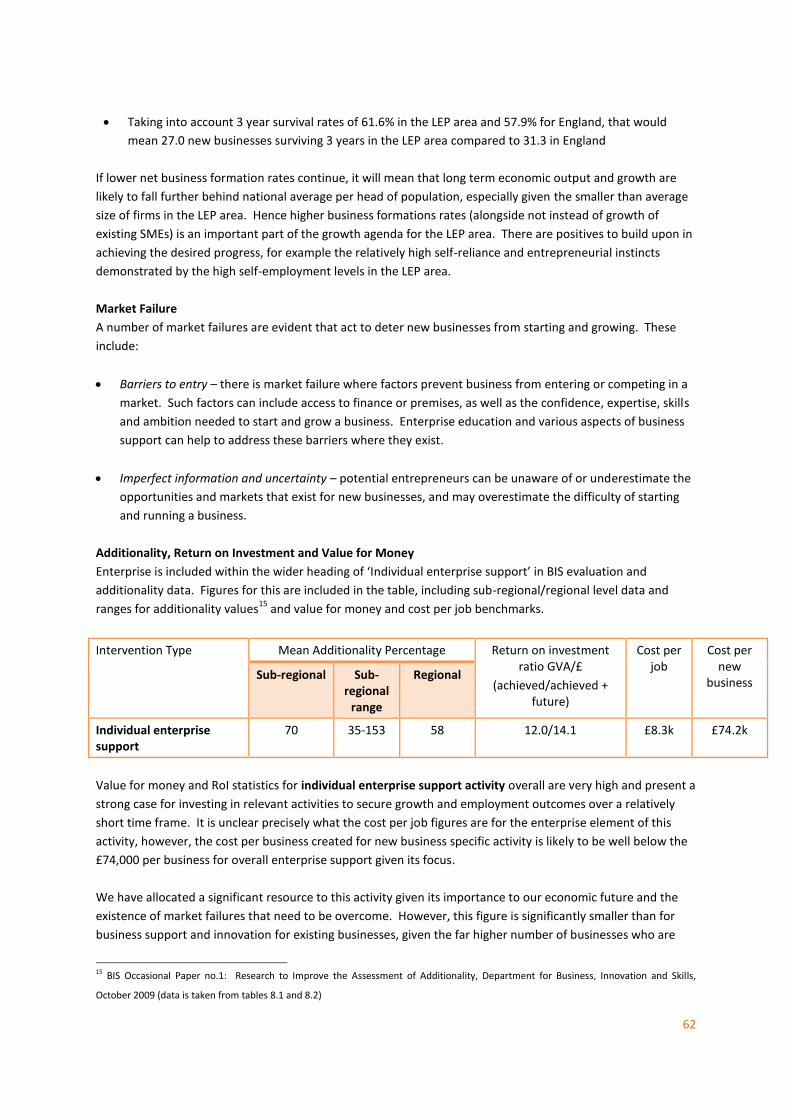
62
Taking into account 3 year survival rates of 61.6% in the LEP area and 57.9% for England, that would
mean 27.0 new businesses surviving 3 years in the LEP area compared to 31.3 in England
If lower net business formation rates continue, it will mean that long term economic output and growth are
likely to fall further behind national average per head of population, especially given the smaller than average
size of firms in the LEP area. Hence higher business formations rates (alongside not instead of growth of
existing SMEs) is an important part of the growth agenda for the LEP area. There are positives to build upon in
achieving the desired progress, for example the relatively high self-reliance and entrepreneurial instincts
demonstrated by the high self-employment levels in the LEP area.
Market Failure
A number of market failures are evident that act to deter new businesses from starting and growing. These
include:
Barriers to entry – there is market failure where factors prevent business from entering or competing in a
market. Such factors can include access to finance or premises, as well as the confidence, expertise, skills
and ambition needed to start and grow a business. Enterprise education and various aspects of business
support can help to address these barriers where they exist.
Imperfect information and uncertainty – potential entrepreneurs can be unaware of or underestimate the
opportunities and markets that exist for new businesses, and may overestimate the difficulty of starting
and running a business.
Additionality, Return on Investment and Value for Money
Enterprise is included within the wider heading of ‘Individual enterprise support’ in BIS evaluation and
additionality data. Figures for this are included in the table, including sub-regional/regional level data and
ranges for additionality values15
and value for money and cost per job benchmarks.
Intervention Type Mean Additionality Percentage Return on investment ratio GVA/£
(achieved/achieved + future)
Cost per job
Cost per new
business Sub-regional Sub-
regional range
Regional
Individual enterprise support
70 35-153 58 12.0/14.1 £8.3k £74.2k
Value for money and RoI statistics for individual enterprise support activity overall are very high and present a
strong case for investing in relevant activities to secure growth and employment outcomes over a relatively
short time frame. It is unclear precisely what the cost per job figures are for the enterprise element of this
activity, however, the cost per business created for new business specific activity is likely to be well below the
£74,000 per business for overall enterprise support given its focus.
We have allocated a significant resource to this activity given its importance to our economic future and the
existence of market failures that need to be overcome. However, this figure is significantly smaller than for
business support and innovation for existing businesses, given the far higher number of businesses who are
15 BIS Occasional Paper no.1: Research to Improve the Assessment of Additionality, Department for Business, Innovation and Skills,
October 2009 (data is taken from tables 8.1 and 8.2)
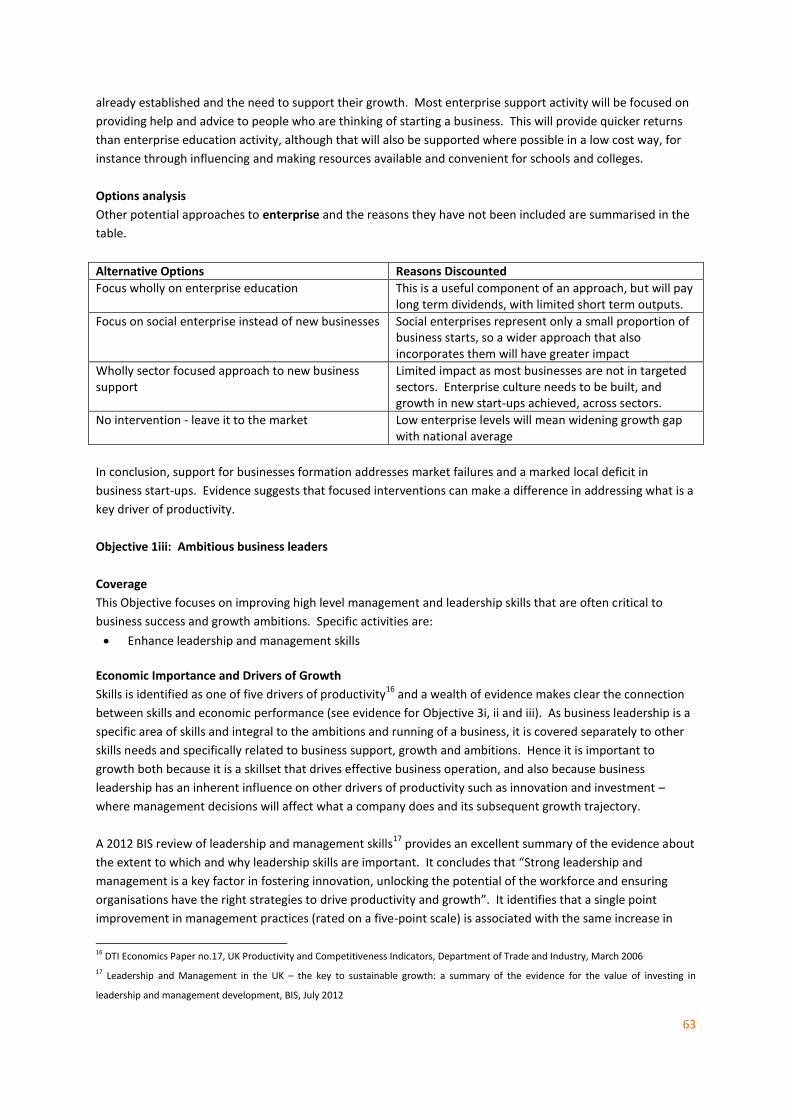
63
already established and the need to support their growth. Most enterprise support activity will be focused on
providing help and advice to people who are thinking of starting a business. This will provide quicker returns
than enterprise education activity, although that will also be supported where possible in a low cost way, for
instance through influencing and making resources available and convenient for schools and colleges.
Options analysis
Other potential approaches to enterprise and the reasons they have not been included are summarised in the
table.
Alternative Options Reasons Discounted
Focus wholly on enterprise education This is a useful component of an approach, but will pay long term dividends, with limited short term outputs.
Focus on social enterprise instead of new businesses Social enterprises represent only a small proportion of business starts, so a wider approach that also incorporates them will have greater impact
Wholly sector focused approach to new business support
Limited impact as most businesses are not in targeted sectors. Enterprise culture needs to be built, and growth in new start-ups achieved, across sectors.
No intervention - leave it to the market Low enterprise levels will mean widening growth gap with national average
In conclusion, support for businesses formation addresses market failures and a marked local deficit in
business start-ups. Evidence suggests that focused interventions can make a difference in addressing what is a
key driver of productivity.
Objective 1iii: Ambitious business leaders
Coverage
This Objective focuses on improving high level management and leadership skills that are often critical to
business success and growth ambitions. Specific activities are:
Enhance leadership and management skills
Economic Importance and Drivers of Growth
Skills is identified as one of five drivers of productivity16
and a wealth of evidence makes clear the connection
between skills and economic performance (see evidence for Objective 3i, ii and iii). As business leadership is a
specific area of skills and integral to the ambitions and running of a business, it is covered separately to other
skills needs and specifically related to business support, growth and ambitions. Hence it is important to
growth both because it is a skillset that drives effective business operation, and also because business
leadership has an inherent influence on other drivers of productivity such as innovation and investment –
where management decisions will affect what a company does and its subsequent growth trajectory.
A 2012 BIS review of leadership and management skills17
provides an excellent summary of the evidence about
the extent to which and why leadership skills are important. It concludes that “Strong leadership and
management is a key factor in fostering innovation, unlocking the potential of the workforce and ensuring
organisations have the right strategies to drive productivity and growth”. It identifies that a single point
improvement in management practices (rated on a five-point scale) is associated with the same increase in
16 DTI Economics Paper no.17, UK Productivity and Competitiveness Indicators, Department of Trade and Industry, March 2006
17 Leadership and Management in the UK – the key to sustainable growth: a summary of the evidence for the value of investing in
leadership and management development, BIS, July 2012
64
output as a 25% increase in the labour force or a 65% percent increase in invested capital. Best practice
management development can result in a 23% increase in organisational performance.
Relevance to York, North Yorkshire and East Riding
There is very little specific LEP area based research into the quality of leadership and management skills locally
and their importance to business. A major business survey carried out by Ekosgen and partners for the Skills
Funding Agency in 201218
found that 21% of businesses thought that the importance of management skills
would increase in the next three years. However it did not identify how far businesses thought management
and leadership skills influenced business success, or how well these were developed.
The previously cited BIS research did look at how UK leadership and management skills compared to those
elsewhere. It found that whilst these skills have been improving in the last ten years in the UK, it is “clear that
the UK is falling behind many of our key competitor nations in terms of leadership and management capability,
which is undermining our productivity compared to those competitors. This is having a direct and detrimental
impact on UK business profits, sales, growth and survival.” Specific statistics are:
Ineffective management is estimated to be costing UK businesses over £19billion per year in lost working
hours.
43% of UK managers rate their own line manager as ineffective – and only one in five are qualified.
Nearly three quarters of organisations in England reported a deficit of management and leadership skills
in 2012. This deficit is contributing to our productivity gap with countries like the US, Germany and
Japan.
As there is no reason to expect leadership and management skills in the LEP area to be significantly better than
in the UK as a whole, this suggests that there is almost certainly considerable opportunity to enhance these
skills locally and to enhance growth and productivity as a result.
The UKCES 2011 survey19
found that 32% of UK SMEs had provided managers with some training or
development to improve their leadership and management skills in the last 12 months. This proportion varied
from 28% of micro businesses to 49% of small businesses and 67% of medium sized businesses. As the LEP
area has smaller than average businesses, if anything, it is likely that businesses here will undertake less
management training than UK average.
Market Failure
The main reason(s) for a deficit in leadership and management skills and training is likely to be:
Imperfect information and uncertainty – businesses (especially smaller ones) underestimate the value of
leadership and management skills in influencing their profitability and growth.
In addition:
18 Ekosgen and partners/associates, Skills Research in York, North Yorkshire and East Riding August 2012, SFA/Skills Enhancement Fund, August 2012 19 UKCES (UK Commission’s Employer Skills) Survey 2011: UK Results, UK Commission for Employment and Skills, 2012
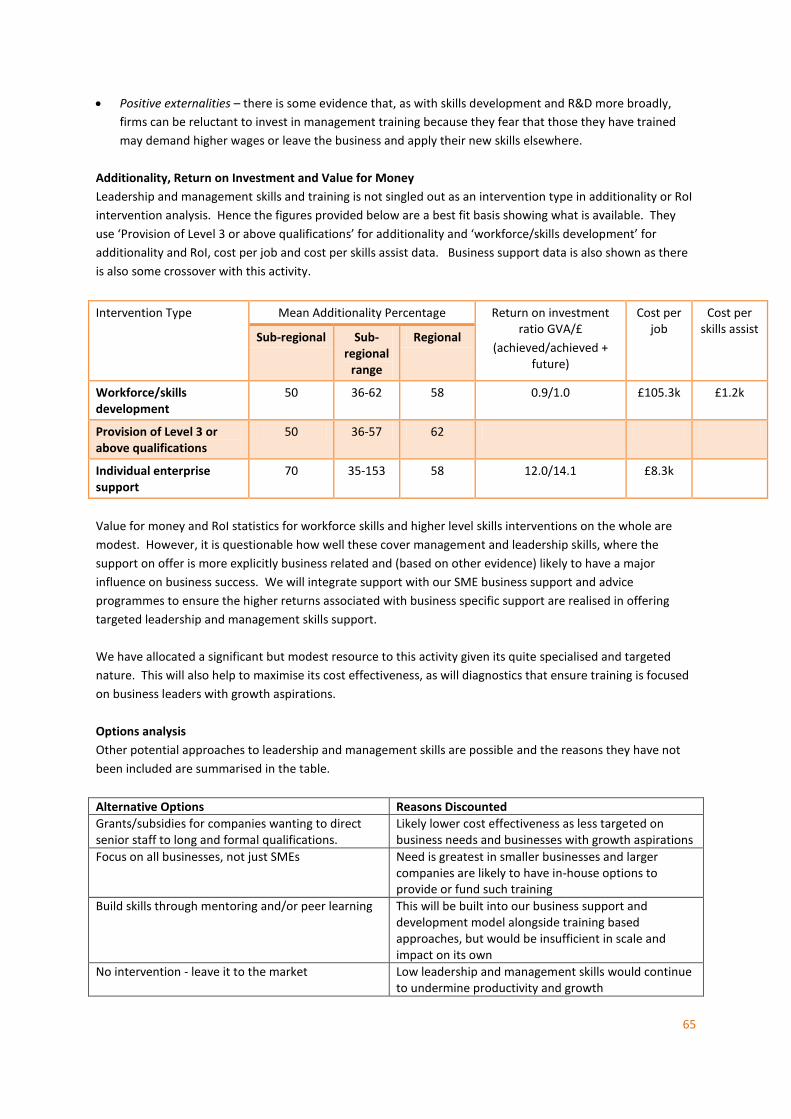
65
Positive externalities – there is some evidence that, as with skills development and R&D more broadly,
firms can be reluctant to invest in management training because they fear that those they have trained
may demand higher wages or leave the business and apply their new skills elsewhere.
Additionality, Return on Investment and Value for Money
Leadership and management skills and training is not singled out as an intervention type in additionality or RoI
intervention analysis. Hence the figures provided below are a best fit basis showing what is available. They
use ‘Provision of Level 3 or above qualifications’ for additionality and ‘workforce/skills development’ for
additionality and RoI, cost per job and cost per skills assist data. Business support data is also shown as there
is also some crossover with this activity.
Intervention Type Mean Additionality Percentage Return on investment ratio GVA/£
(achieved/achieved + future)
Cost per job
Cost per skills assist
Sub-regional Sub-regional
range
Regional
Workforce/skills development
50 36-62 58 0.9/1.0 £105.3k £1.2k
Provision of Level 3 or above qualifications
50 36-57 62
Individual enterprise support
70 35-153 58 12.0/14.1 £8.3k
Value for money and RoI statistics for workforce skills and higher level skills interventions on the whole are
modest. However, it is questionable how well these cover management and leadership skills, where the
support on offer is more explicitly business related and (based on other evidence) likely to have a major
influence on business success. We will integrate support with our SME business support and advice
programmes to ensure the higher returns associated with business specific support are realised in offering
targeted leadership and management skills support.
We have allocated a significant but modest resource to this activity given its quite specialised and targeted
nature. This will also help to maximise its cost effectiveness, as will diagnostics that ensure training is focused
on business leaders with growth aspirations.
Options analysis
Other potential approaches to leadership and management skills are possible and the reasons they have not
been included are summarised in the table.
Alternative Options Reasons Discounted
Grants/subsidies for companies wanting to direct senior staff to long and formal qualifications.
Likely lower cost effectiveness as less targeted on business needs and businesses with growth aspirations
Focus on all businesses, not just SMEs Need is greatest in smaller businesses and larger companies are likely to have in-house options to provide or fund such training
Build skills through mentoring and/or peer learning This will be built into our business support and development model alongside training based approaches, but would be insufficient in scale and impact on its own
No intervention - leave it to the market Low leadership and management skills would continue to undermine productivity and growth
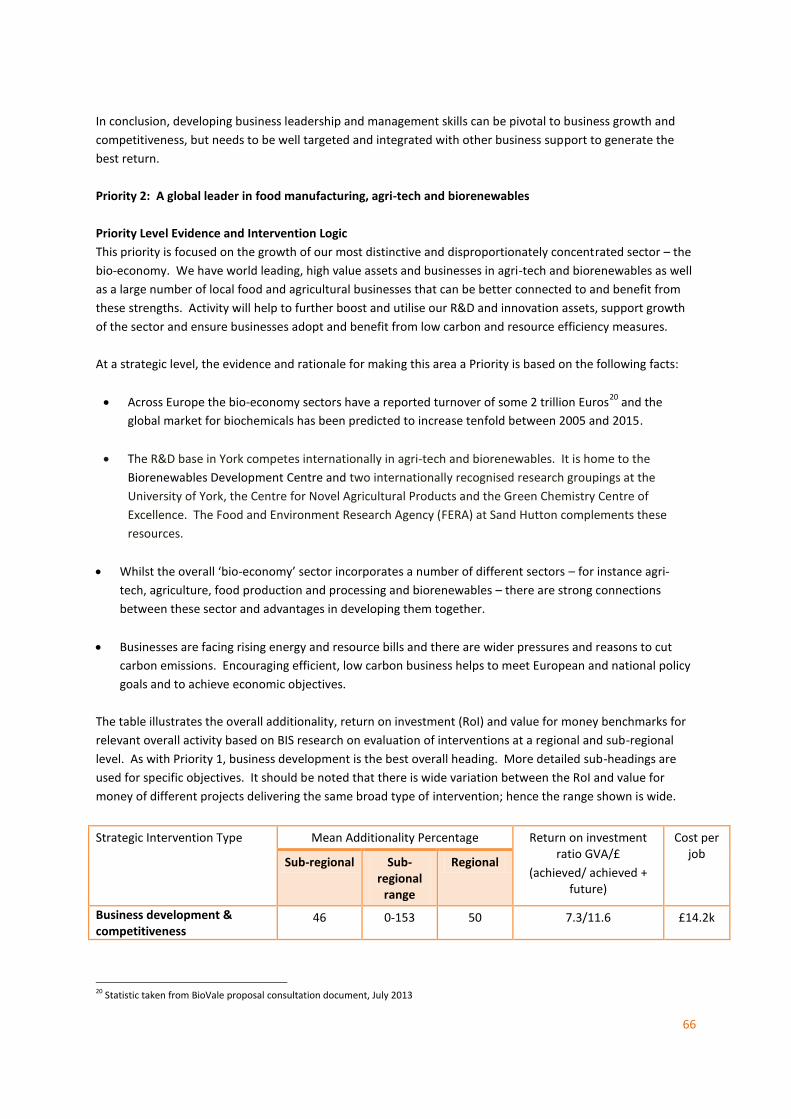
66
In conclusion, developing business leadership and management skills can be pivotal to business growth and
competitiveness, but needs to be well targeted and integrated with other business support to generate the
best return.
Priority 2: A global leader in food manufacturing, agri-tech and biorenewables
Priority Level Evidence and Intervention Logic
This priority is focused on the growth of our most distinctive and disproportionately concentrated sector – the
bio-economy. We have world leading, high value assets and businesses in agri-tech and biorenewables as well
as a large number of local food and agricultural businesses that can be better connected to and benefit from
these strengths. Activity will help to further boost and utilise our R&D and innovation assets, support growth
of the sector and ensure businesses adopt and benefit from low carbon and resource efficiency measures.
At a strategic level, the evidence and rationale for making this area a Priority is based on the following facts:
Across Europe the bio-economy sectors have a reported turnover of some 2 trillion Euros20
and the
global market for biochemicals has been predicted to increase tenfold between 2005 and 2015.
The R&D base in York competes internationally in agri-tech and biorenewables. It is home to the
Biorenewables Development Centre and two internationally recognised research groupings at the
University of York, the Centre for Novel Agricultural Products and the Green Chemistry Centre of
Excellence. The Food and Environment Research Agency (FERA) at Sand Hutton complements these
resources.
Whilst the overall ‘bio-economy’ sector incorporates a number of different sectors – for instance agri-
tech, agriculture, food production and processing and biorenewables – there are strong connections
between these sector and advantages in developing them together.
Businesses are facing rising energy and resource bills and there are wider pressures and reasons to cut
carbon emissions. Encouraging efficient, low carbon business helps to meet European and national policy
goals and to achieve economic objectives.
The table illustrates the overall additionality, return on investment (RoI) and value for money benchmarks for
relevant overall activity based on BIS research on evaluation of interventions at a regional and sub-regional
level. As with Priority 1, business development is the best overall heading. More detailed sub-headings are
used for specific objectives. It should be noted that there is wide variation between the RoI and value for
money of different projects delivering the same broad type of intervention; hence the range shown is wide.
Strategic Intervention Type Mean Additionality Percentage Return on investment ratio GVA/£
(achieved/ achieved + future)
Cost per job
Sub-regional Sub-regional
range
Regional
Business development & competitiveness
46 0-153 50 7.3/11.6 £14.2k
20 Statistic taken from BioVale proposal consultation document, July 2013

67
Objective 2i: World class innovation in agri-tech and biorenewables
and
Objective 2ii: Agriculture and food businesses connected to new opportunities
Coverage
These two objectives are covered together given a high degree of cross-over between them. This gives a more
connected and rounded presentation of the evidence for intervention and avoids duplication. Together, they
involve business cluster/sectoral support and innovation which will build the bio-economy sector’s innovation
assets and activities, and promote the utilisation of these by food, agri-tech, agricultural and low carbon
businesses to support their growth and development. Specific activities are:
Grow our international competitiveness in agri-tech
Capitalise on our biorenewables and low carbon assets
Connect our agricultural sector, agri-tech and biorenewables based expertise and opportunities
Economic Importance and Drivers of Growth
This Objective responds to innovation as a driver of productivity and to the important role of focusing on the
most outstanding assets and economic sectors/clusters in line with the principles of Smart Specialisation and
the Witty review (as previously cited). Innovation is also closely related to other drivers of productivity –
notably skills and innovation. By focusing on one overall bio-economy sector (made up of a number of related
sub-sectors) rather than a wider spread of business sectors, we have taken the tough decisions required to
focus energy and resources on excellence in the one key area that is best tuned to our area’s strengths, assets
and opportunities.
Relevance to York, North Yorkshire and East Riding
The LEP area has a wide and diverse agricultural base. Businesses in the agricultural sector are around 3.5
times more concentrated in the LEP area than national average, and more concentrated than any other sector
locally, whilst food manufacturing accounts for around 35% of all manufacturing jobs. The biorenewables and
energy sector is also highly concentrated, in the south east of our area in particular around the Drax and
Eggborough power stations near Selby.
Additionally, there are key assets and opportunities in the sector. Assets include research institutions at the
University of York and FERA (see Priority overview for more detail) and Askham Bryan, the fastest growing
college in the UK specialising in land based disciplines. Opportunities include:
the BioVale initiative led by the University of York and its partners which spans this LEP area and the Leeds
City Region;
major investments in low carbon energy, such as biorenewable and carbon capture and storage) at Drax
and Eggborough power stations;
expansion of the FERA Sand Hutton site to double its current size;
the potential for potash mining at Whitby; and
linkages to other low carbon energy development such as offshore wind.
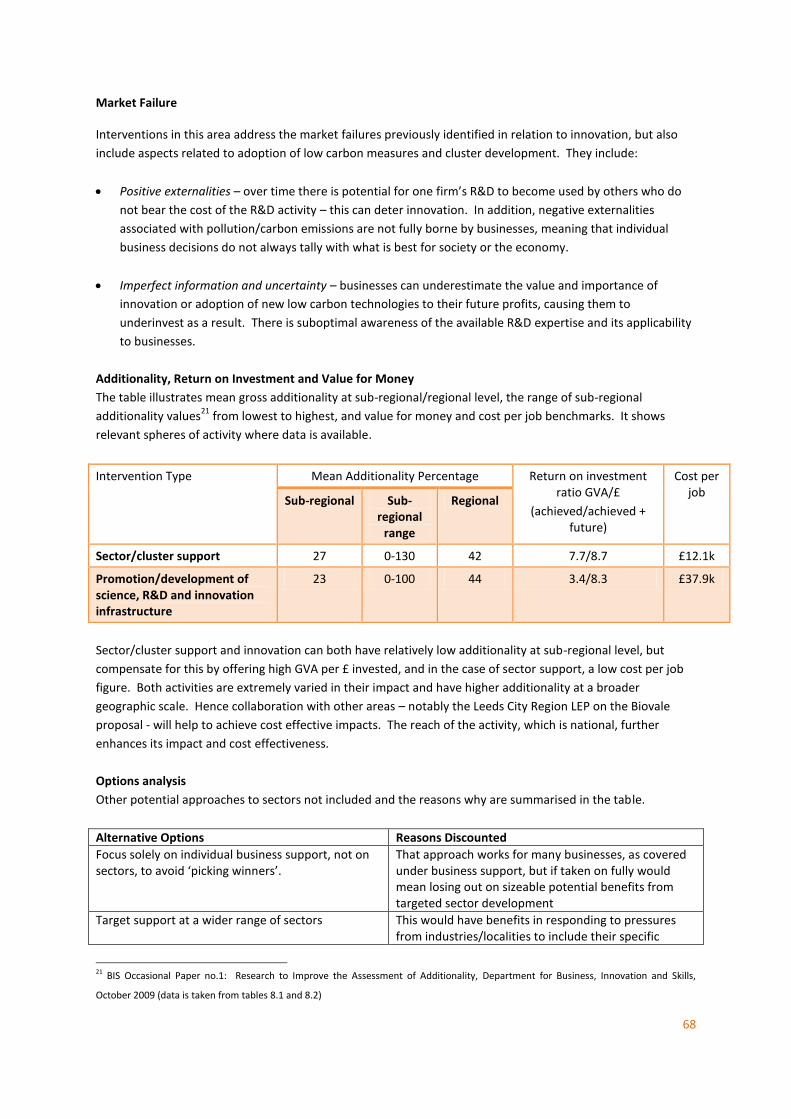
68
Market Failure
Interventions in this area address the market failures previously identified in relation to innovation, but also
include aspects related to adoption of low carbon measures and cluster development. They include:
Positive externalities – over time there is potential for one firm’s R&D to become used by others who do
not bear the cost of the R&D activity – this can deter innovation. In addition, negative externalities
associated with pollution/carbon emissions are not fully borne by businesses, meaning that individual
business decisions do not always tally with what is best for society or the economy.
Imperfect information and uncertainty – businesses can underestimate the value and importance of
innovation or adoption of new low carbon technologies to their future profits, causing them to
underinvest as a result. There is suboptimal awareness of the available R&D expertise and its applicability
to businesses.
Additionality, Return on Investment and Value for Money
The table illustrates mean gross additionality at sub-regional/regional level, the range of sub-regional
additionality values21
from lowest to highest, and value for money and cost per job benchmarks. It shows
relevant spheres of activity where data is available.
Intervention Type Mean Additionality Percentage Return on investment ratio GVA/£
(achieved/achieved + future)
Cost per job
Sub-regional Sub-
regional range
Regional
Sector/cluster support 27 0-130 42 7.7/8.7 £12.1k
Promotion/development of science, R&D and innovation infrastructure
23 0-100 44 3.4/8.3 £37.9k
Sector/cluster support and innovation can both have relatively low additionality at sub-regional level, but
compensate for this by offering high GVA per £ invested, and in the case of sector support, a low cost per job
figure. Both activities are extremely varied in their impact and have higher additionality at a broader
geographic scale. Hence collaboration with other areas – notably the Leeds City Region LEP on the Biovale
proposal - will help to achieve cost effective impacts. The reach of the activity, which is national, further
enhances its impact and cost effectiveness.
Options analysis
Other potential approaches to sectors not included and the reasons why are summarised in the table.
Alternative Options Reasons Discounted
Focus solely on individual business support, not on sectors, to avoid ‘picking winners’.
That approach works for many businesses, as covered under business support, but if taken on fully would mean losing out on sizeable potential benefits from targeted sector development
Target support at a wider range of sectors This would have benefits in responding to pressures from industries/localities to include their specific
21 BIS Occasional Paper no.1: Research to Improve the Assessment of Additionality, Department for Business, Innovation and Skills,
October 2009 (data is taken from tables 8.1 and 8.2)

69
strengths, but would mean focusing on sectors that do not have any particular concentration in the LEP area, diluting resources and energy and diminishing impact in truly outstanding areas
Treat biorenewables/low carbon and agri-tech/food manufacturing as wholly separate
Misses out the considerable overlap and connective benefits between these sectors
Leave it to the market Misses out on opportunities based on strong assets and pipeline investments, where interventions will lead to amplified benefits
Objective 2iii: Low Carbon Businesses
Coverage
This objective is designed to support, widen and accelerate low carbon based progress and competitiveness
within our economy. It includes resource efficiency and clean, low carbon energy generation activity within
the bioeconomy sector (including food and farm businesses) where there are particular opportunities and in
SMEs more widely. Specific activities are:
Support investment in energy & resource efficiency
Economic Importance and Drivers of Growth
This activity will contribute to economic growth by helping SMEs to enhance their productivity and
competitiveness by reducing long term energy and resource costs, and developing new and better products,
services and processes. This activity will put businesses in a stronger position to survive and grow given likely
increases in energy and resource costs over time.
Relevance to York, North Yorkshire and East Riding
There are aspects of low carbon activity and technologies that are particularly relevant to businesses in the
bio-economy that is so prominent in the LEP area, including food, agriculture and biorenewables based
businesses. These include ways of reducing high and often rising resource costs, for example, by turning farm
waste into energy, anaerobic digestion can turn a cost into an income stream. Likewise, agricultural
businesses can face costs for carbon intensive products such as fertilisers and other costs relating to pollution
control, water use and energy requirements. Sustainable approaches can help to reduce these costs and
environmental impacts. More widely, SMEs (of which the LEP area has a disproportionately high number) are
the most likely to face information based or access to finance/technology based market failures that restrict
use of low carbon solutions.
Market Failure
Interventions in this area address market failures including:
Negative externalities – damage associated with pollution/carbon emissions is not fully costed or borne by
businesses, meaning that individual business decisions do not always tally with what is best for society or
the economy.
Imperfect information and uncertainty – businesses often underestimate the benefits and cost savings
associated with low carbon and resource efficiency measures, such as anaerobic digestion or energy
efficiency improvement. Additionally, many businesses are not aware of what options there are or how to
go about implementing them. These failures restrict adoption of new low carbon technologies and mean
businesses miss out on long term cost savings and market opportunities.
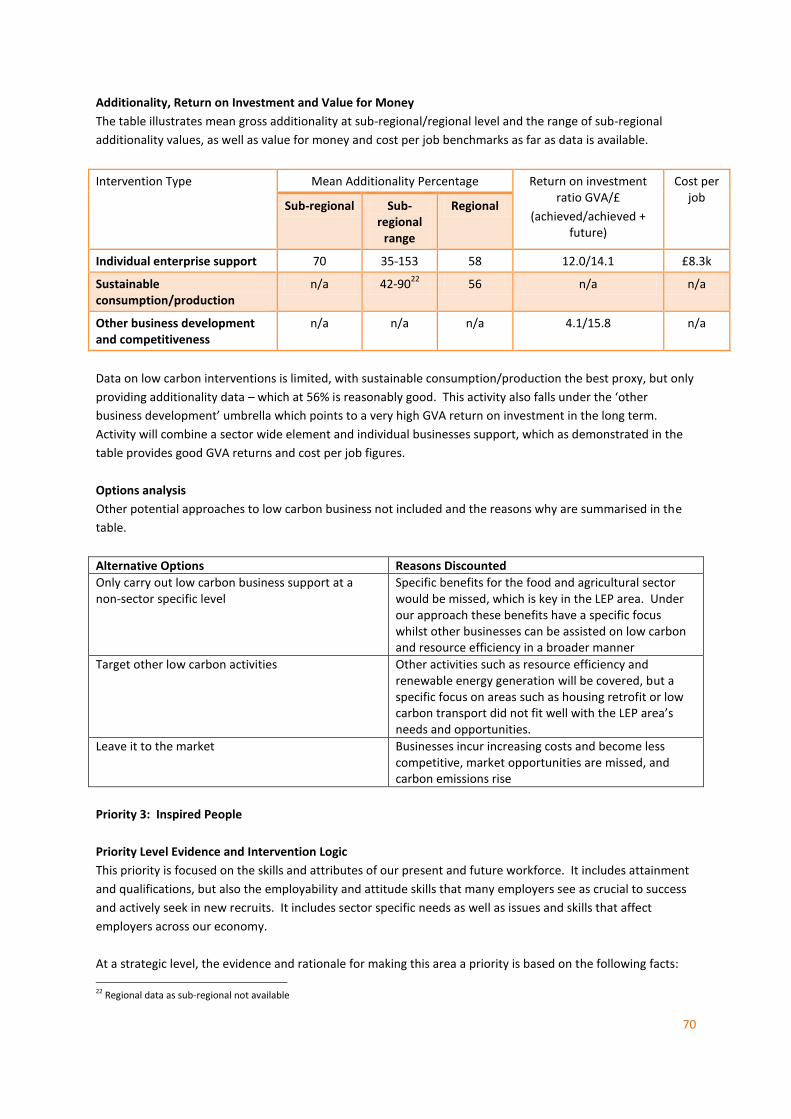
70
Additionality, Return on Investment and Value for Money
The table illustrates mean gross additionality at sub-regional/regional level and the range of sub-regional
additionality values, as well as value for money and cost per job benchmarks as far as data is available.
Intervention Type Mean Additionality Percentage Return on investment ratio GVA/£
(achieved/achieved + future)
Cost per job
Sub-regional Sub-
regional range
Regional
Individual enterprise support 70 35-153 58 12.0/14.1 £8.3k
Sustainable consumption/production
n/a 42-9022
56 n/a n/a
Other business development and competitiveness
n/a n/a n/a 4.1/15.8 n/a
Data on low carbon interventions is limited, with sustainable consumption/production the best proxy, but only
providing additionality data – which at 56% is reasonably good. This activity also falls under the ‘other
business development’ umbrella which points to a very high GVA return on investment in the long term.
Activity will combine a sector wide element and individual businesses support, which as demonstrated in the
table provides good GVA returns and cost per job figures.
Options analysis
Other potential approaches to low carbon business not included and the reasons why are summarised in the
table.
Alternative Options Reasons Discounted
Only carry out low carbon business support at a non-sector specific level
Specific benefits for the food and agricultural sector would be missed, which is key in the LEP area. Under our approach these benefits have a specific focus whilst other businesses can be assisted on low carbon and resource efficiency in a broader manner
Target other low carbon activities Other activities such as resource efficiency and renewable energy generation will be covered, but a specific focus on areas such as housing retrofit or low carbon transport did not fit well with the LEP area’s needs and opportunities.
Leave it to the market Businesses incur increasing costs and become less competitive, market opportunities are missed, and carbon emissions rise
Priority 3: Inspired People
Priority Level Evidence and Intervention Logic
This priority is focused on the skills and attributes of our present and future workforce. It includes attainment
and qualifications, but also the employability and attitude skills that many employers see as crucial to success
and actively seek in new recruits. It includes sector specific needs as well as issues and skills that affect
employers across our economy.
At a strategic level, the evidence and rationale for making this area a priority is based on the following facts:
22 Regional data as sub-regional not available

71
Skills is recognised as a key driver of productivity and one that also supports enterprise and innovation.
A fifth of UK economic growth is due to improvements in workforce skills.
Businesses that develop their skills do better. ‘Low training’ companies are between 2 and 2.5 times
more likely to go out of business as ‘high training’ companies.
People with better skills are more likely to be employed, to contribute more to productivity, and to earn
more. The earnings premia associated with achieving higher qualifications are: Level 2 (15%); Level 3
(13%); Level 4 (28%); Level 5 (23%) – these are additive percentages23
.
Whilst qualifications levels across most of the LEP area are above national average, they are not rising as
fast as nationally – so our advantage in this area will diminish unless we act. Additionally, there are
localised areas where skills levels are lower, most notably on the Yorkshire Coast.
The table illustrates the overall additionality, return on investment (RoI) and value for money benchmarks for
overall skills activity based on BIS research on evaluation of interventions at a regional and sub-regional level.
The overall ‘People and Skills’ based interventions headings is used, which includes subheadings such as skills
development, matching people to jobs, and educational infrastructure More detailed sub-headings are used
for specific objectives. As with other priorities, it should be noted that there is wide variation between the RoI
and value for money of different projects delivering the same broad type of intervention, hence the range
shown is wide.
Strategic Intervention Type Mean Additionality Percentage Return on investment ratio GVA/£
(achieved/ achieved + future)
Cost per job
Sub-regional Sub-regional
range
Regional
People and Skills 54 36-66 55 2.5/2.5 £43.3k
Objective 3i: A productive workforce for growing businesses
and
Objective 3ii: Inspired people making the right choices
Coverage
These two objectives include a focus on workforce and skills needs from a business perspective and seeks to
enhance the level and relevance of skills to improve business productivity profits and growth. They combine
qualifications, employability skills and work experience, as well as actions to do with careers choices which
benefit individuals and the economy. Specific activities are:
Increase productivity by investing in workforce skills
Build competitive advantage through higher level skills
Support high quality apprenticeships and internships
Increase employability by connecting business to education
Economic Importance and Drivers of Growth
23 Statistics from “The Big Picture: skills and employment needs in a global context” presentation by Professor Mike Campbell OBE to LCR
skills network, June 28 2012
72
Skills is identified as one of five drivers of productivity24
and a wealth of evidence makes clear the connection
between skills and economic performance. Skilled people enable businesses to get started, to perform better
and to innovate, whilst unskilled workers can hold companies back. For instance in UK manufacturing, lower
skill levels were found to have a negative effect on labour productivity and on the types of machinery chosen,
the way that machinery was used and the introduction of new technology. Some studies25
suggest that a
year’s additional education can raise productivity by 5%-9% and 6%-12% in the manufacturing and service
sectors respectively
Whilst all skills support growth, higher level skills have a particularly strong impact. The Leitch Review26
found
that increased skill levels accounted for a fifth of annual growth in the last 25 years, and that in the five years
leading up to 2000 higher skills added 0.37 percentage points to annual growth. Additionally, Hanushek and
Woessmann27
found that a 10% increase in students reaching basic literacy increased annual growth by 0.3%,
compared to 1.3% higher annual growth from a similar increase in high level skills.
Wide ranging evidence shows that many businesses value apprenticeships as a route to securing new workers,
offering them ability to mould and train recruits to meet their requirements at relatively low cost. We were
unable to find evidence that directly links taking on apprentices to productivity growth. Some UK research28
has investigated this link and been unable to find a significant correlation, but it notes that this may well be
because of limited data sets rather than there being no relationship. Businesses also stress the importance of
employability skills29
- incorporating basic English and maths skills, attitudes and ambition, and soft skills such
as teamwork, communication and creativity. These skills can be enhanced during education, and also
progressed through work experience and apprenticeships.
Relevance to York, North Yorkshire and East Riding
Research by Ekosgen and partners for the Skills Funding Agency in 201230
investigated skills requirements in
the LEP area, in part through a major survey of businesses. This demonstrated particular needs within the LEP
area, and key findings include:
Significant future employment demands will present skills needs, based on a combination of baseline
economic growth, major initiatives, and ‘replacement demand’. In total 30,000 recruits were forecast to
be required between 2011 and 2015, with that figure rising to 91,000 by 2020.
Replacement demand accounts for the bulk of the expected employment needs - 20,000 workers by 2015
and 67,000 by 2020. It will involve a mixture of upskilling within businesses and recruitment of new
employees with the right skills. The largest volume of replacement demand needs is in large sectors such
as health, business services, retail and education.
24 DTI Economics Paper no.17, UK Productivity and Competitiveness Indicators, Department of Trade and Industry, March 2006
25 Lynch and Black, Beyond the incidence of training, evidence from a national employers survey, NBER working paper 5231, 1995
26 Leitch Review of Skills, Lord Leitch, 2006
27 The Role of Cognitive Skills in Economic Development, Hanushek and Woessmann, 2008
28 Steven Mcintosh, Jin Wenchao and Anna Vignoles, Research Report DFE-RR180 - Firms’ engagement with the Apprenticeship
Programme, University of Sheffield, Institute for Fiscal Studies and Institute for Education, November 2011
29 http://www.cbi.org.uk/business-issues/education-and-skills/in-focus/employability/ (accessed 6/9/2013)
30 Ekosgen and partners/associates, Skills Research in York, North Yorkshire and East Riding August 2012, SFA/Skills Enhancement Fund, August 2012

73
17% of businesses currently employ apprentices – but 22% of those surveyed planned to employ one in
the next three years. Apprenticeships and other models that combine learning and practical work
experience were popular with employers and are expected to grow.
Only 17% of firms said they employed graduates, with another 4% expecting to do so in the next three
years. That is a low figure and suggests application of high level skills could be improved.
30% of firms said they did not plan to provide any formal training – a higher figure than in neighbouring
LEP areas - and suggesting that business could be more aware of the value of skills.
Specific, sector based skills gaps did not emerge strongly in the research, although in other areas specialist
engineering and software development skills emerged as needs. However, employers did stress the
importance of job-specific and ICT skills, work readiness and generic employability skills.
Market Failure
A number of market failures act to prevent businesses addressing their skills needs, even though doing so
would in principle be in their own financial interests. The main ones are:
Imperfect information and uncertainty – businesses, most notably SMEs, underestimate the value of skills
in influencing their profitability and growth.
Positive externalities – there is evidence that some businesses, especially smaller ones do not invest in
upskilling workers because they fear poaching of skilled workers by other firms, and training leading to
wage demands31
. Hence the value to the economy overall may be greater than to an individual SME.
Public goods – many skills issues are intimately related to education, including what it taught, how it is
taught, and careers choices. As education is a public good, it is not directly influenced by the market,
meaning that mechanisms need to be found to exert influence on education so that it meets business and
economic needs – for example to improve employability skills or produce more people with qualifications
in STEM subjects.
Additionality, Return on Investment and Value for Money
The figures below show data for the spread of skills and educational infrastructure sub-headings that are
available. Educational infrastructure is also included for information, although the interventions covered here
are more about people/business based connections to education than infrastructure. ‘Hybrid’ interventions
refers to large, integrated people and skills programmes, sometimes including high level skills.
Intervention Type Mean Additionality Percentage Return on investment ratio GVA/£
(achieved/achieved + future)
Cost per job
Cost per skills assist
Sub-regional Sub-regional
range
Regional
Workforce/skills development
50 36-62 58 0.9/1.0 £105.3k £1.2k
Provision of Level 3 or above qualifications
50 36-57 62
Educational infrastructure 57 49-61 46 5.2/5.2 £34.0k £6.5k
31 Professor Ian Stone, Praxis no.5, Encouraging small firms to invest in training: learning from overseas, UKCES, June 2010

74
Other people and skills/hybrid
59 47-66 55 4.1/4.1 £24.0k £5.4k
Value for money and RoI statistics for workforce skills and higher level skills interventions on the whole are
modest, however additionality percentages are about or just above average compared to interventions across
all categories of activity. This is not a reason to avoid skills based activity, partly because that is intrinsic to ESF
programme requirements and an integrated economic programme for our area, but also because the cost per
job and GVA RoI data is unreliable in relation to skills32
and GVA returns are likely to be notably higher than
those suggested in the data. There is also evidence in some specific areas, such as apprenticeships, to suggest
that deadweight in particular is low. Research concluded that taking on apprentices complements rather than
substitutes for other training activity33
.
Given the sizeable resources devoted to skills interventions, thorough appraisal and selection will be important
in maximising value for money and impact. Whilst the ‘hybrid’ interventions category is based on a small
sample, it appears to deliver returns quite efficiently, so the principle of integrating skills, employment and
business development goals in interventions (which it involves) will be taken forward in our approach within
the LEP area.
Options analysis
Other potential approaches to skills are possible and the reasons they have not been included are summarised
in the table.
Alternative Options Reasons Discounted
Concentrate wholly on skills in priority sectors As we only single out the bio-economy sector, this would leave skills untouched in a large majority of businesses and sectors
Focus on all businesses, not just SMEs Evidence suggests SMEs are less likely to upskill employees or take on apprentices, so support should be targeted at them
Focus wholly on formal qualifications Misses out employability skills, which employers tend to single out as a key need
Wholly locally focused approach Whilst the flexibility to respond to local skills needs where they exist is helpful and part of our approach, many skills needs (e.g. employability skills, apprenticeships) apply across our area
Focus wholly on education Would miss out current employees, who will be the majority of the workforce for many years
Focus wholly on educational infrastructure Educational infrastructure is covered in our strategic economic plan local growth deal priorities
No intervention - leave it to the market Key skills issues and their impact on productivity would go untouched
In conclusion, there is clear evidence that skills are a major influence on growth, relevant to our area, and that
market failures exist that require intervention. Acting in a targeted and integrated way can address these
issues and improve productivity. 32 The methodology used in the PWC/BIS research for calculating RoI and cost per job impacts was based only on job creation outputs by
skills projects, even though many of those projects evaluated were primarily designed to enhance GVA and productivity and not
necessarily to create any or many jobs in the short term.
33 Steven Mcintosh, Jin Wenchao and Anna Vignoles, Research Report DFE-RR180 - Firms’ engagement with the Apprenticeship
Programme, University of Sheffield, Institute for Fiscal Studies and Institute for Education, November 2011
75
Objective 3iii: Empowered communities delivering support and inclusion
Coverage
This objective is designed to support employment and inclusion by addressing barriers to work including those
related to ambitions, health, travel, skills and family issues. It includes a focus (but not an exclusive one) on
young people and on areas where unemployment and disadvantage is most widespread, and it is designed to
build community capacity and ownership of local solutions.
Specific activities are:
Build skills, attitudes and ambition to help people access jobs
Develop strong communities and active inclusion
Economic Importance and Drivers of Growth
Activity under this objective is about social goals as well as economic growth. Nevertheless by addressing
barriers and building capacities that provide routes into employment, it will increase employment and incomes
and contribute to economic growth. Additionally, there is some crossover between this Objective and
Objective 3ii in relation to employability skills, which assist people in life and help them to gain and progress in
a job, but also support business success and productivity.
Relevance to York, North Yorkshire and East Riding
Economic activity rates in the LEP area are generally above national average – around five percentage points
higher. However, the employment rate has fallen since pre-recession peaks and varies significantly across our
area. The Yorkshire Coast has the most pronounced unemployment and associated exclusion issues, however,
even seemingly prosperous places such as Harrogate and York have areas with significant social and
employment issues at a local level, whilst smaller districts also have pockets of disadvantage, sometimes
hidden within seemingly prosperous neighbourhoods. The proportion of young people not in employment,
education or training is around 4.5-5.5%, but this has not fallen over time, and there is a need to ensure that
all young people are able to make an economic contribution.
Analysis of incomes further makes clear that our area is less prosperous than sometimes perceived. The most
rural and remote rural districts in our area, such as Craven, Hambleton, Ryedale and Richmondshire, have
some of the lowest median incomes in Yorkshire. These are typically in the region of £340-£355 per week,
lower for instance than in every district in South Yorkshire and all but one in West Yorkshire. When low
incomes are set against the significantly higher living costs that apply in rural areas (research34
shows these to
be 10-20% higher than in urban areas), it demonstrates that our area faces issues of in-work poverty as well as
unemployment.
Market Failure
The two main market failures that apply in our area in relation to this objective are:
Factor immobility – because travel and access barriers make it difficult for many people, especially those
on low incomes and/or without access to a car, to get to a place of work or study. In technical terms, this
prevents labour, from being efficiently employed and hence distorts and undermines the efficient
operation of markets.
34 Noel Smith, Abigail Davis and Donald Hirsch, A minimum income standard for rural areas, Loughborough University Centre for Research
in Social Policy, published by Joseph Rowntree Foundation, November 2010

76
Equity issues – because markets have generated an unacceptable distribution of income with social exclusion consequences.
Additionality, Return on Investment and Value for Money
The main area of activity where evaluation based data allows calculation of RoI, additionality and value for
money in terms of outputs is ‘matching people to jobs’. Figures for this are provided in the table.
Intervention Type Mean Additionality Percentage Return on investment ratio GVA/£
(achieved/achieved + future)
Cost per job
Cost per skills assist
Sub-regional Sub-regional
range
Regional
Matching people to jobs 52 41-62 53 0.8/0.8 £49.2k £2.6k
Additionality levels are around average for matching people to jobs interventions. Whilst GVA returns are
relatively low and cost per job figures quite high, these figures need to be taken in the context of social as well
as economic objectives, and the much greater difficult and intensity work required to secure employment in
deprived areas and for people who are some distance from the labour market. For instance, capacity building
and personal development work may be required first to get a person to a stage where they are realistically
able to gain and hold down a job. Reflecting this less direct route to employment, cost per job is quite high,
but skills assist outputs are on average achieved at low cost. In addition to the outputs shown in the table, the
average cost per person ‘assisted into a job’ is £4.7k – again a low figure and one which demonstrates value for
money impacts are achievable.
Options analysis
Other potential approaches to employment and inclusion are possible and outlined in the table together with
the reasons for discounting them.
Alternative Options Reasons Discounted
Rely on education to build inclusion long term This has not worked to date – or there would not be the problem we face. It is unlikely to be a realistic solution on its own (although it can contribute)
Focus on business growth to drive employment, backed by a tougher benefits regime
This does not address the market failure based vicious cycle that exists, whereby some businesses avoid areas of disadvantage, adding to exclusion and employment barriers within them
Rely on skills solutions alone (as per objectives 3i and 3ii)
Misses the need to address wider barriers that cause unemployment and exclusion, e.g. travel, family, health or social/personal
No intervention - leave it to the market Leaves people excluded and means that people and places that could be economically productive assets are instead a drain on resources
Priority 4: Successful and Distinctive Places
and
Priority 5: A Well Connected Economy
Priority Level Evidence and Intervention Logic
These two priorities are covered together because they both have a focus on physical development, have
fewer supporting objectives that are seeking EU funding, and are less well supported by evaluation based

77
intervention data – meaning that the same overall category (‘Place/Regeneration through physical
infrastructure’) covers both priorities.
At a strategic level, the rationale for Successful and Distinctive Places a priority is:
Our area contains a number of overlapping functional economic areas. These areas have their own
distinctive challenges and opportunities, so local place based responses are needed.
The rural nature and hilly terrain of much of York, North Yorkshire and East Riding means that there are
often physical constraints or resource capacity issues that raise the cost of development beyond the
point of its financial viability. Equally, localised responses are needed that fit the community and
environmental needs of specific areas.
There is wide evidence to show that higher quality environments and quality of life attract business
investment and support successful economies. Community led approaches have been shown to be
successful in advancing these goals (e.g. through LEADER programmes)
Some aspects of place based development – notably large scale infrastructure - are outside the scope of
ERDF or ESF investment. Recognising this, proposed activities focus on elements that are generally
smaller scale, community led and which deliver environmental as well as economic goals.
The rationale for the Priority of a Well Connected Economy is:
It is widely recognised that transport and connectivity have a direct impact on economic performance
and business success. Transport is an enabler for growth and it can help stronger economies in the LEP
area to grow further and weaker ones to recover.
The key to business connectivity is quick, easy and reliable access for the flow of goods and services.
Well managed transport networks that achieve this, with minimal congestion, enable businesses to
become more competitive and reduce transport costs. Consequently, investment in transport can lead
to sustainable economic growth.35
Targeted investments in transport infrastructure can unlock specific growth sites and better connect our
major settlements to places elsewhere in the LEP area and beyond. We envisage that this is outside the
scope of ERDF or ESF investment. However, appropriate investment in existing road and rail
infrastructure and in low carbon transport solutions is required to underpin growth, tackle pinch points
constraining new development, and to prevent the deterioration of transport networks/services from
constraining economic performance in the LEP area.
The table illustrates the overall additionality, return on investment (RoI) and value for money benchmarks for
place based investment. It is based on BIS research on evaluation of interventions at a regional and sub-
regional level. More detailed sub-headings are used for the relevant objective covered within each of the two
priorities covered in this section. As with other sections, it should be noted that there is wide variation
between the RoI and value for money of different projects delivering the same broad type of intervention,
hence the range shown is wide.
35 Transport – an engine for growth, Department of Transport, August 2013
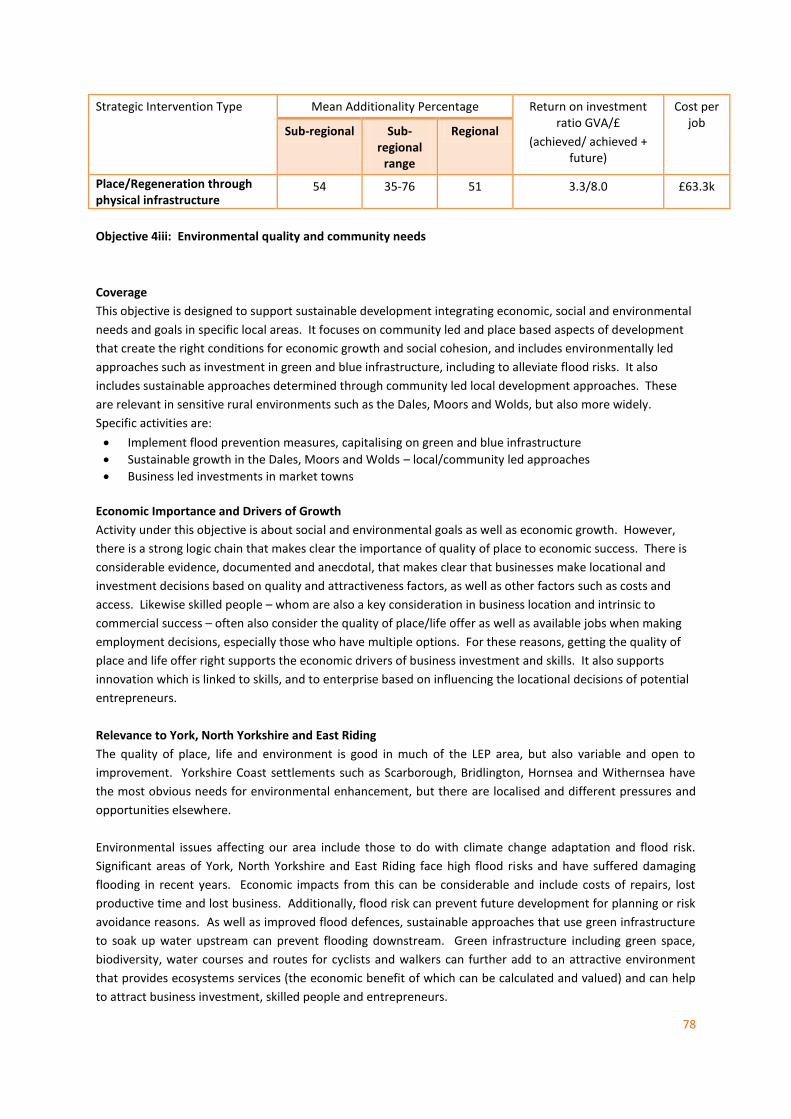
78
Strategic Intervention Type Mean Additionality Percentage Return on investment ratio GVA/£
(achieved/ achieved + future)
Cost per job
Sub-regional Sub-regional
range
Regional
Place/Regeneration through physical infrastructure
54 35-76 51 3.3/8.0 £63.3k
Objective 4iii: Environmental quality and community needs
Coverage
This objective is designed to support sustainable development integrating economic, social and environmental
needs and goals in specific local areas. It focuses on community led and place based aspects of development
that create the right conditions for economic growth and social cohesion, and includes environmentally led
approaches such as investment in green and blue infrastructure, including to alleviate flood risks. It also
includes sustainable approaches determined through community led local development approaches. These
are relevant in sensitive rural environments such as the Dales, Moors and Wolds, but also more widely.
Specific activities are:
Implement flood prevention measures, capitalising on green and blue infrastructure
Sustainable growth in the Dales, Moors and Wolds – local/community led approaches
Business led investments in market towns
Economic Importance and Drivers of Growth
Activity under this objective is about social and environmental goals as well as economic growth. However,
there is a strong logic chain that makes clear the importance of quality of place to economic success. There is
considerable evidence, documented and anecdotal, that makes clear that businesses make locational and
investment decisions based on quality and attractiveness factors, as well as other factors such as costs and
access. Likewise skilled people – whom are also a key consideration in business location and intrinsic to
commercial success – often also consider the quality of place/life offer as well as available jobs when making
employment decisions, especially those who have multiple options. For these reasons, getting the quality of
place and life offer right supports the economic drivers of business investment and skills. It also supports
innovation which is linked to skills, and to enterprise based on influencing the locational decisions of potential
entrepreneurs.
Relevance to York, North Yorkshire and East Riding
The quality of place, life and environment is good in much of the LEP area, but also variable and open to
improvement. Yorkshire Coast settlements such as Scarborough, Bridlington, Hornsea and Withernsea have
the most obvious needs for environmental enhancement, but there are localised and different pressures and
opportunities elsewhere.
Environmental issues affecting our area include those to do with climate change adaptation and flood risk.
Significant areas of York, North Yorkshire and East Riding face high flood risks and have suffered damaging
flooding in recent years. Economic impacts from this can be considerable and include costs of repairs, lost
productive time and lost business. Additionally, flood risk can prevent future development for planning or risk
avoidance reasons. As well as improved flood defences, sustainable approaches that use green infrastructure
to soak up water upstream can prevent flooding downstream. Green infrastructure including green space,
biodiversity, water courses and routes for cyclists and walkers can further add to an attractive environment
that provides ecosystems services (the economic benefit of which can be calculated and valued) and can help
to attract business investment, skilled people and entrepreneurs.
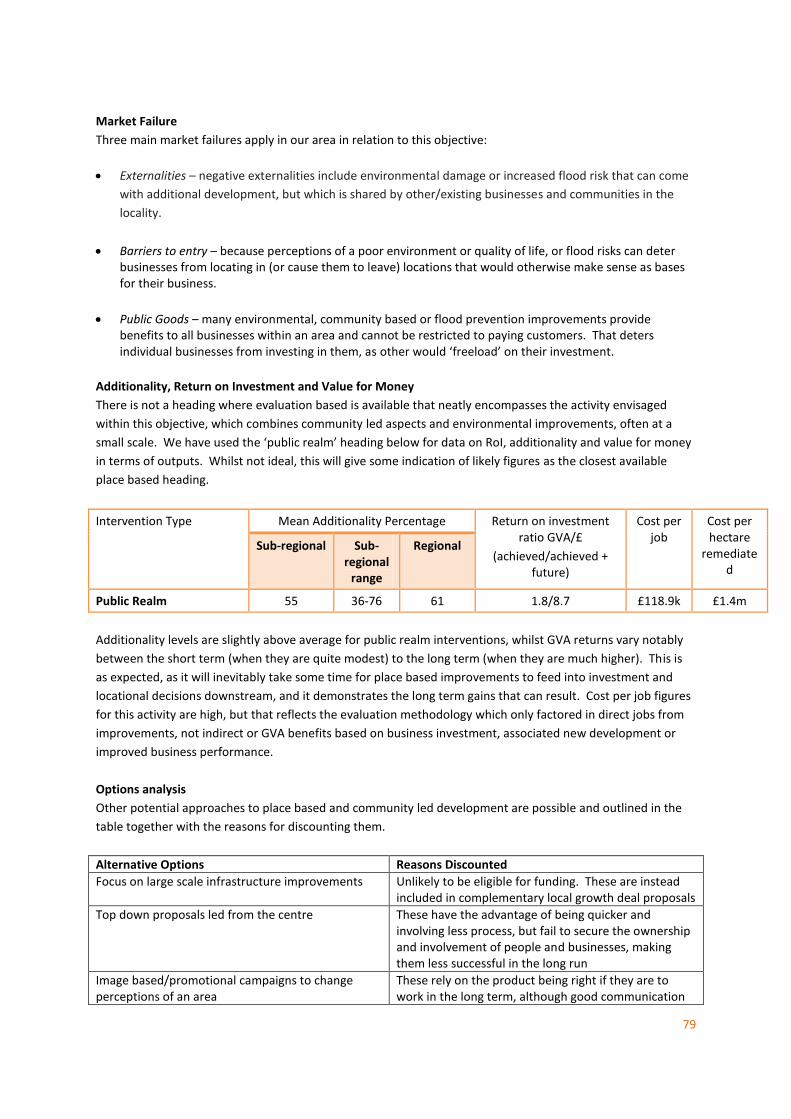
79
Market Failure
Three main market failures apply in our area in relation to this objective:
Externalities – negative externalities include environmental damage or increased flood risk that can come
with additional development, but which is shared by other/existing businesses and communities in the
locality.
Barriers to entry – because perceptions of a poor environment or quality of life, or flood risks can deter businesses from locating in (or cause them to leave) locations that would otherwise make sense as bases for their business.
Public Goods – many environmental, community based or flood prevention improvements provide benefits to all businesses within an area and cannot be restricted to paying customers. That deters individual businesses from investing in them, as other would ‘freeload’ on their investment.
Additionality, Return on Investment and Value for Money
There is not a heading where evaluation based is available that neatly encompasses the activity envisaged
within this objective, which combines community led aspects and environmental improvements, often at a
small scale. We have used the ‘public realm’ heading below for data on RoI, additionality and value for money
in terms of outputs. Whilst not ideal, this will give some indication of likely figures as the closest available
place based heading.
Intervention Type Mean Additionality Percentage Return on investment ratio GVA/£
(achieved/achieved + future)
Cost per job
Cost per hectare
remediated
Sub-regional Sub-regional
range
Regional
Public Realm 55 36-76 61 1.8/8.7 £118.9k £1.4m
Additionality levels are slightly above average for public realm interventions, whilst GVA returns vary notably
between the short term (when they are quite modest) to the long term (when they are much higher). This is
as expected, as it will inevitably take some time for place based improvements to feed into investment and
locational decisions downstream, and it demonstrates the long term gains that can result. Cost per job figures
for this activity are high, but that reflects the evaluation methodology which only factored in direct jobs from
improvements, not indirect or GVA benefits based on business investment, associated new development or
improved business performance.
Options analysis
Other potential approaches to place based and community led development are possible and outlined in the
table together with the reasons for discounting them.
Alternative Options Reasons Discounted
Focus on large scale infrastructure improvements Unlikely to be eligible for funding. These are instead included in complementary local growth deal proposals
Top down proposals led from the centre These have the advantage of being quicker and involving less process, but fail to secure the ownership and involvement of people and businesses, making them less successful in the long run
Image based/promotional campaigns to change perceptions of an area
These rely on the product being right if they are to work in the long term, although good communication

80
of existing strengths or improvements made does have a role.
No intervention - leave it to the market Leaves places and communities in a sub-optimal position for economic development and erodes growth prospects and social inclusion.
Objective 5iii: Transport that underpins growth and low carbon goals
Coverage
This objective focuses on enhancing transport to enable access to employment and economic growth, with
focus on low carbon modes and enhancements. These potentially include public transport, cycling, demand
reduction (e.g. through home working, workplace travel planning, or car sharing) and more efficient
management of the transport network to reduce emissions and congestion and enhance safety.
Investment to ensure the existing transport network supports growth
Economic Importance and Drivers of Growth
Activity under this objective combines low carbon, economic and employment goals. Transport is a key
enabler of economic growth as better access to workplaces allows businesses to recruit workers from a wider
catchment area, enhancing the skills they can employ. Equally good transport links widen the markets
businesses can serve, whilst reliability of transport services is important for employee commuting, securing
supplies and serving customers.
However, transport is a significant source of carbon emissions and a sizeable share of these emissions are
linked to the operation of the economy, whether linked to commuting or to business trade and operations.
Reducing the carbon intensity of travel, either by more efficient car and freight journeys, travel avoidance or
achieving switches to alternative modes can achieve environment goals at the same time as helping to prevent
congestion – in turn enabling economic development and growth.
Relevance to York, North Yorkshire and East Riding
North Yorkshire and the East Riding are large areas with a dispersed population, and sizeable distances
between many of their settlements. This can help to reduce congestion to some extent, but means that the
economies of many places suffer from their remoteness from raw materials, markets and workforces. North-
South connectivity is generally good, but East-West connections are often poor and there are specific
transport problems and pinch points in our major centres and off the major motorway network. It can also be
hard to travel to work or training from many smaller centres and rural areas, especially for those without
access to a car. Improving transport connections and options can therefore help to connect people to
economic opportunities and support business success.
Carbon emissions are above England average in seven of the nine unitary and district local authority areas in
our area, and around a third of carbon emission in the LEP area are from transport. This proportion is higher in
more rural and remote districts such as Hambleton and Richmondshire. Low carbon transport solutions are
hence an important part of meeting transport, environmental, social and economic growth goals.

81
Market Failure
The main market failures that apply in our area in relation to this objective are:
Externalities – negative externalities from motor transport include environmental damage in the form of
carbon emissions, air and noise pollution plus social impacts from traffic accidents or the severance effects
of major roads.
Barriers to entry – poor transport links and access can prevent firms locating in an area (or cause them to leave) even though that area may otherwise make sense a base for their business. This distorts market operation and acts to suppress the economies of more remote area.
Public Goods – it is difficult to directly charge for many aspects of transport provision, such as road and rail infrastructure and maintenance, traffic management or facilities for pedestrians and cyclists. These provide benefits to all businesses within an area and cannot easily be restricted to paying customers, deterring individual businesses from investing in them.
Additionality, Return on Investment and Value for Money
The BIS data sources we have used for additionality and value for money analysis have barely any coverage of
transport. Only one scheme is reported as evaluated - at the regional level and with an additionality score of
46%. Likewise we do not consider other place and infrastructure headings to be closely related enough to
transport to provide a useful indication of likely value for money, outputs or additionality. For those reasons
no data table is provided for this objective. Nevertheless, transport authorities are well versed in thorough
and complex transport appraisal mechanisms which assess the economic, social and environmental impacts of
individual schemes and their return on investment. We will ensure appropriate use is made of such appraisal
mechanisms in selecting transport based initiatives under this objective as we develop the programme for
delivery.
Options analysis
Other potential approaches to low carbon transport are possible and outlined in the table together with the
reasons for discounting them.
Alternative Options Reasons Discounted
Focus on all transport, not low carbon options Unlikely to be eligible for funding, plus counterproductive in terms of progress to a low carbon economy
Focus only on local level and wholly carbon neutral forms of transport – walking, cycling
These will be part of our approach, but would not be realistic options for longer journeys or for most business needs
Focus only on avoidance of travel through IT solutions and journey planning
These will be part of our approach, but travel will still be essential for many economic purposes and low carbon transport options are needed to meet these needs
No intervention - leave it to the market Leaves places and communities with major transport and access barriers to economic development and employment, and fails to address carbon emissions from transport
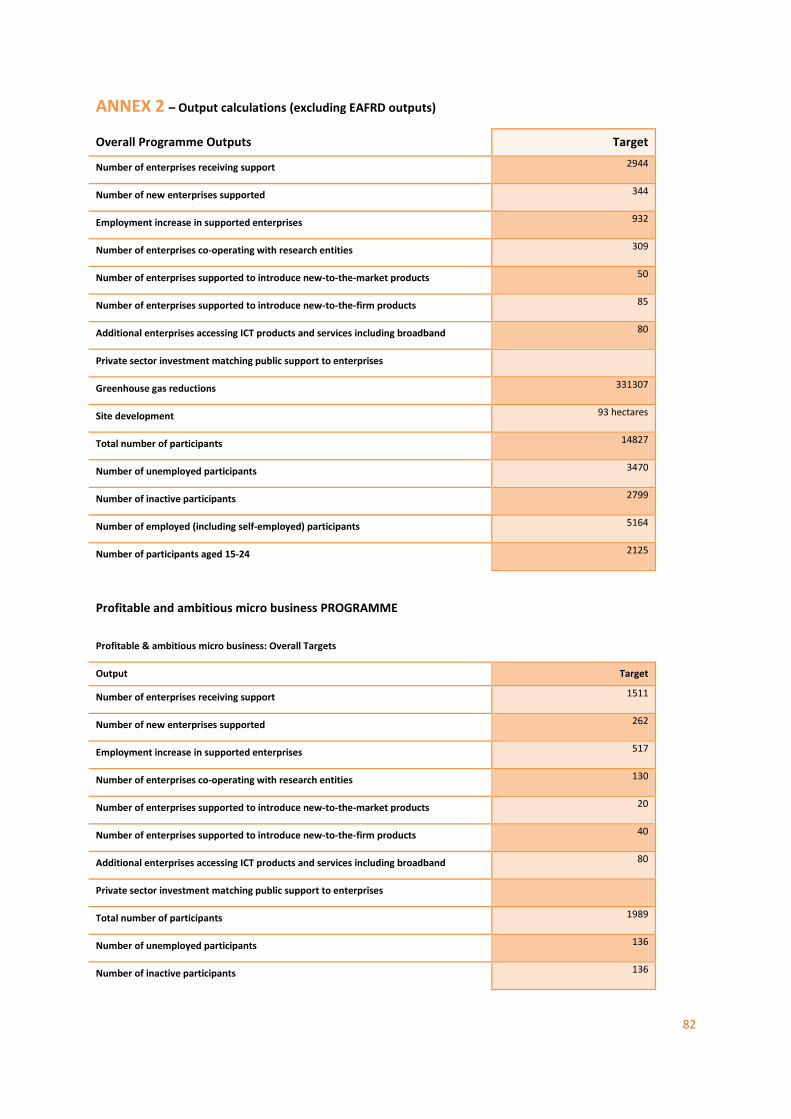
82
ANNEX 2 – Output calculations (excluding EAFRD outputs)
Overall Programme Outputs Target
Number of enterprises receiving support 2944
Number of new enterprises supported 344
Employment increase in supported enterprises 932
Number of enterprises co-operating with research entities 309
Number of enterprises supported to introduce new-to-the-market products 50
Number of enterprises supported to introduce new-to-the-firm products 85
Additional enterprises accessing ICT products and services including broadband 80
Private sector investment matching public support to enterprises
Greenhouse gas reductions 331307
Site development 93 hectares
Total number of participants 14827
Number of unemployed participants 3470
Number of inactive participants 2799
Number of employed (including self-employed) participants 5164
Number of participants aged 15-24 2125
Profitable and ambitious micro business PROGRAMME
Profitable & ambitious micro business: Overall Targets
Output Target
Number of enterprises receiving support 1511
Number of new enterprises supported 262
Employment increase in supported enterprises 517
Number of enterprises co-operating with research entities 130
Number of enterprises supported to introduce new-to-the-market products 20
Number of enterprises supported to introduce new-to-the-firm products 40
Additional enterprises accessing ICT products and services including broadband 80
Private sector investment matching public support to enterprises
Total number of participants 1989
Number of unemployed participants 136
Number of inactive participants 136
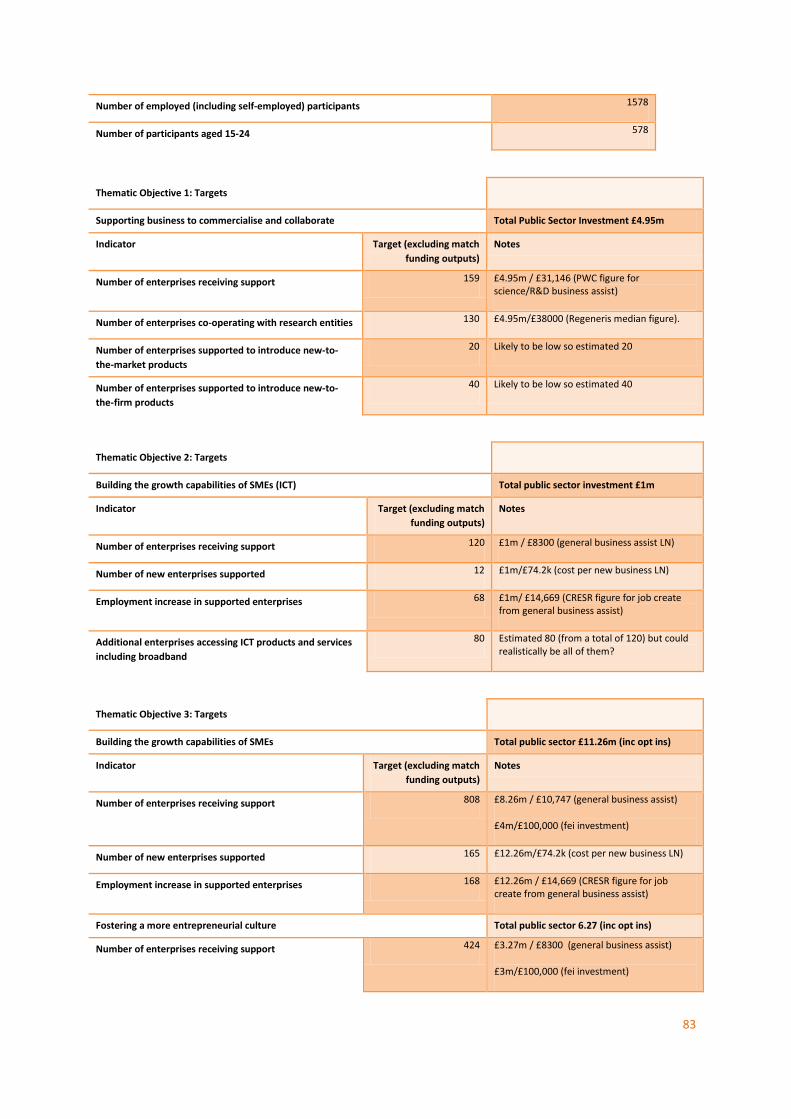
83
Number of employed (including self-employed) participants 1578
Number of participants aged 15-24 578
Thematic Objective 1: Targets
Supporting business to commercialise and collaborate Total Public Sector Investment £4.95m
Indicator Target (excluding match
funding outputs)
Notes
Number of enterprises receiving support 159 £4.95m / £31,146 (PWC figure for science/R&D business assist)
Number of enterprises co-operating with research entities 130 £4.95m/£38000 (Regeneris median figure).
Number of enterprises supported to introduce new-to-
the-market products
20 Likely to be low so estimated 20
Number of enterprises supported to introduce new-to-
the-firm products
40 Likely to be low so estimated 40
Thematic Objective 2: Targets
Building the growth capabilities of SMEs (ICT) Total public sector investment £1m
Indicator Target (excluding match
funding outputs)
Notes
Number of enterprises receiving support 120 £1m / £8300 (general business assist LN)
Number of new enterprises supported 12 £1m/£74.2k (cost per new business LN)
Employment increase in supported enterprises 68 £1m/ £14,669 (CRESR figure for job create from general business assist)
Additional enterprises accessing ICT products and services
including broadband
80 Estimated 80 (from a total of 120) but could realistically be all of them?
Thematic Objective 3: Targets
Building the growth capabilities of SMEs Total public sector £11.26m (inc opt ins)
Indicator Target (excluding match
funding outputs)
Notes
Number of enterprises receiving support 808 £8.26m / £10,747 (general business assist)
£4m/£100,000 (fei investment)
Number of new enterprises supported 165 £12.26m/£74.2k (cost per new business LN)
Employment increase in supported enterprises 168 £12.26m / £14,669 (CRESR figure for job create from general business assist)
Fostering a more entrepreneurial culture Total public sector 6.27 (inc opt ins)
Number of enterprises receiving support 424 £3.27m / £8300 (general business assist)
£3m/£100,000 (fei investment)
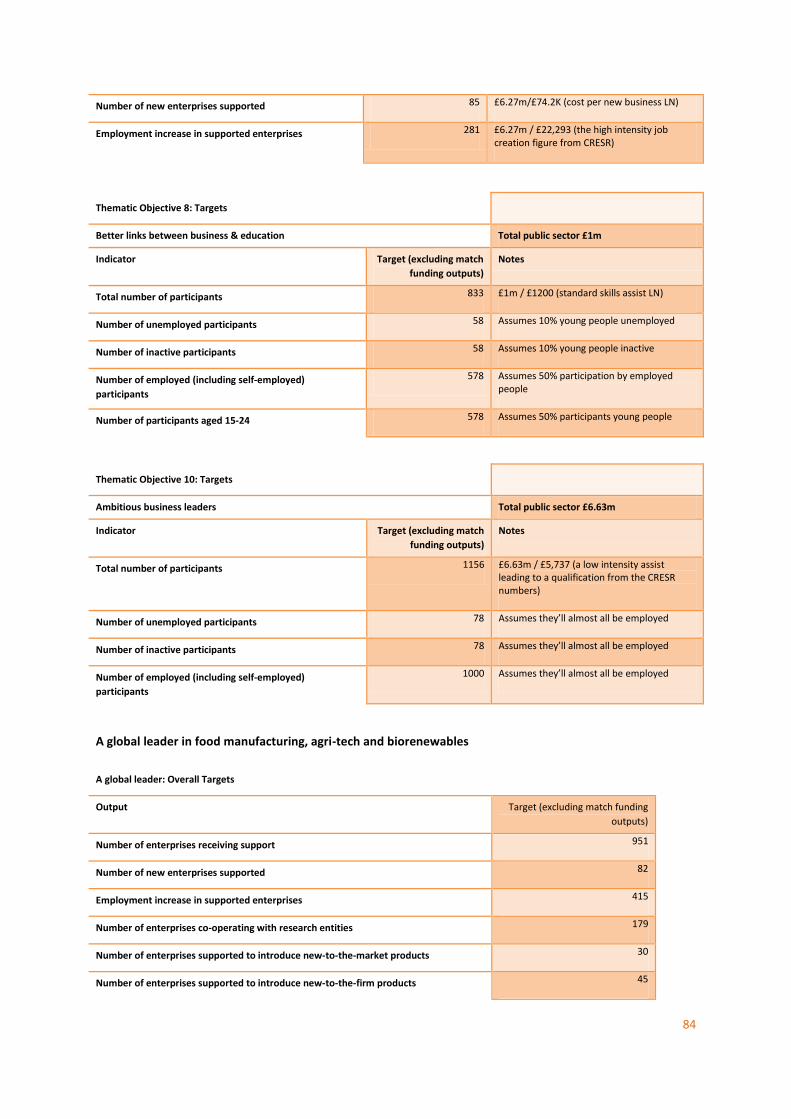
84
Number of new enterprises supported 85 £6.27m/£74.2K (cost per new business LN)
Employment increase in supported enterprises 281 £6.27m / £22,293 (the high intensity job creation figure from CRESR)
Thematic Objective 8: Targets
Better links between business & education Total public sector £1m
Indicator Target (excluding match
funding outputs)
Notes
Total number of participants 833 £1m / £1200 (standard skills assist LN)
Number of unemployed participants 58 Assumes 10% young people unemployed
Number of inactive participants 58 Assumes 10% young people inactive
Number of employed (including self-employed)
participants
578 Assumes 50% participation by employed people
Number of participants aged 15-24 578 Assumes 50% participants young people
Thematic Objective 10: Targets
Ambitious business leaders Total public sector £6.63m
Indicator Target (excluding match
funding outputs)
Notes
Total number of participants 1156 £6.63m / £5,737 (a low intensity assist leading to a qualification from the CRESR numbers)
Number of unemployed participants 78 Assumes they’ll almost all be employed
Number of inactive participants 78 Assumes they’ll almost all be employed
Number of employed (including self-employed)
participants
1000 Assumes they’ll almost all be employed
A global leader in food manufacturing, agri-tech and biorenewables
A global leader: Overall Targets
Output Target (excluding match funding
outputs)
Number of enterprises receiving support 951
Number of new enterprises supported 82
Employment increase in supported enterprises 415
Number of enterprises co-operating with research entities 179
Number of enterprises supported to introduce new-to-the-market products 30
Number of enterprises supported to introduce new-to-the-firm products 45
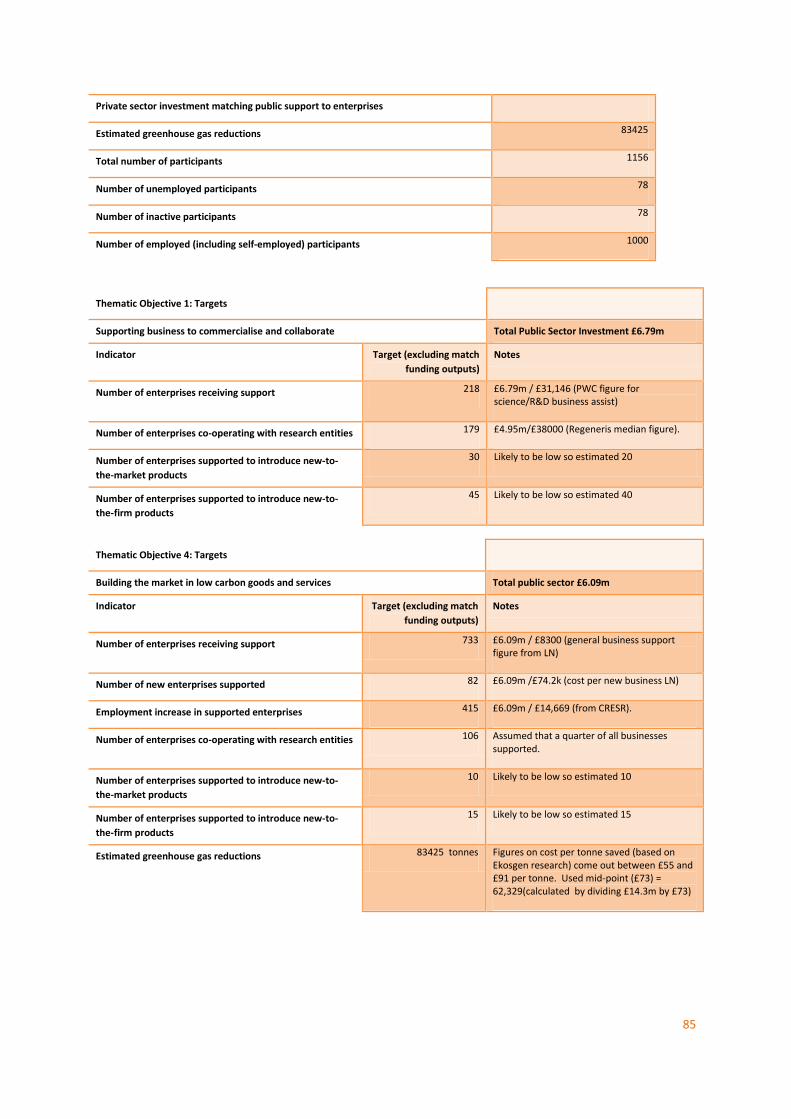
85
Private sector investment matching public support to enterprises
Estimated greenhouse gas reductions 83425
Total number of participants 1156
Number of unemployed participants 78
Number of inactive participants 78
Number of employed (including self-employed) participants 1000
Thematic Objective 1: Targets
Supporting business to commercialise and collaborate Total Public Sector Investment £6.79m
Indicator Target (excluding match
funding outputs)
Notes
Number of enterprises receiving support 218 £6.79m / £31,146 (PWC figure for science/R&D business assist)
Number of enterprises co-operating with research entities 179 £4.95m/£38000 (Regeneris median figure).
Number of enterprises supported to introduce new-to-
the-market products
30 Likely to be low so estimated 20
Number of enterprises supported to introduce new-to-
the-firm products
45 Likely to be low so estimated 40
Thematic Objective 4: Targets
Building the market in low carbon goods and services Total public sector £6.09m
Indicator Target (excluding match
funding outputs)
Notes
Number of enterprises receiving support 733 £6.09m / £8300 (general business support figure from LN)
Number of new enterprises supported 82 £6.09m /£74.2k (cost per new business LN)
Employment increase in supported enterprises 415 £6.09m / £14,669 (from CRESR).
Number of enterprises co-operating with research entities 106 Assumed that a quarter of all businesses supported.
Number of enterprises supported to introduce new-to-
the-market products
10 Likely to be low so estimated 10
Number of enterprises supported to introduce new-to-
the-firm products
15 Likely to be low so estimated 15
Estimated greenhouse gas reductions 83425 tonnes Figures on cost per tonne saved (based on Ekosgen research) come out between £55 and £91 per tonne. Used mid-point (£73) = 62,329(calculated by dividing £14.3m by £73)
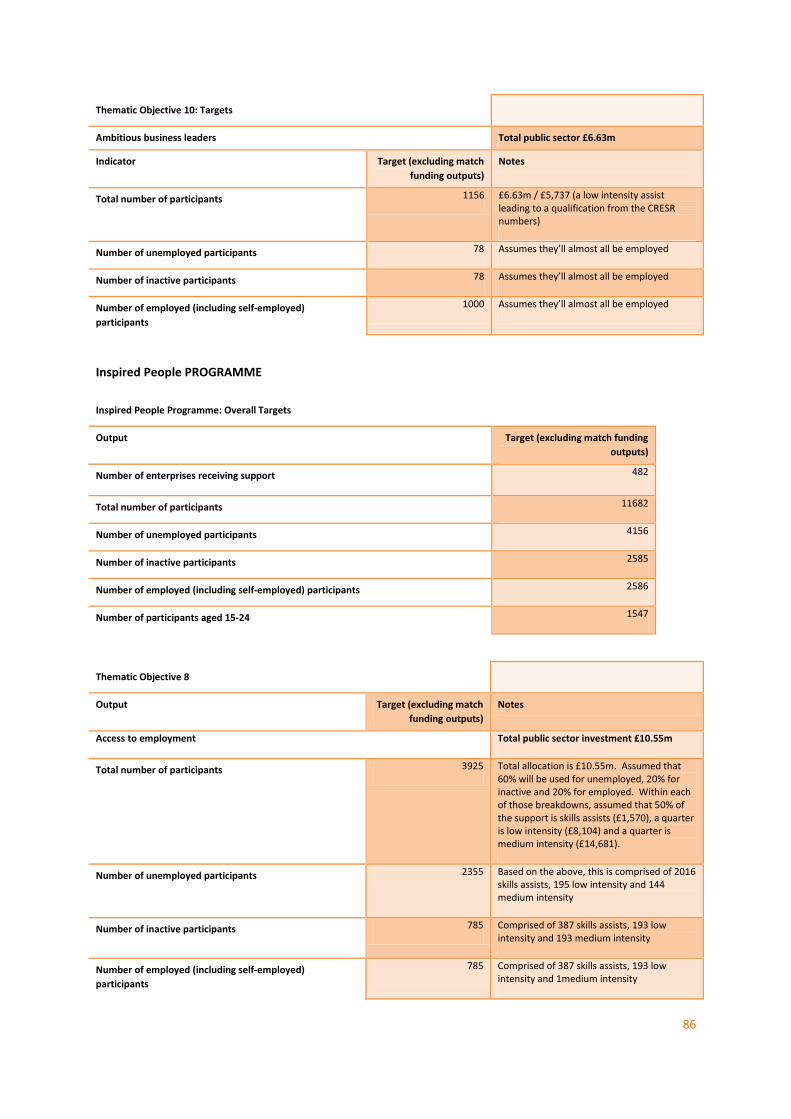
86
Thematic Objective 10: Targets
Ambitious business leaders Total public sector £6.63m
Indicator Target (excluding match
funding outputs)
Notes
Total number of participants 1156 £6.63m / £5,737 (a low intensity assist leading to a qualification from the CRESR numbers)
Number of unemployed participants 78 Assumes they’ll almost all be employed
Number of inactive participants 78 Assumes they’ll almost all be employed
Number of employed (including self-employed)
participants
1000 Assumes they’ll almost all be employed
Inspired People PROGRAMME
Inspired People Programme: Overall Targets
Output Target (excluding match funding
outputs)
Number of enterprises receiving support 482
Total number of participants 11682
Number of unemployed participants 4156
Number of inactive participants 2585
Number of employed (including self-employed) participants 2586
Number of participants aged 15-24 1547
Thematic Objective 8
Output Target (excluding match
funding outputs)
Notes
Access to employment Total public sector investment £10.55m
Total number of participants 3925 Total allocation is £10.55m. Assumed that 60% will be used for unemployed, 20% for inactive and 20% for employed. Within each of those breakdowns, assumed that 50% of the support is skills assists (£1,570), a quarter is low intensity (£8,104) and a quarter is medium intensity (£14,681).
Number of unemployed participants 2355 Based on the above, this is comprised of 2016 skills assists, 195 low intensity and 144 medium intensity
Number of inactive participants 785 Comprised of 387 skills assists, 193 low intensity and 193 medium intensity
Number of employed (including self-employed)
participants
785 Comprised of 387 skills assists, 193 low intensity and 1medium intensity
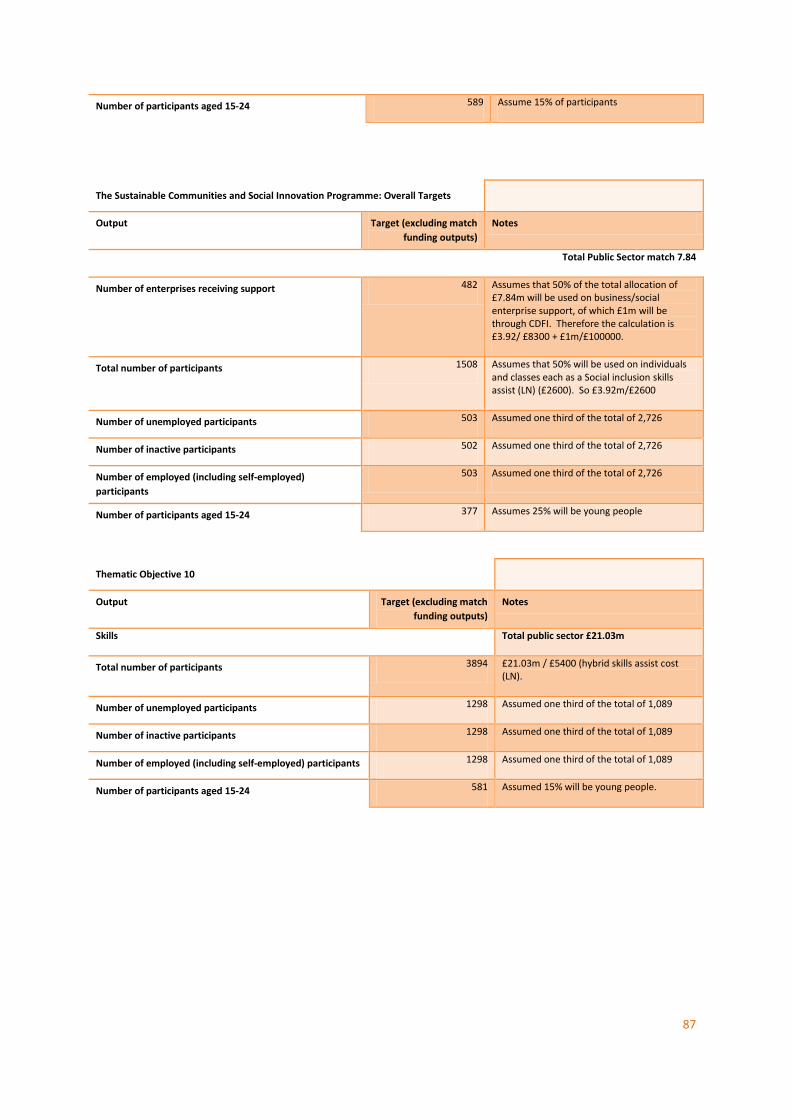
87
Number of participants aged 15-24 589 Assume 15% of participants
The Sustainable Communities and Social Innovation Programme: Overall Targets
Output Target (excluding match
funding outputs)
Notes
Total Public Sector match 7.84
Number of enterprises receiving support 482 Assumes that 50% of the total allocation of £7.84m will be used on business/social enterprise support, of which £1m will be through CDFI. Therefore the calculation is £3.92/ £8300 + £1m/£100000.
Total number of participants 1508 Assumes that 50% will be used on individuals and classes each as a Social inclusion skills assist (LN) (£2600). So £3.92m/£2600
Number of unemployed participants 503 Assumed one third of the total of 2,726
Number of inactive participants 502 Assumed one third of the total of 2,726
Number of employed (including self-employed)
participants
503 Assumed one third of the total of 2,726
Number of participants aged 15-24 377 Assumes 25% will be young people
Thematic Objective 10
Output Target (excluding match
funding outputs)
Notes
Skills Total public sector £21.03m
Total number of participants 3894 £21.03m / £5400 (hybrid skills assist cost (LN).
Number of unemployed participants 1298 Assumed one third of the total of 1,089
Number of inactive participants 1298 Assumed one third of the total of 1,089
Number of employed (including self-employed) participants 1298 Assumed one third of the total of 1,089
Number of participants aged 15-24 581 Assumed 15% will be young people.
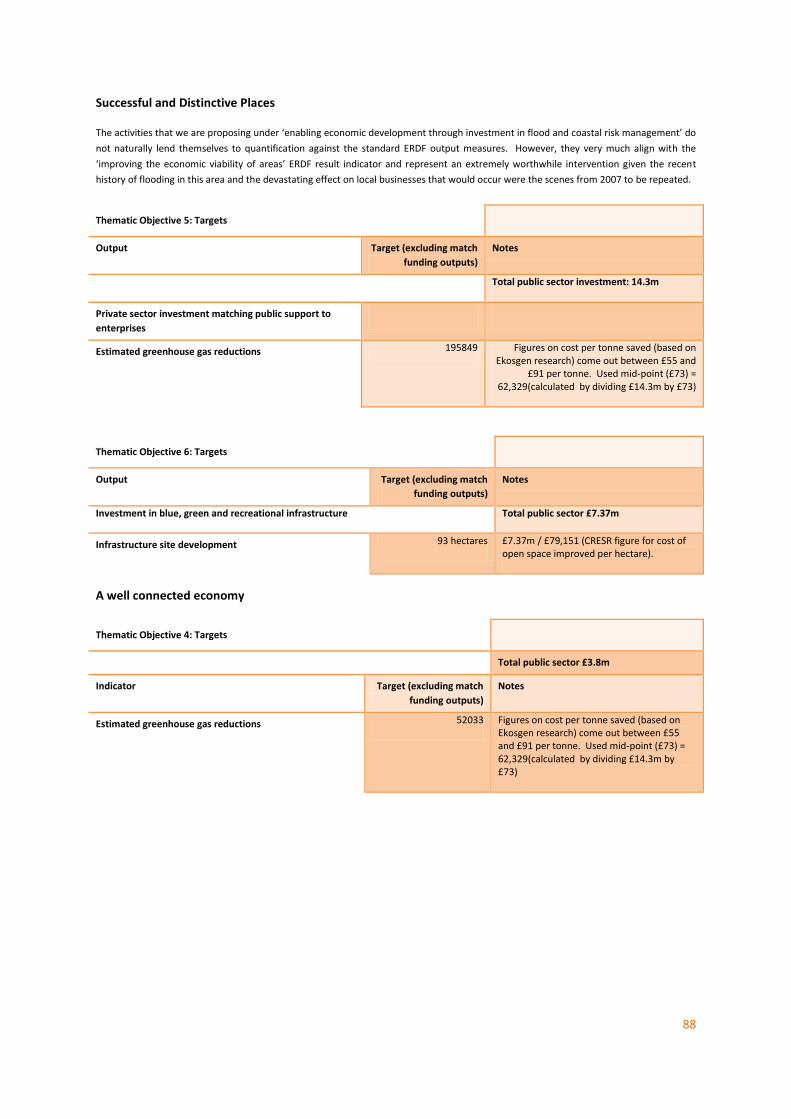
88
Successful and Distinctive Places
The activities that we are proposing under ‘enabling economic development through investment in flood and coastal risk management’ do
not naturally lend themselves to quantification against the standard ERDF output measures. However, they very much align with the
‘improving the economic viability of areas’ ERDF result indicator and represent an extremely worthwhile intervention given the recent
history of flooding in this area and the devastating effect on local businesses that would occur were the scenes from 2007 to be repeated.
Thematic Objective 5: Targets
Output Target (excluding match
funding outputs)
Notes
Total public sector investment: 14.3m
Private sector investment matching public support to
enterprises
Estimated greenhouse gas reductions 195849 Figures on cost per tonne saved (based on Ekosgen research) come out between £55 and
£91 per tonne. Used mid-point (£73) = 62,329(calculated by dividing £14.3m by £73)
Thematic Objective 6: Targets
Output Target (excluding match
funding outputs)
Notes
Investment in blue, green and recreational infrastructure Total public sector £7.37m
Infrastructure site development 93 hectares £7.37m / £79,151 (CRESR figure for cost of open space improved per hectare).
A well connected economy
Thematic Objective 4: Targets
Total public sector £3.8m
Indicator Target (excluding match
funding outputs)
Notes
Estimated greenhouse gas reductions 52033 Figures on cost per tonne saved (based on Ekosgen research) come out between £55 and £91 per tonne. Used mid-point (£73) = 62,329(calculated by dividing £14.3m by £73)