Embed Size (px)
Citation preview

September 2014
Economic and Financial Affairs
BUSINESS AND CONSUMER SURVEY RESULTS
60
70
80
90
100
110
120
1990 1991 1992 1993 1994 1995 1996 1997 1998 1999 2000 2001 2002 2003 2004 2005 2006 2007 2008 2009 2010 2011 2012 2013 2014
Graph 1: Economic sentiment indicator (s.a.)
Euro Area (EA)
European Union (EU)
source: European Commission serv ices
long-term average (1990-2013) = 100
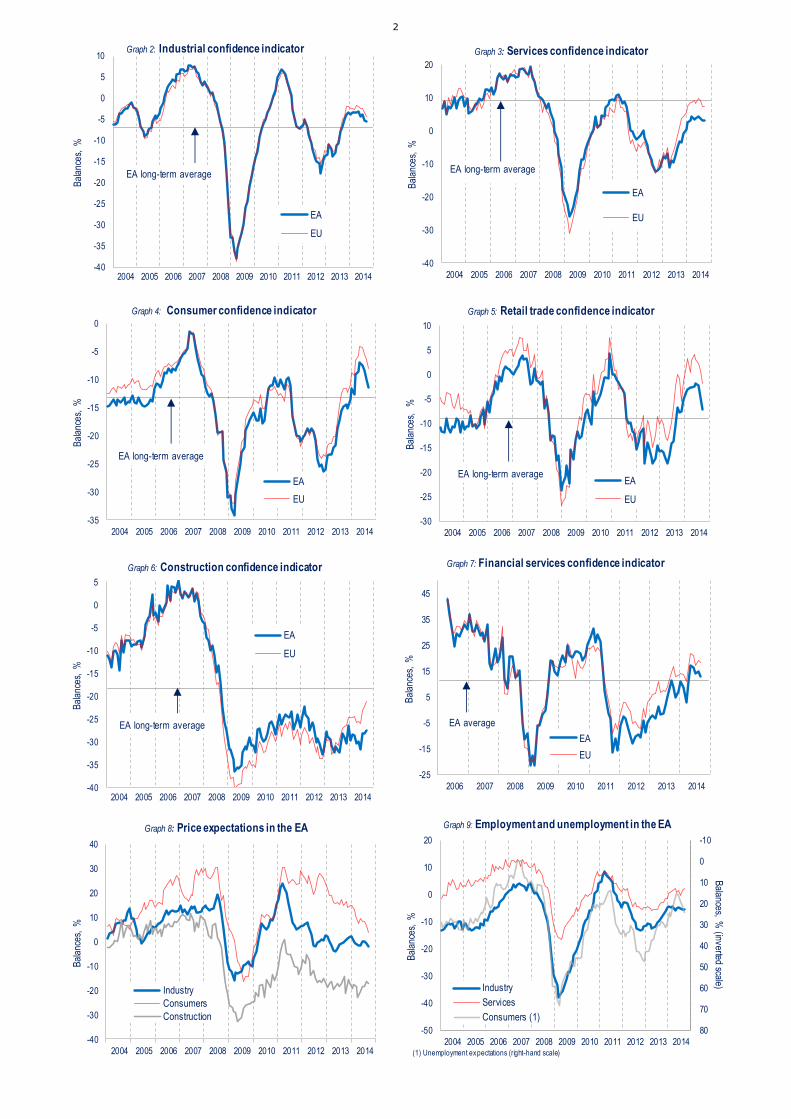
September 2014: Economic Sentiment decreases in the euro area and the EU
In September the Economic Sentiment Indicator (ESI) decreased in both the euro area (by 0.7 points to 99.9) and the EU (by 1.0 point to 103.6). The euro-area indicator fell slightly below its long-term average of 100, which it
had surpassed only in December 2013. The negative developments in the EU and the euro area indicator mainly reflect more cautious views of consumers and the retail trade sector.
Euro area developments
In the euro area, lower readings of retail trade and consumer confidence were only partly offset by positive signals
from the construction sector. Industry and services confidence remained virtually unchanged. Amongst the largest euro-area economies, sentiment increased only in Spain (+0.5), while it remained broadly flat in the Netherlands (+0.3), France (+0.2) and Germany (-0.3) and shed in Italy (-0.9).
The virtually flat development in industry confidence (-0.2) resulted from managers' improved production
expectations being counter-balanced by grimmer views on the stocks of finished products and the current level of
overall order books. The assessments of the level of export order books and past production, which do not enter the calculation of the confidence indicator, worsened significantly. The broadly unchanged reading of services confidence compared to the previous month (+0.1) was due to improved demand expectations being outweighed by managers' more negative stance on past demand and unchanged appraisals of the past business situation.
Consumer confidence booked the fourth month-on-month decline in a row (-1.4) propelled by consumers' increased pessimism about future unemployment, the future general economic situation and, less so, the level of future savings. Consumers' expected financial situation remained unchanged. The sharp drop in retail trade confidence (-2.6) owed to more negative assessments of all components of the indicator, namely the expected and present business situation, as well as the adequacy of the volume of stocks. Construction confidence brightened (+0.7) as a consequence of significantly improved assessments of the level of order books in combination with broadly unchanged employment expectations. Dropping by 1.9 points, financial services confidence (not included in the ESI) continued the broad downward trend observed over the last 3 months. Clearly less positive appraisals of the past business situation and past demand were mitigated somewhat by
broadly unchanged demand expectations.
Employment plans were only revised downwards in retail trade, while they remained virtually unchanged in
industry and construction and even improved in services. Selling price expectations decreased in all surveyed business sectors (industry, services, construction and, most so, retail trade). Also consumer price expectations saw significant downward revisions.
EU developments
With sentiment slipping in the largest EU economies outside the euro area (UK: -0.9, Poland: -0.4, Sweden: -2.6),
the EU headline indicator shed somewhat more in the EU (-1.0) than in the euro area. In line with euro-area developments, confidence only strengthened in the construction sector, while remaining unchanged in services and fading in the retail trade and financial sector, as well as among consumers. Slipping industry confidence (-1.0) was the main sectoral difference compared to euro-area results.
Euro-area consumers' gloomier unemployment expectations were paralleled at EU-level, as were the downward
revision of employment plans in the retail trade sector and the broadly unchanged plans in industry. By contrast, employment plans in construction saw upward revisions rather than unchanged readings, whereas they were corrected downwards rather than upwards in services. EU price expectations were in line with those for the euro area, except for the EU construction sector, where price expectations remained virtually unchanged.
2
-40
-35
-30
-25
-20
-15
-10
-5
0
5
10
2004 2005 2006 2007 2008 2009 2010 2011 2012 2013 2014
Bal
ance
s, %
Graph 2: Industrial confidence indicator
EA
EU
EA long-term average
-40
-30
-20
-10
0
10
20
2004 2005 2006 2007 2008 2009 2010 2011 2012 2013 2014
Bal
ance
s, %
Graph 3: Services confidence indicator
EA
EU
EA long-term average
-35
-30
-25
-20
-15
-10
-5
0
2004 2005 2006 2007 2008 2009 2010 2011 2012 2013 2014
Bal
ance
s, %
Graph 4: Consumer confidence indicator
EA
EU
EA long-term average
-30
-25
-20
-15
-10
-5
0
5
10
2004 2005 2006 2007 2008 2009 2010 2011 2012 2013 2014
Bal
ance
s,
%
Graph 5: Retail trade confidence indicator
EA
EU
EA long-term average
-40
-35
-30
-25
-20
-15
-10
-5
0
5
2004 2005 2006 2007 2008 2009 2010 2011 2012 2013 2014
Bal
ance
s, %
Graph 6: Construction confidence indicator
EA
EU
EA long-term average
-25
-15
-5
5
15
25
35
45
2006 2007 2008 2009 2010 2011 2012 2013 2014
Bal
ance
s, %
Graph 7: Financial services confidence indicator
EA
EU
EA average
-40
-30
-20
-10
0
10
20
30
40
2004 2005 2006 2007 2008 2009 2010 2011 2012 2013 2014
Bal
ance
s, %
Graph 8: Price expectations in the EA
Industry
Consumers
Construction
-10
0
10
20
30
40
50
60
70
80-50
-40
-30
-20
-10
0
10
20
2004 2005 2006 2007 2008 2009 2010 2011 2012 2013 2014
Balances, %
(inverted scale)
Bal
ance
s, %
Graph 9: Employment and unemployment in the EA
Industry
Services
Consumers (1)
(1) Unemployment expectations (right-hand scale)

3
TABLE 1*: Indicators of confidence and economic sentiment (s.a.)
2013 2014
Date Value Date Value Oct Nov Dec Jan Feb Mar Apr May Jun Jul Aug Sep
EU 1. Industry 03-09 -38.7 -7.1 06-07 7.5 -4.3 -2.0 -2.0 -2.5 -2.4 -2.7 -1.8 -1.9 -2.4 -2.6 -3.2 -4.2
2. Services 03-09 -31.1 8.5 06-98 33.5 3.6 4.2 5.6 7.3 8.5 8.4 8.9 8.2 9.8 8.9 7.4 7.4
3. Consumer 03-09 -32.2 -12.1 08-00 1.6 -11.6 -12.3 -10.9 -8.7 -9.3 -6.6 -5.7 -4.0 -4.3 -5.5 -6.4 -8.0
4. Retail trade 12-08 -26.8 -6.4 04-07 7.7 -0.9 -5.5 -1.5 1.9 3.3 0.5 2.9 4.1 3.0 2.2 1.0 -1.8
5. Construction 06-93 -45.3 -19.6 12-06 3.8 -26.7 -26.4 -24.8 -24.6 -24.7 -24.5 -25.9 -25.6 -26.0 -23.0 -22.3 -21.2
= 6. ESI 03-09 67.2 100.0 05-00 117.1 101.9 102.4 103.8 104.7 105.0 105.3 106.3 106.5 106.4 105.8 104.6 103.6
7. Financial services (n) 01-09 -20.0 13.1 04-06 43.3 16.7 12.7 13.2 14.2 13.8 10.9 16.1 21.9 20.8 17.1 19.0 18.3
EA 1. Industry 03-09 -38.1 -6.9 04-07 7.9 -5.0 -3.9 -3.4 -3.8 -3.5 -3.3 -3.5 -3.1 -4.3 -3.8 -5.3 -5.5
2. Services 03-09 -26.1 9.0 08-98 35.4 -3.6 -0.8 0.4 2.4 3.3 4.5 3.5 3.8 4.4 3.6 3.1 3.2
3. Consumer 03-09 -34.3 -13.2 05-00 2.4 -14.4 -15.3 -13.5 -11.6 -12.7 -9.2 -8.6 -7.1 -7.5 -8.3 -10.0 -11.4
4. Retail trade 01-93 -24.9 -9.1 06-90 5.2 -7.7 -7.6 -5.1 -3.5 -3.1 -2.6 -2.6 -2.5 -1.9 -2.3 -4.6 -7.2
5. Construction 09-93 -46.0 -18.3 02-90 6.0 -29.1 -30.4 -26.4 -29.8 -28.5 -28.7 -30.4 -30.1 -31.7 -28.2 -28.4 -27.7
= 6. ESI 03-09 70.1 100.0 05-00 118.6 98.1 98.8 100.4 101.0 101.2 102.5 102.0 102.6 102.1 102.2 100.6 99.9
7. Financial services (n) 01-09 -21.8 11.3 04-06 42.6 8.6 4.9 6.9 11.0 8.5 2.8 10.9 17.1 16.4 14.2 14.6 12.7
BE 1. Industry 03-09 -33.8 -9.7 06-07 6.9 -10.3 -4.7 -6.3 -5.2 -2.9 -3.2 -4.5 -6.3 -6.0 -7.5 -7.2 -6.5
2. Services 04-09 -42.9 11.4 08-07 32.2 11.3 14.7 12.3 12.6 20.5 12.7 11.5 19.2 16.1 14.2 15.4 9.5
3. Consumer 02-09 -26.5 -7.0 12-00 16.2 -8.1 -7.1 -5.3 -2.6 -4.5 -6.5 -7.6 -5.2 -5.8 -7.6 -8.1 -9.6
4. Retail trade 01-09 -27.9 -3.9 10-10 13.7 -7.0 -5.2 1.3 0.4 5.4 8.5 5.1 0.7 3.4 -6.8 -7.2 -6.7
5. Construction 11-95 -35.1 -10.0 02-90 9.7 -20.2 -21.3 -23.6 -24.4 -19.4 -20.2 -21.5 -22.1 -21.6 -20.6 -19.5 -20.3
= 6. ESI 03-09 70.9 100.0 06-07 116.6 99.3 103.5 102.8 103.4 107.2 104.6 102.2 103.7 103.6 101.6 101.8 99.5
BG 1. Industry 06-93 -32.1 -6.4 01-08 12.3 -11.2 -12.5 -11.5 -8.7 -8.0 -7.9 -8.3 -2.2 -0.7 -1.9 -0.4 -2.5
2. Services 06-10 -13.6 10.3 03-07 33.4 3.3 3.9 8.7 9.4 8.6 10.2 8.1 10.2 8.4 7.9 1.0 -0.7
3. Consumer 04-09 -50.1 -33.9 08-01 -13.0 -38.1 -38.0 -38.9 -37.2 -34.9 -32.5 -30.5 -31.1 -36.0 -35.2 -36.9 -39.8
4. Retail trade 07-09 -14.8 14.5 08-94 31.8 9.5 11.3 9.5 11.0 12.3 18.6 17.8 14.0 15.2 11.9 5.8 5.3
5. Construction 10-09 -56.0 -25.2 11-07 23.9 -33.2 -32.0 -33.5 -31.6 -33.0 -31.9 -33.0 -30.4 -33.7 -32.2 -31.1 -33.7
= 6. ESI 05-93 72.0 100.0 04-07 120.0 95.6 95.2 96.4 98.8 99.9 101.3 100.8 104.1 102.9 102.3 99.8 96.9
CZ 1. Industry 02-09 -35.6 2.1 06-00 29.8 -0.9 3.5 1.2 -0.6 1.6 2.3 2.4 3.5 2.7 1.9 2.8 4.2
2. Services 09-09 6.4 33.5 02-07 52.6 26.1 25.8 27.9 26.6 25.5 27.8 25.8 24.8 29.0 27.7 29.9 30.1
3. Consumer 03-98 -35.8 -12.8 10-06 3.9 -13.6 -9.8 -10.8 -8.4 -8.4 -5.4 -2.6 -3.4 -1.6 -1.7 -5.0 -6.3
4. Retail trade 02-99 -1.3 14.3 11-07 29.5 5.7 5.5 11.7 9.4 11.9 12.1 14.6 12.5 13.5 15.4 11.5 12.6
5. Construction 02-99 -54.9 -20.9 01-05 5.3 -47.7 -48.1 -47.5 -47.4 -42.6 -44.0 -39.3 -38.9 -37.0 -36.4 -31.5 -27.6
= 6. ESI 01-99 73.2 100.0 02-07 118.8 95.4 97.7 98.0 96.9 98.1 100.0 100.3 99.7 101.8 101.0 101.5 102.3
DK 1. Industry 02-09 -34.5 -0.7 09-94 16.7 7.5 9.5 4.8 10.9 5.7 11.6 10.5 4.0 -2.9 -9.9 -2.8 -7.0
2. Services 02-13 -10.4 4.8 05-10 28.4 8.7 6.2 6.7 7.0 1.7 1.6 -0.2 6.9 6.8 6.1 7.1 4.3
3. Consumer 10-90 -11.8 7.8 06-14 20.4 16.9 14.9 15.4 17.6 17.2 14.0 13.6 17.4 20.4 19.5 19.8 14.5
4. Retail trade 11-11 -11.6 5.2 09-14 15.6 14.0 10.5 8.1 11.0 6.9 1.3 2.4 3.8 13.5 4.2 9.4 15.6
5. Construction 10-09 -50.0 -10.0 11-06 24.2 -14.5 -15.2 -8.0 -2.9 -2.6 -4.4 -6.9 -12.0 -9.6 -7.4 -7.5 -10.0
= 6. ESI 02-09 68.7 100.0 05-10 117.3 109.2 107.3 105.4 110.3 104.9 106.3 104.9 105.1 103.0 98.8 104.6 99.5
DE 1. Industry 03-09 -42.5 -7.7 02-11 16.0 0.4 1.1 1.0 0.1 0.1 0.9 -0.1 1.2 -1.3 -0.3 -2.7 -3.1
2. Services 12-02 -19.9 17.9 03-99 50.1 10.2 12.1 12.7 16.5 17.7 15.0 14.8 14.6 15.0 12.1 10.6 12.5
3. Consumer 04-09 -32.9 -8.6 11-10 10.9 -4.2 -2.1 -2.2 -0.8 -0.7 2.3 3.1 5.5 4.3 3.9 0.3 -1.1
4. Retail trade 01-03 -37.4 -11.6 12-90 22.3 -2.4 -4.0 -3.7 1.2 2.1 1.2 0.2 -1.1 1.1 -4.1 -4.4 -7.2
5. Construction 12-02 -55.4 -28.3 02-90 2.2 -3.0 -3.0 -2.3 -7.0 -5.4 -7.0 -9.7 -12.4 -9.9 -12.0 -13.0 -11.5
= 6. ESI 03-09 72.4 100.0 08-90 119.4 104.9 105.7 106.0 106.7 107.1 107.5 107.1 107.8 106.5 106.0 104.1 103.8
EE 1. Industry 03-09 -39.1 2.8 12-06 28.5 1.0 -0.2 -3.5 3.8 1.4 -2.3 -1.2 -2.0 -3.9 -2.0 -0.5 -3.2
2. Services 02-09 -50.3 11.0 01-06 38.3 13.1 16.0 13.9 15.8 14.4 17.2 14.1 0.4 -0.7 -8.7 -1.6 2.1
3. Consumer 04-93 -56.3 -16.6 04-06 12.8 -2.8 -1.5 -2.3 -3.9 -2.6 -4.3 -2.7 -5.0 -3.7 -1.4 -4.0 -5.7
4. Retail trade 06-09 -45.6 7.7 04-07 35.6 9.2 11.0 18.5 14.2 16.3 16.9 16.2 14.1 13.0 10.3 13.8 10.0
5. Construction 04-09 -76.0 -1.5 05-06 48.8 -9.9 -14.7 -19.9 -19.1 -24.5 -21.7 -16.2 -20.0 -29.9 -30.2 -23.6 -24.2
= 6. ESI 03-09 68.6 100.0 09-06 117.7 103.3 103.7 102.7 104.8 103.7 102.6 102.9 99.2 98.5 97.8 99.9 99.7
IE 1. Industry : : : : : : : : : : : : : : : : :
2. Services : : : : : : : : : : : : : : : : :
3. Consumer 05-09 -32.1 -7.0 01-00 19.1 2.8 3.4 9.9 8.4 10.8 11.5 12.2 10.0 6.9 11.3 12.0 13.9
4. Retail trade : : : : : : : : : : : : : : : : :
5. Construction : : : : : : : : : : : : : : : : :
= 6. ESI : : : : : : : : : : : : : : : : :
EL 1. Industry 03-09 -36.6 -4.0 03-00 13.3 -9.9 -11.0 -10.6 -11.2 -7.1 -4.1 -8.9 -4.9 1.3 1.5 0.3 -5.4
2. Services 10-12 -46.0 10.1 08-00 58.7 -7.1 -8.1 -4.9 2.5 4.5 4.9 6.0 6.5 18.4 19.7 22.3 14.8
3. Consumer 10-11 -83.8 -38.6 04-00 -5.8 -66.2 -66.7 -63.3 -62.7 -63.1 -58.0 -52.6 -50.5 -47.7 -48.1 -54.2 -55.8
4. Retail trade 10-12 -48.4 -2.4 07-07 39.0 -22.8 -18.1 -15.0 -11.6 -8.4 -10.0 -9.7 -7.4 2.5 4.8 6.6 -2.5
5. Construction 08-11 -77.4 -20.1 04-00 32.5 -37.1 -33.4 -39.4 -23.4 -23.2 -13.5 -19.9 -20.3 -19.1 -19.6 -21.1 -32.7
= 6. ESI 03-09 74.8 100.0 07-00 119.1 91.7 91.6 91.4 92.9 95.1 97.7 95.8 99.4 104.1 103.0 102.0 99.3
ES 1. Industry 01-93 -43.2 -10.2 11-97 7.1 -14.2 -11.7 -8.8 -9.5 -8.1 -9.6 -9.3 -8.0 -7.4 -5.7 -5.7 -5.7
2. Services 01-09 -38.7 9.3 06-98 54.0 -7.2 -4.9 2.9 7.6 3.3 11.6 8.4 6.4 12.5 7.0 6.4 13.1
3. Consumer 02-09 -47.6 -14.4 03-00 5.3 -20.7 -20.5 -17.1 -12.4 -14.7 -8.3 -7.8 -6.7 -3.9 -7.7 -6.4 -9.6
4. Retail trade 02-93 -36.0 -10.0 06-00 9.5 -5.0 -2.6 5.5 6.6 1.1 7.5 6.9 7.2 6.0 6.0 9.0 6.9
5. Construction 08-13 -69.3 -12.1 12-98 39.5 -64.8 -60.4 -46.9 -52.9 -51.3 -52.6 -54.4 -48.3 -64.6 -40.0 -33.5 -31.5
= 6. ESI 01-93 72.7 100.0 06-98 116.3 95.0 96.4 100.5 100.3 100.3 102.5 101.5 101.9 104.1 103.5 103.5 104.0
FR 1. Industry 07-93 -39.4 -8.4 06-00 14.7 -8.1 -9.3 -7.2 -5.5 -7.4 -7.6 -6.1 -8.9 -11.3 -10.5 -11.5 -9.8
2. Services 04-09 -28.8 -0.4 01-90 16.2 -9.6 -6.4 -9.9 -9.5 -8.9 -7.1 -6.3 -5.4 -7.1 -7.0 -5.9 -6.5
3. Consumer 03-09 -37.0 -18.7 01-01 3.3 -18.4 -26.4 -22.4 -20.2 -23.1 -20.2 -21.7 -22.0 -21.7 -22.8 -22.3 -24.0
4. Retail trade 04-97 -27.2 -8.8 12-07 8.8 -10.1 -12.0 -7.3 -10.2 -10.6 -9.9 -10.2 -10.3 -9.8 -4.4 -15.0 -15.8
5. Construction 01-93 -62.3 -14.2 10-00 44.9 -25.7 -29.2 -27.3 -30.3 -31.1 -28.9 -32.5 -32.1 -34.3 -39.4 -41.5 -40.5
= 6. ESI 03-09 74.9 100.0 10-00 117.9 96.6 95.5 96.0 97.5 95.9 97.1 97.1 96.3 95.3 95.7 95.1 95.3
HR 1. Industry 04-09 -28.6 -11.5 08-14 5.0 -7.1 -6.2 -4.4 -3.3 -0.8 0.3 -3.0 0.7 -1.9 -1.5 5.0 -0.5
2. Services 07-09 -31.6 -5.6 05-08 20.8 -5.0 -5.1 -3.6 -3.9 1.3 3.3 3.8 2.3 4.0 3.5 1.6 3.0
3. Consumer 08-09 -51.5 -33.3 07-07 -14.0 -37.4 -38.0 -41.4 -36.3 -35.7 -34.4 -34.7 -36.2 -34.3 -37.5 -34.1 -34.6
4. Retail trade 08-09 -31.0 -13.3 09-08 2.6 -8.4 -10.0 -4.8 -8.4 -4.2 -11.9 -3.6 -6.8 -3.6 -4.3 -7.0 -5.5
5. Construction 03-10 -49.2 -31.2 05-08 13.0 -41.4 -42.1 -40.8 -38.9 -39.6 -32.5 -32.9 -36.0 -34.2 -34.1 -31.9 -29.8
= 6. ESI 08-09 71.4 100.0 05-08 127.4 104.4 104.5 105.2 107.0 111.7 113.2 113.6 113.5 114.1 112.1 117.3 113.9
Ave.Min. Max.
Since 1990 (*)

4
TABLE 1* (continued) : Indicators of confidence and economic sentiment (s.a.)
Since 1990 (*) 2013 2014Min. Max.
Date Value Date Value Oct Nov Dec Jan Feb Mar Apr May Jun Jul Aug Sep
IT 1. Industry 03-09 -34.5 -5.2 02-95 14.2 -7.9 -6.1 -5.7 -6.6 -4.8 -4.5 -4.1 -4.1 -3.9 -4.1 -8.0 -7.8
2. Services 06-13 -27.0 1.5 04-00 33.1 -23.4 -17.8 -14.8 -12.9 -9.7 -5.7 -10.1 -9.9 -10.3 -4.2 -6.5 -8.3
3. Consumer 06-12 -41.5 -16.6 06-01 2.5 -19.1 -20.9 -20.2 -18.5 -18.8 -14.3 -9.6 -8.7 -11.4 -12.3 -14.1 -15.4
4. Retail trade 04-99 -65.4 -14.5 02-92 17.3 -13.9 -11.9 -12.6 -9.0 -5.6 -8.6 -5.8 -3.2 -1.9 -0.9 -3.2 -8.7
5. Construction 09-93 -75.4 -23.4 04-90 13.4 -33.1 -34.2 -31.4 -36.9 -35.8 -36.4 -37.1 -39.0 -32.0 -29.7 -35.5 -37.0
= 6. ESI 03-09 75.4 100.0 05-00 120.7 92.7 94.6 96.8 96.6 99.0 100.3 100.8 101.3 100.3 101.9 97.8 96.9
CY 1. Industry 04-13 -37.4 -3.5 04-08 19.9 -17.4 -18.6 -14.8 -13.3 -13.0 -13.3 -8.5 -8.1 -8.8 -9.4 -7.6 -8.5
2. Services 04-13 -59.0 -1.9 08-07 35.4 -29.7 -20.7 -24.2 -16.5 -16.5 -12.4 0.0 5.6 4.5 7.0 2.5 5.7
3. Consumer 04-13 -64.4 -35.3 06-01 -13.0 -53.1 -50.2 -43.9 -46.7 -39.3 -38.5 -38.1 -33.9 -28.2 -27.5 -26.8 -30.9
4. Retail trade 04-13 -48.9 -9.6 05-07 20.6 -25.1 -26.3 -19.1 -17.7 -17.7 -22.7 -9.5 -12.0 -13.4 -13.8 -14.0 -12.1
5. Construction 04-13 -72.7 -23.2 12-03 36.5 -50.7 -59.6 -54.5 -57.6 -53.5 -50.0 -42.9 -49.3 -47.6 -50.2 -44.9 -47.4
= 6. ESI 04-13 69.9 100.0 08-07 116.7 86.9 87.9 90.3 91.3 92.9 93.5 97.3 99.3 99.7 100.6 100.0 99.8
LV 1. Industry 04-93 -44.0 -8.2 02-07 11.8 -4.4 -2.4 -2.6 -1.5 -0.9 -4.7 -3.2 -5.5 -4.2 -3.5 -4.7 -4.7
2. Services 03-09 -43.9 4.4 12-06 20.9 3.7 5.2 3.5 6.8 7.7 4.1 4.0 2.5 2.3 2.8 1.2 -0.8
3. Consumer 07-09 -54.9 -22.4 09-06 1.0 -14.5 -13.9 -9.1 -9.6 -12.2 -10.4 -7.5 -8.0 -9.3 -6.1 -11.7 -13.2
4. Retail trade 02-09 -35.2 6.4 04-07 22.8 5.6 8.3 9.0 7.8 10.3 10.5 9.5 10.2 6.1 8.6 7.4 6.6
5. Construction 07-09 -79.4 -25.4 01-07 19.2 -20.1 -19.6 -18.2 -15.6 -16.0 -12.5 -14.0 -17.1 -20.3 -21.8 -18.8 -18.2
= 6. ESI 03-09 71.5 100.0 02-07 115.1 103.0 104.2 104.6 105.8 106.0 104.1 105.0 103.7 103.7 104.7 102.9 102.1
LT 1. Industry 04-09 -41.4 -11.6 08-07 9.8 -6.3 -7.8 -7.6 -4.5 -4.9 -2.9 -4.9 -6.9 -9.0 -10.2 -8.0 -8.4
2. Services 03-09 -47.2 7.4 07-06 34.3 -6.2 -5.9 -3.9 -1.3 2.3 2.0 2.6 -0.7 -1.5 -6.3 -3.7 -8.5
3. Consumer 01-09 -56.1 -16.2 05-07 9.2 -9.3 -10.2 -5.7 -7.4 -8.7 -10.7 -11.5 -12.1 -11.5 -14.6 -21.1 -20.1
4. Retail trade 04-09 -57.8 -1.9 01-07 41.7 -4.1 -2.0 -4.8 8.7 7.2 7.8 6.6 5.7 -1.8 0.4 5.3 1.6
5. Construction 05-09 -92.9 -34.3 01-07 13.4 -21.1 -23.5 -21.1 -19.3 -16.0 -14.1 -14.8 -13.6 -15.7 -20.0 -18.0 -14.5
= 6. ESI 04-09 69.7 100.0 07-06 118.3 102.9 102.1 103.6 105.3 105.6 105.8 105.3 103.4 102.1 99.9 100.5 99.6
LU 1. Industry 03-09 -53.9 -15.2 04-95 24.1 -33.7 -28.1 -31.1 -33.5 -30.5 -31.1 -28.0 -21.4 -30.0 -27.9 -30.0 -31.3
2. Services : : : : : : : : : : : : : : : : :
3. Consumer 12-08 -20.7 -1.0 02-02 13.4 -1.2 -1.0 -0.9 -2.8 -1.5 -2.8 -5.2 -2.2 2.4 -2.1 -5.3 -7.8
4. Retail trade : : : : : : : : : : : : : : : : :
5. Construction 03-94 -70.9 -22.6 03-90 26.4 -11.7 -3.4 -6.7 -8.4 -0.3 -3.3 -8.3 -8.9 -9.0 -2.5 -0.3 2.4
= 6. ESI 03-09 74.5 100.0 04-95 122.6 90.3 94.2 92.6 90.1 93.2 91.8 91.7 95.7 93.8 92.1 90.1 87.9
HU 1. Industry 03-09 -34.7 -4.1 04-98 10.4 -1.3 2.3 5.6 3.4 6.7 5.6 8.7 6.4 3.3 0.7 1.6 2.5
2. Services 03-09 -44.2 -9.3 03-02 13.8 -2.5 -0.6 1.5 4.4 6.4 5.4 8.5 5.5 12.7 6.2 2.2 6.7
3. Consumer 04-09 -68.8 -33.2 08-02 0.2 -27.0 -22.4 -22.9 -17.1 -21.6 -16.3 -15.1 -17.6 -18.3 -17.6 -21.2 -17.8
4. Retail trade 03-09 -41.1 -9.3 01-14 14.1 -2.9 -3.5 5.6 14.1 7.2 10.1 8.5 8.9 5.3 4.5 9.6 12.8
5. Construction 04-09 -56.0 -18.9 08-98 11.5 -15.0 -15.0 -13.1 -10.8 -12.2 -12.4 -4.5 -7.0 -4.3 -2.8 -3.7 -4.1
= 6. ESI 03-09 58.0 100.0 04-14 121.9 106.6 111.0 115.4 117.1 118.2 117.9 121.9 118.8 119.7 115.4 113.4 117.1
MT 1. Industry 03-09 -31.6 -5.3 03-08 18.8 -3.6 -6.1 -2.3 -3.6 -4.6 -7.1 -7.7 -6.6 -7.0 -2.2 4.2 15.1
2. Services 03-09 -22.0 19.7 05-07 65.2 19.1 20.0 21.4 31.1 23.6 27.3 19.6 22.7 23.4 28.2 28.6 24.4
3. Consumer 04-11 -41.3 -24.2 11-13 1.4 -5.2 1.4 0.0 -3.3 -1.9 1.1 0.7 -0.3 1.4 0.3 -1.1 -2.7
4. Retail trade 08-14 -19.5 -6.3 08-13 3.9 -9.6 -8.3 -1.4 1.1 -9.9 -7.7 -13.4 -5.6 -8.1 0.9 -19.5 -12.9
5. Construction 03-09 -53.4 -31.3 05-08 2.0 -44.6 -26.0 -34.9 -30.5 -43.5 -24.3 -25.7 -27.3 -18.7 -30.1 -22.5 -20.5
= 6. ESI 03-09 73.7 100.0 03-08 126.4 106.1 109.0 110.2 111.9 108.1 110.8 108.0 109.5 109.8 112.3 114.0 118.0
NL 1. Industry 02-09 -25.4 -3.0 10-06 7.6 -2.7 -2.8 -3.5 -3.1 -3.2 -1.8 -2.6 -2.0 -1.7 -1.0 -1.6 -1.3
2. Services 03-09 -41.6 5.9 04-07 46.5 -3.4 -0.2 4.1 3.5 3.0 7.3 5.8 5.5 6.3 3.4 2.0 3.7
3. Consumer 02-13 -30.2 1.0 03-00 30.8 -12.9 -5.9 -3.5 -2.6 -5.8 0.4 -2.1 3.9 3.7 4.7 3.3 4.1
4. Retail trade 06-09 -16.9 11.2 10-99 33.3 -6.0 -5.3 -6.5 -2.8 -3.8 0.4 0.4 1.7 0.8 4.7 4.5 4.0
5. Construction 12-12 -47.7 -6.9 12-00 27.1 -35.7 -37.5 -33.6 -30.7 -29.4 -28.0 -22.8 -25.2 -18.6 -19.3 -18.1 -11.1
= 6. ESI 03-09 68.5 100.0 03-07 117.3 95.8 97.0 98.4 97.4 98.0 100.3 99.3 100.6 101.3 101.7 100.9 101.2
AT 1. Industry 03-09 -37.8 -5.0 02-07 15.2 -6.1 -2.6 -3.6 -5.8 -2.9 -2.8 -4.4 -1.6 -4.4 -8.6 -3.6 -7.1
2. Services 04-09 -24.9 14.5 06-98 33.4 18.4 16.9 14.6 9.5 14.2 14.1 16.6 12.5 12.6 8.1 7.8 2.2
3. Consumer 04-09 -23.0 -1.5 06-07 16.3 -3.6 -3.9 -6.4 -6.9 -6.5 -6.2 -6.7 -7.9 -6.6 -7.9 -11.2 -12.5
4. Retail trade 03-09 -26.4 -7.6 05-10 13.2 -7.9 -9.2 -3.9 -8.5 -7.7 -3.9 -3.2 -4.4 -12.7 -12.4 -11.6 -11.0
5. Construction 04-96 -56.4 -18.5 07-07 5.8 -5.2 -18.3 -19.5 -13.8 -13.1 -14.2 -14.1 -18.0 -19.9 -19.3 -19.8 -19.8
= 6. ESI 04-09 70.2 100.0 03-90 118.9 101.8 101.8 100.6 97.7 100.4 101.3 101.0 100.5 98.9 95.1 96.5 93.0
PL 1. Industry 03-09 -29.1 -14.4 06-07 -0.5 -15.2 -15.5 -15.0 -12.7 -12.6 -13.4 -12.6 -12.7 -12.6 -11.5 -12.5 -13.5
2. Services 03-09 -12.0 4.0 07-07 22.7 -2.3 -2.1 -0.9 1.5 1.3 0.7 1.7 -0.4 1.4 0.9 0.8 1.3
3. Consumer 08-01 -40.1 -22.3 04-08 -0.5 -24.2 -23.6 -19.7 -21.4 -20.8 -17.5 -20.2 -15.9 -14.7 -19.3 -20.3 -20.5
4. Retail trade 03-03 -16.8 -3.3 12-07 11.9 -3.2 -3.7 -3.4 -1.9 0.4 1.0 1.2 -0.1 0.5 -1.1 -0.5 -1.7
5. Construction 02-02 -67.9 -34.5 02-08 -0.7 -35.3 -34.5 -32.9 -30.3 -30.2 -29.1 -28.9 -28.9 -27.8 -27.2 -26.9 -26.0
= 6. ESI 03-09 77.6 100.0 05-96 123.1 93.1 93.0 95.4 97.1 97.4 97.6 97.5 97.5 98.7 97.8 96.8 96.4
PT 1. Industry 04-09 -35.7 -7.9 03-98 8.7 -12.8 -10.3 -7.4 -6.8 -8.3 -6.1 -5.9 -6.3 -7.3 -7.5 -7.4 -6.5
2. Services 10-12 -38.0 -4.5 06-01 24.7 -14.3 -13.3 -9.1 -6.0 -6.9 -3.1 -4.4 -0.1 2.8 4.0 2.6 0.4
3. Consumer 10-12 -60.1 -26.9 07-91 -0.5 -42.3 -39.1 -35.8 -31.5 -29.5 -31.3 -29.6 -25.4 -25.9 -24.3 -28.2 -23.9
4. Retail trade 12-08 -30.7 -3.0 07-98 14.1 -6.5 -5.0 0.7 -1.9 0.5 3.9 3.4 4.5 2.3 1.6 1.2 2.0
5. Construction 05-12 -75.1 -32.2 12-97 1.9 -49.0 -48.4 -48.5 -44.8 -45.1 -46.8 -45.1 -44.1 -43.4 -43.9 -46.2 -44.8
= 6. ESI 04-09 75.4 100.0 03-98 116.8 92.5 94.8 98.1 99.6 98.6 100.4 100.6 102.1 102.3 102.4 100.5 101.6
RO 1. Industry 09-92 -22.2 -2.2 06-96 27.3 -3.0 -3.6 -2.0 -3.1 -1.5 0.0 -0.5 -1.0 -1.0 1.4 -0.1 -0.4
2. Services 06-09 -19.3 12.7 06-04 56.2 0.3 1.5 -1.9 -0.2 5.6 3.6 2.5 4.0 2.3 1.3 8.9 7.7
3. Consumer 06-10 -63.3 -30.2 07-07 -10.6 -36.2 -34.9 -34.8 -34.3 -33.8 -35.1 -33.4 -34.1 -30.6 -27.6 -27.5 -29.4
4. Retail trade 07-09 -21.6 11.2 12-97 35.8 1.8 6.5 -0.1 -1.3 5.8 8.1 4.2 9.7 8.7 13.1 11.7 6.6
5. Construction 09-99 -60.4 -14.5 06-96 34.6 -29.0 -29.2 -30.5 -31.4 -23.0 -22.0 -21.6 -21.0 -23.0 -21.4 -21.8 -19.6
= 6. ESI 09-92 70.8 100.0 06-96 124.2 95.0 95.6 95.3 94.7 97.7 97.6 97.3 97.4 97.6 99.6 101.0 99.8
SI 1. Industry 01-09 -38.0 -3.1 06-00 17.8 -4.3 -0.6 -0.6 -2.2 -0.2 1.5 1.3 3.2 6.3 7.2 4.8 2.4
2. Services 04-09 -28.9 12.5 09-02 38.0 -13.8 -9.7 -10.5 -5.6 -6.1 -3.4 2.6 8.7 7.1 7.3 7.0 8.5
3. Consumer 09-12 -46.1 -21.0 07-07 -4.1 -34.7 -34.6 -34.4 -30.9 -31.5 -30.1 -29.0 -23.4 -21.8 -16.8 -20.1 -12.9
4. Retail trade 03-09 -21.6 10.4 09-07 38.2 10.7 -7.1 -4.2 11.0 2.7 6.7 3.7 17.8 -2.0 12.1 8.2 5.2
5. Construction 03-10 -63.9 -13.0 03-07 27.8 -18.9 -18.2 -19.4 -15.6 -18.1 -8.2 -14.0 -3.4 -6.1 -5.7 -10.8 -10.7
= 6. ESI 04-09 69.4 100.0 07-07 120.8 90.9 92.8 92.7 94.5 95.2 97.2 98.8 102.4 103.8 105.9 103.3 104.4
Ave.

5
TABLE 1* (continued) : Indicators of confidence and economic sentiment (s.a.)
Since 1990 (*) 2013 2014Min. Max.
Date Value Date Value Oct Nov Dec Jan Feb Mar Apr May Jun Jul Aug Sep
SK 1. Industry 04-09 -31.8 2.9 05-96 25.8 4.1 -1.8 -0.8 2.4 -4.7 -1.7 2.1 1.1 -2.0 5.3 5.5 4.6
2. Services 05-09 -24.0 27.9 03-02 62.6 6.1 5.3 7.2 8.0 2.9 4.5 11.7 19.6 23.1 23.7 15.0 13.5
3. Consumer 09-99 -49.0 -24.2 12-06 6.6 -20.1 -17.4 -16.4 -12.6 -16.5 -13.3 -13.4 -12.3 -12.6 -12.2 -11.7 -15.5
4. Retail trade 03-09 -22.7 8.7 11-98 34.4 -1.1 3.4 5.7 5.4 10.7 3.1 4.5 8.1 10.2 8.1 9.2 9.5
5. Construction 07-99 -86.1 -28.4 03-97 17.5 -45.3 -43.4 -43.9 -36.1 -25.8 -25.2 -30.8 -31.1 -39.0 -34.9 -26.3 -19.1
= 6. ESI 04-09 66.1 100.0 05-96 122.0 95.6 94.0 95.4 98.1 93.7 95.9 99.0 101.3 100.4 103.3 102.0 100.9
FI 1. Industry 03-09 -37.3 1.6 10-94 31.3 -13.4 -7.5 -6.1 -10.4 -7.2 -8.9 -8.3 -6.2 -8.8 -8.8 -4.8 -9.0
2. Services 12-01 -47.6 14.7 09-00 51.1 -1.1 -4.3 6.4 4.3 1.3 0.1 -1.9 -2.1 0.6 -2.0 5.9 -7.4
3. Consumer 12-08 -6.4 13.2 09-10 23.8 7.0 8.2 9.3 11.0 7.6 7.8 4.4 9.0 10.3 12.4 6.3 2.3
4. Retail trade 09-14 -21.9 -0.8 08-07 23.8 -12.0 -6.7 -3.1 -4.5 -6.4 -10.6 -3.4 -6.5 -15.7 -21.2 -14.1 -21.9
5. Construction 06-91 -99.0 -19.0 06-98 36.5 -10.7 -28.2 -15.7 -28.9 -24.4 -29.7 -31.5 -18.3 -20.9 -23.5 -29.1 -34.4
= 6. ESI 04-91 73.0 100.0 11-94 120.9 92.1 94.8 97.2 95.2 95.2 93.3 92.4 95.1 94.6 94.4 96.1 90.3
SE 1. Industry 03-09 -38.5 -5.0 09-10 15.8 -6.6 -0.7 -1.4 -0.6 -4.3 -5.4 0.3 -7.0 -4.2 -0.8 3.6 -1.0
2. Services 04-09 -26.3 19.3 02-11 53.0 22.1 25.1 26.7 33.0 29.6 27.8 25.0 26.5 25.5 22.1 25.6 20.8
3. Consumer 12-08 -10.0 9.9 09-10 28.0 14.9 17.0 18.3 17.9 17.6 15.5 17.0 18.8 18.1 19.0 19.8 20.1
4. Retail trade 01-09 -38.3 10.2 01-10 47.6 8.0 11.1 14.4 15.5 15.8 17.5 20.1 23.7 21.8 22.0 18.1 22.0
5. Construction 12-93 -82.9 -24.7 08-07 47.6 -34.1 -23.8 -15.8 -19.8 -17.0 -18.1 -20.7 -17.3 -13.2 -5.9 -5.2 -6.8
= 6. ESI 08-91 78.1 100.0 01-11 118.5 104.2 107.6 108.2 109.1 106.5 105.8 107.2 105.0 106.3 106.7 108.8 106.2
UK 1. Industry 03-09 -49.0 -9.7 06-14 11.9 2.3 11.3 8.8 5.9 6.0 1.3 8.0 8.0 11.9 7.4 8.4 4.1
2. Services 03-09 -57.4 3.7 10-97 36.1 29.4 21.0 23.9 23.2 27.1 22.3 29.9 24.2 29.6 29.1 22.1 22.5
3. Consumer 01-09 -35.2 -9.5 05-14 7.6 -2.1 -2.9 -3.3 1.0 2.0 3.3 5.7 7.6 7.4 4.8 6.6 3.5
4. Retail trade 01-09 -47.1 0.6 05-14 25.8 22.2 -3.2 7.6 19.4 24.5 7.9 20.6 25.8 16.9 15.0 17.9 12.0
5. Construction 06-91 -79.3 -22.4 10-07 5.5 -14.6 -9.6 -17.8 -4.6 -11.3 -9.5 -11.1 -10.8 -8.0 -6.1 -2.0 0.9
= 6. ESI 03-09 64.1 100.0 06-14 120.7 114.8 115.0 114.9 115.9 116.9 112.8 119.5 118.5 120.7 117.4 116.3 115.4
Ave.
In the tables: (s.a.) = seasonally adjusted, (n) = not seasonally adjusted, : = not available.
(*) Minimum, maximum and averages are calculated over the period of availability which is not necessarily as from 01/1990.
The economic sentiment indicator is composed of the industrial confidence indicator (40%), the service confidence indicator (30%), the consumer confidence indicator (20%), the construction
confidence indicator (5%), and the retail trade confidence indicator (5%). Its long term average (1990-2012) equals 100. The reported ESI average is based on this standardisation sample. All
confidence indicators are balances.
The country weights have been updated in January 2014.

6
TABLE 2: Monthly survey of manufacturing industry (s.a.)
Since 1990 (*) 2013 2014
Date Value Date Value Oct Nov Dec Jan Feb Mar Apr May Jun Jul Aug Sep
INDUSTRIAL EU 03-09 -38.7 -7.1 06-07 7.5 -4.3 -2.0 -2.0 -2.5 -2.4 -2.7 -1.8 -1.9 -2.4 -2.6 -3.2 -4.2
CONFIDENCE EA 03-09 -38.1 -6.9 04-07 7.9 -5.0 -3.9 -3.4 -3.8 -3.5 -3.3 -3.5 -3.1 -4.3 -3.8 -5.3 -5.5
INDICATOR (a) BE 03-09 -33.8 -9.7 06-07 6.9 -10.3 -4.7 -6.3 -5.2 -2.9 -3.2 -4.5 -6.3 -6.0 -7.5 -7.2 -6.5
BG 06-93 -32.1 -6.4 01-08 12.3 -11.2 -12.5 -11.5 -8.7 -8.0 -7.9 -8.3 -2.2 -0.7 -1.9 -0.4 -2.5
CZ 02-09 -35.6 2.1 06-00 29.8 -0.9 3.5 1.2 -0.6 1.6 2.3 2.4 3.5 2.7 1.9 2.8 4.2
DK 02-09 -34.5 -0.7 09-94 16.7 7.5 9.5 4.8 10.9 5.7 11.6 10.5 4.0 -2.9 -9.9 -2.8 -7.0
DE 03-09 -42.5 -7.7 02-11 16.0 0.4 1.1 1.0 0.1 0.1 0.9 -0.1 1.2 -1.3 -0.3 -2.7 -3.1
EE 03-09 -39.1 2.8 12-06 28.5 1.0 -0.2 -3.5 3.8 1.4 -2.3 -1.2 -2.0 -3.9 -2.0 -0.5 -3.2
IE : : : : : : : : : : : : : : : : :
EL 03-09 -36.6 -4.0 03-00 13.3 -9.9 -11.0 -10.6 -11.2 -7.1 -4.1 -8.9 -4.9 1.3 1.5 0.3 -5.4
ES 01-93 -43.2 -10.2 11-97 7.1 -14.2 -11.7 -8.8 -9.5 -8.1 -9.6 -9.3 -8.0 -7.4 -5.7 -5.7 -5.7
FR 07-93 -39.4 -8.4 06-00 14.7 -8.1 -9.3 -7.2 -5.5 -7.4 -7.6 -6.1 -8.9 -11.3 -10.5 -11.5 -9.8
HR 04-09 -28.6 -11.5 08-14 5.0 -7.1 -6.2 -4.4 -3.3 -0.8 0.3 -3.0 0.7 -1.9 -1.5 5.0 -0.5
IT 03-09 -34.5 -5.2 02-95 14.2 -7.9 -6.1 -5.7 -6.6 -4.8 -4.5 -4.1 -4.1 -3.9 -4.1 -8.0 -7.8
CY 04-13 -37.4 -3.5 04-08 19.9 -17.4 -18.6 -14.8 -13.3 -13.0 -13.3 -8.5 -8.1 -8.8 -9.4 -7.6 -8.5
LV 04-93 -44.0 -8.2 02-07 11.8 -4.4 -2.4 -2.6 -1.5 -0.9 -4.7 -3.2 -5.5 -4.2 -3.5 -4.7 -4.7
LT 04-09 -41.4 -11.6 08-07 9.8 -6.3 -7.8 -7.6 -4.5 -4.9 -2.9 -4.9 -6.9 -9.0 -10.2 -8.0 -8.4
LU 03-09 -53.9 -15.2 04-95 24.1 -33.7 -28.1 -31.1 -33.5 -30.5 -31.1 -28.0 -21.4 -30.0 -27.9 -30.0 -31.3
HU 03-09 -34.7 -4.1 04-98 10.4 -1.3 2.3 5.6 3.4 6.7 5.6 8.7 6.4 3.3 0.7 1.6 2.5
MT 03-09 -31.6 -5.3 03-08 18.8 -3.6 -6.1 -2.3 -3.6 -4.6 -7.1 -7.7 -6.6 -7.0 -2.2 4.2 15.1
NL 02-09 -25.4 -3.0 10-06 7.6 -2.7 -2.8 -3.5 -3.1 -3.2 -1.8 -2.6 -2.0 -1.7 -1.0 -1.6 -1.3
AT 03-09 -37.8 -5.0 02-07 15.2 -6.1 -2.6 -3.6 -5.8 -2.9 -2.8 -4.4 -1.6 -4.4 -8.6 -3.6 -7.1
PL 03-09 -29.1 -14.4 06-07 -0.5 -15.2 -15.5 -15.0 -12.7 -12.6 -13.4 -12.6 -12.7 -12.6 -11.5 -12.5 -13.5
PT 04-09 -35.7 -7.9 03-98 8.7 -12.8 -10.3 -7.4 -6.8 -8.3 -6.1 -5.9 -6.3 -7.3 -7.5 -7.4 -6.5
RO 09-92 -22.2 -2.2 06-96 27.3 -3.0 -3.6 -2.0 -3.1 -1.5 0.0 -0.5 -1.0 -1.0 1.4 -0.1 -0.4
SI 01-09 -38.0 -3.1 06-00 17.8 -4.3 -0.6 -0.6 -2.2 -0.2 1.5 1.3 3.2 6.3 7.2 4.8 2.4
SK 04-09 -31.8 2.9 05-96 25.8 4.1 -1.8 -0.8 2.4 -4.7 -1.7 2.1 1.1 -2.0 5.3 5.5 4.6
FI 03-09 -37.3 1.6 10-94 31.3 -13.4 -7.5 -6.1 -10.4 -7.2 -8.9 -8.3 -6.2 -8.8 -8.8 -4.8 -9.0
SE 03-09 -38.5 -5.0 09-10 15.8 -6.6 -0.7 -1.4 -0.6 -4.3 -5.4 0.3 -7.0 -4.2 -0.8 3.6 -1.0
UK 03-09 -49.0 -9.7 06-14 11.9 2.3 11.3 8.8 5.9 6.0 1.3 8.0 8.0 11.9 7.4 8.4 4.1
PRODUCTION EU 03-09 -33.9 6.6 12-94 23.9 10.5 13.7 11.5 11.1 11.6 11.4 11.8 12.2 11.1 11.7 9.4 9.1
EXPECTATIONS EA 03-09 -32.3 5.6 12-94 22.2 9.4 9.7 8.3 8.2 8.3 9.8 8.2 8.9 6.9 8.2 4.3 5.2
(Question 5) BE 03-09 -35.3 -2.9 01-11 20.3 2.6 4.5 1.5 2.4 4.8 4.3 2.9 0.6 2.6 0.9 -1.8 1.0
BG 02-97 -11.5 22.2 09-08 43.9 12.2 10.0 9.3 17.6 18.3 18.7 14.2 22.6 25.5 21.9 24.0 21.9
Component of the CZ 02-09 -49.0 19.8 06-00 54.7 16.1 28.0 23.8 19.2 18.8 17.5 16.2 17.2 12.7 13.3 13.0 17.7
industrial confidence DK 02-09 -34.3 10.3 02-98 31.2 19.4 24.0 20.4 19.7 16.8 25.0 28.3 10.7 9.2 0.8 7.1 9.4
indicator DE 02-09 -41.0 2.9 02-11 27.0 15.2 14.5 11.8 10.9 10.6 12.5 10.2 14.1 7.2 11.0 5.9 7.0
EE 04-92 -69.6 15.2 03-02 67.5 11.5 11.4 7.6 16.3 15.7 0.6 5.5 2.3 -2.6 -1.3 7.5 3.0
IE : : : : : : : : : : : : : : : : :
EL 03-09 -20.3 19.6 02-00 44.3 7.4 1.9 10.4 7.9 10.9 16.5 9.5 12.0 24.7 25.5 24.2 10.7
ES 03-09 -28.3 2.6 12-00 17.7 -1.1 5.0 2.7 -2.4 3.4 2.7 -2.2 0.0 7.8 4.4 3.9 2.5
FR 02-09 -31.3 5.0 11-00 26.8 7.4 4.4 5.6 10.4 7.3 8.7 11.2 5.1 3.3 3.2 -1.9 2.9
HR 04-09 -18.6 9.5 08-14 35.2 16.9 14.6 23.6 23.0 23.9 28.9 20.7 32.0 20.2 23.8 35.2 22.9
IT 03-09 -27.7 10.9 12-94 34.3 4.0 5.6 5.3 5.8 6.1 7.0 6.7 5.5 6.4 8.5 1.1 2.8
CY 04-13 -53.2 5.4 02-08 37.8 -24.0 -20.7 -16.3 -6.6 -7.7 -8.6 2.6 3.1 6.3 2.5 10.2 7.0
LV 02-09 -38.9 12.7 03-02 41.8 7.7 8.7 8.5 8.2 3.5 5.5 2.6 1.6 6.1 8.3 5.2 7.2
LT 04-09 -34.8 10.1 08-97 35.9 20.4 21.6 19.2 22.2 20.4 16.7 13.7 12.3 4.8 6.1 9.6 12.1
LU 02-09 -49.8 -5.5 04-10 36.1 -9.6 -4.1 -20.3 -18.4 -3.4 -5.3 -3.0 5.5 -5.9 -10.3 -9.3 -6.9
HU 04-09 -47.3 7.6 12-97 36.2 11.7 14.8 17.9 15.1 18.6 19.1 25.2 15.4 12.5 9.2 10.4 12.1
MT 12-08 -22.7 19.3 03-08 58.2 18.1 16.5 20.9 17.5 9.9 6.8 3.6 13.2 19.3 34.4 34.4 54.5
NL 02-09 -25.9 5.7 04-11 17.4 10.6 11.1 8.3 7.7 7.6 11.2 8.3 8.0 7.9 7.6 7.2 7.5
AT 03-09 -34.5 9.9 11-00 32.4 9.1 16.2 15.8 10.0 15.7 18.8 10.8 16.0 14.2 6.8 11.3 7.3
PL 03-09 -19.0 15.6 06-95 34.1 2.6 4.1 3.7 9.3 9.5 5.9 7.1 6.5 8.0 7.3 7.3 5.6
PT 02-09 -30.9 1.8 01-97 21.3 -4.6 -2.2 2.6 8.8 5.2 8.5 7.8 4.3 4.7 3.0 0.9 4.2
RO 03-09 -25.9 13.7 03-03 48.1 6.6 6.0 7.6 5.5 6.3 9.5 8.9 6.1 7.6 10.5 8.5 7.5
SI 01-09 -25.4 19.9 06-06 43.3 12.3 18.8 12.8 11.2 14.1 16.4 21.1 23.9 22.3 23.6 17.8 15.6
SK 01-09 -32.1 25.1 12-97 62.0 29.3 6.5 5.9 25.8 1.3 -0.8 9.2 6.8 -5.7 19.9 18.6 13.5
FI 11-08 -37.0 11.7 05-07 41.0 2.8 7.6 10.6 7.6 9.8 1.9 4.2 7.7 10.5 7.5 14.4 8.8
SE 12-08 -30.7 16.9 09-10 50.2 19.4 25.4 24.3 26.4 22.2 25.4 30.3 16.2 22.1 29.8 35.1 28.6
UK 03-09 -52.4 6.1 11-13 33.5 15.3 33.5 25.4 22.6 26.3 14.3 25.1 31.2 33.5 30.4 31.7 26.8
ORDER BOOKS EU 07-09 -62.4 -18.3 04-07 8.5 -19.2 -15.2 -14.5 -15.1 -15.0 -15.0 -13.6 -13.3 -13.5 -13.9 -13.1 -15.5
(Question 2) EA 06-09 -63.4 -17.5 04-07 11.0 -21.2 -17.9 -16.7 -16.7 -16.3 -16.6 -15.3 -14.6 -15.9 -15.5 -15.6 -16.2
BE 06-09 -56.8 -20.5 06-00 10.7 -28.5 -19.9 -18.6 -16.0 -13.9 -16.2 -13.9 -16.5 -21.0 -21.9 -21.0 -18.9
Component of the BG 10-99 -70.0 -43.6 03-07 -10.2 -50.8 -50.7 -48.5 -45.7 -44.6 -44.8 -41.0 -28.2 -26.0 -28.6 -24.6 -25.1
industrial confidence CZ 03-09 -56.8 -4.5 01-01 30.6 -11.2 -10.3 -12.4 -12.2 -9.5 -7.2 -3.7 -2.5 -0.8 -3.6 -2.5 -1.5
indicator DK 04-09 -61.7 -4.5 12-94 32.5 4.0 16.6 10.1 14.4 9.3 17.7 14.2 9.1 1.1 -12.9 -11.2 -13.5
DE 07-09 -63.7 -17.3 12-06 17.7 -11.8 -9.0 -7.3 -9.3 -9.2 -8.7 -9.1 -7.1 -8.5 -9.0 -10.5 -10.9
EE 06-09 -76.5 -5.4 12-06 32.1 -12.2 -16.7 -22.8 -12.5 -15.5 -12.2 -15.8 -17.4 -18.8 -14.3 -15.6 -19.6
IE : : : : : : : : : : : : : : : : :
EL 05-09 -59.1 -19.5 05-98 5.9 -30.8 -30.7 -31.8 -32.0 -25.7 -24.4 -27.3 -25.9 -20.8 -14.7 -16.8 -26.6
ES 01-93 -63.9 -18.8 06-98 14.2 -32.0 -27.3 -25.4 -16.4 -20.1 -22.6 -17.2 -14.3 -19.1 -15.9 -12.2 -12.3
FR 06-09 -68.7 -18.4 06-00 27.7 -23.6 -22.9 -19.3 -20.1 -20.1 -20.0 -18.0 -21.7 -25.6 -23.2 -22.4 -22.5
HR 07-09 -62.2 -40.3 07-08 -8.9 -38.5 -37.5 -36.1 -31.3 -25.6 -28.5 -33.8 -30.7 -30.3 -29.4 -28.2 -28.1
IT 03-09 -69.0 -19.9 02-95 14.5 -29.2 -24.8 -26.8 -26.9 -24.0 -21.8 -20.3 -20.5 -18.9 -21.2 -23.2 -24.1
CY 04-13 -67.7 -27.3 06-07 4.6 -53.8 -53.1 -49.3 -50.7 -48.6 -47.1 -39.8 -41.5 -42.3 -46.9 -43.3 -47.3
LV 07-93 -78.2 -34.6 02-07 -1.1 -24.2 -20.6 -19.8 -18.2 -20.1 -24.4 -19.4 -23.0 -24.6 -23.5 -24.0 -22.3
LT 11-98 -78.9 -38.3 08-07 1.9 -38.3 -42.9 -39.9 -37.0 -33.6 -27.0 -28.3 -33.6 -32.5 -32.9 -32.7 -32.9
LU 03-09 -83.0 -29.6 12-97 29.2 -60.2 -55.0 -57.4 -57.0 -64.0 -63.8 -60.7 -49.7 -53.9 -45.6 -54.5 -54.7
HU 03-09 -68.5 -19.0 05-14 4.6 -11.3 -6.3 -3.2 -4.9 0.8 0.4 1.8 4.6 0.6 -4.0 -2.3 -1.7
MT 06-09 -71.9 -25.7 10-07 14.5 -26.7 -33.7 -27.8 -31.9 -25.7 -32.0 -30.6 -41.0 -42.2 -39.3 -26.2 -17.7
NL 06-09 -45.7 -9.5 12-06 9.0 -16.2 -15.4 -16.6 -12.9 -14.0 -12.6 -12.2 -10.6 -10.1 -9.0 -10.3 -8.6
AT 05-09 -63.7 -16.1 03-90 21.1 -24.4 -19.4 -21.7 -22.6 -18.4 -23.8 -21.1 -18.0 -22.3 -23.5 -16.5 -21.0
PL 12-01 -85.2 -55.5 02-08 -28.9 -45.3 -45.5 -44.9 -43.4 -43.2 -41.6 -40.4 -40.2 -40.5 -37.3 -38.9 -41.2
PT 04-09 -71.4 -22.6 03-98 10.5 -35.8 -32.4 -28.6 -29.6 -29.7 -25.6 -25.8 -24.6 -27.1 -24.8 -19.9 -21.2
RO 06-99 -51.9 -15.8 06-96 50.9 -17.6 -17.5 -15.5 -14.6 -12.5 -11.1 -9.2 -9.2 -9.3 -7.1 -10.1 -10.7
SI 04-09 -82.1 -18.5 03-07 23.8 -26.0 -20.3 -17.1 -16.6 -16.5 -12.9 -18.3 -10.5 -5.2 -0.1 -2.6 -6.2
SK 03-99 -69.6 -11.7 09-94 49.0 -19.9 -15.3 -11.6 -21.8 -21.0 -14.5 -12.0 -12.9 -7.9 -6.0 -5.3 -6.6
FI 06-09 -69.1 -11.2 11-94 42.1 -34.4 -32.6 -27.1 -33.8 -28.8 -26.4 -22.9 -26.6 -31.7 -30.5 -24.9 -28.4
SE 03-92 -70.6 -23.9 12-94 14.0 -29.5 -22.5 -25.0 -25.1 -22.2 -30.8 -20.2 -18.3 -24.4 -19.1 -14.0 -15.1
UK 07-09 -66.3 -18.5 01-08 14.1 1.1 10.4 9.3 3.1 1.4 3.6 4.0 1.5 9.5 3.8 8.9 -5.7
Ave.Min. Max.

7
TABLE 2 (continued) : Monthly survey of manufacturing industry (s.a.)
Since 1990 (*) 2013 2014
Min. Max.
Date Value Date Value Oct Nov Dec Jan Feb Mar Apr May Jun Jul Aug Sep
STOCKS OF EU 01-93 21.8 9.7 03-11 -0.7 4.2 4.5 2.9 3.6 3.8 4.7 3.7 4.6 4.8 5.5 6.0 6.4
FINISHED EA 07-93 23.0 8.8 03-11 -2.0 3.3 3.5 1.7 3.0 2.4 3.0 3.2 3.5 4.0 4.1 4.5 5.4
PRODUCTS (b) BE 10-01 26.1 5.7 03-10 -11.2 5.1 -1.3 1.6 2.0 -0.4 -2.4 2.5 3.1 -0.4 1.7 -1.4 1.5
(Question 4) BG 08-93 35.2 -2.2 06-97 -20.5 -5.0 -3.2 -4.6 -1.8 -2.3 -2.5 -2.0 1.1 1.6 -1.0 0.7 4.3
CZ 08-93 46.3 11.5 04-00 -11.5 7.7 7.1 7.6 8.8 4.5 3.5 5.4 4.2 3.8 4.1 2.1 3.6
Component of the DK 06-99 28.5 8.0 02-10 -28.3 1.0 12.1 16.2 1.2 8.9 8.0 11.2 7.9 19.0 17.7 4.3 16.8
industrial confidence DE 04-09 30.7 8.7 09-90 -9.0 2.2 2.3 1.4 1.5 1.1 1.2 1.2 3.3 2.5 3.0 3.4 5.3
indicator EE 06-93 38.7 1.5 12-06 -20.9 -3.8 -4.6 -4.8 -7.7 -3.9 -4.6 -6.6 -9.0 -9.6 -9.5 -6.4 -7.0
IE : : : : : : : : : : : : : : : : :
EL 03-09 33.9 12.1 05-13 -1.2 6.3 4.2 10.5 9.3 6.5 4.3 9.1 0.7 -0.1 6.4 6.6 0.3
ES 01-93 46.6 14.5 12-97 2.9 9.6 12.7 3.7 9.8 7.6 8.8 8.5 9.8 11.0 5.5 8.7 7.3
FR 07-93 32.5 11.7 03-10 -5.7 8.1 9.3 7.8 6.9 9.3 11.5 11.4 10.0 11.6 11.6 10.2 9.9
HR 06-09 19.0 3.8 08-14 -7.9 -0.4 -4.5 0.6 1.5 0.7 -0.6 -4.2 -0.9 -4.3 -1.2 -7.9 -3.7
IT 10-90 20.0 6.5 06-10 -5.4 -1.4 -0.7 -4.4 -1.1 -3.6 -1.3 -1.2 -2.8 -0.7 -0.3 1.8 2.0
CY 03-09 5.5 -11.4 09-01 -34.9 -25.7 -17.8 -21.2 -17.2 -17.3 -15.8 -11.6 -14.2 -9.5 -16.2 -10.4 -14.6
LV 07-93 43.3 2.6 02-14 -14.0 -3.4 -4.7 -3.6 -5.4 -14.0 -4.8 -7.1 -4.9 -6.0 -4.6 -4.6 -0.9
LT 01-94 49.5 6.6 06-11 -17.3 0.9 2.0 2.2 -1.5 1.4 -1.7 0.1 -0.5 -0.8 3.7 0.8 4.5
LU 05-12 45.6 10.7 03-95 -23.6 31.4 25.2 15.7 25.2 24.3 24.3 20.4 20.2 30.3 27.9 26.2 32.4
HU 04-97 17.7 1.0 05-09 -17.5 4.1 1.8 -2.2 -0.1 -0.7 2.6 0.9 0.7 3.1 3.0 3.4 3.1
MT 06-06 36.7 9.6 06-05 -14.7 2.2 0.9 -0.2 -3.5 -2.0 -3.9 -3.8 -8.0 -1.9 1.9 -4.5 -8.3
NL 02-09 14.6 5.2 03-11 -0.8 2.6 4.0 2.3 4.2 3.1 4.0 3.8 3.3 2.9 1.6 1.5 2.9
AT 07-96 30.3 8.9 11-06 -6.7 3.0 4.5 4.8 4.8 6.2 3.3 2.9 2.6 5.3 9.1 5.5 7.7
PL 01-99 11.5 -1.5 09-94 -22.1 2.9 5.2 3.6 3.9 4.1 4.5 4.5 4.5 5.4 4.7 5.9 5.0
PT 06-93 21.0 2.8 01-08 -15.0 -2.0 -3.6 -3.9 -0.3 0.6 1.1 -0.3 -1.3 -0.4 0.8 3.1 2.6
RO 07-92 49.4 4.6 03-10 -10.9 -2.1 -0.7 -1.9 0.3 -1.8 -1.5 1.1 -0.1 1.3 -0.9 -1.4 -1.8
SI 02-96 29.6 10.7 03-10 -7.4 -0.7 0.2 -2.5 1.2 -1.8 -1.0 -1.1 3.8 -1.8 2.0 0.8 2.2
SK 05-94 54.6 4.6 02-01 -27.1 -3.0 -3.5 -3.3 -3.3 -5.7 -10.2 -9.0 -9.4 -7.6 -1.9 -3.1 -6.9
FI 01-96 26.9 1.3 04-95 -23.7 8.5 -2.5 2.0 5.0 2.6 2.3 6.1 -0.3 5.3 3.6 3.8 7.5
SE 04-09 39.1 15.4 09-10 -3.4 9.7 5.0 3.7 3.3 12.8 10.7 9.3 18.8 10.2 13.2 10.4 16.7
UK 04-09 37.0 16.6 03-10 0.5 9.4 9.9 8.3 7.9 9.7 14.0 5.0 8.7 7.3 12.0 15.4 8.7
PRODUCTION EU 03-09 -46.7 -0.7 03-11 18.7 -0.8 6.6 6.0 4.8 7.4 7.2 5.8 6.6 4.6 3.5 4.5 2.8
TREND OBSERVED EA 03-09 -48.0 -1.9 05-00 17.1 -4.1 2.7 1.3 1.3 3.8 4.6 2.2 3.7 1.7 -0.3 1.5 -1.4
IN RECENT MONTHS BE 03-09 -39.4 -0.6 02-11 20.6 3.7 6.0 11.2 9.8 6.0 4.6 1.1 8.3 3.3 1.6 2.5 -5.2
(Question 1) BG 07-09 -38.6 -3.2 01-07 32.0 -0.1 -5.3 -3.4 -4.3 4.1 6.4 9.4 11.9 4.2 4.6 7.2 8.3
CZ 02-09 -58.0 13.1 04-95 78.6 -0.4 6.3 8.8 5.6 16.7 14.8 13.1 9.9 8.5 11.4 10.5 14.0
DK 04-09 -44.7 9.5 09-94 41.8 16.3 11.9 10.0 -0.1 1.5 22.9 19.0 8.6 13.1 2.6 8.2 11.4
DE 02-09 -48.5 -1.3 12-10 27.3 0.7 9.3 6.1 7.4 11.3 8.8 7.6 9.5 4.5 4.1 6.5 2.0
EE 04-09 -53.0 10.2 06-01 56.2 16.9 14.1 4.1 0.9 12.4 2.5 2.1 5.9 2.5 0.0 -4.1 -5.1
IE : : : : : : : : : : : : : : : : :
EL 03-09 -35.1 8.2 01-00 35.7 4.7 -9.4 -6.0 2.2 0.3 7.0 12.6 5.2 4.8 10.9 7.6 -3.6
ES 03-09 -52.0 -3.6 04-95 21.2 -9.7 -4.1 -0.8 -0.9 -2.8 4.2 -2.1 -0.1 3.7 -3.2 4.0 -2.2
FR 04-09 -44.4 3.5 06-00 35.1 -1.1 7.1 8.2 1.3 6.8 10.4 5.3 8.1 5.6 2.0 0.7 2.6
HR 04-09 -39.0 -4.1 05-08 24.5 1.1 0.7 -3.6 -1.1 8.4 15.6 5.0 17.9 12.7 13.9 11.0 13.5
IT 07-09 -64.8 -14.6 03-95 12.1 -24.1 -19.2 -23.2 -23.2 -20.8 -19.2 -19.7 -20.0 -17.5 -18.8 -20.2 -21.8
CY 06-13 -60.4 -14.9 09-08 47.2 -48.8 -48.4 -47.9 -36.4 -27.9 -21.3 -6.7 -4.3 -5.5 -3.5 -1.2 -8.6
LV 02-09 -49.5 1.7 06-01 29.6 -1.1 2.8 4.5 1.5 9.1 3.3 3.4 0.6 -3.6 -0.3 -1.0 -2.1
LT 01-09 -41.6 2.3 04-98 34.8 -1.5 -6.1 -2.5 16.0 17.1 15.6 9.3 13.9 9.5 3.6 2.1 -3.7
LU 12-08 -58.9 -3.7 08-10 44.4 -7.2 1.6 2.0 3.5 -1.0 -5.7 -2.6 14.1 14.7 9.9 1.6 6.6
HU 03-09 -57.4 -3.5 04-98 26.1 2.0 6.1 7.6 9.9 15.2 13.5 8.3 13.8 4.9 2.3 8.3 6.7
MT 04-09 -49.8 10.4 07-06 52.2 8.8 6.1 4.6 4.9 0.5 9.7 8.1 -18.2 0.4 26.0 18.1 14.5
NL 04-09 -44.7 2.4 12-10 24.9 5.6 7.4 9.2 14.9 13.3 11.5 6.8 8.0 6.0 4.0 7.6 9.5
AT 03-09 -41.9 12.8 04-11 39.9 12.8 14.5 10.6 13.4 11.6 17.6 15.9 19.7 16.4 5.8 13.5 6.7
PL 03-09 -32.4 1.2 12-06 28.4 1.0 3.4 1.4 5.8 8.0 7.8 7.2 6.1 6.2 4.1 6.7 3.1
PT 11-08 -50.1 -8.1 08-14 13.1 -9.6 -1.2 -4.0 0.3 2.6 3.0 -5.5 -6.9 -6.3 6.7 13.1 10.6
RO 04-09 -32.4 6.3 04-02 42.6 1.1 4.8 6.4 6.2 6.5 11.8 9.8 9.2 5.6 3.4 5.2 1.2
SI 12-08 -45.4 6.8 05-00 40.3 -3.5 6.7 -3.5 8.0 1.6 4.2 3.1 24.4 14.5 20.2 20.3 23.5
SK 03-09 -63.0 15.3 12-03 77.7 3.9 29.8 15.6 2.2 11.7 21.9 17.0 20.5 17.0 4.2 2.9 22.8
FI 02-09 -52.5 11.2 06-06 49.5 -9.9 -5.5 -1.0 7.2 9.2 9.3 11.5 -1.1 1.9 5.4 9.3 2.2
SE 04-09 -40.1 11.1 11-10 58.6 10.9 15.1 19.6 17.1 18.8 9.9 24.1 22.6 14.8 9.7 24.3 24.8
UK 05-09 -54.8 0.6 03-95 32.7 12.0 26.7 29.1 20.4 24.2 17.8 18.4 17.2 16.6 23.6 14.9 19.1
EXPORT EU 05-09 -62.3 -18.9 04-07 6.3 -18.1 -13.4 -12.9 -14.3 -13.5 -14.7 -14.0 -14.7 -15.2 -15.7 -13.9 -17.8
ORDER BOOKS EA 06-09 -64.4 -19.2 04-07 7.0 -18.2 -14.3 -14.3 -14.0 -13.4 -14.1 -15.0 -14.4 -15.1 -14.8 -14.1 -15.6
(Question 3) BE 05-09 -63.3 -21.6 06-00 7.4 -22.1 -15.6 -18.4 -13.0 -12.9 -16.4 -15.9 -18.0 -16.5 -22.2 -23.4 -15.2
BG 09-93 -68.5 -45.3 03-07 -18.9 -49.1 -48.4 -47.4 -49.4 -48.1 -43.8 -44.3 -33.9 -33.1 -33.6 -30.1 -29.2
CZ 03-09 -58.1 -4.9 09-00 26.7 -8.8 -6.9 -8.3 -7.6 -7.1 -5.7 -5.9 -6.4 -5.2 -6.5 -5.9 -2.9
DK 04-09 -61.6 -3.3 05-07 27.6 6.3 15.8 7.9 12.9 11.1 16.9 12.9 7.3 -0.2 -11.7 -14.4 -8.3
DE 06-09 -64.6 -20.7 04-11 13.1 -13.2 -8.1 -8.2 -10.6 -9.9 -9.9 -12.2 -9.7 -9.6 -11.0 -11.2 -12.3
EE 03-09 -66.9 -6.0 03-01 25.4 -17.5 -14.8 -21.1 -11.6 -14.1 -16.4 -15.2 -21.6 -20.7 -20.9 -17.9 -20.4
IE : : : : : : : : : : : : : : : : :
EL 05-09 -58.6 -17.7 03-95 11.9 -24.5 -18.3 -21.8 -23.8 -19.5 -18.0 -21.0 -15.1 -18.9 -12.2 -15.9 -24.3
ES 07-09 -61.1 -23.8 04-07 5.1 -23.8 -18.3 -15.4 -11.8 -11.7 -16.5 -11.1 -11.1 -14.1 -9.5 -8.1 -10.5
FR 07-09 -73.3 -14.6 06-00 34.3 -22.0 -20.8 -18.5 -14.5 -17.5 -15.7 -18.9 -21.2 -24.3 -20.2 -16.7 -20.9
HR 07-09 -65.9 -45.3 07-08 -24.8 -37.6 -40.9 -40.3 -36.7 -32.6 -32.8 -36.6 -36.3 -37.4 -33.5 -30.8 -35.8
IT 06-09 -71.4 -20.6 02-95 18.5 -18.0 -16.5 -20.4 -21.4 -17.2 -16.8 -16.2 -17.1 -18.7 -19.2 -19.3 -21.3
CY 10-09 -83.1 -35.4 05-05 -1.4 -39.2 -33.4 -32.8 -23.8 -28.4 -33.3 -28.8 -32.0 -36.0 -56.6 -38.2 -41.2
LV 03-09 -65.5 -32.6 03-07 -10.9 -29.2 -25.5 -22.7 -23.7 -27.8 -30.1 -24.6 -29.8 -29.9 -27.1 -27.5 -27.2
LT 07-09 -75.4 -34.7 08-07 28.1 -41.6 -44.0 -36.4 -43.6 -38.5 -31.8 -31.8 -36.3 -36.1 -33.1 -34.0 -39.5
LU 03-09 -91.1 -25.2 04-00 50.3 -48.5 -42.2 -42.1 -52.1 -57.6 -60.3 -56.1 -52.2 -49.9 -47.6 -58.8 -63.9
HU 04-09 -66.1 -18.6 12-00 5.9 -14.3 -16.1 -12.4 -11.0 -13.7 -8.4 -9.2 -6.2 -14.5 -9.4 -9.8 -14.7
MT 12-03 -76.0 -29.0 09-07 23.9 -37.3 -40.1 -36.2 -35.7 -29.1 -39.3 -33.7 -51.4 -47.1 -41.6 -36.7 -23.4
NL 04-09 -38.3 -8.4 09-00 9.6 -6.7 -5.9 -8.3 -6.1 -4.1 -4.8 -4.9 -4.4 -3.4 -3.9 -5.1 -5.0
AT 05-09 -66.5 -22.9 03-90 11.5 -31.9 -29.3 -28.8 -26.7 -24.8 -28.2 -25.5 -26.4 -27.7 -27.1 -23.7 -25.3
PL 12-01 -75.1 -55.4 09-07 -35.1 -51.7 -50.7 -50.1 -47.8 -49.1 -47.3 -47.7 -49.3 -49.8 -46.6 -47.4 -49.1
PT 04-09 -77.1 -22.0 01-95 18.8 -28.6 -23.8 -20.3 -8.4 -12.7 -9.2 -10.7 -12.2 -10.5 -16.7 -13.0 -14.4
RO 06-94 -39.5 -12.5 11-03 3.5 -12.2 -12.4 -10.6 -11.2 -9.9 -7.5 -5.1 -6.6 -5.1 -5.0 -9.8 -9.2
SI 04-09 -77.7 -16.6 05-07 18.0 -20.2 -14.0 -16.0 -15.5 -13.0 -14.3 -18.3 -9.2 -4.0 4.5 -2.3 -4.1
SK 03-99 -56.6 -12.0 01-94 52.6 -16.4 -12.7 -14.5 -17.8 -19.6 -14.1 -11.7 -11.4 -7.1 -7.2 -4.2 -6.6
FI 03-09 -71.9 -13.5 04-95 31.8 -31.7 -31.0 -27.1 -31.2 -23.0 -21.5 -23.6 -24.9 -28.7 -29.9 -27.5 -28.2
SE 02-09 -64.4 -3.6 08-91 44.4 -29.7 -12.3 -26.0 -19.3 -15.7 -23.5 -15.2 -12.0 -21.5 -22.1 -2.1 -11.9
UK 05-09 -60.5 -16.9 04-95 20.9 -6.4 2.1 9.4 -6.9 -4.4 -10.3 -1.0 -9.5 -5.6 -11.6 -5.7 -24.4
Ave.

8
TABLE 2 (continued) : Monthly survey of manufacturing industry (s.a.)
Since 1990 (*) 2013 2014
Min. Max.
Date Value Date Value Oct Nov Dec Jan Feb Mar Apr May Jun Jul Aug Sep
EMPLOYMENT EU 03-09 -40.5 -11.4 03-11 9.8 -4.8 -4.1 -3.4 -1.9 -3.1 -3.0 -2.6 -3.5 -2.6 -2.0 -3.0 -3.0
EXPECTATIONS EA 06-93 -39.8 -10.6 03-11 8.6 -7.3 -6.2 -4.7 -4.5 -4.8 -4.6 -5.7 -5.2 -4.9 -5.0 -5.3 -5.4
(Question 7) BE 03-09 -36.3 -8.3 10-00 8.8 -12.3 -11.7 -11.5 -10.5 -10.5 -8.7 -9.1 -10.3 -6.9 -7.0 -6.1 -4.5
BG 06-99 -45.3 -13.5 11-06 12.8 -6.5 -5.9 -6.0 -3.5 -1.2 -2.4 -0.5 3.8 3.9 3.4 4.8 4.1
CZ 02-09 -61.9 -11.2 02-11 18.3 -5.4 -0.3 2.6 -3.9 -4.8 -4.8 1.0 2.3 5.3 3.8 2.7 0.6
DK 04-09 -42.1 -2.7 04-14 15.9 9.1 12.7 12.4 6.4 2.2 4.5 15.9 -0.3 -1.1 -3.3 4.6 1.1
DE 06-93 -52.1 -13.8 03-11 17.1 -2.4 -1.3 1.1 1.5 0.9 -0.1 -1.8 -1.7 -1.4 -1.8 -2.8 -1.5
EE 04-92 -77.8 -8.0 11-06 22.2 4.4 1.2 3.0 6.3 7.9 -0.6 -0.9 0.8 -4.4 -5.7 -3.2 1.4
IE : : : : : : : : : : : : : : : : :
EL 02-09 -36.4 -5.7 05-02 11.8 -5.3 -12.3 -18.8 -7.3 -3.4 -7.9 -9.0 -12.2 -4.1 4.6 1.0 -1.2
ES 06-93 -51.9 -9.2 03-01 9.7 -5.9 -6.3 -5.9 -3.3 -11.5 -10.0 -10.4 -6.5 -5.5 -4.8 -6.4 -6.2
FR 09-93 -47.2 -13.9 09-00 13.8 -14.0 -15.2 -11.7 -13.9 -12.9 -11.9 -12.9 -11.3 -12.2 -11.3 -11.8 -12.9
HR 07-09 -28.2 -8.4 05-08 12.5 -10.5 -3.1 -3.9 -1.0 0.4 8.9 0.0 8.2 6.7 4.4 -1.1 -3.5
IT 08-96 -29.6 -5.5 11-00 11.6 -10.7 -7.9 -8.9 -8.4 -6.7 -6.2 -6.7 -5.6 -5.6 -7.8 -8.1 -9.1
CY 04-13 -37.2 0.5 10-04 38.0 -16.8 -10.8 -3.0 -8.4 -4.9 -10.1 -0.8 -3.1 5.5 -3.2 -10.6 -8.7
LV 04-93 -50.2 -5.6 11-05 13.4 0.4 3.7 2.6 1.9 -0.6 2.5 -0.3 -1.1 -0.8 3.0 -2.1 -0.2
LT 04-94 -59.1 -18.7 05-14 11.2 4.1 3.8 5.3 5.7 9.3 9.3 9.0 11.2 6.3 7.3 3.7 1.9
LU 04-09 -72.2 -26.2 06-10 25.4 -15.3 -14.6 -20.3 -23.4 -16.3 -17.3 -19.6 -15.9 -25.6 -24.5 -26.5 -26.6
HU 03-09 -47.4 -6.5 04-14 18.9 3.2 3.5 6.7 7.4 4.7 9.3 18.9 9.4 9.5 3.0 8.5 4.9
MT 05-09 -40.1 -4.2 09-14 21.8 8.6 6.2 5.0 -3.2 10.3 7.2 17.9 4.3 8.0 2.0 14.1 21.8
NL 04-09 -37.8 -6.5 04-90 13.1 -10.1 -12.4 -12.8 -12.3 -6.9 -7.4 -2.1 -4.8 -7.0 -2.8 -3.5 -2.1
AT 03-09 -39.4 -3.2 11-06 20.9 -10.1 -1.2 3.7 -3.2 2.6 1.0 -2.6 -3.1 0.0 -7.4 0.5 -1.9
PL 05-99 -50.7 -18.1 05-07 7.3 -7.6 -6.6 -5.3 -0.3 -0.9 1.8 1.3 -1.2 -2.0 -2.1 1.2 -1.9
PT 06-93 -24.5 -6.5 02-90 8.5 -6.9 -5.4 -6.4 -0.9 -1.3 -0.7 -1.7 -3.0 -2.0 -2.0 -4.9 -3.1
RO 07-92 -70.9 -21.4 03-12 2.9 -6.1 -3.4 -3.2 -0.3 -2.7 0.9 2.7 2.1 2.3 -1.4 1.2 0.8
SI 04-09 -53.8 -19.8 02-08 13.8 -11.7 -5.4 -8.7 -8.5 -6.9 -2.9 -3.2 3.3 6.0 8.7 6.1 1.4
SK 02-09 -57.1 -16.2 01-11 22.9 -0.5 2.7 -1.6 -5.7 -6.6 -2.9 -1.5 -4.0 -6.8 -2.3 -3.4 -8.4
FI 06-91 -58.7 -16.5 05-11 15.3 -18.8 -14.5 -11.6 -6.3 -15.1 -7.0 -7.8 -8.8 -13.5 -14.7 -11.0 -13.0
SE 03-09 -60.1 -16.8 02-11 26.3 -11.7 -11.5 -9.5 -7.2 -15.5 -15.2 -6.3 -14.6 -13.3 -5.3 -6.8 -5.4
UK 03-09 -51.3 -14.2 03-11 15.8 11.2 8.0 2.7 12.1 8.4 6.4 10.8 5.6 10.3 15.0 6.8 9.6
SELLING–PRICE EU 03-09 -14.5 5.7 02-95 27.0 1.2 2.1 3.1 3.6 1.3 0.3 0.1 0.0 0.7 1.5 0.7 -0.6
EXPECTATIONS EA 03-09 -15.7 5.3 02-95 25.1 1.1 1.5 2.4 2.4 -0.2 -0.7 -1.3 -1.3 -0.1 0.4 -0.7 -1.8
(Question 6) BE 04-09 -21.1 2.6 12-94 25.9 4.4 4.3 3.5 0.6 2.9 -0.7 -3.6 -1.6 -0.6 2.2 -0.1 -2.0
BG 08-09 -5.5 21.6 11-96 90.6 2.1 1.7 0.1 0.4 0.9 1.3 1.4 2.9 3.7 2.6 4.2 2.7
CZ 01-09 -17.4 12.5 03-95 69.9 -4.3 0.4 -0.1 5.1 -2.6 0.1 6.9 8.3 6.6 8.1 10.0 5.4
DK 10-09 -19.1 1.7 01-08 26.4 -3.6 -4.6 -17.3 -11.1 -3.2 -5.7 -13.5 -6.0 -8.2 -0.2 -7.9 -12.8
DE 03-09 -13.5 5.7 04-11 27.7 3.8 5.8 8.6 7.8 4.8 4.1 2.5 1.9 2.6 3.3 4.1 5.2
EE 02-09 -36.9 13.7 04-92 86.3 3.4 3.0 1.1 5.0 -2.1 0.7 0.0 2.7 1.6 2.4 -1.0 2.4
IE : : : : : : : : : : : : : : : : :
EL 03-09 -18.1 12.1 10-90 40.6 -7.4 -3.8 -8.4 -7.5 -4.9 -5.8 -7.0 -10.4 -8.5 -7.3 -6.6 -6.2
ES 03-09 -20.3 1.3 03-95 33.0 -2.1 -4.6 -4.2 -5.7 -10.8 -8.7 -7.2 -7.4 0.2 -6.8 -5.8 -6.2
FR 01-99 -24.7 2.1 03-11 32.9 -1.8 -5.9 -6.7 1.0 -6.1 -7.0 -3.6 -4.5 -6.2 -2.7 -7.0 -14.2
HR 02-09 -21.9 -2.4 07-08 30.9 -5.6 -2.0 -5.1 -0.6 -6.2 -2.8 -0.1 -1.4 -1.7 5.6 6.2 -0.7
IT 07-09 -13.6 8.8 03-95 39.9 1.3 0.5 0.8 0.2 -1.5 -1.8 -2.7 -1.4 0.3 1.0 -0.7 -2.6
CY 04-13 -18.5 3.5 10-03 38.7 -4.1 -5.7 1.0 -6.2 -6.2 -9.2 -2.4 0.8 -2.9 -1.3 3.6 -5.3
LV 02-09 -25.8 14.9 07-94 51.5 5.6 8.9 8.9 9.4 11.2 2.8 0.5 1.9 5.3 4.6 -0.3 0.0
LT 04-09 -36.2 10.8 11-93 75.0 6.2 6.4 6.6 0.9 3.8 1.8 -4.7 -7.7 -6.7 7.4 4.9 -4.3
LU 08-91 -52.5 -5.3 12-94 51.2 -14.8 -4.0 -31.6 -39.8 -23.3 -29.5 -16.8 -11.4 -8.3 -3.5 -16.7 -6.0
HU 01-09 -17.3 15.4 01-01 49.4 -0.6 -1.0 0.7 0.3 4.0 0.1 4.1 5.6 1.3 6.1 3.1 2.1
MT 12-04 -41.7 -9.6 12-03 36.1 -10.8 -23.8 -9.7 -11.0 -25.7 -18.7 -19.9 -21.3 -13.2 -25.1 -14.6 -21.4
NL 04-09 -14.3 7.2 03-11 25.7 -1.5 4.2 1.4 1.8 2.3 1.5 2.2 2.3 4.0 4.9 1.5 1.0
AT 03-09 -28.7 1.3 03-11 30.3 1.2 4.3 8.1 2.6 1.1 -2.2 -1.8 0.6 -1.1 1.4 -2.0 -4.1
PL 04-09 -5.9 12.4 06-93 40.8 1.2 0.0 0.9 -2.1 0.3 -1.8 -1.1 -0.4 2.0 -1.5 1.8 -0.7
PT 01-09 -25.3 4.4 10-90 27.3 9.6 8.1 7.7 -5.2 -0.1 -1.2 -6.9 -5.1 -8.0 -11.8 -13.9 -14.1
RO 02-10 -2.4 35.6 10-93 91.2 1.4 6.0 3.4 4.4 3.5 3.7 8.0 5.9 5.9 2.3 1.5 1.6
SI 03-09 -32.1 -4.1 03-11 25.9 -10.5 -1.7 -6.4 -9.7 -6.6 -7.0 -7.5 -7.9 -0.8 0.6 -4.1 -6.2
SK 07-11 -44.4 18.9 04-95 81.2 4.5 8.1 -13.5 -12.5 4.8 16.9 4.6 -5.9 -7.9 -0.6 -9.9 -9.2
FI 03-09 -30.7 4.7 08-94 51.2 -6.1 -8.4 -3.5 -3.6 0.2 -2.1 -7.5 -4.9 -6.6 -6.0 -5.9 -3.6
SE 06-09 -17.7 6.9 12-94 40.7 5.1 5.9 8.4 11.7 8.8 8.5 8.2 9.9 5.6 7.5 11.6 11.8
UK 01-99 -28.2 4.6 07-08 40.9 3.8 7.0 10.2 11.4 9.4 5.5 6.8 3.5 3.7 5.5 4.9 3.8
(*) Minimum, maximum and averages are calculated over the period of availability which is not necessarily as from 01/1990.
(a) The indicator is the arithmetic average of the balances (%) of the questions on production expectations, order-books and stocks (the last with inverted sign).
(b) Highest figure is considered as a minimum, lowest figure is considered as a maximum.
Ave.

9
TABLE 3: Monthly survey of services (s.a.)
Since 1990 (*) 2013 2014
Min. Max.
Date Value Date Value Oct Nov Dec Jan Feb Mar Apr May Jun Jul Aug Sep
SERVICES EU 03-09 -31.1 8.5 06-98 33.5 3.6 4.2 5.6 7.3 8.5 8.4 8.9 8.2 9.8 8.9 7.4 7.4
CONFIDENCE EA 03-09 -26.1 9.0 08-98 35.4 -3.6 -0.8 0.4 2.4 3.3 4.5 3.5 3.8 4.4 3.6 3.1 3.2
INDICATOR (a) BE 04-09 -42.9 11.4 08-07 32.2 11.3 14.7 12.3 12.6 20.5 12.7 11.5 19.2 16.1 14.2 15.4 9.5
BG 06-10 -13.6 10.3 03-07 33.4 3.3 3.9 8.7 9.4 8.6 10.2 8.1 10.2 8.4 7.9 1.0 -0.7
CZ 09-09 6.4 33.5 02-07 52.6 26.1 25.8 27.9 26.6 25.5 27.8 25.8 24.8 29.0 27.7 29.9 30.1
DK 02-13 -10.4 4.8 05-10 28.4 8.7 6.2 6.7 7.0 1.7 1.6 -0.2 6.9 6.8 6.1 7.1 4.3
DE 12-02 -19.9 17.9 03-99 50.1 10.2 12.1 12.7 16.5 17.7 15.0 14.8 14.6 15.0 12.1 10.6 12.5
EE 02-09 -50.3 11.0 01-06 38.3 13.1 16.0 13.9 15.8 14.4 17.2 14.1 0.4 -0.7 -8.7 -1.6 2.1
IE : : : : : : : : : : : : : : : : :
EL 10-12 -46.0 10.1 08-00 58.7 -7.1 -8.1 -4.9 2.5 4.5 4.9 6.0 6.5 18.4 19.7 22.3 14.8
ES 01-09 -38.7 9.3 06-98 54.0 -7.2 -4.9 2.9 7.6 3.3 11.6 8.4 6.4 12.5 7.0 6.4 13.1
FR 04-09 -28.8 -0.4 01-90 16.2 -9.6 -6.4 -9.9 -9.5 -8.9 -7.1 -6.3 -5.4 -7.1 -7.0 -5.9 -6.5
HR 07-09 -31.6 -5.6 05-08 20.8 -5.0 -5.1 -3.6 -3.9 1.3 3.3 3.8 2.3 4.0 3.5 1.6 3.0
IT 06-13 -27.0 1.5 04-00 33.1 -23.4 -17.8 -14.8 -12.9 -9.7 -5.7 -10.1 -9.9 -10.3 -4.2 -6.5 -8.3
CY 04-13 -59.0 -1.9 08-07 35.4 -29.7 -20.7 -24.2 -16.5 -16.5 -12.4 0.0 5.6 4.5 7.0 2.5 5.7
LV 03-09 -43.9 4.4 12-06 20.9 3.7 5.2 3.5 6.8 7.7 4.1 4.0 2.5 2.3 2.8 1.2 -0.8
LT 03-09 -47.2 7.4 07-06 34.3 -6.2 -5.9 -3.9 -1.3 2.3 2.0 2.6 -0.7 -1.5 -6.3 -3.7 -8.5
LU : : : : : : : : : : : : : : : : :
HU 03-09 -44.2 -9.3 03-02 13.8 -2.5 -0.6 1.5 4.4 6.4 5.4 8.5 5.5 12.7 6.2 2.2 6.7
MT 03-09 -22.0 19.7 05-07 65.2 19.1 20.0 21.4 31.1 23.6 27.3 19.6 22.7 23.4 28.2 28.6 24.4
NL 03-09 -41.6 5.9 04-07 46.5 -3.4 -0.2 4.1 3.5 3.0 7.3 5.8 5.5 6.3 3.4 2.0 3.7
AT 04-09 -24.9 14.5 06-98 33.4 18.4 16.9 14.6 9.5 14.2 14.1 16.6 12.5 12.6 8.1 7.8 2.2
PL 03-09 -12.0 4.0 07-07 22.7 -2.3 -2.1 -0.9 1.5 1.3 0.7 1.7 -0.4 1.4 0.9 0.8 1.3
PT 10-12 -38.0 -4.5 06-01 24.7 -14.3 -13.3 -9.1 -6.0 -6.9 -3.1 -4.4 -0.1 2.8 4.0 2.6 0.4
RO 06-09 -19.3 12.7 06-04 56.2 0.3 1.5 -1.9 -0.2 5.6 3.6 2.5 4.0 2.3 1.3 8.9 7.7
SI 04-09 -28.9 12.5 09-02 38.0 -13.8 -9.7 -10.5 -5.6 -6.1 -3.4 2.6 8.7 7.1 7.3 7.0 8.5
SK 05-09 -24.0 27.9 03-02 62.6 6.1 5.3 7.2 8.0 2.9 4.5 11.7 19.6 23.1 23.7 15.0 13.5
FI 12-01 -47.6 14.7 09-00 51.1 -1.1 -4.3 6.4 4.3 1.3 0.1 -1.9 -2.1 0.6 -2.0 5.9 -7.4
SE 04-09 -26.3 19.3 02-11 53.0 22.1 25.1 26.7 33.0 29.6 27.8 25.0 26.5 25.5 22.1 25.6 20.8
UK 03-09 -57.4 3.7 10-97 36.1 29.4 21.0 23.9 23.2 27.1 22.3 29.9 24.2 29.6 29.1 22.1 22.5
ASSESSMENT EU 03-09 -36.2 3.0 04-00 33.7 -1.8 -0.3 -0.3 1.6 2.7 3.7 4.7 5.6 6.0 3.9 2.3 2.9
OF BUSINESS EA 03-09 -31.5 5.0 08-00 41.7 -6.6 -4.0 -2.1 -0.6 0.5 3.2 2.3 3.2 2.6 1.7 1.1 1.1
SITUATION BE 04-09 -55.1 0.3 07-07 31.7 3.5 14.1 6.8 13.4 15.0 12.6 9.6 16.7 10.1 6.7 7.5 1.9
OVER THE PAST BG 06-10 -14.1 8.8 05-02 46.1 -5.3 -1.0 2.8 6.4 2.1 6.6 -1.7 4.1 1.0 3.1 -2.0 -2.9
3 MONTHS CZ 09-09 25.2 54.5 07-02 74.7 50.6 51.3 50.3 48.1 49.2 51.5 48.8 49.8 52.6 50.4 49.5 51.5
(Question 1) DK 12-11 -16.1 1.3 05-10 26.3 7.3 6.3 5.8 7.5 -1.2 0.6 -1.2 7.4 1.6 3.6 0.9 3.0
DE 01-03 -38.8 16.6 12-98 59.3 9.2 10.7 13.5 15.9 18.5 16.3 16.7 12.7 12.0 11.0 10.4 11.8
Component of the EE 04-09 -54.0 13.3 11-02 47.4 18.5 23.5 18.1 20.3 21.2 23.5 22.4 7.2 5.8 -8.5 -5.5 -0.4
services confidence IE : : : : : : : : : : : : : : : : :
indicator EL 08-12 -47.3 1.5 09-00 54.7 -4.8 -6.4 -2.3 -5.1 1.4 -0.7 1.9 13.9 19.6 18.9 13.3 13.7
ES 05-09 -49.0 4.9 04-00 64.9 -15.8 -11.5 -4.6 0.9 -5.9 2.6 1.2 2.0 6.8 2.3 0.3 9.0
FR 07-91 -34.1 -3.7 12-04 18.4 -12.0 -9.9 -13.8 -14.4 -11.6 -10.5 -7.3 -4.8 -8.2 -11.7 -9.1 -9.0
HR 07-09 -39.6 -11.2 05-08 13.7 -8.9 -7.7 -7.0 -11.6 -2.8 -1.4 0.5 -2.3 -0.1 -1.3 -2.6 3.6
IT 10-02 -34.7 0.9 04-00 55.9 -23.8 -19.9 -15.8 -14.3 -12.3 -1.9 -9.8 -4.9 -6.6 -0.8 -4.1 -8.0
CY 04-13 -64.8 -9.9 06-08 27.9 -33.5 -27.8 -34.1 -28.8 -27.2 -13.8 -12.1 1.4 -4.0 0.3 -6.3 -0.4
LV 03-09 -42.4 3.1 04-03 20.4 3.3 5.5 4.5 6.8 6.0 5.0 4.1 2.6 2.6 4.3 2.8 0.7
LT 05-09 -49.5 7.0 03-03 50.9 -8.6 -12.1 -8.3 -4.5 0.7 0.2 1.7 -4.3 5.5 -1.4 -2.9 -7.7
LU : : : : : : : : : : : : : : : : :
HU 02-09 -40.9 -10.2 05-02 17.9 -1.1 0.0 2.2 6.1 4.1 5.9 7.6 5.6 10.9 1.9 1.3 7.5
MT 03-09 -31.9 18.1 05-07 75.7 20.4 12.5 19.3 26.5 26.3 16.5 20.7 19.3 26.2 26.5 27.2 21.3
NL 07-93 -68.7 -20.0 05-07 49.7 -10.0 -6.9 -0.7 -1.9 -2.8 2.8 1.3 1.4 2.2 2.9 -2.9 0.2
AT 06-09 -28.3 10.4 03-98 31.1 11.4 14.7 7.3 8.8 14.1 17.0 16.7 9.4 12.2 5.7 9.4 1.8
PL 03-09 -14.1 3.3 08-07 20.3 -4.1 -3.6 -2.1 -0.6 -0.9 -1.7 -0.7 -2.3 -0.4 -0.6 -0.6 -0.3
PT 11-12 -43.8 -7.6 11-97 21.6 -16.8 -17.1 -14.3 -12.4 -12.5 -7.1 -5.7 2.3 5.1 7.3 4.2 1.1
RO 05-09 -18.0 15.5 04-03 67.0 -1.6 -2.5 -3.4 -3.5 4.3 3.5 1.5 3.1 0.5 -0.8 8.4 5.4
SI 10-12 -19.6 18.0 10-02 56.8 -6.1 -7.1 -4.3 -2.2 -1.0 1.4 6.0 13.9 10.9 8.9 12.4 14.2
SK 04-09 -28.9 23.3 06-03 63.2 -1.4 2.0 9.8 12.2 -1.9 -6.8 -14.5 10.8 20.1 24.6 13.2 14.2
FI 12-01 -92.4 9.3 12-02 99.0 -8.6 -21.4 -1.2 -4.9 -10.4 -4.9 -10.5 -13.9 -9.5 -14.4 -3.6 -23.1
SE 01-02 -60.2 14.5 02-11 52.9 18.6 22.8 23.6 31.3 29.8 24.2 25.4 27.8 25.9 20.5 22.4 20.2
UK 03-09 -64.0 -10.7 12-97 26.9 11.6 9.0 1.3 3.7 6.6 2.1 11.7 11.4 15.6 8.5 2.2 5.1
EVOLUTION EU 03-09 -31.7 7.3 08-98 30.7 1.2 1.8 6.2 7.0 8.4 8.2 7.6 9.1 8.1 9.4 7.1 7.7
OF DEMAND EA 03-09 -26.6 7.5 03-00 34.1 -6.9 -2.8 -0.4 -0.2 2.4 3.5 1.5 2.2 1.9 3.1 2.3 1.6
OVER THE PAST BE 04-09 -45.0 10.7 05-11 35.7 10.8 15.5 13.1 13.9 22.8 8.1 10.5 23.3 17.0 13.1 25.2 7.9
3 MONTHS BG 06-10 -25.0 3.6 01-07 29.2 -5.8 -8.2 0.0 0.1 0.4 2.7 4.3 -1.0 -0.1 2.0 -7.0 -10.0
(Question 2) CZ 08-09 -13.0 20.5 04-07 43.9 7.8 7.5 12.2 11.9 4.6 11.3 10.6 12.9 18.5 15.6 21.6 17.3
DK 04-13 -13.9 3.6 05-10 32.6 8.0 3.3 3.9 3.9 -1.4 -0.3 -4.9 7.5 4.0 5.3 4.0 1.1
Component of the DE 01-03 -26.5 15.1 09-98 41.2 7.6 9.7 12.8 14.2 17.8 16.4 10.3 12.4 12.3 12.3 11.6 11.3
services confidence EE 04-09 -60.8 10.7 01-06 48.6 15.6 19.3 11.9 16.0 13.6 23.2 17.5 4.2 -1.9 -12.4 -11.1 -7.1
indicator IE : : : : : : : : : : : : : : : : :
EL 10-12 -50.4 12.2 06-01 67.7 -6.7 -6.3 -8.9 4.9 7.1 -1.3 1.9 -4.6 15.5 23.7 26.0 11.5
ES 05-09 -51.2 1.3 06-98 53.8 -20.3 -15.0 -9.3 -2.8 -10.3 1.2 -2.8 -5.8 2.1 0.7 -0.2 4.1
FR 04-09 -27.7 1.3 01-90 18.9 -8.8 -5.2 -5.6 -7.2 -4.2 -3.7 -1.7 -0.8 -5.9 -5.8 -5.5 -2.4
HR 07-09 -35.9 -8.4 05-08 23.5 -10.0 -10.3 -6.8 -9.8 -2.7 2.7 -0.1 -2.5 1.6 -1.2 -1.4 -0.6
IT 08-02 -43.8 -5.9 03-01 22.7 -30.5 -24.5 -19.4 -21.1 -13.6 -11.6 -14.0 -14.5 -15.3 -4.8 -10.4 -14.5
CY 04-13 -57.5 -4.5 05-08 39.0 -35.4 -26.9 -33.6 -25.9 -24.8 -23.0 -7.2 -6.5 -0.2 -0.8 4.8 5.7
LV 04-09 -48.0 2.2 11-06 20.9 -1.1 -0.2 1.5 3.3 7.6 3.4 3.2 0.8 -1.4 -0.2 0.1 -5.6
LT 03-09 -55.3 7.8 07-06 45.4 -11.8 -6.7 -5.3 -0.9 -1.5 0.2 3.7 0.4 -6.3 -8.9 -4.0 -13.2
LU : : : : : : : : : : : : : : : : :
HU 09-09 -47.3 -11.4 06-14 12.4 -3.3 -0.5 -4.8 3.3 8.0 6.4 7.0 8.1 12.4 8.1 2.1 6.6
MT 06-09 -26.3 20.0 05-07 69.9 22.7 28.5 26.5 40.4 18.3 29.5 16.4 22.3 24.8 31.6 37.5 23.1
NL 03-09 -36.1 19.6 06-98 78.5 -3.7 1.8 6.4 4.1 3.6 11.6 7.1 7.0 7.6 2.9 1.3 3.4
AT 04-09 -25.5 17.1 08-00 43.1 14.1 24.1 16.0 8.7 10.7 14.3 21.1 13.1 9.6 9.2 0.7 1.3
PL 01-03 -22.4 1.1 07-07 21.8 -3.0 -3.6 -2.7 -0.6 -1.1 0.2 0.7 -2.8 -0.8 -1.2 -0.9 -0.9
PT 10-12 -45.5 -7.0 06-01 21.7 -16.4 -16.0 -10.1 -9.1 -11.6 -6.6 -7.4 -0.9 0.6 1.6 -0.2 -3.0
RO 05-09 -19.4 10.0 06-04 56.9 -0.6 0.9 -0.5 0.6 7.3 7.2 5.5 4.7 0.4 -0.1 6.0 6.9
SI 06-09 -41.5 6.2 03-06 36.7 -21.6 -14.3 -15.2 -12.5 -8.6 -9.1 1.8 6.7 0.9 -2.9 -4.6 -0.2
SK 05-09 -30.2 27.5 07-03 65.5 -4.8 -6.1 10.3 8.9 8.7 11.0 18.1 17.5 14.0 22.8 22.0 14.5
FI 10-01 -41.1 18.3 04-01 71.6 -0.2 7.3 9.3 6.2 4.1 -4.7 -7.6 -1.0 3.3 -1.1 6.7 -3.6
SE 02-09 -30.4 18.5 01-01 53.3 15.0 20.6 19.4 28.8 23.0 24.6 18.8 22.7 23.7 20.3 25.0 20.0
UK 03-09 -56.1 6.2 01-97 41.7 31.9 17.6 32.6 33.7 32.5 26.1 33.1 36.4 31.6 35.1 24.5 31.7
Ave.

10
TABLE 3 (continued) : Monthly survey of services (s.a.)
Since 1990 (*) 2013 2014
Min. Max.
Date Value Date Value Oct Nov Dec Jan Feb Mar Apr May Jun Jul Aug Sep
EVOLUTION OF EU 03-09 -25.4 15.4 12-97 40.7 11.4 11.1 11.0 13.3 14.4 13.4 14.6 10.0 15.3 13.6 13.0 11.6
DEMAND EXPECTED EA 03-09 -20.1 14.9 08-00 41.9 2.7 4.4 3.6 8.0 7.0 6.7 6.7 5.9 8.6 6.1 5.9 6.8
OVER THE NEXT BE 02-09 -31.9 23.3 07-00 47.1 19.7 14.7 17.0 10.6 23.5 17.4 14.3 17.5 21.2 22.7 13.6 18.7
3 MONTHS BG 06-10 -1.6 18.6 05-02 49.2 20.9 20.9 23.4 21.7 23.3 21.2 21.6 27.5 24.2 18.6 11.9 10.8
(Question 3) CZ 06-09 -1.8 25.7 02-07 50.4 20.0 18.6 21.3 19.9 22.7 20.8 18.0 11.7 16.0 17.1 18.5 21.4
DK 01-12 -7.7 9.5 01-11 35.4 10.9 9.2 10.3 9.7 7.5 4.4 5.6 5.9 14.9 9.4 16.4 8.6
Component of the DE 11-01 -15.7 22.1 09-00 60.0 13.7 15.9 11.7 19.5 16.7 12.4 17.4 18.7 20.6 13.0 9.9 14.5
services confidence EE 03-09 -46.2 9.1 12-05 32.9 5.3 5.1 11.7 11.3 8.5 4.8 2.5 -10.4 -6.1 -5.2 11.9 13.7
indicator IE : : : : : : : : : : : : : : : : :
EL 10-12 -47.8 16.5 09-01 73.5 -9.9 -11.7 -3.5 7.8 4.9 16.6 14.2 10.2 20.3 16.4 27.7 19.2
ES 02-09 -27.0 21.6 06-98 57.6 14.5 11.9 22.5 24.8 26.1 30.9 26.9 23.0 28.6 17.9 19.1 26.2
FR 04-09 -28.1 1.4 11-06 17.4 -8.1 -4.0 -10.3 -6.9 -10.8 -7.2 -9.8 -10.7 -7.3 -3.5 -3.1 -8.2
HR 03-09 -21.8 2.9 07-08 27.1 3.9 2.7 3.1 9.6 9.5 8.7 10.9 11.7 10.5 13.0 8.8 6.0
IT 04-96 -31.3 10.2 06-98 42.0 -15.8 -9.0 -9.3 -3.4 -3.2 -3.6 -6.3 -10.4 -9.0 -6.8 -5.0 -2.3
CY 04-13 -54.6 8.7 03-07 47.6 -20.3 -7.3 -4.8 5.2 2.6 -0.4 19.5 21.9 17.8 21.4 9.1 11.7
LV 03-09 -43.3 7.9 12-06 27.8 9.0 10.4 4.6 10.2 9.4 4.1 4.7 3.9 5.8 4.2 0.8 2.6
LT 03-09 -41.3 7.5 01-08 30.3 1.8 1.0 1.8 1.4 7.5 5.5 2.4 1.6 -3.6 -8.6 -4.1 -4.7
LU : : : : : : : : : : : : : : : : :
HU 03-09 -48.7 -6.4 02-02 16.7 -3.2 -1.2 7.1 3.8 7.1 3.9 11.0 3.0 14.8 8.5 3.1 5.9
MT 04-09 -17.7 20.9 08-07 52.6 14.3 19.1 18.6 26.3 26.2 35.7 21.8 26.3 19.4 26.4 20.9 28.8
NL 02-09 -30.1 15.8 02-07 58.9 3.6 4.4 6.4 8.2 8.0 7.6 8.9 8.1 9.0 4.6 7.5 7.3
AT 02-09 -30.6 15.9 12-96 36.7 29.6 12.0 20.5 10.9 17.9 11.1 12.0 15.1 16.1 9.2 13.4 3.4
PL 03-03 -15.1 7.8 12-07 28.2 0.2 0.9 2.0 5.6 5.9 3.7 5.0 4.0 5.4 4.4 3.9 5.1
PT 11-12 -27.3 1.2 06-01 33.1 -9.5 -6.8 -2.9 3.6 3.6 4.3 -0.2 -1.5 2.7 3.2 3.9 3.2
RO 06-09 -22.9 12.8 06-04 51.4 3.2 6.2 -1.6 2.2 5.4 0.1 0.3 4.1 6.1 4.7 12.2 10.8
SI 04-09 -30.0 13.5 07-08 43.2 -13.8 -7.7 -12.0 -2.1 -8.5 -2.5 0.0 5.6 9.5 15.7 13.3 11.4
SK 03-09 -19.0 32.9 01-02 85.5 24.5 19.9 1.5 3.0 1.9 9.3 31.4 30.6 35.2 23.7 9.9 11.8
FI 07-02 -41.0 16.4 04-00 51.9 5.5 1.1 11.2 11.4 10.4 10.0 12.3 8.7 8.1 9.6 14.6 4.4
SE 04-09 -25.7 24.8 02-01 66.0 32.7 31.8 37.1 39.0 36.1 34.5 30.9 29.0 27.0 25.4 29.4 22.1
UK 01-09 -54.1 15.7 10-97 55.7 44.8 36.4 37.8 32.3 42.1 38.5 45.0 24.8 41.5 43.7 39.5 30.7
EVOLUTION OF EU 06-09 -22.2 5.3 02-99 27.5 -1.7 1.7 5.4 3.7 2.6 4.3 7.7 7.3 5.5 6.8 4.6 5.9
EMPLOYMENT EA 05-09 -18.3 6.2 02-99 30.6 -3.9 -2.0 1.8 -0.2 -1.9 -0.9 2.2 1.9 1.3 2.8 0.5 2.0
OVER THE PAST BE 04-09 -46.0 6.3 12-99 33.7 -0.1 2.0 5.6 -4.6 5.9 12.2 6.9 8.5 7.6 15.4 5.5 2.1
3 MONTHS BG 08-12 -30.5 -9.0 08-07 9.6 -15.7 -24.8 -9.3 -7.8 -0.7 -3.8 -2.2 -3.6 0.0 -1.9 -0.9 -4.7
(Question 4) CZ 07-09 -43.9 -7.9 11-02 27.0 -27.5 -29.1 -25.6 -17.5 -11.7 -15.9 -5.8 -2.5 -1.0 -6.9 -6.2 -4.4
DK 06-12 -17.5 -6.8 04-11 7.5 -1.6 -5.2 -3.9 -1.3 -9.1 -5.1 -9.4 -5.1 -1.9 -3.4 -5.0 -8.5
DE 12-02 -21.3 11.6 03-99 42.3 8.1 10.4 10.8 14.5 10.8 11.0 14.6 11.7 13.5 15.2 13.8 16.3
EE 02-09 -28.2 3.9 01-11 18.0 4.1 4.8 5.3 4.9 1.7 4.9 8.3 8.3 3.2 0.5 4.6 7.2
IE : : : : : : : : : : : : : : : : :
EL 06-01 -44.5 -4.0 06-00 41.9 -16.0 -26.2 -24.5 -8.5 -4.7 -13.0 -8.3 -13.5 -13.5 -2.2 6.5 -2.3
ES 02-10 -25.7 4.7 08-98 44.0 -4.8 -10.5 -2.4 -5.5 -6.5 -5.5 -6.6 -0.8 2.0 2.8 -5.6 0.8
FR 05-09 -26.7 1.9 02-01 25.4 -6.3 0.3 4.7 1.6 1.3 -2.7 4.5 3.4 2.9 4.1 1.0 0.7
HR 11-09 -12.0 -3.5 05-08 14.0 -4.7 -4.0 -3.9 -4.4 -6.3 -3.6 -0.9 0.5 3.5 -4.5 9.1 7.2
IT 02-14 -21.6 2.7 04-06 27.9 -10.1 -13.2 -3.9 -11.9 -21.6 -11.7 -8.8 -9.2 -16.0 -17.9 -19.3 -15.8
CY 10-12 -19.9 -0.4 07-08 36.4 -7.4 -9.3 -7.8 -3.1 2.7 -1.4 -1.5 -6.8 -1.0 2.3 -7.2 10.2
LV 08-09 -47.9 -0.2 12-06 17.6 -3.2 0.4 2.7 0.2 1.1 -1.3 -1.8 -1.2 -0.9 2.4 -0.2 -0.2
LT 08-09 -54.9 -1.4 04-07 42.2 12.9 13.2 9.2 1.7 6.6 1.1 4.6 12.9 8.0 10.7 3.4 9.0
LU : : : : : : : : : : : : : : : : :
HU 04-09 -29.5 -9.9 09-14 6.5 -2.9 -2.7 0.1 1.5 0.2 6.1 4.0 5.9 3.2 3.8 2.8 6.5
MT 03-09 -22.4 6.4 05-07 38.5 2.8 11.3 19.5 15.9 17.8 10.0 20.8 11.8 24.9 33.5 9.2 9.0
NL 07-09 -37.6 1.5 09-98 51.8 -17.7 -17.8 -15.0 -13.5 -13.0 -13.8 -9.7 -7.6 -8.0 -5.5 -3.1 -1.2
AT 08-09 -22.8 8.7 01-13 27.1 -16.5 5.3 5.9 -20.6 0.9 3.4 1.8 1.8 1.7 6.6 2.5 -3.1
PL 01-04 -17.0 -1.6 01-08 12.8 -3.9 -3.6 -4.1 -4.7 -3.9 -0.9 -1.5 -2.0 -1.5 -2.6 -2.2 -3.6
PT 05-03 -38.6 -9.6 07-98 23.3 -9.3 -7.9 -8.0 -3.3 -2.9 -1.9 -3.7 -2.3 -3.0 -2.4 -0.5 -0.3
RO 01-03 -28.8 -2.2 12-04 23.7 -7.0 -11.2 -11.3 -9.4 -6.3 -5.8 -6.5 -5.8 -3.8 -4.9 -0.5 -4.9
SI 04-10 -36.7 -5.3 04-08 26.3 -26.0 -22.9 -21.6 -18.9 -24.1 -20.5 -15.9 -10.7 -11.8 -11.7 -9.5 -8.2
SK 12-04 -67.6 -26.4 08-10 10.0 -22.8 -19.1 -13.6 -18.6 -9.1 -12.8 -11.4 -19.6 -7.5 -14.3 -9.6 -23.5
FI 07-03 -36.6 13.3 11-97 88.0 -11.9 -1.3 -10.0 -6.8 -4.2 -4.3 -4.1 -1.8 -7.5 -6.1 -3.5 -5.2
SE 04-03 -39.9 3.1 01-01 42.1 -6.8 -8.2 -3.4 0.2 2.5 -0.8 5.8 4.8 0.5 1.4 2.6 -2.8
UK 07-09 -41.4 4.2 05-07 35.3 9.5 21.7 25.4 23.3 23.3 28.2 33.7 33.3 25.2 27.3 24.2 26.1
EVOLUTION OF EU 02-09 -20.9 6.4 10-99 23.1 0.3 2.8 6.2 5.6 6.2 5.6 8.7 6.0 5.4 7.1 7.7 7.0
EMPLOYMENT EA 04-09 -16.6 5.1 01-01 21.4 -3.1 -1.3 -1.2 0.4 1.1 1.8 2.3 0.9 1.7 -0.4 1.3 2.2
EXPECTED BE 03-09 -33.9 16.9 12-99 45.2 13.3 13.6 17.2 13.0 19.4 23.9 19.6 22.4 18.8 14.5 18.3 25.6
OVER THE NEXT BG 05-02 -30.9 -7.6 04-08 15.4 -11.2 -8.8 -9.5 -8.3 -4.5 -7.7 -4.1 -1.6 -1.9 -4.3 -7.6 -9.3
3 MONTHS CZ 06-13 -33.5 -11.4 01-08 16.6 -15.6 -11.7 -15.8 -15.8 -16.2 -11.2 -6.6 -9.7 -10.4 -14.8 -12.1 -11.6
(Question 5) DK 01-12 -18.8 -4.0 01-11 13.5 -4.3 -3.1 0.1 1.3 -8.7 -3.4 -3.1 -1.6 0.5 0.4 -2.6 -1.6
DE 02-09 -14.0 4.0 04-11 18.2 4.7 9.5 7.4 7.6 12.8 9.9 10.8 9.5 9.4 9.1 12.1 9.1
EE 03-09 -26.9 10.5 03-05 27.0 10.1 10.8 11.5 12.7 13.9 11.7 8.9 6.0 5.4 8.5 19.8 18.1
IE : : : : : : : : : : : : : : : : :
EL 11-12 -41.5 0.2 05-99 46.7 -19.5 -18.7 -14.8 -10.5 -4.9 2.9 12.0 4.8 3.7 6.8 7.7 -1.1
ES 02-09 -16.1 8.8 04-00 40.4 -4.0 -5.5 -1.7 6.1 -0.2 -0.4 5.0 4.9 7.7 0.5 1.2 4.7
FR 05-09 -27.9 1.0 12-00 21.9 -3.4 -3.6 -4.6 -3.5 -6.3 -1.8 -1.3 -2.3 -1.1 -2.1 -0.7 0.0
HR 08-09 -11.0 -2.6 05-08 16.9 -3.1 -7.1 -4.7 -2.2 -0.4 5.7 5.3 3.3 7.7 2.8 -1.0 2.8
IT 07-14 -18.4 3.4 04-00 26.2 -12.4 -11.0 -9.0 -11.8 -8.1 -8.1 -9.0 -15.4 -13.3 -18.4 -17.5 -10.3
CY 04-13 -26.1 1.5 07-08 30.0 -10.7 -4.3 -0.7 -6.6 -7.9 -8.2 -6.3 -4.8 -3.1 4.2 0.8 6.9
LV 04-09 -39.9 3.5 08-06 20.4 -0.9 0.4 1.5 3.2 2.9 0.8 -0.1 0.1 0.5 3.6 0.0 -0.7
LT 05-02 -48.9 1.3 01-07 35.1 12.7 14.7 13.2 3.6 1.6 3.9 10.5 10.8 13.7 10.9 2.6 6.2
LU : : : : : : : : : : : : : : : : :
HU 04-09 -31.2 -6.0 03-14 9.7 2.9 0.6 5.9 8.5 4.6 9.7 8.1 2.7 9.7 0.7 5.5 5.2
MT 03-09 -22.0 7.5 04-08 30.9 2.4 11.9 16.8 18.7 29.3 29.1 19.9 19.2 13.4 17.8 13.0 22.8
NL 04-09 -29.3 5.0 03-07 33.0 -16.1 -16.7 -12.8 -12.3 -8.3 -5.7 -6.0 -4.7 -3.3 -4.3 -2.8 -3.7
AT 04-09 -21.8 8.0 08-00 36.9 0.0 11.5 2.6 18.4 4.3 6.3 -4.3 5.0 3.0 1.6 2.4 0.8
PL 03-03 -11.9 0.5 12-07 18.6 -5.4 -5.2 -4.5 -1.2 -1.2 0.2 -0.9 -2.1 -1.2 -1.7 -1.3 -0.4
PT 07-03 -58.6 -9.6 05-98 21.5 -11.6 -10.1 -8.3 -1.0 -2.9 -4.5 -3.4 -1.3 -4.0 -4.9 -3.7 -2.3
RO 06-02 -44.7 -1.0 03-03 24.9 -8.3 -0.6 -4.6 -5.2 -5.3 -3.7 -8.4 -7.1 -7.3 -7.9 -2.8 -3.9
SI 09-13 -31.8 -3.0 10-08 25.8 -27.2 -26.1 -23.0 -18.8 -18.1 -19.4 -16.4 -10.5 -5.8 -10.6 -9.4 -7.5
SK 12-04 -67.5 -25.1 10-08 6.2 -9.8 -12.2 -10.8 -7.7 -11.3 -7.3 -6.7 -8.6 0.0 -0.3 3.8 -3.8
FI 11-96 -31.6 12.1 07-00 81.2 2.4 -6.2 -6.6 2.0 -7.3 -10.8 -10.2 -6.7 -4.9 -3.6 -7.7 -6.2
SE 02-09 -36.8 9.5 09-00 62.2 4.1 4.9 8.6 18.4 16.9 14.3 11.8 14.3 10.2 4.2 12.7 7.2
UK 01-09 -49.1 11.7 07-14 41.2 15.2 20.9 38.6 27.5 29.3 22.3 37.8 27.8 21.2 41.2 36.4 29.5
Ave.

11
TABLE 3 (continued) : Monthly survey of services (s.a.)
Since 1990 (*) 2013 2014
Min. Max.
Date Value Date Value Oct Nov Dec Jan Feb Mar Apr May Jun Jul Aug Sep
SELLING–PRICE EU 02-09 -13.2 2.4 01-07 12.7 0.8 -0.5 2.2 0.9 3.0 1.7 2.7 1.5 2.9 3.5 3.7 1.4
EXPECTATIONS EA 07-09 -10.1 2.9 06-08 13.2 -2.6 -1.9 -0.8 -0.4 2.1 -0.9 -0.7 -0.1 1.2 0.2 1.0 -0.6
(Question 6) BE 01-10 -13.8 6.2 07-08 28.8 7.2 6.0 12.3 12.4 9.1 5.6 4.9 7.5 4.9 8.4 5.5 6.7
BG 01-11 -11.9 7.3 07-04 37.5 5.5 -0.8 5.0 2.1 5.2 1.7 -0.1 -2.8 -0.4 -3.0 -6.0 -1.2
CZ 02-13 -8.3 4.2 01-04 23.6 0.5 0.3 3.1 -1.6 3.5 -0.9 -1.6 -0.8 5.9 3.0 2.9 -0.6
DK 01-13 -8.1 1.9 12-10 16.0 3.2 -3.7 -1.5 -6.4 0.7 -2.1 -4.3 -2.6 3.4 0.0 -3.2 -1.0
DE 07-09 -10.9 8.2 03-11 22.9 11.0 12.6 13.8 15.2 17.7 12.3 9.8 11.8 14.4 15.1 17.6 12.1
EE 03-09 -31.5 9.8 09-05 26.4 8.6 12.3 8.8 5.0 14.0 9.4 9.0 2.1 4.4 9.5 11.5 14.1
IE : : : : : : : : : : : : : : : : :
EL 09-12 -40.2 -3.4 06-06 24.2 -24.7 -20.7 -16.6 -22.7 -14.6 -12.2 -7.6 -1.6 -5.1 -12.6 -14.0 -11.5
ES 11-11 -17.9 2.4 09-04 20.3 -11.7 -10.6 -11.8 -14.0 -2.9 -7.4 -11.0 -5.4 -5.1 -9.5 -10.6 -6.8
FR 07-09 -21.0 -2.5 04-90 16.6 -11.0 -8.9 -10.3 -10.3 -6.9 -12.2 -8.9 -10.2 -9.0 -9.1 -7.9 -9.2
HR 03-10 -10.6 -1.7 07-08 25.4 -3.7 -4.1 -5.2 -3.5 -2.0 -3.4 -4.4 0.0 -1.2 -0.4 -5.1 -3.6
IT 08-13 -15.7 -1.2 05-04 17.9 -10.8 -12.1 -8.9 -12.4 -11.5 -10.4 -5.7 -8.8 -7.2 -9.3 -10.4 -10.4
CY 04-13 -38.9 2.6 06-03 72.7 -17.0 -20.6 -19.7 -15.3 -19.0 -16.9 -7.9 -3.4 -6.3 -13.1 -8.2 -5.4
LV 12-09 -31.1 8.1 12-07 35.8 1.1 2.9 1.6 2.9 1.1 -0.7 -0.8 -0.3 0.7 -1.4 -1.9 -3.2
LT 06-09 -23.0 -0.2 08-06 20.8 -1.0 -2.7 -3.7 0.2 1.0 -4.3 -4.2 1.0 1.5 2.9 -3.1 -3.6
LU : : : : : : : : : : : : : : : : :
HU 02-09 -8.5 5.4 09-06 28.0 3.0 2.6 0.1 0.8 5.8 3.2 3.7 5.7 6.5 5.6 2.8 1.9
MT 08-09 -21.6 0.1 05-08 18.6 -5.1 -2.3 1.8 -5.1 -0.7 -1.9 -3.1 -0.3 0.2 -2.5 -2.6 -1.1
NL 08-09 -5.5 9.2 01-07 30.7 4.0 2.9 3.1 1.8 4.9 7.3 6.1 7.1 7.7 7.2 8.1 7.8
AT 05-09 -10.3 10.3 11-07 30.4 11.2 10.0 5.7 27.6 11.7 12.6 12.2 3.7 8.2 1.0 3.4 1.7
PL 07-13 -10.6 1.8 04-08 16.8 -4.4 -3.7 -3.6 -4.2 -2.4 -3.0 -2.7 -2.1 -1.0 -1.3 -2.3 -2.8
PT 11-03 -17.3 -3.8 11-05 10.6 -5.7 -6.6 -5.1 -2.7 -3.7 -1.6 -5.5 -2.3 -2.7 -3.0 -3.3 -3.0
RO 06-10 -8.7 15.7 04-04 54.5 -0.2 5.8 6.0 3.5 0.9 2.1 5.1 2.2 3.2 0.5 1.2 -0.8
SI 02-10 -16.4 1.2 01-08 23.1 -12.2 -7.7 -9.2 -8.4 -12.2 -12.5 -11.0 -5.7 -5.1 -4.6 -4.0 -6.7
SK 12-10 -17.5 12.7 07-02 68.9 -0.4 -4.1 -1.8 4.8 -1.8 1.4 5.5 4.2 -6.1 -8.8 -1.4 1.1
FI 07-04 -25.1 10.7 01-08 40.7 7.1 -10.8 -5.7 -1.1 5.9 2.1 -3.0 3.6 5.7 4.2 7.2 -1.5
SE 04-09 -17.0 9.5 11-07 32.4 5.5 3.7 8.2 11.1 4.5 4.5 2.3 6.6 6.0 2.2 7.6 7.2
UK 02-09 -34.3 -1.3 07-14 18.1 13.1 4.3 14.3 6.9 7.3 12.6 17.8 8.0 9.2 18.1 16.0 9.2
(a) The indicator is the arithmetic average of the balances (%) for the questions on business situation and recent and expected evolution of demand.
(*) Minimum, maximum and averages are calculated over the period of availability which is not necessarily as from 01/1990.
Ave.

12
TABLE 4: Monthly survey of consumers (s.a.) (a)
Since 1990 (*) 2013 2014
Min. Max.
Date Value Date Value Oct Nov Dec Jan Feb Mar Apr May Jun Jul Aug Sep
CONSUMER EU 03-09 -32.2 -12.1 08-00 1.6 -11.6 -12.3 -10.9 -8.7 -9.3 -6.6 -5.7 -4.0 -4.3 -5.5 -6.4 -8.0
CONFIDENCE EA 03-09 -34.3 -13.2 05-00 2.4 -14.4 -15.3 -13.5 -11.6 -12.7 -9.2 -8.6 -7.1 -7.5 -8.3 -10.0 -11.4
INDICATOR (b) BE 02-09 -26.5 -7.0 12-00 16.2 -8.1 -7.1 -5.3 -2.6 -4.5 -6.5 -7.6 -5.2 -5.8 -7.6 -8.1 -9.6
BG 04-09 -50.1 -33.9 08-01 -13.0 -38.1 -38.0 -38.9 -37.2 -34.9 -32.5 -30.5 -31.1 -36.0 -35.2 -36.9 -39.8
CZ 03-98 -35.8 -12.8 10-06 3.9 -13.6 -9.8 -10.8 -8.4 -8.4 -5.4 -2.6 -3.4 -1.6 -1.7 -5.0 -6.3
DK 10-90 -11.8 7.8 06-14 20.4 16.9 14.9 15.4 17.6 17.2 14.0 13.6 17.4 20.4 19.5 19.8 14.5
DE 04-09 -32.9 -8.6 11-10 10.9 -4.2 -2.1 -2.2 -0.8 -0.7 2.3 3.1 5.5 4.3 3.9 0.3 -1.1
EE 04-93 -56.3 -16.6 04-06 12.8 -2.8 -1.5 -2.3 -3.9 -2.6 -4.3 -2.7 -5.0 -3.7 -1.4 -4.0 -5.7
IE 05-09 -32.1 -7.0 01-00 19.1 2.8 3.4 9.9 8.4 10.8 11.5 12.2 10.0 6.9 11.3 12.0 13.9
EL 10-11 -83.8 -38.6 04-00 -5.8 -66.2 -66.7 -63.3 -62.7 -63.1 -58.0 -52.6 -50.5 -47.7 -48.1 -54.2 -55.8
ES 02-09 -47.6 -14.4 03-00 5.3 -20.7 -20.5 -17.1 -12.4 -14.7 -8.3 -7.8 -6.7 -3.9 -7.7 -6.4 -9.6
FR 03-09 -37.0 -18.7 01-01 3.3 -18.4 -26.4 -22.4 -20.2 -23.1 -20.2 -21.7 -22.0 -21.7 -22.8 -22.3 -24.0
HR 08-09 -51.5 -33.3 07-07 -14.0 -37.4 -38.0 -41.4 -36.3 -35.7 -34.4 -34.7 -36.2 -34.3 -37.5 -34.1 -34.6
IT 06-12 -41.5 -16.6 06-01 2.5 -19.1 -20.9 -20.2 -18.5 -18.8 -14.3 -9.6 -8.7 -11.4 -12.3 -14.1 -15.4
CY 04-13 -64.4 -35.3 06-01 -13.0 -53.1 -50.2 -43.9 -46.7 -39.3 -38.5 -38.1 -33.9 -28.2 -27.5 -26.8 -30.9
LV 07-09 -54.9 -22.4 09-06 1.0 -14.5 -13.9 -9.1 -9.6 -12.2 -10.4 -7.5 -8.0 -9.3 -6.1 -11.7 -13.2
LT 01-09 -56.1 -16.2 05-07 9.2 -9.3 -10.2 -5.7 -7.4 -8.7 -10.7 -11.5 -12.1 -11.5 -14.6 -21.1 -20.1
LU 12-08 -20.7 -1.0 02-02 13.4 -1.2 -1.0 -0.9 -2.8 -1.5 -2.8 -5.2 -2.2 2.4 -2.1 -5.3 -7.8
HU 04-09 -68.8 -33.2 08-02 0.2 -27.0 -22.4 -22.9 -17.1 -21.6 -16.3 -15.1 -17.6 -18.3 -17.6 -21.2 -17.8
MT 04-11 -41.3 -24.2 11-13 1.4 -5.2 1.4 0.0 -3.3 -1.9 1.1 0.7 -0.3 1.4 0.3 -1.1 -2.7
NL 02-13 -30.2 1.0 03-00 30.8 -12.9 -5.9 -3.5 -2.6 -5.8 0.4 -2.1 3.9 3.7 4.7 3.3 4.1
AT 04-09 -23.0 -1.5 06-07 16.3 -3.6 -3.9 -6.4 -6.9 -6.5 -6.2 -6.7 -7.9 -6.6 -7.9 -11.2 -12.5
PL 08-01 -40.1 -22.3 04-08 -0.5 -24.2 -23.6 -19.7 -21.4 -20.8 -17.5 -20.2 -15.9 -14.7 -19.3 -20.3 -20.5
PT 10-12 -60.1 -26.9 07-91 -0.5 -42.3 -39.1 -35.8 -31.5 -29.5 -31.3 -29.6 -25.4 -25.9 -24.3 -28.2 -23.9
RO 06-10 -63.3 -30.2 07-07 -10.6 -36.2 -34.9 -34.8 -34.3 -33.8 -35.1 -33.4 -34.1 -30.6 -27.6 -27.5 -29.4
SI 09-12 -46.1 -21.0 07-07 -4.1 -34.7 -34.6 -34.4 -30.9 -31.5 -30.1 -29.0 -23.4 -21.8 -16.8 -20.1 -12.9
SK 09-99 -49.0 -24.2 12-06 6.6 -20.1 -17.4 -16.4 -12.6 -16.5 -13.3 -13.4 -12.3 -12.6 -12.2 -11.7 -15.5
FI 12-08 -6.4 13.2 09-10 23.8 7.0 8.2 9.3 11.0 7.6 7.8 4.4 9.0 10.3 12.4 6.3 2.3
SE 12-08 -10.0 9.9 09-10 28.0 14.9 17.0 18.3 17.9 17.6 15.5 17.0 18.8 18.1 19.0 19.8 20.1
UK 01-09 -35.2 -9.5 05-14 7.6 -2.1 -2.9 -3.3 1.0 2.0 3.3 5.7 7.6 7.4 4.8 6.6 3.5
FINANCIAL EU 07-08 -12.8 -2.5 04-01 5.3 -5.4 -4.8 -4.2 -2.9 -2.8 -1.9 -1.6 -1.4 -1.3 -1.5 -1.8 -2.6
SITUATION OF EA 11-12 -13.6 -3.7 03-00 4.6 -7.1 -6.0 -5.7 -4.9 -4.8 -4.0 -4.1 -3.4 -2.9 -3.0 -4.0 -4.0
HOUSEHOLDS BE 12-93 -8.9 1.4 08-00 13.2 1.4 1.6 3.8 2.5 4.0 1.7 0.0 1.1 1.0 2.9 0.1 -0.5
OVER NEXT BG 10-12 -34.0 -19.3 07-01 3.2 -23.6 -23.5 -24.7 -25.3 -22.1 -18.7 -14.5 -18.0 -22.9 -18.5 -19.6 -26.5
12 MONTHS CZ 02-98 -31.7 -8.8 12-06 4.8 0.9 -0.8 -1.0 -0.1 -1.3 1.5 1.9 1.5 1.2 1.0 2.1 0.0
(Question 2) DK 12-90 1.8 12.2 10-00 38.7 11.5 10.6 11.3 10.9 9.9 10.5 7.9 12.1 11.8 13.2 14.9 13.1
DE 02-94 -15.1 -3.2 04-14 5.3 2.4 3.5 3.3 3.6 4.1 4.1 5.3 5.2 4.7 4.9 4.7 4.1Component of the EE 04-93 -38.3 -6.2 04-06 17.3 6.4 5.0 5.6 3.8 4.7 0.8 3.4 3.1 3.8 4.5 3.9 5.0consumer confidence IE 04-13 -32.5 -3.8 01-00 15.9 -6.1 -4.6 5.1 0.3 2.6 5.5 5.2 -4.4 -3.7 -0.7 -1.9 2.9indicator EL 10-11 -79.1 -25.1 04-00 9.5 -56.5 -59.0 -52.0 -55.6 -55.4 -47.0 -44.2 -43.9 -39.5 -38.9 -46.5 -46.9
ES 02-09 -30.2 -3.2 10-99 9.7 -8.9 -7.6 -7.2 -5.3 -5.1 -2.0 -1.4 0.0 1.4 -0.5 1.0 -0.2
FR 05-13 -17.3 -3.8 01-01 6.2 -12.1 -13.0 -12.6 -11.3 -11.3 -10.9 -16.1 -14.3 -12.1 -11.8 -12.3 -11.8
HR 08-09 -32.3 -13.8 12-06 3.0 -17.2 -17.7 -18.3 -16.6 -11.3 -10.7 -14.3 -15.7 -13.3 -15.2 -11.9 -12.0
IT 07-12 -20.3 -3.1 07-01 6.8 -8.6 -6.8 -8.3 -5.1 -6.8 -6.2 -1.5 -1.4 -2.9 -3.7 -6.0 -6.4
CY 04-13 -46.9 -19.5 06-01 0.0 -33.6 -31.1 -26.2 -31.3 -23.8 -25.4 -19.3 -17.5 -19.2 -11.7 -11.9 -12.3
LV 06-09 -38.7 -5.4 09-06 16.3 2.2 0.4 6.1 5.7 3.2 4.5 8.5 7.8 4.7 10.1 5.5 5.0
LT 01-09 -37.7 -4.8 03-07 12.5 -0.2 1.2 3.8 1.7 0.2 -1.7 -2.7 -3.9 -3.7 -5.9 -11.0 -11.6
LU 09-14 -9.4 -0.2 06-02 11.8 -0.5 -0.5 0.0 -3.3 -4.4 -8.0 -6.1 -4.9 -2.0 -8.3 -8.1 -9.4
HU 04-95 -62.7 -23.8 08-02 16.2 -13.3 -6.4 -5.3 0.0 -5.6 0.6 1.1 -2.4 -5.1 -3.3 -4.5 -2.2
MT 11-08 -41.2 -20.1 11-13 13.3 5.4 13.3 6.6 4.1 7.4 11.1 8.6 10.9 12.4 8.9 4.9 4.2
NL 11-12 -22.8 0.5 12-99 16.4 -13.6 -5.1 -3.3 -5.1 -2.2 -0.6 -2.0 -0.2 -1.4 -3.0 -3.3 -2.5
AT 04-96 -18.3 -4.0 04-99 4.0 -2.8 -0.6 -2.7 -3.4 -3.7 -1.8 -3.2 -4.1 -3.1 -3.5 -3.5 -3.7
PL 12-11 -22.6 -7.6 12-07 4.8 -8.3 -8.0 -4.2 -7.1 -6.4 -3.9 -5.2 -3.7 -1.6 -5.5 -5.1 -7.7
PT 12-11 -41.0 -10.7 01-92 10.9 -26.7 -25.4 -23.5 -24.2 -23.4 -23.6 -22.1 -18.7 -20.3 -16.8 -22.7 -17.1
RO 06-10 -47.0 -8.3 12-07 10.3 -10.7 -10.8 -13.4 -10.4 -10.9 -13.0 -11.0 -12.2 -8.7 -4.6 -5.6 -5.3
SI 09-12 -41.2 -15.2 11-96 -1.9 -26.1 -28.4 -27.9 -22.3 -22.4 -23.3 -19.8 -18.2 -15.3 -9.5 -14.6 -7.2
SK 08-99 -44.7 -17.3 12-06 10.3 -9.8 -7.9 -6.3 -3.5 -8.8 -4.0 -5.9 -4.3 -5.9 -6.5 -4.7 -6.6
FI 04-93 -8.3 6.3 10-04 12.7 5.3 5.8 5.7 5.7 5.0 4.1 3.1 3.6 7.3 6.9 6.4 5.0
SE 09-96 -12.6 9.2 07-02 17.6 11.3 12.3 11.7 9.4 9.2 9.3 9.5 11.2 9.2 9.1 8.2 11.0
UK 03-90 -22.8 1.3 09-02 15.5 -1.4 -2.9 -1.6 3.2 3.4 4.8 6.8 5.0 3.9 3.0 4.9 1.4
GENERAL EU 03-09 -40.0 -13.2 01-00 0.8 -9.2 -10.6 -6.9 -4.5 -5.6 -2.1 -1.0 -0.3 0.2 -1.2 -3.6 -6.8
ECONOMIC EA 03-09 -44.1 -14.0 04-00 3.5 -11.7 -13.4 -9.8 -7.5 -8.7 -4.5 -3.5 -2.5 -2.8 -4.0 -7.3 -9.8
SITUATION BE 07-93 -45.5 -9.2 06-00 19.6 5.3 10.0 9.0 16.5 12.6 10.6 5.0 6.7 6.3 1.5 -3.8 -5.5
OVER NEXT BG 04-09 -42.8 -19.2 07-01 15.6 -27.9 -29.1 -27.8 -29.1 -23.3 -18.4 -18.1 -18.2 -28.9 -28.3 -28.8 -33.7
12 MONTHS CZ 05-12 -45.9 -12.5 11-05 8.4 -9.1 -5.4 -8.4 -5.2 -3.5 -3.0 2.6 3.1 6.5 3.7 -1.1 -4.2
(Question 4) DK 09-08 -22.9 1.1 08-14 23.5 22.8 19.8 19.5 22.3 18.1 17.8 14.5 17.8 22.9 23.0 23.5 17.1
DE 03-09 -52.1 -12.9 11-10 21.2 -4.2 -1.9 -0.2 2.3 1.4 2.5 1.6 4.6 7.6 5.3 0.4 -2.1Component of the EE 04-93 -38.3 -1.8 12-06 26.9 11.0 13.9 10.3 10.7 8.9 7.4 6.9 2.7 2.5 6.9 -0.8 -1.2consumer confidence IE 07-09 -46.1 -7.5 09-14 26.8 8.4 9.3 20.0 16.1 21.2 20.7 21.1 18.0 12.2 20.3 22.7 26.8indicator EL 10-11 -88.7 -28.7 01-00 17.2 -63.9 -62.2 -59.4 -59.4 -59.6 -51.2 -44.3 -43.3 -37.1 -38.8 -45.5 -47.5
ES 02-09 -48.2 -9.9 08-97 10.9 -9.7 -9.2 -4.8 0.6 0.9 4.7 3.6 7.7 5.6 3.6 9.5 5.6
FR 11-11 -46.6 -20.5 05-07 5.7 -24.0 -36.1 -28.6 -24.6 -28.2 -25.2 -22.6 -26.6 -30.2 -28.6 -29.6 -33.6
HR 08-09 -53.7 -28.3 07-07 -1.9 -34.4 -33.5 -36.5 -31.2 -33.3 -29.6 -33.7 -32.6 -33.2 -36.6 -30.8 -30.9
IT 06-12 -44.8 -11.6 02-95 13.2 -6.2 -11.3 -8.3 -10.0 -8.9 1.5 8.9 9.4 6.4 3.3 -2.0 -2.8
CY 04-13 -66.5 -29.9 05-01 -6.2 -56.1 -49.2 -35.9 -43.8 -35.5 -30.8 -28.4 -19.0 -12.3 -12.7 -9.6 -16.0
LV 07-09 -53.5 -8.9 09-06 17.2 -7.6 -6.3 1.9 -0.3 -0.2 0.5 1.7 0.9 -2.3 1.5 -6.6 -7.1
LT 01-09 -58.1 -6.4 06-07 17.9 3.2 3.0 10.2 4.2 0.7 -3.6 -5.4 -6.3 -4.5 -10.0 -19.5 -18.8
LU 12-08 -44.3 -12.9 05-11 6.4 -9.1 -7.3 -4.9 -8.3 -8.9 -11.4 -15.4 -10.4 -8.9 -9.9 -17.3 -19.1
HU 04-09 -66.5 -19.5 08-02 19.2 -12.9 -5.7 -5.7 1.2 -3.8 1.9 3.0 -0.9 -4.6 -2.8 -7.6 -2.5
MT 04-11 -36.1 -15.9 11-13 16.7 8.9 16.7 9.8 9.7 12.9 14.4 13.2 13.7 13.9 11.8 10.6 8.6
NL 03-09 -50.8 -9.7 03-00 26.0 -7.5 4.1 7.3 6.7 4.7 14.6 11.9 12.7 17.7 14.8 4.1 2.5
AT 01-09 -40.3 -6.2 07-07 17.1 0.3 2.1 -3.3 -3.3 -8.2 -9.2 -10.4 -11.5 -8.4 -6.8 -9.9 -16.4
PL 08-01 -35.2 -14.6 04-08 13.5 -19.3 -19.2 -14.3 -12.2 -14.1 -10.7 -14.6 -10.6 -6.3 -13.6 -14.7 -12.1
PT 09-11 -76.7 -25.3 01-92 12.4 -45.0 -41.3 -33.8 -26.4 -25.5 -24.5 -22.7 -17.8 -23.1 -19.0 -24.3 -17.6
RO 06-10 -64.1 -15.2 01-05 12.2 -26.5 -26.6 -25.4 -26.0 -25.5 -27.9 -27.6 -26.3 -22.8 -15.8 -17.6 -17.7
SI 09-12 -52.7 -14.6 10-04 7.2 -38.8 -42.9 -38.1 -28.1 -32.4 -27.1 -28.7 -17.3 -12.7 -8.5 -8.5 -4.8
SK 04-09 -53.5 -24.8 12-06 15.4 -18.2 -16.0 -13.5 -7.8 -16.7 -12.3 -12.9 -14.8 -12.1 -12.9 -11.3 -14.6
FI 12-08 -27.9 3.4 01-95 28.3 1.9 4.1 5.9 6.2 -1.3 -1.5 -6.7 0.9 3.8 8.6 -1.9 -9.6
SE 09-96 -29.8 1.5 04-10 30.8 6.4 9.2 10.5 9.9 7.9 4.5 5.1 4.6 6.0 4.4 7.2 3.6
UK 07-08 -50.1 -12.0 06-97 13.5 -1.5 -2.7 2.5 5.9 4.9 8.1 11.2 9.6 12.2 10.7 10.6 3.7
Ave.

13
TABLE 4 (continued) : Monthly survey of consumers (s.a.) (a)
Since 1990 (*) 2013 2014
Min. Max.
Date Value Date Value Oct Nov Dec Jan Feb Mar Apr May Jun Jul Aug Sep
SAVINGS EU 08-93 -15.7 -6.2 04-01 3.0 -6.7 -7.3 -6.2 -6.1 -7.4 -5.0 -4.9 -2.9 -3.7 -3.7 -3.9 -4.1
OVER NEXT EA 06-08 -16.4 -7.5 04-01 2.4 -9.5 -10.4 -9.5 -9.5 -11.0 -8.2 -8.5 -7.4 -8.0 -7.1 -7.4 -7.8
12 MONTHS BE 12-12 -9.3 9.3 06-98 31.2 0.4 0.1 3.2 3.8 0.7 -1.3 -1.8 -1.4 -3.5 2.2 -2.9 -3.9
(Question 11) BG 03-02 -80.7 -68.2 06-14 -57.3 -61.7 -61.5 -66.0 -61.7 -58.5 -59.3 -58.9 -58.0 -57.3 -57.3 -60.1 -62.9
CZ 03-98 -16.2 -2.9 04-07 18.5 -7.6 -4.2 -3.8 -6.2 -5.2 -2.8 0.6 -1.7 0.1 -1.1 -0.5 3.5
Component of the DK 01-90 -3.2 24.2 12-06 39.9 26.1 23.8 25.3 28.1 33.9 20.2 24.6 29.0 28.5 23.8 24.8 20.6
consumer confidence DE 03-03 -5.2 5.8 08-90 23.4 3.7 3.5 5.8 3.3 2.0 7.4 8.3 11.3 3.8 7.3 6.7 6.1
indicator EE 10-93 -69.2 -38.1 05-06 -4.2 -26.1 -25.9 -22.3 -27.0 -22.3 -21.6 -20.0 -20.1 -16.0 -14.1 -15.8 -14.0
IE 03-93 -32.0 1.4 09-07 30.6 9.6 5.2 9.7 10.7 15.7 13.4 13.0 14.6 10.7 13.1 13.2 10.5
EL 08-13 -81.8 -49.8 01-00 -23.3 -74.7 -71.6 -72.2 -73.6 -75.0 -75.4 -73.0 -75.7 -74.8 -75.6 -79.5 -79.3
ES 12-08 -44.5 -23.5 07-00 0.0 -40.0 -41.6 -39.8 -38.7 -39.7 -32.3 -36.1 -35.5 -28.2 -32.7 -34.6 -34.6
FR 03-96 -35.8 -18.5 05-12 -2.6 -7.6 -10.6 -11.4 -8.3 -12.6 -8.4 -11.7 -12.2 -5.6 -6.3 -4.9 -6.1
HR 12-12 -63.5 -55.3 02-07 -44.2 -54.2 -58.3 -60.7 -57.1 -55.6 -56.9 -51.4 -55.2 -53.7 -58.2 -56.1 -56.4
IT 09-12 -49.5 -22.0 03-91 2.2 -25.3 -25.7 -26.9 -24.6 -25.3 -27.7 -24.3 -24.3 -26.3 -25.2 -22.7 -24.8
CY 06-13 -67.1 -45.8 06-01 -12.3 -55.6 -55.6 -58.2 -57.3 -60.9 -56.4 -61.0 -60.7 -54.1 -60.7 -57.0 -60.0
LV 03-96 -90.0 -52.5 01-94 13.0 -41.3 -38.8 -37.9 -38.7 -44.6 -39.4 -35.3 -36.4 -36.5 -33.8 -33.8 -37.4
LT 11-01 -55.0 -41.1 05-07 -21.1 -27.7 -32.1 -24.9 -26.8 -28.3 -28.3 -22.4 -28.4 -28.4 -31.0 -32.9 -30.3
LU 01-10 33.4 44.9 10-05 58.0 38.7 42.4 36.8 39.2 43.5 43.1 37.3 40.5 45.1 41.2 37.2 34.8
HU 05-12 -77.1 -57.5 01-00 -19.0 -63.8 -61.0 -62.7 -57.8 -59.6 -55.7 -56.7 -55.5 -50.8 -53.3 -55.6 -53.1
MT 04-11 -66.1 -43.6 01-03 -15.3 -34.1 -26.2 -20.6 -27.1 -26.7 -22.3 -19.6 -24.1 -21.1 -22.5 -22.4 -25.0
NL 02-13 16.3 34.4 10-99 55.2 20.4 21.7 24.8 22.7 24.0 23.5 20.6 25.9 23.9 24.9 23.2 26.0
AT 11-00 -11.3 28.7 03-02 54.6 16.2 13.3 16.8 11.1 11.0 12.3 14.0 15.9 14.7 12.6 4.6 10.3
PL 09-03 -65.7 -43.1 09-01 -21.1 -39.0 -37.6 -30.8 -37.6 -34.3 -31.6 -37.9 -31.8 -33.8 -34.1 -39.0 -40.7
PT 05-13 -54.3 -31.2 11-97 -4.9 -52.7 -49.5 -51.6 -51.8 -52.0 -50.9 -49.7 -49.6 -49.1 -49.1 -52.1 -47.0
RO 06-10 -69.8 -55.5 09-07 -44.8 -58.0 -55.9 -53.1 -58.3 -57.0 -58.2 -55.0 -56.3 -54.8 -51.4 -50.3 -55.2
SI 06-99 -52.0 -24.7 05-07 -6.2 -32.4 -25.9 -31.4 -33.9 -32.2 -32.9 -32.1 -31.8 -29.4 -26.0 -29.4 -24.7
SK 08-01 -69.1 -33.0 12-06 -17.3 -26.5 -24.8 -22.7 -22.8 -22.9 -22.2 -22.8 -19.4 -22.3 -23.3 -20.0 -19.9
FI 01-96 19.0 44.3 04-08 58.4 49.0 47.6 48.7 49.0 51.5 49.4 47.3 48.0 48.4 49.3 49.5 46.2
SE 06-98 11.1 35.8 09-14 58.5 50.9 56.3 56.0 50.9 51.4 47.9 51.6 56.4 52.2 56.7 56.6 58.5
UK 10-92 -26.0 -1.2 04-06 23.2 5.6 5.1 5.6 7.8 5.8 9.0 10.2 14.5 13.3 9.7 11.0 11.5
UNEMPLOYMENT EU 03-09 67.0 26.6 05-00 0.7 25.1 26.4 26.4 21.4 21.4 17.5 15.3 11.6 12.3 15.4 16.4 18.7
OVER NEXT EA 03-09 68.5 27.5 05-00 -2.2 29.2 31.3 29.0 24.5 26.2 20.3 18.3 15.1 16.1 19.1 21.4 23.9
12 MONTHS (c) BE 02-09 76.0 29.5 12-00 -17.2 39.6 40.0 37.2 33.4 35.1 37.2 33.4 27.1 27.0 36.9 26.0 28.5
(Question 7) BG 02-10 65.5 28.8 07-01 -1.6 39.1 37.9 37.2 32.9 35.7 33.7 30.5 30.3 34.9 36.7 39.1 36.1
CZ 01-99 67.8 28.6 09-07 -2.2 38.6 28.5 30.2 22.3 23.7 17.3 15.5 16.5 14.3 10.3 20.4 24.7
Component of the DK 02-09 51.4 6.5 02-95 -20.5 -7.3 -5.5 -5.4 -9.0 -6.8 -7.2 -7.3 -10.6 -18.5 -17.9 -15.8 -7.3
consumer confidence DE 03-09 71.9 24.3 05-07 -18.6 18.9 13.5 17.8 12.6 10.2 4.7 2.7 -0.9 -1.3 2.1 10.6 12.4
indicator EE 09-93 81.0 23.3 09-06 -21.6 2.3 -0.8 2.8 3.1 1.6 3.9 1.2 5.7 5.2 2.8 3.5 12.6
IE 04-08 58.9 18.0 12-99 -29.8 1.0 -3.8 -4.7 -6.7 -3.6 -6.5 -9.2 -11.7 -8.3 -12.5 -13.9 -15.4
EL 12-11 92.9 50.8 04-04 20.5 69.7 74.2 69.4 62.3 62.6 58.1 48.7 39.0 39.3 39.1 45.4 49.6
ES 12-08 71.2 21.0 05-00 -8.7 23.9 23.6 16.5 6.4 14.9 3.7 -2.8 -1.0 -5.6 1.1 1.4 9.3
FR 03-09 74.0 32.2 01-01 -12.7 30.0 46.1 36.8 36.4 40.1 36.1 36.3 34.9 38.7 44.3 42.4 44.3
HR 03-10 67.5 35.7 04-07 5.6 43.9 42.6 49.9 40.1 42.4 40.6 39.5 41.3 37.2 39.8 37.6 39.0
IT 03-93 70.8 29.7 06-01 -4.0 36.3 39.7 37.2 34.1 34.1 25.0 21.4 18.4 22.6 23.6 25.7 27.5
CY 04-13 79.5 45.9 07-14 24.8 67.1 64.8 55.5 54.4 36.9 41.5 43.6 38.4 27.3 24.8 28.8 35.4
LV 02-09 80.1 22.8 09-06 -10.4 11.2 10.9 6.5 5.0 7.3 7.4 4.9 4.2 3.3 2.1 11.8 13.5
LT 02-09 82.1 12.5 06-07 -33.1 12.4 12.7 11.9 8.6 7.5 9.1 15.6 9.8 9.5 11.6 21.2 19.7
LU 04-09 75.2 35.8 05-11 10.2 34.0 38.6 35.7 38.6 36.3 34.9 36.5 34.1 24.6 31.3 33.0 37.6
HU 02-09 84.0 33.3 07-98 -6.2 18.1 16.6 18.1 11.6 17.4 12.1 8.0 11.5 12.8 11.1 17.1 13.6
MT 01-04 45.7 17.1 03-08 -12.7 0.8 -2.0 -4.3 -0.1 1.1 -1.1 -0.8 1.7 -0.6 -3.2 -2.4 -1.6
NL 03-09 81.4 21.3 07-98 -33.0 51.0 44.5 42.9 34.7 49.8 36.0 39.1 22.9 25.5 17.9 10.7 9.7
AT 04-09 65.4 24.3 03-01 -8.1 28.0 30.6 36.6 31.9 25.2 26.2 27.3 32.1 29.6 33.9 35.8 40.3
PL 05-01 61.0 24.0 07-07 -20.2 30.4 29.7 29.6 28.7 28.6 23.7 23.1 17.4 17.3 24.1 22.6 21.5
PT 02-09 85.6 40.5 08-97 -11.0 45.0 40.3 34.3 23.4 17.0 26.1 23.7 15.6 11.2 12.5 13.9 14.0
RO 02-10 78.0 41.7 01-07 10.5 49.4 46.2 47.5 42.7 41.7 41.3 39.9 41.7 36.1 38.8 36.5 39.4
SI 01-09 72.7 29.8 04-08 4.6 41.6 41.4 40.4 39.2 39.0 37.0 35.4 26.5 29.7 23.3 27.9 14.9
SK 03-09 76.5 21.7 01-07 -19.5 25.9 21.1 23.2 16.4 17.7 14.5 12.1 10.7 10.0 6.0 10.9 20.9
FI 12-08 51.8 3.9 03-98 -27.7 28.0 24.9 23.0 16.8 24.9 20.6 26.2 16.5 18.2 15.0 28.9 32.6
SE 04-09 64.0 6.9 08-00 -28.0 9.1 10.0 5.1 -1.2 -2.0 -0.3 -1.6 -3.0 -5.1 -5.9 -7.0 -7.2
UK 01-09 75.3 26.0 07-97 -13.9 11.3 10.9 19.8 13.0 6.2 8.8 5.2 -1.3 0.0 4.0 0.0 2.6
FINANCIAL EU 02-13 -21.1 -11.6 03-01 -1.7 -17.2 -17.0 -16.4 -15.5 -15.4 -14.0 -13.4 -13.1 -12.8 -12.7 -12.3 -11.9
SITUATION OF EA 07-08 -23.4 -12.5 05-90 -0.8 -18.1 -17.9 -17.7 -17.4 -17.0 -15.7 -15.4 -14.9 -14.9 -14.2 -14.4 -13.7
HOUSEHOLDS BE 12-08 -16.5 -6.9 11-00 3.5 -7.4 -6.2 -4.4 -6.1 -5.6 -5.0 -6.9 -6.4 -7.1 -5.7 -7.1 -7.1
OVER LAST BG 10-12 -45.8 -33.7 04-07 -17.9 -33.9 -35.2 -38.8 -39.3 -36.1 -31.6 -26.4 -26.1 -31.6 -28.5 -30.5 -33.9
12 MONTHS CZ 05-12 -33.1 -15.8 04-07 -2.4 -20.7 -18.2 -21.3 -20.1 -20.2 -14.0 -15.0 -12.0 -14.0 -13.7 -14.9 -12.0
(Question 1) DK 02-12 -5.8 5.2 02-05 15.8 0.5 -0.8 0.8 0.6 0.2 -1.7 1.4 1.0 0.1 1.5 3.4 1.0
DE 12-02 -31.2 -8.9 07-14 4.5 2.3 1.9 3.7 3.0 3.3 3.6 4.0 4.3 2.9 4.5 3.1 3.9
EE 04-93 -54.1 -14.6 03-07 18.0 -9.6 -9.9 -7.8 -9.2 -8.0 -5.8 -5.3 -3.0 -3.7 -6.4 -3.8 -2.4
IE 11-12 -45.1 -13.4 04-00 11.2 -28.5 -29.9 -27.7 -23.2 -18.1 -16.8 -17.7 -21.1 -15.7 -16.0 -14.5 -12.9
EL 04-12 -86.0 -36.9 04-00 -6.2 -72.1 -74.8 -71.1 -72.8 -69.9 -63.4 -65.0 -61.7 -62.4 -57.3 -59.7 -63.7
ES 11-12 -44.7 -14.6 04-00 3.8 -34.3 -34.7 -34.3 -33.2 -33.7 -30.6 -31.2 -29.6 -24.5 -25.7 -23.8 -25.7
FR 08-08 -23.5 -11.9 01-01 -2.1 -21.9 -22.1 -22.6 -23.3 -21.6 -20.9 -22.1 -21.2 -21.9 -20.6 -19.8 -17.9
HR 03-11 -43.4 -29.0 08-07 -10.4 -37.3 -36.4 -34.4 -33.3 -30.1 -30.0 -31.8 -34.4 -30.9 -33.9 -28.8 -30.1
IT 01-13 -40.2 -18.1 05-90 -0.9 -31.7 -29.8 -32.7 -28.9 -31.8 -29.8 -25.5 -26.0 -26.4 -27.1 -27.6 -27.2
CY 09-13 -53.4 -26.6 07-03 -3.9 -47.1 -49.5 -48.0 -47.8 -47.1 -46.7 -48.6 -46.5 -44.3 -41.3 -38.7 -38.2
LV 10-09 -64.3 -20.2 09-06 9.4 -5.9 -6.1 -3.8 -6.2 -6.8 -5.6 -1.2 -6.6 -6.7 -6.0 -8.2 -3.9
LT 03-10 -45.6 -13.9 03-07 14.6 -10.6 -10.6 -6.7 -9.0 -8.3 -6.7 -5.1 -6.3 -6.9 -6.9 -7.6 -10.3
LU 08-08 -11.0 -2.8 01-02 7.7 -5.5 -5.8 -5.1 -6.9 -5.3 -4.7 -5.9 -5.1 -5.6 -7.4 -4.0 -5.3
HU 11-95 -64.7 -37.4 08-02 0.3 -28.7 -24.5 -21.8 -19.1 -19.7 -12.3 -13.6 -11.4 -10.5 -9.8 -12.9 -8.6
MT 08-12 -54.4 -32.3 06-14 6.9 -10.5 -7.6 -11.1 -9.2 -2.2 2.4 1.4 2.4 6.9 2.9 1.5 2.5
NL 06-13 -29.6 -4.0 02-00 16.8 -26.3 -25.2 -24.3 -21.4 -15.9 -16.8 -18.3 -16.3 -17.0 -15.7 -15.0 -13.9
AT 06-08 -27.8 -13.1 08-99 -2.2 -10.5 -7.4 -9.4 -12.3 -12.0 -8.4 -9.7 -9.9 -8.6 -10.5 -10.1 -9.4
PL 08-01 -34.5 -16.1 10-08 4.3 -17.6 -15.4 -10.5 -13.7 -13.9 -9.2 -9.7 -7.2 -8.6 -14.8 -10.5 -11.7
PT 03-13 -41.6 -16.7 01-92 2.9 -35.6 -33.4 -33.2 -35.7 -35.4 -31.8 -31.8 -33.0 -31.5 -28.5 -28.4 -27.1
RO 12-10 -54.3 -24.9 12-07 1.8 -24.9 -23.6 -26.4 -23.0 -23.4 -24.5 -23.1 -24.0 -21.9 -18.8 -17.1 -20.1
SI 01-08 -48.1 -30.0 07-06 -13.5 -44.7 -41.8 -41.6 -42.6 -37.8 -36.8 -37.7 -38.8 -35.8 -32.8 -35.1 -30.0
SK 10-99 -43.0 -21.0 04-07 4.8 -21.2 -19.9 -15.0 -14.3 -17.3 -12.0 -10.1 -9.3 -12.1 -13.5 -9.6 -12.5
FI 04-93 -21.7 1.1 04-05 9.4 -1.1 -1.1 -0.4 -1.0 -0.1 0.6 -2.2 -2.4 -0.2 -0.1 -3.1 -2.4
SE 11-95 -12.9 3.7 04-07 13.0 4.0 6.6 7.5 5.2 4.4 4.7 5.1 5.8 6.7 7.3 4.7 8.1
UK 05-90 -32.4 -9.6 06-02 7.0 -16.4 -17.3 -16.1 -11.3 -12.6 -10.9 -9.2 -10.0 -8.3 -9.8 -7.4 -7.6
Ave.

14
TABLE 4 (continued) : Monthly survey of consumers (s.a.) (a)
Since 1990 (*) 2013 2014
Min. Max.
Date Value Date Value Oct Nov Dec Jan Feb Mar Apr May Jun Jul Aug Sep
GENERAL EU 05-09 -66.6 -30.0 05-00 -5.1 -32.5 -32.9 -30.2 -27.7 -26.7 -22.2 -21.5 -18.3 -17.0 -17.5 -17.6 -20.2
ECONOMIC EA 03-09 -65.7 -31.0 05-00 -2.9 -35.9 -36.3 -34.0 -32.2 -31.3 -26.1 -26.0 -22.5 -21.7 -22.0 -22.7 -26.1
SITUATION BE 02-09 -75.7 -26.9 12-00 22.4 -12.6 -9.5 -5.8 1.3 -0.3 1.0 -6.0 -4.6 -6.2 -12.1 -18.8 -21.5
OVER LAST BG 03-10 -59.5 -39.0 08-01 -8.8 -50.7 -48.7 -52.8 -52.9 -48.1 -40.2 -35.2 -36.7 -44.3 -45.1 -49.2 -54.3
12 MONTHS CZ 08-12 -60.0 -24.3 06-06 3.8 -39.5 -35.6 -39.8 -32.7 -32.3 -23.1 -16.5 -12.9 -12.0 -10.3 -10.2 -13.4
(Question 3) DK 03-09 -53.9 -1.9 03-06 26.3 8.3 8.7 10.5 12.0 9.7 9.4 5.8 8.7 14.3 14.3 14.5 13.8
DE 06-09 -67.3 -20.2 05-11 29.3 -2.8 -1.8 -1.2 2.0 3.0 6.9 6.8 8.3 11.3 9.9 8.7 7.2
EE 10-92 -72.1 -11.8 01-07 33.0 -4.6 1.5 -4.2 -1.4 -0.8 -3.5 -2.0 0.1 -3.5 -4.3 -3.1 -5.0
IE 07-09 -91.8 -16.6 08-99 41.7 -23.2 -22.8 -9.2 -7.5 -2.0 3.2 2.6 1.4 -1.3 5.0 6.6 14.0
EL 01-12 -98.6 -43.6 05-00 5.8 -78.1 -77.8 -75.5 -78.2 -76.1 -68.3 -68.4 -64.2 -59.1 -54.0 -56.4 -63.2
ES 08-12 -82.0 -28.4 03-00 12.8 -50.5 -46.3 -43.1 -40.9 -41.7 -32.2 -33.9 -28.1 -25.8 -26.6 -18.7 -21.9
FR 08-09 -74.2 -41.0 01-01 -1.3 -47.0 -57.6 -52.1 -50.8 -53.5 -47.5 -49.2 -47.3 -51.4 -50.9 -50.5 -57.4
HR 03-11 -74.0 -49.8 07-07 -14.3 -63.9 -60.5 -61.2 -58.4 -57.5 -56.6 -62.3 -63.4 -59.7 -63.7 -60.9 -59.8
IT 04-93 -73.9 -43.6 05-90 -8.2 -63.8 -61.2 -63.2 -64.2 -57.7 -54.8 -47.7 -40.6 -38.9 -39.7 -44.1 -47.7
CY 05-13 -90.5 -41.9 01-02 -12.5 -82.1 -77.7 -73.1 -77.6 -70.2 -66.5 -65.6 -59.5 -55.7 -45.9 -45.9 -45.4
LV 06-09 -92.1 -26.3 09-06 5.9 -10.4 -11.3 -8.1 -8.3 -8.2 -6.4 -4.0 -7.6 -11.7 -9.2 -12.6 -13.2
LT 01-10 -72.8 -17.4 06-07 21.5 -8.7 -8.9 -3.4 -2.3 -3.6 -3.9 -2.8 -2.7 -3.0 -6.8 -6.5 -10.3
LU 04-09 -54.6 -27.6 01-02 -3.5 -33.3 -32.0 -26.0 -27.0 -26.2 -23.3 -22.5 -22.4 -21.4 -21.6 -24.4 -27.3
HU 04-09 -79.4 -37.1 09-02 6.3 -24.7 -18.4 -16.2 -11.9 -17.6 -10.1 -6.8 -8.7 -9.5 -10.6 -15.6 -6.8
MT 04-10 -59.2 -28.6 06-14 12.4 -6.5 0.7 -2.4 0.9 6.3 6.5 8.8 9.7 12.4 5.7 9.5 6.3
NL 03-03 -73.0 -19.0 03-00 44.6 -51.9 -40.9 -32.9 -29.8 -23.3 -16.2 -14.8 -9.5 -5.7 -6.1 -4.7 -8.1
AT 04-09 -66.0 -21.3 08-07 22.3 -19.1 -20.7 -24.7 -23.4 -24.5 -23.3 -22.7 -30.3 -24.3 -23.6 -25.8 -34.4
PL 09-01 -54.9 -23.6 04-08 15.3 -28.0 -26.8 -22.9 -21.3 -23.5 -16.3 -17.9 -10.9 -10.7 -18.0 -16.8 -13.2
PT 10-12 -83.1 -38.2 10-91 13.2 -63.7 -61.5 -56.8 -52.6 -49.5 -42.7 -43.3 -40.4 -40.5 -35.9 -41.3 -35.6
RO 06-10 -76.1 -31.4 07-07 -3.1 -39.0 -39.9 -36.9 -40.0 -36.9 -40.9 -36.4 -36.9 -34.5 -31.1 -31.5 -34.1
SI 10-09 -77.3 -39.0 12-06 -5.2 -69.8 -72.7 -69.7 -64.3 -62.0 -60.9 -59.9 -53.9 -51.5 -53.4 -44.2 -41.0
SK 10-99 -69.0 -33.2 04-07 17.4 -36.2 -33.9 -31.7 -25.2 -27.8 -20.5 -21.0 -19.0 -19.3 -21.3 -17.0 -18.5
FI 01-92 -65.1 -7.2 08-98 30.0 -27.6 -24.1 -20.2 -16.3 -25.2 -24.3 -33.9 -23.1 -25.3 -18.8 -26.1 -31.5
SE 04-09 -68.3 -6.3 01-11 30.1 -3.6 -0.6 0.0 3.3 0.0 -2.4 -2.5 -1.9 -3.7 0.7 0.2 3.3
UK 05-09 -82.3 -31.6 10-97 4.6 -26.2 -27.6 -23.1 -17.6 -14.5 -12.0 -9.0 -6.5 -3.0 -4.4 -1.6 -3.4
SAVINGS EU : : : : : : : : : : : : : : : : :
AT PRESENT (d) EA : : : : : : : : : : : : : : : : :
(Question 10) BE 12-12 -52.0 16.8 02-01 69.6 -32.7 -36.2 -32.9 -31.7 -32.6 -34.3 -32.8 -32.8 -36.4 -32.9 -39.8 -38.3
BG 07-03 -76.5 -64.0 05-14 -50.8 -61.7 -54.8 -60.7 -60.2 -56.6 -53.1 -55.5 -50.8 -51.7 -51.5 -55.5 -56.5
CZ 06-11 -37.4 -17.2 03-01 14.7 -31.0 -30.2 -33.2 -29.6 -32.8 -28.6 -24.1 -23.7 -19.1 -26.5 -25.8 -27.3
DK 01-90 50.7 66.7 07-08 82.8 68.0 66.1 67.3 66.9 65.8 60.6 60.7 61.9 58.7 60.6 59.3 62.7
DE 02-14 15.0 42.2 09-02 61.1 23.8 21.4 18.5 16.3 15.0 19.3 20.4 20.8 17.8 16.7 21.7 19.4
EE 09-96 -58.3 -28.6 02-07 -2.0 -18.4 -17.8 -20.0 -17.0 -14.1 -16.8 -13.0 -15.3 -9.3 -12.0 -8.1 -10.4
IE 04-13 -11.9 19.8 12-01 56.0 8.8 5.6 9.4 11.2 15.3 12.0 14.0 4.6 3.0 6.5 7.1 9.3
EL 10-05 -69.9 -48.7 07-08 -13.9 -44.5 -51.6 -52.5 -53.9 -56.2 -66.5 -55.2 -58.4 -50.0 -50.9 -48.8 -59.0
ES 06-08 -48.4 7.2 08-96 58.5 -36.7 -34.5 -37.4 -36.5 -36.2 -34.4 -33.0 -32.1 -34.4 -32.8 -32.3 -36.0
FR 10-08 -4.7 32.6 06-95 61.1 22.3 10.3 11.0 16.1 13.8 14.2 9.3 11.3 10.3 8.9 7.4 9.8
HR 07-05 -47.0 -36.7 09-07 -27.5 -35.5 -40.6 -40.4 -38.6 -36.3 -36.2 -34.2 -35.1 -37.8 -39.7 -33.8 -38.4
IT 06-04 26.0 53.2 09-09 84.8 67.2 66.2 64.6 66.1 56.5 61.0 59.7 60.1 62.1 60.6 61.1 56.7
CY 07-13 -50.5 -16.0 06-01 9.9 -41.2 -34.4 -32.5 -34.9 -38.3 -34.2 -33.7 -36.6 -35.0 -32.2 -32.7 -33.1
LV 12-95 -78.0 -56.6 08-14 -38.8 -49.8 -48.1 -45.3 -46.8 -45.8 -42.8 -38.9 -43.0 -42.3 -42.0 -38.8 -42.5
LT 10-05 -49.2 -31.7 10-10 -12.3 -20.9 -20.4 -14.7 -24.4 -25.3 -24.3 -20.8 -23.3 -24.3 -24.8 -27.7 -24.5
LU 08-14 26.3 52.2 08-07 69.3 49.5 39.4 32.2 33.3 39.7 39.1 38.3 34.8 46.8 38.1 26.3 30.8
HU 11-95 -82.9 -64.8 12-00 -27.5 -62.2 -60.5 -58.6 -57.9 -59.6 -54.5 -57.1 -52.3 -48.9 -51.3 -53.3 -48.8
MT 04-11 -65.2 -45.7 01-03 -23.6 -41.1 -34.0 -33.9 -31.1 -35.5 -34.5 -30.4 -32.3 -30.0 -29.7 -32.8 -34.7
NL 07-14 33.3 60.5 11-08 71.2 46.3 42.3 44.4 39.2 39.3 46.6 46.6 46.1 44.2 33.3 38.7 35.1
AT 09-14 -0.8 39.0 11-07 65.6 11.3 9.3 12.3 6.6 7.8 8.1 9.8 9.8 5.5 4.5 2.7 -0.8
PL 09-01 -48.7 -24.1 02-13 -6.7 -14.9 -15.2 -14.3 -14.6 -15.9 -16.4 -16.2 -10.7 -9.7 -11.6 -14.0 -16.3
PT 06-08 -71.7 -45.2 01-92 -13.3 -65.3 -64.0 -64.5 -61.1 -63.3 -59.6 -62.4 -62.2 -61.6 -62.4 -60.8 -60.1
RO 06-02 -62.1 -48.7 06-01 -23.7 -51.8 -48.0 -45.6 -51.2 -48.2 -50.7 -46.9 -46.8 -46.2 -42.8 -44.8 -46.1
SI 01-14 -29.4 -8.6 12-06 18.6 -14.7 -19.2 -20.9 -29.4 -22.5 -23.3 -20.3 -13.5 -22.1 -17.1 -17.9 -12.7
SK 10-04 -55.0 -40.2 08-14 -25.7 -33.9 -30.4 -31.5 -31.6 -33.4 -31.5 -29.8 -28.3 -32.0 -33.5 -25.7 -33.6
FI 04-94 -22.8 8.2 11-07 36.6 4.9 2.3 1.4 5.3 5.7 5.8 4.0 7.3 4.6 5.8 -0.4 2.4
SE 09-01 -9.4 10.2 08-07 26.1 12.8 12.3 12.8 8.6 8.6 10.9 11.7 13.2 11.5 12.7 11.7 13.0
UK 03-09 -22.3 8.2 08-07 41.1 -10.6 -11.7 -11.6 -11.0 -10.2 -10.4 -5.6 -8.7 -6.9 -9.0 -8.0 -6.4
MAJOR EU 01-09 -27.2 -17.7 03-00 -9.4 -23.2 -23.6 -23.8 -22.6 -21.5 -21.9 -22.6 -20.0 -20.0 -20.7 -19.5 -19.8
PURCHASES EA 08-13 -27.6 -18.4 03-00 -11.7 -25.2 -25.1 -25.1 -24.3 -22.6 -23.6 -24.2 -21.7 -21.9 -22.6 -22.1 -22.2
OVER NEXT BE 10-96 -28.7 -16.1 10-03 -5.9 -16.7 -13.9 -12.1 -13.4 -10.0 -15.0 -14.7 -15.1 -13.5 -8.6 -13.8 -14.5
12 MONTHS BG 04-03 -46.8 -31.6 08-08 -5.9 -34.5 -33.6 -37.9 -31.7 -29.3 -28.1 -30.5 -33.7 -37.6 -32.8 -31.4 -31.7
(Question 9) CZ 01-01 -36.2 -20.6 05-07 -0.3 -21.9 -19.1 -17.4 -20.3 -21.1 -14.5 -13.5 -19.6 -12.8 -19.6 -19.6 -15.5
DK 01-93 -14.2 -5.7 03-06 3.9 -3.6 -5.2 -3.1 -2.9 -7.5 -4.8 -7.2 -6.1 -4.6 -3.7 -3.3 -5.7
DE 02-03 -38.9 -24.9 01-90 -13.6 -18.9 -19.5 -20.2 -17.6 -16.4 -18.3 -19.5 -16.6 -18.7 -19.9 -18.0 -20.4
EE 10-92 -64.3 -25.4 09-06 -0.3 -31.2 -37.5 -33.4 -35.2 -38.7 -29.5 -32.5 -30.2 -35.7 -33.1 -24.0 -27.1
IE 07-09 -56.7 -15.6 12-00 1.6 -27.7 -30.4 -25.5 -24.1 -23.5 -19.5 -19.8 -19.4 -19.1 -18.1 -14.1 -13.0
EL 01-13 -81.2 -33.5 06-03 4.8 -70.9 -70.1 -69.4 -72.4 -68.0 -62.5 -65.2 -66.0 -57.0 -53.3 -53.8 -62.7
ES 08-12 -53.8 -28.6 11-00 -7.1 -41.5 -41.0 -41.7 -37.1 -35.4 -35.2 -32.2 -37.8 -31.4 -33.3 -33.8 -30.5
FR 05-08 -8.0 -2.0 09-99 1.2 -3.5 -3.8 -3.5 -4.9 -3.5 -4.5 -4.4 -4.2 -4.8 -3.9 -2.7 -4.2
HR 03-11 -50.2 -37.5 06-07 -23.6 -39.8 -39.1 -42.7 -38.6 -38.9 -40.9 -42.8 -43.5 -42.6 -42.5 -40.6 -41.4
IT 08-13 -58.1 -21.4 12-06 -8.0 -53.6 -53.0 -51.9 -51.9 -48.5 -51.4 -53.0 -40.3 -44.0 -45.9 -47.7 -43.2
CY 04-13 -79.8 -16.4 03-03 40.0 -63.3 -65.6 -64.9 -67.0 -59.8 -64.5 -57.6 -55.8 -64.0 -49.9 -55.5 -53.1
LV 03-96 -84.0 -28.4 06-06 22.9 -22.1 -20.7 -21.9 -20.0 -21.5 -18.5 -15.8 -18.1 -22.3 -17.3 -12.7 -17.7
LT 11-09 -38.1 -8.1 03-08 16.6 -6.6 -9.2 -5.3 -5.4 -5.6 -7.7 -5.9 -6.7 -4.9 -2.0 -5.0 -5.2
LU 02-14 -32.7 -16.5 01-02 -6.4 -15.1 -14.1 -12.5 -21.0 -32.7 -22.8 -7.0 -18.6 -24.3 -17.7 -25.6 -19.2
HU 06-95 -68.6 -39.2 08-02 -7.5 -36.2 -29.2 -28.4 -24.6 -27.2 -19.2 -20.3 -20.4 -18.1 -18.0 -19.2 -17.4
MT 02-07 -22.3 -8.2 11-13 3.9 3.0 3.9 2.5 -0.9 -0.6 1.3 -0.8 0.3 0.1 -1.0 -2.3 1.1
NL 03-03 -24.5 -13.9 11-98 -3.7 -15.4 -16.7 -14.9 -14.8 -11.9 -12.0 -14.9 -15.5 -11.9 -15.2 -12.5 -13.9
AT 01-09 -27.6 -17.1 11-00 -3.9 -17.7 -14.8 -19.7 -20.3 -18.6 -17.5 -20.9 -17.0 -15.5 -20.2 -17.9 -16.2
PL 09-01 -25.7 -5.2 09-08 1.1 -7.4 -2.5 -5.5 -10.5 -6.2 -5.8 -2.8 -2.7 -5.5 -7.9 -2.6 -5.6
PT 05-13 -48.2 -19.7 06-90 14.1 -39.4 -39.6 -38.4 -38.1 -39.5 -36.3 -39.1 -39.3 -39.1 -39.5 -40.4 -37.7
RO 09-10 -50.6 -30.6 08-04 -15.6 -37.8 -43.7 -36.1 -37.4 -38.9 -35.5 -37.9 -38.2 -36.7 -36.9 -36.5 -33.3
SI 10-12 -32.7 -10.4 08-07 4.3 -19.7 -19.6 -17.6 -19.3 -18.9 -16.2 -11.0 -13.9 -15.3 -21.1 -18.3 -17.1
SK 10-99 -40.9 -28.0 01-08 -13.9 -34.5 -30.7 -32.0 -27.9 -33.4 -28.3 -28.4 -24.1 -26.9 -28.3 -28.6 -27.3
FI 11-08 -17.7 -8.7 12-06 -3.1 -14.0 -13.3 -14.0 -11.7 -12.5 -13.5 -15.3 -14.8 -11.4 -13.1 -14.1 -14.4
SE 10-08 -17.0 -5.8 09-96 7.2 -3.6 -2.0 -2.4 -4.2 -5.3 -4.4 -6.1 -4.3 -3.0 -4.1 -5.7 -4.5
UK 02-09 -39.7 -16.8 03-00 0.6 -21.1 -24.0 -25.9 -21.3 -22.0 -21.0 -22.4 -18.3 -17.5 -18.3 -14.0 -15.4
Ave.

15
TABLE 4 (continued) : Monthly survey of consumers (s.a.) (a)
Since 1990 (*) 2013 2014
Min. Ave. Max.
Date Value Date Value Oct Nov Dec Jan Feb Mar Apr May Jun Jul Aug Sep
MAJOR EU 10-08 -35.8 -13.0 01-00 5.7 -14.9 -14.9 -14.9 -14.7 -14.0 -10.8 -10.5 -9.7 -8.0 -10.0 -10.4 -9.6
PURCHASES EA 10-08 -36.9 -16.6 03-99 4.6 -16.4 -16.2 -14.9 -16.6 -15.0 -12.4 -13.2 -12.6 -10.1 -12.6 -13.3 -12.3
AT PRESENT BE 06-97 -40.4 -1.8 09-07 26.1 -8.7 -8.1 -1.0 -3.6 -0.9 4.1 -2.2 -4.7 -2.5 -3.8 -7.0 0.3
(Question 8) BG 06-02 -65.3 -39.3 10-06 -17.1 -37.3 -37.9 -39.2 -33.1 -30.5 -32.8 -29.1 -29.7 -31.8 -33.1 -35.5 -40.8
CZ 05-95 -32.7 -0.4 07-03 33.8 -14.2 -13.2 -17.9 -17.3 -17.7 -11.8 -11.2 -9.6 -7.2 -8.3 -9.0 -7.1
DK 11-08 -32.8 -7.9 09-97 9.5 -10.6 -11.7 -8.5 -10.4 -9.5 -5.8 -5.1 -3.9 -7.7 -8.1 -8.7 -8.0
DE 11-02 -30.8 -5.4 11-06 32.2 16.6 14.8 20.0 16.2 17.9 20.9 18.8 20.0 22.7 20.0 18.0 16.6
EE 11-11 -20.6 12.4 05-06 49.2 -8.6 -2.2 -3.0 5.4 1.4 4.9 0.4 5.0 4.8 -0.1 4.0 3.3
IE 04-13 -32.9 5.8 09-97 39.7 -9.4 -9.7 -6.7 -9.9 -1.8 -0.3 2.6 -1.2 0.4 1.2 6.5 12.2
EL 07-12 -75.0 -41.3 01-01 -9.8 -51.2 -54.2 -59.1 -59.4 -56.9 -52.5 -54.2 -54.3 -47.5 -42.5 -53.5 -57.9
ES 06-93 -63.8 -23.8 11-99 25.7 -36.1 -33.8 -34.3 -39.8 -40.0 -30.6 -30.2 -31.4 -25.4 -32.7 -29.1 -29.6
FR 08-08 -40.6 -17.5 07-00 14.4 -28.8 -29.4 -28.2 -28.4 -29.1 -25.9 -28.1 -27.1 -24.2 -26.7 -26.2 -27.8
HR 05-12 -50.8 -33.4 12-06 -11.4 -39.3 -37.4 -39.7 -38.3 -38.4 -38.9 -39.6 -40.1 -40.4 -44.2 -38.3 -41.4
IT 11-96 -64.2 -37.2 05-90 -2.4 -43.8 -39.7 -43.3 -41.7 -37.7 -39.6 -38.1 -37.4 -37.9 -39.2 -40.9 -34.6
CY 04-13 -70.4 -22.2 11-04 24.0 -53.8 -57.8 -50.4 -54.8 -52.7 -45.6 -48.4 -47.9 -50.4 -44.6 -48.0 -42.5
LV 06-96 -81.0 -29.9 12-06 21.4 -8.5 -7.9 -15.5 -17.7 -12.4 -15.4 -14.0 -15.1 -18.2 -19.6 -17.1 -17.0
LT 03-09 -11.9 17.8 02-06 50.0 13.3 8.9 11.7 21.3 22.1 24.2 22.5 21.2 24.0 24.0 31.4 26.0
LU 10-08 -34.5 -8.4 08-14 14.4 -10.8 -0.6 -2.3 -7.2 2.0 3.4 10.4 3.2 6.8 9.1 14.4 9.8
HU 06-96 -86.8 -52.2 03-06 -6.9 -50.1 -49.4 -47.9 -45.0 -46.5 -45.0 -45.4 -42.5 -34.9 -38.9 -38.9 -33.8
MT 04-09 -22.4 6.0 09-03 35.8 14.9 19.1 12.6 15.5 17.2 14.8 21.7 19.0 23.6 19.3 20.8 14.2
NL 04-03 -39.2 -0.2 02-00 53.8 -14.8 -20.2 -19.3 -16.7 -12.5 -14.5 -12.6 -9.0 -8.7 -8.1 -9.4 -6.0
AT 07-08 -17.8 8.0 08-99 29.4 8.7 15.1 11.5 8.1 11.9 12.1 13.2 10.3 16.0 11.8 12.5 17.2
PL 11-01 -27.0 -3.7 05-07 13.9 -6.6 -1.6 -5.2 -0.2 -11.4 -5.3 -1.8 2.7 0.9 -2.3 -8.1 -2.2
PT 12-08 -89.5 -48.4 01-92 -1.5 -71.9 -72.9 -73.6 -69.7 -69.1 -69.2 -69.7 -66.5 -65.8 -67.7 -67.4 -66.0
RO 08-10 -62.8 -37.2 06-01 4.6 -53.1 -49.4 -44.9 -44.9 -45.6 -46.2 -44.8 -42.5 -46.3 -43.0 -39.8 -41.5
SI 08-12 -59.6 -25.3 08-06 17.7 -45.5 -40.6 -48.2 -47.2 -43.5 -41.0 -38.4 -41.9 -38.8 -30.9 -32.7 -32.3
SK 02-04 -24.8 -7.9 06-08 11.3 -9.6 -9.3 -8.7 -6.4 -7.8 -7.2 -2.5 -4.0 -1.8 -7.0 -2.0 -5.0
FI 04-90 -27.3 16.4 12-09 48.7 3.4 2.7 8.6 6.9 5.3 5.1 3.2 7.9 8.0 4.1 2.5 5.7
SE 10-08 -37.9 13.8 08-05 36.2 13.3 12.6 13.7 12.0 11.2 13.6 14.0 15.0 13.0 10.1 1.1 7.8
UK 10-08 -40.6 -0.3 11-02 28.3 -10.8 -12.4 -17.4 -10.3 -11.0 -5.9 -1.9 -0.8 -0.6 -1.1 1.7 0.1
PRICE TRENDS EU 08-09 -11.4 21.3 09-90 49.1 18.6 17.2 18.1 16.6 15.8 13.1 10.5 12.2 11.7 11.0 9.3 7.3
OVER NEXT EA 08-09 -16.2 20.4 01-91 51.0 16.8 14.2 15.1 15.0 13.5 10.7 7.4 9.6 8.5 8.6 6.6 4.0
12 MONTHS BE 08-09 -13.6 19.2 10-01 45.6 11.4 11.5 16.6 11.1 9.6 13.6 9.7 20.9 13.5 19.0 15.5 10.1
(Question 6) BG 07-01 -3.2 34.4 12-06 54.4 24.5 23.1 26.2 20.1 23.1 16.9 20.1 21.2 26.9 27.6 33.9 35.0
CZ 11-09 -8.7 37.5 03-98 72.0 12.4 18.6 26.5 24.8 22.8 20.0 20.4 26.9 17.8 24.3 23.2 19.8
DK 07-09 -40.9 -5.0 06-08 31.5 8.3 12.6 15.3 16.9 14.2 16.8 22.7 18.8 22.8 20.1 22.4 21.7
DE 08-09 -18.1 28.4 03-91 57.9 26.5 24.6 25.5 24.0 22.0 19.9 18.0 18.1 14.6 15.3 14.8 10.0
EE 04-09 -28.8 39.3 05-04 87.8 11.8 15.3 16.1 13.3 24.4 24.8 21.2 21.0 15.4 14.8 14.1 3.8
IE 05-09 -43.5 16.9 10-00 42.2 8.2 10.7 5.1 6.7 7.0 5.2 4.2 6.3 9.4 10.1 7.1 2.3
EL 12-13 -8.9 32.5 05-90 60.1 -1.1 -2.0 -8.9 -8.7 -2.3 7.6 -4.8 -3.9 -7.9 -7.7 -0.1 -4.7
ES 05-09 -29.9 11.8 08-12 40.0 2.3 0.2 -0.4 1.9 5.2 -0.9 -7.7 -8.6 -7.3 -10.9 -15.4 -10.3
FR 08-97 -13.4 14.4 01-91 53.6 25.4 26.2 28.7 29.2 23.2 19.0 16.9 22.5 20.0 18.7 12.1 14.2
HR 07-13 7.8 28.8 06-08 53.6 23.2 20.4 21.2 16.2 13.4 15.7 13.4 16.5 14.1 20.4 11.7 8.5
IT 07-09 -29.1 13.3 02-91 61.8 8.7 -4.3 -7.1 -8.5 -9.0 -10.4 -18.2 -17.5 -11.9 -11.0 -8.8 -16.1
CY 04-13 -41.4 22.9 10-02 68.2 -22.5 -33.7 -30.1 -13.6 -17.7 -34.7 -18.3 -19.6 -15.1 -14.2 -25.7 -30.4
LV 05-09 -40.8 30.6 03-04 69.7 37.6 37.8 31.7 21.4 27.6 19.5 16.7 20.7 22.3 18.4 10.9 6.0
LT 06-09 1.4 46.7 05-04 74.2 48.9 48.9 42.3 45.0 48.9 49.9 51.4 55.4 51.2 59.1 59.7 55.2
LU 07-09 -21.2 15.2 08-07 44.1 11.5 18.3 13.6 24.0 24.2 26.3 29.4 28.8 24.1 33.6 31.5 29.2
HU 06-14 22.3 50.6 01-07 75.5 34.2 32.3 32.5 26.8 31.2 28.2 27.5 29.8 22.3 25.2 23.5 26.0
MT 08-14 -8.3 31.9 03-11 66.1 0.1 1.9 -5.0 5.1 0.4 -1.5 -0.9 -5.5 -5.5 -2.8 -8.3 -1.0
NL 12-02 -27.6 23.0 01-91 60.0 -7.6 -2.9 6.5 10.1 8.3 4.6 6.8 9.0 4.6 10.1 9.8 4.5
AT 12-95 -18.6 21.8 03-11 50.4 33.1 26.1 30.8 33.6 32.5 31.3 30.6 31.2 31.2 29.8 24.2 25.4
PL 04-05 7.5 30.8 04-04 54.7 23.9 21.3 21.7 23.2 21.2 18.1 19.6 18.9 17.5 23.1 14.4 13.5
PT 08-97 -8.5 29.9 09-11 73.1 13.0 11.8 15.6 15.0 17.5 17.2 13.9 18.2 24.6 14.7 13.6 7.0
RO 07-14 28.3 47.5 02-08 63.4 33.4 36.9 43.5 40.9 36.3 38.0 41.1 38.7 36.0 28.3 32.9 32.5
SI 10-09 -11.0 33.9 04-00 62.2 28.6 22.8 22.3 12.9 10.8 8.5 22.5 20.4 9.5 10.7 7.2 0.8
SK 11-09 -3.7 40.7 11-02 77.6 21.6 20.3 20.4 14.1 21.0 13.7 12.9 17.5 14.6 9.5 7.6 3.8
FI 12-95 -21.4 18.8 01-08 49.9 21.5 22.5 23.2 27.7 26.8 26.8 22.1 26.5 19.0 25.3 19.9 14.9
SE 03-05 -14.4 16.0 10-07 47.1 10.2 6.2 10.6 11.7 5.2 2.7 2.9 4.5 3.2 -3.6 -6.4 -9.6
UK 07-09 -5.1 23.5 09-90 57.1 24.1 26.5 25.7 18.6 21.7 19.1 17.5 18.1 19.9 16.1 16.4 15.8
PRICE TRENDS EU 03-99 -3.6 25.5 07-08 67.9 29.5 28.2 29.0 26.1 23.1 18.9 16.3 17.7 16.7 16.5 14.2 10.3
OVER LAST EA 10-09 -8.4 29.4 07-08 73.6 29.8 27.7 28.1 26.3 23.3 18.9 14.8 15.4 14.4 15.3 12.8 7.1
12 MONTHS BE 06-98 -1.3 40.8 05-08 83.6 39.4 41.5 44.6 41.6 34.1 32.9 31.1 34.3 32.0 36.3 29.4 19.7
(Question 5) BG 06-01 5.6 50.0 05-08 85.9 44.5 39.1 45.1 43.1 41.2 36.2 34.7 31.1 34.7 36.3 39.8 40.9
CZ 10-09 -36.5 11.3 03-98 63.2 6.6 4.0 6.0 5.1 10.0 2.6 7.3 2.1 2.9 3.1 2.6 -1.5
DK 09-93 -50.8 -15.7 07-08 55.5 2.0 -0.3 0.5 -4.9 -1.1 -4.2 -6.5 -3.4 0.3 -6.8 -5.3 -3.9
DE 10-09 -24.9 31.0 07-08 77.8 35.0 34.5 34.7 32.1 31.8 26.2 23.0 21.0 19.7 18.2 18.2 14.5
EE 11-09 -35.0 40.4 04-08 88.3 56.3 51.9 52.0 54.3 52.5 50.8 44.7 45.8 42.1 40.6 34.9 27.1
IE 02-10 -62.4 21.2 12-02 66.0 7.8 9.5 7.3 2.4 -0.5 -2.9 -5.1 1.6 7.1 2.5 2.4 -4.2
EL 07-14 3.3 43.9 01-08 84.8 8.4 16.4 11.8 10.2 13.6 17.3 5.8 9.4 9.6 3.3 15.8 7.3
ES 01-10 -37.5 28.6 07-08 65.6 27.1 20.7 20.0 24.5 22.1 15.8 8.0 11.3 5.4 6.6 4.6 -1.8
FR 01-99 -22.6 24.5 06-08 82.5 38.4 39.4 39.2 35.3 31.0 27.1 23.1 26.3 24.7 23.8 18.5 12.3
HR 12-06 29.0 55.0 07-08 85.3 64.7 60.4 57.8 55.0 48.9 45.9 46.6 44.5 42.2 45.1 36.4 31.7
IT 09-14 -8.5 32.7 08-08 70.3 23.4 15.5 17.5 14.5 9.7 5.7 -0.6 -4.3 -0.2 3.4 2.0 -8.5
CY 03-14 -28.5 31.4 06-08 68.5 -22.2 -28.1 -19.3 -14.6 -19.8 -28.5 -24.3 -19.3 -12.3 -11.5 -16.4 -19.3
LV 02-10 -36.5 28.9 06-08 81.0 24.0 26.0 22.6 18.2 20.4 20.2 23.0 25.3 29.8 31.4 28.6 20.9
LT 10-03 -17.4 34.5 06-08 71.2 43.3 46.2 41.7 39.0 37.0 35.7 32.7 36.4 33.9 36.1 37.8 39.1
LU 11-09 -9.6 33.6 08-08 69.6 29.2 22.7 25.1 26.5 26.6 18.7 14.0 18.7 23.9 16.5 17.0 15.6
HU 07-14 5.2 40.4 06-95 71.2 30.3 29.2 27.6 23.0 23.4 19.5 18.9 14.7 6.7 5.2 7.0 6.1
MT 07-14 0.6 46.1 01-11 69.3 21.5 23.1 16.2 17.3 10.0 9.8 7.0 1.3 3.3 0.6 2.1 8.0
NL 09-09 -20.9 23.8 12-02 89.2 12.9 11.2 13.7 15.8 7.3 7.4 3.2 5.4 0.6 3.6 -0.2 2.6
AT 02-96 -48.2 21.4 06-08 79.8 35.7 31.8 33.2 34.2 35.9 25.6 28.1 33.5 30.5 35.7 27.5 27.1
PL 05-03 -4.0 28.1 04-11 55.1 26.1 25.1 26.4 25.4 22.3 17.8 17.9 16.0 14.6 19.2 12.3 10.8
PT 01-10 -18.6 36.2 05-08 72.0 21.8 18.0 19.4 18.2 13.6 8.1 7.5 10.2 11.3 10.3 6.0 2.1
RO 04-07 30.5 56.0 06-11 79.3 42.5 40.3 46.5 46.2 40.6 40.7 40.5 44.5 38.7 33.1 36.0 37.5
SI 09-14 5.4 39.8 02-08 87.8 40.2 39.6 36.9 26.5 19.0 20.3 23.0 27.6 17.9 25.0 10.9 5.4
SK 02-10 -18.1 28.0 10-99 69.9 20.5 16.1 16.2 11.3 9.5 3.0 -0.6 -0.6 -1.6 0.9 -8.1 -4.2
FI 11-95 -58.5 -6.8 07-08 33.0 4.9 4.4 3.3 5.6 4.2 2.6 -1.4 -2.9 1.5 1.3 -2.4 -6.1
SE 03-05 -40.1 -22.2 07-08 21.9 -27.7 -29.7 -30.3 -30.3 -29.9 -32.5 -34.8 -32.5 -34.0 -34.7 -34.1 -35.1
UK 11-01 -15.1 16.8 08-08 59.6 38.4 40.9 42.6 35.2 31.8 27.3 29.1 34.2 32.9 28.7 26.6 27.7
(*) Minimum, maximum and averages are calculated over the period of availibility which is not necessarily as from 01/1990.(a) The sum of the replies for each Member State are weighted in the Community total with the value of consumers’ expenditure.
(b) The indicator is the arithmetic average of the balances (%) of four questions: the financial situation of households, the general economic situation,
unemployment expectations (with inverted sign) and savings, all over the next 12 months.
(c) Results for question 7 are not seasonally adjusted.
(d) Due to a lack of harmonisation, the publication of the European aggregates is discontinued. National results are not comparable across countries.

16
TABLE 5: Monthly survey of retail trade (s.a.)
Since 1990 (*) 2013 2014
Min. Max.
Date Value Date Value Oct Nov Dec Jan Feb Mar Apr May Jun Jul Aug Sep
RETAIL TRADE EU 12-08 -26.8 -6.4 04-07 7.7 -0.9 -5.5 -1.5 1.9 3.3 0.5 2.9 4.1 3.0 2.2 1.0 -1.8
CONFIDENCE EA 01-93 -24.9 -9.1 06-90 5.2 -7.7 -7.6 -5.1 -3.5 -3.1 -2.6 -2.6 -2.5 -1.9 -2.3 -4.6 -7.2
INDICATOR (a) BE 01-09 -27.9 -3.9 10-10 13.7 -7.0 -5.2 1.3 0.4 5.4 8.5 5.1 0.7 3.4 -6.8 -7.2 -6.7
BG 07-09 -14.8 14.5 08-94 31.8 9.5 11.3 9.5 11.0 12.3 18.6 17.8 14.0 15.2 11.9 5.8 5.3
CZ 02-99 -1.3 14.3 11-07 29.5 5.7 5.5 11.7 9.4 11.9 12.1 14.6 12.5 13.5 15.4 11.5 12.6
DK 11-11 -11.6 5.2 09-14 15.6 14.0 10.5 8.1 11.0 6.9 1.3 2.4 3.8 13.5 4.2 9.4 15.6
DE 01-03 -37.4 -11.6 12-90 22.3 -2.4 -4.0 -3.7 1.2 2.1 1.2 0.2 -1.1 1.1 -4.1 -4.4 -7.2
EE 06-09 -45.6 7.7 04-07 35.6 9.2 11.0 18.5 14.2 16.3 16.9 16.2 14.1 13.0 10.3 13.8 10.0
IE : : : : : : : : : : : : : : : : :
EL 10-12 -48.4 -2.4 07-07 39.0 -22.8 -18.1 -15.0 -11.6 -8.4 -10.0 -9.7 -7.4 2.5 4.8 6.6 -2.5
ES 02-93 -36.0 -10.0 06-00 9.5 -5.0 -2.6 5.5 6.6 1.1 7.5 6.9 7.2 6.0 6.0 9.0 6.9
FR 04-97 -27.2 -8.8 12-07 8.8 -10.1 -12.0 -7.3 -10.2 -10.6 -9.9 -10.2 -10.3 -9.8 -4.4 -15.0 -15.8
HR 08-09 -31.0 -13.3 09-08 2.6 -8.4 -10.0 -4.8 -8.4 -4.2 -11.9 -3.6 -6.8 -3.6 -4.3 -7.0 -5.5
IT 04-99 -65.4 -14.5 02-92 17.3 -13.9 -11.9 -12.6 -9.0 -5.6 -8.6 -5.8 -3.2 -1.9 -0.9 -3.2 -8.7
CY 04-13 -48.9 -9.6 05-07 20.6 -25.1 -26.3 -19.1 -17.7 -17.7 -22.7 -9.5 -12.0 -13.4 -13.8 -14.0 -12.1
LV 02-09 -35.2 6.4 04-07 22.8 5.6 8.3 9.0 7.8 10.3 10.5 9.5 10.2 6.1 8.6 7.4 6.6
LT 04-09 -57.8 -1.9 01-07 41.7 -4.1 -2.0 -4.8 8.7 7.2 7.8 6.6 5.7 -1.8 0.4 5.3 1.6
LU : : : : : : : : : : : : : : : : :
HU 03-09 -41.1 -9.3 01-14 14.1 -2.9 -3.5 5.6 14.1 7.2 10.1 8.5 8.9 5.3 4.5 9.6 12.8
MT 08-14 -19.5 -6.3 08-13 3.9 -9.6 -8.3 -1.4 1.1 -9.9 -7.7 -13.4 -5.6 -8.1 0.9 -19.5 -12.9
NL 06-09 -16.9 11.2 10-99 33.3 -6.0 -5.3 -6.5 -2.8 -3.8 0.4 0.4 1.7 0.8 4.7 4.5 4.0
AT 03-09 -26.4 -7.6 05-10 13.2 -7.9 -9.2 -3.9 -8.5 -7.7 -3.9 -3.2 -4.4 -12.7 -12.4 -11.6 -11.0
PL 03-03 -16.8 -3.3 12-07 11.9 -3.2 -3.7 -3.4 -1.9 0.4 1.0 1.2 -0.1 0.5 -1.1 -0.5 -1.7
PT 12-08 -30.7 -3.0 07-98 14.1 -6.5 -5.0 0.7 -1.9 0.5 3.9 3.4 4.5 2.3 1.6 1.2 2.0
RO 07-09 -21.6 11.2 12-97 35.8 1.8 6.5 -0.1 -1.3 5.8 8.1 4.2 9.7 8.7 13.1 11.7 6.6
SI 03-09 -21.6 10.4 09-07 38.2 10.7 -7.1 -4.2 11.0 2.7 6.7 3.7 17.8 -2.0 12.1 8.2 5.2
SK 03-09 -22.7 8.7 11-98 34.4 -1.1 3.4 5.7 5.4 10.7 3.1 4.5 8.1 10.2 8.1 9.2 9.5
FI 09-14 -21.9 -0.8 08-07 23.8 -12.0 -6.7 -3.1 -4.5 -6.4 -10.6 -3.4 -6.5 -15.7 -21.2 -14.1 -21.9
SE 01-09 -38.3 10.2 01-10 47.6 8.0 11.1 14.4 15.5 15.8 17.5 20.1 23.7 21.8 22.0 18.1 22.0
UK 01-09 -47.1 0.6 05-14 25.8 22.2 -3.2 7.6 19.4 24.5 7.9 20.6 25.8 16.9 15.0 17.9 12.0
PRESENT EU 12-08 -32.6 -6.5 06-90 18.6 -1.2 -8.3 -2.7 1.2 5.4 0.8 3.9 8.4 6.9 5.3 2.6 -0.2
BUSINESS EA 12-94 -33.9 -10.2 06-90 21.8 -11.1 -11.2 -9.2 -8.2 -4.4 -4.5 -5.9 -3.0 -1.7 -1.6 -6.3 -9.0
SITUATION (b) BE 06-93 -30.2 0.6 10-10 35.0 -12.3 -8.2 -1.8 -7.2 8.1 8.0 12.3 8.7 10.5 3.3 5.9 7.5
(Question 1) BG 08-09 -36.2 13.2 11-97 51.9 6.7 5.7 15.7 7.3 12.2 19.6 13.4 17.5 9.3 8.4 6.4 1.4
CZ 12-09 -2.6 29.5 11-07 67.2 8.2 11.4 15.6 14.9 13.9 17.0 23.7 24.9 25.1 26.6 20.8 24.6
Component of the DK 11-11 -23.6 3.2 09-14 30.2 3.3 0.5 -7.7 2.3 -9.9 -3.5 4.4 6.0 27.7 -2.5 10.9 30.2
retail confidence DE 12-02 -47.1 -6.1 11-90 52.6 8.0 6.9 6.7 10.5 13.9 13.1 12.4 12.5 16.4 10.5 7.0 6.2
indicator EE 06-09 -61.5 13.6 04-07 71.6 16.5 13.1 26.4 20.4 25.8 36.1 33.4 33.9 33.1 24.3 27.5 20.1
IE : : : : : : : : : : : : : : : : :
EL 10-12 -78.7 -10.2 09-07 63.9 -40.4 -41.4 -30.3 -17.5 -10.5 -18.1 -22.8 -19.2 -5.2 0.6 -4.9 -5.6
ES 07-93 -72.7 -33.2 06-00 3.5 -25.3 -17.2 -11.4 -8.4 -10.0 -4.5 -6.0 -1.2 -3.5 -5.6 -0.1 -4.6
FR 04-97 -48.7 -9.6 12-07 24.8 -9.7 -14.4 -10.8 -12.3 -12.0 -14.4 -19.6 -16.6 -11.9 -4.3 -21.5 -25.2
HR 07-09 -50.5 -24.5 07-08 -1.0 -19.8 -22.3 -3.3 -20.1 -10.9 -17.4 -12.6 -18.7 -10.9 -12.9 -15.7 -19.5
IT 11-94 -91.7 -19.3 05-00 45.4 -32.7 -34.8 -35.0 -35.1 -23.2 -26.7 -27.4 -18.5 -17.4 -15.0 -19.1 -23.8
CY 04-13 -72.5 -29.5 04-07 25.9 -48.4 -50.3 -47.6 -41.8 -43.9 -47.5 -37.1 -32.8 -31.9 -29.1 -37.5 -33.8
LV 02-09 -60.9 4.0 03-07 36.2 7.6 11.6 13.0 10.2 18.6 17.4 15.9 17.1 8.9 11.3 11.4 7.4
LT 09-09 -58.0 -3.9 01-07 75.4 4.8 11.7 -8.4 9.3 2.9 9.2 7.1 10.3 -2.1 -9.5 3.5 8.2
LU : : : : : : : : : : : : : : : : :
HU 03-09 -59.9 -10.2 08-14 20.5 -8.0 -7.9 2.4 15.6 14.6 18.1 18.4 17.9 15.5 11.9 20.5 16.5
MT 02-14 -29.8 -9.3 11-13 19.1 -15.7 19.1 -12.8 -18.2 -29.8 -7.9 -7.9 -12.3 -16.3 -5.4 -20.0 -26.8
NL 08-09 -25.2 22.7 06-99 61.3 -10.9 -10.6 -14.4 -0.4 0.8 1.1 3.3 6.0 -0.2 6.5 10.8 4.7
AT 03-03 -32.8 -2.8 02-06 26.6 -6.5 -6.7 1.0 -9.0 -13.0 4.7 1.5 0.8 -15.1 -16.3 -14.8 -13.6
PL 10-01 -30.9 -5.6 12-07 23.8 -2.8 -2.9 -4.2 -3.5 2.8 4.4 6.5 5.2 3.9 -1.4 0.8 0.8
PT 08-12 -60.0 -8.6 04-99 23.1 -17.9 -11.8 -3.8 -12.9 -6.6 5.9 2.4 10.3 5.8 6.3 3.6 4.5
RO 08-09 -41.1 18.0 09-97 57.3 7.4 16.9 -0.3 -1.3 2.6 10.3 -1.0 15.8 11.3 19.6 22.2 17.1
SI 03-09 -48.1 13.0 11-07 63.1 15.9 -15.4 -31.5 3.0 -22.8 -11.0 -14.9 28.8 -29.3 6.1 7.9 -3.0
SK 06-95 -35.1 11.5 11-98 57.9 -10.1 -0.5 0.2 -2.0 5.8 -6.6 3.2 9.2 13.0 17.6 10.1 9.3
FI 09-14 -40.1 8.7 03-12 48.8 -23.9 -8.4 -6.4 -9.4 -10.4 -9.4 1.1 -13.7 -25.7 -39.6 -31.2 -40.1
SE 01-09 -50.1 16.3 07-06 66.9 7.1 18.3 18.0 22.8 24.4 29.6 37.1 42.6 42.3 39.9 30.6 38.5
UK 01-09 -56.8 3.6 01-11 48.9 33.8 -5.5 17.9 33.1 39.9 14.0 34.6 45.8 31.1 25.7 29.2 22.2
VOLUME EU 08-99 25.3 15.2 04-10 5.1 5.2 8.3 8.9 8.3 6.1 6.8 8.2 8.3 7.8 9.7 10.1 10.7
OF STOCKS EA 10-99 27.3 15.0 03-14 5.0 5.5 7.8 6.4 5.7 6.1 5.0 6.2 8.0 6.0 6.8 7.3 9.3
(Question 2) BE 02-93 30.9 11.5 12-13 -11.7 -2.0 0.3 -11.7 -2.8 -3.2 -2.0 1.5 3.3 0.5 10.9 15.2 17.6
BG 02-12 6.1 -12.0 07-96 -52.2 -4.2 -9.1 -1.3 -5.3 -6.0 -4.2 -4.4 0.5 -0.2 2.1 0.9 1.6
Component of the CZ 05-95 27.8 8.9 08-11 -5.5 6.9 6.0 2.5 3.6 2.8 1.5 1.6 3.6 1.9 1.5 4.1 -1.0
retail confidence DK 10-11 28.1 8.0 05-13 -6.9 -0.7 -1.2 -1.0 -1.6 2.6 4.7 3.3 6.9 4.4 3.9 8.7 13.6
indicator DE 01-03 37.2 21.9 01-91 1.7 14.5 19.3 15.8 12.3 13.5 12.7 16.7 16.2 14.3 18.3 16.9 20.2
EE 06-09 37.4 11.4 07-96 -7.7 8.1 10.3 11.4 11.0 11.1 12.4 7.6 9.1 10.8 11.5 10.9 10.7
IE : : : : : : : : : : : : : : : : :
EL 12-93 40.9 11.5 02-13 -15.2 -9.0 -10.2 -5.4 -4.5 2.5 -3.6 -6.8 -3.5 1.0 -3.5 -10.4 1.7
ES 06-06 25.4 4.8 02-96 -7.2 -0.2 2.6 -6.1 -3.0 3.3 -1.2 -0.2 1.6 -2.2 0.1 2.8 -1.0
FR 03-12 25.2 10.7 03-09 -13.9 7.7 8.3 7.1 10.2 7.5 5.2 4.4 8.0 6.1 4.7 6.0 6.7
HR 10-08 17.7 10.4 12-13 3.8 6.2 8.3 3.8 7.9 12.2 13.9 7.4 4.1 5.9 9.1 6.4 8.9
IT 04-99 73.7 17.1 10-13 -5.9 -5.9 -4.6 1.7 -5.3 -4.3 -2.6 -2.4 2.6 -3.0 -5.3 -2.9 0.6
CY 03-09 26.7 0.4 04-05 -18.8 -4.5 -9.5 -7.9 -15.3 -12.2 -8.5 -14.5 -4.7 -1.8 0.3 -5.7 -3.8
LV 12-02 7.6 -1.6 07-96 -17.2 -1.3 -0.8 -0.9 -2.6 -1.2 -1.2 -1.8 -2.1 0.1 -0.9 -0.1 -2.4
LT 04-09 49.8 3.0 12-99 -20.7 11.4 8.8 3.3 -1.5 0.5 0.2 0.0 0.2 2.3 2.2 2.8 3.6
LU : : : : : : : : : : : : : : : : :
HU 01-99 33.8 18.2 08-10 1.6 6.7 13.1 8.6 9.5 15.1 9.9 19.5 12.6 11.3 10.2 12.6 5.8
MT 09-11 25.7 13.3 09-12 1.1 9.6 13.3 8.1 8.6 18.6 18.9 11.7 17.7 22.2 16.6 25.6 14.6
NL 10-11 21.3 8.2 08-09 -2.4 3.7 5.3 7.7 11.7 8.5 6.7 6.3 6.1 5.5 4.7 6.1 5.3
AT 01-02 41.6 22.9 01-00 -1.7 21.8 21.1 15.3 20.1 10.7 14.0 10.9 17.4 22.5 15.0 18.7 19.9
PL 05-05 13.0 1.6 12-93 -15.5 4.5 5.2 4.7 5.3 4.8 3.7 4.8 4.9 5.4 4.6 4.5 5.1
PT 06-90 27.4 8.3 10-13 -16.5 -16.5 -11.0 -11.8 -9.4 -6.4 -6.2 -6.3 -1.8 -0.8 -2.6 -3.1 -2.8
RO 10-95 54.7 3.3 12-94 -20.4 1.3 0.4 1.4 2.4 0.9 1.4 1.7 -0.4 -0.1 0.5 -0.5 1.0
SI 01-99 32.6 10.7 03-08 -6.7 6.0 9.0 6.7 6.9 6.8 3.6 3.6 3.4 4.9 4.8 4.3 8.0
SK 02-95 25.9 8.2 01-03 -11.0 6.7 6.7 6.6 6.3 3.7 9.0 7.6 5.9 5.3 5.2 5.0 6.4
FI 08-00 38.8 20.9 10-13 -5.1 -5.1 2.4 2.0 7.5 7.3 15.2 1.2 -0.6 4.6 -0.3 4.0 8.6
SE 02-98 45.4 28.3 06-10 4.0 30.1 23.1 21.8 24.9 20.7 24.4 24.9 21.6 20.7 22.2 22.7 24.2
UK 02-09 33.1 17.2 08-09 0.9 1.1 10.4 19.7 17.2 5.2 12.0 14.7 8.2 14.7 21.6 20.6 16.3
Ave.

17
TABLE 5 (continued) : Monthly survey of retail trade (s.a.)
Since 1990 (*) 2013 2014
Date Value Date Value Oct Nov Dec Jan Feb Mar Apr May Jun Jul Aug Sep
EXPECTED EU 02-09 -28.9 2.4 04-07 20.5 3.7 0.0 7.0 12.8 10.7 7.5 13.1 12.1 10.0 11.0 10.5 5.5
BUSINESS EA 02-93 -27.2 -2.0 04-07 15.9 -6.6 -3.8 0.4 3.5 1.3 1.6 4.2 3.6 2.1 1.5 -0.2 -3.3
SITUATION BE 02-09 -42.5 -0.9 01-90 26.8 -10.8 -7.2 -5.9 5.5 5.0 15.3 4.5 -3.2 0.3 -12.8 -12.4 -10.0
(Question 4) BG 02-97 -39.3 18.3 01-07 56.6 17.6 19.3 11.6 20.2 18.7 32.1 35.5 24.9 36.2 29.5 11.8 16.0
CZ 02-99 3.5 22.5 02-02 46.1 15.9 11.2 21.9 16.9 24.6 21.0 21.6 16.4 17.3 21.1 17.9 12.3
Component of the DK 02-12 -18.7 20.4 01-11 59.2 37.9 29.8 31.1 29.1 33.3 12.2 6.2 12.1 17.2 19.0 26.1 30.2
retail confidence DE 04-09 -44.0 -6.6 12-90 27.0 -0.7 0.4 -2.1 5.5 6.0 3.1 4.8 0.5 1.1 -4.5 -3.4 -7.8
indicator EE 03-09 -48.4 19.9 03-04 57.4 19.2 30.2 40.5 33.0 34.1 27.1 22.8 17.5 16.8 18.1 24.9 20.7
IE : : : : : : : : : : : : : : : : :
EL 10-12 -68.0 14.4 07-07 70.3 -36.9 -23.1 -20.2 -21.7 -12.1 -15.4 -13.1 -6.5 13.6 10.2 14.3 -0.1
ES 02-93 -33.7 8.0 04-91 34.0 10.0 12.0 21.8 25.2 16.5 25.7 26.6 24.3 19.5 23.5 29.8 24.4
FR 04-09 -33.1 -6.1 06-07 20.0 -12.8 -13.3 -4.0 -7.9 -12.3 -10.1 -6.5 -6.3 -11.5 -4.2 -17.4 -15.6
HR 08-09 -34.7 -4.9 08-08 23.2 0.7 0.4 -7.3 2.7 10.6 -4.4 9.3 2.5 6.0 8.9 1.1 11.8
IT 08-95 -79.6 -7.2 05-96 33.5 -15.1 -5.4 -1.1 2.9 2.2 -1.6 7.6 11.5 8.6 7.0 6.5 -1.7
CY 04-13 -69.6 1.1 02-08 54.7 -31.4 -38.1 -17.6 -26.7 -21.3 -29.0 -5.8 -7.9 -10.3 -12.1 -10.4 -6.3
LV 03-09 -43.7 13.7 02-07 38.2 7.8 12.5 13.0 10.7 11.2 13.0 10.9 11.5 9.6 13.6 10.7 9.9
LT 04-09 -74.3 1.1 11-06 62.6 -5.7 -8.8 -2.8 15.3 19.3 14.5 12.9 7.1 -0.9 13.0 15.2 0.2
LU : : : : : : : : : : : : : : : : :
HU 03-09 -50.1 0.5 02-98 36.9 6.1 10.6 23.1 36.3 22.1 22.0 26.6 21.5 11.6 11.7 20.8 27.7
MT 11-13 -30.7 3.7 11-11 40.1 -3.4 -30.7 16.8 30.1 18.6 3.7 -20.8 13.1 14.2 24.6 -13.0 2.7
NL 07-09 -18.4 19.2 10-99 45.3 -3.2 -0.1 2.7 3.8 -3.6 6.8 4.1 5.1 8.0 12.5 8.9 12.7
AT 03-09 -26.6 2.9 03-05 30.3 4.6 0.1 2.5 3.5 0.5 -2.4 -0.4 3.5 -0.5 -6.0 -1.5 0.6
PL 01-02 -27.1 -2.8 02-08 16.9 -2.4 -2.9 -1.4 3.3 3.2 2.3 1.9 -0.5 3.1 2.5 2.2 -0.8
PT 09-12 -36.6 7.9 07-98 39.4 -18.0 -14.2 -6.0 -2.3 1.7 -0.4 1.6 1.4 0.2 -4.0 -3.1 -1.1
RO 10-94 -36.7 18.8 11-95 73.6 -0.8 2.9 1.3 -0.1 15.7 15.5 15.4 12.9 14.6 20.3 12.4 3.8
SI 01-09 -20.2 28.8 09-07 56.0 22.3 3.0 25.6 36.9 37.8 34.8 29.7 27.9 28.2 35.1 20.8 26.5
SK 03-09 -34.8 22.8 12-96 60.0 13.6 17.3 23.6 24.4 30.0 24.7 17.8 21.0 22.9 12.1 22.7 25.7
FI 04-09 -24.4 9.7 04-07 41.2 -17.3 -9.3 -0.8 3.4 -1.6 -7.3 -10.1 -6.5 -16.6 -24.3 -7.2 -17.1
SE 01-09 -33.9 42.6 01-10 86.2 47.1 38.2 47.1 48.6 43.7 47.4 48.3 50.1 43.8 48.3 46.5 51.6
UK 02-09 -55.7 15.5 01-97 48.9 33.8 6.1 24.6 42.4 38.8 21.9 41.8 39.9 34.2 40.8 45.2 30.1
INTENTIONS EU 12-08 -34.1 -5.9 02-90 10.2 -3.0 -9.2 -2.4 0.0 2.9 -0.7 2.9 2.5 2.7 0.0 -0.3 -5.5
OF PLACING EA 12-08 -30.8 -10.0 02-90 9.5 -12.0 -12.1 -10.1 -6.9 -7.4 -4.8 -4.7 -5.6 -5.4 -7.3 -7.8 -11.1
ORDERS BE 01-09 -37.3 -7.3 01-90 19.8 -15.9 -12.2 -10.7 -5.7 -7.5 -4.3 -9.9 -13.6 -9.9 -17.5 -9.4 -12.8
(Question 3) BG 02-97 -43.1 11.2 01-07 49.5 15.1 13.6 6.8 20.4 15.9 32.3 36.7 20.3 26.2 23.9 11.0 15.3
CZ 02-96 -32.4 21.6 02-95 57.6 16.7 12.3 13.9 16.6 28.4 24.8 17.1 18.3 12.6 10.8 10.9 7.7
DK 02-12 -25.2 3.2 01-11 28.0 12.4 18.6 3.6 14.6 26.0 -4.8 -10.1 -0.3 6.5 3.6 4.8 16.1
DE 01-03 -40.2 -12.4 01-91 25.3 -4.2 -6.0 -7.4 -3.0 -2.7 0.2 -1.2 -2.6 -1.0 -5.5 -4.9 -13.6
EE 03-09 -58.8 11.9 03-02 62.8 16.1 20.0 27.1 18.9 22.5 12.3 17.2 14.0 9.2 12.5 15.2 11.7
IE : : : : : : : : : : : : : : : : :
EL 10-12 -61.3 -0.6 07-07 46.6 -27.7 -17.8 -10.3 -22.2 -14.2 -5.9 -7.4 -12.6 5.4 -0.3 -6.7 -10.0
ES 12-08 -37.4 -1.8 01-90 20.8 -2.8 -0.4 13.0 7.7 4.4 12.9 13.1 8.1 9.1 9.8 10.6 9.9
FR 04-09 -33.7 -10.5 10-99 12.6 -15.7 -15.2 -16.1 -10.0 -14.6 -10.5 -9.5 -9.2 -11.9 -6.8 -16.1 -17.1
HR 08-09 -41.7 -17.0 05-08 9.2 -19.0 -7.7 -5.3 -10.8 -3.8 -16.0 2.0 -5.8 1.9 0.6 -5.1 -5.8
IT 07-99 -82.1 -17.2 09-00 32.5 -23.8 -24.2 -23.4 -14.5 -14.5 -16.4 -10.6 -11.1 -14.4 -18.9 -14.7 -15.2
CY 04-13 -72.2 -17.1 03-07 34.8 -47.7 -49.3 -34.7 -39.0 -30.6 -47.0 -23.4 -21.5 -20.5 -29.3 -24.2 -20.2
LV 02-09 -53.7 5.3 02-07 30.2 5.6 8.2 3.3 3.1 10.9 6.8 9.6 11.5 6.5 6.7 4.8 8.6
LT 11-09 -86.1 5.1 12-06 55.7 -6.2 6.6 -23.9 21.3 33.6 27.1 10.4 23.0 4.5 17.4 13.2 9.5
LU : : : : : : : : : : : : : : : : :
HU 02-09 -48.8 -6.0 01-14 27.7 -0.2 7.3 18.4 27.7 19.0 18.3 19.5 20.8 14.8 5.0 16.8 21.6
MT 11-12 -24.0 -4.9 11-11 10.0 4.5 -2.3 -1.3 -10.9 2.2 -4.4 -13.3 0.1 -11.7 8.7 -9.6 6.2
NL 07-09 -25.2 4.8 08-99 29.0 -1.7 -11.1 -10.0 -8.4 -4.3 -3.8 -6.2 -6.6 2.0 -2.8 -2.1 -3.8
AT 03-03 -39.1 -20.1 10-10 6.3 -12.2 -12.0 -8.4 -17.4 -9.8 -10.0 -15.8 -7.3 -18.4 -16.9 -15.6 -13.8
PL 02-02 -24.3 -3.3 06-08 18.4 -4.4 -6.3 -3.4 0.9 0.7 -0.6 0.2 -2.5 -0.2 -0.1 0.2 -1.6
PT 10-12 -45.0 -7.2 11-98 26.6 -24.2 -18.9 -12.9 -13.2 -6.2 -5.0 -6.8 -7.4 -7.4 -5.2 -5.6 -7.3
RO 01-10 -25.7 14.3 03-97 80.5 0.0 -1.3 -2.8 -6.7 8.0 8.5 2.5 13.6 15.2 17.9 12.0 -0.8
SI 03-09 -47.0 11.1 08-06 32.5 -2.4 2.9 -0.9 -8.7 -0.9 22.6 21.1 4.6 1.8 6.3 0.5 0.7
SK 03-96 -18.8 33.7 01-02 79.8 30.0 36.5 41.9 38.9 51.0 41.7 36.8 37.4 48.8 42.5 37.6 37.2
FI 07-14 -39.9 -7.8 09-07 21.3 -32.5 -29.3 -13.2 -14.0 -15.8 -22.9 -29.6 -21.5 -22.3 -39.9 -22.3 -20.7
SE 01-09 -49.8 11.2 04-10 60.1 15.0 15.7 15.3 15.0 12.8 13.5 14.4 20.6 18.4 13.9 20.8 21.4
UK 01-09 -65.7 6.8 12-01 44.4 25.6 -6.2 22.4 20.3 35.2 9.5 28.7 28.4 29.1 23.0 22.8 7.5
EMPLOYMENT EU 03-09 -18.4 -2.6 04-07 8.1 0.3 -3.2 3.0 1.8 1.9 2.2 0.6 1.9 0.8 1.1 1.1 0.1
EXPECTATIONS EA 04-09 -15.2 -3.7 03-91 7.9 -5.1 -6.2 -3.0 -2.4 -4.3 -1.6 -1.2 -1.8 -1.6 -2.8 -3.9 -4.9
(Question 5) BE 04-09 -17.2 2.8 01-07 16.4 -3.2 -3.2 -3.8 0.3 -1.0 -1.4 1.2 1.9 2.7 -4.0 -0.3 -0.9
BG 04-98 -44.6 -6.7 10-06 14.7 -2.6 -2.9 -2.3 1.5 1.3 6.9 1.2 0.7 -0.3 2.9 0.6 0.5
CZ 01-95 -40.7 5.0 02-08 37.3 2.2 5.3 -3.4 2.8 7.8 7.4 -3.2 -5.5 -8.5 -0.9 9.4 2.6
DK 01-12 -16.8 -2.2 08-14 15.0 6.3 8.3 2.8 6.2 2.6 0.6 0.9 -4.2 4.6 2.1 15.0 4.5
DE 12-02 -31.8 -7.6 12-10 11.2 -1.6 -1.9 -1.1 -0.3 -1.8 1.6 1.5 1.3 -0.2 -3.2 -0.9 -5.5
EE 03-09 -51.1 -2.6 04-07 25.0 1.5 4.5 2.7 0.4 -2.1 1.8 5.5 6.0 2.5 3.3 5.0 3.8
IE : : : : : : : : : : : : : : : : :
EL 01-12 -69.9 17.3 03-98 62.0 -17.8 -8.0 -0.8 0.5 11.2 17.7 9.2 4.6 32.9 11.9 2.4 12.5
ES 12-08 -19.2 -2.2 12-98 7.7 -2.9 -9.9 2.6 -4.5 -5.1 -0.4 1.2 2.4 -3.7 -0.7 3.1 -0.9
FR 05-09 -22.0 -2.3 12-00 12.3 -6.9 -11.5 -7.2 -7.5 -7.6 -6.3 -3.9 -3.7 -5.8 -6.0 -9.8 -10.0
HR 08-09 -25.2 -8.3 06-08 7.2 -12.7 -7.8 -13.7 -2.6 4.3 2.5 4.2 -0.5 -3.1 -2.0 -0.6 -3.7
IT 01-97 -53.9 -5.0 01-00 34.3 -4.5 -1.5 -1.4 0.3 -4.5 -1.8 -1.6 -5.3 0.6 1.2 -4.2 -1.3
CY 06-13 -19.2 -3.1 06-08 13.1 -3.3 -2.4 0.4 1.6 -1.2 -4.4 -2.4 -2.7 -2.9 -5.8 -5.2 -2.8
LV 03-09 -39.3 0.2 04-07 24.6 0.9 2.8 6.7 3.7 3.8 2.7 2.9 2.7 5.6 4.7 2.0 5.3
LT 11-09 -69.9 1.5 11-06 74.3 18.3 12.7 8.3 19.9 34.1 28.6 24.7 19.1 20.8 11.9 18.3 13.0
LU : : : : : : : : : : : : : : : : :
HU 05-96 -35.2 -8.2 01-14 7.4 -3.0 0.6 6.5 7.4 2.8 5.2 3.2 5.7 -2.9 1.4 2.9 6.6
MT 06-12 -23.7 -6.2 06-11 13.2 -4.0 -0.3 -10.8 -4.4 -16.7 -5.8 -10.4 6.1 -12.5 -0.1 -21.9 -8.3
NL 11-12 -21.5 2.9 12-10 20.7 -14.5 -13.5 -14.6 -1.1 -6.7 -2.5 -7.9 -4.8 -9.2 -5.8 -6.9 -3.4
AT 03-96 -16.4 -3.8 08-10 12.7 -0.9 -0.3 7.3 3.7 0.4 -2.0 1.0 2.3 0.7 0.4 -5.3 -5.3
PL 12-01 -24.6 -7.2 02-08 12.9 -6.1 -5.1 -5.6 -3.1 -3.5 -1.8 -1.8 -1.4 -0.3 -1.6 -1.8 -1.7
PT 10-12 -32.7 -6.3 09-97 17.3 -17.6 -13.5 -13.5 -6.8 -6.6 -8.3 -7.7 -6.9 -4.1 -4.1 -5.7 -4.5
RO 10-94 -32.1 -1.3 12-98 64.2 4.1 3.9 4.6 7.3 0.1 -6.0 5.0 1.8 7.7 6.4 9.7 8.5
SI 02-99 -46.5 -10.3 12-07 30.4 -2.5 -25.1 -25.0 -18.1 -10.2 0.8 -21.9 -10.2 -24.3 -21.5 -20.0 -28.9
SK 12-93 -70.6 -0.4 09-02 32.7 -2.1 -3.3 6.9 4.0 1.5 3.8 0.6 -1.8 8.8 2.3 4.8 2.2
FI 05-14 -27.3 -6.6 02-07 11.1 -14.7 -16.6 -6.0 -4.9 -18.2 -16.0 -12.7 -27.3 -12.8 -19.6 -21.6 -21.6
SE 12-08 -50.3 -12.2 02-10 23.1 3.4 -1.6 2.2 3.3 -3.7 5.0 13.1 6.5 3.4 6.8 8.0 8.4
UK 01-09 -44.3 2.9 10-97 33.4 20.7 6.6 27.2 16.8 25.8 16.2 5.1 16.0 9.1 15.0 17.1 16.7
Ave.Max.Min.

18
TABLE 5 (continued) : Monthly survey of retail trade (s.a.)
Since 1990 (*) 2013 2014
Min. Max.
Date Value Date Value Oct Nov Dec Jan Feb Mar Apr May Jun Jul Aug Sep
SELLING–PRICE EU 09-09 -4.3 10.3 03-11 27.6 5.6 5.6 8.1 6.4 5.7 4.6 5.0 2.5 4.6 5.4 2.6 -0.9
EXPECTATIONS EA 03-09 -11.4 6.2 11-07 23.3 2.1 3.5 6.0 4.1 1.8 -0.3 -0.3 -1.5 0.1 0.2 -0.1 -4.1
(Question 6) BE 08-09 -13.2 5.0 04-11 26.4 -2.1 4.6 9.2 10.2 7.9 11.1 4.7 4.4 1.4 -3.9 2.5 -8.0
BG 11-09 -9.2 12.6 07-08 45.8 -4.6 -2.4 1.5 -0.1 -3.2 -2.4 0.7 -2.6 2.4 -1.8 0.7 -1.5
CZ 12-08 -11.3 2.2 01-04 22.5 -3.6 -3.4 6.5 5.0 8.9 3.4 3.3 3.5 2.8 6.1 7.5 4.1
DK 02-13 -13.1 1.1 02-11 23.7 -0.4 -0.4 -5.3 -8.1 -8.7 -5.5 -3.7 -1.7 1.0 0.2 -1.1 1.3
DE 09-09 -21.1 11.5 12-06 42.2 7.4 10.2 13.4 12.1 11.6 8.8 8.0 8.0 4.7 9.3 7.3 2.8
EE 03-09 -35.9 27.6 04-11 54.9 30.4 30.2 29.4 29.4 28.5 27.4 23.6 27.9 28.2 23.9 18.0 12.6
IE : : : : : : : : : : : : : : : : :
EL 06-12 -35.2 -2.1 05-08 33.6 -16.2 -17.9 -21.6 -18.3 -12.2 -20.3 -10.1 -10.2 -2.3 -6.6 -10.6 -12.3
ES 02-09 -18.6 5.4 01-05 28.7 -7.9 -3.6 0.7 -1.5 -3.6 -5.9 -5.7 -4.4 3.1 -8.9 -3.2 -10.1
FR 03-09 -29.4 -2.4 09-95 15.5 -3.8 -3.2 -1.9 -2.9 -9.1 -11.7 -12.5 -14.4 -12.4 -10.3 -11.8 -15.0
HR 02-14 -13.2 0.6 06-08 31.6 -6.2 -10.7 -7.9 -6.8 -13.2 -12.8 -9.2 -5.5 -6.0 -1.5 -3.0 -4.0
IT 08-05 -14.5 10.3 06-08 33.1 9.7 5.0 6.2 0.1 -1.8 -1.1 -0.5 -2.7 5.2 6.5 5.2 0.6
CY 04-13 -27.7 4.7 07-08 34.3 -20.9 -17.8 -9.9 -1.7 -10.2 -9.0 -5.8 -6.4 -6.9 -0.8 -16.9 -15.6
LV 01-10 -22.5 24.2 05-04 55.7 16.2 19.3 15.1 9.9 11.4 14.0 9.7 14.4 17.3 18.0 10.9 8.4
LT 07-09 -46.5 11.0 04-11 61.7 22.7 12.6 7.0 8.5 13.7 15.8 11.3 12.5 30.6 31.2 26.4 1.9
LU : : : : : : : : : : : : : : : : :
HU 03-10 3.6 43.7 05-96 81.3 10.7 14.4 9.4 11.4 17.1 20.4 17.0 12.2 10.3 14.7 10.7 15.3
MT 02-14 -23.7 8.1 08-12 30.8 15.1 -3.4 10.2 -8.1 -23.7 10.4 2.0 0.2 2.1 -4.6 -11.3 5.3
NL 11-10 -18.7 6.6 10-12 26.2 -9.9 -0.2 -2.4 2.0 -1.5 -2.8 1.2 -5.4 -6.1 -10.1 -7.0 -4.0
AT 09-09 -1.0 12.6 02-08 34.1 18.1 15.4 25.0 22.2 22.0 18.3 15.5 13.7 12.7 8.6 16.9 11.5
PL 07-02 -7.0 16.1 03-09 39.4 7.2 7.8 4.6 3.9 7.3 4.9 6.0 7.3 4.9 6.2 5.7 4.0
PT 07-03 -19.6 6.7 07-05 27.2 -2.1 -3.9 -2.5 -1.1 2.0 0.0 2.9 1.4 2.2 1.2 0.0 1.0
RO 10-13 6.4 30.6 10-04 56.0 6.4 25.0 31.8 16.2 22.5 16.6 33.5 17.3 13.6 12.1 12.5 7.4
SI 03-09 -32.6 13.3 02-08 40.2 21.5 24.8 24.4 22.3 18.6 27.8 26.0 28.9 -0.5 0.5 14.3 -3.0
SK 07-09 -36.9 17.6 11-02 73.9 8.7 2.1 7.5 1.7 4.7 9.9 5.9 0.4 5.9 3.8 2.0 2.0
FI 09-09 -43.3 10.6 07-11 59.6 17.8 18.9 24.1 15.3 10.1 -0.3 9.5 2.3 7.1 -0.4 -13.6 -6.9
SE 07-05 -10.3 11.5 07-08 36.8 10.2 8.4 7.8 4.1 8.3 4.6 9.6 10.1 8.8 7.2 9.3 14.0
UK 07-05 -2.4 23.0 01-11 66.9 18.0 11.2 16.0 15.7 18.4 22.3 21.7 13.7 18.8 23.2 9.4 6.8
(a) The indicator is the arithmetic average of the balances (%) for the present and the future business situation, and for stocks – with inverted sign.
(b) United Kingdom: refers to the volume of sales for the time of the year.
(*) Minimum, maximum and averages are calculated over the period of availability which is not necessarily as from 01/1990.
Ave.

19
TABLE 6: Monthly survey of construction industry (s.a.) (a)
Since 1990 (*) 2013 2014
Min. Max.
Date Value Date Value Oct Nov Dec Jan Feb Mar Apr May Jun Jul Aug Sep
CONSTRUCTION EU 06-93 -45.3 -19.6 12-06 3.8 -26.7 -26.4 -24.8 -24.6 -24.7 -24.5 -25.9 -25.6 -26.0 -23.0 -22.3 -21.2
CONFIDENCE EA 09-93 -46.0 -18.3 02-90 6.0 -29.1 -30.4 -26.4 -29.8 -28.5 -28.7 -30.4 -30.1 -31.7 -28.2 -28.4 -27.7
INDICATOR (a) BE 11-95 -35.1 -10.0 02-90 9.7 -20.2 -21.3 -23.6 -24.4 -19.4 -20.2 -21.5 -22.1 -21.6 -20.6 -19.5 -20.3
BG 10-09 -56.0 -25.2 11-07 23.9 -33.2 -32.0 -33.5 -31.6 -33.0 -31.9 -33.0 -30.4 -33.7 -32.2 -31.1 -33.7
CZ 02-99 -54.9 -20.9 01-05 5.3 -47.7 -48.1 -47.5 -47.4 -42.6 -44.0 -39.3 -38.9 -37.0 -36.4 -31.5 -27.6
DK 10-09 -50.0 -10.0 11-06 24.2 -14.5 -15.2 -8.0 -2.9 -2.6 -4.4 -6.9 -12.0 -9.6 -7.4 -7.5 -10.0
DE 12-02 -55.4 -28.3 02-90 2.2 -3.0 -3.0 -2.3 -7.0 -5.4 -7.0 -9.7 -12.4 -9.9 -12.0 -13.0 -11.5
EE 04-09 -76.0 -1.5 05-06 48.8 -9.9 -14.7 -19.9 -19.1 -24.5 -21.7 -16.2 -20.0 -29.9 -30.2 -23.6 -24.2
IE : : : : : : : : : : : : : : : : :
EL 08-11 -77.4 -20.1 04-00 32.5 -37.1 -33.4 -39.4 -23.4 -23.2 -13.5 -19.9 -20.3 -19.1 -19.6 -21.1 -32.7
ES 08-13 -69.3 -12.1 12-98 39.5 -64.8 -60.4 -46.9 -52.9 -51.3 -52.6 -54.4 -48.3 -64.6 -40.0 -33.5 -31.5
FR 01-93 -62.3 -14.2 10-00 44.9 -25.7 -29.2 -27.3 -30.3 -31.1 -28.9 -32.5 -32.1 -34.3 -39.4 -41.5 -40.5
HR 03-10 -49.2 -31.2 05-08 13.0 -41.4 -42.1 -40.8 -38.9 -39.6 -32.5 -32.9 -36.0 -34.2 -34.1 -31.9 -29.8
IT 09-93 -75.4 -23.4 04-90 13.4 -33.1 -34.2 -31.4 -36.9 -35.8 -36.4 -37.1 -39.0 -32.0 -29.7 -35.5 -37.0
CY 04-13 -72.7 -23.2 12-03 36.5 -50.7 -59.6 -54.5 -57.6 -53.5 -50.0 -42.9 -49.3 -47.6 -50.2 -44.9 -47.4
LV 07-09 -79.4 -25.4 01-07 19.2 -20.1 -19.6 -18.2 -15.6 -16.0 -12.5 -14.0 -17.1 -20.3 -21.8 -18.8 -18.2
LT 05-09 -92.9 -34.3 01-07 13.4 -21.1 -23.5 -21.1 -19.3 -16.0 -14.1 -14.8 -13.6 -15.7 -20.0 -18.0 -14.5
LU 03-94 -70.9 -22.6 03-90 26.4 -11.7 -3.4 -6.7 -8.4 -0.3 -3.3 -8.3 -8.9 -9.0 -2.5 -0.3 2.4
HU 04-09 -56.0 -18.9 08-98 11.5 -15.0 -15.0 -13.1 -10.8 -12.2 -12.4 -4.5 -7.0 -4.3 -2.8 -3.7 -4.1
MT 03-09 -53.4 -31.3 05-08 2.0 -44.6 -26.0 -34.9 -30.5 -43.5 -24.3 -25.7 -27.3 -18.7 -30.1 -22.5 -20.5
NL 12-12 -47.7 -6.9 12-00 27.1 -35.7 -37.5 -33.6 -30.7 -29.4 -28.0 -22.8 -25.2 -18.6 -19.3 -18.1 -11.1
AT 04-96 -56.4 -18.5 07-07 5.8 -5.2 -18.3 -19.5 -13.8 -13.1 -14.2 -14.1 -18.0 -19.9 -19.3 -19.8 -19.8
PL 02-02 -67.9 -34.5 02-08 -0.7 -35.3 -34.5 -32.9 -30.3 -30.2 -29.1 -28.9 -28.9 -27.8 -27.2 -26.9 -26.0
PT 05-12 -75.1 -32.2 12-97 1.9 -49.0 -48.4 -48.5 -44.8 -45.1 -46.8 -45.1 -44.1 -43.4 -43.9 -46.2 -44.8
RO 09-99 -60.4 -14.5 06-96 34.6 -29.0 -29.2 -30.5 -31.4 -23.0 -22.0 -21.6 -21.0 -23.0 -21.4 -21.8 -19.6
SI 03-10 -63.9 -13.0 03-07 27.8 -18.9 -18.2 -19.4 -15.6 -18.1 -8.2 -14.0 -3.4 -6.1 -5.7 -10.8 -10.7
SK 07-99 -86.1 -28.4 03-97 17.5 -45.3 -43.4 -43.9 -36.1 -25.8 -25.2 -30.8 -31.1 -39.0 -34.9 -26.3 -19.1
FI 06-91 -99.0 -19.0 06-98 36.5 -10.7 -28.2 -15.7 -28.9 -24.4 -29.7 -31.5 -18.3 -20.9 -23.5 -29.1 -34.4
SE 12-93 -82.9 -24.7 08-07 47.6 -34.1 -23.8 -15.8 -19.8 -17.0 -18.1 -20.7 -17.3 -13.2 -5.9 -5.2 -6.8
UK 06-91 -79.3 -22.4 10-07 5.5 -14.6 -9.6 -17.8 -4.6 -11.3 -9.5 -11.1 -10.8 -8.0 -6.1 -2.0 0.9
ORDER BOOKS EU 06-93 -58.4 -28.9 03-90 0.7 -39.9 -38.5 -35.6 -38.0 -36.8 -38.1 -36.6 -37.3 -36.0 -35.7 -34.8 -33.6
(Question 3) EA 08-93 -57.0 -26.0 07-06 1.4 -38.9 -39.5 -34.8 -41.3 -37.5 -39.9 -40.0 -40.4 -40.1 -39.0 -39.8 -37.9
BE 01-96 -47.2 -18.7 03-07 3.5 -29.1 -29.5 -33.5 -34.1 -28.0 -28.9 -29.8 -32.7 -32.3 -30.6 -28.5 -27.5
Component of the BG 03-12 -82.2 -44.1 10-07 0.8 -62.0 -57.6 -60.5 -57.5 -60.2 -55.5 -60.1 -50.2 -53.8 -54.1 -51.3 -50.2
construction confidence CZ 10-13 -70.7 -27.1 12-02 10.9 -70.7 -67.3 -66.4 -65.2 -62.8 -66.2 -62.1 -62.2 -56.4 -55.9 -49.1 -46.2
indicator DK 01-10 -66.0 -14.1 07-06 33.4 -19.3 -22.7 -15.6 -13.6 -12.3 -10.4 -12.7 -13.5 -14.2 -12.6 -17.7 -22.5
DE 07-02 -66.5 -38.5 12-13 -6.8 -9.4 -9.2 -6.8 -13.3 -10.6 -13.4 -14.4 -19.1 -14.2 -17.7 -20.1 -20.2
EE 07-09 -82.8 -9.8 04-06 59.1 -20.1 -27.0 -37.3 -28.3 -36.7 -31.4 -33.2 -29.8 -49.5 -52.3 -41.9 -44.6
IE : : : : : : : : : : : : : : : : :
EL 11-11 -98.6 -42.9 04-00 16.0 -61.3 -64.4 -63.8 -52.6 -58.2 -47.5 -55.2 -62.4 -57.3 -53.0 -56.7 -62.6
ES 08-13 -72.9 -9.3 11-05 54.2 -70.6 -65.4 -51.2 -67.4 -54.8 -63.9 -63.9 -57.1 -70.2 -50.9 -48.4 -41.0
FR 07-93 -71.3 -21.8 10-00 50.9 -39.3 -40.6 -41.2 -42.8 -42.4 -40.4 -42.4 -42.4 -44.1 -52.2 -53.1 -51.9
HR 03-10 -64.4 -47.3 05-08 -0.2 -57.4 -62.2 -60.1 -58.4 -57.9 -52.0 -52.5 -52.8 -52.3 -52.3 -49.4 -46.3
IT 01-94 -94.5 -37.6 04-90 6.5 -48.4 -47.6 -42.8 -51.4 -49.5 -53.5 -50.3 -54.6 -43.0 -43.7 -47.7 -48.4
CY 08-13 -94.1 -38.1 12-03 43.0 -85.9 -88.7 -89.1 -90.6 -90.0 -84.5 -73.9 -88.3 -83.9 -85.7 -85.0 -86.1
LV 09-09 -92.3 -45.2 01-07 8.5 -33.3 -32.6 -31.9 -30.8 -32.0 -26.7 -27.8 -32.2 -31.0 -35.2 -30.0 -30.7
LT 10-09 -99.7 -55.4 03-07 1.2 -41.5 -42.8 -38.7 -39.6 -41.4 -41.3 -35.8 -33.7 -32.0 -42.7 -36.1 -34.0
LU 08-93 -70.1 -25.6 05-00 15.5 -17.9 -12.0 -13.7 -10.8 -6.8 -9.3 -13.4 -12.3 -10.9 -3.1 -3.5 -2.3
HU 05-09 -69.2 -30.3 09-98 2.8 -23.6 -26.7 -22.8 -20.7 -19.8 -16.1 -10.4 -12.9 -9.2 -7.8 -6.7 -6.8
MT 10-13 -72.6 -49.3 05-08 -5.0 -72.6 -57.9 -59.2 -51.6 -61.2 -34.6 -51.0 -44.1 -34.4 -51.4 -51.3 -41.2
NL 03-13 -56.7 -12.5 02-08 21.1 -45.4 -44.5 -37.6 -37.1 -41.6 -40.6 -36.5 -37.7 -30.7 -29.7 -28.0 -22.7
AT 04-96 -59.1 -26.5 05-12 1.5 -7.4 -25.6 -25.7 -23.0 -20.2 -23.3 -22.3 -25.6 -22.5 -26.4 -24.9 -24.4
PL 10-02 -86.4 -56.9 02-08 -24.7 -53.8 -53.4 -53.0 -50.6 -49.6 -47.1 -46.4 -46.6 -45.9 -44.4 -44.9 -43.7
PT 06-12 -87.9 -48.6 05-08 -4.6 -68.1 -67.5 -68.9 -66.7 -64.8 -66.9 -64.4 -63.2 -64.2 -63.8 -65.9 -64.6
RO 09-99 -89.1 -21.8 03-98 63.2 -44.5 -43.9 -44.8 -47.0 -40.4 -38.4 -36.5 -35.0 -35.2 -35.1 -35.8 -33.7
SI 07-10 -79.1 -16.9 08-04 31.7 -23.6 -23.2 -23.8 -24.4 -24.3 -18.3 -16.2 -9.3 -9.6 -11.2 -13.9 -10.4
SK 03-94 -92.8 -44.3 03-97 -4.5 -59.1 -57.5 -59.5 -55.1 -40.8 -50.3 -60.7 -52.1 -61.7 -60.3 -52.2 -38.2
FI 06-94 -99.0 -29.2 11-07 27.8 -14.8 -38.5 -18.9 -34.8 -30.2 -25.1 -29.9 -16.6 -27.5 -29.2 -38.2 -40.8
SE 05-97 -97.4 -37.3 05-07 43.3 -54.4 -43.3 -36.9 -48.7 -46.7 -49.1 -47.7 -46.5 -44.6 -36.1 -39.0 -38.6
UK 06-91 -86.6 -36.8 10-07 -1.1 -37.6 -29.4 -32.7 -21.1 -30.0 -28.0 -20.4 -23.5 -18.5 -22.1 -14.3 -14.9
EMPLOYMENT EU 10-92 -34.8 -10.3 03-07 11.8 -13.4 -14.3 -14.0 -11.2 -12.5 -10.9 -15.3 -13.9 -16.1 -10.3 -9.8 -8.8
EXPECTATIONS EA 06-93 -36.0 -10.7 02-90 13.4 -19.2 -21.3 -18.0 -18.4 -19.5 -17.6 -20.7 -19.7 -23.3 -17.3 -17.1 -17.4
(Question 4) BE 11-95 -25.1 -1.3 02-90 20.8 -11.2 -13.1 -13.6 -14.6 -10.8 -11.4 -13.2 -11.5 -10.9 -10.6 -10.5 -13.0
BG 10-09 -49.3 -6.4 12-07 49.7 -4.5 -6.3 -6.5 -5.7 -5.7 -8.2 -5.9 -10.5 -13.6 -10.3 -10.8 -17.3
Component of the CZ 03-99 -53.1 -14.6 01-96 19.7 -24.8 -28.9 -28.6 -29.6 -22.4 -21.8 -16.4 -15.7 -17.7 -16.9 -13.9 -8.9
construction confidence DK 03-09 -38.0 -5.9 03-98 42.0 -9.6 -7.7 -0.4 7.7 7.2 1.6 -1.1 -10.4 -4.9 -2.3 2.7 2.5
indicator DE 12-96 -50.0 -18.1 02-90 18.9 3.4 3.2 2.1 -0.6 -0.1 -0.6 -4.9 -5.8 -5.6 -6.4 -5.9 -2.7
EE 03-09 -75.9 6.9 01-97 68.6 0.4 -2.4 -2.5 -10.0 -12.3 -11.9 0.7 -10.2 -10.3 -8.2 -5.4 -3.8
IE : : : : : : : : : : : : : : : : :
EL 04-11 -69.9 2.7 03-99 59.5 -13.0 -2.3 -15.0 5.8 11.8 20.6 15.5 21.8 19.2 13.8 14.4 -2.7
ES 12-11 -76.2 -14.9 12-98 54.6 -59.1 -55.4 -42.7 -38.4 -47.8 -41.4 -44.9 -39.5 -59.1 -29.0 -18.7 -21.9
FR 01-93 -54.9 -6.5 10-00 39.0 -12.0 -17.8 -13.5 -17.7 -19.8 -17.4 -22.5 -21.9 -24.4 -26.6 -29.8 -29.1
HR 08-09 -35.2 -15.2 05-08 26.2 -25.4 -21.9 -21.5 -19.5 -21.2 -13.0 -13.2 -19.3 -16.1 -15.9 -14.4 -13.3
IT 09-93 -64.5 -9.1 05-04 26.8 -17.8 -20.8 -20.0 -22.3 -22.0 -19.4 -23.8 -23.4 -20.9 -15.7 -23.4 -25.6
CY 04-13 -53.0 -8.3 11-03 49.6 -15.5 -30.5 -19.9 -24.6 -17.1 -15.5 -11.9 -10.3 -11.3 -14.6 -4.7 -8.7
LV 05-09 -74.4 -5.6 12-06 34.5 -6.9 -6.7 -4.4 -0.5 0.1 1.6 -0.2 -2.0 -9.6 -8.4 -7.7 -5.8
LT 05-09 -95.2 -13.1 03-03 36.7 -0.6 -4.1 -3.4 1.1 9.4 13.2 6.2 6.5 0.7 2.7 0.1 5.0
LU 02-94 -75.6 -19.7 03-90 37.3 -5.5 5.1 0.2 -6.0 6.2 2.6 -3.2 -5.6 -7.2 -1.8 3.0 7.0
HU 04-09 -46.0 -7.4 01-98 21.2 -6.4 -3.2 -3.4 -0.8 -4.6 -8.7 1.3 -1.1 0.6 2.3 -0.6 -1.3
MT 04-09 -38.6 -13.4 05-08 8.9 -16.7 5.8 -10.6 -9.4 -25.8 -14.0 -0.4 -10.6 -3.0 -8.9 6.3 0.3
NL 12-12 -42.8 -1.3 07-08 41.3 -26.0 -30.4 -29.6 -24.2 -17.2 -15.4 -9.1 -12.7 -6.5 -9.0 -8.1 0.5
AT 02-01 -73.9 -10.5 01-08 21.1 -3.1 -11.0 -13.2 -4.7 -6.1 -5.1 -5.9 -10.3 -17.3 -12.2 -14.7 -15.2
PL 02-02 -58.6 -11.1 12-07 24.1 -16.8 -15.5 -12.8 -10.1 -10.8 -11.2 -11.4 -11.3 -9.8 -10.0 -8.9 -8.3
PT 05-12 -63.6 -15.7 09-97 19.4 -29.9 -29.4 -28.1 -23.0 -25.3 -26.7 -25.8 -25.0 -22.5 -23.9 -26.4 -25.0
RO 06-97 -39.4 -7.2 03-01 37.6 -13.5 -14.4 -16.1 -15.8 -5.6 -5.5 -6.6 -7.1 -10.8 -7.7 -7.8 -5.5
SI 03-10 -56.8 -9.0 10-06 30.7 -14.1 -13.1 -15.0 -6.7 -11.8 1.9 -11.7 2.4 -2.7 -0.2 -7.7 -11.0
SK 07-99 -85.9 -12.5 01-97 40.5 -31.6 -29.4 -28.2 -17.1 -10.8 -0.2 -1.0 -10.1 -16.2 -9.6 -0.4 0.1
FI 04-91 -99.1 -8.7 03-97 59.8 -6.6 -17.9 -12.5 -23.0 -18.6 -34.4 -33.0 -20.0 -14.4 -17.8 -19.9 -28.0
SE 01-97 -77.6 -12.0 12-10 63.0 -13.8 -4.3 5.3 9.0 12.7 13.0 6.3 11.9 18.1 24.2 28.5 25.0
UK 06-91 -72.0 -8.1 09-14 16.7 8.3 10.3 -2.8 11.9 7.3 9.1 -1.9 2.0 2.4 9.8 10.3 16.7
Ave.

20
TABLE 6 (continued) : Monthly survey of construction industry (s.a.)
Since 1990 (*) 2013 2014
Min. Max.
Date Value Date Value Oct Nov Dec Jan Feb Mar Apr May Jun Jul Aug Sep
TREND OF ACTIVITY EU 05-09 -32.7 -7.1 02-07 16.8 -13.3 -6.0 -6.9 -4.6 -6.2 -2.9 -9.0 -8.5 -7.9 -9.6 -7.9 -7.4
COMPARED WITH EA 04-13 -34.7 -7.9 09-06 17.4 -19.1 -13.3 -13.4 -12.4 -11.4 -9.3 -15.8 -16.3 -13.7 -16.0 -15.7 -13.4
PRECEDING MONTHS BE 03-96 -25.3 -3.6 02-90 12.9 -5.6 -9.6 -10.7 -5.7 2.9 5.7 -2.4 -8.4 -14.0 -11.3 -8.8 -9.0
(Question 1) BG 10-00 -51.3 -10.0 12-05 28.2 -9.1 -4.0 -8.7 -11.9 -3.7 -7.6 -0.6 -9.1 -10.3 -10.6 -9.0 -16.1
CZ 01-14 -11.1 25.4 01-05 78.4 -4.1 -6.7 -7.4 -11.1 -10.6 -7.7 -1.4 2.0 0.8 0.4 0.8 -1.5
DK 03-10 -46.0 -5.0 02-07 21.0 -7.0 -2.7 -0.7 5.5 2.3 10.2 5.8 3.4 -2.3 -2.4 -5.8 1.6
DE 03-05 -45.3 -14.9 03-91 39.5 -0.9 -5.4 1.1 6.9 7.8 14.2 -6.3 -14.0 -5.1 -5.2 -1.0 -0.8
EE 06-09 -50.5 12.0 06-02 87.1 0.8 -1.5 -4.9 -8.1 -8.6 8.8 9.9 11.6 -5.2 -14.6 -11.1 -5.0
IE : : : : : : : : : : : : : : : : :
EL 08-11 -73.7 -3.0 06-98 60.6 -33.4 -24.8 -18.5 -20.7 -33.1 -9.5 -19.7 -7.8 -23.3 -23.6 -27.7 -35.6
ES 07-97 -50.7 -0.6 06-99 47.8 -42.3 -13.0 -18.2 -19.3 -19.4 -17.3 -32.3 -18.7 -25.8 -19.3 -14.9 -0.6
FR 01-93 -65.8 -5.4 04-00 51.3 -13.5 -13.0 -18.6 -14.5 -12.5 -12.6 -11.5 -11.4 -11.5 -25.3 -29.2 -33.7
HR 01-10 -54.1 -20.3 07-08 24.9 -26.6 -37.0 -29.5 -24.0 -26.1 -13.4 -15.4 -16.9 -16.8 -17.5 -13.3 -14.2
IT 02-93 -56.7 -15.9 06-04 19.4 -38.8 -30.6 -28.3 -32.3 -35.1 -38.5 -35.7 -37.6 -23.3 -24.8 -29.8 -30.3
CY 04-13 -77.6 -26.7 09-02 63.6 -48.3 -65.4 -58.5 -65.8 -61.8 -52.1 -41.8 -54.6 -41.9 -35.3 -49.0 -42.6
LV 07-09 -74.3 -4.6 06-02 41.9 1.2 -1.3 -2.7 0.2 -1.0 6.3 7.7 9.3 -1.4 -3.8 0.2 1.1
LT 06-09 -85.7 -2.8 06-02 81.1 5.3 7.1 11.2 16.8 2.2 12.1 18.1 15.0 0.7 4.6 3.7 4.5
LU 08-99 -78.6 -22.4 09-99 49.4 -9.6 -7.6 -7.2 0.0 1.1 2.0 -3.4 -9.9 -5.7 -7.6 -6.6 3.6
HU 05-09 -54.5 -16.1 03-99 14.0 -2.7 0.2 8.3 6.9 9.0 4.5 11.1 4.3 6.8 11.7 5.2 14.0
MT 04-09 -54.2 -15.4 09-14 16.4 -29.2 5.4 -10.0 -5.6 -8.4 -8.3 -7.3 5.6 5.6 7.2 6.5 16.4
NL 03-10 -47.4 -5.2 03-97 36.5 -14.9 -11.2 -7.6 -5.5 0.9 1.4 8.1 -4.7 -1.1 -3.4 1.9 3.2
AT 04-96 -83.7 -0.2 01-04 30.2 13.5 12.3 19.1 12.5 9.7 3.1 10.4 -0.3 -0.8 -6.1 -8.4 1.7
PL 03-04 -26.9 4.0 01-05 45.3 -10.6 -9.5 -6.9 -3.4 -1.2 4.0 4.0 -3.6 -4.1 -4.8 -2.9 -2.0
PT 05-12 -68.4 -15.9 05-97 26.1 -37.6 -32.9 -24.1 -29.5 -25.9 -32.0 -26.1 -26.1 -29.8 -33.5 -34.2 -36.5
RO 06-99 -99.0 5.9 04-02 98.8 -18.8 -19.1 -17.1 -18.1 -11.5 -12.3 -9.6 -9.1 -10.1 -12.7 -9.6 -8.9
SI 10-09 -65.6 -2.4 03-07 48.1 -12.5 -7.2 -1.2 3.4 -2.6 0.2 2.7 -5.9 7.8 9.6 3.6 4.0
SK 06-99 -43.4 6.2 12-04 56.6 -4.5 2.4 7.0 16.7 20.4 22.8 12.7 1.6 28.7 7.9 22.9 22.1
FI 09-91 -99.7 -4.8 06-98 47.1 -4.0 -15.8 -9.7 -16.6 -12.9 -0.2 -5.0 6.6 -6.4 -2.9 -11.5 -15.0
SE 12-91 -66.7 -3.9 12-10 61.8 -4.6 5.4 4.6 7.2 13.9 14.5 18.8 12.8 26.3 16.8 10.9 9.9
UK 06-91 -68.2 -6.5 01-14 22.9 5.1 20.8 15.3 22.9 9.1 16.6 7.7 14.0 7.3 7.4 16.0 9.3
PRICE EU 05-09 -33.8 2.8 05-90 25.7 -12.8 -5.7 -7.6 -7.0 -5.6 -6.3 -11.4 -8.7 -6.4 -6.4 -5.5 -5.3
EXPECTATIONS EA 05-09 -32.8 -0.1 05-90 42.8 -21.1 -15.4 -16.5 -19.0 -17.5 -18.5 -22.8 -20.4 -18.0 -18.5 -16.3 -17.1
(Question 5) BE 01-96 -20.0 -0.4 01-90 32.5 -12.6 -13.9 -13.9 -13.3 -13.3 -10.7 -12.2 -13.2 -12.6 -11.6 -12.6 -11.6
BG 10-09 -18.1 26.9 01-95 91.3 -4.3 1.6 0.5 1.3 1.1 -1.5 -0.6 2.3 -1.1 -5.8 -0.4 -4.9
CZ 07-13 -32.8 23.4 02-95 81.6 -21.9 -22.4 -17.0 -23.3 -13.0 -15.1 -18.3 -12.8 -9.9 -10.6 -11.3 -10.4
DK 02-09 -53.1 -15.7 02-06 8.3 -13.2 -12.7 -7.4 -3.2 -4.9 -8.9 -9.5 -11.5 -10.3 -10.4 -9.4 -7.8
DE 02-96 -44.2 -11.8 02-90 44.7 -5.3 -6.4 -2.7 -3.4 -3.8 -4.7 -7.4 -9.3 -8.3 -11.2 -7.2 -12.1
EE 02-09 -59.8 25.6 04-94 88.3 2.8 4.0 -5.9 -5.3 5.4 3.5 6.9 2.4 -6.8 -7.3 -1.1 1.7
IE : : : : : : : : : : : : : : : : :
EL 12-11 -47.8 -2.8 06-95 35.3 -19.2 -13.1 -35.6 -31.4 -45.8 -34.1 -26.5 -30.7 -26.3 -25.2 -28.4 -25.6
ES 04-14 -44.7 8.5 08-99 75.5 -40.4 -12.1 -24.4 -32.2 -26.6 -34.2 -44.7 -30.1 -29.0 -18.7 -11.5 -10.1
FR 06-09 -55.7 -19.2 04-07 12.7 -33.1 -32.4 -34.8 -34.6 -35.2 -34.3 -37.1 -38.6 -34.6 -39.1 -39.9 -39.4
HR 07-10 -27.3 -7.5 06-08 48.5 -8.0 -10.7 -9.2 -6.3 -10.6 -10.1 -8.9 -13.3 -7.7 -10.1 -6.6 -6.0
IT 05-09 -20.7 7.5 05-90 60.6 -13.3 -13.8 -8.8 -12.0 -13.5 -13.1 -14.1 -14.2 -10.2 -13.2 -12.3 -15.5
CY 05-13 -62.3 -4.9 06-04 75.5 -32.5 -39.4 -36.8 -38.5 -31.2 -43.0 -26.0 -33.4 -26.3 -14.9 -25.4 -23.8
LV 05-09 -55.8 23.7 02-07 75.0 14.2 14.0 23.4 25.1 22.2 18.8 17.3 17.8 16.4 13.7 12.2 11.7
LT 03-09 -70.5 26.2 01-95 89.1 12.8 15.4 20.5 24.1 25.2 26.9 25.5 20.9 17.2 14.9 17.9 25.5
LU 05-93 -68.3 -29.1 11-00 24.8 -34.9 -33.6 -31.6 -30.6 -29.5 -23.7 -24.4 -27.3 -25.0 -18.4 -22.9 -20.5
HU 03-10 -22.6 0.3 03-01 33.2 -3.9 -9.6 -5.0 -2.1 -4.7 -4.9 2.1 -2.3 -0.9 0.0 -3.8 6.0
MT 08-13 -30.2 -3.9 05-08 58.1 -21.3 -12.8 -11.3 2.8 -18.0 -8.2 -7.9 -14.1 -12.2 -16.3 -8.3 5.5
NL 07-09 -22.5 20.1 04-01 68.9 -5.6 -6.0 -1.8 -1.7 0.1 0.3 0.1 0.8 3.0 4.0 0.4 2.8
AT 02-96 -59.6 -6.3 11-03 32.9 -1.2 2.7 5.1 -3.0 1.8 4.9 -9.4 -6.3 -2.8 -11.7 -8.3 -3.8
PL 03-02 -27.5 9.3 06-07 47.0 -13.8 -12.2 -11.9 -12.4 -10.7 -9.7 -9.1 -8.9 -7.5 -7.2 -6.8 -6.6
PT 08-12 -45.3 -11.6 06-90 45.8 -26.9 -25.7 -26.9 -22.8 -18.9 -20.8 -19.2 -24.7 -20.6 -20.9 -21.7 -23.4
RO 03-10 -8.0 50.0 11-93 97.2 2.5 5.4 1.7 2.0 5.8 3.3 8.7 7.8 6.3 1.3 0.4 1.5
SI 01-10 -44.1 -4.2 02-08 25.4 -7.5 -10.0 -11.2 -5.3 -7.0 -8.1 -8.6 -4.0 -6.7 -10.1 -9.8 -13.8
SK 02-13 -30.2 35.5 06-97 93.3 -3.9 -4.8 -8.9 -8.3 17.9 4.6 5.9 3.2 -4.2 -7.7 1.4 18.0
FI 04-09 -83.4 1.6 05-97 57.4 -24.4 -23.9 -15.5 -32.2 -21.9 -21.0 -38.4 -23.3 -22.6 -26.5 -17.9 -26.8
SE 06-91 -75.3 -9.1 02-11 63.7 -5.1 -0.1 5.0 7.4 10.0 -2.3 9.4 6.2 8.2 7.2 6.6 13.8
UK 12-90 -56.0 12.0 07-04 43.5 16.1 30.7 22.8 34.0 35.6 38.0 24.7 30.3 33.2 35.3 31.7 34.4
(a) The indicator is the arithmetic average of the balances (%) for the questions on order-books and employment expectations.
(*) Minimum, maximum and averages are calculated over the period of availibily which is not necessarily as from 01/1990.
Ave.

21
TABLE 7: Monthly survey of financial services sector (a)
Since 04/2006 2013 2014
Min. Max.
Date Value Date Value Oct Nov Dec Jan Feb Mar Apr May Jun Jul Aug Sep
FINANCIAL SERVICES EU 01-09 -20.0 13.1 04-06 43.3 16.7 12.7 13.2 14.2 13.8 10.9 16.1 21.9 20.8 17.1 19.0 18.3
CONFIDENCE INDICATOR (b)
EA 01-09 -21.8 11.3 04-06 42.6 8.6 4.9 6.9 11.0 8.5 2.8 10.9 17.1 16.4 14.2 14.6 12.7
ASSESSMENT OF BUSINESS SITUATION EU 02-09 -31.6 10.0 04-06 38.6 14.6 13.9 11.9 15.2 13.6 10.1 12.1 21.4 17.4 15.2 19.1 18.0
OVER THE PAST 3 MONTHS (c)
EA 03-09 -30.1 8.4 04-06 39.6 5.1 6.4 4.5 15.3 10.6 1.9 6.9 16.4 13.5 13.3 14.7 11.6
EVOLUTION OF DEMAND EU 03-09 -24.9 11.1 04-06 41.6 15.6 11.5 16.9 11.6 11.2 8.9 15.7 19.3 21.2 15.4 18.2 16.4
OVER THE PAST 3 MONTHS (c)
EA 03-09 -25.3 9.3 04-06 40.3 8.4 2.9 11.9 10.4 5.9 -0.8 9.6 14.1 17.3 11.8 13.0 10.5
EVOLUTION OF DEMAND EXPECTED EU 01-09 -18.2 18.1 04-06 49.5 19.9 12.9 11.0 15.7 16.4 13.9 20.5 25.0 23.7 20.7 19.7 20.4
OVER THE NEXT 3 MONTHS (c)
EA 01-09 -19.9 16.0 04-06 47.8 12.2 5.3 4.4 7.2 8.9 7.4 16.0 20.8 18.4 17.4 16.1 16.0
EVOLUTION OF EMPLOYMENT EU 02-09 -11.2 6.2 01-07 23.3 5.5 11.1 8.6 8.5 4.0 5.8 6.6 4.5 6.8 8.0 8.2 5.7
OVER THE PAST 3 MONTHS EA 03-13 -12.4 5.5 09-08 25.7 1.3 4.8 0.2 4.4 2.3 -0.6 3.3 -3.6 0.3 0.2 3.2 0.5
EVOLUTION OF EMPLOYMENT EU 01-09 -11.8 8.0 04-06 30.0 4.0 5.3 4.6 10.2 7.2 9.9 12.9 11.4 11.9 5.7 11.1 11.3
EXPECTED OVER THE NEXT 3 MONTHS EA 12-12 -12.4 6.1 04-06 29.5 -2.1 -4.2 -3.3 2.6 -1.8 0.8 8.0 3.6 7.0 1.5 6.0 3.8
(a) Data are not seasonally adjusted.
(b) The confidence indicator is the arithmetic average of the balances (%) for the questions on business situation and past and expected evolution of demand.
(c) Component of the confidence indicator.
Ave.
Information
The European Commission publishes the Business and Consumer Survey Results every month. The issues of January, April, July and October also include the quarterly survey results for the manufacturing industry and consumers. The April and November issues also include the investment survey results.
The data of the surveys is processed by the Directorate-General Financial and Economic Affairs (DG ECFIN), Unit Economic situation, forecasts, business and consumer surveys (A4), Sector Business and consumer surveys and short-term forecast.
To obtain additional information regarding these survey results you can contact the European Commission at the following addresses:
Mail: European Commission
DG ECFIN / Unit A4 200, Rue de La Loi B-1049 Brussels
Email: [email protected]
Website: http://ec.europa.eu/economy_finance/db_indicators/surveys/index_en.htm
Upcoming releases: Flash Consumer Confidence Indicator 23 October 2014
Economic Sentiment Indicator 30 October 2014
Business Climate Indicator for the euro area 30 October 2014