Embed Size (px)
Citation preview
European Technology Update
Member FINRA/SIPC
European Technology Update10 November 2011
Thierry MonjauzeThierry MonjauzeManaging Director63 Brook StreetLondon W1K 4HSUnited KingdomPhone: +44 20 7518 [email protected]
Francois MorinDirector63 Brook Street
www.harriswilliams.comThis report has been prepared by Harris Williams & Co. Ltd and approved by Sturgeon Ventures LLP in accordance with Conduct Of Business rules COBS 4 of the FSA Handbook.
Harris Williams & Co. Ltd is an authorised representative of Sturgeon Ventures LLP which is Authorised and Regulated by the Financial Services Authority. This report is being made by Harris Williams & Co. Ltd. Investment banking services are provided by Harris Williams LLC, a registered broker-dealer and member of FINRA and SIPC, and Harris
Williams & Co. Ltd. Harris Williams & Co. is a trade name under which Harris Williams LLC and Harris Williams & Co. Ltd conduct business in the U.S. and Europe, respectively.
63 Brook StreetLondon W1K 4HSUnited KingdomPhone: +44 20 7518 [email protected]
Recent Developments
Sony acquired the remaining 50% stake in Sony Ericsson Mobile Communications from LM Ericsson Telephone for €1 billion Yahoo acquired interclick, an advertising technology solutions provider, for an estimated $270 millionC3 Technologies, a Swedish 3D mapping company, was acquired by Apple for $264 millionThe Riverside Company and Halder have acquired Keymile Group, a leading supplier of communication solutions in the field of access and transmission systems, for $164 million
p
Company Specific
News
yAdobe acquired video ad management and monetization company Auditude for an estimated $100 millionApp-DNA, provider of application migration and compatibility software, was acquired by Citrix for $92 millionVistaprint acquired the European photobook software solutions provider Albumprinter for €60 millionThe Riverside Company sold Swiss electronics manufacturer EM Test to AMETEK for $41 millionGB Group plc acquired Capscan, a supplier of customer registration management software, for £11.2 millionDescartes Systems Group acquired InterCommIT, a provider of B2B IT integration services, for $14 millionAlentus Corporation acquired Emnet UK, a provider of collocation, managed services and shared hostingVeriFone Systems acquired Global Bay Mobile Technologies, a provider of mobile retail solutionsPrysm, a developer of digital displays, raised $100 million from investors including Artiman and PartechCoraid, a leading developer of Ethernet SAN solutions, raised $50 million led by Crosslink CapitalDelivery Agent provider of multi-channel commerce technology, raised $35.5 million in a round led by Intel Capital, Liberty Global and Grazia EquityBoulder, a maker of primary storage systems for cloud service providers, raised $25 million from New Enterprise Associates, Valhalla Partners and Novak Biddle Calient Technologies, a developer of photonic switching systems and network systems, raised $19.4 million to help it expand into datacenter and cloud computing markets Tradeshift, the B2B social network, raised $17 million in a round led by ru-Net and Kite Ventures Appcelerator, a producer of a development platform for mobile web applications, raised $15 million from Mayfield Fund, Translink Capital and Red HatIndex Ventures and Creandum invested €8.2 million in the Swedish mobile payment company iZettleRuna Capital invested £5 million in ThinkGrid, the provider of cloud-based IT solutionsGroupon raised $700 million from its IPO, valuing the Company at roughly $12.7 billion, with the share price gaining over 30% on its first day of tradingJive Software, a social-networking software company, filed for a $100 million IPO on NasdaqThe Chinese daily deal website lashou.com filed for an IPO to raise $100 million on NasdaqHTC’s profits rose 68% y-o-y to $624.9 million in Q3 2011Russian search engine Yandex's profits increased 93% to $53.5 million Amazon.com’s earnings fell by 73% in Q3 as a sharp increase in spending offset a strong surge in sales
Online video ad spending is projected to grow to $7.1 billion by 2015, according to eMarketerHTC has become the biggest smartphone seller in the US, shipping 5.7 milllion units and taking almost a quarter of the market in Q3, according to CanalysThe US mobile coupon market will be worth $43 billion by 2016, according to JuniperDigital music will account for half of the total $14 5 billion recorded music sales in 2015 according to IDC
Industry Trends
Digital music will account for half of the total $14.5 billion recorded music sales in 2015, according to IDCNokia's share of the global handset market fell to 27.3% in Q3, according to Strategy AnalyticsThe VoIP market is expected to reach $40 billion globally, according to Point TopicNearly 40% of US cellphone owners downloaded an app in August, according to Pew Research CenterReal-time bidding will grow to a $5 billion business by 2015, International Data Corporation predictsWorldwide ad spending on social networks is expected to top $8 billion next year, according to eMarketerSpending on mobile advertising will top $1 billion in the US for the first time this year, according to eMarketerMobile commerce is expected to reach $163 billion globally by 2015, according to ABI ResearchA third of consumers are now paying to watch online video content, according to paidContentOnline gaming will account for $11.9 billion or 16% of gaming sector revenues this year, according to GartnerOnline gaming will account for $11.9 billion or 16% of gaming sector revenues this year, according to GartnerThe number of tablet owners in the US will double in the next year with an estimated 58 million people owning a device by early 2012, according to OPA
Source: Various industry news outlets. 1
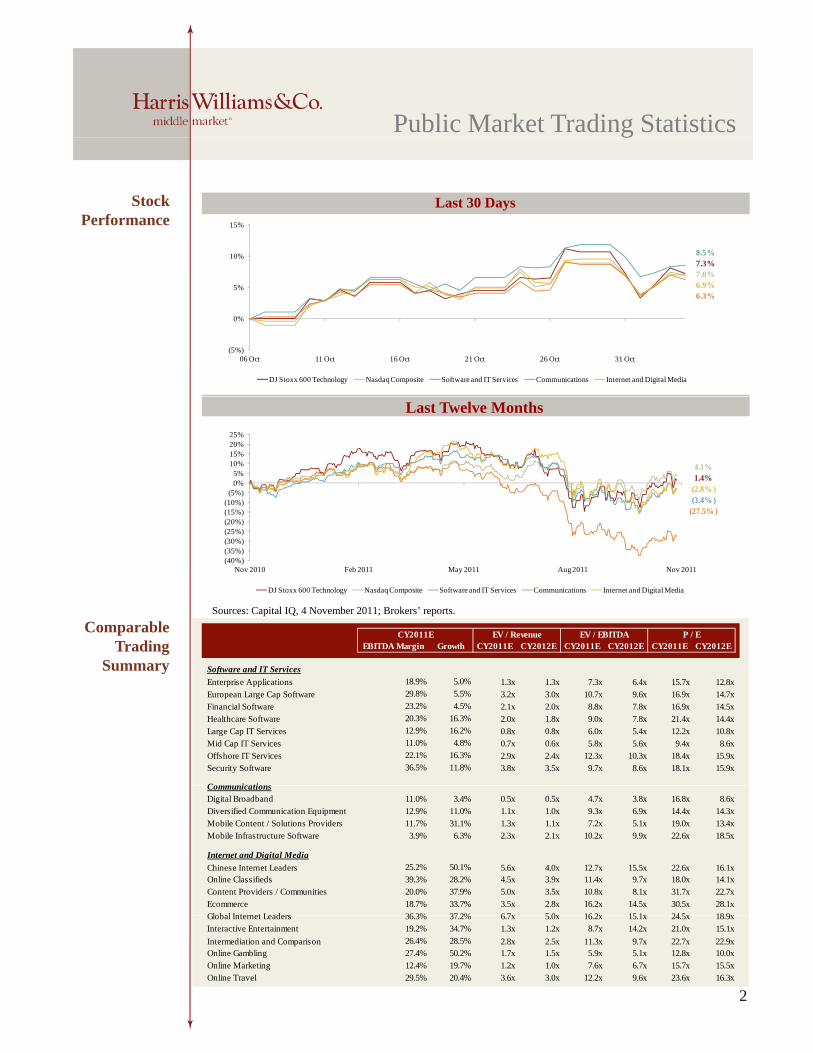
Public Market Trading Statistics
Stock Performance
Last 30 Days
g
10%
15%
8.5%7.3%
(5%)
0%
5%
06 Oct 11 Oct 16 Oct 21 Oct 26 Oct 31 Oct
DJ Stoxx 600 Technology Nasdaq Composite Software and IT Services Communications Internet and Digital Media
7.0%6.9%6.3%
Last Twelve Months
4.1%1.4%
(2.8% )(3.4% )
(27.5% )(20%)(15%)(10%)
(5%)0%5%
10%15%20%25%
Comparable Trading
Sources: Capital IQ, 4 November 2011; Brokers’ reports.
CY2011EEBITDA Margin Growth CY2011E CY2012E CY2011E CY2012E CY2011E CY2012E
P / EEV / Revenue EV / EBITDA
(40%)(35%)(30%)(25%)
Nov 2010 Feb 2011 May 2011 Aug 2011 Nov 2011
DJ Stoxx 600 Technology Nasdaq Composite Software and IT Services Communications Internet and Digital Media
Summary Software and IT ServicesEnterprise Applications 18.9% 5.0% 1.3x 1.3x 7.3x 6.4x 15.7x 12.8xEuropean Large Cap Software 29.8% 5.5% 3.2x 3.0x 10.7x 9.6x 16.9x 14.7xFinancial Software 23.2% 4.5% 2.1x 2.0x 8.8x 7.8x 16.9x 14.5xHealthcare Software 20.3% 16.3% 2.0x 1.8x 9.0x 7.8x 21.4x 14.4xLarge Cap IT Services 12.9% 16.2% 0.8x 0.8x 6.0x 5.4x 12.2x 10.8xMid Cap IT Services 11.0% 4.8% 0.7x 0.6x 5.8x 5.6x 9.4x 8.6xOffshore IT Services 22.1% 16.3% 2.9x 2.4x 12.3x 10.3x 18.4x 15.9xSecurity Software 36.5% 11.8% 3.8x 3.5x 9.7x 8.6x 18.1x 15.9x
CommunicationsCommunicationsDigital Broadband 11.0% 3.4% 0.5x 0.5x 4.7x 3.8x 16.8x 8.6xDiversified Communication Equipment 12.9% 11.0% 1.1x 1.0x 9.3x 6.9x 14.4x 14.3xMobile Content / Solutions Providers 11.7% 31.1% 1.3x 1.1x 7.2x 5.1x 19.0x 13.4xMobile Infrastructure Software 3.9% 6.3% 2.3x 2.1x 10.2x 9.9x 22.6x 18.5x
Internet and Digital MediaChinese Internet Leaders 25.2% 50.1% 5.6x 4.0x 12.7x 15.5x 22.6x 16.1xOnline Classifieds 39.3% 28.2% 4.5x 3.9x 11.4x 9.7x 18.0x 14.1xContent Providers / Communities 20.0% 37.9% 5.0x 3.5x 10.8x 8.1x 31.7x 22.7xEcommerce 18.7% 33.7% 3.5x 2.8x 16.2x 14.5x 30.5x 28.1xGlobal Internet Leaders 36 3% 37 2% 6 7x 5 0x 16 2x 15 1x 24 5x 18 9x
2
Global Internet Leaders 36.3% 37.2% 6.7x 5.0x 16.2x 15.1x 24.5x 18.9xInteractive Entertainment 19.2% 34.7% 1.3x 1.2x 8.7x 14.2x 21.0x 15.1xIntermediation and Comparison 26.4% 28.5% 2.8x 2.5x 11.3x 9.7x 22.7x 22.9xOnline Gambling 27.4% 50.2% 1.7x 1.5x 5.9x 5.1x 12.8x 10.0xOnline Marketing 12.4% 19.7% 1.2x 1.0x 7.6x 6.7x 15.7x 15.5xOnline Travel 29.5% 20.4% 3.6x 3.0x 12.2x 9.6x 23.6x 16.3x
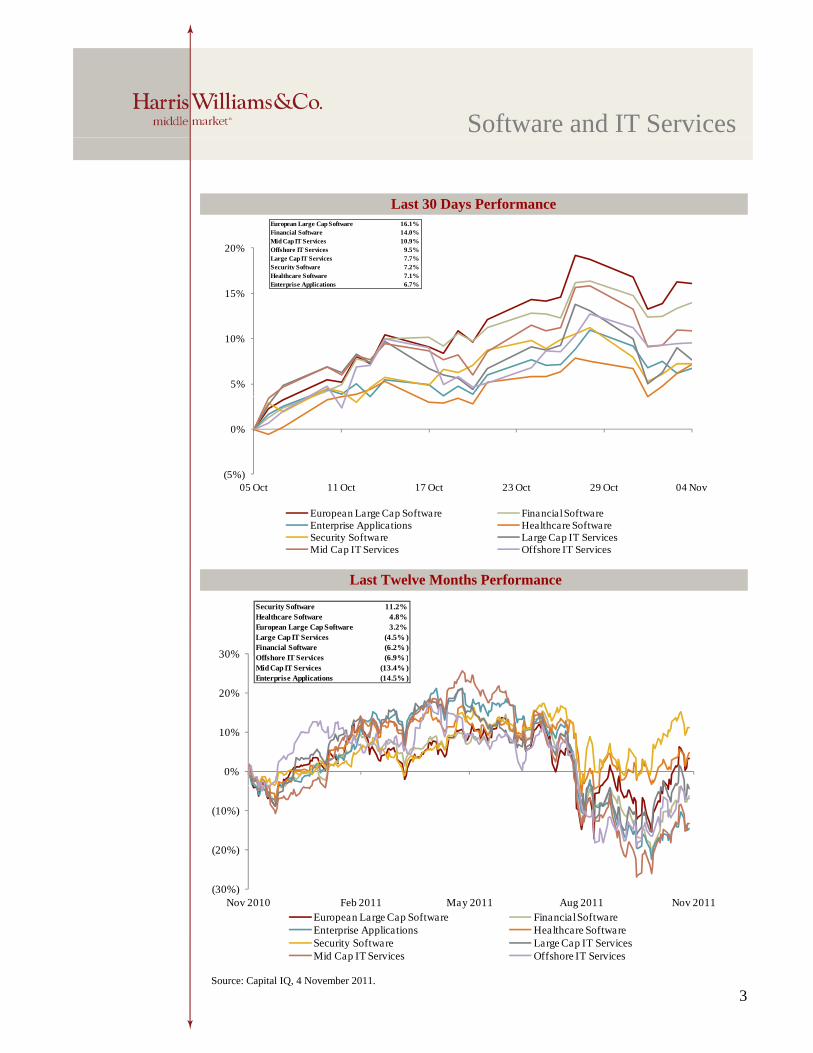
Software and IT Services
20%
Last 30 Days PerformanceEuropean Large Cap Software 16.1%Financial Software 14.0%Mid Cap IT Services 10.9%Offshore IT Services 9.5%Large Cap IT Services 7.7%Security Software 7 2%
5%
10%
15%
Security Software 7.2%Healthcare Software 7.1%Enterprise Applications 6.7%
(5%)
0%
05 Oct 11 Oct 17 Oct 23 Oct 29 Oct 04 Nov
European Large Cap Software Financial SoftwareEnterprise Applications Healthcare SoftwareEnterprise Applications Healthcare SoftwareSecurity Software Large Cap IT ServicesMid Cap IT Services Offshore IT Services
Last Twelve Months Performance
30%
Security Software 11.2%Healthcare Software 4.8%European Large Cap Software 3.2%Large Cap IT Services (4.5% )Financial Software (6.2% )Off h IT S i (6 9% )
0%
10%
20%
30% Offshore IT Services (6.9% )Mid Cap IT Services (13.4% )Enterprise Applications (14.5% )
(30%)
(20%)
(10%)
Nov 2010 Feb 2011 May 2011 Aug 2011 Nov 2011E L C S ft Fi i lS ft
Source: Capital IQ, 4 November 2011.3
European Large Cap Software Financial SoftwareEnterprise Applications Healthcare SoftwareSecurity Software Large Cap IT ServicesMid Cap IT Services Offshore IT Services
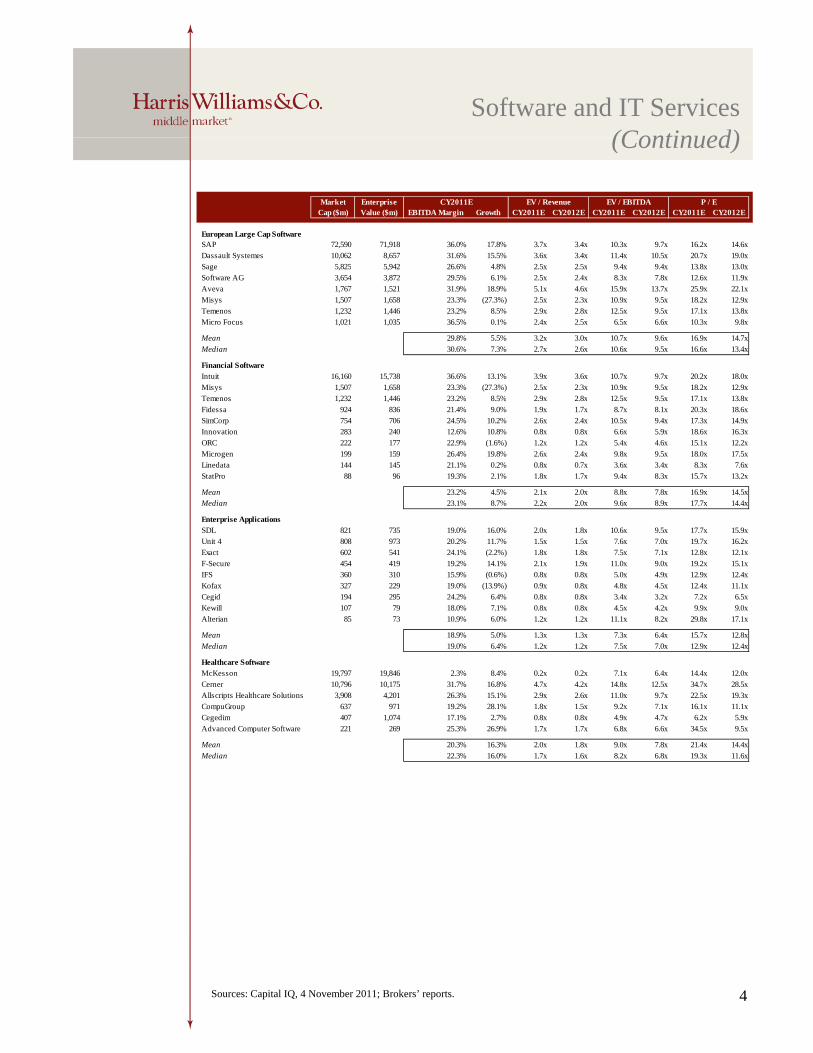
Software and IT Services(Continued)(Continued)
Market Enterprise CY2011ECap ($m) Value ($m) EBITDA Margin Growth CY2011E CY2012E CY2011E CY2012E CY2011E CY2012E
European Large Cap SoftwareSAP 72,590 71,918 36.0% 17.8% 3.7x 3.4x 10.3x 9.7x 16.2x 14.6xDassault Systemes 10,062 8,657 31.6% 15.5% 3.6x 3.4x 11.4x 10.5x 20.7x 19.0xSage 5 825 5 942 26 6% 4 8% 2 5x 2 5x 9 4x 9 4x 13 8x 13 0x
EV / Revenue EV / EBITDA P / E
Sage 5,825 5,942 26.6% 4.8% 2.5x 2.5x 9.4x 9.4x 13.8x 13.0xSoftware AG 3,654 3,872 29.5% 6.1% 2.5x 2.4x 8.3x 7.8x 12.6x 11.9xAveva 1,767 1,521 31.9% 18.9% 5.1x 4.6x 15.9x 13.7x 25.9x 22.1xMisys 1,507 1,658 23.3% (27.3%) 2.5x 2.3x 10.9x 9.5x 18.2x 12.9xTemenos 1,232 1,446 23.2% 8.5% 2.9x 2.8x 12.5x 9.5x 17.1x 13.8xMicro Focus 1,021 1,035 36.5% 0.1% 2.4x 2.5x 6.5x 6.6x 10.3x 9.8x
Mean 29.8% 5.5% 3.2x 3.0x 10.7x 9.6x 16.9x 14.7xMedian 30.6% 7.3% 2.7x 2.6x 10.6x 9.5x 16.6x 13.4x
Financial SoftwareIntuit 16,160 15,738 36.6% 13.1% 3.9x 3.6x 10.7x 9.7x 20.2x 18.0xMisys 1,507 1,658 23.3% (27.3%) 2.5x 2.3x 10.9x 9.5x 18.2x 12.9xT 1 232 1 446 23 2% 8 5% 2 9 2 8 12 5 9 5 17 1 13 8Temenos 1,232 1,446 23.2% 8.5% 2.9x 2.8x 12.5x 9.5x 17.1x 13.8xFidessa 924 836 21.4% 9.0% 1.9x 1.7x 8.7x 8.1x 20.3x 18.6xSimCorp 754 706 24.5% 10.2% 2.6x 2.4x 10.5x 9.4x 17.3x 14.9xInnovation 283 240 12.6% 10.8% 0.8x 0.8x 6.6x 5.9x 18.6x 16.3xORC 222 177 22.9% (1.6%) 1.2x 1.2x 5.4x 4.6x 15.1x 12.2xMicrogen 199 159 26.4% 19.8% 2.6x 2.4x 9.8x 9.5x 18.0x 17.5xLinedata 144 145 21.1% 0.2% 0.8x 0.7x 3.6x 3.4x 8.3x 7.6xStatPro 88 96 19.3% 2.1% 1.8x 1.7x 9.4x 8.3x 15.7x 13.2x
Mean 23.2% 4.5% 2.1x 2.0x 8.8x 7.8x 16.9x 14.5xMedian 23.1% 8.7% 2.2x 2.0x 9.6x 8.9x 17.7x 14.4x
Enterprise ApplicationsSDL 821 735 19.0% 16.0% 2.0x 1.8x 10.6x 9.5x 17.7x 15.9xUnit 4 808 973 20.2% 11.7% 1.5x 1.5x 7.6x 7.0x 19.7x 16.2xExact 602 541 24.1% (2.2%) 1.8x 1.8x 7.5x 7.1x 12.8x 12.1xF-Secure 454 419 19.2% 14.1% 2.1x 1.9x 11.0x 9.0x 19.2x 15.1xIFS 360 310 15.9% (0.6%) 0.8x 0.8x 5.0x 4.9x 12.9x 12.4xKofax 327 229 19.0% (13.9%) 0.9x 0.8x 4.8x 4.5x 12.4x 11.1xCegid 194 295 24.2% 6.4% 0.8x 0.8x 3.4x 3.2x 7.2x 6.5xKewill 107 79 18.0% 7.1% 0.8x 0.8x 4.5x 4.2x 9.9x 9.0xAlterian 85 73 10.9% 6.0% 1.2x 1.2x 11.1x 8.2x 29.8x 17.1x
Mean 18.9% 5.0% 1.3x 1.3x 7.3x 6.4x 15.7x 12.8xMedian 19.0% 6.4% 1.2x 1.2x 7.5x 7.0x 12.9x 12.4x
Healthcare SoftwareMcKesson 19,797 19,846 2.3% 8.4% 0.2x 0.2x 7.1x 6.4x 14.4x 12.0xCerner 10,796 10,175 31.7% 16.8% 4.7x 4.2x 14.8x 12.5x 34.7x 28.5xAllscripts Healthcare Solutions 3,908 4,201 26.3% 15.1% 2.9x 2.6x 11.0x 9.7x 22.5x 19.3xCompuGroup 637 971 19.2% 28.1% 1.8x 1.5x 9.2x 7.1x 16.1x 11.1xCegedim 407 1,074 17.1% 2.7% 0.8x 0.8x 4.9x 4.7x 6.2x 5.9xAdvanced Computer Software 221 269 25.3% 26.9% 1.7x 1.7x 6.8x 6.6x 34.5x 9.5x
Mean 20.3% 16.3% 2.0x 1.8x 9.0x 7.8x 21.4x 14.4xMedian 22.3% 16.0% 1.7x 1.6x 8.2x 6.8x 19.3x 11.6x
4Sources: Capital IQ, 4 November 2011; Brokers’ reports.

Software and IT Services(Continued)(Continued)
Market Enterprise CY2011ECap ($m) Value ($m) EBITDA Margin Growth CY2011E CY2012E CY2011E CY2012E CY2011E CY2012E
Security SoftwareSymantec 12,517 12,361 33.2% 11.4% 1.8x 1.8x 5.5x 5.0x 10.8x 9.7xCheck Point 12,264 11,054 60.0% 14.9% 8.9x 8.0x 14.8x 13.5x 20.9x 18.7x
d i
P / EEV / Revenue EV / EBITDA
Trend Micro 4,605 3,144 33.5% 6.9% 2.5x 2.4x 7.5x 6.8x 21.4x 20.1xF-Secure 454 419 19.2% 14.1% 2.1x 1.9x 11.0x 9.0x 19.2x 15.1x
Mean 36.5% 11.8% 3.8x 3.5x 9.7x 8.6x 18.1x 15.9xMedian 33.3% 12.8% 2.3x 2.2x 9.2x 7.9x 20.0x 16.9x
Large Cap IT ServicesAccenture 37,327 32,097 15.7% 17.1% 1.2x 1.1x 7.8x 7.2x 16.5x 14.8xCapita Group 6,893 8,861 17.2% 10.2% 1.9x 1.7x 10.9x 10.0x 14.7x 13.3xCap Gemini 5,712 5,448 9.1% 14.8% 0.4x 0.4x 4.5x 4.2x 11.1x 9.9xComputer Sciences 5,024 6,264 12.6% 0.0% 0.4x 0.4x 3.0x 2.6x 8.0x 6.9xAtos Origin 3,320 3,448 10.1% 39.1% 0.4x 0.3x 3.6x 2.8x 10.9x 8.8x
Mean 12 9% 16 2% 0 8x 0 8x 6 0x 5 4x 12 2x 10 8xMean 12.9% 16.2% 0.8x 0.8x 6.0x 5.4x 12.2x 10.8xMedian 12.6% 14.8% 0.4x 0.4x 4.5x 4.2x 11.1x 9.9x
Mid Cap IT ServicesCGI 5,289 6,197 18.7% 6.9% 1.5x 1.4x 7.8x 7.3x 13.2x 12.0xIndra Sistemas 2,703 3,202 12.0% 6.0% 0.9x 0.8x 7.3x 6.9x 10.1x 9.8xLogica 2,162 2,852 8.2% 8.7% 0.5x 0.4x 5.6x 5.3x 7.6x 6.9xTieto 1,139 1,303 10.7% 10.0% 0.5x 0.5x 4.9x 4.7x 12.6x 10.2xSopra 734 900 10.7% (5.7%) 0.6x 0.6x 5.8x 5.9x 8.6x 8.6xGroupe Steria 569 847 9.0% 1.3% 0.4x 0.4x 4.1x 4.0x 6.8x 6.4xGFI Informatique 209 367 7.9% 6.7% 0.4x 0.4x 4.9x 4.7x 6.8x 6.4x
Mean 11.0% 4.8% 0.7x 0.6x 5.8x 5.6x 9.4x 8.6xM di 10 7% 6 7% 0 5 0 5 5 6 5 3 8 6 8 6Median 10.7% 6.7% 0.5x 0.5x 5.6x 5.3x 8.6x 8.6x
Offshore IT ServicesTata 43,861 42,675 29.6% 18.2% 4.6x 3.8x 15.6x 13.2x 21.0x 18.4xInfosys 32,959 29,159 30.7% 14.2% 4.5x 3.7x 14.5x 12.2x 21.1x 17.5xCognizant 21,402 19,111 20.5% 34.0% 3.1x 2.6x 15.3x 12.6x 25.0x 20.9xWipro 18,505 17,828 20.1% 7.6% 2.5x 2.1x 12.3x 10.3x 16.6x 14.9xHCL 6,159 6,122 17.5% 18.9% 1.7x 1.3x 9.6x 7.7x 15.5x 13.0xSatyam 1,771 1,091 14.0% 5.1% 0.9x 0.8x 6.5x 5.6x 11.1x 10.5x
Mean 22.1% 16.3% 2.9x 2.4x 12.3x 10.3x 18.4x 15.9xMedian 20.3% 16.2% 2.8x 2.3x 13.4x 11.3x 18.8x 16.2x
5Sources: Capital IQ, 4 November 2011; Brokers’ reports.
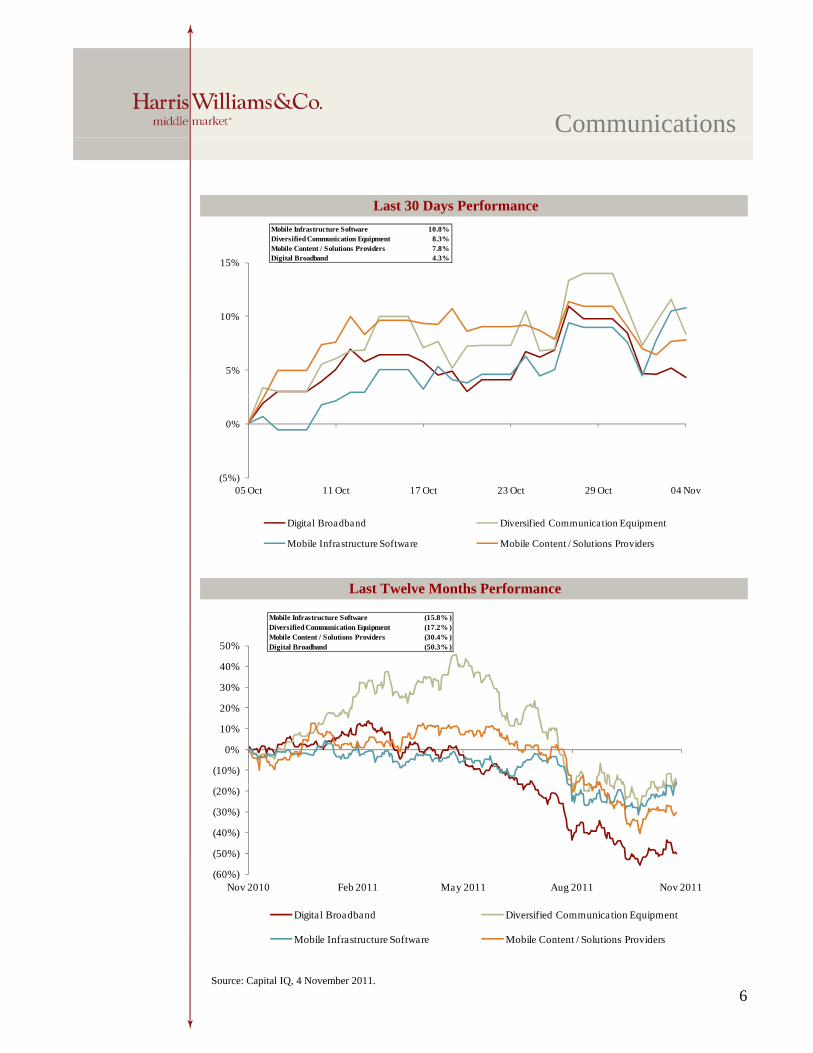
Communications
Last 30 Days PerformanceMobile Infrastructure Software 10.8%Diversified Communication Equipment 8.3%Mobile Content / Solutions Providers 7.8%Digital Broadband 4.3%15%
5%
10%
(5%)
0%
05 Oct 11 Oct 17 Oct 23 Oct 29 Oct 04 Nov
Digital Broadband Diversified Communication Equipment
50%
Last Twelve Months Performance
Mobile Infrastructure Software (15.8% )Diversified Communication Equipment (17.2% )Mobile Content / Solutions Providers (30.4% )Digital Broadband (50.3% )
Digital Broadband Diversified Communication Equipment
Mobile Infrastructure Software Mobile Content / Solutions Providers
(10%)
0%
10%
20%
30%
40%
(60%)
(50%)
(40%)
(30%)
(20%)
Nov 2010 Feb 2011 May 2011 Aug 2011 Nov 2011
Digital Broadband Diversified Communication EquipmentDigital Broadband Diversified Communication Equipment
Mobile Infrastructure Software Mobile Content / Solutions Providers
6Source: Capital IQ, 4 November 2011.

Communications(C ti d)(Continued)
Market Enterprise CY2011ECap ($m) Value ($m) EBITDA Margin Growth CY2011E CY2012E CY2011E CY2012E CY2011E CY2012E
Digital BroadbandLogitech 1,660 1,274 6.0% 2.6% 0.5x 0.5x 8.9x 5.9x 31.2x 13.8xTomTom 999 1,424 14.4% (12.3%) 0.8x 0.8x 5.6x 4.9x 14.0x 8.4xK d l ki 631 934 11 1% (14 2%) 0 9 0 9 8 3 6 6 27 0 12 2
P / EEV / EBITDAEV / Revenue
Kudelski 631 934 11.1% (14.2%) 0.9x 0.9x 8.3x 6.6x 27.0x 12.2xTechnicolor 357 1,680 13.6% 4.5% 0.4x 0.4x 2.6x 2.5x NA NAPace 311 604 9.0% 19.7% 0.2x 0.2x 2.7x 2.5x 3.2x 2.9xParrot 270 136 16.3% 9.2% 0.4x 0.4x 2.4x 2.4x 8.9x 8.3xAdvanced Digital Broadcast 74 70 6.6% 14.3% 0.2x 0.2x 2.6x 1.6x 16.4x 5.9x
Mean 11.0% 3.4% 0.5x 0.5x 4.7x 3.8x 16.8x 8.6xMedian 11.1% 4.5% 0.4x 0.4x 2.7x 2.5x 15.2x 8.3x
Diversified Communication EquipmentLM Ericsson Telephone 33,935 27,199 15.0% 16.4% 0.8x 0.8x 5.2x 5.0x 13.8x 12.2xNokia 24,522 19,885 5.5% (5.6%) 0.4x 0.4x 6.7x 6.1x 19.7x 21.3xAlcatel-Lucent 5,201 7,189 8.9% 4.9% 0.3x 0.3x 3.6x 3.5x 8.6x 8.3xADTRAN 2,122 2,014 28.8% 20.2% 2.8x 2.6x 9.8x 9.0x 15.6x 14.4xCIENA 1,325 2,281 6.1% 19.0% 1.3x 1.1x 21.2x 10.9x NM 15.3x
Mean 12.9% 11.0% 1.1x 1.0x 9.3x 6.9x 14.4x 14.3xMedian 8.9% 16.4% 0.8x 0.8x 6.7x 6.1x 14.7x 14.4x
Mobile Infrastructure SoftwareQUALCOMM 94,976 84,510 45.5% 40.3% 5.2x 4.4x 11.5x 11.0x 17.2x 15.3xAmdocs 5,467 4,333 20.5% 6.2% 1.3x 1.3x 6.6x 6.6x 13.3x 12.2xVeriSign 5,248 4,599 54.9% 4.2% 6.0x 5.3x 10.9x 9.5x 22.1x 17.8xComverse Technology 1,361 1,500 13.5% 5.3% 1.0x 0.9x 7.1x 6.8x 15.2x 10.8xSynchronoss Technologies 1,193 1,035 27.2% 37.0% 4.5x 3.8x 16.6x 13.3x 37.2x 29.5xSonus Networks 754 428 1.0% 9.2% 1.7x 1.6x NM NM NM NMTekelec 685 422 NA (4.4%) 1.1x 1.1x NA 7.4x 24.2x 23.4xTeleCommunication Systems 192 288 14.3% 6.9% 0.7x 0.6x 4.7x 4.6x 29.2x 25.8xOpenwave Systems 149 92 (0.8%) (4.6%) 0.6x 0.7x NM 22.8x NM NMRedknee Solutions 72 69 7.6% 21.1% 1.1x 1.0x 14.4x 7.6x NM 13.3xSmith Micro Software 44 NM (144.4%) (52.4%) NM NM NM NM NM NM
Mean 3.9% 6.3% 2.3x 2.1x 10.2x 9.9x 22.6x 18.5xMedian 13.9% 6.2% 1.2x 1.2x 10.9x 7.6x 22.1x 16.6x
Mobile Content / Solutions ProvidersOpera Software 541 460 24.8% 33.4% 2.9x 2.3x 11.8x 7.7x 22.3x 13.8xGameLoft 439 403 21.7% 18.8% 1.8x 1.6x 8.3x 7.1x 21.5x 17.4xBuongiorno 148 266 11.5% 30.4% 0.6x 0.5x 5.2x 4.2x 13.1x 8.1xBuongiorno 148 266 11.5% 30.4% 0.6x 0.5x 5.2x 4.2x 13.1x 8.1xDanal 101 78 17.7% 24.2% 0.7x 0.6x 3.9x 3.0x 15.0x 11.0xDada 51 84 11.5% (47.1%) 0.8x 0.7x 6.6x 6.1x 37.2x 28.5xSynchronica 20 22 (16.7%) 127.0% 0.9x 0.6x NM 2.2x 5.1x 1.7x
Mean 11.7% 31.1% 1.3x 1.1x 7.2x 5.1x 19.0x 13.4xMedian 14.6% 27.3% 0.8x 0.6x 6.6x 5.2x 18.2x 12.4x
7Sources: Capital IQ, 4 November 2011; Brokers’ reports.
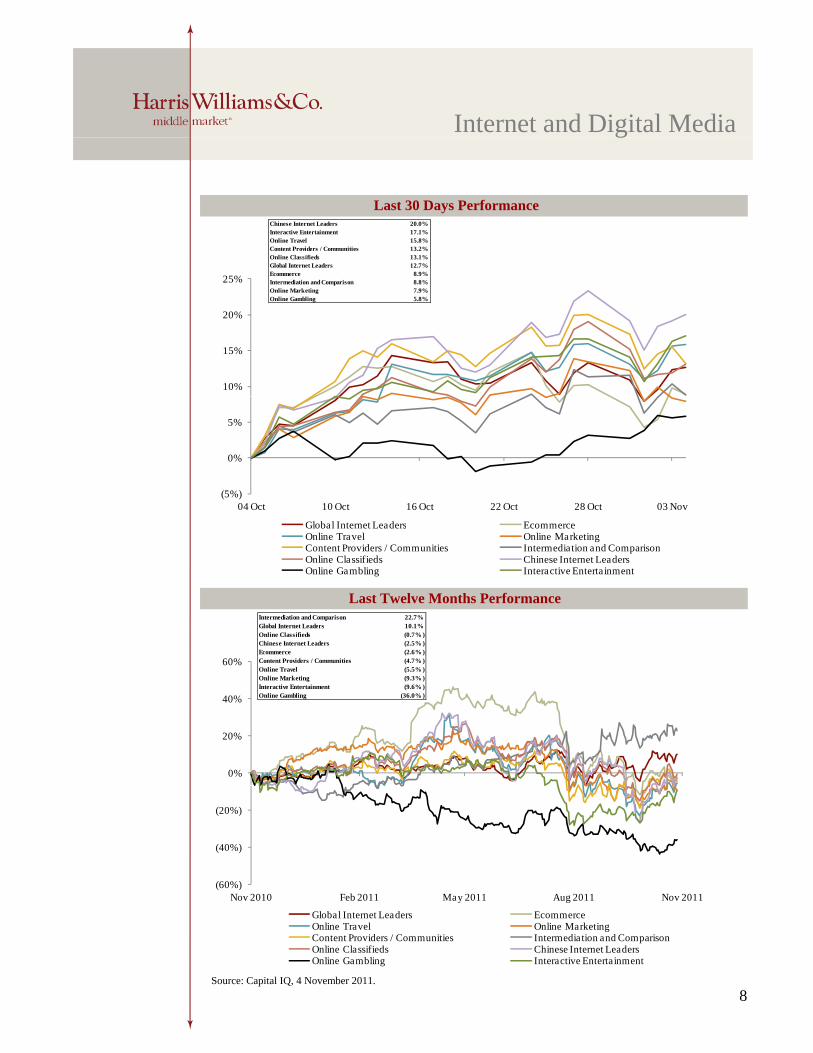
Internet and Digital Media
Last 30 Days Performance
g
Chinese Internet Leaders 20.0%Interactive Entertainment 17.1%Online Travel 15.8%Content Providers / Communities 13.2%Online Classifieds 13.1%Global Internet Leaders 12.7%
10%
15%
20%
25%Global Internet Leaders 12.7%Ecommerce 8.9%Intermediation and Comparison 8.8%Online Marketing 7.9%Online Gambling 5.8%
(5%)
0%
5%
04 Oct 10 Oct 16 Oct 22 Oct 28 Oct 03 Nov
Global Internet Leaders Ecommerce
Last Twelve Months Performance
Global Internet Leaders EcommerceOnline Travel Online MarketingContent Providers / Communities Intermediation and ComparisonOnline Classifieds Chinese Internet LeadersOnline Gambling Interactive Entertainment
Intermediation and Comparison 22.7%Global Internet Leaders 10.1%Online Classifieds (0.7% )Chinese Internet Leaders (2.5% )Ecommerce (2.6% )
0%
20%
40%
60% Content Providers / Communities (4.7% )Online Travel (5.5% )Online Marketing (9.3% )Interactive Entertainment (9.6% )Online Gambling (36.0% )
(60%)
(40%)
(20%)
Nov 2010 Feb 2011 May 2011 Aug 2011 Nov 2011
Global Internet Leaders EcommerceGlobal Internet Leaders EcommerceOnline Travel Online MarketingContent Providers / Communities Intermediation and ComparisonOnline Classifieds Chinese Internet LeadersOnline Gambling Interactive Entertainment
8Source: Capital IQ, 4 November 2011.

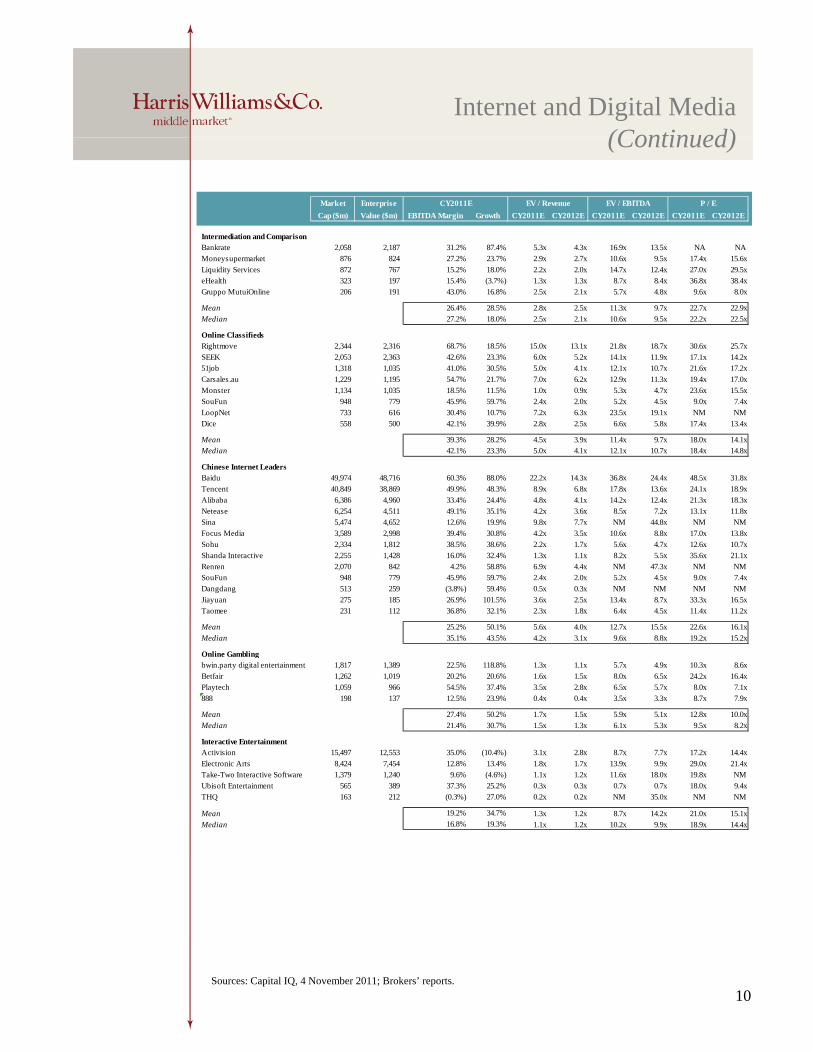
Internet and Digital Media(Continued)(Continued)
Market Enterprise CY2011ECap ($m) Value ($m) EBITDA Margin Growth CY2011E CY2012E CY2011E CY2012E CY2011E CY2012E
Global Internet LeadersApple 371,987 346,035 33.6% 61.6% 2.9x 2.4x 8.6x 7.1x 12.9x 11.2xMicrosoft 220,820 177,978 41.9% 9.7% 2.5x 2.3x 5.9x 5.4x 9.5x 9.0x
l
EV / EBITDA P / EEV / Revenue
Google 193,082 157,780 41.9% 32.1% 4.1x 3.4x 9.9x 8.1x 16.2x 13.7xAmazon 98,445 92,119 3.5% 42.8% 1.9x 1.4x NM 34.8x NM NMBaidu 49,974 48,716 60.3% 88.0% 22.2x 14.3x 36.8x 24.4x 48.5x 31.8xeBay 42,226 40,758 32.7% 26.7% 3.5x 3.0x 10.8x 9.2x 16.4x 14.1xYahoo! 19,242 17,307 32.7% (3.7%) 3.9x 3.8x 12.0x 11.3x 19.0x 17.9xYandex 9,222 8,789 43.9% 40.1% 12.8x 9.5x 29.2x 20.5x 48.8x 35.0x
Mean 36.3% 37.2% 6.7x 5.0x 16.2x 15.1x 24.5x 18.9xMedian 37.7% 36.1% 3.7x 3.2x 10.8x 10.3x 16.4x 14.1x
EcommerceAmazon 98,445 92,119 3.5% 42.8% 1.9x 1.4x NM 34.8x NM NMeBay 42,226 40,758 32.7% 26.7% 3.5x 3.0x 10.8x 9.2x 16.4x 14.1xMail.ru 6,887 6,748 48.8% 61.7% 13.8x 10.9x 28.3x 21.8x 40.6x 30.0xNetflix 4,726 4,595 14.5% 47.3% 1.4x 1.3x 10.0x 17.4x 21.4x NMMercadolibre 3,801 3,678 36.3% 39.2% 12.4x 9.5x 34.0x 25.5x 48.9x 37.5xIAC 3,578 2,923 17.6% 22.2% 1.5x 1.3x 8.3x 6.6x 20.7x 17.0xAsos 1,782 1,765 9.8% 56.7% 2.4x 1.7x 24.1x 17.1x 42.3x 29.7xShutterfly 1,449 1,380 19.5% 63.8% 2.9x 2.2x 14.7x 10.4x NM 40.0xVistaprint 1,380 1,219 16.7% 26.1% 1.3x 1.1x 8.0x 8.6x 16.9x 20.7xOpenTable 995 915 37.5% 40.9% 6.6x 5.4x 17.6x 13.3x 34.9x 28.3xYOOX 768 762 9.8% 37.0% 2.0x 1.5x 19.9x 14.4x NM 37.3xOcado 750 750 5.4% 23.2% 0.8x 0.6x 14.0x 9.2x NM NMDigital River 650 339 20.0% 7.8% 0.9x 0.8x 4.3x 3.7x 17.0x 14.3xBlue Nile 631 558 7.2% 8.5% 1.6x 1.4x 21.8x 19.6x 45.4x 39.9xBlue Nile 631 558 7.2% 8.5% 1.6x 1.4x 21.8x 19.6x 45.4x 39.9xOverstock 189 148 1.2% 1.1% 0.1x 0.1x 11.4x 5.9x NM NM
Mean 18.7% 33.7% 3.5x 2.8x 16.2x 14.5x 30.5x 28.1xMedian 16.7% 37.0% 1.9x 1.4x 14.3x 13.3x 28.2x 29.7x
Online TravelPriceline 25,550 24,244 33.4% 39.8% 5.6x 4.5x 16.8x 12.9x 22.9x 17.4xExpedia 7,633 7,413 25.8% 16.9% 1.9x 1.7x 7.4x 6.7x 14.4x 13.1xCtrip 5,102 4,514 39.5% 28.9% 8.2x 6.5x 20.7x 16.4x 24.3x 19.5xWotif 803 665 56.3% 4.2% 4.5x 4.1x 8.0x 7.4x 14.6x 13.2xTravelzoo 473 440 26.0% 34.8% 2.9x 2.4x 11.1x 8.5x 21.5x 17.2xOrbitz 309 641 16.3% 1.6% 0.8x 0.8x 5.1x 4.7x 32.8x 18.1xhotel de 95 84 8 9% 16 7% 1 4x 1 2x 16 2x 10 9x 34 6x 15 7xhotel.de 95 84 8.9% 16.7% 1.4x 1.2x 16.2x 10.9x 34.6x 15.7x
Mean 29.5% 20.4% 3.6x 3.0x 12.2x 9.6x 23.6x 16.3xMedian 26.0% 16.9% 2.9x 2.4x 11.1x 8.5x 22.9x 17.2x
Online MarketingHomeAway 2,757 2,585 28.5% 51.0% 11.2x 8.9x 39.3x 31.1x NM NMValueClick 1,354 1,400 30.8% 29.7% 2.5x 2.0x 8.2x 6.5x 15.4x 14.8xConstant Contact 664 536 16.5% 22.9% 2.5x 2.1x 15.2x 11.5x 33.1x 24.2xInfoSpace 328 48 14.5% (7.0%) 0.2x 0.2x 1.5x 1.6x 18.7x 22.3xLBI 302 304 16.8% 19.6% 1.1x 1.1x 6.8x 6.2x 8.8x 9.1xMarchex 282 247 15.6% 53.6% 1.7x 1.4x 10.7x 8.7x NM NMTradeDoubler 181 141 5.0% 5.9% 0.3x 0.3x 6.3x 6.1x 12.9x 12.0x1000 i 165 134 NA 24 9% 2 5 2 2 NA NA 11 0 9 71000mercis 165 134 NA 24.9% 2.5x 2.2x NA NA 11.0x 9.7xHi-Media 148 178 9.0% 11.8% 0.5x 0.5x 5.9x 5.1x 9.9x 8.1xSedo 96 66 6.3% 15.6% 0.4x 0.3x 6.0x 5.1x 15.8x 11.5xad pepper media 37 24 (3.0%) 19.9% 0.3x 0.3x NM 9.1x NM 27.9x
Mean 12.4% 19.7% 1.2x 1.0x 7.6x 6.7x 15.7x 15.5xMedian 14.5% 19.7% 0.8x 0.8x 6.5x 6.2x 14.2x 12.0x
Content Providers / CommunitiesLinkedIn 7,943 7,555 16.7% 113.2% 14.6x 9.7x NM NM NM NMPandora Media 2,454 2,359 2.0% 149.5% 17.1x 9.1x NM NM NM NMWebMD Health 1,845 1,543 32.8% 4.9% 2.8x 2.7x 8.4x 8.4x 27.8x 29.6xPerform Group 764 666 16.0% 55.5% 4.1x 3.2x 25.3x 13.0x 41.8x 22.8x
9Sources: Capital IQ, 4 November 2011; Brokers’ reports.
Demand Media 651 548 26.1% 27.0% 1.7x 1.4x 6.5x 4.7x 32.7x 21.9xMixi 504 385 26.8% (8.5%) 2.1x 1.7x 7.9x 6.7x 41.3x 19.2xXING 446 358 31.5% 27.1% 3.9x 3.4x 12.4x 10.2x 36.3x 25.3x
Internet and Digital Media(Continued)(Continued)
Market Enterprise CY2011ECap ($m) Value ($m) EBITDA Margin Growth CY2011E CY2012E CY2011E CY2012E CY2011E CY2012E
Intermediation and ComparisonBankrate 2,058 2,187 31.2% 87.4% 5.3x 4.3x 16.9x 13.5x NA NAMoneysupermarket 876 824 27.2% 23.7% 2.9x 2.7x 10.6x 9.5x 17.4x 15.6xLi idi S i 872 767 15 2% 18 0% 2 2 2 0 14 7 12 4 27 0 29 5
P / EEV / EBITDAEV / Revenue
Liquidity Services 872 767 15.2% 18.0% 2.2x 2.0x 14.7x 12.4x 27.0x 29.5xeHealth 323 197 15.4% (3.7%) 1.3x 1.3x 8.7x 8.4x 36.8x 38.4xGruppo MutuiOnline 206 191 43.0% 16.8% 2.5x 2.1x 5.7x 4.8x 9.6x 8.0x
Mean 26.4% 28.5% 2.8x 2.5x 11.3x 9.7x 22.7x 22.9xMedian 27.2% 18.0% 2.5x 2.1x 10.6x 9.5x 22.2x 22.5x
Online ClassifiedsRightmove 2,344 2,316 68.7% 18.5% 15.0x 13.1x 21.8x 18.7x 30.6x 25.7xSEEK 2,053 2,363 42.6% 23.3% 6.0x 5.2x 14.1x 11.9x 17.1x 14.2x51job 1,318 1,035 41.0% 30.5% 5.0x 4.1x 12.1x 10.7x 21.6x 17.2xCarsales.au 1,229 1,195 54.7% 21.7% 7.0x 6.2x 12.9x 11.3x 19.4x 17.0xMonster 1,134 1,035 18.5% 11.5% 1.0x 0.9x 5.3x 4.7x 23.6x 15.5xSouFun 948 779 45.9% 59.7% 2.4x 2.0x 5.2x 4.5x 9.0x 7.4xLoopNet 733 616 30.4% 10.7% 7.2x 6.3x 23.5x 19.1x NM NMDice 558 500 42.1% 39.9% 2.8x 2.5x 6.6x 5.8x 17.4x 13.4x
Mean 39.3% 28.2% 4.5x 3.9x 11.4x 9.7x 18.0x 14.1xMedian 42.1% 23.3% 5.0x 4.1x 12.1x 10.7x 18.4x 14.8x
Chinese Internet LeadersBaidu 49,974 48,716 60.3% 88.0% 22.2x 14.3x 36.8x 24.4x 48.5x 31.8xTencent 40,849 38,869 49.9% 48.3% 8.9x 6.8x 17.8x 13.6x 24.1x 18.9xAlibaba 6,386 4,960 33.4% 24.4% 4.8x 4.1x 14.2x 12.4x 21.3x 18.3xNetease 6,254 4,511 49.1% 35.1% 4.2x 3.6x 8.5x 7.2x 13.1x 11.8xSina 5,474 4,652 12.6% 19.9% 9.8x 7.7x NM 44.8x NM NMFocus Media 3,589 2,998 39.4% 30.8% 4.2x 3.5x 10.6x 8.8x 17.0x 13.8xSohu 2,334 1,812 38.5% 38.6% 2.2x 1.7x 5.6x 4.7x 12.6x 10.7xShanda Interactive 2,255 1,428 16.0% 32.4% 1.3x 1.1x 8.2x 5.5x 35.6x 21.1xRenren 2,070 842 4.2% 58.8% 6.9x 4.4x NM 47.3x NM NMSouFun 948 779 45.9% 59.7% 2.4x 2.0x 5.2x 4.5x 9.0x 7.4xDangdang 513 259 (3.8%) 59.4% 0.5x 0.3x NM NM NM NMJiayuan 275 185 26.9% 101.5% 3.6x 2.5x 13.4x 8.7x 33.3x 16.5xTaomee 231 112 36.8% 32.1% 2.3x 1.8x 6.4x 4.5x 11.4x 11.2x
Mean 25.2% 50.1% 5.6x 4.0x 12.7x 15.5x 22.6x 16.1xMedian 35.1% 43.5% 4.2x 3.1x 9.6x 8.8x 19.2x 15.2x
Online GamblingOnline Gamblingbwin.party digital entertainment 1,817 1,389 22.5% 118.8% 1.3x 1.1x 5.7x 4.9x 10.3x 8.6xBetfair 1,262 1,019 20.2% 20.6% 1.6x 1.5x 8.0x 6.5x 24.2x 16.4xPlaytech 1,059 966 54.5% 37.4% 3.5x 2.8x 6.5x 5.7x 8.0x 7.1x888 198 137 12.5% 23.9% 0.4x 0.4x 3.5x 3.3x 8.7x 7.9x
Mean 27.4% 50.2% 1.7x 1.5x 5.9x 5.1x 12.8x 10.0xMedian 21.4% 30.7% 1.5x 1.3x 6.1x 5.3x 9.5x 8.2x
Interactive EntertainmentActivision 15,497 12,553 35.0% (10.4%) 3.1x 2.8x 8.7x 7.7x 17.2x 14.4xElectronic Arts 8,424 7,454 12.8% 13.4% 1.8x 1.7x 13.9x 9.9x 29.0x 21.4xTake-Two Interactive Software 1,379 1,240 9.6% (4.6%) 1.1x 1.2x 11.6x 18.0x 19.8x NMUbisoft Entertainment 565 389 37 3% 25 2% 0 3x 0 3x 0 7x 0 7x 18 0x 9 4xUbisoft Entertainment 565 389 37.3% 25.2% 0.3x 0.3x 0.7x 0.7x 18.0x 9.4xTHQ 163 212 (0.3%) 27.0% 0.2x 0.2x NM 35.0x NM NM
Mean 19.2% 34.7% 1.3x 1.2x 8.7x 14.2x 21.0x 15.1xMedian 16.8% 19.3% 1.1x 1.2x 10.2x 9.9x 18.9x 14.4x
10Sources: Capital IQ, 4 November 2011; Brokers’ reports.
TTDM Group Overviewand Disclosuresand Disclosures
Our Technology, Telecom & Digital Media (TTDM) Group is dedicated to providing superior merger &acquisition and capital markets advisory services to market leading companies. Our extensive industryknowledge and transaction leadership experience spans the software, digital media, IT services andcommunications sectors. Our professionals in London, Boston and San Francisco have global
1001 Haxall Point9th FloorRichmond, VA 23219USAPh +1 (804) 648 0072
Thierry MonjauzeManaging Director63 Brook StreetLondon W1K 4HSUnited Kingdom
Jeff BistrongManaging DirectorTwo International Place, 24th FloorBoston, MA 02110USA
communications sectors. Our professionals in London, Boston and San Francisco have globalrelationships with leading technology companies and financial investors. Thoughtful advice, deepexperience and technology expertise, creativity and attention to detail from our senior technology bankershave resulted in a track record of consistently exceeding our clients' expectations.
Phone: +1 (804) 648-0072Fax: +1 (804) 648-0073
Two International Place24th FloorBoston, MA 02110USAPhone: +1 (617) 482-7501Fax: +1 (617) 482-7503
Michael Wilkins Managing Director575 Market Street, 31st FloorSan Francisco, CA 94105USA
This report has been prepared by Harris Williams & Co. Ltd and approved by Sturgeon Ventures LLP in accordance withConduct Of Business rules COBS 4 of the FSA Handbook. Harris Williams & Co. Ltd is an authorised representative ofSturgeon Ventures LLP which is Authorised and Regulated by the Financial Services Authority. This report is being made byHarris Williams & Co. Ltd.
Investment banking services are provided by Harris Williams LLC, a registered broker-dealer and member of FINRA andSIPC and Harris Williams & Co Ltd Harris Williams & Co is a trade name under which Harris Williams LLC and Harris
Phone: +44 20 7518 [email protected]
Phone: +1 (617) [email protected]
Fax: 1 (617) 482 7503
1900 East 9th Street20th FloorCleveland, OH 44114USAPhone: +1 (216) 689-2400Fax: +1 (216) 689-2401
Phone: +1 (415) [email protected]
SIPC, and Harris Williams & Co. Ltd. Harris Williams & Co. is a trade name under which Harris Williams LLC and HarrisWilliams & Co. Ltd conduct business in the U.S. and Europe, respectively.
Harris Williams & Co. (www.harriswilliams.com), a member of The PNC Financial Services Group, Inc. (NYSE:PNC), is thepremier middle market advisor with a two-decade legacy of sell side excellence serving clients worldwide. The firm is focusedexclusively on the middle market providing sell side and acquisition advisory, restructuring advisory, board advisory, privateplacements and capital markets advisory services.
THIS REPORT MAY CONTAIN REFERENCES TO REGISTERED TRADEMARKS, SERVICE MARKS ANDCOPYRIGHTS OWNED BY THIRD-PARTY INFORMATION PROVIDERS. NONE OF THE THIRD PARTYINFORMATION PROVIDERS IS ENDORSING THE OFFERING OF AND SHALL NOT IN ANY WAY BE DEEMED
63 Brook StLondon, W1K 4HSUnited KingdomPhone: +44 20 7518 8900Fax: +44 20 7526 2187
222 South Ninth Street INFORMATION PROVIDERS IS ENDORSING THE OFFERING OF, AND SHALL NOT IN ANY WAY BE DEEMEDAN ISSUER OR UNDERWRITER OF, THE SECURITIES, FINANCIAL INSTRUMENTS OR OTHERINVESTMENTS DISCUSSED IN THIS REPORT AND SHALL NOT HAVE ANY LIABILITY OR RESPONSIBILITYFOR ANY STATEMENTS MADE IN THE REPORT OR FOR ANY FINANCIAL STATEMENTS, FINANCIALPROJECTIONS OR OTHER FINANCIAL INFORMATION CONTAINED OR ATTACHED AS AN EXHIBIT TO THEREPORT. FOR MORE INFORMATION ABOUT THE MATERIALS PROVIDED BY SUCH THIRD PARTIES,PLEASE CONTACT US AT +44 20 7518 8900.
The information and views contained in this report were prepared by Harris Williams & Co. Ltd (“Harris Williams”). It isnot a research report, as such term is defined by applicable law and regulations, and is provided for informational purposesonly. It is not to be construed as an offer to buy or sell or a solicitation of an offer to buy or sell any financial instruments or
Suite 3350Minneapolis, MN 55402USAPhone: +1 (612) 359-2700Fax: +1 (612) 359-2701
1600 Market Street21st FloorPhil d l hi PA 19103 y ff y f ff y y f
to participate in any particular trading strategy. The information contained herein is believed by Harris Williams to bereliable but Harris Williams makes no representation as to the accuracy or completeness of such information.
Harris Williams and/or its affiliates may be market makers or specialists in, act as advisers or lenders to, have positions inand effect transactions in securities of companies mentioned herein and also may provide, may have provided, or may seek toprovide investment banking services for those companies. In addition, Harris Williams and/or its affiliates or their respectiveofficers, directors and employees may hold long or short positions in the securities, options thereon or other related financialproducts of companies discussed herein. Opinions, estimates and projections in this report constitute Harris Williams’judgment and are subject to change without notice. The financial instruments discussed in this report may not be suitable forall investors and investors must make their own investment decisions using their own independent advisors as they believe
Philadelphia, PA 19103USAPhone: +1 (267) 675-5900Fax: +1 (267) 675-5901
575 Market Street31st FloorSan Francisco, CA 94105USA g p y
necessary and based upon their specific financial situations and investment objectives. Also, past performance is notnecessarily indicative of future results. No part of this material may be copied or duplicated in any form or by any means, orredistributed, without Harris Williams’ prior written consent.
Copyright© 2011 Harris Williams & Co., all rights reserved.www.harriswilliams.com
USPhone: +1 (415) 288-4260Fax: +1 (415) 288-4269


![Cuyahoga County Clerk of Courts Merit Brief of Respondent ...Relator/Appellant Biswanath Halder ["Mr. Halder"] filed his "Complaint for Writ of Mandamus" ["Complaint"], being Eighth](https://img.pdfslide.us/doc/110x75/5f50722c6bf8a25c8f1488e6/cuyahoga-county-clerk-of-courts-merit-brief-of-respondent-relatorappellant.jpg)