Embed Size (px)
Citation preview

European Real Estate SocietyEuropean Real Estate SocietyStockholm 24Stockholm 24thth-27-27thth June 2009 June 2009
Are Tall Buildings and a City’s Skyline Are Tall Buildings and a City’s Skyline Emblematic of City Competitiveness?Emblematic of City Competitiveness?
Lesley Hemphill*, Stanley McGreal*, Ali Parsa* and Stephen Roulac#
*Built Environment Research Institute, University of Ulster# Roulac Global Places and University of Ulster

Background to the PaperBackground to the Paper
• Widespread tall building activity throughout world’s major cities
• Evidence that some cities are adopting a visual or ‘look at me’ strategy based on tall buildings
• Fierce competition between cities for world’s tallest building, hence there must be perceived benefits to title
• Investigation of linkage between a city’s skyline and city competitiveness
• Emerging tall building trends for regions and cities
• Potential to formally measure skyline and competitiveness relationship

Key Research QuestionsKey Research Questions
• Can the presence of tall buildings help promote city
competitiveness?
• Is there a global hierarchy of skyscraper cities?
• Will tall buildings become an increasingly important element
of a city’s competitiveness strategy?
• Can a tall building-led strategy help attract foreign
investment?
• Does the presence of tall buildings influence corporate
location choices?

Literature ReviewLiterature Review
• Key emerging literature themes –
• City imagery associated with tall buildings – ‘corporate skyline’; city identity; international brand recognition; big business symbols; symbols of capitalism; skyline & popular preference [Attoe, 1981; Catchpole, 1987; Domosh, 1988; Huxtable, 1992; Willis, 1995; Heath et al, 2000; Gair, 2002; Polisano, 2006]
• Iconic/signature buildings & star architects – McGuggenisation; benefits of iconic buildings; use of high profile architects; [McNeill, 2000, 2005; Vale & Warner, 2001; Charney, 2007; Sklair, 2006; Jencks, 2004, 2006; Sudjic, 2005]
• Increasing monumentality of skylines – race for the sky; protection of strategic views; groundscraper alternative to skyscraper; skyscraper opposition; cost effectiveness [Ford, 1994; Carmona & Freeman, 2007; Holleran, 1996; Weir, 2005; Frackler, 2007; Thornton, 2005]

Literature ReviewLiterature Review
• World city formation & inter-city competitiveness – competing forces; with or without tall bldgs; putting a city on the world map; corporate publicity [Young et al, 2006; Kim, 2008; Thurley, 2007; Gilligan, 2007; March, 2004; Ashworth, 2008]
• Contrasting world city measurement methodologies – world city hypothesis; triad of world cities; distinguished characteristics; command centres; connectivity; press coverage; data availability; power relations [Friedmann, 1986; Sassen, 1991, 1994; Beaverstock et al, 1999, 2000; Taylor, 1997; Taylor et al, 2002; Rosen, 2007]
• Multi-national corporation location choices – 9/11 impact; corporate image; globalisation benefits; [Johnson & Kasarda, 2003; Laing, 2003; Dermisi & Baen, 2005; Abadie & Dermisi, 2006; Millar et al, 2003; Cohen, 1981]

Key Data SourcesKey Data Sources
Emporis.com [High-rise Building Database – Skyline Ranking, World’s Tallest 200 Buildings and supporting population/area data]
Council for Tall Buildings and Urban Habitat [CTBUH official tallest 100 building database]
Chinese Academy of Social Sciences [Global Urban Competitiveness Index, 2008]
Beaverstock et al [A Roster of World Cities, Cities, Vol. 16, No. 6, p445-458, 1999].
PriceWaterhouseCoopers [UK Economic Outlook, March 2007 – GDP data]
CB Richard Ellis [Market Report on Office Occupancy Costs, May 2009]

Skyline Skyline Ranking – Ranking –
Emporis.comEmporis.comMay 2009May 2009
Skyline Rank City RegionUrban Competitiveness
RankUC Re-Rank
1 Hong Kong Asia 26 19
2 New York City North America 1 1
3 Singapore Asia 8 6
4 Chicago North America 10 8
5 Sao Paulo South America 201 54
6 Seoul Asia 12 10
7 Shanghai Asia 41 29
8 Tokyo Asia 3 3
9 Bangkok Asia 155 53
10 Guangzhou Asia 130 49
11 Dubai Middle East 39 28
12 Toronto North America 11 9
13 Chongqing Asia 292 77
14 Shenzhen Asia 64 37
15 Moscow Europe 30 21
16 Kuala Lumpur Asia 209 55
17 Beijing Asia 66 38
18 Rio de Janeiro South America 258 69
19 Jakarta Asia 248 66
20 Macao Asia 78 42
21 Miami North America 32 23
22 Buenos Aires South America 24 17
23 Osaka Asia 67 40
24 Sydney Australia 31 22
25 Recife South America 313 82
26 Wuhan Asia 277 73
27 Melbourne Australia 22 15
28 Mumbai Asia 114 48
29 Istanbul Europe 136 50
30 Houston North America 20 14
31 Honolulu North America 77 41
32 Vancouver North America 47 31
33 Curitiba South America 310 81
34 Panama City South America 264 70
35 London Europe 2 2
36 Gold Coast City Australia N/D N/D
37 Mexico City North America 74 39
38 Los Angeles North America 6 5
39 Caracas South America 305 80
40 Makati Asia N/D N/D
Urban Urban Competitiveness Competitiveness
Rank – CASSRank – CASSJune 2008June 2008

Figure 1: Regional Breakdown of Top 200 Tall Buildings93
59
29
9 10
63
64 59 58
54
299
286
279
264
256
0
10
20
30
40
50
60
70
80
90
100
Asia North America Middle East Australia Europe
Regions
230
240
250
260
270
280
290
300
310
No in Top 200
Ave Floors
Ave height m

Figure 2: Supertall Buildings by Region
39
47
3
11 12
62
23
1317
0
51
25
14
6
24
0
27
7
23
0
6
00
10
20
30
40
50
60
70
Asia North America Middle East Australia Europe South America
No
of
Bu
ildin
gs
Vision
Approved
Completed
Under construction


Corporate Location Choices within Alpha Cities
Quadrant 1 Region Prime ServicesDominant use of
Top 200Occupancy Cost US$
sq ft
Hong Kong Asia L, B Office 150.42
New York N America L, B, Ac, Ad Office 68.63
Chicago N America L, Ac, Ad Office 35.14
Singapore Asia L, B Office 82.79
Tokyo Asia L, B, Ac, Ad Office 183.62
London Europe L, B, Ac, Ad Office 172.62
Los Angeles N America L, Ac Office 52.83
Paris Europe L, B, Ac, Ad Office 114.89
Frankfurt Europe L, B, Ac, Ad Office 68.30

Conclusions Conclusions
• Asia dominates tall building construction – West to East shift
• Asia & Middle East world leaders in tall building height
• Emergence of Dubai, Shanghai, Guangzhou & Moscow on height spectrum
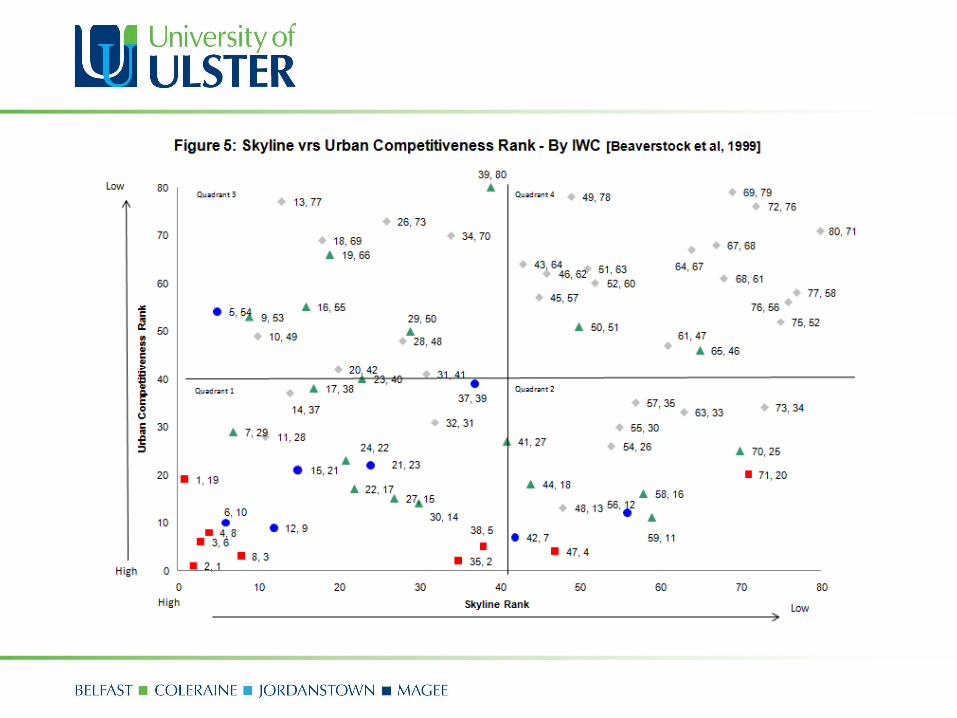
• Two tiers of skyscraper cities – established & emerging [‘wannabe cities’]
• ‘Wannabe cities’ adopt an aggressive visual based strategy
• Buildings under 30 floors have limited impact on city competitiveness
• Importance of reviewing skyline ranking to keep pace with competitors
• Positive correlations between skyline and city competitiveness as well as contributory factors
• Further research needed to determine height & number of tall buildings needed to make a major contribution to competitiveness.