Embed Size (px)
Citation preview
CIEP PAPER 2013 | 03
EUROPEAN POWER UTILITIES UNDER PRESSURE? HOW THE ELECTRICITY MAJORS ARE DEALING
WITH THE CHANGING INVESTMENT CLIMATE IN
THE EU POWER SECTOR
BY KOEN GROOT
CIEP is affiliated to the Netherlands Institute of International Relations ‘Clingendael’.
CIEP acts as an independent forum for governments, non-governmental organizations,
the private sector, media, politicians and all others interested in changes and
developments in the energy sector.
CIEP organizes lectures, seminars, conferences and roundtable discussions. In addition,
CIEP members of staff lecture in a variety of courses and training programmes. CIEP’s
research, training and activities focus on two themes:
• European energy market developments and policy-making;
• Geopolitics of energy policy-making and energy markets
CIEP is endorsed by the Dutch Ministry of Economic Affairs, the Dutch Ministry of Foreign
Affairs, the Dutch Ministry of Infrastructure and the Environment, BP Europe SE- BP
Nederland, Delta N.V., GDF-Suez Energie Nederland, GDF Suez E&P Nederland B.V.,
Eneco, EBN B.V., Essent N.V., Esso Nederland B.V., GasTerra B.V., N.V. Nederlandse Gasunie,
Heerema Marine Contractors Nederland B.V., ING Commercial Banking, Nederlandse
Aardolie Maatschappij B.V., N.V. NUON Energy, TenneT TSO B.V., Oranje-Nassau Energie
B.V., Havenbedrijf Rotterdam N.V., Shell Nederland N.V., TAQA Energy B.V.,Total E&P
Nederland B.V., Koninklijke Vopak N.V. and Wintershall Nederland B.V..
CIEP Energy Papers are published on the CIEP website: www.clingendaelenergy.com/
publications
TITLE
EUROPEAN POWER UTILITIES UNDER PRESSURE?
SUBTITLE
HOW THE ELECTRICITY MAJORS ARE DEALING WITH THE CHANGING
INVESTMENT CLIMATE IN THE EU POWER SECTOR
AUTHOR
Koen Groot
COPYRIGHT
@ 2013 Clingendael International Energy Programme (CIEP)
NUMBER
2013 | 03
DESIGN
Studio Maartje de Sonnaville
PUBLISHEDBY
Clingendael International Energy Programme (CIEP)
ADDRESS
Clingendael 7, 2597 VH The Hague, The Netherlands
P.O. Box 93080, 2509 AB The Hague, The Netherlands
TELEPHONE
+31 70 374 66 16
TELEFAX
+31 70 374 66 88
WEBSITE
www.clingendaelenergy.com
EUROPEANPOWERUTILITIESUNDERPRESSURE?
BY KOEN GROOT
7
TABLEOFCONTENTS
EXECUTIVESUMMARY
1 INTRODUCTION
2 ACHALLENGINGENVIRONMENT
2.1 A sector determined by external developments
2.2 Unforeseen effects of a changing fuel mix
2.3 A combination of pressures
3 THECONUNDRUMFOREUROPEANPOWERUTILITIES
3.1 Changes in the business environment of the European power majors
3.2 The outlook for the European power utilities
3.3 The impact on EU power majors’ activities
4 HOWTHEEUROPEANPOWERMAJORSARERESPONDING
TOTHECHALLENGES
4.1 Strategic adaptation and restructuring
4.2 Expanding horizons
5 CONCLUSION
9
11
15
15
20
24
29
29
32
39
43
43
46
55
9
EXECUTIVESUMMARY
The European power sector is challenged by a series of developments. These range
from planned changes to the institutional environment and the functioning of the
market, to unforeseen external shocks like the decline of demand as a result of the
economic and financial crisis and the German decision to completely phase out
nuclear energy after all. The challenges also include the unexpected results of
foreseeable developments, such as the impact of renewable energy sources (RES) on
business models terms of profit margins and system requirements.
Lower demand for electricity, energy efficiency measures and the rapid expansion of
RES has strained the power majors’ business models, whereas in many cases
operating margins are under pressure and the returns on investments are poor. It is
the confluence of circumstances, which has already been referred to as ‘a perfect
storm’ for power utilities in Europe that is creating stress among the existing power
majors.
A new context seems to emerge in which earlier premises of EU energy policies and
corresponding corporate strategies no longer hold. Companies in the EU power
sector are being forced to adapt to new circumstances and adjust their strategies in
order to move forward. The arrangements the power utilities are now taking are
characteristic for firms operating in an industry in distress. Shedding non-core
functions, becoming more agile and focused are typical strategies in that sense. At
the same time, we see the EU power majors making inroads, if not expanding their
footprints, in business activities outside of the EU power sector. Whenever possible,
firms seek to diversify their portfolio towards markets outside the EU power sector,
in order to become less dependent on a market in which the fundamentals are
characterised by declining demand due to energy efficiency, substitution and a
continued negative economic outlook.
In the process of long-term strategic restructuring, we observe some trends. While
the firms take on different approaches, we do see a differentiation along three lines:
(i) the increased presence over the energy value chain, investing in energy services,
upstream and other non-power generation activities; (ii) increased generation
activities in growth markets in the Americas, Asia and the Middle East; and (iii)
increased investments in (subsidised) RES projects within and outside the European
10 EUROPEAN POWER UTILITIES UNDER PRESSURE? ENERGY PAPER
market. In other words, the major EU power utilities choose to scale up traditional
activities by expanding geographically and realise that a change in the business
models is needed, thereby developing new activities.
Regarding their activities in the European power sector, the EU power majors will
continue operations as long as economically feasible, whereas, based on the current
market conditions, for new investments, the firms will only invest in capacity with
guaranteed incomes. For now, this seems to be limited to RES, in which continued
investment by the EU power majors is indeed expected.
How this will fit in the policies of the EU and Member States remains to be seen. A
critical success factor for the continued success of the major European power utilities
may be to better align the corporate and national interests.
11
1 INTRODUCTION
The nuclear disaster in Fukushima, Japan, the prolonged economic crisis in Europe
and the shale gas boom in the United States have all left their mark on the EU power
sector. These and other events in the sector’s external environment, as well as recent
changes within the power sector itself, have created challenging conditions and an
uncertain outlook for today’s major European power utilities1.
If the stream of messages currently being conveyed by representatives of the
European power majors is any indication, the situation in the EU power sector is
dire2. The profit margins of individual plants and entire generation portfolios are
under pressure, and as a result, firms are considering mothballing their generation
assets. Neither the current market conditions nor the prospects for the immediate
future seem to provide any relief. At the same time, the costs of transitioning
towards a sustainable energy economy are increasing for governments as well as for
consumers. In the case of governments, this has to do with much needed subsidy
schemes, while for consumers the increase is due to higher surcharges and tax rises.
The rocky situation in today’s electricity market in the EU confronts policymakers,
investors in generation capacity and consumers alike.
1 In the power sector of the European Union, seven firms stand out in size when it comes to installed capacity, electricity
production and revenues. These are E.On, EDF, Enel, GDF Suez, Iberdrola, RWE and Vattenfall. In this study we focus on
power generation activities, the operation of transmission and distribution systems are outside the scope of this study.
2 E.On CEO Teyssen at the EU Energy Roadmap 2050 stakeholder conference: ‘When you invest in new generation,
you can write it off the day you start’, stated while discussing the current climate and policy stance in the EU power
sector (European Energy Review, 29 February 2012, http://www.europeanenergyreview.eu/site/pagina.php?id=3522).
In addition, E.On has hinted at closing power plants. Coal and especially gas-fired power plants have been ‘largely
uneconomic[al] to operate’. CEO Teyssen said that under these conditions the firm ‘can’t continue operating conventional
plants in the hope something changes’. (Financial Times, 20 January 2012, 'E.On Eyes Closure of Gas-fired Power Plant',
http://www.ft.com/intl/cms/s/0/edf37798-6aec-11e2-9871-00144feab49a.html#axzz2K2PQpNvv). RWE considers firing
2400 employees as part of a million euro cost-cutting to counter declining returns; these come on top of the resignation
of 8000 employees, announced in 2011, related to the closure of nuclear plants (Financial Times, 14 August 2012,
'RWE Cost Cuts Threaten 2,400 Jobs', http://www.ft.com/intl/cms/s/0/8d8536f0-e5d4-11e1-a430-00144feab49a.
html#axzz2FJV9mRAY). GDF Suez Energie Nederland CEO Bos has alluded to the possibility of blackouts if market
conditions do not alter and investments in generation capacity that can function as a back-up to renewable generation
sources do not emerge (Financieel Dagblad, 3 October 2012, 'Extra Energieheffing Dreigt', http://fd.nl/economie-
politiek/848010-1210/extra-energieheffing-dreigt). Iberdrola warns on profit as demand falls (Financial Times, February
2012, http://www.ft.com/intl/cms/s/0/a333baf0-5e0f-11e1-b1e9-00144feabdc0.html#axzz2FJV9mRAY). 'Enel to Cut
Costs in Push to Reduce Debt' (Financial Times, 8 March 2012, http://www.ft.com/intl/cms/s/0/da510f6c-6902-11e1-
956a-00144feabdc0.html#axzz2FJV9mRAY).
12 EUROPEAN POWER UTILITIES UNDER PRESSURE? ENERGY PAPER
The power sector in Europe faces challenges that stem from a series of consecutive
developments. These range from planned changes to the institutional environment
and the functioning of the market, to unforeseen external shocks like the financial
crisis and the German decision to completely phase out nuclear energy
(Atomausstieg). Yet sources of distress also include the unexpected results of
foreseeable developments, such as the impact of renewable energy sources (RES) on
business models3 in terms of profit margins and system requirements.
The prolonged economic crisis has created a downturn in electricity demand on the
one hand, while endangering the attainability of renewable support schemes on the
other4. The current market dynamics have contributed to a situation of overcapacity
in the electricity market, a bane to the owners of conventional and especially gas-
fired power plants. This confluence of circumstances has already been referred to as
‘a perfect storm’ for power utilities in Europe5. Due to these developments, a new
context seems to have emerged in which earlier premises of EU energy policies and
corresponding corporate strategies no longer hold. Compelled by the challenging
conditions in the EU power sector, all major European power utilities appear to be in
a process of strategic re-orientation.
In this paper, we provide answers to two questions:
– What are the sources of the distress among power utilities in the Northwest
European market6? and
– How do the major EU power utilities respond?
In order to do so, we first focus on various aspects of EU energy policy and their
influences on the sector. We furthermore assess the impacts of the enduring
economic crisis and the unilaterally implemented nuclear phase-outs in various EU
Member States. Next, we examine changes on the supply side and address how
these changes influence the portfolios and thus the business models of industry
3 I.e. RES generally drive down the load factors of conventional generation sources.
4 In Spain and Italy, government-financed support schemes have been stopped. Due to budgetary constraints, the funding
for these programmes could no longer be realised. In Germany, the costs are passed on to households through electricity
bills, with increasing electricity costs as a result, which might turn out to be troublesome in times of economic recession
when customers’ budgets become stretched. See also Section 2.2.
5 The Wall Street Journal, 2012, 'Germany’s Utilities Caught in a Perfect Storm', http://online.wsj.com/article/SB10001424
127887324556304578116240833080594.html
6 While we focus on the Northwest market, the subject of this paper, the portfolios of the major power utilities active in
these markets also compel us to pay attention to adjacent markets. In our definition of the Northwest European market,
we follow earlier CIEP publications. Here the Northwest European market consists of the Benelux countries, France,
the UK, Germany, Denmark and Norway (Meulman et al., 2012, 'Harvesting Transition? Energy policy cooperation or
competition around the North Sea', CIEP).
13
participants. Most importantly we look at the impact of still relatively small shares of
RES on the system and at the downward pressure on European coal prices resulting
from the US switch from coal to gas during the shale gas boom.
After charting these developments, we assess how they together affect the activities
of the European power majors. Finally, we provide a picture of how the companies
are dealing with these changes and, moreover, the influence these changes are
exerting on the corporate strategies of the EU power majors.
15
2 ACHALLENGINGENVIRONMENT
2.1ASECTORDETERMINEDBYEXTERNALDEVELOPMENTS
The liberalisation of the EU power and gas markets began in the second half of the
1990s, when the EU introduced policies to remove obstacles between Member
States’ electricity and gas markets7. The liberalisation agenda aimed to create a
single European market for gas and electricity, in order to satisfy the competitiveness
objective of the EU energy policy by enabling the supply of relatively cheap energy8.
The implementation of the liberalisation agenda has led to several changes in the
structure of the EU power sector9. Unbundling, privatisation and the investment in
cross-border interconnection capacity have contributed to a sector characterised by
competition, non-public players and cross-border exchanges of gas and electricity on
a much larger scale.
This has provided the firms in the EU power sector with a stimulus to develop
international portfolios, leading to a phase of cross-border mergers and acquisitions
in Europe10. These strategies were propelled by the continuing growth of the internal
market and gained strength as the result of the EU enlargement strategy.
Anticipating the accession of Central and Eastern European states, the major power
utilities in Europe continued their foreign investments and acquisitions in these
states11. Firms employed holistic strategies12 for the European market, largely treating
it as a single market. Even as the full implementation of the internal electricity and
7 The EU went through three waves of legislation: the first set of directives (96/92/EC and 98/30/EC) in 1996 for electricity
and in 1998 for gas; the second package in 2004 (Directive 2003/54/EC for electricity and Directive 2003/55/EC for gas);
and most recently the Third Energy Package (Directive 2009/72/EC) adopted in 2009 and implemented in 2011.
8 Meulman et al, 2012, 'Harvesting Transition? Energy policy cooperation or competition around the North Sea', CIEP.
9 See for an in depth review the publication of IFRI (2010, 'The EU’s Major Electricity and Gas Utilities Since Market
Liberalization') and CIEP (2010, 'Energy Company Strategies in the Dynamic EU Energy Market, 1995-2007').
10 E.g. E.On’s acquisition of British Powergen (2001); RWE’s purchase of Innogy (2002); the acquisition of Electrabel by Suez
(2003); EDF’s taking of a substantial shareholding in Edison (2005); Enel’s purchase of Spanish Endesa (2007); Spanish
Iberdrola’s purchase of Scottish Power (2007); EDF’s acquisition of British Energy (2008); the purchase of Dutch Nuon by
Swedish Vattenfall (2009); and the acquisition of Dutch Essent by RWE (2009).
11 Several of the major power utilities in the EU have activities in Central and Eastern European countries (non-EU-member
and Member States). RWE is active in Poland, Czech Republic (directly and via NET4GAS), Hungary, Slovakia (through its
share in VSE since 2002) and Croatia; GDF Suez is active in Poland, Czech Republic, Lithuania, Hungary, Romania, Croatia
and Serbia; Enel is active in Slovakia (since 2006) and Romania, as well as in Moldova and Bulgaria through its subsidiary
Enel Green Power; E.On is active in Hungary, Czech Republic, Slovakia, Poland, Russia, Bulgaria, Romania and Russia; EDF
is active in Hungary, Poland and Slovakia (annual reports of respective firms).
12 E.g. GDF Suez in 2001 regarded the entire continent as its domestic market (GDF Suez, 2012, 'GDF Suez 150 Years in
World Markets: Shared Energy')
16 EUROPEAN POWER UTILITIES UNDER PRESSURE? ENERGY PAPER
gas market is still underway and doubts remain regarding the viability of the aim to
complete the internal market in 201413, the process is afoot and the results are
already significant.
In addition to the development of an internal market, EU energy policy also upholds
the sustainability objective. The market alone has so far been unable to enforce the
transition to a low-carbon system, making it necessary for policymakers to step in.
This has resulted in the integrated energy and climate change package, the 20-20-
20 policies, an effort shared by all Member States to strive for three targets14 to be
attained by 2020 with the corresponding policy tools, namely the Renewable Energy
Directive15, the Energy Efficiency Directive16 and the Emissions Trading Directive17.
These directives have brought about the implementation of policy measures by the
27 Member States at the national level.
In response to the energy and climate directives, the European power utilities
ventured into renewable energy projects all over Europe. This triggered a wave of
international investments by power utilities. Most often it has been domestic firms
that have dominated the (large-scale) subsidised investment projects throughout the
EU. In the deployment of RES capacity in the EU, we can observe some geographic
trends. Large-scale instalments of wind power generation capacity predominantly
have taken place in the UK, Spain, Portugal, Germany and Denmark, while solar
power generation capacity instalments have been highly concentrated in Spain, Italy
and Germany. These investments were mainly driven by national policy, but also by
the direct and indirect subsidies provided through the different National Renewable
Energy Action Plans18. Although some of the major power utilities had specific
strategies to develop renewable champions19, without the subsidies many of these
investments would not have been viable.
13 EU Commissioner Oettinger, 29 September 2012, DG Energy Internal Market Conference, http://europa.eu/rapid/press-
release_SPEECH-11-614_en.htm
14 A 20% reduction in EU greenhouse gas emissions from 1990 levels, raising the share of EU energy consumption produced
from renewable resources to 20%, and a 20% improvement in the EU's energy efficiency. http://ec.europa.eu/clima/
policies/package/index_en.htm
15 Directive 2009/28/EC on the promotion of the use of energy from renewable sources, http://eur-lex.europa.eu/LexUriServ/
LexUriServ.do?uri=Oj:L:2009:140:0016:0062:en:PDF
16 Directive 2012/27/EU on energy efficiency amending Directives 2009/125/EC (on Ecodesign) and 2010/30/EU (Energy
labelling) and repealing Directives 2004/8/EC (on Cogeneration) and 2006/32/EC (on Energy Efficiency).
17 Directive 2003/87/ establishing a scheme for greenhouse gas emission allowance trading within the Community and
amending Council Directive 96/61/EC (on Internal Pollution Prevention and Control)
18 National Renewable Energy Action Plans
19 Iberdrola Renovables, DONG, EDF Energies Nouvelles, Enel Green Power, RWE Innogy
17
Apart from stimulating specific investments, the 20-20-20 policies have hindered the
completion of the internal market by creating discord among the Member States’
policies. The policy aim to produce twenty percent of energy through renewable
energy technologies by 2020, guided by EU RES directive20, has resulted in a myriad
of nationally devised support mechanisms21. These support programmes take the
form of market interventions aimed at providing a stimulus for the deployment of
renewable generation technologies on a large scale. The lack of alignment between
the various national policies, as well as the perceived lack of coherency and
consistency with there being 27 different support schemes, potentially creates policy
competition and investor uncertainty, the latter due to the fact that it constrains the
ability of firms to create strategies that incorporate multiple Member States.
EXTERNAL SHOCKS
Interventions in the market, however, are not all related to EU energy policy. For
example, the meltdown of reactors in the Fukushima Daiichi Nuclear Power Plant in
2011 were what brought about anti-nuclear marches in Germany. In an unexpected
turn of events, these protests resulted in the redefinition of the German policy to
transition to entirely renewable energy sources, or the Energiewende. The German
government decided that all nuclear power generation in Germany was to stop by
January 202322. Since that announcement, other EU Member States have followed
suit by adapting their own policies toward limiting or outright abolishing nuclear
power production in the near future. The Belgian government has decided to phase
out nuclear power production completely by September 202523, and in Switzerland
the last nuclear power generator will go offline by 203424. In France, there is an
ongoing discussion about reducing the share of nuclear energy in the power mix
from 75% to 50%25. Because of the phase-out in Germany, power utilities that
operate nuclear generation plants there already had to shut down eight plants in
20 Directive 2009/28/EC on the promotion of the use of energy from renewable sources, http://eur-lex.europa.eu/LexUriServ/
LexUriServ.do?uri=Oj:L:2009:140:0016:0062:en:PDF
21 ‘In addition to the different sectorial prices, there are at least 28 prices for carbon, namely one in the ETS and at least one
per member state for non-ETS emissions’ (European Investment Bank and Bruegel, 2012, Investment and Growth in the
Time of Climate Change, p. 189).
22 This Atomausstieg was written into law on the first of August 2011 (http://www.gesetze-im-internet.de/bundesrect/
atg/gesamt.pdf).
23 FPS Economy, 2012, 'The Phasing-out of Nuclear Power', http://economie.fgov.be/en/consumers/Energy/Nuclear_energy/
Nuclear_power_plants/The_phasing-out_of_nuclear_power/.
24 Swiss Broadcasting Corporation, 25 May 2011, 'Swiss to Phase Out Nuclear Power by 2034', http://www.swissinfo.ch/
eng/politics/internal_affairs/Swiss_to_phase_out_nuclear_power_by_2034.html?cid=30315730.
25 Reuters. 14 November 2012, 'Nuclear Power Champions Japan and France Turn Away', http://www.reuters.nl/
article/2012/09/14/us-energy-nuclear-idUSBRE88D1DR20120914; France 24; France 24, 17 September 2012, 'President
Hollande Promises to Revamp Energy Sector', http://www.france24.com/en/20120914-hollande-promises-to-revamp-
energy-sector.
18 EUROPEAN POWER UTILITIES UNDER PRESSURE? ENERGY PAPER
2011, the others needing to plan their closures by 2023 at the latest. The earlier
than planned shutdown26 of nuclear assets in the portfolios of the major European
power utilities operating in Germany forced the firms to adopt major write-offs on
assets and goodwill impairments27. This has forced mainly E.On and RWE to sell
assets in order to reduce debt and make up for lost earnings. Ambivalently, some
perceived the Atomausstieg as an opportunity to internationally commercialise the
lessons learned from the laboratory the German power sector had become28.
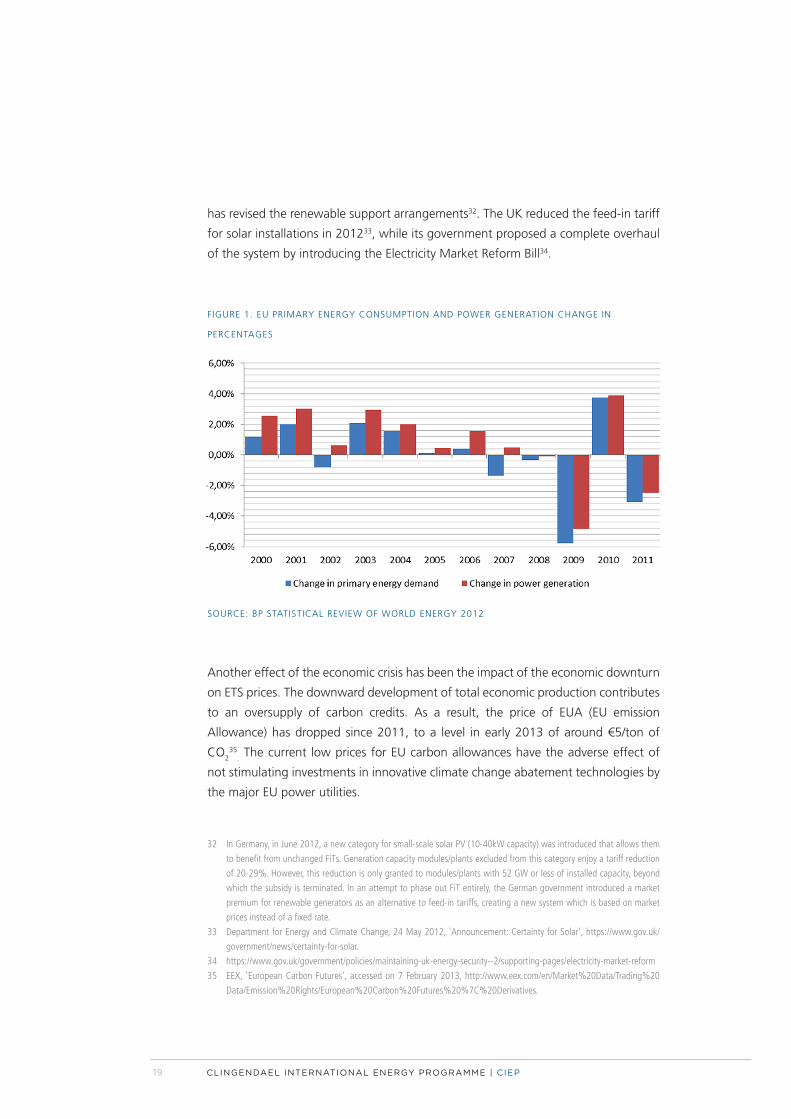
A second external shock was the economic crisis, starting with the financial crisis in
2008 and continuing to date in Europe, where the burden has shifted to sovereign
debt and the euro system. The current economic climate has resulted in lower
primary energy demand in the EU (see Figure 1: EU primary energy consumption and
power generation). Concordantly, electricity demand both from industrial consumers
and from households has declined29.
Besides affecting EU electricity market fundamentals, the euro crisis has also forced
governments to tighten their budgets. Given that the majority of renewable energy
projects were backed by government subsidies, the impact of austerity in the power
sector has been substantial. The governments of Spain30 and Italy31 have cancelled
the majority of incentives and subsidisation schemes. In Germany, the government
26 In 2001 the Germany government targeted an exit out of nuclear energy by 2022. In September 2010 the law establishing
the 2022 phase-out was reversed, in effect extending the lifetime of nuclear power plants by an average of 12 years
(Meulman et al., 2012, 'Harvesting Transition? Energy policy cooperation or competition around the North Sea', CIEP).
27 EY, 2012, Utilities Unbundled, Issue 12: 'Europe’s Utilities Take Multi-Billion Asset Impairment Hit', http://www.ey.com/
GL/en/Industries/Power---Utilities/Utilities-Unbundled---4---Europes-utilities-take-multi-billion-euro-asset-impairment-
hit.
28 Bloomberg, 27 June 2011, 'E.ON’s Teyssen Sees Opportunity in German Energy Shift, FT Says', http://www.bloomberg.
com/news/2011-06-27/e-on-s-teyssen-sees-opportunity-in-german-energy-shift-ft-says.html.
29 In Germany industrial sales are down noticeably, while Spanish industrial demand has fallen 7% and electricity volumes
sold in Italy have declined by 10% year on year. (The Wall Street Journal, 14 November 2012, 'Germany’s Utilities Caught
in a Perfect Storm', http://online.wsj.com/article/SB10001424127887324556304578116240833080594.html) In the
Netherlands year-on-year electricity consumption has declined by nearly 3% (Tennet, 2013, 'Energieverbruik in December
Gedaald', http://www.tennet.org/tennet/nieuws/energieverbruik-in-december-2012-gedaald.aspx_.
30 The Italian government announced per decree the replacement of the green certificate support for large-scale wind with
reversed auctions; and in the fifth Conto Energia it announced a 39-43% cut in the FiT, starting in August 2012.
31 In January 2012 Spain introduced a reform in its renewable subsidy policy, annulling the feed-in-tariff for renewable
energy. This reform withstood various juridical claims on a breach by the government of the principle of legal certainty. (El
Pais, 21 August 2012, 'Montoro Desautoria la Reforma Energética que Plantea Soria'). Amidst the government deficits,
Spain also had to deal with a tariff deficit, meaning that full system costs supersede the income generated by the system,
which has been attributed to regulated end-user prices and renewable subsidies (HSBC, 2011, 'European Utilities', p. 35).
19
has revised the renewable support arrangements32. The UK reduced the feed-in tariff
for solar installations in 201233, while its government proposed a complete overhaul
of the system by introducing the Electricity Market Reform Bill34.
FIGURE 1. EU PRIMARY ENERGY CONSUMPTION AND POWER GENERATION CHANGE IN
PERCENTAGES
SOURCE: BP STATISTICAL REVIEW OF WORLD ENERGY 2012
Another effect of the economic crisis has been the impact of the economic downturn
on ETS prices. The downward development of total economic production contributes
to an oversupply of carbon credits. As a result, the price of EUA (EU emission
Allowance) has dropped since 2011, to a level in early 2013 of around €5/ton of
CO235
. The current low prices for EU carbon allowances have the adverse effect of
not stimulating investments in innovative climate change abatement technologies by
the major EU power utilities.
32 In Germany, in June 2012, a new category for small-scale solar PV (10-40kW capacity) was introduced that allows them
to benefit from unchanged FiTs. Generation capacity modules/plants excluded from this category enjoy a tariff reduction
of 20-29%. However, this reduction is only granted to modules/plants with 52 GW or less of installed capacity, beyond
which the subsidy is terminated. In an attempt to phase out FiT entirely, the German government introduced a market
premium for renewable generators as an alternative to feed-in tariffs, creating a new system which is based on market
prices instead of a fixed rate.
33 Department for Energy and Climate Change, 24 May 2012, 'Announcement: Certainty for Solar', https://www.gov.uk/
government/news/certainty-for-solar.
34 https://www.gov.uk/government/policies/maintaining-uk-energy-security--2/supporting-pages/electricity-market-reform
35 EEX, 'European Carbon Futures', accessed on 7 February 2013, http://www.eex.com/en/Market%20Data/Trading%20
Data/Emission%20Rights/European%20Carbon%20Futures%20%7C%20Derivatives.
20 EUROPEAN POWER UTILITIES UNDER PRESSURE? ENERGY PAPER
The economic crisis has also had a direct effect on several of the major European
power utilities. Downgrades in sovereign bond credit ratings is seeping through in
the valuation of firms because of the public holdings in many of these EU power
majors36. In the past three years the credit ratings of several Irish, Greek, Italian and
Spanish power utilities have been downgraded37. This is likely to complicate the
refinancing of on-going operations and the financing of new investments by these
firms. These downgrades are best understood in the context of the already grim
outlook within the European power generation sector, where demand is expected to
continue to decline because of the pressure on operating and profit margins, which
is not expected to lift anytime soon. The impoverished economic outlook and the
impact of this on sales has also hurt the credit ratings of RWE and E.On, which were
downgraded in 201238.
A third external shock for producers in the EU power market is the effect of the US
revolution in shale gas production39 on coal prices in Europe. In the US the low prices
for natural gas – the result of a dramatic increase in domestic gas production – has
resulted in a feedstock switch among US power utilities, with an increase of 23.6%
in gas fired-power generation in 2012, predominantly at the cost of coal fired-power
generation40. Coal from the US has found its way to world markets through exports,
which increased by 22.8% from 2011 to 201241. As a result, the European price for
coal has declined42.
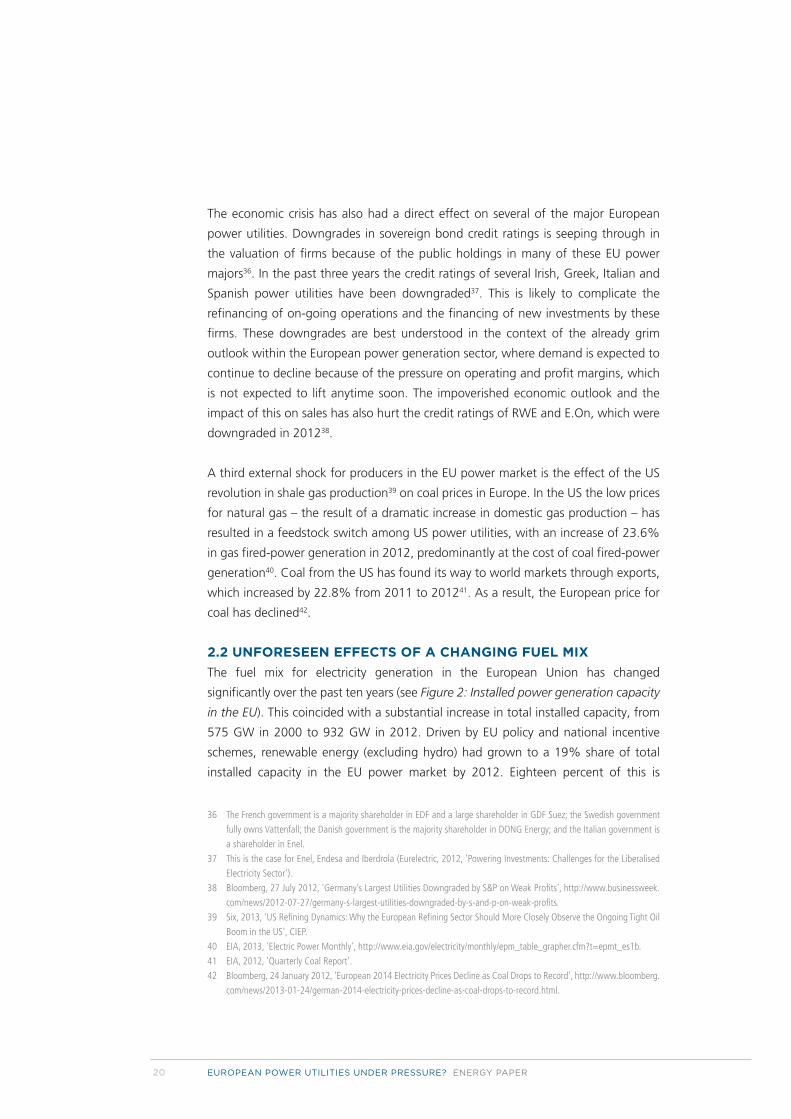
2.2UNFORESEENEFFECTSOFACHANGINGFUELMIX
The fuel mix for electricity generation in the European Union has changed
significantly over the past ten years (see Figure 2: Installed power generation capacity
in the EU). This coincided with a substantial increase in total installed capacity, from
575 GW in 2000 to 932 GW in 2012. Driven by EU policy and national incentive
schemes, renewable energy (excluding hydro) had grown to a 19% share of total
installed capacity in the EU power market by 2012. Eighteen percent of this is
36 The French government is a majority shareholder in EDF and a large shareholder in GDF Suez; the Swedish government
fully owns Vattenfall; the Danish government is the majority shareholder in DONG Energy; and the Italian government is
a shareholder in Enel.
37 This is the case for Enel, Endesa and Iberdrola (Eurelectric, 2012, 'Powering Investments: Challenges for the Liberalised
Electricity Sector').
38 Bloomberg, 27 July 2012, 'Germany’s Largest Utilities Downgraded by S&P on Weak Profits', http://www.businessweek.
com/news/2012-07-27/germany-s-largest-utilities-downgraded-by-s-and-p-on-weak-profits.
39 Six, 2013, 'US Refining Dynamics: Why the European Refining Sector Should More Closely Observe the Ongoing Tight Oil
Boom in the US', CIEP.
40 EIA, 2013, 'Electric Power Monthly', http://www.eia.gov/electricity/monthly/epm_table_grapher.cfm?t=epmt_es1b.
41 EIA, 2012, 'Quarterly Coal Report'.
42 Bloomberg, 24 January 2012, 'European 2014 Electricity Prices Decline as Coal Drops to Record', http://www.bloomberg.
com/news/2013-01-24/german-2014-electricity-prices-decline-as-coal-drops-to-record.html.
21
intermittent wind and solar power generation capacity, which has a significant
impact on the market, given the zero marginal costs of these energy sources and the
political priority43 allotted to them in the merit order. Online RES drive down
wholesale prices44 and lower the generation time of conventional generation
sources. Under the current market conditions, especially gas-fired power plants are
suffering, as their uptime is limited and their generation spreads have weakened. For
investors in gas fired-generation capacity, who had expected gas to have a prominent
place in the fuel mix (because of its CO2 properties and its flexibility), this is an
unwelcome turn of events. Their investments had created the vast increase in gas-
fired generation capacity, the other prominent feature in the development of
installed capacity over the past decade.
FIGURE 2. INSTALLED POWER GENERATION CAPACITY IN THE EU (IN MW), COMPARISON BETWEEN
2000 AND 2012
SOURCE: EWEA (2012)
The unforeseen effects of RES in the EU power market predominantly relate to their
rapid and concentrated deployment on a large scale and to their subsequently
significant impact on the system. Propelled by policymakers, wind- and solar-
powered generation capacity grew from 13 GW in 2000 to 177 GW in 2012 and
continues to increase. Compared to conventional sources, wind and solar power
account for a relatively small share. Wind and solar made up only 18% of total EU
installed electricity generation capacity in 2012, yet the effect of this rapid emergence
is considerable.
43 E.g. in Germany and the Netherlands in relation to congestion and/or preferred dispatching.
44 Méray, 2012, 'Wind and Gas: Back Up or Back Out, That’s the Question', CIEP.
22 EUROPEAN POWER UTILITIES UNDER PRESSURE? ENERGY PAPER
In the Northwest European power market45, the increased share of power generated
by renewable energy sources (RES) contributes to a situation of overcapacity. Under
normal market conditions, overcapacity leads to a stop in the creation of new
capacity. The increase in RES capacity, however, is not based on market signals but is
made possible by RES support schemes. In some countries, these support schemes
have been cancelled as the result of austerity measures. Yet in other countries the
schemes are still intact, most often in those countries where subsidies are financed
through (renewable) energy charges to households46. In 2011 solar energy
contributed 41.5 TWh to the European power sector (as compared to 7.4 TWh in
2008)47; this equalled 1.3% of total EU power production48. Given that the EU is on
its way to become a single market through interconnections and market coupling,
the impact of price changes resulting from national fuel mix characteristics is
exported to surrounding countries49.
On days when the conditions for wind or solar generation are favourable, in some
markets up to 50% of power generated can be produced by renewable energy
sources. In February 2013, the German installed solar generation capacity equalled
32.88 GW50, approximately equal to that of 30 large nuclear reactors51. During some
sunny days in May 2012, solar power contributed 22 GW to the German market, or
approximately half of total demand52. When generated, this power comes online
simultaneously with the other, more steady, energy streams, and with priority,
causing large load jumps. This forces other generators to switch off. This not only
occurs in the country of origin, but also affects (connected) neighbouring countries.
45 See Section 1: Introduction.
46 For example in Germany
47 ACER/CEER, 2012, 'Annual Report on the Results of Monitoring the Internal Electricity and Natural Gas Markets'.
48 Total 2011 generation equalled 3116.94 TWh. http://epp.eurostat.ec.europa.eu/statistics_explained/images/f/f6/
Electricity_Statistics%2C_2011_%28in_GWh%29.png
49 Although as of late, power prices in the Northwest European electricity markets have been diverging rather than
converging. This is attributed to the fragmentation in national energy policies (European Energy Review, 7 February 2013,
'European Power Markets are Being Split Apart by Political Fickleness', http://www.europeanenergyreview.eu/site/pagina.
php?id=4049).
50 Bundesnetzagentur, 'Monatliche Veröffentlichung der PV-Meldezahlen', http://www.bundesnetzagentur.
de/cln_1911/DE/Sachgebiete/ElektrizitaetGas/ErneuerbareEnergienGesetz/VerguetungssaetzePVAnlagen/
VerguetungssaetzePhotovoltaik_Basepage.html?nn=135464.
51 The Wall Street Journal, 14 November 2012, 'Germany’s Utilities Caught in a Perfect Storm', http://online.wsj.com/article/
SB10001424127887324556304578116240833080594.html.
52 Reuters, 2012, 'Germany Sets New Solar Power Record', http://www.reuters.com/article/2012/05/26/us-climate-
germany-solar-idUSBRE84P0FI20120526.
23
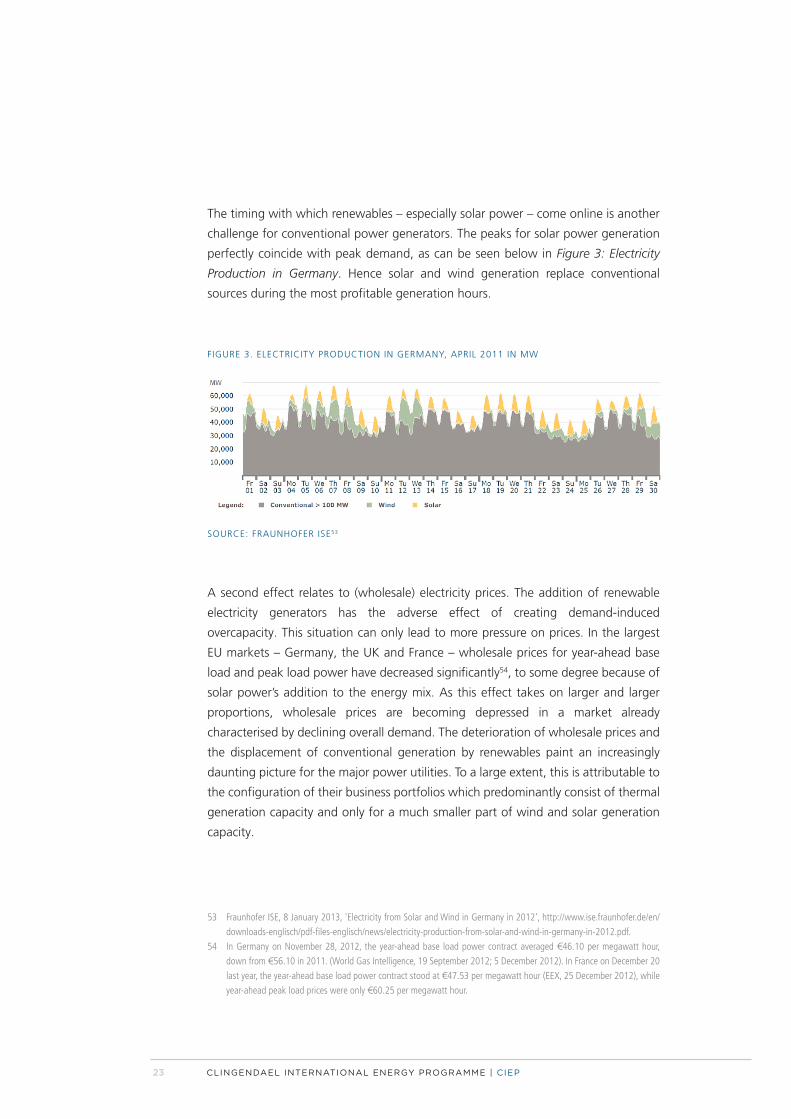
The timing with which renewables – especially solar power – come online is another
challenge for conventional power generators. The peaks for solar power generation
perfectly coincide with peak demand, as can be seen below in Figure 3: Electricity
Production in Germany. Hence solar and wind generation replace conventional
sources during the most profitable generation hours.
FIGURE 3. ELECTRICITY PRODUCTION IN GERMANY, APRIL 2011 IN MW
SOURCE: FRAUNHOFER ISE53
A second effect relates to (wholesale) electricity prices. The addition of renewable
electricity generators has the adverse effect of creating demand-induced
overcapacity. This situation can only lead to more pressure on prices. In the largest
EU markets – Germany, the UK and France – wholesale prices for year-ahead base
load and peak load power have decreased significantly54, to some degree because of
solar power’s addition to the energy mix. As this effect takes on larger and larger
proportions, wholesale prices are becoming depressed in a market already
characterised by declining overall demand. The deterioration of wholesale prices and
the displacement of conventional generation by renewables paint an increasingly
daunting picture for the major power utilities. To a large extent, this is attributable to
the configuration of their business portfolios which predominantly consist of thermal
generation capacity and only for a much smaller part of wind and solar generation
capacity.
53 Fraunhofer ISE, 8 January 2013, 'Electricity from Solar and Wind in Germany in 2012', http://www.ise.fraunhofer.de/en/
downloads-englisch/pdf-files-englisch/news/electricity-production-from-solar-and-wind-in-germany-in-2012.pdf.
54 In Germany on November 28, 2012, the year-ahead base load power contract averaged €46.10 per megawatt hour,
down from €56.10 in 2011. (World Gas Intelligence, 19 September 2012; 5 December 2012). In France on December 20
last year, the year-ahead base load power contract stood at €47.53 per megawatt hour (EEX, 25 December 2012), while
year-ahead peak load prices were only €60.25 per megawatt hour.
24 EUROPEAN POWER UTILITIES UNDER PRESSURE? ENERGY PAPER
In addition to this, the success of RES support schemes leads to another painful
problem, namely that the support schemes are becoming unaffordable. The
associated costs directly affect already austere government budgets and contribute
to rising consumer costs55. Connecting the newly added RES capacity to the grid is
one aspect of the spiralling cost increases. Another is that the perceived lack of
(international) co-ordination between investments in infrastructure and generation
capacity remains unresolved. These rising costs in a time of crisis have forced several
countries to redraft their renewable energy support schemes, adding to the
uncertainties.
2.3ACOMBINATIONOFPRESSURES
Dwindling demand for power in the EU has contributed to lower power prices.
While the circumstances differ per country, this situation of overcapacity is unlikely
to change in the near future, given the continued installation of RES production and
the significant size of gas and coal56 generation capacity (respectively 18.5GW and
10 GW) under construction in the EU. Nevertheless, the sector awaits some relief
starting in 2015, when both the EU Large Combustion Plants Directive57 and the EU
Industrial Emissions Directive58 will force a significant outtake of generation capacity.
The impact of these outtakes will differ among Member States, depending on the
number and capacity of old plants still in operation. In the UK some 12 GW of power
generation capacity is expected to be dismantled on behalf of these EU directives59,
or approximately 13% of total installed generation capacity60. In the UK market, this
could imply a return to higher wholesale power prices and resulting higher margins
after 2015. More conventional generation capacity is, however, still underway. For
example, in the German market more new plants will be completed than old plants
55 In Germany, consumers are to face a 47% hike in the contribution to renewables subsidy, which is part of their electricity
bill; following an increase of 72% in 2010; the gross national surcharge is expected to be around 20.4 billion EUR in
2013, compared to 8.3 billion EUR in 2010. The reason for this is the vast expansion of RES generators in Germany – 5/7
GW annually – and the heavily subsidised industrial power rates with households footing the bill. (Petroleum Intelligence
Weekly, 24 October 2013).
56 Approximately 10 GW of coal-fired generation capacity is under construction in the Netherlands, Germany, Romania and
Greece. Approximately 18.5 GW of gas-fired power generation capacity is under construction in the UK, the Netherlands,
Italy, Greece, Germany, Cyprus and Belgium. (World Gas Intelligence, 23 January 2013, 'Brussels Aims for Hands-on
Revival of European CCS').
57 Directive 2001/80/EC on the limitation of certain pollutants into the air from large combustion plants, http://eur-lex.
europa.eu/LexUriServ/LexUriServ.do?uri=OJ:L:2001:309:0001:0001:EN:PDF.
58 Directive 2010/75/EU on industrial emissions (integrated pollution prevention and control), http://eur-lex.europa.eu/
LexUriServ/LexUriServ.do?uri=OJ:L:2010:334:0017:0119:en:PDF.
59 Credit Suisse, 2012, UK Power Generators.
60 In 2011 the total generation of the UK was approximately 94 GW.
25
retired61. Combined with the continued deployment of RES capacity, this will result
in even less dispatch time for conventional generation sources, plus lower prices
during dispatch.
All of the major EU power utilities have significant shares of conventional thermal
generation capacity, which makes them even more susceptible to depressed
generation margins. The owners of gas-fired power plants suffer more than the
owners of coal-fired generation because of the higher cost of generation feedstock.
The reduced demand for power is one of the drivers for the reduction in gas-fired
power generation, whereas sources with lower marginal costs outperform gas-fired
generation capacity with its (relatively) high marginal costs: the so-called merit order
effect62.
The other aspect behind the dwindling demand for conventional power is that
during uptimes, renewable energy sources push out conventional power sources.
The current feedstock prices provide coal fired-generators with favourable margins
compared to gas-fired plants, albeit that these margins are only slightly better, as the
depressed power prices barely leave a margin sufficient to meet long-term capital
costs let alone to provide a return on investment. Because of this, gas-fired power
plants and new coal-fired power plants are financially underwater. Towards the end
of 2012, operators of gas-fired power plants faced near-zero clean spark spreads63.
Firms with nuclear generation capacity in their portfolio are also vulnerable to
(downward) price swings, given the stable and relatively low operational costs but
high capital costs.
61 In Germany, in the base case scenario more new plants will be completed than retired (World Gas Intelligence, 5
December 2012).
62 Méray, Wind and Gas: 'Back Up or Back Out, That’s the Question', 2012, CIEP.
63 GDF Suez trading.
26 EUROPEAN POWER UTILITIES UNDER PRESSURE? ENERGY PAPER
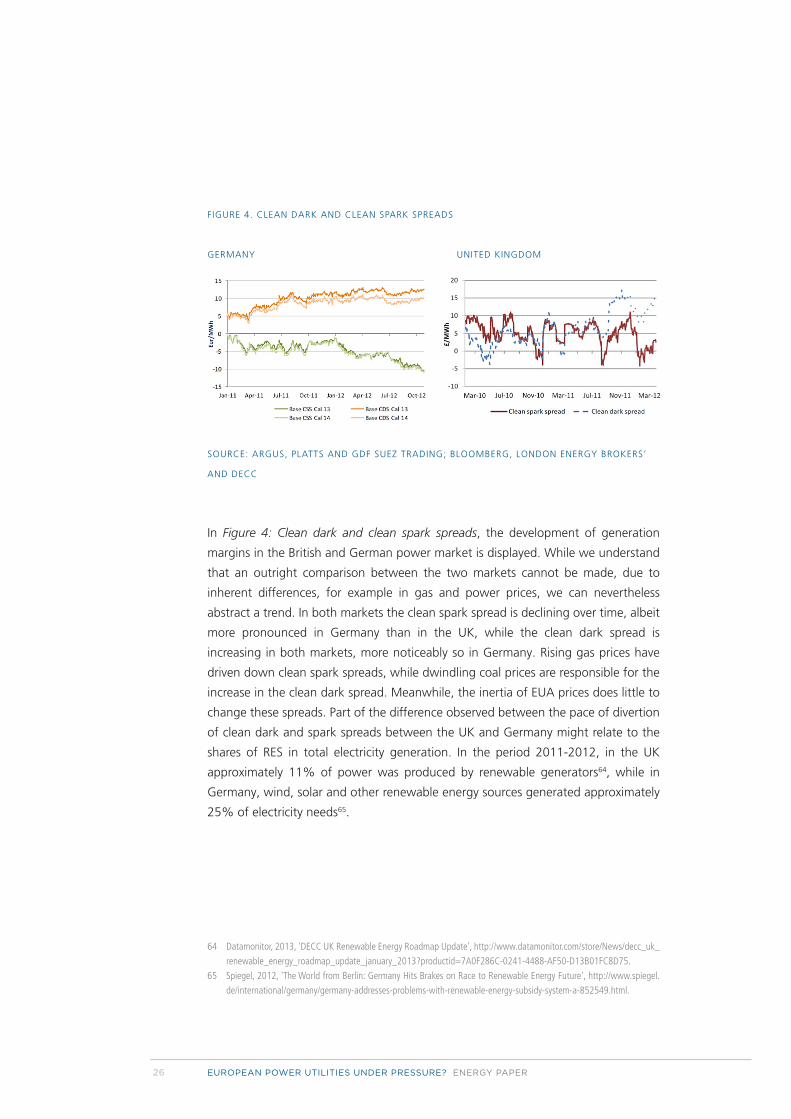
FIGURE 4. CLEAN DARK AND CLEAN SPARK SPREADS
GERMANY UNITED KINGDOM
SOURCE: ARGUS, PLATTS AND GDF SUEZ TRADING; BLOOMBERG, LONDON ENERGY BROKERS’
AND DECC
In Figure 4: Clean dark and clean spark spreads, the development of generation
margins in the British and German power market is displayed. While we understand
that an outright comparison between the two markets cannot be made, due to
inherent differences, for example in gas and power prices, we can nevertheless
abstract a trend. In both markets the clean spark spread is declining over time, albeit
more pronounced in Germany than in the UK, while the clean dark spread is
increasing in both markets, more noticeably so in Germany. Rising gas prices have
driven down clean spark spreads, while dwindling coal prices are responsible for the
increase in the clean dark spread. Meanwhile, the inertia of EUA prices does little to
change these spreads. Part of the difference observed between the pace of divertion
of clean dark and spark spreads between the UK and Germany might relate to the
shares of RES in total electricity generation. In the period 2011-2012, in the UK
approximately 11% of power was produced by renewable generators64, while in
Germany, wind, solar and other renewable energy sources generated approximately
25% of electricity needs65.
64 Datamonitor, 2013, 'DECC UK Renewable Energy Roadmap Update', http://www.datamonitor.com/store/News/decc_uk_
renewable_energy_roadmap_update_january_2013?productid=7A0F286C-0241-4488-AF50-D13B01FC8D75.
65 Spiegel, 2012, 'The World from Berlin: Germany Hits Brakes on Race to Renewable Energy Future', http://www.spiegel.
de/international/germany/germany-addresses-problems-with-renewable-energy-subsidy-system-a-852549.html.
27
The changing clean dark and clean spark dynamics now result in larger shares of
coal-fired and less gas-fired power plant production. Year-on-year use of lignite and
black coal jumped by 6.7 percent and 3.2 percent respectively66, while the
contribution of gas-fired power production has dropped to a long-time minimum67.
This leads to a situation in which the share of coal in power generation is growing,
to the detriment of gas. This provides power utilities with coal-fired generation
assets in the portfolio with an advantage. As a result, coal-fired power generation
accounts for higher shares in generation in Germany, among others. Regardless of
this increased consumption of coal, prices remain low.
None of the major power utilities in Europe has a portfolio that evades the challenges
posed by the current market conditions. The share of renewable energy sources in
power generation has increased in virtually all markets of the EU. The economic
recession is taking its toll throughout the EU. All owners of nuclear capacity are
exposed to countries looking to shrink or diminish their share of nuclear power
generation. All power majors have a significant share of gas-fired power plants in
their generation fleet. All have opted for strategies to increase invest in RES capacity,
the subsidies of which are subject to restructuring.
The developments in the EU power sector seem to alarm both industry participants
and policymakers. The latter are preoccupied with the costs of transition and the
ability of existent policy to steer the development of the EU power sector towards
the policy aim of a low-carbon sector. This enforces the feeling of apprehension
amongst industry leaders about the investment climate and possible political
interference.
66 Petroleum Intelligence Weekly (20, July, 2012).
67 UK 14-year low for gas, and 6-year high for coal; Spain 14.2% electricity generated by gas in h1 2012 as opposed to 23%
in 2010, while coal accounted for 19% in H1 2012 vs. 8% in 2010. (Petroleum Intelligence Weekly, 20, July, 2012).
29
3 THECONUNDRUMFOREUROPEANPOWERUTILITIES
3.1CHANGESINTHEBUSINESSENVIRONMENTOFTHE
EUROPEANPOWERMAJORS
Three years ago, the EU seemed well on its way to recovering from the economic
crisis, and after a dip in 2009, demand for primary energy appeared to be picking up
again (see Figure 1: EU primary energy consumption). Now, five years after the
outbreak of the crisis, the economy has still not turned around, with a significant
decrease in power consumption as a result. In 2013 the outlook for the sector has
changed drastically. In addition to the usual competitive pressures, the European
utilities are facing a larger set of challenges. The mothballing of power plants,
announced reorganisation, impairments and divestments68 are a clear indication of
the troublesome situation this creates for many European power utilities. The current
dynamic has the potential to change the makeup of the sector. The reduced power
demand, combined with the surplus and intermittent generation by renewables,
make the business case for running thermal power plants less attractive. When
governments then press the firms to keep money-losing plants open, this only adds
to potential problems69. The impact of RES on the system and the seeming inability
of power utilities to come to terms with the effects on generation margins add to
the uncertainty for investors in generation capacity. It appears that the market has
thus not yet adapted to the new conditions.
INFRASTRUCTURAL CHALLENGES
Unattractive as the outlook for the generation part of the power sector may be,
even more uncertainty exists on the infrastructural side. In order to support the
transition envisioned in EU Energy Policy, eventually to a low-carbon economy, the
infrastructure is in dire need of additions and upgrades. Investments are required in
interconnectors, storage capacity, super grids and smart grids. In the EU infrastructure
package released in 201170, the required investment is estimated at €210 billion71,72.
68 See Section 4.1 for a more detailed description.
69 The German government has threatened power producers with a ban on shutting down unprofitable power plants.
(Handelsblatt, 15 September 2012, 'Regierung droht mit Abschalt-Verbot für ältere Kraftwerke', http://www.handelsblatt.
com/politik/deutschland/blackout-gefahr-regierung-droht-mit-abschalt-verbot-fuer-aeltere-kraftwerke/7137864.html).
70 EC, 2011, 'Energy Infrastructure Priorities for 2020 and Beyond', http://ec.europa.eu/energy/infrastructure/strategy/2020_
en.htm.
71 EC, 19 October 2011, 'The Commission’s Energy Infrastructure Package', http://europa.eu/rapid/pressReleasesAction.do?
reference=MEMO/11/710&format=HTML&aged=0&language=EN&guiLanguage=en.
72 An approximate €140 billion is needed to establish a more interconnected and powerful network by constructing
electricity transmission systems, storage and smart grid application. The remaining share of the estimate is directed at
gas, and to a much smaller extent CCS infrastructure.
30 EUROPEAN POWER UTILITIES UNDER PRESSURE? ENERGY PAPER
Germany alone needs an approximate €20 billion to adapt the system to the new
realities of large RES shares73 and the nuclear phase-out, described in the national
grid plan74. Large RES shares in the power system require investments in
interconnection capacity, as well as the expansion of existing transport capacity, e.g.
in Germany from North to South. In addition, the actual connection of RES
generation capacity might also pose a challenge in terms of cost. This is the case
especially for offshore wind parks.
In an unbundled market, this co-ordination challenge is exacerbated. Especially the
uneasy co-ordination between investments in (renewable) generation capacity and
in transmission and distribution infrastructure may contribute to suboptimal
outcomes in terms of cost. The unbundling of generation and infrastructure
companies has led to the externalisation of the connection cost of generation
capacity. Substantial investment capital shortages exist and are likely to increase.
Government programmes are unlikely to overcome these shortcomings. This
predominately ties in to the austerity measures taken by national governments in
response to the economic downturn plus the expenditures related to the bailing out
of various EU Member States. Nevertheless, the needs remain and only seem to be
increasing with the emergence of a better understanding of the impact of larger
shares of renewable intermittent generation. The costs and the effort involved in
co-ordinating cross-border investments in infrastructure can result in collective action
problems. In order to alleviate the problems more co-ordination between the
interests of the major power generators and those of their (former) governmental
shareholders, the Member States is required.
This creates uncertainty among investors in generation capacity. Apprehensive of
government interference, the infrastructural problem makes investments in regions
where this occurs less interesting for the EU power majors.
COMPETITIVE PRESSURES
Legally binding targets for energy efficiency measures and RES capacity instalments
in the various Member States will contribute to a stagnation of previous growth in
power demand in the EU. For power utilities, a decrease in demand or a substitution
of their product is perceived as a threat to future income. Social and technological
73 In order to attain the EU 2020 RES aim of having 18% of primary energy be derived from renewables, Germany will
have to increase its current 20/25% share of RES electricity generation to an approximate 35% by 2020 (Petroleum
Intelligence Weekly, 24 October 2012, 'Germany Rethinks Green Subsidy Regime as Consumer Costs Soar').
74 The Economist, 28 July 2012, 'Energiewende'.
31
developments could lead to an increased independence of electricity consumers
from the electricity grid, and thus from the power suppliers. The instalments of
small-scale renewables, in combination with micro storage capacity to bridge the
intermittency gap, is already possible with existing technologies75. The rising prices
for household power in countries like Germany have the potential to create a
precarious situation. Higher prices for power combined with decreasing prices for
renewable energy generation equipment, such as solar PV, create the conditions for
so-called 'socket parity' when the cost of installation for RES to household consumers
is lower than power from the grid. In addition to the substitution of centralised
power supply by individual consumers, we see the rise of co-operative power
generation ventures organised on the level of housing blocks. This emancipation of
the electricity consumer has the potential to eradicate a fair share of the retail market
for EU power firms.
Industrial power consumers are investing in renewable generation technologies to
leverage expected growth in energy costs in the future. Additionally, the scaling
back of centralised energy production to the level of municipalities could pose a
threat. In Germany, the portfolio restructuring by some of the EU power majors has
resulted in power generation ownership being returned to the level of the
municipality. The Stadtwerke, municipal multi-utility services, also develop their own
strategies, which could threaten the market share of the EU power majors in
Germany76 .
The power utilities also likely face outright competition from established energy
firms that do not yet have a major presence in the EU power sector. These could be
either sub-major power utilities operating in the EU power markets or entries in the
generation sector by energy firms from other parts of the value chain. Sub-major
power utilities in Central Europe have engaged in vertical integration strategies to
integrate their gas and power businesses. This is the case for both Austrian OMV
and Polish PGNIG, while at the same time these firms are off selling of non-core
assets77. If successful in these endeavours, these firms could very well turn out to be
formidable competitors in new generation projects, especially in the Central and
Eastern European markets.
75 Nedap, http://powerrouter.com/, accessed 20 February 2012.
76 Der Spiegel, 22 December 2012, 'Milliarden-Plan: Stadtwerke attackieren Stromriesen', http://www.spiegel.de/wirtschaft/
soziales/milliarden-plan-stadtwerke-attackieren-stromriesen-a-805247.html.
77 World Gas Intelligence, 2 January 2013, 'Pole’s Output Vault'.
32 EUROPEAN POWER UTILITIES UNDER PRESSURE? ENERGY PAPER
Forward integration into the electricity sector by upstream and midstream gas
players already present in the EU is the other case in point. As the result of
developments in the Russian power sector, European power generators have entered
the Russian market arena78, to the detriment of Russian upstream firms with power
generation capacity in Russia. These firms could assert their position in Europe by
entering the European power markets. International energy firms with midstream
operations in Europe such as the Abu Dhabi National Energy Company could develop
their portfolios towards power generation. The development of new technologies in
order to mitigate the intermittency problem of RES by storing power in gaseous
forms could offer opportunities for these types of firms. Other candidates could be
power firms from China which have already made inroads into Europe, for example
China Three gorges Corporation (CTC)79, which has purchased a share in Portuguese
power utility EDP (EDF), or the State Grid Corporation of China80, which has taken a
share in Portugal’s grid operator REN. The continued privatisation of predominantly
Southern European national assets provides plenty of opportunity to non-European
energy giants.
The arrival of new competitors, some with different business models, combined with
the substitution of electricity demand by self-generating consumers and energy
efficiency, all contribute to uncertainty regarding future power demand in the EU
and the ability of the EU power majors to serve this demand. This introduces yet
another source of pressure for these EU power majors.
3.2THEOUTLOOKFORTHEEUROPEANPOWERUTILITIES
Developments in the economic, competitive, technological and policy environments
are affecting the firms in the European power sector. The confluence of these
developments has been referred to as 'the perfect storm' for power utilities in
Europe81. So how does this reflect on the EU power majors?
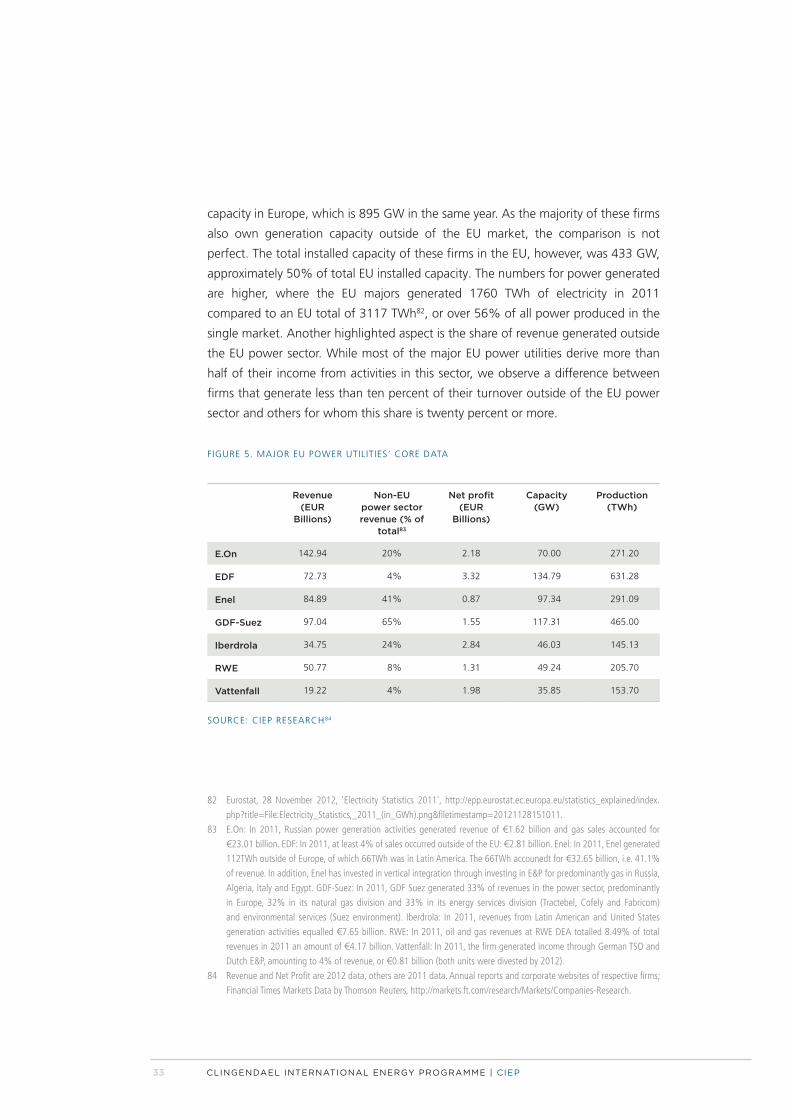
Figure 5: Major EU power utilities’ core data provides an overview of some key
indicators for the major power utilities in Europe. In order to grasp the size of these
firms we compare the firms’ total installed capacity of 552 GW to the total installed
78 Enel OGK-5, May 2012, Enel OGK-5 Investor Presentation, http://www.ogk-5.com/upload/Investor%20
Relations/2012%20IR%20docs/presentations/Enel%20OGK-5%20Investor%20Presentation%20(May12).pdf.
79 EDP, 2011, 'Partnership with China Three Gorges', http://www.edp.pt/pt/investidores/DiaInvestidor/Investor%20Day%20
2012/7.%20JMC%20-%20Partnership%20with%20China%20Three%20Gorges.pdf.
80 State Grid Corporation of China, 5 February 2012, 'State Grid Corporation of China Successfully Acquires a 25% Stake in
REN Portugal' , http://www.sgcc.com.cn/ywlm/mediacenter/corporatenews/02/265956.shtml.
81 The Wall Street Journal, 14 November 2012, 'Germany’s Utilities Caught in a Perfect Storm', http://online.wsj.com/article/
SB10001424127887324556304578116240833080594.html.
33
capacity in Europe, which is 895 GW in the same year. As the majority of these firms
also own generation capacity outside of the EU market, the comparison is not
perfect. The total installed capacity of these firms in the EU, however, was 433 GW,
approximately 50% of total EU installed capacity. The numbers for power generated
are higher, where the EU majors generated 1760 TWh of electricity in 2011
compared to an EU total of 3117 TWh82, or over 56% of all power produced in the
single market. Another highlighted aspect is the share of revenue generated outside
the EU power sector. While most of the major EU power utilities derive more than
half of their income from activities in this sector, we observe a difference between
firms that generate less than ten percent of their turnover outside of the EU power
sector and others for whom this share is twenty percent or more.
FIGURE 5. MAJOR EU POWER UTILITIES’ CORE DATA
Revenue (EUR
Billions)
Non-EU power sector revenue (% of
total83
Net profit (EUR
Billions)
Capacity (GW)
Production (TWh)
E.On 142.94 20% 2.18 70.00 271.20
EDF 72.73 4% 3.32 134.79 631.28
Enel 84.89 41% 0.87 97.34 291.09
GDF-Suez 97.04 65% 1.55 117.31 465.00
Iberdrola 34.75 24% 2.84 46.03 145.13
RWE 50.77 8% 1.31 49.24 205.70
Vattenfall 19.22 4% 1.98 35.85 153.70
SOURCE: CIEP RESEARCH84
82 Eurostat, 28 November 2012, 'Electricity Statistics 2011', http://epp.eurostat.ec.europa.eu/statistics_explained/index.
php?title=File:Electricity_Statistics,_2011_(in_GWh).png&filetimestamp=20121128151011.
83 E.On: In 2011, Russian power generation activities generated revenue of €1.62 billion and gas sales accounted for
€23.01 billion. EDF: In 2011, at least 4% of sales occurred outside of the EU: €2.81 billion. Enel: In 2011, Enel generated
112TWh outside of Europe, of which 66TWh was in Latin America. The 66TWh accounedt for €32.65 billion, i.e. 41.1%
of revenue. In addition, Enel has invested in vertical integration through investing in E&P for predominantly gas in Russia,
Algeria, Italy and Egypt. GDF-Suez: In 2011, GDF Suez generated 33% of revenues in the power sector, predominantly
in Europe, 32% in its natural gas division and 33% in its energy services division (Tractebel, Cofely and Fabricom)
and environmental services (Suez environment). Iberdrola: In 2011, revenues from Latin American and United States
generation activities equalled €7.65 billion. RWE: In 2011, oil and gas revenues at RWE DEA totalled 8.49% of total
revenues in 2011 an amount of €4.17 billion. Vattenfall: In 2011, the firm generated income through German TSO and
Dutch E&P, amounting to 4% of revenue, or €0.81 billion (both units were divested by 2012).
84 Revenue and Net Profit are 2012 data, others are 2011 data. Annual reports and corporate websites of respective firms;
Financial Times Markets Data by Thomson Reuters, http://markets.ft.com/research/Markets/Companies-Research.
34 EUROPEAN POWER UTILITIES UNDER PRESSURE? ENERGY PAPER
EU POWER MAJORS’ PORTFOLIOS
Although we refer to the EU power utilities as a group, they are by no means a
homogeneous group. Figure 5: Major EU power utilities’ core data alludes to
inherent differences between these firms. From Figure 7: Major EU power utilities’
generation mix in 2011 and Figure 6: EU power utilities’ installed capacity in the EU
in 2011 it becomes clear these firms are different in terms of exposure to the
problems in the EU, its Member States’ markets and the different generation types.
On top of this divergence come the activities of these firms that are outside of the
power generation industry. GDF-Suez realises 32% of its revenues from its gas
business and 33% from energy and environmental services, predominantly related
to water and waste disposal85. Through RWE Dea, the gas and oil E&P subsidiary,
RWE generated €4.17 billion in revenues in 2011, although in early 2012 RWE
signalled that it was looking to sell the division as part of its divestment programme86.
RWE additionally produced 90 million megatons of lignite in its opencast mines in
Germany87. Vattenfall also operates lignite mines in Germany88. All of the major
power utilities have upstream oil, gas or mining assets. The gas division of E.On,
nearly ten years after the acquisition of Rurhgas, is still a significant driver of revenue,
producing approximately 8.2 BCM in 201189. Enel has invested in E&P activities in
Russia, Algeria, Egypt and Italy. Enel’s investment in Russia resulted in the production
of 2.2 BCM in 201290.
The differences continue when we look at the structure of the power generation
portfolios. In most cases, the firms still derive the majority of their incomes from
activities in the EU power sector. However, the geographical focus within Europe
differs (see Figure 6: Major EU power utilities’ installed capacity in the EU in 2011).
85 GDF Suez, 2012, 'Activities Report 2011'.
86 Financial Times, 5 March 2013, 'RWE to Quit Oil and Gas Exploration', http://www.ft.com/intl/cms/s/0/ef00d724-856e-
11e2-9ee3-00144feabdc0.html#axzz2OjEm0S2Y.
87 RWE, 2012, 'Facts and Figures 2011'.
88 Vattenfall, 3 December 2012, 'The Generation Heart of Vattenfall', Presentation by Tuomo Hatakka, Head of Business
Division Production.
89 E.on, 2011, 'Facts and Figures 2011'.
90 Enel, 9 November, 2012, 'Enel Announces New Gas Discovery in Algeria', http://www.enel.com/en-GB/media/press_
releases/enel-announces-new-gas-discovery-in-algeria/r/1655925/.
35
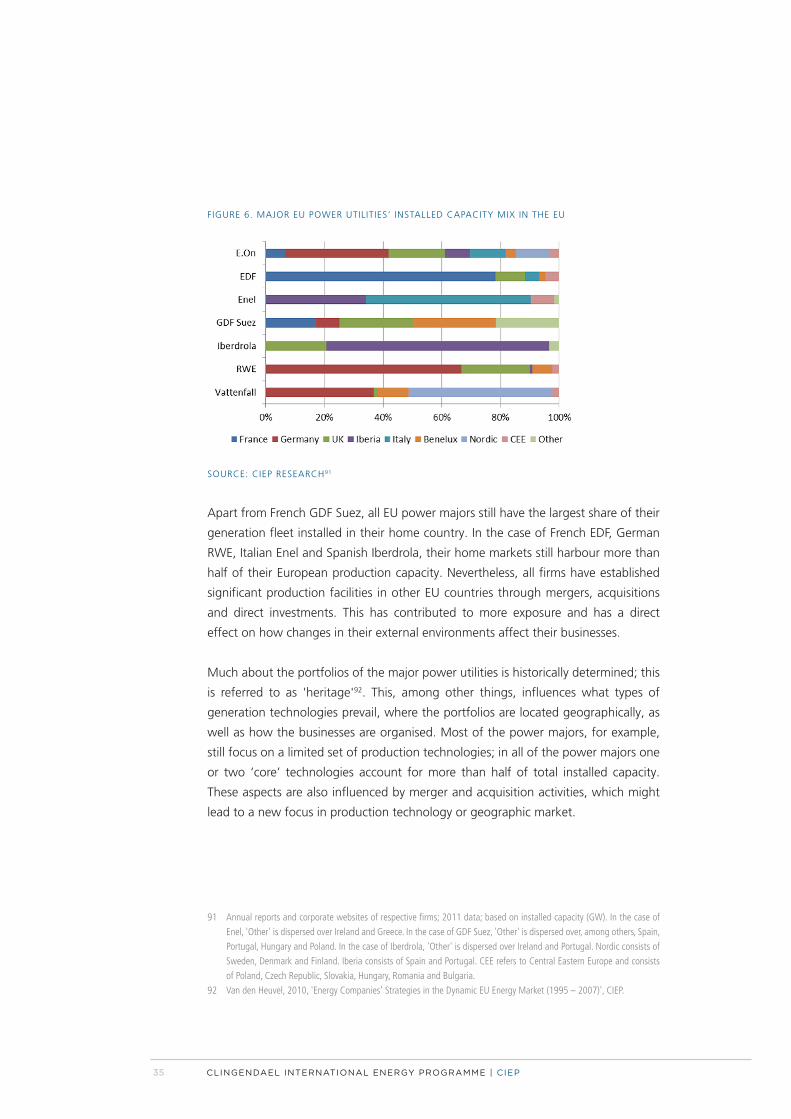
FIGURE 6. MAJOR EU POWER UTILITIES’ INSTALLED CAPACITY MIX IN THE EU
SOURCE: CIEP RESEARCH91
Apart from French GDF Suez, all EU power majors still have the largest share of their
generation fleet installed in their home country. In the case of French EDF, German
RWE, Italian Enel and Spanish Iberdrola, their home markets still harbour more than
half of their European production capacity. Nevertheless, all firms have established
significant production facilities in other EU countries through mergers, acquisitions
and direct investments. This has contributed to more exposure and has a direct
effect on how changes in their external environments affect their businesses.
Much about the portfolios of the major power utilities is historically determined; this
is referred to as 'heritage'92. This, among other things, influences what types of
generation technologies prevail, where the portfolios are located geographically, as
well as how the businesses are organised. Most of the power majors, for example,
still focus on a limited set of production technologies; in all of the power majors one
or two ‘core’ technologies account for more than half of total installed capacity.
These aspects are also influenced by merger and acquisition activities, which might
lead to a new focus in production technology or geographic market.
91 Annual reports and corporate websites of respective firms; 2011 data; based on installed capacity (GW). In the case of
Enel, 'Other' is dispersed over Ireland and Greece. In the case of GDF Suez, 'Other' is dispersed over, among others, Spain,
Portugal, Hungary and Poland. In the case of Iberdrola, 'Other' is dispersed over Ireland and Portugal. Nordic consists of
Sweden, Denmark and Finland. Iberia consists of Spain and Portugal. CEE refers to Central Eastern Europe and consists
of Poland, Czech Republic, Slovakia, Hungary, Romania and Bulgaria.
92 Van den Heuvel, 2010, 'Energy Companies’ Strategies in the Dynamic EU Energy Market (1995 – 2007)', CIEP.
36 EUROPEAN POWER UTILITIES UNDER PRESSURE? ENERGY PAPER
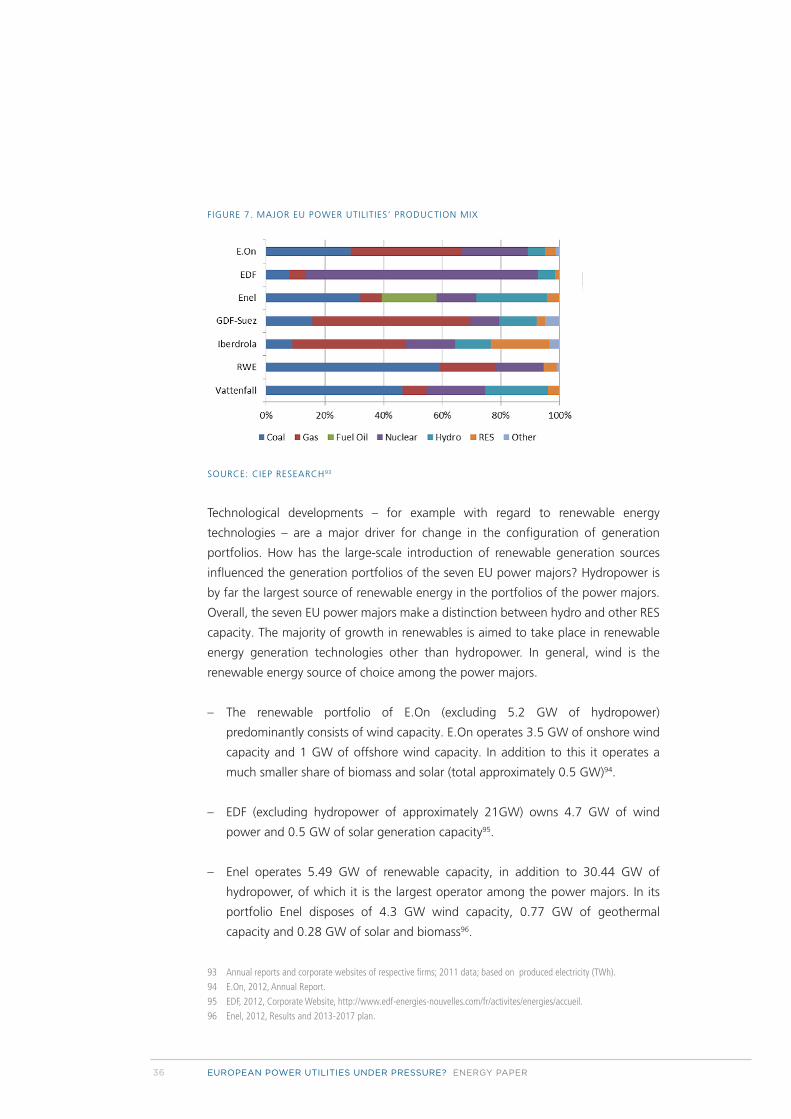
FIGURE 7. MAJOR EU POWER UTILITIES’ PRODUCTION MIX
SOURCE: CIEP RESEARCH93
Technological developments – for example with regard to renewable energy
technologies – are a major driver for change in the configuration of generation
portfolios. How has the large-scale introduction of renewable generation sources
influenced the generation portfolios of the seven EU power majors? Hydropower is
by far the largest source of renewable energy in the portfolios of the power majors.
Overall, the seven EU power majors make a distinction between hydro and other RES
capacity. The majority of growth in renewables is aimed to take place in renewable
energy generation technologies other than hydropower. In general, wind is the
renewable energy source of choice among the power majors.
– The renewable portfolio of E.On (excluding 5.2 GW of hydropower)
predominantly consists of wind capacity. E.On operates 3.5 GW of onshore wind
capacity and 1 GW of offshore wind capacity. In addition to this it operates a
much smaller share of biomass and solar (total approximately 0.5 GW)94.
– EDF (excluding hydropower of approximately 21GW) owns 4.7 GW of wind
power and 0.5 GW of solar generation capacity95.
– Enel operates 5.49 GW of renewable capacity, in addition to 30.44 GW of
hydropower, of which it is the largest operator among the power majors. In its
portfolio Enel disposes of 4.3 GW wind capacity, 0.77 GW of geothermal
capacity and 0.28 GW of solar and biomass96.
93 Annual reports and corporate websites of respective firms; 2011 data; based on produced electricity (TWh).
94 E.On, 2012, Annual Report.
95 EDF, 2012, Corporate Website, http://www.edf-energies-nouvelles.com/fr/activites/energies/accueil.
96 Enel, 2012, Results and 2013-2017 plan.
37
– The renewable portfolio of GDF Suez consists of a 3.5 GW wind generation
capacity and 1 GW biomass generation capacity. In addition to this, GDF Suez
runs 16 GW of hydropower, while another 4 GW of hydropower and 0.8 GW of
wind power is under construction97.
– Iberdrola champions wind power, with 13.62 GW of installed onshore capacity
and 6.3 GW of offshore wind capacity under development98. Apart from wind,
Iberdrola operates 9.89 GW of hydropower and 0.42 GW of, among others,
solar, mini hydro and biomass capacity99.
– Total installed RWE renewable capacity, including hydropower, equalled 4.1
GW100, of which approximately half is onshore and offshore wind capacity, a
third biomass and twenty percent hydropower101. In 2012, RWE produced 5.5%
of electricity from renewable sources, roughly equally divided over wind, biomass
and hydro.
– Hydropower is the largest contributor to Vattenfall’s renewable portfolio (11.4
GW), followed by wind (1.4 GW)102. Vattenfall describes biomass as the third
most important renewable energy source in the European energy mix103. The
company focuses on co-firing biomass in existing coal-fired plants as well as on
biomass power plants. So far, however, biomass contributes less than one percent
to Vattenfall’s total power production104.
From the above we deduct a strategic focus on centralised generation capacity by
the power majors. All firms focus on wind projects, both onshore and offshore. In
addition to wind, we observe that the firms invest in biomass, which most often
entails the transformation or adjustment of existing coal plants, again in line with
the centralised business models. This is not to say the firms do not invest in other
renewable power generation technologies, but so far this has occurred on a
significantly smaller scale.
97 GDF Suez, 2013, 'Sustainability: GDF Suez Strategy to Foster Long Term Value Creation'.
98 Iberdrola, 2012, Results.
99 Iberdrola, 2012, Results.
100 RWE, 2012, Annual Report.
101 RWE, 2012, 'Factbook Renewable Energy', http://www.rwe.com/web/cms/mediablob/en/108824/data/114404/25/rwe/
investor-relations/factbook/factbook-renewable-energy-new.pdf.
102 Vattenfall, 2012, 'The Generation Heart of Vattenfall', http://www.vattenfall.com/en/file/6_BD_Production_
CMD2012_23656712.pdf.
103 Vattenfall corporate website, http://www.vattenfall.com/en/biomass-energy.htm.
104 Vattenfall, 2011, Annual Report.
38 EUROPEAN POWER UTILITIES UNDER PRESSURE? ENERGY PAPER
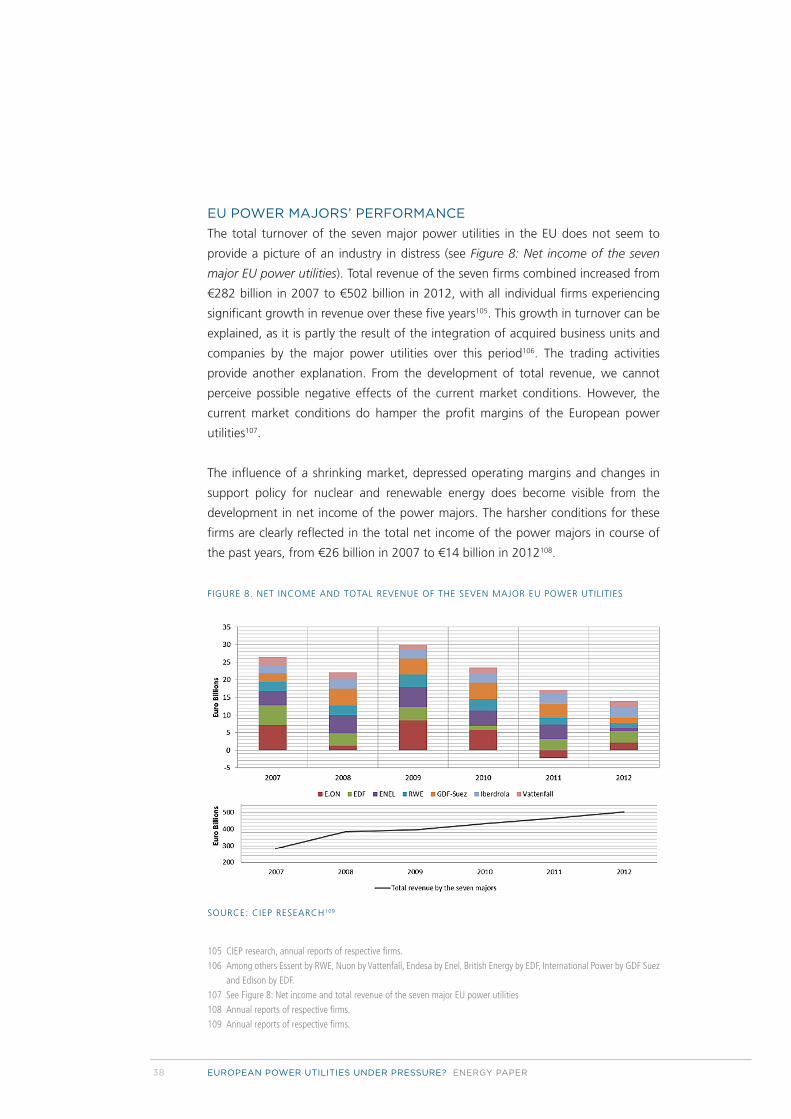
EU POWER MAJORS’ PERFORMANCE
The total turnover of the seven major power utilities in the EU does not seem to
provide a picture of an industry in distress (see Figure 8: Net income of the seven
major EU power utilities). Total revenue of the seven firms combined increased from
€282 billion in 2007 to €502 billion in 2012, with all individual firms experiencing
significant growth in revenue over these five years105. This growth in turnover can be
explained, as it is partly the result of the integration of acquired business units and
companies by the major power utilities over this period106. The trading activities
provide another explanation. From the development of total revenue, we cannot
perceive possible negative effects of the current market conditions. However, the
current market conditions do hamper the profit margins of the European power
utilities107.
The influence of a shrinking market, depressed operating margins and changes in
support policy for nuclear and renewable energy does become visible from the
development in net income of the power majors. The harsher conditions for these
firms are clearly reflected in the total net income of the power majors in course of
the past years, from €26 billion in 2007 to €14 billion in 2012108.
FIGURE 8. NET INCOME AND TOTAL REVENUE OF THE SEVEN MAJOR EU POWER UTILITIES
SOURCE: CIEP RESEARCH109
105 CIEP research, annual reports of respective firms.
106 Among others Essent by RWE, Nuon by Vattenfall, Endesa by Enel, British Energy by EDF, International Power by GDF Suez
and Edison by EDF.
107 See Figure 8: Net income and total revenue of the seven major EU power utilities
108 Annual reports of respective firms.
109 Annual reports of respective firms.
39
Looking at the development of the total profit of the seven large European power
utilities, we first see a dip in 2008 related to the outbreak of the economic crisis. In
2009, however, the net income of all firms levelled out again. The period from 2007
to 2012 was a turbulent time for most firms. Apart from EDF and Vattenfall, the
power majors saw their profit margins decrease significantly in this period. A part of
the decrease in net income relates to impairments on the generation portfolio,
whether related to specific events such as the Atomausstieg, market conditions
related to the profitability of gas- and coal-fired generation assets, or the macro-
economic conditions in specific EU markets such as Spain. In addition to impairments,
lay-offs and divestitures have been instrumental in dealing with the affected income
of EU power majors. Given that the market dynamics do not seem to be improving,
restructuring and divestments are expected to continue.
3.3THEIMPACTONEUPOWERMAJORS’ACTIVITIES
While struck by the changes in their external environments, various power firms
were already in the process of updating or even transforming their portfolios.
Counting on demand for power to grow, but unsure what the future power source
of choice would be, firms invested in capacity additions focused on differentiation.
Now some years on and faced with deteriorated market conditions, the EU power
majors are trapped in new generation projects for which the decision to develop was
made some years ago. As a result, European power utilities continue to add new
capacity. This is not only the case for renewable generation capacity, but also for gas
and coal-fired power production110. The outlook per firm changes both
technologically and geographically, depending on the composition of its portfolio.
Firms with portfolios focused in Northern Europe face different problems from those
predominantly positioned in Southern Europe. Firms with large shares of coal
generators are likely to have a better short-term outlook than those with large shares
of gas generation capacity.
– E.On seems to have overcome the blow received from having to shed its nuclear
activities, albeit at the detriment of various assets it has divested from in order to
rebalance the books. E.On is unlikely to enter into new nuclear projects in the
short term, possibly moving strategically away from nuclear111. E.On, because of
the large share of gas fired-power plants in its portfolio, suffers from the
depressed operating margins on gas-fired power production and has had to
make significant impairments on these assets.
110 See Section 2.4: A combination of pressures.
111 Der Spiegel, 29 June 2012, 'CEO of Energy Giant RWE: 'The Nuclear Power Chapter Has Come to an End'', http://www.
spiegel.de/international/business/rwe-s-new-ceo-terium-to-halt-nuclear-power-and-invest-in-renewables-a-841260.
html.
40 EUROPEAN POWER UTILITIES UNDER PRESSURE? ENERGY PAPER
– EDF is the largest contributor to the French electricity market, where it operates
all nuclear power plants112. As a result, EDF is very vulnerable in this period in
which governments are reassessing the role of nuclear energy in their national
fuel mixes. Although the French government has plans to limit the contribution
of nuclear energy to the power generation mix by 33%113, it aims to do so by
replacing this with renewable energy sources. EDF might be well placed to do the
replacement investments in RES capacity, whereas through its EDF Energies
Nouvelles arm, it is already engaged in ambitious renewable projects114. While
EDF seems able to manage the pressures, the rising costs of new nuclear
generation capacity development might pose new challenges115.
– Enel holds a significant market share of RES in Italy and Spain through the Enel
Green Power subsidiary. Enel will have to come to terms with the revisions in the
renewable support schemes. Besides the impact on the renewable portfolio,
Enel owns a large generation fleet in the EU Member States hit hard by the
economic crisis, Spain, Italy and some assets in Greece, which have already
forced significant write-downs.
– GDF Suez is the largest operator of gas-fired power plants in the EU market and
as such suffers from the poor market conditions for this generation type. The
largest share of the company’s portfolio is comprised of gas-fired power
generators. Adding to the challenge for GDF Suez is the decision by the Belgian
government to phase out nuclear power, because of which it faces the
decommissioning of its nuclear fleet. On the other hand, GDF Suez only derives
about a third of its income from electricity production and a smaller segment
from the EU power sector.
– With a significant portion of its fleets installed in Spain and Portugal, Iberdrola is
affected by the deteriorated market conditions there. In addition, Iberdrola has a
considerable share of wind generation capacity in its portfolio in the Iberian
Peninsula and as such will have to come to terms with the Spanish cutbacks in
renewables support.
112 France’s installed nuclear capacity consists of 58 plants (OECD Nuclear Energy Agency, accessed 11 February 2013,
Country Profile France, http://www.oecd-nea.org/general/profiles/france.html). EDF has 58 nuclear reactors in France out
of its 82 total global nuclear fleet (EDF, accessed 11 February 2013, EDF’s technical expertise, http://www.edfenergy.com/
energyfuture/edf-energys-approach-why-we-choose-new-nuclear/technical-expertise).
113 See Section 2.2: Unforeseen effects of a changing fuel mix.
114 Bloomberg, 13 November 2012, 'EDF Completes Europe’s Largest Photovoltaic Plant in France', http://www.bloomberg.
com/news/2012-11-13/edf-completes-europe-s-largest-photovoltaic-plant-in-france.html.
115 The Guardian, 7 December 2012, 'Nuclear Giant EDF Postpones Decision on New Hinkley Point Reactor', http://www.
guardian.co.uk/business/2012/dec/07/nuclear-edf-hinkley-point.
41
– RWE also seems to have overcome the blow received by the impact of the
German nuclear phase-out and, similar to E.On, is unlikely to engage in new
nuclear projects116. RWE, by far the largest producer of coal-fired power in the
EU, has an advantage over utilities that suffer from depressed margins on gas-
fired power generation. Nevertheless it suffers, as margins on coal-fired power
generation are also depressed. Adding to the pressure for RWE is the uncertain
future of coal in Europe. Without carbon capture and storage technologies, it
will be impossible to maintain the operation of these plants in the future, given
the emissions. In the long run, especially RWE faces compromising tasks, which is
especially daunting because the current market conditions do not provide much
return on recent investment in coal-fired generation assets.
– Vattenfall suffers from the depressed market conditions and as a result is
undergoing significant corporate restructuring117. In the meanwhile, Vattenfall is
likely to become instrumental in the (Swedish) transition towards a low-carbon
economy. In this respect, it should be noted that Vattenfall already operates a
power generation fleet comprised for over 50% of low-CO2-emitting
technologies, namely nuclear, hydro and other RES capacity.
As long as the economic downturn overshadows Europe, the outlook does not bear
much hope. The on-going economic crisis has various impacts on the EU power
utilities: it causes the market to shrink, the conditions for investment in new
generation technologies to deter, various support schemes for renewable generation
technologies to be adjusted and the rating of their credits to go down. As a result,
the investment outlook for the firms operating in the European power sector has
deteriorated.
On the operational level, individual assets of firms are financially underwater118. In
case of power generation assets characterised by high short-run marginal costs
related to power generation feedstock, this is likely to lead to the mothballing of
power plants. Shutting down plants brings with it write-downs of investments and
dismissals. Apart from the conventional thermal power plants, the operators of
116 Der Spiegel, 29 June 2012, 'CEO of Energy Giant RWE: 'The Nuclear Power Chapter Has Come to an End'', http://www.
spiegel.de/international/business/rwe-s-new-ceo-terium-to-halt-nuclear-power-and-invest-in-renewables-a-841260.
html.
117 Addressed in Section 4.1.
118 Resulting in mothballing of generation capacity because of unfavourable generation margins, e.g. in the case of GDF Suez
(GDF Suez, 6 December 2012, Investor Day presentation) and E.On (Bloomberg, 12 March, 2013, 'Europe Gas Carnage
Shown by E.On Closing 3-Year-Old Plant', http://www.bloomberg.com/news/2013-03-12/europe-gas-carnage-shown-
by-eon-closing-3-year-old-plant-energy.html).
42 EUROPEAN POWER UTILITIES UNDER PRESSURE? ENERGY PAPER
nuclear facilities suffer from the consequences of lower power prices. Investors in
nuclear power generation are unlikely to have accounted for long times of price falls
in the EU power market. High capital costs drive the long-run marginal cost of their
plants, which are hard to service under the current market conditions.
The abovementioned is detrimental to the investment climate. For businesses looking
for growth rather than a consolidation of their position, the European power market
is in most instances an unwelcoming place. Investments in coal- or gas-fired
generation capacity are unlikely to occur for the time to come, given the unfavourable
market conditions. The decreasing support for nuclear power generation in the EU
will not lead to the construction of new nuclear plants anytime soon, unless support
policies such as envisioned in the UK are established. For now, the only business case
to be made for investors in EU power generation is in renewables – that is, as long as
subsidies remain in place.
43
4 HOWTHEEUROPEANPOWERMAJORSARERESPONDINGTOTHECHALLENGES
4.1STRATEGICADAPTATIONANDRESTRUCTURING
European power majors are facing an environment in flux, with no certainty for
economic growth to settle in any time soon, leaving power prices depressed.
Technology- and policy-driven developments continue to affect the ability of these
power majors to maintain their revenues, margins and therefore income. Driven by
the effects of a changing European power system, all major European power utilities
seem to be in a process of strategic re-orientation. In the assessment of how the
major European power utilities are responding to these drivers of change, we make
a distinction between ad hoc reactions focused on easing the currently felt pressures
and strategic shifts aimed at the longer-term consolidation of income.
AD HOC RESPONSES
The write-downs on nuclear assets have forced E.On, RWE and Vattenfall to
rebalance their portfolios, which has resulted in the firms divesting from (non-core)
assets. In an attempt to limit costs and reduce debt, Vattenfall and RWE have
announced reorganisations resulting in significant losses of jobs119. As a result of the
dificult market conditions in the power sector in Europe, power majors that have not
been exposed to the German Atomausstieg are now also being forced to make
significant write-downs and announce divestments programmes120, as is the case
with GDF Suez, Iberdrola and Enel.
In order to execute its divestment programme, RWE will need an approximate €5
billion before the end of 2013121. In mid-2012 E.On had already divested for €12.5
billion, expected to amount to €15 billion by the end of 2013122. Vattenfall completed
its envisioned divestment of non-core assets by 2012, after which it imposed an
119 RWE announced to cut 2400 jobs (Reuters, 10 August 2012, 'RWE to Cut 2,400 Jobs', http://www.reuters.com/
article/2012/08/10/us-rwe-jobs-idUSBRE8790FC20120810). Vattenfall announced that it would cut 2,500 jobs (Wall
Street Journal, 6 March 2013, 'Swedish Utility Vattenfall Cuts 2,500 Jobs', http://www.reuters.com/article/2012/08/10/
us-rwe-jobs-idUSBRE8790FC20120810).
120 GDF Suez wrote down €2 billion over 2012 (GDF Suez, 6 December 2012, Investor Day presentation), while Enel made
impairments of €2.58 billion over the same period (Enel, 2012, Results and 2013-2017 plan).
121 RWE, January 2013, 'Value in uncertain times', http://www.rwe.com/web/cms/mediablob/de/649048/data/105818/42/
rwe/investor-relations/08.01.2013-Unternehmenspraesentation-Januar-2013-Nur-in-englischer-Sprache-.pdf.
122 E.On, July 2012, 'We Make Clean Energy Better. An overview of our business activities. Q2/2012', http://www.eon.com/
content/dam/eon-com/%C3%9Cber%20uns/Globale-Einheiten/ECR%20Company%20Presentation%202012-Q2.pdf.
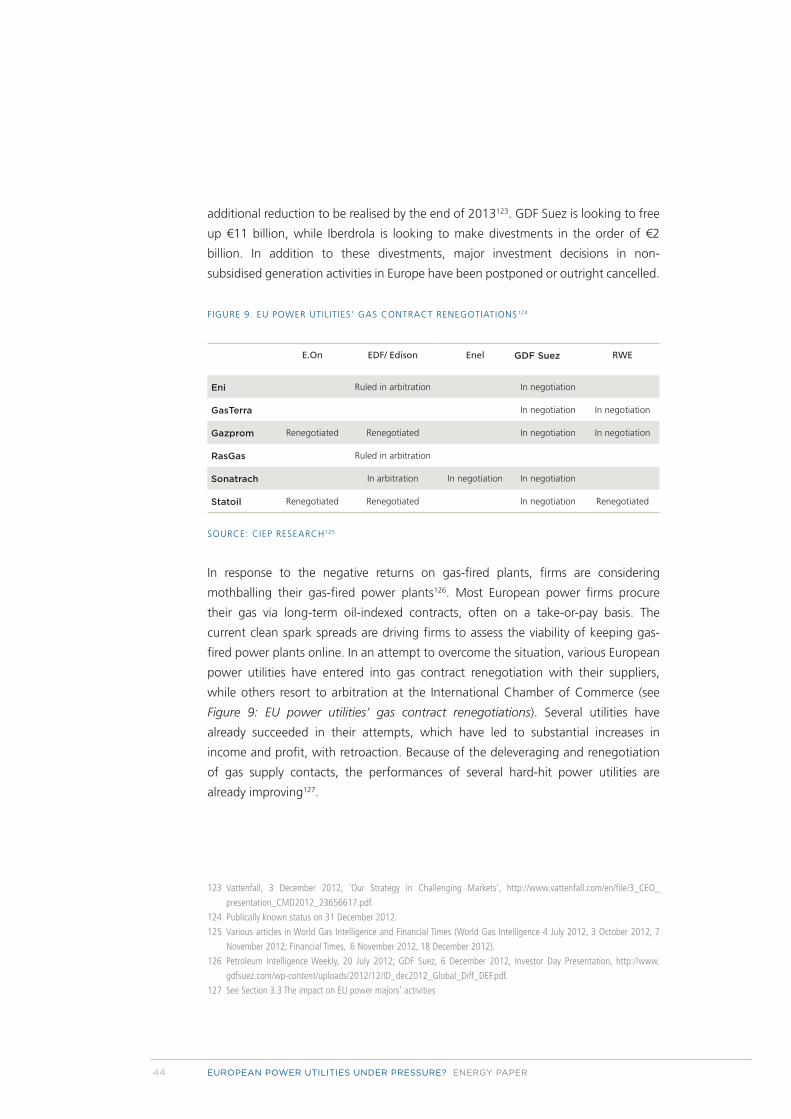
44 EUROPEAN POWER UTILITIES UNDER PRESSURE? ENERGY PAPER
additional reduction to be realised by the end of 2013123. GDF Suez is looking to free
up €11 billion, while Iberdrola is looking to make divestments in the order of €2
billion. In addition to these divestments, major investment decisions in non-
subsidised generation activities in Europe have been postponed or outright cancelled.
FIGURE 9. EU POWER UTILITIES’ GAS CONTRACT RENEGOTIATIONS124
E.On EDF/ Edison Enel GDF Suez RWE
Eni Ruled in arbitration In negotiation
GasTerra In negotiation In negotiation
Gazprom Renegotiated Renegotiated In negotiation In negotiation
RasGas Ruled in arbitration
Sonatrach In arbitration In negotiation In negotiation
Statoil Renegotiated Renegotiated In negotiation Renegotiated
SOURCE: CIEP RESEARCH125
In response to the negative returns on gas-fired plants, firms are considering
mothballing their gas-fired power plants126. Most European power firms procure
their gas via long-term oil-indexed contracts, often on a take-or-pay basis. The
current clean spark spreads are driving firms to assess the viability of keeping gas-
fired power plants online. In an attempt to overcome the situation, various European
power utilities have entered into gas contract renegotiation with their suppliers,
while others resort to arbitration at the International Chamber of Commerce (see
Figure 9: EU power utilities’ gas contract renegotiations). Several utilities have
already succeeded in their attempts, which have led to substantial increases in
income and profit, with retroaction. Because of the deleveraging and renegotiation
of gas supply contacts, the performances of several hard-hit power utilities are
already improving127.
123 Vattenfall, 3 December 2012, 'Our Strategy in Challenging Markets', http://www.vattenfall.com/en/file/3_CEO_
presentation_CMD2012_23656617.pdf.
124 Publically known status on 31 December 2012.
125 Various articles in World Gas Intelligence and Financial Times (World Gas Intelligence 4 July 2012, 3 October 2012, 7
November 2012; Financial Times, 6 November 2012, 18 December 2012).
126 Petroleum Intelligence Weekly, 20 July 2012; GDF Suez, 6 December 2012, Investor Day Presentation, http://www.
gdfsuez.com/wp-content/uploads/2012/12/ID_dec2012_Global_Diff_DEF.pdf.
127 See Section 3.3 The impact on EU power majors’ activities
45
RESTRUCTURING
Apart from a response to the current pressures, the actions taken by firms allude to a
general process of re-orientation. The power utilities are deleveraging in certain
markets while investing in others. We see a refocus of firms to their core competences
on the one hand, while on the other they still engage to some degree in the
development of new markets. Several of the EU power majors are applying a
combination of the two. Apart from dealing with the existing problems, the major
European power utilities are thus seeking to develop strategies that will make them
more resistant to current and future pressures. The restructuring of their corporate
portfolios seems to be taking place along two lines. We see that firms apply a more
specific, geographically directed focus, away from the numerous cross-EU activities.
Yet we observe that other firms are focusing on certain generation technologies or
activities. The combination of both also occurs. Clearly, while divesting in order to
deleverage, the firms are seeking to develop or strengthen a strategic focus.
Some firms focus on specific types of power generation, as is the case for Vattenfall
with its emphasis on nuclear and renewables. Vattenfall has divested from its
upstream assets in the Netherlands128 and its transmission system in Germany129.
Vattenfall has also sold its Belgian activities to Italian ENI and its Finnish electricity
and heating distribution assets to a financial market consortium, while Polish firms
PGNiG and Tauron have acquired Vattenfall´s heat, electricity distribution, network
services and electricity sales interests in Poland130. GDF Suez is taking a geographically
focused approach and has shed various distribution assets in Italy, France and
Belgium131, while it seeks to expand its activities outside of Europe132. An example of
the combination of both trajectories is Iberdrola. Iberdrola has integrated its
renewables business unit in its general portfolio, whereas it is looking to sell non-
core assets in Poland and has sold a minority stake in Scottish Power’s network
business133. At the same time Iberdrola focuses investments in markets outside the
EU, with over 25% of installed capacity being in North and South America. All these
are examples of firms seeking to adjust their portfolios from (highly) differentiated
activities in different generation and geographical markets into much more focused
portfolios.
128 Divested to UK Independent Tullow in 2011 (http://www.upstreamonline.com/live/article1210389.ece).
129 Vattenfall: Other businesses, both divested sectors: German TSO and Dutch E&P: 4% of revenue €0.81 billion.
130 PWC, 2011, Power Deals.
131 Wall Street Journal, 1 July 2007, 'GDF Suez Plans Sale of Assets'.
132 See Section 4.2.
133 Financial Times, 28 September 2012, 'Iberdrola Weighs Scottish Power Options'.
46 EUROPEAN POWER UTILITIES UNDER PRESSURE? ENERGY PAPER
The development of portfolios that cover different steps in the energy value chain is
a trend we see strengthening. Through its acquisition of Edison, EDF seeks to
become a significant producer of gas and gas-fired power134. RWE, with its vast
shares of coal-fired power production, is looking for ways to modernise its fleet,
making it more compatible, as a backup, with intermittent generation sources as a
backup135, in order to maintain synergy with its mining activities. RWE, however, has
shed infrastructural assets and has diminished share holdings in smaller regional
utilities136 as part of its portfolio restructuring. GDF Suez is by far the most diversified
of all EU power majors and continuous to develop its energy services and liquefied
natural gas operations outside of the EU137. Enel & E.On also focus on upstream
activities, among others in Russia.
4.2EXPANDINGHORIZONS
BEYOND THE CORE MARKETS IN EUROPE
The major European power utilities that have the ability to do so will restructure their
assets such that they become less dependent on the mature economies in Europe
and generate more revenue in other markets. Growth potential for power generation
across the globe (see Figure 10: Global electricity demand development) is not
dispersed equally over OECD and non-OECD states. The majority of growth in
electricity demand will come from Asian countries like China, India and Russia, as
well as the Middle East and Latin America.
134 EDF seeks to become the electric company of choice across the value chain, the leader in renewables with EDF Energies
Nouvelles and, through the integration of Edison, to execute its gas strategy (EDF, 2011, Facts and Figures).
135 RWEs attempt to make coal generation more flexible by adding silos for lignite/coal granulite or pulverised coal (RWE,
accessed 8 February 2013, Lignite Energy Plant Engineering, http://www.rwe.com/web/cms/en/496012/lignite-energy/
process-heat-generation/lignite-energy-pulverized/plant-engineering/).
136 RWE, 14 August 2012, 'Divesting from Saarland-based Utility VSE'.
137 ‘GDF Suez will allocate up to 50 percent of its medium-term capital expenditure in these areas, compared with 30
percent currently’, Financial Times, 5 December 2012, 'GDF Suez Warns of Lower Profits Next Year', http://www.ft.com/
intl/cms/s/0/67d6fd0e-3f15-11e2-9214-00144feabdc0.html#axzz2LG7H2Tou.
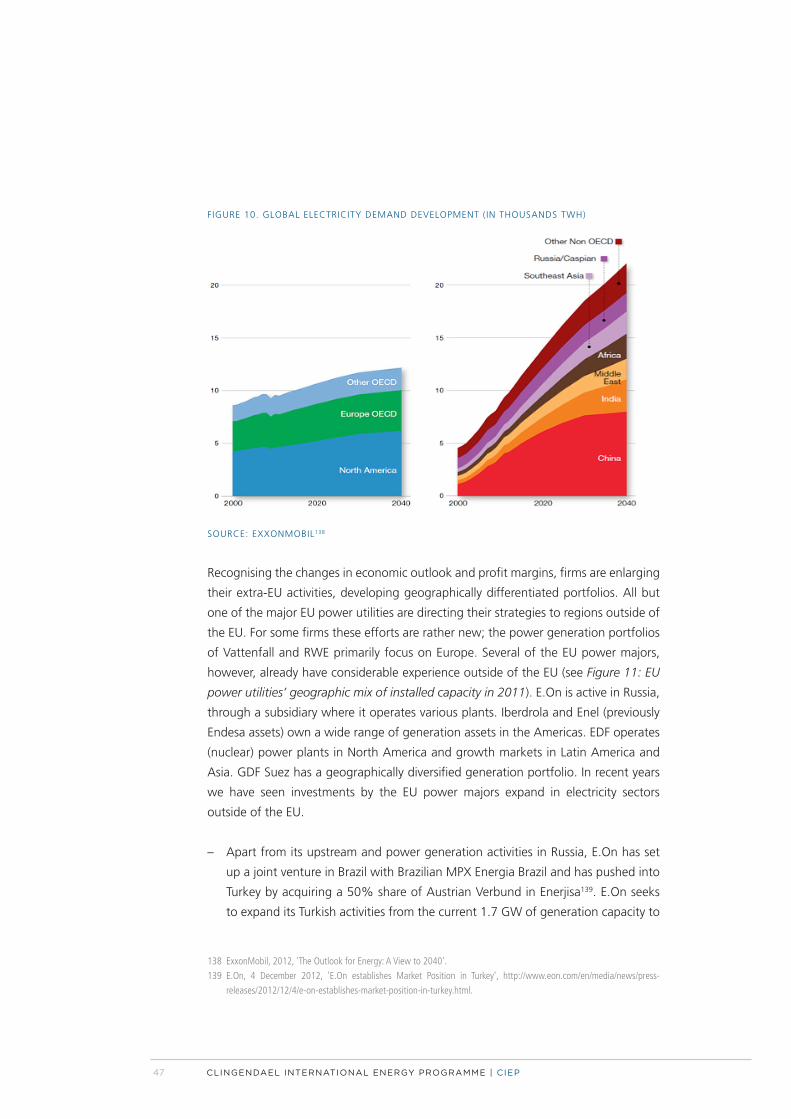
47
FIGURE 10. GLOBAL ELECTRICITY DEMAND DEVELOPMENT (IN THOUSANDS TWH)
SOURCE: EXXONMOBIL138
Recognising the changes in economic outlook and profit margins, firms are enlarging
their extra-EU activities, developing geographically differentiated portfolios. All but
one of the major EU power utilities are directing their strategies to regions outside of
the EU. For some firms these efforts are rather new; the power generation portfolios
of Vattenfall and RWE primarily focus on Europe. Several of the EU power majors,
however, already have considerable experience outside of the EU (see Figure 11: EU
power utilities’ geographic mix of installed capacity in 2011). E.On is active in Russia,
through a subsidiary where it operates various plants. Iberdrola and Enel (previously
Endesa assets) own a wide range of generation assets in the Americas. EDF operates
(nuclear) power plants in North America and growth markets in Latin America and
Asia. GDF Suez has a geographically diversified generation portfolio. In recent years
we have seen investments by the EU power majors expand in electricity sectors
outside of the EU.
– Apart from its upstream and power generation activities in Russia, E.On has set
up a joint venture in Brazil with Brazilian MPX Energia Brazil and has pushed into
Turkey by acquiring a 50% share of Austrian Verbund in Enerjisa139. E.On seeks
to expand its Turkish activities from the current 1.7 GW of generation capacity to
138 ExxonMobil, 2012, 'The Outlook for Energy: A View to 2040'.
139 E.On, 4 December 2012, 'E.On establishes Market Position in Turkey', http://www.eon.com/en/media/news/press-
releases/2012/12/4/e-on-establishes-market-position-in-turkey.html.
48 EUROPEAN POWER UTILITIES UNDER PRESSURE? ENERGY PAPER
8 GW of installed capacity by 2020, while in Brazil the joint venture with local
MPX seeks to add 20 GW of generation capacity by 2020140.
– Enel focuses 56% of its CAPEX on power generation activities in the Americas141.
Enel, through its Spanish subsidiary Endesa, is increasing its ownership share in
Enersis, a Chilean utility. Enersis has generation, transmission and distribution
assets throughout the major economies of the South American continent: Brazil,
Chile and Argentina, as well as Columbia and Peru. Up to 2017 Enel’s renewable
energy subsidiary, Enel Green Power will invest €4 billion in emerging economies142.
– EDF is limitedly active outside the EU marketplace, as it operates a number of
nuclear facilities in the US and China, hydropower facilities in Brazil and Laos, as
well as wind power generation assets in the US and Canada.
– GDF Suez aims to direct up to 50% of its capital expenditures in the medium term
to power generation and LNG facilities in Latin America, Asia and the Middle East,
a significant increase of the 30% it has dedicated to these regions to date143. In
2012, 90% of added power generation capacity took place in growth markets like
Brazil, Indonesia and Thailand144. Of the 10 GW of generation capacity the firm
currently has under construction, 80% is outside of the EU145.
– Iberdrola is another example, spending nearly €3 billion on the purchase of
Elekro Electricidade e Servicos SA, a Brazilian utility. Iberdrola is looking to
increase its already substantial share of generation capacity installed outside of
the European market.
– RWE is seeking to extend its business in Turkey from trade and sales into
generation activities with the development of a gas-fired power plant146. RWE
140 E.On, 2013, corporate website, http://www.eon.com/en/about-us/strategy/strategic-priorities/outside-europe/new-
markets.html.
141 Enel, corporate website, http://www.enel.com/en-gb/investors/our_business/industrial_plan/renewables/.
142 Financial Times, 17 April 2013, Enel Green Power Bullish on Expansion
143 GDF Suez, 5 December 2012, Press Release, http://www.gdfsuez.com/wp-content/uploads/2012/12/Accelerating_GDF_
SUEZ_transformation.pdf.
144 Reuters, 28 February 2013, 'GDF Suez Writes Down European Assets, Expands in Asia', http://www.reuters.com/
article/2013/02/28/gdfsuez-results-idUSL6N0BS2C920130228.
145 GDF Suez, March 2013, 'GDF Suez at a Glance', https://www.gdfsuez.com/wp-content/uploads/2013/03/GDF-SUEZ-at-
a-glance-FY2012.pdf.
146 Denizli power plant with an installed capacity of 775 MW, co-owned for 30% by Turkish energy company Turcas (RWE,
Annual Report, 2011).
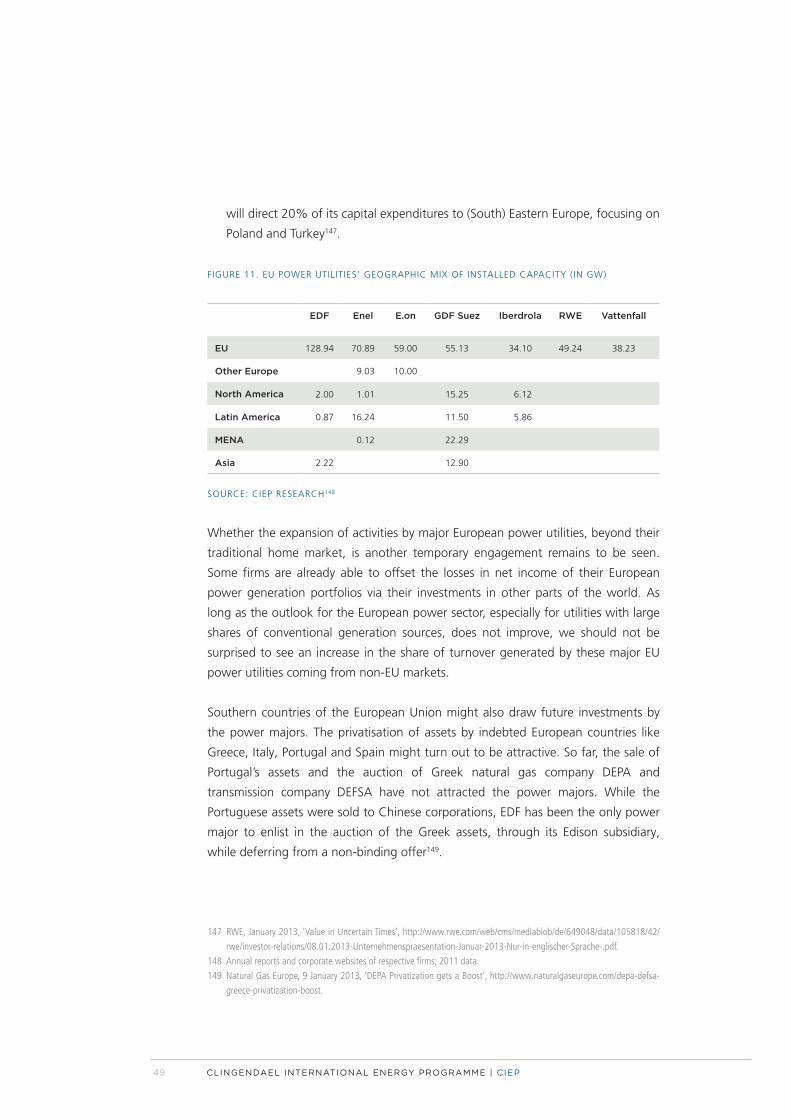
49
will direct 20% of its capital expenditures to (South) Eastern Europe, focusing on
Poland and Turkey147.
FIGURE 11. EU POWER UTILITIES’ GEOGRAPHIC MIX OF INSTALLED CAPACITY (IN GW)
EDF Enel E.on GDF Suez Iberdrola RWE Vattenfall
EU 128.94 70.89 59.00 55.13 34.10 49.24 38.23
Other Europe 9.03 10.00
North America 2.00 1.01 15.25 6.12
Latin America 0.87 16.24 11.50 5.86
MENA 0.12 22.29
Asia 2.22 12.90
SOURCE: CIEP RESEARCH148
Whether the expansion of activities by major European power utilities, beyond their
traditional home market, is another temporary engagement remains to be seen.
Some firms are already able to offset the losses in net income of their European
power generation portfolios via their investments in other parts of the world. As
long as the outlook for the European power sector, especially for utilities with large
shares of conventional generation sources, does not improve, we should not be
surprised to see an increase in the share of turnover generated by these major EU
power utilities coming from non-EU markets.
Southern countries of the European Union might also draw future investments by
the power majors. The privatisation of assets by indebted European countries like
Greece, Italy, Portugal and Spain might turn out to be attractive. So far, the sale of
Portugal’s assets and the auction of Greek natural gas company DEPA and
transmission company DEFSA have not attracted the power majors. While the
Portuguese assets were sold to Chinese corporations, EDF has been the only power
major to enlist in the auction of the Greek assets, through its Edison subsidiary,
while deferring from a non-binding offer149.
147 RWE, January 2013, 'Value in Uncertain Times', http://www.rwe.com/web/cms/mediablob/de/649048/data/105818/42/
rwe/investor-relations/08.01.2013-Unternehmenspraesentation-Januar-2013-Nur-in-englischer-Sprache-.pdf.
148 Annual reports and corporate websites of respective firms; 2011 data.
149 Natural Gas Europe, 9 January 2013, 'DEPA Privatization gets a Boost', http://www.naturalgaseurope.com/depa-defsa-
greece-privatization-boost.
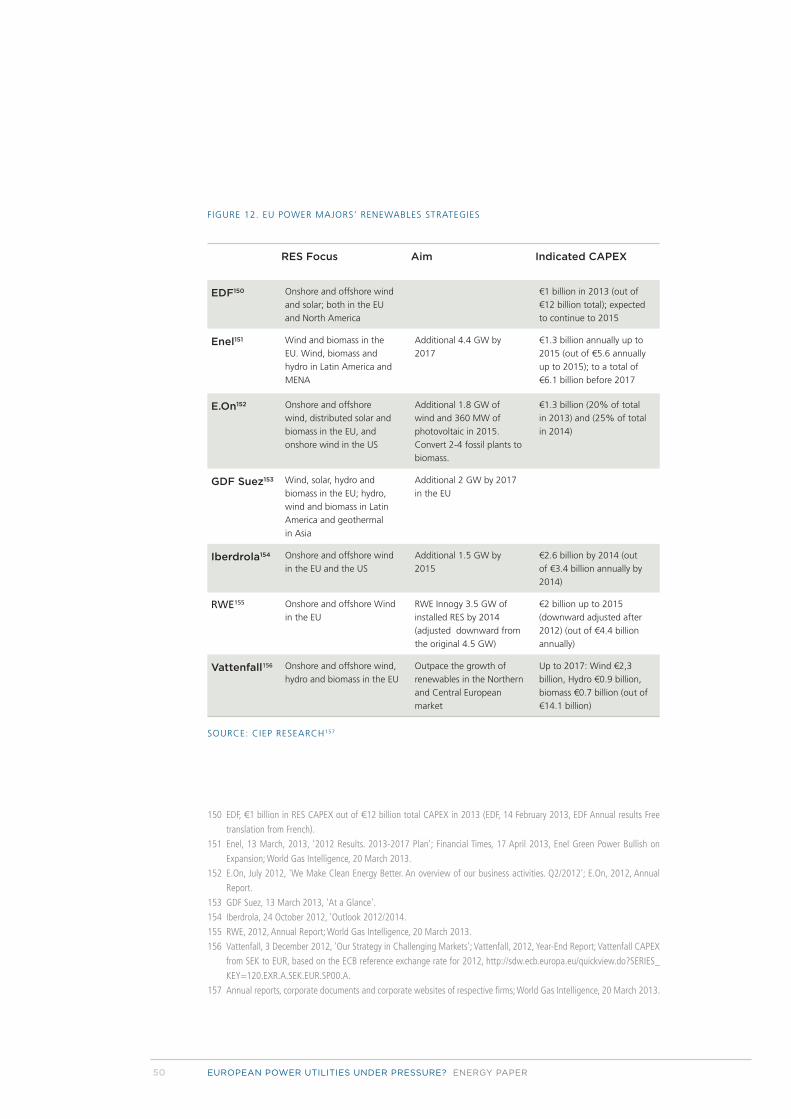
50 EUROPEAN POWER UTILITIES UNDER PRESSURE? ENERGY PAPER
FIGURE 12. EU POWER MAJORS’ RENEWABLES STRATEGIES
RES Focus Aim Indicated CAPEX
EDF150 Onshore and offshore wind and solar; both in the EU and North America
€1 billion in 2013 (out of €12 billion total); expected to continue to 2015
Enel151 Wind and biomass in the EU. Wind, biomass and hydro in Latin America and MENA
Additional 4.4 GW by 2017
€1.3 billion annually up to 2015 (out of €5.6 annually up to 2015); to a total of €6.1 billion before 2017
E.On152 Onshore and offshore wind, distributed solar and biomass in the EU, and onshore wind in the US
Additional 1.8 GW of wind and 360 MW of photovoltaic in 2015. Convert 2-4 fossil plants to biomass.
€1.3 billion (20% of total in 2013) and (25% of total in 2014)
GDF Suez153 Wind, solar, hydro and biomass in the EU; hydro, wind and biomass in Latin America and geothermal in Asia
Additional 2 GW by 2017 in the EU
Iberdrola154 Onshore and offshore wind in the EU and the US
Additional 1.5 GW by 2015
€2.6 billion by 2014 (out of €3.4 billion annually by 2014)
RWE155 Onshore and offshore Wind in the EU
RWE Innogy 3.5 GW of installed RES by 2014 (adjusted downward from the original 4.5 GW)
€2 billion up to 2015 (downward adjusted after 2012) (out of €4.4 billion annually)
Vattenfall156 Onshore and offshore wind, hydro and biomass in the EU
Outpace the growth of renewables in the Northern and Central European market
Up to 2017: Wind €2,3 billion, Hydro €0.9 billion, biomass €0.7 billion (out of €14.1 billion)
SOURCE: CIEP RESEARCH157
150 EDF, €1 billion in RES CAPEX out of €12 billion total CAPEX in 2013 (EDF, 14 February 2013, EDF Annual results Free
translation from French).
151 Enel, 13 March, 2013, '2012 Results. 2013-2017 Plan'; Financial Times, 17 April 2013, Enel Green Power Bullish on
Expansion; World Gas Intelligence, 20 March 2013.
152 E.On, July 2012, 'We Make Clean Energy Better. An overview of our business activities. Q2/2012'; E.On, 2012, Annual
Report.
153 GDF Suez, 13 March 2013, 'At a Glance'.
154 Iberdrola, 24 October 2012, 'Outlook 2012/2014.
155 RWE, 2012, Annual Report; World Gas Intelligence, 20 March 2013.
156 Vattenfall, 3 December 2012, 'Our Strategy in Challenging Markets'; Vattenfall, 2012, Year-End Report; Vattenfall CAPEX
from SEK to EUR, based on the ECB reference exchange rate for 2012, http://sdw.ecb.europa.eu/quickview.do?SERIES_
KEY=120.EXR.A.SEK.EUR.SP00.A.
157 Annual reports, corporate documents and corporate websites of respective firms; World Gas Intelligence, 20 March 2013.
51
GREENER PASTURES
Under the current subsidisation schemes EU power firms are likely to engage in
large-scale investments in RES (wind and solar). EU Member States will continue to
look for ways to entice investors in renewable capacity investments, as states seek to
attain their shares of renewable energy laid down in the legally binding EU 2020
policy. In the UK the Electricity Market Reform Bill (EMR) proposes to support
renewable power generation from offshore wind, in order to stimulate the
installation of vast shares of this generation type along Albion’s coastline. In an effort
to diversify their energy mix, to decrease dependency on expansive energy flows and
to diversify their economies, the southern European countries hit hardest by the
crisis aim to develop their RES potentials. Various initiatives in the Mediterranean
focus on extensive RES capacity158. Meanwhile, as 2020 is nearing, not all EU
Member States seem able to satisfy their RES objectives yet. Hence, the governments
of these Member States, e.g. France and the Netherlands, are expected to take
action in order to accommodate RES investments by creating a benevolent
investment climate.
The nourishing and further development of renewable business units is likely to
proceed, especially as renewable energy projects, certainly in the case of wind
energy, take on a much larger scale. Thereby these projects are becoming more akin
to the EU power majors’ traditional activities of large-scale centralised production. In
absolute figures, by comparing total 2011 installed (non-hydro) renewable capacities,
Iberdrola stands out with over 14 GW of installed capacity, followed by E.On, GDF
Suez, Enel, EDF and RWE, all having approximately 4-5 GW of installed capacity in
the same year, and Vattenfall with approximately 2 GW of renewable generation
capacity, apart from hydro. However, when comparing this to the relative shares of
renewable energy generation and the investment plans, we observe the following
(also see Figure 12: EU power majors’ renewables strategies).
– Iberdrola is on the vanguard, with over 50% of installed capacity in hydroelectric,
wind, solar or other RES generators. Seeking to solidify its position, Iberdrola has
unlisted its Iberdrola Renovables arm as a means to fully integrate the assets in its
portfolio. Iberdrola will invest approximately €1 billion annually for the year to
come in the development of renewable generation capacity, a significant
decrease from the €5.5 to €6 billion it has spent in the period 2009 to 2011159. In
158 E.g. the Mediterranean Renewable Energy Centre (MEDREC), http://www.medrec.org/en/index.php.
159 Iberdrola, 23 November 2012, 'Renewable Business Outlook', https://www.iberdrola.es/webibd/gc/prod/en/doc/
Perspectivas12_5.pdf.
52 EUROPEAN POWER UTILITIES UNDER PRESSURE? ENERGY PAPER
order to deal with setbacks in demand and renewable support, the firm is
strategically shedding assets.
– Vattenfall, as a Swedish state-owned enterprise, will be instrumental in the effort
of developing a low-carbon energy mix and thus a low-carbon portfolio for
Vattenfall, already producing about 25% of its electricity by its nuclear,
hydroelectric and other RES assets. In the medium term, Vattenfall envisions
directing 33% of capital expenditures to RES generation, predominantly wind160.
Nevertheless, the firm regards biomass as the cornerstone of its strategy to
obtain near-term CO2 reduction161.
– A significant share of Enel’s RES portfolio consists of hydroelectric assets and of
renewable generation assets, with significant RES projects in Spain and Latin
America. Enel expects the contribution from its renewable portfolio to grow
steadily by more than 50% in the next four years. In order to bring this about it
will spend €6.1 billion, more than half of which in the Americas162. Enel is looking
to reduce installed capacity in the mature Iberian and Italian markets by 11.9%
(to 52 GW) in the period 2012-2017. By the same year, 45% of earnings should
derive from RES and non-EU activities (up from 40% in 2012 and 11% in 2005).
The renewable capacity additions will consist for 66% of wind, 14% of solar, 9%
of hydro, 9% of geothermal and 2% of biomass assets163.
– RWE is seeking to catch up in the RES rat race, with capital expenditures equalling
about €1 billion annually for the years to come. Through its RWE Innogy
renewable arm plans and builds its renewable power generation facilities164. RWE
focuses primarily on wind and hydro, as it has voiced its intention to move away
from biomass165; 70% of RWE Innogy investments are focused on onshore and
offshore wind166.
160 Vattenfall, 3 May 2012, 'Vattenfall Q1 Results', http://www.vattenfall.com/en/file/Q1-2012-Presentation_20598590.pdf.
161 Vattenfall, 30 October 2012, 'Biomass and Waste Co-firing Experience at Vattenfall', Presentation by Daniel Seibt, Head
of Power Plant Engineering and Ronald Rost, Head of Sales.
162 Enel corporate website, http://www.enel.com/en-GB/investors/our_business/industrial_plan/renewables/.
163 Enel, 2012, Results and 2013-2017 plan.
164 RWE, September 2012, 'Factbook Renewable Energy', http://www.rwe.com/web/cms/mediablob/en/1464826/
data/86190/2/rwe-innogy/news-press/dl-factbook-new.pdf.
165 Bloomberg New Energy Finance, 26 February 2013, 'RWE to Sell German Biomass in Absence of Government Support',
http://about.bnef.com/bnef-news/rwe-to-sell-german-biomass-in-absence-of-government-support/.
166 RWE, 2012, 'Tapping Tomorrow’s Energy Sources Today, RWE Innogy', https://www.rwe.com/web/cms/mediablob/
en/592806/data/86642/2/rwe-innogy/sites/wind-onshore/RWE-Innogy-company-broschure.pdf.
53
– GDF Suez aims to increase its RES capacity by 2 GW in 2015167. GDF Suez devotes
the majority of its capital expenditures to investments in growth markets rather
than in the EU power sector. The renewable strategy of the firm prioritises
onshore wind and hydropower168.
– E.On aims to invest €1.6 billion of growth CAPEX in renewable investments169.
As part of the cost-cutting programme, E.On will reduce capital expenditures in
the medium term by at least 25%170. Given the size of the total portfolio, the
new share of renewables remain limited even if the 2015 aims are obtained;
hence it will be some time before RES become a core activity.
– EDF is likely to be instrumental in the French RES efforts. Through its recently
reintegrated subsidiary EDF Energies Nouvelles, it can become the foremost RES
player in France. In Italy EDF is predominantly active in hydroelectric generation
through its Edison assets. The French power utility is internationally active
through its renewable energy subsidy and aims to strengthen its position; in
2011 EDF invested €1.8 billion in renewable energy171.
When it comes to making investment decisions focused at stimulating growth in
profits, through increases in generation and market shares, the major EU power
utilities will increasingly look to expand their portfolios outside of conventional
power generation in Europe. While the firms take on different approaches, we do
see a differentiation along three lines: (i) the increased presence over the energy
value chain, investing in energy services, upstream and other non-power generation
activities; (ii) increased generation activities in growth markets in the Americas, Asia
and the Middle East; and (iii) increased investments in (subsidised) renewable energy
projects within and outside of the European market. In other words the EU power
majors choose to scale up traditional activities by expanding geographically and
realise that a change in the business models is needed, thereby developing new
activities.
167 GDF Suez, July 2012, 'GDF Suez at a Glance. A Unique Value Proposal Among the Industry', http://www.gdfsuez.com/
wp-content/uploads/2012/07/GDF-SUEZ-at-a-glance-060712-final.pdf.
168 GDF Suez, 13 March 2013, 'At a Glance'.
169 E.On, 2012, 'Interim Report III/2012'.
170 E.On, July 2012, 'We Make Clean Energy Better. An overview of our business activities. Q2/2012' http://www.eon.com/
content/dam/eon-com/%C3%9Cber%20uns/Globale-Einheiten/ECR%20Company%20Presentation%202012-Q2.pdf;
E.On, 2012, 'Interim Report III/2012'.
171 EDF, 2011, 'Facts and Figures'.
55
5 CONCLUSION
In this paper, we have sought to provide answers to two questions: firstly, what are
the sources of distress amongst power utilities in the Northwest EU market?
Secondly, how are the major EU power utilities responding? Developments in the
external environments of the major power utilities in the EU have affected their
outlook. Consequently, the companies are being forced to adapt to new
circumstances and adjust their strategies in order to move forward. Five years after
the outbreak of the financial crisis and still no sign of relief, the impact has turned
into a lasting one and as such has resulted in structural changes. Lower demand for
electricity, energy efficiency measures and the rapid expansion of renewable energy
complicate the opportunities for growth. This has strained the power majors’
business models, whereas in many cases, operating margins are under pressure and
the returns on investments are poor. In addition, the nuclear phase-outs have forced
firms into significant write-downs. This has forced strategic readjustment by the
major power firms. In the short term, this has brought about divestments from non-
core assets, the renegotiations of gas procurement contracts with suppliers and
budgetary cuts resulting in the resignation of employees.
Apart from the short-term alleviation measures, the major power utilities in the EU
electricity generation sector are going through a process of long-term strategic
re-orientation. It remains uncertain whether this implies that firms adapting to
changing practices will indeed secure future income. Perhaps the changing practices
driven by new technologies and new players will bring about new business models,
making the current ones redundant. The arrangements the power utilities are now
taking are characteristic for firms operating in an industry in distress. Shedding non-
core functions, becoming more nimble and focused are typical strategies in that
sense. At the same time, we see the EU power majors making inroads, if not
expanding their footprints, in business activities outside of the EU power sector.
In the process of strategic restructuring, we observe some trends. The strategies
employed by the EU power majors no longer seem focused on the perception of the
European continent as one single market in which firms hold dispersed portfolios.
Rather, these portfolios focus on specific regions. Whenever possible, firms seek to
diversify their portfolio towards markets outside of Europe, even outside the power
generation business. They are doing this in order to become less dependent on a
56 EUROPEAN POWER UTILITIES UNDER PRESSURE? ENERGY PAPER
market in which the fundamentals are characterised by declining demand due to
energy efficiency, substitution, increased shares of renewable energy and the
continued negative outlook. Regarding their activities in the European power sector,
the EU power majors will continue operations as long as economically feasible,
whereas, based on the current market conditions, for new investments the firms will
only invest in capacity with guaranteed incomes. For now, this is limited to
renewables, in which continued investment by the EU power majors is indeed
expected.
How this will fit in the policies of the EU and Member States remains to be seen. The
economic crisis has strained government budgets, while the costs of integrating
renewables are increasing. Firms are worried about the future, one that remains
unpredictable precisely because of policy, regulatory and technological
developments. A critical success factor for the continued success of the major
European power utilities may be to align the corporate and national interests.
When the storm settles, which will most likely occur only when the economic
recession starts to ebb away, demand for power will again increase. By then, the EU
power sector will have undergone restructuring. The ones to come out on top of this
process will presumably be those firms that were most successful in the adjustment
process. After a period of turbulence, it is likely that major merger and acquisition
activities between and among the major EU power utilities will take place. Then
another step will have been taken in the further consolidation of the EU power
sector.
When thinking about policy for the power sector in the European Union, it is
recommendable to bear in mind the developments central to this study. The
investment climate of the EU power sector has deteriorated due to a combination of
policy measures, economic stagnation and increased shares of RES. For businesses
looking for growth rather than consolidation of their position, the European power
market is in most instances an unwelcoming place. Investments in coal- or gas-fired
generation capacity are unlikely to be made for the time being, given the
unfavourable market conditions. The decreasing support for nuclear power
generation in the EU-15 will not lead to the construction of new nuclear plants
anytime soon, either, unless support policies such as those envisioned in the UK are
established. The only business case for investors to be made in EU power generation
seems to be in renewables – that is, as long as subsidies remain in place. Virtually all
the EU power majors have significant operations in markets other than the EU power
sector. Given the abovementioned, they are likely to increasingly divert their capital
allocations to other markets.

57
CIEP PAPER 2013 | 03
EUROPEAN POWER UTILITIES UNDER PRESSURE? HOW THE ELECTRICITY MAJORS ARE DEALING
WITH THE CHANGING INVESTMENT CLIMATE IN
THE EU POWER SECTOR
BY KOEN GROOT