Embed Size (px)
Citation preview

European Paper Packaging OverviewAn outlook for the next two years
Gleb SinavskisAssociate Economist, European Paper Packaging
European Paper Week ‐ Brussels23rd November, 2016
© Copyright 2016 RISI, Inc. | Proprietary Information

Gleb Sinavskis
• Previous experience in the financial services industry
• Masters in Economics from Uppsala University
• Co‐author of the European Packaging Paper 5‐Year and 15‐Year Forecasts
Associate Economist, European Paper Packaging
© Copyright 2016 RISI, Inc. | Proprietary Information 2

• Capacity• Demand• Trade• Production Costs
3
Containerboard
© Copyright 2016 RISI, Inc. | Proprietary Information

4© Copyright 2016 RISI, Inc. | Proprietary Information
Containerboard Expansion Projects for 2015‐2018
Company Location Country Capacity Year Quarter
Metsä Board Husum Mill Sweden 300 2015 2
Aviretta Ettringen Mill Germany 180 2015 2
Modern Karton Çorlu Mill Turkey 400 2015 3
Stora Enso Varkaus Mill Finland 300 2015 4
Parenco Renkum Mill Netherlands 385 2016 3
EcoPaper Zarnesti Mill Romania 280 2016 3
Rafael Hinojosa Sarria de Ter Mill Spain 90 2016 4Papierfabrik Schoellershammer Düren Mill Germany 250 2016 4
Pro-Gest Mantova Mill Italy 550 2017
Leipa Schwedt Mill Germany 450 2017 H2
International Paper Madrid Mill Spain 380 2017 H2
Heinzel Group Laakirchen Mill Austria 450 2017 H2
Hamburger Spremberg Mill (?) Germany or Turkey 450-493 2017 or 2018
Burgo Avezzano Mill Italy 200 (?) 2017 (?)
Schumacher Myszkow or Grudziadz Poland 250-300 2018

5© Copyright 2016 RISI, Inc. | Proprietary Information
Containerboard Expansion Projects 2015‐2018

Western European Containerboard Demand Growth is Slowing Down in 2016 and 2017
6© Copyright 2016 RISI, Inc. | Proprietary Information
[CELLREF][CELLREF] [CELLREF]
[CELLREF]
85%
86%
87%
88%
89%
90%
91%
92%
93%
94%
95%
18
20
22
24
26
28
30
2011 2012 2013 2014 2015 2016 2017 2018
MILLION TONNES
Capacity Demand (APC) Production Operating Rates

Western European Virgin Containerboard
7© Copyright 2016 RISI, Inc. | Proprietary Information
[CELLREF]
[CELLREF][CELLREF] [CELLREF]
3
3.5
4
4.5
5
5.5
2011 2012 2013 2014 2015 2016 2017 2018
MILLION TONNES
Capacity Demand Production
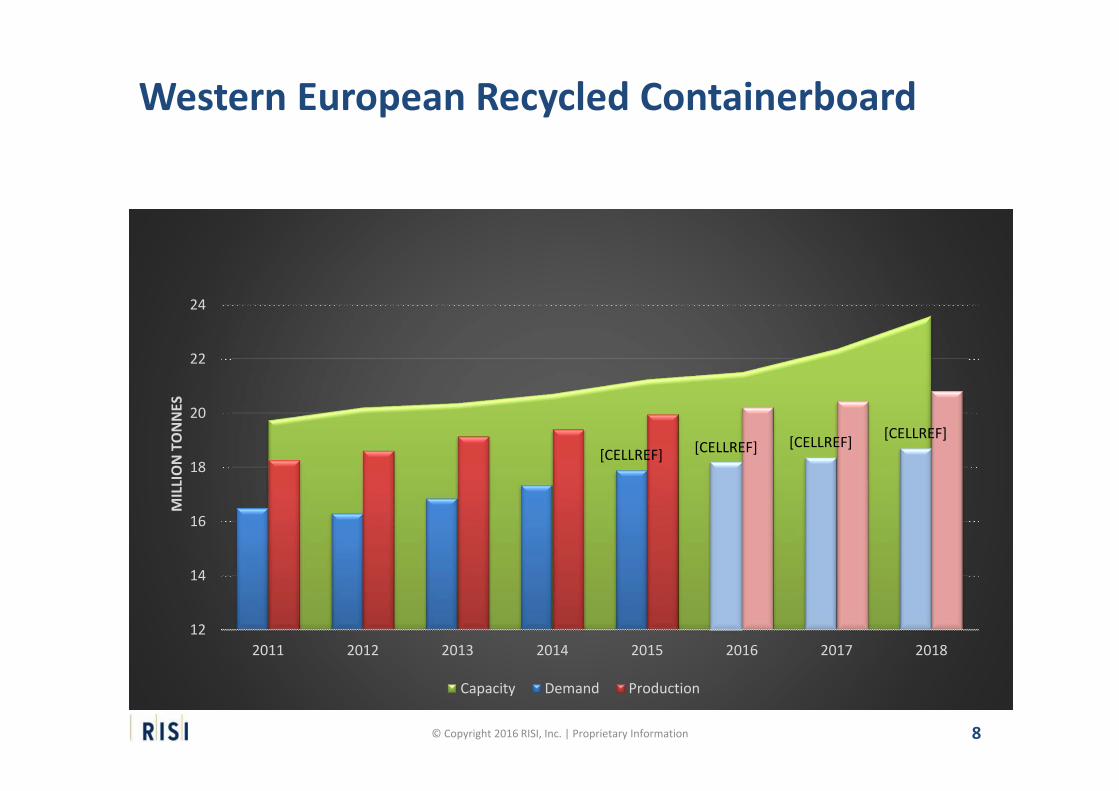
Western European Recycled Containerboard
8© Copyright 2016 RISI, Inc. | Proprietary Information
[CELLREF] [CELLREF] [CELLREF] [CELLREF]
12
14
16
18
20
22
24
2011 2012 2013 2014 2015 2016 2017 2018
MILLION TONNES
Capacity Demand Production

Trade trends in Western EuropeModerate Changes Going Forward
9© Copyright 2016 RISI, Inc. | Proprietary Information
‐1
‐0.5
0
0.5
1
1.5
2
2.5
2011 2012 2013 2014 2015 2016 2017 2018
MILLION TONNES
Net Exports of Containerboard
Virgin Containerboard Recycled containerboard

Western European Virgin Containerboard Operating Rates and Production Costs
10© Copyright 2016 RISI, Inc. | Proprietary Information
70%
75%
80%
85%
90%
95%
350
400
450
500
550
2011 2012 2013 2014 2015 2016 2017 2018
EURO
S PE
R TO
NNE
Virgin Containerboard
Production Costs Operating Rate
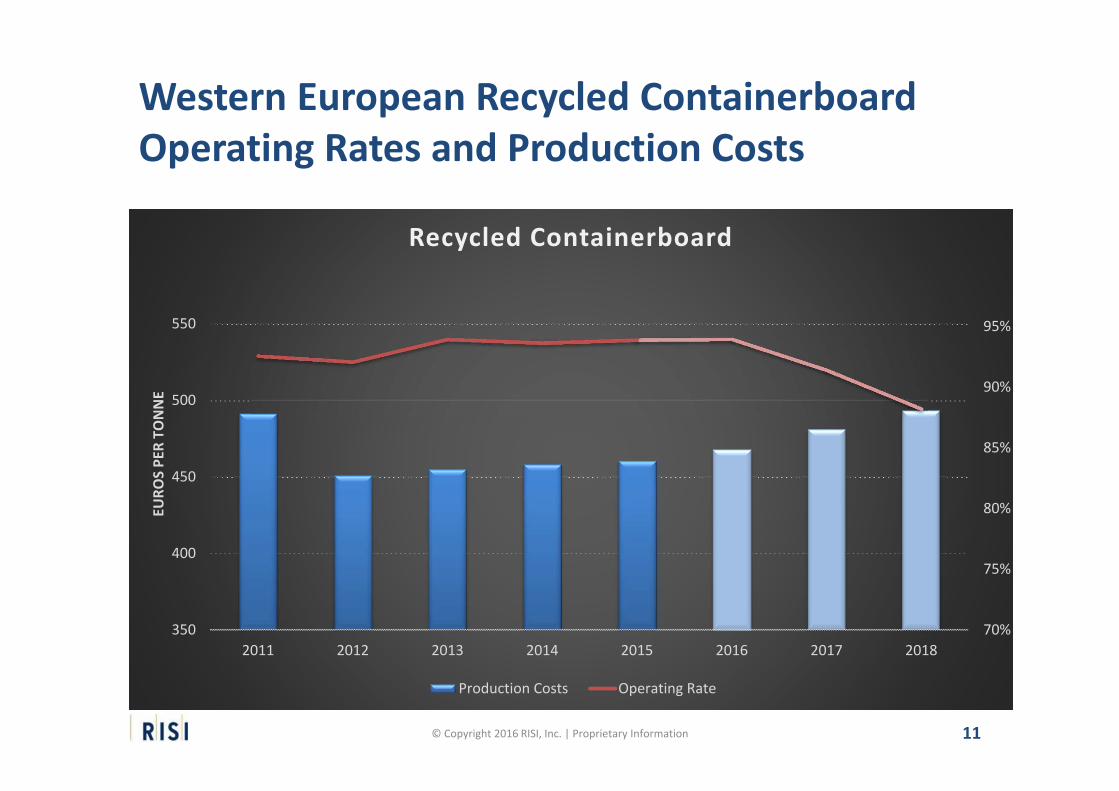
Western European Recycled Containerboard Operating Rates and Production Costs
11© Copyright 2016 RISI, Inc. | Proprietary Information
70%
75%
80%
85%
90%
95%
350
400
450
500
550
2011 2012 2013 2014 2015 2016 2017 2018
EURO
S PE
R TO
NNE
Recycled Containerboard
Production Costs Operating Rate

Containerboard in Emerging Europe
12© Copyright 2016 RISI, Inc. | Proprietary Information
[CELLREF][CELLREF]
[CELLREF][CELLREF]
5.5
6.5
7.5
8.5
9.5
10.5
11.5
12.5
13.5
2011 2012 2013 2014 2015 2016 2017 2018
MILLION TONNES
Overall Containerboard
Capacity Demand (APC) Production
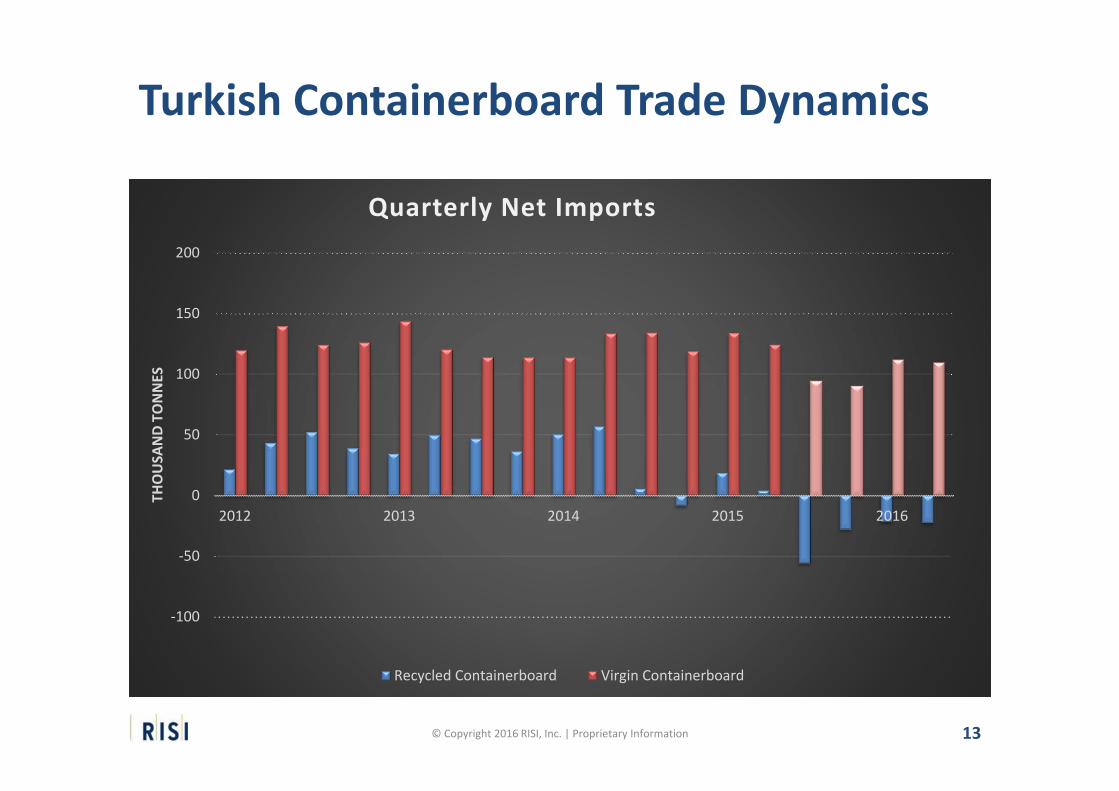
Turkish Containerboard Trade Dynamics
13© Copyright 2016 RISI, Inc. | Proprietary Information
‐100
‐50
0
50
100
150
200
2012 2013 2014 2015 2016
THOUSA
ND TONNES
Quarterly Net Imports
Recycled Containerboard Virgin Containerboard
• Demand• Production Costs• Trade
14
Cartonboard
© Copyright 2016 RISI, Inc. | Proprietary Information
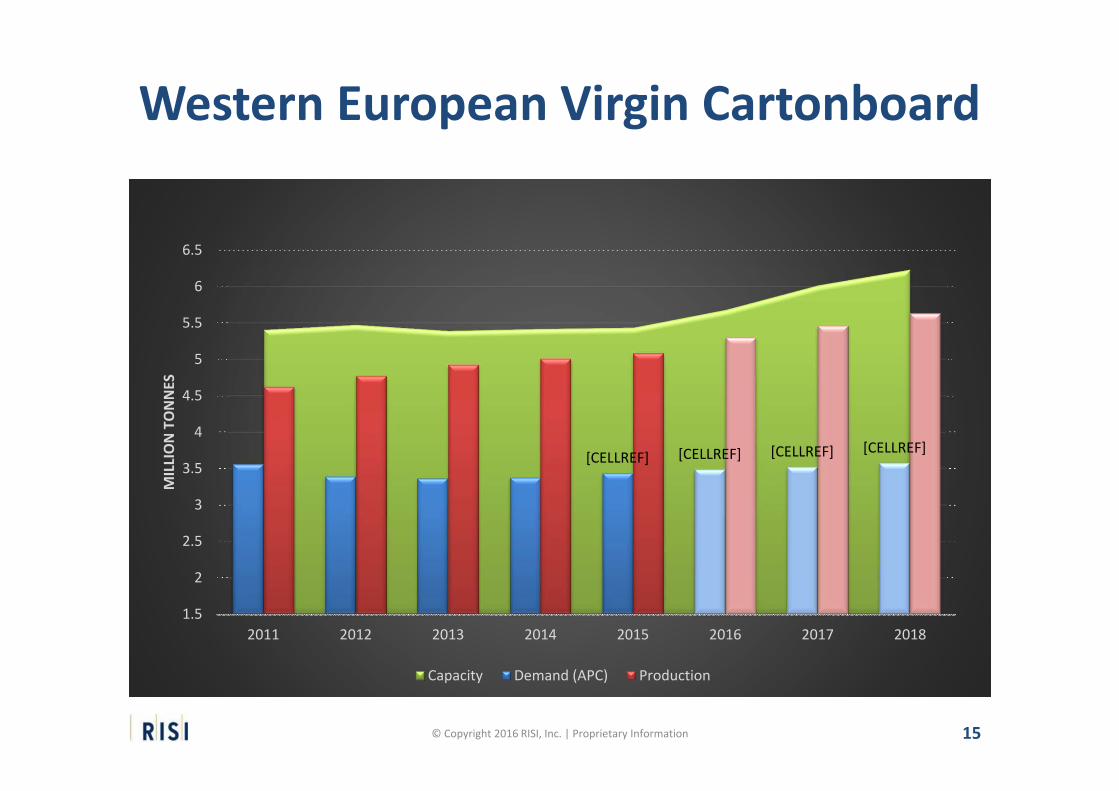
Western European Virgin Cartonboard
15© Copyright 2016 RISI, Inc. | Proprietary Information
[CELLREF] [CELLREF] [CELLREF] [CELLREF]
1.5
2
2.5
3
3.5
4
4.5
5
5.5
6
6.5
2011 2012 2013 2014 2015 2016 2017 2018
MILLION TONNES
Capacity Demand (APC) Production

Western European Recycled Cartonboard
16© Copyright 2016 RISI, Inc. | Proprietary Information
[CELLREF] [CELLREF] [CELLREF] [CELLREF]
1.2
1.7
2.2
2.7
3.2
3.7
4.2
2011 2012 2013 2014 2015 2016 2017 2018
MILLION TONNES
Capacity Demand (APC) Production
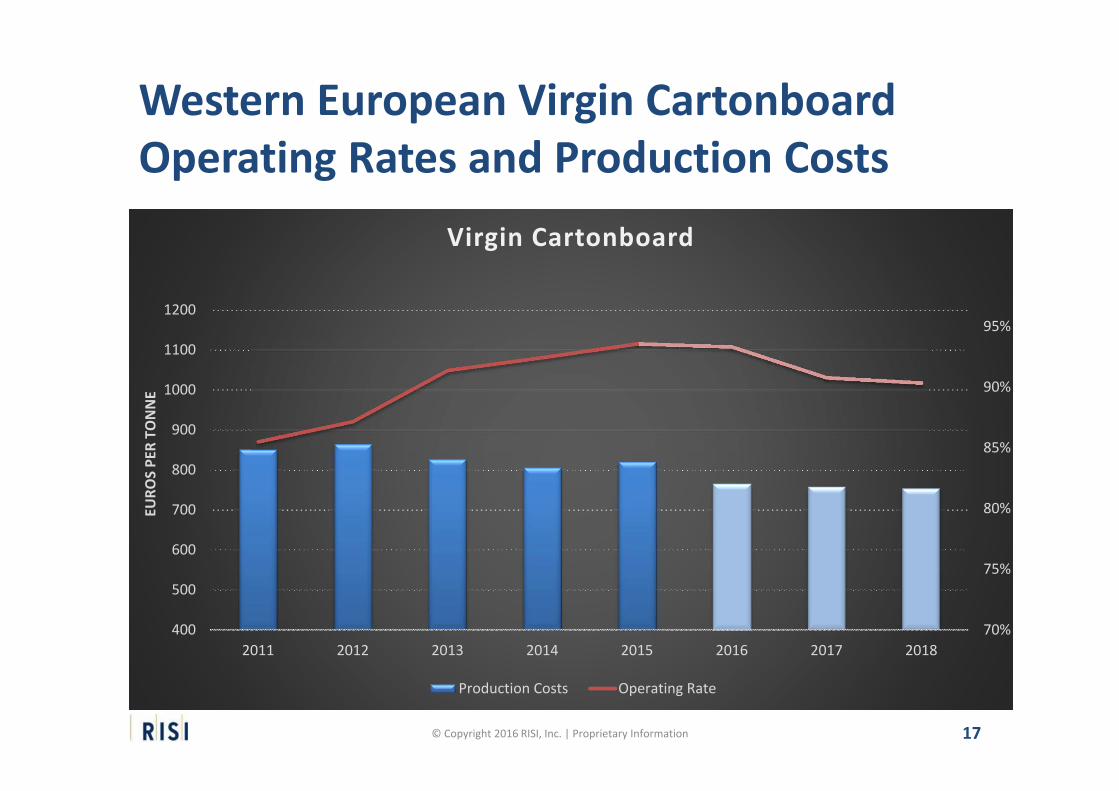
Western European Virgin Cartonboard Operating Rates and Production Costs
17© Copyright 2016 RISI, Inc. | Proprietary Information
70%
75%
80%
85%
90%
95%
400
500
600
700
800
900
1000
1100
1200
2011 2012 2013 2014 2015 2016 2017 2018
EURO
S PE
R TO
NNE
Virgin Cartonboard
Production Costs Operating Rate

Western European Recycled Cartonboard Operating Rates and Production Costs
18© Copyright 2016 RISI, Inc. | Proprietary Information
70%
75%
80%
85%
90%
95%
400
450
500
550
600
650
700
2011 2012 2013 2014 2015 2016 2017 2018
EURO
S PE
R TO
NNE
Recycled Cartonboard
Production Costs Operating Rate

Trade trends in Western Europe
19© Copyright 2016 RISI, Inc. | Proprietary Information
0
0.5
1
1.5
2
2.5
2011 2012 2013 2014 2015 2016 2017 2018
MILLION TONNES
Net exports of cartonboard
Virgin Cartonboard Recycled Cartonboard

20© Copyright 2016 RISI, Inc. | Proprietary Information
Thank you!