Embed Size (px)
Citation preview
Report EUR 26359 EN
2 0 1 4
Authored by PwC on behalf of JRC-IPTS
FINAL REPORT
European Hospital Survey: Benchmarking Deployment of eHealth Services (2012-2013)
Third Main Title Line Third Line

European Commission
Joint Research Centre
Institute for Prospective Technological Studies
Contact information
Address: Edificio Expo. c/ Inca Garcilaso, 3. E-41092 Seville (Spain)
E-mail: [email protected]
Tel.: +34 954488318
Fax: +34 954488300
http://ipts.jrc.ec.europa.eu
http://www.jrc.ec.europa.eu
Legal Notice
Neither the European Commission nor any person acting on behalf of the Commission
is responsible for the use which might be made of this publication.
Europe Direct is a service to help you find answers to your questions about the European Union
Freephone number (*): 00 800 6 7 8 9 10 11
(*) Certain mobile telephone operators do not allow access to 00 800 numbers or these calls may be billed.
A great deal of additional information on the European Union is available on the Internet.
It can be accessed through the Europa server http://europa.eu/.
JRC85852
EUR 26359 EN
ISBN 978-92-79-34781-8 (pdf)
ISSN 1831-9424 (online)
doi:10.2791/56790
Luxembourg: Publications Office of the European Union, 2014
© European Union, 2014
Reproduction is authorised provided the source is acknowledged.
Printed in Spain
1
Preface The "European Hospital Survey: Benchmarking deployment of e-Health services (2012–2013)" project gathered information on eHealth adoption and use in acute hospitals in all 28 EU Member States as well as Iceland and Norway (EU28+2). It was carried out on behalf of IPTS by Price Waterhouse Cooper (PwC) Luxembourg in cooperation with Global Data Collection Company (CDCC) which collected the data through a survey. This report prepared by PwC describes and analyses the main descriptive results of the 2012-2013 survey, which is the continuation of the eHealth benchmarking Phase III project carried out in 2010-2011 on behalf of the European Commission.
PwC EU Services Europees Economisch Samenwerkingsverband/Groupement Européen d’Intérêt Economique/ European Economic Interest Grouping Maatschappelijke zetel/Siège social/Registered office: Woluwe Garden, Woluwedal 18, B-1932 Sint-Stevens-Woluwe T: +32 (0)2 710 4211, F: +32 (0)2 710 4299, www.pwc.com BTW/TVA BE 0872.793.825 / RPR Brussel - RPM Bruxelles / INGBE16 3101 8056 4374 - BIC BBRUBEBB


1
1 Executive Summary 10
1.1 Main results from this study ........................................................................................................... 10
1.2 Policy recommendations ................................................................................................................... 11
1.3 Methodology recommendations .................................................................................................... 12
2 Introduction 14
2.1 Context of the study ............................................................................................................................ 14
2.1.1 Health, Healthcare and eHealth 14 2.1.2 The context of eHealth in the world 15 2.1.3 The context of eHealth in Europe 16 2.1.4 The need for monitoring ICT take-up in the healthcare sector 19
2.2 Objectives of the study ...................................................................................................................... 20
2.2.1 Overall objectives of the study 20 2.2.2 Specific objectives 20
2.3 Content of the final report ............................................................................................................... 20
3 Methodological approach 21
3.1 Overview .................................................................................................................................................... 21
3.2 Sampling methodology ...................................................................................................................... 22
3.2.1 Estimation of the overall universe 22 3.2.2 Implementation of a census strategy 22 3.2.3 Determination of sampling approach by country 23 3.2.4 Calculation of error margins and confidence intervals 23
3.3 The questionnaire ................................................................................................................................. 24
4 Results at European level 25
4.1 Overview .................................................................................................................................................... 25
4.1.1 The European eHealth capabilities 26
4.2 Block A. Characterisation of the surveyed hospitals........................................................... 31
4.2.1 IT budget vs. Hospital budget 31 4.2.2 Outsourcing of services 33 4.2.3 Presence of an IT strategic plan 35 4.2.4 Financial incentives for IT systems 37
4.3 Block B. ICT infrastructure ................................................................................................................ 41
4.3.1 Presence of a computerised system 41 4.3.2 Availability of external connections 44 4.3.3 Type of internet connection available 46 4.3.4 Wireless communications support types 49 4.3.5 Videoconferencing 52 4.3.6 Management of services 54
4.4 Block C. ICT applications.................................................................................................................... 56
4.4.1 Electronic Medical/Health/Patient Record 56 4.4.2 Patients’ online access to personal data 60 4.4.3 Picture Archiving and Communication System 63 4.4.4 Integration of systems and applications 65
Table of contents
2
4.5 Block D. Health Information Exchange .......................................................................................69
4.5.1 Exchange of clinical care information with other providers 69 4.5.2 Electronic exchange of laboratory results information 73 4.5.3 Exchange of medication lists information 78 4.5.4 Electronic exchange of radiology images and reports 80 4.5.5 Interoperability of systems 83 4.5.6 Standards supported by the EPR systems 88
4.6 Block E. Security and privacy ..........................................................................................................89
4.6.1 Regulations for the protection of patient data 89 4.6.2 Security measures 93 4.6.3 Rules governing access to patients’ medical data 96 4.6.4 Archive strategy for storage and disaster recovery 99 4.6.5 Timing for restoring information after loss of data 101
4.7 Block F. IT functionalities ............................................................................................................... 103
4.7.1 EMRs/EHRs/EPRs availability 104 4.7.2 Information input and viewing 105 4.7.3 Clinical decision support functionalities and usage 108 4.7.4 Health Information Exchange availability and usage 110 4.7.5 Telehealth availability and usage 112 4.7.6 Transition from paper-based to fully electronic systems 114
5 Results at national and regional level 118
5.1 Method of analysis ............................................................................................................................ 118
5.1.1 Creation of the eHealth indicators 118 5.1.2 Representation and analysis of the eHealth indicators 120 5.1.3 NUTS analysis 121
5.2 Results at national level ................................................................................................................. 122
5.2.1 Austria’s acute hospital eHealth profile 122 5.2.2 Belgium’s acute hospital eHealth profile 126 5.2.3 Bulgaria’s acute hospital eHealth profile 130 5.2.4 Croatia’s acute hospital eHealth profile 134 5.2.5 Cyprus’s acute hospital eHealth profile 137 5.2.6 The Czech Republic’s acute hospital eHealth profile 141 5.2.7 Denmark’s acute hospital eHealth profile 145 5.2.8 Estonia’s acute hospital eHealth profile 149 5.2.9 Finland’s acute hospital eHealth profile 153 5.2.10 France’s acute hospital eHealth profile 157 5.2.11 Germany’s acute hospital eHealth profile 161 5.2.12 Greece’s acute hospital eHealth profile 165 5.2.13 Hungary’s acute hospital eHealth profile 169 5.2.14 Iceland’s acute hospital eHealth profile 173 5.2.15 Ireland’s acute hospital eHealth profile 176 5.2.16 Italy’s acute hospital eHealth profile 180 5.2.17 Latvia’s acute hospital eHealth profile 185 5.2.18 Lithuania’s acute hospital eHealth profile 189 5.2.19 Luxembourg’s acute hospital eHealth profile 192 5.2.20 Malta’s acute hospitals eHealth profile 194 5.2.21 The Netherlands’s acute hospitals eHealth profile 197 5.2.22 Norway’s acute hospitals eHealth profile 201 5.2.23 Poland’s acute hospitals eHealth profile 205 5.2.24 Portugal’s acute hospitals eHealth profile 209 5.2.25 Romania’s acute hospitals eHealth profile 213 5.2.26 Slovakia’s acute hospitals eHealth profile 217 5.2.27 Slovenia’s acute hospitals eHealth profile 221 5.2.28 Spain’s acute hospitals eHealth profile 224 5.2.29 Sweden’s acute hospitals eHealth profile 229

3
5.2.30 United Kingdom's acute hospitals eHealth profile 233
6 Conclusions and recommendations 238
6.1 Comparison with other studies and surveys ........................................................................ 238
6.1.1 Studies used for comparison 238 6.1.2 Comparison in detail 238 6.1.3 Summary of the findings 241
6.2 Study Conclusions ............................................................................................................................. 242
6.2.1 Larger and public hospitals are at the forefront 242 6.2.2 Definite country differences are in place 242 6.2.3 eHealth can be slow to develop, but is quickly relied upon once in place 243 6.2.4 Gaps in terms of data security, data access and IT planning could easily be closed 243
6.3 Recommendations ............................................................................................................................. 244
6.3.1 Survey recommendations 244 6.3.2 Policy Recommendations 246
7 Appendix 278
7.1 Appendix 1: Abbreviations and acronyms ............................................................................. 278
7.2 Appendix 2: Glossary of terms and definitions ................................................................... 280
7.3 Appendix 3: Final questionnaire ................................................................................................. 285
7.4 Appendix 4: Details on the methodological approach .................................................... 303
7.4.1 Preparation of the questionnaire 303 7.4.2 Sampling methodology 304 7.4.3 Data gathering 309 7.4.4 Data analysis 309
7.5 Appendix 5: Awareness letters .................................................................................................... 310
7.6 Appendix 6: Acknowledgements ................................................................................................. 313
7.7 Appendix 7: Literature ..................................................................................................................... 314
7.7.1 Publications 314 7.7.2 Other online resources 315
4
Table of figures
Figure 1: European indicator benchmarking results, 2010/2012 .........................................................................................27 Figure 2: European analysis by ownership type ..............................................................................................................................29 Figure 3: European analysis by size of hospital ..............................................................................................................................30 Figure 4: Part of the Hospital Budget represented by the IT budget, European level results ............................31 Figure 5: Part of the Hospital Budget represented by the IT budget, Country-level results ...............................32 Figure 6: Part of the IT budget dedicated to outsourced services, European level results ..................................33 Figure 7: Part of the IT budget dedicated to outsourced services, Country-level results .....................................34 Figure 8: Availability of a formal IT Strategic Plan in the IT Department, European level
results .............................................................................................................................................................................................................35 Figure 9: Availability of a formal IT Strategic Plan in the IT Department, Country-level results .....................36 Figure 10: Financial incentives tied to information technology systems, European level results ...................37 Figure 11: Financial incentives tied to information technology systems, Country-level results ......................38 Figure 12: Financial incentives tied to information technology systems, results by ownership ......................39 Figure 13: Financial incentives tied to information technology systems, results by size .....................................40 Figure 14: Presence of a computer system in the hospital, European level results ................................................42 Figure 15: Presence of a computer system in the hospital, Country-level results....................................................43 Figure 16: Presence of an externally connected computer system, European level results ...............................44 Figure 17: Presence of an externally connected computer system, Country-level results ..................................45 Figure 18: Type of internet connection available in the hospital, European level results ....................................46 Figure 19: Type of internet connection available in the hospital, Country-level results .......................................47 Figure 20: Type of internet connection available in the hospital, results by ownership........................................48 Figure 21: Type of internet connection available in the hospital, results by size ......................................................49 Figure 22: Presence and type of wireless communication supported by the hospital, European level
results .............................................................................................................................................................................................................50 Figure 23: Presence and type of wireless communication supported by the hospital, Country-level results
.............................................................................................................................................................................................................................51 Figure 24: Presence of videoconferencing facilities in the hospital, European level results ..............................52 Figure 25: Presence of videoconferencing facilities in the hospital, Country-level results .................................53 Figure 26: Type of managed services, European level results ...............................................................................................54 Figure 27: Type of services currently outsourced, Country-level results ........................................................................55 Figure 28: Type of Electronic Medical Records (EMRs) / Electronic Health Records (EHRs) / Electronic
Patient Records (EPRs) used by the hospital, European level results .....................................................................57 Figure 29: Type of Electronic Medical Records (EMRs) / Electronic Health Records (EHRs) / Electronic
Patient Records (EPRs) used by the hospital, Country-level results ........................................................................58 Figure 30: Type of Electronic Medical Records (EMRs) / Electronic Health Records (EHRs) / Electronic
Patient Records (EPRs) used by the hospital, results by ownership ........................................................................59 Figure 31: Type of Electronic Medical Records (EMRs) / Electronic Health Records (EHRs) / Electronic
Patient Records (EPRs) used by the hospital, results by size .......................................................................................60 Figure 32: Availability of online access to electronic records by patients, European level results .................61 Figure 33: Availability of online access to electronic records by patients, Country-level results ....................62 Figure 34: Availability of Picture Archiving and Communication System (PACS), European level results ..63 Figure 35: Availability of Picture Archiving and Communication System (PACS), Country-level results .....64 Figure 36: Availability of Picture Archiving and Communication System (PACS), results by size ....................65 Figure 37: Type of computerised systems integrated by the hospital, European level results ........................66 Figure 38: Type of computerised systems integrated by the hospital, Country-level results ............................67 Figure 39: Exchange of clinical care information about patients, European level results....................................70 Figure 40 Exchange of clinical care information about patients, Country-level results ........................................71 Figure 41: Exchange of clinical care information about patients, results by ownership .......................................72 Figure 42: Exchange of clinical care information about patients, results by size .....................................................73 Figure 43: Electronic exchange of laboratory results information, European level results .................................74 Figure 44: Electronic exchange of laboratory results information, European level results .................................75 Figure 45: Exchange of laboratory results information, results by ownership ............................................................76
5
Figure 46: Exchange of laboratory results information, results by size ......................................................................... 77 Figure 47: Exchange of medication lists information, European level results ............................................................ 78 Figure 48: Exchange of medication lists information, European level results ............................................................ 79 Figure 49: Exchange of radiology images and reports, European level results ......................................................... 80 Figure 50: Exchange of radiology images and reports, Country-level results............................................................. 81 Figure 51: Exchange of radiology images and reports, results by ownership ............................................................. 82 Figure 52: Exchange of radiology images and reports, results by size ........................................................................... 83 Figure 53: Interoperability problems between departmental EPR systems, European level
results ............................................................................................................................................................................................................ 84 Figure 54: Interoperability problems between departmental EPR systems, Country-level
results ............................................................................................................................................................................................................ 85 Figure 55: Interoperability problems between departmental EPR systems, results by ownership ................ 86 Figure 56: Interoperability problems between departmental EPR systems, results by size............................... 87 Figure 57: Type of standards the hospital comply with, European level results ....................................................... 88 Figure 58: Presence of regulations to guarantee the security and privacy of electronic patient medical
data, European level results ............................................................................................................................................................ 90 Figure 59: Presence of regulations to guarantee the security and privacy of electronic patient medical
data, Country-level results ................................................................................................................................................................ 91 Figure 60: Presence of regulations to guarantee the security and privacy of electronic patient medical
data, results by ownership ................................................................................................................................................................ 92 Figure 61: Presence of regulations to guarantee the security and privacy of electronic patient medical
data, results by size .............................................................................................................................................................................. 93 Figure 62: Type of security measures taken to protect patient data, European level results .......................... 94 Figure 63: Type of security measures taken to protect patient data, Country-level results.............................. 95 Figure 64: Presence of clear and structured rules on accessing patients’ electronic medical data,
European level results ......................................................................................................................................................................... 96 Figure 65: Presence of clear and structured rules on accessing patients’ electronic medical data,
Country-level results............................................................................................................................................................................. 97 Figure 66: Presence of clear and structured rules on accessing patients’ electronic medical data, results
by ownership .............................................................................................................................................................................................. 98 Figure 67: Presence of clear and structured rules on accessing patients’ electronic medical data, results
by size ............................................................................................................................................................................................................ 98 Figure 68: Availability of an enterprise archive strategy for long-term storage and disaster recovery,
European level results ......................................................................................................................................................................... 99 Figure 69: Availability of an enterprise archive strategy for long-term storage and disaster recovery,
Country-level results.......................................................................................................................................................................... 100 Figure 70: Restoring capacity of critical clinical information system operations, European level results
......................................................................................................................................................................................................................... 101 Figure 71: Restoring capacity of critical clinical information system operations, Country-level results . 102 Figure 72: Availability of EMRs / EHRs / EPRs, European level results .......................................................................... 104 Figure 73: Availability of EMRs / EHRs / EPRs, Country-level results ............................................................................. 105 Figure 74: Availability of EHRs or other ICT systems allowing health professionals to view and/or to input
information, European level results ......................................................................................................................................... 106 Figure 75: Usage of EHRs or other ICT systems allowing health professionals to view and/or to input
information, European level results ......................................................................................................................................... 107 Figure 76: Availability of clinical decision support functionalities, European level results .............................. 108 Figure 77: Usage of clinical decision support functionalities, European level results ......................................... 109 Figure 78: Availability of Health Information Exchange (HIE) systems, European level results ................... 110 Figure 79: Usage of Health Information Exchange (HIE) systems, European level results .............................. 111 Figure 80: Availability of Telehealth systems, European level results .......................................................................... 112 Figure 81: Usage of Telehealth systems, European level results .................................................................................... 113 Figure 82: Position of the hospital in the transition from paper-based systems to a fully electronic
system, European level results ................................................................................................................................................... 114 Figure 83: Position of the hospital in the transition from paper-based systems to a fully electronic
system, Country-level results....................................................................................................................................................... 115

6
Figure 84: Position of the hospital in the transition from paper-based systems to a fully electronic
system, results by ownership ....................................................................................................................................................... 116 Figure 85: Position of the hospital in the transition from paper-based systems to a fully electronic
system, results by size ..................................................................................................................................................................... 117 Figure 86: Austrian acute hospital eHealth profile .................................................................................................................... 123 Figure 87: Austrian acute hospitals eHealth profile by ownership .................................................................................. 124 Figure 88: Austrian acute hospitals eHealth profile by size ................................................................................................ 125 Figure 89: Belgian acute hospital eHealth profile ...................................................................................................................... 127 Figure 90: Belgian acute hospitals eHealth profile by ownership .................................................................................... 128 Figure 91: Belgian acute hospitals eHealth profile by size .................................................................................................. 129 Figure 92: Bulgarian acute hospital eHealth profile ................................................................................................................. 131 Figure 93: Bulgarian acute hospitals eHealth profile by ownership type ................................................................... 132 Figure 94: Bulgarian acute hospitals eHealth profile by size ............................................................................................. 133 Figure 95: Croatian acute hospital eHealth profile ................................................................................................................... 135 Figure 96: Croatian acute hospitals eHealth profile by size ................................................................................................ 136 Figure 97: Cypriot acute hospital eHealth profile....................................................................................................................... 138 Figure 98: Cypriot acute hospitals eHealth profile by ownership .................................................................................... 139 Figure 99: Cypriot acute hospitals eHealth profile by size ................................................................................................... 140 Figure 100: Czech acute hospital eHealth profile ...................................................................................................................... 142 Figure 101: Czech acute hospitals eHealth profile by ownership .................................................................................... 143 Figure 102: Czech acute hospitals eHealth profile by size .................................................................................................. 144 Figure 103: Danish acute hospital eHealth profile .................................................................................................................... 146 Figure 104: Danish acute hospitals eHealth profile by ownership .................................................................................. 147 Figure 105: Danish acute hospitals eHealth profile by size ................................................................................................ 148 Figure 106: Difference between NUTS 2 level and country-level results ................................................................... 148 Figure 107: Estonian acute hospital eHealth profile ................................................................................................................ 150 Figure 108: Estonian acute hospitals eHealth profile by ownership .............................................................................. 151 Figure 109: Estonian acute hospitals eHealth profile by size ............................................................................................ 152 Figure 110: Finnish acute hospital eHealth profile ................................................................................................................... 154 Figure 111: Finnish acute hospitals eHealth profile by ownership ................................................................................. 155 Figure 112: Finnish acute hospitals eHealth profile by size ................................................................................................ 156 Figure 113: French acute hospital eHealth profile .................................................................................................................... 158 Figure 114: French acute hospitals eHealth profile by ownership .................................................................................. 159 Figure 115: French acute hospitals eHealth profile by size ................................................................................................. 160 Figure 116: German acute hospital eHealth profile ................................................................................................................. 162 Figure 117: German acute hospitals eHealth profile by ownership ............................................................................... 163 Figure 118: German acute hospitals eHealth profile by size .............................................................................................. 164 Figure 119: Difference between NUTS 1 level and country-level results ................................................................... 164 Figure 120: Greek acute hospital eHealth profile ...................................................................................................................... 166 Figure 121: Greek acute hospitals eHealth profile by ownership .................................................................................... 167 Figure 122: Greek acute hospitals eHealth profile by size ................................................................................................... 168 Figure 123: Hungarian acute hospital eHealth profile ............................................................................................................ 170 Figure 124: Hungarian acute hospitals eHealth profile by ownership .......................................................................... 171 Figure 125: Hungarian acute hospitals eHealth profile by size ........................................................................................ 172 Figure 126: Icelandic acute hospital eHealth profile................................................................................................................ 174 Figure 127: Icelandic acute hospitals eHealth profile by ownership ............................................................................. 175 Figure 128: Irish acute hospital eHealth profile .......................................................................................................................... 177 Figure 129: Irish acute hospitals eHealth profile by ownership ........................................................................................ 178 Figure 130: Irish acute hospitals eHealth profile by size ...................................................................................................... 179 Figure 131: Italian acute hospital eHealth profile ..................................................................................................................... 181 Figure 132: Italian acute hospitals eHealth profile by ownership ................................................................................... 182 Figure 133: Italian acute hospitals eHealth profile by size.................................................................................................. 183 Figure 134: Difference between NUTS 2 level and country-level results ................................................................... 184 Figure 135: Latvian acute hospital eHealth profile ................................................................................................................... 186 Figure 136: Latvian acute hospitals eHealth profile by ownership................................................................................. 187

7
Figure 137: Latvian acute hospitals eHealth profile by size ............................................................................................... 188 Figure 138: Lithuanian acute hospital eHealth profile ............................................................................................................ 190 Figure 139: Lithuanian acute hospitals eHealth profile by size ........................................................................................ 191 Figure 140: Luxembourgish acute hospital eHealth profile ................................................................................................. 193 Figure 141: Maltese acute hospital eHealth profile .................................................................................................................. 195 Figure 142: Dutch acute hospital eHealth profile ...................................................................................................................... 198 Figure 143: Dutch acute hospitals eHealth profile by ownership .................................................................................... 199 Figure 144: Dutch acute hospitals eHealth profile by size ................................................................................................... 200 Figure 145: Norwegian acute hospital eHealth profile ........................................................................................................... 202 Figure 146: Norwegian acute hospitals eHealth profile by ownership ......................................................................... 203 Figure 147: Norwegian acute hospitals eHealth profile by size........................................................................................ 204 Figure 148: Polish acute hospital eHealth profile ...................................................................................................................... 206 Figure 149: Polish acute hospitals eHealth profile by ownership type ......................................................................... 207 Figure 150: Polish acute hospitals eHealth profile by size .................................................................................................. 208 Figure 151: Portuguese acute hospital eHealth profile .......................................................................................................... 210 Figure 152: Portuguese acute hospitals eHealth profile by ownership ........................................................................ 211 Figure 153: Portuguese acute hospitals eHealth profile by size ...................................................................................... 212 Figure 154: Difference between NUTS 2 level and country-level results ................................................................... 213 Figure 155: Romanian acute hospital eHealth profile ............................................................................................................. 214 Figure 156: Romanian acute hospitals eHealth profile by ownership ........................................................................... 215 Figure 157: Romanian acute hospitals eHealth profile by size ......................................................................................... 216 Figure 158: Slovakian acute hospital eHealth profile .............................................................................................................. 218 Figure 159: Slovakian acute hospitals eHealth profile by ownership ............................................................................ 219 Figure 160: Slovakian acute hospitals eHealth profile by size .......................................................................................... 220 Figure 161: Slovenian acute hospital eHealth profile.............................................................................................................. 222 Figure 162: Slovenian acute hospitals eHealth profile by size .......................................................................................... 223 Figure 163: Spanish acute hospital eHealth profile .................................................................................................................. 225 Figure 164: Spanish acute hospitals eHealth profile by ownership ................................................................................ 226 Figure 165: Spanish acute hospitals eHealth profile by size .............................................................................................. 227 Figure 166: Swedish acute hospital eHealth profile ................................................................................................................. 230 Figure 167: Swedish acute hospitals eHealth profile by ownership ............................................................................... 231 Figure 168: Swedish acute hospitals eHealth profile by size ............................................................................................. 232 Figure 169: United Kingdom acute hospital eHealth profile ............................................................................................... 234 Figure 170: United Kingdom acute hospitals eHealth profile by ownership ............................................................. 235 Figure 171: United Kingdom acute hospitals eHealth profile by size ............................................................................ 236 Figure 172: Difference between NUTS 1 level and country-level results ................................................................... 236 Figure 173: Estimation of the acute care hospitals universe ............................................................................................. 305

8
List of tables
Table 1: Interviews completed by country ..........................................................................................................................................25 Table 2: Breakdown of the sample by ownership type of hospitals ..................................................................................27 Table 3: Breakdown of the sample by size of hospitals ............................................................................................................28 Table 4: Question items used for the eHealth indicators ...................................................................................................... 119 Table 5: Source questions for the eHealth profile composite indicators ..................................................................... 121 Table 6: NUTS Level of analysis per country................................................................................................................................. 122 Table 7: Austrian breakdown by size of hospital ........................................................................................................................ 122 Table 8: Austrian breakdown by ownership type ........................................................................................................................ 122 Table 9: Belgian breakdown by size of hospital .......................................................................................................................... 126 Table 10: Belgian breakdown by ownership type ....................................................................................................................... 126 Table 11: Bulgarian breakdown by size of hospital .................................................................................................................. 130 Table 12: Bulgarian breakdown by ownership type .................................................................................................................. 130 Table 13: Croatian breakdown by size of hospital .................................................................................................................... 134 Table 14: Croatian breakdown by ownership type .................................................................................................................... 134 Table 15: Cypriot breakdown by size of hospital ........................................................................................................................ 137 Table 16: Cypriot breakdown by ownership type ........................................................................................................................ 137 Table 17: Czech breakdown by size of hospital .......................................................................................................................... 141 Table 18: Czech breakdown by size of hospital .......................................................................................................................... 141 Table 19: Danish breakdown by size of hospital ........................................................................................................................ 145 Table 20: Danish breakdown by ownership type ........................................................................................................................ 145 Table 21: Estonian breakdown by size of hospital .................................................................................................................... 149 Table 22: Estonian breakdown by ownership type .................................................................................................................... 149 Table 23: Finnish breakdown by size of hospital ........................................................................................................................ 153 Table 24: Finnish breakdown by ownership type ........................................................................................................................ 153 Table 25: French breakdown by size of hospital ........................................................................................................................ 157 Table 26: French breakdown by ownership type ........................................................................................................................ 157 Table 27: German breakdown by size of hospital...................................................................................................................... 161 Table 28: German breakdown by ownership type ...................................................................................................................... 161 Table 29: Greek breakdown by size of hospital .......................................................................................................................... 165 Table 30: Greek breakdown by ownership type........................................................................................................................... 165 Table 31: Hungarian breakdown by size of hospital ................................................................................................................ 169 Table 32: Hungarian breakdown by ownership type ................................................................................................................ 169 Table 33: Icelandic breakdown by size of hospital .................................................................................................................... 173 Table 34: Icelandic breakdown by ownership type .................................................................................................................... 173 Table 35: Irish breakdown by size of hospital .............................................................................................................................. 176 Table 36: Irish breakdown by ownership type .............................................................................................................................. 176 Table 37: Italian breakdown by size of hospital ......................................................................................................................... 180 Table 38: Italian breakdown by ownership type ......................................................................................................................... 180 Table 39: Latvian breakdown by size of hospital ....................................................................................................................... 185 Table 40: Latvian breakdown by ownership type ....................................................................................................................... 185 Table 41: Lithuanian breakdown by size of hospital ................................................................................................................ 189 Table 42: Lithuanian breakdown by ownership type ................................................................................................................ 189 Table 43: Luxembourgish breakdown by size of hospital ..................................................................................................... 192 Table 44: Luxembourgish breakdown by ownership type ..................................................................................................... 192 Table 45: Maltese breakdown by size of hospital ...................................................................................................................... 194 Table 46: Maltese breakdown by ownership type ...................................................................................................................... 194 Table 47: Dutch breakdown by size of hospital .......................................................................................................................... 197 Table 48: Dutch breakdown by ownership type .......................................................................................................................... 197 Table 49: Norwegian breakdown by size of hospital ............................................................................................................... 201 Table 50: Norwegian breakdown by ownership type ............................................................................................................... 201 Table 51: Polish breakdown by size of hospital .......................................................................................................................... 205 Table 52: Polish breakdown by ownership type .......................................................................................................................... 205

9
Table 53: Portuguese breakdown by size of hospital .............................................................................................................. 209 Table 54: Portuguese breakdown by ownership type .............................................................................................................. 209 Table 55: Romanian breakdown by size of hospital ................................................................................................................. 213 Table 56: Romanian breakdown by ownership type ................................................................................................................. 213 Table 57: Slovakian breakdown by size of hospital .................................................................................................................. 217 Table 58: Slovakian breakdown by ownership type .................................................................................................................. 217 Table 59: Slovenian breakdown by size of hospital .................................................................................................................. 221 Table 60: Slovenian breakdown by ownership type .................................................................................................................. 221 Table 61: Spanish breakdown by size of hospital ...................................................................................................................... 224 Table 62: Spanish breakdown by ownership type ...................................................................................................................... 224 Table 63: Swedish breakdown by size of hospital ..................................................................................................................... 229 Table 64: Swedish breakdown by ownership type ..................................................................................................................... 229 Table 65: United Kingdom breakdown by size of hospital ................................................................................................... 233 Table 66: United Kingdom breakdown by ownership type ................................................................................................... 233 Table 67: Sampling approach by country ........................................................................................................................................ 306 Table 68: Elements for proportional sampling ............................................................................................................................. 307 Table 69: Sampling and error margins by country .................................................................................................................... 308
European Hospital Survey: Benchmarking deployment of eHealth services (2012-2013)
10
1 Executive Summary
01 The objective of this survey, conducted by PwC Luxembourg in cooperation with GDCC, was to benchmark
the level of eHealth use in acute hospitals in all 27 EU Member States and Croatia, Iceland and Norway.
The total geographical scope is hereafter referred to as EU27+3. This study builds upon previous studies in
the area, most recently the eHealth Benchmarking III study of 20111, hereafter referred to as “the previous
study”.
02 The survey targeted the Chief Information Officers (CIOs) of the acute hospitals. We used Computer-Aided
Telephone Interviewing (CATI) with native-speaking interviewers. In total, we called 26,550 healthcare
establishments within EU27+3. Of the 26,550 establishments, 5,424 qualified as acute care hospitals and
of this number, 1,753 hospitals completed the interview.
03 We analysed the results by hospital size (i.e. number of beds, categorised) and by ownership type (public,
private not for profit, private). At a national level, we analysed a number of eHealth take-up indicators and
for certain countries, performed an analysis at regional level based on the NUTS2 classification.
1.1 Main results from this study
eHealth uptake increases slightly
04 Overall, eHealth uptake in the EU27+3 countries has increased only slightly since the previous study.
Notable growth areas are PACS and wireless infrastructures. PACS usage in hospitals has increased from
61% in the previous study to 70% today. Wireless infrastructure usage has similarly grown from 54% in
the previous study to 66% in this study.
05 Areas which have not shown considerable progress are: EMR/EHR/EPR3 usage, health information exchange
and patient online access. More than 80% of the surveyed hospitals use an EMR/EHR/EPR system, which
represents no change over the previous study. In addition, 90% of the surveyed hospitals still do not allow
patients to access their EPRs online (compared to 95% in the previous study). More than 50% of the
surveyed hospitals exchange clinical care information as well as laboratory results, whereas 46% did not
experience interoperability problems.
06 However, this slight growth trend is uneven and a number of European countries have failed to register
any meaningful growth or have actually fallen behind in their eHealth scores. This might be explained by
the larger sample size used in this study. In fact, sample size has almost doubled in relation to the
previous study (from n=906 to n=1753), which may simply have led to more realistic results. However, the
uneven growth may also be a temporary setback due to the effects of austerity across much of Europe.
1 Deloitte & Ipsos (2011), ‘eHealth Benchmarking III, SMART 2009/0022, Final Report’, Deloitte & Ipsos, April 2011, Belgium. 2 The NUTS classification (Nomenclature of territorial units for statistics) is a hierarchical system dividing up the economic territory
of the EU according to an established common classification of territorial units. Its purpose is to facilitate the collection, transmission and publication of harmonised regional statistics in the European Union. The establishment of the classification system ensures the stability of regional statistics over time and defines the procedure for any future amendments.
3 EMR: Electronic Medical Records, EHR: Electronic Health Records, EPR: Electronic Patient Records.

European Hospital Survey: Benchmarking Deployment of eHealth Services (2012-2013)
11
Size and ownership type play a role
07 Larger hospitals and public hospitals have a clear advantage as regards the development, take-up and
roll-out of eHealth capabilities. This is no surprise as such institutions have larger economies of scale and
greater in-house expertise in terms of vital eHealth skill sets. Larger hospitals (as well as public hospitals)
are also generally better-equipped than private establishments and small and medium sized hospitals
with respect to the type of internet connection they use. Overall, these factors allow larger hospitals to
become eHealth hubs which can not only develop and roll out eHealth practices and solutions more
quickly, but also lead with respect to the quality of and reliance on eHealth capabilities.
Nordic countries are strongest
08 Nordic countries continue to be the overall leaders in eHealth across the EU27+3, with consistent
leadership across a range of eHealth indicators. Conversely, the lesser performing regions are within
Eastern and Southern Europe. This remains an unchanged aspect of the eHealth situation in Europe and
one that has persisted for a period of time.
When eHealth is in place, it’s used
09 Hospitals which have eHealth functionalities mostly use them routinely. This is important because, overall,
it justifies the investment into eHealth. For example, telehealth is only implemented to a minor extent and
is mostly available for holding consultations with other healthcare practitioners (31%). However, when
telehealth capabilities are implemented, they are mostly used (on average usage rates were
approximately 90% of the surveyed hospitals).
Governance can be improved
10 Despite having apparently high rates for data security, data privacy and access rules and regulations, the
gap should be much smaller. While 85% of hospitals surveyed have clear rules for accessing patients’
electronic medical data, and more than 90% of hospitals surveyed have regulations to guarantee the
privacy and security of data, either at national (58%), regional (27%) or hospital level (66%), we would
have expected results in excess of this, considering that these should be mandatory areas. Also, only a
small majority (57%) of European hospitals have an IT strategic plan, which does not bode well for
efficient implementation of eHealth capabilities.
Sophistication level, IT budgets and interoperability issues are related
11 Hospitals situated in Nordic countries, larger hospitals and public hospitals are the categories of hospitals
most likely to encounter interoperability problems and there is a relationship between sophistication, IT
budgets and interoperability problems. Nordic countries exemplify this. Despite being the most advanced in
terms of implementation of computerised systems or applications, and also devoting a generally higher
part of their budget to IT than other countries, they also have the greatest level of interoperability
problems.
1.2 Policy recommendations
Benefit from the advantages of larger hospitals
12 As the statistics have demonstrated, larger hospitals have clear advantages in their use and deployment
of eHealth capabilities. They are more likely to introduce and make use of eHealth capabilities, as well as
exchange data electronically, regardless of the data involved. In the previous eHealth benchmarking study
the authors noted in their conclusion to put forward the concept of building relationships between small
and non-university hospitals with large, research-oriented or university hospitals.
13 We concur with this idea, but suggest examining how this can be leveraged on in a more practical way,
particularly with respect to eHealth infrastructure and assets. For example, we believe it may be worth
investigating the possibility of assigning national ‘centre of excellence’ status to larger hospitals with

European Hospital Survey: Benchmarking Deployment of eHealth Services (2012-2013)
12
advanced eHealth capabilities and assign incentives for these hospitals to improve upon and develop
eHealth further – particularly when these eHealth capabilities can be extended to other hospitals.
Accelerate efforts to overcome interoperability issues
14 The concepts of interoperability and electronically exchangeable patient data are not new. They were
noted already in the 2004 Action Plan4, the 2006 Report of the Unit ICT for Health in collaboration with the
i2010 sub-group on eHealth5 and the 2008 Recommendation on interoperability6 amongst others.
Interoperability was also raised in the 2010 benchmarking study7 as an ongoing issue, and cited again in
the 2011 Cross-border Healthcare directive8, which stated that ‘widely different and incompatible formats
and standards are used for provision of healthcare using ICTs throughout the Union, creating both
obstacles to this mode of cross-border healthcare provision and possible risks to health protection’.
Interoperability remains a clear issue of concern based on our observations within this study.
15 Deliverables from various EU efforts (epSOS9, CALLIOPE10 and HITCH11) should be evident from 2014
onwards, and will hopefully be reflected in the corresponding benchmark study for that period. However,
based on the long duration of interoperability issues with the eHealth sector, it may be time for the EU to
consider bolder action in relation to interoperability issues if no substantive progress is evident by that
time.
Close the governance gaps in data security, privacy, access and hospital ICT strategy planning
16 The Commission is currently working on a root and branch review of the EU’s data protection rules, and
therefore has a golden opportunity to create a regime which will be conducive to eHealth capability
development. Therefore, it is to be hoped that the ultimate output of this review will address the high-level
concerns in relation to data exchange, privacy and access. These parallel trends should produce a
functioning regulatory and technical environment which is conducive to a much greater development and
roll-out of eHealth capabilities.
17 However, at the hospital level there must be a concentrated push to close all current gaps in security,
guaranteeing the privacy and security of data and accessing patients’ electronic medical data . By contrast
to infrastructure and ICT investment, this is a relatively low cost area which can be addressed by Member
States (with whom the responsibility lies to implement the provisions of the Cross-border healthcare
directive for example) simply by enforcing the requirements of the Directive.
18 Similarly, the current low levels of strategy planning need to be improved, and all hospitals should either
have an ICT strategy plan of their own, or at least be incorporated under regional and/or national ICT
strategy plans if the hospital is below a certain threshold in terms of IT staffing, budgets, etc.
19 Promotion of specific Healthcare ICT governance, covering eHealth as a major component, derived from
existing best practices in both the healthcare sector and the ICT industry, could assist in the improvement
of this area and closure of the governance gap.
1.3 Methodology recommendations
20 By default, we have carried out the survey via Computer-Aided Telephone Interviewing (CATI) targeting the
Chief Information Officers (CIOs) with native-speaking interviewers. Interviews were conducted in one of
4 European Commission, COM (2004) 356, ‘e-Health - making healthcare better for European citizens: An action plan for a
European e-Health Area’, European Commission. 5 European Commission (2006), ICT and e-Business in Hospital Activities: ICT adoption and e-Business activities in 2006’, Sector
Report No. 10/2006, European Commission. 6 European Commission, COM(2008)3282, ‘Commission Recommendation of 2 July 2008 on cross-border interoperability of
electronic health record systems’, European Commission. 7 Deloitte & Ipsos (2011), op. Cit. 8 European Commission, ‘Directive 2011/24/EU of the European Parliament and of The Council of 9 March 2011 on the application
of patients’ rights in cross-border healthcare’, European Commission. 9 The European Patients Smart Open Services project, http://www.epsos.eu/, accessed 16 May 2013. 10 A thematic network on eHealth interoperability, http://www.calliope-network.eu/, accessed 16 May 2013. 11 Healthcare Interoperability Testing and Conformance Harmonisation, http://www.hitch-project.eu/, accessed 16 May 2013.

European Hospital Survey: Benchmarking Deployment of eHealth Services (2012-2013)
13
the official languages of the country. While CATI was the predominant method, responses could also be
provided via an online questionnaire in order to improve response rates. The questionnaires were
translated into 23 languages covering EU27+3.
21 Our validation of the sources of the previous study12 demonstrated that the earlier estimated universe of
12,230 acute hospitals in that study was larger than current official records would support. Due to this
reason, a census strategy was proposed as the best approach for estimating the universe and collecting
the data.
22 To initiate an interview, the interviewers requested to speak to the CIOs of those hospitals defined as
acute and invited them to participate in the survey. Depending on the CIO’s availability, the interviewer
then either started the interview immediately or booked a future date to conduct the survey. Each
interview lasted on average 43 minutes. The main field work started shortly after the pilot phase in
October 2012 and lasted until early February 2013.
For future benchmarking studies
Shorten the overall questionnaire to a more manageable length in order to increase the number and quality of responses.
Generate new indicators from the new block of questions (Block F: IT functionalities) which can complement the 13 indicators already in use for benchmarking.
Consider exploring the barriers to the development and usage of eHealth capabilities. The current survey mainly gathers information on the access and penetration of eHealth capabilities but not the impediments to developing eHealth more widely.
12 Deloitte & Ipsos (2011), op. Cit.
European Hospital Survey: Benchmarking Deployment of eHealth Services (2012-2013)
14
2 Introduction
2.1 Context of the study
2.1.1 Health, Healthcare and eHealth
23 The World Health Organisation’s definition of health is: ‘a state of complete physical, mental and social
well-being and not merely the absence of disease or infirmity’13. As can be observed, this definition allows
for an extremely broad range of areas to be considered within the ambit of health. Taking primary health
care as an example, the WHO’s ultimate goal of primary health care is better health for all. WHO has
identified five key elements14 to achieving that goal:
Reducing exclusion and social disparities in health (universal coverage reforms);
Organising health services around people's needs and expectations (service delivery reforms);
Integrating health into all sectors (public policy reforms);
Pursuing collaborative models of policy dialogue (leadership reforms); and
Increasing stakeholder participation.
24 However, healthcare as a sector is facing increasingly high barriers in terms of accessibility, funding and
efficiency. Health gaps between countries and among social groups within countries have widened. Social,
demographic and epidemiological transformations fed by globalisation, urbanisation and ageing
populations pose challenges of a magnitude that was not anticipated three decades ago 15. Healthcare is
hence globally impacted by a combination of powerful trends:
The demographic shift towards an ageing population;
A rise of chronic diseases and in disease burden;
An increasing demand for quality healthcare services; and
Difficulty to control expenditures and to assign incentives in a fair way.
25 These trends consequently lead to a risk of disruption of social cohesion and health sector resilience16 as
well as to continuously rising healthcare cost. If ignored, these trends will overwhelm health systems,
creating massive financial burdens for countries, with repercussions on individuals17. This financial burden
can already be seen in the high per capita healthcare spending in developed countries. It can be observed
that there is still room for improvement regarding the elimination of waste and the promotion of
efficiency. Several measures apply: more efficient procurement, more rational medicine use, properly
allocated and managed human and technical resources, as well as defragmentation of financing and
administration. Some countries obtain higher levels of coverage and better health outcomes for their
money than others, and the gap between what countries achieve and what they could potentially achieve
with the same resources is sometimes vast18. This clear need for greater efficiency, resource care, as well
as greater flexibility required for the provision of healthcare is currently driving the development of
‘eHealth’.
13 Preamble to the Constitution of the World Health Organisation as adopted by the International Health Conference, New York, 19-
22 June, 1946; signed on 22 July 1946 by the representatives of 61 States (Official Records of the World Health Organisation, no. 2, p. 100) and entered into force on 7 April 1948.
14 WHO: http://www.who.int/topics/primary_health_care/en 15 WHO (2008), ‘World Health Report 2008’, the World Health Organisation. 16 Ibidem. 17 PwC (2010), ‘Luxembourg Ministry of Health eHealth Service Platform Study, Final Report’, PricewaterhouseCoopers. 18 WHO (2010), ‘World Health Report 2010’, the World Health Organisation.

European Hospital Survey: Benchmarking Deployment of eHealth Services (2012-2013)
15
26 There is no single definition of what eHealth is. This term is now used to characterise not only ‘Internet
medicine’, but also virtually everything related to computers and medicine. Today, the word eHealth stands
at the crossroads of medical informatics, public health and business, and refers to health services and
information delivered or enhanced through the Internet and related technologies.
27 The European Commission eHealth Action Plan defines eHealth as referring to "the application of
information and communications technologies across the whole range of functions that affect the health
sector”’ and “including ‘products, systems and services that go beyond simply Internet-based
applications"19. Forms of eHealth include electronic health/medical records (EHR/EMR), telemedicine
(including m-Health), consumer health informatics, health knowledge management, virtual healthcare
teams, or Healthcare Information Systems (HIS).
28 eHealth increases and supports the quality of healthcare through better follow-up of patients, greater
exchange of data and information between healthcare professionals, fewer prescription errors and more
healthcare services for patients. This was demonstrated in a dedicated study of six European countries20.
Among the main findings it is worth pointing out that, for instance, prescription errors could be reduced
(for example 1 million per year in France and 300,000 in the Czech Republic), adverse drug events leading
to 100,000 in-patients (requiring 700,000 extra bed-days and €300 million of treatment cost per year,
across six countries) could be avoided as well as 5.6 million unnecessary admissions to hospitals for
chronically ill patients (across six countries). eHealth also improves the efficiency of care and decreases
healthcare costs by eliminating duplicate and unnecessary diagnostics or therapeutic interventions.
29 However, implementation costs are deemed to be high. An average of 4 to 7 years are necessary for
annual benefits to exceed annual costs and an average of 5 to 9 years are necessary for cumulative
benefits to exceed cumulative costs21,22.
30 A variety of stakeholders are involved in eHealth. Healthcare professionals are direct users of eHealth
services, while local, regional and national governments are responsible for implementing and monitoring
eHealth programmes and initiatives. Beyond the national scope, European-level policymakers take part in
the drafting of regulations and recommendations. Over the last two decades, the European institutions
have contributed substantially to the emergence and implementation of eHealth in European countries.
2.1.2 The context of eHealth in the world
31 The evidence base for the benefits of eHealth has been further established by other intergovernmental
organisations. In 1998, the World Health Organisation (WHO) recognised the importance of regulating
cross-border advertising and the promotion of medical products through the internet23. At the 58th World
Health Assembly in Geneva, Switzerland, WHO adopted a resolution on eHealth24. The resolution invited
WHO Member States to conceive and implement health information systems, to evaluate eHealth activities
and to share knowledge on cost-effectiveness, thus ensuring quality, safety, ethical standards, data
confidentiality, privacy, equity and equality.
32 In the same year, WHO launched the Global Observatory for eHealth (GOe) aiming
at monitoring the development of eHealth in 114 WHO Member States. WHO released the second Global
Survey results on eHealth in 2010 and 2011 25 . The survey covers a broad variety of
topics such as the national policy framework (eGovernment, eHealth, ICT procurement, multiculturalism,
telemedicine), the legal and ethical framework or eHealth application initiatives (telemedicine, m-health
and e-Learning) implemented at national level. The report also highlights the Member States’ barriers in
19 Global Observatory for e-Health: http://www.who.int/kms/initiatives/ehealth/en/, accessed 29 March 2013 20 Gartner (2009), ‘eHealth for a Healthier Europe!’, Gartner. 21 European Commission (2010), ‘Socio-economic impact of interoperable electronic health record and ePrescription systems in
Europe’, European Commission. 22 EHR-Impact (2010), ‘Interoperable eHealth is Worth it – Securing benefits from Electronic Health Records and ePrescribing’,
European Commission publication. 23 WHO (1998), ‘Resolution EB101.R3 on Cross-border Advertising, Promotion and Sale of Medical Products through the Internet’,
the World Health Organisation. 24 WHO (2005), ‘WHO Resolution WHA58.28 on eHealth’, the World Health Organisation. 25 WHO (2010), ‘Atlas of eHealth country profiles based on the findings of the second global survey on eHealth’, Global Observatory
for eHealth Series Volume 1, the World Health Organisation.

European Hospital Survey: Benchmarking Deployment of eHealth Services (2012-2013)
16
implementing these eHealth applications and the information needed to support telemedicine
implementation.
33 In 2010, the OECD published a report on the improvement of Health Sector efficiency26 analysing
incentives, policy options, and institutional mechanisms tailored to the improvement of eHealth
implementation. Based on case studies in six OECD countries (Australia, Canada, the Netherlands, Spain,
Sweden and the United States), the report compares how these countries have implemented eHealth in
order to illustrate the benefits and the drawbacks of eHealth in terms of quality and efficiency of care as
well as operative and administrative costs.
34 Based on this report, the OECD launched a project27 on “benchmarking ICTs in health systems” in order to
harmonise statistical data at a worldwide level. An expert group has been established gathering
representatives of 30 countries (including Brazil, Egypt and India) together with the European Commission,
WHO and the OECD Business and Industry Advisory Committee. Its first workshop was held in January
2012 to identify priorities and ascertain the next steps to be taken, such as the creation of core indicators
to be tested in pilot countries.
35 In order to foster eHealth cooperation between the European Union and the United States, a memorandum
of understanding was signed during the Trans-Atlantic Economic Council (TEC) in December 2010 between
European Commissioner Neelie Kroes and United States Secretary of Health and Human Services Kathleen
Sebelius. The memorandum of understanding recognises the importance of health-related information and
communication technologies (eHealth/ health IT) in promoting individual and community health while
fostering innovation and economic growth and proposes the organisation of shared delegations, joint
working groups, expert visits, conferences, meetings and workshops on standardisation, safety and
education. In November 2011, the TEC reinforced the commitment on the Memorandum of Understanding
and requested a report on the status of interoperability of Electronic Health Records (EHRs). Several
workshops have been organised to establish a conceptual framework for the development of global
interoperability standards and of a skilled IT workforce supporting healthcare professionals to use eHealth.
36 With regard to developing countries, several organisations support eHealth projects. For instance, the
World Bank is funding 55 eHealth projects for about $1.5 billion28. Moreover, participants to the HIMSS G7,
a World Bank-endorsed thought leadership assembly, established a wish list which included29:
Collaboration around health IT initiatives in various regions around the world;
Collaboration between the healthcare sector and the World Bank Group to support access to finance by small and medium local enterprises, and others;
Reinforce research around business findings in client countries using World Bank-funded research in health IT;
Collaboration between the health IT sector and the World Bank Group in making the regulatory environment less tedious, more predictable, stable and in alignment with regional and global markets;
Collaboration between the health IT sector and the World Bank Group in capacity-building;
Support health insurance as an important means through which countries can increase their access and utilisation of technology;
Promote regional and international regulatory harmonisation.
2.1.3 The context of eHealth in Europe
37 Over the past two decades, enormous progress has been made in information and communication
technologies (ICT) to support health systems and services in Europe. The European Commission has been
at the forefront of policy-making and has supported Member States in developing their eHealth strategies.
This has taken place in the context of broader initiatives in the ICT area and of more focused support for
specific eHealth policies.
26 OECD (2010), ‘Improving Health Sector Efficiency: The role of Information and Communication Technologies’, OECD Health Policy
Studies. 27 OECD: http://www.oecd.org/health/health-
systems/benchmarkingofinformationandcommunicationtechnologiesictsinhealthsystems.htm 28 HiMSS (2012), ‘A HIMSS G7 Advisory Report. Advancing Global Health IT: A Consultation with the World Bank at HIMSS12’, HiMSS. 29 HiMSS (2012), op. Cit.
European Hospital Survey: Benchmarking Deployment of eHealth Services (2012-2013)
17
38 Two Actions Plans, eEurope 2002 and eEurope 2005, have contributed to the development of eHealth
across Europe. The eEurope 2002 Action Plan30 was an integral part of the Lisbon strategy and established
measures to make the European Union the world’s most dynamic knowledge-based economy by 2010.
Healthcare was already fully part of the Plan and was considered to be one of the key applications of
Information and Communication Technologies (ICT). The Action Plan recommended ensuring that
healthcare professionals had appropriate telematic infrastructures and established quality criteria for
health-related websites, health technologies and data assessment networks. The subsequent eEurope
2005 Action Plan31 followed the 2002 version but this time targeting more closely the development of
services, applications and secure broadband Internet access. The modernisation of governmental and
public services was one of the key focus points of this Action Plan. As for the healthcare sector, the Action
Plan emphasised the substantial benefits of ICT applications in health management, including lower
administrative costs as well as the provision of remote healthcare services, medical information and
preventive services. More concretely, the Action Plan proposed the introduction of a pan-European health
insurance card (firstly non-electronic) to replace paper forms, the establishment of health information
networks between points of care, and the provision of online health services to the general public.
39 A specific eHealth strategy was proposed in 2004. The objectives of the 2004-2010 Action Plan for a
European eHealth Area32 were to achieve full potential in eHealth systems and services, in particular by
addressing common challenges at the European level and by creating the right framework to support the
development of eHealth. Practical examples included the piloting of eHealth actions and the sharing of
best practices. This Action Plan was one of the first documents to propose concrete solutions for direct
productivity gains based on the improvement of both quality of care and effectiveness. This also made
Member States responsible for the deployment of eHealth in a practical fashion, including the
development of a national or regional roadmap for eHealth covering (amongst other items)
interoperability standards for health data messages, electronic health records and patient identification.
30 European Commission, COM (2001) 140, ‘Commission Communication of 13 March 2001 on eEurope2002: Impact and Priorities.
A communication to the Spring European Council in Stockholm, 23-24 March 2001’, European Commission. 31 European Commission, COM(2002)263, ‘The eEurope2005 Action Plan: an Information Society for Everyone’, European
Commission. 32 European Commission, COM (2004) 356, op. Cit.
European Hospital Survey: Benchmarking Deployment of eHealth Services (2012-2013)
18
40 In addition to these programs, various Framework Programmes for Research and the Competitiveness and
Innovation Programme Information and Communication Technologies Policy Support Programme (CIP ICT
PSP) pilot actions have also supported eHealth initiatives. Structural Funds and regional funds have also
been available since 2007 for the deployment of eHealth initiatives: however, apparently, it is considered
that the Member States have to date not used these sources of funding to great advantage33.
41 As from 2007, the practical issues within eHealth began to receive more attention. The objective of the
European Commission’s White Paper Together for Health34 was to create a coherent framework for
European health through guideline principles and implementation mechanisms for better cooperation
between stakeholders at the EU level, including support for interoperable eHealth solutions. In addition,
Communication COM(2007)860 35 highlighted low investments in the eHealth sector, a strong
fragmentation of the market due to the different social security systems, a lack of interoperability and the
need for a common legal framework within Europe. This was followed in 2008 by concrete
recommendations regarding cross-border interoperability of electronic health records systems through the
development and deployment of guidelines36 for systems interoperability involving policy, social, and legal
aspects. These recommendations also addressed the creation of processes and structures for pan-
European interoperability and issues related to security, privacy and certification. At the same time, the
EU-funded Thematic Network "CALLIOPE”37, launched for 30 months, established a collaborative platform
for many stakeholders in eHealth interoperability in Europe and enabled communication routes and
working procedures.
42 Interoperability has remained a strong theme within EU policy. The 2009 ICT Standardisation Work
Programme38 highlighted the lack of interoperability and standardisation across systems, and three
European Standards Organisations (CEN, CENELEC and ETSI) were invited to address existing
standardisation gaps, especially regarding cross-border interoperability of electronic health record
systems, the application of patients’ rights in cross-border healthcare, telemedicine and market initiatives
for eHealth themes. However, as outlined by the European Commission (Impact Study 2010)39 on the
benefits of Electronic Health Records and ePrescribing, the process of eHealth implementation remains
slow. One of the reasons can be traced back to the fact that workflows and processes are significantly
more complex in healthcare than in other economic sectors and are less easily standardised by
conventional business systems. Another reason also suggested by the 2012 Impact Study40 is the lack of
awareness and sufficient empirical evidence on the costs and benefits of existing interoperable eHealth
Record and ePrescription systems and services. Differences in the organisation and delivery of healthcare
systems between various countries also constitute a major factor. Correspondingly the recently published
eHealth Action Plan 2012-202041 — in line with the Europe 2020 Strategy42 and the Digital Agenda43 for
Europe — addresses and proposes solutions to remaining interoperability barriers at the legal,
organisational, semantic and technical levels.
33 Deloitte & Ipsos (2011), op. Cit. 34 European Commission, COM (2007) 630, Together for Health: A Strategic Approach for the EU 2008-2013’, European
Commission. 35 Ibidem. 36 European Commission, COM (2008) 3282, op. Cit. 37 Calliope Network: “Creating a European coordination network for eHealth interoperability implementation”, http://www.calliope-
network.eu/ 38 European Commission, DG Enterprise and Industry, ICT Standardisation Work Programme,
http://ec.europa.eu/enterprise/sectors/ict/standards/work-programme/ 39 EHR-Impact (2010), op. cit. 40 Ibidem. 41 European Commission, COM(2012) 736, ‘eHealth Action Plan 2012-2020 - Innovative Healthcare for the 21st Century’, European
Commission. 42 European Commission (2010), ‘Europe 2020: A strategy for Smart, Sustainable and Inclusive Growth’, European Commission. 43 European Commission, COM(2010) 245, ‘A Digital Agenda for Europe’, European Commission.

European Hospital Survey: Benchmarking Deployment of eHealth Services (2012-2013)
19
43 Despite the ongoing challenges from an ICT perspective, an important boost to eHealth was achieved
through Article 14(2) of the 2011 European directive on the application of patients’ rights in cross-border
healthcare44 which marked formal cooperation on eHealth between Member States. The instrument
establishes an eHealth network in charge of supporting and facilitating cooperation and the exchange of
information among Member States. National authorities are asked to work together on a voluntary basis,
in order to achieve common positions on eHealth and to promote an interoperable and sustainable
implementation of eHealth across Europe. Member States are obliged to set up National Contact Points
(NCPs) to provide the appropriate information on all essential aspects of cross-border healthcare. This is to
enable patients to exercise their rights on cross-border healthcare in practice.
44 Individual Member States are responsible to decide on the form and the number of NCPs needed in order
to provide the proper information about cross-border healthcare. Such a function could for instance be
incorporated in existing information centres45.
2.1.4 The need for monitoring ICT take-up in the healthcare sector
45 Considering the complexity of the eHealth environment, as well as its strategic importance to sustainable
healthcare, benchmarking is vital to establishing progress made, as well as identifying areas of concern
and potential areas for future policy attention. Benchmarking of progress is therefore an important
element of the Commission's contribution to the improvement of healthcare. This necessarily must take
into account not just statistical measures, but also trends in the overall area of eHealth, a sector
fundamentally affected by the rapid pace of information and communication technology and usage.
46 Previous studies have focussed on the specific implementation of eHealth across different health sectors.
The first study focussed on the use of ICT by general practitioners46, and showed that e-Health
applications had a growing role in the doctors' practices, although there is room for improvement in areas
such as e-Prescribing, telemedicine, and cross-border interoperability. The second study collected and
analysed existing eHealth monitoring and benchmarking sources in Europe and beyond, identified good
practices in data gathering and developed an indicator framework for an EU-wide quantitative
benchmark47 covering key eHealth stakeholders and eHealth related activities. The third study48 focussed on
hospitals as key institutions in the healthcare system and their role in the adoption of eHealth processes.
That study developed composite indicators on the basis of the Deloitte-Ipsos survey results (see further
below). Prior to this study, the eBusiness W@tch survey49 of 2006, which surveyed 834 acute care
hospitals in 18 countries, found that hospitals were in general better equipped with basic ICT
infrastructure than other sectors. However, hospitals still showed weaknesses in the introduction of ICT
applications directly with patients.
44 European Parliament (1995), ‘Directive 2011/24/EU of the European Parliament and of the Council of 9 March 2011 on the
application of patients’ rights in cross-border healthcare’, European Parliament. 45 PwC (2012), ‘Recommendation Report: A Best Practice based approach to National Contact Points Website: Feasibility Study’,
PricewaterhouseCoopers. 46 Empirica (2008), ‘Benchmarking ICT use among General Practitioners in Europe’, European Commission publication,
http://www.rcc.gov.pt/SiteCollectionDocuments/ICT_Europe_final_report08.pdf 47 European Commission (2009), ‘eHealth Benchmarking (Phase II)’, a study of Empirica for the European Commission,
http://www.ehealth-benchmarking.eu/results/documents/eHealthBenchmarking_Final-Report_2009.pdf 48 Codagnone, C. & F. Lupiañez-Villanueva (2011), ‘A composite index for the benchmarking of eHealth Deployment in European
acute Hospitals. Distilling reality in manageable form for evidence based policy’, Institute for Prospective Technological Studies (IPTS) - European Commission's Joint Research Centre (JRC).
49 European Commission (2006), op. Cit.
European Hospital Survey: Benchmarking Deployment of eHealth Services (2012-2013)
20
47 Cultural aspects should also be taken into account as Europe has a broad diversity of healthcare systems.
Healthcare establishments can be public, private or private-not-for-profit, on one site or spread across
several locations, specialised or general and can vary widely in scale. In addition to these factors, types of
establishments and healthcare systems can also vary across Europe and hence can impact medical
practices and usage of eHealth solutions. For example, depending on the health insurance system, patients
with private health insurance may have their care services fully reimbursed, bypass waiting lists (e.g. UK),
have access to services that are not covered by the public health system (e.g. Hungary), or have access to
specialised physicians affiliated to private health insurance only (e.g. Germany)50.
2.2 Objectives of the study
2.2.1 Overall objectives of the study
48 The overall objective of the European Hospital Survey (Benchmarking deployment of eHealth services,
2012–2013) is to contribute to public services improvement, particularly in the healthcare sector, by
assessing the level of eHealth usage in acute care hospitals in the EU27, Norway, Iceland and Croatia.
49 This study is part of a broader research context. In particular, it will update the findings of a previous study
carried out in 2010 by Deloitte/Ipsos (“eHealth Benchmarking Study III”, hereafter “the previous study”).
Hence, a significant portion of this report will focus on monitoring apparent trends and changes in the
eHealth landscape.
2.2.2 Specific objectives
50 The specific objective of this study is to design, conduct and present a survey on the level of eHealth
deployment with a representative sample of acute hospitals in the EU27, Norway, Iceland and Croatia.
51 Following the guidelines of the previous study and in direct collaboration with IPTS, the study will be
structured in line with the following objectives:
52 Draw up, propose and agree on a definitive set of questions and a scientifically robust and transparent
sampling and data gathering strategy to carry out the field-work, ensuring appropriate geographical
distribution of the acute care hospitals.
53 Conduct a survey in collaboration with the Chief Information Officers (CIOs) working at the acute hospitals
of the selected countries.
54 Analyse the survey data in order to present the descriptive statistics and the characterisation of the acute
care hospitals surveyed.
55 Present a survey set up that will enable the monitoring of the evolution over time.
2.3 Content of the final report
56 The final report covers the following:
Chapter 3 - Methodological approach: summary of the survey methodology and drafting of the questionnaire. A more detailed methodology is presented in Appendix 4: Details on the methodological approach;
Chapter 4 - Overall results at European level: descriptive analysis of the survey results for EU27+3. Differences according to size and ownership of hospitals together with specificities of major countries are also presented;
Chapter 5 - Results at country level: country reports comparing each country profile to the European average and to the previous study for 13 selected indicators, results of 5 selected indicators by size and by ownership. Regional specificities (NUTS 1/2 levels) are presented for selected regions;
Chapter 6 - Conclusions and recommendations: comparison with similar surveys and recommendations.
50 PwC (2012), op. Cit.

European Hospital Survey: Benchmarking Deployment of eHealth Services (2012-2013)
21
3 Methodological approach
57 This chapter presents the preparation and the implementation of the survey. A detailed description is given
in Appendix 4: Details on the methodological approach.
58 The project consists of the following three main phases:
Phase I. Survey structure preparation and definition of sampling methodology: the work plan,
the draft questionnaire, the sampling methodology and approach. This also included translation of the questionnaire into the different country languages as well as the pilot phase of the survey;
Phase II. Survey implementation: This phase included data gathering, data cleansing and the
development of the codification manual;
Phase III. Survey analysis and reporting: analysis of collected data and preparation of a final
report presenting the results at European, national and in specific cases regional level.
3.1 Overview
59 The objective of this survey is to benchmark the level of eHealth use in acute hospitals in all 27 EU
Member States and Croatia, Iceland and Norway. The total geographical scope is hereafter referred to as
EU27+3.
60 By default, we have carried out the survey via Computer-Assisted Telephone Interviewing (CATI) targeting
the Chief Information Officers (CIOs). Native-speaking interviewers have conducted the interviews in one
of the official languages of the countries in scope. The predominant use of CATI ensures user-friendliness
as the respondent can ask for explanations or clarifications directly, has direct human contact and hence
avoids e-mails and reminders.
61 However, we also offered the interviewees the possibility to respond via an online questionnaire. This
ultimately led to a greater response rate.
62 In the context of this survey, the universe is the population of acute care hospitals in all EU27+3 countries.
Our review of the sources of the previous study51 has shown that the earlier estimated universe of 12,230
acute hospitals in that study was larger than current official records would support. Based on the national
Ministries of Health’s official information sources, we reassessed the universe and obtained a number of
8,199 acute care hospitals.
63 This is why a census strategy was proposed as the best approach for estimating the universe and
collecting the data. A census is one of the most viable methods to ensure that we reach every entity within
the universe. The census is also the best way to implement a proportional sampling methodology that
requires knowledge of the following elements: distribution of hospital size, ownership and region at NUTS52
level.
64 A random sample of acute care hospitals, based on quotas for hospital ownership, hospital size and region
(NUTS 2 level), was drawn from the universe. Target respondents have been selected through a random
procedure.
65 The survey questionnaire was structured by subject blocks (cf. section 3.3 below) and built upon the
previous53 study as well as further sources. It was further developed in the kick-off meeting at IPTS in
early September 2012 and finalised (English version) at the end of September 2012.
51 Deloitte & Ipsos (2011), op. Cit. 52 NUTS are territorial units defined in terms of the existing administrative units in the Member States. An 'administrative unit'
marks out a geographical area for which an administrative authority has power to take administrative or policy decisions in accordance with the legal and institutional framework of the Member State. NUTS 2 levels are administrative units comprising between 800,000 and 3 million inhabitants.
53 Deloitte & Ipsos (2011), op. Cit.
European Hospital Survey: Benchmarking Deployment of eHealth Services (2012-2013)
22
66 To pilot the survey field work, the questionnaire was translated into 23 languages covering EU27+3. The
translated questionnaires were quality reviewed by technically qualified native speakers and implemented
into the CATI system.
67 To initiate an interview, the interviewers asked to speak to the CIOs of those hospitals defined as acute
and invited them to participate to the survey. It was also suggested that a presentation letter from IPTS
along with the questionnaire could be sent in advance (for the letter please refer to Appendix 5:
Awareness letters).
68 Depending on the CIO’s availability, the interviewer then either started the interview immediately or
booked a future date to conduct the survey. Each interview lasted on average 43 minutes..
69 We conducted 122 interviews in the pilot phase (from 2 to 22 October 2012). The aim of the pilot phase
was to detect wording issues and potential difficulties in understanding the questions. Suggestions
regarding the optimisation of the questionnaire structure were also discussed with IPTS. Based on the
feedback from the pilot phase, we updated the structure and implemented some minor changes to the
questionnaire for the main field work.
70 The main field work started shortly after the pilot phase and lasted until early February 2013. In total, we
called 26,550 healthcare establishments. Of the 26,550 establishments, 5,424 qualified as acute care
hospitals and of this number, 1,753 hospitals granted us an interview.
3.2 Sampling methodology
71 The methodology used to define the appropriate sample in each of the 30 countries surveyed followed a
four step approach:
3.2.1 Estimation of the overall universe
72 The previous eHealth Benchmarking III study was used as a basis to re-estimate the overall acute care
hospital universe. The previous study used various sources to ascertain a total universe of 12,230 acute
care hospitals. We verified these sources and found that many were no longer available or accessible, and
commercial list brokers could not be considered reliable for the purposes of this study. For this reason, we
also used the WHO list of hospitals for the 30 countries as well as hospital lists from the each national
Ministry of Health. This led to a universe estimation of 8,199 acute care hospitals in the EU27+3 countries.
3.2.2 Implementation of a census strategy
73 To assure overall coherence of the data and analysis, we decided to apply a census strategy as the best
approach for estimating the universe and collecting the data.
74 The census methodology is composed as follows:
Define and select hospitals (not only acute) through commercial sources, official listings and business directories, such as Yellow pages and the PwC network;
Remove duplicates from the data based on phone number and addresses to avoid calling the same entities more than once;
Screen visually, whereby a native speaker goes through the whole list;
Stratify on a country level.
75 Practically this meant that all entities contacted during the census were asked for ownership and size, and
whether their institution was an acute hospital according to the agreed definition. Their postal code was
also recorded so the region could be defined.
European Hospital Survey: Benchmarking Deployment of eHealth Services (2012-2013)
23
3.2.3 Determination of sampling approach by country
76 The following elements are part of the stratification of the sample and were determined from the actual
answers to the questionnaire:
Location: Country / NUTS 1/ NUTS 2 level classification, using the postal code;
Ownership: Public, private, private not for profit;
Size class: Number of beds (< 101 beds, 101-250 beds, 251 to 750 beds, > 750 beds);
Acute hospital: Definition implemented in screening questions.
77 All other types of health care establishments were excluded. Therefore, psychiatric hospitals, military
hospitals, police hospitals, prison hospitals, non-hospital primary care centres, family planning centres,
facilities focusing on plastic surgery, hospices, mobile emergency care providers, fertility clinics and
diagnostic imaging clinics are not part of our study.
78 No exclusion criteria have been applied with regard to ownership (public, private, private not-for-profit),
size (number of beds), teaching activity (university hospital, non-university teaching hospital, non-
university non-teaching), or organisation of the hospital (independent on one site, independent on multiple
sites, part of a group, etc.).
79 The unit of enquiry has been defined as the actual “acute care hospital” (i.e. the local unit where
healthcare was provided). In the case of grouping of hospitals, information was collected only for the
acute care unit sample.
3.2.4 Calculation of error margins and confidence intervals
80 For the countries, an initial sample figure was calculated as well as the related error margins.
81 These error margins represent a measure of the variability of estimates due to sampling error and so
enable data users to measure the range of uncertainty around each estimate. Two error margins were
calculated for each country, based on answer characteristics of 30% and 50% (corresponding to different
assumed levels of accuracy or, in other words, sampling errors).
82 We have calculated the error margins at country and regional level, based on a confidence interval of
95%. The confidence interval corresponds to the range of values of sample observations that contain the
true parameter (here, the sample figure) value within a given probability of 95%.
83 Error margins and confidence levels for the sampling have been recalculated based on the final size of the
universe from the census results.
Definition of “Acute hospital”: As the definition of acute care hospital varies across the different EU countries, we defined the following criteria to qualify survey participants as acute care hospital:
1. Respondents consider that the hospital is an acute or general hospital; or
2. The hospital has an emergency department, and at least one of the following:
a. a routine and/or life-saving surgery operating room; and/or
b. an intensive care unit.
European Hospital Survey: Benchmarking Deployment of eHealth Services (2012-2013)
24
3.3 The questionnaire
84 The main sources which influenced the design of the questionnaire were:
“eHealth Benchmarking Study III”54: This study contributed to the development of a definitive set of questions and a scientifically robust and transparent sampling and data gathering strategy for the field-work. This ensured appropriate geographical distribution of the acute care hospitals;
“A Composite Index for the Benchmarking of eHealth Deployment in European Acute Hospitals”55: based on the Deloitte/IPSOS study, this study constructed a composite index, offered key policy messages and new areas for research;
“Benchmarking ICT use among General Practitioners in Europe”56 contributed a number of questions, particularly those related to the availability and usage of eHealth applications and data exchange; and
“The eHealth Service Platform Study”, a PwC benchmarking study on 20 international, national and regional eHealth platforms57.
85 Three new sections were added into the original questionnaire included in the latest version from IPTS.
These were pilot-tested with CIOs from 6 countries (ES, IT, DE, UK, HU, LU). A validation workshop has been
held with EC experts.
86 Translations were initiated in late September 2012, with the questionnaire translated from Standard
English into 23 different languages by an accredited translation agency with experience in translating
questionnaires and health-related terminology. Multiple cross-checks ensured the quality of the
translations, with translations double-checked by evaluators from our subcontractor GDCC and by PwC
native speakers, with further tests during the pilot phase.
87 The questionnaire has been organised as follows:
Screening questions (acute care hospital definition, size, ownership, etc. see above);
The main part of the survey, divided into 7 blocks:
Block A. Characterisation of the hospital;
Block B. ICT infrastructure;
Block C. ICT applications;
Block D. Health Information Exchange;
Block E. Security and privacy;
Block F. IT functionalities;
Block G. Hospital statistics.
88 The final version of the questionnaire is presented in Appendix 3: Final questionnaire.
89 For further details on the methodological approach, please refer to Appendix 4: Details on the
methodological approach.
54 Deloitte & Ipsos (2011), op. Cit. 55 Codagnone , C. & Lupiañez-Villanueva, F. (2011), op. cit. 56 Empirica (2008), ‘Benchmarking ICT use among General Practitioners in Europe’, European Commission Publication. 57 http://www.sante.public.lu/fr/systeme-sante/programme-esante/agence-esante/pwc-report-ehealth-service.pdf
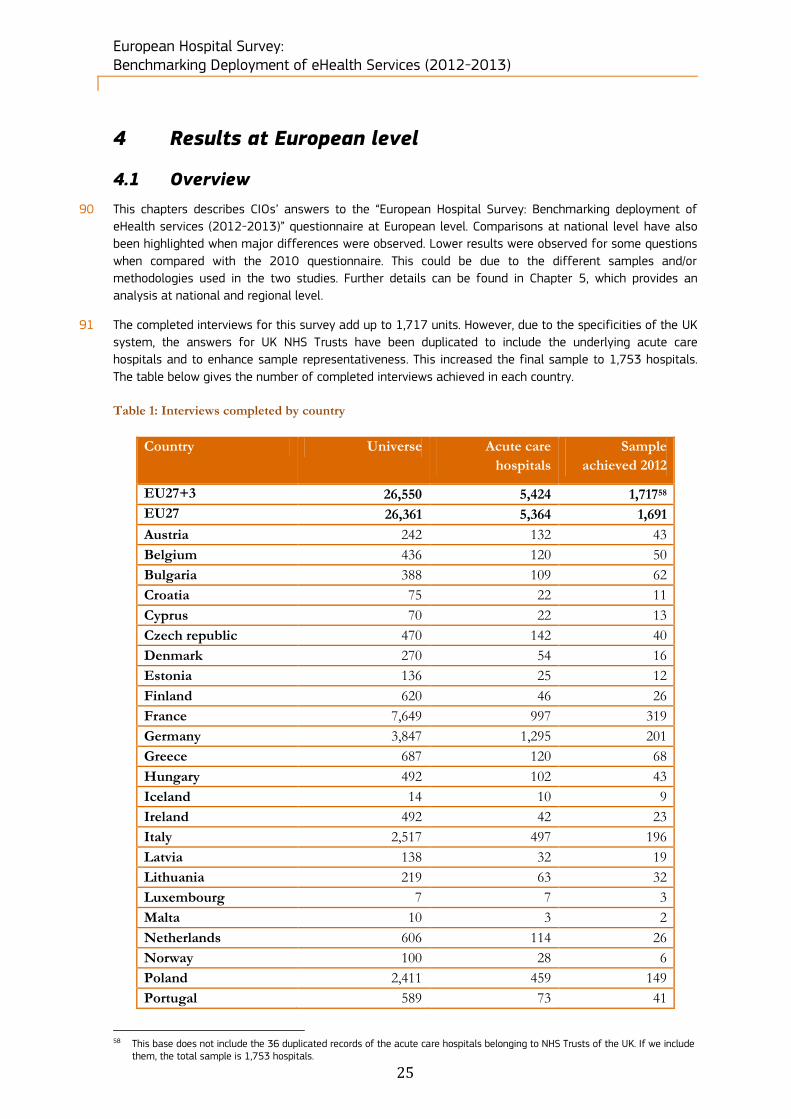
European Hospital Survey: Benchmarking Deployment of eHealth Services (2012-2013)
25
4 Results at European level
4.1 Overview
90 This chapters describes CIOs’ answers to the “European Hospital Survey: Benchmarking deployment of
eHealth services (2012-2013)” questionnaire at European level. Comparisons at national level have also
been highlighted when major differences were observed. Lower results were observed for some questions
when compared with the 2010 questionnaire. This could be due to the different samples and/or
methodologies used in the two studies. Further details can be found in Chapter 5, which provides an
analysis at national and regional level.
91 The completed interviews for this survey add up to 1,717 units. However, due to the specificities of the UK
system, the answers for UK NHS Trusts have been duplicated to include the underlying acute care
hospitals and to enhance sample representativeness. This increased the final sample to 1,753 hospitals.
The table below gives the number of completed interviews achieved in each country.
Table 1: Interviews completed by country
Country Universe Acute care
hospitals
Sample
achieved 2012
EU27+3 26,550 5,424 1,71758
EU27 26,361 5,364 1,691
Austria 242 132 43
Belgium 436 120 50
Bulgaria 388 109 62
Croatia 75 22 11
Cyprus 70 22 13
Czech republic 470 142 40
Denmark 270 54 16
Estonia 136 25 12
Finland 620 46 26
France 7,649 997 319
Germany 3,847 1,295 201
Greece 687 120 68
Hungary 492 102 43
Iceland 14 10 9
Ireland 492 42 23
Italy 2,517 497 196
Latvia 138 32 19
Lithuania 219 63 32
Luxembourg 7 7 3
Malta 10 3 2
Netherlands 606 114 26
Norway 100 28 6
Poland 2,411 459 149
Portugal 589 73 41
58 This base does not include the 36 duplicated records of the acute care hospitals belonging to NHS Trusts of the UK. If we include
them, the total sample is 1,753 hospitals.
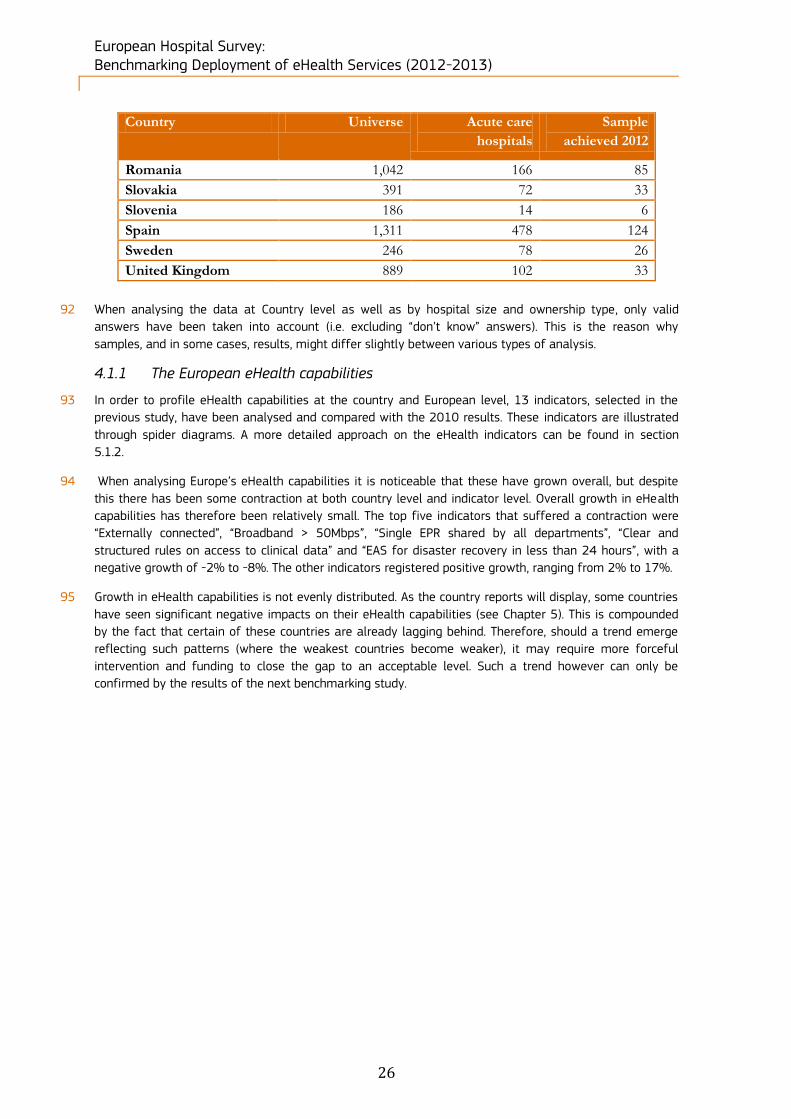
European Hospital Survey: Benchmarking Deployment of eHealth Services (2012-2013)
26
Country Universe Acute care
hospitals
Sample
achieved 2012
Romania 1,042 166 85
Slovakia 391 72 33
Slovenia 186 14 6
Spain 1,311 478 124
Sweden 246 78 26
United Kingdom 889 102 33
92 When analysing the data at Country level as well as by hospital size and ownership type, only valid
answers have been taken into account (i.e. excluding “don’t know” answers). This is the reason why
samples, and in some cases, results, might differ slightly between various types of analysis.
4.1.1 The European eHealth capabilities
93 In order to profile eHealth capabilities at the country and European level, 13 indicators, selected in the
previous study, have been analysed and compared with the 2010 results. These indicators are illustrated
through spider diagrams. A more detailed approach on the eHealth indicators can be found in section
5.1.2.
94 When analysing Europe’s eHealth capabilities it is noticeable that these have grown overall, but despite
this there has been some contraction at both country level and indicator level. Overall growth in eHealth
capabilities has therefore been relatively small. The top five indicators that suffered a contraction were
“Externally connected”, “Broadband > 50Mbps”, “Single EPR shared by all departments”, “Clear and
structured rules on access to clinical data” and “EAS for disaster recovery in less than 24 hours”, with a
negative growth of -2% to -8%. The other indicators registered positive growth, ranging from 2% to 17%.
95 Growth in eHealth capabilities is not evenly distributed. As the country reports will display, some countries
have seen significant negative impacts on their eHealth capabilities (see Chapter 5). This is compounded
by the fact that certain of these countries are already lagging behind. Therefore, should a trend emerge
reflecting such patterns (where the weakest countries become weaker), it may require more forceful
intervention and funding to close the gap to an acceptable level. Such a trend however can only be
confirmed by the results of the next benchmarking study.
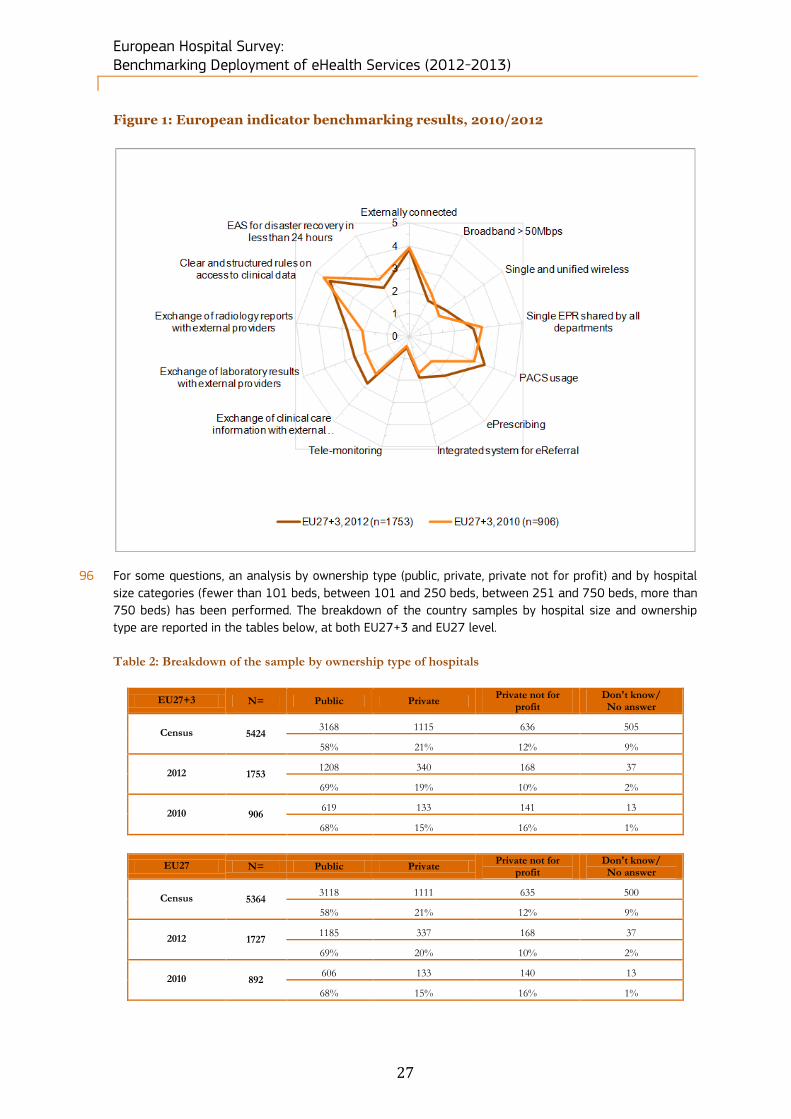
European Hospital Survey: Benchmarking Deployment of eHealth Services (2012-2013)
27
Figure 1: European indicator benchmarking results, 2010/2012
96 For some questions, an analysis by ownership type (public, private, private not for profit) and by hospital
size categories (fewer than 101 beds, between 101 and 250 beds, between 251 and 750 beds, more than
750 beds) has been performed. The breakdown of the country samples by hospital size and ownership
type are reported in the tables below, at both EU27+3 and EU27 level.
Table 2: Breakdown of the sample by ownership type of hospitals
EU27+3 N= Public Private Private not for
profit Don't know/ No answer
Census 5424 3168 1115 636 505
58% 21% 12% 9%
2012 1753 1208 340 168 37
69% 19% 10% 2%
2010 906 619 133 141 13
68% 15% 16% 1%
EU27 N= Public Private Private not for
profit Don't know/ No answer
Census 5364 3118 1111 635 500
58% 21% 12% 9%
2012 1727 1185 337 168 37
69% 20% 10% 2%
2010 892 606 133 140 13
68% 15% 16% 1%
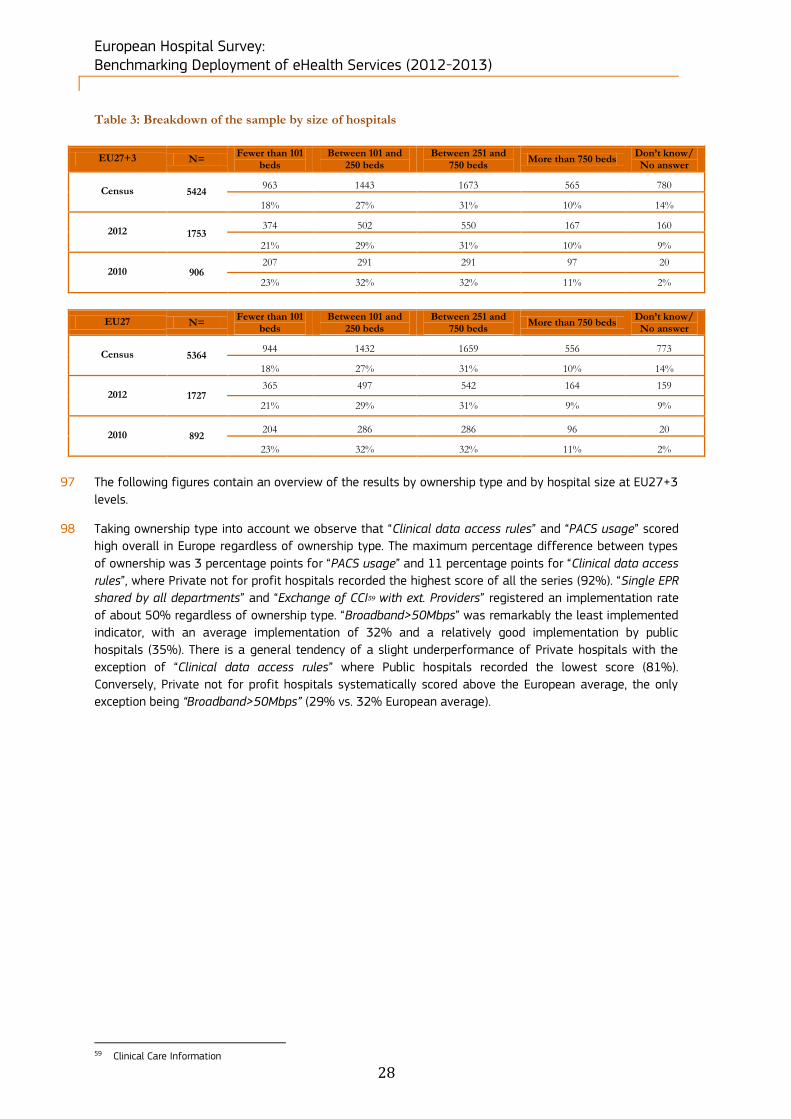
European Hospital Survey: Benchmarking Deployment of eHealth Services (2012-2013)
28
Table 3: Breakdown of the sample by size of hospitals
EU27+3 N= Fewer than 101
beds Between 101 and
250 beds Between 251 and
750 beds More than 750 beds
Don’t know/ No answer
Census 5424 963 1443 1673 565 780
18% 27% 31% 10% 14%
2012 1753
374 502 550 167 160
21% 29% 31% 10% 9%
2010 906 207 291 291 97 20
23% 32% 32% 11% 2%
EU27 N= Fewer than 101
beds Between 101 and
250 beds Between 251 and
750 beds More than 750 beds
Don’t know/ No answer
Census 5364 944 1432 1659 556 773
18% 27% 31% 10% 14%
2012 1727 365 497 542 164 159
21% 29% 31% 9% 9%
2010 892 204 286 286 96 20
23% 32% 32% 11% 2%
97 The following figures contain an overview of the results by ownership type and by hospital size at EU27+3
levels.
98 Taking ownership type into account we observe that “Clinical data access rules” and “PACS usage” scored
high overall in Europe regardless of ownership type. The maximum percentage difference between types
of ownership was 3 percentage points for “PACS usage” and 11 percentage points for “Clinical data access
rules”, where Private not for profit hospitals recorded the highest score of all the series (92%). “Single EPR
shared by all departments” and “Exchange of CCI59 with ext. Providers” registered an implementation rate
of about 50% regardless of ownership type. “Broadband>50Mbps” was remarkably the least implemented
indicator, with an average implementation of 32% and a relatively good implementation by public
hospitals (35%). There is a general tendency of a slight underperformance of Private hospitals with the
exception of “Clinical data access rules” where Public hospitals recorded the lowest score (81%).
Conversely, Private not for profit hospitals systematically scored above the European average, the only
exception being “Broadband>50Mbps” (29% vs. 32% European average).
59 Clinical Care Information

European Hospital Survey: Benchmarking Deployment of eHealth Services (2012-2013)
29
Figure 2: European analysis by ownership type
99 Taking hospital size into account, “Clinical data access rules” recorded the highest average results (82%),
while “Broadband>50Mbps” and “Exchange of CCI with ext. providers” registered the lowest penetration
rate. The biggest percentage difference was observed in “Exchange of CCI with ext. Providers” (33%
difference between small and big hospitals) and “PACS usage” (30% between the smallest and the biggest
hospital category).
100 There is a general trend for smaller hospitals to underperform in relation to the European averages and
bigger hospitals. Large hospitals with more than 750 beds consistently reported higher implementation
scores than smaller hospitals, save for the category “Single EPR shared by all departments”, where the
results were aligned to those of hospitals with between 251 and 750 beds.
32%
55%
70%
53%
83%
35%
54%
70%
53%
81%
24%
51%
69%
47%
84%
29%
70%
72%
61%
92%
0% 10% 20% 30% 40% 50% 60% 70% 80% 90% 100%
Broadband >50Mbps
Single EPR shared by all departments
PACS usage
Exchange of CCI with ext. providers
Clinical data access rules
Total (n=1716) Public (n=1208) Private (n=340) Private not prof it (n=168)
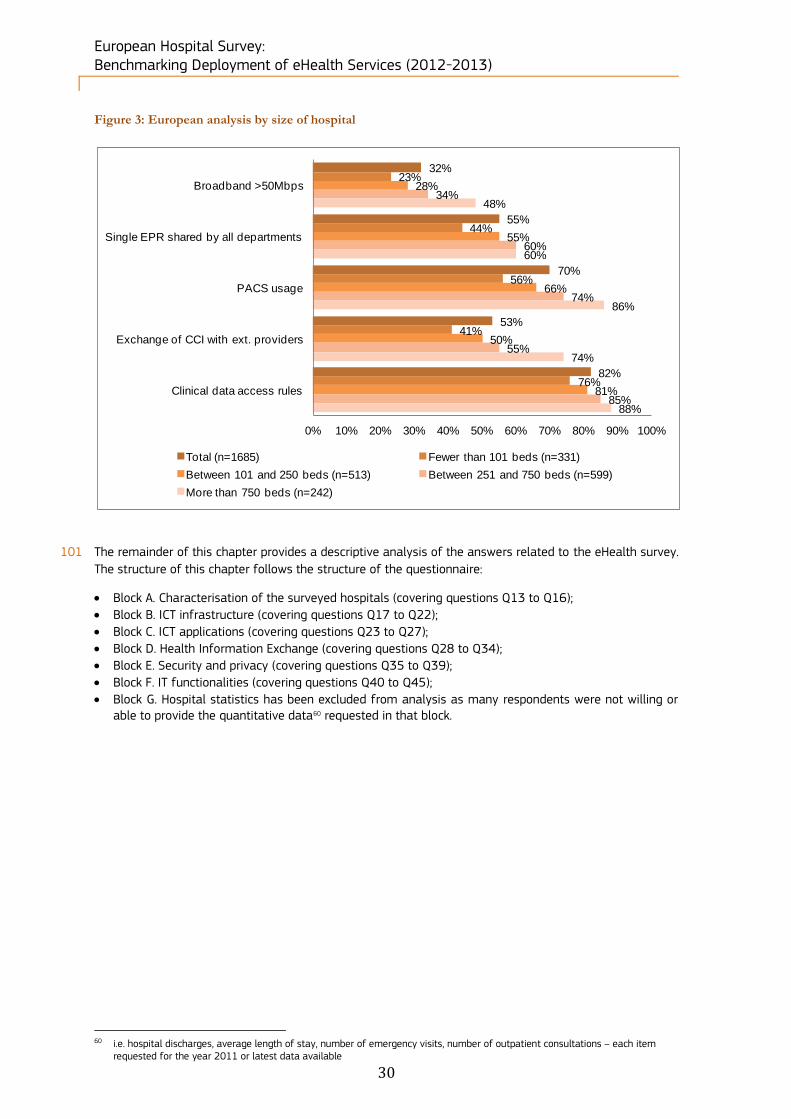
European Hospital Survey: Benchmarking Deployment of eHealth Services (2012-2013)
30
Figure 3: European analysis by size of hospital
101 The remainder of this chapter provides a descriptive analysis of the answers related to the eHealth survey.
The structure of this chapter follows the structure of the questionnaire:
Block A. Characterisation of the surveyed hospitals (covering questions Q13 to Q16);
Block B. ICT infrastructure (covering questions Q17 to Q22);
Block C. ICT applications (covering questions Q23 to Q27);
Block D. Health Information Exchange (covering questions Q28 to Q34);
Block E. Security and privacy (covering questions Q35 to Q39);
Block F. IT functionalities (covering questions Q40 to Q45);
Block G. Hospital statistics has been excluded from analysis as many respondents were not willing or able to provide the quantitative data60 requested in that block.
60 i.e. hospital discharges, average length of stay, number of emergency visits, number of outpatient consultations – each item
requested for the year 2011 or latest data available
32%
55%
70%
53%
82%
23%
44%
56%
41%
76%
28%
55%
66%
50%
81%
34%
60%
74%
55%
85%
48%
60%
86%
74%
88%
0% 10% 20% 30% 40% 50% 60% 70% 80% 90% 100%
Broadband >50Mbps
Single EPR shared by all departments
PACS usage
Exchange of CCI with ext. providers
Clinical data access rules
Total (n=1685) Fewer than 101 beds (n=331)
Between 101 and 250 beds (n=513) Between 251 and 750 beds (n=599)
More than 750 beds (n=242)
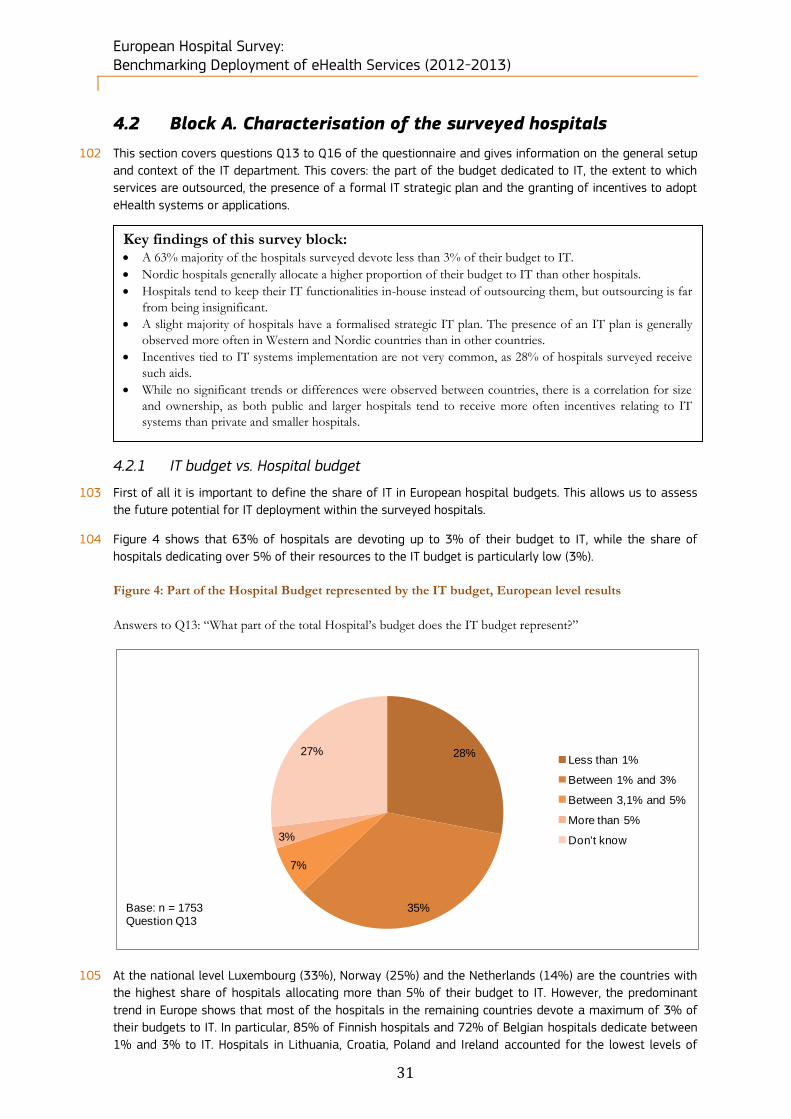
European Hospital Survey: Benchmarking Deployment of eHealth Services (2012-2013)
31
4.2 Block A. Characterisation of the surveyed hospitals
102 This section covers questions Q13 to Q16 of the questionnaire and gives information on the general setup
and context of the IT department. This covers: the part of the budget dedicated to IT, the extent to which
services are outsourced, the presence of a formal IT strategic plan and the granting of incentives to adopt
eHealth systems or applications.
4.2.1 IT budget vs. Hospital budget
103 First of all it is important to define the share of IT in European hospital budgets. This allows us to assess
the future potential for IT deployment within the surveyed hospitals.
104 Figure 4 shows that 63% of hospitals are devoting up to 3% of their budget to IT, while the share of
hospitals dedicating over 5% of their resources to the IT budget is particularly low (3%).
Figure 4: Part of the Hospital Budget represented by the IT budget, European level results
Answers to Q13: “What part of the total Hospital’s budget does the IT budget represent?”
105 At the national level Luxembourg (33%), Norway (25%) and the Netherlands (14%) are the countries with
the highest share of hospitals allocating more than 5% of their budget to IT. However, the predominant
trend in Europe shows that most of the hospitals in the remaining countries devote a maximum of 3% of
their budgets to IT. In particular, 85% of Finnish hospitals and 72% of Belgian hospitals dedicate between
1% and 3% to IT. Hospitals in Lithuania, Croatia, Poland and Ireland accounted for the lowest levels of
28%
35%
7%
3%
27%Less than 1%
Between 1% and 3%
Between 3,1% and 5%
More than 5%
Don't know
Base: n = 1753Question Q13
Key findings of this survey block: A 63% majority of the hospitals surveyed devote less than 3% of their budget to IT.
Nordic hospitals generally allocate a higher proportion of their budget to IT than other hospitals.
Hospitals tend to keep their IT functionalities in-house instead of outsourcing them, but outsourcing is far
from being insignificant.
A slight majority of hospitals have a formalised strategic IT plan. The presence of an IT plan is generally
observed more often in Western and Nordic countries than in other countries.
Incentives tied to IT systems implementation are not very common, as 28% of hospitals surveyed receive
such aids.
While no significant trends or differences were observed between countries, there is a correlation for size
and ownership, as both public and larger hospitals tend to receive more often incentives relating to IT
systems than private and smaller hospitals.

European Hospital Survey: Benchmarking Deployment of eHealth Services (2012-2013)
32
investment in IT: between 63% and 86% of hospitals in these countries dedicate less than 1% of their
budget to IT.
Figure 5: Part of the Hospital Budget represented by the IT budget, Country-level results
Answers to Q13: “What part of the total Hospital’s budget does the IT budget represent?”
39%
39%
3%
15%
52%
86%
40%
54%
38%
60%
27%
19%
48%
41%
44%
63%
56%
50%
83%
33%
50%
25%
63%
46%
52%
45%
33%
38%
11%
26%
47%
48%
56%
72%
40%
50%
43%
12%
40%
85%
64%
60%
34%
49%
33%
32%
33%
40%
9%
33%
50%
45%
50%
30%
43%
40%
45%
67%
40%
67%
69%
10%
10%
38%
13%
2%
14%
4%
50%
15%
6%
12%
16%
8%
22%
7%
9%
41%
7%
11%
5%
9%
13%
17%
2%
4%
4%
3%
5%
10%
3%
9%
2%
3%
5%
4%
10%
33%
14%
25%
3%
9%
6%
2%
0% 10% 20% 30% 40% 50% 60% 70% 80% 90% 100%
EU27+3
EU27
Austria
Belgium
Bulgaria
Croatia
Cyprus
Czech republic
Denmark
Estonia
Finland
France
Germany
Greece
Hungary
Iceland
Ireland
Italy
Latvia
Lithuania
Luxembourg
Malta
Netherlands
Norway
Poland
Portugal
Romania
Slovakia
Slovenia
Spain
Sweden
United Kingdom
Less than 1% Between 1% and 3% Between 3,1% and 5% More than 5%
Base: n = 1279Question Q13
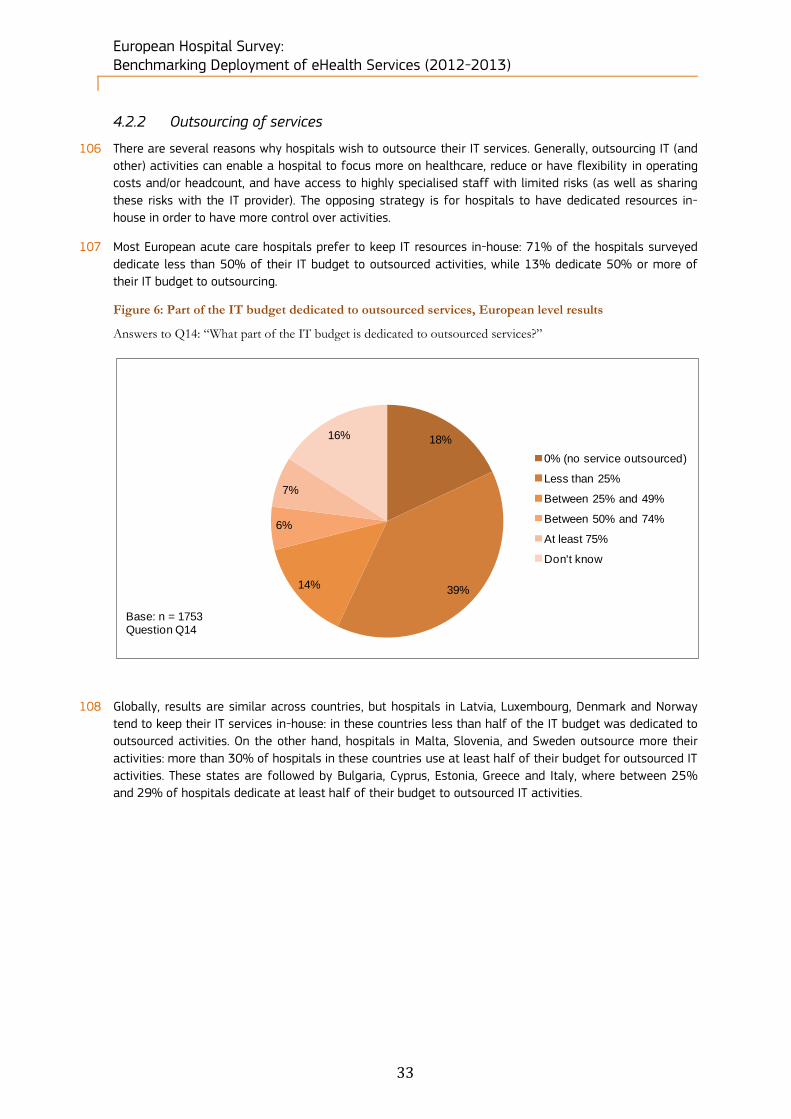
European Hospital Survey: Benchmarking Deployment of eHealth Services (2012-2013)
33
4.2.2 Outsourcing of services
106 There are several reasons why hospitals wish to outsource their IT services. Generally, outsourcing IT (and
other) activities can enable a hospital to focus more on healthcare, reduce or have flexibility in operating
costs and/or headcount, and have access to highly specialised staff with limited risks (as well as sharing
these risks with the IT provider). The opposing strategy is for hospitals to have dedicated resources in-
house in order to have more control over activities.
107 Most European acute care hospitals prefer to keep IT resources in-house: 71% of the hospitals surveyed
dedicate less than 50% of their IT budget to outsourced activities, while 13% dedicate 50% or more of
their IT budget to outsourcing.
Figure 6: Part of the IT budget dedicated to outsourced services, European level results
Answers to Q14: “What part of the IT budget is dedicated to outsourced services?”
108 Globally, results are similar across countries, but hospitals in Latvia, Luxembourg, Denmark and Norway
tend to keep their IT services in-house: in these countries less than half of the IT budget was dedicated to
outsourced activities. On the other hand, hospitals in Malta, Slovenia, and Sweden outsource more their
activities: more than 30% of hospitals in these countries use at least half of their budget for outsourced IT
activities. These states are followed by Bulgaria, Cyprus, Estonia, Greece and Italy, where between 25%
and 29% of hospitals dedicate at least half of their budget to outsourced IT activities.
18%
39%14%
6%
7%
16%
0% (no service outsourced)
Less than 25%
Between 25% and 49%
Between 50% and 74%
At least 75%
Don't know
Base: n = 1753Question Q14

European Hospital Survey: Benchmarking Deployment of eHealth Services (2012-2013)
34
Figure 7: Part of the IT budget dedicated to outsourced services, Country-level results
Answers to Q14: “What part of the IT budget is dedicated to outsourced services?”
22%
22%
11%
19%
14%
14%
45%
15%
32%
30%
18%
7%
41%
11%
37%
16%
50%
16%
33%
25%
17%
22%
17%
42%
23%
18%
21%
5%
46%
46%
57%
44%
53%
57%
18%
65%
67%
55%
42%
45%
53%
44%
37%
56%
47%
42%
25%
68%
67%
46%
33%
49%
36%
25%
37%
17%
46%
46%
63%
17%
17%
17%
28%
8%
14%
9%
15%
33%
18%
5%
13%
20%
22%
5%
11%
11%
17%
25%
8%
17%
50%
16%
28%
15%
23%
50%
21%
21%
8%
8%
3%
5%
14%
9%
3%
18%
11%
7%
1%
15%
5%
13%
4%
8%
8%
11%
7%
7%
17%
13%
8%
2%
8%
8%
11%
5%
12%
14%
18%
3%
9%
11%
4%
8%
11%
12%
22%
5%
12%
4%
100%
4%
6%
8%
11%
10%
17%
2%
25%
9%
0% 20% 40% 60% 80% 100%
EU27+3
EU27
Austria
Belgium
Bulgaria
Croatia
Cyprus
Czech republic
Denmark
Estonia
Finland
France
Germany
Greece
Hungary
Iceland
Ireland
Italy
Latvia
Lithuania
Luxembourg
Malta
Netherlands
Norway
Poland
Portugal
Romania
Slovakia
Slovenia
Spain
Sweden
United …
0% (no service outsourced) Less than 25%Between 25% and 49% Between 50% and 74%At least 75%
Base: n = 1469Question Q14
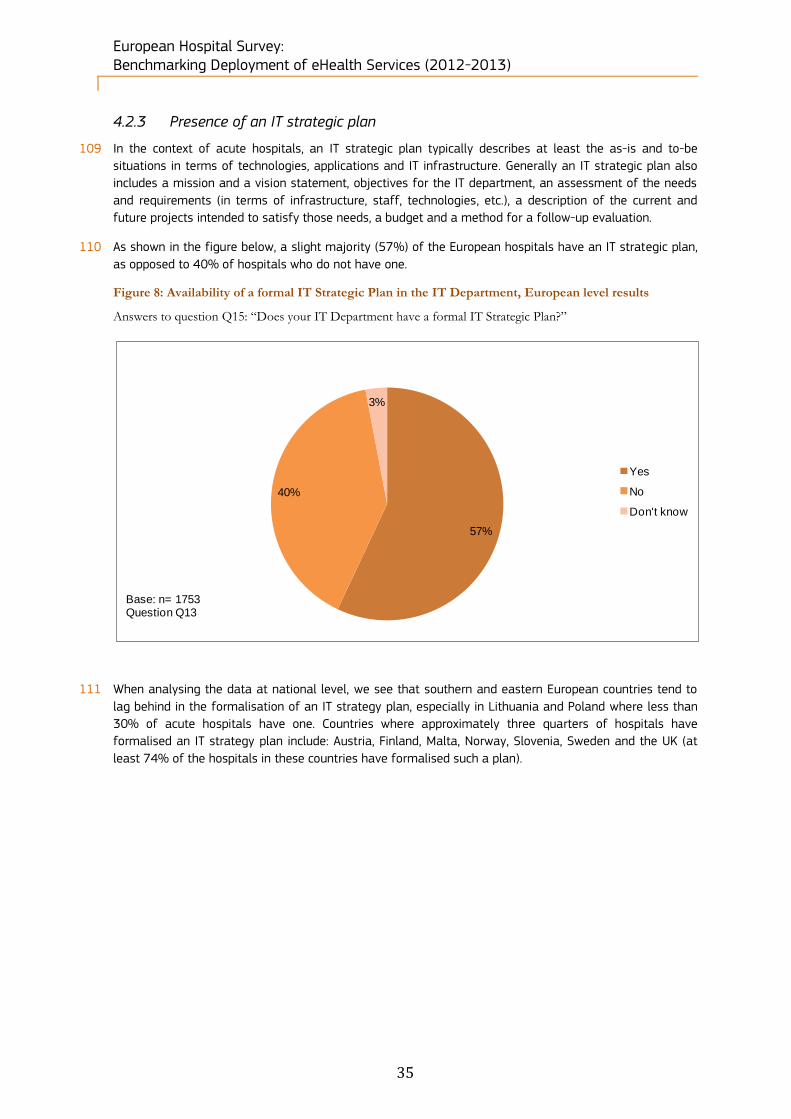
European Hospital Survey: Benchmarking Deployment of eHealth Services (2012-2013)
35
4.2.3 Presence of an IT strategic plan
109 In the context of acute hospitals, an IT strategic plan typically describes at least the as-is and to-be
situations in terms of technologies, applications and IT infrastructure. Generally an IT strategic plan also
includes a mission and a vision statement, objectives for the IT department, an assessment of the needs
and requirements (in terms of infrastructure, staff, technologies, etc.), a description of the current and
future projects intended to satisfy those needs, a budget and a method for a follow-up evaluation.
110 As shown in the figure below, a slight majority (57%) of the European hospitals have an IT strategic plan,
as opposed to 40% of hospitals who do not have one.
Figure 8: Availability of a formal IT Strategic Plan in the IT Department, European level results
Answers to question Q15: “Does your IT Department have a formal IT Strategic Plan?”
111 When analysing the data at national level, we see that southern and eastern European countries tend to
lag behind in the formalisation of an IT strategy plan, especially in Lithuania and Poland where less than
30% of acute hospitals have one. Countries where approximately three quarters of hospitals have
formalised an IT strategy plan include: Austria, Finland, Malta, Norway, Slovenia, Sweden and the UK (at
least 74% of the hospitals in these countries have formalised such a plan).
57%
40%
3%
Yes
No
Don't know
Base: n= 1753Question Q13

European Hospital Survey: Benchmarking Deployment of eHealth Services (2012-2013)
36
Figure 9: Availability of a formal IT Strategic Plan in the IT Department, Country-level results
Answers to question Q15: “Does your IT Department have a formal IT Strategic Plan?”
58%
58%
79%
56%
39%
64%
62%
62%
73%
64%
77%
71%
55%
45%
47%
44%
57%
55%
61%
23%
67%
100%
73%
83%
28%
63%
52%
34%
83%
68%
76%
98%
42%
42%
21%
44%
61%
36%
38%
38%
27%
36%
23%
29%
45%
55%
53%
56%
43%
45%
39%
77%
33%
27%
17%
72%
37%
48%
66%
17%
32%
24%
2%
0% 10% 20% 30% 40% 50% 60% 70% 80% 90% 100%
EU27+3
EU27
Austria
Belgium
Bulgaria
Croatia
Cyprus
Czech republic
Denmark
Estonia
Finland
France
Germany
Greece
Hungary
Iceland
Ireland
Italy
Latvia
Lithuania
Luxembourg
Malta
Netherlands
Norway
Poland
Portugal
Romania
Slovakia
Slovenia
Spain
Sweden
United Kingdom
Yes NoBase: n = 1698Question Q15
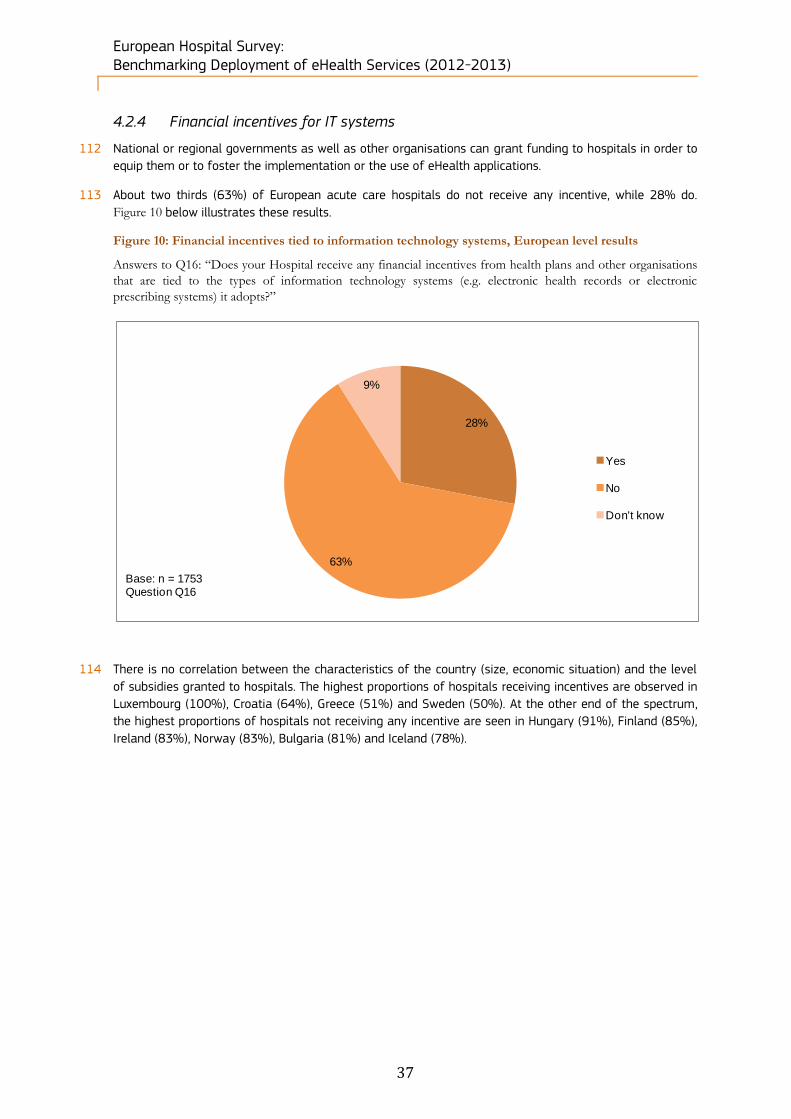
European Hospital Survey: Benchmarking Deployment of eHealth Services (2012-2013)
37
4.2.4 Financial incentives for IT systems
112 National or regional governments as well as other organisations can grant funding to hospitals in order to
equip them or to foster the implementation or the use of eHealth applications.
113 About two thirds (63%) of European acute care hospitals do not receive any incentive, while 28% do.
Figure 10 below illustrates these results.
Figure 10: Financial incentives tied to information technology systems, European level results
Answers to Q16: “Does your Hospital receive any financial incentives from health plans and other organisations
that are tied to the types of information technology systems (e.g. electronic health records or electronic
prescribing systems) it adopts?”
114 There is no correlation between the characteristics of the country (size, economic situation) and the level
of subsidies granted to hospitals. The highest proportions of hospitals receiving incentives are observed in
Luxembourg (100%), Croatia (64%), Greece (51%) and Sweden (50%). At the other end of the spectrum,
the highest proportions of hospitals not receiving any incentive are seen in Hungary (91%), Finland (85%),
Ireland (83%), Norway (83%), Bulgaria (81%) and Iceland (78%).
28%
63%
9%
Yes
No
Don't know
Base: n = 1753Question Q16
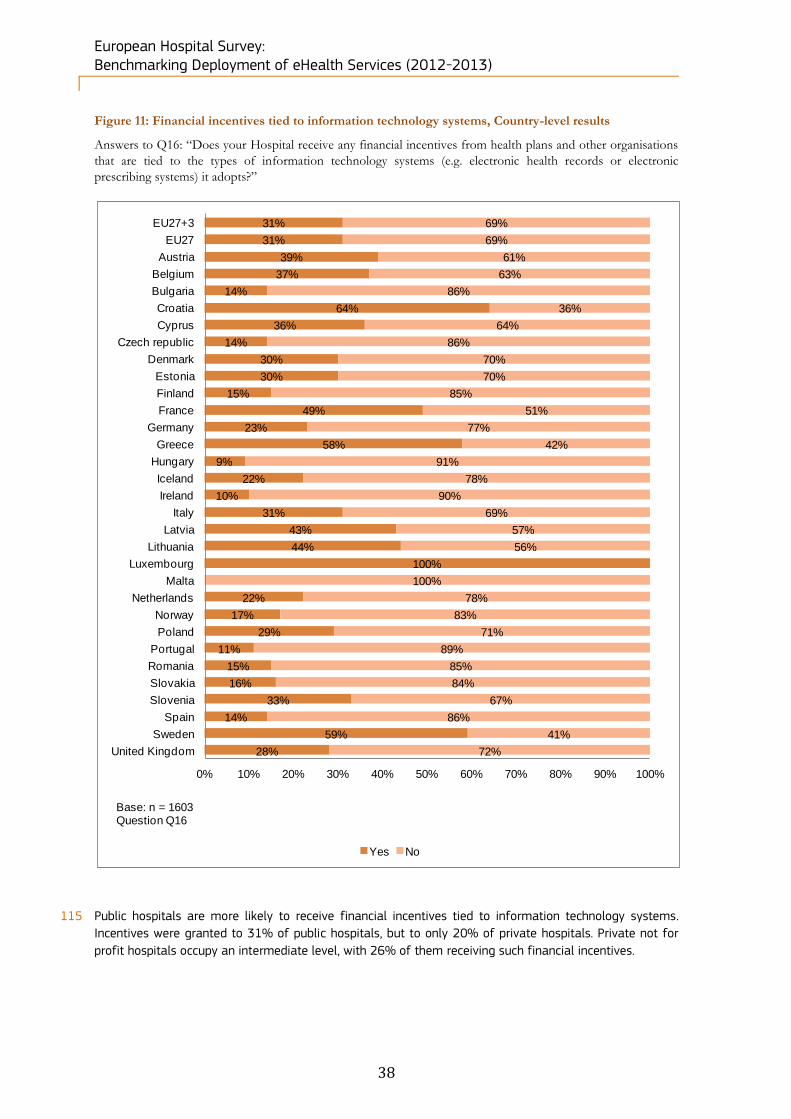
European Hospital Survey: Benchmarking Deployment of eHealth Services (2012-2013)
38
Figure 11: Financial incentives tied to information technology systems, Country-level results
Answers to Q16: “Does your Hospital receive any financial incentives from health plans and other organisations
that are tied to the types of information technology systems (e.g. electronic health records or electronic
prescribing systems) it adopts?”
115 Public hospitals are more likely to receive financial incentives tied to information technology systems.
Incentives were granted to 31% of public hospitals, but to only 20% of private hospitals. Private not for
profit hospitals occupy an intermediate level, with 26% of them receiving such financial incentives.
31%
31%
39%
37%
14%
64%
36%
14%
30%
30%
15%
49%
23%
58%
9%
22%
10%
31%
43%
44%
100%
22%
17%
29%
11%
15%
16%
33%
14%
59%
28%
69%
69%
61%
63%
86%
36%
64%
86%
70%
70%
85%
51%
77%
42%
91%
78%
90%
69%
57%
56%
100%
78%
83%
71%
89%
85%
84%
67%
86%
41%
72%
0% 10% 20% 30% 40% 50% 60% 70% 80% 90% 100%
EU27+3
EU27
Austria
Belgium
Bulgaria
Croatia
Cyprus
Czech republic
Denmark
Estonia
Finland
France
Germany
Greece
Hungary
Iceland
Ireland
Italy
Latvia
Lithuania
Luxembourg
Malta
Netherlands
Norway
Poland
Portugal
Romania
Slovakia
Slovenia
Spain
Sweden
United Kingdom
Yes No
Base: n = 1603Question Q16
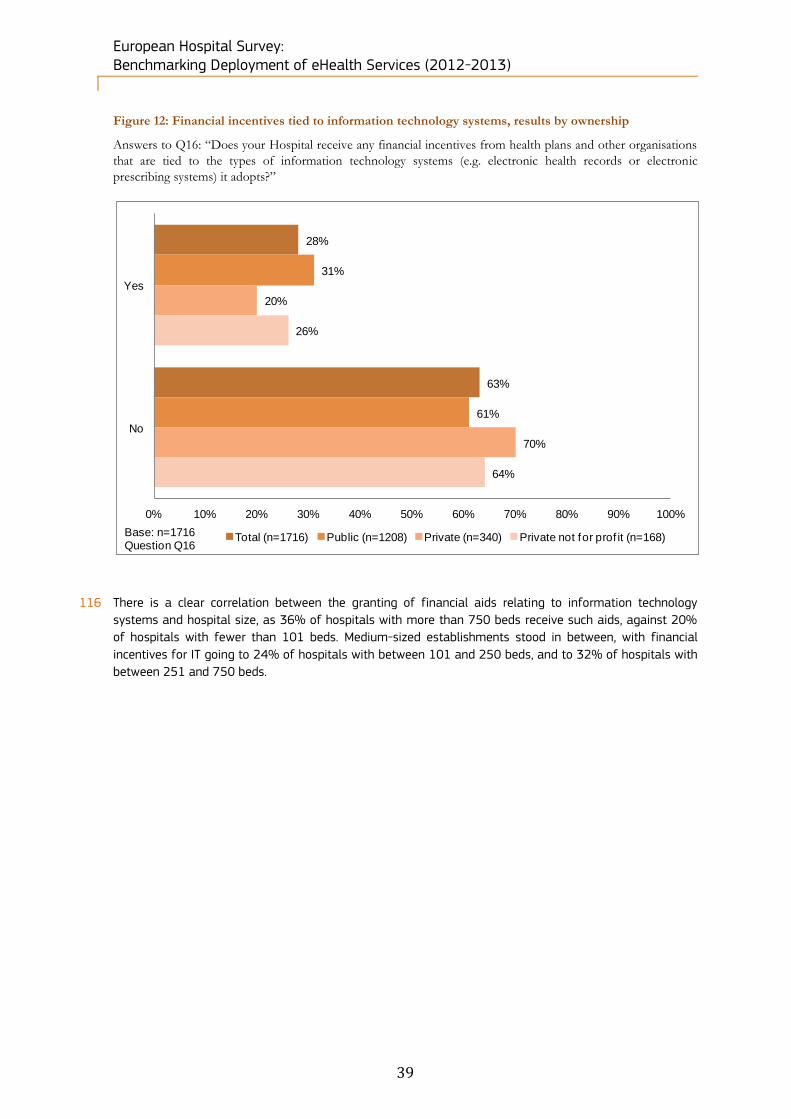
European Hospital Survey: Benchmarking Deployment of eHealth Services (2012-2013)
39
Figure 12: Financial incentives tied to information technology systems, results by ownership
Answers to Q16: “Does your Hospital receive any financial incentives from health plans and other organisations
that are tied to the types of information technology systems (e.g. electronic health records or electronic
prescribing systems) it adopts?”
116 There is a clear correlation between the granting of financial aids relating to information technology
systems and hospital size, as 36% of hospitals with more than 750 beds receive such aids, against 20%
of hospitals with fewer than 101 beds. Medium-sized establishments stood in between, with financial
incentives for IT going to 24% of hospitals with between 101 and 250 beds, and to 32% of hospitals with
between 251 and 750 beds.
28%
63%
31%
61%
20%
70%
26%
64%
0% 10% 20% 30% 40% 50% 60% 70% 80% 90% 100%
Yes
No
Total (n=1716) Public (n=1208) Private (n=340) Private not for prof it (n=168)Base: n=1716 Question Q16
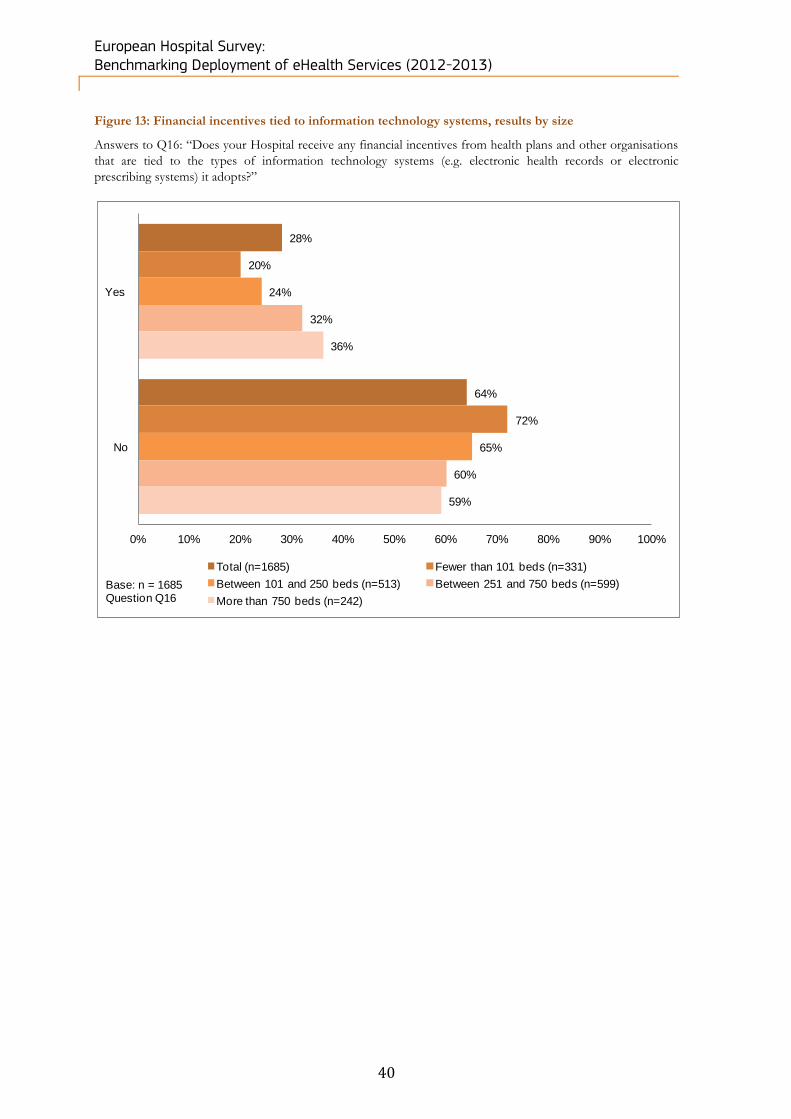
European Hospital Survey: Benchmarking Deployment of eHealth Services (2012-2013)
40
Figure 13: Financial incentives tied to information technology systems, results by size
Answers to Q16: “Does your Hospital receive any financial incentives from health plans and other organisations
that are tied to the types of information technology systems (e.g. electronic health records or electronic
prescribing systems) it adopts?”
28%
64%
20%
72%
24%
65%
32%
60%
36%
59%
0% 10% 20% 30% 40% 50% 60% 70% 80% 90% 100%
Yes
No
Total (n=1685) Fewer than 101 beds (n=331)
Between 101 and 250 beds (n=513) Between 251 and 750 beds (n=599)
More than 750 beds (n=242)
Base: n = 1685Question Q16

European Hospital Survey: Benchmarking Deployment of eHealth Services (2012-2013)
41
4.3 Block B. ICT infrastructure
117 Hospitals, national and regional governments and the European Commission have designed and
implemented policies to foster systems connectivity. The cross-border healthcare61 Directive requires
Member States to connect healthcare providers throughout their territory (specifically the European Union
“shall support and facilitate cooperation and the exchange of information among Member States working
within a voluntary network connecting national authorities responsible for eHealth designated by the
Member States”). This is intended to facilitate the transfer of healthcare data across borders.
4.3.1 Presence of a computerised system
118 Questions Q17 and Q18 relate to ICT connections in acute care hospitals. Question Q17 deals with the
type of computer system used.
119 Almost all hospitals (96%) have a computer system as part of a hospital-wide computer system or
network. The majority (62%) of European acute care hospitals have a computer system that is limited to
the hospital, while 19% have connected their computer system with the systems of other hospitals; 15%
of the surveyed hospitals have a nationally or regionally connected computer system. These results are
very similar to those of the previous survey, in which 66% of the surveyed hospitals had an independent
computer system, 17% had a computer system connected to the systems of other hospitals or other
hospital sites and 14% had a computer system which was connected nationally or regionally. The figure
below illustrates the 2012 survey results.
61 Directive 2011/24/EU of the European Parliament and of the Council of 9 March 2011 on the application of patients’ rights in
cross-border healthcare.
Key findings of this survey block: Most European acute care hospitals have an independent hospital-wide computer system. Among the 34%
of hospitals with a computer system that is part of a network, a slight majority are connected to the
systems of other hospitals, while the remainder are connected at national or regional level.
Hospitals in Eastern European countries tend to lag behind as regards the interconnectivity of their
computer systems, while Nordic countries generally perform well.
Almost 80% of the hospitals surveyed are externally connected, the majority of which use an extranet
rather than a value-added network or proprietary infrastructure. Hospitals in Central and Eastern
European countries are lagging behind in terms of external connections.
On average, hospitals are not well equipped in terms of internet connections, as over half (56%) have a
broadband connection below 50 Mbps, and only 16% have a fast connection above 100 Mbps.
Eastern European countries generally accounted for a higher proportion of hospitals with a narrowband
connection, while Nordic and Benelux countries recorded the highest proportion of hospitals with a fast
broadband connection.
Public hospitals and larger hospitals are generally better equipped than Private establishments and small
and medium-sized hospitals with respect to the type of internet connection they use.
Results regarding wireless communication are evenly distributed: 39% of hospitals have a single unified
wireless network able to support most applications, while 32% have no wireless communications. The
remainder have an individual wireless network.
Countries behind in the implementation of a wireless infrastructure in their hospitals are located in
Eastern, Southern and Central Europe, while those where it is most developed are the countries of
Northern and Western Europe.
Almost half of the surveyed hospitals have videoconferencing facilities. The countries where this
proportion is the highest are mainly located in Northern Europe, whereas countries lagging behind are
mostly located in Central and Eastern Europe.
Management of IT services is generally kept in-house rather than outsourced. Countries in which
outsourcing is most widely practiced are located in Western and Northern Europe.

European Hospital Survey: Benchmarking Deployment of eHealth Services (2012-2013)
42
Figure 14: Presence of a computer system in the hospital, European level results
Answers to Q17: “Do you have a computer system in your hospital?”
120 At national level, Cyprus recorded the highest proportion of PCs not being part of a hospital-wide system
(23%). Eastern European countries also tend to lag behind as regards the interconnectivity of hospital
computer systems: a comparatively high share of hospitals in Lithuania (16%), Poland (13%) and Romania
(8%) declared having personal computers that are not part of a hospital-wide system. In contrast, Nordic
countries display a higher proportion of hospitals having a computer system connected nationally or
regionally, as is the case in more than half of the surveyed hospitals of Denmark, Iceland and Sweden. In
Ireland, Malta, Spain and the UK, results are also largely above the European average.
3%
62%
19%
15%
1%
PC's not part of hospital-wide system
Independent hospital-wide computer system
Computer systems part of a network of dif ferent hospitals
Computers systems part of a regional or national network
Don't know
Base: n = 1753Question Q17

European Hospital Survey: Benchmarking Deployment of eHealth Services (2012-2013)
43
Figure 15: Presence of a computer system in the hospital, Country-level results
Answers to Q17: “Do you have a computer system in your hospital?”
3%
3%
2%
2%
27%
2%
2%
1%
2%
5%
16%
4%
13%
8%
3%
1%
62%
62%
37%
70%
89%
100%
64%
97%
12%
83%
46%
72%
62%
64%
67%
33%
48%
51%
84%
41%
67%
80%
67%
76%
60%
84%
97%
100%
40%
19%
12%
19%
20%
37%
20%
2%
3%
31%
27%
18%
32%
13%
33%
11%
13%
24%
11%
31%
33%
50%
12%
17%
5%
22%
7%
19%
31%
47%
15%
15%
26%
8%
8%
9%
56%
17%
27%
8%
6%
21%
56%
39%
23%
12%
50%
4%
17%
6%
18%
1%
41%
50%
41%
0% 10% 20% 30% 40% 50% 60% 70% 80% 90% 100%
EU27+3
EU27
Austria
Belgium
Bulgaria
Croatia
Cyprus
Czech republic
Denmark
Estonia
Finland
France
Germany
Greece
Hungary
Iceland
Ireland
Italy
Latvia
Lithuania
Luxembourg
Malta
Netherlands
Norway
Poland
Portugal
Romania
Slovakia
Slovenia
Spain
Sweden
United Kingdom
PC's not part of hospital-wide system
Independent hospital-wide computer system
Computer systems part of a network of dif ferent hospitals
Computers systems part of a regional or national network
Base: n = 1740Question Q17

European Hospital Survey: Benchmarking Deployment of eHealth Services (2012-2013)
44
4.3.2 Availability of external connections
121 Among the hospitals which do have a computer system, 19% are not externally connected, as shown in
Figure 16. This result is similar to what was observed in the previous survey (18%). For those hospitals
that have a computer system which is externally connected, the majority use an extranet (52% of the
overall answers) and/or a value-added network or proprietary infrastructure (35% of the respondents).
Figure 16: Presence of an externally connected computer system, European level results
Answers to Q18: Is your hospital computer system externally connected…?”
122 Central and Eastern European countries (such as Bulgaria, Czech Republic, Hungary, Poland, Slovakia) and
Malta have the highest proportion of hospitals not externally connected (at least 35% of answers).
Conversely, all the interviewed hospitals in Croatia, Estonia, Luxembourg and Norway are externally
connected. There seems to be no country specificity (size, geographical situation within Europe, economic
situation) that clearly influences the decision to opt for an extranet or a value-added network.
52%
35%
18%
3%
0% 10% 20% 30% 40% 50% 60% 70% 80% 90% 100%
Yes, through an Extranet (over the Internet, using a secure connection)
Yes, through a value added network or proprietary inf rastructure
No, our computer system is not externally connected
Don’t know
Base: n = 1687Question Q18Multiple answers allowed

European Hospital Survey: Benchmarking Deployment of eHealth Services (2012-2013)
45
Figure 17: Presence of an externally connected computer system, Country-level results
Answers to Q18: Is your hospital computer system externally connected…?”
Base: n=1687
Question Q18
Multiple
answ ers
allow ed
Through an Extranet (over the
Internet, using a secure
connection)
Through a value added netw ork
or proprietary infrastructure
Our computer system is not
externally connected
EU27+3 52% 35% 18%
EU27 52% 36% 18%
Austria 65% 53% 9%
Belgium 63% 39% 4%
Bulgaria 48% 13% 38%
Croatia 100% 0% 0%
Cyprus 50% 0% 25%
Czech
republic 54% 13% 44%
Denmark 56% 31% 6%
Estonia 75% 25% 0%
Finland 50% 46% 15%
France 40% 41% 24%
Germany 60% 41% 10%
Greece 55% 18% 24%
Hungary 35% 35% 37%
Iceland 78% 11% 11%
Ireland 43% 30% 17%
Italy 68% 33% 11%
Latvia 78% 11% 6%
Lithuania 70% 11% 11%
Luxembourg 67% 33% 0%
Malta 50% 0% 50%
Netherlands 50% 42% 21%
Norw ay 83% 33% 0%
Poland 8% 55% 35%
Portugal 45% 52% 15%
Romania 83% 10% 8%
Slovakia 31% 19% 56%
Slovenia 83% 17% 17%
Spain 52% 53% 7%
Sw eden 69% 27% 15%
United
Kingdom 65% 22% 4%
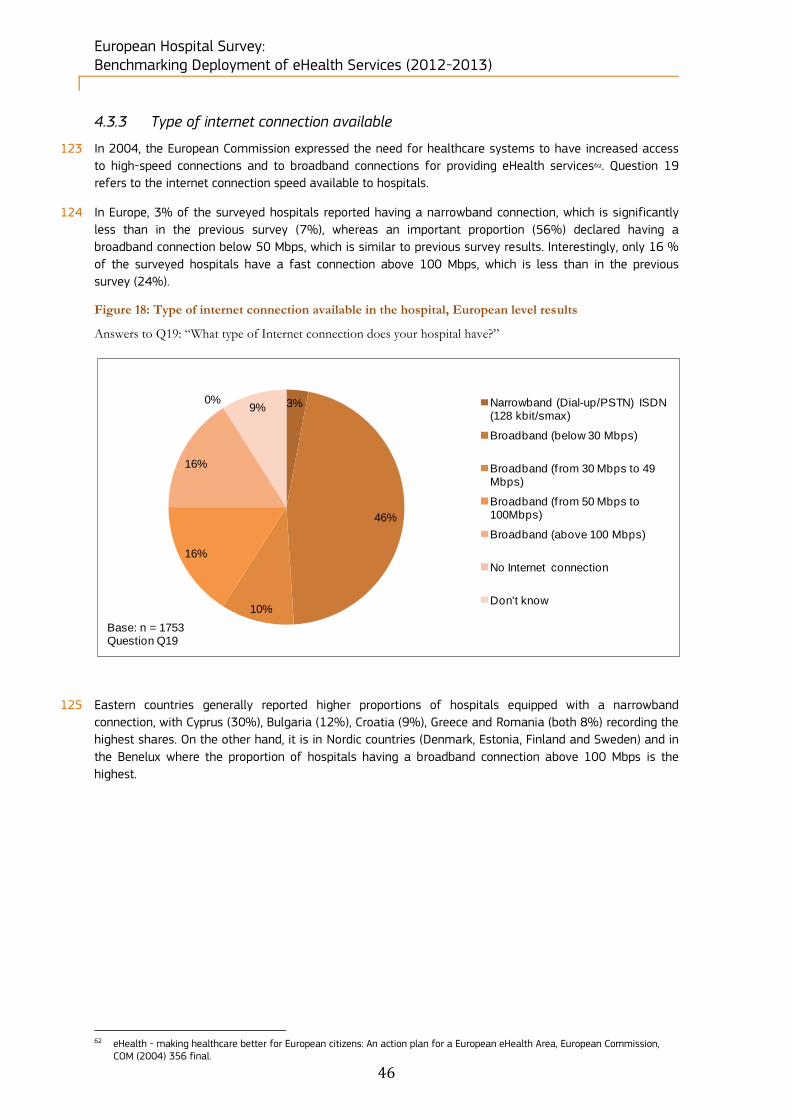
European Hospital Survey: Benchmarking Deployment of eHealth Services (2012-2013)
46
4.3.3 Type of internet connection available
123 In 2004, the European Commission expressed the need for healthcare systems to have increased access
to high-speed connections and to broadband connections for providing eHealth services62. Question 19
refers to the internet connection speed available to hospitals.
124 In Europe, 3% of the surveyed hospitals reported having a narrowband connection, which is significantly
less than in the previous survey (7%), whereas an important proportion (56%) declared having a
broadband connection below 50 Mbps, which is similar to previous survey results. Interestingly, only 16 %
of the surveyed hospitals have a fast connection above 100 Mbps, which is less than in the previous
survey (24%).
Figure 18: Type of internet connection available in the hospital, European level results
Answers to Q19: “What type of Internet connection does your hospital have?”
125 Eastern countries generally reported higher proportions of hospitals equipped with a narrowband
connection, with Cyprus (30%), Bulgaria (12%), Croatia (9%), Greece and Romania (both 8%) recording the
highest shares. On the other hand, it is in Nordic countries (Denmark, Estonia, Finland and Sweden) and in
the Benelux where the proportion of hospitals having a broadband connection above 100 Mbps is the
highest.
62 eHealth - making healthcare better for European citizens: An action plan for a European eHealth Area, European Commission,
COM (2004) 356 final.
3%
46%
10%
16%
16%
0%9% Narrowband (Dial-up/PSTN) ISDN
(128 kbit/smax)
Broadband (below 30 Mbps)
Broadband (f rom 30 Mbps to 49 Mbps)
Broadband (f rom 50 Mbps to 100Mbps)
Broadband (above 100 Mbps)
No Internet connection
Don't know
Base: n = 1753Question Q19

European Hospital Survey: Benchmarking Deployment of eHealth Services (2012-2013)
47
Figure 19: Type of internet connection available in the hospital, Country-level results
Answers to Q19: “What type of Internet connection does your hospital have?”
3%
3%
12%
9%
30%
4%
2%
8%
5%
2%
6%
5%
3%
8%
1%
5%
50%
50%
45%
38%
25%
55%
60%
41%
12%
9%
75%
48%
66%
67%
50%
38%
43%
22%
48%
100%
12%
20%
82%
21%
42%
61%
50%
37%
11%
11%
11%
18%
9%
17%
9%
19%
18%
8%
7%
19%
13%
9%
16%
39%
6%
8%
3%
11%
15%
3%
7%
3%
18%
18%
12%
24%
35%
9%
10%
22%
9%
42%
3%
13%
10%
12%
38%
43%
23%
28%
29%
42%
40%
8%
42%
24%
24%
33%
25%
32%
30%
18%
18%
22%
29%
12%
18%
19%
88%
64%
50%
11%
17%
2%
12%
12%
14%
16%
6%
16%
100%
38%
40%
3%
24%
11%
12%
17%
29%
68%
51%
0% 10% 20% 30% 40% 50% 60% 70% 80% 90% 100%
EU27+3
EU27
Austria
Belgium
Bulgaria
Croatia
Cyprus
Czech republic
Denmark
Estonia
Finland
France
Germany
Greece
Hungary
Iceland
Ireland
Italy
Latvia
Lithuania
Luxembourg
Malta
Netherlands
Norway
Poland
Portugal
Romania
Slovakia
Slovenia
Spain
Sweden
United Kingdom
Narrowband (Dial-up/PSTN) ISDN (128 kbit/smax)Broadband (below 30 Mbps)Broadband (f rom 30 Mbps to 49 Mbps)Broadband (f rom 50 Mbps to 100Mbps)Broadband (above 100 Mbps)
Base: n= 1598Question Q19
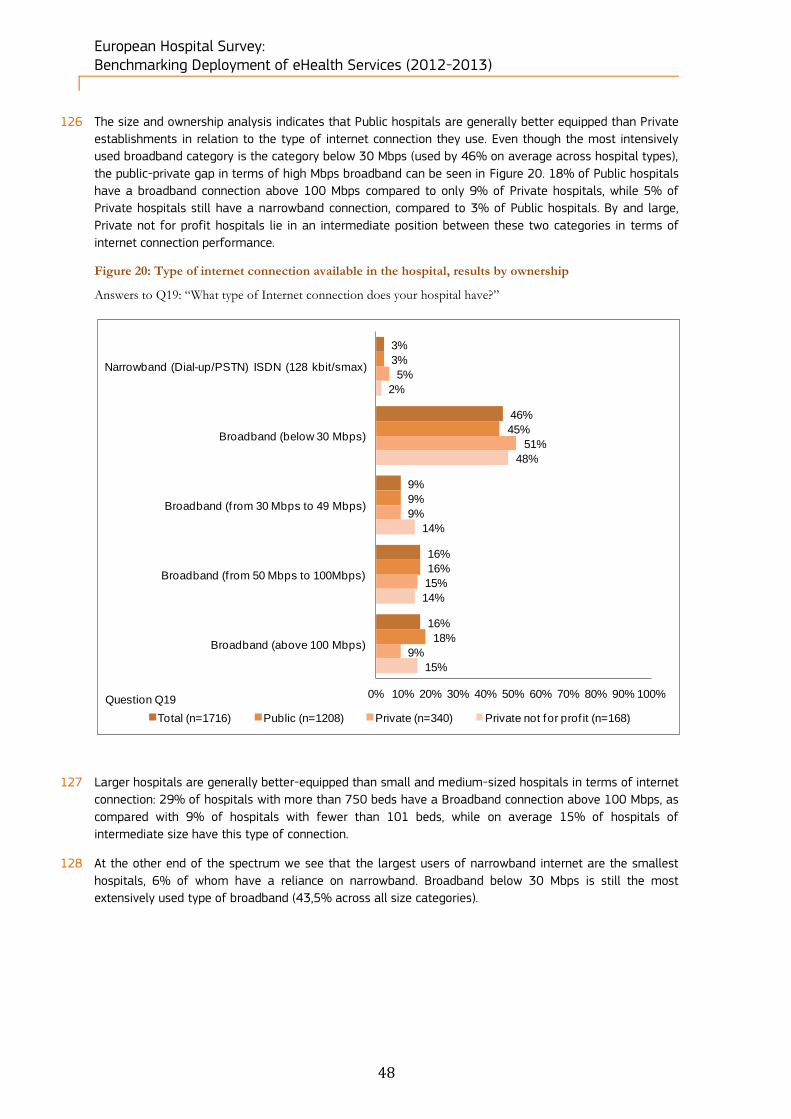
European Hospital Survey: Benchmarking Deployment of eHealth Services (2012-2013)
48
126 The size and ownership analysis indicates that Public hospitals are generally better equipped than Private
establishments in relation to the type of internet connection they use. Even though the most intensively
used broadband category is the category below 30 Mbps (used by 46% on average across hospital types),
the public-private gap in terms of high Mbps broadband can be seen in Figure 20. 18% of Public hospitals
have a broadband connection above 100 Mbps compared to only 9% of Private hospitals, while 5% of
Private hospitals still have a narrowband connection, compared to 3% of Public hospitals. By and large,
Private not for profit hospitals lie in an intermediate position between these two categories in terms of
internet connection performance.
Figure 20: Type of internet connection available in the hospital, results by ownership
Answers to Q19: “What type of Internet connection does your hospital have?”
127 Larger hospitals are generally better-equipped than small and medium-sized hospitals in terms of internet
connection: 29% of hospitals with more than 750 beds have a Broadband connection above 100 Mbps, as
compared with 9% of hospitals with fewer than 101 beds, while on average 15% of hospitals of
intermediate size have this type of connection.
128 At the other end of the spectrum we see that the largest users of narrowband internet are the smallest
hospitals, 6% of whom have a reliance on narrowband. Broadband below 30 Mbps is still the most
extensively used type of broadband (43,5% across all size categories).
3%
46%
9%
16%
16%
3%
45%
9%
16%
18%
5%
51%
9%
15%
9%
2%
48%
14%
14%
15%
0% 10% 20% 30% 40% 50% 60% 70% 80% 90% 100%
Narrowband (Dial-up/PSTN) ISDN (128 kbit/smax)
Broadband (below 30 Mbps)
Broadband (f rom 30 Mbps to 49 Mbps)
Broadband (f rom 50 Mbps to 100Mbps)
Broadband (above 100 Mbps)
Total (n=1716) Public (n=1208) Private (n=340) Private not for prof it (n=168)
Question Q19
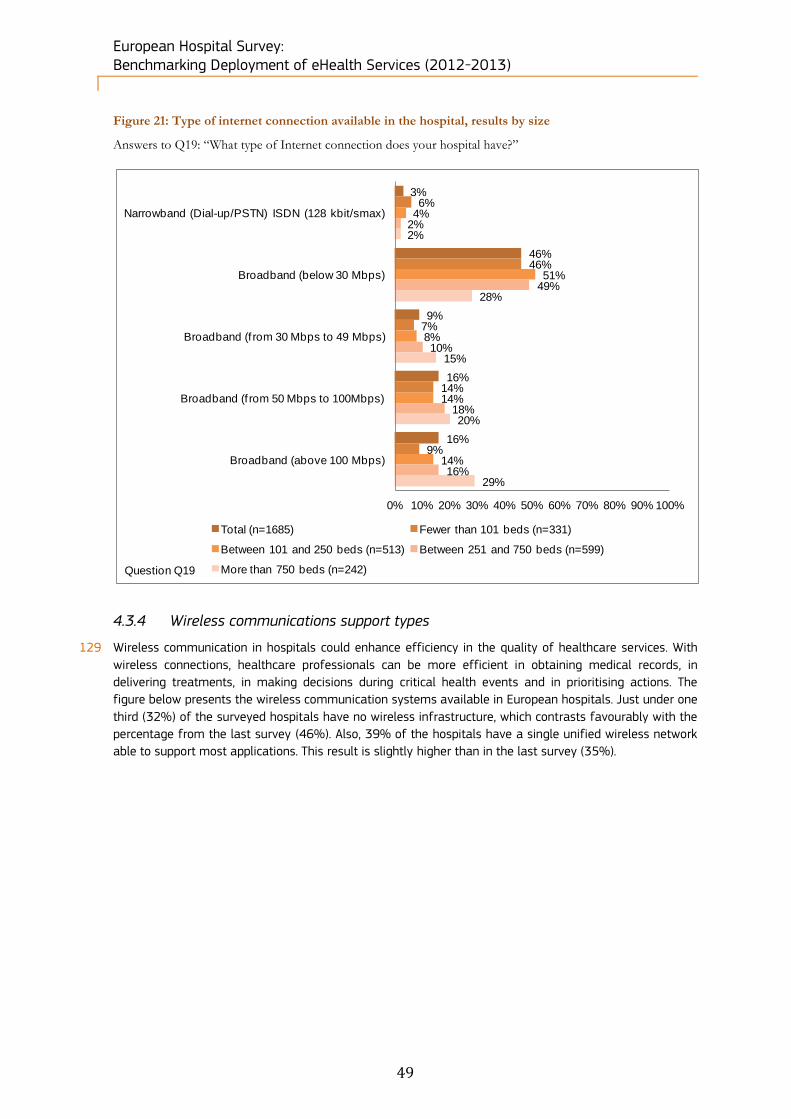
European Hospital Survey: Benchmarking Deployment of eHealth Services (2012-2013)
49
Figure 21: Type of internet connection available in the hospital, results by size
Answers to Q19: “What type of Internet connection does your hospital have?”
4.3.4 Wireless communications support types
129 Wireless communication in hospitals could enhance efficiency in the quality of healthcare services. With
wireless connections, healthcare professionals can be more efficient in obtaining medical records, in
delivering treatments, in making decisions during critical health events and in prioritising actions. The
figure below presents the wireless communication systems available in European hospitals. Just under one
third (32%) of the surveyed hospitals have no wireless infrastructure, which contrasts favourably with the
percentage from the last survey (46%). Also, 39% of the hospitals have a single unified wireless network
able to support most applications. This result is slightly higher than in the last survey (35%).
3%
46%
9%
16%
16%
6%
46%
7%
14%
9%
4%
51%
8%
14%
14%
2%
49%
10%
18%
16%
2%
28%
15%
20%
29%
0% 10% 20% 30% 40% 50% 60% 70% 80% 90% 100%
Narrowband (Dial-up/PSTN) ISDN (128 kbit/smax)
Broadband (below 30 Mbps)
Broadband (f rom 30 Mbps to 49 Mbps)
Broadband (f rom 50 Mbps to 100Mbps)
Broadband (above 100 Mbps)
Total (n=1685) Fewer than 101 beds (n=331)
Between 101 and 250 beds (n=513) Between 251 and 750 beds (n=599)
More than 750 beds (n=242)Question Q19

European Hospital Survey: Benchmarking Deployment of eHealth Services (2012-2013)
50
Figure 22: Presence and type of wireless communication supported by the hospital, European level
results
Answers to Q20: “How does your hospital support wireless communications?”
130 Countries running late in the implementation of a wireless infrastructure in their hospitals are located in
Eastern Europe (Poland 71%; Lithuania 62%; Romania and Hungary 60%), Southern Europe (Greece 68%;
Malta 50%) and Central Europe (Hungary 60%; Czech Republic 51%).The countries where wireless
infrastructure is most developed — with a unified network supporting most applications — are
Luxembourg (100%), Denmark (80%) and Sweden (76%).
39%
27%
32%
2%
Single unif ied wireless network supporting most applications
Individual wireless networks for discrete applications
No wireless inf rastructure
Don't know
Base: n = 1753Question Q20
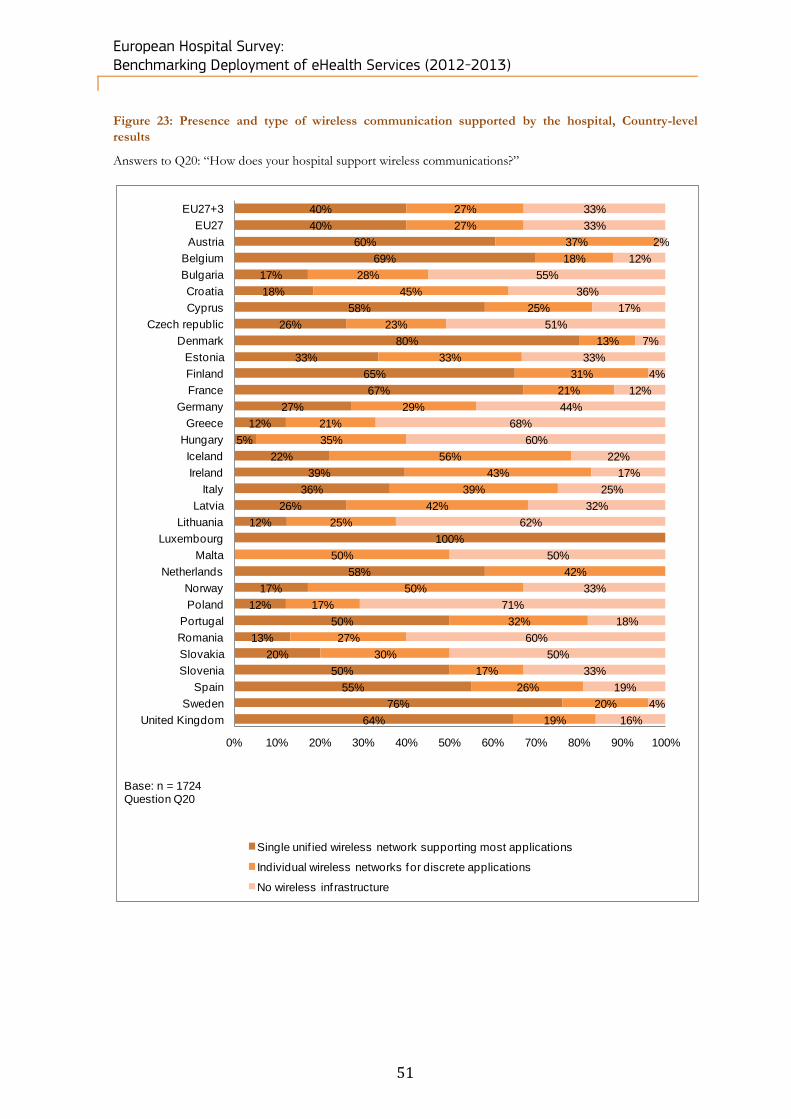
European Hospital Survey: Benchmarking Deployment of eHealth Services (2012-2013)
51
Figure 23: Presence and type of wireless communication supported by the hospital, Country-level
results
Answers to Q20: “How does your hospital support wireless communications?”
40%
40%
60%
69%
17%
18%
58%
26%
80%
33%
65%
67%
27%
12%
5%
22%
39%
36%
26%
12%
100%
58%
17%
12%
50%
13%
20%
50%
55%
76%
64%
27%
27%
37%
18%
28%
45%
25%
23%
13%
33%
31%
21%
29%
21%
35%
56%
43%
39%
42%
25%
50%
42%
50%
17%
32%
27%
30%
17%
26%
20%
19%
33%
33%
2%
12%
55%
36%
17%
51%
7%
33%
4%
12%
44%
68%
60%
22%
17%
25%
32%
62%
50%
33%
71%
18%
60%
50%
33%
19%
4%
16%
0% 10% 20% 30% 40% 50% 60% 70% 80% 90% 100%
EU27+3
EU27
Austria
Belgium
Bulgaria
Croatia
Cyprus
Czech republic
Denmark
Estonia
Finland
France
Germany
Greece
Hungary
Iceland
Ireland
Italy
Latvia
Lithuania
Luxembourg
Malta
Netherlands
Norway
Poland
Portugal
Romania
Slovakia
Slovenia
Spain
Sweden
United Kingdom
Single unif ied wireless network supporting most applications
Individual wireless networks for discrete applications
No wireless inf rastructure
Base: n = 1724Question Q20

European Hospital Survey: Benchmarking Deployment of eHealth Services (2012-2013)
52
4.3.5 Videoconferencing
131 Hospital videoconferencing facilities can be used for a variety of applications, such as consultations with
other healthcare professionals, patient monitoring or consultations, continuing medical education, etc.
Videoconferencing allows better access to healthcare, including for people living in rural areas; it can also
reduce healthcare costs and improve efficiency by decreasing physicians’ on-site consultations and by
avoiding patient transfers.
132 Almost half (46%) of the surveyed hospitals have videoconferencing facilities. This result is higher than
that observed in the previous survey (39%).
Figure 24: Presence of videoconferencing facilities in the hospital, European level results
Answers to Q21: “Does your hospital have videoconferencing facilities (for home monitoring of patients, contact
with other institutions for administrative, medical or education purposes)?”
133 Hospital videoconferencing facilities are predominantly available in Northern Europe. More than 75% of
the surveyed hospitals in Denmark, Finland, Iceland, Ireland, the Netherlands, Sweden and the UK have
such facilities. Countries lagging behind are mostly located in Central/Eastern Europe (Bulgaria, Hungary,
Latvia, Poland and Slovakia) where less than one quarter of the hospitals have videoconferencing facilities.
45%
54%
1%
Yes
No
Don't know
Base: n = 1753Question Q21

European Hospital Survey: Benchmarking Deployment of eHealth Services (2012-2013)
53
Figure 25: Presence of videoconferencing facilities in the hospital, Country-level results
Answers to Q21: “Does your hospital have videoconferencing facilities (for home monitoring of patients, contact
with other institutions for administrative, medical or education purposes)?”
45%
45%
63%
46%
20%
73%
31%
32%
81%
67%
92%
60%
38%
25%
12%
78%
83%
40%
22%
50%
67%
50%
88%
67%
13%
34%
33%
15%
33%
56%
80%
84%
55%
55%
37%
54%
80%
27%
69%
68%
19%
33%
8%
40%
62%
75%
88%
22%
17%
60%
78%
50%
33%
50%
12%
33%
87%
66%
67%
85%
67%
44%
20%
16%
0% 10% 20% 30% 40% 50% 60% 70% 80% 90% 100%
EU27+3
EU27
Austria
Belgium
Bulgaria
Croatia
Cyprus
Czech republic
Denmark
Estonia
Finland
France
Germany
Greece
Hungary
Iceland
Ireland
Italy
Latvia
Lithuania
Luxembourg
Malta
Netherlands
Norway
Poland
Portugal
Romania
Slovakia
Slovenia
Spain
Sweden
United Kingdom
Yes No
Base: n = 1743Question Q21
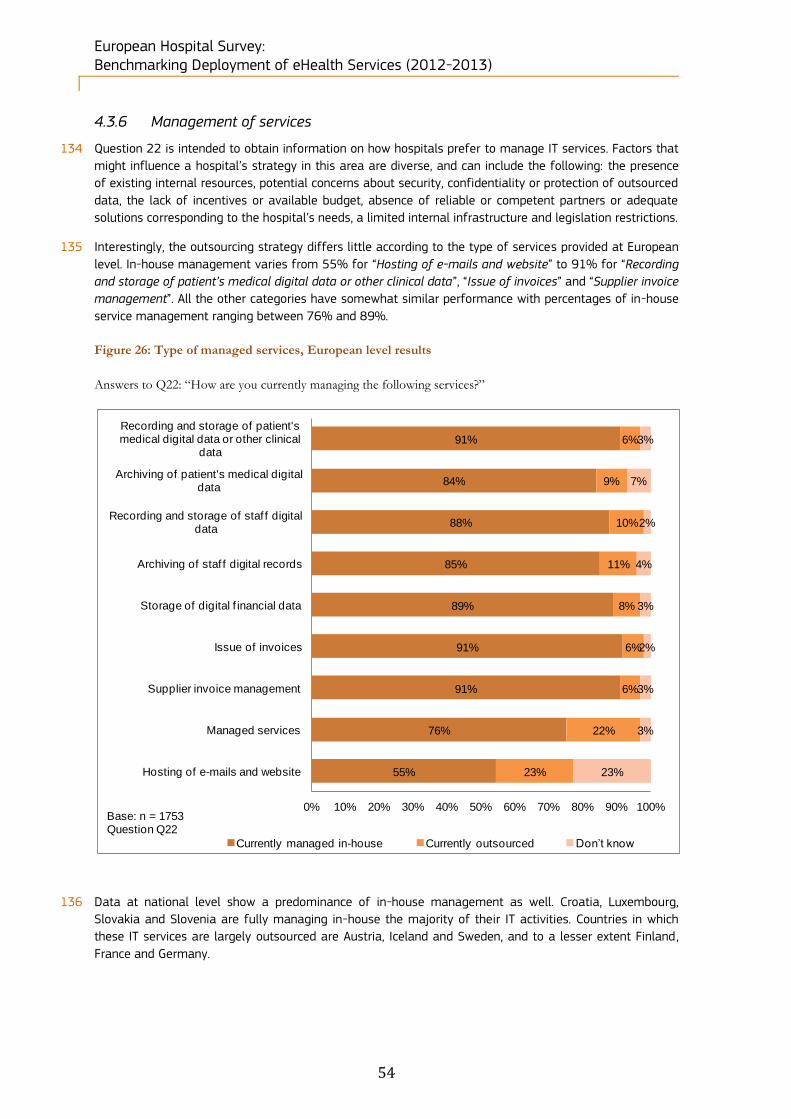
European Hospital Survey: Benchmarking Deployment of eHealth Services (2012-2013)
54
4.3.6 Management of services
134 Question 22 is intended to obtain information on how hospitals prefer to manage IT services. Factors that
might influence a hospital’s strategy in this area are diverse, and can include the following: the presence
of existing internal resources, potential concerns about security, confidentiality or protection of outsourced
data, the lack of incentives or available budget, absence of reliable or competent partners or adequate
solutions corresponding to the hospital’s needs, a limited internal infrastructure and legislation restrictions.
135 Interestingly, the outsourcing strategy differs little according to the type of services provided at European
level. In-house management varies from 55% for “Hosting of e-mails and website” to 91% for “Recording
and storage of patient’s medical digital data or other clinical data”, “Issue of invoices” and “Supplier invoice
management”. All the other categories have somewhat similar performance with percentages of in-house
service management ranging between 76% and 89%.
Figure 26: Type of managed services, European level results
Answers to Q22: “How are you currently managing the following services?”
136 Data at national level show a predominance of in-house management as well. Croatia, Luxembourg,
Slovakia and Slovenia are fully managing in-house the majority of their IT activities. Countries in which
these IT services are largely outsourced are Austria, Iceland and Sweden, and to a lesser extent Finland,
France and Germany.
91%
84%
88%
85%
89%
91%
91%
76%
55%
6%
9%
10%
11%
8%
6%
6%
22%
23%
3%
7%
2%
4%
3%
2%
3%
3%
23%
0% 10% 20% 30% 40% 50% 60% 70% 80% 90% 100%
Recording and storage of patient's medical digital data or other clinical
data
Archiving of patient's medical digital data
Recording and storage of staf f digital data
Archiving of staf f digital records
Storage of digital f inancial data
Issue of invoices
Supplier invoice management
Managed services
Hosting of e-mails and website
Currently managed in-house Currently outsourced Don’t know
Base: n = 1753Question Q22
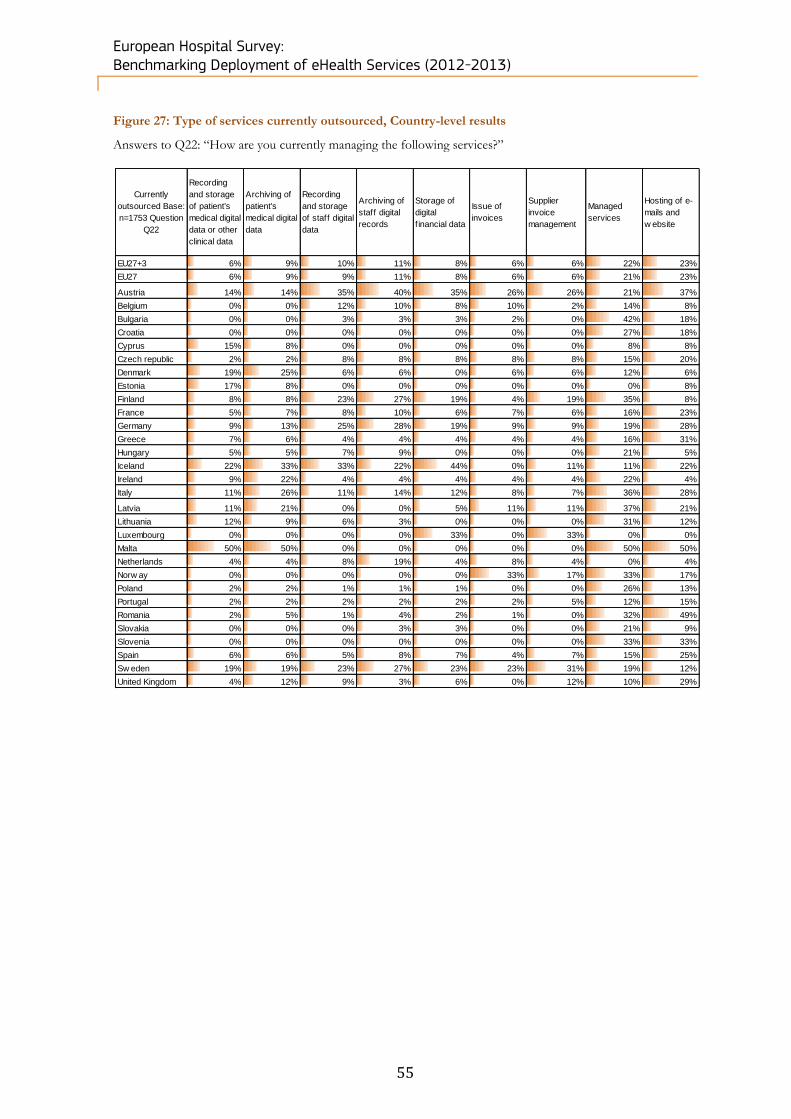
European Hospital Survey: Benchmarking Deployment of eHealth Services (2012-2013)
55
Figure 27: Type of services currently outsourced, Country-level results
Answers to Q22: “How are you currently managing the following services?”
Currently
outsourced Base:
n=1753 Question
Q22
Recording
and storage
of patient's
medical digital
data or other
clinical data
Archiving of
patient's
medical digital
data
Recording
and storage
of staff digital
data
Archiving of
staff digital
records
Storage of
digital
f inancial data
Issue of
invoices
Supplier
invoice
management
Managed
services
Hosting of e-
mails and
w ebsite
EU27+3 6% 9% 10% 11% 8% 6% 6% 22% 23%
EU27 6% 9% 9% 11% 8% 6% 6% 21% 23%
Austria 14% 14% 35% 40% 35% 26% 26% 21% 37%
Belgium 0% 0% 12% 10% 8% 10% 2% 14% 8%
Bulgaria 0% 0% 3% 3% 3% 2% 0% 42% 18%
Croatia 0% 0% 0% 0% 0% 0% 0% 27% 18%
Cyprus 15% 8% 0% 0% 0% 0% 0% 8% 8%
Czech republic 2% 2% 8% 8% 8% 8% 8% 15% 20%
Denmark 19% 25% 6% 6% 0% 6% 6% 12% 6%
Estonia 17% 8% 0% 0% 0% 0% 0% 0% 8%
Finland 8% 8% 23% 27% 19% 4% 19% 35% 8%
France 5% 7% 8% 10% 6% 7% 6% 16% 23%
Germany 9% 13% 25% 28% 19% 9% 9% 19% 28%
Greece 7% 6% 4% 4% 4% 4% 4% 16% 31%
Hungary 5% 5% 7% 9% 0% 0% 0% 21% 5%
Iceland 22% 33% 33% 22% 44% 0% 11% 11% 22%
Ireland 9% 22% 4% 4% 4% 4% 4% 22% 4%
Italy 11% 26% 11% 14% 12% 8% 7% 36% 28%
Latvia 11% 21% 0% 0% 5% 11% 11% 37% 21%
Lithuania 12% 9% 6% 3% 0% 0% 0% 31% 12%
Luxembourg 0% 0% 0% 0% 33% 0% 33% 0% 0%
Malta 50% 50% 0% 0% 0% 0% 0% 50% 50%
Netherlands 4% 4% 8% 19% 4% 8% 4% 0% 4%
Norw ay 0% 0% 0% 0% 0% 33% 17% 33% 17%
Poland 2% 2% 1% 1% 1% 0% 0% 26% 13%
Portugal 2% 2% 2% 2% 2% 2% 5% 12% 15%
Romania 2% 5% 1% 4% 2% 1% 0% 32% 49%
Slovakia 0% 0% 0% 3% 3% 0% 0% 21% 9%
Slovenia 0% 0% 0% 0% 0% 0% 0% 33% 33%
Spain 6% 6% 5% 8% 7% 4% 7% 15% 25%
Sw eden 19% 19% 23% 27% 23% 23% 31% 19% 12%
United Kingdom 4% 12% 9% 3% 6% 0% 12% 10% 29%
European Hospital Survey: Benchmarking Deployment of eHealth Services (2012-2013)
56
4.4 Block C. ICT applications
137 This section covers questions Q23 to Q27 referring to the type of Electronic Medical/Health/Patient Record
used, Picture Archiving and Communication System as well as systems and applications integrated by the
hospital. These areas reflect the sophistication of the data management systems employed by acute
hospitals across Europe as well as the approximate level of digitisation of records and departure from
paper-based systems.
4.4.1 Electronic Medical/Health/Patient Record
138 An electronic record is a file containing information about the patient’s current health and history. Patient
records used to be kept as hard paper copies, but this method is largely being phased out. With the
development of IT healthcare professionals have started to store patient data virtually with Electronic
Medical Records (EMRs), Electronic Health Records (EHRs) and Electronic Patient Records (EPRs).
139 EMR/EHR/EPR refers to three different definitions:
An EMR is the electronic record of health-related information on an individual that is created, gathered,
managed, and consulted by licensed clinicians and staff from a single organisation who are involved in the individual's health and care.63
An EHR is the aggregate electronic record of health-related information on an individual that is created
and gathered cumulatively across more than one health care organisation and is managed and consulted by licensed clinicians and staff involved in the individual's health and care. 64
An EPR is a record about an individual patient stored in a healthcare provider's computer, in a
database that is typically the property of the provider. It will usually contain the patient's demographic data and medical information collected only when the patient visits that provider.65
63 http://www.nursetogether.com/nurse-informatics-spotlight-emr-vs-ehr, accessed 20 June 2013 64 Ibidem. 65 http://www.avazmd.com/resources/emr_cpr_ehr.html, accessed 20 June 2013
Key findings of this survey block:
More than 80% of the surveyed hospitals use an EMR/EHR/EPR system. More specifically 55% use a
hospital-wide EMR/EHR/EPR.
Southern and Eastern European countries tend to use EMR/EHR/EPRs the least.
The distribution of EMR/EHR/EPR availability between private and the public hospitals is comparable.
The bigger hospitals are, the more they tend to have EMR/EHR/EP and the more they tend to share
information.
The vast majority of hospitals (90%) still do not provide online access to their electronic patient records.
70% of the European acute care hospitals have a Picture Archiving and Communication System (PACS).
Forerunners in PACS usage are mainly situated in Western and Northern Europe, while countries lagging
behind are France and those located in Southern/Eastern/Central Europe.
There is no significant difference in PACS usage between hospitals according to their ownership status.
There is a correlation based on size and PACS usage, as the bigger the establishments are, the more they
rely on a PACS.
Computerised systems for billing management, transmission of results of clinical tests, appointment
booking, medical/nursing document management are well implemented, with a European average above
60%.
Integrated systems for Tele-radiology, ePrescribing, adverse health events reporting, service order placing,
critical care information, and business intelligence information ranges from 40% to 60%.
Other systems, such as those for sending or receiving electronic referral letters or electronic discharge
letters, medical decision support, Tele-homecare/Tele-monitoring services to outpatients are less well
implemented, with a European average below 40%.
Most of the Nordic and the small/middle-sized countries of Western Europe are the most advanced in
terms of implementation of computerised systems or applications, whereas Eastern European countries
tend to lag behind. Other countries are in line with the European average.

European Hospital Survey: Benchmarking Deployment of eHealth Services (2012-2013)
57
140 The use of EMR/EHR systems is critical for sharing information between healthcare professionals. Directive
2011/24/EU66 has set up an eHealth network aiming to draw up guidelines on a non-exhaustive list of data
to be included in patients’ summaries and that can be shared between health professionals to enable
continuity of care and patient safety across borders.
141 Figure 28 shows that only 16% of the surveyed hospitals do not use any EMR/EHR/EPR. This result is
slightly lower but comparable to that of the previous survey (19%). Nevertheless, when hospitals have an
EMR/EPR/EHR system, progress has been made as regards information sharing: in 2012/2013, only 6% of
respondents declared having a multiple local/departmental EMR/EHR/EPR system not sharing information,
representing a 5 percentage point decrease over 2010. 55% of European hospitals use a hospital-wide
EMR/EHR/EPR, while 20% use a multiple EMR/EHR/EPR system sharing information with a central system.
These two results are lower than those of the previous survey, which may be due to the fact that multiple
answers were allowed in the 2010 questionnaire.
Figure 28: Type of Electronic Medical Records (EMRs) / Electronic Health Records (EHRs) /
Electronic Patient Records (EPRs) used by the hospital, European level results
Answer to Q23: “Which type of Electronic Medical Records (EMRs) / Electronic Health Records (EHRs) /
Electronic Patient Records (EPRs) does your hospital mainly use?”
142 Southern (Cyprus, Greece) and Eastern (Lithuania, Poland) European countries, together with Slovenia,
Ireland and the UK are those using EMR/EHR/EPRs the least. By contrast, Estonia (100%), Hungary (86%),
Slovakia (82%), Croatia (82%) and Denmark (82%) are the most advanced countries with respect to the
use of EMR/EHR/EPR systems in hospitals.
66 Directive 2011/24/EU of the European Parliament and of the Council of 9 March 2011 on the application of patients’ rights in
cross-border healthcare.
55%
20%
6%
16%
3%
Hospital-wide EMR/EHR/EPR shared by all clinical services
Multiple loc/dept EMR/EHR/EPR, which share information
Multiple loc/dept EMR/EHR/EPR, not sharing information
No EMR/EHR/EPR systems used in the hospital
Don't know
Base: n = 1753Question Q23
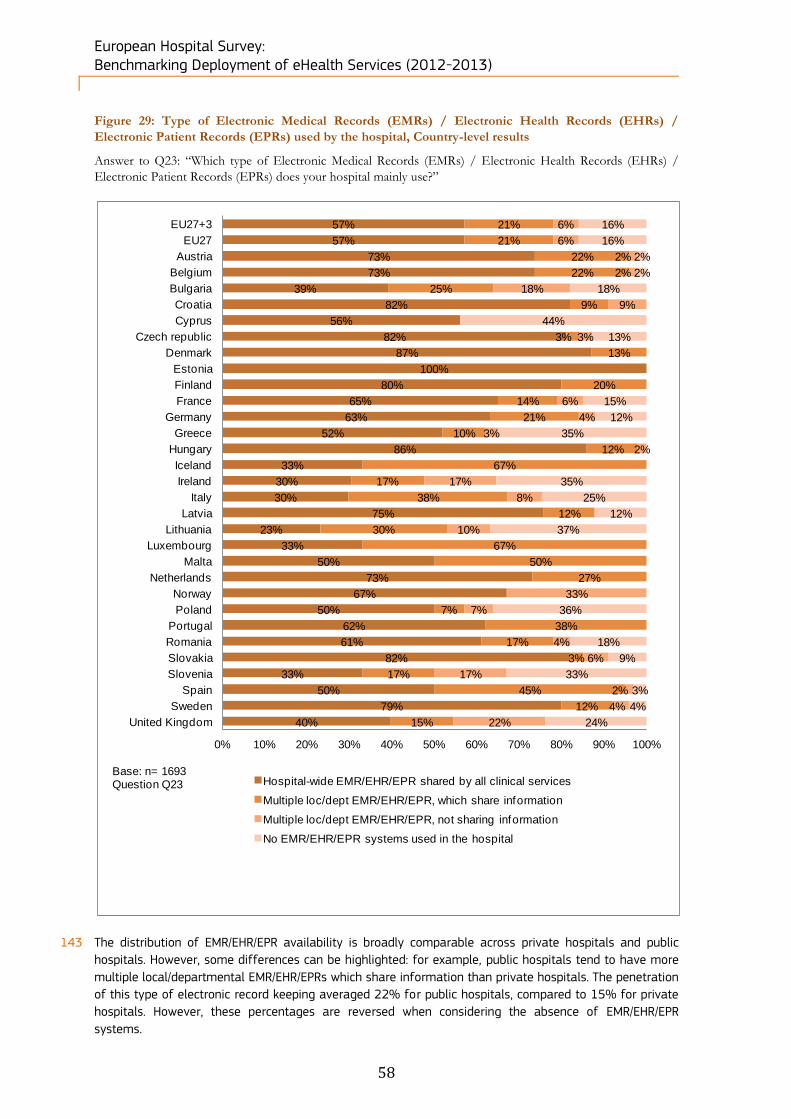
European Hospital Survey: Benchmarking Deployment of eHealth Services (2012-2013)
58
Figure 29: Type of Electronic Medical Records (EMRs) / Electronic Health Records (EHRs) /
Electronic Patient Records (EPRs) used by the hospital, Country-level results
Answer to Q23: “Which type of Electronic Medical Records (EMRs) / Electronic Health Records (EHRs) /
Electronic Patient Records (EPRs) does your hospital mainly use?”
143 The distribution of EMR/EHR/EPR availability is broadly comparable across private hospitals and public
hospitals. However, some differences can be highlighted: for example, public hospitals tend to have more
multiple local/departmental EMR/EHR/EPRs which share information than private hospitals. The penetration
of this type of electronic record keeping averaged 22% for public hospitals, compared to 15% for private
hospitals. However, these percentages are reversed when considering the absence of EMR/EHR/EPR
systems.
57%
57%
73%
73%
39%
82%
56%
82%
87%
100%
80%
65%
63%
52%
86%
33%
30%
30%
75%
23%
33%
50%
73%
67%
50%
62%
61%
82%
33%
50%
79%
40%
21%
21%
22%
22%
25%
9%
3%
13%
20%
14%
21%
10%
12%
67%
17%
38%
12%
30%
67%
50%
27%
7%
38%
17%
3%
17%
45%
12%
15%
6%
6%
2%
2%
18%
9%
3%
6%
4%
3%
2%
17%
8%
10%
33%
7%
4%
6%
17%
2%
4%
22%
16%
16%
2%
2%
18%
44%
13%
15%
12%
35%
35%
25%
12%
37%
36%
18%
9%
33%
3%
4%
24%
0% 10% 20% 30% 40% 50% 60% 70% 80% 90% 100%
EU27+3
EU27
Austria
Belgium
Bulgaria
Croatia
Cyprus
Czech republic
Denmark
Estonia
Finland
France
Germany
Greece
Hungary
Iceland
Ireland
Italy
Latvia
Lithuania
Luxembourg
Malta
Netherlands
Norway
Poland
Portugal
Romania
Slovakia
Slovenia
Spain
Sweden
United Kingdom
Hospital-wide EMR/EHR/EPR shared by all clinical services
Multiple loc/dept EMR/EHR/EPR, which share information
Multiple loc/dept EMR/EHR/EPR, not sharing information
No EMR/EHR/EPR systems used in the hospital
Base: n= 1693Question Q23
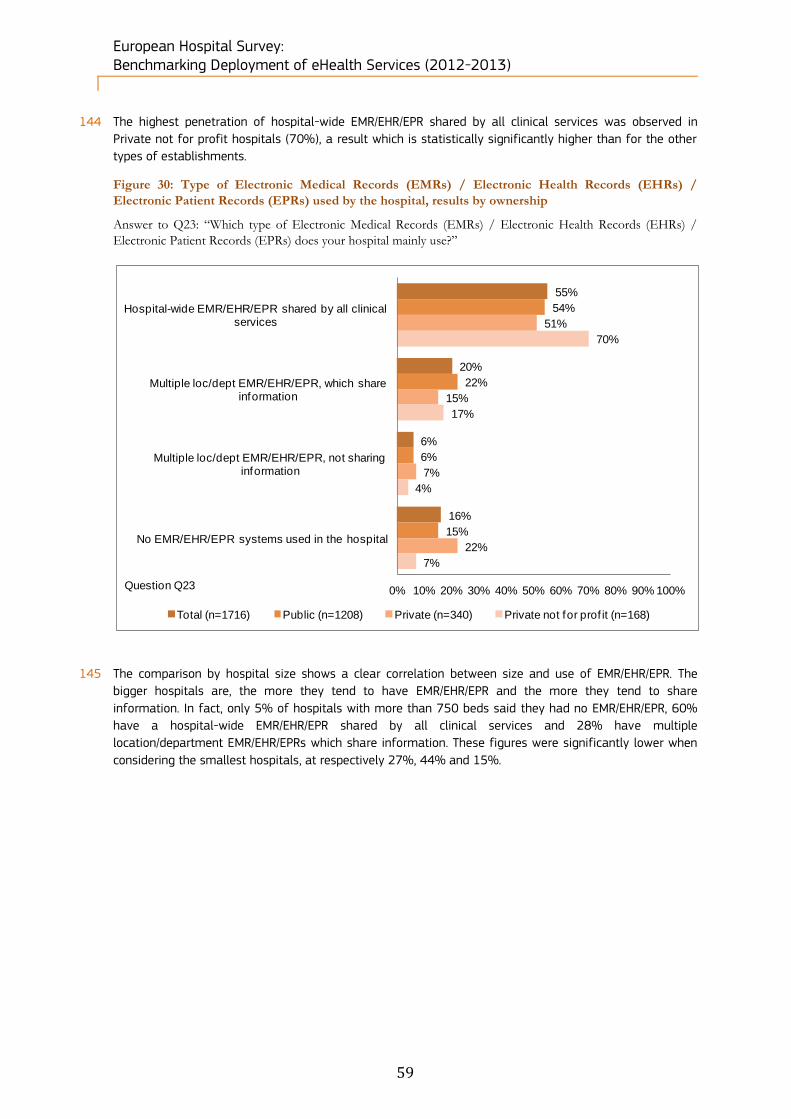
European Hospital Survey: Benchmarking Deployment of eHealth Services (2012-2013)
59
144 The highest penetration of hospital-wide EMR/EHR/EPR shared by all clinical services was observed in
Private not for profit hospitals (70%), a result which is statistically significantly higher than for the other
types of establishments.
Figure 30: Type of Electronic Medical Records (EMRs) / Electronic Health Records (EHRs) /
Electronic Patient Records (EPRs) used by the hospital, results by ownership
Answer to Q23: “Which type of Electronic Medical Records (EMRs) / Electronic Health Records (EHRs) /
Electronic Patient Records (EPRs) does your hospital mainly use?”
145 The comparison by hospital size shows a clear correlation between size and use of EMR/EHR/EPR. The
bigger hospitals are, the more they tend to have EMR/EHR/EPR and the more they tend to share
information. In fact, only 5% of hospitals with more than 750 beds said they had no EMR/EHR/EPR, 60%
have a hospital-wide EMR/EHR/EPR shared by all clinical services and 28% have multiple
location/department EMR/EHR/EPRs which share information. These figures were significantly lower when
considering the smallest hospitals, at respectively 27%, 44% and 15%.
55%
20%
6%
16%
54%
22%
6%
15%
51%
15%
7%
22%
70%
17%
4%
7%
0% 10% 20% 30% 40% 50% 60% 70% 80% 90% 100%
Hospital-wide EMR/EHR/EPR shared by all clinical services
Multiple loc/dept EMR/EHR/EPR, which share information
Multiple loc/dept EMR/EHR/EPR, not sharing information
No EMR/EHR/EPR systems used in the hospital
Total (n=1716) Public (n=1208) Private (n=340) Private not for prof it (n=168)
Question Q23
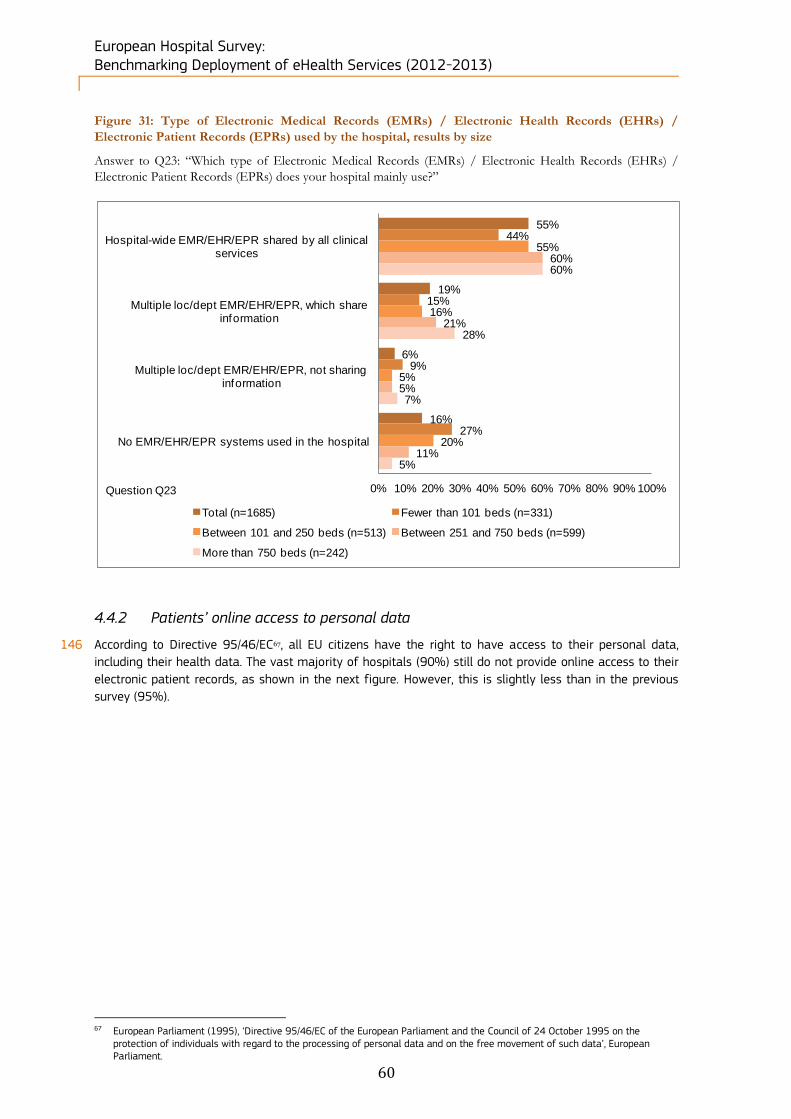
European Hospital Survey: Benchmarking Deployment of eHealth Services (2012-2013)
60
Figure 31: Type of Electronic Medical Records (EMRs) / Electronic Health Records (EHRs) /
Electronic Patient Records (EPRs) used by the hospital, results by size
Answer to Q23: “Which type of Electronic Medical Records (EMRs) / Electronic Health Records (EHRs) /
Electronic Patient Records (EPRs) does your hospital mainly use?”
4.4.2 Patients’ online access to personal data
146 According to Directive 95/46/EC67, all EU citizens have the right to have access to their personal data,
including their health data. The vast majority of hospitals (90%) still do not provide online access to their
electronic patient records, as shown in the next figure. However, this is slightly less than in the previous
survey (95%).
67 European Parliament (1995), ‘Directive 95/46/EC of the European Parliament and the Council of 24 October 1995 on the
protection of individuals with regard to the processing of personal data and on the free movement of such data’, European Parliament.
55%
19%
6%
16%
44%
15%
9%
27%
55%
16%
5%
20%
60%
21%
5%
11%
60%
28%
7%
5%
0% 10% 20% 30% 40% 50% 60% 70% 80% 90% 100%
Hospital-wide EMR/EHR/EPR shared by all clinical services
Multiple loc/dept EMR/EHR/EPR, which share information
Multiple loc/dept EMR/EHR/EPR, not sharing information
No EMR/EHR/EPR systems used in the hospital
Total (n=1685) Fewer than 101 beds (n=331)
Between 101 and 250 beds (n=513) Between 251 and 750 beds (n=599)
More than 750 beds (n=242)
Question Q23

European Hospital Survey: Benchmarking Deployment of eHealth Services (2012-2013)
61
Figure 32: Availability of online access to electronic records by patients, European level results
Answer to Q24: “Do patients have online access to their electronic patient records?”
147 Hospitals in Denmark, Estonia and Malta — and to a lesser extent Italy and Spain — are more likely to
grant patients online access to their health data. However, when they do so, they provide access to only a
limited amount of data.
1%
8%
90%
1%
Yes, to everything
Yes, but only to certain data (e.g. results and protocols)
No
Don't know
Base: n = 1753Question Q24
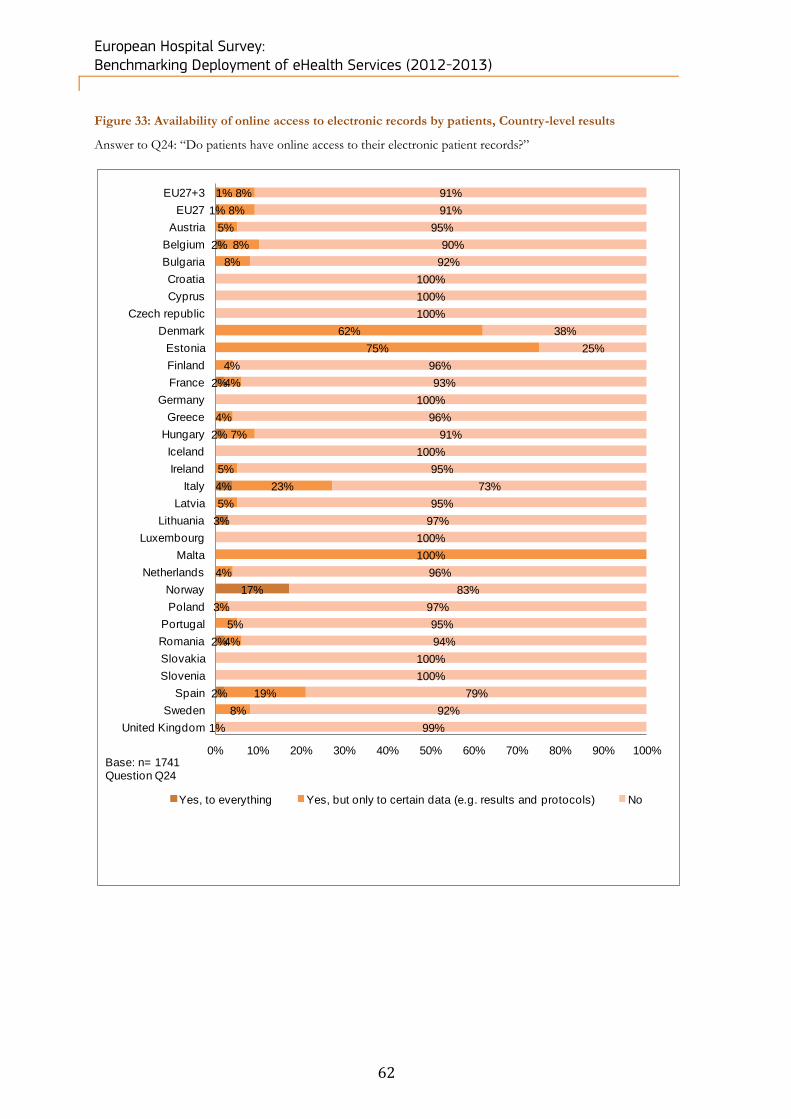
European Hospital Survey: Benchmarking Deployment of eHealth Services (2012-2013)
62
Figure 33: Availability of online access to electronic records by patients, Country-level results
Answer to Q24: “Do patients have online access to their electronic patient records?”
1%
1%
2%
2%
2%
4%
3%
17%
2%
2%
8%
8%
5%
8%
8%
62%
75%
4%
4%
4%
7%
5%
23%
5%
100%
4%
3%
5%
4%
19%
8%
1%
91%
91%
95%
90%
92%
100%
100%
100%
38%
25%
96%
93%
100%
96%
91%
100%
95%
73%
95%
97%
100%
96%
83%
97%
95%
94%
100%
100%
79%
92%
99%
0% 10% 20% 30% 40% 50% 60% 70% 80% 90% 100%
EU27+3
EU27
Austria
Belgium
Bulgaria
Croatia
Cyprus
Czech republic
Denmark
Estonia
Finland
France
Germany
Greece
Hungary
Iceland
Ireland
Italy
Latvia
Lithuania
Luxembourg
Malta
Netherlands
Norway
Poland
Portugal
Romania
Slovakia
Slovenia
Spain
Sweden
United Kingdom
Yes, to everything Yes, but only to certain data (e.g. results and protocols) No
Base: n= 1741Question Q24

European Hospital Survey: Benchmarking Deployment of eHealth Services (2012-2013)
63
4.4.3 Picture Archiving and Communication System
148 A Picture Archiving and Communication System (PACS) is a combination of hardware and software which
stores, retrieves, manages, shares (under DICOM format) and displays medical images such as
ultrasounds, Magnetic Resonance Imagings (MRI), positron emission tomography, computed tomography,
endoscopy, mammograms and radiography. A PACS replaces hard film copies with digital images. The
usage of a PACS enables healthcare cost reductions (by avoiding duplicates and film purchase), as well as
rapid and easy access to patients’ data and history.
149 70% of surveyed European acute care hospitals have a PACS, which is a higher percentage than that
reported in the previous survey (61%).
Figure 34: Availability of Picture Archiving and Communication System (PACS), European level results
Answer to Q25: “Does the hospital use a Picture Archiving and Communication System (PACS)?”
150 Forerunners in PACS usage are Austria, Czech Republic, Estonia, Finland, Iceland, Luxembourg, Malta and
the UK: at least 95% of the hospitals in these countries use a PACS. In contrast, countries lagging behind
include France and those located in Southern/Eastern/Central Europe (Bulgaria, Cyprus, Greece, Romania
and Slovenia); here PACS usage does not exceed 50%.
70%
29%
1%
Yes
No
Don't know
Base: n = 1753Question Q25
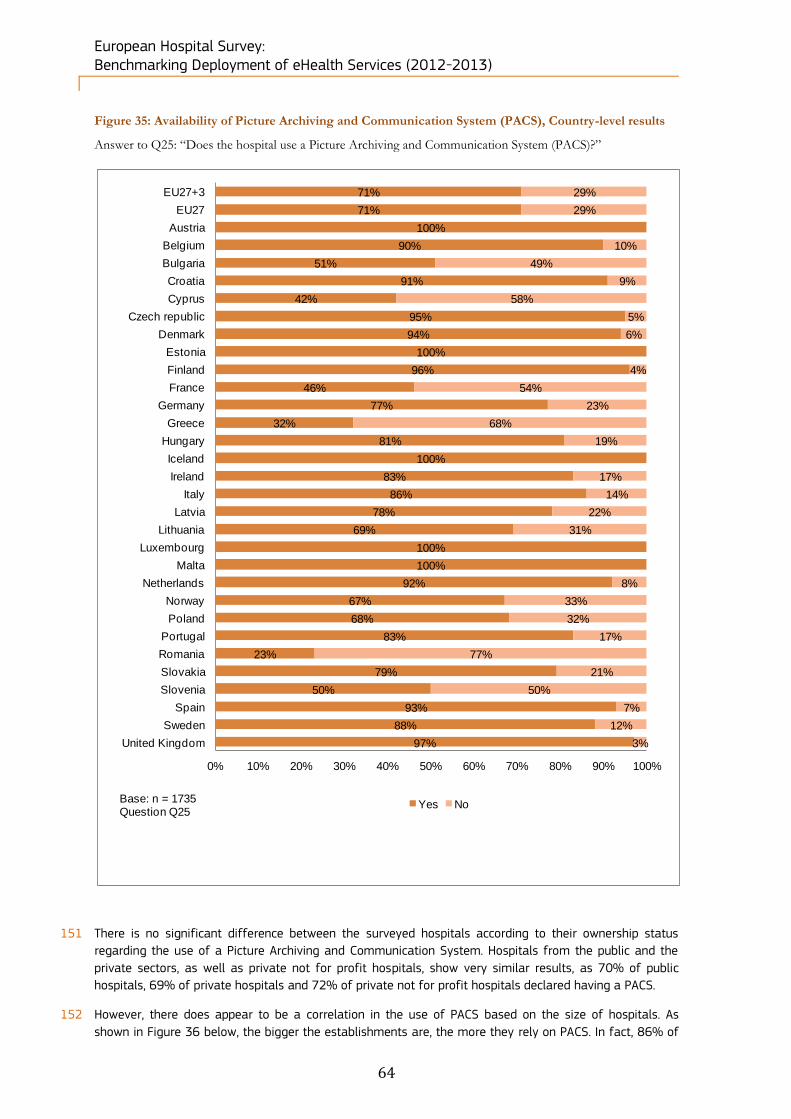
European Hospital Survey: Benchmarking Deployment of eHealth Services (2012-2013)
64
Figure 35: Availability of Picture Archiving and Communication System (PACS), Country-level results
Answer to Q25: “Does the hospital use a Picture Archiving and Communication System (PACS)?”
151 There is no significant difference between the surveyed hospitals according to their ownership status
regarding the use of a Picture Archiving and Communication System. Hospitals from the public and the
private sectors, as well as private not for profit hospitals, show very similar results, as 70% of public
hospitals, 69% of private hospitals and 72% of private not for profit hospitals declared having a PACS.
152 However, there does appear to be a correlation in the use of PACS based on the size of hospitals. As
shown in Figure 36 below, the bigger the establishments are, the more they rely on PACS. In fact, 86% of
71%
71%
100%
90%
51%
91%
42%
95%
94%
100%
96%
46%
77%
32%
81%
100%
83%
86%
78%
69%
100%
100%
92%
67%
68%
83%
23%
79%
50%
93%
88%
97%
29%
29%
10%
49%
9%
58%
5%
6%
4%
54%
23%
68%
19%
17%
14%
22%
31%
8%
33%
32%
17%
77%
21%
50%
7%
12%
3%
0% 10% 20% 30% 40% 50% 60% 70% 80% 90% 100%
EU27+3
EU27
Austria
Belgium
Bulgaria
Croatia
Cyprus
Czech republic
Denmark
Estonia
Finland
France
Germany
Greece
Hungary
Iceland
Ireland
Italy
Latvia
Lithuania
Luxembourg
Malta
Netherlands
Norway
Poland
Portugal
Romania
Slovakia
Slovenia
Spain
Sweden
United Kingdom
Yes NoBase: n = 1735Question Q25
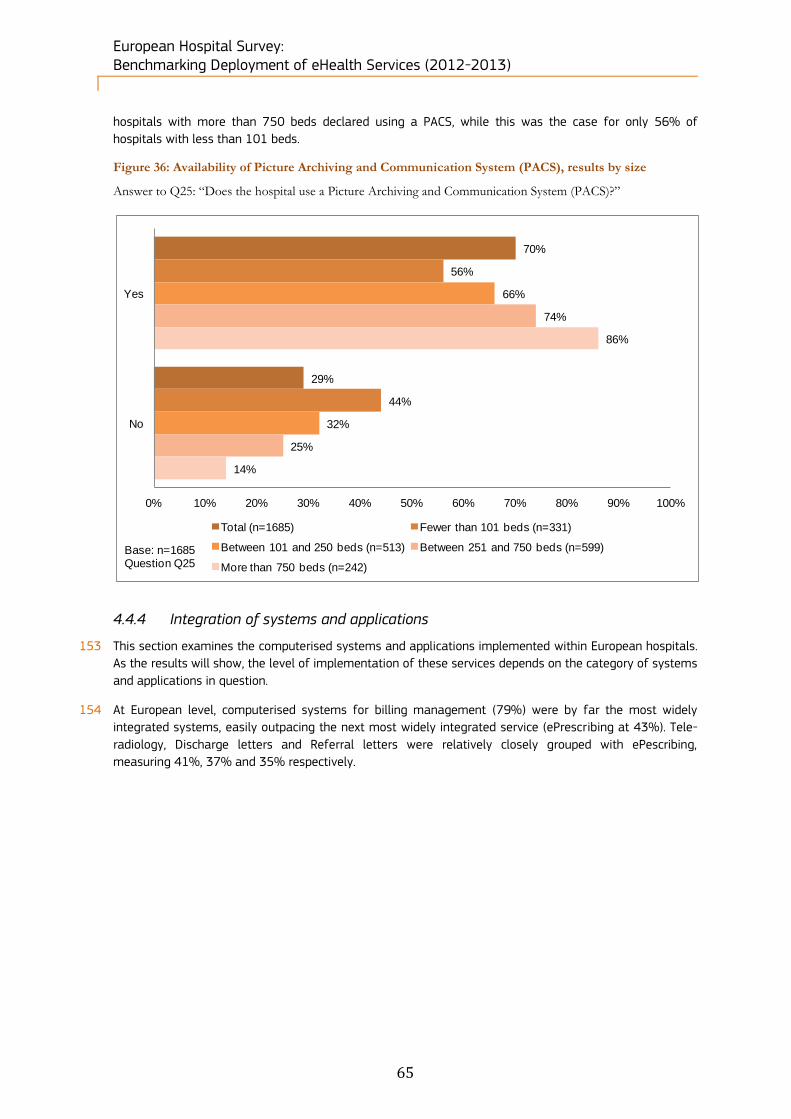
European Hospital Survey: Benchmarking Deployment of eHealth Services (2012-2013)
65
hospitals with more than 750 beds declared using a PACS, while this was the case for only 56% of
hospitals with less than 101 beds.
Figure 36: Availability of Picture Archiving and Communication System (PACS), results by size
Answer to Q25: “Does the hospital use a Picture Archiving and Communication System (PACS)?”
4.4.4 Integration of systems and applications
153 This section examines the computerised systems and applications implemented within European hospitals.
As the results will show, the level of implementation of these services depends on the category of systems
and applications in question.
154 At European level, computerised systems for billing management (79%) were by far the most widely
integrated systems, easily outpacing the next most widely integrated service (ePrescribing at 43%). Tele-
radiology, Discharge letters and Referral letters were relatively closely grouped with ePescribing,
measuring 41%, 37% and 35% respectively.
70%
29%
56%
44%
66%
32%
74%
25%
86%
14%
0% 10% 20% 30% 40% 50% 60% 70% 80% 90% 100%
Yes
No
Total (n=1685) Fewer than 101 beds (n=331)
Between 101 and 250 beds (n=513) Between 251 and 750 beds (n=599)
More than 750 beds (n=242)
Base: n=1685Question Q25
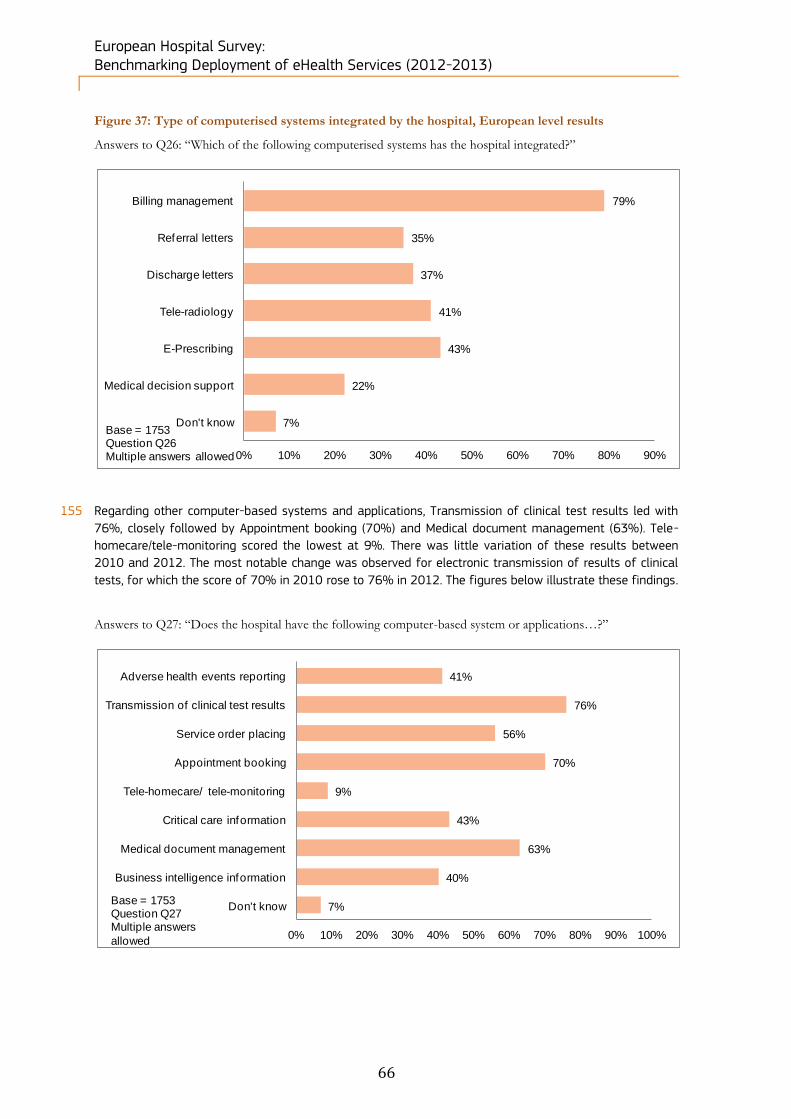
European Hospital Survey: Benchmarking Deployment of eHealth Services (2012-2013)
66
Figure 37: Type of computerised systems integrated by the hospital, European level results
Answers to Q26: “Which of the following computerised systems has the hospital integrated?”
155 Regarding other computer-based systems and applications, Transmission of clinical test results led with
76%, closely followed by Appointment booking (70%) and Medical document management (63%). Tele-
homecare/tele-monitoring scored the lowest at 9%. There was little variation of these results between
2010 and 2012. The most notable change was observed for electronic transmission of results of clinical
tests, for which the score of 70% in 2010 rose to 76% in 2012. The figures below illustrate these findings.
Answers to Q27: “Does the hospital have the following computer-based system or applications…?”
79%
35%
37%
41%
43%
22%
7%
0% 10% 20% 30% 40% 50% 60% 70% 80% 90%
Billing management
Referral letters
Discharge letters
Tele-radiology
E-Prescribing
Medical decision support
Don't knowBase = 1753Question Q26Multiple answers allowed
41%
76%
56%
70%
9%
43%
63%
40%
7%
0% 10% 20% 30% 40% 50% 60% 70% 80% 90% 100%
Adverse health events reporting
Transmission of clinical test results
Service order placing
Appointment booking
Tele-homecare/ tele-monitoring
Critical care information
Medical document management
Business intelligence information
Don't knowBase = 1753Question Q27Multiple answers
allowed
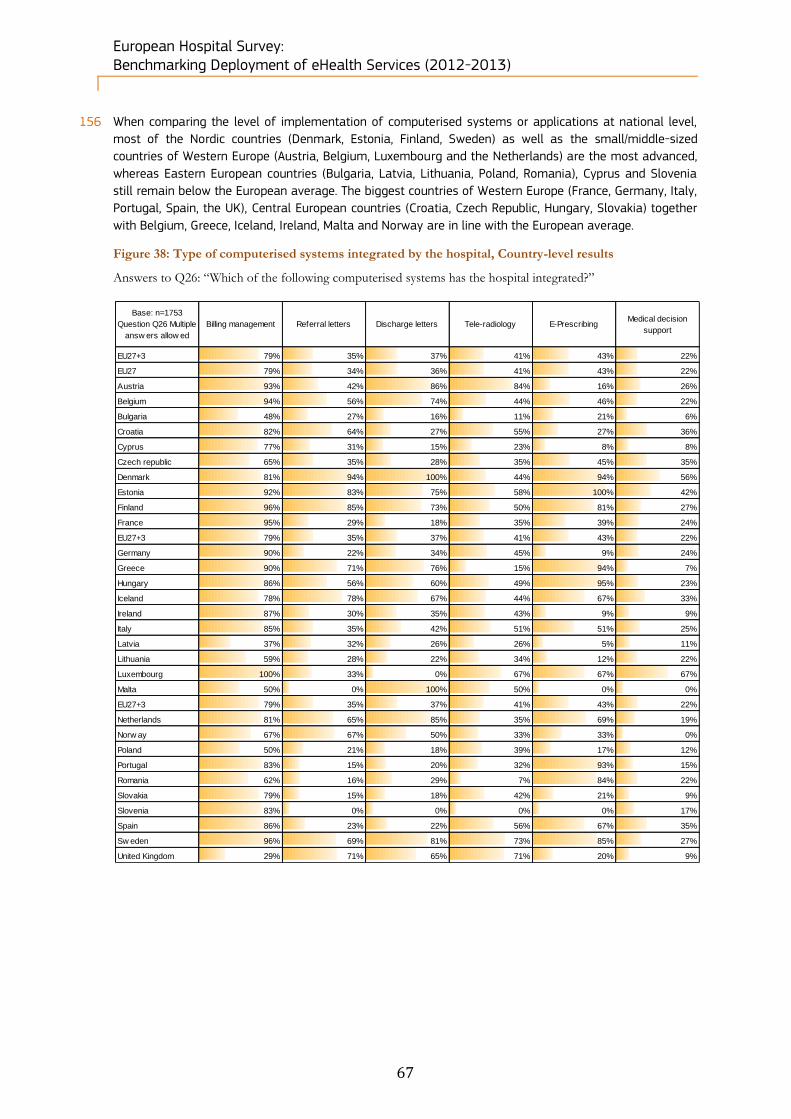
European Hospital Survey: Benchmarking Deployment of eHealth Services (2012-2013)
67
156 When comparing the level of implementation of computerised systems or applications at national level,
most of the Nordic countries (Denmark, Estonia, Finland, Sweden) as well as the small/middle-sized
countries of Western Europe (Austria, Belgium, Luxembourg and the Netherlands) are the most advanced,
whereas Eastern European countries (Bulgaria, Latvia, Lithuania, Poland, Romania), Cyprus and Slovenia
still remain below the European average. The biggest countries of Western Europe (France, Germany, Italy,
Portugal, Spain, the UK), Central European countries (Croatia, Czech Republic, Hungary, Slovakia) together
with Belgium, Greece, Iceland, Ireland, Malta and Norway are in line with the European average.
Figure 38: Type of computerised systems integrated by the hospital, Country-level results
Answers to Q26: “Which of the following computerised systems has the hospital integrated?”
Base: n=1753
Question Q26 Multiple
answ ers allow ed
Billing management Referral letters Discharge letters Tele-radiology E-PrescribingMedical decision
support
EU27+3 79% 35% 37% 41% 43% 22%
EU27 79% 34% 36% 41% 43% 22%
Austria 93% 42% 86% 84% 16% 26%
Belgium 94% 56% 74% 44% 46% 22%
Bulgaria 48% 27% 16% 11% 21% 6%
Croatia 82% 64% 27% 55% 27% 36%
Cyprus 77% 31% 15% 23% 8% 8%
Czech republic 65% 35% 28% 35% 45% 35%
Denmark 81% 94% 100% 44% 94% 56%
Estonia 92% 83% 75% 58% 100% 42%
Finland 96% 85% 73% 50% 81% 27%
France 95% 29% 18% 35% 39% 24%
EU27+3 79% 35% 37% 41% 43% 22%
Germany 90% 22% 34% 45% 9% 24%
Greece 90% 71% 76% 15% 94% 7%
Hungary 86% 56% 60% 49% 95% 23%
Iceland 78% 78% 67% 44% 67% 33%
Ireland 87% 30% 35% 43% 9% 9%
Italy 85% 35% 42% 51% 51% 25%
Latvia 37% 32% 26% 26% 5% 11%
Lithuania 59% 28% 22% 34% 12% 22%
Luxembourg 100% 33% 0% 67% 67% 67%
Malta 50% 0% 100% 50% 0% 0%
EU27+3 79% 35% 37% 41% 43% 22%
Netherlands 81% 65% 85% 35% 69% 19%
Norw ay 67% 67% 50% 33% 33% 0%
Poland 50% 21% 18% 39% 17% 12%
Portugal 83% 15% 20% 32% 93% 15%
Romania 62% 16% 29% 7% 84% 22%
Slovakia 79% 15% 18% 42% 21% 9%
Slovenia 83% 0% 0% 0% 0% 17%
Spain 86% 23% 22% 56% 67% 35%
Sw eden 96% 69% 81% 73% 85% 27%
United Kingdom 29% 71% 65% 71% 20% 9%

European Hospital Survey: Benchmarking Deployment of eHealth Services (2012-2013)
68
Answers to Q27: “Does the hospital have the following computer-based system or applications…?”
Base: n=1753
Question Q27
Multiple answ ers
allow ed
Adverse health
events reporting
Transmission of
clinical test results
Service order
placing
Appointment
booking
Tele-homecare/
tele-monitoring
Critical care
information
Medical document
management
Business
intelligence
information
EU27+3 41% 76% 56% 70% 9% 43% 63% 40%
EU27 42% 76% 56% 70% 9% 43% 63% 39%
Austria 42% 91% 77% 95% 7% 84% 91% 60%
Belgium 54% 90% 34% 90% 10% 78% 76% 52%
Bulgaria 10% 45% 31% 21% 18% 48% 53%
Croatia 18% 73% 36% 36% 18% 36% 55% 45%
Cyprus 23% 54% 23% 31% 15% 31% 23%
Czech republic 48% 95% 68% 28% 2% 52% 85% 45%
Denmark 75% 94% 75% 75% 19% 62% 88% 50%
Estonia 25% 83% 83% 92% 17% 67% 100% 33%
Finland 88% 96% 81% 88% 19% 69% 100% 73%
France 72% 79% 38% 66% 13% 44% 71% 24%
Germany 38% 82% 63% 80% 3% 52% 74% 44%
Greece 12% 78% 68% 78% 1% 31% 53% 53%
Hungary 9% 60% 58% 56% 26% 95% 23%
Iceland 44% 78% 78% 89% 11% 11% 78% 44%
Ireland 39% 83% 57% 87% 30% 26% 57%
Italy 40% 79% 78% 88% 17% 62% 53% 42%
Latvia 5% 47% 26% 32% 16% 37% 32%
Lithuania 12% 41% 25% 41% 9% 22% 19%
Luxembourg 67% 100% 100% 100% 67% 100% 33%
Malta 100% 100% 100%
Netherlands 73% 81% 65% 96% 35% 85% 81% 92%
Norw ay 17% 83% 83% 17% 17% 33% 67% 50%
Poland 13% 56% 45% 56% 3% 13% 38% 34%
Portugal 32% 76% 68% 76% 5% 29% 63% 32%
Romania 9% 53% 38% 27% 1% 19% 48% 7%
Slovakia 15% 100% 73% 36% 48% 82% 36%
Slovenia 33% 83% 33% 67% 33% 33%
Spain 42% 86% 69% 97% 22% 60% 82% 52%
Sw eden 69% 88% 73% 88% 8% 50% 69% 58%
United Kingdom 84% 93% 67% 91% 22% 30% 32% 61%
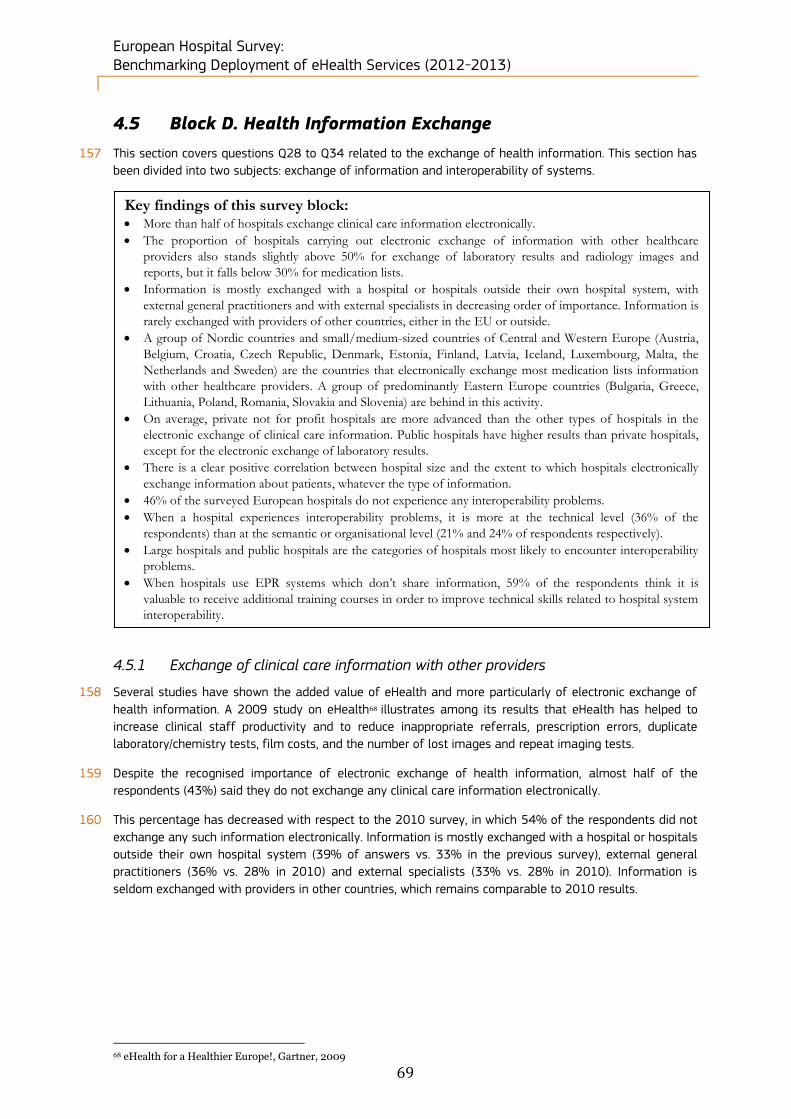
European Hospital Survey: Benchmarking Deployment of eHealth Services (2012-2013)
69
4.5 Block D. Health Information Exchange
157 This section covers questions Q28 to Q34 related to the exchange of health information. This section has
been divided into two subjects: exchange of information and interoperability of systems.
4.5.1 Exchange of clinical care information with other providers
158 Several studies have shown the added value of eHealth and more particularly of electronic exchange of
health information. A 2009 study on eHealth68 illustrates among its results that eHealth has helped to
increase clinical staff productivity and to reduce inappropriate referrals, prescription errors, duplicate
laboratory/chemistry tests, film costs, and the number of lost images and repeat imaging tests.
159 Despite the recognised importance of electronic exchange of health information, almost half of the
respondents (43%) said they do not exchange any clinical care information electronically.
160 This percentage has decreased with respect to the 2010 survey, in which 54% of the respondents did not
exchange any such information electronically. Information is mostly exchanged with a hospital or hospitals
outside their own hospital system (39% of answers vs. 33% in the previous survey), external general
practitioners (36% vs. 28% in 2010) and external specialists (33% vs. 28% in 2010). Information is
seldom exchanged with providers in other countries, which remains comparable to 2010 results.
68 eHealth for a Healthier Europe!, Gartner, 2009
Key findings of this survey block: More than half of hospitals exchange clinical care information electronically.
The proportion of hospitals carrying out electronic exchange of information with other healthcare
providers also stands slightly above 50% for exchange of laboratory results and radiology images and
reports, but it falls below 30% for medication lists.
Information is mostly exchanged with a hospital or hospitals outside their own hospital system, with
external general practitioners and with external specialists in decreasing order of importance. Information is
rarely exchanged with providers of other countries, either in the EU or outside.
A group of Nordic countries and small/medium-sized countries of Central and Western Europe (Austria,
Belgium, Croatia, Czech Republic, Denmark, Estonia, Finland, Latvia, Iceland, Luxembourg, Malta, the
Netherlands and Sweden) are the countries that electronically exchange most medication lists information
with other healthcare providers. A group of predominantly Eastern Europe countries (Bulgaria, Greece,
Lithuania, Poland, Romania, Slovakia and Slovenia) are behind in this activity.
On average, private not for profit hospitals are more advanced than the other types of hospitals in the
electronic exchange of clinical care information. Public hospitals have higher results than private hospitals,
except for the electronic exchange of laboratory results.
There is a clear positive correlation between hospital size and the extent to which hospitals electronically
exchange information about patients, whatever the type of information.
46% of the surveyed European hospitals do not experience any interoperability problems.
When a hospital experiences interoperability problems, it is more at the technical level (36% of the
respondents) than at the semantic or organisational level (21% and 24% of respondents respectively).
Large hospitals and public hospitals are the categories of hospitals most likely to encounter interoperability
problems.
When hospitals use EPR systems which don’t share information, 59% of the respondents think it is
valuable to receive additional training courses in order to improve technical skills related to hospital system
interoperability.
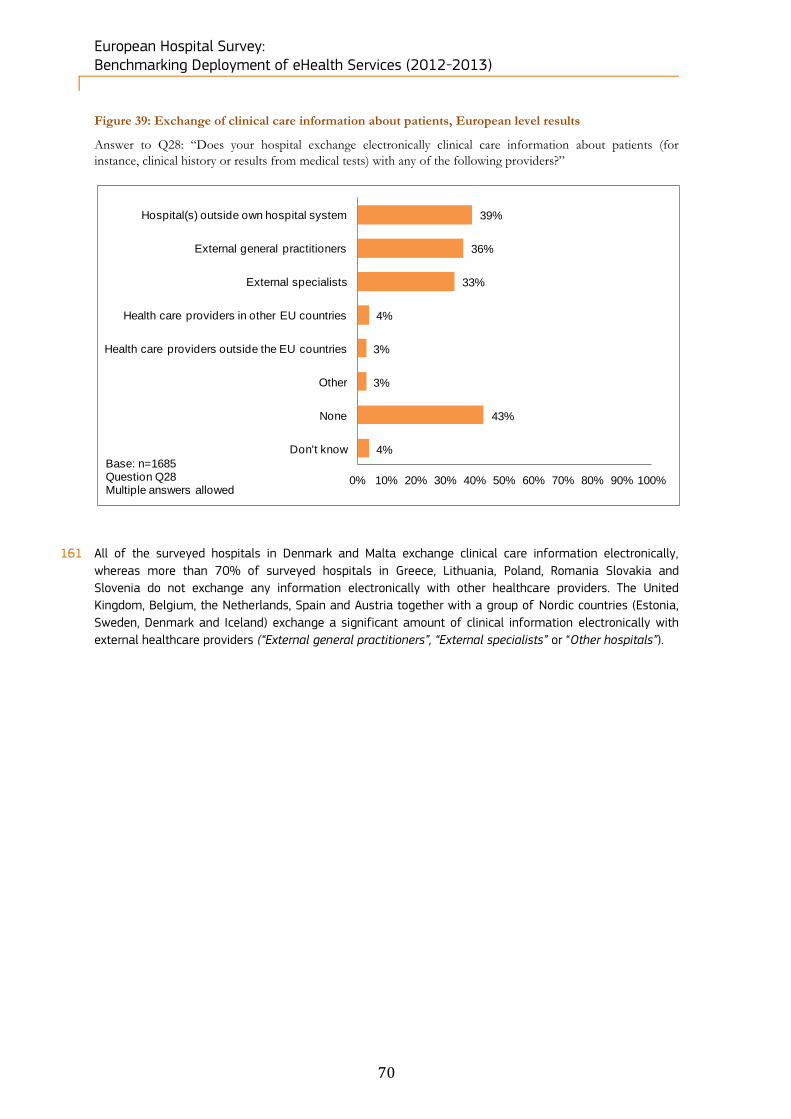
European Hospital Survey: Benchmarking Deployment of eHealth Services (2012-2013)
70
Figure 39: Exchange of clinical care information about patients, European level results
Answer to Q28: “Does your hospital exchange electronically clinical care information about patients (for
instance, clinical history or results from medical tests) with any of the following providers?”
161 All of the surveyed hospitals in Denmark and Malta exchange clinical care information electronically,
whereas more than 70% of surveyed hospitals in Greece, Lithuania, Poland, Romania Slovakia and
Slovenia do not exchange any information electronically with other healthcare providers. The United
Kingdom, Belgium, the Netherlands, Spain and Austria together with a group of Nordic countries (Estonia,
Sweden, Denmark and Iceland) exchange a significant amount of clinical information electronically with
external healthcare providers (“External general practitioners”, “External specialists” or “Other hospitals”).
39%
36%
33%
4%
3%
3%
43%
4%
0% 10% 20% 30% 40% 50% 60% 70% 80% 90% 100%
Hospital(s) outside own hospital system
External general practitioners
External specialists
Health care providers in other EU countries
Health care providers outside the EU countries
Other
None
Don't know
Base: n=1685Question Q28Multiple answers allowed
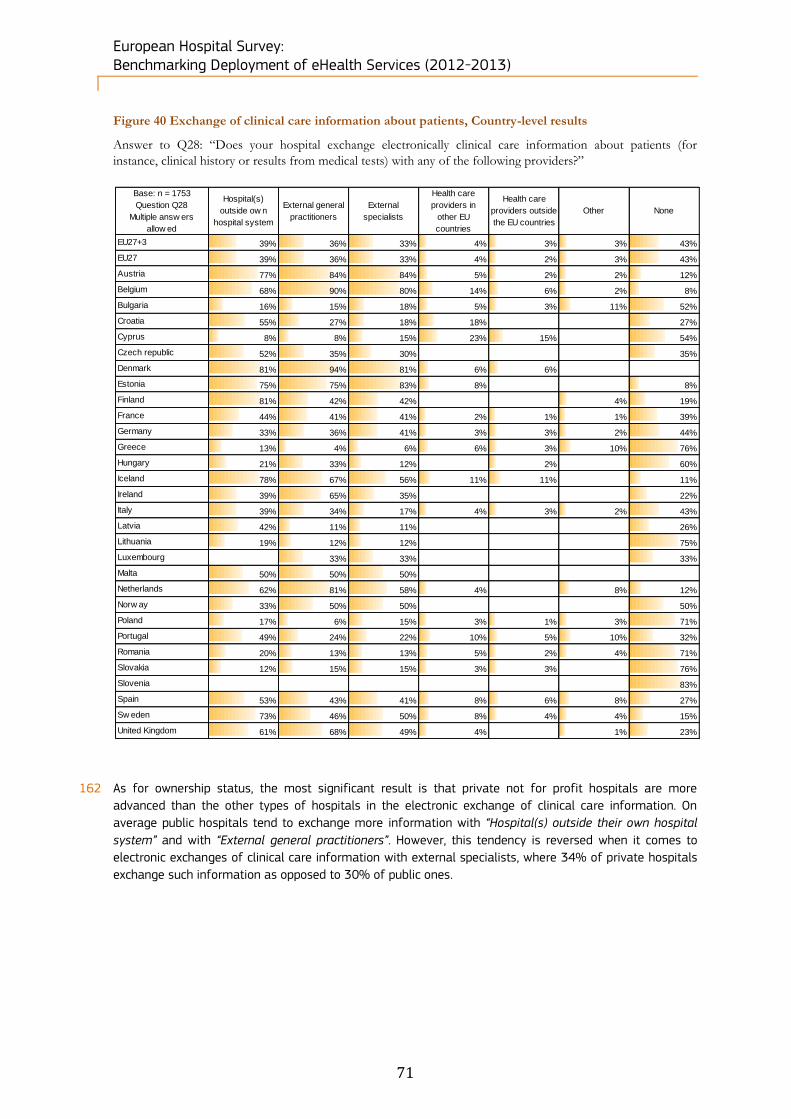
European Hospital Survey: Benchmarking Deployment of eHealth Services (2012-2013)
71
Figure 40 Exchange of clinical care information about patients, Country-level results
Answer to Q28: “Does your hospital exchange electronically clinical care information about patients (for
instance, clinical history or results from medical tests) with any of the following providers?”
162 As for ownership status, the most significant result is that private not for profit hospitals are more
advanced than the other types of hospitals in the electronic exchange of clinical care information. On
average public hospitals tend to exchange more information with “Hospital(s) outside their own hospital
system” and with “External general practitioners”. However, this tendency is reversed when it comes to
electronic exchanges of clinical care information with external specialists, where 34% of private hospitals
exchange such information as opposed to 30% of public ones.
Base: n = 1753
Question Q28
Multiple answ ers
allow ed
Hospital(s)
outside ow n
hospital system
External general
practitioners
External
specialists
Health care
providers in
other EU
countries
Health care
providers outside
the EU countries
Other None
EU27+3 39% 36% 33% 4% 3% 3% 43%
EU27 39% 36% 33% 4% 2% 3% 43%
Austria 77% 84% 84% 5% 2% 2% 12%
Belgium 68% 90% 80% 14% 6% 2% 8%
Bulgaria 16% 15% 18% 5% 3% 11% 52%
Croatia 55% 27% 18% 18% 27%
Cyprus 8% 8% 15% 23% 15% 54%
Czech republic 52% 35% 30% 35%
Denmark 81% 94% 81% 6% 6%
Estonia 75% 75% 83% 8% 8%
Finland 81% 42% 42% 4% 19%
France 44% 41% 41% 2% 1% 1% 39%
Germany 33% 36% 41% 3% 3% 2% 44%
Greece 13% 4% 6% 6% 3% 10% 76%
Hungary 21% 33% 12% 2% 60%
Iceland 78% 67% 56% 11% 11% 11%
Ireland 39% 65% 35% 22%
Italy 39% 34% 17% 4% 3% 2% 43%
Latvia 42% 11% 11% 26%
Lithuania 19% 12% 12% 75%
Luxembourg 33% 33% 33%
Malta 50% 50% 50%
Netherlands 62% 81% 58% 4% 8% 12%
Norw ay 33% 50% 50% 50%
Poland 17% 6% 15% 3% 1% 3% 71%
Portugal 49% 24% 22% 10% 5% 10% 32%
Romania 20% 13% 13% 5% 2% 4% 71%
Slovakia 12% 15% 15% 3% 3% 76%
Slovenia 83%
Spain 53% 43% 41% 8% 6% 8% 27%
Sw eden 73% 46% 50% 8% 4% 4% 15%
United Kingdom 61% 68% 49% 4% 1% 23%

European Hospital Survey: Benchmarking Deployment of eHealth Services (2012-2013)
72
Figure 41: Exchange of clinical care information about patients, results by ownership
Answer to Q28: “Does your hospital exchange electronically clinical care information about patients (for
instance, clinical history or results from medical tests) with any of the following providers?”
163 The electronic information exchange shares by hospital size follow a regular distribution path between
exchange of information with hospital(s) outside their own hospital system, external general practitioners
and external specialists. For these categories a clear positive correlation between the size of the hospital
and the amount of information exchanged can be identified. In line with this result, the correlation is still
present but reversed for the “none” category. The electronic exchange of information with providers in EU
and non-EU countries accounted for the lowest scores in all hospital size categories. Information exchange
scores for very large hospitals recorded the highest percentage gap with the other categories.
39%
36%
33%
4%
3%
3%
43%
40%
37%
30%
4%
2%
3%
43%
32%
29%
34%
6%
4%
4%
48%
46%
43%
47%
5%
2%
4%
36%
0% 10% 20% 30% 40% 50% 60% 70% 80% 90% 100%
Hospital(s) outside own hospital system
External general practitioners
External specialists
Health care providers in other EU countries
Health care providers outside the EU countries
Other
None
Total (n=1716) Public (n=1208) Private (n=340) Private not for prof it (n=168)
Base: n= 1716Question Q28Multiple answers allowed
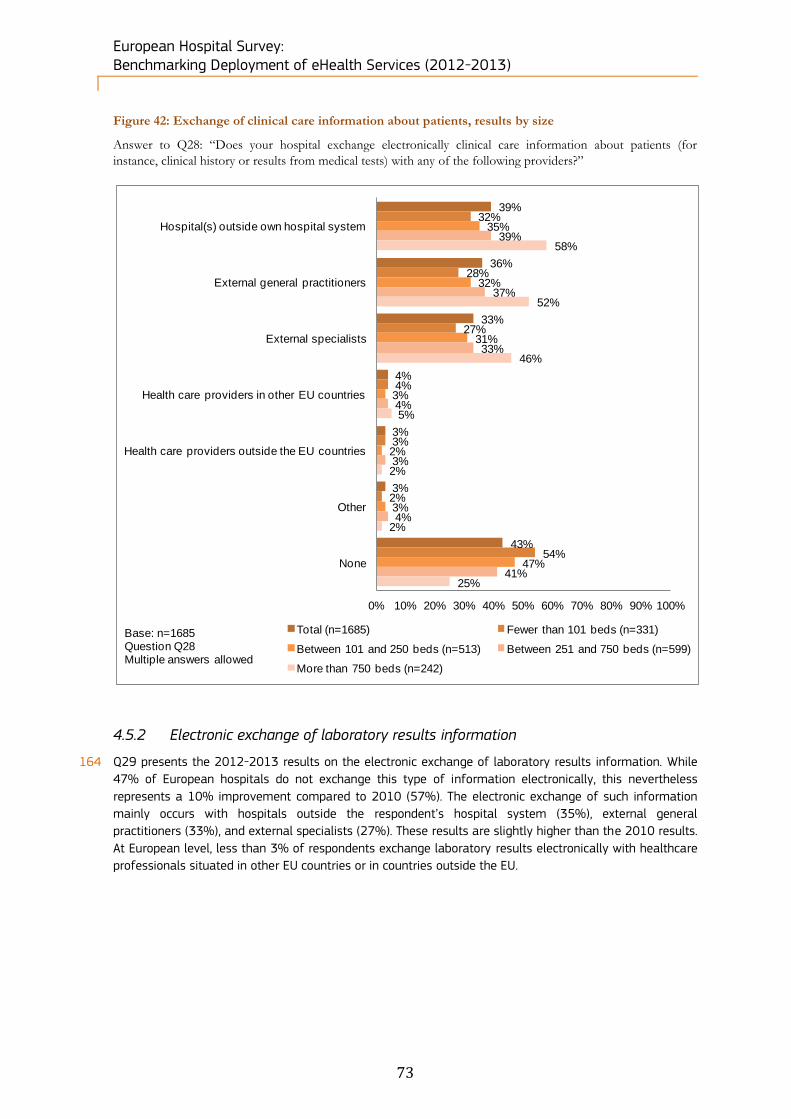
European Hospital Survey: Benchmarking Deployment of eHealth Services (2012-2013)
73
Figure 42: Exchange of clinical care information about patients, results by size
Answer to Q28: “Does your hospital exchange electronically clinical care information about patients (for
instance, clinical history or results from medical tests) with any of the following providers?”
4.5.2 Electronic exchange of laboratory results information
164 Q29 presents the 2012-2013 results on the electronic exchange of laboratory results information. While
47% of European hospitals do not exchange this type of information electronically, this nevertheless
represents a 10% improvement compared to 2010 (57%). The electronic exchange of such information
mainly occurs with hospitals outside the respondent’s hospital system (35%), external general
practitioners (33%), and external specialists (27%). These results are slightly higher than the 2010 results.
At European level, less than 3% of respondents exchange laboratory results electronically with healthcare
professionals situated in other EU countries or in countries outside the EU.
39%
36%
33%
4%
3%
3%
43%
32%
28%
27%
4%
3%
2%
54%
35%
32%
31%
3%
2%
3%
47%
39%
37%
33%
4%
3%
4%
41%
58%
52%
46%
5%
2%
2%
25%
0% 10% 20% 30% 40% 50% 60% 70% 80% 90% 100%
Hospital(s) outside own hospital system
External general practitioners
External specialists
Health care providers in other EU countries
Health care providers outside the EU countries
Other
None
Total (n=1685) Fewer than 101 beds (n=331)
Between 101 and 250 beds (n=513) Between 251 and 750 beds (n=599)
More than 750 beds (n=242)
Base: n=1685Question Q28Multiple answers allowed
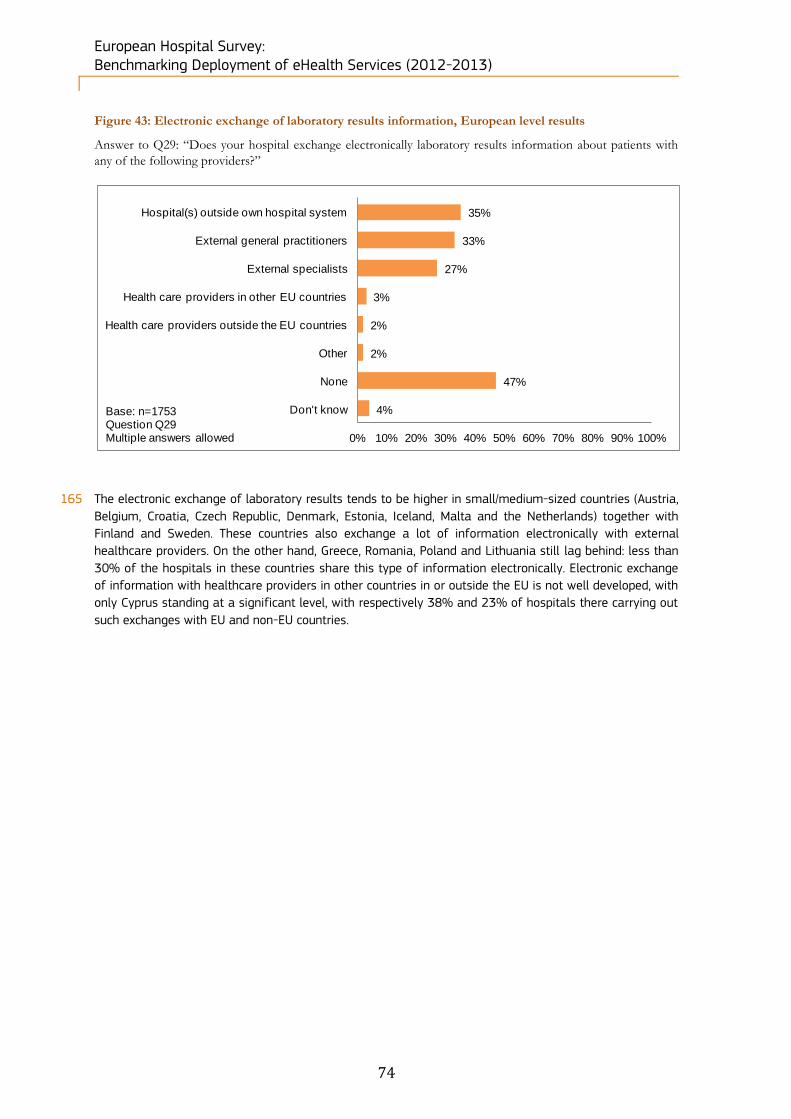
European Hospital Survey: Benchmarking Deployment of eHealth Services (2012-2013)
74
Figure 43: Electronic exchange of laboratory results information, European level results
Answer to Q29: “Does your hospital exchange electronically laboratory results information about patients with
any of the following providers?”
165 The electronic exchange of laboratory results tends to be higher in small/medium-sized countries (Austria,
Belgium, Croatia, Czech Republic, Denmark, Estonia, Iceland, Malta and the Netherlands) together with
Finland and Sweden. These countries also exchange a lot of information electronically with external
healthcare providers. On the other hand, Greece, Romania, Poland and Lithuania still lag behind: less than
30% of the hospitals in these countries share this type of information electronically. Electronic exchange
of information with healthcare providers in other countries in or outside the EU is not well developed, with
only Cyprus standing at a significant level, with respectively 38% and 23% of hospitals there carrying out
such exchanges with EU and non-EU countries.
35%
33%
27%
3%
2%
2%
47%
4%
0% 10% 20% 30% 40% 50% 60% 70% 80% 90% 100%
Hospital(s) outside own hospital system
External general practitioners
External specialists
Health care providers in other EU countries
Health care providers outside the EU countries
Other
None
Don't knowBase: n=1753Question Q29Multiple answers allowed
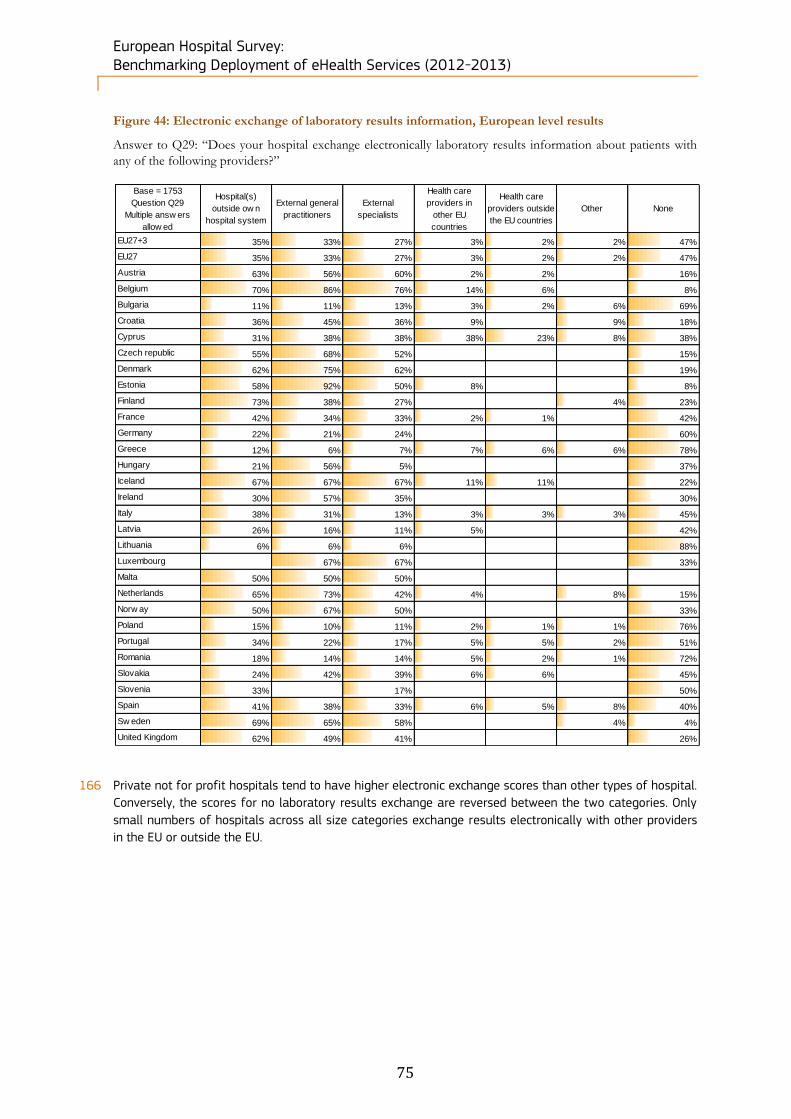
European Hospital Survey: Benchmarking Deployment of eHealth Services (2012-2013)
75
Figure 44: Electronic exchange of laboratory results information, European level results
Answer to Q29: “Does your hospital exchange electronically laboratory results information about patients with
any of the following providers?”
166 Private not for profit hospitals tend to have higher electronic exchange scores than other types of hospital.
Conversely, the scores for no laboratory results exchange are reversed between the two categories. Only
small numbers of hospitals across all size categories exchange results electronically with other providers
in the EU or outside the EU.
Base = 1753
Question Q29
Multiple answ ers
allow ed
Hospital(s)
outside ow n
hospital system
External general
practitioners
External
specialists
Health care
providers in
other EU
countries
Health care
providers outside
the EU countries
Other None
EU27+3 35% 33% 27% 3% 2% 2% 47%
EU27 35% 33% 27% 3% 2% 2% 47%
Austria 63% 56% 60% 2% 2% 16%
Belgium 70% 86% 76% 14% 6% 8%
Bulgaria 11% 11% 13% 3% 2% 6% 69%
Croatia 36% 45% 36% 9% 9% 18%
Cyprus 31% 38% 38% 38% 23% 8% 38%
Czech republic 55% 68% 52% 15%
Denmark 62% 75% 62% 19%
Estonia 58% 92% 50% 8% 8%
Finland 73% 38% 27% 4% 23%
France 42% 34% 33% 2% 1% 42%
Germany 22% 21% 24% 60%
Greece 12% 6% 7% 7% 6% 6% 78%
Hungary 21% 56% 5% 37%
Iceland 67% 67% 67% 11% 11% 22%
Ireland 30% 57% 35% 30%
Italy 38% 31% 13% 3% 3% 3% 45%
Latvia 26% 16% 11% 5% 42%
Lithuania 6% 6% 6% 88%
Luxembourg 67% 67% 33%
Malta 50% 50% 50%
Netherlands 65% 73% 42% 4% 8% 15%
Norw ay 50% 67% 50% 33%
Poland 15% 10% 11% 2% 1% 1% 76%
Portugal 34% 22% 17% 5% 5% 2% 51%
Romania 18% 14% 14% 5% 2% 1% 72%
Slovakia 24% 42% 39% 6% 6% 45%
Slovenia 33% 17% 50%
Spain 41% 38% 33% 6% 5% 8% 40%
Sw eden 69% 65% 58% 4% 4%
United Kingdom 62% 49% 41% 26%
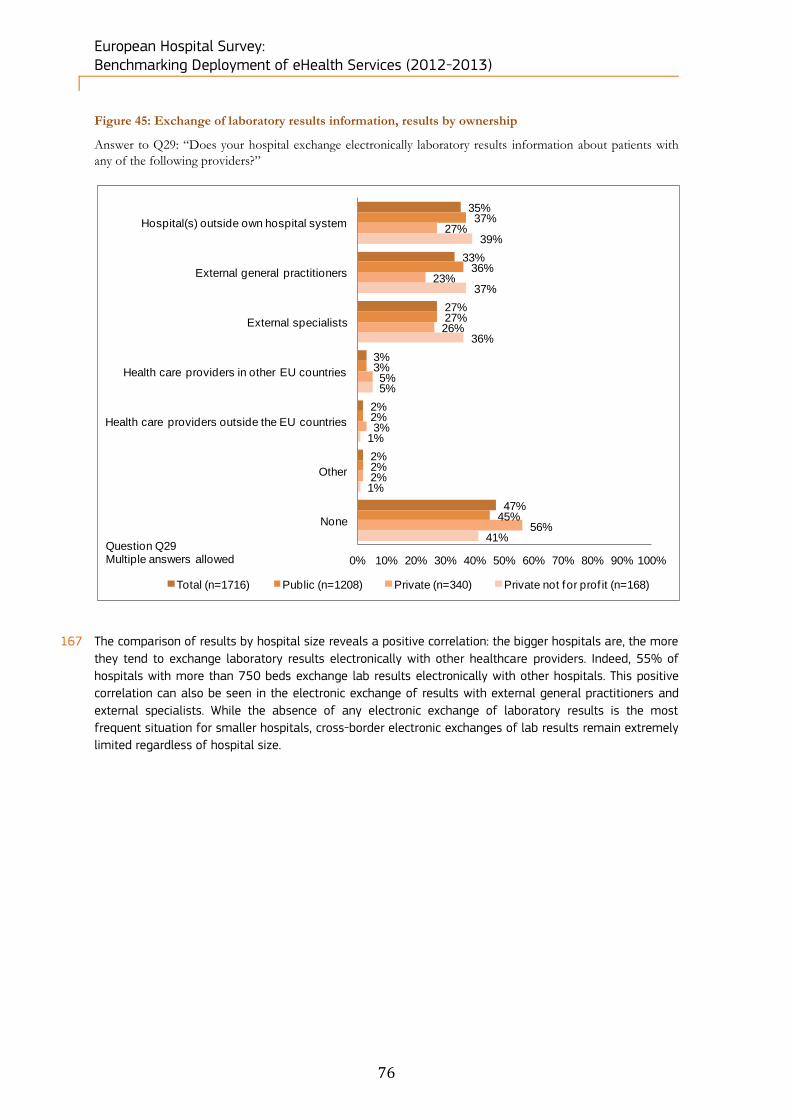
European Hospital Survey: Benchmarking Deployment of eHealth Services (2012-2013)
76
Figure 45: Exchange of laboratory results information, results by ownership
Answer to Q29: “Does your hospital exchange electronically laboratory results information about patients with
any of the following providers?”
167 The comparison of results by hospital size reveals a positive correlation: the bigger hospitals are, the more
they tend to exchange laboratory results electronically with other healthcare providers. Indeed, 55% of
hospitals with more than 750 beds exchange lab results electronically with other hospitals. This positive
correlation can also be seen in the electronic exchange of results with external general practitioners and
external specialists. While the absence of any electronic exchange of laboratory results is the most
frequent situation for smaller hospitals, cross-border electronic exchanges of lab results remain extremely
limited regardless of hospital size.
35%
33%
27%
3%
2%
2%
47%
37%
36%
27%
3%
2%
2%
45%
27%
23%
26%
5%
3%
2%
56%
39%
37%
36%
5%
1%
1%
41%
0% 10% 20% 30% 40% 50% 60% 70% 80% 90% 100%
Hospital(s) outside own hospital system
External general practitioners
External specialists
Health care providers in other EU countries
Health care providers outside the EU countries
Other
None
Total (n=1716) Public (n=1208) Private (n=340) Private not for prof it (n=168)
Question Q29Multiple answers allowed

European Hospital Survey: Benchmarking Deployment of eHealth Services (2012-2013)
77
Figure 46: Exchange of laboratory results information, results by size
Answer to Q29: “Does your hospital exchange electronically laboratory results information about patients with
any of the following providers?”
35%
33%
27%
3%
2%
2%
47%
28%
21%
21%
3%
2%
2%
61%
30%
27%
25%
2%
2%
2%
51%
35%
40%
31%
4%
2%
3%
43%
55%
46%
36%
4%
3%
1%
31%
0% 10% 20% 30% 40% 50% 60% 70% 80% 90% 100%
Hospital(s) outside own hospital system
External general practitioners
External specialists
Health care providers in other EU countries
Health care providers outside the EU countries
Other
None
Total (n=1685) Fewer than 101 beds (n=331)
Between 101 and 250 beds (n=513) Between 251 and 750 beds (n=599)
More than 750 beds (n=242)
Question Q29Multiple answers allowed
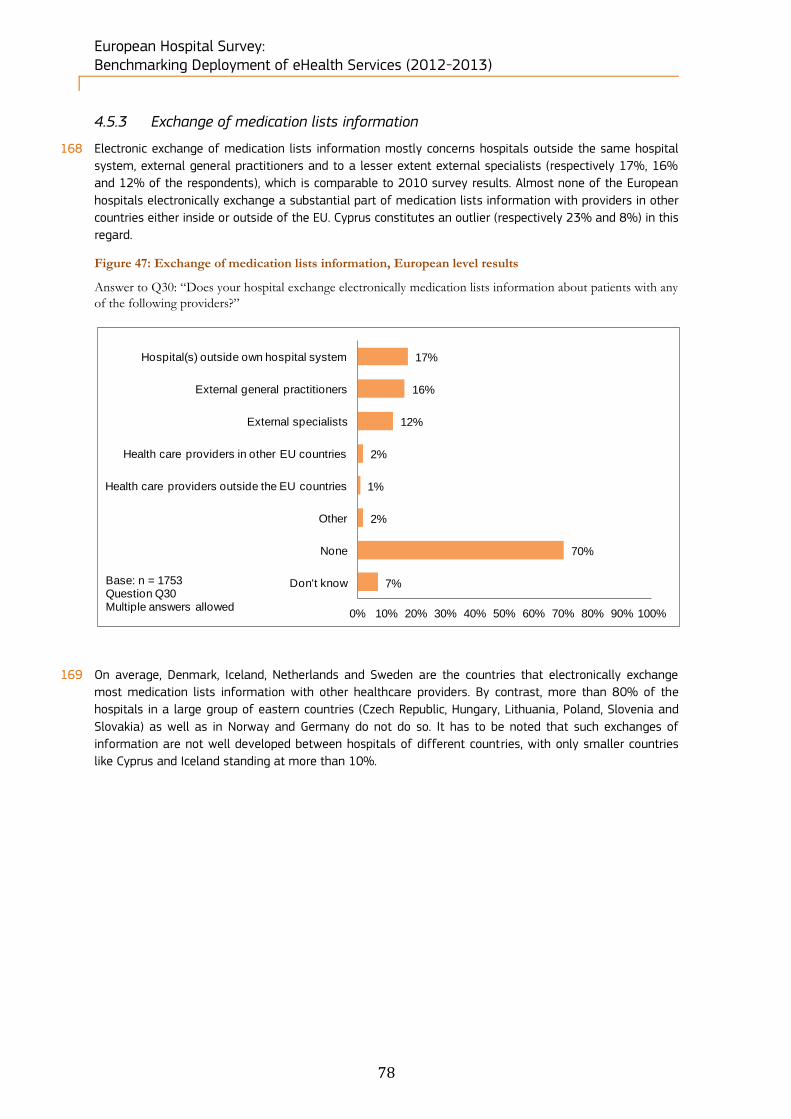
European Hospital Survey: Benchmarking Deployment of eHealth Services (2012-2013)
78
4.5.3 Exchange of medication lists information
168 Electronic exchange of medication lists information mostly concerns hospitals outside the same hospital
system, external general practitioners and to a lesser extent external specialists (respectively 17%, 16%
and 12% of the respondents), which is comparable to 2010 survey results. Almost none of the European
hospitals electronically exchange a substantial part of medication lists information with providers in other
countries either inside or outside of the EU. Cyprus constitutes an outlier (respectively 23% and 8%) in this
regard.
Figure 47: Exchange of medication lists information, European level results
Answer to Q30: “Does your hospital exchange electronically medication lists information about patients with any
of the following providers?”
169 On average, Denmark, Iceland, Netherlands and Sweden are the countries that electronically exchange
most medication lists information with other healthcare providers. By contrast, more than 80% of the
hospitals in a large group of eastern countries (Czech Republic, Hungary, Lithuania, Poland, Slovenia and
Slovakia) as well as in Norway and Germany do not do so. It has to be noted that such exchanges of
information are not well developed between hospitals of different countries, with only smaller countries
like Cyprus and Iceland standing at more than 10%.
17%
16%
12%
2%
1%
2%
70%
7%
0% 10% 20% 30% 40% 50% 60% 70% 80% 90% 100%
Hospital(s) outside own hospital system
External general practitioners
External specialists
Health care providers in other EU countries
Health care providers outside the EU countries
Other
None
Don't knowBase: n = 1753Question Q30Multiple answers allowed
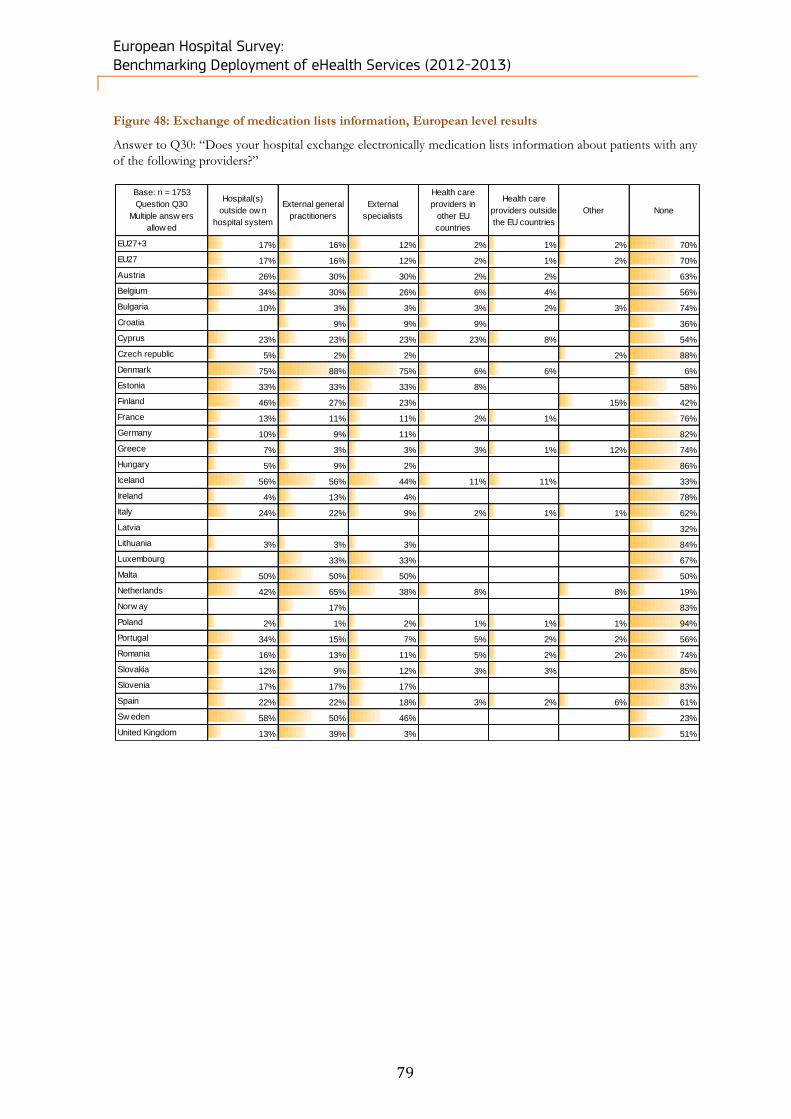
European Hospital Survey: Benchmarking Deployment of eHealth Services (2012-2013)
79
Figure 48: Exchange of medication lists information, European level results
Answer to Q30: “Does your hospital exchange electronically medication lists information about patients with any
of the following providers?”
Base: n = 1753
Question Q30
Multiple answ ers
allow ed
Hospital(s)
outside ow n
hospital system
External general
practitioners
External
specialists
Health care
providers in
other EU
countries
Health care
providers outside
the EU countries
Other None
EU27+3 17% 16% 12% 2% 1% 2% 70%
EU27 17% 16% 12% 2% 1% 2% 70%
Austria 26% 30% 30% 2% 2% 63%
Belgium 34% 30% 26% 6% 4% 56%
Bulgaria 10% 3% 3% 3% 2% 3% 74%
Croatia 9% 9% 9% 36%
Cyprus 23% 23% 23% 23% 8% 54%
Czech republic 5% 2% 2% 2% 88%
Denmark 75% 88% 75% 6% 6% 6%
Estonia 33% 33% 33% 8% 58%
Finland 46% 27% 23% 15% 42%
France 13% 11% 11% 2% 1% 76%
Germany 10% 9% 11% 82%
Greece 7% 3% 3% 3% 1% 12% 74%
Hungary 5% 9% 2% 86%
Iceland 56% 56% 44% 11% 11% 33%
Ireland 4% 13% 4% 78%
Italy 24% 22% 9% 2% 1% 1% 62%
Latvia 32%
Lithuania 3% 3% 3% 84%
Luxembourg 33% 33% 67%
Malta 50% 50% 50% 50%
Netherlands 42% 65% 38% 8% 8% 19%
Norw ay 17% 83%
Poland 2% 1% 2% 1% 1% 1% 94%
Portugal 34% 15% 7% 5% 2% 2% 56%
Romania 16% 13% 11% 5% 2% 2% 74%
Slovakia 12% 9% 12% 3% 3% 85%
Slovenia 17% 17% 17% 83%
Spain 22% 22% 18% 3% 2% 6% 61%
Sw eden 58% 50% 46% 23%
United Kingdom 13% 39% 3% 51%

European Hospital Survey: Benchmarking Deployment of eHealth Services (2012-2013)
80
4.5.4 Electronic exchange of radiology images and reports
170 The next question relates to the electronic exchange of radiology images and reports. Even though the
percentage of hospitals exchanging such information has increased since 2010, 44% of the surveyed
hospitals still do not exchange any radiology images and reports. For the remaining hospitals, the
electronic exchange mainly occurs with hospitals outside the same hospital system (46%, representing an
increase over 2010). Electronic exchanges with external general practitioners and specialists are less
important (respectively 26% and 32% of the surveyed hospitals) and remain stable compared to 2010
results.
Figure 49: Exchange of radiology images and reports, European level results
Answer to Q31: “Does your hospital exchange electronically radiology images and reports about patients with
any of the following providers?”
171 The comparison at country level shows that more than 80% of hospitals in Austria, Czech Republic,
Denmark, Estonia, Finland, Latvia, Luxembourg, Malta and Sweden electronically exchange radiology
reports and images with other hospitals. More than half of the hospitals in Cyprus electronically exchange
such information with other providers in the EU and 31% do so with providers in countries outside the EU.
However, the Cyprus results have to be seen with caution as the number of participating hospitals in
Cyprus is low (n=13). On the other side of the spectrum, a number of countries, namely Bulgaria, Greece,
Romania and Slovenia are falling behind with more than 70% of their hospitals not exchanging this type
of information electronically.
46%
26%
32%
5%
3%
1%
44%
3%
0% 10% 20% 30% 40% 50% 60% 70% 80% 90% 100%
Hospital(s) outside own hospital system
External general practitioners
External specialists
Health care providers in other EU countries
Health care providers outside the EU countries
Other
None
Don't knowBase: n = 1753Question Q31Multiple answers allowed
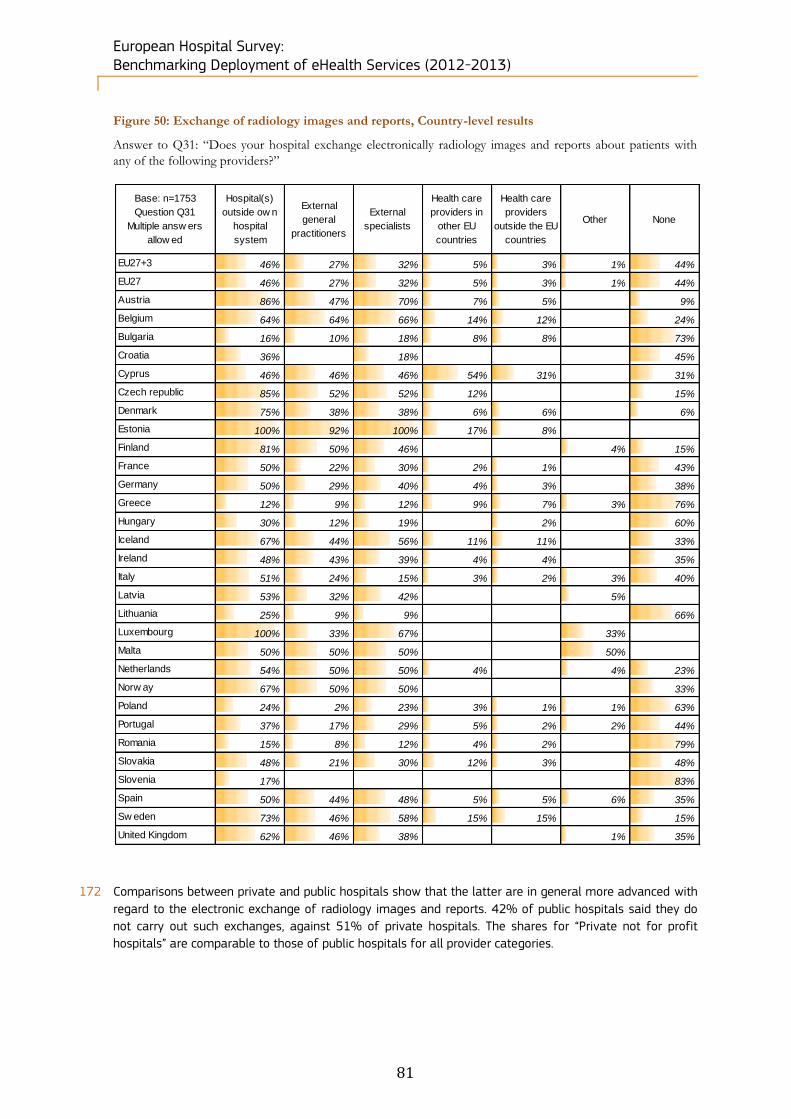
European Hospital Survey: Benchmarking Deployment of eHealth Services (2012-2013)
81
Figure 50: Exchange of radiology images and reports, Country-level results
Answer to Q31: “Does your hospital exchange electronically radiology images and reports about patients with
any of the following providers?”
172 Comparisons between private and public hospitals show that the latter are in general more advanced with
regard to the electronic exchange of radiology images and reports. 42% of public hospitals said they do
not carry out such exchanges, against 51% of private hospitals. The shares for “Private not for profit
hospitals” are comparable to those of public hospitals for all provider categories.
Base: n=1753
Question Q31
Multiple answ ers
allow ed
Hospital(s)
outside ow n
hospital
system
External
general
practitioners
External
specialists
Health care
providers in
other EU
countries
Health care
providers
outside the EU
countries
Other None
EU27+3 46% 27% 32% 5% 3% 1% 44%
EU27 46% 27% 32% 5% 3% 1% 44%
Austria 86% 47% 70% 7% 5% 9%
Belgium 64% 64% 66% 14% 12% 24%
Bulgaria 16% 10% 18% 8% 8% 73%
Croatia 36% 18% 45%
Cyprus 46% 46% 46% 54% 31% 31%
Czech republic 85% 52% 52% 12% 15%
Denmark 75% 38% 38% 6% 6% 6%
Estonia 100% 92% 100% 17% 8%
Finland 81% 50% 46% 4% 15%
France 50% 22% 30% 2% 1% 43%
Germany 50% 29% 40% 4% 3% 38%
Greece 12% 9% 12% 9% 7% 3% 76%
Hungary 30% 12% 19% 2% 60%
Iceland 67% 44% 56% 11% 11% 33%
Ireland 48% 43% 39% 4% 4% 35%
Italy 51% 24% 15% 3% 2% 3% 40%
Latvia 53% 32% 42% 5%
Lithuania 25% 9% 9% 66%
Luxembourg 100% 33% 67% 33%
Malta 50% 50% 50% 50%
Netherlands 54% 50% 50% 4% 4% 23%
Norw ay 67% 50% 50% 33%
Poland 24% 2% 23% 3% 1% 1% 63%
Portugal 37% 17% 29% 5% 2% 2% 44%
Romania 15% 8% 12% 4% 2% 79%
Slovakia 48% 21% 30% 12% 3% 48%
Slovenia 17% 83%
Spain 50% 44% 48% 5% 5% 6% 35%
Sw eden 73% 46% 58% 15% 15% 15%
United Kingdom 62% 46% 38% 1% 35%

European Hospital Survey: Benchmarking Deployment of eHealth Services (2012-2013)
82
Figure 51: Exchange of radiology images and reports, results by ownership
Answer to Q31: “Does your hospital exchange electronically radiology images and reports about patients with
any of the following providers?”
173 As already mentioned for other types of clinical information, there is a positive correlation between
hospital size and the extent to which hospitals can electronically exchange radiology images and reports.
The biggest hospitals tend to exchange more information about medication lists; only 22% of them do not
exchange medication lists information, compared to 65% of hospitals with fewer than 101 beds. This
correlation is observed for electronic information exchanges with any type of healthcare providers, except
for the “None” category and for the exchange of medication lists with “Health care providers outside the
EU countries”.
46%
26%
32%
5%
3%
1%
44%
50%
27%
31%
4%
3%
1%
42%
33%
21%
30%
6%
4%
2%
51%
46%
34%
43%
7%
4%
1%
42%
0% 10% 20% 30% 40% 50% 60% 70% 80% 90% 100%
Hospital(s) outside own hospital system
External general practitioners
External specialists
Health care providers in other EU countries
Health care providers outside the EU countries
Other
None
Total (n=1716) Public (n=1208) Private (n=340) Private not for prof it (n=168)
Question Q31Multiple answers allowed
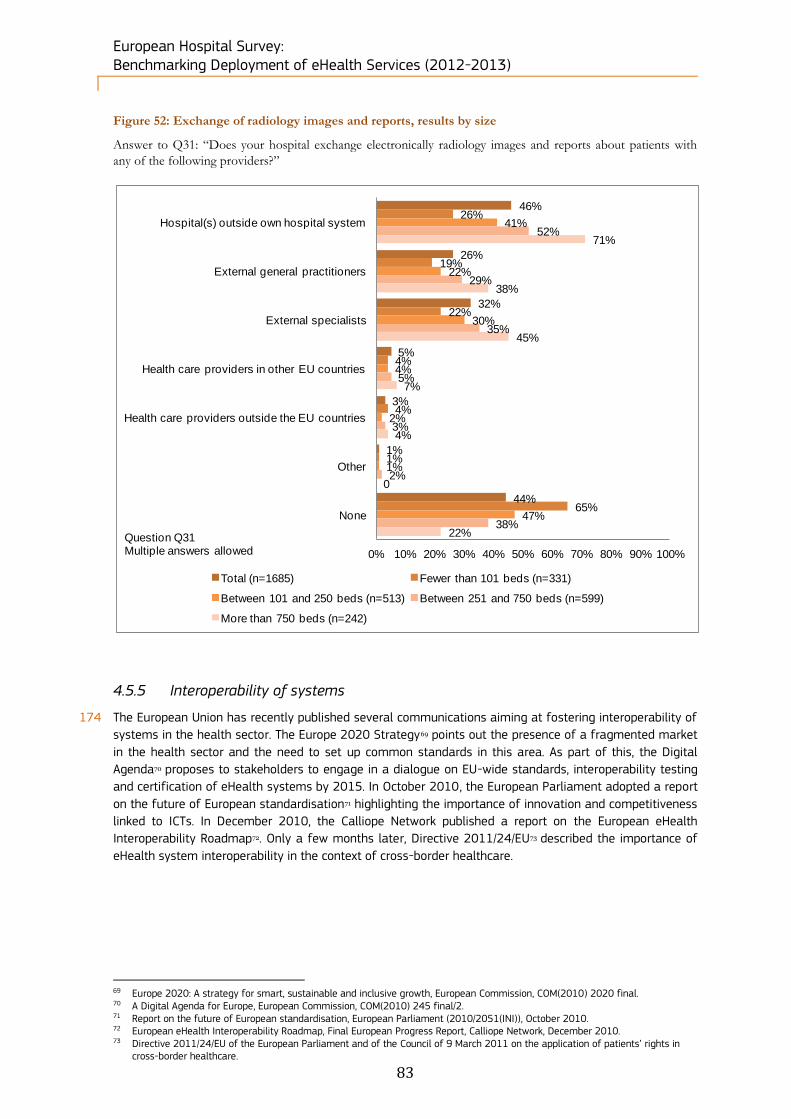
European Hospital Survey: Benchmarking Deployment of eHealth Services (2012-2013)
83
Figure 52: Exchange of radiology images and reports, results by size
Answer to Q31: “Does your hospital exchange electronically radiology images and reports about patients with
any of the following providers?”
4.5.5 Interoperability of systems
174 The European Union has recently published several communications aiming at fostering interoperability of
systems in the health sector. The Europe 2020 Strategy69 points out the presence of a fragmented market
in the health sector and the need to set up common standards in this area. As part of this, the Digital
Agenda70 proposes to stakeholders to engage in a dialogue on EU-wide standards, interoperability testing
and certification of eHealth systems by 2015. In October 2010, the European Parliament adopted a report
on the future of European standardisation71 highlighting the importance of innovation and competitiveness
linked to ICTs. In December 2010, the Calliope Network published a report on the European eHealth
Interoperability Roadmap72. Only a few months later, Directive 2011/24/EU73 described the importance of
eHealth system interoperability in the context of cross-border healthcare.
69 Europe 2020: A strategy for smart, sustainable and inclusive growth, European Commission, COM(2010) 2020 final. 70 A Digital Agenda for Europe, European Commission, COM(2010) 245 final/2. 71 Report on the future of European standardisation, European Parliament (2010/2051(INI)), October 2010. 72 European eHealth Interoperability Roadmap, Final European Progress Report, Calliope Network, December 2010. 73 Directive 2011/24/EU of the European Parliament and of the Council of 9 March 2011 on the application of patients’ rights in
cross-border healthcare.
46%
26%
32%
5%
3%
1%
44%
26%
19%
22%
4%
4%
1%
65%
41%
22%
30%
4%
2%
1%
47%
52%
29%
35%
5%
3%
2%
38%
71%
38%
45%
7%
4%
0
22%
0% 10% 20% 30% 40% 50% 60% 70% 80% 90% 100%
Hospital(s) outside own hospital system
External general practitioners
External specialists
Health care providers in other EU countries
Health care providers outside the EU countries
Other
None
Total (n=1685) Fewer than 101 beds (n=331)
Between 101 and 250 beds (n=513) Between 251 and 750 beds (n=599)
More than 750 beds (n=242)
Question Q31Multiple answers allowed

European Hospital Survey: Benchmarking Deployment of eHealth Services (2012-2013)
84
175 As shown on the bar chart below, 46% of European hospitals do not experience any interoperability
problems. Interestingly, this result is lower than in 2010 (57%). A reason that may explain this difference
is that more hospitals exchange information and those that recently started may need some time to solve
potential interoperability problems. When a hospital experiences interoperability problems, it is more at the
technical level (36% of the respondents) than at the semantic or organisational level (21% and 24% of
respondents respectively).
Figure 53: Interoperability problems between departmental EPR systems, European level results
Answer to Q32: “You said that your hospital uses electronic patient records (EPRs) which share information. Do
you encounter interoperability problems between the different departmental EPR systems?”
176 The countries where hospitals experience the least interoperability problems are Bulgaria, Hungary, Poland
Slovakia and Slovenia. In contrast, Estonian, British and Norwegian hospitals experienced the most
interoperability problems.
36%
21%
24%
46%
5%
0% 10% 20% 30% 40% 50% 60% 70% 80% 90% 100%
Yes, at the technical level
Yes, at the semantic level
Yes, at the organisational level
Never
Don't know
Base: n = 1314 (said 1 or 2 at Q23)Question Q32Multiple answers allowed

European Hospital Survey: Benchmarking Deployment of eHealth Services (2012-2013)
85
Figure 54: Interoperability problems between departmental EPR systems, Country-level results
Answer to Q32: “You said that your hospital uses electronic patient records (EPRs) which share information. Do
you encounter interoperability problems between the different departmental EPR systems?”
177 Results by ownership type show that public hospitals encounter more interoperability problems than
private ones. Between 39% and 28% of the surveyed public hospitals have technical, semantic or
organisational problems between different departmental EPR systems. In fact, only 43% of public
hospitals declared they never had such problems, compared to 54% of private hospitals and 58% of
private not for profit hospitals.
Base: n=1314
Question Q32Yes, at the technical level Yes, at the semantic level
Yes, at the organisational
levelNever
EU27+3 36% 21% 24% 46%
EU27 36% 21% 24% 46%
Austria 31% 13% 26% 51%
Belgium 30% 38% 36% 43%
Bulgaria 10% 5% 10% 79%
Croatia 40% 10% 20% 40%
Cyprus 40% 20% 0% 40%
Czech republic 31% 19% 22% 47%
Denmark 53% 20% 27% 47%
Estonia 58% 67% 33% 8%
Finland 48% 36% 36% 40%
France 39% 22% 27% 43%
Germany 37% 13% 24% 47%
Greece 44% 13% 23% 49%
Hungary 14% 5% 10% 71%
Iceland 44% 0% 44% 44%
Ireland 45% 45% 27% 27%
Italy 45% 38% 44% 31%
Latvia 43% 14% 7% 43%
Lithuania 56% 12% 6% 38%
Luxembourg 0% 67% 0% 33%
Malta 50% 50% 50% 50%
Netherlands 50% 58% 46% 27%
Norw ay 75% 25% 25% 25%
Poland 17% 5% 15% 68%
Portugal 22% 32% 22% 35%
Romania 44% 3% 12% 45%
Slovakia 18% 4% 7% 71%
Slovenia 0% 0% 33% 67%
Spain 32% 18% 20% 50%
Sw eden 23% 14% 9% 59%
United Kingdom 62% 41% 24% 22%

European Hospital Survey: Benchmarking Deployment of eHealth Services (2012-2013)
86
Figure 55: Interoperability problems between departmental EPR systems, results by ownership
Answer to Q32: “You said that your hospital uses electronic patient records (EPRs) which share information. Do
you encounter interoperability problems between the different departmental EPR systems?”
178 There seems to be a correlation between the size of hospitals and the presence of interoperability
problems between the different departmental EPR systems: the bigger hospitals are, the more they
encounter interoperability problems. However, the differences are more or less pronounced when
considering the type of problem. Differences are evident for problems at the organisational and semantic
levels, but they are less marked at technical level, as shown in Figure 56.
36%
21%
24%
46%
5%
39%
24%
28%
43%
4%
30%
10%
15%
54%
6%
27%
16%
17%
58%
3%
0% 10% 20% 30% 40% 50% 60% 70% 80% 90% 100%
Yes, at the technical level
Yes, at the semantic level
Yes, at the organisational level
Never
Don't know
Total (n=1283) Public (n=914) Private (n=224) Private not for prof it (n=145)
Question Q32Multiple answers allowed

European Hospital Survey: Benchmarking Deployment of eHealth Services (2012-2013)
87
Figure 56: Interoperability problems between departmental EPR systems, results by size
Answer to Q32: “You said that your hospital uses electronic patient records (EPRs) which share information. Do
you encounter interoperability problems between the different departmental EPR systems?”
36%
21%
24%
46%
5%
29%
6%
11%
57%
7%
35%
17%
18%
50%
6%
37%
22%
30%
44%
3%
38%
37%
34%
36%
5%
0% 10% 20% 30% 40% 50% 60% 70% 80% 90% 100%
Yes, at the technical level
Yes, at the semantic level
Yes, at the organisational level
Never
Don't know
Total (n=1256) Fewer than 101 beds (n=196)
Between 101 and 250 beds (n=363) Between 251 and 750 beds (n=486)
More than 750 beds (n=211)
Question Q32Multiple answers allowed
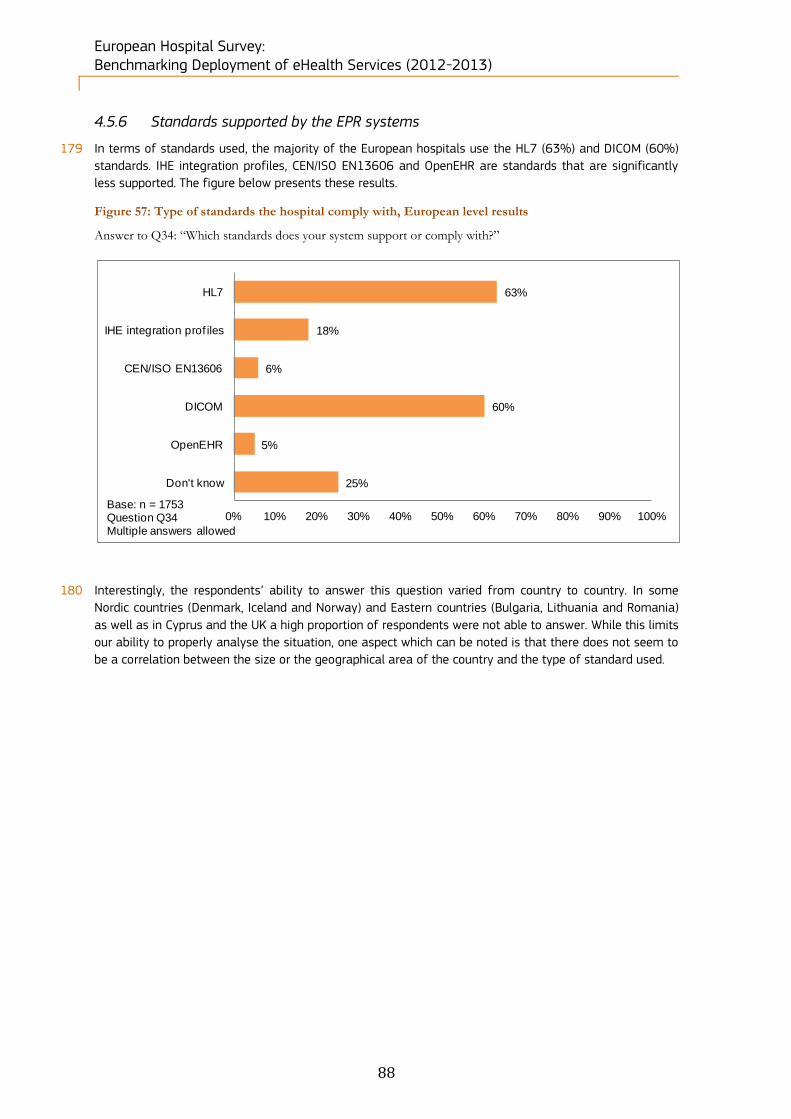
European Hospital Survey: Benchmarking Deployment of eHealth Services (2012-2013)
88
4.5.6 Standards supported by the EPR systems
179 In terms of standards used, the majority of the European hospitals use the HL7 (63%) and DICOM (60%)
standards. IHE integration profiles, CEN/ISO EN13606 and OpenEHR are standards that are significantly
less supported. The figure below presents these results.
Figure 57: Type of standards the hospital comply with, European level results
Answer to Q34: “Which standards does your system support or comply with?”
180 Interestingly, the respondents’ ability to answer this question varied from country to country. In some
Nordic countries (Denmark, Iceland and Norway) and Eastern countries (Bulgaria, Lithuania and Romania)
as well as in Cyprus and the UK a high proportion of respondents were not able to answer. While this limits
our ability to properly analyse the situation, one aspect which can be noted is that there does not seem to
be a correlation between the size or the geographical area of the country and the type of standard used.
63%
18%
6%
60%
5%
25%
0% 10% 20% 30% 40% 50% 60% 70% 80% 90% 100%
HL7
IHE integration prof iles
CEN/ISO EN13606
DICOM
OpenEHR
Don't know
Base: n = 1753Question Q34Multiple answers allowed
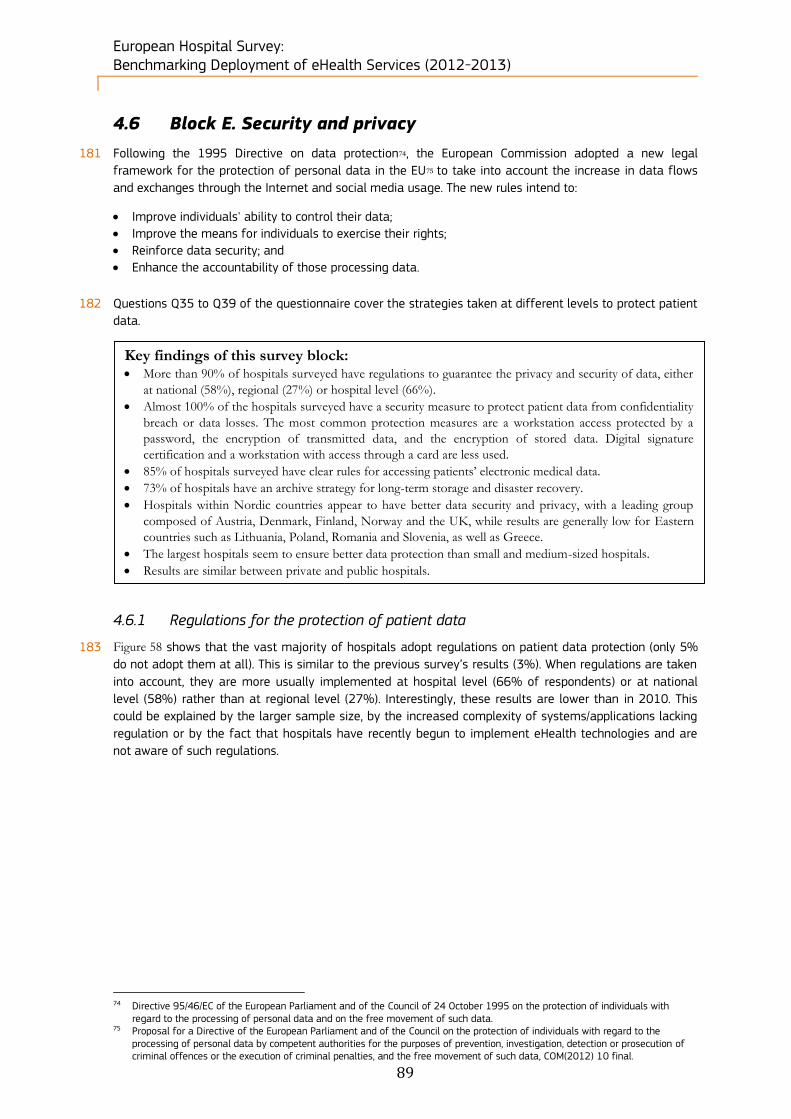
European Hospital Survey: Benchmarking Deployment of eHealth Services (2012-2013)
89
4.6 Block E. Security and privacy
181 Following the 1995 Directive on data protection74, the European Commission adopted a new legal
framework for the protection of personal data in the EU75 to take into account the increase in data flows
and exchanges through the Internet and social media usage. The new rules intend to:
Improve individuals' ability to control their data;
Improve the means for individuals to exercise their rights;
Reinforce data security; and
Enhance the accountability of those processing data.
182 Questions Q35 to Q39 of the questionnaire cover the strategies taken at different levels to protect patient
data.
4.6.1 Regulations for the protection of patient data
183 Figure 58 shows that the vast majority of hospitals adopt regulations on patient data protection (only 5%
do not adopt them at all). This is similar to the previous survey’s results (3%). When regulations are taken
into account, they are more usually implemented at hospital level (66% of respondents) or at national
level (58%) rather than at regional level (27%). Interestingly, these results are lower than in 2010. This
could be explained by the larger sample size, by the increased complexity of systems/applications lacking
regulation or by the fact that hospitals have recently begun to implement eHealth technologies and are
not aware of such regulations.
74 Directive 95/46/EC of the European Parliament and of the Council of 24 October 1995 on the protection of individuals with
regard to the processing of personal data and on the free movement of such data. 75 Proposal for a Directive of the European Parliament and of the Council on the protection of individuals with regard to the
processing of personal data by competent authorities for the purposes of prevention, investigation, detection or prosecution of criminal offences or the execution of criminal penalties, and the free movement of such data, COM(2012) 10 final.
Key findings of this survey block: More than 90% of hospitals surveyed have regulations to guarantee the privacy and security of data, either
at national (58%), regional (27%) or hospital level (66%).
Almost 100% of the hospitals surveyed have a security measure to protect patient data from confidentiality
breach or data losses. The most common protection measures are a workstation access protected by a
password, the encryption of transmitted data, and the encryption of stored data. Digital signature
certification and a workstation with access through a card are less used.
85% of hospitals surveyed have clear rules for accessing patients’ electronic medical data.
73% of hospitals have an archive strategy for long-term storage and disaster recovery.
Hospitals within Nordic countries appear to have better data security and privacy, with a leading group
composed of Austria, Denmark, Finland, Norway and the UK, while results are generally low for Eastern
countries such as Lithuania, Poland, Romania and Slovenia, as well as Greece.
The largest hospitals seem to ensure better data protection than small and medium-sized hospitals.
Results are similar between private and public hospitals.
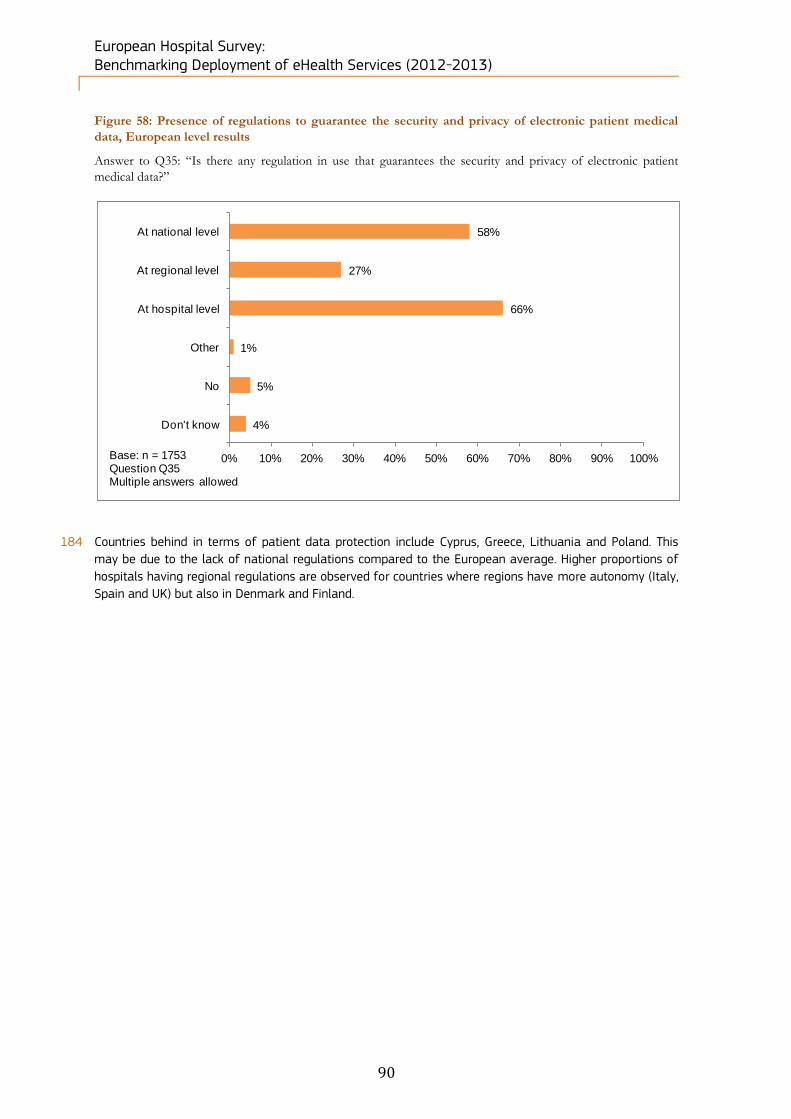
European Hospital Survey: Benchmarking Deployment of eHealth Services (2012-2013)
90
Figure 58: Presence of regulations to guarantee the security and privacy of electronic patient medical
data, European level results
Answer to Q35: “Is there any regulation in use that guarantees the security and privacy of electronic patient
medical data?”
184 Countries behind in terms of patient data protection include Cyprus, Greece, Lithuania and Poland. This
may be due to the lack of national regulations compared to the European average. Higher proportions of
hospitals having regional regulations are observed for countries where regions have more autonomy (Italy,
Spain and UK) but also in Denmark and Finland.
58%
27%
66%
1%
5%
4%
0% 10% 20% 30% 40% 50% 60% 70% 80% 90% 100%
At national level
At regional level
At hospital level
Other
No
Don't know
Base: n = 1753Question Q35Multiple answers allowed
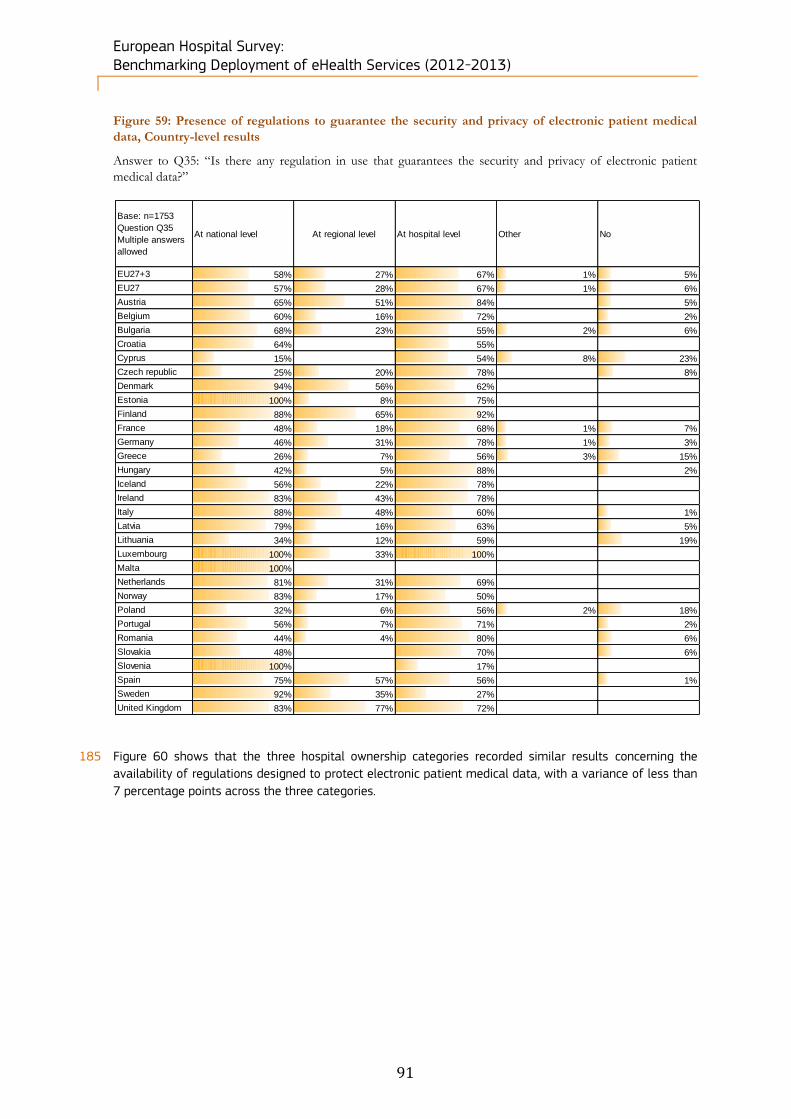
European Hospital Survey: Benchmarking Deployment of eHealth Services (2012-2013)
91
Figure 59: Presence of regulations to guarantee the security and privacy of electronic patient medical
data, Country-level results
Answer to Q35: “Is there any regulation in use that guarantees the security and privacy of electronic patient
medical data?”
185 Figure 60 shows that the three hospital ownership categories recorded similar results concerning the
availability of regulations designed to protect electronic patient medical data, with a variance of less than
7 percentage points across the three categories.
Base: n=1753
Question Q35
Multiple answers
allowed
At national level At regional level At hospital level Other No
EU27+3 58% 27% 67% 1% 5%
EU27 57% 28% 67% 1% 6%
Austria 65% 51% 84% 5%
Belgium 60% 16% 72% 2%
Bulgaria 68% 23% 55% 2% 6%
Croatia 64% 55%
Cyprus 15% 54% 8% 23%
Czech republic 25% 20% 78% 8%
Denmark 94% 56% 62%
Estonia 100% 8% 75%
Finland 88% 65% 92%
France 48% 18% 68% 1% 7%
Germany 46% 31% 78% 1% 3%
Greece 26% 7% 56% 3% 15%
Hungary 42% 5% 88% 2%
Iceland 56% 22% 78%
Ireland 83% 43% 78%
Italy 88% 48% 60% 1%
Latvia 79% 16% 63% 5%
Lithuania 34% 12% 59% 19%
Luxembourg 100% 33% 100%
Malta 100%
Netherlands 81% 31% 69%
Norway 83% 17% 50%
Poland 32% 6% 56% 2% 18%
Portugal 56% 7% 71% 2%
Romania 44% 4% 80% 6%
Slovakia 48% 70% 6%
Slovenia 100% 17%
Spain 75% 57% 56% 1%
Sweden 92% 35% 27%
United Kingdom 83% 77% 72%

European Hospital Survey: Benchmarking Deployment of eHealth Services (2012-2013)
92
Figure 60: Presence of regulations to guarantee the security and privacy of electronic patient medical
data, results by ownership
Answer to Q35: “Is there any regulation in use that guarantees the security and privacy of electronic patient
medical data?”
186 The majority of hospitals across all size categories have regulations in place guaranteeing security and
privacy of data at both national and hospital level. Percentages are highest for larger hospitals and can
reach respectively 69% and 72%, while hospitals with less than 251 beds report relatively smaller values
(from 50% to 66%). Regional level regulations are not very widely implemented in comparison.
187 The analysis reveals no clear correlation between hospital size and the availability of regulations
guaranteeing the security and privacy of electronic patient data. However, larger hospitals tend to have
more regulations of this type (only 3% of hospitals with more than 251 beds said they did not have such
regulations, compared to around 8% of hospitals with 250 beds or fewer).
57%
27%
67%
1%
6%
58%
28%
66%
1%
5%
57%
24%
67%
1%
7%
52%
26%
73%
1%
4%
0% 10% 20% 30% 40% 50% 60% 70% 80% 90% 100%
At national level
At regional level
At hospital level
Other
No
Total (n=1716) Public (n=1208) Private (n=340) Private not for prof it (n=168)
Base: n=1716Question Q35Multiple answers
allowed

European Hospital Survey: Benchmarking Deployment of eHealth Services (2012-2013)
93
Figure 61: Presence of regulations to guarantee the security and privacy of electronic patient medical
data, results by size
Answer to Q35: “Is there any regulation in use that guarantees the security and privacy of electronic patient
medical data?”
4.6.2 Security measures
188 All but 7 of the hospitals surveyed have at least one security measure to protect patient data from any
confidentiality breach or data losses. The most common protection measure is “Workstation access
protected by a password” (93% of the hospitals). “Encryption of transmitted data” and “Encryption of
stored data” are used by respectively 58% and 37% of the hospitals surveyed. Additional (though less
commonly used) security measures are “Digital signature certification” and “Workstation with access
through card”, for 30% and 18% of respondents respectively.
58%
27%
67%
1%
6%
56%
30%
63%
1%
7%
50%
24%
66%
1%
9%
60%
28%
68%
1%
3%
69%
29%
72%
0%
3%
0% 10% 20% 30% 40% 50% 60% 70% 80% 90% 100%
At national level
At regional level
At hospital level
Other
No
Total (n=1685)Fewer than 101 beds (n=331)Between 101 and 250 beds (n=513)Between 251 and 750 beds (n=599)More than 750 beds (n=242)
Base: n=1685Question Q35Multiple answers allowed
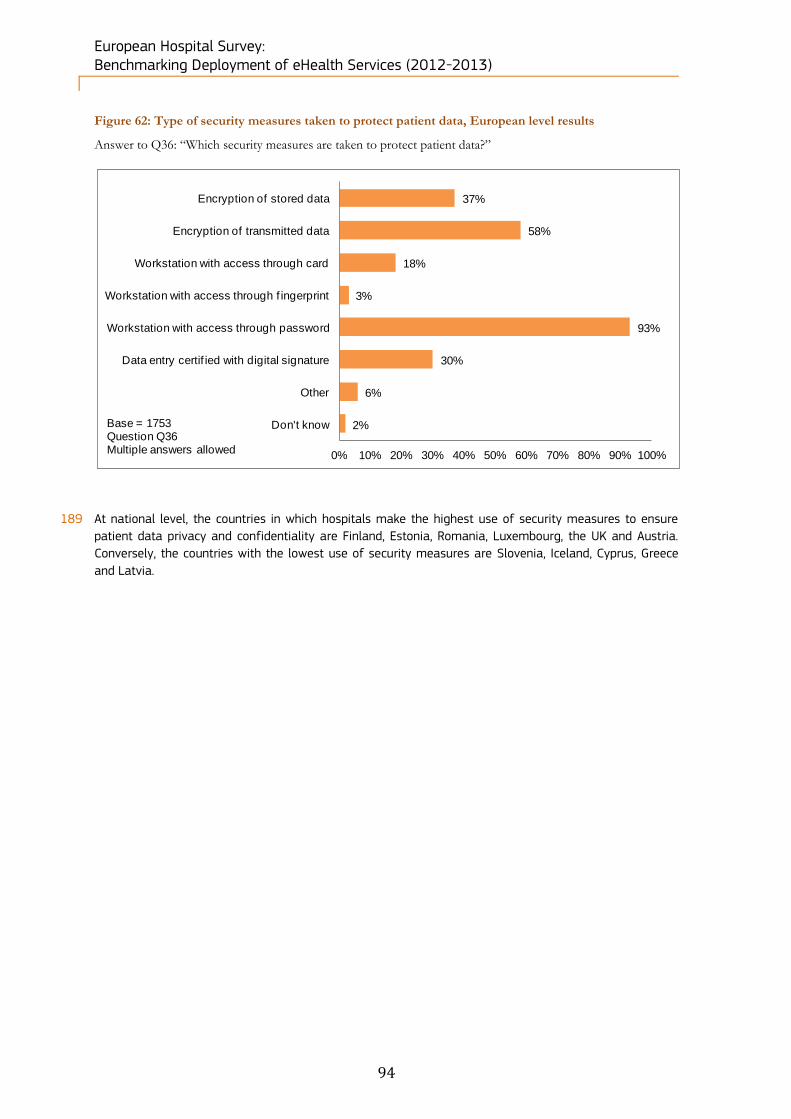
European Hospital Survey: Benchmarking Deployment of eHealth Services (2012-2013)
94
Figure 62: Type of security measures taken to protect patient data, European level results
Answer to Q36: “Which security measures are taken to protect patient data?”
189 At national level, the countries in which hospitals make the highest use of security measures to ensure
patient data privacy and confidentiality are Finland, Estonia, Romania, Luxembourg, the UK and Austria.
Conversely, the countries with the lowest use of security measures are Slovenia, Iceland, Cyprus, Greece
and Latvia.
37%
58%
18%
3%
93%
30%
6%
2%
0% 10% 20% 30% 40% 50% 60% 70% 80% 90% 100%
Encryption of stored data
Encryption of transmitted data
Workstation with access through card
Workstation with access through f ingerprint
Workstation with access through password
Data entry certif ied with digital signature
Other
Don't knowBase = 1753Question Q36Multiple answers allowed

European Hospital Survey: Benchmarking Deployment of eHealth Services (2012-2013)
95
Figure 63: Type of security measures taken to protect patient data, Country-level results
Answer to Q36: “Which security measures are taken to protect patient data?”
Base: n=1753
Question Q36 Multiple
answ ers allow ed
Encryption
of stored
data
Encryption
of
transmitted
data
Workstation
w ith
access
through
card
Workstation
w ith
access
through
fingerprint
Workstation
w ith
access
through
passw ord
Data entry
certif ied
w ith digital
signature
Other
EU27+3 37% 58% 18% 3% 93% 30% 6%
EU27 37% 58% 18% 3% 94% 31% 6%
Austria 40% 86% 26% 12% 95% 26% 7%
Belgium 28% 82% 20% 10% 92% 40% 8%
Bulgaria 37% 50% 10% 92% 37% 2%
Croatia 36% 18% 18% 82% 18%
Cyprus 38% 15% 8% 69% 8% 8%
Czech republic 45% 50% 100% 15%
Denmark 31% 44% 12% 88% 88%
Estonia 33% 83% 58% 75% 58% 33%
Finland 69% 77% 27% 4% 100% 31% 19%
France 26% 62% 21% 1% 97% 37% 3%
Germany 40% 69% 15% 3% 98% 25% 6%
Greece 18% 16% 3% 91% 10% 3%
Hungary 53% 51% 5% 95% 5% 2%
Iceland 11% 56% 56% 11% 11%
Ireland 43% 70% 4% 91% 22% 9%
Italy 36% 57% 25% 1% 93% 53% 9%
Latvia 11% 21% 11% 89% 16%
Lithuania 28% 34% 22% 84% 38% 9%
Luxembourg 67% 33% 67% 100% 33%
Malta 50% 50% 100% 50%
Netherlands 23% 69% 38% 8% 92% 23% 23%
Norw ay 50% 17% 83% 17% 17%
Poland 29% 38% 6% 1% 90% 7% 2%
Portugal 22% 24% 2% 22% 93% 5% 2%
Romania 59% 85% 14% 2% 88% 59% 11%
Slovakia 33% 52% 3% 97% 9% 9%
Slovenia 33% 83%
Spain 44% 68% 21% 2% 99% 38% 3%
Sw eden 54% 62% 58% 88% 42% 8%
United Kingdom 80% 62% 35% 13% 91% 12% 1%
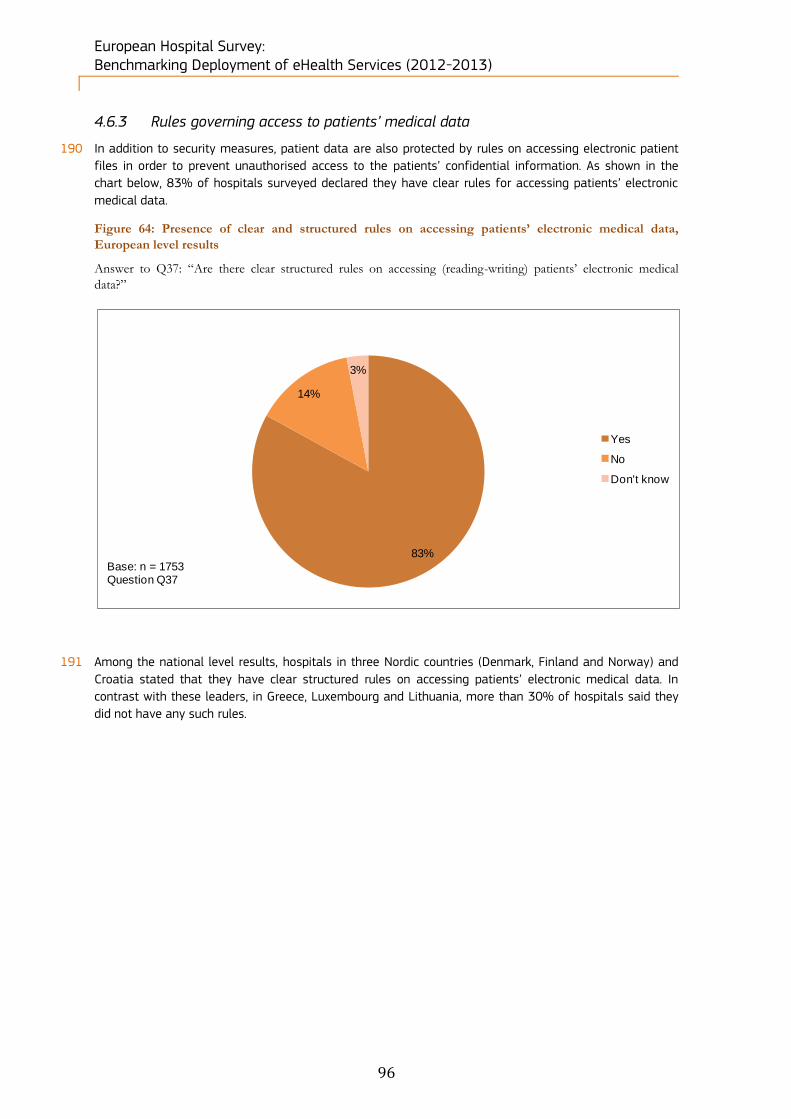
European Hospital Survey: Benchmarking Deployment of eHealth Services (2012-2013)
96
4.6.3 Rules governing access to patients’ medical data
190 In addition to security measures, patient data are also protected by rules on accessing electronic patient
files in order to prevent unauthorised access to the patients’ confidential information. As shown in the
chart below, 83% of hospitals surveyed declared they have clear rules for accessing patients’ electronic
medical data.
Figure 64: Presence of clear and structured rules on accessing patients’ electronic medical data,
European level results
Answer to Q37: “Are there clear structured rules on accessing (reading-writing) patients’ electronic medical
data?”
191 Among the national level results, hospitals in three Nordic countries (Denmark, Finland and Norway) and
Croatia stated that they have clear structured rules on accessing patients’ electronic medical data. In
contrast with these leaders, in Greece, Luxembourg and Lithuania, more than 30% of hospitals said they
did not have any such rules.
83%
14%
3%
Yes
No
Don't know
Base: n = 1753Question Q37
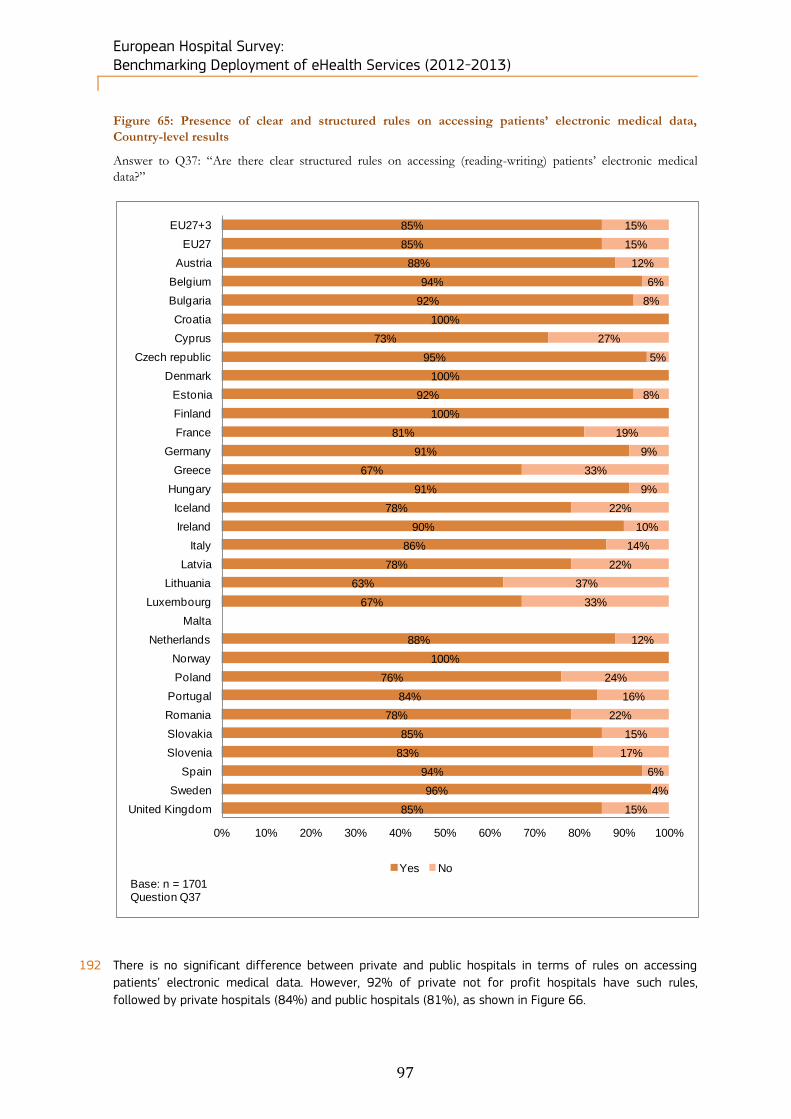
European Hospital Survey: Benchmarking Deployment of eHealth Services (2012-2013)
97
Figure 65: Presence of clear and structured rules on accessing patients’ electronic medical data,
Country-level results
Answer to Q37: “Are there clear structured rules on accessing (reading-writing) patients’ electronic medical
data?”
192 There is no significant difference between private and public hospitals in terms of rules on accessing
patients’ electronic medical data. However, 92% of private not for profit hospitals have such rules,
followed by private hospitals (84%) and public hospitals (81%), as shown in Figure 66.
85%
85%
88%
94%
92%
100%
73%
95%
100%
92%
100%
81%
91%
67%
91%
78%
90%
86%
78%
63%
67%
88%
100%
76%
84%
78%
85%
83%
94%
96%
85%
15%
15%
12%
6%
8%
27%
5%
8%
19%
9%
33%
9%
22%
10%
14%
22%
37%
33%
12%
24%
16%
22%
15%
17%
6%
4%
15%
0% 10% 20% 30% 40% 50% 60% 70% 80% 90% 100%
EU27+3
EU27
Austria
Belgium
Bulgaria
Croatia
Cyprus
Czech republic
Denmark
Estonia
Finland
France
Germany
Greece
Hungary
Iceland
Ireland
Italy
Latvia
Lithuania
Luxembourg
Malta
Netherlands
Norway
Poland
Portugal
Romania
Slovakia
Slovenia
Spain
Sweden
United Kingdom
Yes No
Base: n = 1701Question Q37
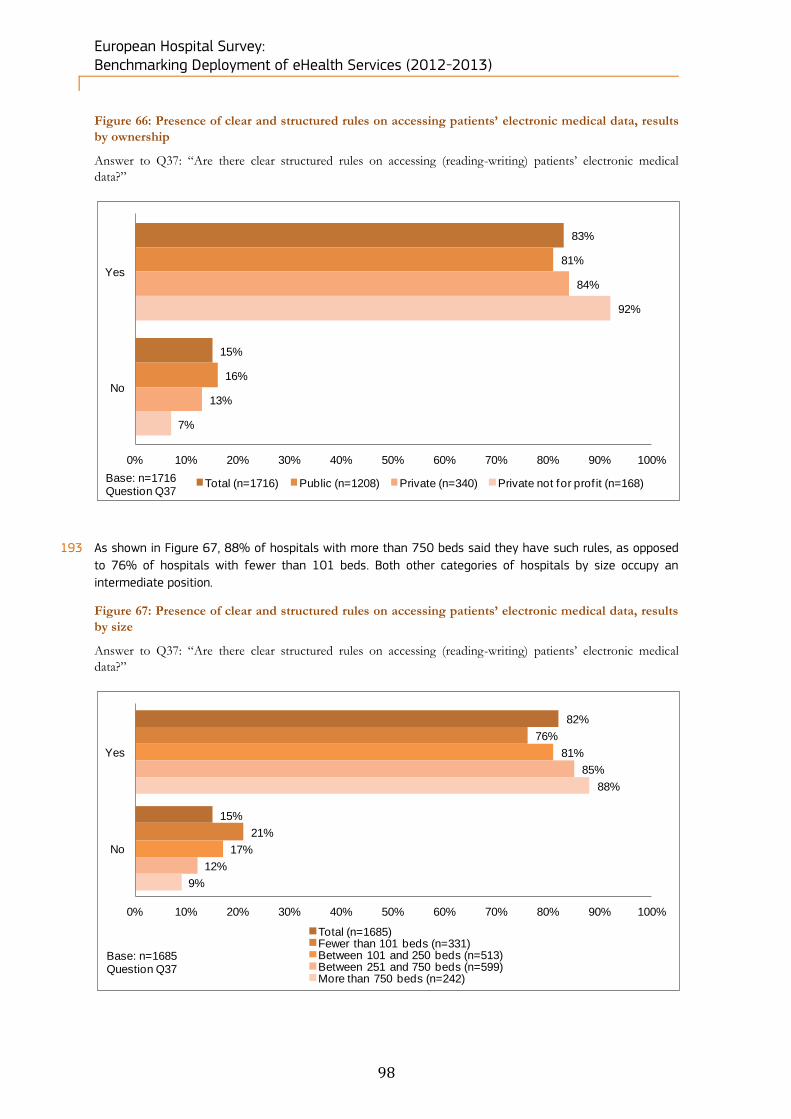
European Hospital Survey: Benchmarking Deployment of eHealth Services (2012-2013)
98
Figure 66: Presence of clear and structured rules on accessing patients’ electronic medical data, results
by ownership
Answer to Q37: “Are there clear structured rules on accessing (reading-writing) patients’ electronic medical
data?”
193 As shown in Figure 67, 88% of hospitals with more than 750 beds said they have such rules, as opposed
to 76% of hospitals with fewer than 101 beds. Both other categories of hospitals by size occupy an
intermediate position.
Figure 67: Presence of clear and structured rules on accessing patients’ electronic medical data, results
by size
Answer to Q37: “Are there clear structured rules on accessing (reading-writing) patients’ electronic medical
data?”
83%
15%
81%
16%
84%
13%
92%
7%
0% 10% 20% 30% 40% 50% 60% 70% 80% 90% 100%
Yes
No
Total (n=1716) Public (n=1208) Private (n=340) Private not for prof it (n=168)Base: n=1716Question Q37
82%
15%
76%
21%
81%
17%
85%
12%
88%
9%
0% 10% 20% 30% 40% 50% 60% 70% 80% 90% 100%
Yes
No
Total (n=1685)Fewer than 101 beds (n=331)Between 101 and 250 beds (n=513)Between 251 and 750 beds (n=599)More than 750 beds (n=242)
Base: n=1685Question Q37
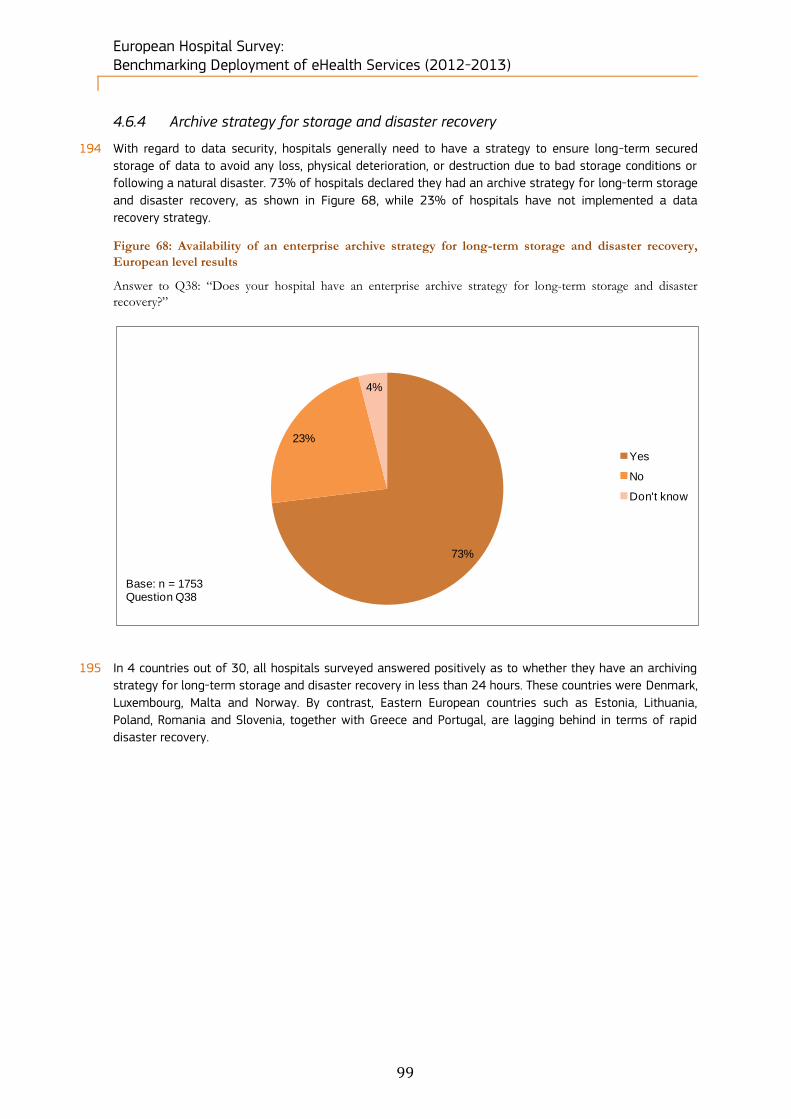
European Hospital Survey: Benchmarking Deployment of eHealth Services (2012-2013)
99
4.6.4 Archive strategy for storage and disaster recovery
194 With regard to data security, hospitals generally need to have a strategy to ensure long-term secured
storage of data to avoid any loss, physical deterioration, or destruction due to bad storage conditions or
following a natural disaster. 73% of hospitals declared they had an archive strategy for long-term storage
and disaster recovery, as shown in Figure 68, while 23% of hospitals have not implemented a data
recovery strategy.
Figure 68: Availability of an enterprise archive strategy for long-term storage and disaster recovery,
European level results
Answer to Q38: “Does your hospital have an enterprise archive strategy for long-term storage and disaster
recovery?”
195 In 4 countries out of 30, all hospitals surveyed answered positively as to whether they have an archiving
strategy for long-term storage and disaster recovery in less than 24 hours. These countries were Denmark,
Luxembourg, Malta and Norway. By contrast, Eastern European countries such as Estonia, Lithuania,
Poland, Romania and Slovenia, together with Greece and Portugal, are lagging behind in terms of rapid
disaster recovery.
73%
23%
4%
Yes
No
Don't know
Base: n = 1753Question Q38
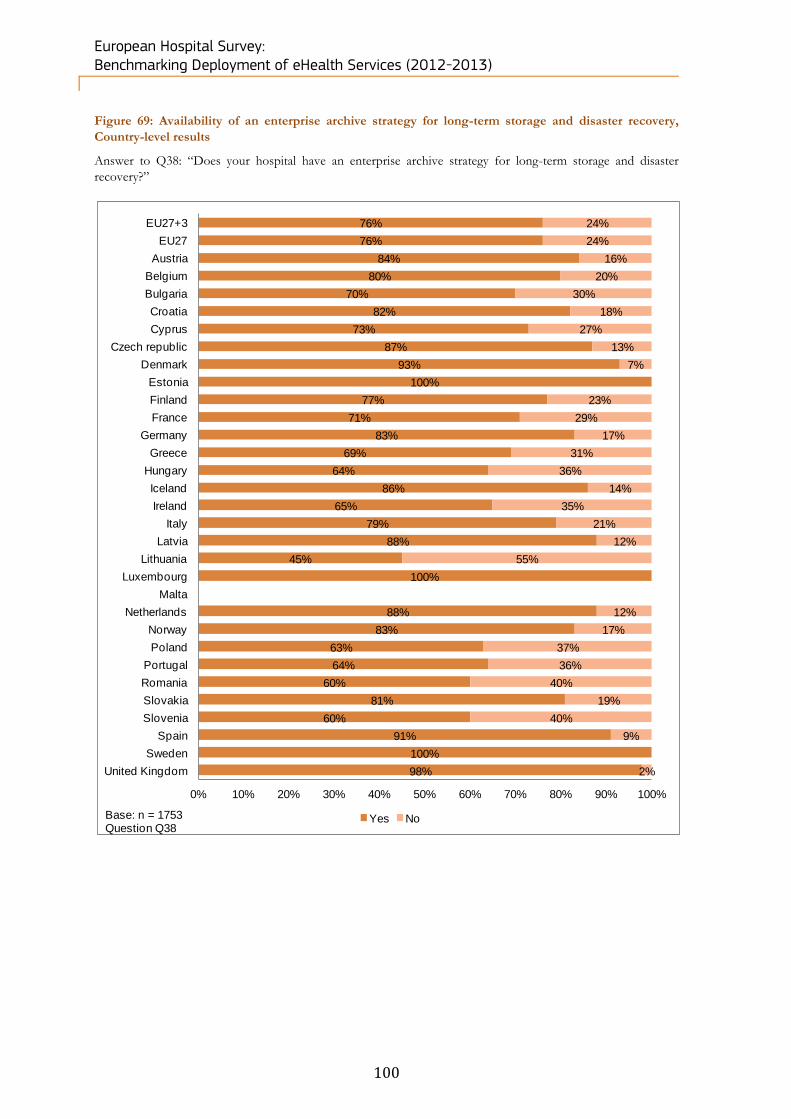
European Hospital Survey: Benchmarking Deployment of eHealth Services (2012-2013)
100
Figure 69: Availability of an enterprise archive strategy for long-term storage and disaster recovery,
Country-level results
Answer to Q38: “Does your hospital have an enterprise archive strategy for long-term storage and disaster
recovery?”
76%
76%
84%
80%
70%
82%
73%
87%
93%
100%
77%
71%
83%
69%
64%
86%
65%
79%
88%
45%
100%
88%
83%
63%
64%
60%
81%
60%
91%
100%
98%
24%
24%
16%
20%
30%
18%
27%
13%
7%
23%
29%
17%
31%
36%
14%
35%
21%
12%
55%
12%
17%
37%
36%
40%
19%
40%
9%
2%
0% 10% 20% 30% 40% 50% 60% 70% 80% 90% 100%
EU27+3
EU27
Austria
Belgium
Bulgaria
Croatia
Cyprus
Czech republic
Denmark
Estonia
Finland
France
Germany
Greece
Hungary
Iceland
Ireland
Italy
Latvia
Lithuania
Luxembourg
Malta
Netherlands
Norway
Poland
Portugal
Romania
Slovakia
Slovenia
Spain
Sweden
United Kingdom
Yes NoBase: n = 1753Question Q38

European Hospital Survey: Benchmarking Deployment of eHealth Services (2012-2013)
101
4.6.5 Timing for restoring information after loss of data
196 Another criterion to evaluate data security levels in hospitals is their ability to restore information quickly,
based on the time needed to recover the data. Only a minority of hospitals (14%) declared that they have
fully redundant data which allows them to restore information immediately. This result is partly balanced
by the fact that 42% of the surveyed hospitals declared that they could restore information in less than
24 hours. Taking these two figures together, 60% of hospitals have the ability to restore data in a short
period of time. The remaining 40% of hospitals would take more than one day to restore data, as
illustrated by Figure 70.
Figure 70: Restoring capacity of critical clinical information system operations, European level results
Answer to Q39: “Please estimate how quickly your organisation can restore critical clinical information system
operations”
197 Countries that are the best prepared to face data losses are Malta, Denmark and Luxembourg, since all
the hospitals from these countries can restore information either immediately or in less than 24 hours.
Other countries which perform well are Iceland, Norway, Austria and Netherlands, where more than 80%
of hospitals are able to restore information in the same period of time. Conversely, more than half of the
hospitals surveyed in Greece, Romania, Lithuania and Portugal would take more than one day to restore
critical medical information.
14%
42%17%
13%
4%
2%7%
Immediate (we have a fully redundant data centre)
Less than 24 hours
Less than 2 days
Less than 1 week
Less than 1 month
More than 1 month
Don't know
Base: n = 1753Question Q39

European Hospital Survey: Benchmarking Deployment of eHealth Services (2012-2013)
102
Figure 71: Restoring capacity of critical clinical information system operations, Country-level results
Answer to Q39: “Please estimate how quickly your organisation can restore critical clinical information system
operations”
15%
15%
38%
27%
8%
11%
20%
10%
31%
8%
8%
22%
20%
13%
15%
11%
20%
11%
7%
67%
100%
48%
33%
3%
3%
4%
6%
20%
12%
11%
45%
45%
42%
32%
49%
67%
40%
69%
69%
42%
60%
34%
46%
32%
52%
78%
40%
45%
79%
31%
33%
32%
50%
49%
33%
40%
64%
50%
53%
67%
65%
18%
19%
15%
20%
19%
11%
10%
18%
33%
16%
14%
23%
20%
20%
15%
20%
31%
12%
25%
19%
28%
18%
50%
15%
4%
16%
15%
15%
5%
16%
17%
11%
20%
3%
17%
12%
19%
8%
23%
10%
11%
20%
16%
16%
21%
8%
18%
28%
18%
9%
9%
17%
9%
4%
4%
5%
6%
10%
4%
8%
1%
8%
2%
5%
7%
3%
17%
5%
11%
6%
3%
1%
2%
2%
2%
3%
1%
3%
2%
5%
7%
1%
6%
5%
2%
0% 10% 20% 30% 40% 50% 60% 70% 80% 90% 100%
EU27+3
EU27
Austria
Belgium
Bulgaria
Croatia
Cyprus
Czech republic
Denmark
Estonia
Finland
France
Germany
Greece
Hungary
Iceland
Ireland
Italy
Latvia
Lithuania
Luxembourg
Malta
Netherlands
Norway
Poland
Portugal
Romania
Slovakia
Slovenia
Spain
Sweden
United Kingdom
Immediate (we have a fully redundant data centre)Less than 24 hoursLess than 2 daysLess than 1 weekLess than 1 monthMore than 1 month
Base: n= 1626Question Q39
European Hospital Survey: Benchmarking Deployment of eHealth Services (2012-2013)
103
4.7 Block F. IT functionalities
198 This block explores the answers to questions Q40 to Q45 of the questionnaire regarding IT functionalities
for entering, viewing, storing, managing and exchanging information on patients. Questions 40 and 41
deal with the availability and use of Electronic Medical Records (EMRs), Electronic Health Records (EHRs)
and Electronic Patient Records (EPRs) as well as their different functional modules.
Key findings of this survey block: Within EMR/EHR/EPR functionalities, laboratory test results and radiology information have the
highest implementation levels.
Hospitals with eHealth functionalities mostly use them routinely.
Regarding clinical decision support functionalities, the implementation level in the majority of the units is
similar to the non-implementation level.
Alerts to a critical laboratory value are the most available clinical decision support functionality.
Non-implementation of Health Information Exchange (HIE) is still very high, except for receiving
laboratory reports (62% implemented). However, these reports are only sent and shared in 42% of cases.
Nordic and Baltic countries are forerunners in HIE, with high implementation and usage.
Although the HIE functionality "Transfer of prescriptions to pharmacists" is only implemented in 26% of
the surveyed hospitals, it is widely used, with a total implementation score of 89%.
Telehealth is only implemented to a minor extent and is mostly available for holding consultations with
other healthcare practitioners (31%).
Telehealth with patients is not very common (implemented in less than 12% of the surveyed hospitals on
average).
However, when telehealth is implemented, it is mostly used (usage in around 90% of the surveyed
hospitals on average).
In the transition process from paper-based to electronic systems, 41% use a hybrid model.
Results by hospital ownership and size in this transition process do not differ much from one category to
another.
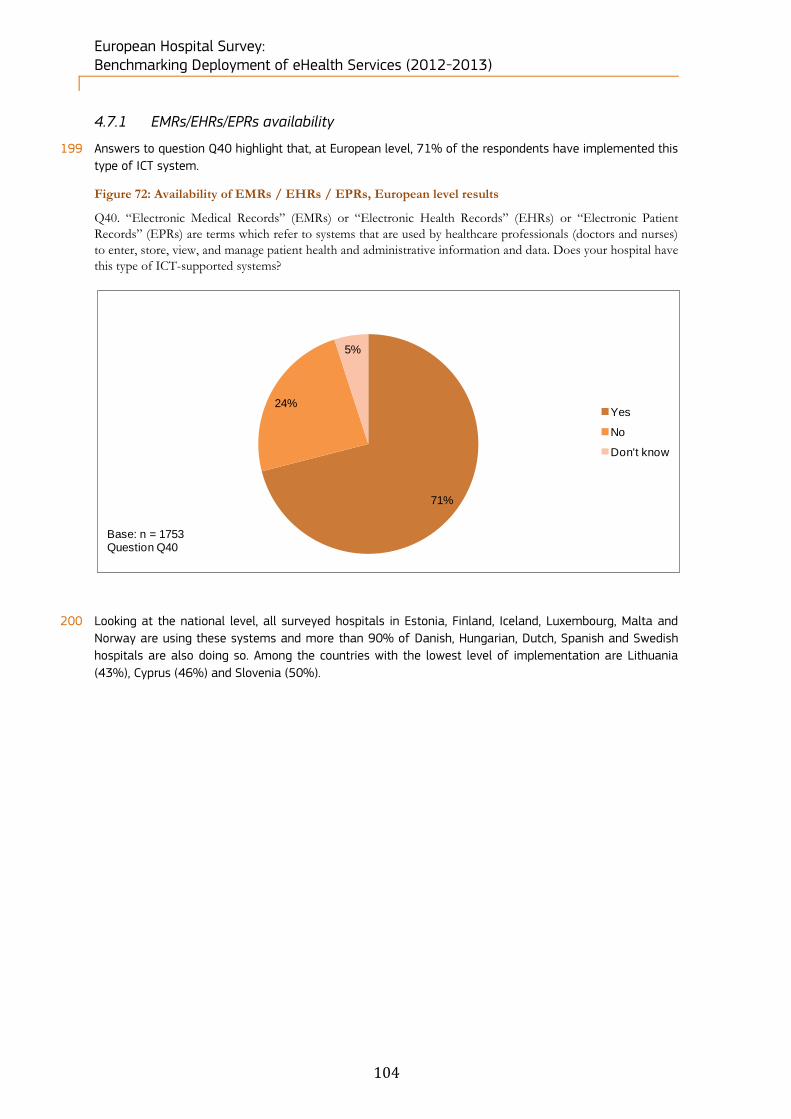
European Hospital Survey: Benchmarking Deployment of eHealth Services (2012-2013)
104
4.7.1 EMRs/EHRs/EPRs availability
199 Answers to question Q40 highlight that, at European level, 71% of the respondents have implemented this
type of ICT system.
Figure 72: Availability of EMRs / EHRs / EPRs, European level results
Q40. “Electronic Medical Records” (EMRs) or “Electronic Health Records” (EHRs) or “Electronic Patient
Records” (EPRs) are terms which refer to systems that are used by healthcare professionals (doctors and nurses)
to enter, store, view, and manage patient health and administrative information and data. Does your hospital have
this type of ICT-supported systems?
200 Looking at the national level, all surveyed hospitals in Estonia, Finland, Iceland, Luxembourg, Malta and
Norway are using these systems and more than 90% of Danish, Hungarian, Dutch, Spanish and Swedish
hospitals are also doing so. Among the countries with the lowest level of implementation are Lithuania
(43%), Cyprus (46%) and Slovenia (50%).
71%
24%
5%
Yes
No
Don't know
Base: n = 1753Question Q40
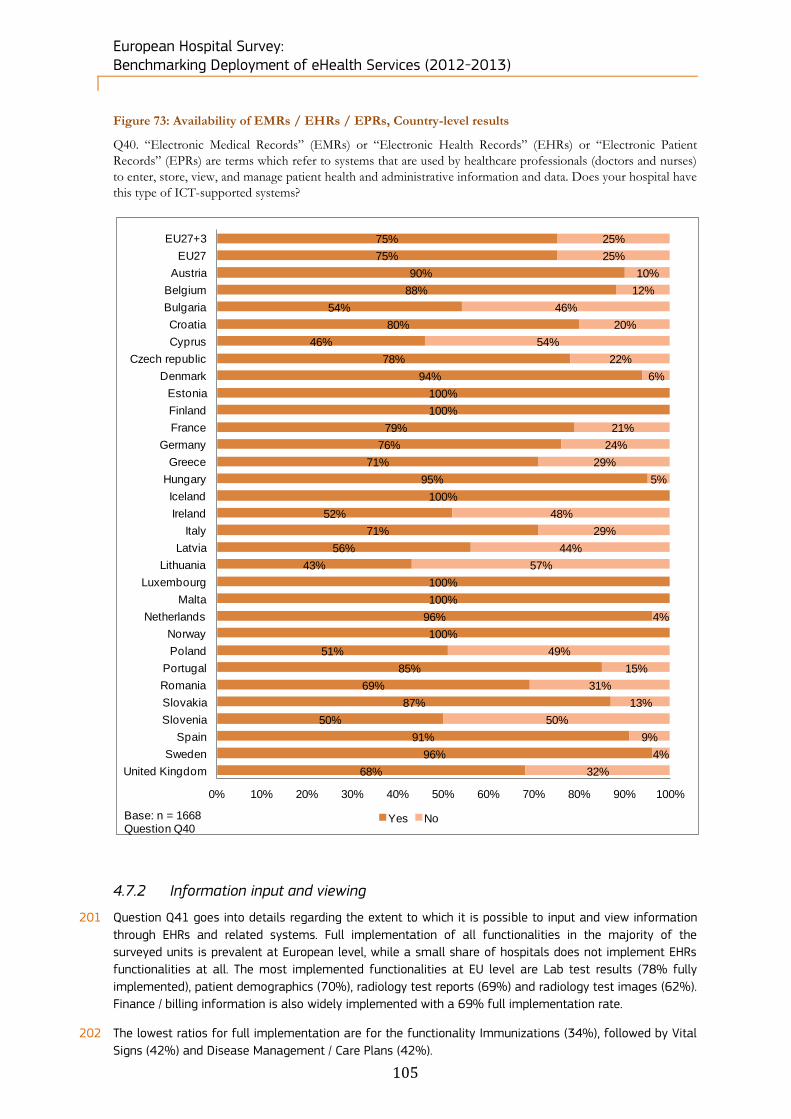
European Hospital Survey: Benchmarking Deployment of eHealth Services (2012-2013)
105
Figure 73: Availability of EMRs / EHRs / EPRs, Country-level results
Q40. “Electronic Medical Records” (EMRs) or “Electronic Health Records” (EHRs) or “Electronic Patient
Records” (EPRs) are terms which refer to systems that are used by healthcare professionals (doctors and nurses)
to enter, store, view, and manage patient health and administrative information and data. Does your hospital have
this type of ICT-supported systems?
4.7.2 Information input and viewing
201 Question Q41 goes into details regarding the extent to which it is possible to input and view information
through EHRs and related systems. Full implementation of all functionalities in the majority of the
surveyed units is prevalent at European level, while a small share of hospitals does not implement EHRs
functionalities at all. The most implemented functionalities at EU level are Lab test results (78% fully
implemented), patient demographics (70%), radiology test reports (69%) and radiology test images (62%).
Finance / billing information is also widely implemented with a 69% full implementation rate.
202 The lowest ratios for full implementation are for the functionality Immunizations (34%), followed by Vital
Signs (42%) and Disease Management / Care Plans (42%).
75%
75%
90%
88%
54%
80%
46%
78%
94%
100%
100%
79%
76%
71%
95%
100%
52%
71%
56%
43%
100%
100%
96%
100%
51%
85%
69%
87%
50%
91%
96%
68%
25%
25%
10%
12%
46%
20%
54%
22%
6%
21%
24%
29%
5%
48%
29%
44%
57%
4%
49%
15%
31%
13%
50%
9%
4%
32%
0% 10% 20% 30% 40% 50% 60% 70% 80% 90% 100%
EU27+3
EU27
Austria
Belgium
Bulgaria
Croatia
Cyprus
Czech republic
Denmark
Estonia
Finland
France
Germany
Greece
Hungary
Iceland
Ireland
Italy
Latvia
Lithuania
Luxembourg
Malta
Netherlands
Norway
Poland
Portugal
Romania
Slovakia
Slovenia
Spain
Sweden
United Kingdom
Yes NoBase: n = 1668Question Q40

European Hospital Survey: Benchmarking Deployment of eHealth Services (2012-2013)
106
Figure 74: Availability of EHRs or other ICT systems allowing health professionals to view and/or to
input information, European level results
Q41. Do your EHRs or any other ICT system allow health professionals to view and/or to input the following
types of information? Please indicate the extent to which they are implemented (fully implemented means it has
completely replaced paper record for the function) in your hospital and the extent to which health professionals
use them.
203 At country level, the countries having high full implementation rates across all functionalities are
Luxembourg, Estonia, Sweden, Malta and Finland.
52%
44%
78%
69%
62%
55%
51%
51%
52%
34%
42%
70%
55%
59%
56%
42%
69%
14%
15%
9%
8%
9%
12%
11%
12%
13%
8%
12%
7%
14%
17%
14%
13%
7%
12%
13%
4%
4%
5%
9%
8%
11%
11%
9%
14%
4%
11%
10%
10%
13%
7%
8%
11%
4%
9%
11%
12%
13%
13%
12%
28%
16%
9%
11%
6%
9%
16%
9%
11%
13%
4%
7%
10%
6%
6%
7%
6%
6%
8%
3%
5%
5%
6%
9%
3%
3%
5%
1%
2%
2%
5%
12%
7%
6%
16%
8%
7%
5%
3%
5%
8%
5%
0% 10% 20% 30% 40% 50% 60% 70% 80% 90% 100%
Medication list
Prescription list
Lab test results
Radiology test reports
Radiology test images
Problem list/diagnoses
Reason for encounter
Allergies
Encounter notes, clinical notes
Immunizations
Vital signs
Patient demographics
Symptoms
Medical history
Ordered tests
Disease management or care plans
Finance/billing information
Fully implemented across all units Fully implemented in at least 50% of units
Fully implemented in less than 50% of units Not in place
Considering implementing Don’t know
Base: n=1336 (said 1 or 3 at Q40)Question Q41A

European Hospital Survey: Benchmarking Deployment of eHealth Services (2012-2013)
107
204 A second question regarding the usage of EHRs was addressed to respondents having implemented EHRs
(in all units, in at least 50% of units or in less than 50% of units). At European level, 70% or more of the
surveyed hospitals with an EHR system in place use EHRs or other ICT systems routinely (except for
Immunizations at 67%). EHRs are routinely used by the surveyed hospitals for Lab test results (93%),
Radiology test reports (91%) and Radiology test images (89%). The scores for no usage when EHR
systems are in place are consistently low, ranging between 1% and 3%. The only notable exception is
Finance/billing information, for which 9% of European hospitals with EHR systems in place do not use such
system.
Figure 75: Usage of EHRs or other ICT systems allowing health professionals to view and/or to input
information, European level results
84%
80%
93%
91%
89%
74%
76%
70%
75%
67%
77%
81%
78%
82%
81%
72%
75%
10%
13%
4%
5%
8%
19%
19%
23%
20%
24%
16%
13%
17%
13%
14%
21%
14%
2%
2%
1%
1%
1%
3%
1%
3%
3%
3%
3%
3%
2%
1%
1%
3%
9%
4%
5%
2%
2%
2%
4%
4%
5%
3%
7%
4%
4%
4%
4%
3%
4%
3%
0% 10% 20% 30% 40% 50% 60% 70% 80% 90% 100%
Medication list
Prescription list
Lab test results
Radiology test reports
Radiology test images
Problem list/diagnoses
Reason for encounter
Allergies
Encounter notes, clinical notes
Immunizations
Vital signs
Patient demographics
Symptoms
Medical history
Ordered tests
Disease management or care plans
Finance/billing information
YES, routinely YES, occasionally No Don’t know
Base: n=639-1081 (said 1, 2 or 3 at Q41A)Question Q41U

European Hospital Survey: Benchmarking Deployment of eHealth Services (2012-2013)
108
4.7.3 Clinical decision support functionalities and usage
205 As shown in Figure 76, the implementation of clinical decision support functionalities does not show a
clear trend regarding the hospitals which have either implemented or not implemented these
functionalities. Regarding clinical decision support, the availability in the majority of the units is similar to
the distribution of the “not in place” category. In fact, Drug-drug interaction (27%), Drug-allergy alerts
(28%) and Alerts to a critical laboratory value (46%) are the most broadly implemented functionalities
across all units. While the latter functionality is the most available across Europe with the highest share of
full implementation in the majority of the units (53%), the second functionality is characterized by the
highest percentage of “Not in place” answers (28%). Despite non-implementation being relatively high
(ranging from 20% to 38%), around half of the non-implementer population is considering
implementation: 13%-14% for all the answer categories but one (8% in Alerts to critical laboratory value).
Figure 76: Availability of clinical decision support functionalities, European level results
Q42: Do your EHRs or any other ICT system have any of the clinical decision support functionalities listed below?
18%
27%
28%
15%
23%
46%
10%
9%
8%
7%
9%
7%
14%
10%
10%
8%
11%
6%
34%
28%
28%
38%
31%
20%
13%
14%
14%
14%
13%
8%
10%
11%
11%
17%
13%
13%
0% 10% 20% 30% 40% 50% 60% 70% 80% 90% 100%
Clinical guidelines and best practices
Drug-drug interactions
Drug-allergy alerts
Drug-lab interactions
Contraindications
Alerts to a critical laboratory value
Fully implemented across all units Fully implemented in at least 50% of units
Fully implemented in less than 50% of units Not in place
Considering implementing Don’t know
Base: n=1336 (said 1 or 3 at Q40)Question Q42A
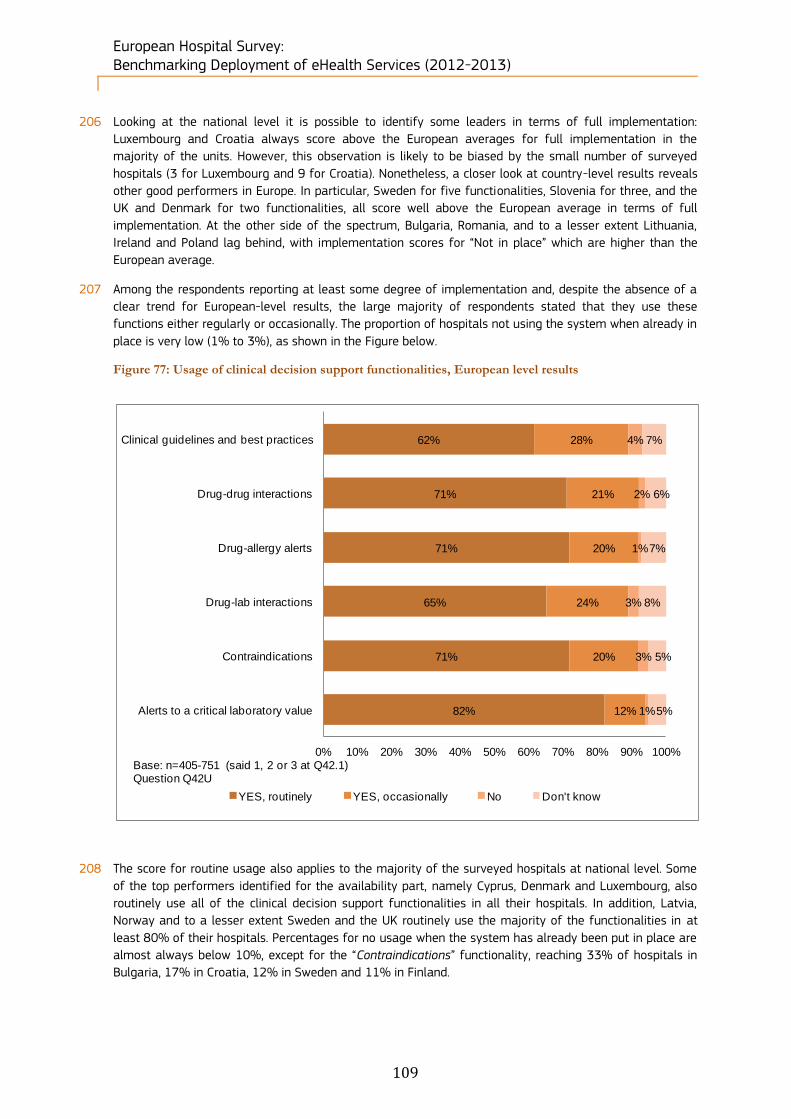
European Hospital Survey: Benchmarking Deployment of eHealth Services (2012-2013)
109
206 Looking at the national level it is possible to identify some leaders in terms of full implementation:
Luxembourg and Croatia always score above the European averages for full implementation in the
majority of the units. However, this observation is likely to be biased by the small number of surveyed
hospitals (3 for Luxembourg and 9 for Croatia). Nonetheless, a closer look at country-level results reveals
other good performers in Europe. In particular, Sweden for five functionalities, Slovenia for three, and the
UK and Denmark for two functionalities, all score well above the European average in terms of full
implementation. At the other side of the spectrum, Bulgaria, Romania, and to a lesser extent Lithuania,
Ireland and Poland lag behind, with implementation scores for “Not in place” which are higher than the
European average.
207 Among the respondents reporting at least some degree of implementation and, despite the absence of a
clear trend for European-level results, the large majority of respondents stated that they use these
functions either regularly or occasionally. The proportion of hospitals not using the system when already in
place is very low (1% to 3%), as shown in the Figure below.
Figure 77: Usage of clinical decision support functionalities, European level results
208 The score for routine usage also applies to the majority of the surveyed hospitals at national level. Some
of the top performers identified for the availability part, namely Cyprus, Denmark and Luxembourg, also
routinely use all of the clinical decision support functionalities in all their hospitals. In addition, Latvia,
Norway and to a lesser extent Sweden and the UK routinely use the majority of the functionalities in at
least 80% of their hospitals. Percentages for no usage when the system has already been put in place are
almost always below 10%, except for the “Contraindications” functionality, reaching 33% of hospitals in
Bulgaria, 17% in Croatia, 12% in Sweden and 11% in Finland.
62%
71%
71%
65%
71%
82%
28%
21%
20%
24%
20%
12%
4%
2%
1%
3%
3%
1%
7%
6%
7%
8%
5%
5%
0% 10% 20% 30% 40% 50% 60% 70% 80% 90% 100%
Clinical guidelines and best practices
Drug-drug interactions
Drug-allergy alerts
Drug-lab interactions
Contraindications
Alerts to a critical laboratory value
YES, routinely YES, occasionally No Don't know
Base: n=405-751 (said 1, 2 or 3 at Q42.1)Question Q42U

European Hospital Survey: Benchmarking Deployment of eHealth Services (2012-2013)
110
4.7.4 Health Information Exchange availability and usage
209 Q43 deals with electronic exchange of health information enabling the transferring, sharing and accessing
of this type of data by health professionals. At European level, the majority of hospitals have not
implemented 7 out of 12 Health Information Exchange (HIE) functionalities. The distribution of full
implementation follows a similar pattern across different HIE functionalities and mostly remains within a
20% average range. The percentage of European hospitals not exchanging medical patient data with
providers in other countries is remarkably high (81%), as is the percentage of hospitals not having e-mail
interactions with patients (65%) and the percentage of hospitals not certifying disabilities (63%). The only
striking result regarding full implementation of HIE functionalities concerns the category Receive
laboratory reports (45%). However, only 25% of the respondents have fully implemented the sending and
sharing of such reports. The distribution of those considering implementing HIE features mostly ranges
between 12% and 13%.
Figure 78: Availability of Health Information Exchange (HIE) systems, European level results
Q43. Health Information Exchange (HIE) is electronically transferring / sharing / enabling access to patient
health information and data. Do your EHRs or any other ICT systems in place in your hospital allow health
professionals to engage into any of the following forms of HIE? Please indicate the extent to which these are
implemented (fully implemented means it has completely replaced paper record for the function) in your hospital
and the extent to which health professionals use them.
6%
10%
21%
17%
17%
45%
25%
11%
25%
3%
21%
11%
3%
5%
6%
4%
8%
8%
8%
5%
9%
1%
4%
3%
9%
9%
9%
5%
13%
9%
9%
6%
11%
2%
4%
3%
65%
58%
45%
53%
42%
22%
41%
58%
37%
81%
56%
63%
14%
12%
13%
15%
15%
12%
13%
13%
13%
8%
7%
7%
3%
6%
5%
5%
4%
4%
5%
6%
5%
5%
9%
14%
0% 10% 20% 30% 40% 50% 60% 70% 80% 90% 100%
Interact with patients by e-mail
Make appointments at other care provider
Send/receive referral and discharge letters
Transfer prescriptions to pharmacists
Exchange medical patient data
Receive laboratory reports
Receive/send laboratory reports and share them
Exchange patient medication lists
Exchange radiologiy reports
Exchange medical patient data with provider in other countries
Certify sick leaves
Certify disabilities
Fully implemented across all units Fully implemented in at least 50% of units
Fully implemented in less than 50% of units Not in place
Considering implementing Don't know
Base: n=1753Question Q43A
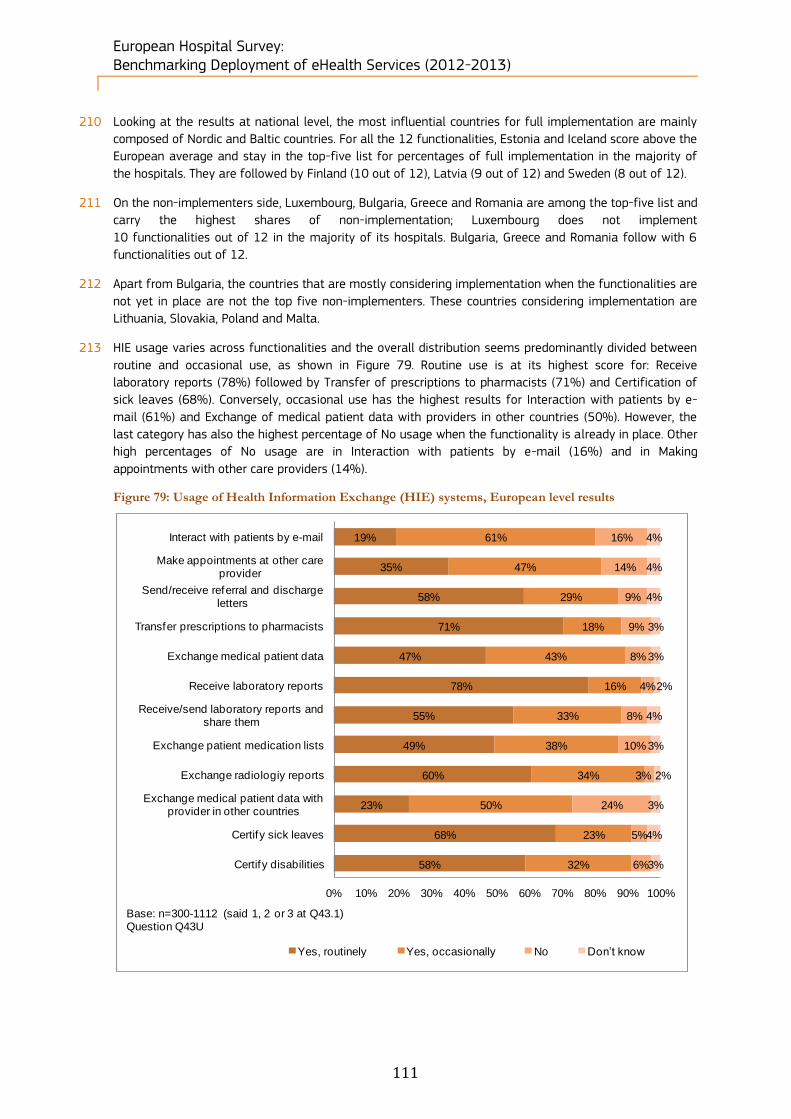
European Hospital Survey: Benchmarking Deployment of eHealth Services (2012-2013)
111
210 Looking at the results at national level, the most influential countries for full implementation are mainly
composed of Nordic and Baltic countries. For all the 12 functionalities, Estonia and Iceland score above the
European average and stay in the top-five list for percentages of full implementation in the majority of
the hospitals. They are followed by Finland (10 out of 12), Latvia (9 out of 12) and Sweden (8 out of 12).
211 On the non-implementers side, Luxembourg, Bulgaria, Greece and Romania are among the top-five list and
carry the highest shares of non-implementation; Luxembourg does not implement
10 functionalities out of 12 in the majority of its hospitals. Bulgaria, Greece and Romania follow with 6
functionalities out of 12.
212 Apart from Bulgaria, the countries that are mostly considering implementation when the functionalities are
not yet in place are not the top five non-implementers. These countries considering implementation are
Lithuania, Slovakia, Poland and Malta.
213 HIE usage varies across functionalities and the overall distribution seems predominantly divided between
routine and occasional use, as shown in Figure 79. Routine use is at its highest score for: Receive
laboratory reports (78%) followed by Transfer of prescriptions to pharmacists (71%) and Certification of
sick leaves (68%). Conversely, occasional use has the highest results for Interaction with patients by e-
mail (61%) and Exchange of medical patient data with providers in other countries (50%). However, the
last category has also the highest percentage of No usage when the functionality is already in place. Other
high percentages of No usage are in Interaction with patients by e-mail (16%) and in Making
appointments with other care providers (14%).
Figure 79: Usage of Health Information Exchange (HIE) systems, European level results
19%
35%
58%
71%
47%
78%
55%
49%
60%
23%
68%
58%
61%
47%
29%
18%
43%
16%
33%
38%
34%
50%
23%
32%
16%
14%
9%
9%
8%
4%
8%
10%
3%
24%
5%
6%
4%
4%
4%
3%
3%
2%
4%
3%
2%
3%
4%
3%
0% 10% 20% 30% 40% 50% 60% 70% 80% 90% 100%
Interact with patients by e-mail
Make appointments at other care provider
Send/receive referral and discharge letters
Transfer prescriptions to pharmacists
Exchange medical patient data
Receive laboratory reports
Receive/send laboratory reports and share them
Exchange patient medication lists
Exchange radiologiy reports
Exchange medical patient data with provider in other countries
Certify sick leaves
Certify disabilities
Yes, routinely Yes, occasionally No Don’t know
Base: n=300-1112 (said 1, 2 or 3 at Q43.1)Question Q43U
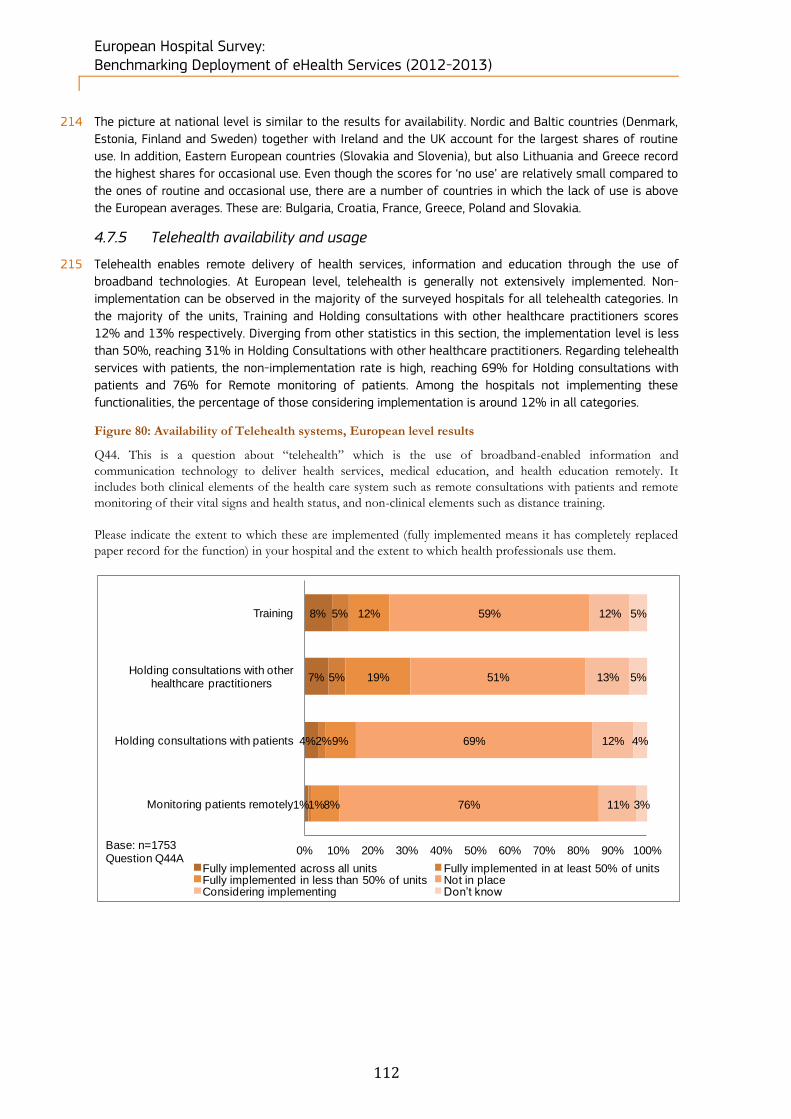
European Hospital Survey: Benchmarking Deployment of eHealth Services (2012-2013)
112
214 The picture at national level is similar to the results for availability. Nordic and Baltic countries (Denmark,
Estonia, Finland and Sweden) together with Ireland and the UK account for the largest shares of routine
use. In addition, Eastern European countries (Slovakia and Slovenia), but also Lithuania and Greece record
the highest shares for occasional use. Even though the scores for ‘no use’ are relatively small compared to
the ones of routine and occasional use, there are a number of countries in which the lack of use is above
the European averages. These are: Bulgaria, Croatia, France, Greece, Poland and Slovakia.
4.7.5 Telehealth availability and usage
215 Telehealth enables remote delivery of health services, information and education through the use of
broadband technologies. At European level, telehealth is generally not extensively implemented. Non-
implementation can be observed in the majority of the surveyed hospitals for all telehealth categories. In
the majority of the units, Training and Holding consultations with other healthcare practitioners scores
12% and 13% respectively. Diverging from other statistics in this section, the implementation level is less
than 50%, reaching 31% in Holding Consultations with other healthcare practitioners. Regarding telehealth
services with patients, the non-implementation rate is high, reaching 69% for Holding consultations with
patients and 76% for Remote monitoring of patients. Among the hospitals not implementing these
functionalities, the percentage of those considering implementation is around 12% in all categories.
Figure 80: Availability of Telehealth systems, European level results
Q44. This is a question about “telehealth” which is the use of broadband-enabled information and
communication technology to deliver health services, medical education, and health education remotely. It
includes both clinical elements of the health care system such as remote consultations with patients and remote
monitoring of their vital signs and health status, and non-clinical elements such as distance training.
Please indicate the extent to which these are implemented (fully implemented means it has completely replaced
paper record for the function) in your hospital and the extent to which health professionals use them.
8%
7%
4%
1%
5%
5%
2%
1%
12%
19%
9%
8%
59%
51%
69%
76%
12%
13%
12%
11%
5%
5%
4%
3%
0% 10% 20% 30% 40% 50% 60% 70% 80% 90% 100%
Training
Holding consultations with other healthcare practitioners
Holding consultations with patients
Monitoring patients remotely
Fully implemented across all units Fully implemented in at least 50% of unitsFully implemented in less than 50% of units Not in placeConsidering implementing Don’t know
Base: n=1753Question Q44A
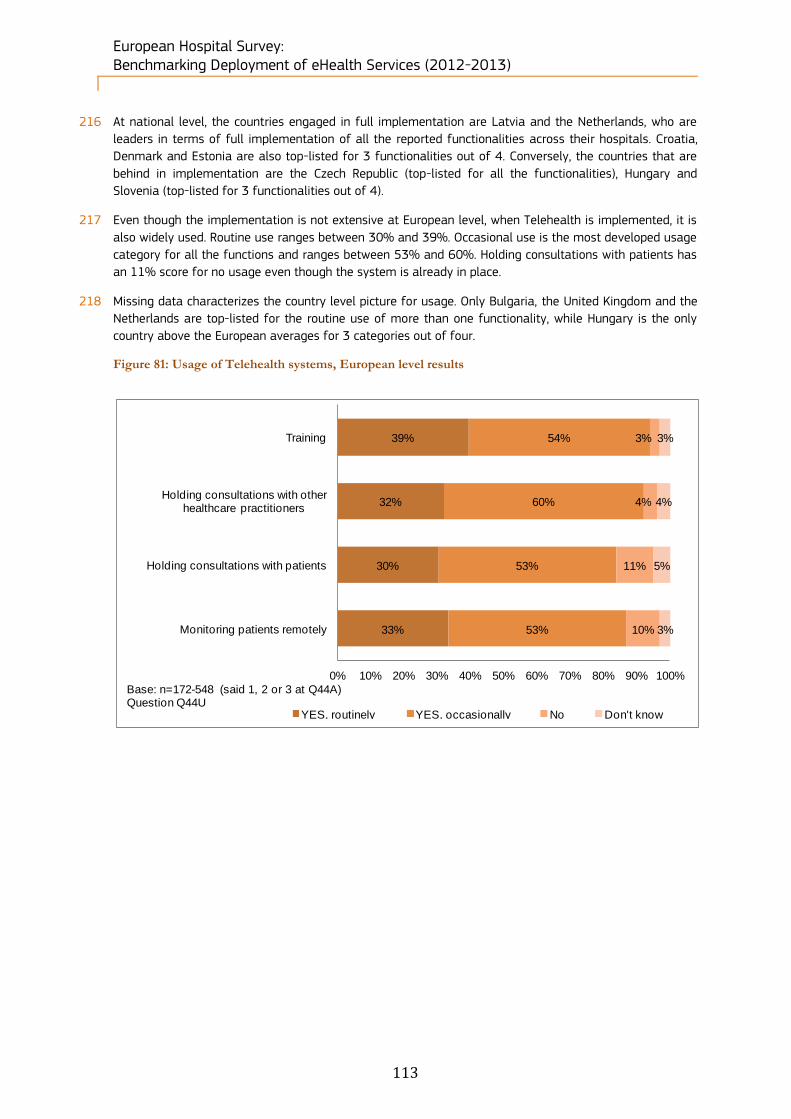
European Hospital Survey: Benchmarking Deployment of eHealth Services (2012-2013)
113
216 At national level, the countries engaged in full implementation are Latvia and the Netherlands, who are
leaders in terms of full implementation of all the reported functionalities across their hospitals. Croatia,
Denmark and Estonia are also top-listed for 3 functionalities out of 4. Conversely, the countries that are
behind in implementation are the Czech Republic (top-listed for all the functionalities), Hungary and
Slovenia (top-listed for 3 functionalities out of 4).
217 Even though the implementation is not extensive at European level, when Telehealth is implemented, it is
also widely used. Routine use ranges between 30% and 39%. Occasional use is the most developed usage
category for all the functions and ranges between 53% and 60%. Holding consultations with patients has
an 11% score for no usage even though the system is already in place.
218 Missing data characterizes the country level picture for usage. Only Bulgaria, the United Kingdom and the
Netherlands are top-listed for the routine use of more than one functionality, while Hungary is the only
country above the European averages for 3 categories out of four.
Figure 81: Usage of Telehealth systems, European level results
39%
32%
30%
33%
54%
60%
53%
53%
3%
4%
11%
10%
3%
4%
5%
3%
0% 10% 20% 30% 40% 50% 60% 70% 80% 90% 100%
Training
Holding consultations with other healthcare practitioners
Holding consultations with patients
Monitoring patients remotely
YES, routinely YES, occasionally No Don't know
Base: n=172-548 (said 1, 2 or 3 at Q44A)Question Q44U
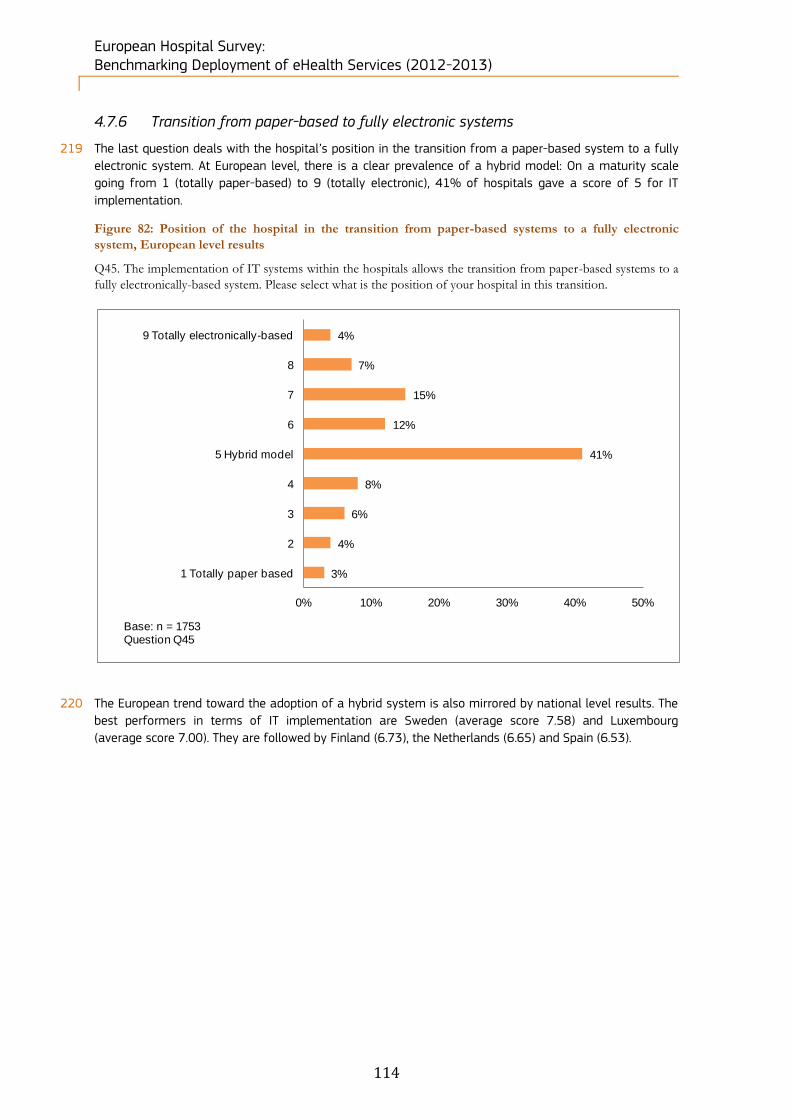
European Hospital Survey: Benchmarking Deployment of eHealth Services (2012-2013)
114
4.7.6 Transition from paper-based to fully electronic systems
219 The last question deals with the hospital’s position in the transition from a paper-based system to a fully
electronic system. At European level, there is a clear prevalence of a hybrid model: On a maturity scale
going from 1 (totally paper-based) to 9 (totally electronic), 41% of hospitals gave a score of 5 for IT
implementation.
Figure 82: Position of the hospital in the transition from paper-based systems to a fully electronic
system, European level results
Q45. The implementation of IT systems within the hospitals allows the transition from paper-based systems to a
fully electronically-based system. Please select what is the position of your hospital in this transition.
220 The European trend toward the adoption of a hybrid system is also mirrored by national level results. The
best performers in terms of IT implementation are Sweden (average score 7.58) and Luxembourg
(average score 7.00). They are followed by Finland (6.73), the Netherlands (6.65) and Spain (6.53).
3%
4%
6%
8%
41%
12%
15%
7%
4%
0% 10% 20% 30% 40% 50%
1 Totally paper based
2
3
4
5 Hybrid model
6
7
8
9 Totally electronically-based
Base: n = 1753Question Q45

European Hospital Survey: Benchmarking Deployment of eHealth Services (2012-2013)
115
Figure 83: Position of the hospital in the transition from paper-based systems to a fully electronic
system, Country-level results
Q45. The implementation of IT systems within the hospitals allows the transition from paper-based systems to a
fully electronically-based system. Please select what is the position of your hospital in this transition.
221 Comparisons between hospitals according to their ownership does not show any real difference as regards
the implementation of IT systems, since results are very similar for both public and private hospitals.
Private not for profit hospitals perform similarly, but are slightly more advanced in the transition to fully
electronic systems, as they scored an average 5.69 on a 1 to 10 scale, while Private and Public hospitals
scored 5.31 and 5.34 respectively.
From paper- to
electronically-
based
1 Totally
paper
based
2 3 45 Hybrid
model6 7 8
9 Totally
electronic
ally-based
EU27+3 3% 4% 6% 8% 41% 12% 15% 7% 4%
EU27 3% 4% 6% 8% 40% 13% 15% 7% 4%
Austria 5% 7% 26% 14% 26% 14% 9%
Belgium 6% 36% 22% 24% 8% 4%
Bulgaria 6% 10% 11% 40% 10% 15% 5% 3%
Croatia 9% 64% 27%
Cyprus 15% 15% 8% 23% 23% 15%
Czech republic 2% 2% 8% 12% 40% 8% 15% 8% 5%
Denmark 44% 19% 12% 12% 12%
Estonia 17% 25% 58%
Finland 4% 4% 19% 8% 19% 42% 4%
France 2% 2% 7% 9% 41% 16% 16% 6% 1%
Germany 3% 4% 7% 8% 48% 15% 10% 3% 1%
Greece 3% 0% 10% 10% 28% 15% 22% 6% 4%
Hungary 2% 5% 12% 37% 7% 12% 19% 7%
Iceland 11% 22% 44% 22%
Ireland 4% 17% 26% 17% 22% 4% 9%
Italy 3% 3% 7% 7% 48% 13% 14% 3% 3%
Latvia 5% 11% 5% 11% 53% 11% 5%
Lithuania 12% 6% 12% 59% 3% 3% 3%
Luxembourg 33% 33% 33%
Malta 100%
Netherlands 31% 15% 23% 19% 12%
Norway 50% 17% 17% 17%
Poland 17% 6% 5% 10% 45% 8% 5% 1% 2%
Portugal 2% 34% 24% 27% 10% 2%
Romania 2% 1% 1% 8% 60% 9% 11% 1% 6%
Slovakia 6% 58% 12% 15% 6% 3%
Slovenia 17% 17% 67%
Spain 1% 4% 3% 23% 13% 27% 17% 12%
Sweden 12% 38% 19% 31%
United Kingdom 33% 6% 14% 35% 6% 4% 1%
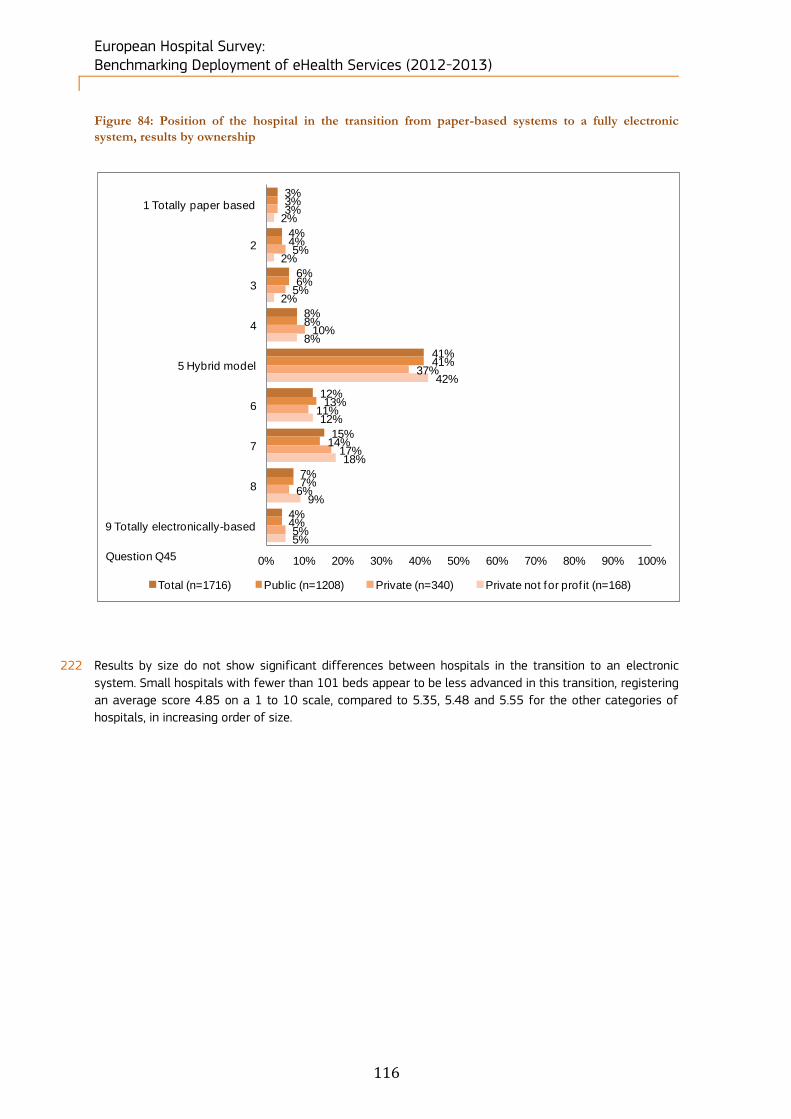
European Hospital Survey: Benchmarking Deployment of eHealth Services (2012-2013)
116
Figure 84: Position of the hospital in the transition from paper-based systems to a fully electronic
system, results by ownership
222 Results by size do not show significant differences between hospitals in the transition to an electronic
system. Small hospitals with fewer than 101 beds appear to be less advanced in this transition, registering
an average score 4.85 on a 1 to 10 scale, compared to 5.35, 5.48 and 5.55 for the other categories of
hospitals, in increasing order of size.
3%
4%
6%
8%
41%
12%
15%
7%
4%
3%
4%
6%
8%
41%
13%
14%
7%
4%
3%
5%
5%
10%
37%
11%
17%
6%
5%
2%
2%
2%
8%
42%
12%
18%
9%
5%
0% 10% 20% 30% 40% 50% 60% 70% 80% 90% 100%
1 Totally paper based
2
3
4
5 Hybrid model
6
7
8
9 Totally electronically-based
Total (n=1716) Public (n=1208) Private (n=340) Private not for prof it (n=168)
Question Q45
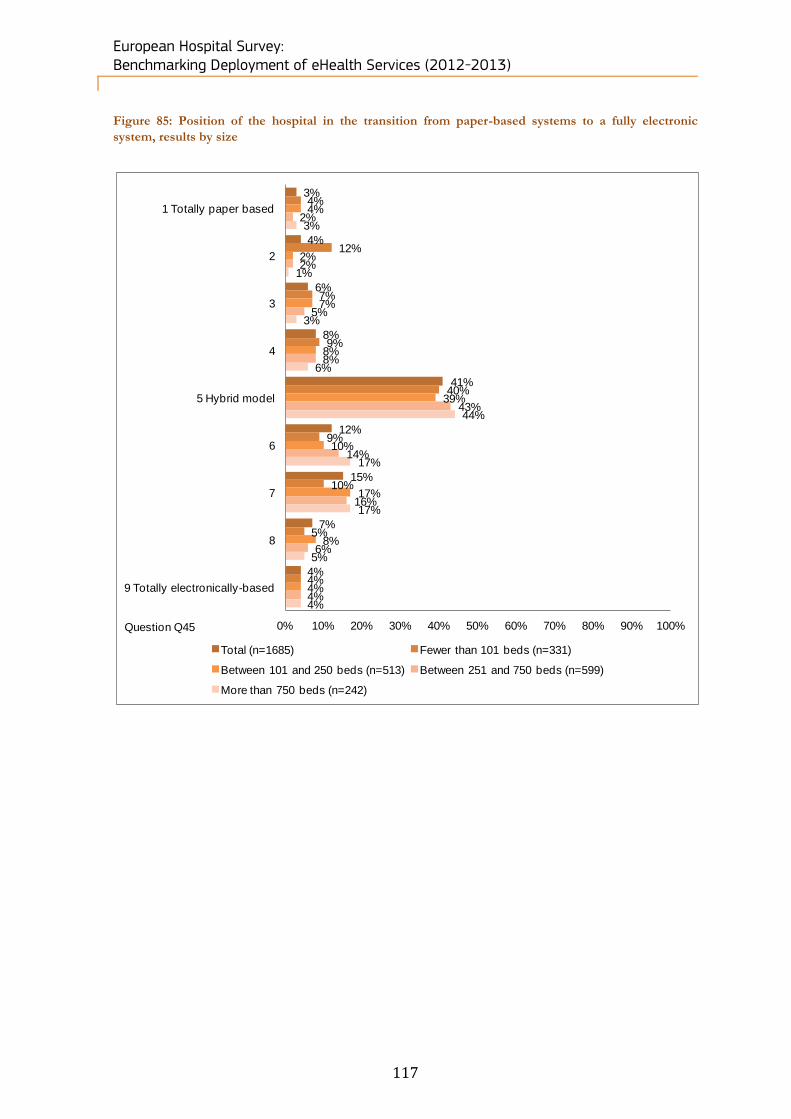
European Hospital Survey: Benchmarking Deployment of eHealth Services (2012-2013)
117
Figure 85: Position of the hospital in the transition from paper-based systems to a fully electronic
system, results by size
3%
4%
6%
8%
41%
12%
15%
7%
4%
4%
12%
7%
9%
40%
9%
10%
5%
4%
4%
2%
7%
8%
39%
10%
17%
8%
4%
2%
2%
5%
8%
43%
14%
16%
6%
4%
3%
1%
3%
6%
44%
17%
17%
5%
4%
0% 10% 20% 30% 40% 50% 60% 70% 80% 90% 100%
1 Totally paper based
2
3
4
5 Hybrid model
6
7
8
9 Totally electronically-based
Total (n=1685) Fewer than 101 beds (n=331)
Between 101 and 250 beds (n=513) Between 251 and 750 beds (n=599)
More than 750 beds (n=242)
Question Q45

European Hospital Survey: Benchmarking Deployment of eHealth Services (2012-2013)
118
5 Results at national and regional level
5.1 Method of analysis
5.1.1 Creation of the eHealth indicators
223 Based on the eHealth Benchmarking III study, country profiles have been built using 13 eHealth indicators.
These eHealth indicators consist in specific answers to the questionnaire and identify the eHealth best
practices in Europe. For consistency reasons, the eHealth indicators are identical to the ones that were
used in the previous survey. They cover the following areas:
Infrastructure: three eHealth indicators are used to identify pre-requisites towards “ubiquitous
eHealth systems”. These systems enable remote patient monitoring and health information exchange beyond hospital boundaries. The three indicators used are:
Externally connected: access to the infrastructure outside the hospital-specific site is important. Extranet systems, value-added networks and proprietary infrastructures enable inter-connectivity between healthcare stakeholders and hence ensure a high level of health care;
Broadband > 50Mbps: a high-speed broadband was one of the most important policy priorities within the European Commission’s Digital Agenda for Europe. It also enables the processing and transfer of an increasing amount of data, such as images, reports, telemonitoring services;
Single and unified wireless: such infrastructure allows mobile access to different applications and services in every location of the hospital.
Applications: a selection of five medical applications was made. These include:
Single EPR shared by all departments: a unique file where patient clinical information is stored, managed, viewed, completed and shared everywhere in the hospital constitutes an important tool for the improvement of quality of care and patient safety;
PACS usage: by enabling digital transmission and management of images, PACS facilitates quick and access to images and reports, reduces the number of duplicate images, and easy acquisition of a chronological view of the patient’s radiology history;
ePrescribing: the implementation of such system is crucial to avoid prescription duplicates and errors;
Integrated system for eReferral: such system avoids faxes or letter losses and overlooked communications between two medical directors;
Tele-monitoring: with the use of ICT for patients outside the hospital premises, healthcare professionals can more effectively manage patient health and prevent exacerbations and complications which may lead to re-hospitalisations. These services are particularly useful for patients living with chronic illnesses or elderly patients.
Integration: this area reflects the ability of the hospital to communicate with healthcare stakeholders
that are outside the hospital. Hence, it directly impacts the health professional’s work. As such, interoperability of eHealth applications is a key, especially in Europe where the notion of cross-border healthcare has become increasingly important. As a result, three eHealth indicators have been chosen:
Exchange of clinical care information with external providers;
Exchange of laboratory results with external providers;
Exchange of radiology reports with external providers.
Security: ensuring security and privacy of data is required to build trust between the medical staff,
the patient, and the other stakeholders who may need patient clinical information. If risks are perceived or information is not accurate or partially complete, patients or physicians may not be willing to disclose necessary health information, which could be life-threatening. Two indicators have been selected to reflect the level of security in acute care hospitals:
Clear and structured rules on access to clinical data: to ensure privacy of data, access to certain types of data must be restricted to some specific healthcare professionals;
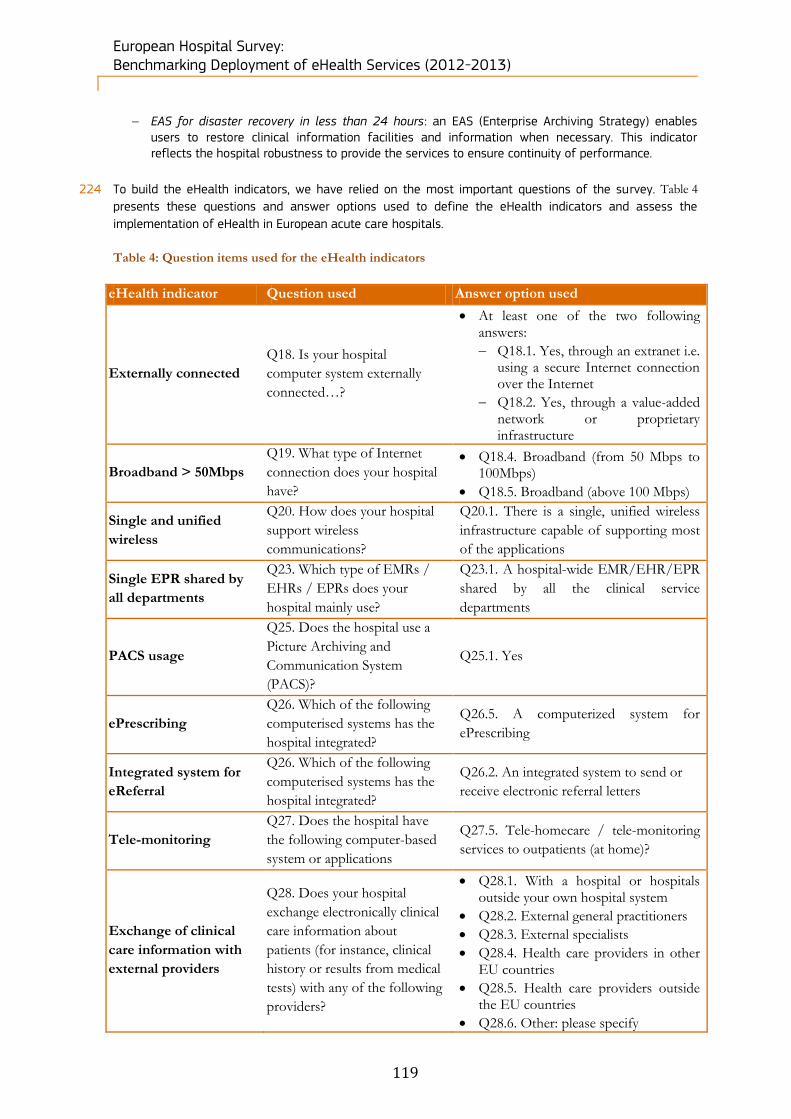
European Hospital Survey: Benchmarking Deployment of eHealth Services (2012-2013)
119
EAS for disaster recovery in less than 24 hours: an EAS (Enterprise Archiving Strategy) enables users to restore clinical information facilities and information when necessary. This indicator reflects the hospital robustness to provide the services to ensure continuity of performance.
224 To build the eHealth indicators, we have relied on the most important questions of the survey. Table 4
presents these questions and answer options used to define the eHealth indicators and assess the
implementation of eHealth in European acute care hospitals.
Table 4: Question items used for the eHealth indicators
eHealth indicator Question used Answer option used
Externally connected
Q18. Is your hospital
computer system externally
connected…?
At least one of the two following answers:
Q18.1. Yes, through an extranet i.e. using a secure Internet connection over the Internet
Q18.2. Yes, through a value-added network or proprietary infrastructure
Broadband > 50Mbps
Q19. What type of Internet
connection does your hospital
have?
Q18.4. Broadband (from 50 Mbps to 100Mbps)
Q18.5. Broadband (above 100 Mbps)
Single and unified
wireless
Q20. How does your hospital
support wireless
communications?
Q20.1. There is a single, unified wireless
infrastructure capable of supporting most
of the applications
Single EPR shared by
all departments
Q23. Which type of EMRs /
EHRs / EPRs does your
hospital mainly use?
Q23.1. A hospital-wide EMR/EHR/EPR
shared by all the clinical service
departments
PACS usage
Q25. Does the hospital use a
Picture Archiving and
Communication System
(PACS)?
Q25.1. Yes
ePrescribing
Q26. Which of the following
computerised systems has the
hospital integrated?
Q26.5. A computerized system for
ePrescribing
Integrated system for
eReferral
Q26. Which of the following
computerised systems has the
hospital integrated?
Q26.2. An integrated system to send or
receive electronic referral letters
Tele-monitoring
Q27. Does the hospital have
the following computer-based
system or applications
Q27.5. Tele-homecare / tele-monitoring
services to outpatients (at home)?
Exchange of clinical
care information with
external providers
Q28. Does your hospital
exchange electronically clinical
care information about
patients (for instance, clinical
history or results from medical
tests) with any of the following
providers?
Q28.1. With a hospital or hospitals outside your own hospital system
Q28.2. External general practitioners
Q28.3. External specialists
Q28.4. Health care providers in other EU countries
Q28.5. Health care providers outside the EU countries
Q28.6. Other: please specify
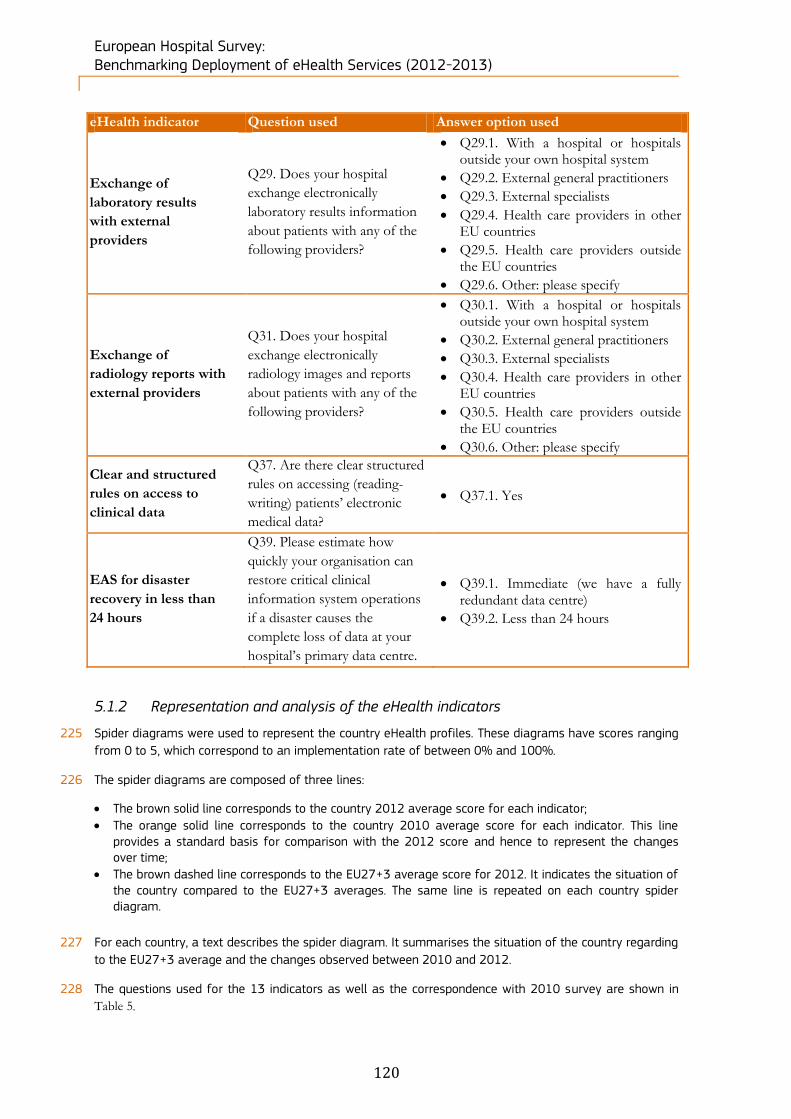
European Hospital Survey: Benchmarking Deployment of eHealth Services (2012-2013)
120
eHealth indicator Question used Answer option used
Exchange of
laboratory results
with external
providers
Q29. Does your hospital
exchange electronically
laboratory results information
about patients with any of the
following providers?
Q29.1. With a hospital or hospitals outside your own hospital system
Q29.2. External general practitioners
Q29.3. External specialists
Q29.4. Health care providers in other EU countries
Q29.5. Health care providers outside the EU countries
Q29.6. Other: please specify
Exchange of
radiology reports with
external providers
Q31. Does your hospital
exchange electronically
radiology images and reports
about patients with any of the
following providers?
Q30.1. With a hospital or hospitals outside your own hospital system
Q30.2. External general practitioners
Q30.3. External specialists
Q30.4. Health care providers in other EU countries
Q30.5. Health care providers outside the EU countries
Q30.6. Other: please specify
Clear and structured
rules on access to
clinical data
Q37. Are there clear structured
rules on accessing (reading-
writing) patients’ electronic
medical data?
Q37.1. Yes
EAS for disaster
recovery in less than
24 hours
Q39. Please estimate how
quickly your organisation can
restore critical clinical
information system operations
if a disaster causes the
complete loss of data at your
hospital’s primary data centre.
Q39.1. Immediate (we have a fully redundant data centre)
Q39.2. Less than 24 hours
5.1.2 Representation and analysis of the eHealth indicators
225 Spider diagrams were used to represent the country eHealth profiles. These diagrams have scores ranging
from 0 to 5, which correspond to an implementation rate of between 0% and 100%.
226 The spider diagrams are composed of three lines:
The brown solid line corresponds to the country 2012 average score for each indicator;
The orange solid line corresponds to the country 2010 average score for each indicator. This line provides a standard basis for comparison with the 2012 score and hence to represent the changes over time;
The brown dashed line corresponds to the EU27+3 average score for 2012. It indicates the situation of the country compared to the EU27+3 averages. The same line is repeated on each country spider diagram.
227 For each country, a text describes the spider diagram. It summarises the situation of the country regarding
to the EU27+3 average and the changes observed between 2010 and 2012.
228 The questions used for the 13 indicators as well as the correspondence with 2010 survey are shown in
Table 5.
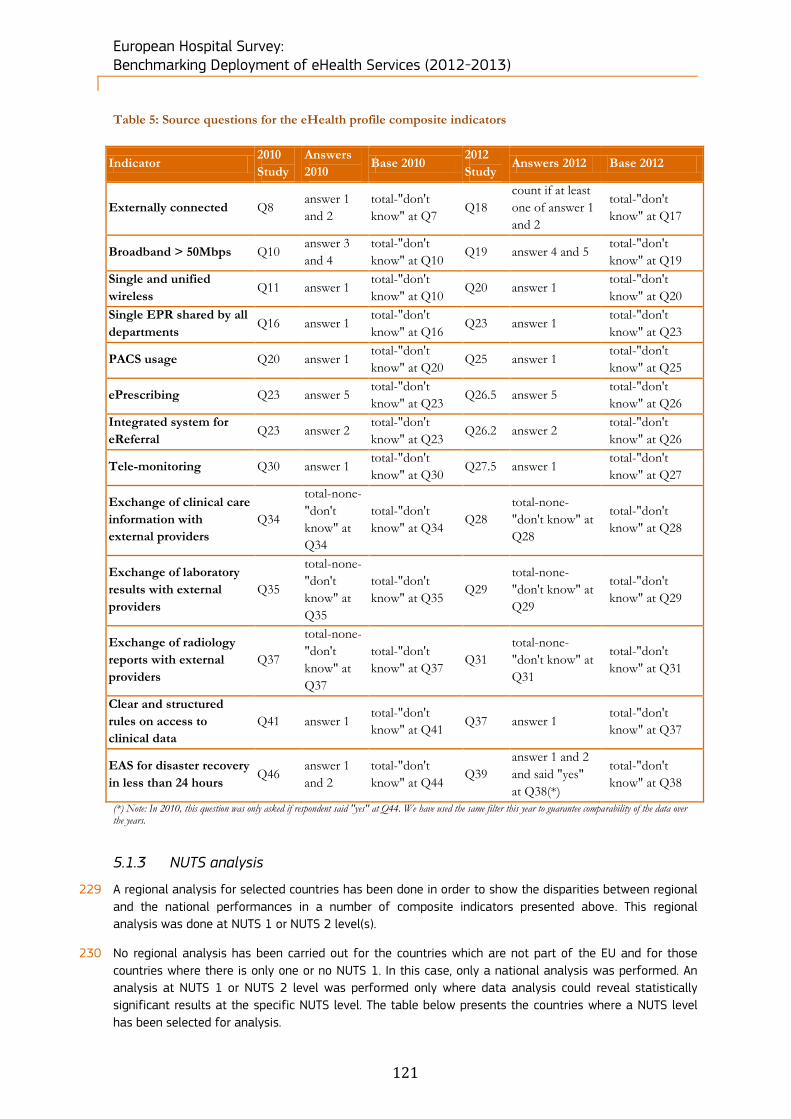
European Hospital Survey: Benchmarking Deployment of eHealth Services (2012-2013)
121
Table 5: Source questions for the eHealth profile composite indicators
Indicator 2010
Study
Answers
2010 Base 2010
2012
Study Answers 2012 Base 2012
Externally connected Q8 answer 1
and 2
total-"don't
know" at Q7 Q18
count if at least
one of answer 1
and 2
total-"don't
know" at Q17
Broadband > 50Mbps Q10 answer 3
and 4
total-"don't
know" at Q10 Q19 answer 4 and 5
total-"don't
know" at Q19
Single and unified
wireless Q11 answer 1
total-"don't
know" at Q10 Q20 answer 1
total-"don't
know" at Q20
Single EPR shared by all
departments Q16 answer 1
total-"don't
know" at Q16 Q23 answer 1
total-"don't
know" at Q23
PACS usage Q20 answer 1 total-"don't
know" at Q20 Q25 answer 1
total-"don't
know" at Q25
ePrescribing Q23 answer 5 total-"don't
know" at Q23 Q26.5 answer 5
total-"don't
know" at Q26
Integrated system for
eReferral Q23 answer 2
total-"don't
know" at Q23 Q26.2 answer 2
total-"don't
know" at Q26
Tele-monitoring Q30 answer 1 total-"don't
know" at Q30 Q27.5 answer 1
total-"don't
know" at Q27
Exchange of clinical care
information with
external providers
Q34
total-none-
"don't
know" at
Q34
total-"don't
know" at Q34 Q28
total-none-
"don't know" at
Q28
total-"don't
know" at Q28
Exchange of laboratory
results with external
providers
Q35
total-none-
"don't
know" at
Q35
total-"don't
know" at Q35 Q29
total-none-
"don't know" at
Q29
total-"don't
know" at Q29
Exchange of radiology
reports with external
providers
Q37
total-none-
"don't
know" at
Q37
total-"don't
know" at Q37 Q31
total-none-
"don't know" at
Q31
total-"don't
know" at Q31
Clear and structured
rules on access to
clinical data
Q41 answer 1 total-"don't
know" at Q41 Q37 answer 1
total-"don't
know" at Q37
EAS for disaster recovery
in less than 24 hours Q46
answer 1
and 2
total-"don't
know" at Q44 Q39
answer 1 and 2
and said "yes"
at Q38(*)
total-"don't
know" at Q38
(*) Note: In 2010, this question was only asked if respondent said "yes" at Q44. We have used the same filter this year to guarantee comparability of the data over the years.
5.1.3 NUTS analysis
229 A regional analysis for selected countries has been done in order to show the disparities between regional
and the national performances in a number of composite indicators presented above. This regional
analysis was done at NUTS 1 or NUTS 2 level(s).
230 No regional analysis has been carried out for the countries which are not part of the EU and for those
countries where there is only one or no NUTS 1. In this case, only a national analysis was performed. An
analysis at NUTS 1 or NUTS 2 level was performed only where data analysis could reveal statistically
significant results at the specific NUTS level. The table below presents the countries where a NUTS level
has been selected for analysis.

European Hospital Survey: Benchmarking Deployment of eHealth Services (2012-2013)
122
Table 6: NUTS Level of analysis per country
Country Level of analysis
Germany NUTS 1
Denmark NUTS 2
Italy NUTS 2
Portugal NUTS 2
Spain NUTS 2
United Kingdom NUTS 1
5.2 Results at national level
5.2.1 Austria’s acute hospital eHealth profile
231 242 hospitals were identified in Austria. Within this sample, 201 (83%) completed the screener part of the
questionnaire and of these, 55% qualified as acute care hospitals. Of the 132 screened in,
43 acute hospitals (33%) completed the survey. The number of medium-sized hospitals in Austria has
increased significantly between 2010 and 2012.
Table 7: Austrian breakdown by size of hospital
Austria N= Fewer than
101 beds Between 101 and
250 beds Between 251 and
750 beds More than 750
beds Don’t know/ No answer
Census 132 9 60 46 14 3
7% 45% 35% 11% 2%
2012 43 2 21 16 4 -
5% 49% 37% 9% -
2010 15 1 9 5 - -
7% 60% 33% - -
The number of hospitals has increased by a factor of two or more in all ownership categories between 2010 and 2012.
Table 8: Austrian breakdown by ownership type
Austria N= Public Private Private not for profit Don't know/ No answer
Census 132 55 25 35 17
42% 19% 27% 13%
2012 43 20 7 14 2
47% 16% 33% 5%
2010 15 10 2 3 -
67% 13% 20% -
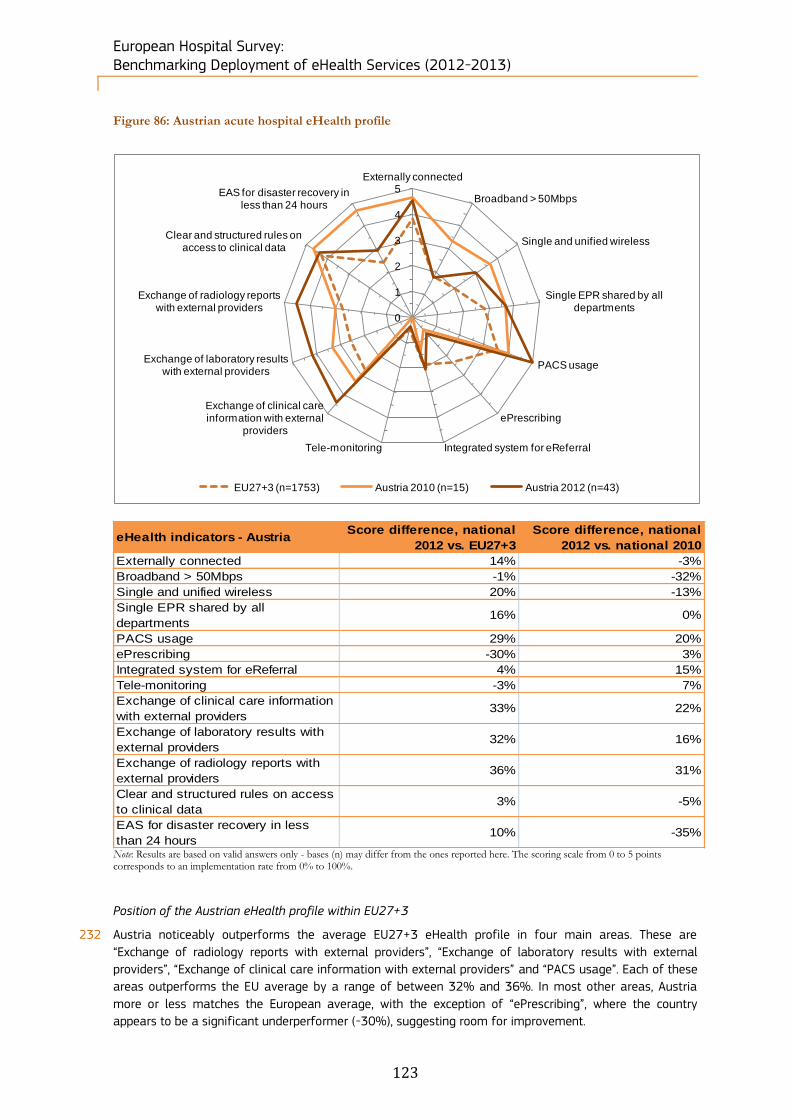
European Hospital Survey: Benchmarking Deployment of eHealth Services (2012-2013)
123
Figure 86: Austrian acute hospital eHealth profile
Note: Results are based on valid answers only - bases (n) may differ from the ones reported here. The scoring scale from 0 to 5 points corresponds to an implementation rate from 0% to 100%.
Position of the Austrian eHealth profile within EU27+3
232 Austria noticeably outperforms the average EU27+3 eHealth profile in four main areas. These are
“Exchange of radiology reports with external providers”, “Exchange of laboratory results with external
providers”, “Exchange of clinical care information with external providers” and “PACS usage”. Each of these
areas outperforms the EU average by a range of between 32% and 36%. In most other areas, Austria
more or less matches the European average, with the exception of “ePrescribing”, where the country
appears to be a significant underperformer (-30%), suggesting room for improvement.
0
1
2
3
4
5Externally connected
Broadband > 50Mbps
Single and unified wireless
Single EPR shared by all departments
PACS usage
ePrescribing
Integrated system for eReferralTele-monitoring
Exchange of clinical care information with external
providers
Exchange of laboratory results with external providers
Exchange of radiology reports with external providers
Clear and structured rules on access to clinical data
EAS for disaster recovery in less than 24 hours
EU27+3 (n=1753) Austria 2010 (n=15) Austria 2012 (n=43)
eHealth indicators - AustriaScore difference, national
2012 vs. EU27+3
Score difference, national
2012 vs. national 2010
Externally connected 14% -3%
Broadband > 50Mbps -1% -32%
Single and unified wireless 20% -13%
Single EPR shared by all
departments16% 0%
PACS usage 29% 20%
ePrescribing -30% 3%
Integrated system for eReferral 4% 15%
Tele-monitoring -3% 7%
Exchange of clinical care information
with external providers33% 22%
Exchange of laboratory results with
external providers32% 16%
Exchange of radiology reports with
external providers36% 31%
Clear and structured rules on access
to clinical data3% -5%
EAS for disaster recovery in less
than 24 hours10% -35%
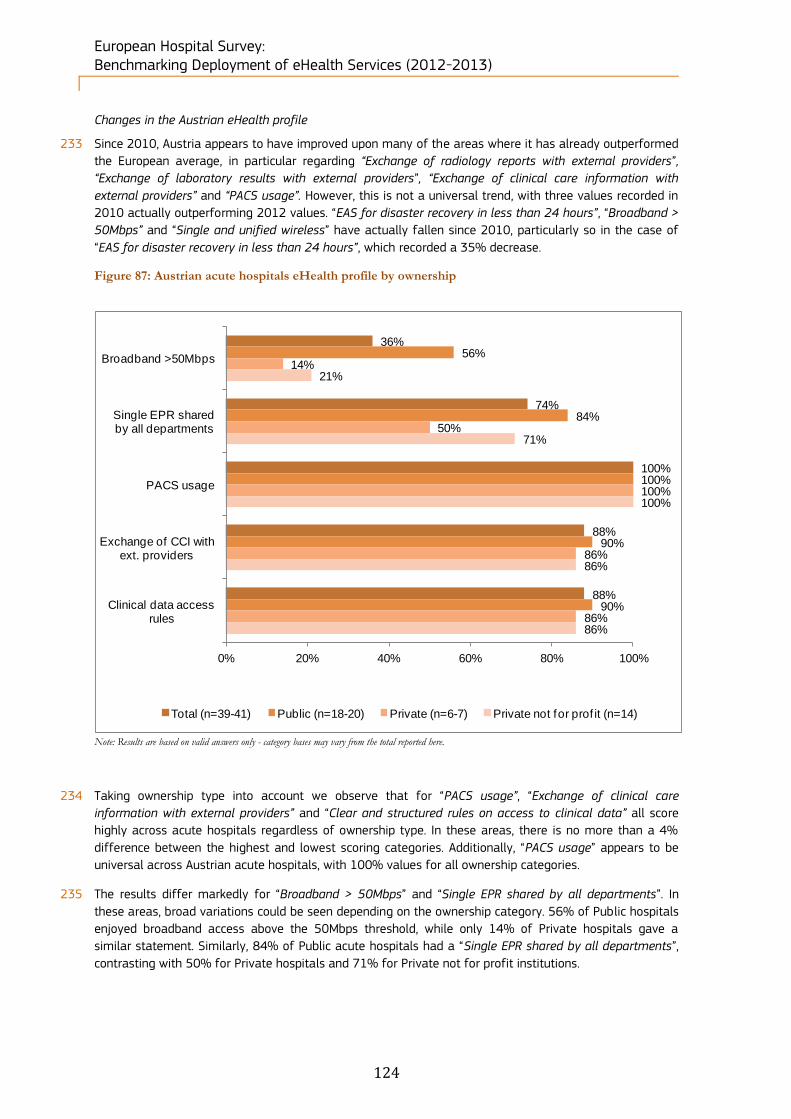
European Hospital Survey: Benchmarking Deployment of eHealth Services (2012-2013)
124
Changes in the Austrian eHealth profile
233 Since 2010, Austria appears to have improved upon many of the areas where it has already outperformed
the European average, in particular regarding “Exchange of radiology reports with external providers”,
“Exchange of laboratory results with external providers”, “Exchange of clinical care information with
external providers” and “PACS usage”. However, this is not a universal trend, with three values recorded in
2010 actually outperforming 2012 values. “EAS for disaster recovery in less than 24 hours”, “Broadband >
50Mbps” and “Single and unified wireless” have actually fallen since 2010, particularly so in the case of
“EAS for disaster recovery in less than 24 hours”, which recorded a 35% decrease.
Figure 87: Austrian acute hospitals eHealth profile by ownership
Note: Results are based on valid answers only - category bases may vary from the total reported here.
234 Taking ownership type into account we observe that for “PACS usage”, “Exchange of clinical care
information with external providers” and “Clear and structured rules on access to clinical data” all score
highly across acute hospitals regardless of ownership type. In these areas, there is no more than a 4%
difference between the highest and lowest scoring categories. Additionally, “PACS usage” appears to be
universal across Austrian acute hospitals, with 100% values for all ownership categories.
235 The results differ markedly for “Broadband > 50Mbps” and “Single EPR shared by all departments”. In
these areas, broad variations could be seen depending on the ownership category. 56% of Public hospitals
enjoyed broadband access above the 50Mbps threshold, while only 14% of Private hospitals gave a
similar statement. Similarly, 84% of Public acute hospitals had a “Single EPR shared by all departments”,
contrasting with 50% for Private hospitals and 71% for Private not for profit institutions.
36%
74%
100%
88%
88%
56%
84%
100%
90%
90%
14%
50%
100%
86%
86%
21%
71%
100%
86%
86%
0% 20% 40% 60% 80% 100%
Broadband >50Mbps
Single EPR shared by all departments
PACS usage
Exchange of CCI with ext. providers
Clinical data access rules
Total (n=39-41) Public (n=18-20) Private (n=6-7) Private not for prof it (n=14)
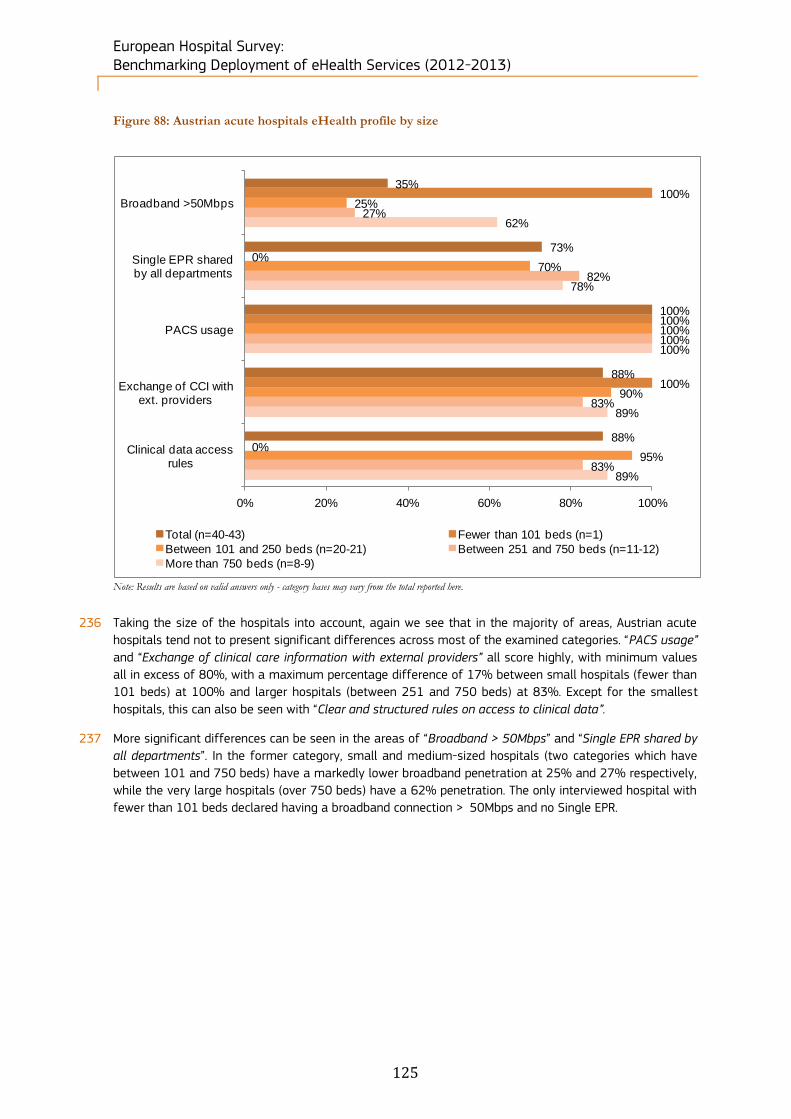
European Hospital Survey: Benchmarking Deployment of eHealth Services (2012-2013)
125
Figure 88: Austrian acute hospitals eHealth profile by size
Note: Results are based on valid answers only - category bases may vary from the total reported here.
236 Taking the size of the hospitals into account, again we see that in the majority of areas, Austrian acute
hospitals tend not to present significant differences across most of the examined categories. “PACS usage”
and “Exchange of clinical care information with external providers” all score highly, with minimum values
all in excess of 80%, with a maximum percentage difference of 17% between small hospitals (fewer than
101 beds) at 100% and larger hospitals (between 251 and 750 beds) at 83%. Except for the smallest
hospitals, this can also be seen with “Clear and structured rules on access to clinical data”.
237 More significant differences can be seen in the areas of “Broadband > 50Mbps” and “Single EPR shared by
all departments”. In the former category, small and medium-sized hospitals (two categories which have
between 101 and 750 beds) have a markedly lower broadband penetration at 25% and 27% respectively,
while the very large hospitals (over 750 beds) have a 62% penetration. The only interviewed hospital with
fewer than 101 beds declared having a broadband connection > 50Mbps and no Single EPR.
35%
73%
100%
88%
88%
100%
0%
100%
100%
0%
25%
70%
100%
90%
95%
27%
82%
100%
83%
83%
62%
78%
100%
89%
89%
0% 20% 40% 60% 80% 100%
Broadband >50Mbps
Single EPR shared by all departments
PACS usage
Exchange of CCI with ext. providers
Clinical data access rules
Total (n=40-43) Fewer than 101 beds (n=1)
Between 101 and 250 beds (n=20-21) Between 251 and 750 beds (n=11-12)
More than 750 beds (n=8-9)

European Hospital Survey: Benchmarking Deployment of eHealth Services (2012-2013)
126
5.2.2 Belgium’s acute hospital eHealth profile
238 436 hospitals were identified in Belgium. Within this sample, 243 (56%) completed the screener part of
the questionnaire and of these, 28% qualified as acute care hospitals. Of the 120 screened in, 50 acute
hospitals (42%) completed the survey.
239 The two biggest hospital size categories have doubled their number of hospital between 2010 and 2012.
Table 9: Belgian breakdown by size of hospital
Belgium N= Fewer than
101 beds Between 101 and
250 beds Between 251 and
750 beds More than 750
beds Don’t know/ No answer
Census 120
3 25 49 25 18
3% 21% 41% 21% 15%
2012 50 1 10 23 10 6
2% 20% 46% 20% 12%
2010 23 - 7 11 5 -
- 30% 48% 22% -
240 Public hospitals have almost tripled in number between 2010 and 2012; there were 13 private hospitals in
2012 compared to none in 2010.
Table 10: Belgian breakdown by ownership type
Belgium N= Public Private Private not for profit Don't know/ No answer
Census 120
47 25 36 12
39% 21% 30% 10%
2012 50 23 13 13 1
46% 26% 26% 2%
2010 23 8 - 14 1
35% - 61% 4%

European Hospital Survey: Benchmarking Deployment of eHealth Services (2012-2013)
127
Figure 89: Belgian acute hospital eHealth profile
Note: Results are based on valid answers only - bases (n) may differ from the ones reported here. The scoring scale from 0 to 5 points corresponds to an implementation rate from 0% to 100%.
0
1
2
3
4
5Externally connected
Broadband > 50Mbps
Single and unified wireless
Single EPR shared by all departments
PACS usage
ePrescribing
Integrated system for eReferralTele-monitoring
Exchange of clinical care information with external
providers
Exchange of laboratory results with external providers
Exchange of radiology reports with external providers
Clear and structured rules on access to clinical data
EAS for disaster recovery in less than 24 hours
EU27+3 (n=1753) Belgium 2010 (n=23) Belgium 2012 (n=50)
eHealth indicators - Belgium Score difference, national
2012 vs. EU27+3
Score difference, national
2012 vs. national 2010
Externally connected 16% -4%
Broadband > 50Mbps 18% 10%
Single and unified wireless 29% 4%
Single EPR shared by all
departments16% -5%
PACS usage 19% -6%
ePrescribing 2% 10%
Integrated system for eReferral 22% -10%
Tele-monitoring 0% 6%
Exchange of clinical care information
with external providers37% 1%
Exchange of laboratory results with
external providers41% 1%
Exchange of radiology reports with
external providers21% -11%
Clear and structured rules on access
to clinical data9% 3%
EAS for disaster recovery in less
than 24 hours-1% -27%

European Hospital Survey: Benchmarking Deployment of eHealth Services (2012-2013)
128
Position of the Belgian eHealth profile in EU27+3
241 Belgium outperforms the European average most notably in the following areas: “Externally connected”,
“Broadband > 50Mbps”, “Single and unified wireless”, “Single EPR shared by all departments”, “PACS
usage”, “Exchange of clinical care information with external providers”, “Exchange of laboratory results
with external providers” and “Exchange of radiology reports with external providers”. In particular
“Exchange of clinical care information with external providers” and “Exchange of laboratory results with
external providers” enjoy a substantial lead over the European average, with these areas having a 37%
and 41% lead. However, with respect to “EAS for disaster recovery in less than 24 hours”, “Tele-
monitoring” and “ePrescribing”, Belgium either slightly lags behind the average or is very close to the
average.
Changes in the Belgian eHealth profile
242 In the intervening period between this study and the last, it appears that Belgium’s eHealth profile has
remained largely unchanged. With the exception of “EAS for disaster recovery in less than
24 hours”, which recorded a 27% decrease relative to the 2010 results, most other values occupy a
similar range. In fact, other than the EAS result, all other positions registered a shift lower than or equal to
-11%.
Figure 90: Belgian acute hospitals eHealth profile by ownership
Note: Results are based on valid answers only - category bases may vary from the total reported here.
243 Looking at the ownership types of Belgian hospitals, we can see a generally close range for the majority of
the indicators. For “PACS usage”, “Exchange of clinical care information with external providers” and “Clear
and structured rules on access to clinical data”, that the variation in percentage penetration is 10% or less
in all three indicators. “Exchange of clinical care information with external providers” has the largest
variation of these three categories with a 10% variation between Public hospitals (95%) and Private
52%
75%
90%
92%
94%
50%
65%
91%
95%
91%
55%
75%
92%
85%
92%
54%
92%
85%
92%
100%
0% 20% 40% 60% 80% 100%
Broadband >50Mbps
Single EPR shared by all departments
PACS usage
Exchange of CCI with ext. providers
Clinical data access rules
Total (n=44-49) Public (n=20-23)
Private (n=11-13) Private not for prof it (n=13)

European Hospital Survey: Benchmarking Deployment of eHealth Services (2012-2013)
129
hospitals (85%). For the other closely matching areas, differences of only 6-7% are in evidence, regardless
of ownership type.
244 However, differences are more pronounced for “Single EPR shared by all departments”. In this category, a
difference of 27 percentage points can be seen depending on the ownership type, with Public hospitals,
Private hospitals and Private not for profit hospitals recording respectively 65%, 75% and 92%
penetration for this category.
245 Almost no difference was observed for “Broadband > 50Mbps”, with only a 5% difference between public
hospitals (50% penetration) and private hospitals (55% penetration). Private not for profit hospitals
occupy a midway point with a 54% penetration rate.
Figure 91: Belgian acute hospitals eHealth profile by size
Note: Results are based on valid answers only - category bases may vary from the total reported here.
246 When we take hospital scale into consideration we can see more differentiation across multiple areas.
With the exception of “Clear and structured rules on access to clinical data”, where variation between
hospitals is at a maximum of 4% and all reported hospital size groupings display over 90% penetration,
all other areas show a large disparity between eHealth profile values. “Broadband > 50Mbps”, “Single EPR
shared by all departments”, “PACS usage” and “Exchange of clinical care information with external
providers” all display variations of 12-25%. However, it does not appear that scale is by itself a
determinant of penetration in this context. For example, while the largest acute hospitals (over 750 beds)
have 100% usage of “PACS usage” and “Exchange of clinical care information with external providers” and
69% of “Broadband > 50Mbps”, when we examine “Single EPR shared by all departments” the largest
hospitals actually lag behind the smaller ones.
53%
74%
90%
91%
94%
0%
0%
0%
0%
0%
50%
80%
73%
73%
91%
45%
77%
91%
95%
95%
69%
67%
100%
100%
93%
0% 20% 40% 60% 80% 100%
Broadband >50Mbps
Single EPR shared by all departments
PACS usage
Exchange of CCI with ext. providers
Clinical data access rules
Total (n=43-48) Fewer than 101 beds (n=0)
Between 101 and 250 beds (n=10-11) Between 251 and 750 beds (n=20-22)
More than 750 beds (n=13-15)
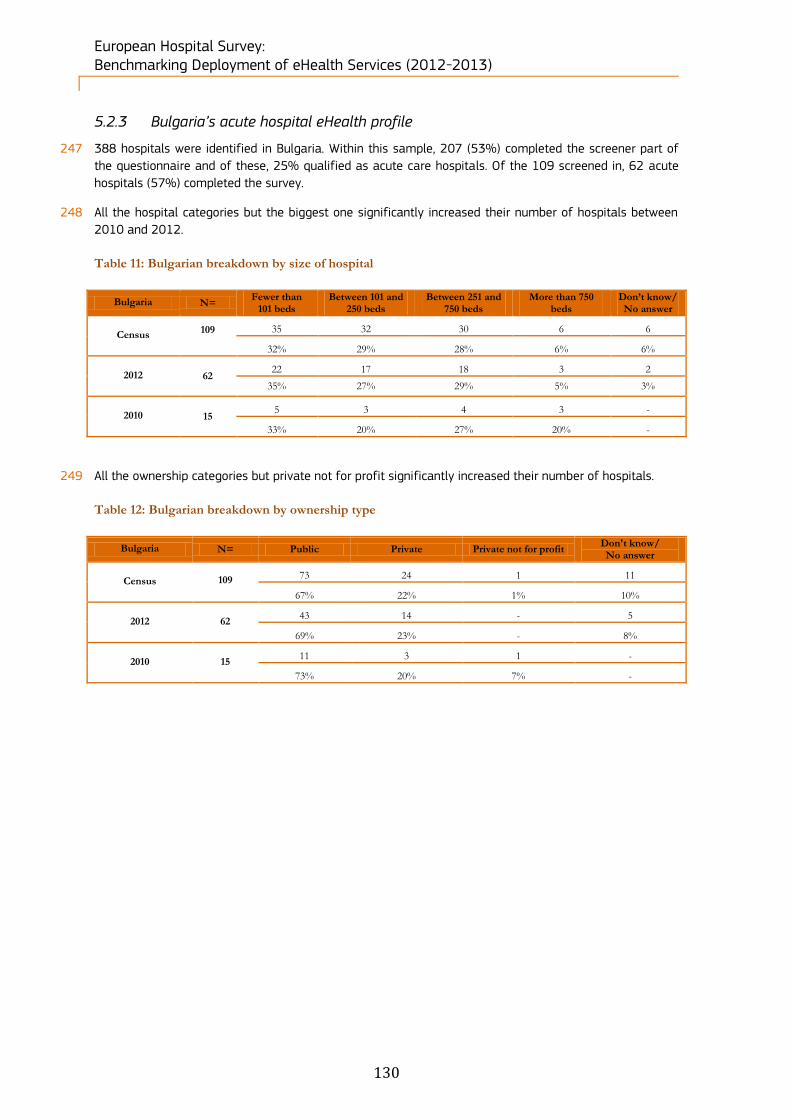
European Hospital Survey: Benchmarking Deployment of eHealth Services (2012-2013)
130
5.2.3 Bulgaria’s acute hospital eHealth profile
247 388 hospitals were identified in Bulgaria. Within this sample, 207 (53%) completed the screener part of
the questionnaire and of these, 25% qualified as acute care hospitals. Of the 109 screened in, 62 acute
hospitals (57%) completed the survey.
248 All the hospital categories but the biggest one significantly increased their number of hospitals between
2010 and 2012.
Table 11: Bulgarian breakdown by size of hospital
Bulgaria N= Fewer than
101 beds Between 101 and
250 beds Between 251 and
750 beds More than 750
beds Don’t know/ No answer
Census 109
35 32 30 6 6
32% 29% 28% 6% 6%
2012 62 22 17 18 3 2
35% 27% 29% 5% 3%
2010 15 5 3 4 3 -
33% 20% 27% 20% -
249 All the ownership categories but private not for profit significantly increased their number of hospitals.
Table 12: Bulgarian breakdown by ownership type
Bulgaria N= Public Private Private not for profit Don't know/ No answer
Census 109
73 24 1 11
67% 22% 1% 10%
2012 62 43 14 - 5
69% 23% - 8%
2010 15 11 3 1 -
73% 20% 7% -

European Hospital Survey: Benchmarking Deployment of eHealth Services (2012-2013)
131
Figure 92: Bulgarian acute hospital eHealth profile
Note: Results are based on valid answers only - bases (n) may differ from the ones reported here. The scoring scale from 0 to 5 points corresponds to an implementation rate from 0% to 100%.
0
1
2
3
4
5Externally connected
Broadband > 50Mbps
Single and unified wireless
Single EPR shared by all departments
PACS usage
ePrescribing
Integrated system for eReferralTele-monitoring
Exchange of clinical care information with external
providers
Exchange of laboratory results with external providers
Exchange of radiology reports with external providers
Clear and structured rules on access to clinical data
EAS for disaster recovery in less than 24 hours
EU27+3 (n=1753) Bulgaria 2010 (n=15) Bulgaria 2012 (n=62)
eHealth indicators - Bulgaria Score difference, national
2012 vs. EU27+3
Score difference, national
2012 vs. national 2010
Externally connected -17% -14%
Broadband > 50Mbps 11% 4%
Single and unified wireless -23% -3%
Single EPR shared by all
departments-18% -7%
PACS usage -20% 11%
ePrescribing -13% 33%
Integrated system for eReferral 6% 17%
Tele-monitoring -10% -7%
Exchange of clinical care information
with external providers-11% 44%
Exchange of laboratory results with
external providers-27% 25%
Exchange of radiology reports with
external providers-35% 20%
Clear and structured rules on access
to clinical data7% -1%
EAS for disaster recovery in less
than 24 hours-3% -19%

European Hospital Survey: Benchmarking Deployment of eHealth Services (2012-2013)
132
Position of the Bulgarian eHealth profile within EU27+3
250 Bulgaria significantly underperforms the European average in many areas, although the
underperformance is most evident in a select number of areas. “Exchange of radiology reports with
external providers”, “Exchange of laboratory results with external providers” and “PACS usage” are the
largest underperforming areas, with discrepancies of -35%, -27% and -20% respectively. However, other
areas fared better, with “Clear and structured rules on access to clinical data”, “Broadband > 50Mbps” and
“Integrated system for eReferral” all very close to the European average.
Change in the Bulgarian eHealth profile
251 While Bulgaria underperforms the European average, it has shown some significant advances within a
two-year period. These advances are most noteworthy in the areas of “Exchange of radiology reports with
external providers” (+20%), “Exchange of clinical care information with external providers” (+44%) and also
“ePrescribing” (+33%). Two areas appear to have suffered notable contraction: “EAS for disaster recovery
in less than 24 hours” and “Externally connected” which are now -19% and -14% below the 2010 value
respectively.
Figure 93: Bulgarian acute hospitals eHealth profile by ownership type
Note: Results are based on valid answers only - category bases may vary from the total reported here.
252 With the exception of “Clear and structured rules on access to clinical data” and “Single EPR shared by all
departments”, where penetration values are relatively close across both Public and Private hospitals
(within maximum 6% difference), other areas (“Broadband > 50Mbps”, “Exchange of clinical care
information with external providers” and “PACS usage”) show important differences. “Broadband
> 50Mbps” displays an 8 percentage point gap between Public and Private hospitals, “Exchange of clinical
care information with external providers” a 19 percentage point gap and “PACS usage” even a 24
percentage point gap. Looking across ownership types, Private hospitals appear to be generally better
endowed with respect to eHealth facilities, with the exception of “Broadband > 50Mbps”, where Private
hospitals lag behind Public hospitals.
43%
41%
46%
43%
91%
44%
40%
40%
39%
91%
36%
46%
64%
58%
93%
0%
0%
0%
0%
0%
0% 20% 40% 60% 80% 100%
Broadband > 50Mbps
Single EPR shared by all departments
PACS usage
Exchange of CCI with ext. providers
Clear data access rules
Total (n=47-57) Public (n=36-43) Private (n=11-14) Private not for prof it (n=0)
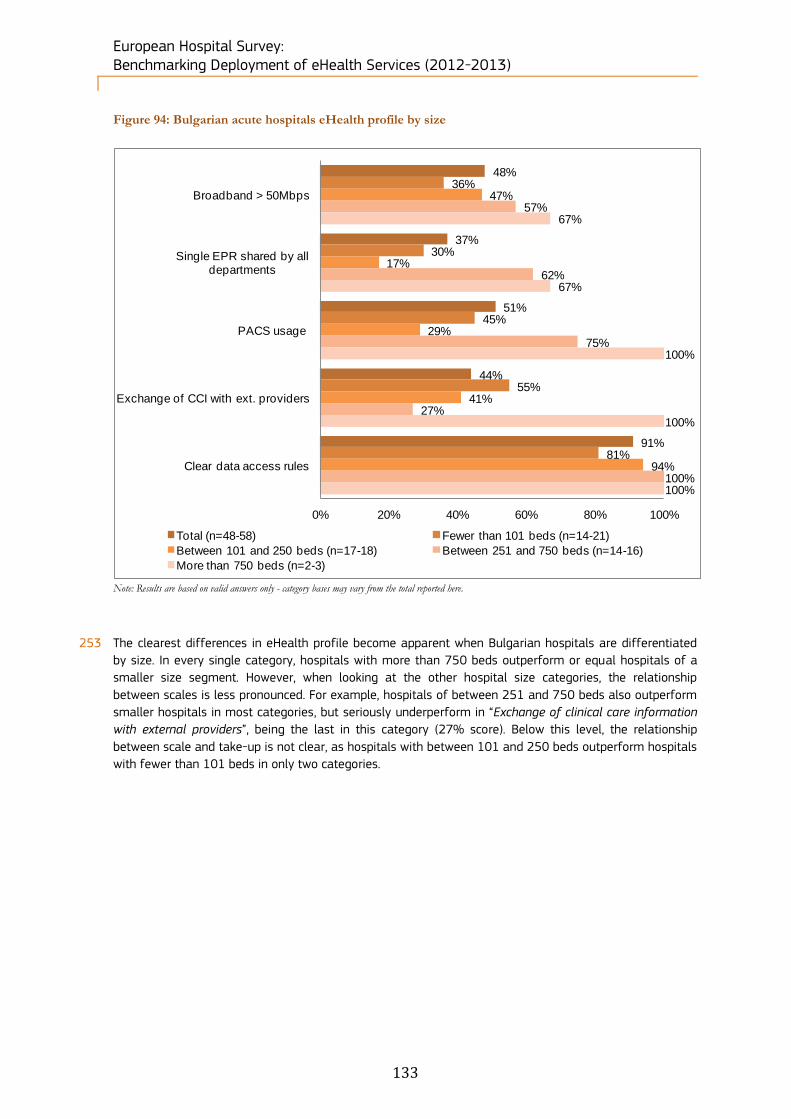
European Hospital Survey: Benchmarking Deployment of eHealth Services (2012-2013)
133
Figure 94: Bulgarian acute hospitals eHealth profile by size
Note: Results are based on valid answers only - category bases may vary from the total reported here.
253 The clearest differences in eHealth profile become apparent when Bulgarian hospitals are differentiated
by size. In every single category, hospitals with more than 750 beds outperform or equal hospitals of a
smaller size segment. However, when looking at the other hospital size categories, the relationship
between scales is less pronounced. For example, hospitals of between 251 and 750 beds also outperform
smaller hospitals in most categories, but seriously underperform in “Exchange of clinical care information
with external providers”, being the last in this category (27% score). Below this level, the relationship
between scale and take-up is not clear, as hospitals with between 101 and 250 beds outperform hospitals
with fewer than 101 beds in only two categories.
48%
37%
51%
44%
91%
36%
30%
45%
55%
81%
47%
17%
29%
41%
94%
57%
62%
75%
27%
100%
67%
67%
100%
100%
100%
0% 20% 40% 60% 80% 100%
Broadband > 50Mbps
Single EPR shared by all departments
PACS usage
Exchange of CCI with ext. providers
Clear data access rules
Total (n=48-58) Fewer than 101 beds (n=14-21)
Between 101 and 250 beds (n=17-18) Between 251 and 750 beds (n=14-16)
More than 750 beds (n=2-3)

European Hospital Survey: Benchmarking Deployment of eHealth Services (2012-2013)
134
5.2.4 Croatia’s acute hospital eHealth profile
254 75 hospitals were identified in Croatia. Within this sample, 32 (43%) completed the screener part of the
questionnaire and of these, 29% qualified as acute care hospitals. Of the 22 screened in, 11 acute
hospitals (50%) completed the survey.
255 The number of intermediate size hospitals increased from 2 in 2010 to 6 in 2012 and two hospitals with
more than 750 beds have been created over the same period.
Table 13: Croatian breakdown by size of hospital
Croatia N= Fewer than
101 beds Between 101 and
250 beds Between 251 and
750 beds More than 750
beds Don’t know/ No answer
Census 22
- 4 9 6 3
- 18% 41% 27% 14%
2012 11 - 2 6 2 1
- 18% 55% 18% 9%
2010 4 - 2 2 - -
- 50% 50% - -
The number of Public hospitals (the only category present) has more than doubled between 2010
and 2012.
Table 14: Croatian breakdown by ownership type
Croatia N= Public Private Private not for profit Don't know/ No answer
Census 22
20 - - 2
91% - - 9%
2012 11 11 - - -
100% - - -
2010 4 4 - - -
100% - - -
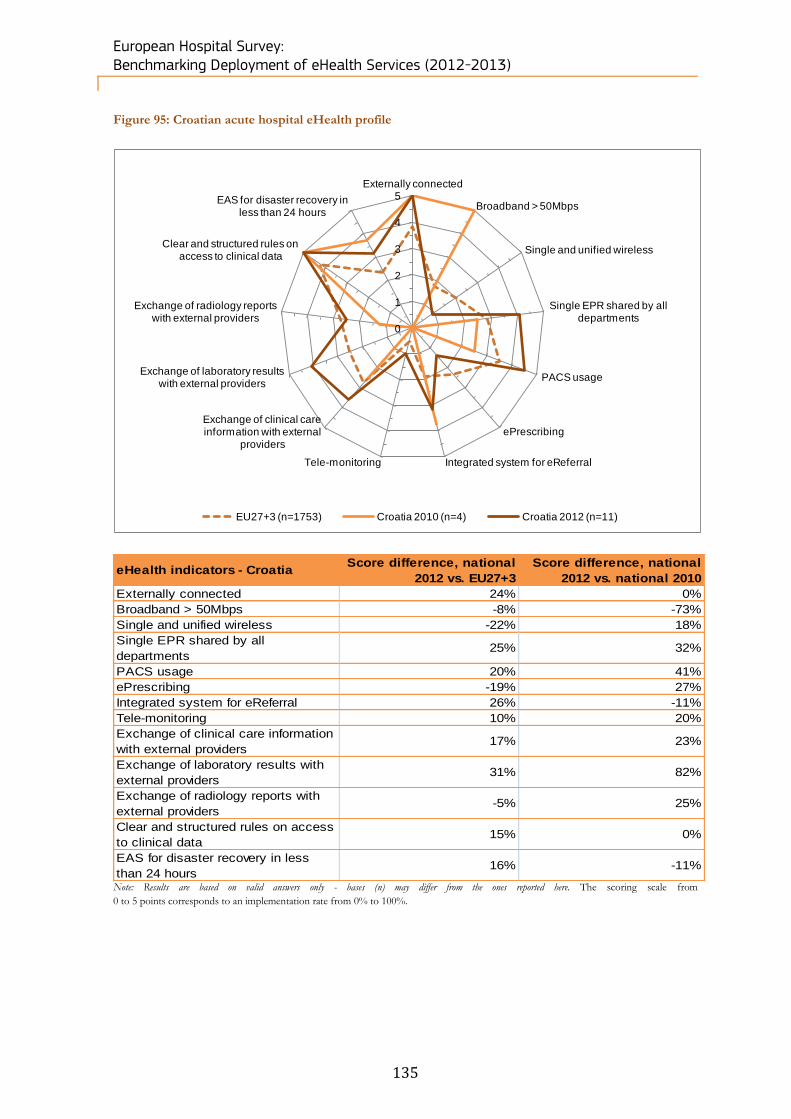
European Hospital Survey: Benchmarking Deployment of eHealth Services (2012-2013)
135
Figure 95: Croatian acute hospital eHealth profile
Note: Results are based on valid answers only - bases (n) may differ from the ones reported here. The scoring scale from
0 to 5 points corresponds to an implementation rate from 0% to 100%.
0
1
2
3
4
5Externally connected
Broadband > 50Mbps
Single and unified wireless
Single EPR shared by all departments
PACS usage
ePrescribing
Integrated system for eReferralTele-monitoring
Exchange of clinical care information with external
providers
Exchange of laboratory results with external providers
Exchange of radiology reports with external providers
Clear and structured rules on access to clinical data
EAS for disaster recovery in less than 24 hours
EU27+3 (n=1753) Croatia 2010 (n=4) Croatia 2012 (n=11)
eHealth indicators - Croatia Score difference, national
2012 vs. EU27+3
Score difference, national
2012 vs. national 2010
Externally connected 24% 0%
Broadband > 50Mbps -8% -73%
Single and unified wireless -22% 18%
Single EPR shared by all
departments25% 32%
PACS usage 20% 41%
ePrescribing -19% 27%
Integrated system for eReferral 26% -11%
Tele-monitoring 10% 20%
Exchange of clinical care information
with external providers17% 23%
Exchange of laboratory results with
external providers31% 82%
Exchange of radiology reports with
external providers-5% 25%
Clear and structured rules on access
to clinical data15% 0%
EAS for disaster recovery in less
than 24 hours16% -11%

European Hospital Survey: Benchmarking Deployment of eHealth Services (2012-2013)
136
Position of the Croatian eHealth profile within EU27+3
256 Croatia remains close to the European average regarding the development of its eHealth profile, with
some underperformance and some overperformance across the range of examined indicators. Areas of
overperformance include: “Externally connected”, “Single EPR shared by all departments”, “PACS usage”,
“Integrated system for eReferral”, “Tele-monitoring”, “Exchange of clinical care information with external
providers”, “Exchange of laboratory results with external providers”, “Clear and structured rules on access
to clinical data” and “EAS for disaster recovery in less than 24 hours”. Compared the EU27+3 average,
underperforming areas included “Broadband > 50Mbps”, “Single and unified wireless”, “ePrescribing”, and
“Exchange of radiology reports with external providers” (although in the latter case, the underperformance
is marginal).
Change in the Croatian eHealth profile
257 Interestingly, the development of Croatia’s eHealth profile has been strong between 2010 and 2012.
Croatia demonstrated a healthy growth in eHealth endowment across the acute hospital sector. Five areas
in particular recorded high growth: “Single EPR shared by all departments”, “PACS usage”, “ePrescribing”,
“Exchange of clinical care information with external providers” and “Exchange of laboratory results with
external providers”.
258 With respect to ownership, only data for Public hospitals are available, and therefore no comparisons can
be drawn in this context.
Figure 96: Croatian acute hospitals eHealth profile by size
Note: Results are based on valid answers only - category bases may vary from the total reported here.
259 When taking the size of hospitals into account, we can see very good penetration of “Clear and structured
rules on access to clinical data” across all size segments. Otherwise the results do not show any strong
patterns. For example, larger hospitals (including hospitals with between 251 and 750 beds and those with
over 750 beds) perform well regarding “PACS usage”. However, with respect to “Exchange of clinical care
information with external providers”, smaller hospitals (between 101 and 250 beds) have 100%
30%
80%
90%
70%
100%
0%
0%
0%
0%
0%
0%
100%
50%
100%
100%
33%
83%
100%
83%
100%
50%
50%
100%
0%
100%
0% 20% 40% 60% 80% 100%
Broadband > 50Mbps3
Single EPR shared by all departments
PACS usage
Exchange of CCI with ext. providers
Clear data access rules
Total (n=10) Fewer than 101 beds (n=0)
Between 101 and 250 beds (n=2) Between 251 and 750 beds (n=6)
More than 750 beds (n=2)
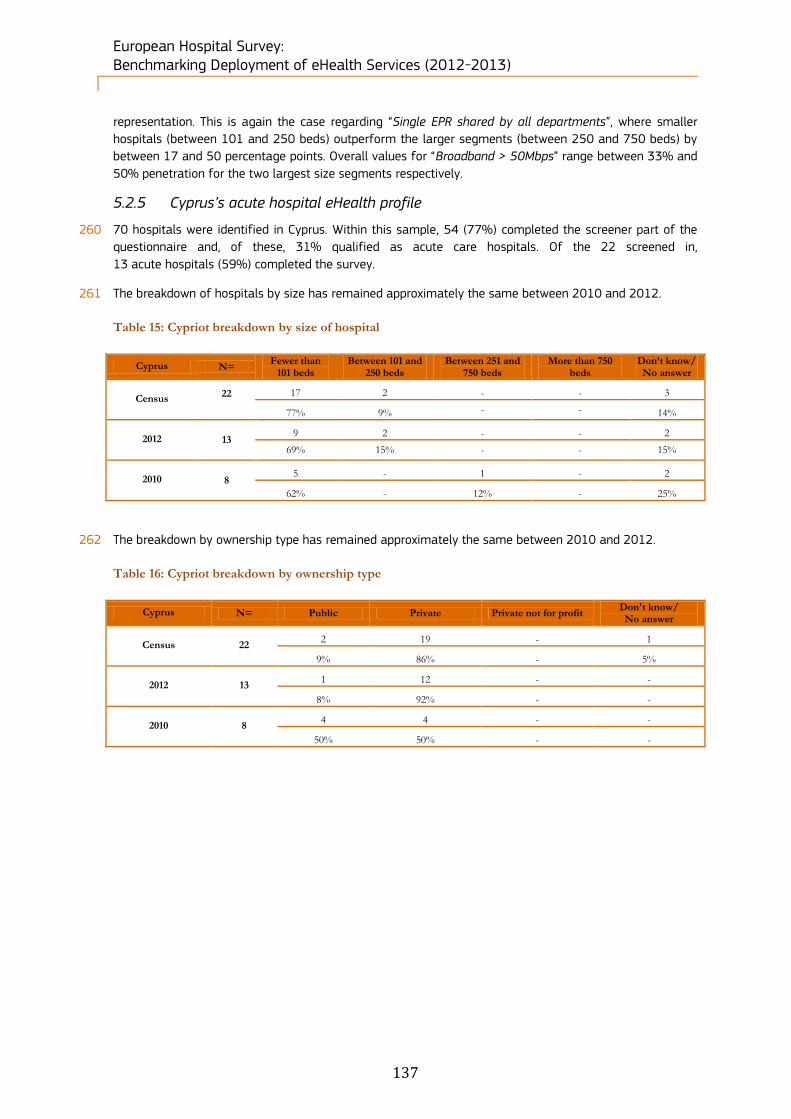
European Hospital Survey: Benchmarking Deployment of eHealth Services (2012-2013)
137
representation. This is again the case regarding “Single EPR shared by all departments”, where smaller
hospitals (between 101 and 250 beds) outperform the larger segments (between 250 and 750 beds) by
between 17 and 50 percentage points. Overall values for “Broadband > 50Mbps” range between 33% and
50% penetration for the two largest size segments respectively.
5.2.5 Cyprus’s acute hospital eHealth profile
260 70 hospitals were identified in Cyprus. Within this sample, 54 (77%) completed the screener part of the
questionnaire and, of these, 31% qualified as acute care hospitals. Of the 22 screened in,
13 acute hospitals (59%) completed the survey.
261 The breakdown of hospitals by size has remained approximately the same between 2010 and 2012.
Table 15: Cypriot breakdown by size of hospital
Cyprus N= Fewer than
101 beds Between 101 and
250 beds Between 251 and
750 beds More than 750
beds Don’t know/ No answer
Census 22
17 2 - - 3
77% 9% - - 14%
2012 13 9 2 - - 2
69% 15% - - 15%
2010 8 5 - 1 - 2
62% - 12% - 25%
262 The breakdown by ownership type has remained approximately the same between 2010 and 2012.
Table 16: Cypriot breakdown by ownership type
Cyprus N= Public Private Private not for profit Don't know/ No answer
Census 22 2 19 - 1
9% 86% - 5%
2012 13 1 12 - -
8% 92% - -
2010 8 4 4 - -
50% 50% - -

European Hospital Survey: Benchmarking Deployment of eHealth Services (2012-2013)
138
Figure 97: Cypriot acute hospital eHealth profile
Note: Results are based on valid answers only - bases (n) may differ from the ones reported here. The scoring scale from 0 to 5 points corresponds to an
implementation rate from 0% to 100%.
0
1
2
3
4
5Externally connected
Broadband > 50Mbps
Single and unified wireless
Single EPR shared by all departments
PACS usage
ePrescribing
Integrated system for eReferralTele-monitoring
Exchange of clinical care information with external
providers
Exchange of laboratory results with external providers
Exchange of radiology reports with external providers
Clear and structured rules on access to clinical data
EAS for disaster recovery in less than 24 hours
EU27+3 (n=1753) Cyprus 2010 (n=8) Cyprus 2012 (n=13)
eHealth indicators - Cyprus score difference 2012-
Eu27+3score difference 2012-2010
Externally connected -40% -39%
Broadband > 50Mbps -26% 10%
Single and unified wireless 18% 58%
Single EPR shared by all
departments-1% -19%
PACS usage -29% 13%
ePrescribing -37% -28%
Integrated system for eReferral 2% -10%
Tele-monitoring -10% 0%
Exchange of clinical care information
with external providers-25% 13%
Exchange of laboratory results with
external providers3% 21%
Exchange of radiology reports with
external providers9% 47%
Clear and structured rules on access
to clinical data-13% -27%
EAS for disaster recovery in less
than 24 hours-3% -30%
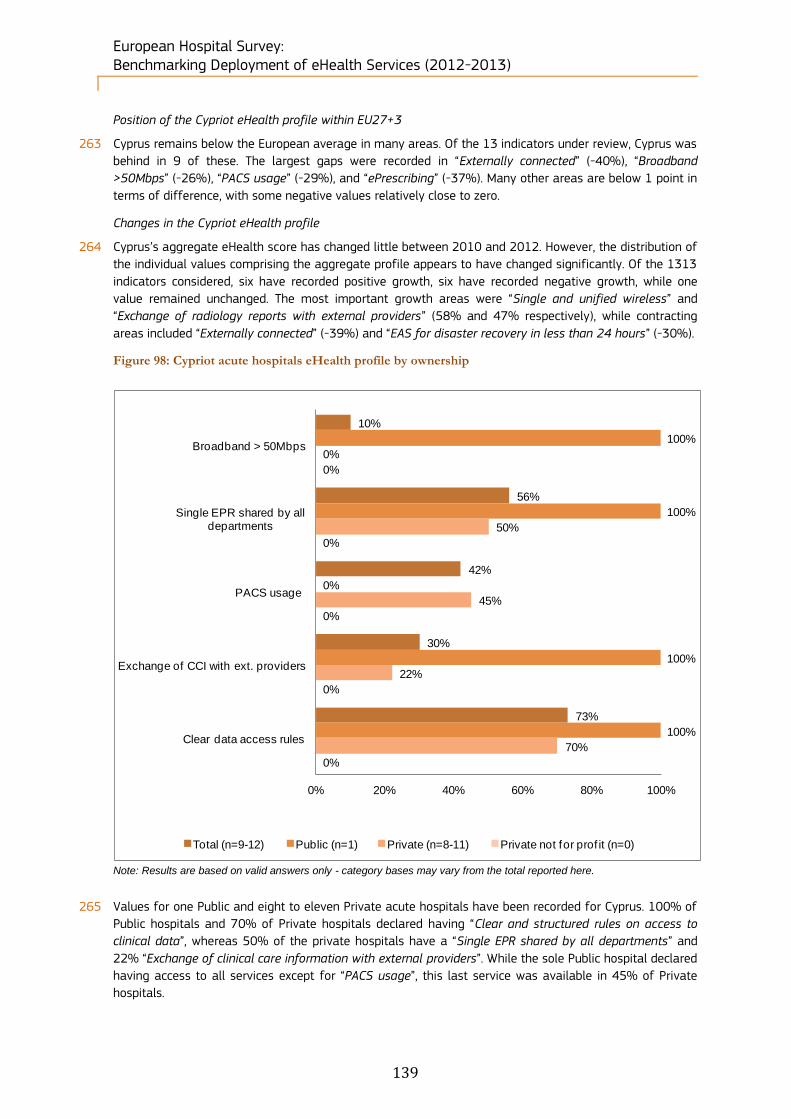
European Hospital Survey: Benchmarking Deployment of eHealth Services (2012-2013)
139
Position of the Cypriot eHealth profile within EU27+3
263 Cyprus remains below the European average in many areas. Of the 13 indicators under review, Cyprus was
behind in 9 of these. The largest gaps were recorded in “Externally connected” (-40%), “Broadband
>50Mbps” (-26%), “PACS usage” (-29%), and “ePrescribing” (-37%). Many other areas are below 1 point in
terms of difference, with some negative values relatively close to zero.
Changes in the Cypriot eHealth profile
264 Cyprus’s aggregate eHealth score has changed little between 2010 and 2012. However, the distribution of
the individual values comprising the aggregate profile appears to have changed significantly. Of the 1313
indicators considered, six have recorded positive growth, six have recorded negative growth, while one
value remained unchanged. The most important growth areas were “Single and unified wireless” and
“Exchange of radiology reports with external providers” (58% and 47% respectively), while contracting
areas included “Externally connected” (-39%) and “EAS for disaster recovery in less than 24 hours” (-30%).
Figure 98: Cypriot acute hospitals eHealth profile by ownership
Note: Results are based on valid answers only - category bases may vary from the total reported here.
265 Values for one Public and eight to eleven Private acute hospitals have been recorded for Cyprus. 100% of
Public hospitals and 70% of Private hospitals declared having “Clear and structured rules on access to
clinical data”, whereas 50% of the private hospitals have a “Single EPR shared by all departments” and
22% “Exchange of clinical care information with external providers”. While the sole Public hospital declared
having access to all services except for “PACS usage”, this last service was available in 45% of Private
hospitals.
10%
56%
42%
30%
73%
100%
100%
0%
100%
100%
0%
50%
45%
22%
70%
0%
0%
0%
0%
0%
0% 20% 40% 60% 80% 100%
Broadband > 50Mbps
Single EPR shared by all departments
PACS usage
Exchange of CCI with ext. providers
Clear data access rules
Total (n=9-12) Public (n=1) Private (n=8-11) Private not for prof it (n=0)

European Hospital Survey: Benchmarking Deployment of eHealth Services (2012-2013)
140
Figure 99: Cypriot acute hospitals eHealth profile by size
Note: Results are based on valid answers only - category bases may vary from the total reported here.
266 As Cyprus is one of the smallest European states, it is not surprising that no values were returned for the
size segments of ‘Between 251 and 750 beds’ and ‘More than 750 beds’. Therefore our analysis is
confined to the smaller categories, namely ‘fewer than 101 beds’ and ‘between 101 and 250 beds’.
Within this grouping, the larger hospitals tend to lead in all five categories. In addition, the disparity
between Cyprus’s larger and smaller hospitals is striking, with “Single EPR shared by all departments”,
“PACS usage”, “Exchange of clinical care information with external providers” and “Clear and structured
rules on access to clinical data” registering differences of 67, 34, 53 and 38 percentage points
respectively. Interestingly, only one hospital declared having access to “Broadband > 50Mbps”.
10%
56%
42%
30%
73%
0%
33%
33%
14%
62%
50%
100%
67%
67%
100%
0%
0%
0%
0%
0%
0%
0%
0%
0%
0%
0% 10% 20% 30% 40% 50% 60% 70% 80% 90% 100%
Broadband > 50Mbps
Single EPR shared by all departments
PACS usage
Exchange of CCI with ext. providers
Clear data access rules
Total (n=9-12) Fewer than 101 beds (n=6-9)
Between 101 and 250 beds (n=2-3) Between 251 and 750 beds (n=0)
More than 750 beds (n=0)
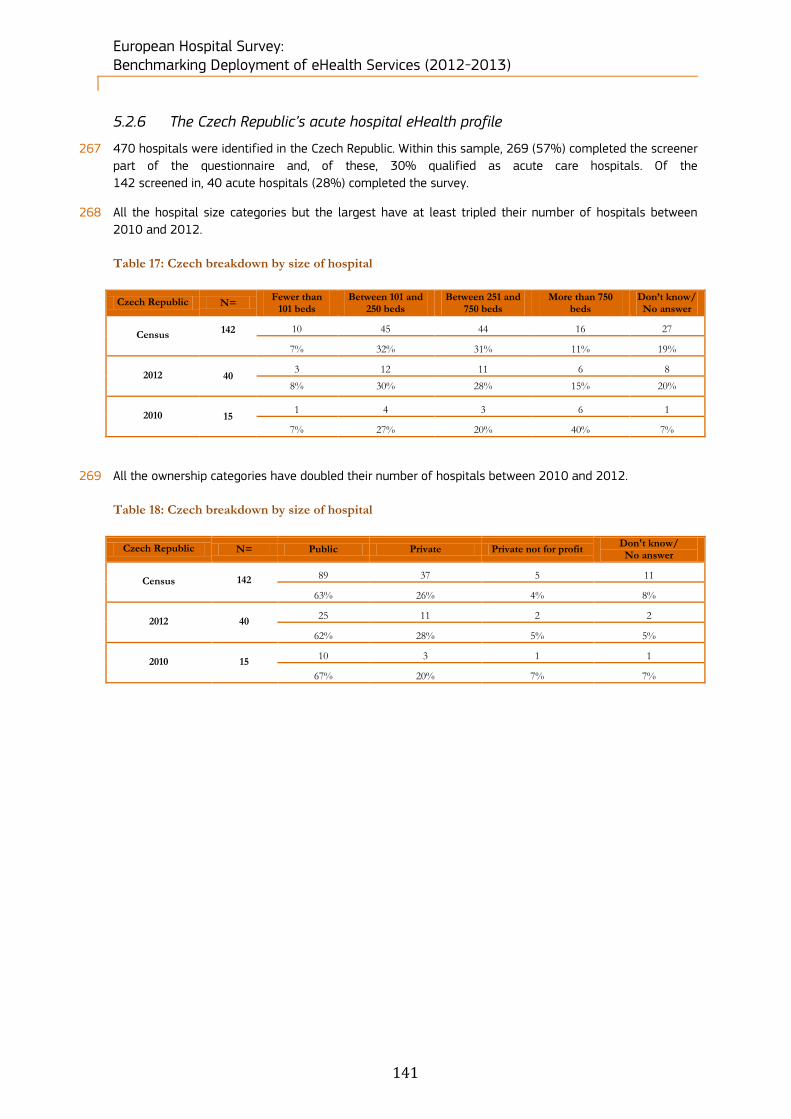
European Hospital Survey: Benchmarking Deployment of eHealth Services (2012-2013)
141
5.2.6 The Czech Republic’s acute hospital eHealth profile
267 470 hospitals were identified in the Czech Republic. Within this sample, 269 (57%) completed the screener
part of the questionnaire and, of these, 30% qualified as acute care hospitals. Of the
142 screened in, 40 acute hospitals (28%) completed the survey.
268 All the hospital size categories but the largest have at least tripled their number of hospitals between
2010 and 2012.
Table 17: Czech breakdown by size of hospital
Czech Republic N= Fewer than
101 beds Between 101 and
250 beds Between 251 and
750 beds More than 750
beds Don’t know/ No answer
Census 142
10 45 44 16 27
7% 32% 31% 11% 19%
2012 40 3 12 11 6 8
8% 30% 28% 15% 20%
2010 15 1 4 3 6 1
7% 27% 20% 40% 7%
269 All the ownership categories have doubled their number of hospitals between 2010 and 2012.
Table 18: Czech breakdown by size of hospital
Czech Republic N= Public Private Private not for profit Don't know/ No answer
Census 142
89 37 5 11
63% 26% 4% 8%
2012 40 25 11 2 2
62% 28% 5% 5%
2010 15 10 3 1 1
67% 20% 7% 7%

European Hospital Survey: Benchmarking Deployment of eHealth Services (2012-2013)
142
Figure 100: Czech acute hospital eHealth profile
Note: Results are based on valid answers only - bases (n) may differ from the ones reported here. The scoring scale from 0 to 5 points corresponds to an
implementation rate from 0% to 100%.
0
1
2
3
4
5Externally connected
Broadband > 50Mbps
Single and unified wireless
Single EPR shared by all departments
PACS usage
ePrescribing
Integrated system for eReferralTele-monitoring
Exchange of clinical care information with external
providers
Exchange of laboratory results with external providers
Exchange of radiology reports with external providers
Clear and structured rules on access to clinical data
EAS for disaster recovery in less than 24 hours
EU27+3 (n=1753) Czech Republic 2010 (n=15) Czech Republic 2012 (n=40)
eHealth indicators - Czech
Republic
Score difference, national
2012 vs. EU27+3
Score difference, national
2012 vs. national 2010
Externally connected -20% -17%
Broadband > 50Mbps 5% 7%
Single and unified wireless -14% 12%
Single EPR shared by all
departments25% -5%
PACS usage 24% 22%
ePrescribing 3% 37%
Integrated system for eReferral 1% 19%
Tele-monitoring -8% 3%
Exchange of clinical care
information with external providers6% 47%
Exchange of laboratory results with
external providers33% 27%
Exchange of radiology reports with
external providers30% -1%
Clear and structured rules on
access to clinical data10% 8%
EAS for disaster recovery in less
than 24 hours24% 15%

European Hospital Survey: Benchmarking Deployment of eHealth Services (2012-2013)
143
Position of the Czech eHealth profile within the EU27+3
270 The Czech Republic exceeded the European average score in eHealth profile indicators, in particular in the
areas of “Single EPR shared by all departments” (25%), “PACS usage” (24%), “Exchange of laboratory
results with external providers” (33%), “Exchange of radiology reports with external providers” (30%) and
“EAS for disaster recovery in less than 24 hours” (24%). Areas in which the country notably underperforms
the average were “Externally connected” (-20%), “Single and unified wireless” (-14%) and “Tele-
monitoring” (-8%).
Change in the Czech eHealth profile
271 The Czech eHealth profile has expanded considerably since 2010. Areas which have seen the most gain
include “ePrescribing” (+37%), “Exchange of clinical care information with external providers” (+47%) and
“Exchange of laboratory results with external providers” (+27%). In contrast, the Czech Republic reported
only three areas with negative growth; however in each of these areas the drop did not exceed 17%.
Figure 101: Czech acute hospitals eHealth profile by ownership
Note: Results are based on valid answers only - category bases may vary from the total reported here.
272 Some patterns can be seen with respect to ownership of acute hospitals and performance within eHealth.
Although the two Private not for profit hospitals scored 100% in three of the five categories (“Single EPR
shared by all departments”, “PACS usage” and “Clear and structured rules on access to clinical data”), they
did not have “Broadband > 50Mbps” and were the lowest performer (50%) in “Exchange of clinical care
information with external providers”. When comparing the Public and Private hospital segments, a
relatively narrow percentage point difference can be seen in four of the five categories, whereas a 47
percentage point difference was observed for “Broadband > 50Mbps”.
43%
81%
95%
62%
95%
58%
83%
100%
59%
96%
11%
73%
82%
70%
91%
0%
100%
100%
50%
100%
0% 20% 40% 60% 80% 100%
Broadband > 50Mbps
Single EPR shared by all departments
PACS usage
Exchange of CCI with ext. providers
Clear data access rules
Total (n=34-38) Public (n=22-25) Private (n=9-11) Private not for prof it (n=2)
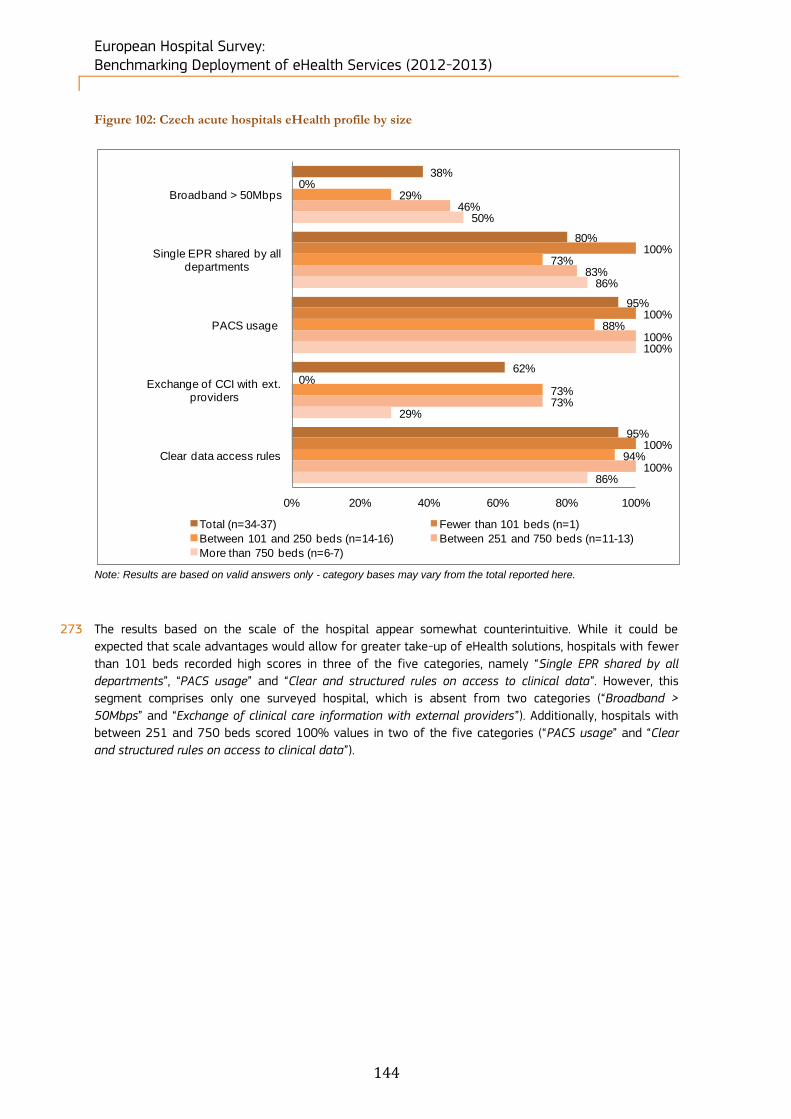
European Hospital Survey: Benchmarking Deployment of eHealth Services (2012-2013)
144
Figure 102: Czech acute hospitals eHealth profile by size
Note: Results are based on valid answers only - category bases may vary from the total reported here.
273 The results based on the scale of the hospital appear somewhat counterintuitive. While it could be
expected that scale advantages would allow for greater take-up of eHealth solutions, hospitals with fewer
than 101 beds recorded high scores in three of the five categories, namely “Single EPR shared by all
departments”, “PACS usage” and “Clear and structured rules on access to clinical data”. However, this
segment comprises only one surveyed hospital, which is absent from two categories (“Broadband >
50Mbps” and “Exchange of clinical care information with external providers”). Additionally, hospitals with
between 251 and 750 beds scored 100% values in two of the five categories (“PACS usage” and “Clear
and structured rules on access to clinical data”).
38%
80%
95%
62%
95%
0%
100%
100%
0%
100%
29%
73%
88%
73%
94%
46%
83%
100%
73%
100%
50%
86%
100%
29%
86%
0% 20% 40% 60% 80% 100%
Broadband > 50Mbps
Single EPR shared by all departments
PACS usage
Exchange of CCI with ext. providers
Clear data access rules
Total (n=34-37) Fewer than 101 beds (n=1)
Between 101 and 250 beds (n=14-16) Between 251 and 750 beds (n=11-13)
More than 750 beds (n=6-7)
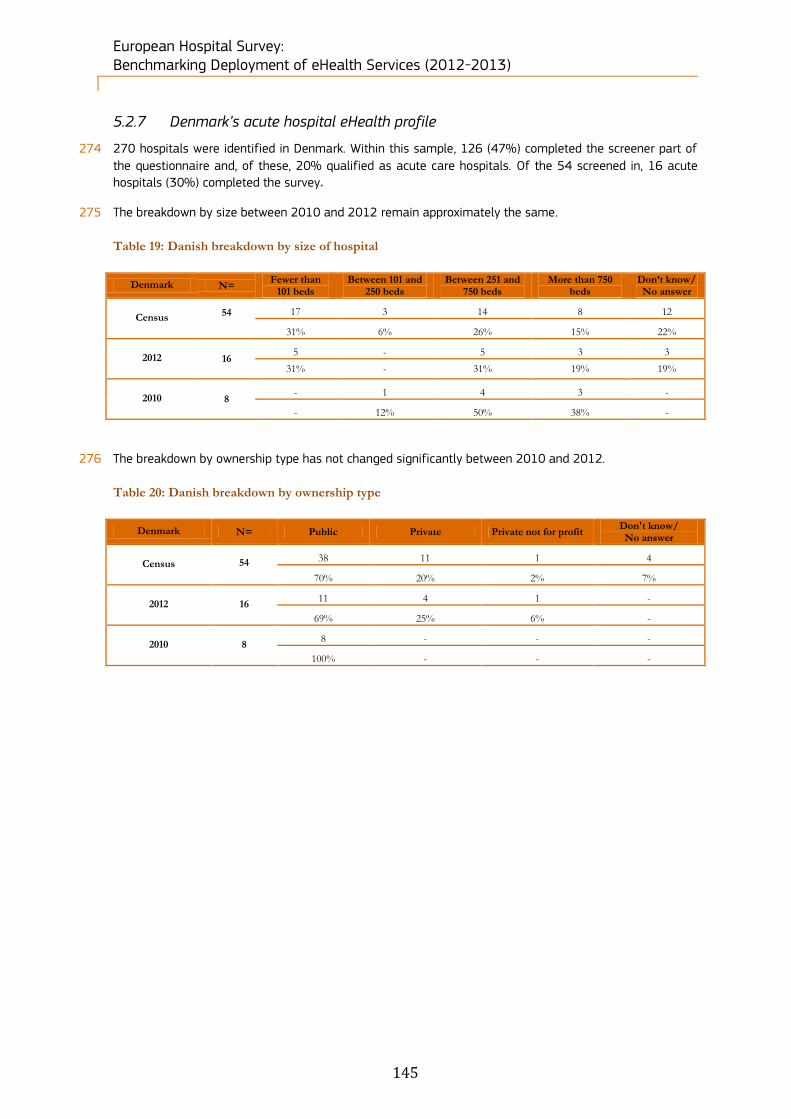
European Hospital Survey: Benchmarking Deployment of eHealth Services (2012-2013)
145
5.2.7 Denmark’s acute hospital eHealth profile
274 270 hospitals were identified in Denmark. Within this sample, 126 (47%) completed the screener part of
the questionnaire and, of these, 20% qualified as acute care hospitals. Of the 54 screened in, 16 acute
hospitals (30%) completed the survey.
275 The breakdown by size between 2010 and 2012 remain approximately the same.
Table 19: Danish breakdown by size of hospital
Denmark N= Fewer than
101 beds Between 101 and
250 beds Between 251 and
750 beds More than 750
beds Don’t know/ No answer
Census 54
17 3 14 8 12
31% 6% 26% 15% 22%
2012 16 5 - 5 3 3
31% - 31% 19% 19%
2010 8 - 1 4 3 -
- 12% 50% 38% -
276 The breakdown by ownership type has not changed significantly between 2010 and 2012.
Table 20: Danish breakdown by ownership type
Denmark N= Public Private Private not for profit Don't know/ No answer
Census 54
38 11 1 4
70% 20% 2% 7%
2012 16 11 4 1 -
69% 25% 6% -
2010 8 8 - - -
100% - - -

European Hospital Survey: Benchmarking Deployment of eHealth Services (2012-2013)
146
Figure 103: Danish acute hospital eHealth profile
Note: Results are based on valid answers only - bases (n) may differ from the ones reported here. The scoring scale from
0 to 5 points corresponds to an implementation rate from 0% to 100%.
0
1
2
3
4
5Externally connected
Broadband > 50Mbps
Single and unified wireless
Single EPR shared by all departments
PACS usage
ePrescribing
Integrated system for eReferral
Tele-monitoring
Exchange of clinical care information with external
providers
Exchange of laboratory results with external
providers
Exchange of radiology reports with external
providers
Clear and structured rules on access to clinical data
EAS for disaster recovery in less than 24 hours
EU27+3 (n=1753) Denmark 2010 (n=8) Denmark 2012 (n=16)
eHealth indicators - Denmark Score difference, national
2012 vs. EU27+3
Score difference, national
2012 vs. national 2010
Externally connected 5% -19%
Broadband > 50Mbps 52% -13%
Single and unified wireless 40% -20%
Single EPR shared by all
departments30% -13%
PACS usage 23% -6%
ePrescribing 47% -6%
Integrated system for eReferral 56% -6%
Tele-monitoring 9% -19%
Exchange of clinical care
information with external providers49% 13%
Exchange of laboratory results with
external providers32% -20%
Exchange of radiology reports with
external providers-9% -3%
Clear and structured rules on
access to clinical data15% 0%
EAS for disaster recovery in less
than 24 hours30% 4%

European Hospital Survey: Benchmarking Deployment of eHealth Services (2012-2013)
147
Position of the Danish eHealth profile in EU27+3
277 Denmark recorded strong eHealth indicators compared to the EU27+3 average. All Danish indicators were
higher than European averages except for “Exchange of radiology reports with external providers” (-9%).
The performances for “Integrated system for eReferral” and “Broadband > 50Mbps” were particularly
outstanding, registering respectively 56% and 52% higher than EU27+3 scores.
Change in the Danish eHealth profile
278 The lower average scores recorded by Denmark’s eHealth indicators between 2010 and 2012 can be
partly explained by the doubling of the sample and its increased representativeness. Indeed, all but two
eHealth indicators (“Exchange of clinical care information with external providers” and “EAS for disaster
recovery in less than 24 hours”) dropped over the period under review. However, the indicator “Clear and
structured rules on access to clinical data” remained unchanged at the maximum level. However, this
negative evolution has to be seen in the context of the already high 2010 scores for all indicators.
Figure 104: Danish acute hospitals eHealth profile by ownership
Note: Results are based on valid answers only - category bases may vary from the total reported here.
279 Danish eHealth indicators generally scored high across all ownership categories. While “Exchange of
clinical care information with external providers” and “Clear and structured rules on access to clinical data”
were the most widely implemented indicators across all hospital types, “Broadband > 50Mbps” was not
implemented at all by the sole Private hospital interviewed. All the other indicators registered high
implementation rates in both Private and Public hospitals (from 75% to 100%).
88%
87%
94%
100%
100%
100%
82%
100%
100%
100%
0%
100%
75%
100%
100%
100%
100%
100%
100%
100%
0% 20% 40% 60% 80% 100%
Broadband > 50Mbps
Single EPR shared by all departments
PACS usage
Echange of CCI with ext. Providers
Clear data access rules
Total (n=8-16) Public (n=6-11) Private (n=1-4) Private not for prof it (n=1)

European Hospital Survey: Benchmarking Deployment of eHealth Services (2012-2013)
148
Figure 105: Danish acute hospitals eHealth profile by size
Note: Results are based on valid answers only - category bases may vary from the total reported here.
280 In terms of hospital size, none of the respondents fell into the category “Between 101 and 250 beds”.
“Clear and structured rules on access to clinical data” and “Exchange of clinical care information with
external providers” recorded the highest implementation levels across all hospital size categories. This was
followed by “PACS usage” (94% average score).
Figure 106: Difference between NUTS 2 level and country-level results
Note: Results are based on valid answers only - bases may vary from the total observations reported here. No statistically significant difference between regions and the
national level (at the 95% and 99% confidence level).
281 In the context of the study, we have analysed two NUTS 2 regions for Denmark. Both the DK01 -
Hovedstaden and DK05 - Nordjylland region reported full implementation of the “Broadband > 50Mbps”,
“Single EPR shared by all departments”, “Exchange of clinical care information with external providers” and
“Clear and structured rules on access to clinical data” indicators. However the results for “Single EPR
shared by all departments” for the DK05 - Nordjylland region were below the national average (75%
compared to 87% at national level). None of these results reached statistical significance using a 95%
and 99% confidence interval.
88%
87%
94%
100%
100%
50%
100%
80%
100%
100%
0%
0%
0%
0%
0%
100%
100%
100%
100%
100%
100%
50%
100%
100%
100%
0% 20% 40% 60% 80% 100%
Broadband > 50Mbps
Single EPR shared by all departments
PACS usage
Echange of CCI with ext. Providers
Clear data access rules
Total (n=8-16) Fewer than 101 beds (n=2-5)
Between 101 and 250 beds (n=0) Between 251 and 750 beds (n=4-7)
More than 750 beds (n=2-4)
Broadband >
50Mbps
Single EPR
shared by all
departments
PACS usage
Exchange of
clinical care
information with
external providers
Clear and
structured rules
on access to
clinical data
Total Denmark (n=16) 88% 87% 94% 100% 100%
DK01 - Hovedstaden (n=5) 100% 100% 100% 100% 100%
DK05 - Nordjylland (n=4) 100% 75% 100% 100% 100%

European Hospital Survey: Benchmarking Deployment of eHealth Services (2012-2013)
149
5.2.8 Estonia’s acute hospital eHealth profile
282 136 hospitals were identified in Estonia. Within this sample, 90 (66%) completed the screener part of the
questionnaire and, of these, 18% qualified as acute care hospitals. Of the 25 screened in,
12 acute hospitals (48%) completed the survey.
283 The number of intermediate size hospitals has increased significantly between 2010 and 2012.
Table 21: Estonian breakdown by size of hospital
Estonia N= Fewer than
101 beds Between 101 and
250 beds Between 251 and
750 beds More than 750
beds Don’t know/ No answer
Census 25
4 10 5 4 2
16% 40% 20% 16% 8%
2012 12 1 5 4 2 -
8% 42% 33% 17% -
2010 3 - 1 - 2 -
- 33% - 67% -
284 The number of Public hospitals in Estonia has more than tripled between 2010 and 2012.
Table 22: Estonian breakdown by ownership type
Estonia N= Public Private Private not for profit Don't know/ No answer
Census 25
21 1 2 1
84% 4% 8% 4%
2012 12 11 - 1 -
92% - 8% -
2010 3 3 - - -
100% - - -

European Hospital Survey: Benchmarking Deployment of eHealth Services (2012-2013)
150
Figure 107: Estonian acute hospital eHealth profile
Note: Results are based on valid answers only - bases (n) may differ from the ones reported here. The scoring scale from 0 to 5 points corresponds to an
implementation rate from 0% to 100%.
0
1
2
3
4
5Externally connected
Broadband > 50Mbps
Single and unified wireless
Single EPR shared by all departments
PACS usage
ePrescribing
Integrated system for eReferralTele-monitoring
Exchange of clinical care information with external
providers
Exchange of laboratory results with external providers
Exchange of radiology reports with external providers
Clear and structured rules on access to clinical data
EAS for disaster recovery in less than 24 hours
EU27+3 (n=1753) Estonia 2010 (n=3) Estonia 2012 (n=12)
eHealth indicators - Estonia Score difference, national
2012 vs. EU27+3
Score difference, national
2012 vs. national 2010
Externally connected 24% 33%
Broadband > 50Mbps 37% 39%
Single and unified wireless -7% 0%
Single EPR shared by all
departments43% 33%
PACS usage 29% 0%
ePrescribing 53% 0%
Integrated system for eReferral 46% 17%
Tele-monitoring 6% 17%
Exchange of clinical care information
with external providers36% -8%
Exchange of laboratory results with
external providers40% 42%
Exchange of radiology reports with
external providers45% 33%
Clear and structured rules on access
to clinical data6% -8%
EAS for disaster recovery in less
than 24 hours2% -17%
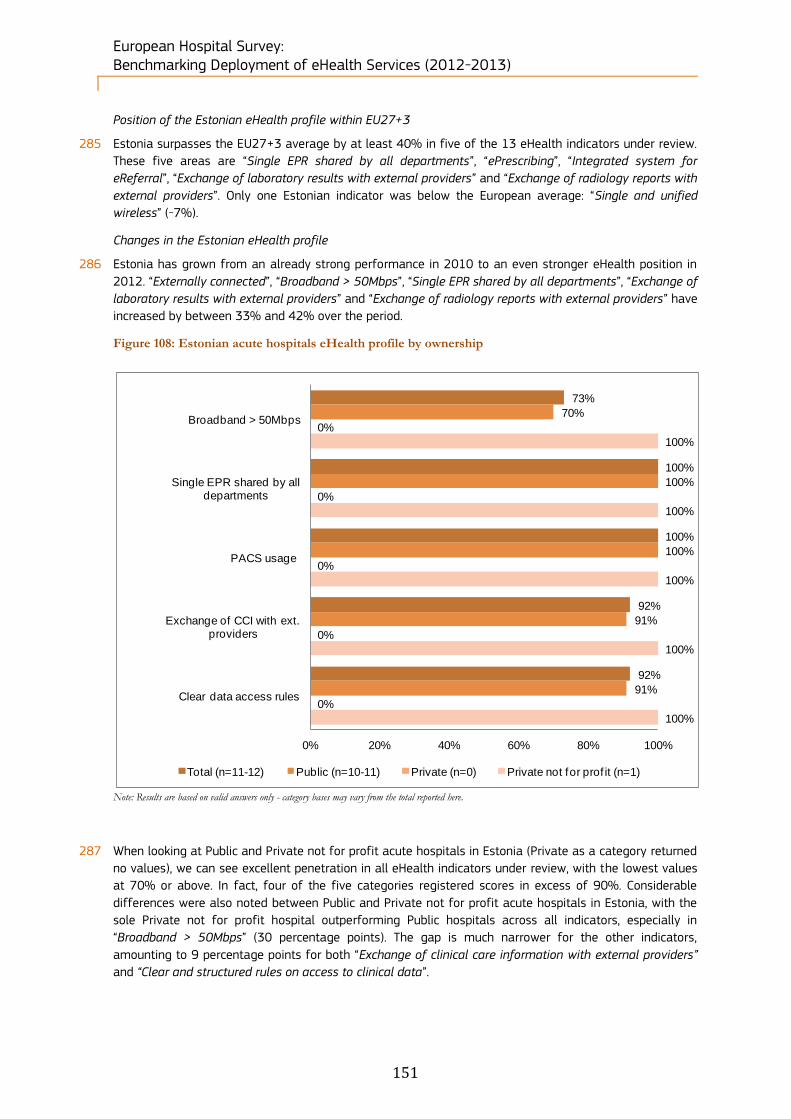
European Hospital Survey: Benchmarking Deployment of eHealth Services (2012-2013)
151
Position of the Estonian eHealth profile within EU27+3
285 Estonia surpasses the EU27+3 average by at least 40% in five of the 13 eHealth indicators under review.
These five areas are “Single EPR shared by all departments”, “ePrescribing”, “Integrated system for
eReferral”, “Exchange of laboratory results with external providers” and “Exchange of radiology reports with
external providers”. Only one Estonian indicator was below the European average: “Single and unified
wireless” (-7%).
Changes in the Estonian eHealth profile
286 Estonia has grown from an already strong performance in 2010 to an even stronger eHealth position in
2012. “Externally connected”, “Broadband > 50Mbps”, “Single EPR shared by all departments”, “Exchange of
laboratory results with external providers” and “Exchange of radiology reports with external providers” have
increased by between 33% and 42% over the period.
Figure 108: Estonian acute hospitals eHealth profile by ownership
Note: Results are based on valid answers only - category bases may vary from the total reported here.
287 When looking at Public and Private not for profit acute hospitals in Estonia (Private as a category returned
no values), we can see excellent penetration in all eHealth indicators under review, with the lowest values
at 70% or above. In fact, four of the five categories registered scores in excess of 90%. Considerable
differences were also noted between Public and Private not for profit acute hospitals in Estonia, with the
sole Private not for profit hospital outperforming Public hospitals across all indicators, especially in
“Broadband > 50Mbps” (30 percentage points). The gap is much narrower for the other indicators,
amounting to 9 percentage points for both “Exchange of clinical care information with external providers”
and “Clear and structured rules on access to clinical data”.
73%
100%
100%
92%
92%
70%
100%
100%
91%
91%
0%
0%
0%
0%
0%
100%
100%
100%
100%
100%
0% 20% 40% 60% 80% 100%
Broadband > 50Mbps
Single EPR shared by all departments
PACS usage
Exchange of CCI with ext. providers
Clear data access rules
Total (n=11-12) Public (n=10-11) Private (n=0) Private not for prof it (n=1)

European Hospital Survey: Benchmarking Deployment of eHealth Services (2012-2013)
152
Figure 109: Estonian acute hospitals eHealth profile by size
Note: Results are based on valid answers only - category bases may vary from the total reported here.
288 Estonia has returned no values for acute hospitals with under 101 beds. However, two of the five
indicators (“Single EPR shared by all departments” and “PACS usage”) were fully implemented across the
remaining categories. After this we can see no clear pattern, as for the remaining three categories, being
“Broadband > 50Mbps”, “Exchange of clinical care information with external providers” and “Clear and
structured rules on access to clinical data”, we can see each segment of the acute hospital population as
divided by scale underperforms in at least one category out of five.
73%
100%
100%
92%
92%
0%
0%
0%
0%
0%
60%
100%
100%
100%
100%
75%
100%
100%
100%
75%
100%
100%
100%
67%
100%
0% 20% 40% 60% 80% 100%
Broadband > 50Mbps
Single EPR shared by all departments
PACS usage
Exchange of CCI with ext. providers
Clear data access rules
Total (n=11-12) Fewer than 101 beds (n=0)
Between 101 and 250 beds (n=5) Between 251 and 750 beds (n=4)
More than 750 beds (n=2-3)
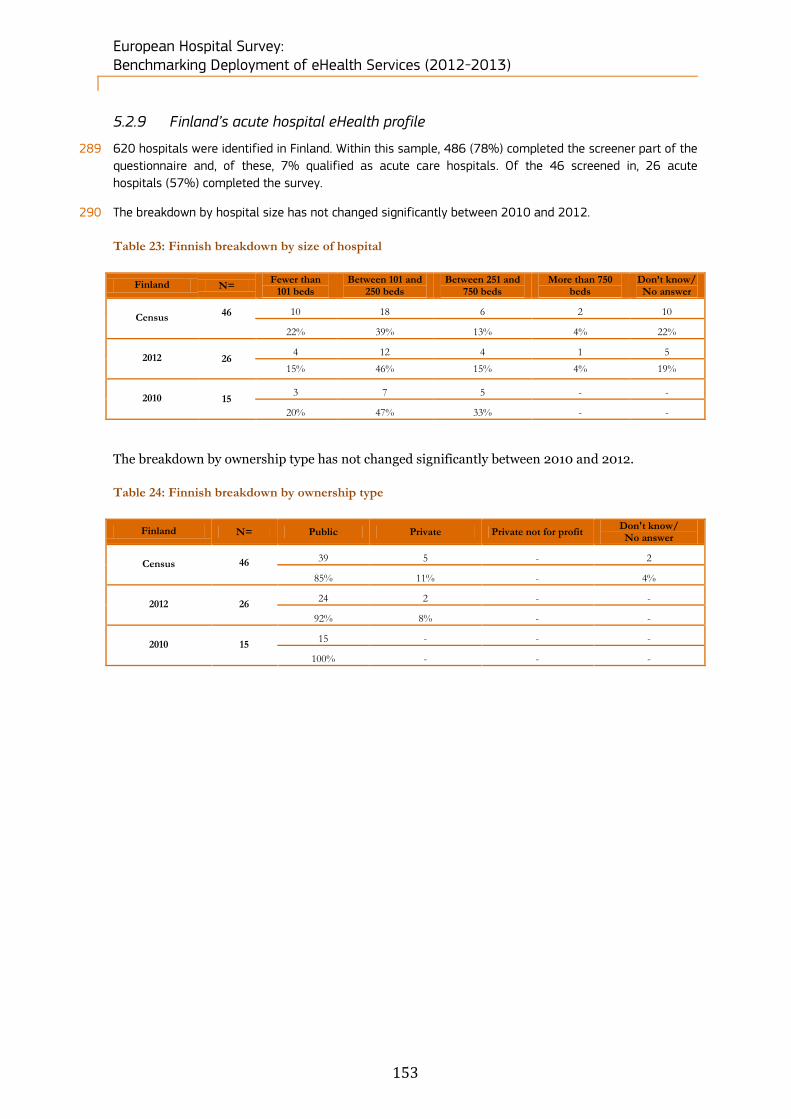
European Hospital Survey: Benchmarking Deployment of eHealth Services (2012-2013)
153
5.2.9 Finland’s acute hospital eHealth profile
289 620 hospitals were identified in Finland. Within this sample, 486 (78%) completed the screener part of the
questionnaire and, of these, 7% qualified as acute care hospitals. Of the 46 screened in, 26 acute
hospitals (57%) completed the survey.
290 The breakdown by hospital size has not changed significantly between 2010 and 2012.
Table 23: Finnish breakdown by size of hospital
Finland N= Fewer than
101 beds Between 101 and
250 beds Between 251 and
750 beds More than 750
beds Don’t know/ No answer
Census 46
10 18 6 2 10
22% 39% 13% 4% 22%
2012 26 4 12 4 1 5
15% 46% 15% 4% 19%
2010 15 3 7 5 - -
20% 47% 33% - -
The breakdown by ownership type has not changed significantly between 2010 and 2012.
Table 24: Finnish breakdown by ownership type
Finland N= Public Private Private not for profit Don't know/ No answer
Census 46
39 5 - 2
85% 11% - 4%
2012 26 24 2 - -
92% 8% - -
2010 15 15 - - -
100% - - -

European Hospital Survey: Benchmarking Deployment of eHealth Services (2012-2013)
154
Figure 110: Finnish acute hospital eHealth profile
Note: Results are based on valid answers only - bases (n) may differ from the ones reported here. The scoring scale from 0 to 5 points corresponds to an
implementation rate from 0% to 100%.
0
1
2
3
4
5Externally connected
Broadband > 50Mbps
Single and unified wireless
Single EPR shared by all departments
PACS usage
ePrescribing
Integrated system for eReferralTele-monitoring
Exchange of clinical care information with external
providers
Exchange of laboratory results with external providers
Exchange of radiology reports with external providers
Clear and structured rules on access to clinical data
EAS for disaster recovery in less than 24 hours
EU27+3 (n=1753) Finland 2010 (n=15) Finland 2012 (n=26)
eHealth indicators - Finland Score difference, national
2012 vs. EU27+3
Score difference, national
2012 vs. national 2010
Externally connected 8% -15%
Broadband > 50Mbps 56% -2%
Single and unified wireless 25% -15%
Single EPR shared by all
departments23% -7%
PACS usage 25% -4%
ePrescribing 34% 74%
Integrated system for eReferral 47% -9%
Tele-monitoring 9% -4%
Exchange of clinical care
information with external providers25% -12%
Exchange of laboratory results with
external providers26% -23%
Exchange of radiology reports with
external providers29% -9%
Clear and structured rules on
access to clinical data15% 0%
EAS for disaster recovery in less
than 24 hours2% 10%

European Hospital Survey: Benchmarking Deployment of eHealth Services (2012-2013)
155
Position of the Finnish eHealth profile in EU27+3
291 Finland’s eHealth profile in the European context can be currently considered to be excellent. It displays
high value positive difference in every single one of the 13 values examined – essentially outperforming
the EU average in all areas. In addition to this, Finland’s outperformance is relatively evenly distributed.
The two highest performing areas, “Broadband > 50Mbps” and “Integrated system for eReferral” score
56% and 47% respectively.
Change in the Finnish eHealth profile
292 Less positive for Finland is the decrease in eHealth values in the overall period between 2010 and 2012: it
has in fact recorded negative growth in 11 of 13 areas. Mostly the negative growth has been less than -
15%; however the sharp increase in the area of “ePrescribing” (74% growth) and to a lesser extent “EAS
for disaster recovery in less than 24 hours” (10% growth) have been enough to offset the losses in other
categories.
Figure 111: Finnish acute hospitals eHealth profile by ownership
Note: Results are based on valid answers only - category bases may vary from the total reported here.
293 Finland has returned values for only two of our three categories of acute hospital, with Private not for
profit not represented in any of the eHealth areas we examined. Of the two categories remaining, Finnish
Private hospitals outperform their Public counterparts in four of the five areas under examination, scoring
100% penetration on “Broadband > 50Mbps”, “Single EPR shared by all departments”, “PACS usage” and
“Clear and structured rules on access to clinical data”. Public hospitals, by contrast, range from 78% to
96% in four of five categories, retuning a 100% score only in “Clear and structured rules on access to
clinical data”.
92%
80%
96%
81%
100%
91%
78%
96%
83%
100%
100%
100%
100%
50%
100%
0%
0%
0%
0%
0%
0% 20% 40% 60% 80% 100%
Broadband > 50Mbps
Single EPR shared by all departments
PACS usage
Echange of CCI with ext. providers
Clear data access rules
Total (n=24-26) Public (n=22-24) Private (n=2) Private not for profit (n=0)

European Hospital Survey: Benchmarking Deployment of eHealth Services (2012-2013)
156
Figure 112: Finnish acute hospitals eHealth profile by size
Note: Results are based on valid answers only - category bases may vary from the total reported here.
294 A definite scale advantage appears to be relevant when examining Finnish acute hospitals in terms of size.
Hospitals which have in excess of 750 beds score 100% in four of five categories, while hospitals with
between 251 and 750 beds score 100% in three of five categories. Unusually, hospitals with fewer than
101 beds also score 100% in three of five categories, however the next largest segment (between 101
and 250 beds) only scores 100% in a single category. Also, there are wide variations in scores for two
areas, “Single EPR shared by all departments” and “Exchange of clinical care information with external
providers”, in which values range from 50% to 100%, but with no pattern evident.
91%
83%
96%
79%
100%
100%
75%
100%
50%
100%
91%
92%
92%
77%
100%
80%
80%
100%
100%
100%
100%
50%
100%
100%
100%
0% 20% 40% 60% 80% 100%
Broadband > 50Mbps
Single EPR shared by all departments
PACS usage
Echange of CCI with ext. providers
Clear data access rules
Total (n=22-24) Fewer than 101 beds (n=4)
Between 101 and 250 beds (n=11-13) Between 251 and 750 beds (n=5)
More than 750 beds (n=2)
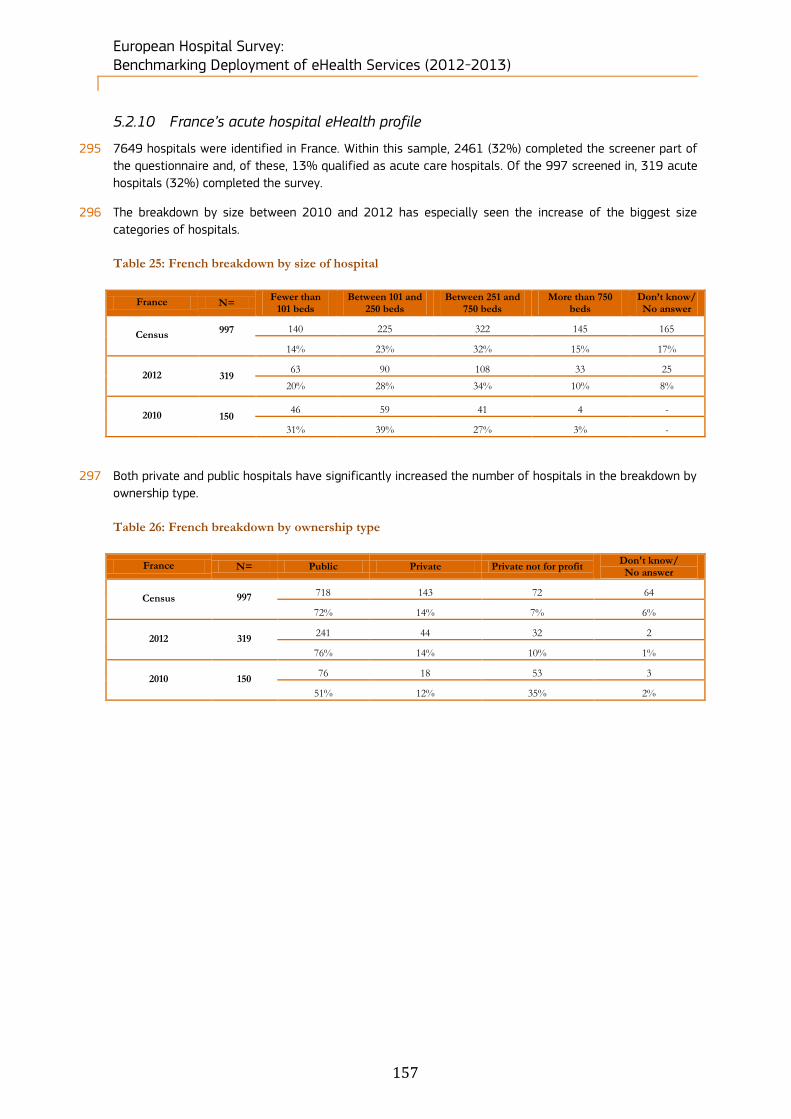
European Hospital Survey: Benchmarking Deployment of eHealth Services (2012-2013)
157
5.2.10 France’s acute hospital eHealth profile
295 7649 hospitals were identified in France. Within this sample, 2461 (32%) completed the screener part of
the questionnaire and, of these, 13% qualified as acute care hospitals. Of the 997 screened in, 319 acute
hospitals (32%) completed the survey.
296 The breakdown by size between 2010 and 2012 has especially seen the increase of the biggest size
categories of hospitals.
Table 25: French breakdown by size of hospital
France N= Fewer than
101 beds Between 101 and
250 beds Between 251 and
750 beds More than 750
beds Don’t know/ No answer
Census 997
140 225 322 145 165
14% 23% 32% 15% 17%
2012 319 63 90 108 33 25
20% 28% 34% 10% 8%
2010 150 46 59 41 4 -
31% 39% 27% 3% -
297 Both private and public hospitals have significantly increased the number of hospitals in the breakdown by
ownership type.
Table 26: French breakdown by ownership type
France N= Public Private Private not for profit Don't know/ No answer
Census 997
718 143 72 64
72% 14% 7% 6%
2012 319 241 44 32 2
76% 14% 10% 1%
2010 150 76 18 53 3
51% 12% 35% 2%
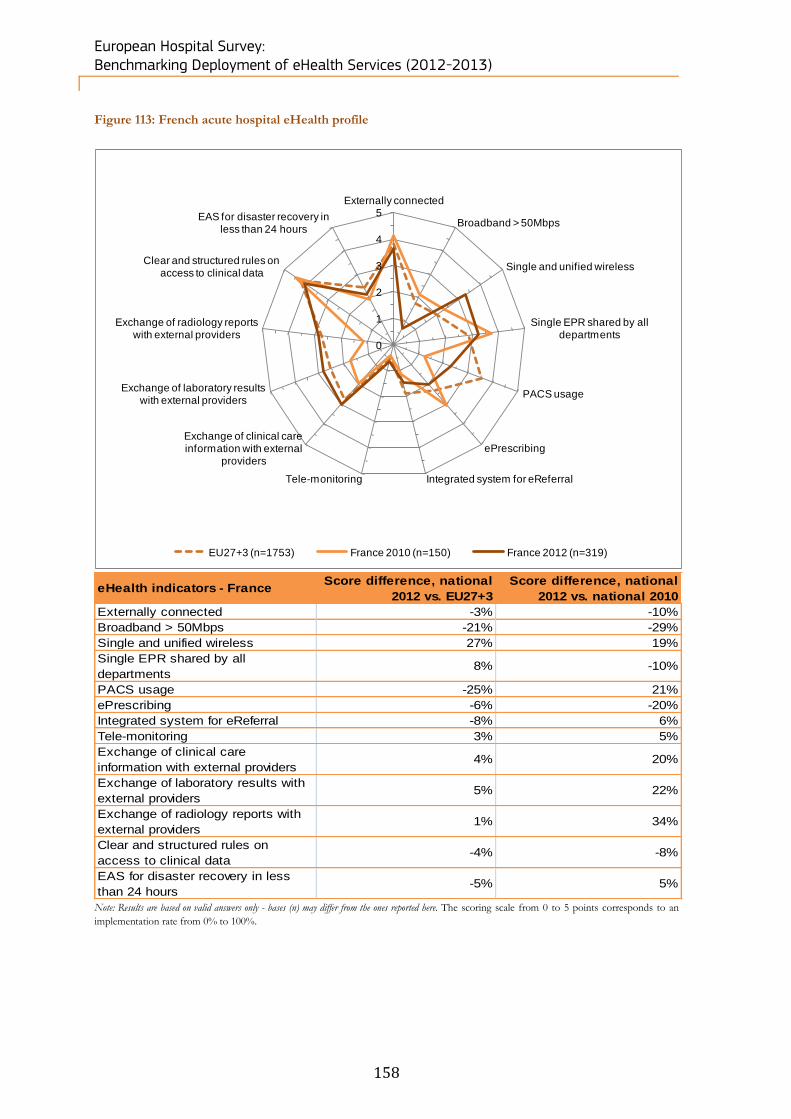
European Hospital Survey: Benchmarking Deployment of eHealth Services (2012-2013)
158
Figure 113: French acute hospital eHealth profile
Note: Results are based on valid answers only - bases (n) may differ from the ones reported here. The scoring scale from 0 to 5 points corresponds to an
implementation rate from 0% to 100%.
0
1
2
3
4
5Externally connected
Broadband > 50Mbps
Single and unified wireless
Single EPR shared by all departments
PACS usage
ePrescribing
Integrated system for eReferralTele-monitoring
Exchange of clinical care information with external
providers
Exchange of laboratory results with external providers
Exchange of radiology reports with external providers
Clear and structured rules on access to clinical data
EAS for disaster recovery in less than 24 hours
EU27+3 (n=1753) France 2010 (n=150) France 2012 (n=319)
eHealth indicators - France Score difference, national
2012 vs. EU27+3
Score difference, national
2012 vs. national 2010
Externally connected -3% -10%
Broadband > 50Mbps -21% -29%
Single and unified wireless 27% 19%
Single EPR shared by all
departments8% -10%
PACS usage -25% 21%
ePrescribing -6% -20%
Integrated system for eReferral -8% 6%
Tele-monitoring 3% 5%
Exchange of clinical care
information with external providers4% 20%
Exchange of laboratory results with
external providers5% 22%
Exchange of radiology reports with
external providers1% 34%
Clear and structured rules on
access to clinical data-4% -8%
EAS for disaster recovery in less
than 24 hours-5% 5%
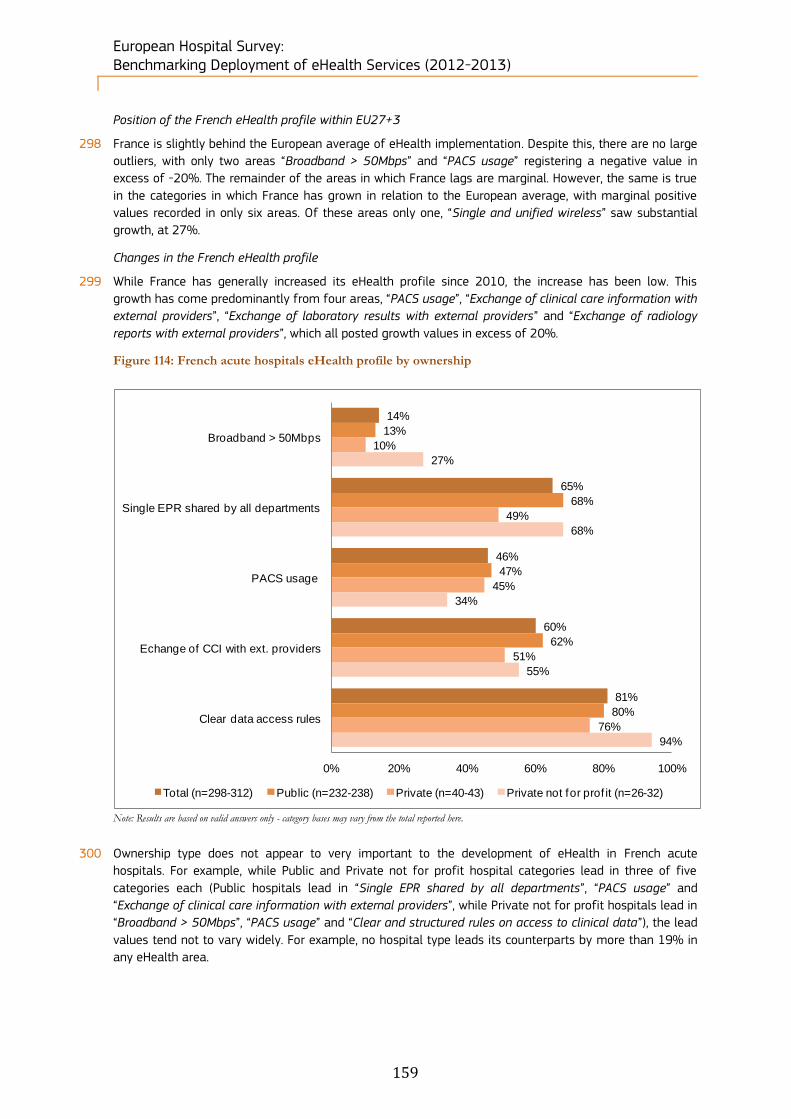
European Hospital Survey: Benchmarking Deployment of eHealth Services (2012-2013)
159
Position of the French eHealth profile within EU27+3
298 France is slightly behind the European average of eHealth implementation. Despite this, there are no large
outliers, with only two areas “Broadband > 50Mbps” and “PACS usage” registering a negative value in
excess of -20%. The remainder of the areas in which France lags are marginal. However, the same is true
in the categories in which France has grown in relation to the European average, with marginal positive
values recorded in only six areas. Of these areas only one, “Single and unified wireless” saw substantial
growth, at 27%.
Changes in the French eHealth profile
299 While France has generally increased its eHealth profile since 2010, the increase has been low. This
growth has come predominantly from four areas, “PACS usage”, “Exchange of clinical care information with
external providers”, “Exchange of laboratory results with external providers” and “Exchange of radiology
reports with external providers”, which all posted growth values in excess of 20%.
Figure 114: French acute hospitals eHealth profile by ownership
Note: Results are based on valid answers only - category bases may vary from the total reported here.
300 Ownership type does not appear to very important to the development of eHealth in French acute
hospitals. For example, while Public and Private not for profit hospital categories lead in three of five
categories each (Public hospitals lead in “Single EPR shared by all departments”, “PACS usage” and
“Exchange of clinical care information with external providers”, while Private not for profit hospitals lead in
“Broadband > 50Mbps”, “PACS usage” and “Clear and structured rules on access to clinical data”), the lead
values tend not to vary widely. For example, no hospital type leads its counterparts by more than 19% in
any eHealth area.
14%
65%
46%
60%
81%
13%
68%
47%
62%
80%
10%
49%
45%
51%
76%
27%
68%
34%
55%
94%
0% 20% 40% 60% 80% 100%
Broadband > 50Mbps
Single EPR shared by all departments
PACS usage
Echange of CCI with ext. providers
Clear data access rules
Total (n=298-312) Public (n=232-238) Private (n=40-43) Private not for prof it (n=26-32)

European Hospital Survey: Benchmarking Deployment of eHealth Services (2012-2013)
160
Figure 115: French acute hospitals eHealth profile by size
Note: Results are based on valid answers only - category bases may vary from the total reported here.
301 In contrast to ownership type (see above), when scale considerations are taken into account, we can see
that a very definite advantage is enjoyed by French acute hospitals which have more than 750 beds. This
category of hospital leads in all five areas examined, and additionally leads by significant margins in three
of these categories (14% in “Broadband > 50Mbps”, 24% in “PACS usage” and 32% in “Exchange of clinical
care information with external providers”). Even more significantly, the link between increased scale and
greater eHealth capabilities is evident in all the categories, with smaller hospital segments recording
progressively lower capabilities in each category under review.
14%
65%
46%
59%
81%
3%
49%
30%
39%
67%
13%
64%
35%
53%
77%
14%
66%
49%
58%
83%
28%
73%
70%
91%
93%
0% 20% 40% 60% 80% 100%
Broadband > 50Mbps
Single EPR shared by all departments
PACS usage
Echange of CCI with ext. providers
Clear data access rules
Total (n=293-309) Fewer than 101 beds (n=35-37)
Between 101 and 250 beds (n=76-88) Between 251 and 750 beds (n=137-139)
More than 750 beds (n=43-46)
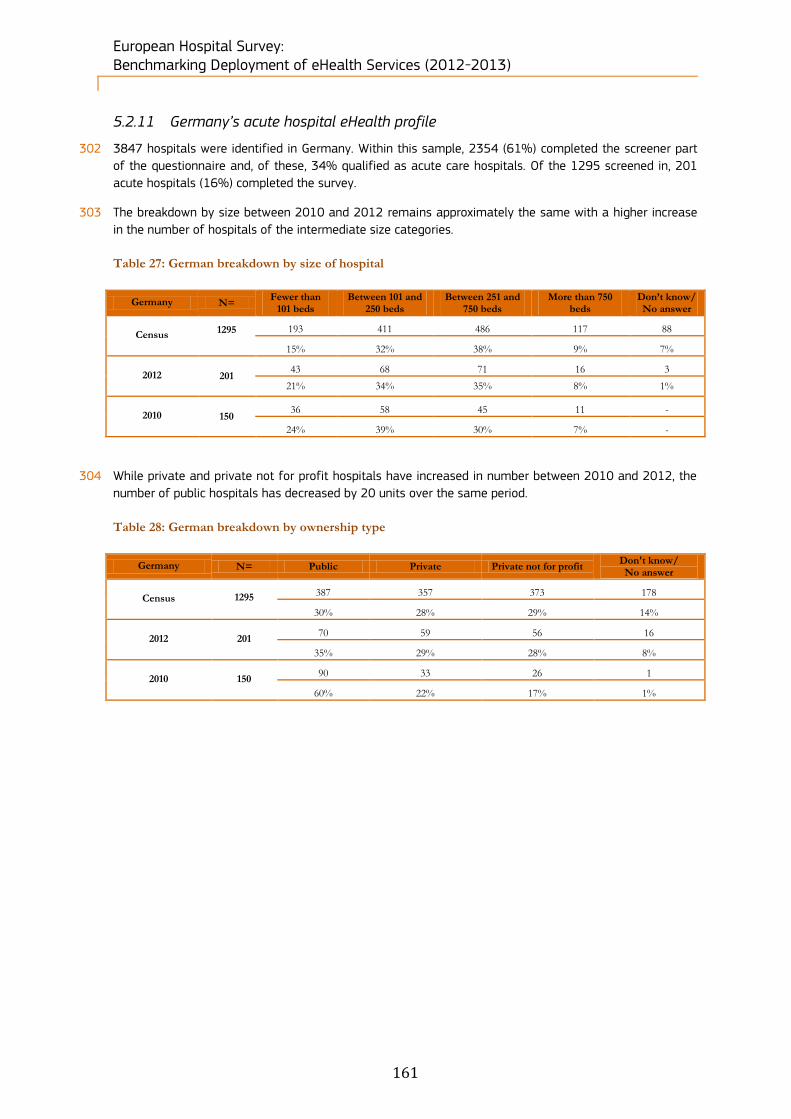
European Hospital Survey: Benchmarking Deployment of eHealth Services (2012-2013)
161
5.2.11 Germany’s acute hospital eHealth profile
302 3847 hospitals were identified in Germany. Within this sample, 2354 (61%) completed the screener part
of the questionnaire and, of these, 34% qualified as acute care hospitals. Of the 1295 screened in, 201
acute hospitals (16%) completed the survey.
303 The breakdown by size between 2010 and 2012 remains approximately the same with a higher increase
in the number of hospitals of the intermediate size categories.
Table 27: German breakdown by size of hospital
Germany N= Fewer than
101 beds Between 101 and
250 beds Between 251 and
750 beds More than 750
beds Don’t know/ No answer
Census 1295
193 411 486 117 88
15% 32% 38% 9% 7%
2012 201 43 68 71 16 3
21% 34% 35% 8% 1%
2010 150 36 58 45 11 -
24% 39% 30% 7% -
304 While private and private not for profit hospitals have increased in number between 2010 and 2012, the
number of public hospitals has decreased by 20 units over the same period.
Table 28: German breakdown by ownership type
Germany N= Public Private Private not for profit Don't know/ No answer
Census 1295
387 357 373 178
30% 28% 29% 14%
2012 201 70 59 56 16
35% 29% 28% 8%
2010 150 90 33 26 1
60% 22% 17% 1%

European Hospital Survey: Benchmarking Deployment of eHealth Services (2012-2013)
162
Figure 116: German acute hospital eHealth profile
eHealth indicators - Germany score difference 2012-
Eu27+3score difference 2012-2010
Externally connected 8% -2%
Broadband > 50Mbps -5% -10%
Single and unified wireless -13% 4%
Single EPR shared by all
departments6% 1%
PACS usage 6% 13%
ePrescribing -37% 3%
Integrated system for eReferral -15% 13%
Tele-monitoring -7% 2%
Exchange of clinical care
information with external providers-2% 22%
Exchange of laboratory results with
external providers-14% 11%
Exchange of radiology reports with
external providers6% 23%
Clear and structured rules on
access to clinical data6% -5%
EAS for disaster recovery in less
than 24 hours7% -6%
Note: Results are based on valid answers only - bases (n) may differ from the ones reported here. The scoring scale from 0 to 5 points corresponds to an
implementation rate from 0% to 100%.
0
1
2
3
4
5Externally connected
Broadband > 50Mbps
Single and unified wireless
Single EPR shared by all departments
PACS usage
ePrescribing
Integrated system for eReferralTele-monitoring
Exchange of clinical care information with external
providers
Exchange of laboratory results with external providers
Exchange of radiology reports with external providers
Clear and structured rules on access to clinical data
EAS for disaster recovery in less than 24 hours
EU27+3 (n=1753) Germany 2010 (n=150) Germany 2012 (n=201)
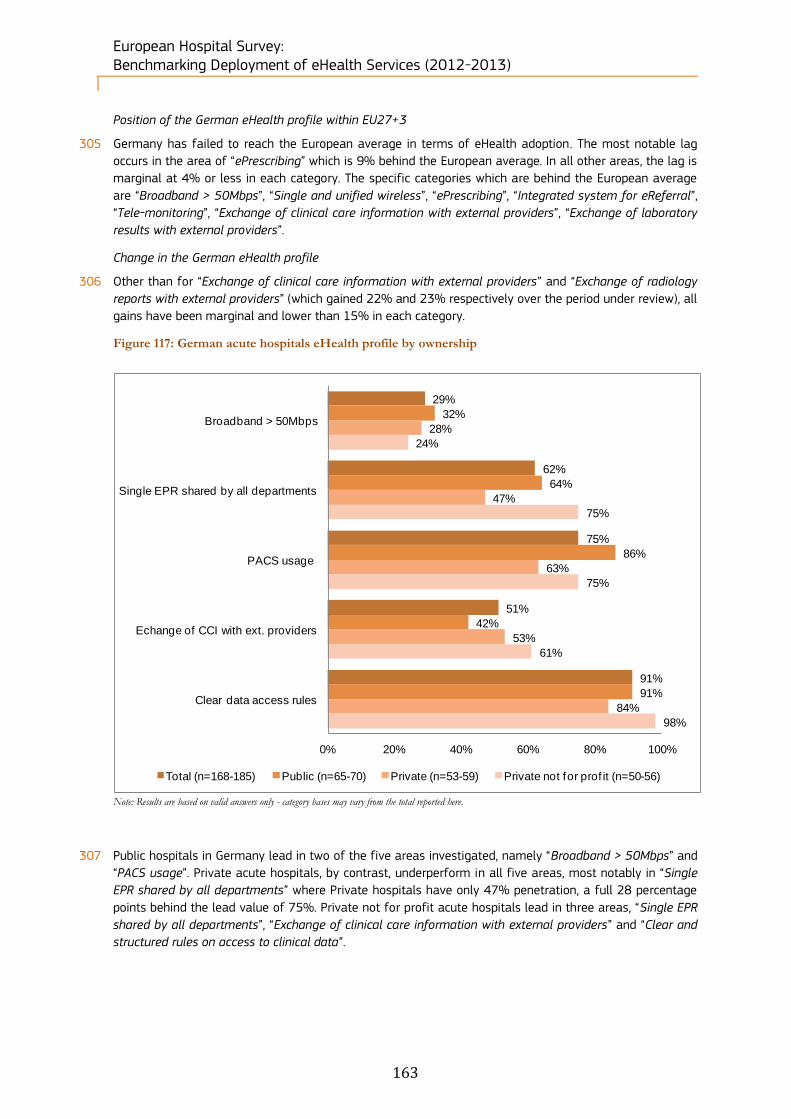
European Hospital Survey: Benchmarking Deployment of eHealth Services (2012-2013)
163
Position of the German eHealth profile within EU27+3
305 Germany has failed to reach the European average in terms of eHealth adoption. The most notable lag
occurs in the area of “ePrescribing” which is 9% behind the European average. In all other areas, the lag is
marginal at 4% or less in each category. The specific categories which are behind the European average
are “Broadband > 50Mbps”, “Single and unified wireless”, “ePrescribing”, “Integrated system for eReferral”,
“Tele-monitoring”, “Exchange of clinical care information with external providers”, “Exchange of laboratory
results with external providers”.
Change in the German eHealth profile
306 Other than for “Exchange of clinical care information with external providers” and “Exchange of radiology
reports with external providers” (which gained 22% and 23% respectively over the period under review), all
gains have been marginal and lower than 15% in each category.
Figure 117: German acute hospitals eHealth profile by ownership
Note: Results are based on valid answers only - category bases may vary from the total reported here.
307 Public hospitals in Germany lead in two of the five areas investigated, namely “Broadband > 50Mbps” and
“PACS usage”. Private acute hospitals, by contrast, underperform in all five areas, most notably in “Single
EPR shared by all departments” where Private hospitals have only 47% penetration, a full 28 percentage
points behind the lead value of 75%. Private not for profit acute hospitals lead in three areas, “Single EPR
shared by all departments”, “Exchange of clinical care information with external providers” and “Clear and
structured rules on access to clinical data”.
29%
62%
75%
51%
91%
32%
64%
86%
42%
91%
28%
47%
63%
53%
84%
24%
75%
75%
61%
98%
0% 20% 40% 60% 80% 100%
Broadband > 50Mbps
Single EPR shared by all departments
PACS usage
Echange of CCI with ext. providers
Clear data access rules
Total (n=168-185) Public (n=65-70) Private (n=53-59) Private not for prof it (n=50-56)

European Hospital Survey: Benchmarking Deployment of eHealth Services (2012-2013)
164
Figure 118: German acute hospitals eHealth profile by size
Note: Results are based on valid answers only - category bases may vary from the total reported here.
308 In Germany, scale advantages can be observed across all eHealth indicators under review. In all five areas,
“Broadband > 50Mbps”, “Single EPR shared by all departments”, “PACS usage”, “Exchange of clinical care
information with external providers” and “Clear and structured rules on access to clinical data”, acute
hospitals over 750 beds in size led. For smaller size segments, the ranking is also commensurate with
scale: the larger the hospital, the better it is equipped for eHealth (although in some cases the advantage
was marginal).
Figure 119: Difference between NUTS 1 level and country-level results
Note: Results are based on valid answers only - bases may vary from the total observations reported here. No statistically significant difference between regions and the
national level (at the 95% and 99% confidence level).
30%
63%
76%
53%
91%
15%
47%
49%
31%
80%
28%
62%
72%
57%
91%
29%
68%
86%
58%
94%
59%
71%
100%
64%
100%
0% 20% 40% 60% 80% 100%
Broadband > 50Mbps
Single EPR shared by all departments
PACS usage
Echange of CCI with ext. providers
Clear data access rules
Total (n=182-200) Fewer than 101 beds (n=26-35)Between 101 and 250 beds (n=63-69) Between 251 and 750 beds (n=69-74)More than 750 beds (n=21-22)
RegionsBroadband >
50Mbps
Single EPR
shared by all
departments
PACS usage
Exchange of
clinical care
information with
external providers
Clear and structured
rules on access to
clinical data
Total Germany (n=201) 31% 63% 77% 54% 91%
DE1 - BADEN-WÜRTTEMBERG (n=29) 43% 62% 72% 65% 93%
DE2 - BAYERN (n=49) 22% 59% 73% 45% 90%
DE3 - BERLIN (n=4) 50% 67% 50% 33% 100%
DE4 - BRANDENBURG (n=5) - 60% 100% 40% 100%
DE6 - HAMBURG (n=4) 50% 100% 100% 50% 100%
DE7 - HESSEN (n=16) 20% 62% 75% 40% 87%
DE8 - MECKLENBURG-VORPOMMERN (n=3) 33% 50% 100% 67% 100%
DE9 - NIEDERSACHSEN (n=19) 28% 50% 74% 53% 78%
DEA - NORDRHEIN-WESTFALEN (n=37) 38% 74% 73% 51% 91%
DEB - RHEINLAND-PFALZ (n=8) - 43% 88% 43% 100%
DEC - SAARLAND (n=1) 100% - 100% 100% 100%
DED - SACHSEN (n=6) 33% 50% 100% 50% 100%
DEE - SACHSEN-ANHALT (n=4) 50% 75% 100% 75% 75%
DEF - SCHLESWIG-HOLSTEIN (n=10) 33% 67% 70% 90% 100%
DEG - THÜRINGEN (n=6) 20% 83% 83% 80% 100%

European Hospital Survey: Benchmarking Deployment of eHealth Services (2012-2013)
165
309 In the context of the study, we have analysed 16 NUTS 1 regions for Germany. Two regions, DE6 -
Hamburg and DEC - Saarland, scored the highest, scoring on average 80% and 100% at combined level.
DE6 - Hamburg scored 50% in “Broadband > 50Mbps”, 50% in “Exchange of clinical care information with
external providers” and 100% “Single EPR shared by all departments”, “PACS usage” and “Clear and
structured rules on access to clinical data”. DEC - Saarland by contrast scored 100% in four areas
“Broadband >50 Mbps”, “PACS usage”, “Exchange of clinical care information with external providers” and
“Clear and structured rules on access to clinical data” but zero for “Single EPR shared by all departments”,
although this region is represented by only one hospital.
5.2.12 Greece’s acute hospital eHealth profile
310 687 hospitals were identified in Greece. Within this sample, 398 (58%) completed the screener part of the
questionnaire and, of these, 17% qualified as acute care hospitals. Of the 120 screened in, 68 acute
hospitals (57%) completed the survey.
311 The breakdown by size points to a significant increase in the number of hospitals with fewer than 101
beds and with between 251 and 750 beds between 2010 and 2012.
Table 29: Greek breakdown by size of hospital
Greece N= Fewer than
101 beds Between 101 and
250 beds Between 251 and
750 beds More than 750
beds Don’t know/ No answer
Census 120
32 28 25 3 32
27% 23% 21% 3% 27%
2012 68 18 16 18 2 14
26% 24% 26% 3% 21%
2010 26 5 11 7 3 -
19% 42% 27% 12% -
312 The number of Greek public and private hospitals has increased significantly between 2010 and 2012.
Table 30: Greek breakdown by ownership type
Greece N= Public Private Private not for profit Don't know/ No answer
Census 120
85 20 1 14
71% 17% 1% 12%
2012 68 59 8 1 -
87% 12% 1% -
2010 26 24 1 1 -
92% 4% 4% -
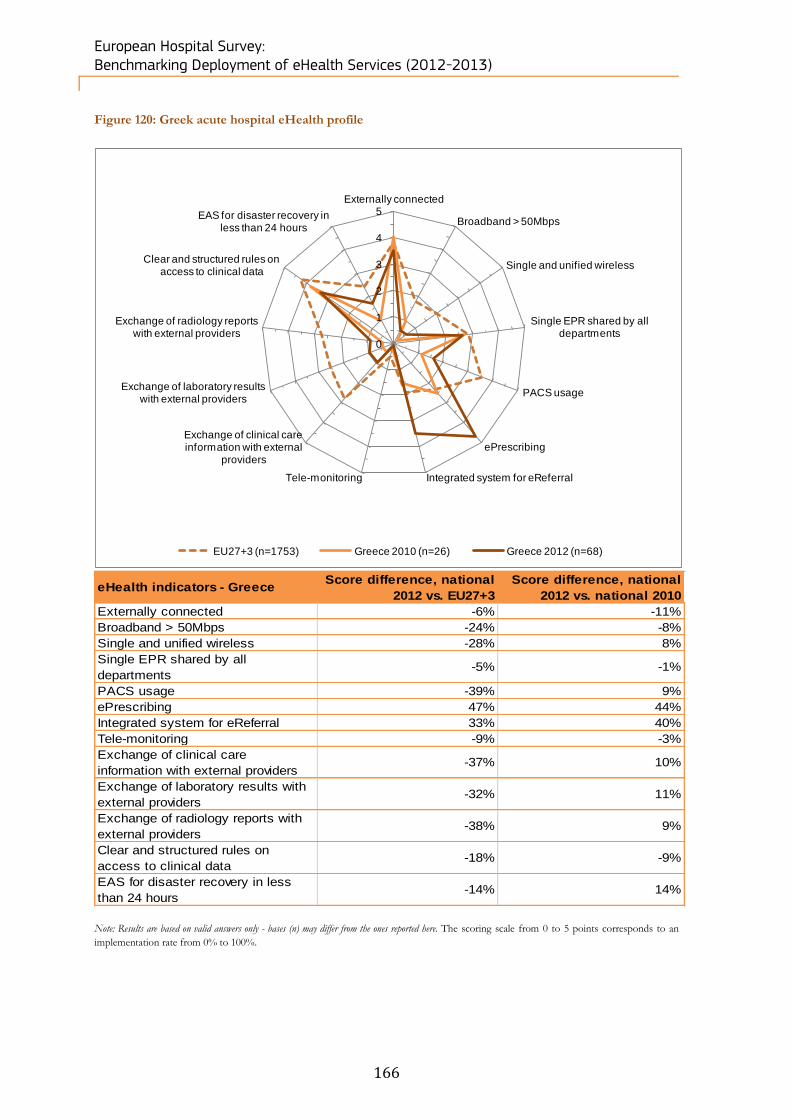
European Hospital Survey: Benchmarking Deployment of eHealth Services (2012-2013)
166
Figure 120: Greek acute hospital eHealth profile
eHealth indicators - Greece Score difference, national
2012 vs. EU27+3
Score difference, national
2012 vs. national 2010
Externally connected -6% -11%
Broadband > 50Mbps -24% -8%
Single and unified wireless -28% 8%
Single EPR shared by all
departments-5% -1%
PACS usage -39% 9%
ePrescribing 47% 44%
Integrated system for eReferral 33% 40%
Tele-monitoring -9% -3%
Exchange of clinical care
information with external providers-37% 10%
Exchange of laboratory results with
external providers-32% 11%
Exchange of radiology reports with
external providers-38% 9%
Clear and structured rules on
access to clinical data-18% -9%
EAS for disaster recovery in less
than 24 hours-14% 14%
Note: Results are based on valid answers only - bases (n) may differ from the ones reported here. The scoring scale from 0 to 5 points corresponds to an
implementation rate from 0% to 100%.
0
1
2
3
4
5Externally connected
Broadband > 50Mbps
Single and unified wireless
Single EPR shared by all departments
PACS usage
ePrescribing
Integrated system for eReferralTele-monitoring
Exchange of clinical care information with external
providers
Exchange of laboratory results with external providers
Exchange of radiology reports with external providers
Clear and structured rules on access to clinical data
EAS for disaster recovery in less than 24 hours
EU27+3 (n=1753) Greece 2010 (n=26) Greece 2012 (n=68)

European Hospital Survey: Benchmarking Deployment of eHealth Services (2012-2013)
167
Position of the Greek eHealth profile in EU27+3
313 Greece is significantly behind the European average in terms of eHealth development. The areas which
contribute the most to this lag are “PACS usage” (-39%), “Exchange of clinical care information with
external providers” (-37%), “Exchange of laboratory results with external providers”, (-32%) and “Exchange
of radiology reports with external providers” (-38%). Greece, however, exceeds the European average in
“ePrescribing” (47%) and “Integrated system for eReferral” (33%).
Change in the Greek eHealth profile
314 Despite lagging behind the European average, Greece has in fact made significant progress over its
previous eHealth profile as evaluated in 2010. The country improvements are mainly due to the two areas
in which it exceeds the average, “ePrescribing” and “Integrated system for eReferral”.
Figure 121: Greek acute hospitals eHealth profile by ownership
Note: Results are based on valid answers only - category bases may vary from the total reported here.
315 Greece’s Public acute hospitals underperform in all areas examined and consistently rank equal to or
behind the average values for all indicators. Private hospitals fare much better, exceeding the average
value in all areas, sometimes by a wide margin, for example in “PACS usage”. Finally, the sole Private not
for profit acute hospital returned values for only two of three areas (“Single EPR shared by all
departments” and “Clear and structured rules on access to clinical data”), but displays 100% penetration in
these areas.
11%
52%
32%
19%
67%
11%
50%
27%
14%
65%
14%
62%
75%
57%
75%
0%
100%
0%
0%
100%
0% 20% 40% 60% 80% 100%
Broadband > 50Mbps
Single EPR shared by all departments
PACS usage
Echange of CCI with ext. providers
Clear data access rules
Total (n=61-65) Public (n=52-56) Private (n=7-8) Private not for prof it (n=1)

European Hospital Survey: Benchmarking Deployment of eHealth Services (2012-2013)
168
Figure 122: Greek acute hospitals eHealth profile by size
Note: Results are based on valid answers only - category bases may vary from the total reported here.
316 Considering the scale of acute hospitals in Greece, we can see that the only hospital with more than 750
beds has “Broadband > 50Mbps”, “Single EPR shared by all departments” and “Clear and structured rules
on access to clinical data”. In addition to the high penetration of these eHealth services in hospitals with
above 750 beds, the gap in relation to other hospital sizes is considerable, ranging from 44 to 96
percentage points between the highest performer and the lowest performer.
11%
50%
28%
17%
66%
21%
50%
12%
7%
62%
6%
53%
35%
33%
56%
4%
50%
32%
12%
76%
100%
0%
100%
0%
100%
0% 20% 40% 60% 80% 100%
Broadband > 50Mbps
Single EPR shared by all departments
PACS usage
Echange of CCI with ext. providers
Clear data access rules
Total (n=56-60) Fewer than 101 beds (n=14-17)Between 101 and 250 beds (n=16-19) Between 251 and 750 beds (n=21-26)More than 750 beds (n=1)

European Hospital Survey: Benchmarking Deployment of eHealth Services (2012-2013)
169
5.2.13 Hungary’s acute hospital eHealth profile
317 492 hospitals were identified in Hungary. Within this sample, 279 (57%) completed the screener part of
the questionnaire and, of these, 21% qualified as acute care hospitals. Of the 102 screened in, 43 acute
hospitals (42%) completed the survey.
318 The intermediate size categories experienced a significant increase in the number of hospitals between
2010 and 2012.
Table 31: Hungarian breakdown by size of hospital
Hungary N= Fewer than
101 beds Between 101 and
250 beds Between 251 and
750 beds More than 750
beds Don’t know/ No answer
Census 102
15 20 34 23 10
15% 20% 33% 23% 10%
2012 43 6 7 17 8 5
14% 16% 40% 19% 12%
2010 10 - 2 7 1 -
- 20% 70% 10% -
319 The number of Public hospitals has increased from nine to 40 between 2010 and 2012. The Private and
Private not for profit categories each counted only one hospital in 2012 (compared to 0 in 2010).
Table 32: Hungarian breakdown by ownership type
Hungary N= Public Private Private not for profit Don't know/ No answer
Census 102
90 7 1 4
88% 7% 1% 4%
2012 43 40 1 1 1
93% 2% 2% 2%
2010 10 9 - - 1
90% - - 10%
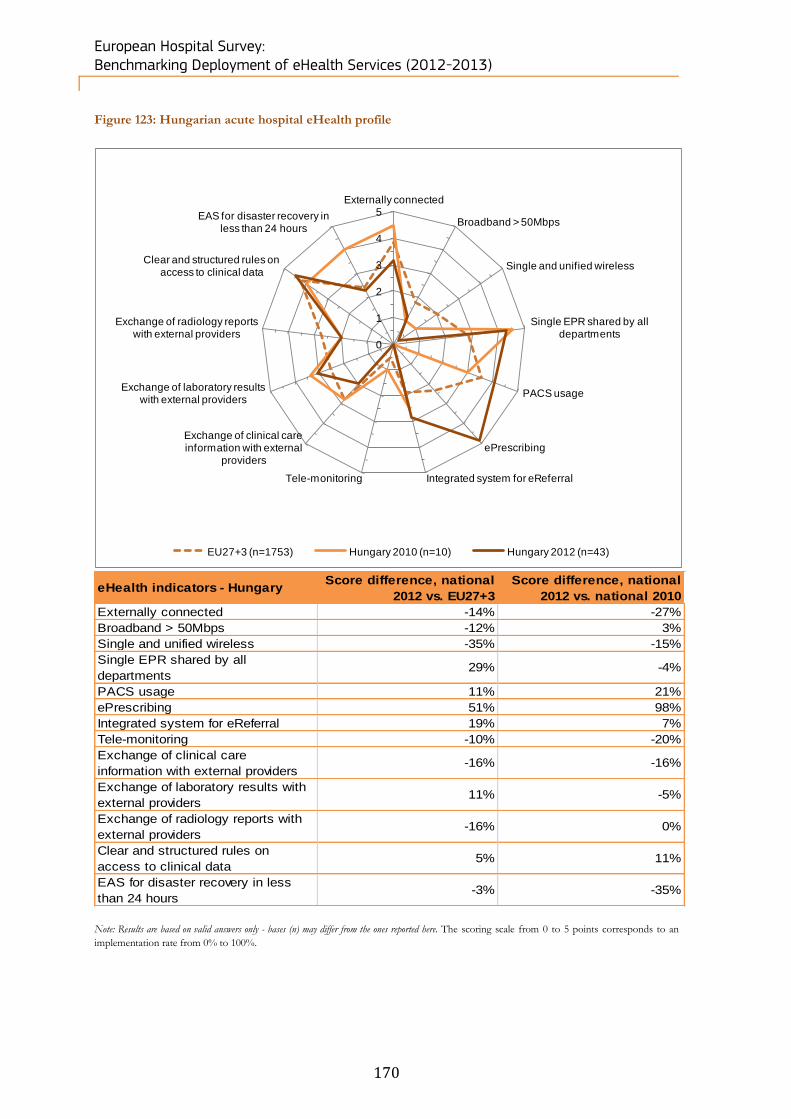
European Hospital Survey: Benchmarking Deployment of eHealth Services (2012-2013)
170
Figure 123: Hungarian acute hospital eHealth profile
eHealth indicators - Hungary Score difference, national
2012 vs. EU27+3
Score difference, national
2012 vs. national 2010
Externally connected -14% -27%
Broadband > 50Mbps -12% 3%
Single and unified wireless -35% -15%
Single EPR shared by all
departments29% -4%
PACS usage 11% 21%
ePrescribing 51% 98%
Integrated system for eReferral 19% 7%
Tele-monitoring -10% -20%
Exchange of clinical care
information with external providers-16% -16%
Exchange of laboratory results with
external providers11% -5%
Exchange of radiology reports with
external providers-16% 0%
Clear and structured rules on
access to clinical data5% 11%
EAS for disaster recovery in less
than 24 hours-3% -35%
Note: Results are based on valid answers only - bases (n) may differ from the ones reported here. The scoring scale from 0 to 5 points corresponds to an
implementation rate from 0% to 100%.
0
1
2
3
4
5Externally connected
Broadband > 50Mbps
Single and unified wireless
Single EPR shared by all departments
PACS usage
ePrescribing
Integrated system for eReferralTele-monitoring
Exchange of clinical care information with external
providers
Exchange of laboratory results with external providers
Exchange of radiology reports with external providers
Clear and structured rules on access to clinical data
EAS for disaster recovery in less than 24 hours
EU27+3 (n=1753) Hungary 2010 (n=10) Hungary 2012 (n=43)
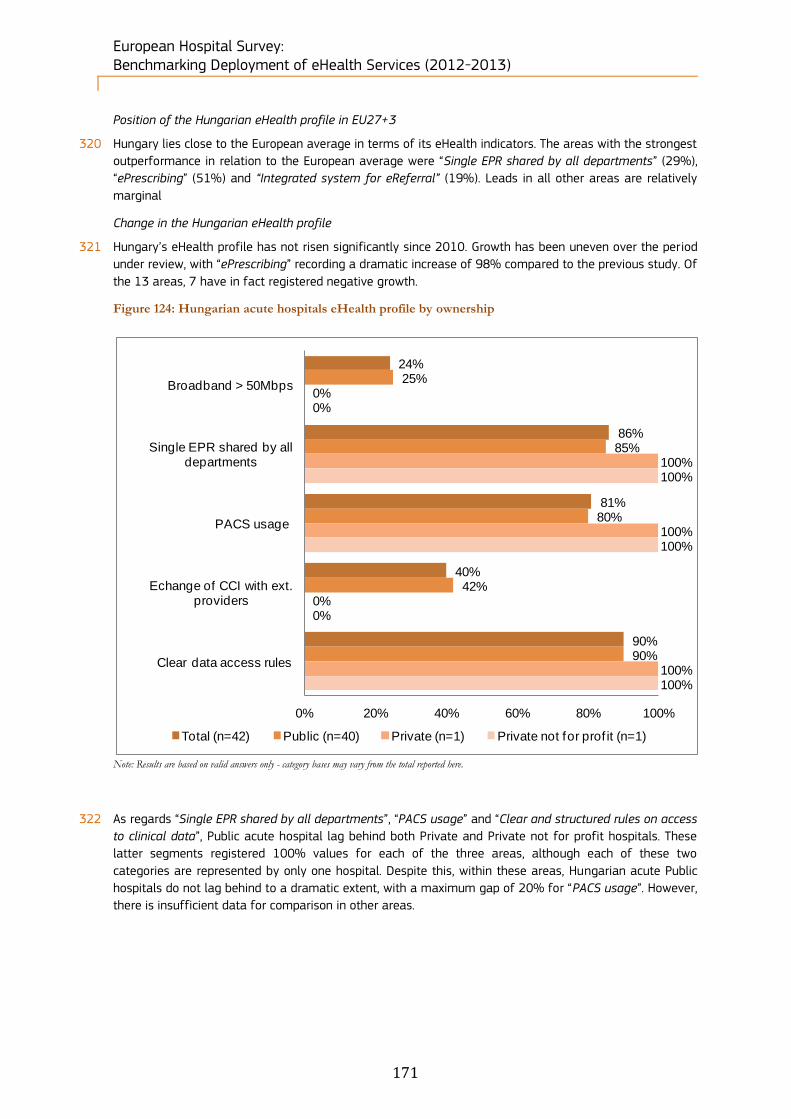
European Hospital Survey: Benchmarking Deployment of eHealth Services (2012-2013)
171
Position of the Hungarian eHealth profile in EU27+3
320 Hungary lies close to the European average in terms of its eHealth indicators. The areas with the strongest
outperformance in relation to the European average were “Single EPR shared by all departments” (29%),
“ePrescribing” (51%) and “Integrated system for eReferral” (19%). Leads in all other areas are relatively
marginal
Change in the Hungarian eHealth profile
321 Hungary’s eHealth profile has not risen significantly since 2010. Growth has been uneven over the period
under review, with “ePrescribing” recording a dramatic increase of 98% compared to the previous study. Of
the 13 areas, 7 have in fact registered negative growth.
Figure 124: Hungarian acute hospitals eHealth profile by ownership
Note: Results are based on valid answers only - category bases may vary from the total reported here.
322 As regards “Single EPR shared by all departments”, “PACS usage” and “Clear and structured rules on access
to clinical data”, Public acute hospital lag behind both Private and Private not for profit hospitals. These
latter segments registered 100% values for each of the three areas, although each of these two
categories are represented by only one hospital. Despite this, within these areas, Hungarian acute Public
hospitals do not lag behind to a dramatic extent, with a maximum gap of 20% for “PACS usage”. However,
there is insufficient data for comparison in other areas.
24%
86%
81%
40%
90%
25%
85%
80%
42%
90%
0%
100%
100%
0%
100%
0%
100%
100%
0%
100%
0% 20% 40% 60% 80% 100%
Broadband > 50Mbps
Single EPR shared by all departments
PACS usage
Echange of CCI with ext. providers
Clear data access rules
Total (n=42) Public (n=40) Private (n=1) Private not for prof it (n=1)

European Hospital Survey: Benchmarking Deployment of eHealth Services (2012-2013)
172
Figure 125: Hungarian acute hospitals eHealth profile by size
Note: Results are based on valid answers only - category bases may vary from the total reported here.
323 Scale does not appear have a clear influence on the results of eHealth progress in Hungarian acute
hospitals. In two areas, “Single EPR shared by all departments” and “Clear and structured rules on access
to clinical data”, although larger hospitals tend to be dominate, this lead is not dramatic and overall values
are closely grouped with discrepancies of 15 percentage points at most. Of the larger hospitals, those with
above 750 beds lead in four of five areas under scrutiny.
22%
85%
80%
42%
90%
29%
86%
71%
14%
86%
0%
80%
60%
20%
80%
21%
84%
79%
53%
95%
33%
89%
100%
56%
89%
0% 20% 40% 60% 80% 100%
Broadband > 50Mbps
Single EPR shared by all departments
PACS usage
Echange of CCI with ext. providers
Clear data access rules
Total (n=40) Fewer than 101 beds (n=7)
Between 101 and 250 beds (n=5) Between 251 and 750 beds (n=19)
More than 750 beds (n=9)

European Hospital Survey: Benchmarking Deployment of eHealth Services (2012-2013)
173
5.2.14 Iceland’s acute hospital eHealth profile
324 14 hospitals were identified in Iceland. Within this sample, 11 (79%) completed the screener part of the
questionnaire and, of these, 71% qualified as acute care hospitals. Of the 10 screened in, 9 acute
hospitals (90%) completed the survey.
325 The breakdown by size in Iceland reveals a majority of small hospitals with fewer than 101 beds, while
the larger categories counted only one unit each in 2012.
Table 33: Icelandic breakdown by size of hospital
Iceland N= Fewer than
101 beds Between 101 and
250 beds Between 251 and
750 beds More than 750
beds Don’t know/ No answer
Census 10
7 1 1 - 1
70% 10% 10% - 10%
2012 9 7 1 1 - -
78% 11% 11% - -
2010 3 2 1 - - -
67% 33% - - -
326 As in 2010, the respondents to the 2012 survey included only public hospitals.
Table 34: Icelandic breakdown by ownership type
Iceland N= Public Private Private not for profit Don't know/ No answer
Census 10
9 - - 1
90% - - 10%
2012 9 9 - - -
100% - - -
2010 3 3 - - -
100% - - -
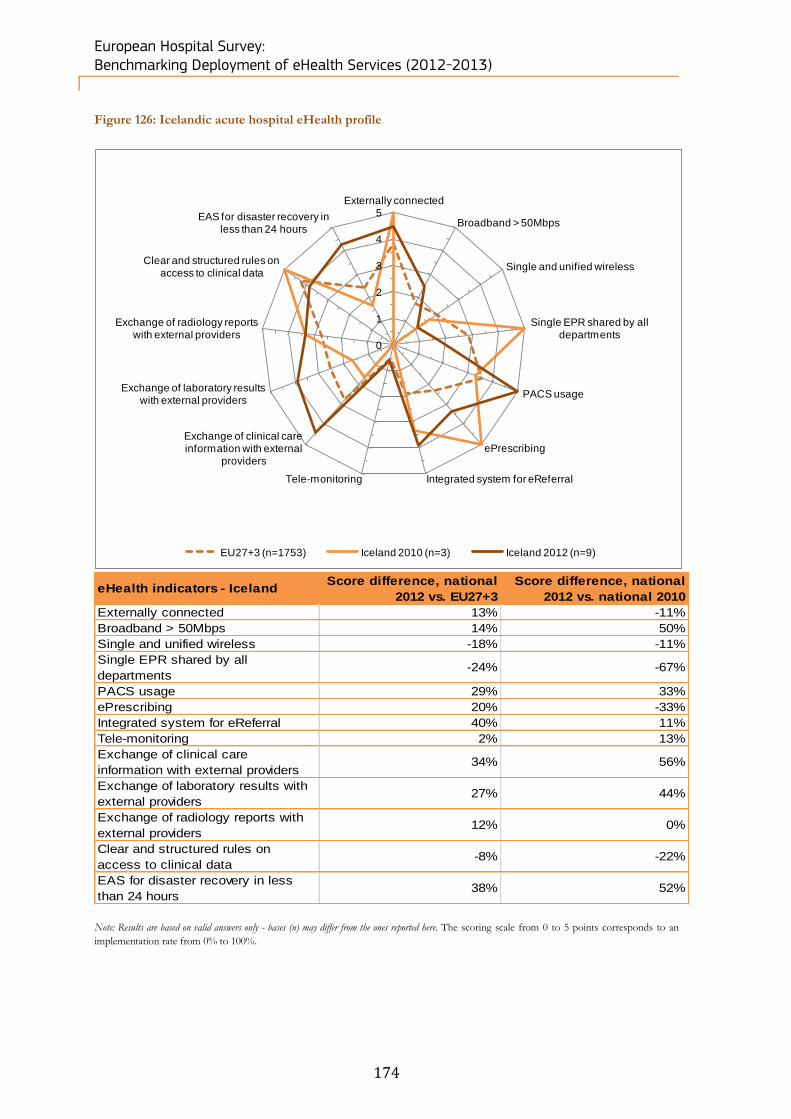
European Hospital Survey: Benchmarking Deployment of eHealth Services (2012-2013)
174
Figure 126: Icelandic acute hospital eHealth profile
eHealth indicators - IcelandScore difference, national
2012 vs. EU27+3
Score difference, national
2012 vs. national 2010
Externally connected 13% -11%
Broadband > 50Mbps 14% 50%
Single and unified wireless -18% -11%
Single EPR shared by all
departments-24% -67%
PACS usage 29% 33%
ePrescribing 20% -33%
Integrated system for eReferral 40% 11%
Tele-monitoring 2% 13%
Exchange of clinical care
information with external providers34% 56%
Exchange of laboratory results with
external providers27% 44%
Exchange of radiology reports with
external providers12% 0%
Clear and structured rules on
access to clinical data-8% -22%
EAS for disaster recovery in less
than 24 hours38% 52%
Note: Results are based on valid answers only - bases (n) may differ from the ones reported here. The scoring scale from 0 to 5 points corresponds to an
implementation rate from 0% to 100%.
0
1
2
3
4
5Externally connected
Broadband > 50Mbps
Single and unified wireless
Single EPR shared by all departments
PACS usage
ePrescribing
Integrated system for eReferralTele-monitoring
Exchange of clinical care information with external
providers
Exchange of laboratory results with external providers
Exchange of radiology reports with external providers
Clear and structured rules on access to clinical data
EAS for disaster recovery in less than 24 hours
EU27+3 (n=1753) Iceland 2010 (n=3) Iceland 2012 (n=9)
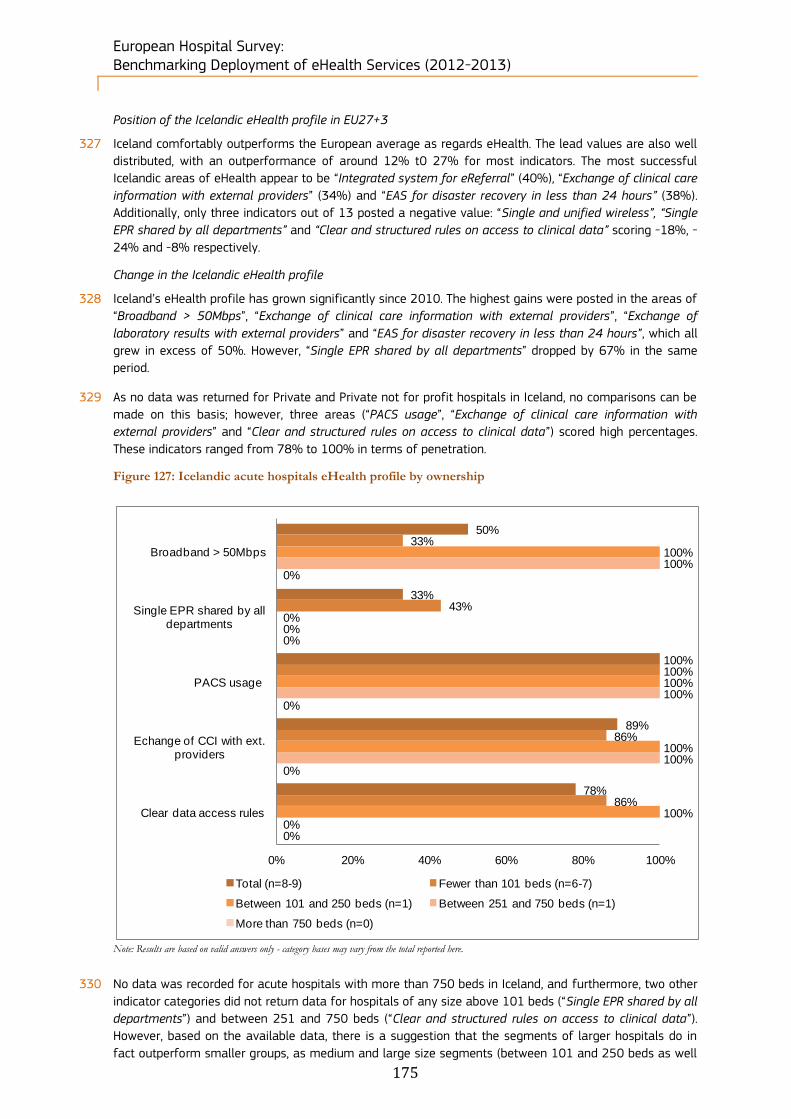
European Hospital Survey: Benchmarking Deployment of eHealth Services (2012-2013)
175
Position of the Icelandic eHealth profile in EU27+3
327 Iceland comfortably outperforms the European average as regards eHealth. The lead values are also well
distributed, with an outperformance of around 12% t0 27% for most indicators. The most successful
Icelandic areas of eHealth appear to be “Integrated system for eReferral” (40%), “Exchange of clinical care
information with external providers” (34%) and “EAS for disaster recovery in less than 24 hours” (38%).
Additionally, only three indicators out of 13 posted a negative value: “Single and unified wireless”, “Single
EPR shared by all departments” and “Clear and structured rules on access to clinical data” scoring -18%, -
24% and -8% respectively.
Change in the Icelandic eHealth profile
328 Iceland’s eHealth profile has grown significantly since 2010. The highest gains were posted in the areas of
“Broadband > 50Mbps”, “Exchange of clinical care information with external providers”, “Exchange of
laboratory results with external providers” and “EAS for disaster recovery in less than 24 hours”, which all
grew in excess of 50%. However, “Single EPR shared by all departments” dropped by 67% in the same
period.
329 As no data was returned for Private and Private not for profit hospitals in Iceland, no comparisons can be
made on this basis; however, three areas (“PACS usage”, “Exchange of clinical care information with
external providers” and “Clear and structured rules on access to clinical data”) scored high percentages.
These indicators ranged from 78% to 100% in terms of penetration.
Figure 127: Icelandic acute hospitals eHealth profile by ownership
Note: Results are based on valid answers only - category bases may vary from the total reported here.
330 No data was recorded for acute hospitals with more than 750 beds in Iceland, and furthermore, two other
indicator categories did not return data for hospitals of any size above 101 beds (“Single EPR shared by all
departments”) and between 251 and 750 beds (“Clear and structured rules on access to clinical data”).
However, based on the available data, there is a suggestion that the segments of larger hospitals do in
fact outperform smaller groups, as medium and large size segments (between 101 and 250 beds as well
50%
33%
100%
89%
78%
33%
43%
100%
86%
86%
100%
0%
100%
100%
100%
100%
0%
100%
100%
0%
0%
0%
0%
0%
0%
0% 20% 40% 60% 80% 100%
Broadband > 50Mbps
Single EPR shared by all departments
PACS usage
Echange of CCI with ext. providers
Clear data access rules
Total (n=8-9) Fewer than 101 beds (n=6-7)
Between 101 and 250 beds (n=1) Between 251 and 750 beds (n=1)
More than 750 beds (n=0)
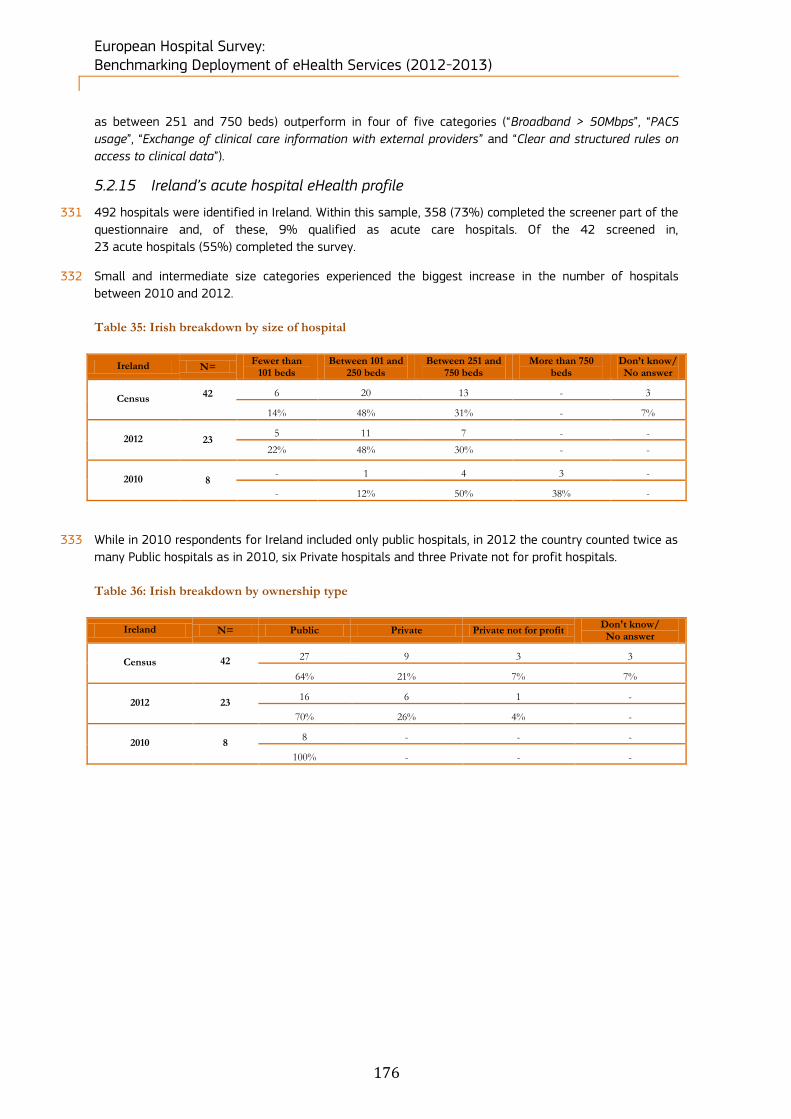
European Hospital Survey: Benchmarking Deployment of eHealth Services (2012-2013)
176
as between 251 and 750 beds) outperform in four of five categories (“Broadband > 50Mbps”, “PACS
usage”, “Exchange of clinical care information with external providers” and “Clear and structured rules on
access to clinical data”).
5.2.15 Ireland’s acute hospital eHealth profile
331 492 hospitals were identified in Ireland. Within this sample, 358 (73%) completed the screener part of the
questionnaire and, of these, 9% qualified as acute care hospitals. Of the 42 screened in,
23 acute hospitals (55%) completed the survey.
332 Small and intermediate size categories experienced the biggest increase in the number of hospitals
between 2010 and 2012.
Table 35: Irish breakdown by size of hospital
Ireland N= Fewer than
101 beds Between 101 and
250 beds Between 251 and
750 beds More than 750
beds Don’t know/ No answer
Census 42
6 20 13 - 3
14% 48% 31% - 7%
2012 23 5 11 7 - -
22% 48% 30% - -
2010 8 - 1 4 3 -
- 12% 50% 38% -
333 While in 2010 respondents for Ireland included only public hospitals, in 2012 the country counted twice as
many Public hospitals as in 2010, six Private hospitals and three Private not for profit hospitals.
Table 36: Irish breakdown by ownership type
Ireland N= Public Private Private not for profit Don't know/ No answer
Census 42
27 9 3 3
64% 21% 7% 7%
2012 23 16 6 1 -
70% 26% 4% -
2010 8 8 - - -
100% - - -

European Hospital Survey: Benchmarking Deployment of eHealth Services (2012-2013)
177
Figure 128: Irish acute hospital eHealth profile
Note: Results are based on valid answers only - bases (n) may differ from the ones reported here. The scoring scale from
0 to 5 points corresponds to an implementation rate from 0% to 100%.
Position of the Irish eHealth profile in EU27+3
334 In 2012 Ireland was largely in line with the European average with respect to eHealth indicators. In
addition to this, Ireland is remarkably average in the distribution of its eHealth indicators in relation to the
European mean, with disparities ranging from -38% to 23%. However, many of these discrepancies were
only marginal.
0
1
2
3
4
5Externally connected
Broadband > 50Mbps
Single and unified wireless
Single EPR shared by all departments
PACS usage
ePrescribing
Integrated system for eReferralTele-monitoring
Exchange of clinical care information with external
providers
Exchange of laboratory results with external providers
Exchange of radiology reports with external providers
Clear and structured rules on access to clinical data
EAS for disaster recovery in less than 24 hours
EU27+3 (n=1753) Ireland 2010 (n=8) Ireland 2012 (n=23)
eHealth indicators - Ireland Score difference, national
2012 vs. EU27+3
Score difference, national
2012 vs. national 2010
Externally connected -2% -14%
Broadband > 50Mbps 22% -43%
Single and unified wireless -1% -11%
Single EPR shared by all
departments-27% -7%
PACS usage 12% 8%
ePrescribing -38% 9%
Integrated system for eReferral -7% -7%
Tele-monitoring -10% -25%
Exchange of clinical care
information with external providers23% -9%
Exchange of laboratory results with
external providers18% -18%
Exchange of radiology reports with
external providers10% -10%
Clear and structured rules on
access to clinical data5% -10%
EAS for disaster recovery in less
than 24 hours-9% -11%
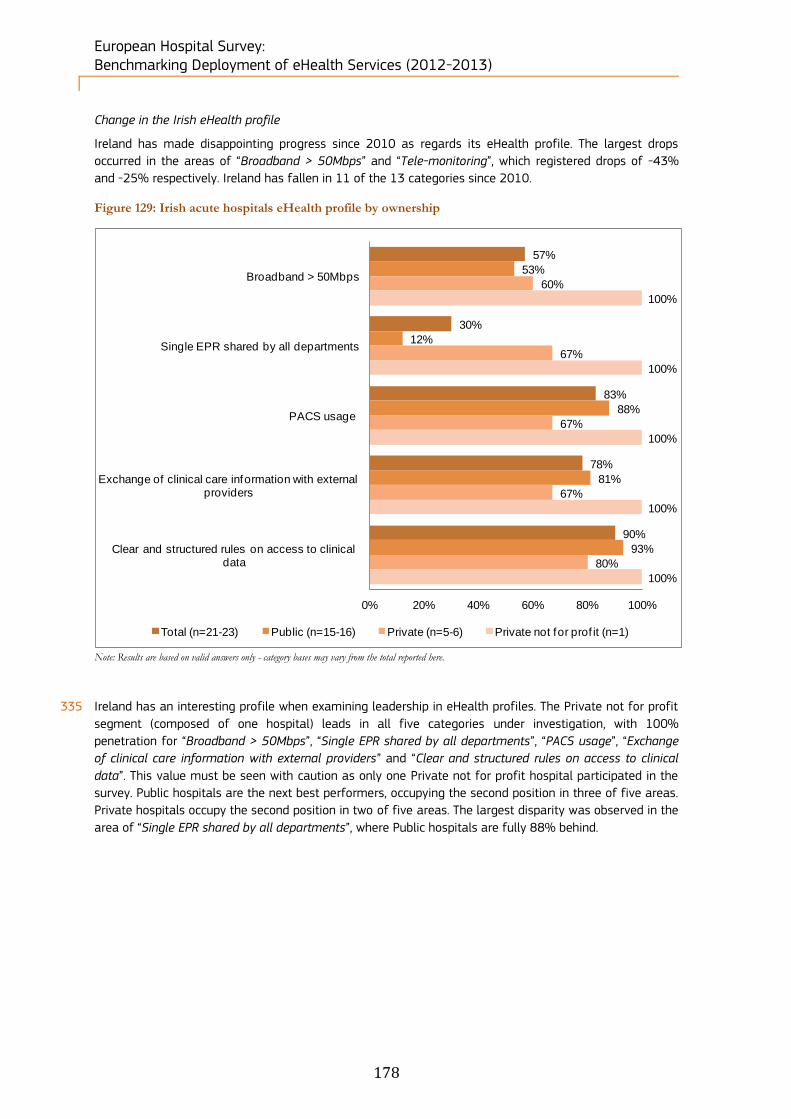
European Hospital Survey: Benchmarking Deployment of eHealth Services (2012-2013)
178
Change in the Irish eHealth profile
Ireland has made disappointing progress since 2010 as regards its eHealth profile. The largest drops
occurred in the areas of “Broadband > 50Mbps” and “Tele-monitoring”, which registered drops of -43%
and -25% respectively. Ireland has fallen in 11 of the 13 categories since 2010.
Figure 129: Irish acute hospitals eHealth profile by ownership
Note: Results are based on valid answers only - category bases may vary from the total reported here.
335 Ireland has an interesting profile when examining leadership in eHealth profiles. The Private not for profit
segment (composed of one hospital) leads in all five categories under investigation, with 100%
penetration for “Broadband > 50Mbps”, “Single EPR shared by all departments”, “PACS usage”, “Exchange
of clinical care information with external providers” and “Clear and structured rules on access to clinical
data”. This value must be seen with caution as only one Private not for profit hospital participated in the
survey. Public hospitals are the next best performers, occupying the second position in three of five areas.
Private hospitals occupy the second position in two of five areas. The largest disparity was observed in the
area of “Single EPR shared by all departments”, where Public hospitals are fully 88% behind.
57%
30%
83%
78%
90%
53%
12%
88%
81%
93%
60%
67%
67%
67%
80%
100%
100%
100%
100%
100%
0% 20% 40% 60% 80% 100%
Broadband > 50Mbps
Single EPR shared by all departments
PACS usage
Exchange of clinical care information with external providers
Clear and structured rules on access to clinical data
Total (n=21-23) Public (n=15-16) Private (n=5-6) Private not for prof it (n=1)
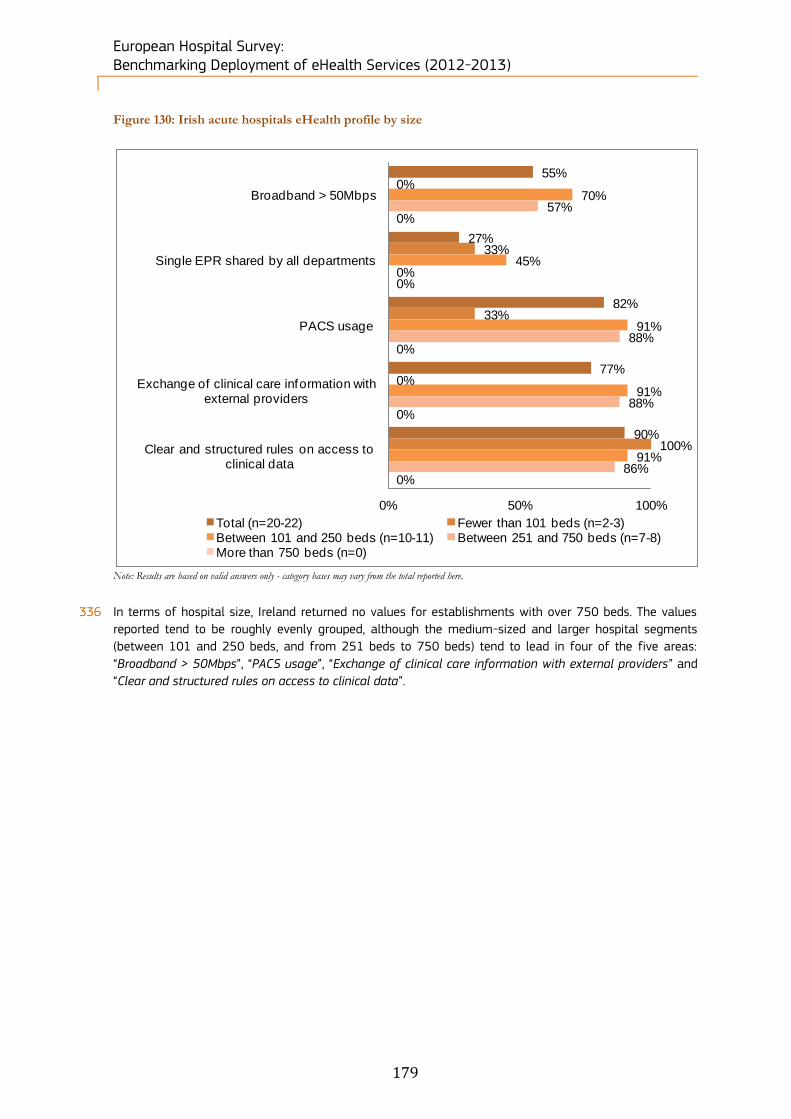
European Hospital Survey: Benchmarking Deployment of eHealth Services (2012-2013)
179
Figure 130: Irish acute hospitals eHealth profile by size
Note: Results are based on valid answers only - category bases may vary from the total reported here.
336 In terms of hospital size, Ireland returned no values for establishments with over 750 beds. The values
reported tend to be roughly evenly grouped, although the medium-sized and larger hospital segments
(between 101 and 250 beds, and from 251 beds to 750 beds) tend to lead in four of the five areas:
“Broadband > 50Mbps”, “PACS usage”, “Exchange of clinical care information with external providers” and
“Clear and structured rules on access to clinical data”.
55%
27%
82%
77%
90%
0%
33%
33%
0%
100%
70%
45%
91%
91%
91%
57%
0%
88%
88%
86%
0%
0%
0%
0%
0%
0% 50% 100%
Broadband > 50Mbps
Single EPR shared by all departments
PACS usage
Exchange of clinical care information with external providers
Clear and structured rules on access to clinical data
Total (n=20-22) Fewer than 101 beds (n=2-3)Between 101 and 250 beds (n=10-11) Between 251 and 750 beds (n=7-8)More than 750 beds (n=0)

European Hospital Survey: Benchmarking Deployment of eHealth Services (2012-2013)
180
5.2.16 Italy’s acute hospital eHealth profile
337 2,517 hospitals were identified in Italy. Within this sample, 1063 (42%) completed the screener part of the
questionnaire and, of these, 20% qualified as acute care hospitals. Of the 497 screened in,
196 acute hospitals (39%) completed the survey.
338 As regards the breakdown by size, the highest increases in number between 2010 and 2012 were
recorded by the biggest categories of hospitals.
Table 37: Italian breakdown by size of hospital
Italy N= Fewer than
101 beds Between 101 and
250 beds Between 251 and
750 beds More than 750
beds Don’t know/ No answer
Census 497
87 96 143 55 116
18% 19% 29% 11% 23%
2012 196 39 37 67 21 32
20% 19% 34% 11% 16%
2010 90 29 26 21 10 4
32% 29% 23% 11% 4%
339 Public hospitals almost tripled in number between 2010 and 2012, while the number of Private and
Private not for profit hospitals declined over the same period.
Table 38: Italian breakdown by ownership type
Italy N= Public Private Private not for profit Don't know/ No answer
Census 497
342 106 11 38
69% 21% 2% 8%
2012 196 136 51 9 -
69% 26% 5% -
2010 90 47 29 14 -
52% 32% 16% -
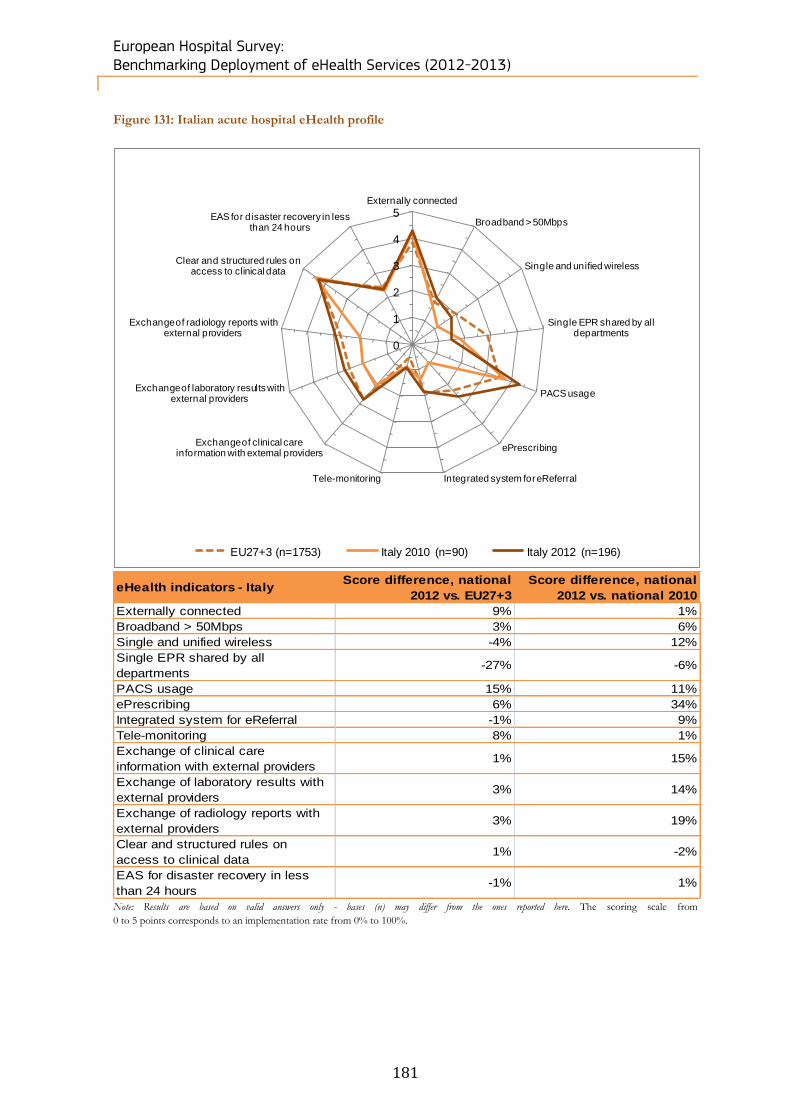
European Hospital Survey: Benchmarking Deployment of eHealth Services (2012-2013)
181
Figure 131: Italian acute hospital eHealth profile
Note: Results are based on valid answers only - bases (n) may differ from the ones reported here. The scoring scale from
0 to 5 points corresponds to an implementation rate from 0% to 100%.
0
1
2
3
4
5Externally connected
Broadband > 50Mbps
Single and unified wireless
Single EPR shared by all departments
PACS usage
ePrescribing
Integrated system for eReferralTele-monitoring
Exchange of clinical care information with external providers
Exchange of laboratory results with external providers
Exchange of radiology reports with external providers
Clear and structured rules on access to clinical data
EAS for disaster recovery in less than 24 hours
EU27+3 (n=1753) Italy 2010 (n=90) Italy 2012 (n=196)
eHealth indicators - Italy Score difference, national
2012 vs. EU27+3
Score difference, national
2012 vs. national 2010
Externally connected 9% 1%
Broadband > 50Mbps 3% 6%
Single and unified wireless -4% 12%
Single EPR shared by all
departments-27% -6%
PACS usage 15% 11%
ePrescribing 6% 34%
Integrated system for eReferral -1% 9%
Tele-monitoring 8% 1%
Exchange of clinical care
information with external providers1% 15%
Exchange of laboratory results with
external providers3% 14%
Exchange of radiology reports with
external providers3% 19%
Clear and structured rules on
access to clinical data1% -2%
EAS for disaster recovery in less
than 24 hours-1% 1%

European Hospital Survey: Benchmarking Deployment of eHealth Services (2012-2013)
182
Position of the Italian eHealth profile in EU27+3
340 Italy closely resembles the European average in eHealth. Of 13 areas considered, only one, “Single EPR
shared by all departments”, showed a significant drop (-27%). All other areas track the European average
very closely, with only marginal discrepancies.
Change in the Italian eHealth profile
341 Italy’s eHealth profile has progressed well from its 2010 position. In addition to this, the distribution has
been relatively even, with only one of 13 areas posting a growth level in excess of 10%, being
“ePrescribing” with a growth of 34%. All other growth areas were marginal, and of all areas examined,
only two areas displayed negative growth, which was also marginal.
Figure 132: Italian acute hospitals eHealth profile by ownership
Note: Results are based on valid answers only - category bases may vary from the total reported here.
342 Public acute hospitals in Italy appear to enjoy the best penetration of eHealth capabilities, leading in four
of five areas, and with only a 2% lag behind the leader in a fifth area (“Single EPR shared by all
departments”). The distribution of eHealth capabilities also appears to be roughly similar across Private
and Private not for profit acute hospitals, with Private hospitals slightly weaker in terms of percentage
penetration (taking last place in three areas of five: “Single EPR shared by all departments”, “PACS usage”
and “Exchange of clinical care information with external providers”).
39%
30%
86%
56%
86%
48%
31%
90%
66%
87%
19%
26%
75%
31%
86%
11%
33%
89%
44%
78%
0% 20% 40% 60% 80% 100%
Broadband > 50Mbps
Single EPR shared by all departments
PACS usage
Echange of CCI with ext. providers
Clear data access rules
Total (n=187-196) Public (n=130-136) Private (n=46-51) Private not for prof it (n=9)
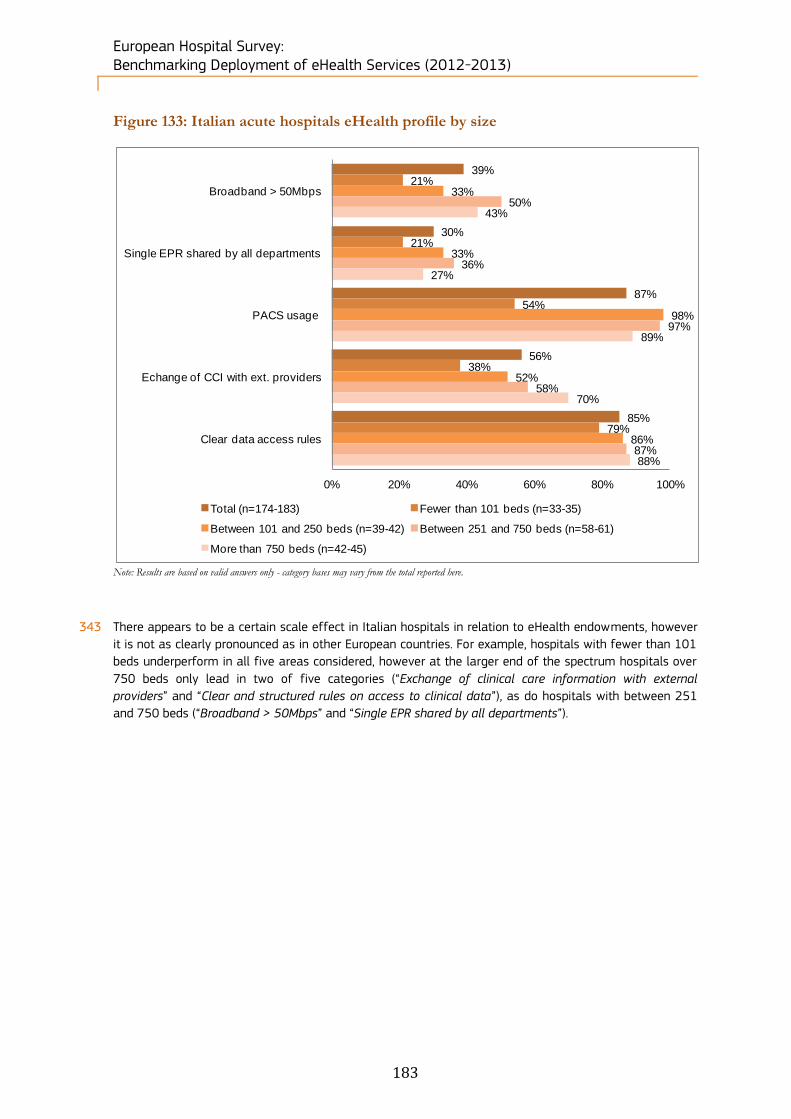
European Hospital Survey: Benchmarking Deployment of eHealth Services (2012-2013)
183
Figure 133: Italian acute hospitals eHealth profile by size
Note: Results are based on valid answers only - category bases may vary from the total reported here.
343 There appears to be a certain scale effect in Italian hospitals in relation to eHealth endowments, however
it is not as clearly pronounced as in other European countries. For example, hospitals with fewer than 101
beds underperform in all five areas considered, however at the larger end of the spectrum hospitals over
750 beds only lead in two of five categories (“Exchange of clinical care information with external
providers” and “Clear and structured rules on access to clinical data”), as do hospitals with between 251
and 750 beds (“Broadband > 50Mbps” and “Single EPR shared by all departments”).
39%
30%
87%
56%
85%
21%
21%
54%
38%
79%
33%
33%
98%
52%
86%
50%
36%
97%
58%
87%
43%
27%
89%
70%
88%
0% 20% 40% 60% 80% 100%
Broadband > 50Mbps
Single EPR shared by all departments
PACS usage
Echange of CCI with ext. providers
Clear data access rules
Total (n=174-183) Fewer than 101 beds (n=33-35)
Between 101 and 250 beds (n=39-42) Between 251 and 750 beds (n=58-61)
More than 750 beds (n=42-45)
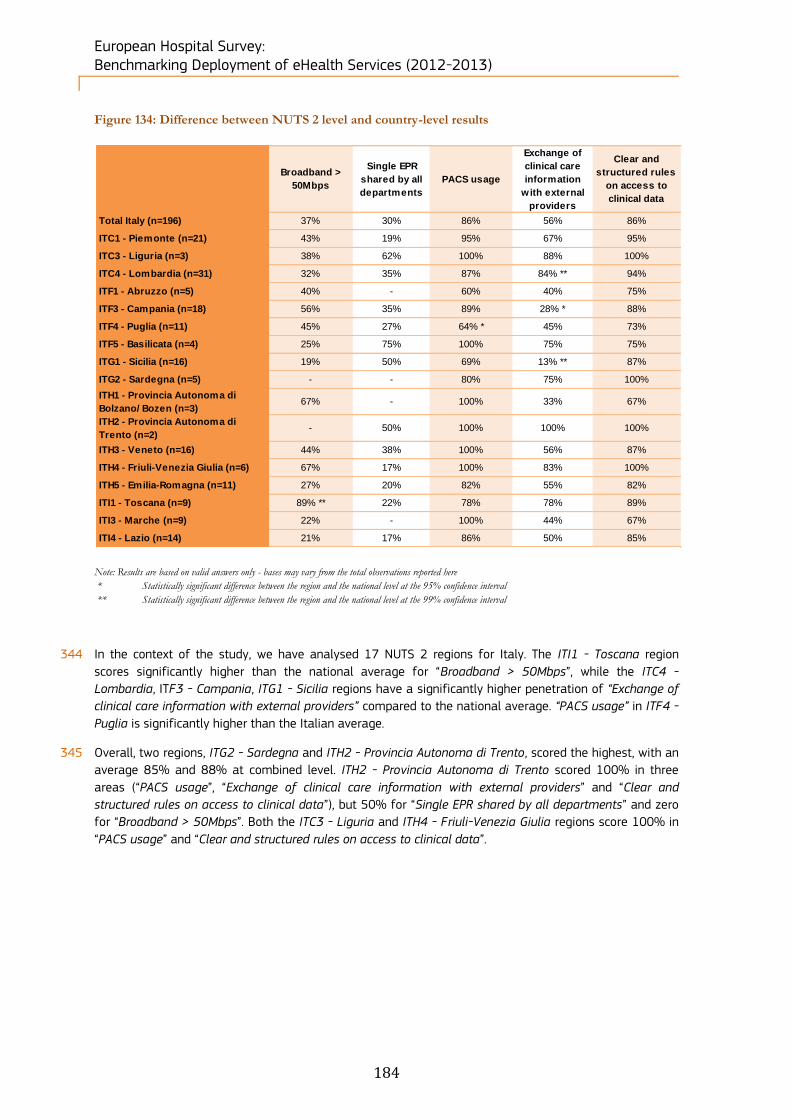
European Hospital Survey: Benchmarking Deployment of eHealth Services (2012-2013)
184
Figure 134: Difference between NUTS 2 level and country-level results
Note: Results are based on valid answers only - bases may vary from the total observations reported here
* Statistically significant difference between the region and the national level at the 95% confidence interval
** Statistically significant difference between the region and the national level at the 99% confidence interval
344 In the context of the study, we have analysed 17 NUTS 2 regions for Italy. The ITI1 - Toscana region
scores significantly higher than the national average for “Broadband > 50Mbps”, while the ITC4 -
Lombardia, ITF3 - Campania, ITG1 - Sicilia regions have a significantly higher penetration of “Exchange of
clinical care information with external providers” compared to the national average. “PACS usage” in ITF4 -
Puglia is significantly higher than the Italian average.
345 Overall, two regions, ITG2 - Sardegna and ITH2 - Provincia Autonoma di Trento, scored the highest, with an
average 85% and 88% at combined level. ITH2 - Provincia Autonoma di Trento scored 100% in three
areas (“PACS usage”, “Exchange of clinical care information with external providers” and “Clear and
structured rules on access to clinical data”), but 50% for “Single EPR shared by all departments” and zero
for “Broadband > 50Mbps”. Both the ITC3 - Liguria and ITH4 - Friuli-Venezia Giulia regions score 100% in
“PACS usage” and “Clear and structured rules on access to clinical data”.
Broadband >
50Mbps
Single EPR
shared by all
departments
PACS usage
Exchange of
clinical care
information
with external
providers
Clear and
structured rules
on access to
clinical data
Total Italy (n=196) 37% 30% 86% 56% 86%
ITC1 - Piemonte (n=21) 43% 19% 95% 67% 95%
ITC3 - Liguria (n=3) 38% 62% 100% 88% 100%
ITC4 - Lombardia (n=31) 32% 35% 87% 84% ** 94%
ITF1 - Abruzzo (n=5) 40% - 60% 40% 75%
ITF3 - Campania (n=18) 56% 35% 89% 28% * 88%
ITF4 - Puglia (n=11) 45% 27% 64% * 45% 73%
ITF5 - Basilicata (n=4) 25% 75% 100% 75% 75%
ITG1 - Sicilia (n=16) 19% 50% 69% 13% ** 87%
ITG2 - Sardegna (n=5) - - 80% 75% 100%
ITH1 - Provincia Autonoma di
Bolzano/ Bozen (n=3)67% - 100% 33% 67%
ITH2 - Provincia Autonoma di
Trento (n=2)- 50% 100% 100% 100%
ITH3 - Veneto (n=16) 44% 38% 100% 56% 87%
ITH4 - Friuli-Venezia Giulia (n=6) 67% 17% 100% 83% 100%
ITH5 - Emilia-Romagna (n=11) 27% 20% 82% 55% 82%
ITI1 - Toscana (n=9) 89% ** 22% 78% 78% 89%
ITI3 - Marche (n=9) 22% - 100% 44% 67%
ITI4 - Lazio (n=14) 21% 17% 86% 50% 85%
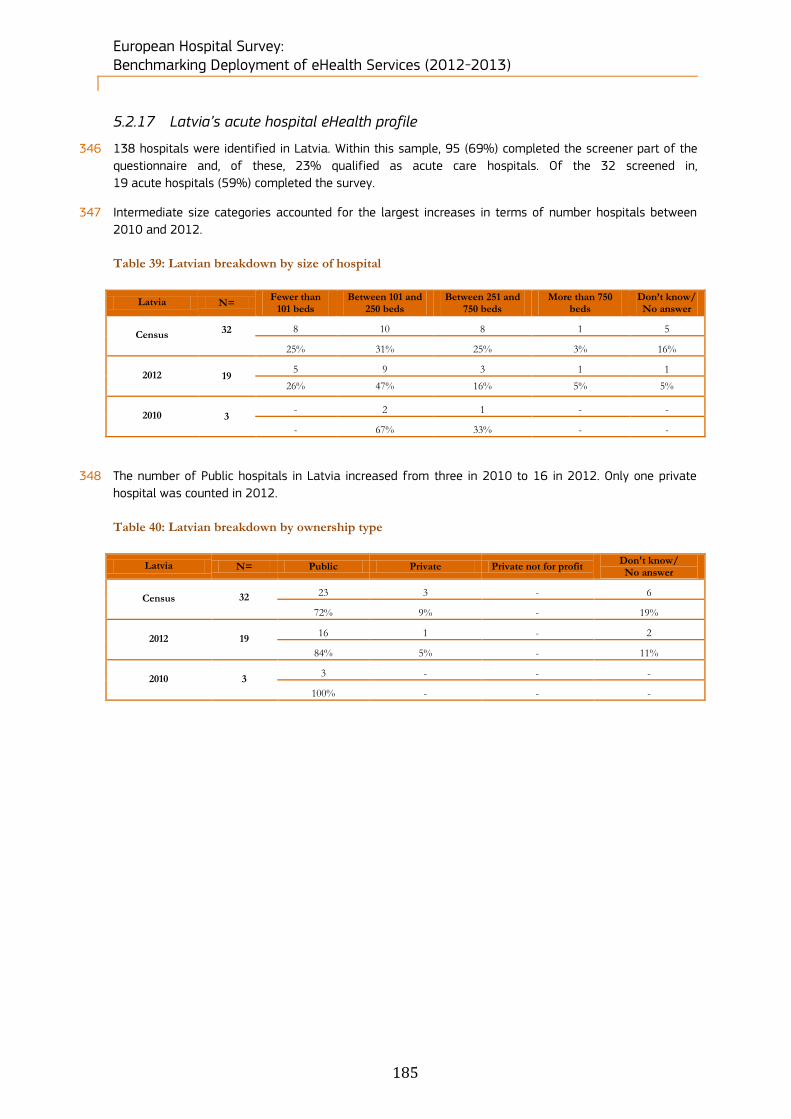
European Hospital Survey: Benchmarking Deployment of eHealth Services (2012-2013)
185
5.2.17 Latvia’s acute hospital eHealth profile
346 138 hospitals were identified in Latvia. Within this sample, 95 (69%) completed the screener part of the
questionnaire and, of these, 23% qualified as acute care hospitals. Of the 32 screened in,
19 acute hospitals (59%) completed the survey.
347 Intermediate size categories accounted for the largest increases in terms of number hospitals between
2010 and 2012.
Table 39: Latvian breakdown by size of hospital
Latvia N= Fewer than
101 beds Between 101 and
250 beds Between 251 and
750 beds More than 750
beds Don’t know/ No answer
Census 32
8 10 8 1 5
25% 31% 25% 3% 16%
2012 19 5 9 3 1 1
26% 47% 16% 5% 5%
2010 3 - 2 1 - -
- 67% 33% - -
348 The number of Public hospitals in Latvia increased from three in 2010 to 16 in 2012. Only one private
hospital was counted in 2012.
Table 40: Latvian breakdown by ownership type
Latvia N= Public Private Private not for profit Don't know/ No answer
Census 32
23 3 - 6
72% 9% - 19%
2012 19 16 1 - 2
84% 5% - 11%
2010 3 3 - - -
100% - - -

European Hospital Survey: Benchmarking Deployment of eHealth Services (2012-2013)
186
Figure 135: Latvian acute hospital eHealth profile
eHealth indicators - Latvia Score difference, national
2012 vs. EU27+3
Score difference, national
2012 vs. national 2010
Externally connected 8% 18%
Broadband > 50Mbps -2% 0%
Single and unified wireless -14% 26%
Single EPR shared by all
departments18% 8%
PACS usage 7% 11%
ePrescribing -39% 8%
Integrated system for eReferral 8% 13%
Tele-monitoring -10% 0%
Exchange of clinical care
information with external providers6% 28%
Exchange of laboratory results with
external providers-13% 5%
Exchange of radiology reports with
external providers45% 67%
Clear and structured rules on
access to clinical data-8% -22%
EAS for disaster recovery in less
than 24 hours21% 35%
Note: Results are based on valid answers only - bases (n) may differ from the ones reported here. The scoring scale from
0 to 5 points corresponds to an implementation rate from 0% to 100%.
0
1
2
3
4
5Externally connected
Broadband > 50Mbps
Single and unified wireless
Single EPR shared by all departments
PACS usage
ePrescribing
Integrated system for eReferralTele-monitoring
Exchange of clinical care information with external
providers
Exchange of laboratory results with external providers
Exchange of radiology reports with external providers
Clear and structured rules on access to clinical data
EAS for disaster recovery in less than 24 hours
EU27+3 (n=1753) Latvia 2010 (n=3) Latvia 2012 (n=19)

European Hospital Survey: Benchmarking Deployment of eHealth Services (2012-2013)
187
Position of the Latvian eHealth profile in EU27+3
349 Latvia experienced an uneven development, with “Exchange of radiology reports with external providers”
and “EAS for disaster recovery in less than 24 hours” outperforming the EU27+3 mean by 45% and 21%
respectively, while “ePrescribing” was 29% below the European average.
Change in the Latvian eHealth profile
350 Latvia has made great strides in its development of eHealth in acute hospitals. “Exchange of radiology
reports with external providers” and “EAS for disaster recovery in less than 24 hours” accounted for the
largest areas of growth at 67% and 35% respectively. Despite this, of the 13 areas examined, only one
experienced negative growth and two recorded no variation in relation to the 2010 results.
Figure 136: Latvian acute hospitals eHealth profile by ownership
Note: Results are based on valid answers only - category bases may vary from the total reported here.
351 The category of Private not for profit returned no values for Latvia, while values for the sole Private acute
hospital were only recorded for three of five areas, in which it recorded full implementation for “Single EPR
shared by all departments”, “PACS usage” and “Clear and structured rules on access to clinical data”. By
contrast, Public hospitals clearly lag in these areas, with gaps of 20% or more compared to the Private
category.
31%
79%
81%
55%
75%
33%
77%
80%
55%
73%
0%
100%
100%
0%
100%
0%
0%
0%
0%
0%
0% 20% 40% 60% 80% 100%
Broadband > 50Mbps
Single EPR shared by all departments
PACS usage
Echange of CCI with ext. providers
Clear data access rules
Total (n=11-16) Public (n=11-15) Private (n=1) Private not for prof it (n=0)
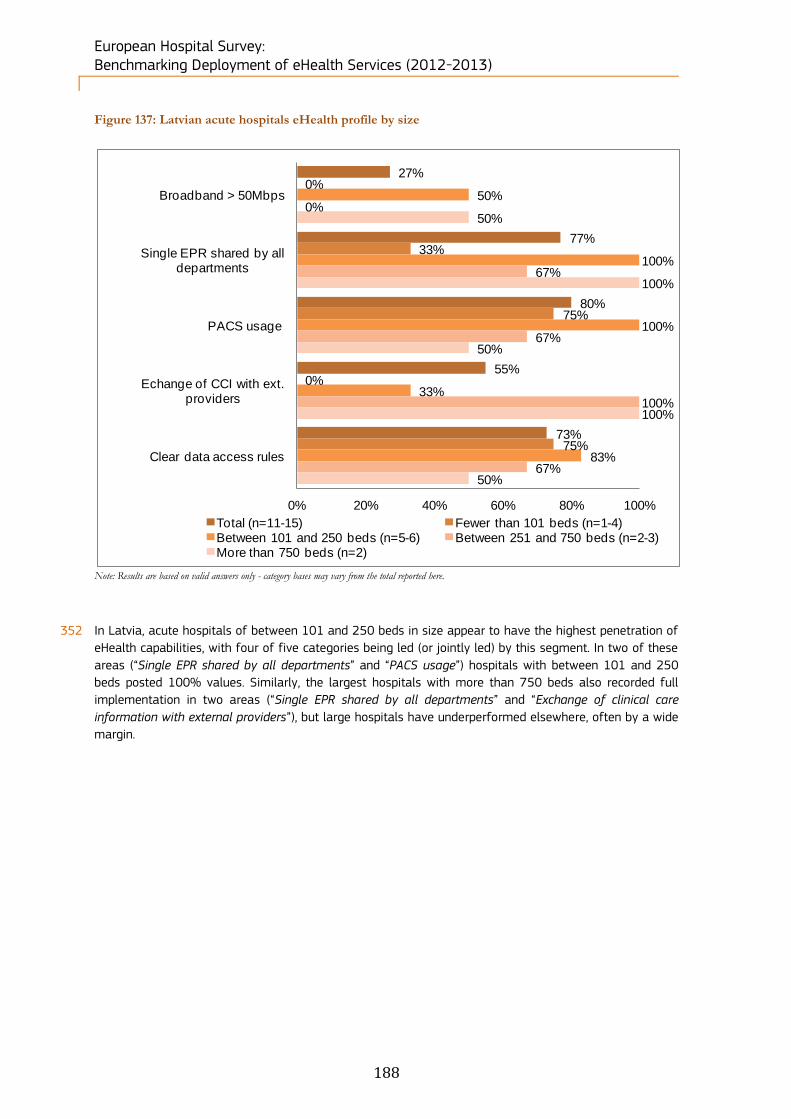
European Hospital Survey: Benchmarking Deployment of eHealth Services (2012-2013)
188
Figure 137: Latvian acute hospitals eHealth profile by size
Note: Results are based on valid answers only - category bases may vary from the total reported here.
352 In Latvia, acute hospitals of between 101 and 250 beds in size appear to have the highest penetration of
eHealth capabilities, with four of five categories being led (or jointly led) by this segment. In two of these
areas (“Single EPR shared by all departments” and “PACS usage”) hospitals with between 101 and 250
beds posted 100% values. Similarly, the largest hospitals with more than 750 beds also recorded full
implementation in two areas (“Single EPR shared by all departments” and “Exchange of clinical care
information with external providers”), but large hospitals have underperformed elsewhere, often by a wide
margin.
27%
77%
80%
55%
73%
0%
33%
75%
0%
75%
50%
100%
100%
33%
83%
0%
67%
67%
100%
67%
50%
100%
50%
100%
50%
0% 20% 40% 60% 80% 100%
Broadband > 50Mbps
Single EPR shared by all departments
PACS usage
Echange of CCI with ext. providers
Clear data access rules
Total (n=11-15) Fewer than 101 beds (n=1-4)Between 101 and 250 beds (n=5-6) Between 251 and 750 beds (n=2-3)More than 750 beds (n=2)
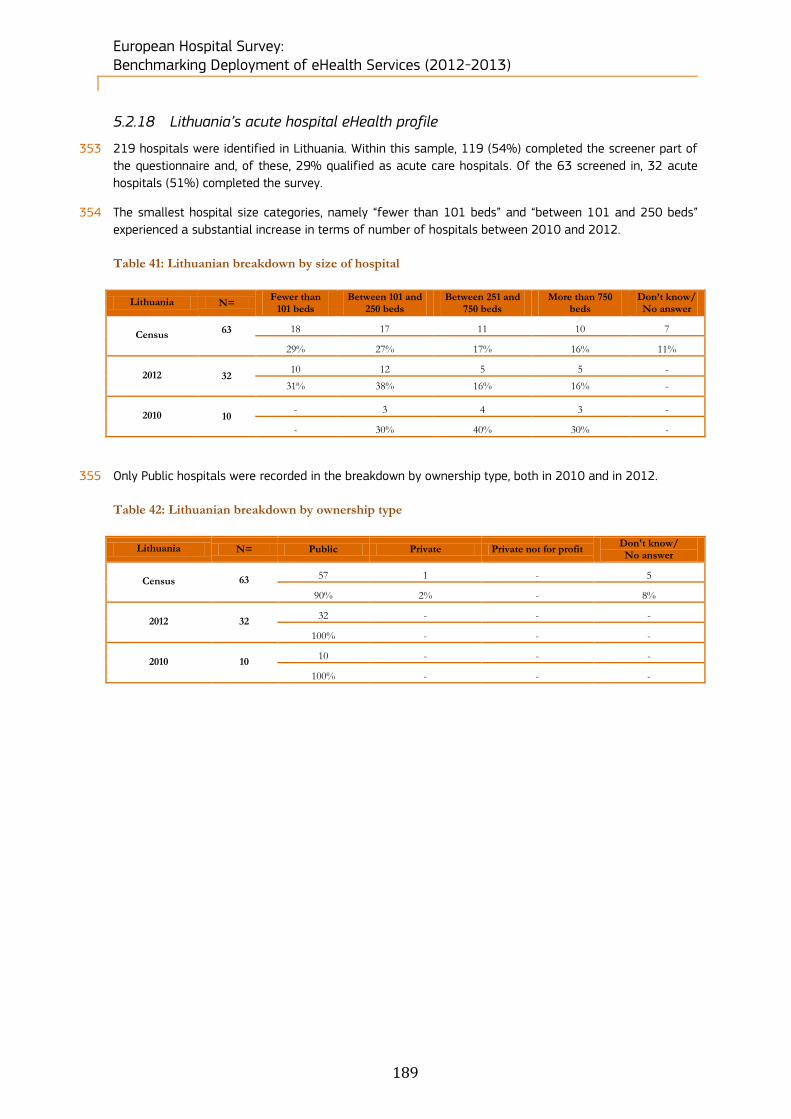
European Hospital Survey: Benchmarking Deployment of eHealth Services (2012-2013)
189
5.2.18 Lithuania’s acute hospital eHealth profile
353 219 hospitals were identified in Lithuania. Within this sample, 119 (54%) completed the screener part of
the questionnaire and, of these, 29% qualified as acute care hospitals. Of the 63 screened in, 32 acute
hospitals (51%) completed the survey.
354 The smallest hospital size categories, namely “fewer than 101 beds” and “between 101 and 250 beds”
experienced a substantial increase in terms of number of hospitals between 2010 and 2012.
Table 41: Lithuanian breakdown by size of hospital
Lithuania N= Fewer than
101 beds Between 101 and
250 beds Between 251 and
750 beds More than 750
beds Don’t know/ No answer
Census 63
18 17 11 10 7
29% 27% 17% 16% 11%
2012 32 10 12 5 5 -
31% 38% 16% 16% -
2010 10 - 3 4 3 -
- 30% 40% 30% -
355 Only Public hospitals were recorded in the breakdown by ownership type, both in 2010 and in 2012.
Table 42: Lithuanian breakdown by ownership type
Lithuania N= Public Private Private not for profit Don't know/ No answer
Census 63
57 1 - 5
90% 2% - 8%
2012 32 32 - - -
100% - - -
2010 10 10 - - -
100% - - -
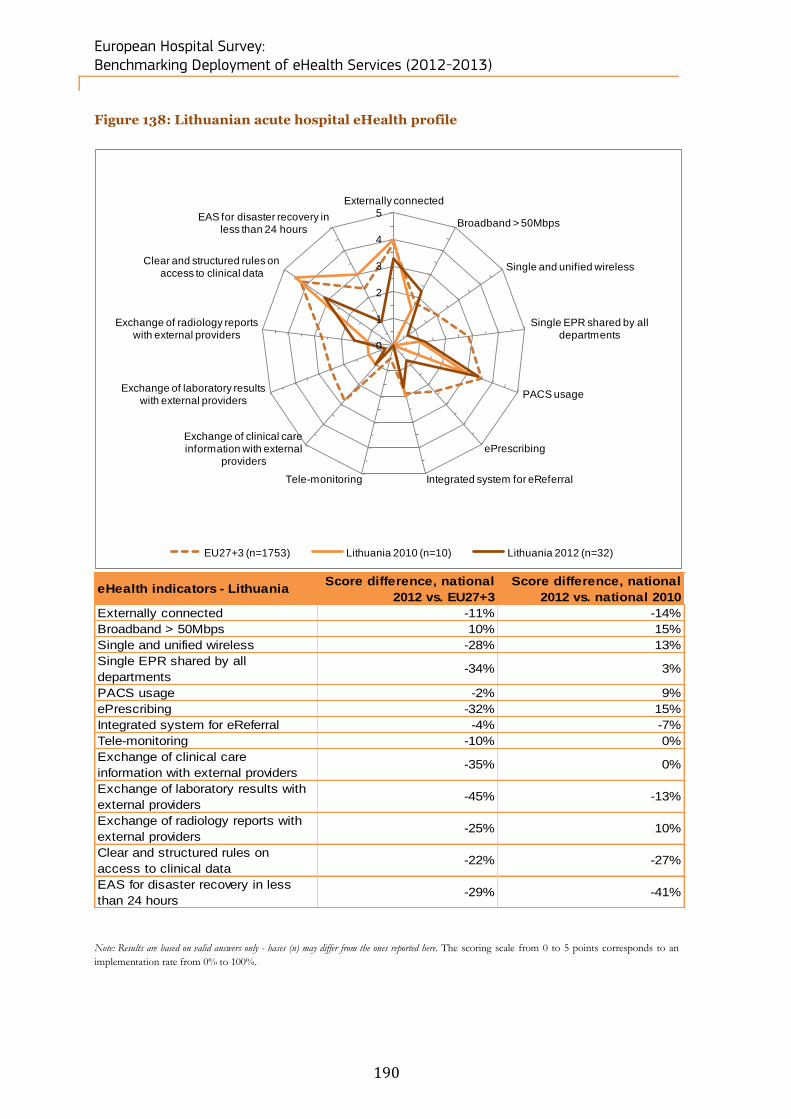
European Hospital Survey: Benchmarking Deployment of eHealth Services (2012-2013)
190
Figure 138: Lithuanian acute hospital eHealth profile
eHealth indicators - Lithuania Score difference, national
2012 vs. EU27+3
Score difference, national
2012 vs. national 2010
Externally connected -11% -14%
Broadband > 50Mbps 10% 15%
Single and unified wireless -28% 13%
Single EPR shared by all
departments-34% 3%
PACS usage -2% 9%
ePrescribing -32% 15%
Integrated system for eReferral -4% -7%
Tele-monitoring -10% 0%
Exchange of clinical care
information with external providers-35% 0%
Exchange of laboratory results with
external providers-45% -13%
Exchange of radiology reports with
external providers-25% 10%
Clear and structured rules on
access to clinical data-22% -27%
EAS for disaster recovery in less
than 24 hours-29% -41%
Note: Results are based on valid answers only - bases (n) may differ from the ones reported here. The scoring scale from 0 to 5 points corresponds to an
implementation rate from 0% to 100%.
0
1
2
3
4
5Externally connected
Broadband > 50Mbps
Single and unified wireless
Single EPR shared by all departments
PACS usage
ePrescribing
Integrated system for eReferralTele-monitoring
Exchange of clinical care information with external
providers
Exchange of laboratory results with external providers
Exchange of radiology reports with external providers
Clear and structured rules on access to clinical data
EAS for disaster recovery in less than 24 hours
EU27+3 (n=1753) Lithuania 2010 (n=10) Lithuania 2012 (n=32)
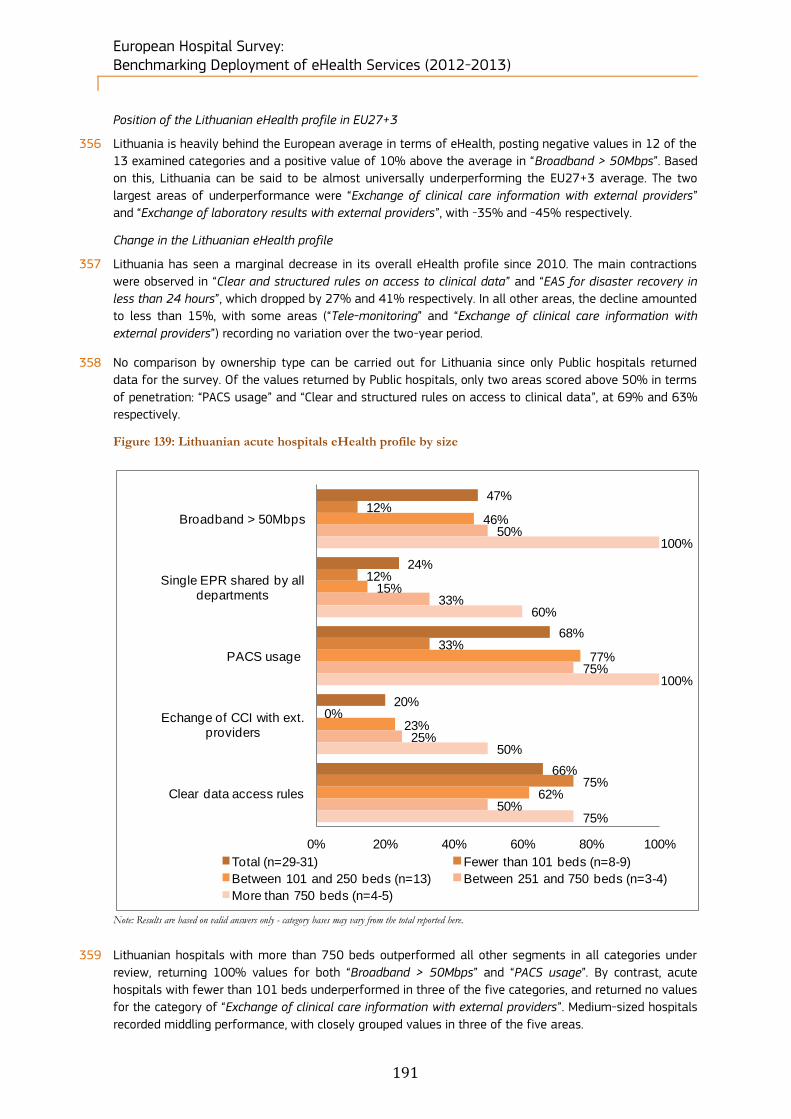
European Hospital Survey: Benchmarking Deployment of eHealth Services (2012-2013)
191
Position of the Lithuanian eHealth profile in EU27+3
356 Lithuania is heavily behind the European average in terms of eHealth, posting negative values in 12 of the
13 examined categories and a positive value of 10% above the average in “Broadband > 50Mbps”. Based
on this, Lithuania can be said to be almost universally underperforming the EU27+3 average. The two
largest areas of underperformance were “Exchange of clinical care information with external providers”
and “Exchange of laboratory results with external providers”, with -35% and -45% respectively.
Change in the Lithuanian eHealth profile
357 Lithuania has seen a marginal decrease in its overall eHealth profile since 2010. The main contractions
were observed in “Clear and structured rules on access to clinical data” and “EAS for disaster recovery in
less than 24 hours”, which dropped by 27% and 41% respectively. In all other areas, the decline amounted
to less than 15%, with some areas (“Tele-monitoring” and “Exchange of clinical care information with
external providers”) recording no variation over the two-year period.
358 No comparison by ownership type can be carried out for Lithuania since only Public hospitals returned
data for the survey. Of the values returned by Public hospitals, only two areas scored above 50% in terms
of penetration: “PACS usage” and “Clear and structured rules on access to clinical data”, at 69% and 63%
respectively.
Figure 139: Lithuanian acute hospitals eHealth profile by size
Note: Results are based on valid answers only - category bases may vary from the total reported here.
359 Lithuanian hospitals with more than 750 beds outperformed all other segments in all categories under
review, returning 100% values for both “Broadband > 50Mbps” and “PACS usage”. By contrast, acute
hospitals with fewer than 101 beds underperformed in three of the five categories, and returned no values
for the category of “Exchange of clinical care information with external providers”. Medium-sized hospitals
recorded middling performance, with closely grouped values in three of the five areas.
47%
24%
68%
20%
66%
12%
12%
33%
0%
75%
46%
15%
77%
23%
62%
50%
33%
75%
25%
50%
100%
60%
100%
50%
75%
0% 20% 40% 60% 80% 100%
Broadband > 50Mbps
Single EPR shared by all departments
PACS usage
Echange of CCI with ext. providers
Clear data access rules
Total (n=29-31) Fewer than 101 beds (n=8-9)
Between 101 and 250 beds (n=13) Between 251 and 750 beds (n=3-4)
More than 750 beds (n=4-5)

European Hospital Survey: Benchmarking Deployment of eHealth Services (2012-2013)
192
5.2.19 Luxembourg’s acute hospital eHealth profile
360 7 hospitals were identified in Luxembourg. Within this sample, 7 (100%) completed the screener part of
the questionnaire and, of these, 100% qualified as acute care hospitals. Of the 7 screened in, 3 acute
hospitals (43%) completed the survey.
The breakdown by hospital size has not changed significantly between 2010 and 2012.
Table 43: Luxembourgish breakdown by size of hospital
Luxembourg N= Fewer than
101 beds Between 101 and
250 beds Between 251 and
750 beds More than 750
beds Don’t know/ No answer
Census 7
2 - 5 - -
29% - 71% - -
2012 3 - - 3 - -
- - 100% - -
2010 3 1 - 2 - -
33% - 67% - -
361 The breakdown by ownership type has not changed significantly between 2010 and 2012.
Table 44: Luxembourgish breakdown by ownership type
Luxembourg N= Public Private Private not for profit Don't know/ No answer
Census 7
4 - 3 -
57% - 43% -
2012 3 1 - 2 -
33% - 67% -
2010 3 2 1 - -
67% 33% - -
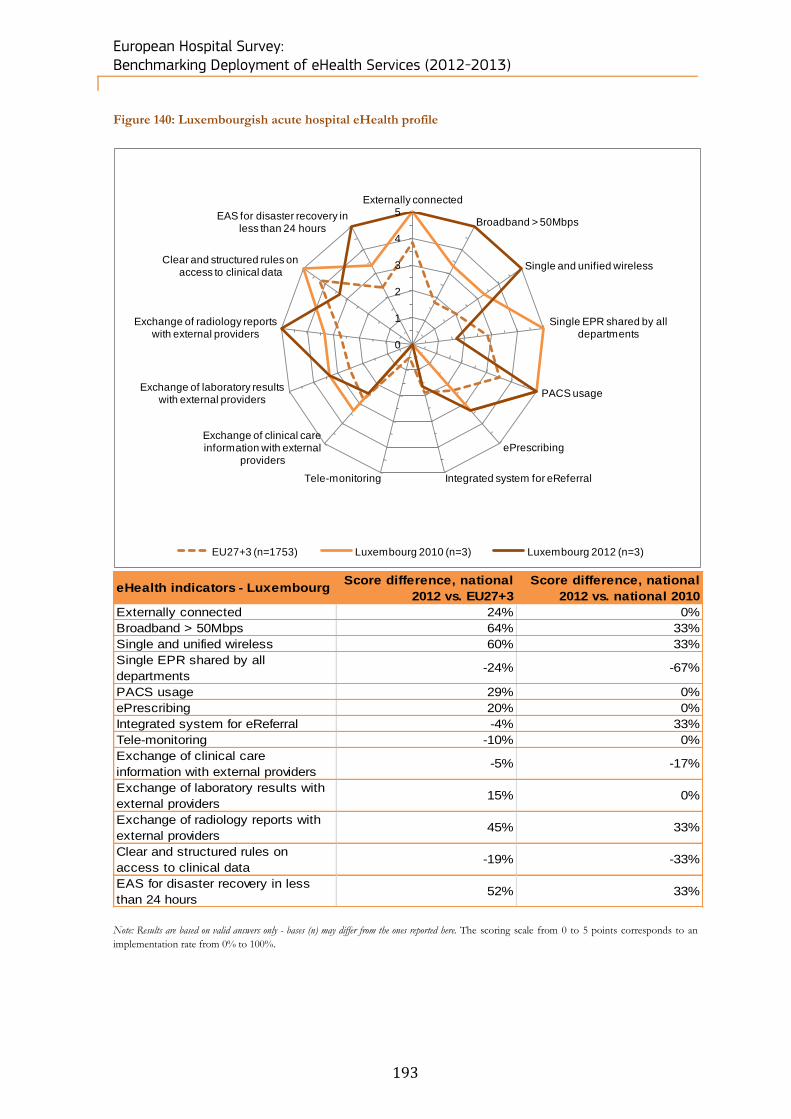
European Hospital Survey: Benchmarking Deployment of eHealth Services (2012-2013)
193
Figure 140: Luxembourgish acute hospital eHealth profile
eHealth indicators - Luxembourg Score difference, national
2012 vs. EU27+3
Score difference, national
2012 vs. national 2010
Externally connected 24% 0%
Broadband > 50Mbps 64% 33%
Single and unified wireless 60% 33%
Single EPR shared by all
departments-24% -67%
PACS usage 29% 0%
ePrescribing 20% 0%
Integrated system for eReferral -4% 33%
Tele-monitoring -10% 0%
Exchange of clinical care
information with external providers-5% -17%
Exchange of laboratory results with
external providers15% 0%
Exchange of radiology reports with
external providers45% 33%
Clear and structured rules on
access to clinical data-19% -33%
EAS for disaster recovery in less
than 24 hours52% 33%
Note: Results are based on valid answers only - bases (n) may differ from the ones reported here. The scoring scale from 0 to 5 points corresponds to an
implementation rate from 0% to 100%.
0
1
2
3
4
5Externally connected
Broadband > 50Mbps
Single and unified wireless
Single EPR shared by all departments
PACS usage
ePrescribing
Integrated system for eReferralTele-monitoring
Exchange of clinical care information with external
providers
Exchange of laboratory results with external providers
Exchange of radiology reports with external providers
Clear and structured rules on access to clinical data
EAS for disaster recovery in less than 24 hours
EU27+3 (n=1753) Luxembourg 2010 (n=3) Luxembourg 2012 (n=3)
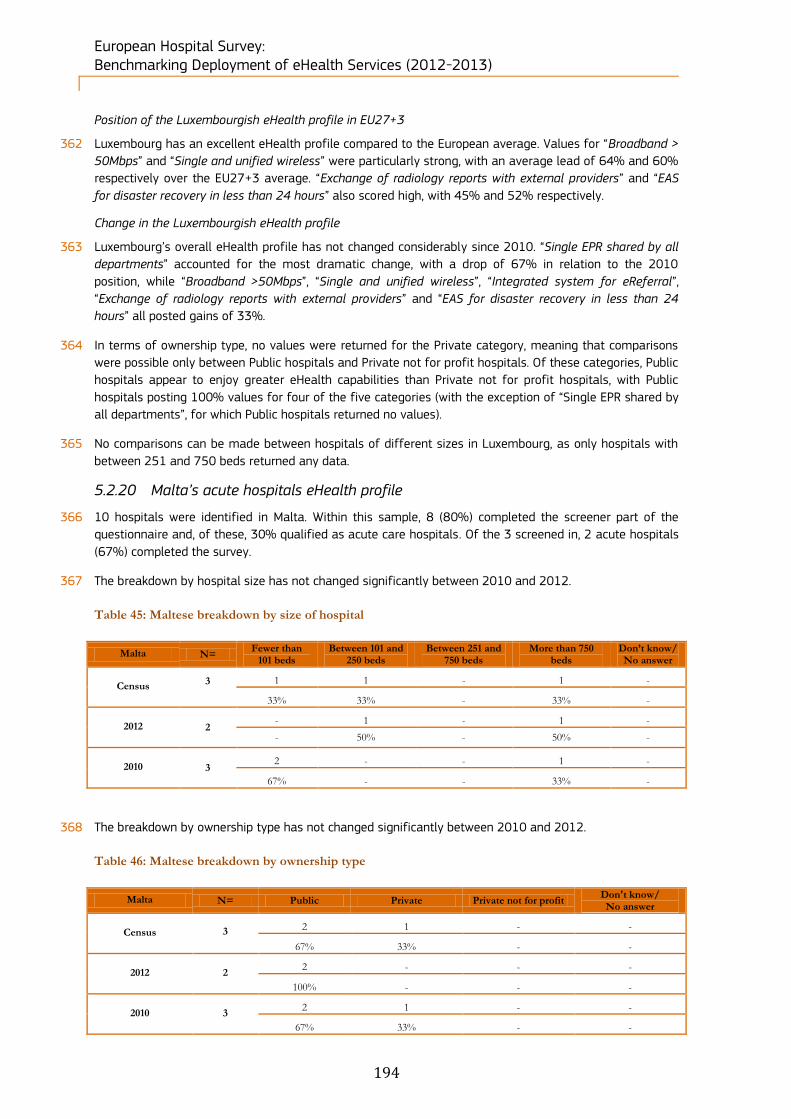
European Hospital Survey: Benchmarking Deployment of eHealth Services (2012-2013)
194
Position of the Luxembourgish eHealth profile in EU27+3
362 Luxembourg has an excellent eHealth profile compared to the European average. Values for “Broadband >
50Mbps” and “Single and unified wireless” were particularly strong, with an average lead of 64% and 60%
respectively over the EU27+3 average. “Exchange of radiology reports with external providers” and “EAS
for disaster recovery in less than 24 hours” also scored high, with 45% and 52% respectively.
Change in the Luxembourgish eHealth profile
363 Luxembourg’s overall eHealth profile has not changed considerably since 2010. “Single EPR shared by all
departments” accounted for the most dramatic change, with a drop of 67% in relation to the 2010
position, while “Broadband >50Mbps”, “Single and unified wireless”, “Integrated system for eReferral”,
“Exchange of radiology reports with external providers” and “EAS for disaster recovery in less than 24
hours” all posted gains of 33%.
364 In terms of ownership type, no values were returned for the Private category, meaning that comparisons
were possible only between Public hospitals and Private not for profit hospitals. Of these categories, Public
hospitals appear to enjoy greater eHealth capabilities than Private not for profit hospitals, with Public
hospitals posting 100% values for four of the five categories (with the exception of “Single EPR shared by
all departments”, for which Public hospitals returned no values).
365 No comparisons can be made between hospitals of different sizes in Luxembourg, as only hospitals with
between 251 and 750 beds returned any data.
5.2.20 Malta’s acute hospitals eHealth profile
366 10 hospitals were identified in Malta. Within this sample, 8 (80%) completed the screener part of the
questionnaire and, of these, 30% qualified as acute care hospitals. Of the 3 screened in, 2 acute hospitals
(67%) completed the survey.
367 The breakdown by hospital size has not changed significantly between 2010 and 2012.
Table 45: Maltese breakdown by size of hospital
Malta N= Fewer than
101 beds Between 101 and
250 beds Between 251 and
750 beds More than 750
beds Don’t know/ No answer
Census 3
1 1 - 1 -
33% 33% - 33% -
2012 2 - 1 - 1 -
- 50% - 50% -
2010 3 2 - - 1 -
67% - - 33% -
368 The breakdown by ownership type has not changed significantly between 2010 and 2012.
Table 46: Maltese breakdown by ownership type
Malta N= Public Private Private not for profit Don't know/ No answer
Census 3
2 1 - -
67% 33% - -
2012 2 2 - - -
100% - - -
2010 3 2 1 - -
67% 33% - -

European Hospital Survey: Benchmarking Deployment of eHealth Services (2012-2013)
195
Figure 141: Maltese acute hospital eHealth profile
eHealth indicators - Malta Score difference, national
2012 vs. EU27+3
Score difference, national
2012 vs. national 2010
Externally connected -26% 17%
Broadband > 50Mbps -36% -67%
Single and unified wireless -40% -33%
Single EPR shared by all
departments-7% 50%
PACS usage 29% 33%
ePrescribing -47% 0%
Integrated system for eReferral -38% -33%
Tele-monitoring -10% 0%
Exchange of clinical care
information with external providers45% 67%
Exchange of laboratory results with
external providers49% 67%
Exchange of radiology reports with
external providers45% 67%
Clear and structured rules on
access to clinical data-85% -67%
EAS for disaster recovery in less
than 24 hours-48% -33%
Note: Results are based on valid answers only - bases (n) may differ from the ones reported here. The scoring scale from 0 to 5 points corresponds to an
implementation rate from 0% to 100%.
0
1
2
3
4
5Externally connected
Broadband > 50Mbps
Single and unified wireless
Single EPR shared by all departments
PACS usage
ePrescribing
Integrated system for eReferralTele-monitoring
Exchange of clinical care information with external
providers
Exchange of laboratory results with external providers
Exchange of radiology reports with external providers
Clear and structured rules on access to clinical data
EAS for disaster recovery in less than 24 hours
EU27+3 (n=1753) Malta 2010 (n=3) Malta 2012 (n=2)
European Hospital Survey: Benchmarking Deployment of eHealth Services (2012-2013)
196
Position of the Maltese eHealth profile in EU27+3
369 Malta trails the European average in eHealth, with significant discrepancies in four of the 13 areas
examined. These are “Single and unified wireless” (-40%), “ePrescribing” (-47%), “Clear and structured
rules on access to clinical data” (-85%) and “EAS for disaster recovery in less than 24 hours” (-48%).
However, for “Exchange of clinical care information with external providers”, “Exchange of laboratory
results with external providers” and “Exchange of radiology reports with external providers” Malta
outperformed the EU27+3 mean by over 45% in each category.
Change in the Maltese eHealth profile
370 Since 2010, Malta has made progress on its eHealth profile. “Exchange of clinical care information with
external providers”, “Exchange of laboratory results with external providers” and “Exchange of radiology
reports with external providers” each recorded gains of 67% between 2010 and 2012.
371 The data returned by Maltese hospitals in terms of ownership type was not sufficient to allow a
comparative analysis. Similarly, for Public hospitals, data was not available for two of the five categories
under examination, although of the three areas which did return data, Maltese acute hospitals posted
100% penetration for both “PACS usage” and “Exchange of clinical care information with external
providers”.
372 All Maltese hospitals that could provide data posted 100% penetration for the following eHealth
capabilities: “Single EPR shared by all departments”, “PACS usage” and “Exchange of clinical care
information with external providers”. The segments covering fewer than 101 beds and between
101 and 250 beds returned no data.
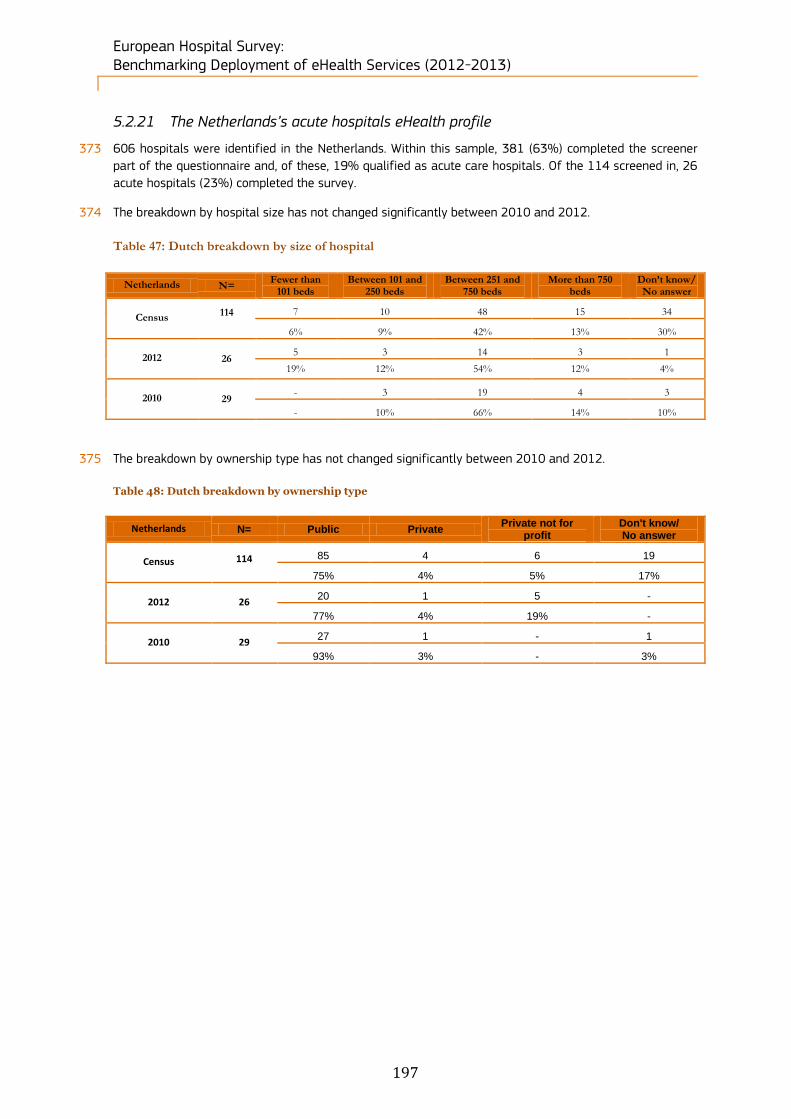
European Hospital Survey: Benchmarking Deployment of eHealth Services (2012-2013)
197
5.2.21 The Netherlands’s acute hospitals eHealth profile
373 606 hospitals were identified in the Netherlands. Within this sample, 381 (63%) completed the screener
part of the questionnaire and, of these, 19% qualified as acute care hospitals. Of the 114 screened in, 26
acute hospitals (23%) completed the survey.
374 The breakdown by hospital size has not changed significantly between 2010 and 2012.
Table 47: Dutch breakdown by size of hospital
Netherlands N= Fewer than
101 beds Between 101 and
250 beds Between 251 and
750 beds More than 750
beds Don’t know/ No answer
Census 114
7 10 48 15 34
6% 9% 42% 13% 30%
2012 26 5 3 14 3 1
19% 12% 54% 12% 4%
2010 29 - 3 19 4 3
- 10% 66% 14% 10%
375 The breakdown by ownership type has not changed significantly between 2010 and 2012.
Table 48: Dutch breakdown by ownership type
Netherlands N= Public Private Private not for
profit Don't know/ No answer
Census 114
85 4 6 19
75% 4% 5% 17%
2012 26 20 1 5 -
77% 4% 19% -
2010 29 27 1 - 1
93% 3% - 3%

European Hospital Survey: Benchmarking Deployment of eHealth Services (2012-2013)
198
Figure 142: Dutch acute hospital eHealth profile
eHealth indicators - Netherlands Score difference, national
2012 vs. EU27+3
Score difference, national
2012 vs. national 2010
Externally connected -8% -22%
Broadband > 50Mbps 45% 10%
Single and unified wireless 18% 13%
Single EPR shared by all
departments16% 8%
PACS usage 21% -4%
ePrescribing 25% 24%
Integrated system for eReferral 30% -15%
Tele-monitoring 3% 68%
Exchange of clinical care
information with external providers33% 8%
Exchange of laboratory results with
external providers33% 3%
Exchange of radiology reports with
external providers21% -9%
Clear and structured rules on
access to clinical data3% -12%
EAS for disaster recovery in less
than 24 hours21% 8%
Note: Results are based on valid answers only - bases (n) may differ from the ones reported here. The scoring scale from 0 to 5 points
corresponds to an implementation rate from 0% to 100%.
0
1
2
3
4
5Externally connected
Broadband > 50Mbps
Single and unified wireless
Single EPR shared by all departments
PACS usage
ePrescribing
Integrated system for eReferralTele-monitoring
Exchange of clinical care information with external
providers
Exchange of laboratory results with external providers
Exchange of radiology reports with external providers
Clear and structured rules on access to clinical data
EAS for disaster recovery in less than 24 hours
EU27+3 (n=1753) Netherlands 2010 (n=29) Netherlands 2012 (n=26)

European Hospital Survey: Benchmarking Deployment of eHealth Services (2012-2013)
199
Position of the Dutch eHealth profile in EU27+3
376 The Netherlands outperforms the European eHealth profile by a wide margin, with “Broadband > 50Mbps”
45% in excess of the European average. This high performance is distributed evenly across all sectors,
with only one indicator of the 13 under review scoring below the EU27+3 average (“Externally connected”
at -8%).
Change in the Dutch eHealth profile
377 The Dutch eHealth profile has improved between 2010 and 2012. The single largest gain was realised in
the area of “Tele-monitoring”, which increased by 68% over the period. By contrast, “Externally connected”,
“PACS usage”, “Integrated system for eReferral”, “Exchange of radiology reports with external providers”
and “Clear and structured rules on access to clinical data” all posted negative growth; however, with the
exception of “Externally connected” these reductions did not exceed 15%.
Figure 143: Dutch acute hospitals eHealth profile by ownership
Note: Results are based on valid answers only - category bases may vary from the total reported here.
378 When considering capabilities based on the ownership type of the hospital in question, in the Netherlands
we can observe that both Private and Private not for profit hospitals lead in all five categories: “Broadband
> 50Mbps”, “Single EPR shared by all departments”, “PACS usage”, “Exchange of clinical care information
with external providers” and “Clear and structured rules on access to clinical data”. Public hospitals, by
contrast, lag behind in all these categories, with gaps of up to 30% (“Single EPR shared by all
departments”).
81%
73%
92%
88%
88%
75%
70%
95%
90%
85%
100%
0%
0%
100%
100%
100%
100%
100%
80%
100%
0% 20% 40% 60% 80% 100%
Broadband > 50Mbps
Single EPR shared by all departments
PACS usage
Echange of CCI with ext. providers
Clear data access rules
Total (n=26) Public (n=20) Private (n=1) Private not for profit (n=5)
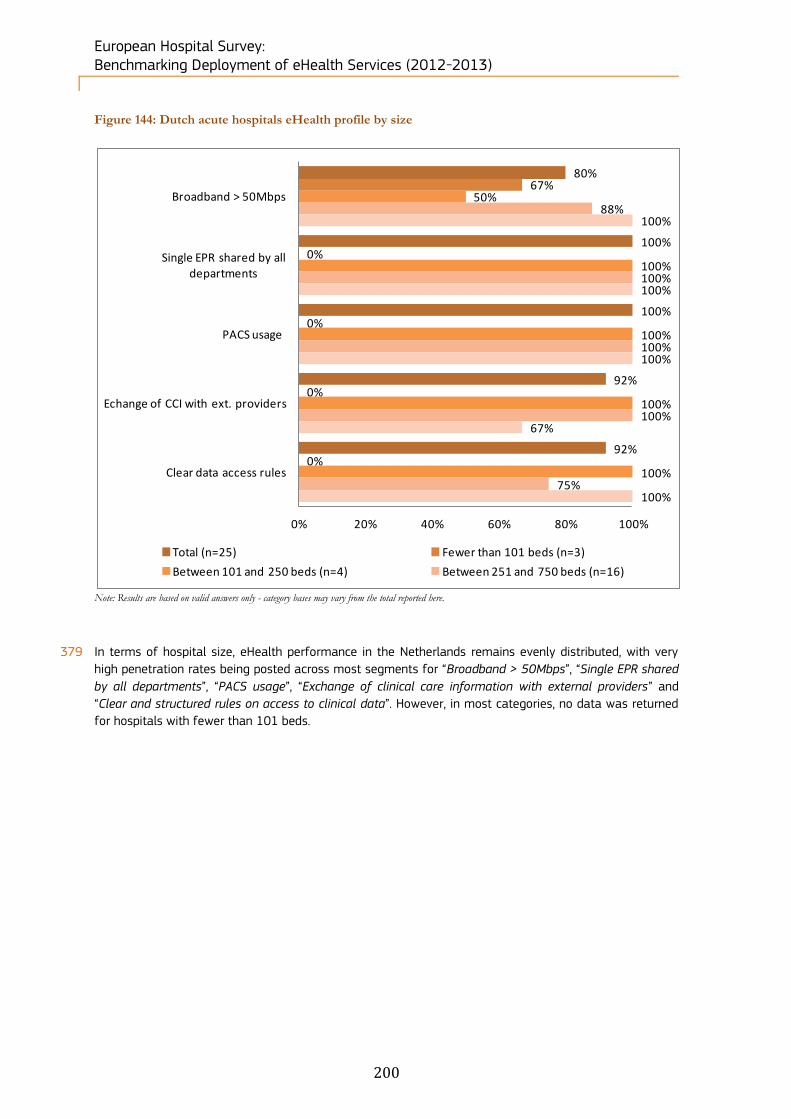
European Hospital Survey: Benchmarking Deployment of eHealth Services (2012-2013)
200
Figure 144: Dutch acute hospitals eHealth profile by size
Note: Results are based on valid answers only - category bases may vary from the total reported here.
379 In terms of hospital size, eHealth performance in the Netherlands remains evenly distributed, with very
high penetration rates being posted across most segments for “Broadband > 50Mbps”, “Single EPR shared
by all departments”, “PACS usage”, “Exchange of clinical care information with external providers” and
“Clear and structured rules on access to clinical data”. However, in most categories, no data was returned
for hospitals with fewer than 101 beds.
80%
100%
100%
92%
92%
67%
0%
0%
0%
0%
50%
100%
100%
100%
100%
88%
100%
100%
100%
75%
100%
100%
100%
67%
100%
0% 20% 40% 60% 80% 100%
Broadband > 50Mbps
Single EPR shared by all departments
PACS usage
Echange of CCI with ext. providers
Clear data access rules
Total (n=25) Fewer than 101 beds (n=3)
Between 101 and 250 beds (n=4) Between 251 and 750 beds (n=16)

European Hospital Survey: Benchmarking Deployment of eHealth Services (2012-2013)
201
5.2.22 Norway’s acute hospitals eHealth profile
380 100 hospitals were identified in Norway. Within this sample, 75 (75%) completed the screener part of the
questionnaire and, of these, 28% qualified as acute care hospitals. Of the 28 screened in, 6 acute
hospitals (21%) completed the survey.
381 The breakdown by hospital size has not changed significantly between 2010 and 2012.
Table 49: Norwegian breakdown by size of hospital
Norway N= Fewer than
101 beds Between 101 and
250 beds Between 251 and
750 beds More than 750
beds Don’t know/ No answer
Census 28
12 6 4 3 3
43% 21% 14% 11% 11%
2012 6 2 2 1 1 -
33% 33% 17% 17% -
2010 7 1 2 3 1 -
14% 29% 43% 14% -
382 The breakdown by ownership type has not changed significantly between 2010 and 2012.
Table 50: Norwegian breakdown by ownership type
Norway N= Public Private Private not for profit Don't know/ No answer
Census 28
21 4 1 2
75% 14% 4% 7%
2012 6 3 3 - -
50% 50% - -
2010 7 6 - 1 -
86% - 14% -
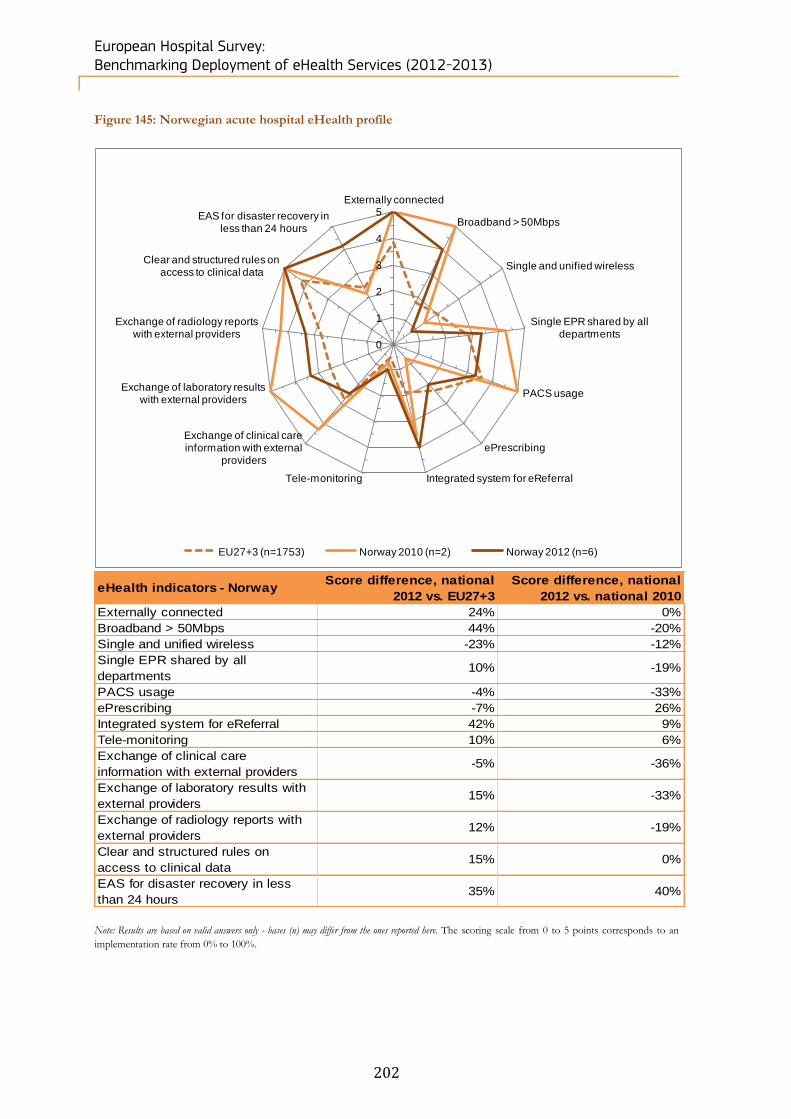
European Hospital Survey: Benchmarking Deployment of eHealth Services (2012-2013)
202
Figure 145: Norwegian acute hospital eHealth profile
eHealth indicators - Norway Score difference, national
2012 vs. EU27+3
Score difference, national
2012 vs. national 2010
Externally connected 24% 0%
Broadband > 50Mbps 44% -20%
Single and unified wireless -23% -12%
Single EPR shared by all
departments10% -19%
PACS usage -4% -33%
ePrescribing -7% 26%
Integrated system for eReferral 42% 9%
Tele-monitoring 10% 6%
Exchange of clinical care
information with external providers-5% -36%
Exchange of laboratory results with
external providers15% -33%
Exchange of radiology reports with
external providers12% -19%
Clear and structured rules on
access to clinical data15% 0%
EAS for disaster recovery in less
than 24 hours35% 40%
Note: Results are based on valid answers only - bases (n) may differ from the ones reported here. The scoring scale from 0 to 5 points corresponds to an
implementation rate from 0% to 100%.
0
1
2
3
4
5Externally connected
Broadband > 50Mbps
Single and unified wireless
Single EPR shared by all departments
PACS usage
ePrescribing
Integrated system for eReferralTele-monitoring
Exchange of clinical care information with external
providers
Exchange of laboratory results with external providers
Exchange of radiology reports with external providers
Clear and structured rules on access to clinical data
EAS for disaster recovery in less than 24 hours
EU27+3 (n=1753) Norway 2010 (n=2) Norway 2012 (n=6)

European Hospital Survey: Benchmarking Deployment of eHealth Services (2012-2013)
203
Position of the Norwegian eHealth profile in EU27+3
383 Norway is most strongly represented in the areas of “Broadband > 50Mbps” and “Integrated system for
eReferral” for which it is ahead by 44% and 42% respectively. The country is slightly behind in terms of
“Single and unified wireless” (-23%), “PACS usage” (-4%), “ePrescribing” (-7%) and “Exchange of clinical
care information with external providers” (-5%).
Change in the Norwegian eHealth profile
384 Norway’s eHealth profile has declined in relation to 2010, with nine of 13 areas posting zero growth or
negative growth in 2012. This reduction was fairly evenly distributed, with the largest decreases registered
in “PACS usage” (-33%), “Exchange of clinical care information with external providers” (-36%) and
“Exchange of laboratory results with external providers” (-33%).
Figure 146: Norwegian acute hospitals eHealth profile by ownership
Note: Results are based on valid answers only - category bases may vary from the total reported here.
385 Although Private not for profit hospitals did not return any results for Norway, a clear comparison can still
be made between Public and Private hospitals in terms of eHealth capabilities. Public hospitals in Norway
recorded full implementation in all five areas under scrutiny and outperformed Private hospitals by a wide
margin in the areas of “Broadband > 50Mbps”, “Single EPR shared by all departments” and “PACS usage”,
with differences ranging between 33 and 67 percentage points.
80%
67%
67%
50%
100%
100%
100%
100%
100%
100%
67%
33%
33%
0%
100%
0%
0%
0%
0%
0%
0% 20% 40% 60% 80% 100%
Broadband > 50Mbps
Single EPR shared by all departments
PACS usage
Echange of CCI with ext. providers
Clear data access rules
Total (n=5-6) Public (n=2-3) Private (n=3) Private not for prof it (n=0)
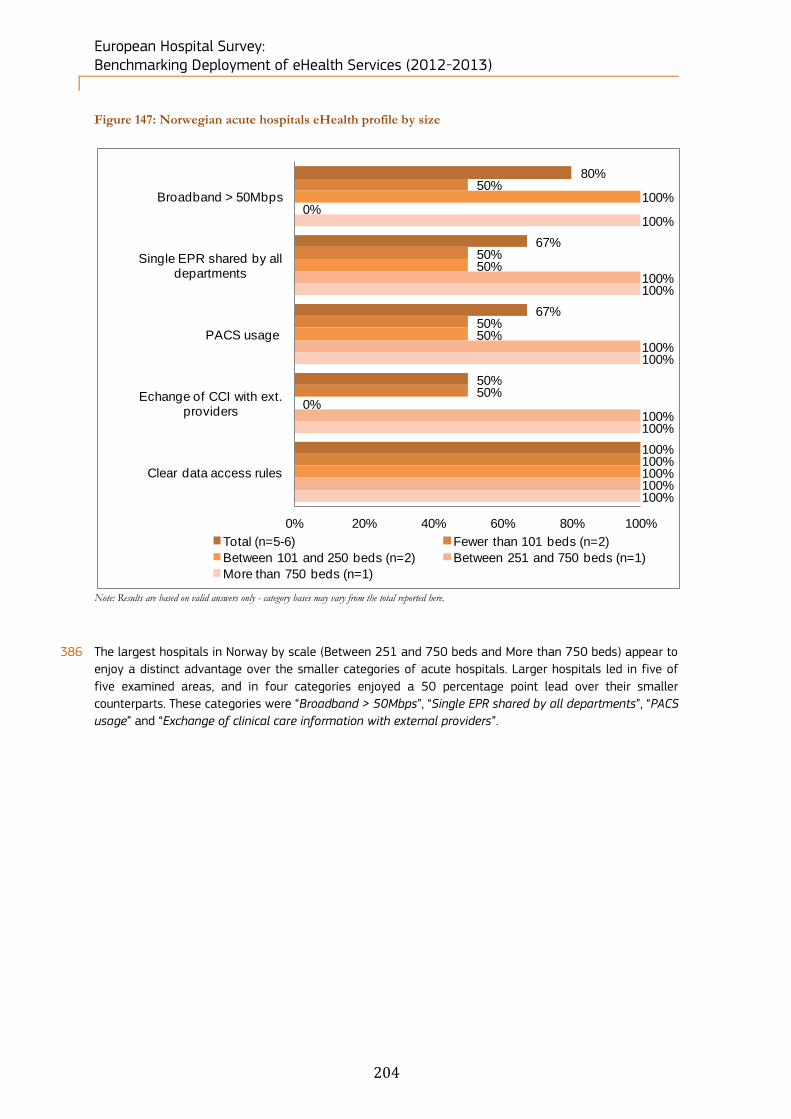
European Hospital Survey: Benchmarking Deployment of eHealth Services (2012-2013)
204
Figure 147: Norwegian acute hospitals eHealth profile by size
Note: Results are based on valid answers only - category bases may vary from the total reported here.
386 The largest hospitals in Norway by scale (Between 251 and 750 beds and More than 750 beds) appear to
enjoy a distinct advantage over the smaller categories of acute hospitals. Larger hospitals led in five of
five examined areas, and in four categories enjoyed a 50 percentage point lead over their smaller
counterparts. These categories were “Broadband > 50Mbps”, “Single EPR shared by all departments”, “PACS
usage” and “Exchange of clinical care information with external providers”.
80%
67%
67%
50%
100%
50%
50%
50%
50%
100%
100%
50%
50%
0%
100%
0%
100%
100%
100%
100%
100%
100%
100%
100%
100%
0% 20% 40% 60% 80% 100%
Broadband > 50Mbps
Single EPR shared by all departments
PACS usage
Echange of CCI with ext. providers
Clear data access rules
Total (n=5-6) Fewer than 101 beds (n=2)
Between 101 and 250 beds (n=2) Between 251 and 750 beds (n=1)
More than 750 beds (n=1)
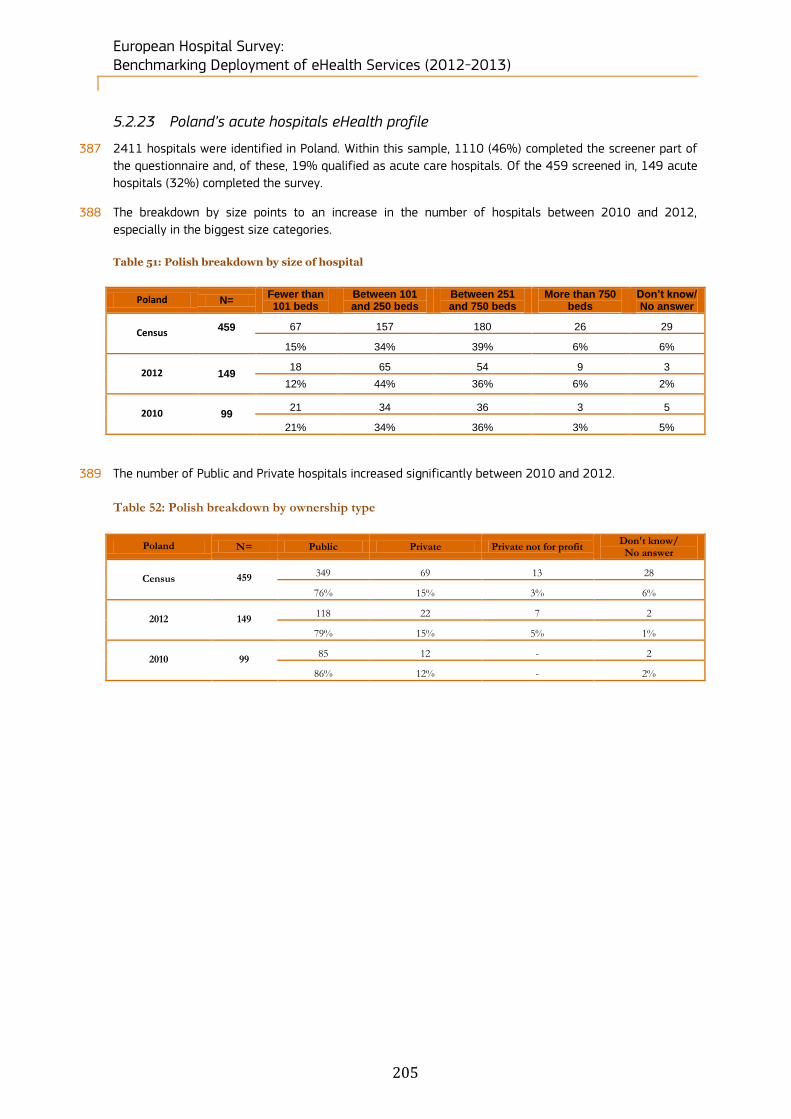
European Hospital Survey: Benchmarking Deployment of eHealth Services (2012-2013)
205
5.2.23 Poland’s acute hospitals eHealth profile
387 2411 hospitals were identified in Poland. Within this sample, 1110 (46%) completed the screener part of
the questionnaire and, of these, 19% qualified as acute care hospitals. Of the 459 screened in, 149 acute
hospitals (32%) completed the survey.
388 The breakdown by size points to an increase in the number of hospitals between 2010 and 2012,
especially in the biggest size categories.
Table 51: Polish breakdown by size of hospital
Poland N= Fewer than 101 beds
Between 101 and 250 beds
Between 251 and 750 beds
More than 750 beds
Don’t know/ No answer
Census 459
67 157 180 26 29
15% 34% 39% 6% 6%
2012 149 18 65 54 9 3
12% 44% 36% 6% 2%
2010 99 21 34 36 3 5
21% 34% 36% 3% 5%
389 The number of Public and Private hospitals increased significantly between 2010 and 2012.
Table 52: Polish breakdown by ownership type
Poland N= Public Private Private not for profit Don't know/ No answer
Census 459
349 69 13 28
76% 15% 3% 6%
2012 149 118 22 7 2
79% 15% 5% 1%
2010 99 85 12 - 2
86% 12% - 2%

European Hospital Survey: Benchmarking Deployment of eHealth Services (2012-2013)
206
Figure 148: Polish acute hospital eHealth profile
eHealth indicators - Poland Score difference, national
2012 vs. EU27+3
Score difference, national
2012 vs. national 2010
Externally connected -21% 30%
Broadband > 50Mbps -25% -5%
Single and unified wireless -28% 6%
Single EPR shared by all
departments-7% -4%
PACS usage -3% 18%
ePrescribing -22% 13%
Integrated system for eReferral -9% 5%
Tele-monitoring -6% -1%
Exchange of clinical care
information with external providers-30% 8%
Exchange of laboratory results with
external providers-29% 14%
Exchange of radiology reports with
external providers-20% 21%
Clear and structured rules on
access to clinical data-9% -14%
EAS for disaster recovery in less
than 24 hours-16% -41%
Note: Results are based on valid answers only - bases (n) may differ from the ones reported here. The scoring scale from 0 to 5 points corresponds to an
implementation rate from 0% to 100%.
0
1
2
3
4
5Externally connected
Broadband > 50Mbps
Single and unified wireless
Single EPR shared by all departments
PACS usage
ePrescribing
Integrated system for eReferralTele-monitoring
Exchange of clinical care information with external
providers
Exchange of laboratory results with external providers
Exchange of radiology reports with external providers
Clear and structured rules on access to clinical data
EAS for disaster recovery in less than 24 hours
EU27+3 (n=1753) Poland 2010 (n=99) Poland 2012 (n=149)
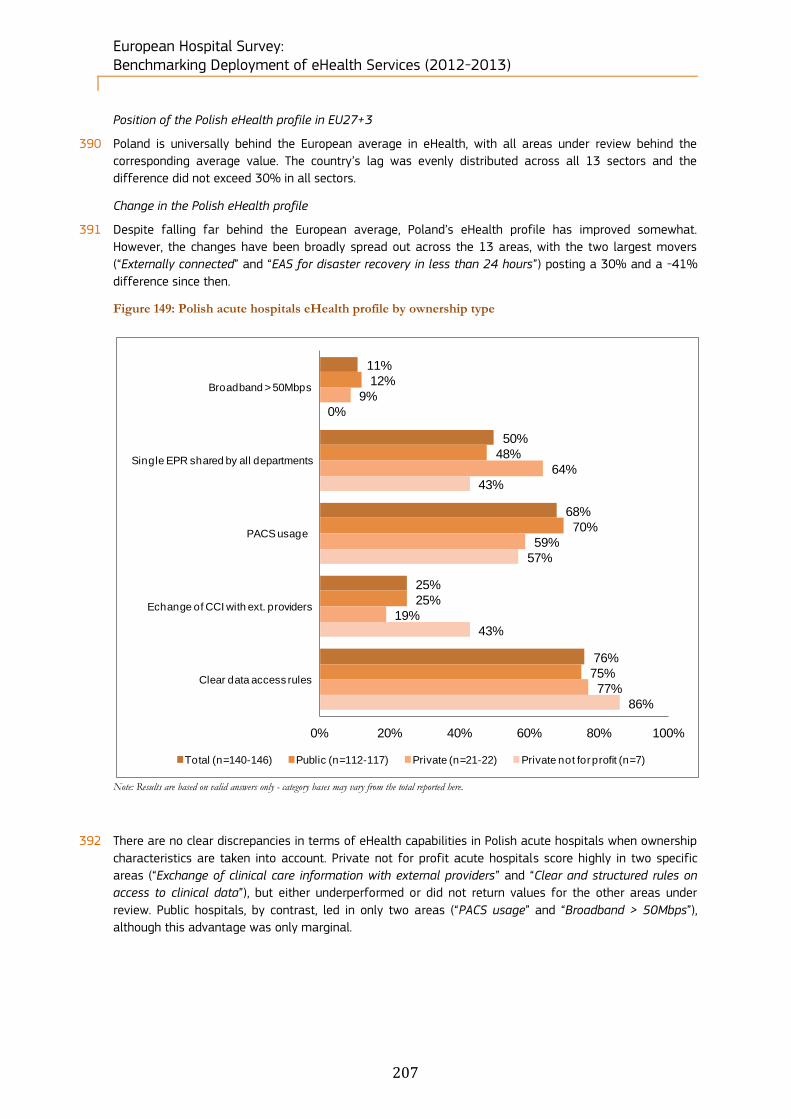
European Hospital Survey: Benchmarking Deployment of eHealth Services (2012-2013)
207
Position of the Polish eHealth profile in EU27+3
390 Poland is universally behind the European average in eHealth, with all areas under review behind the
corresponding average value. The country’s lag was evenly distributed across all 13 sectors and the
difference did not exceed 30% in all sectors.
Change in the Polish eHealth profile
391 Despite falling far behind the European average, Poland’s eHealth profile has improved somewhat.
However, the changes have been broadly spread out across the 13 areas, with the two largest movers
(“Externally connected” and “EAS for disaster recovery in less than 24 hours”) posting a 30% and a -41%
difference since then.
Figure 149: Polish acute hospitals eHealth profile by ownership type
Note: Results are based on valid answers only - category bases may vary from the total reported here.
392 There are no clear discrepancies in terms of eHealth capabilities in Polish acute hospitals when ownership
characteristics are taken into account. Private not for profit acute hospitals score highly in two specific
areas (“Exchange of clinical care information with external providers” and “Clear and structured rules on
access to clinical data”), but either underperformed or did not return values for the other areas under
review. Public hospitals, by contrast, led in only two areas (“PACS usage” and “Broadband > 50Mbps”),
although this advantage was only marginal.
11%
50%
68%
25%
76%
12%
48%
70%
25%
75%
9%
64%
59%
19%
77%
0%
43%
57%
43%
86%
0% 20% 40% 60% 80% 100%
Broadband > 50Mbps
Single EPR shared by all departments
PACS usage
Echange of CCI with ext. providers
Clear data access rules
Total (n=140-146) Public (n=112-117) Private (n=21-22) Private not for profit (n=7)
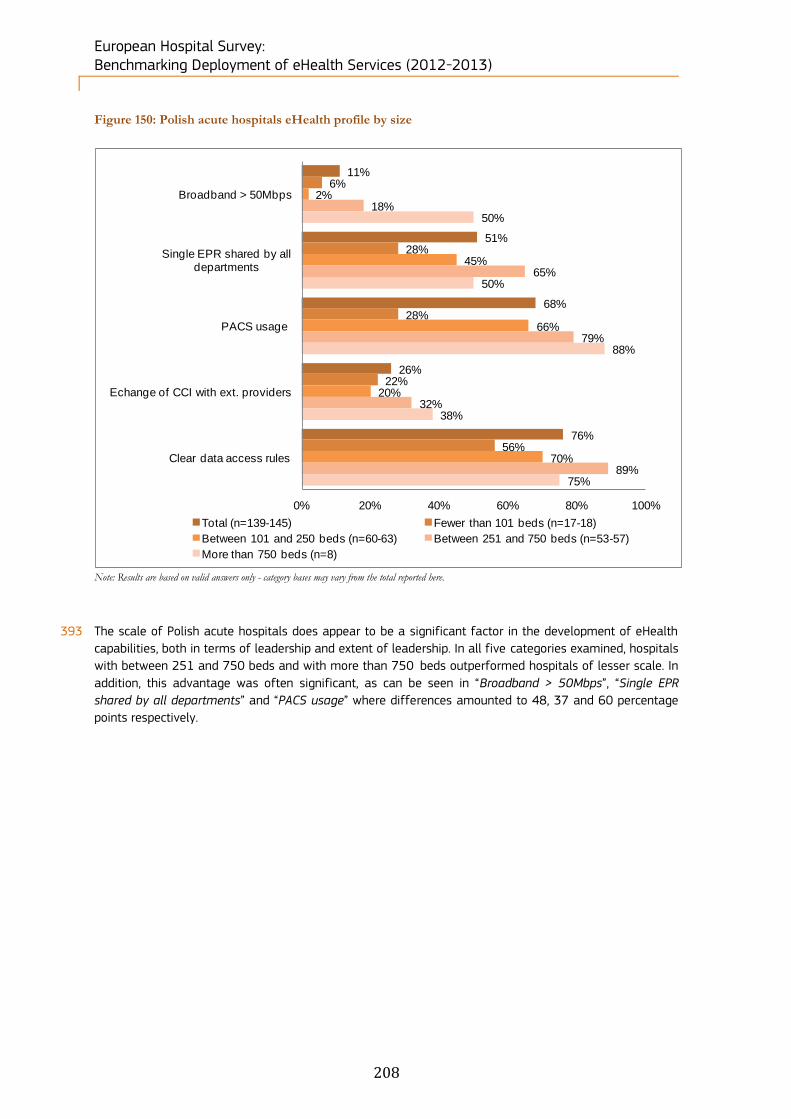
European Hospital Survey: Benchmarking Deployment of eHealth Services (2012-2013)
208
Figure 150: Polish acute hospitals eHealth profile by size
Note: Results are based on valid answers only - category bases may vary from the total reported here.
393 The scale of Polish acute hospitals does appear to be a significant factor in the development of eHealth
capabilities, both in terms of leadership and extent of leadership. In all five categories examined, hospitals
with between 251 and 750 beds and with more than 750 beds outperformed hospitals of lesser scale. In
addition, this advantage was often significant, as can be seen in “Broadband > 50Mbps”, “Single EPR
shared by all departments” and “PACS usage” where differences amounted to 48, 37 and 60 percentage
points respectively.
11%
51%
68%
26%
76%
6%
28%
28%
22%
56%
2%
45%
66%
20%
70%
18%
65%
79%
32%
89%
50%
50%
88%
38%
75%
0% 20% 40% 60% 80% 100%
Broadband > 50Mbps
Single EPR shared by all departments
PACS usage
Echange of CCI with ext. providers
Clear data access rules
Total (n=139-145) Fewer than 101 beds (n=17-18)
Between 101 and 250 beds (n=60-63) Between 251 and 750 beds (n=53-57)
More than 750 beds (n=8)
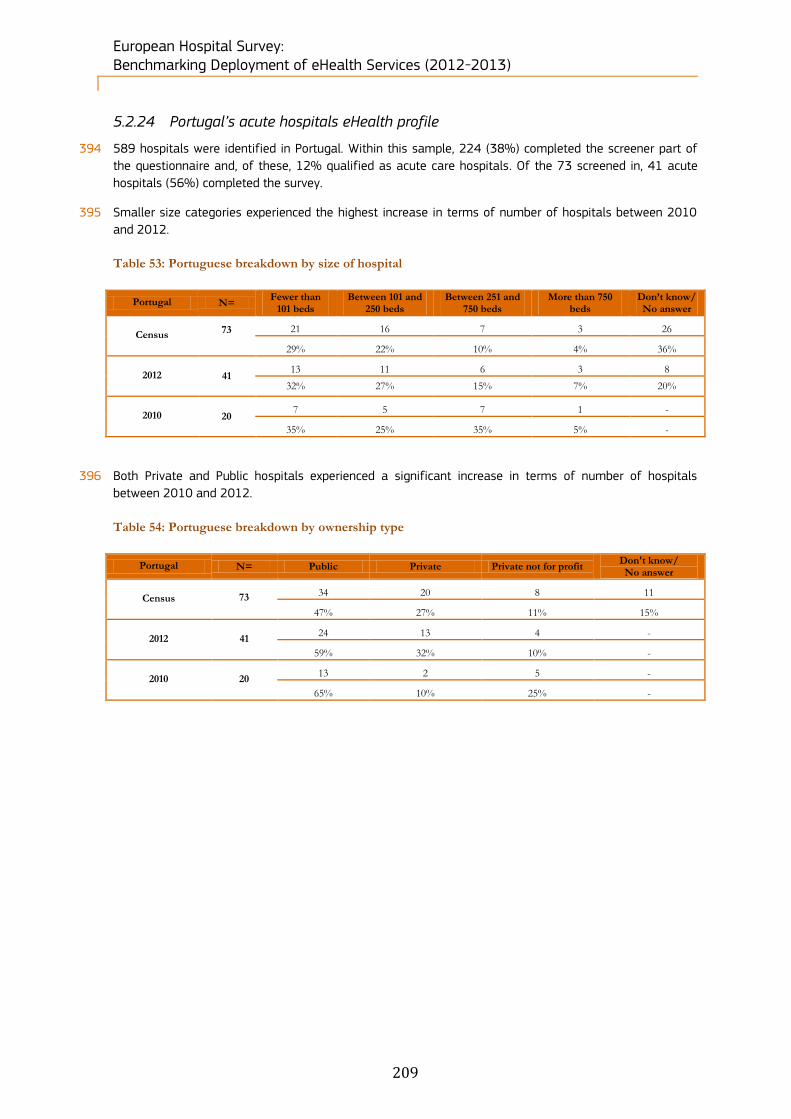
European Hospital Survey: Benchmarking Deployment of eHealth Services (2012-2013)
209
5.2.24 Portugal’s acute hospitals eHealth profile
394 589 hospitals were identified in Portugal. Within this sample, 224 (38%) completed the screener part of
the questionnaire and, of these, 12% qualified as acute care hospitals. Of the 73 screened in, 41 acute
hospitals (56%) completed the survey.
395 Smaller size categories experienced the highest increase in terms of number of hospitals between 2010
and 2012.
Table 53: Portuguese breakdown by size of hospital
Portugal N= Fewer than
101 beds Between 101 and
250 beds Between 251 and
750 beds More than 750
beds Don’t know/ No answer
Census 73
21 16 7 3 26
29% 22% 10% 4% 36%
2012 41 13 11 6 3 8
32% 27% 15% 7% 20%
2010 20 7 5 7 1 -
35% 25% 35% 5% -
396 Both Private and Public hospitals experienced a significant increase in terms of number of hospitals
between 2010 and 2012.
Table 54: Portuguese breakdown by ownership type
Portugal N= Public Private Private not for profit Don't know/ No answer
Census 73
34 20 8 11
47% 27% 11% 15%
2012 41 24 13 4 -
59% 32% 10% -
2010 20 13 2 5 -
65% 10% 25% -

European Hospital Survey: Benchmarking Deployment of eHealth Services (2012-2013)
210
Figure 151: Portuguese acute hospital eHealth profile
eHealth indicators - Portugal Score difference, national
2012 vs. EU27+3
Score difference, national
2012 vs. national 2010
Externally connected 9% 5%
Broadband > 50Mbps 30% 31%
Single and unified wireless 10% 25%
Single EPR shared by all
departments6% -28%
PACS usage 12% -12%
ePrescribing 48% 15%
Integrated system for eReferral -23% -40%
Tele-monitoring -5% 0%
Exchange of clinical care
information with external providers11% 17%
Exchange of laboratory results with
external providers-4% 28%
Exchange of radiology reports with
external providers-1% 19%
Clear and structured rules on
access to clinical data-1% 0%
EAS for disaster recovery in less
than 24 hours-17% -22%
Note: Results are based on valid answers only - bases (n) may differ from the ones reported here. The scoring scale from 0 to 5 points corresponds to an
implementation rate from 0% to 100%.
0
1
2
3
4
5Externally connected
Broadband > 50Mbps
Single and unified wireless
Single EPR shared by all departments
PACS usage
ePrescribing
Integrated system for eReferralTele-monitoring
Exchange of clinical care information with external
providers
Exchange of laboratory results with external providers
Exchange of radiology reports with external providers
Clear and structured rules on access to clinical data
EAS for disaster recovery in less than 24 hours
EU27+3 (n=1753) Portugal 2010 (n=20) Portugal 2012 (n=41)
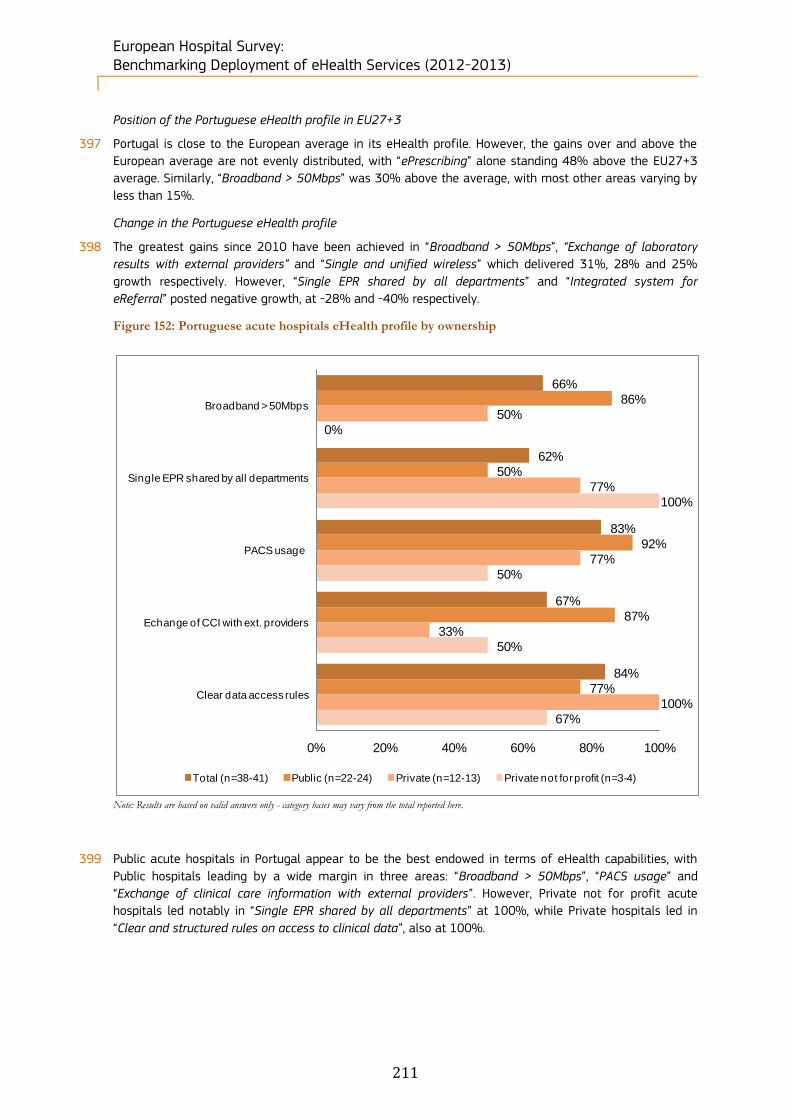
European Hospital Survey: Benchmarking Deployment of eHealth Services (2012-2013)
211
Position of the Portuguese eHealth profile in EU27+3
397 Portugal is close to the European average in its eHealth profile. However, the gains over and above the
European average are not evenly distributed, with “ePrescribing” alone standing 48% above the EU27+3
average. Similarly, “Broadband > 50Mbps” was 30% above the average, with most other areas varying by
less than 15%.
Change in the Portuguese eHealth profile
398 The greatest gains since 2010 have been achieved in “Broadband > 50Mbps”, “Exchange of laboratory
results with external providers” and “Single and unified wireless” which delivered 31%, 28% and 25%
growth respectively. However, “Single EPR shared by all departments” and “Integrated system for
eReferral” posted negative growth, at -28% and -40% respectively.
Figure 152: Portuguese acute hospitals eHealth profile by ownership
Note: Results are based on valid answers only - category bases may vary from the total reported here.
399 Public acute hospitals in Portugal appear to be the best endowed in terms of eHealth capabilities, with
Public hospitals leading by a wide margin in three areas: “Broadband > 50Mbps”, “PACS usage” and
“Exchange of clinical care information with external providers”. However, Private not for profit acute
hospitals led notably in “Single EPR shared by all departments” at 100%, while Private hospitals led in
“Clear and structured rules on access to clinical data”, also at 100%.
66%
62%
83%
67%
84%
86%
50%
92%
87%
77%
50%
77%
77%
33%
100%
0%
100%
50%
50%
67%
0% 20% 40% 60% 80% 100%
Broadband > 50Mbps
Single EPR shared by all departments
PACS usage
Echange of CCI with ext. providers
Clear data access rules
Total (n=38-41) Public (n=22-24) Private (n=12-13) Private not for profit (n=3-4)
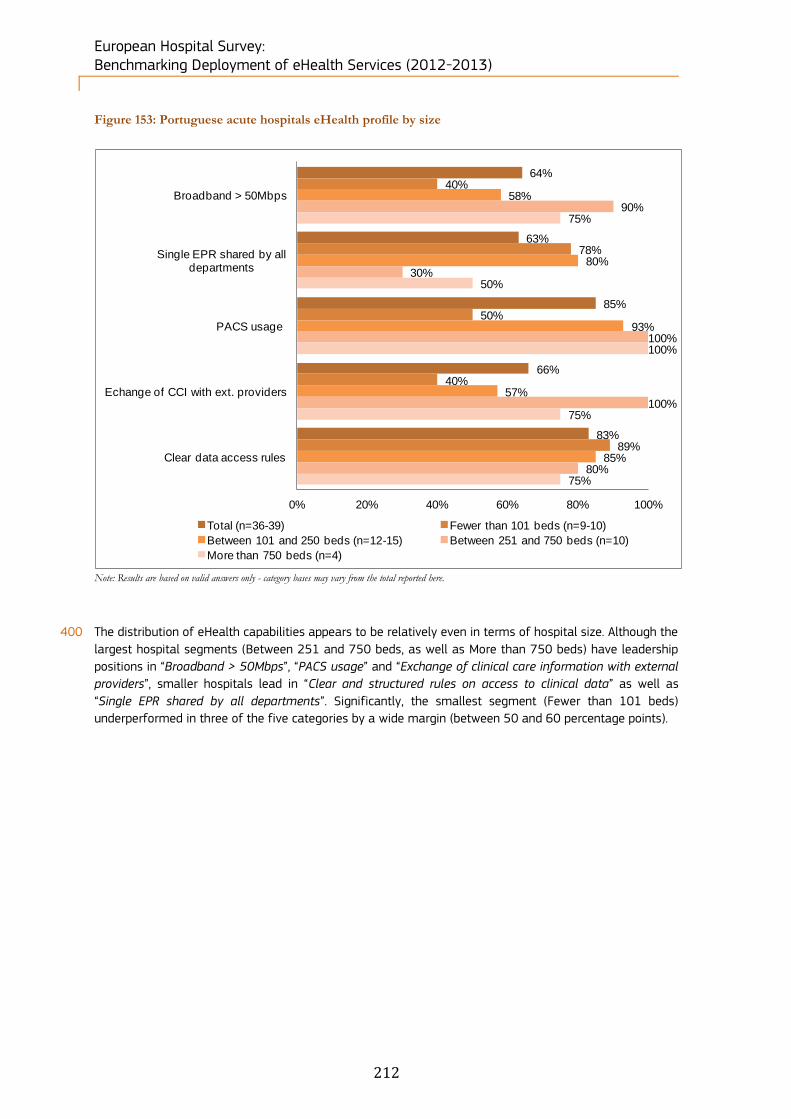
European Hospital Survey: Benchmarking Deployment of eHealth Services (2012-2013)
212
Figure 153: Portuguese acute hospitals eHealth profile by size
Note: Results are based on valid answers only - category bases may vary from the total reported here.
400 The distribution of eHealth capabilities appears to be relatively even in terms of hospital size. Although the
largest hospital segments (Between 251 and 750 beds, as well as More than 750 beds) have leadership
positions in “Broadband > 50Mbps”, “PACS usage” and “Exchange of clinical care information with external
providers”, smaller hospitals lead in “Clear and structured rules on access to clinical data” as well as
“Single EPR shared by all departments”. Significantly, the smallest segment (Fewer than 101 beds)
underperformed in three of the five categories by a wide margin (between 50 and 60 percentage points).
64%
63%
85%
66%
83%
40%
78%
50%
40%
89%
58%
80%
93%
57%
85%
90%
30%
100%
100%
80%
75%
50%
100%
75%
75%
0% 20% 40% 60% 80% 100%
Broadband > 50Mbps
Single EPR shared by all departments
PACS usage
Echange of CCI with ext. providers
Clear data access rules
Total (n=36-39) Fewer than 101 beds (n=9-10)
Between 101 and 250 beds (n=12-15) Between 251 and 750 beds (n=10)
More than 750 beds (n=4)

European Hospital Survey: Benchmarking Deployment of eHealth Services (2012-2013)
213
Figure 154: Difference between NUTS 2 level and country-level results
Note: Results are based on valid answers only - bases may vary from the total observations reported here. No statistically
significant difference between regions and the national level (at the 95% and 99% confidence level).
401 The NUTS 2 level analysis of five eHealth indicators for Portugal shows that PT18 - Alentejo led by a wide
margin, displaying 100% penetration for “Broadband > 50Mbps”, “PACS usage” and “Exchange of clinical
care information with external providers”. However, in the other areas under review, “Single EPR shared by
all departments” and “Clear and structured rules on access to clinical data”, PT18 - Alentejo actually
underperformed in contrast to NUTS 2 regions. Across all NUTS 2 regions, “PACS usage” and “Clear and
structured rules on access to clinical data” were the highest scoring eHealth indicators.
5.2.25 Romania’s acute hospitals eHealth profile
402 1,042 hospitals were identified in Romania. Within this sample, 612 (59%) completed the screener part of
the questionnaire and, of these, 16% qualified as acute care hospitals. Of the 166 screened in, 85 acute
hospitals (51%) completed the survey.
403 All hospital size categories size experienced a balanced increase in terms of number of hospitals between
2010 and 2012.
Table 55: Romanian breakdown by size of hospital
Romania N= Fewer than
101 beds Between 101 and
250 beds Between 251 and
750 beds More than 750
beds Don’t know/ No answer
Census 166
31 53 49 29 4
19% 32% 30% 17% 2%
2012 85 15 27 28 15 -
18% 32% 33% 18% -
2010 38 8 13 10 6 1
21% 34% 26% 16% 3%
404 Romania only counts 82 Public hospitals and 3 Private hospitals. Public hospitals increased from 37
hospitals in 2010 to 82 hospitals in 2012.
Table 56: Romanian breakdown by ownership type
Romania N= Public Private Private not for profit Don't know/ No answer
Census 166
157 7 - 2
95% 4% - 1%
2012 85 82 3 - -
96% 4% - -
2010 38 37 - - 1
97% - - 3%
Broadband >
50Mbps
Single EPR
shared by all
departments
PACS usage
Exchange of clinical
care information
with external
providers
Clear and
structured rules on
access to clinical
data
Total Portugal (n=41) 66% 62% 83% 67% 84%
PT11 - Norte (n=17) 50% 75% 76% 56% 87%
PT16 - Centro (PT) (n=10) 80% 40% 90% 70% 78%
PT17 - Lisboa (n=10) 67% 70% 80% 70% 90%
PT18 - Alentejo (n=4) 100% 50% 100% 100% 75%

European Hospital Survey: Benchmarking Deployment of eHealth Services (2012-2013)
214
Figure 155: Romanian acute hospital eHealth profile
eHealth indicators - Romania Score difference, national
2012 vs. EU27+3
Score difference, national
2012 vs. national 2010
Externally connected 7% 15%
Broadband > 50Mbps 0% 9%
Single and unified wireless -27% 2%
Single EPR shared by all
departments4% 8%
PACS usage -48% -14%
ePrescribing 41% 85%
Integrated system for eReferral -20% -10%
Tele-monitoring -9% -1%
Exchange of clinical care
information with external providers-28% 3%
Exchange of laboratory results with
external providers-26% 6%
Exchange of radiology reports with
external providers-37% 2%
Clear and structured rules on
access to clinical data-8% 6%
EAS for disaster recovery in less
than 24 hours-19% -19%
Note: Results are based on valid answers only - bases (n) may differ from the ones reported here. The scoring scale from 0 to 5 points corresponds to an
implementation rate from 0% to 100%.
0
1
2
3
4
5Externally connected
Broadband > 50Mbps
Single and unified wireless
Single EPR shared by all departments
PACS usage
ePrescribing
Integrated system for eReferralTele-monitoring
Exchange of clinical care information with external
providers
Exchange of laboratory results with external providers
Exchange of radiology reports with external providers
Clear and structured rules on access to clinical data
EAS for disaster recovery in less than 24 hours
EU27+3 (n=1753) Romania 2010 (n=38) Romania 2012 (n=85)
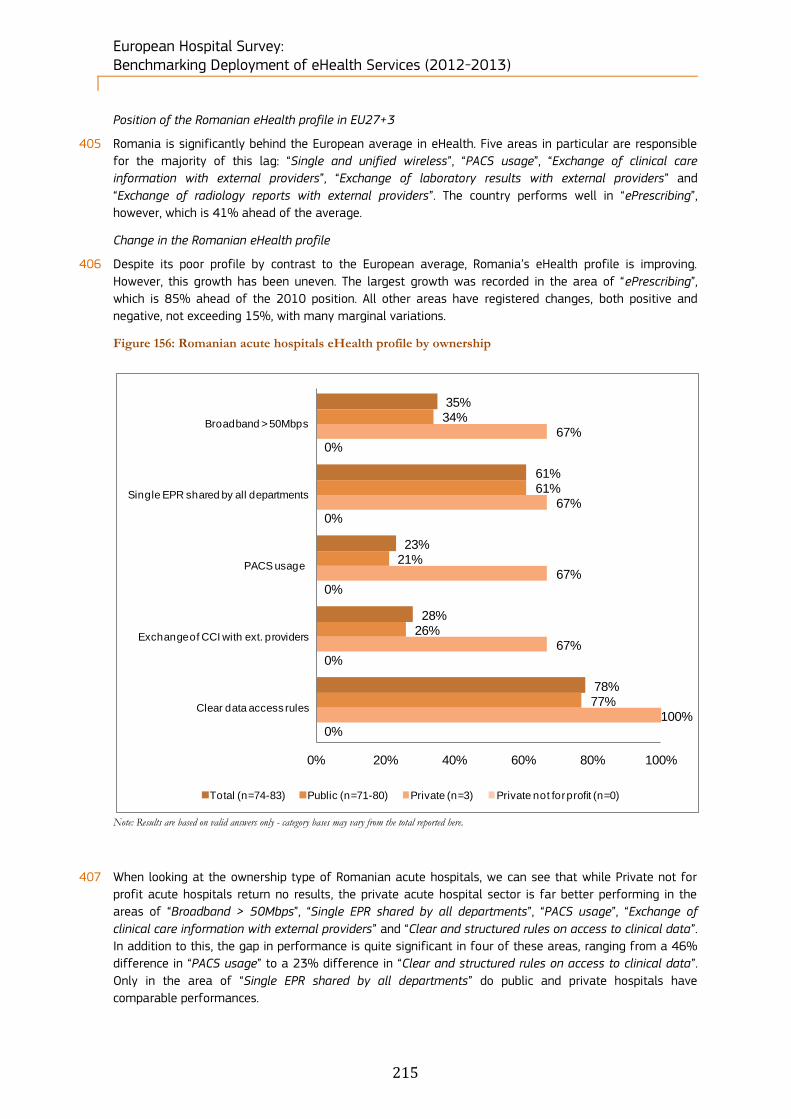
European Hospital Survey: Benchmarking Deployment of eHealth Services (2012-2013)
215
Position of the Romanian eHealth profile in EU27+3
405 Romania is significantly behind the European average in eHealth. Five areas in particular are responsible
for the majority of this lag: “Single and unified wireless”, “PACS usage”, “Exchange of clinical care
information with external providers”, “Exchange of laboratory results with external providers” and
“Exchange of radiology reports with external providers”. The country performs well in “ePrescribing”,
however, which is 41% ahead of the average.
Change in the Romanian eHealth profile
406 Despite its poor profile by contrast to the European average, Romania’s eHealth profile is improving.
However, this growth has been uneven. The largest growth was recorded in the area of “ePrescribing”,
which is 85% ahead of the 2010 position. All other areas have registered changes, both positive and
negative, not exceeding 15%, with many marginal variations.
Figure 156: Romanian acute hospitals eHealth profile by ownership
Note: Results are based on valid answers only - category bases may vary from the total reported here.
407 When looking at the ownership type of Romanian acute hospitals, we can see that while Private not for
profit acute hospitals return no results, the private acute hospital sector is far better performing in the
areas of “Broadband > 50Mbps”, “Single EPR shared by all departments”, “PACS usage”, “Exchange of
clinical care information with external providers” and “Clear and structured rules on access to clinical data”.
In addition to this, the gap in performance is quite significant in four of these areas, ranging from a 46%
difference in “PACS usage” to a 23% difference in “Clear and structured rules on access to clinical data”.
Only in the area of “Single EPR shared by all departments” do public and private hospitals have
comparable performances.
35%
61%
23%
28%
78%
34%
61%
21%
26%
77%
67%
67%
67%
67%
100%
0%
0%
0%
0%
0%
0% 20% 40% 60% 80% 100%
Broadband > 50Mbps
Single EPR shared by all departments
PACS usage
Exchange of CCI with ext. providers
Clear data access rules
Total (n=74-83) Public (n=71-80) Private (n=3) Private not for profit (n=0)

European Hospital Survey: Benchmarking Deployment of eHealth Services (2012-2013)
216
Figure 157: Romanian acute hospitals eHealth profile by size
Note: Results are based on valid answers only - category bases may vary from the total reported here.
408 In terms of hospital size, the very largest segment (More than 750 beds) registered much better
performance than the smaller hospitals, with leading values in four of the five categories under review.
Unusually, however, the worst performing category is not the smallest segment (Fewer than 101 beds) but
the next largest segment of Between 101 and 250 beds. This group of hospitals came last in every single
category examined. The smallest segment, by contrast, has a roughly similar experience to that of the
second largest category (Between 251 and 750 beds). The values recorded by these groups do not differ
widely.
35%
61%
23%
28%
78%
30%
64%
18%
27%
80%
24%
50%
12%
20%
67%
46%
54%
24%
21%
82%
35%
84%
37%
50%
83%
0% 20% 40% 60% 80% 100%
Broadband > 50Mbps
Single EPR shared by all departments
PACS usage
Exchange of CCI with ext. providers
Clear data access rules
Total (n=74-83) Fewer than 101 beds (n=10-11)
Between 101 and 250 beds (n=21-25) Between 251 and 750 beds (n=26-29)
More than 750 beds (n=17-19)
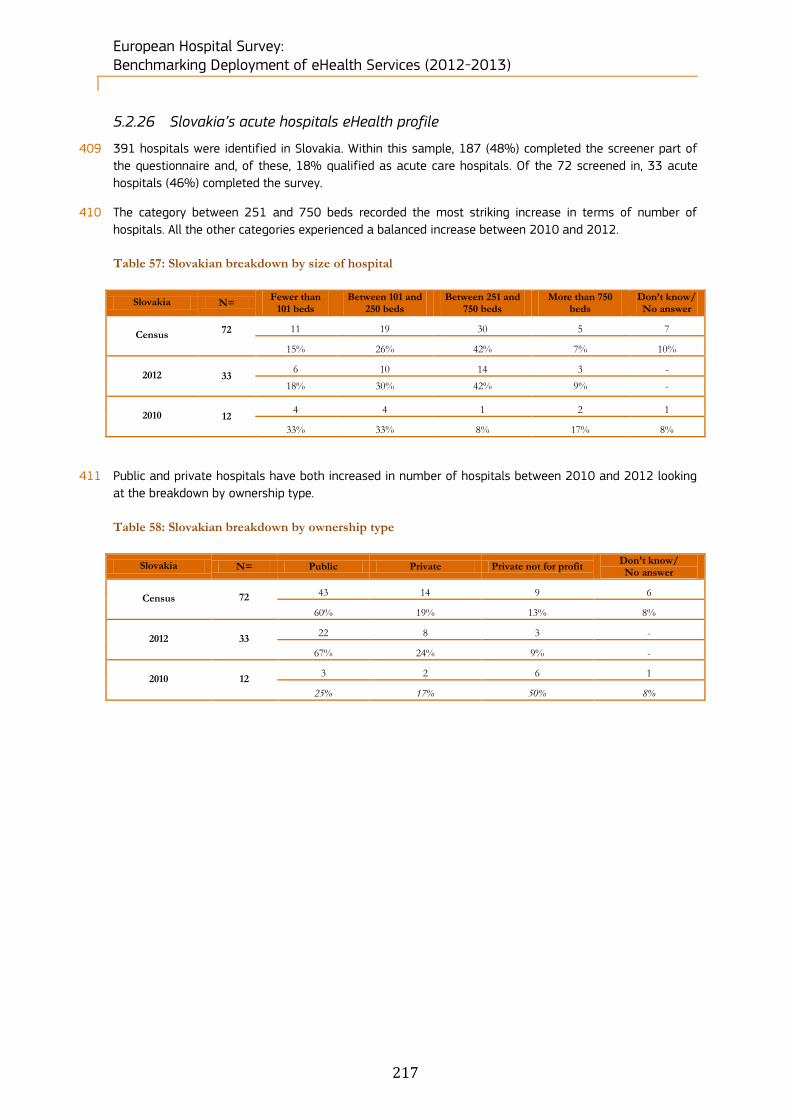
European Hospital Survey: Benchmarking Deployment of eHealth Services (2012-2013)
217
5.2.26 Slovakia’s acute hospitals eHealth profile
409 391 hospitals were identified in Slovakia. Within this sample, 187 (48%) completed the screener part of
the questionnaire and, of these, 18% qualified as acute care hospitals. Of the 72 screened in, 33 acute
hospitals (46%) completed the survey.
410 The category between 251 and 750 beds recorded the most striking increase in terms of number of
hospitals. All the other categories experienced a balanced increase between 2010 and 2012.
Table 57: Slovakian breakdown by size of hospital
Slovakia N= Fewer than
101 beds Between 101 and
250 beds Between 251 and
750 beds More than 750
beds Don’t know/ No answer
Census 72
11 19 30 5 7
15% 26% 42% 7% 10%
2012 33 6 10 14 3 -
18% 30% 42% 9% -
2010 12 4 4 1 2 1
33% 33% 8% 17% 8%
411 Public and private hospitals have both increased in number of hospitals between 2010 and 2012 looking
at the breakdown by ownership type.
Table 58: Slovakian breakdown by ownership type
Slovakia N= Public Private Private not for profit Don't know/ No answer
Census 72
43 14 9 6
60% 19% 13% 8%
2012 33 22 8 3 -
67% 24% 9% -
2010 12 3 2 6 1
25% 17% 50% 8%
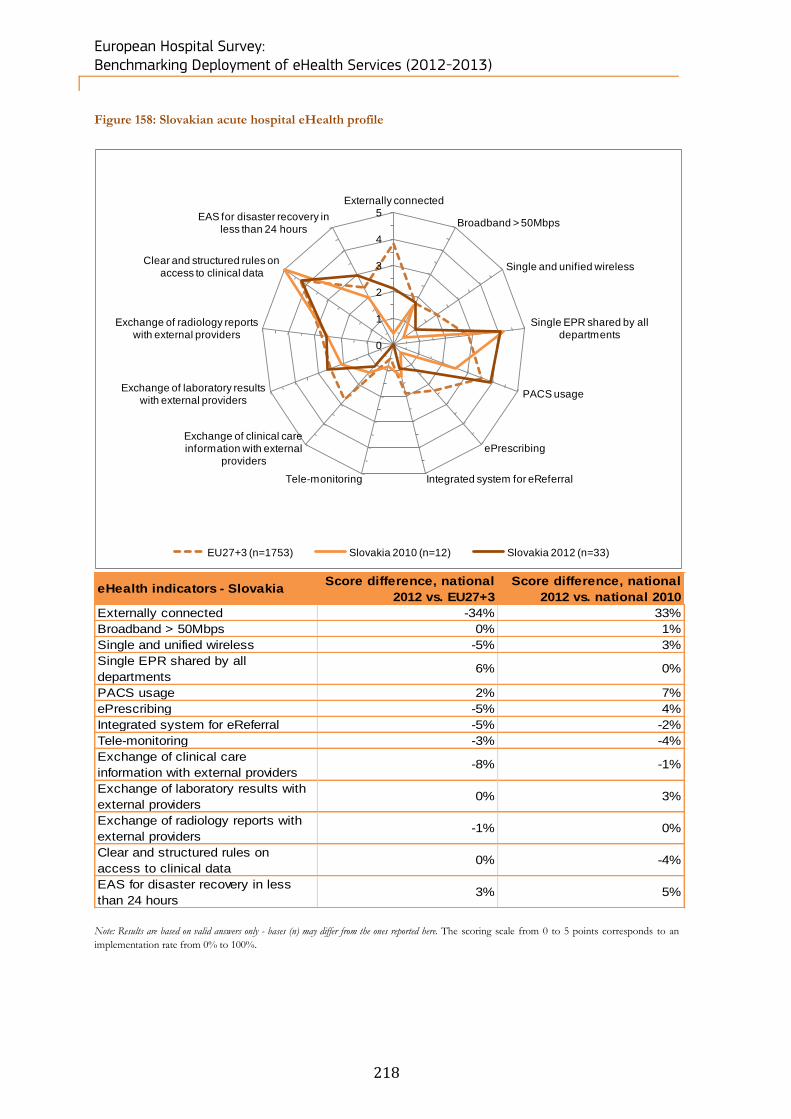
European Hospital Survey: Benchmarking Deployment of eHealth Services (2012-2013)
218
Figure 158: Slovakian acute hospital eHealth profile
eHealth indicators - Slovakia Score difference, national
2012 vs. EU27+3
Score difference, national
2012 vs. national 2010
Externally connected -34% 33%
Broadband > 50Mbps 0% 1%
Single and unified wireless -5% 3%
Single EPR shared by all
departments6% 0%
PACS usage 2% 7%
ePrescribing -5% 4%
Integrated system for eReferral -5% -2%
Tele-monitoring -3% -4%
Exchange of clinical care
information with external providers-8% -1%
Exchange of laboratory results with
external providers0% 3%
Exchange of radiology reports with
external providers-1% 0%
Clear and structured rules on
access to clinical data0% -4%
EAS for disaster recovery in less
than 24 hours3% 5%
Note: Results are based on valid answers only - bases (n) may differ from the ones reported here. The scoring scale from 0 to 5 points corresponds to an
implementation rate from 0% to 100%.
0
1
2
3
4
5Externally connected
Broadband > 50Mbps
Single and unified wireless
Single EPR shared by all departments
PACS usage
ePrescribing
Integrated system for eReferralTele-monitoring
Exchange of clinical care information with external
providers
Exchange of laboratory results with external providers
Exchange of radiology reports with external providers
Clear and structured rules on access to clinical data
EAS for disaster recovery in less than 24 hours
EU27+3 (n=1753) Slovakia 2010 (n=12) Slovakia 2012 (n=33)

European Hospital Survey: Benchmarking Deployment of eHealth Services (2012-2013)
219
Position of the Slovakian eHealth profile in EU27+3
412 Slovakia trails behind the European average in eHealth. Four specific areas account for most of this lag:
“Externally connected” (-34%), “Single and unified wireless” (-5%), “ePrescribing” (-5%) and “Exchange of
clinical care information with external providers” (-8%). However, Slovakia is not universally behind the
European average in all areas, with five of the 13 areas very close to or exceeding the European average.
Change in the Slovakian eHealth profile
413 Although it is still behind the European average, Slovakia has improved on its 2010 eHealth profile. The
major areas of increase were “Externally connected” and “PACS usage”, which had gains of 133% and 7%
respectively. “EAS for disaster recovery in less than 24 hours” also improved, albeit by only 5%.
Figure 159: Slovakian acute hospitals eHealth profile by ownership
Note: Results are based on valid answers only - category bases may vary from the total reported here.
414 Type of ownership does not appear to affect eHealth capabilities in any definite way in Slovakia, with both
Private not for profit and Public hospitals leading in various different areas. While Private hospitals
underperform in four of five areas, the disparity in performance levels in three of these areas is not very
high, for example only 3% behind in “Broadband > 50Mbps”, 17% behind in “PACS usage” and 18% behind
in “Clear and structured rules on access to clinical data”.
36%
82%
79%
22%
85%
41%
86%
91%
23%
82%
38%
62%
50%
12%
88%
0%
100%
67%
50%
100%
0% 20% 40% 60% 80% 100%
Broadband > 50Mbps
Single EPR shared by all departments
PACS usage
Exchange of CCI with ext. providers
Clear data access rules
Total (n=32-33) Public (n=22) Private (n=8) Private not for prof it (n=2-3)

European Hospital Survey: Benchmarking Deployment of eHealth Services (2012-2013)
220
Figure 160: Slovakian acute hospitals eHealth profile by size
Note: Results are based on valid answers only - category bases may vary from the total reported here.
415 Scale does not appear to be a definite factor either in deciding the eHealth development of acute hospitals
in Slovakia. While the largest hospitals have a clear advantage in two areas, “Broadband > 50Mbps” and
“Exchange of clinical care information with external providers”, acute hospitals in the segment of Between
101 and 250 beds perform at 100% levels in two areas, “Single EPR shared by all departments” and
“PACS usage”. Hospitals of all sizes perform well in the final category, “Clear and structured rules on
access to clinical data”, and in this area, the maximum variation between results is 18% between the
lowest and highest performers. By contrast, the greatest disparity in performance can be seen in
“Broadband > 50Mbps”, “PACS usage” and “Exchange of clinical care information with external providers”.
39%
81%
81%
23%
87%
29%
57%
43%
29%
86%
33%
100%
100%
20%
83%
36%
86%
86%
14%
93%
75%
75%
100%
50%
75%
0% 20% 40% 60% 80% 100%
Broadband > 50Mbps
Single EPR shared by all departments
PACS usage
Exchange of CCI with ext. providers
Clear data access rules
Total (n=30-31) Fewer than 101 beds (n=7)
Between 101 and 250 beds (n=5-6) Between 251 and 750 beds (n=14)
More than 750 beds (n=4)
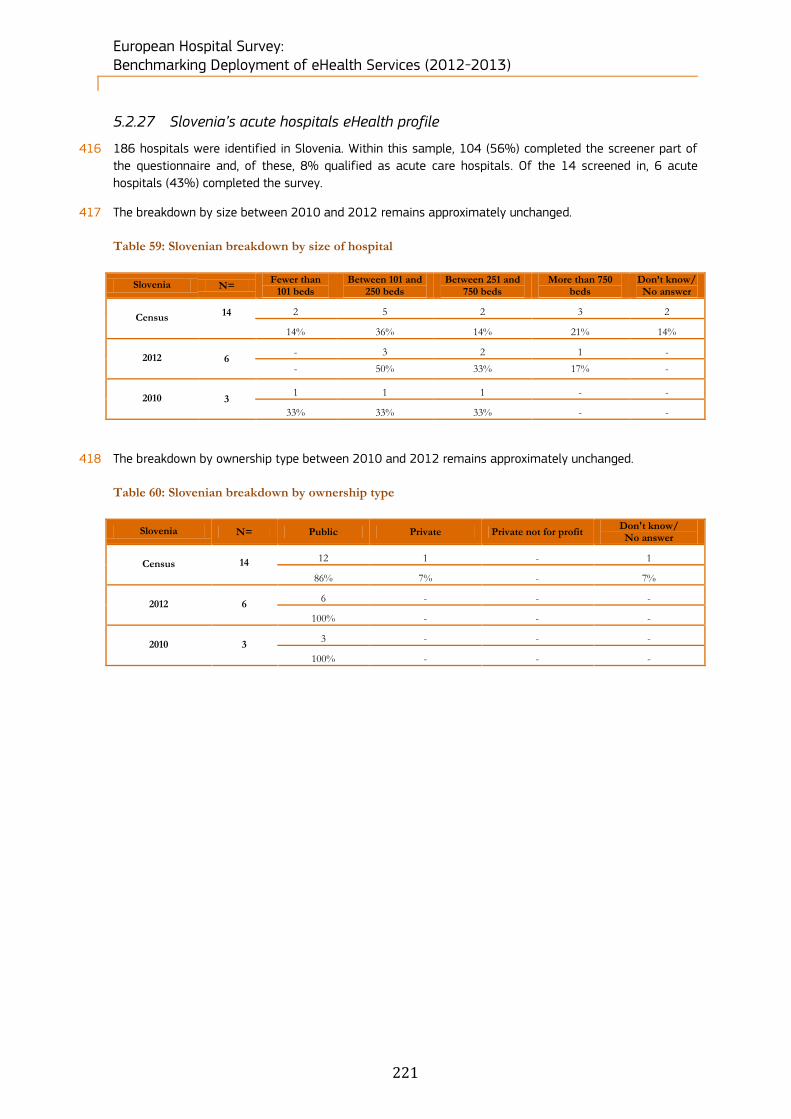
European Hospital Survey: Benchmarking Deployment of eHealth Services (2012-2013)
221
5.2.27 Slovenia’s acute hospitals eHealth profile
416 186 hospitals were identified in Slovenia. Within this sample, 104 (56%) completed the screener part of
the questionnaire and, of these, 8% qualified as acute care hospitals. Of the 14 screened in, 6 acute
hospitals (43%) completed the survey.
417 The breakdown by size between 2010 and 2012 remains approximately unchanged.
Table 59: Slovenian breakdown by size of hospital
Slovenia N= Fewer than
101 beds Between 101 and
250 beds Between 251 and
750 beds More than 750
beds Don’t know/ No answer
Census 14
2 5 2 3 2
14% 36% 14% 21% 14%
2012 6 - 3 2 1 -
- 50% 33% 17% -
2010 3 1 1 1 - -
33% 33% 33% - -
418 The breakdown by ownership type between 2010 and 2012 remains approximately unchanged.
Table 60: Slovenian breakdown by ownership type
Slovenia N= Public Private Private not for profit Don't know/ No answer
Census 14
12 1 - 1
86% 7% - 7%
2012 6 6 - - -
100% - - -
2010 3 3 - - -
100% - - -
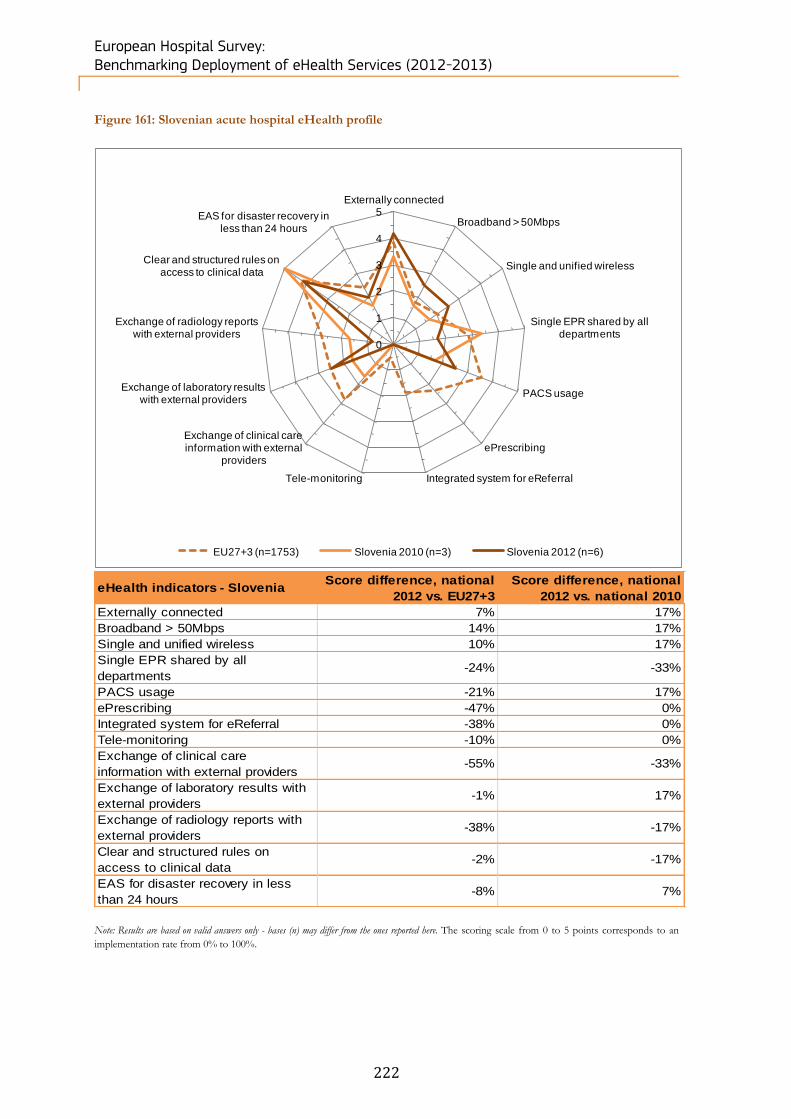
European Hospital Survey: Benchmarking Deployment of eHealth Services (2012-2013)
222
Figure 161: Slovenian acute hospital eHealth profile
eHealth indicators - Slovenia Score difference, national
2012 vs. EU27+3
Score difference, national
2012 vs. national 2010
Externally connected 7% 17%
Broadband > 50Mbps 14% 17%
Single and unified wireless 10% 17%
Single EPR shared by all
departments-24% -33%
PACS usage -21% 17%
ePrescribing -47% 0%
Integrated system for eReferral -38% 0%
Tele-monitoring -10% 0%
Exchange of clinical care
information with external providers-55% -33%
Exchange of laboratory results with
external providers-1% 17%
Exchange of radiology reports with
external providers-38% -17%
Clear and structured rules on
access to clinical data-2% -17%
EAS for disaster recovery in less
than 24 hours-8% 7%
Note: Results are based on valid answers only - bases (n) may differ from the ones reported here. The scoring scale from 0 to 5 points corresponds to an
implementation rate from 0% to 100%.
0
1
2
3
4
5Externally connected
Broadband > 50Mbps
Single and unified wireless
Single EPR shared by all departments
PACS usage
ePrescribing
Integrated system for eReferralTele-monitoring
Exchange of clinical care information with external
providers
Exchange of laboratory results with external providers
Exchange of radiology reports with external providers
Clear and structured rules on access to clinical data
EAS for disaster recovery in less than 24 hours
EU27+3 (n=1753) Slovenia 2010 (n=3) Slovenia 2012 (n=6)
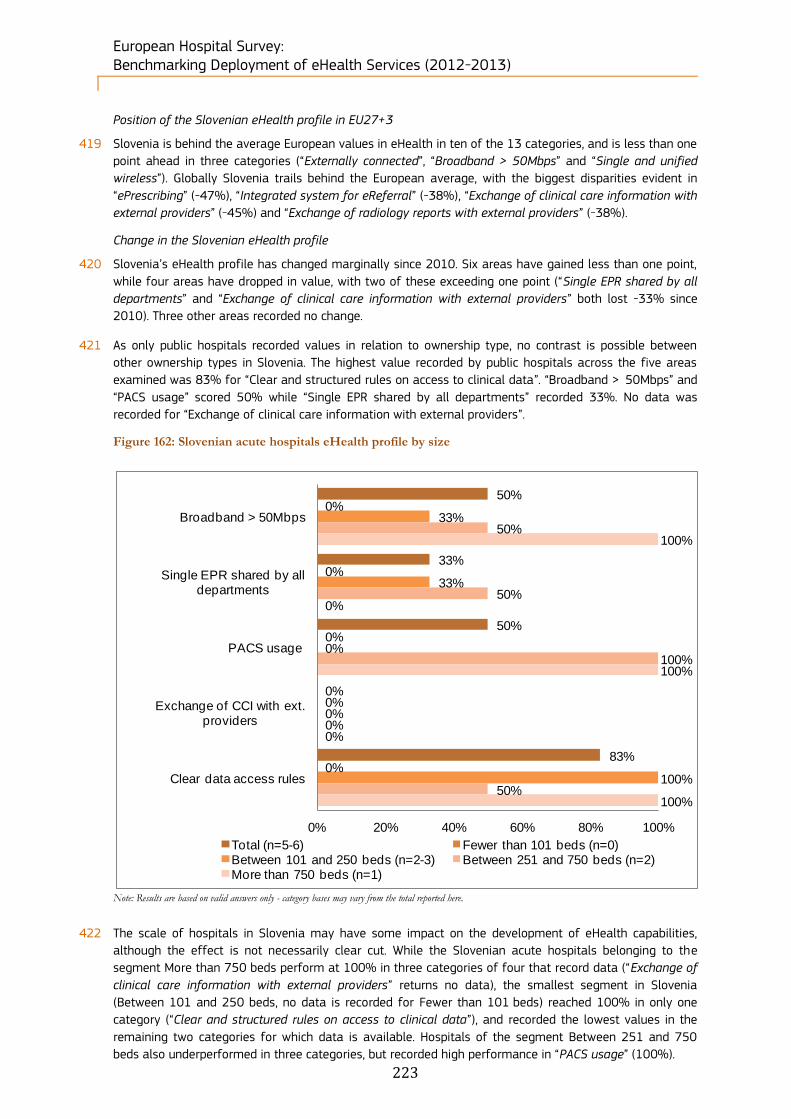
European Hospital Survey: Benchmarking Deployment of eHealth Services (2012-2013)
223
Position of the Slovenian eHealth profile in EU27+3
419 Slovenia is behind the average European values in eHealth in ten of the 13 categories, and is less than one
point ahead in three categories (“Externally connected”, “Broadband > 50Mbps” and “Single and unified
wireless”). Globally Slovenia trails behind the European average, with the biggest disparities evident in
“ePrescribing” (-47%), “Integrated system for eReferral” (-38%), “Exchange of clinical care information with
external providers” (-45%) and “Exchange of radiology reports with external providers” (-38%).
Change in the Slovenian eHealth profile
420 Slovenia’s eHealth profile has changed marginally since 2010. Six areas have gained less than one point,
while four areas have dropped in value, with two of these exceeding one point (“Single EPR shared by all
departments” and “Exchange of clinical care information with external providers” both lost -33% since
2010). Three other areas recorded no change.
421 As only public hospitals recorded values in relation to ownership type, no contrast is possible between
other ownership types in Slovenia. The highest value recorded by public hospitals across the five areas
examined was 83% for “Clear and structured rules on access to clinical data”. “Broadband > 50Mbps” and
“PACS usage” scored 50% while “Single EPR shared by all departments” recorded 33%. No data was
recorded for “Exchange of clinical care information with external providers”.
Figure 162: Slovenian acute hospitals eHealth profile by size
Note: Results are based on valid answers only - category bases may vary from the total reported here.
422 The scale of hospitals in Slovenia may have some impact on the development of eHealth capabilities,
although the effect is not necessarily clear cut. While the Slovenian acute hospitals belonging to the
segment More than 750 beds perform at 100% in three categories of four that record data (“Exchange of
clinical care information with external providers” returns no data), the smallest segment in Slovenia
(Between 101 and 250 beds, no data is recorded for Fewer than 101 beds) reached 100% in only one
category (“Clear and structured rules on access to clinical data”), and recorded the lowest values in the
remaining two categories for which data is available. Hospitals of the segment Between 251 and 750
beds also underperformed in three categories, but recorded high performance in “PACS usage” (100%).
50%
33%
50%
0%
83%
0%
0%
0%
0%
0%
33%
33%
0%
0%
100%
50%
50%
100%
0%
50%
100%
0%
100%
0%
100%
0% 20% 40% 60% 80% 100%
Broadband > 50Mbps
Single EPR shared by all departments
PACS usage
Exchange of CCI with ext. providers
Clear data access rules
Total (n=5-6) Fewer than 101 beds (n=0)Between 101 and 250 beds (n=2-3) Between 251 and 750 beds (n=2)More than 750 beds (n=1)
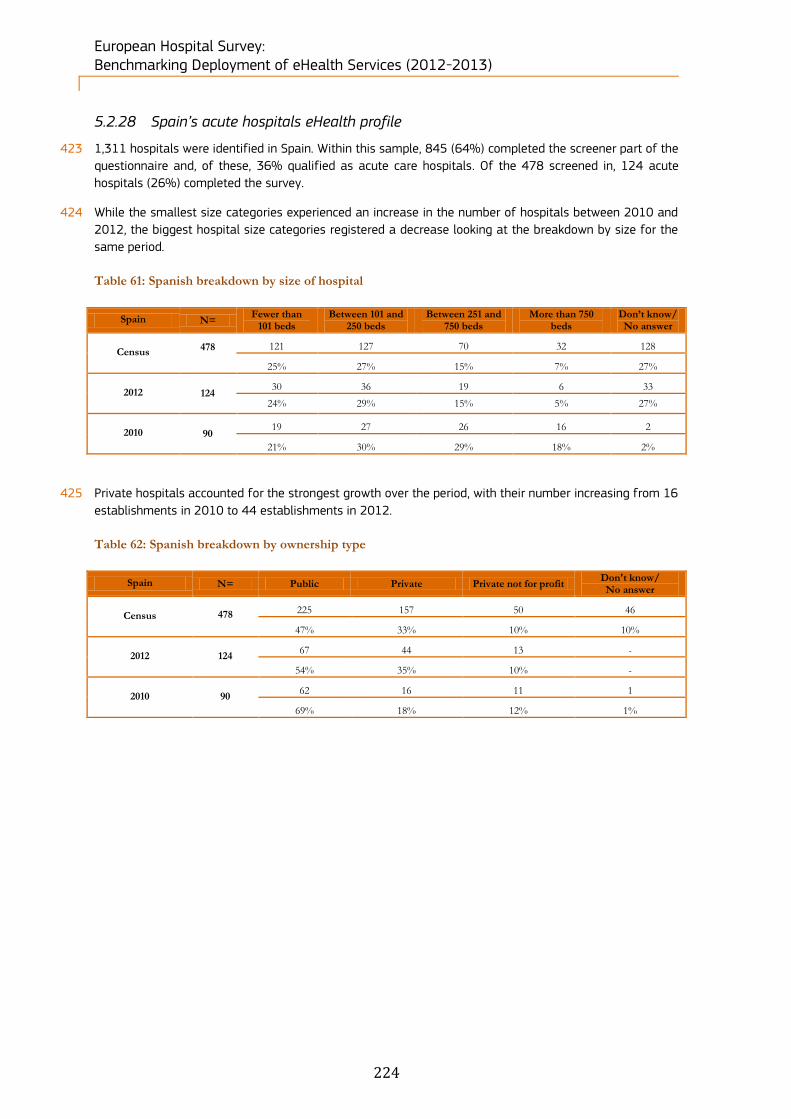
European Hospital Survey: Benchmarking Deployment of eHealth Services (2012-2013)
224
5.2.28 Spain’s acute hospitals eHealth profile
423 1,311 hospitals were identified in Spain. Within this sample, 845 (64%) completed the screener part of the
questionnaire and, of these, 36% qualified as acute care hospitals. Of the 478 screened in, 124 acute
hospitals (26%) completed the survey.
424 While the smallest size categories experienced an increase in the number of hospitals between 2010 and
2012, the biggest hospital size categories registered a decrease looking at the breakdown by size for the
same period.
Table 61: Spanish breakdown by size of hospital
Spain N= Fewer than
101 beds Between 101 and
250 beds Between 251 and
750 beds More than 750
beds Don’t know/ No answer
Census 478
121 127 70 32 128
25% 27% 15% 7% 27%
2012 124 30 36 19 6 33
24% 29% 15% 5% 27%
2010 90 19 27 26 16 2
21% 30% 29% 18% 2%
425 Private hospitals accounted for the strongest growth over the period, with their number increasing from 16
establishments in 2010 to 44 establishments in 2012.
Table 62: Spanish breakdown by ownership type
Spain N= Public Private Private not for profit Don't know/ No answer
Census 478
225 157 50 46
47% 33% 10% 10%
2012 124 67 44 13 -
54% 35% 10% -
2010 90 62 16 11 1
69% 18% 12% 1%

European Hospital Survey: Benchmarking Deployment of eHealth Services (2012-2013)
225
Figure 163: Spanish acute hospital eHealth profile
eHealth indicators - Spain Score difference, national
2012 vs. EU27+3
Score difference, national
2012 vs. national 2010
Externally connected 12% -5%
Broadband > 50Mbps 19% 0%
Single and unified wireless 15% 15%
Single EPR shared by all
departments-7% -28%
PACS usage 23% 10%
ePrescribing 21% 19%
Integrated system for eReferral -15% -24%
Tele-monitoring 12% 7%
Exchange of clinical care
information with external providers16% -1%
Exchange of laboratory results with
external providers7% -8%
Exchange of radiology reports with
external providers9% 0%
Clear and structured rules on
access to clinical data9% -1%
EAS for disaster recovery in less
than 24 hours17% 5%
Note: Results are based on valid answers only - bases (n) may differ from the ones reported here. The scoring scale from 0 to 5 points corresponds to an
implementation rate from 0% to 100%.
0
1
2
3
4
5Externally connected
Broadband > 50Mbps
Single and unified wireless
Single EPR shared by all departments
PACS usage
ePrescribing
Integrated system for eReferralTele-monitoring
Exchange of clinical care information with external
providers
Exchange of laboratory results with external providers
Exchange of radiology reports with external providers
Clear and structured rules on access to clinical data
EAS for disaster recovery in less than 24 hours
EU27+3 (n=1753) Spain 2010 (n=90) Spain 2012 (n=124)
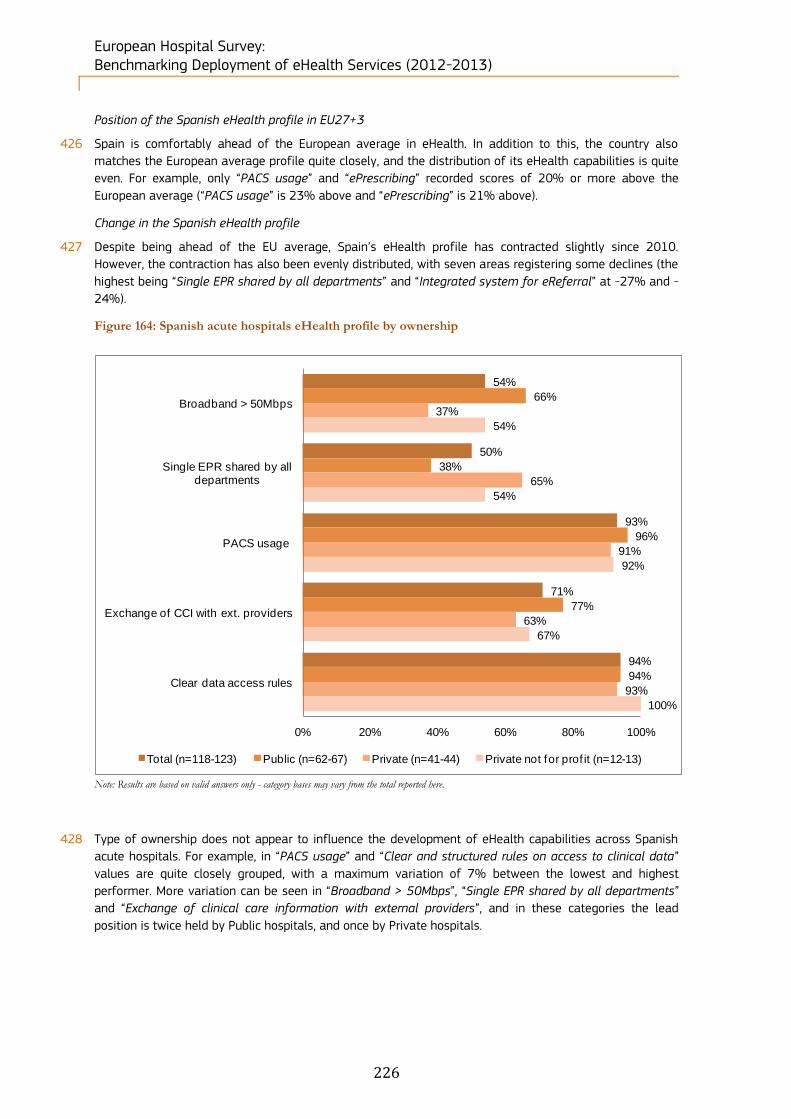
European Hospital Survey: Benchmarking Deployment of eHealth Services (2012-2013)
226
Position of the Spanish eHealth profile in EU27+3
426 Spain is comfortably ahead of the European average in eHealth. In addition to this, the country also
matches the European average profile quite closely, and the distribution of its eHealth capabilities is quite
even. For example, only “PACS usage” and “ePrescribing” recorded scores of 20% or more above the
European average (“PACS usage” is 23% above and “ePrescribing” is 21% above).
Change in the Spanish eHealth profile
427 Despite being ahead of the EU average, Spain’s eHealth profile has contracted slightly since 2010.
However, the contraction has also been evenly distributed, with seven areas registering some declines (the
highest being “Single EPR shared by all departments” and “Integrated system for eReferral” at -27% and -
24%).
Figure 164: Spanish acute hospitals eHealth profile by ownership
Note: Results are based on valid answers only - category bases may vary from the total reported here.
428 Type of ownership does not appear to influence the development of eHealth capabilities across Spanish
acute hospitals. For example, in “PACS usage” and “Clear and structured rules on access to clinical data”
values are quite closely grouped, with a maximum variation of 7% between the lowest and highest
performer. More variation can be seen in “Broadband > 50Mbps”, “Single EPR shared by all departments”
and “Exchange of clinical care information with external providers”, and in these categories the lead
position is twice held by Public hospitals, and once by Private hospitals.
54%
50%
93%
71%
94%
66%
38%
96%
77%
94%
37%
65%
91%
63%
93%
54%
54%
92%
67%
100%
0% 20% 40% 60% 80% 100%
Broadband > 50Mbps
Single EPR shared by all departments
PACS usage
Exchange of CCI with ext. providers
Clear data access rules
Total (n=118-123) Public (n=62-67) Private (n=41-44) Private not for prof it (n=12-13)

European Hospital Survey: Benchmarking Deployment of eHealth Services (2012-2013)
227
Figure 165: Spanish acute hospitals eHealth profile by size
Note: Results are based on valid answers only - category bases may vary from the total reported here.
429 Scale appears to be slightly influential in Spanish acute hospitals, but not universally so. A certain
advantage appears to be conferred upon larger hospital segments in three categories, “Exchange of
clinical care information with external providers”, “Clear and structured rules on access to clinical data” and
“PACS usage”, with acute hospitals of More than 750 beds leading in these areas. However, this segment
performs much less well in “Broadband > 50Mbps” and “Single EPR shared by all departments”, where
performance is reversed and where significant gaps were noted between the highest and lowest
performers.
56%
52%
94%
73%
94%
44%
63%
91%
67%
91%
59%
52%
95%
67%
93%
73%
41%
92%
83%
96%
45%
42%
100%
92%
100%
0% 20% 40% 60% 80% 100%
Broadband > 50Mbps
Single EPR shared by all departments
PACS usage
Exchange of CCI with ext. providers
Clear data access rules
Total (n=106-111) Fewer than 101 beds (n=33-35)
Between 101 and 250 beds (n=39-41) Between 251 and 750 beds (n=22-24)
More than 750 beds (n=11-12)

European Hospital Survey: Benchmarking Deployment of eHealth Services (2012-2013)
228
Figure 166: Difference between NUTS 2 level and country-level results
Note: Results are based on valid answers only - bases may vary from the total observations reported here
* Statistically significant difference between the region and the national level at the 95% confidence interval
430 In the context of the study, we have analysed 10 NUTS 2 regions for Spain. The only region showing a
statistically significant difference when compared to the national results is ES62 -Región de Murcia, where
all hospitals in the sample declared having full penetration of “Broadband > 50Mbps”. This was the only
region to record 100% of penetration in three areas: “Broadband > 50Mbps”, “PACS usage” and “Exchange
of clinical care information with external providers”. Overall, “Clear and structured rules on access to
clinical data” and “PACS usage” are the two areas which scored highest across these 10 NUTS 2 regions.
Broadband >
50Mbps
Single EPR
shared by all
departments
PACS usage
Exchange of
clinical care
information with
external providers
Clear and
structured
rules on access
to clinical data
Total Spain (n=124) 54% 50% 93% 71% 94%
ES11 - Galicia (n=8) 57% 38% 100% 88% 100%
ES21 - País Vasco (n=14) 54% 57% 93% 57% 100%
ES30 - Comunidad de Madrid (n=11) 55% 36% 91% 82% 100%
ES41 - Castilla y León (n=16) 40% 53% 94% 67% 94%
ES42 - Castilla-La Mancha (n=5) 80% 60% 100% 25% 100%
ES51 - Cataluña (n=19) 50% 63% 89% 76% 95%
ES52 - Comunidad Valenciana (n=14) 50% 38% 100% 93% 86%
ES61 - Andalucía (n=13) 46% 46% 85% 69% 100%
ES62 -Región de Murcia (n=5) 100%* 75% 100% 25% 100%
ES70 - Canarias (n=6) 50% 50% 100% 80% 100%

European Hospital Survey: Benchmarking Deployment of eHealth Services (2012-2013)
229
5.2.29 Sweden’s acute hospitals eHealth profile
431 246 hospitals were identified in Sweden. Within this sample, 131 (53%) completed the screener part of
the questionnaire and, of these, 32% qualified as acute care hospitals. Of the 78 screened in, 26 acute
hospitals (33%) completed the survey.
432 All the size categories belonging to the breakdown by size registered an increase in number of hospitals
between 2010 and 2012. This increase has been more evident for smaller hospital categories.
Table 63: Swedish breakdown by size of hospital
Sweden N= Fewer than
101 beds Between 101 and
250 beds Between 251 and
750 beds More than 750
beds Don’t know/ No answer
Census 78
18 13 17 9 21
23% 17% 22% 12% 27%
2012 26 6 5 9 3 3
23% 19% 35% 12% 12%
2010 8 1 1 3 2 1
12% 12% 38% 25% 12%
433 Hospitals in Sweden are mainly public. This ownership category experienced an increase of 12 units,
passing from 8 units in 2010 to 12 units in 2012.
Table 64: Swedish breakdown by ownership type
Sweden N= Public Private Private not for profit Don't know/ No answer
Census 78
59 2 3 14
76% 3% 4% 18%
2012 26 20 - 2 4
77% - 8% 15%
2010 8 8 - - -
100% - - -

European Hospital Survey: Benchmarking Deployment of eHealth Services (2012-2013)
230
Figure 166: Swedish acute hospital eHealth profile
eHealth indicators - Sweden Score difference, national
2012 vs. EU27+3
Score difference, national
2012 vs. national 2010
Externally connected 8% 10%
Broadband > 50Mbps 64% 14%
Single and unified wireless 36% -12%
Single EPR shared by all
departments22% -21%
PACS usage 17% -12%
ePrescribing 38% -15%
Integrated system for eReferral 31% -6%
Tele-monitoring -3% -21%
Exchange of clinical care
information with external providers29% 10%
Exchange of laboratory results with
external providers45% 21%
Exchange of radiology reports with
external providers29% 9%
Clear and structured rules on
access to clinical data11% -4%
EAS for disaster recovery in less
than 24 hours24% -28%
Note: Results are based on valid answers only - bases (n) may differ from the ones reported here. The scoring scale from 0 to 5 points corresponds to an
implementation rate from 0% to 100%.
0
1
2
3
4
5Externally connected
Broadband > 50Mbps
Single and unified wireless
Single EPR shared by all departments
PACS usage
ePrescribing
Integrated system for eReferralTele-monitoring
Exchange of clinical care information with external
providers
Exchange of laboratory results with external providers
Exchange of radiology reports with external providers
Clear and structured rules on access to clinical data
EAS for disaster recovery in less than 24 hours
EU27+3 (n=1753) Sweden 2010 (n=8) Sweden 2012 (n=26)

European Hospital Survey: Benchmarking Deployment of eHealth Services (2012-2013)
231
Position of the Swedish eHealth profile in EU27+3
434 Sweden is one of the strongest eHealth performers in the sample. In fact, in all 13 indicators examined,
Sweden ranked behind in only one area (“Tele-monitoring”) and in this area is only marginally behind (-3%
points). The areas within which Sweden is the most evolved by contrast to other countries within this study
are “Broadband > 50Mbps” (64% ahead) and “Exchange of laboratory results with external providers”
(64% ahead).
Change in the Swedish eHealth profile
435 Despite Sweden’s strong position in eHealth, there has been some contraction of eHealth capabilities when
contrasted with 2010 values. . The most notable decrease was recorded for in “EAS for disaster recovery in
less than 24 hours”, which dropped by -28%. In the 13 areas under review, five indicators posted modest
growth, led by “Exchange of laboratory results with external providers” (which grew by 21%).
Figure 167: Swedish acute hospitals eHealth profile by ownership
Note: Results are based on valid answers only - category bases may vary from the total reported here.
436 Only data for Public and Private not for profit hospitals were returned by our survey, and within this data
we see that the latter segment of the market appears to consistently outperform. Private not for profit
hospitals scored 100% in four of five indicators examined, while public hospitals lag by up to 28%.
However, despite this result, the disparity of performance between the two segments is not dramatically
high, and the worst disparity actually occurs in the area of “PACS usage”, where Private not for profit
hospitals only score 5o% against 95% for Public hospitals.
100%
75%
90%
86%
95%
100%
72%
95%
85%
95%
0%
0%
0%
0%
0%
100%
100%
50%
100%
100%
0% 20% 40% 60% 80% 100%
Broadband > 50Mbps
Single EPR shared by all departments
PACS usage
Exchange of CCI with ext. providers
Clear data access rules
Total (n=19-22) Public (n=17-20) Private (n=0) Private not for prof it (n=2)
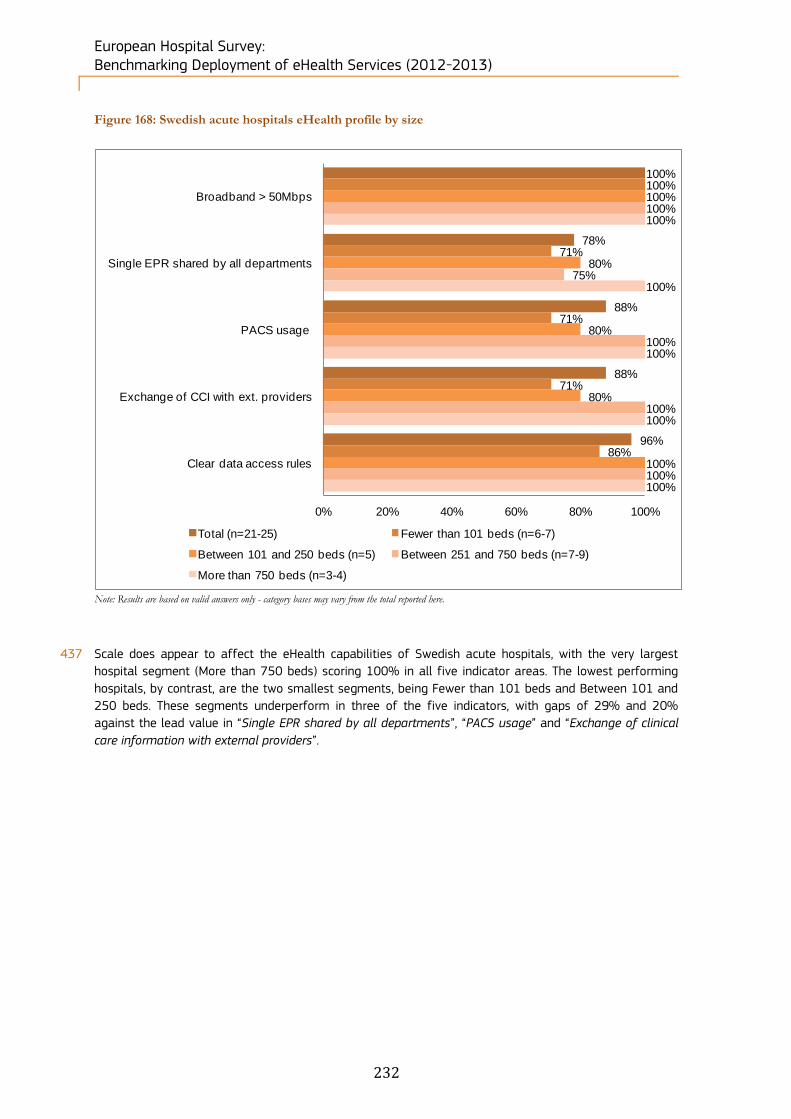
European Hospital Survey: Benchmarking Deployment of eHealth Services (2012-2013)
232
Figure 168: Swedish acute hospitals eHealth profile by size
Note: Results are based on valid answers only - category bases may vary from the total reported here.
437 Scale does appear to affect the eHealth capabilities of Swedish acute hospitals, with the very largest
hospital segment (More than 750 beds) scoring 100% in all five indicator areas. The lowest performing
hospitals, by contrast, are the two smallest segments, being Fewer than 101 beds and Between 101 and
250 beds. These segments underperform in three of the five indicators, with gaps of 29% and 20%
against the lead value in “Single EPR shared by all departments”, “PACS usage” and “Exchange of clinical
care information with external providers”.
100%
78%
88%
88%
96%
100%
71%
71%
71%
86%
100%
80%
80%
80%
100%
100%
75%
100%
100%
100%
100%
100%
100%
100%
100%
0% 20% 40% 60% 80% 100%
Broadband > 50Mbps
Single EPR shared by all departments
PACS usage
Exchange of CCI with ext. providers
Clear data access rules
Total (n=21-25) Fewer than 101 beds (n=6-7)
Between 101 and 250 beds (n=5) Between 251 and 750 beds (n=7-9)
More than 750 beds (n=3-4)

European Hospital Survey: Benchmarking Deployment of eHealth Services (2012-2013)
233
5.2.30 United Kingdom's acute hospitals eHealth profile
438 889 hospitals and NHS trusts were identified in the United Kingdom. Within this sample, 510 (57%)
completed the screener part of the questionnaire and, of these, 11% qualified as acute care hospitals. Of
the 102 screened in, 33 acute hospitals (32%) completed the survey.
439 Among the size categories belonging to the breakdown by size, the smallest hospital size category
registered the highest increase in number of hospitals between 2010 and 2012 (from 9 to 36).
Table 65: United Kingdom breakdown by size of hospital
United Kingdom N= Fewer than
101 beds Between 101 and
250 beds Between 251 and
750 beds More than 750
beds Don’t know/ No answer
Census 102
59 9 15 4 15
58% 9% 15% 4% 15%
2012 69 36 7 16 5 5
64% 9% 9% 3% 15%
2010 38 9 4 18 7 -
24% 11% 47% 18% -
440 Both public and private hospitals have increased in number between 2010 and 2012 looking at the
breakdown by ownership type. The biggest increase in number is for public hospitals.
Table 66: United Kingdom breakdown by ownership type
United Kingdom N= Public Private Private not for profit Don't know/ No answer
Census 102
55 43 2 2
54% 42% 2% 2%
2012 69 55 13 1 -
80% 19% 1% -
2010 38 28 5 5 -
74% 13% 13% -
441 In order to guarantee the representativeness of the healthcare system in the United Kingdom, the 2012
results of the acute hospitals within NHS trusts have been duplicated based on the number of hospitals
represented by the trust. After this duplication process, the United Kingdom counts 69 hospitals in its
sample.

European Hospital Survey: Benchmarking Deployment of eHealth Services (2012-2013)
234
Figure 169: United Kingdom acute hospital eHealth profile
eHealth indicators - United
Kingdom
Score difference, national
2012 vs. EU27+3
Score difference, national
2012 vs. national 2010
Externally connected 3% -15%
Broadband > 50Mbps 46% 13%
Single and unified wireless 24% -2%
Single EPR shared by all
departments-17% -31%
PACS usage 26% 2%
ePrescribing -26% -11%
Integrated system for eReferral 35% 10%
Tele-monitoring 12% 11%
Exchange of clinical care
information with external providers10% -23%
Exchange of laboratory results with
external providers11% -30%
Exchange of radiology reports with
external providers4% -2%
Clear and structured rules on
access to clinical data0% -13%
EAS for disaster recovery in less
than 24 hours9% -16%
Note: Results are based on valid answers only - bases (n) may differ from the ones reported here. The scoring scale from 0 to 5 points corresponds to an
implementation rate from 0% to 100%.
0
1
2
3
4
5Externally connected
Broadband > 50Mbps
Single and unified wireless
Single EPR shared by all departments
PACS usage
ePrescribing
Integrated system for eReferralTele-monitoring
Exchange of clinical care information with external
providers
Exchange of laboratory results with external providers
Exchange of radiology reports with external providers
Clear and structured rules on access to clinical data
EAS for disaster recovery in less than 24 hours
EU27+3 (n=1753) United Kingdom 2010 (n=38) United Kingdom 2012 (n=69)

European Hospital Survey: Benchmarking Deployment of eHealth Services (2012-2013)
235
Position of the United Kingdom’s eHealth profile in EU27+3
442 The United Kingdom is comfortably above the average in terms of the adoption of eHealth capabilities.
The United Kingdom’s largest scores above the average value come from “Broadband > 50Mbps” (46%),
“Single and unified wireless” (24%), “PACS usage” (26%) and “Integrated system for eReferral” (35%). Only
the “Single EPR shared by all departments”, “ePrescribing” and “Clear and structured rules on access to
clinical data” indicators scored below average, with -31%, -11% and -13% respectively.
Change in the United Kingdom eHealth profile
443 Despite the United Kingdom’s healthy position in relation to global eHealth values, the country’s
performance has unfortunately dropped in several areas. Since then, only four areas have posted growth.
All other nine indicators registered negative growth, with “Single EPR shared by all departments”,
“Exchange of clinical care information with external providers” and “Exchange of laboratory results with
external providers” with a change of -31, -23 and -30 percentage points respectively.
Figure 170: United Kingdom acute hospitals eHealth profile by ownership
Note: Results are based on valid answers only - category bases may vary from the total reported here.
444 In the United Kingdom, Private not for profit acute hospitals only returned data for one of five categories
under investigation; however data for Public and Private hospitals is available for all five categories. While
Public hospitals appear to perform better, scoring highest or joint highest in three of five categories
(“Broadband > 50Mbps”, “PACS usage” and “Exchange of clinical care information with external providers”),
Private hospitals perform better in “Clear and structured rules on access to clinical data” and “Single EPR
shared by all departments”. Overall, no definite trends can be observed based on ownership type.
81%
40%
97%
76%
85%
93%
35%
100%
81%
83%
29%
62%
85%
58%
100%
0%
0%
100%
0%
0%
0% 20% 40% 60% 80% 100%
Broadband > 50Mbps
Single EPR shared by all departments
PACS usage
Exchange of CCI with ext. providers
Clear data access rules
Total (n=37-69) Public (n=30-55) Private (n=7-13) Private not for prof it (n=1)

European Hospital Survey: Benchmarking Deployment of eHealth Services (2012-2013)
236
Figure 171: United Kingdom acute hospitals eHealth profile by size
Note: Results are based on valid answers only - category bases may vary from the total reported here.
445 Scale appears to be more influential in the development of eHealth capabilities across UK hospitals, with
the largest hospitals (Between 251 and 750 beds and More than 750 beds) outperforming other segments
in four of five indicator areas. In addition, for three of these indicator, “Broadband > 50Mbps”, “Exchange
of clinical care information with external providers” and “Clear and structured rules on access to clinical
data”, the margin between the highest and lowest performers is considerable (between 33% and 50%).
Figure 172: Difference between NUTS 1 level and country-level results
Note: UK – England combines the UKD - North West (England), UKE - Yorkshire And The Humber, UKF - East Midlands (England), UKH - East Of
England, UKI – London, UKJ - South East (England), UKK - South West (England) NUTS 1 regions
Results are based on valid answers only - bases may vary from the total observations reported here
* Statistically significant difference between the region and the national level at the 95% confidence interval
80%
38%
97%
75%
84%
69%
41%
95%
68%
82%
50%
33%
100%
67%
67%
100%
36%
100%
82%
82%
90%
27%
100%
100%
100%
0% 20% 40% 60% 80% 100%
Broadband > 50Mbps
Single EPR shared by all departments
PACS usage
Exchange of CCI with ext. providers
Clear data access rules
Total (n=35-67) Fewer than 101 beds (n=16-41)
Between 101 and 250 beds (n=2-4) Between 251 and 750 beds (n=7-11)
More than 750 beds (n=10-11)
Broadband >
50Mbps
Single EPR
shared by all
departments
PACS usage
Exchange of clinical
care information
with external
providers
Clear and
structured rules
on access to
clinical data
Total United Kingdom (n=69) 43% 39% 97% 74% 81%
UK - ENGLAND (n=26) 62% 46% 100% 85% 92%
UKL - WALES (n=5) - 100%** 80% 60% 80%
UKM - SCOTLAND (n=35) 37% 26% 97% 69% 74%
UKN - NORTHERN IRELAND
(n=3)
33% 33% 100% 67% 67%

European Hospital Survey: Benchmarking Deployment of eHealth Services (2012-2013)
237
446 The most prevalent eHealth capabilities as displayed by United Kingdom NUTS 1 data are “PACS usage”
and “Clear and structured rules on access to clinical data”, which are at 97% and 81% penetration levels
based on total United Kingdom figures. Furthermore, “Single EPR shared by all departments” is present at
100% in UKL - Wales: this value is statistically significantly different at a 99% confidence interval
compared to the national results.
European Hospital Survey: Benchmarking Deployment of eHealth Services (2012-2013)
238
6 Conclusions and recommendations
6.1 Comparison with other studies and surveys
6.1.1 Studies used for comparison
447 The results of this survey are intended to build upon the results of previous studies which were conducted
in the same field. Therefore we will make a comparison with some of the salient surveys and studies on
eHealth deployment which have been carried out over the past decade. In order to fit with the
chronological evolution of the results, we will focus our comparison on the most recent benchmarking
study in this field (by Deloitte/Ipsos in 2010). Other benchmark studies will also be taken into
consideration in order to develop the final picture on the deployment of eHealth in EU27+3.
448 The main reference studies used in this chapter are as follows (in order of relevance):
Deloitte and Ipsos, “eHealth Benchmarking III SMART 2009/0022 (2011)”;
JRC-IPTS, C. Codagnone, F Lupianez-Villanueva “A composite Index for the Benchmarking of eHealth Deployment in European Acute Hospitals. Distilling reality into a manageable form for evidence-based policy” (2011);
E-Business Watch, the European Commission “ICT and e-Business in Hospital Activities: ICT adoption and e-business activity in 2006” (2006);
Hospital Information Network Europe (HINE) “European Hospital Market Metrics -2004” (2004);
Empirica “Benchmarking ICT use among General Practitioners in Europe” (2008).
6.1.2 Comparison in detail
6.1.2.1 Deloitte and Ipsos, “eHealth Benchmarking III SMART 2009/0022 (2011)”
449 The Benchmarking III study was the most closely aligned to the present work. The objective of our study
was to build directly on the 2010 survey, and in turn update and widen the scope of the analysis provided
at that time.
450 The previous benchmarking study found sound progress in eHealth, with high percentages of hospitals
connected to broadband (92%) but with half of them having a bandwidth of below 50Mbps (52%).
Benchmarking III reported that there was still room for improvement when it came to next-generation
broadband (>100Mbps) and that such high bandwidth could prove useful in advancing digital imaging and
telemonitoring. We concur with this assumption; however we believe that it will take some time for next-
generation broadband to be rolled out to the market, but that the take-up will be inevitable once it
becomes widely available.
451 Another point of interest to our study is that electronic patient record systems and PACSs are less
accessible from outside the hospitals by external healthcare providers (24% for electronic patient record
systems and 27% for PACS) or by patients, meaning that hospitals still act (understandably so) as ‘data
silos’ in many regards. This point was reinforced by figures from the Benchmarking III study which stated
that electronic medical data exchanges outside acute hospitals with other providers were still not common
in European acute hospitals. Three instances are immediately evident: 54% of acute hospitals did not have
electronic exchange of clinical care information, 57% did not exchange laboratory results and 75% did not
exchange medication lists with external providers.
These results have improved noticeably in our study, with a lower number of acute hospitals (43%) now
stating that they have no electronic exchange. Similarly, only 47% of acute hospitals now refrain from
exchanging laboratory results, while only 70% do not exchange medication lists with external providers.
6.1.2.2 JRC-IPTS, composite index for eHealth benchmarking, study (2011)
452 The JRC-IPTS Report is not a survey as such, but a multivariate statistical analysis run on a composite
index (CI) on eHealth deployment in European hospitals. This report was built using the eHealth
Benchmarking III data, and therefore offers further interesting analysis on those results.

European Hospital Survey: Benchmarking Deployment of eHealth Services (2012-2013)
239
453 Using multivariate statistical methods, the study’s aim was to apply a selective but deep vertical focus to
the results of the Benchmarking III study with the objectives of a) providing more meaning to the results
by constructing a composite index; and b) extracting key policy messages. To this end, the report
constructed a composite index of eHealth deployment with a view to proposing a roadmap towards
systematised and replicable benchmarking.
454 Amongst the findings of the study were the following:
Connectivity was quite high in most countries (more than 80% connected through Extranet or Internet);
Electronic exchange of information lagged behind fairly generally (across countries);
Electronic exchanges were still limited among the potential interacting players and cross-border
exchanges were extremely limited.
455 All these characteristics have been noted in our own study:
High levels of broadband infrastructure (88% broadband connectivity - all speeds, excluding 9% expressing a ‘don’t know’ response), 3% narrowband and 0% without any connectivity;
Much lower levels of electronic information exchange: – A maximum of 39% for exchanges with external hospitals;
– Almost no cross-border data exchange, whether in the EU or beyond (typically in the low single-
figure percentages at eu level, although smaller countries such as Cyprus and Iceland tend to
engage in more activity in this area).
456 The Composite Index study also noted the wide variation across countries, an aspect which is also quite
clear from our results. In particular, the lowest deployment measured by the composite index concentrated
mostly among the new Member States and candidate countries. Of the bottom 13 countries identified, 12
were from this group with Greece as the exception. The only new Member State that scored above the
EU27 average was Estonia. Consequently, the report called for awareness-raising policies and possibly
financial support targeting this group of countries.
6.1.2.3 E-Business Watch, the European Commission “ICT and e-Business in Hospital Activities: ICT adoption and e-business activity in 2006” (2006)
457 The e-BusinessWatch survey of 2006, which was the fourth survey after those of 2002, 2003 and 2005,
had a scope of 14,081 telephone interviews with decision-makers in enterprises from 29 countries,
including the 25 EU Member States, EEA and Acceding / Candidate Countries of that period. Similarly to our
study, the interviews were carried out using computer-aided telephone interview (CATI) technology in
March and April 2006.
458 Several interesting aspects which we believe are significant were raised in the 2006 E-Business Watch
survey. This involved size class differences, and standards of interoperability.
1. According to the survey results at the time, and which we also found, small hospitals generally lagged behind medium-sized and large ones in ICT and e-business use. This applied, for example, to internet, broadband and remote network access as well as for internal and external e-collaboration. Equipment with broadband access was reported to be similar in medium-sized (84%) and large hospitals (86%), while small hospitals appeared to lag behind (64%). Large hospitals had a reported lead in remote access (41%), medium-sized hospitals (34%) and small ones (38%) followed behind. However, small hospitals reported higher shares of employees that have internet access and internet telephony use as well as for online service booking, indicating that smaller hospitals could also use ICT to their advantage.
European Hospital Survey: Benchmarking Deployment of eHealth Services (2012-2013)
240
2. Standards and interoperability issues were also highlighted. At the time, certain standards for the healthcare sector were already in use, including TC 251, Health Level 7 (HL7), Digital Image and Communications in Medicine (DICOM), and the specifications developed by Integrating the Healthcare Enterprise (IHE). It was noted that ‘Commitment to European and international standards is generally weak, and there is a tendency for Member States to create national ICT standards for the health sector’. Only 26% of the hospitals of the survey said they used HL7 standard. Even more interesting was that in four of seven categories asked in the 2006 survey, the share of hospitals reporting difficulties due to a lack of interoperability was larger for invoicing, payments, technical aspects and regulatory aspects than in other industry sectors76. This suggests greater inherent complexity within Healthcare as an industry by contrast to other economic sectors.
6.1.2.4 Hospital Information Network Europe (HINE) “European Hospital Market Metrics -2004” (2004)
459 The HINE Report is a series of country-level surveys of 900 mainly large hospitals in 14 countries. Due to
the external support provided by nine leading external commercial organisations, the Report Series
focussed more on business-related issues such as current expenditures, the timing of investments and the
factors influencing IT spending.
460 As mentioned above, as the HINE study was based on larger hospitals, the percentage values for
penetration of eHealth capabilities was more than likely overstated (we have seen how larger hospitals
tend to develop and use eHealth capabilities more so than their smaller counterparts). In addition to this,
the HINE data displayed does not include Eastern European countries, and therefore results are derived
from the wealthier EU states, which would, again, overstate the penetration of capabilities. This makes
some of the results even more impressive when contrasting our results with the comparable data. For
example, PACS use has increased from 32.4% to 70%, Electronic Patient Records (there is no distinction
between EMRs, EHRs and EPRs in the HINE study) have increased from 51% to 81%, while ePrescribing
jumped from 8.6% to 43%.
6.1.2.5 Empirica “Benchmarking ICT use among General Practitioners in Europe” (2008)
461 The study from Empirica is more recent has been included in this section in order make a comparison with
the situation of eHealth in other healthcare environments. The survey was carried out in all 27 Member
States of the European Union and in Norway and Iceland in late 2007 and was also reliant on Computer-
Aided Telephone Interviewing with some exceptions. The universe consisted of all General Practitioners
(GPs) in the respective countries and 6,789 interviews were achieved. From a methodological point of
view, a comparison with the present works well based on the fact that the type of question, the
terminology and the geographical coverage match to a certain extent.
462 While it is clear that the GP working environment differs widely from that of acute hospitals, some
valuable messages in relation to the broader eHealth context, as well as specifically relevant to our study,
can be derived from the GP ICT study.
463 Although GP technology requirements are less complex than those required by acute hospitals, we note in
particular
Electronic connections with other health actors;
Electronic exchange of patient data; and
Electronic interactions with patients.
464 The study found that the Internet as well as other dedicated types of electronic networks allowed GP
practices to establish connections to other health actors' electronic systems, such as those of laboratories,
other GP practices, secondary health actors such as specialists and hospitals, health authorities, insurance
companies, pharmacies, patients’ homes and care homes. While these latter uses were not extensive, they
display the ability for the medical profession to interlink data across geographical divides.
76 The sectors covered were Food and beverages, Footwear, Pulp, paper and paper products, ICT manufacturing, Consumer
electronics, Shipbuilding and repair, Construction, Tourism, Telecommunication services, Hospital activities.

European Hospital Survey: Benchmarking Deployment of eHealth Services (2012-2013)
241
465 As an example, administrative patient data were stored electronically in 80% of the EU27 GP practices,
with practice size playing a certain role in this regard (an average difference of 11 percentage points
between the smallest and the largest size class, with the larger practices being better equipped
approximately at 74% for single GPs versus 85% for multiple GPs). This included patient data stored for
medical purposes, data on diagnoses and medications, administrative patient data, basic medical
parameters, laboratory results, a patient's symptoms or the reasons for his/her visit, medical history of a
patient, ordered examinations and their results all scored in excess of 80%. In addition to this, 76% of all
practices stored individual patient data in a structured manner, which facilitates the automatic processing
of the data in other electronic systems. By contrast, our study found that 71% of acute hospitals have
EMR/EHR/EPR availability, displaying similar levels of digitisation (even if the complexity and volume
differs tremendously between each).
466 Both of these findings have important implications for the development of pan-European medical data
sharing, as it displays a pervasive and increasing level of digitisation across the healthcare market,
regardless of level or location. However, the major challenge – one of convergence of standards and
frameworks (whether legal, ethical or technical) – remains to be solved.
6.1.3 Summary of the findings
467 Looking across the studies, we noted a number of points:
1. The Broadband connection speed has not improved since 2010 and the majority (56%) of
hospitals still have a bandwidth of below 50 Mbps. This is true at European level and in terms of
persisting differences between countries (Nordic countries perform better). Wireless unified
infrastructures on the contrary have advanced since 2010, passing from 54% to 66%. However, single
wireless infrastructures still need to be developed, as they currently stand at 39%
2. eHealth has the capacity to develop quite unevenly. The use of EPR (there was no distinction
used regarding EHR and EMR in the eHealth Benchmarking III study) has not improved since 2010,
while PACS usage has increased from 2010, passing from 61% to 70%. Interestingly, the AHA survey
of 2011 on the American hospitals eHealth77 situation displayed the existence of a trade-off between
accomplishments on specific objectives on the one hand, and having a fully certified EHR technology
for hospitals involved in the Medicare and Medicaid incentives programs for hospitals on the other
hand (“meaningful users” of certified EHR).
This is relevant when considering incentive programs for hospitals, and how they should be best
targeted.
3. The lack of information sharing with patients is regularly cited in many studies. This is a complex
area as it touches on privacy requirements, legal requirements and security issues as well as the more
obvious structural and infrastructural problems. The vast majority of hospitals (90% today vs. 96% in
2010) still do not provide external access to their electronic patient records. Secure online access to
clinical data for patients is likely to remain a high-profile issue.
4. Regarding exchange of clinical care information, radiology reports and medication lists, the
general picture has improved only slightly. In 2010 the majority of information was still exchanged
within the hospital or with other hospitals, but less with other types of providers such as General
Practitioners and specialists. The non-implementation of telemonitoring of outpatients, by contrast, has
gone from 89% non-implementation to 76% non-implementation between 2010 and 2012.
5. Our survey highlights a ‘hybrid hump’, wherein 41% of hospitals occupy a mid-way point between
a fully paper-based non-digitised environment and an electronic paperless environment.
77 AHA (2011), ‘AHA Survey on Hospitals’ Ability to Meet Meaningful Use Requirements of the Medicare and Medicaid Electronic
Health Records Incentive Programs’, American Health Association, http://www.aha.org/content/11/11EHRsurveyresults.pdf.

European Hospital Survey: Benchmarking Deployment of eHealth Services (2012-2013)
242
6. Our survey confirms the findings of multiple other studies (Deloitte, e-BusinessWatch and
Empirica) in relation to conclusions drawn on the subject of interoperability. Interoperability problems
are still one of the most important barriers to be tackled in order to promote the integration of data
systems at all levels of the healthcare chain, including within and between hospitals, as well as with
other healthcare providers (GPs, laboratories, etc.)
7. The GP ICT use study of 2008 demonstrates that eHealth continues to develop in other areas
outside of acute hospitals. General Practitioners’ performance in terms of computer use, transfer of
patient data and electronic data exchange has increased significantly between 2002 and 2008.
6.2 Study Conclusions
6.2.1 Larger and public hospitals are at the forefront
468 Larger and public hospitals have clear advantages in relation to the development, take-up and roll-out of
eHealth capabilities. This is no surprise as such institutions have a larger economies of scale, greater in-
house expertise in terms of vital eHealth skill sets (larger IT departments and dedicated staff, project
managers, staff with more exposure to eHealth concepts, practices and solutions, etc.) as well as more
resources, including incentives to develop eHealth (both public and larger hospitals tend to receive more
incentives relating to IT systems than private and smaller hospitals). Larger hospitals (as well as public
hospitals) are also generally better-equipped than private establishments and small and medium-sized
hospitals with respect to the type of internet connection they use.
469 In addition to this, the quality of eHealth functions also appears to be greater than in smaller hospitals.
The largest hospitals seem to ensure better data protection than small and medium-sized hospitals, and
they are more likely to use EMR/EHR/EPR and tend to share this information more readily. A similar effect
can be observed in relation to hospital size and PACS usage. The bigger the establishments are, the more
they rely on PACS. In fact, there is a very clear positive correlation between hospital size and the extent to
which hospitals electronically exchange information about patients, whatever the type of information.
470 Overall, these characteristics combine to make larger hospitals eHealth hubs that are able to develop and
roll-out eHealth practices and solutions more quickly, as well as lead in terms of reliance on and quality of
eHealth capabilities.
6.2.2 Definite country differences are in place
471 Nordic countries appear to be the overall leaders in eHealth across the EU27+3, with consistent leadership
across a range of eHealth indicators. Hospitals situated in Nordic countries (as well as large hospitals and
public hospitals) are most likely to encounter interoperability problems – which may be due to a wider
investment in different eHealth assets, and thus a higher exposure to problems in integration and
interoperability. This is reinforced by the fact that most of the Nordic countries
Are the most advanced in terms of implementation of IT systems or applications;
Are more advanced in video conferencing; and also
Devote a generally higher part of their budget to IT than other countries.

European Hospital Survey: Benchmarking Deployment of eHealth Services (2012-2013)
243
472 Conversely, the lesser performing regions are within Eastern and Southern Europe. Countries lagging
behind in the implementation of a wireless infrastructure in their hospitals are located in Eastern,
Southern and Central Europe, while those where this is most developed are the countries of Northern and
Western Europe. Eastern countries also have a higher proportion of hospitals having a narrowband
connection. Furthermore, hospitals in Eastern European countries tend to lag behind regarding the
interconnectivity of their computer systems. However, while the relative wealth and capacity to invest may
broadly explain these differences, the conclusions are not necessarily so clear cut. One question raised is
that, if it were simply a matter of relative wealth, then why do many of the larger and wealthier EU states
fail to perform as well as the Nordic countries? The answer may lie in the sheer scale of their healthcare
sector, making change difficult and relatively slow to implement, but this may also have cultural, social
and political underpinnings. Also, many Central European states and other post-soviet states also
performed well in certain indicators. For example, while Nordic countries tend to lead in the electronic
exchange of medication lists information with other healthcare providers, other leaders in this field include
Croatia, the Czech Republic, Estonia and Latvia. Both the Nordic and Baltic countries are also forerunners
in HIE, with high levels of implementation and usage.
6.2.3 eHealth can be slow to develop, but is quickly relied upon once in place
473 While the impediments to eHealth take-up by institutions can be easily imagined (capital investment,
difficulty of introducing change to a complex environment, process reorganisation (accompanied by
potential labour reorganisation and labour relations challenges), technical sophistication and multiple
stakeholders), the user acceptance of eHealth appears to be quite high.
474 Overall, Hospitals having eHealth functionalities available mostly use them routinely, and this is important
in terms of charting not just the take-up of eHealth capabilities, but also the ultimate utility.
475 Telehealth is a good example of this trend. According to our data:
Telehealth is only implemented to a minor extent and is mostly available for holding consultations with other healthcare practitioners (31%);
Telehealth with patients is not very common (implemented in less than 12% of the surveyed hospitals on average).
476 However, when telehealth capabilities are implemented, they are mostly used (usage in around 90% of
the surveyed hospitals on average).
477 This demonstrates that the capability offers genuine utility for healthcare professionals.
6.2.4 Gaps in terms of data security, data access and IT planning could easily be closed
478 We noted the following details in relation to governance of data, patient access to electronic medical data
as well as IT planning:
85% of hospitals surveyed have clear rules for accessing patients’ electronic medical data;
More than 90% of hospitals surveyed have regulations to guarantee the privacy and security of data, either at national (58%), regional (27%) or hospital level (66%);
Only a small majority (57%) of the surveyed European hospitals have an IT strategic plan, as opposed to 40% of hospitals who do not have one.
European Hospital Survey: Benchmarking Deployment of eHealth Services (2012-2013)
244
479 In relation to data access, data security and data privacy, clear rules applying at all hospital levels should
be mandatory. Therefore, despite seemingly high percentage levels (between 85%-90%), the incidence
should in fact be much higher. Data governance – as expressed in guidelines, rules and procedures – is not
difficult to implement and is typically derived from well-known legislative instruments (e.g. European
Directives) or best practice guidelines (such as ITIL78). Translating the various requirements into a single
working document does not require much investment, and should in fact be universal for all healthcare
providers in any jurisdiction. Closing the gap in relation to data governance should thus be one of the
simplest challenges to overcome within the entire sector.
480 Similarly, the study found that the surveyed hospitals seldom implement a coherent IT strategic plan,
despite the relatively low cost of introducing such a document. While it is understood that smaller
hospitals with less IT investment may not have a use for such a plan, the relatively low penetration of IT
strategic plans in European hospitals suggests an environment where eHealth itself is not formally
recognised as a strategic necessity at hospital level. Nor do such documents have to involve painstaking
levels of detail. As stated previously in our study, an IT strategic plan includes a mission and a vision
statement, objectives for the IT department, an assessment of the needs and requirements (in terms of
infrastructure, staff, technologies, etc.), a description of the current and future projects intended to satisfy
those needs, a budget and a method for a follow-up evaluation. The level of granularity invested in these
details is entirely up to the judgment of senior hospital staff. Therefore, the implementation of an IT
strategic plan should be much more prevalent at all levels.
6.3 Recommendations
6.3.1 Survey recommendations
481 Our study has been conducted using largely the same methodology as the 2010 Benchmarking III project
and this has guaranteed the comparability of the data over the years. However, some recommendations
can be made in order to improve the quality of responses in future waves of this study. These
recommendations can be grouped in two main areas:
1. The scope of the study
2. The methodology used and the target population
6.3.1.1 The scope of the study
482 For this edition of the survey, 7 main topics (referred to as ‘Blocks’) were covered during the interviews
with the respondents. These were:
Block A. Characterisation of the hospital;
Block B. ICT infrastructure;
Block C. ICT applications;
Block D. Health Information Exchange;
Block E. Security and privacy;
Block F. IT functionalities;
Block G. Hospital statistics.
483 Block F was a new section on IT functionalities which was not featured in the previous 2010 survey. This
had the practical effect of substantially lengthening the interview with respondents. We estimate that
interview duration hence increased by 13 minutes in comparison to the previous interview duration of 30
minutes, on account of the addition of this new block.
484 The objective of this new block was to analyse the degree of availability as well as the usage of different
types of health information and eHealth functionalities within each hospital. In this, the study has been
78 ITIL (IT Infrastructure Library) is the most widely accepted approach to IT service management in the world. ITIL provides a
cohesive set of best practices, drawn from the public and private sectors internationally. Source: http://www.itil-officialsite.com/, accessed 16 May 2013.
European Hospital Survey: Benchmarking Deployment of eHealth Services (2012-2013)
245
successful in terms of gathering a critical mass of new data. We believe that new indicators could be also
generated from this block and that these functionality indicators would complement the 13 indicators
which are already included on our spider charts for the country reports.
485 Block G was composed of a number of quantitative survey elements, such as the average length of stay in
the hospital per year (see Appendix 3 for more details). Many CIOs however did not have the data at hand
and were rather unwilling or unable to provide the answers. If needed for future surveys, this data should
either be gathered be desk research or by targeting other roles in the respective hospitals.
486 The drawback of the enlargement of the survey was that it had a noticeable effect on the fatigue levels of
respondents, who were “tired” when arriving to the end of the questionnaire and this may have had an
impact on the quality of their answers. We attempted to mitigate this by bringing priority questions closer
to the beginning of the questionnaire. Thus, we would recommend shortening the questionnaire in future
studies in order to maintain a higher quality of responses. As a general rule, new questions should only be
inserted if older questions are being taken out in order to maintain survey lengths at a more ‘respondent-
friendly’ duration.
487 With regard to the scope of the survey, we believe it would be interesting to explore the barriers to
eHealth usage. In fact, this survey mainly gathers information on the access and penetration of eHealth
services but does not examine the reasons for eHealth not being implemented in the first place. For
example, should a respondent give a negative reply to a question asking whether a certain eHealth
solution is in place, follow up questions could ask: 1) whether the eHealth capability was considered and
rejected, and 2) if considered, what was the main reason for the rejection? It should be noted that these
additional questions should be applied sparingly so that the questionnaire is not expanded excessively, and
potentially only to particular eHealth capabilities which have displayed disappointing take up in the past.
The choice of such capabilities should be an item for discussion at the inception phase of the next
benchmarking study.
6.3.1.2 The methodology used and target population
488 We believe the defined target population of the study was relevant to this study and that only highly
skilled ICT profiles would have been able to answer this type of questionnaire. However, due to the busy
schedule of such managerial posts, we believe that online surveys, rather than CATI survey, could be
considered for longer questionnaires, combined with follow-up reminder e-mails and phone calls. The
respondents would have the benefit of being able to complete the questionnaire when most convenient
and at different moments (during time-periods that are less busy), making completion of the
questionnaire more convenient for them. This methodology could also increase the response rate and
could potentially decrease survey costs. It may also allow for respondents to introduce data in open
questions which they would not necessarily have to hand at a specific point in time (e.g. budgetary data)
and that they need time to reference.
489 As most (91%) European hospitals have internet access (88% have access to broadband), it would be
appropriate to use such a methodology and would enhance data comparability in relation to previous
survey results. This methodology could be particularly beneficial in countries such as Italy and Germany,
where we encountered more difficulties in reaching the minimum sample size requested.
490 The number of completed interviews has been significantly increased (from 906 to 1753) compared to the
2010 study, especially in small countries where the representativeness of the sample has improved.
However, in order to be able to expand the analysis at a regional/sub-regional (NUTS 1/NUTS 2) level, it
would be important to achieve a more precise sample; therefore, hard or soft quotas could be applied at
geographical level. This would be very useful in reaching a minimum sample within each NUTS 1/NUTS 2
region so as to enable data analysis at NUTS level in most of the countries.

European Hospital Survey: Benchmarking Deployment of eHealth Services (2012-2013)
246
6.3.2 Policy Recommendations
6.3.2.1 Benefit from the advantages of larger hospitals
491 As the statistics have demonstrated, larger hospitals have clear advantages in their use and deployment
of eHealth capabilities. They are more likely to introduce and make use of eHealth capabilities, as well as
to exchange data electronically, regardless of the data involved. In the previous eHealth benchmarking
study79, the authors noted in their conclusions the need to promote the concept of building relationships
between small, non-university hospitals and large, research-oriented or university hospitals.
492 We concur with this idea, but suggest examining how this can be leveraged in a more practical way,
particularly with respect to eHealth infrastructure and assets. For example, we believe it may be worth
investigating the possibility of assigning national ‘centre of excellence’ status to larger hospitals with
advanced eHealth capabilities and assign incentives for these hospitals to improve upon and develop
eHealth further – particularly when these eHealth capabilities can be extended to other hospitals.
493 This could take the form of larger hospitals acting as shared services centres within a defined region and
responsible for hosting large databases (e.g. patient data) in order to avoid duplication of costly
infrastructure, rationalise maintenance costs and simultaneously extend the benefits of eHealth to smaller
hospitals.
494 There are clear obstacles to such an approach, in particular bandwidth. Indeed, adequate bandwidth is
essential to transfer large medical documents efficiently (particularly medical imagery). This does not
mean that current levels of bandwidth are inadequate, but it may rule out interactions with hospitals
lacking a minimum level of connectivity (for example, hospitals still operating with dial-up facilities are
unlikely to be able to benefit much). Other obstacles involve investments on resolving interoperability
issues – which persist even within hospitals, let alone between them (see below).
495 However, by suggesting a hospital-centric approach focused on national eHealth champions, Member
States may be able to concentrate on consolidating their current eHealth assets and creating a more
robust eHealth base across multiple regions. A combination of grants and low or no interest rate loans
could be made available for those eHealth systems which have a proven track record in cutting overall
hospital budgets or increasing overall efficiency. This could be used in particular to develop Centre of
Excellence Hospitals and potentially shared services solutions. Furthermore, knowledge transfer is vital to
spread the expertise and benefits of eHealth systems across the EU, in particular from advanced countries
to less advanced countries. Exchange programs should be sponsored for administrators, IT staff and senior
healthcare professionals to expose each participant to the varying challenges, solutions and
implementation methodologies available on the market.
6.3.2.2 Accelerate efforts to overcome interoperability issues
496 The concepts of interoperability and electronically exchangeable patient data were already noted in the
2004 Action Plan80, the 2006 Report of Unit ICT for Health in collaboration with the i2010 sub-group on
eHealth81 and the 2008 Recommendation on interoperability82, amongst others. Interoperability was also
raised in the 2010 benchmarking study83 as an ongoing issue, and cited in the 2011 Cross-border
Healthcare directive84, which stated that ‘widely different and incompatible formats and standards are
used for provision of healthcare using ICTs throughout the Union, creating both obstacles to this mode of
cross-border healthcare provision and possible risks to health protection’. Interoperability remains a clear
issue of concern based on our observations within this study.
79 Deloitte & Ipsos, (2011), op. Cit. 80 European Commission, COM (2004) 356, op. Cit 81 European Commission (2006), op. Cit. 82 European Commission, COM(2008)3282, op. Cit. 83 Deloitte & Ipsos (2011), op. Cit. 84 European Parliament, DIRECTIVE 2011/24/EU, op. Cit.
European Hospital Survey: Benchmarking Deployment of eHealth Services (2012-2013)
247
497 Consider this statement made by the International Telecom Union’s Standardisation Sector
(ITU-T)85 in 2012:
Interoperability is not a given in electronic healthcare. Lack of interoperability is one of the greatest threats to achieving the improvements to healthcare and cost efficiency promised by emerging e-health systems. This barrier is not only a technical barrier but a market-driven barrier arising from the economic competition inherently occurring among companies seeking to profit in emerging and extremely lucrative e-health industries, and the lack of incentives among healthcare delivery systems to adopt standards. Unless a critical mass of healthcare technology providers adheres to the same standards for electronic health records, the system will not provide the anticipated cost efficiencies and healthcare quality improvements. The same requirement holds for aggregated public health data and mobile systems. As long as electronic health records are fragmented technically without adequate standardization among providers and vendors, meaningful system federation / public aggregation or remote clinical care will be difficult to achieve.
498 If, as is suggested by the ITU-T86, the eHealth standards landscape is institutionally heterogeneous, it may
be justified to examine the eHealth industry and consider whether the ongoing interoperability issues
constitute a market failure. Unless a critical mass of healthcare technology providers adheres to the same
standards for electronic health records, the system will not provide the anticipated cost efficiencies and
healthcare quality improvements. Technical improvements may foster the uptake of interoperability
standards but they cannot by themselves solve the problem if not accompanied by the appropriate legal
and regulatory frameworks, and more specifically incentives (see also below). Nevertheless, the
Commission is currently actively engaged in reducing interoperability issues on many levels, including the
European Patients Smart Open Services project (epSOS, to end in December 2013), the thematic network
on eHealth Interoperability (CALLIOPE), and the Healthcare Interoperability Testing and Conformance
Harmonisation (HITCH, launched in January 2010). Deliverables from the various efforts should be evident
from 2014 onwards, and will hopefully be reflected in the corresponding benchmark study for that period.
However, based on the long duration of interoperability issues with the eHealth sector, it may be time for
the EU to consider bolder action in relation to interoperability issues if no substantive progress is evident
by that time.
6.3.2.3 Close the governance gaps - Data security, privacy, access and hospital ICT strategy planning
499 The Commission is currently working on a root-and-branch review of the EU’s data protection rules, and
therefore has a golden opportunity to create a regime which will be conducive to eHealth capability
development. Therefore, it is to be hoped that the ultimate output of this review will address the high-level
concerns in relation to data exchange, privacy and access. The 2011 Cross-border Healthcare directive87
went a long way to establish the citizen’s rights in relation to their health records, as well as establ ishing
the eHealth network which is involved in many of the interoperability areas discussed above. This
development should produce a functioning regulatory and technical environment which is conducive to a
much greater development and roll-out of eHealth capabilities.
500 However, at the hospital level there must be a concentrated push to close all current gaps in security,
guaranteeing the privacy and security of data and accessing patients’ electronic medical data. By contrast
to infrastructure and ICT investment, this is a relatively low cost area which can be addressed by Member
States (with whom the responsibility lies to implement the provisions of the Cross-border healthcare
directive for example) simply by enforcing the requirements of the Directive.
501 Similarly, the current low levels of strategy planning need to be improved, and all hospitals should either
have an ICT strategy plan of their own, or at least be incorporated under regional and/or national ICT
strategy plans if the hospital is below a certain threshold in terms of IT staffing, budgets, etc.
502 Promotion of specific Healthcare ICT governance, covering eHealth as a major component, derived from
existing best practices in both the healthcare sector and the ICT industry, could assist in the improvement
of this area and closure of the governance gap.
85 ITU (2012), E-health Standards and Interoperability, ITU-T Technology Watch Report, April 2012, ITU. 86 Ibidem. 87 European Parliament, DIRECTIVE 2011/24/EU, op. Cit.

Appendix 1 Appendix 1: Abbreviations and acronyms
278
7 Apppendix
7.1 Appendix 1: Abbreviations and acronyms
Abbreviations/acronyms Meaning
AHA American Hospital Association
ANSI American National Standards Institute
CAT scanner Computed Axial Tomography scanner
CATI Computer-Assisted Telephone Interviewing
CDC Centre of Disease Control
CENELEC European Committee for Electrotechnical Standardisation
CIO Chief Information Officer
CNO European Committee for Standardisation
COO Chief operational officer
CVIS Cardiology and Visualisation Information System
DG INFSO Directorate-General for Information Society and Media
DICOM Digital Imaging and Communication in Medicine
EAS Enterprise Archiving Strategy
EC European Commission
EHR Electronic Health Record
EMR Electronic Medical Record
EPR Electronic Patient Record
ETSI European Telecommunications Standards Institute
EU European Union
FTE Full-Time Equivalent
GOe Global Observatory for eHealth
GP General Practitioner
HIE Health Information Exchange
HIS Healthcare Information System
HL7 Health Level Seven
ICT Information and Communication Technology
IHE Integrating the Healthcare Enterprise
IPTS Institute for Prospective Technology Studies
ISDN Integrated Services Digital Network
ISO International Organisation for Standardisation
IT Information Technology
ITIL IT Infrastructure library
JRC Joint Research Centre
Mbps Megabits per second
MRI Magnetic Resonance Imaging
NHS National Health Service
NUTS Nomenclature of Units for Territorial Statistics
OECD Organisation for Economic Co-operation and Development
OSI Open Systems Interconnections
PACS Picture Archiving and Communication System
PSTN Public Switched Telephone Network
RIS Radiology Information System

Appendix 1 Appendix 1: Abbreviations and acronyms
279
Abbreviations/acronyms Meaning
TEC Trans-Atlantic Economic Council
UK United Kingdom
US United States
USA United States of America
WHO World Health Organisation

Appendix 2 Appendix 2: Glossary of terms and definitions
280
7.2 Appendix 2: Glossary of terms and definitions
Adverse Event 503 Any undesirable experience occurring to a patient treated with a pharmaceutical product whether or not
considered related to the medicinal product. This includes adverse events occurring in the course of the
use of a drug product in professional practice, adverse events occurring from drug overdose, adverse
events occurring from drug withdrawal and any failure of expected pharmacologic action.
504 Adverse health events reporting system is an electronic reporting system for reporting adverse health
events that take place. These health events could happen at a hospital, department, or ward level and also
include the reporting of near misses.
Application 505 A software program or set of related programs that provide some useful healthcare capability or
functionality.
Archived document 506 A status in which a document has been stored off-line for long-term access.
Billing management system 507 System that produces automated electronic/paper bills and invoices hospital-wide.
Business intelligence information system 508 Reporting applications and analysis tools including a variety of components such as tabular reports,
spreadsheets, charts and dashboards.
Catchment area 509 Number of inhabitants covered by a hospital.
Certification 510 Technical evaluation performed as part of, and in support of, the accreditation process that establishes the
extent to which a particular computer system or network design and implementation meet a pre-specified
set of security requirements.
Clinical data/information 511 Data/information related to the health and healthcare of an individual collected from or about an
individual receiving healthcare services. Includes a caregiver's objective measurement or subjective
evaluation of a patient's physical or mental state of health, descriptions of an individual's health history
and family health history, diagnostic studies, decision rationale, descriptions of procedures performed,
findings, therapeutic interventions, medications prescribed, description of responses to treatment,
prognostic statements and descriptions of socio-economic and environmental factors related to the
patient's health.
512 A clinical information system is a system that collects, stores, retrieves, and communicates health related
data, information and knowledge.
Clinical decision support system 513 Typically used when referring to a type of system that assists health care providers in making medical
decisions. These types of systems typically require input of patient-specific clinical variables and as a
result provide patient-specific recommendations.

Appendix 2 Appendix 2: Glossary of terms and definitions
281
Cryptography 514 The branch of cryptology dealing with the design of algorithms for encryption and decryption, intended to
ensure the secrecy and/or authenticity of messages, primarily through the use of mathematical or logical
functions that transform intelligible data into seemingly unintelligible data and back again.
515 Encryption is a process by which data are temporarily re-arranged into an unreadable or unintelligible
form for confidentiality, transmission, or other security purposes.
Diagnosis 516 Condition for which the patient is seeking care. Types of diagnoses range from early and indefinite to final
and definitive. Some examples (in general order of definiteness) include presenting (or chief complaint),
presumptive, working, admitting, discharge, dismissal, or final. Applying classification codes to the
diagnosis becomes more straightforward as the diagnosis is more established. Early diagnoses may be
vague or even expressed in natural language rather than coded.
Digital Imaging and Communications in Medicine (DICOM) 517 Standard in digital imaging. Version 3 of DICOM defines image data as well as patient, study and visit
information necessary to provide the context for the images. This version incorporates an object-oriented
data model and adds support for ISO Standard communications.
Digital signature 518 Authentication tool that verifies the origin of a message and the identity of the sender and receiver. Can
be used to resolve any authentication issues between the sender and receiver. A digital signature (code) is
unique for every transaction and guarantees the source and integrity of the message.
Discharge letter 519 Letter in which the medical status and the treatment given to the patient and instructions for further
treatment and medication is given to the general practitioner on the discharge of the patient from the
hospital.
Electronic Health (eHealth) ICT tools and services for health, used by healthcare professionals, institutions and administrations as well as utilities which provide patients directly with services related to healthcare.
Electronic Health Record (EHR)
520 Information, assembled and maintained in an electronic format, which pertains to the health status of an
individual, and the health services delivered to an individual.
eBooking 521 System enabling appointments to be booked with health care professionals. Bookings can be done by
either the health care personnel or by the patients/citizens.
Electronic Medical Record 522 Electronic record of health-related information on an individual that is created, gathered, managed, and
consulted by licensed clinicians and staff from a single organisation who are involved in the individual's
health and care.
electronic Prescribing 523 System that enables the prescriber to send an accurate, error-free and understandable prescription
electronically directly to a pharmacy.
Emergency department 524 Area of a hospital especially equipped and staffed for emergency care.

Appendix 2 Appendix 2: Glossary of terms and definitions
282
Electronic Health Record 525 Aggregate electronic record of health-related information on an individual that is created and gathered
cumulatively across more than one health care organisation and is managed and consulted by licensed
clinicians and staff involved in the individual's health and care.
Electronic Patient Record 526 Record about an individual patient stored in a healthcare provider's computer, in a database that is
typically the property of the provider. It will usually contain the patient's demographic data and medical
information collected only when the patient visits that provider.
Enterprise archive strategy (EAS) 527 Comprehensive information archiving strategy that is aligned with the company or the hospital's goals and
performance needs.
Extranet 528 System of computers that makes it possible for a company and people outside the company to
communicate and share information over the internet. Extranets also allow employees who work away
from the office to connect to the office computers
Family planning centre 529 Medical facility focusing on regulating the number and spacing of children in a family (e.g. contraception
and aborts)
Fingerprint system 530 Biometric system that compares a fingerprint pattern with a stored pattern to determine whether there’s a
match.
Full-Time Equivalents 531 Unit indicating the workload of an employed person in a way that makes workloads comparable across
various contexts. For instance, 1 FTE means that a person works full-time worker or two people work half-
time.
General Practitioner 532 Physician providing primary care.
Health alerts 533 Urgent messages from the Centers of Disease Control (CDC) to health officials requiring immediate action
or attention.
Health Information Exchange (HIE) 534 HIE is transferring/sharing/enabling access to patient health information and data. Exchange may take
place between different types of entities, such as care organisations within a country/region/community/or
network of hospitals.
Health Information Security 535 Physical, technological, or administrative safeguards or tools used to protect identifiable health
information from unwarranted access or disclosure.
Health Level 7 (HL7) 536 Application protocol for electronic data exchange in health care environments. The HL7 protocol is a
collection of standard formats which specify the implementation of interfaces between computer
applications from different vendors. This communication protocol allows healthcare institutions to
exchange key sets of data amount different application systems. Flexibility is built into the protocol to
allow compatibility for specialized data sets that have facility-specific needs.

Appendix 2 Appendix 2: Glossary of terms and definitions
283
Healthcare 537 Broad term that directly refers to different activities and means used to prevent or cure different
processes of morbidity.
Hospice 538 Facility where care is provided for free or at very cheap price, most often for elderly people or terminally ill
patients
Information System 539 Interconnected set of electronic information resources and/or applications under the same direct
management control. A system normally includes hardware, software, information, data, applications,
communications, and people. It is made up of databases, application programs, and manual and machine
procedures. It also encompasses the computer systems that do the processing, as well as intermediary
systems that route or perform some action as part of the processing.
Integrating the Healthcare Enterprises (IHE) 540 The IHE initiative defines integration profiles in the context of existing standards to enable information
exchange among different software solution providers. These profiles are based on the corresponding
medical workflows. Solution providers meet annually at so-called “Connectathon” events to test the
interoperability of their products using the IHE integration profiles.
Intensive care unit 541 Unit in which is concentrated special equipment and specially train care of seriously ill patients requiring
immediate and continuous attention.
International Standards Organisation (ISO) 542 Worldwide federation of national standards bodies from some 100 countries; one from each country.
Among the standards it fosters is Open Systems Interconnections (OSI), a universal reference model for
communication protocols. Many countries have national standards organisations, such as the U.S.
American National Standards Institute (ANSI), that participate in and contribute to ISO standards
development.
Interoperability 543 Ability of health information systems to work together within and across organisational boundaries, in
order to advance the effective delivery of health care for individuals and communities.
Mobile emergency care provider 544 Mobile units providing care outside the hospital.
Operating room 545 Room equipped for performing surgical operations.
Organisational level 546 Between the different organisations or departments
Password 547 Confidential authentication information composed of a string of characters.
Picture Archiving and Communication System (PACS) 548 System enabling x-rays and scan images to be viewed on screen and managed, distributed and stored
electronically
Primary care centre 549 Medical facility focusing on the initial treatment of medical ailments that are not life threatening
Appendix 2 Appendix 2: Glossary of terms and definitions
284
Privacy 550 Individual's or organisation's right to determine whether, when, and to whom, personal or organisational
information is released. Also, the right of individuals to control or influence information that is related to
them, in terms of who may collect or store it, and to whom that information may be disclosed.
Protection 551 Domain boundary within which security services provide boundary: a known level of protection against
threats.
Recovery 552 Restoration of an information system back to an error-free and secure state from which normal operation
can resume.
553 A disaster recovery is the process whereby an enterprise would restore any loss of data in the event of
fire, vandalism, natural disaster, or system failure.
Referral letter 554 Letter sent from the medical director (whether a general practitioner or a specialist) referring a patient to
another medical director for treatment in which major medical problems, major findings from previous
medical exams are given.
Security 555 Refers to the physical, technological, or administrative safeguards or tools used to protect identifiable
health data from unwarranted access or disclosure.
Semantic level 556 In terms of the use of terminologies and classifications for clinical, medical or statistical purposes.
Standard 557 Specification of the characteristics of some product or activity that has been agreed by a standards body
operating on a national, a regional or a world basis. In the information systems area the key issue is that
of ensuring that information systems can work together effectively and in the information security area
the key issue is that the security provided by the component or system should be up to the standard
specified. The European regional standards body concerned with Medical Informatics is CEN and
conformance with European standards is a requirement for public bodies within the European Union when
purchasing systems over a certain value.
Technical level 558 At the level of technical standards, architectures or platforms.
Tele-homecare/tele-monitoring services 559 System that sends and views radiological images from one location to another for the purposes of
interpretation and/or consultation by a radiologist form outside the hospital.
Tele-radiology system 560 System that sends and views radiological images from one location to another for the purposes of
interpretation and/or consultation by a radiologist form outside the hospital.
Value-added network 561 Private network provider (sometimes called a turnkey communications line) that is hired by a company.
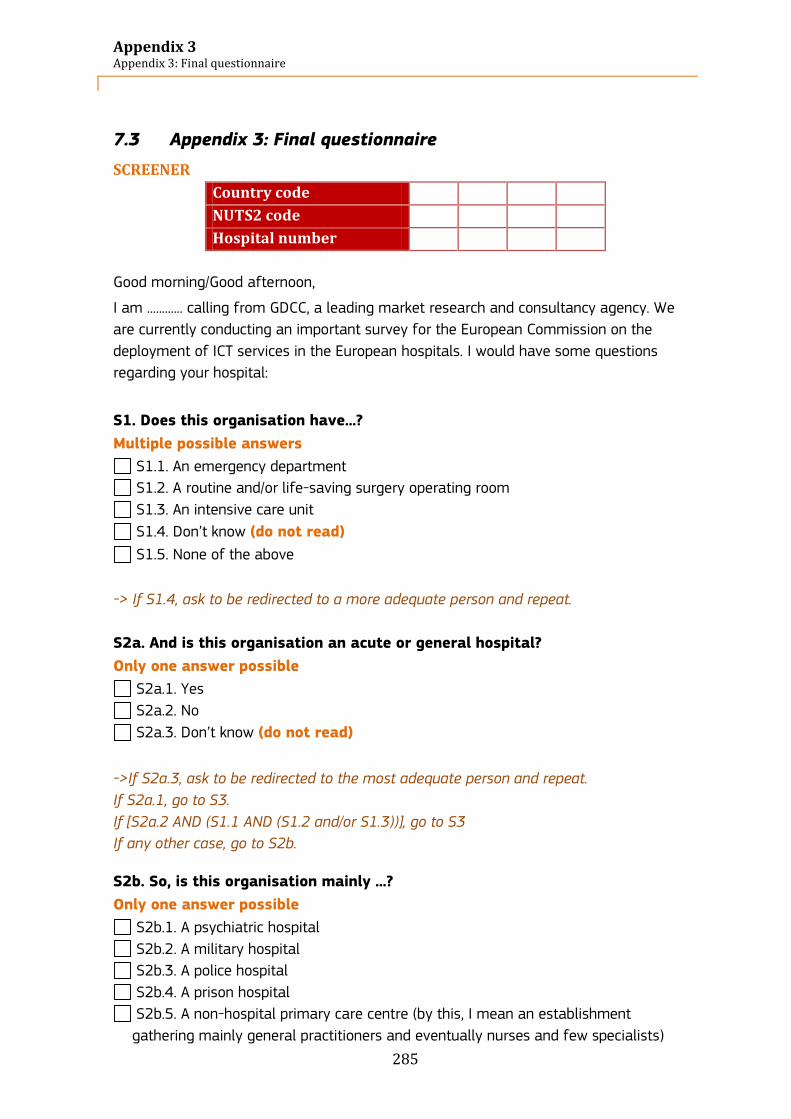
Appendix 3 Appendix 3: Final questionnaire
285
7.3 Appendix 3: Final questionnaire
SCREENER
Country code
NUTS2 code
Hospital number
Good morning/Good afternoon,
I am ............ calling from GDCC, a leading market research and consultancy agency. We
are currently conducting an important survey for the European Commission on the
deployment of ICT services in the European hospitals. I would have some questions
regarding your hospital:
S1. Does this organisation have...?
Multiple possible answers
S1.1. An emergency department
S1.2. A routine and/or life-saving surgery operating room
S1.3. An intensive care unit
S1.4. Don’t know (do not read)
S1.5. None of the above
-> If S1.4, ask to be redirected to a more adequate person and repeat.
S2a. And is this organisation an acute or general hospital?
Only one answer possible
S2a.1. Yes
S2a.2. No
S2a.3. Don’t know (do not read)
->If S2a.3, ask to be redirected to the most adequate person and repeat.
If S2a.1, go to S3.
If [S2a.2 AND (S1.1 AND (S1.2 and/or S1.3))], go to S3
If any other case, go to S2b.
S2b. So, is this organisation mainly ...?
Only one answer possible
S2b.1. A psychiatric hospital
S2b.2. A military hospital
S2b.3. A police hospital
S2b.4. A prison hospital
S2b.5. A non-hospital primary care centre (by this, I mean an establishment
gathering mainly general practitioners and eventually nurses and few specialists)

Appendix 3 Appendix 3: Final questionnaire
286
S2b.6. A family planning centre
S2b.7. A facility focusing on plastic surgery
S2b.8. A hospice
S2b.9. A mobile emergency care provider
S2b.10. A fertility clinic
S2b.11. A diagnostic imaging clinic
S2b.12. Other: Please specify
S2b.13. Don’t know (do not read)
-> If any of these answers, close the interview.
S3. Could you tell me how many beds there are in your hospital?
Only one answer possible
S3.1. Fewer than 101 beds
S3.2. Between 101 and 250 beds
S3.3. Between 251 and 750 beds
S3.4. More than 750 beds
S3.5. Don’t know (do not read)
S4. Is this hospital...?
Only one answer possible
S4.1. Public
S4.2. Private
S4.3. Private not for profit
S4.4. Don’t know (do not read)
Could you please transfer me to the person responsible for information and technical
applications inside your hospital? It can be the Chief information officer, the ICT
director/manager or the Operation manager for instance.
S5. Are you the CIO / IT director/manager and would you describe yourself as
the person with the most knowledge on ICT related matters in {name
organisation}?
Only one answer possible
S5.1. Yes, that is me
S5.2. No, that is someone else
-> if S5.2, ask to be redirected to the most adequate person and repeat.
-> Once in contact with the CIO, explain the survey purpose.
-> Send the letter (if necessary) and the electronic version of the questionnaire (if necessary). Inform on the possibility of answering the survey through internet

Appendix 3 Appendix 3: Final questionnaire
287
SURVEY
Block A. Characterisation
Q1. What is your current position in the hospital?
Only one answer possible
Q1.1. Chief information officer
Q1.2. ICT manager/director
Q1.3. Chief operational officer (COO)/ Operations Manager
Q1.4. Other: specify
Q2a. Could you please confirm that this hospital has...[answer question S3]
Only one answer possible
Q2a.1. Yes
Q2a.2. No
-> If Q2a.1, then go to Q3. If Q2a.2, then go to Q2b.
Q2b. Then, could you tell me how many beds there are in your hospital?
Only one answer possible
Q2b.1. Fewer than 101 beds
Q2b.2. Between 101 and 250 beds
Q2b.3. Between 251 and 750 beds
Q2b.4. More than 750 beds
Q2b.5. Don’t know (do not read)
Q3. And is this hospital …?
Only one answer possible
Q3.1. An independent hospital on one site
Q3.2. An independent hospital on multiple sites
Q3.3. Part of a group of different hospitals: specify how many hospitals in the group
Q3.4. Part of a group of care institutions: specify how many care institutions in the
group
Q3.5. Other: specify
Q4. Is this hospital a university hospital?
Only one answer possible
Q4.1. Yes
Q4.2. No
-> If Q4.2, then ask Q5
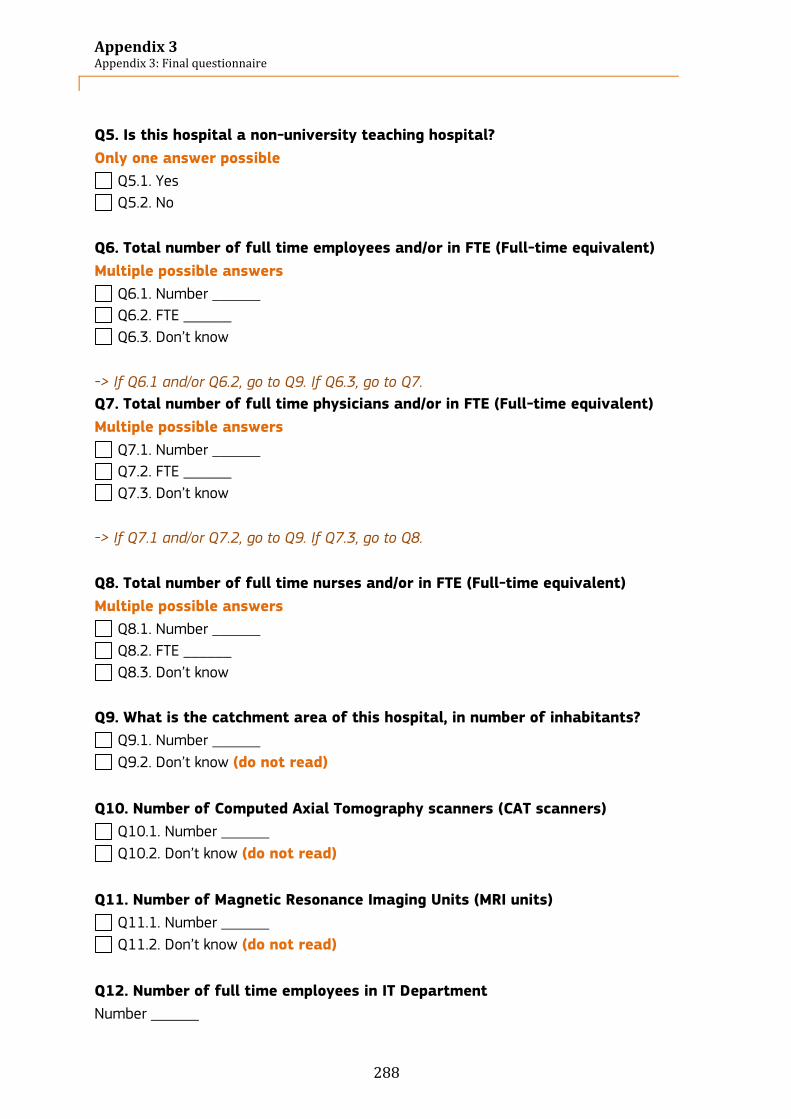
Appendix 3 Appendix 3: Final questionnaire
288
Q5. Is this hospital a non-university teaching hospital?
Only one answer possible
Q5.1. Yes
Q5.2. No
Q6. Total number of full time employees and/or in FTE (Full-time equivalent)
Multiple possible answers
Q6.1. Number ______
Q6.2. FTE ______
Q6.3. Don’t know
-> If Q6.1 and/or Q6.2, go to Q9. If Q6.3, go to Q7.
Q7. Total number of full time physicians and/or in FTE (Full-time equivalent)
Multiple possible answers
Q7.1. Number ______
Q7.2. FTE ______
Q7.3. Don’t know
-> If Q7.1 and/or Q7.2, go to Q9. If Q7.3, go to Q8.
Q8. Total number of full time nurses and/or in FTE (Full-time equivalent)
Multiple possible answers
Q8.1. Number ______
Q8.2. FTE ______
Q8.3. Don’t know
Q9. What is the catchment area of this hospital, in number of inhabitants?
Q9.1. Number ______
Q9.2. Don’t know (do not read)
Q10. Number of Computed Axial Tomography scanners (CAT scanners)
Q10.1. Number ______
Q10.2. Don’t know (do not read)
Q11. Number of Magnetic Resonance Imaging Units (MRI units)
Q11.1. Number ______
Q11.2. Don’t know (do not read)
Q12. Number of full time employees in IT Department
Number ______
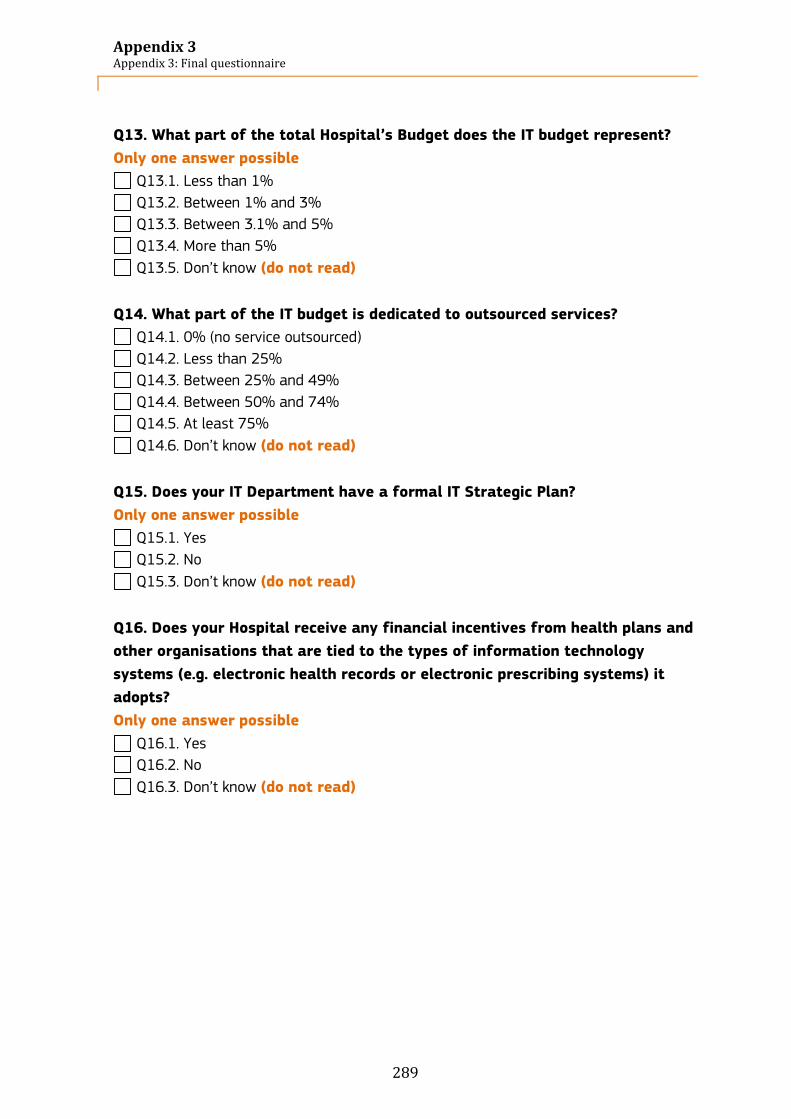
Appendix 3 Appendix 3: Final questionnaire
289
Q13. What part of the total Hospital’s Budget does the IT budget represent?
Only one answer possible
Q13.1. Less than 1%
Q13.2. Between 1% and 3%
Q13.3. Between 3.1% and 5%
Q13.4. More than 5%
Q13.5. Don’t know (do not read)
Q14. What part of the IT budget is dedicated to outsourced services?
Q14.1. 0% (no service outsourced)
Q14.2. Less than 25%
Q14.3. Between 25% and 49%
Q14.4. Between 50% and 74%
Q14.5. At least 75%
Q14.6. Don’t know (do not read)
Q15. Does your IT Department have a formal IT Strategic Plan?
Only one answer possible
Q15.1. Yes
Q15.2. No
Q15.3. Don’t know (do not read)
Q16. Does your Hospital receive any financial incentives from health plans and
other organisations that are tied to the types of information technology
systems (e.g. electronic health records or electronic prescribing systems) it
adopts?
Only one answer possible
Q16.1. Yes
Q16.2. No
Q16.3. Don’t know (do not read)

Appendix 3 Appendix 3: Final questionnaire
290
Block B. ICT infrastructure
Q17. Do you have a computer system in your hospital?
Only one answer possible
Q17.1. We do not have any computer system but only personal computers that are
not part of a hospital-wide system
Q17.2 We have an independent hospital-wide computer system
Q17.3 Our computer systems are part of a network of different hospitals or hospital
sites
Q17.4 Our computers systems are part of a regional or national network
Q17.5. Don’t know (do not read)
Q18. Is your hospital computer system externally connected…?
Allow multiple answers for Q18.1 and Q18.2 only
Q18.1 Yes, through an extranet i.e. using a secure Internet connection over the
Internet
Q18.2 Yes, through a value-added network or proprietary infrastructure
Q18.3 Our computer system is not connected
Q18.4. Don’t know (do not read)
Q19. What type of Internet connection does your hospital have?
Only one answer possible
Q19.1. Narrowband (Dial-up/PSTN) ISDN (128 kbit/smax)
Q19.2. Broadband (below 30 Mbps)
Q19.3. Broadband (from 30 Mbps to 49 Mbps)
Q19.4. Broadband (from 50 Mbps to 100Mbps)
Q19.5. Broadband (above 100 Mbps)
Q19.6. No Internet connection (do not read)
Q19.7. Don’t know (do not read)
Q20. How does your hospital support wireless communications?
Only one answer possible
Q20.1. There is a single, unified wireless infrastructure capable of supporting most of
the applications
Q20.2. There are individual wireless networks for discrete applications
Q20.3. There is no wireless infrastructure
Q20.4. Don’t know (do not read)
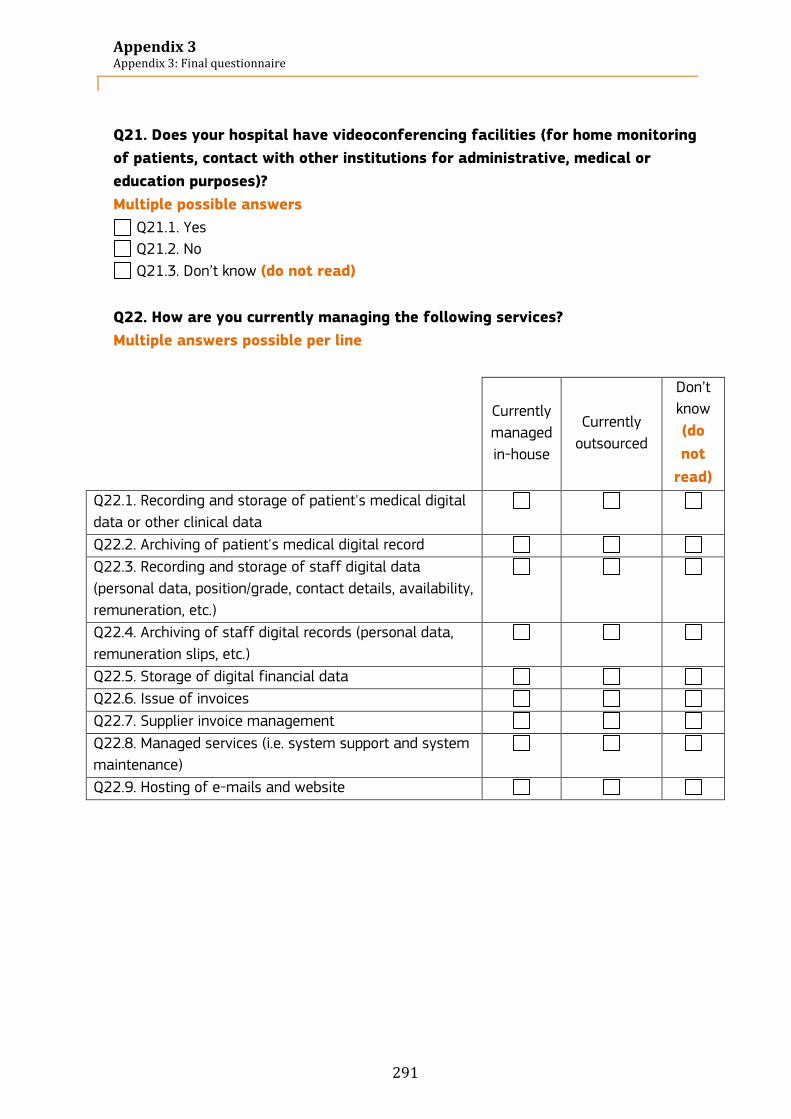
Appendix 3 Appendix 3: Final questionnaire
291
Q21. Does your hospital have videoconferencing facilities (for home monitoring
of patients, contact with other institutions for administrative, medical or
education purposes)?
Multiple possible answers
Q21.1. Yes
Q21.2. No
Q21.3. Don’t know (do not read)
Q22. How are you currently managing the following services?
Multiple answers possible per line
Currently
managed
in-house
Currently
outsourced
Don’t
know
(do
not
read)
Q22.1. Recording and storage of patient's medical digital
data or other clinical data
Q22.2. Archiving of patient's medical digital record
Q22.3. Recording and storage of staff digital data
(personal data, position/grade, contact details, availability,
remuneration, etc.)
Q22.4. Archiving of staff digital records (personal data,
remuneration slips, etc.)
Q22.5. Storage of digital financial data
Q22.6. Issue of invoices
Q22.7. Supplier invoice management
Q22.8. Managed services (i.e. system support and system
maintenance)
Q22.9. Hosting of e-mails and website
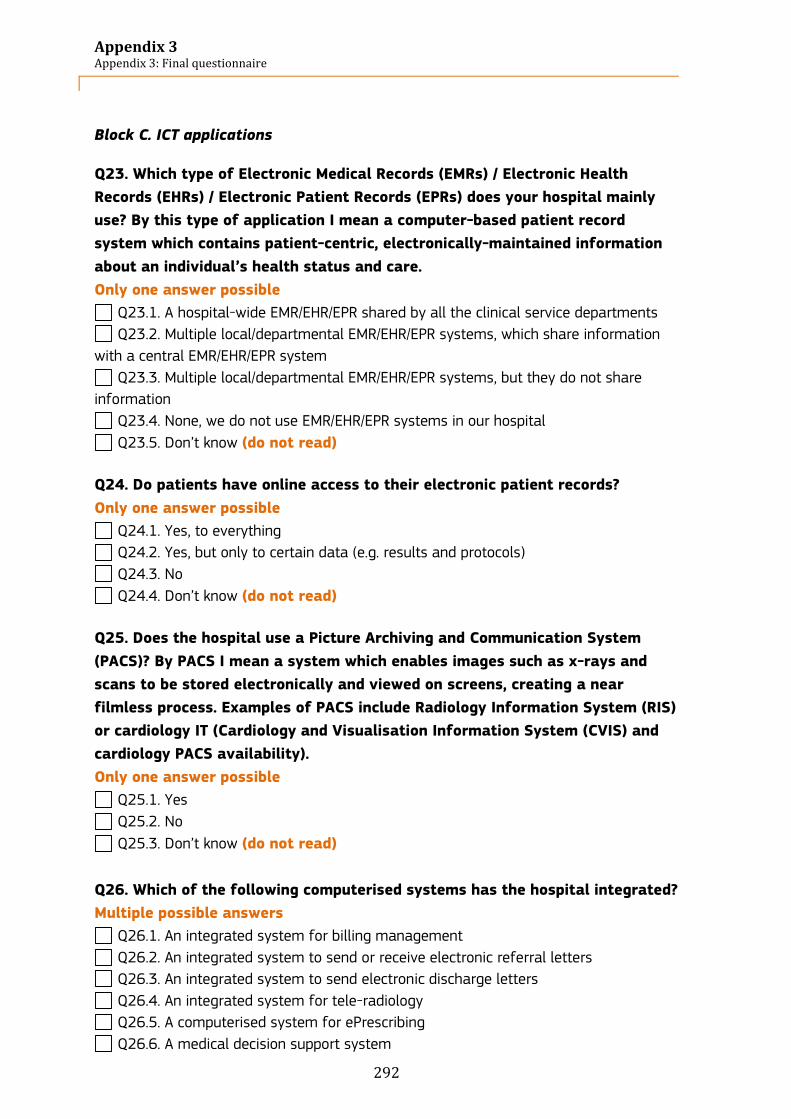
Appendix 3 Appendix 3: Final questionnaire
292
Block C. ICT applications
Q23. Which type of Electronic Medical Records (EMRs) / Electronic Health
Records (EHRs) / Electronic Patient Records (EPRs) does your hospital mainly
use? By this type of application I mean a computer-based patient record
system which contains patient-centric, electronically-maintained information
about an individual’s health status and care.
Only one answer possible
Q23.1. A hospital-wide EMR/EHR/EPR shared by all the clinical service departments
Q23.2. Multiple local/departmental EMR/EHR/EPR systems, which share information
with a central EMR/EHR/EPR system
Q23.3. Multiple local/departmental EMR/EHR/EPR systems, but they do not share
information
Q23.4. None, we do not use EMR/EHR/EPR systems in our hospital
Q23.5. Don’t know (do not read)
Q24. Do patients have online access to their electronic patient records?
Only one answer possible
Q24.1. Yes, to everything
Q24.2. Yes, but only to certain data (e.g. results and protocols)
Q24.3. No
Q24.4. Don’t know (do not read)
Q25. Does the hospital use a Picture Archiving and Communication System
(PACS)? By PACS I mean a system which enables images such as x-rays and
scans to be stored electronically and viewed on screens, creating a near
filmless process. Examples of PACS include Radiology Information System (RIS)
or cardiology IT (Cardiology and Visualisation Information System (CVIS) and
cardiology PACS availability).
Only one answer possible
Q25.1. Yes
Q25.2. No
Q25.3. Don’t know (do not read)
Q26. Which of the following computerised systems has the hospital integrated?
Multiple possible answers
Q26.1. An integrated system for billing management
Q26.2. An integrated system to send or receive electronic referral letters
Q26.3. An integrated system to send electronic discharge letters
Q26.4. An integrated system for tele-radiology
Q26.5. A computerised system for ePrescribing
Q26.6. A medical decision support system
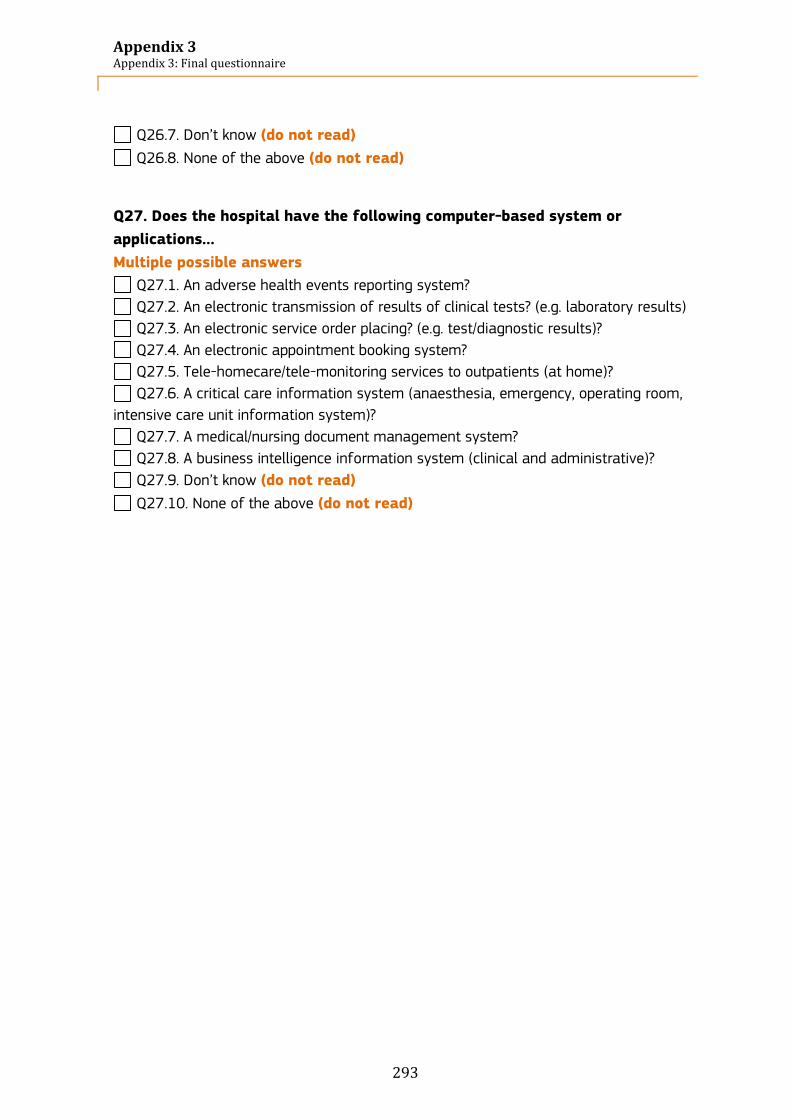
Appendix 3 Appendix 3: Final questionnaire
293
Q26.7. Don’t know (do not read)
Q26.8. None of the above (do not read)
Q27. Does the hospital have the following computer-based system or
applications…
Multiple possible answers
Q27.1. An adverse health events reporting system?
Q27.2. An electronic transmission of results of clinical tests? (e.g. laboratory results)
Q27.3. An electronic service order placing? (e.g. test/diagnostic results)?
Q27.4. An electronic appointment booking system?
Q27.5. Tele-homecare/tele-monitoring services to outpatients (at home)?
Q27.6. A critical care information system (anaesthesia, emergency, operating room,
intensive care unit information system)?
Q27.7. A medical/nursing document management system?
Q27.8. A business intelligence information system (clinical and administrative)?
Q27.9. Don’t know (do not read)
Q27.10. None of the above (do not read)
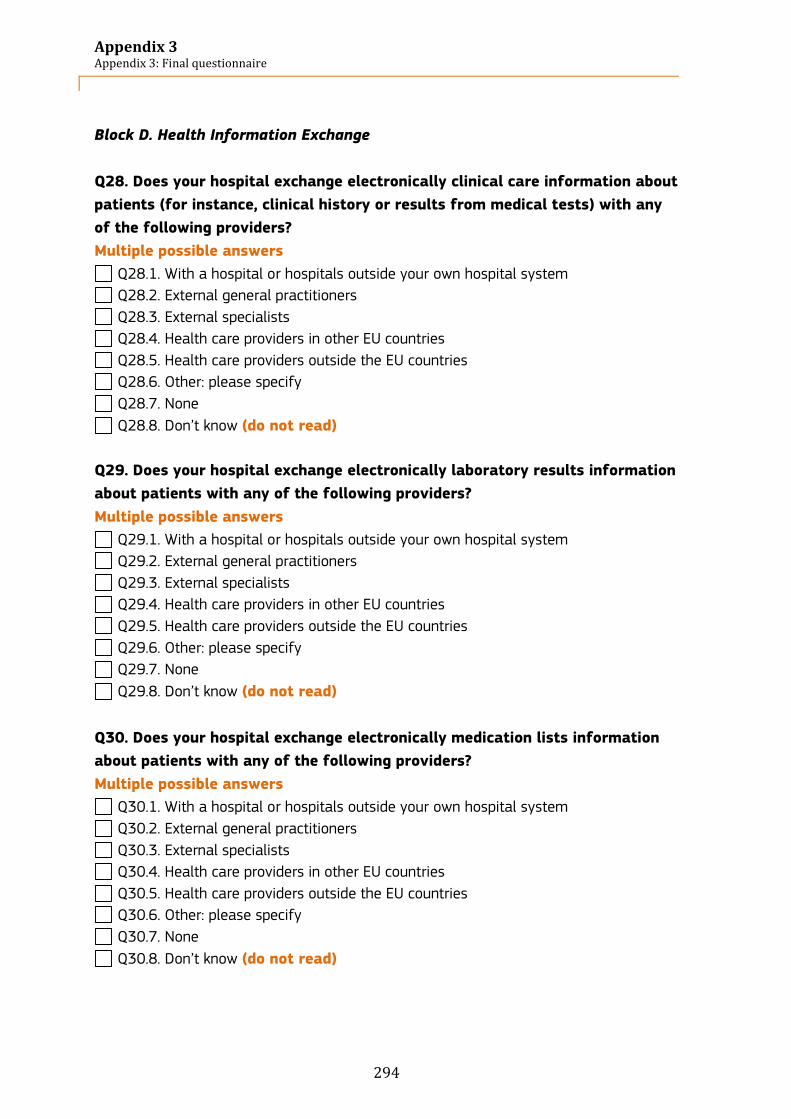
Appendix 3 Appendix 3: Final questionnaire
294
Block D. Health Information Exchange
Q28. Does your hospital exchange electronically clinical care information about
patients (for instance, clinical history or results from medical tests) with any
of the following providers?
Multiple possible answers
Q28.1. With a hospital or hospitals outside your own hospital system
Q28.2. External general practitioners
Q28.3. External specialists
Q28.4. Health care providers in other EU countries
Q28.5. Health care providers outside the EU countries
Q28.6. Other: please specify
Q28.7. None
Q28.8. Don’t know (do not read)
Q29. Does your hospital exchange electronically laboratory results information
about patients with any of the following providers?
Multiple possible answers
Q29.1. With a hospital or hospitals outside your own hospital system
Q29.2. External general practitioners
Q29.3. External specialists
Q29.4. Health care providers in other EU countries
Q29.5. Health care providers outside the EU countries
Q29.6. Other: please specify
Q29.7. None
Q29.8. Don’t know (do not read)
Q30. Does your hospital exchange electronically medication lists information
about patients with any of the following providers?
Multiple possible answers
Q30.1. With a hospital or hospitals outside your own hospital system
Q30.2. External general practitioners
Q30.3. External specialists
Q30.4. Health care providers in other EU countries
Q30.5. Health care providers outside the EU countries
Q30.6. Other: please specify
Q30.7. None
Q30.8. Don’t know (do not read)

Appendix 3 Appendix 3: Final questionnaire
295
Q31. Does your hospital exchange electronically radiology images and reports
about patients with any of the following providers?
Multiple possible answers
Q31.1. With a hospital or hospitals outside your own hospital system
Q31.2. External general practitioners
Q31.3. External specialists
Q31.4. Health care providers in other EU countries
Q31.5. Health care providers outside the EU countries
Q31.6. Other: please specify
Q31.7. None
Q31.8. Don’t know (do not read)
-> If Q23.1 or Q23.2, ask Q32.
Q32. You said that your hospital uses electronic patient records (EPRs) which
share information. Do you encounter interoperability problems between the
different departmental EPR systems? By interoperability problems, I mean that
the systems are not connected and fail to talk to each other.
Multiple possible answers
Q32.1. Yes, at the technical level.
Q32.2. Yes, at the semantic level.
Q32.3. Yes, at the organisational level.
Q32.4. Never
Q32.5. Don’t know (do not read)
-> If Q23.3, ask Q33
Q33. You said that your hospital uses electronic patient records (EPRs) which
does not share information. Considering your technical skills in relation to
hospital system interoperability, do you think you need additional training?
Only one answer possible
Q33.1. Yes
Q33.2. No
Q33.3. Don’t know (do not read)
Q34. Which standards does your system support or comply with?
Multiple possible answers
Q34.1. HL7
Q34.2. IHE integration profiles
Q34.3. CEN/ISO EN 13606
Q34.4. DICOM
Q34.5. OpenEHR
Q34.6. Don’t know (do not read)
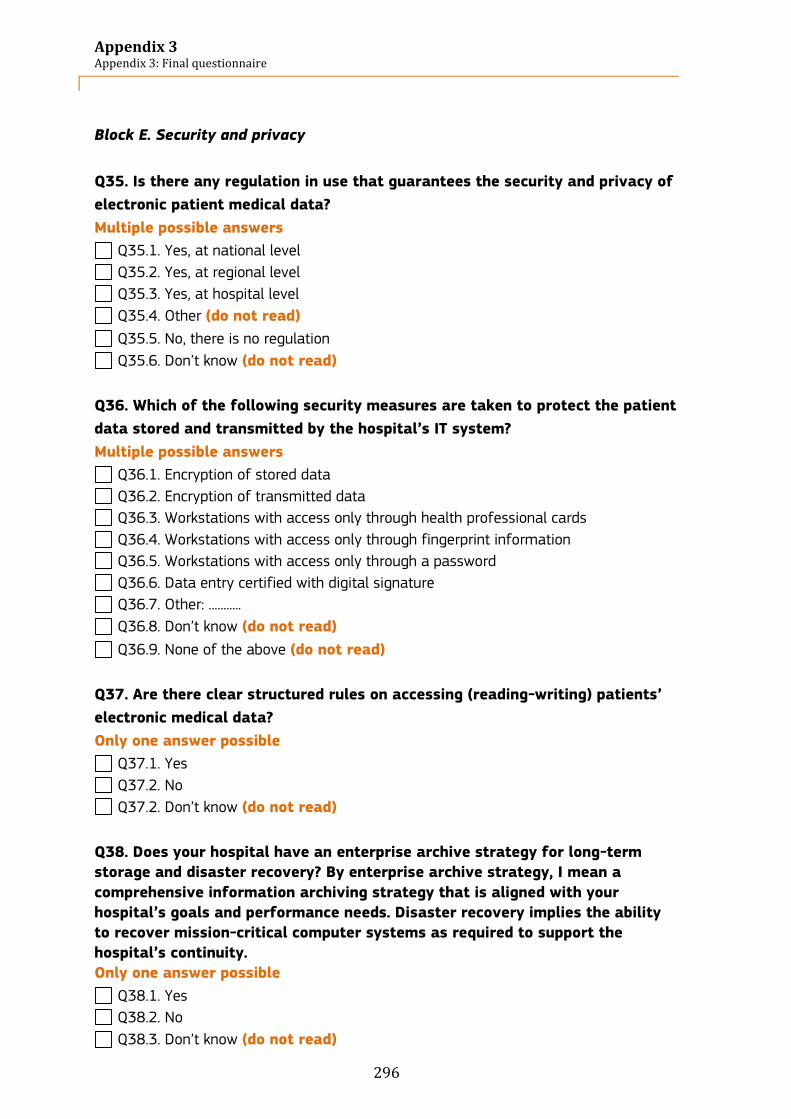
Appendix 3 Appendix 3: Final questionnaire
296
Block E. Security and privacy
Q35. Is there any regulation in use that guarantees the security and privacy of
electronic patient medical data?
Multiple possible answers
Q35.1. Yes, at national level
Q35.2. Yes, at regional level
Q35.3. Yes, at hospital level
Q35.4. Other (do not read)
Q35.5. No, there is no regulation
Q35.6. Don’t know (do not read)
Q36. Which of the following security measures are taken to protect the patient
data stored and transmitted by the hospital’s IT system?
Multiple possible answers
Q36.1. Encryption of stored data
Q36.2. Encryption of transmitted data
Q36.3. Workstations with access only through health professional cards
Q36.4. Workstations with access only through fingerprint information
Q36.5. Workstations with access only through a password
Q36.6. Data entry certified with digital signature
Q36.7. Other: ...........
Q36.8. Don’t know (do not read)
Q36.9. None of the above (do not read)
Q37. Are there clear structured rules on accessing (reading-writing) patients’
electronic medical data?
Only one answer possible
Q37.1. Yes
Q37.2. No
Q37.2. Don’t know (do not read)
Q38. Does your hospital have an enterprise archive strategy for long-term
storage and disaster recovery? By enterprise archive strategy, I mean a
comprehensive information archiving strategy that is aligned with your
hospital’s goals and performance needs. Disaster recovery implies the ability
to recover mission-critical computer systems as required to support the
hospital’s continuity.
Only one answer possible
Q38.1. Yes
Q38.2. No
Q38.3. Don’t know (do not read)

Appendix 3 Appendix 3: Final questionnaire
297
Q39. Please estimate how quickly your organisation can restore critical clinical
information system operations if a disaster causes the complete loss of data
at your hospital’s primary data centre. Interviewer: By restoration of clinical
information systems, we mean those applications that are considered “mission
critical”, level 1”.
Only one answer possible
Q39.1. Immediate (we have a fully redundant data centre)
Q39.2. Less than 24 hours
Q39.3. Less than 2 days
Q39.4. Less than 1 week
Q39.5. Less than 1 month
Q39.6. More than 1 month
Q39.7. Don’t know (do not read)
Block F. IT functionalities
Q40. “Electronic Medical Records” (EMRs) or “Electronic Health Records” (EHRs)
or “Electronic Patient Records” (EPRs) are terms which refer to systems that
are used by healthcare professionals (doctors and nurses) to enter, store, view,
and manage patient health and administrative information and data. Does
your hospital have this type of ICT-supported systems?
Only one answer possible
Q40.1. Yes
Q40.2. No
Q40.3. I don’t know (do not read)
-> if Q40.1, go to Q41. If Q40.2, go to Q43

Appendix 3 Appendix 3: Final questionnaire
298
Q41. Do your EHRs or any other ICT system allow health professionals to view
and/or to input the following types of information? Please indicate the extent
to which they are implemented (fully implemented means it has completely
replaced paper record for the function) in your hospital and the extent to
which health professionals use them.
If feature D, ask (E). If a feature is D or E skip the related "usage" question.
One answer per line.
Availability Usage (if A, B or C)
(A)
Fully
imp
lem
ente
d a
cro
ss
all un
its
(B)
Fully
imp
lem
ente
d in
at
leas
t 50%
of
un
its
(C)
Fully
imp
lem
ente
d in
les
s
than
50%
of
un
its
(D)
No
t in
pla
ce
(E)
Co
nsi
der
ing
imp
lem
enti
ng
Do
n’t
kn
ow
(do
no
t re
ad
)
YE
S, ro
uti
nel
y
YE
S, o
ccas
ion
ally
No
Do
n’t
kn
ow
(do
no
t re
ad
)
Q41.1. Medication list
Q41.2. Prescription list
Q41.3. Lab test results
Q41.4. Radiology test results (reports)
Q41.5. Radiology test results (images)
Q41.6. Problem list / diagnoses
Q41.7. Reason for encounter
Q41.8. Allergies
Q41.9. Encounter Notes, Clinical notes
Q41.10. Immunizations
Q41.11. Vital signs
Q41.12. Patient demographics
Q41.13. Symptoms (reported by patient)
Q41.14. Medical history
Q41.15. Ordered tests
Q41.16. disease management or care plans (e.g. diabetes)
Q41.17. Finance / billing information

Appendix 3 Appendix 3: Final questionnaire
299
Q42. Do your EHRs or any other ICT system have any of the clinical decision
support functionalities listed below (such as real-time alerts or prompts)?
Please indicate the extent to which these are implemented (fully implemented
means it has completely replaced paper record for the function) in your
hospital and the extent to which health professionals use them.
If feature D, ask (E). If a feature is D or E skip the related "usage" question.
One answer per line.
Availability Usage
(if A, B or C)
(A)
Fully
imp
lem
ente
d
acro
ss a
ll un
its
(B)
Fully
imp
lem
ente
d in
at
leas
t 50%
of
un
its
(C)
Fully
imp
lem
ente
d les
s
than
50%
of
un
its
(D)
No
t in
pla
ce
(E)
Co
nsi
der
ing
imp
lem
enti
ng
Do
n’t
kn
ow
(do
no
t re
ad
)
YE
S, ro
uti
nel
y
YE
S, o
ccas
ion
ally
No
Do
n’t
kn
ow
(do
no
t re
ad
)
Q42.1. Clinical
guidelines and best
practices (e.g. alerts,
prompts)
Q42.2. Drug-drug
interactions
Q42.3. Drug-allergy
alerts
Q42.4. Drug-lab
interactions
Q42.5.
Contraindications (e.g.
based on age, gender,
pregnancy status)
Q42.6. Alerts to a
critical laboratory value
Q43. Health Information Exchange (HIE) is electronically transferring / sharing
/ enabling access to patient health information and data. Do your EHRs or any
other ICT systems in place in your hospital allow health professionals to
engage into any of the following forms of HIE?
Please indicate the extent to which these are implemented (fully implemented
means it has completely replaced paper record for the function) in your
hospital and the extent to which health professionals use them.
If feature D, ask (E). If a feature is D or E skip the related "usage" question.
One answer per line.

Appendix 3 Appendix 3: Final questionnaire
300
Availability Usage
(if A, B or C)
(A)
Fully
imp
lem
ente
d a
cross
all un
its
(B)
Fully
imp
lem
ente
d in
at
leas
t 50%
of
un
its
(C)
Fully
imp
lem
ente
d in
les
s
than
50%
of
un
its
(D)
No
t in
pla
ce
(E)
Co
nsi
der
ing
imp
lem
enti
ng
Do
n’t
kn
ow
(do
no
t re
ad
)
YE
S, ro
uti
nel
y
YE
S, o
ccas
ion
ally
No
Do
n’t
kn
ow
(do
no
t re
ad
)
Q43.1. Interact with patients by email about health-related issues
Q43.2. Make appointments at other care providers on your patients’ behalf
Q43.3. Send/receive referral and discharge letters
Q43.4. Transfer prescriptions to pharmacists
Q43.5. Exchange medical patient data with other healthcare providers and professionals
Q43.6. Receive laboratory reports
Q43.7. Receive and send laboratory reports and share them with other healthcare professionals /providers
Q43.8. Exchange patient medication lists with other healthcare professionals / providers
Q43.9. Exchange radiology reports with other healthcare professionals / providers
Q43.10. Exchange medical patient data with any healthcare provider in other countries
Q43.11. Certify sick leaves
Q43.12.Certify disabilities
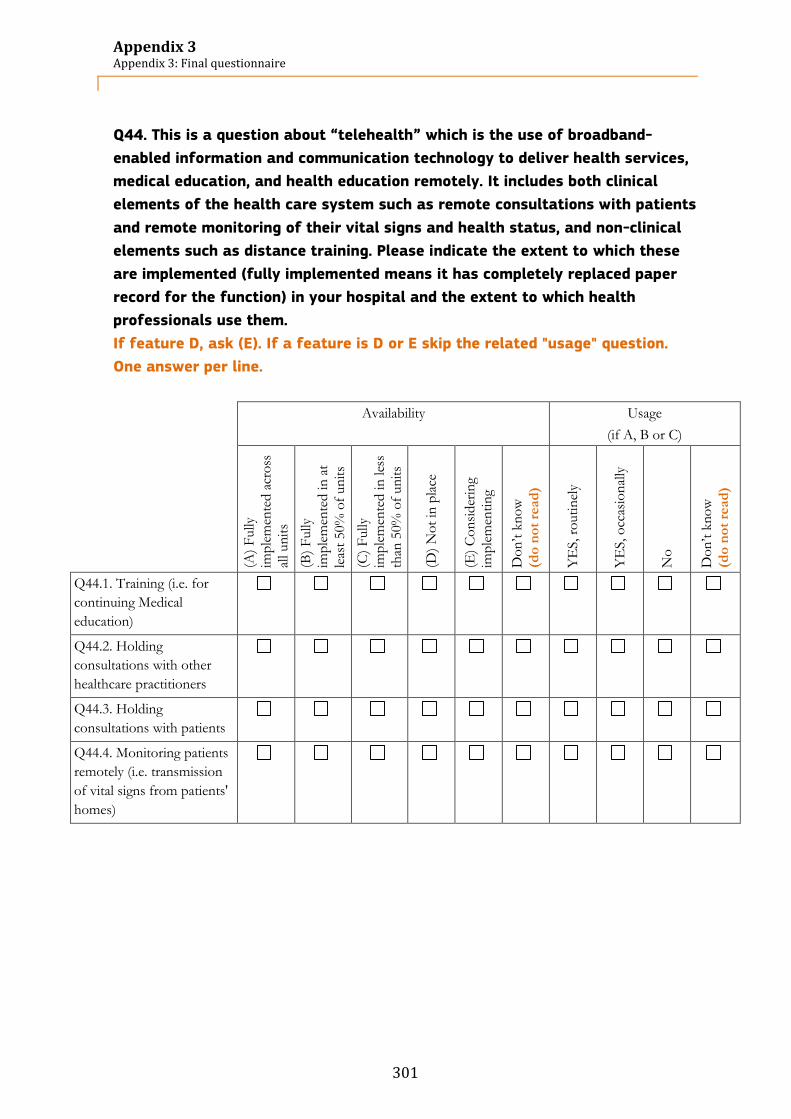
Appendix 3 Appendix 3: Final questionnaire
301
Q44. This is a question about “telehealth” which is the use of broadband-
enabled information and communication technology to deliver health services,
medical education, and health education remotely. It includes both clinical
elements of the health care system such as remote consultations with patients
and remote monitoring of their vital signs and health status, and non-clinical
elements such as distance training. Please indicate the extent to which these
are implemented (fully implemented means it has completely replaced paper
record for the function) in your hospital and the extent to which health
professionals use them.
If feature D, ask (E). If a feature is D or E skip the related "usage" question.
One answer per line.
Availability Usage
(if A, B or C)
(A)
Fully
imp
lem
ente
d a
cross
all un
its
(B)
Fully
imp
lem
ente
d in
at
leas
t 50%
of
un
its
(C)
Fully
imp
lem
ente
d in
les
s
than
50%
of
un
its
(D)
No
t in
pla
ce
(E)
Co
nsi
der
ing
imp
lem
enti
ng
Do
n’t
kn
ow
(do
no
t re
ad
)
YE
S, ro
uti
nel
y
YE
S, o
ccas
ion
ally
No
Do
n’t
kn
ow
(do
no
t re
ad
)
Q44.1. Training (i.e. for
continuing Medical
education)
Q44.2. Holding
consultations with other
healthcare practitioners
Q44.3. Holding
consultations with patients
Q44.4. Monitoring patients
remotely (i.e. transmission
of vital signs from patients'
homes)

Appendix 3 Appendix 3: Final questionnaire
302
Q45. The implementation of IT systems within the hospitals allows the
transition from paper-based systems to a fully electronically-based system.
Please select what is the position of your hospital in this transition
Only one answer possible
Q45.1
Totally paper
based
Q45.2 Q45.3 Q45.4 Q45.5
Hybrid
model
Q45.6 Q45.7 Q45.8 Q45.9
Totally
electronically
based
Block G. Hospital statistics
Q46. Number of hospital discharge during 2011 (or latest data available)
Q46.1. Number ______
Q46.2. Don’t know (do not read)
Q47. Average length of stay in this hospital during 2011 (or latest data
available)
Q47.1. Number ______
Q47.2. Don’t know (do not read)
Q48. Number of emergency visits during 2011 (or latest data available)
Q48.1. Number ______
Q48.2. Don’t know (do not read)
Q49. Number of outpatient consultations during 2011 (or latest data available)
Q49.1. Number ______
Q49.2. Don’t know (do not read)
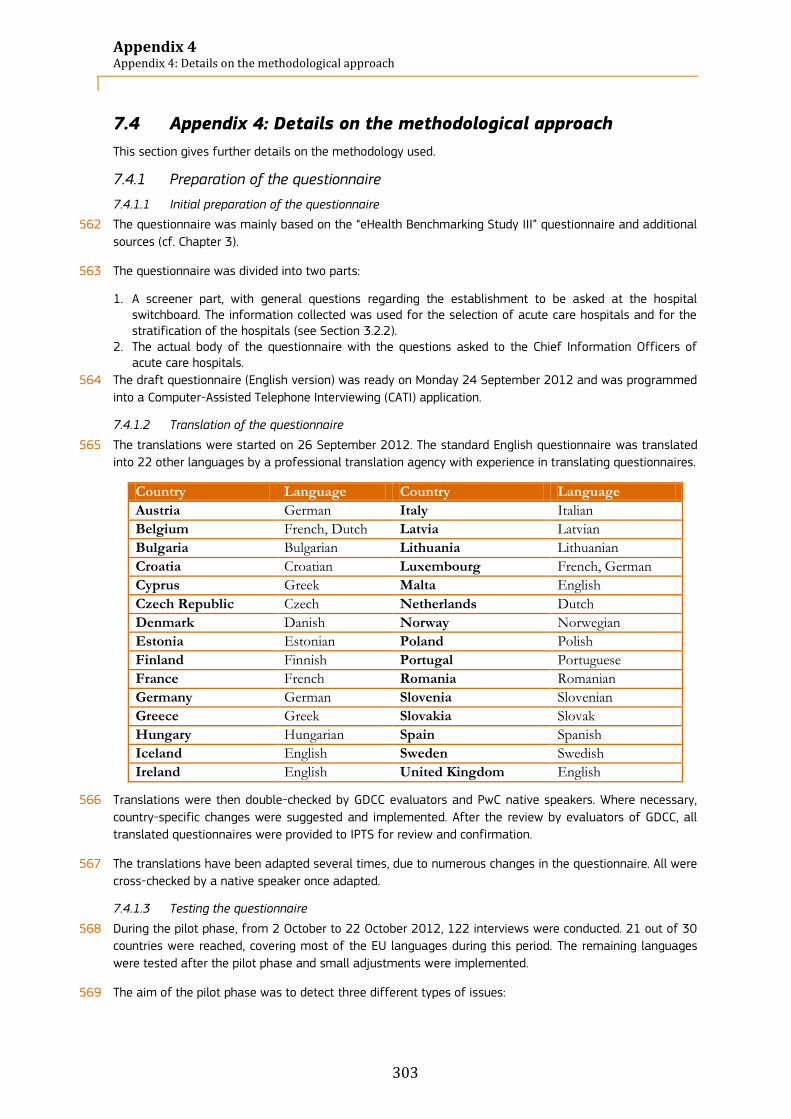
Appendix 4 Appendix 4: Details on the methodological approach
303
7.4 Appendix 4: Details on the methodological approach
This section gives further details on the methodology used.
7.4.1 Preparation of the questionnaire
7.4.1.1 Initial preparation of the questionnaire
562 The questionnaire was mainly based on the “eHealth Benchmarking Study III” questionnaire and additional
sources (cf. Chapter 3).
563 The questionnaire was divided into two parts:
1. A screener part, with general questions regarding the establishment to be asked at the hospital switchboard. The information collected was used for the selection of acute care hospitals and for the stratification of the hospitals (see Section 3.2.2).
2. The actual body of the questionnaire with the questions asked to the Chief Information Officers of acute care hospitals.
564 The draft questionnaire (English version) was ready on Monday 24 September 2012 and was programmed
into a Computer-Assisted Telephone Interviewing (CATI) application.
7.4.1.2 Translation of the questionnaire
565 The translations were started on 26 September 2012. The standard English questionnaire was translated
into 22 other languages by a professional translation agency with experience in translating questionnaires.
Country Language Country Language
Austria German Italy Italian
Belgium French, Dutch Latvia Latvian
Bulgaria Bulgarian Lithuania Lithuanian
Croatia Croatian Luxembourg French, German
Cyprus Greek Malta English
Czech Republic Czech Netherlands Dutch
Denmark Danish Norway Norwegian
Estonia Estonian Poland Polish
Finland Finnish Portugal Portuguese
France French Romania Romanian
Germany German Slovenia Slovenian
Greece Greek Slovakia Slovak
Hungary Hungarian Spain Spanish
Iceland English Sweden Swedish
Ireland English United Kingdom English
566 Translations were then double-checked by GDCC evaluators and PwC native speakers. Where necessary,
country-specific changes were suggested and implemented. After the review by evaluators of GDCC, all
translated questionnaires were provided to IPTS for review and confirmation.
567 The translations have been adapted several times, due to numerous changes in the questionnaire. All were
cross-checked by a native speaker once adapted.
7.4.1.3 Testing the questionnaire
568 During the pilot phase, from 2 October to 22 October 2012, 122 interviews were conducted. 21 out of 30
countries were reached, covering most of the EU languages during this period. The remaining languages
were tested after the pilot phase and small adjustments were implemented.
569 The aim of the pilot phase was to detect three different types of issues:

Appendix 4 Appendix 4: Details on the methodological approach
304
Wording of the questions and answers: identified misunderstandings or requests for details by the interviewee;
Inability to answer: respondents did not have the answer, searched in their files on their computer or called their colleagues. These issues affected the length of the interview;
Structuring of the questionnaire: improvements that could be brought to the questionnaire to ensure a better flow of questions during the interview.
570 All the identified issues were discussed with IPTS, and improvements were implemented. The final version
of the questionnaire was ready on 31 October 2012 and is presented in Appendix 3: Final questionnaire.
7.4.2 Sampling methodology
571 The methodology used to define the appropriate sample in each of the 30 countries surveyed follows a
four-step approach:
1. Estimation of the overall universe; 2. Implementation of a census strategy; 3. Definition of sample approach in each country; 4. Calculation of error margins and confidence intervals.
7.4.2.1 Estimation of the overall universe
572 To estimate the overall universe, a number of sources were consulted and analysed. The starting point
was the sources provided in the previous version of the eHealth survey from 2010. The sources for each
individual country were provided within the overall universe of 12,230 hospitals.
573 Therefore, the first step for the 2012 version of the study was to update the estimated universe by
initially validating the sources used in the previous study. This validation demonstrated that while many of
the sources were no longer available or accessible, others used commercial list brokers, which could not be
considered reliable for the definition of any universe.
574 In addition, two other major sources were consulted during the validation process:
The list of hospitals from WHO for the selected 30 countries;
National Ministry of Health of each country.
575 In our analysis, we found out that the lists provided by the National Ministries of Health were more
frequently updated than those of WHO. As a consequence, the former were most suitable to be used as a
reference to estimate the universe.
Figure 173 below illustrates the process followed to define the universe.
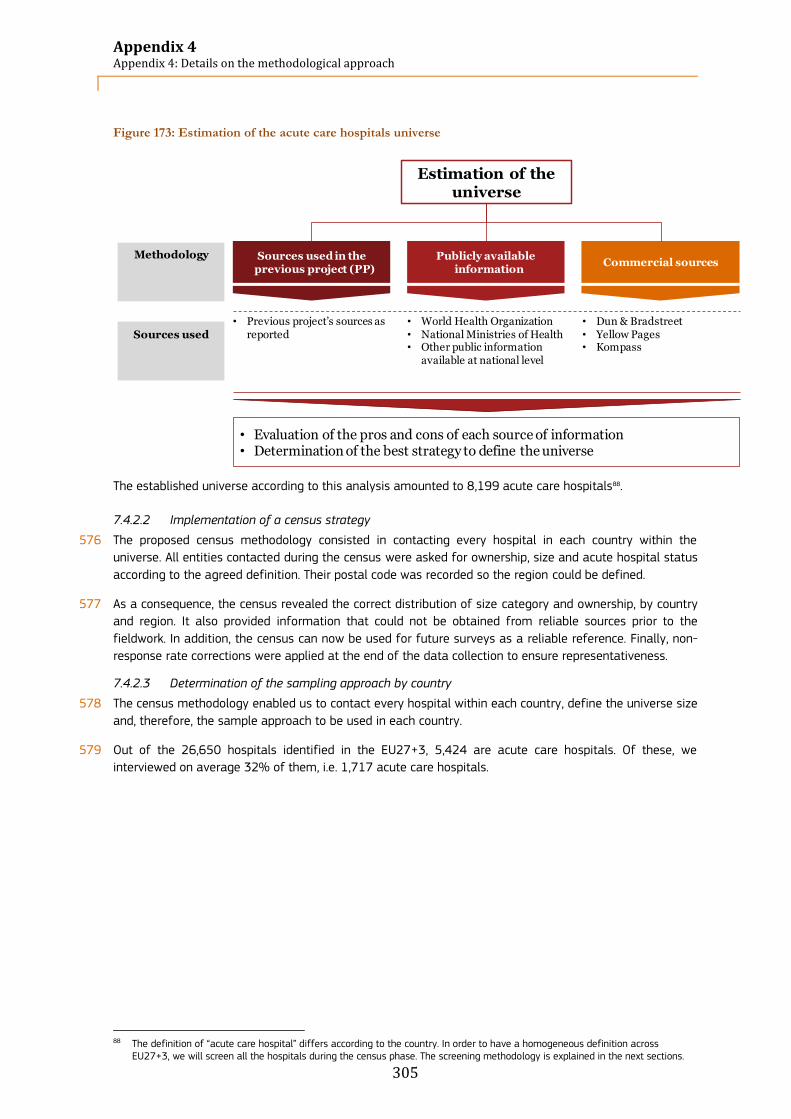
Appendix 4 Appendix 4: Details on the methodological approach
305
Figure 173: Estimation of the acute care hospitals universe
The established universe according to this analysis amounted to 8,199 acute care hospitals88.
7.4.2.2 Implementation of a census strategy
576 The proposed census methodology consisted in contacting every hospital in each country within the
universe. All entities contacted during the census were asked for ownership, size and acute hospital status
according to the agreed definition. Their postal code was recorded so the region could be defined.
577 As a consequence, the census revealed the correct distribution of size category and ownership, by country
and region. It also provided information that could not be obtained from reliable sources prior to the
fieldwork. In addition, the census can now be used for future surveys as a reliable reference. Finally, non-
response rate corrections were applied at the end of the data collection to ensure representativeness.
7.4.2.3 Determination of the sampling approach by country
578 The census methodology enabled us to contact every hospital within each country, define the universe size
and, therefore, the sample approach to be used in each country.
579 Out of the 26,650 hospitals identified in the EU27+3, 5,424 are acute care hospitals. Of these, we
interviewed on average 32% of them, i.e. 1,717 acute care hospitals.
88 The definition of “acute care hospital” differs according to the country. In order to have a homogeneous definition across
EU27+3, we will screen all the hospitals during the census phase. The screening methodology is explained in the next sections.
Methodology
• Previous project’s sources as reported
• World Health Organization• National Ministries of Health• Other public information
available at national level
• Dun & Bradstreet• Yellow Pages• Kompass
Sources used in the previous project (PP)
Publicly available information
Commercial sources
Estimation of the universe
Sources used
• Evaluation of the pros and cons of each source of information• Determination of the best strategy to define the universe
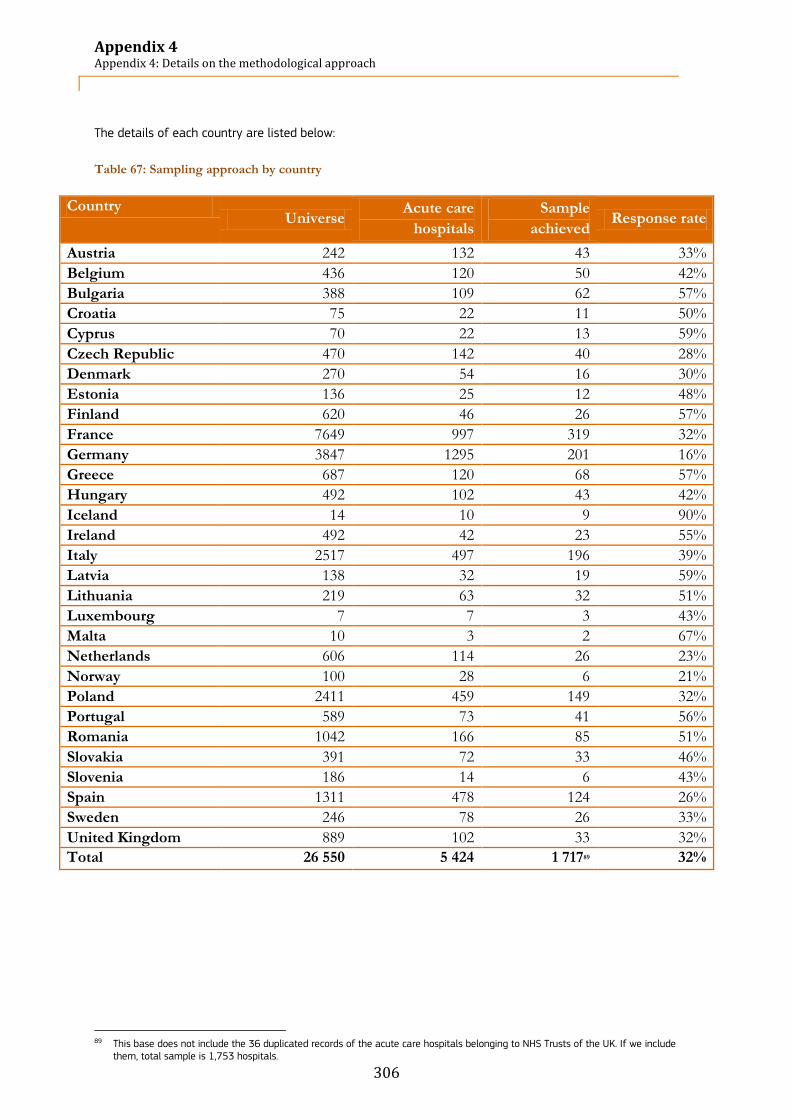
Appendix 4 Appendix 4: Details on the methodological approach
306
The details of each country are listed below:
Table 67: Sampling approach by country
Country Universe
Acute care
hospitals
Sample
achieved Response rate
Austria 242 132 43 33%
Belgium 436 120 50 42%
Bulgaria 388 109 62 57%
Croatia 75 22 11 50%
Cyprus 70 22 13 59%
Czech Republic 470 142 40 28%
Denmark 270 54 16 30%
Estonia 136 25 12 48%
Finland 620 46 26 57%
France 7649 997 319 32%
Germany 3847 1295 201 16%
Greece 687 120 68 57%
Hungary 492 102 43 42%
Iceland 14 10 9 90%
Ireland 492 42 23 55%
Italy 2517 497 196 39%
Latvia 138 32 19 59%
Lithuania 219 63 32 51%
Luxembourg 7 7 3 43%
Malta 10 3 2 67%
Netherlands 606 114 26 23%
Norway 100 28 6 21%
Poland 2411 459 149 32%
Portugal 589 73 41 56%
Romania 1042 166 85 51%
Slovakia 391 72 33 46%
Slovenia 186 14 6 43%
Spain 1311 478 124 26%
Sweden 246 78 26 33%
United Kingdom 889 102 33 32%
Total 26 550 5 424 1 71789 32%
89 This base does not include the 36 duplicated records of the acute care hospitals belonging to NHS Trusts of the UK. If we include
them, total sample is 1,753 hospitals.
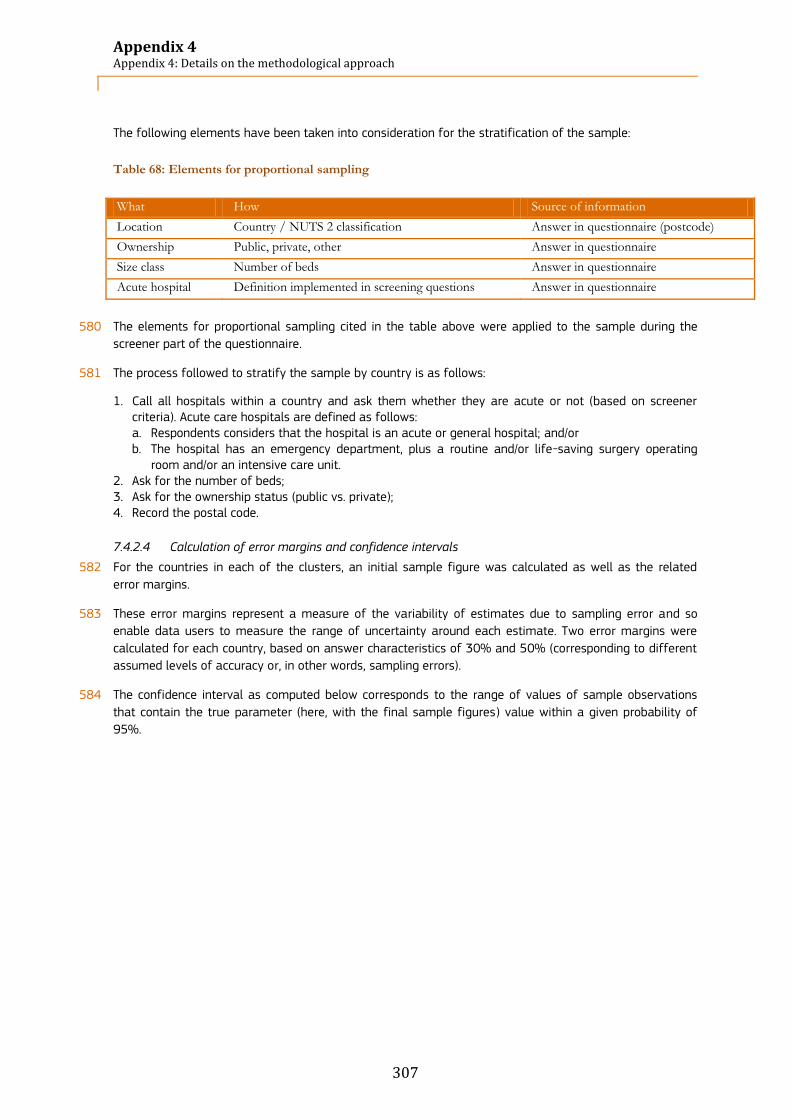
Appendix 4 Appendix 4: Details on the methodological approach
307
The following elements have been taken into consideration for the stratification of the sample:
Table 68: Elements for proportional sampling
What How Source of information
Location Country / NUTS 2 classification Answer in questionnaire (postcode)
Ownership Public, private, other Answer in questionnaire
Size class Number of beds Answer in questionnaire
Acute hospital Definition implemented in screening questions Answer in questionnaire
580 The elements for proportional sampling cited in the table above were applied to the sample during the
screener part of the questionnaire.
581 The process followed to stratify the sample by country is as follows:
1. Call all hospitals within a country and ask them whether they are acute or not (based on screener criteria). Acute care hospitals are defined as follows: a. Respondents considers that the hospital is an acute or general hospital; and/or b. The hospital has an emergency department, plus a routine and/or life-saving surgery operating
room and/or an intensive care unit. 2. Ask for the number of beds; 3. Ask for the ownership status (public vs. private); 4. Record the postal code.
7.4.2.4 Calculation of error margins and confidence intervals
582 For the countries in each of the clusters, an initial sample figure was calculated as well as the related
error margins.
583 These error margins represent a measure of the variability of estimates due to sampling error and so
enable data users to measure the range of uncertainty around each estimate. Two error margins were
calculated for each country, based on answer characteristics of 30% and 50% (corresponding to different
assumed levels of accuracy or, in other words, sampling errors).
584 The confidence interval as computed below corresponds to the range of values of sample observations
that contain the true parameter (here, with the final sample figures) value within a given probability of
95%.
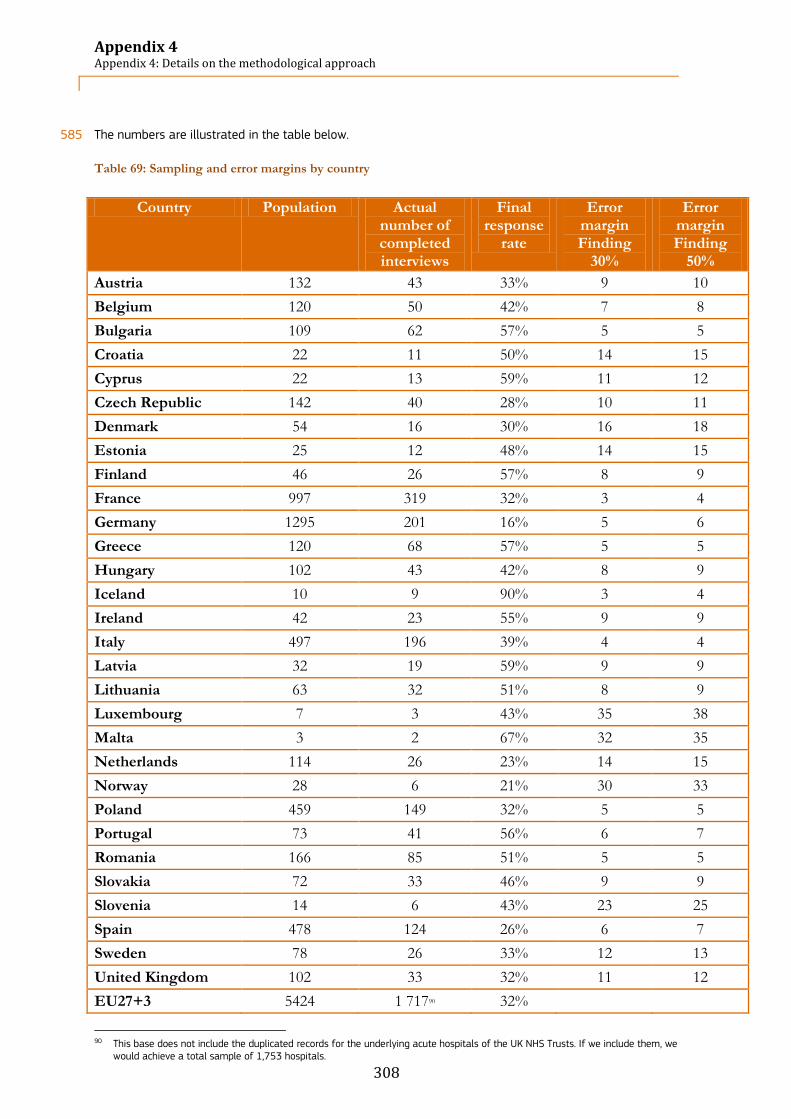
Appendix 4 Appendix 4: Details on the methodological approach
308
585 The numbers are illustrated in the table below.
Table 69: Sampling and error margins by country
Country Population Actual number of completed interviews
Final response
rate
Error margin Finding
30%
Error margin Finding
50%
Austria 132 43 33% 9 10
Belgium 120 50 42% 7 8
Bulgaria 109 62 57% 5 5
Croatia 22 11 50% 14 15
Cyprus 22 13 59% 11 12
Czech Republic 142 40 28% 10 11
Denmark 54 16 30% 16 18
Estonia 25 12 48% 14 15
Finland 46 26 57% 8 9
France 997 319 32% 3 4
Germany 1295 201 16% 5 6
Greece 120 68 57% 5 5
Hungary 102 43 42% 8 9
Iceland 10 9 90% 3 4
Ireland 42 23 55% 9 9
Italy 497 196 39% 4 4
Latvia 32 19 59% 9 9
Lithuania 63 32 51% 8 9
Luxembourg 7 3 43% 35 38
Malta 3 2 67% 32 35
Netherlands 114 26 23% 14 15
Norway 28 6 21% 30 33
Poland 459 149 32% 5 5
Portugal 73 41 56% 6 7
Romania 166 85 51% 5 5
Slovakia 72 33 46% 9 9
Slovenia 14 6 43% 23 25
Spain 478 124 26% 6 7
Sweden 78 26 33% 12 13
United Kingdom 102 33 32% 11 12
EU27+3 5424 1 71790 32%
90 This base does not include the duplicated records for the underlying acute hospitals of the UK NHS Trusts. If we include them, we
would achieve a total sample of 1,753 hospitals.
Appendix 4 Appendix 4: Details on the methodological approach
309
7.4.3 Data gathering
586 The objective of the data collection stage was to assure the highest degree of respondent cooperation in
participating and completing the survey.
587 For this purpose, we prepared, collected and processed the survey responses. High-quality responses were
also guaranteed and validated by the data cleansing process that we put in place.
588 We prepared, collected and processed the data from 2 October 2012 to early February 2013.
589 Contact with the respondents was done via telephone, directly through the acute hospital’s main
switchboard or using the direct extension of the target respondent when available. The objective was to
obtain a full response to the screener during the first call and obtain the name/number of the CIO to
determine the current universe of acute hospitals. The subsequent calls made aimed at obtaining a
response to the interview (which rarely happened during the first call).
590 The initial contact with respondents and all subsequent interviews were conducted in the various survey
languages by GDCC’s staff, which comprises native speakers in each of the interview languages.
591 By default, the screening of hospitals was carried out via CATI. The interviewer’s objective was to conduct
a CATI interview; however, in the cases where the interviewee requested to respond via an online
questionnaire, the option has been made available.
592 The data were collected via an online link after having been recorded (or input) directly by the interviewer
or the respondent (in case the respondent requested to complete an online survey).
593 A letter outlining the objectives of the study and a printable PDF version of the questionnaire has also
been made available for those respondents wishing to obtain more information prior to accepting to
participate in the study. A copy of this letter is available in Appendix 5: Awareness letters.
7.4.4 Data analysis
594 The data collected has been analysed using cross-tabulations generated by SPSS.
595 Each question has been analysed at:
European level: EU27+3;
Country level;
Size of hospital level (Fewer than 101 beds, Between 101 and 250 beds, Between 251 and 750 beds, More than 750 beds);
Type of hospital (i.e. ownership) level (Public, Private, Private not for profit).
596 When analysing the data at country level as well as by size and type of hospital, only valid answers have
been taken into consideration. This means that the “don’t know” option was not taken into consideration
and therefore, response rates were recalculated based on the total sample size minus the number of
respondents who said “don’t know” at that specific question.
597 Results were analysed at European and country level in chapter 4. The country reports (chapter 5) include
the analysis of the 13 indicators already defined in the 2010 study as well as the analysis of these
indicators by size and type of hospitals. Wherever possible, when the sample size was sufficient, an
analysis of these indicators at NUTS level has been conducted, including a test of statistical significance at
the 95% and 99% confidence interval.

Appendix 5 Appendix 5: Awareness letters
310
7.5 Appendix 5: Awareness letters
EUROPEAN COMMISSION DIRECTORATE GENERAL JRC JOINT RESEARCH CENTRE Institute for Prospective Technological Studies (Seville) Information Society Unit
Seville, 1
st October 2012
Ref: Study on “European Hospital Survey: Benchmarking deployment of eHealth
Services (2012-13)”
Dear Sir or Madam, The Institute for Prospective Technological Studies (IPTS), based in Seville (Spain), is one of seven European Commission research institutes, forming the Directorate General Joint Research Centre (JRC). Its mission is to provide techno-economic analysis in support of the EU policy-making process. The prime objectives of IPTS are to monitor and analyse science and technology developments, their inter-relationship with the socio-economic contexts and their implication for future policy development. The IPTS has commissioned to PwC and GDCC a survey to Benchmark the deployment of eHealth Services by acute hospitals across Europe. This study is part of a series evaluating progress in relation to the adoption and use of ICT in the healthcare sector and elaborating a composite indicator. It is expected that the survey results will benefit policy making at both national and European level as well as enable individual hospitals to monitor their performance against the overall context. PwC and GDCC will be contacting you in order to receive your valuable input. Therefore, we would be most grateful if you could contribute to our survey, in the form of a telephone interview. Alternatively, a web link can be provided, for online response to the questionnaire. The final period for collecting survey responses is the beginning of December 2012; hence it would be greatly appreciated if you complete the online questionnaire or supply a telephone interview before this date. Please notice that the results of the study, including the composite indicator, will be shared with participants. We thank you in advance for your time and collaboration. Yours faithfully,
Ioannis Maghiros Project Leader
Institute for Prospective Technological Studies DG JRC - European Commission

Appendix 5 Appendix 5: Awareness letters
311
Sehr geehrte Damen und Herren, Das Institut für technologische Zukunftsforschung (engl. Institute for Prospective Technological Studies, IPTS) mit Sitz in Sevilla (Spanien) ist eins der sieben Forschungsinstitute der Europäischen Kommission, die dem Direktorat Joint Research Center (JRC) unterstellt sind. Die Mission von IPTS ist es technologisch-ökonomische Analysen zur Verfügung zu stellen, die die EU-Politikgestaltung unterstützen. Die Hauptziele des IPTS beinhalten somit das Analysieren und Überprüfen von wissenschaftlichen und technologischen Entwicklungen, ihre Beziehung zu den sozio-ökonomischen Zusammenhängen und ihre Auswirkung auf die zukünftige Politikgestaltung/-entwicklung. Eines der abgedeckten Forschungsgebiete des IPTS ist das "Monitoring von eHealth" in Europa. Das IPTS hat daher eine Studie in Auftrag gegeben um ein Benchmarking über den Einsatz von elektronischen Gesundheitsdiensten (eHealth Services) in Akutkrankenhäusern in Europa durchzuführen. Diese Studie ist ein Teil einer Serie von Studien, die das Ziel verfolgen den Verbreitungsgrad bezüglich der Einführung und der Benutzung von Informations- und Kommunikationstechnologie im Gesundheitswesen zu evaluieren. Diese Studienserie berücksichtigt die jüngsten Entwicklungen und den Einsatz von Diensten die in dem sogenannten EU-eHealth-Aktionsplan enthalten sind. Ihre Meinung ist uns wichtig! Wir haben daher die Unternehmen PwC und GDDC beauftragt Sie zu
kontaktieren um Ihren wertvollen Beitrag zu dieser Studie zu erhalten. Daher wären wir Ihnen sehr dankbar wenn Sie uns etwas Zeit schenken können um an unserer Studie in Form eines telefonischen Interviews teilzunehmen. Alternativ können wir Ihnen einen Internet-Link zur Verfügung stellen um den Fragebogen online zu beantworten. Die Datenerhebung für diese Studie läuft bis Ende Januar 2013; daher wären wir Ihnen sehr verbunden, wenn wir Sie vor diesem Zeitpunkt entweder telefonisch befragen oder Ihren online ausgefüllten Fragebogen erhalten könnten. Wir versichern Ihnen dass Ihre Daten strikt vertraulich behandelt werden und nur in aggregierter Form ausgewertet werden. Im Gegenzug für Ihren geschätzten Beitrag werden wir Ihnen Zugriff auf die Studienergebnisse gewähren. Wir erwarten, dass diese Studienresultate für die Politikgestaltung sowohl auf nationaler als auch auf europäischer Ebene von Nutzen sein werden. Die einzelnen Krankenhäuser werden ebenfalls davon profitieren, indem sie ihre eigene Leistungsfähigkeit mit der Leistungsfähigkeit anderer Krankenhäuser vergleichen können.
Wir danken Ihnen im Voraus für Ihre Zeit und Ihre Mitarbeit. Mit freundlichen Grüßen
Ioannis Maghiros Project Leader
Institute for Prospective Technological Studies DG JRC - European Commission

Appendix 5 Appendix 5: Awareness letters
312
Egregia Signora, Egregio Signore, L’Istituto per gli Studi prospettici tecnologici (Institute for Prospective Technological Studies, IPTS), con sede a Siviglia (Spagna) è uno dei sette istituti di ricerca della Commissione Europea che formano la Direzione Generale del Centro Comune di Ricerca (Joint Research Center, JRC). La sua missione è di fornire analisi tecnico-economiche a supporto dei processi decisionali relativi alle politiche dell’UE. Gli obiettivi primari dell’IPTS sono di osservare ed esaminare gli sviluppi della scienza e della tecnologia, la loro correlazione con gli eventi socio-economici e le loro implicazioni per le politiche future. L’IPTS ha intrapreso uno studio per misurare lo sviluppo dei servizi sanitari elettronici (eHealth Services) negli ospedali europei. Questo studio fa parte di una serie di indagini volte a misurare l’evoluzione nell’uso dell’ICT (Tecnologie dell'informazione e della comunicazione) nel settore sanitario. Lo studio prende in considerazione i più recenti sviluppi nonché le implementazioni dei servizi previsti dall’e-Health Action Plan e permetterà agli stati membri e ai singoli ospedali di valutare la propria situazione rispetto allo stato globale dell’UE. Lo studio è stato commissionato a PwC e alla GDCC, due società di consulenza le quali La contatteranno per avere la Sua preziosa opinione. Per questo Le saremmo grati se potesse dedicare un po’ del Suo tempo a questo studio che sarà effettuato sotto forma di intervista telefonica. In alternativa, Le sarà fornito un web-link per rispondere ad un questionario online. Il termine ultimo per raccogliere le risposte al questionario è il 31 gennaio 2013; per questo Le saremmo grati se potessimo intervistarLa telefonicamente o ricevere il Suo questionario online prima della fine del mese. Si prega di notare che i dati comunicati saranno trattati in forma strettamente confidenziale e che saranno utilizzati a fini statistici e in forma aggregata. Come espressione della nostra gratitudine ai partecipanti per la loro collaborazione, i risultati dello studio saranno distribuiti ai partecipanti. Ringraziandola anticipatamente per la Sua collaborazione, Le porgiamo i nostri più distinti saluti,
Ioannis Maghiros Project Leader
Institute for Prospective Technological Studies DG JRC - European Commission

Appendix 6 Appendix 6: Acknowledgements
313
7.6 Appendix 6: Acknowledgements
598 This study has been conducted by PwC Luxembourg in cooperation with GDCC for the European
Commission’s Directorate General Joint Research Centre and its Institute of Prospective Technological
Studies in Sevilla, Spain (DG JRC – IPTS).
599 The production of this report would not have been possible without the continuous efforts and valuable
input of the people involved in the project. The authors would like to express their deep gratitude to all
who have contributed to the production of this report. We would like to thank the following people involved
in the study for their valuable contribution, their support and critical advice:
600 European Commission - DG JRC – IPTS:
Ioannis Maghiros, Head of Unit J03;
Ramon Sabes-Figuera, Research fellow;
Manuela Deidda, Research fellow.
601 The PwC project team:
PwC Project supervision and management:
Guy Brandenbourger, Partner;
Christine von Reichenbach, Manager.
Quality Review panel:
Dariush Yazdani, Partner, Research unit leader;
Philippe Pierre, Partner, EU Institutions leader.
PwC study team:
Christine von Reichenbach, Manager;
Giulia Spalletti, Senior Market Analyst;
Stéphane Soulard, Senior Advisor;
Daniela Cedola, Senior Advisor;
Eleonora Zoboli, Market Analyst;
Dermot Doyle, Editor;
Pierre-Antoine Khoury-Helou, Analyst.
GDCC field work project team:
Kees-Jan Mars;
Sanne Krom;
Melanie van Schijndel;
Priscilla van der Plaats;
Marlon Mendonca Dias;
Egle Aleknaviciute;
Ruud Gabrielse

Appendix 7 Appendix 7: Literature
314
7.7 Appendix 7: Literature
7.7.1 Publications
602 AHA (2011), ‘AHA Survey on Hospitals’ Ability to Meet Meaningful Use Requirements of theMedicare and
Medicaid Electronic Health Records Incentive Programs’, American Health Association
603 Calliope Network (2010), ‘European eHealth Interoperability Roadmap, Final European Progress Report’,
European Commission
604 Codagnone, C. and F. Lupiañez-Villanueva (2011), ‘A composite index for the benchmarking of eHealth
Deployment in European acute Hospitals: distilling reality in manageable form for evidence based policy’ ,
Institute for Prospective Technological Studies (IPTS) - European Commission's Joint Research Centre (JRC)
605 Deloitte & Ipsos (2011), ‘eHealth Benchmarking III, SMART 2009/0022, Final Report’, Deloitte & Ipsos, April
2011, Belgium
606 EHR-Impact (2010), ‘Interoperable eHealth is Worth it – Securing benefits from Electronic Health Records
and ePrescribing’, European Commission publication
607 Empirica (2008), ‘Benchmarking ICT use among General Practitioners in Europe’, European Commission
publication
608 European Commission (2006), ‘Connected Health: Quality and Safety for European Citizens’, Report of the
Unit ICT for Health in collaboration with the i2010 sub-group on eHealth, European Commission
609 European Commission (2006), ‘ICT and e-Business in Hospital Activities: ICT adoption and e-business
activity in 2006’, Sector Report No. 10/2006, European Commission
610 European Commission (2009), ‘Commission Recommendation of 2 July 2008 on cross-border
interoperability of electronic health record systems: Creating a European coordination network for eHealth
interoperability implementation’
611 European Commission (2010), ‘Socio-economic impact of interoperable electronic health record and
ePrescription systems in Europe’, European Commission
612 European Commission, ‘Directive 2011/24/EU of the European Parliament and of the Council of 9 March
2011 on the application of patients’ rights in cross-border healthcare’, European Commission
613 European Commission, COM (2001) 140, ‘Commission Communication of 13 March 2001 on eEurope
2002: Impact and Priorities A communication to the Spring European Council in Stockholm, 23-24 March
2001’, European Commission
614 European Commission, COM (2002) 263, ‘The eEurope 2005 Action Plan: an information society for
everyone’, European Commission
615 European Commission, COM (2004) 356, ‘eHealth - making healthcare better for European citizens: An
action plan for a European eHealth Area’, European Commission
616 European Commission, COM (2007)630, ‘Together for Health: A Strategic Approach for the EU 2008-2013’,
European Commission
617 European Commission, COM (2007)860, ‘A lead market initiative for Europe’, European Commission
618 European Commission, COM (2008) 3282, ‘Commission Recommendation of 2 July 2008 on cross-border
interoperability of electronic health record systems’, European Commission
619 European Commission, COM (2010) 245, ‘A Digital Agenda for Europe’, European Commission

Appendix 7 Appendix 7: Literature
315
620 European Commission, COM (2010), ‘Europe 2020: A strategy for smart, sustainable and inclusive growth’,
European Commission
621 European Commission, COM (2012) 736, ‘eHealth Action Plan 2012-2020 - Innovative healthcare for the
21st century’, European Commission
622 European Parliament (1995), ‘Directive 95/46/EC of the European Parliament and of the Council of 24
October 1995 on the protection of individuals with regard to the processing of personal data and on the
free movement of such data’, European Commission
623 European Parliament (1995), ‘Directive 95/46/EC of the European Parliament and the Council of 24
October 1995 on the protection of individuals with regard to the processing of personal data and on the
free movement of such data’, European Parliament
624 European Parliament (2010), ‘European Parliament resolution of 21 October 2010 on the future of
European standardisation (2010/2051(INI))’, European Parliament
625 Gartner (2009), ‘eHealth for a Healthier Europe!’, Swedish Presidency of the European Union
626 HiMSS (2012), ‘A HIMSS G7 Advisory Report. Advancing Global Health IT: A Consultation with the World
Bank at HIMSS12’, HiMSS
627 Hospital Information Network Europe (HINE) (2004),’European Hospital Market Metrics -2004’, HINE
628 ITU-T (2012), ‘E-health Standards and Interoperability’, ITU-T Technology Watch Report
629 OECD (2013), ‘Improving Health Sector Efficiency: The role of Information and Communication
Technologies’, OECD Health Policy Studies
630 PwC (2010), ‘Luxembourg Ministry of Health eHealth Service Platform Study, Final Report’,
PricewaterhouseCoopers
631 PwC (2012), ‘Recommendation report: A best practice based approach to National Contact Point Website:
Feasibility Study’, PricewaterhouseCoopers
632 Stroetmann, K.A., Jones,T. et al, ‘eHealth is Worth it. The economic benefits of implemented eHealth
solutions at ten European sites’, European commission
633 WHO (1998), ‘Resolution EB101.R3 on Cross-border Advertising, Promotion and Sale of Medical Products
through the Internet’,
634 WHO (1998), ‘WHO Resolution WHA58.28 on eHealth’, the World Health Organization
635 WHO (2008), ‘World Health Report 2008’, the World Health Organization
636 WHO (2010), ‘Atlas, eHealth country profiles- based on the findings of the second global survey on
eHealth’, Global Observatory for eHealth Series Volume 1, the World Health Organization
637 WHO (2010), ‘World Health Report 2010’ the World Health Organization
7.7.2 Other online resources
638 Preamble to the Constitution of the World Health Organization:
http://www.who.int/topics/primary_health_care/en
639 Global Observatory for e-Health:
http://www.who.int/kms/initiatives/ehealth/en/
640 European Commission, DG Enterprise and Industry, ICT Standardization Work Programme:
http://ec.europa.eu/enterprise/sectors/ict/standards/work-programme/

Appendix 7 Appendix 7: Literature
316
641 OECD website:
http://www.oecd.org/health/healthsystems/benchmarkingofinformationandcommunicationtechnologiesictsi
nhealthsystems.htm
642 WHO website:
http://www.who.int/topics/primary_health_care/en

European Commission
EUR 26359 – Joint Research Centre – Institute for Prospective Technological Studies
Title: European Hospital Survey: Benchmarking Deployment of eHealth Services (2012-2013). Final Report
Luxembourg: Publications Office of the European Union
2014- 316 pp. – 21.0 x 29.7 cm
EUR – Scientific and Technical Research series – ISSN 1831-9424 (online)
ISBN 978-92-79-34781-8 (pdf)
doi:10.2791/56790
Abstract
The objective of this survey, conducted by PwC Luxembourg in cooperation with GDCC, was to benchmark the level of eHealth use in acute hospitals
in all 27 EU Member States and Croatia, Iceland and Norway. The total geographical scope is hereafter referred to as EU27+3. This study builds
upon previous studies in the area, most recently the eHealth Benchmarking III study of 20111, hereafter referred to as “the previous study”.
The survey targeted the Chief Information Officers (CIOs) of the acute hospitals. We used Computer-Aided Telephone Interviewing (CATI) with
native-speaking interviewers. In total, we called 26,550 healthcare establishments within EU27+3. Of the 26,550 establishments, 5,424 qualified
as acute care hospitals and of this number, 1,753 hospitals completed the interview.
We analysed the results by hospital size (i.e. number of beds, categorised) and by ownership type (public, private not for profit, private). At a
national level, we analysed a number of eHealth take-up indicators and for certain countries, performed an analysis at regional level based on the
NUTS2 classification.

z
As the Commission’s in-house science service, the Joint Research Centre’s mission is to provide EU policies with independent, evidence-based scientific and technical support throughout the whole policy cycle. Working in close cooperation with policy Directorates-General, the JRC addresses key societal challenges while stimulating innovation through developing new standards, methods and tools, and sharing and transferring its know-how to the Member States and international community. Key policy areas include: environment and climate change; energy and transport; agriculture and food security; health and consumer protection; information society and digital agenda; safety and security including nuclear; all supported through a cross-cutting and multi-disciplinary approach.
LF-NA
-26
359
-EN-N
doi:10.2791/56790 978-92-79-34781-8 (pdf)