Embed Size (px)
Citation preview
HAL Id: hal-00959394https://hal-pse.archives-ouvertes.fr/hal-00959394
Preprint submitted on 14 Mar 2014
HAL is a multi-disciplinary open accessarchive for the deposit and dissemination of sci-entific research documents, whether they are pub-lished or not. The documents may come fromteaching and research institutions in France orabroad, or from public or private research centers.
L’archive ouverte pluridisciplinaire HAL, estdestinée au dépôt et à la diffusion de documentsscientifiques de niveau recherche, publiés ou non,émanant des établissements d’enseignement et derecherche français ou étrangers, des laboratoirespublics ou privés.
European High-End Products in InternationalCompetition
Lionel Fontagné, Sophie Hatte
To cite this version:Lionel Fontagné, Sophie Hatte. European High-End Products in International Competition. 2013.�hal-00959394�
European High-End Products in International Competition
Lionel FONTAGNE
Paris School of Economics Univ. Paris 1 Panthéon Sorbonne
Sophie HATTE
Univ. Rouen Univ. Paris 1 Panthéon Sorbonne
November 2013
G-MonD Working Paper n°37
For sustainable and inclusive world development
European High-End Products in InternationalCompetition ∗
Lionel Fontagné† Sophie Hatte‡
This Version: November 12th, 2013
Abstract
We study international competition in high-end products for 416 detailed HS6 productcategories marketed by leading French luxury brands. We construct a world database oftrade flows for these products in the period 1994-2009, computing unit values of relatedbilateral trade flows and analyzing competition among the main exporters. We use the ob-served distribution of unit values to define a high-end market segment. In 2009, Europe’smarket share (EU27 plus Switzerland) despite suffering some erosion since 1994, repre-sented three-quarters of the world market. Exports of high-end products are shown to beless sensitive to distance than other products, and found more sensitive to destination coun-try wealth than other products, but only in relation to countries already producing a largerange of luxury brands.
Keywords: product differentiation, market shares, unit valuesJEL Codes: F12, F15
∗This paper has benefited from financial support from the “Mondialisation et Developpement” (GMonD) groupof the Paris School of Economics (PSE). The views expressed in this paper are those of the authors and not beGMonD or its financial partners.†Paris School of Economics (University Paris 1) and CEPII. Corresponding author: Centre d’Economie de la
Sorbonne, 106 boulevard de l’Hôpital 75013 Paris. Email: [email protected]‡University of Rouen and Paris School of Economics. Email : [email protected]
1
1 Introduction
The upgrading of emerging countries’ capabilities combined with rapid GDP and export growth
have led to a profound redistribution of world market shares of manufactured goods since the
mid 1900s. China stands out: its market share increased to 18.5% in 2010, three times its
share in 1995 (6.3%).1. Until the crisis, European commercial performance was proving more
resilient (resp. 17.7% in 2010 and 20.7% 1995 – but 18.9% in 2007) than US or Japanese per-
formance. Using an econometric shift-share methodology, Cheptea et al. (2014) shows buoy-
ancy of EU market shares in the higher market price ranges, although to a lesser extent for
high-technology products, with European producers benefitting from cumulative preferences
for certain products, incremental innovation, and market power. On the demand side, a large
share of high-priced goods in EU consumption and exports is in line with demand-side expla-
nations for how product quality drives trade patterns (Hallak, 2006; Schott, 2004; Fontagne
et al., 2008). The related production function is generally skill or R&D intensive, which leaves
space for a supply-side explanation of this statistical regularity (Goldberg and Pavcnik, 2007;
Verhoogen, 2008; Fontagne et al., 2008). In addition, recent European integration has led to
large differences within the Single European Market in labor costs, skills, and ultimately, com-
parative advantages. EU based firms have been able to exploit advantages in high-priced goods
combined with more affordable labor costs in newly acceded countries. The fragmentation of
production processes along the value chain has favored this; a well-known German top-end
SUV is generally considered the flagship example of this beneficial combination of competitive
elements (Sinn, 2006) in an economy with high labor costs.
At the forefront of this market positioning of European industry, there is a very specific tier
of the upper price range in the market that is worth analyzing. Many traditional, high-end hand-
icrafts industries have managed to sustain European brands and know-how in sectors nearly
decimated by competition from low labor cost economies. On the supply side, these activities
are design, advertising, and cumulative innovation intensive, and respond to a cultural dimen-
sion of consumption. On the demand side, these products are generally luxury goods which are
sold to a tiny fraction of consumers (Ray and Vatan, 2013). We focus on these high-end varieties
in what follows. Martin and Mayneris (2013) analyze the case of French exporters, using cus-
1We exclude oil and intra-EU trade.
2
toms data for individual firms. They identify high-end exporters by combining information on
luxury brands, provided by a trade association of high-end good producers, with prices charged
by their French competitors (they observe unit values). The high-end exporters so-defined are
not more geographically diversified, but they export to more distant markets. This points to
a lower sensitivity to distance of high-end variety export(er)s. Martin and Mayneris (2013)
find also that high-end export(er)s are more sensitive to the average income in the destination
country.
The success of emerging countries in the world market, which is leading to increased income
per capita as well as internal income disparities, has inflated demand for high-end varieties of
goods. The combination of a well established brand, specific skills, and dedicated networks of
wholesalers has given a first-mover advantage to European producers. On the other hand, these
industries rely on – generally skilled – labor intensive activities. This production function al-
lows room for maneuver to producers or sub-contractors in developing economies. Overall, we
expect opposing forces related to differentiated labor intensive products (differentiation versus
labor cost) to be exacerbated in this market segment. This paper examines the recent perfor-
mance of these (tiny) segments of the industry, the main players, and the determinants of exports
of high-end varieties.
An obvious difficulty related to assessing world competition in this market segment is in-
adequate classification of traded products. Despite a reasonable knowledge of the firms selling
high-end products, there is no official list of these products. We propose a tentative list at the
finest level of detail (6-digit Harmonized System - HS6) for the products of interest. We re-
construct the high-end segment of international trade for the product categories exported by
a representative group of those firms presenting themselves as ”[a club] of 78 French luxury
houses and 14 cultural institutions [working] together to promote French art de vivre at interna-
tional level“.2 Based on this sub-sample of products, we focus on the flows corresponding to the
upper tier of the distribution of market prices. Since we do not observe prices, we have to rely
on the unit values of traded products. Thus, our approach is based on products and unit values,
not firms. The aim is to observe the world matrix of bilateral trade flows for these products,
2The objective of the Comité is “to collectively promote [member’s] shared values in France and internation-ally”. See website of the Comité:http : //www.comitecolbert.com/. The selection of products was madeindependently.
3
which constrains our choice,3 and means that initially we need to consider all firms in a given
country, exporting in a given product category to a given market, within each year period, as
an aggregate. Using information on unit values for the corresponding trade flows, we then can
classify traded varieties into two mutually exclusive categories, high-end or not.
It is important to note that the unit value is not the price: higher unit values for certain
exporting countries or in certain destination markets may simply be the result of product com-
position effects within product categories at the HS6 level, rather than higher prices for a given
quality. Conversely, unit values may not capture the fact that high-end products cross borders at
a unit value not too different from the mean, and then very high mark-ups are applied to these
products by the wholesale and retail sectors. These are important issues, even if their impact is
minimized by considering the extreme upper segment of the distribution of unit values of the
traded products. This then, can introduce a second difficulty since extreme (high or low) unit
values may be flawed by declaration errors. In order to try to reduce some of the noise in the
data, we clean our database of outliers at the exporter and product levels. Having constructed
our database, we compute the market shares of the various exporters, at the sectoral level for
the so called “high-end tier” of the market. Finally, note that we do not observe individual ex-
porter’s prices or unit values but rather the average Free on Board (FOB) unit value of all the
flows from an exporting country to a destination country, cumulated over 12 months, reported
under a specific HS6 position.
With these methodological limitations in mind, we systematically explore international trade
in selected products and price ranges in bilateral exchanges. First, we observe that Europe is
still the main player in this arena, with half of world exports of high-end varieties. However,
there has been a profound reshaping of world market share due to a sharp increase in Chinese
exports. These are mainly in the textile sector, where product differentiation has been very
weak protection for producers in rich countries. If we exclude this sector, we observe European
market share resilience in a buoyant world market, which translates into a sharp increase in the
value of exports.
Second, we explore what determines export performance in the high-end market segment
using our aggregated data (annual exports of each selected HS6 product exported in the high-
3Martin and Mayneris (2013) and Ray and Vatan (2013) use individual firm data and consequently consideronly French exports.
4
end segment of the market by a country to a particular market) for 176 countries. We rely on
a standard gravity framework to assess the determinants of trade flows. We are interested in
whether these determinants differ from the usual ones. We find that exporters of high-end prod-
ucts suffer less from distance than exporters of other goods. This confirms Martin and Mayneris
(2013) result regarding distance, that the negative effect of distance on the exports of French
firms dramatically decreases in the case of Comité Colbert firms compared to other firms. How-
ever, not all the results obtained using individual customs data for French firms hold if – as
here – aggregated data are used to construct the world trade in high-end varieties matrix. There
are aspects that are specific to certain exporters, such as France, which will emerge from our
analysis. Martin and Mayneris (2013) highlight that the positive effect of destination country
wealth (GDP per capita) on exports is significantly larger for French firms exporting high-end
products, compared to other French exporters. When we consider cross-country evidence for
the whole set of exporters we find that the average effect of the importing country’s wealth is
lower for high-end goods relative to other products. By resolving this apparent contradiction
related to micro and aggregate data, we show that only some exporting countries (including
France - and thus the Colbert firms analysed in Martin and Mayneris (2013), Italy, and Switzer-
land) benefit more from importers’ wealth in the case of exports of high-end goods than from
exports of other products. Finally, we find that the effect of a destination country’s wealth is
positively and significantly driven by the number of luxury brands in the exporting country. 4
This means that only some exporting countries, home to some very well known luxury brands,
export more high-end than other goods to rich destinations. We conclude that a highly selective
club of exporting countries that are capitalizing on their historical reputation for production and
export of luxury goods, reap relatively more benefits from increasing wealth in the importing
country when exporting high-end products.
The rest of the paper is organized as follows. The related literature is reviewed briefly in
Section 2. Section 3 presents the data, the assumptions made when constructing the bilateral
trade in high-end products matrix, and descriptive statistics for the redistribution of world mar-
ket shares. Section 4 describes our econometric estimation strategy, and summarizes the results.
Section 5 concludes.4We calculate the number of brands classified in the top100 most valuable luxury brands ranking by the World
Luxury Association, by exporting country. Data available at: http://www.top100luxury.com.
5
2 Literature review
Recent advances in trade theory and empirics have led to a profound reshaping of our under-
standing of the patterns of international trade.
Traded goods are differentiated horizontally (in terms of variety) and vertically (in terms
of quality). Economies of scale and the necessity to amortize the development costs for each
new variety impose a limit on the economic affordability of product diversity. The capacity to
offer more varieties is determined by the size of the industry output, which is determined by
country size and comparative advantage (Krugman, 1980). Hummels and Klenow (2005) find
that large countries export higher quality goods and not just a bigger varieties of these goods.
The larger or more sophisticated and wealthier the domestic market, the higher the quality of
the products supplied to the local consumer (Motta et al., 1997). As a result of this orientation
of domestic demand, and the skill content of production, the capacity to offer high-end goods
is positively related to exporting country’s income per capita (Falvey and Kierzkowski, 1987;
Flam and Helpman, 1987; Hallak, 2010). In general, high income countries, conditional on
sector characteristics, engage in more intensive bilateral trade, which is in line with Linder’s
seminal hypothesis (Linder, 1961).
Another departure from the traditional theory is represented by consumer preferences. For
simplicity, theories that address mainly the supply side determinants of trade, usually assume
homothetic and homogenous consumer preferences. This assumption contrasts with frequent
evidence provided by gravity equations, that similarities in income per capita are a driver of
bilateral trade when controlling for economic size. Introducing non-homothetic preferences
in trade theory addresses several puzzles (Markusen, 2013): increasing income inequalities,
missing trade, home bias in consumption habits, higher prices in high income countries, and
dependence of the values of bilateral trade on income per capita controlling for economic size.
Simonovska (2010) shows that variable mark-ups account for 80% of the positive price-income
relationship observed for 123 countries. This has important consequences for our understanding
of the underlying forces of international specialization. Reimer and Hertel (2010) show a strong
correlation between the factor content of consumption and per capita income in the presence of
non-homothetic preferences, and that accounting for this helps to resolve the puzzle related to
missing trade. Fieler (2011) shows that bilateral trade relationships for 162 countries can be
6
better predicted if the usual assumption of homotheticity is relaxed – in particular for countries
of different sizes and income levels. Crozet et al. (2012) give a quality interpretation of the
Melitz model of firm heterogeneity. They use firm-level export data with expert assessments for
the Champagne producers’ quality, to estimate the key parameters of the model. Though de-
mand for Champagne increases with income per capita, higher quality increases exports within
all income categories.
In this context, there is room for exporters to ship similar goods at very different price
and cost level, on a continuous basis. The increasing similarity in the categories of products
exported by countries at different levels of economic development, at very different prices, has
received increased attention in the empirical literature following the seminal study by Schott
(2004). Fontagne et al. (2008) consider all products, exporters and importers (a panel of 163
countries over 10 years) and define three market segments. They explain the value of bilateral
exports in each market segment. They show that low price goods are more sensitive to distance
than high price ones and that richer countries tend to export more goods in the upper segment
of the market. However, their definition of the “upper segment” of the market is very broad and
covers one third of the value of the world market for each product. A more specific study of
the exclusive products at the very top of the vertical differentiation ladder requires a different
approach.
Martin and Mayneris (2013) rely on French customs data to consider those firms (actually
the statistical units defined by their administrative identifier) that define themselves specifi-
cally as exporters of luxury goods (recorded as members of the Comité Colbert referred to
above). Not all French exporters of luxury goods belong to this trade association, and Mar-
tin and Mayneris (2013) also consider non-members exporting from France within the same
product categories at similar (high) prices. They compare these exporters of high-end prod-
ucts to low-end variety exporters. High-end variety exporters do not export to more countries,
but do trade with more distant markets because of the lower sensitivity to distance of high-end
variety exports. High-end variety exporters are also more prone to shift toward fast-growing
economies, and accordingly to reap the benefits of the redistribution of world growth towards
emerging economies. Martin and Mayneris (2013) finally show that high-end French exporters
are more sensitive to average income in the destination country. The final picture is one of
high-price niche good producers that export a small number of products to a small number of
7
countries but, on average, manage to reach more distant and more promising markets. Ray and
Vatan (2013) address a different issue: rather than studying the impact of average wealth of
the destination market on exports of high-end products, they study the impact of income dis-
tribution, based on the assumption of social interactions shaping individual preferences. Using
the same French data on exporters of high-end products, they show that the mean unit value of
exports in a given product category, increases with the Gini index of income dispersion in the
destination country. Countries with more dispersed income show a higher willingness to pay
for the attributes provided by high-end products.
Our paper adds to this literature by considering the whole range of exporting countries and
markets (as opposed e.g. to Martin and Mayneris (2013) and Ray and Vatan (2013) ) and
applying the finest definition of high-end products (as opposed e.g. to Fontagne et al. (2008)).
It also explores the heterogeneity within exporting countries based on their endowment of well-
established luxury brands. Notably, we distinguish between countries with a long history of
high-end producers, and others. This builds on the literature on the heterogeneity in luxury
brands’ performance.
Standard management theories related to luxury brands, such as Doyle (2002), point out
that luxury firms produce goods that are at the top of the quality distribution, and that their
marketing is mostly image-driven (compared to other goods). However, anecdotal evidence
shows, as for example the recent case of Jaguar, that for luxury firms profitability can be elusive
despite huge expenditure on marketing activities. Atwal and Williams (2009) highlight that the
management of the luxury brand is a major determinant of the probability of long-term success
for these firms, which Kapferer and Bastien (2009) argue is due to strong specificities in their
management. Luxury brands have to convey positive values beyond the intrinsic quality of the
good, and provide goods that are socially important from the consumers’ point of view (Han
et al., 2010). Among other characteristics, Kapferer and Bastien (2009) stress that luxury goods
firms have to convince consumers that their products are scarce and unique, which makes their
brands exclusive. This is not just a matter of image: reputation is more easily achieved by
brands that have a long history Dubois et al. (2005). The French luxury goods houses that
belong to the Comité Colbert are good examples of brands – and thus firms – capitalizing on an
ancestral heritage.
8
3 Data, assumptions and descriptive statistics
Data and assumptions
We use BACI data for the period 1994-2009.5 BACI is a world trade dataset developed by the
CEPII. It draws on UN COMTRADE data and provides consistent data on bilateral trade. For
each bilateral flow classified by HS6, BACI reports a unique FOB value, quantity, and unit value
which takes account of the declarations of both exporters and importers. This reconciliation
is based primarily on Cost Insurance Freight (CIF) values reported by importers, treated to
enable comparison with exporters’ FOB values which allows estimation of the reliability of
each country reporting. (Gaulier and Zignago, 2010). BACI is an exhaustive database and
covers trade for more than 200 countries and 5,000 products. Trade flows are considered as
FOB, allowing comparisons clear of transport costs. Also, data are reconciled, correcting for
erroneous declarations by one of the two trading countries.
In 2005, the treatment of unit values by the UN changed, and our understanding, based on a
detailed examination of the series used for our exercise, is that the reliability of this information
has declined somewhat. This reinforces the need to clean the data of outliers, which is a source
of trade-off since we are interested in the upper tier of the distribution. We experimented with
various combinations of thresholds and concluded that the solution presented below is fairly
well balanced. With the exception of Hong-Kong and Singapore which re-export a significant
part of their imports, the sample of exporters and destination countries are from BACI, which
suggests that this study is quite exhaustive.
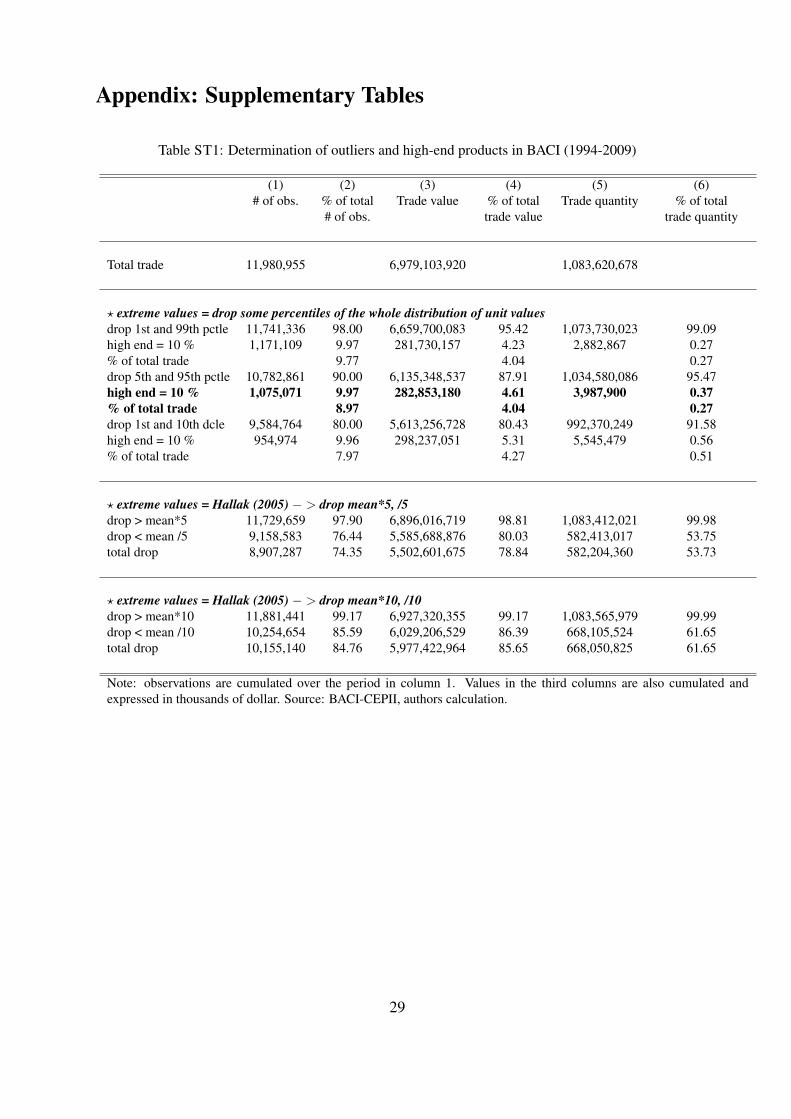
We select 416 HS6 product groups in BACI flagged as European high-end products. This
selection is based on the activities of the 75 manufacturing sector members of the French as-
sociation of luxury brands.6 We use the SITC-rev3 (2-digit and 4-digit) classification to group
the HS6 codes into large industries. Appendix Table ST1 shows that our sample is split into
13 product groups in the SITC-rev3 2-digit classification; we use the 4-digit classification of
products for the rest of the sample (10 product groups with the SITC-rev3 4-digit aggregation
level). This construction of the 23 product groups of the SITC-rev3 classification fits better
5See http://www.cepii.fr/anglaisgraph/bdd/baci.html.6Since France is an important player in the sector, we retained the HS6 codes of the items produced by the
Maisons of the Comité Colbert in order to select relevant HS6 products. The usual disclaimer applies since ComiteColbert was not involved in this selection.
9
with the luxury goods “sectors”. Finally, we aggregate these 23 SITC-rev3 product groups into
8 sectors: tableware, decoration, clothing, beverages, fragrances, jewellery, bags and shoes, and
confectionery. We exclude the upper and lower extreme unit values, computing the difference
between the unit value of each flow and the mean of the unit value of each product group,
exported over the whole period considered.
We use the distribution of these differences retaining only the observations between the 5th
and the 95th percentiles (90% of the observations) in the BACI database, for 1994-2009. Thus,
we work with around 87.9% of the database in value, and 95.5% in quantity. This method can
be compared with Hallak (2006), who defines two thresholds: the mean of the unit value (by
product group, exporter, and year) multiplied by 5 and divided by 5. This method leads to a
smaller sample (25.7% of the observations are deleted). But one of the differences is that unit
values that are excluded are mainly in the low-end of the distribution (91.8% of the deleted
observations). We drop the same share of extreme values from the lowest and the highest unit
values (Appendix Table ST1).
Because the product groups we are interested in cover trade flows at very different prices
(and quality), we focus on the high-end of the unit value distribution. We define high-end
product groups as observations in the upper decile of the distribution of unit values for each
product and year. The top 10% of the unit values represent 4.6% of our trade sample (excluding
one decile of the observations), and 4.1% of total trade in value for these HS6 positions (as
recorded in BACI). This corresponds to only 0.4% of the quantities because the top end of the
distribution of unit values is characterized by small quantity flows of high value.
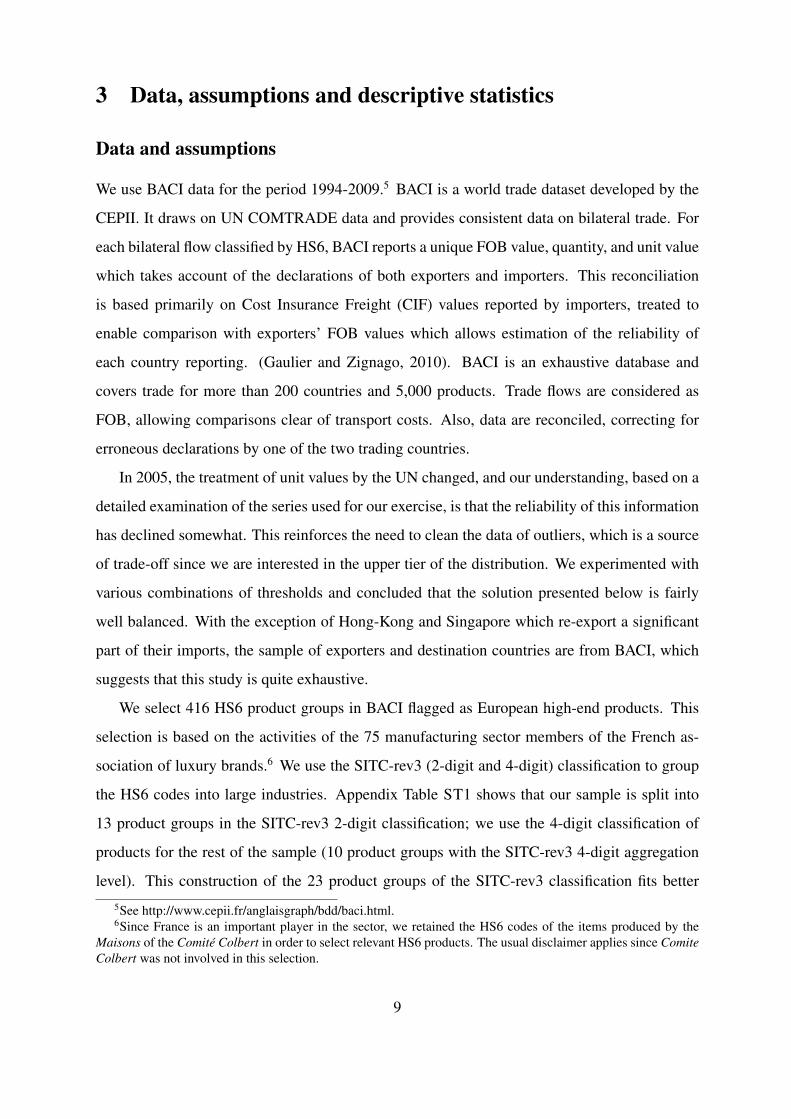
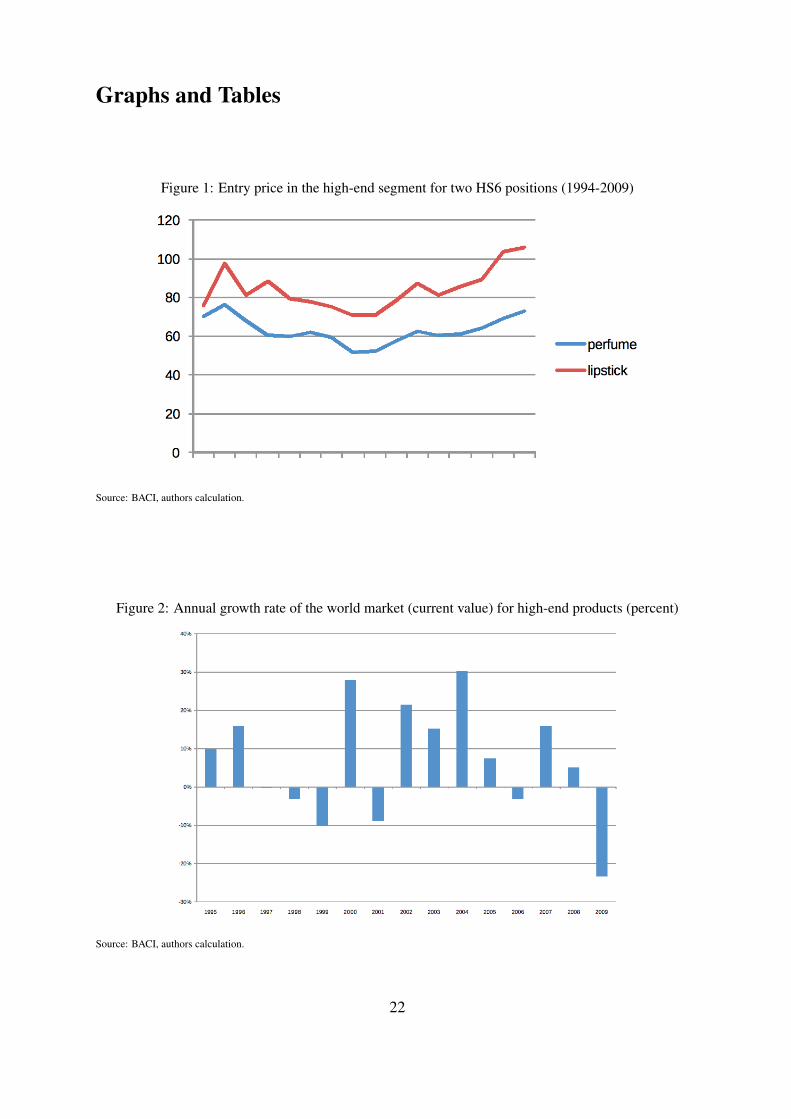
The “entry price” in the upper segment is the same for all exporters and all destination mar-
kets for a given HS6-year pair. Figure 1 depicts how the entry price evolves for two categories
of items: perfumes and lipsticks, over the period considered. Indeed, not all exporters “enter”,
and entry will not correspond to the same unit value of the flow considered, since each exporter
will pass the threshold plotted in Figure 1 at a different unit value. Since the entry price is the
same for all exporters, we would expect large swings in exchange rates to affect the market
shares of countries as long as this shock is passed on to prices in foreign currency.
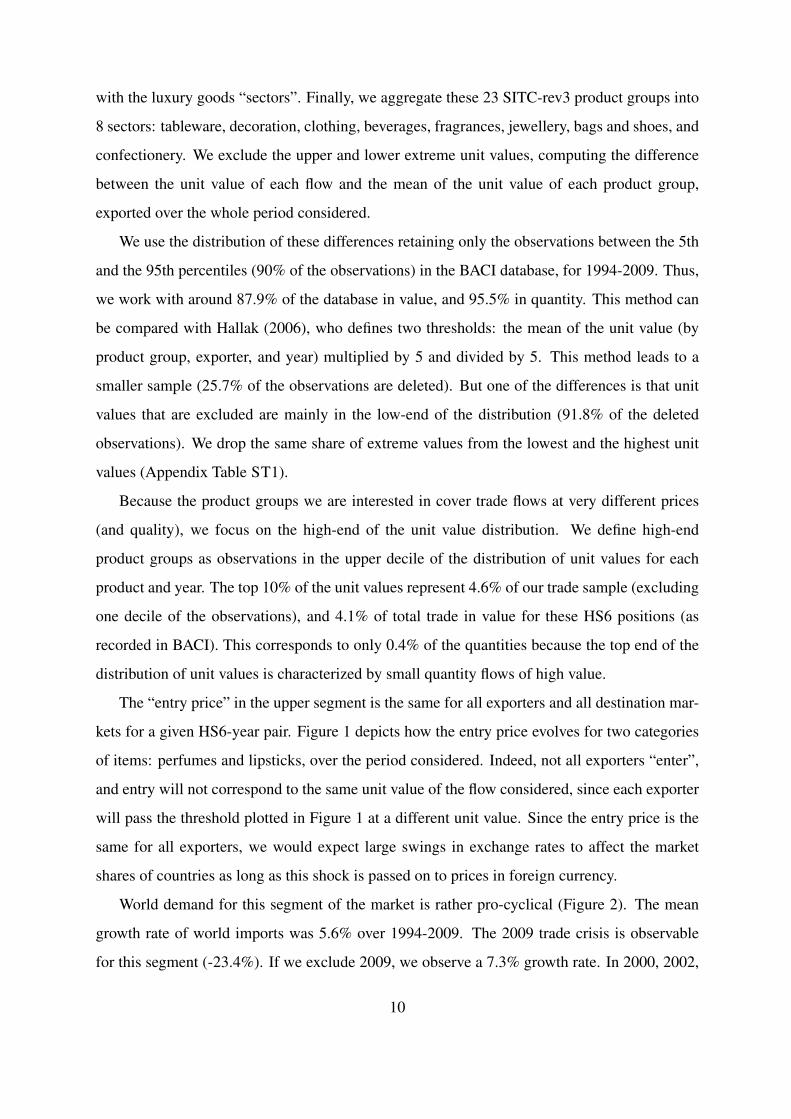
World demand for this segment of the market is rather pro-cyclical (Figure 2). The mean
growth rate of world imports was 5.6% over 1994-2009. The 2009 trade crisis is observable
for this segment (-23.4%). If we exclude 2009, we observe a 7.3% growth rate. In 2000, 2002,
10
and 2004, the growth rate was above 20%. Chinese exports have grown much faster than world
imports (13.2% over 1994-2008), but since their initial value was low, this did not dramatically
affect the relative positions of the main exporters, including the EU27 (resp. 6.2%). Overall, in
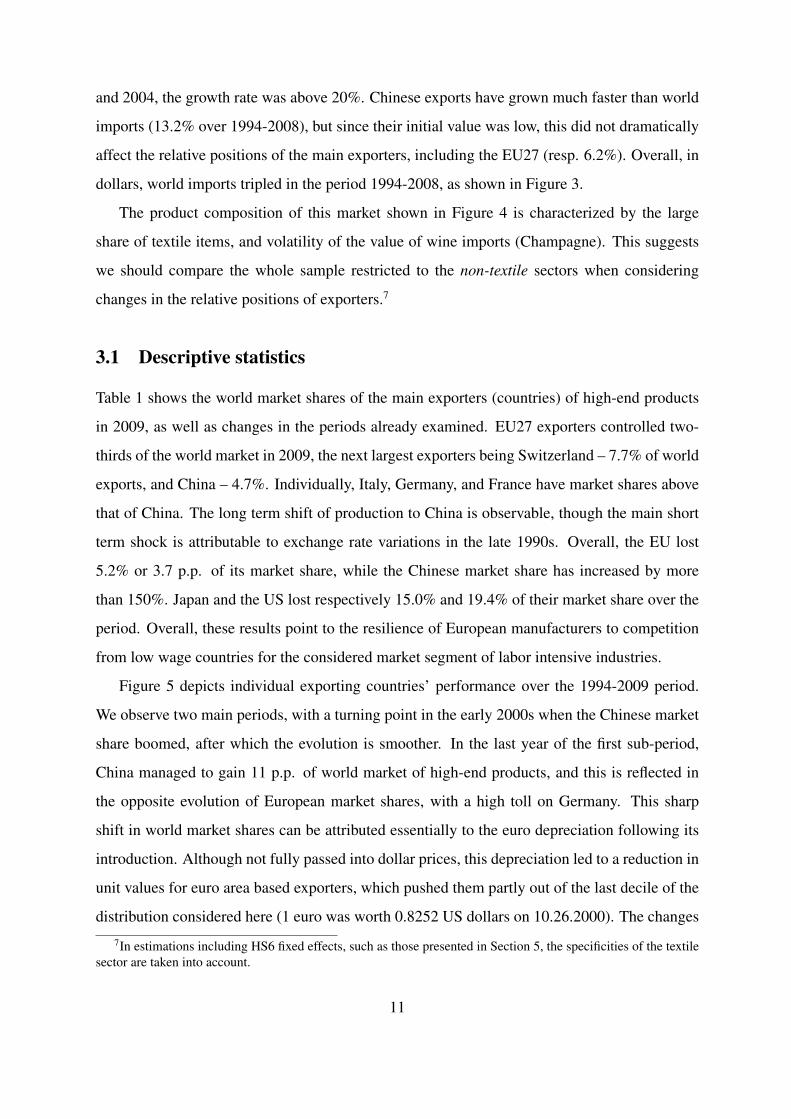
dollars, world imports tripled in the period 1994-2008, as shown in Figure 3.
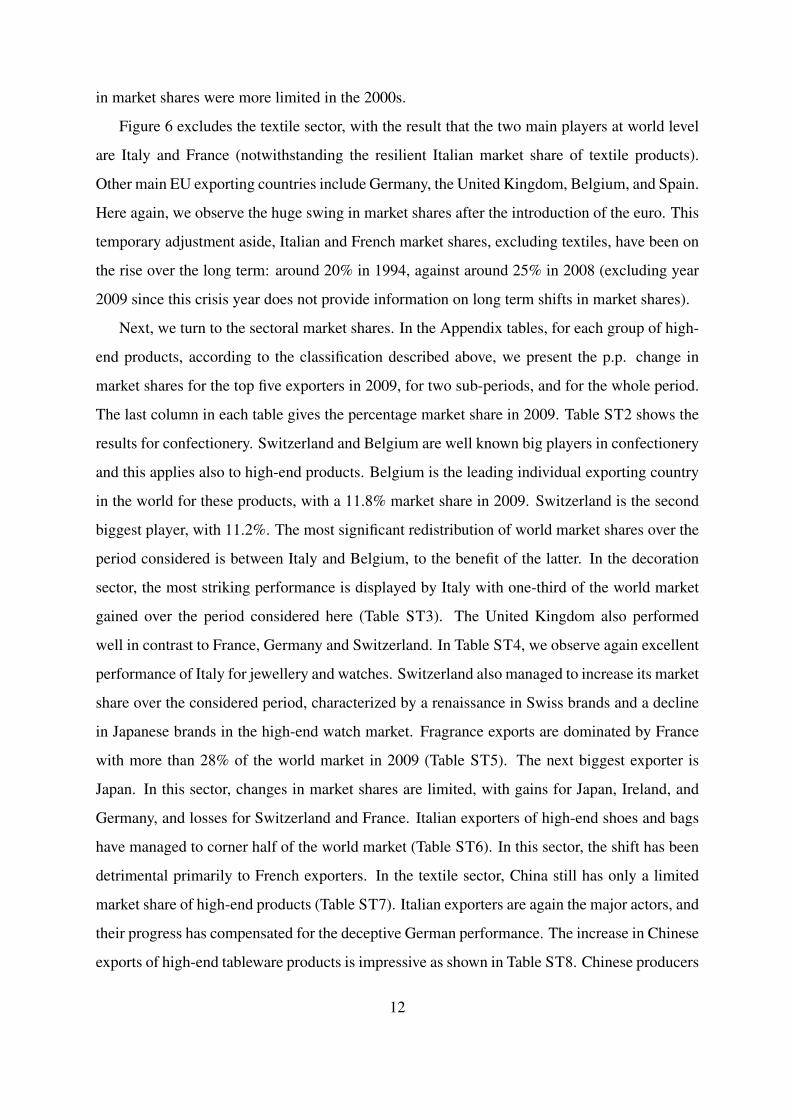
The product composition of this market shown in Figure 4 is characterized by the large
share of textile items, and volatility of the value of wine imports (Champagne). This suggests
we should compare the whole sample restricted to the non-textile sectors when considering
changes in the relative positions of exporters.7
3.1 Descriptive statistics
Table 1 shows the world market shares of the main exporters (countries) of high-end products
in 2009, as well as changes in the periods already examined. EU27 exporters controlled two-
thirds of the world market in 2009, the next largest exporters being Switzerland – 7.7% of world
exports, and China – 4.7%. Individually, Italy, Germany, and France have market shares above
that of China. The long term shift of production to China is observable, though the main short
term shock is attributable to exchange rate variations in the late 1990s. Overall, the EU lost
5.2% or 3.7 p.p. of its market share, while the Chinese market share has increased by more
than 150%. Japan and the US lost respectively 15.0% and 19.4% of their market share over the
period. Overall, these results point to the resilience of European manufacturers to competition
from low wage countries for the considered market segment of labor intensive industries.
Figure 5 depicts individual exporting countries’ performance over the 1994-2009 period.
We observe two main periods, with a turning point in the early 2000s when the Chinese market
share boomed, after which the evolution is smoother. In the last year of the first sub-period,
China managed to gain 11 p.p. of world market of high-end products, and this is reflected in
the opposite evolution of European market shares, with a high toll on Germany. This sharp
shift in world market shares can be attributed essentially to the euro depreciation following its
introduction. Although not fully passed into dollar prices, this depreciation led to a reduction in
unit values for euro area based exporters, which pushed them partly out of the last decile of the
distribution considered here (1 euro was worth 0.8252 US dollars on 10.26.2000). The changes
7In estimations including HS6 fixed effects, such as those presented in Section 5, the specificities of the textilesector are taken into account.
11
in market shares were more limited in the 2000s.
Figure 6 excludes the textile sector, with the result that the two main players at world level
are Italy and France (notwithstanding the resilient Italian market share of textile products).
Other main EU exporting countries include Germany, the United Kingdom, Belgium, and Spain.
Here again, we observe the huge swing in market shares after the introduction of the euro. This
temporary adjustment aside, Italian and French market shares, excluding textiles, have been on
the rise over the long term: around 20% in 1994, against around 25% in 2008 (excluding year
2009 since this crisis year does not provide information on long term shifts in market shares).
Next, we turn to the sectoral market shares. In the Appendix tables, for each group of high-
end products, according to the classification described above, we present the p.p. change in
market shares for the top five exporters in 2009, for two sub-periods, and for the whole period.
The last column in each table gives the percentage market share in 2009. Table ST2 shows the
results for confectionery. Switzerland and Belgium are well known big players in confectionery
and this applies also to high-end products. Belgium is the leading individual exporting country
in the world for these products, with a 11.8% market share in 2009. Switzerland is the second
biggest player, with 11.2%. The most significant redistribution of world market shares over the
period considered is between Italy and Belgium, to the benefit of the latter. In the decoration
sector, the most striking performance is displayed by Italy with one-third of the world market
gained over the period considered here (Table ST3). The United Kingdom also performed
well in contrast to France, Germany and Switzerland. In Table ST4, we observe again excellent
performance of Italy for jewellery and watches. Switzerland also managed to increase its market
share over the considered period, characterized by a renaissance in Swiss brands and a decline
in Japanese brands in the high-end watch market. Fragrance exports are dominated by France
with more than 28% of the world market in 2009 (Table ST5). The next biggest exporter is
Japan. In this sector, changes in market shares are limited, with gains for Japan, Ireland, and
Germany, and losses for Switzerland and France. Italian exporters of high-end shoes and bags
have managed to corner half of the world market (Table ST6). In this sector, the shift has been
detrimental primarily to French exporters. In the textile sector, China still has only a limited
market share of high-end products (Table ST7). Italian exporters are again the major actors, and
their progress has compensated for the deceptive German performance. The increase in Chinese
exports of high-end tableware products is impressive as shown in Table ST8. Chinese producers
12
managed to dominate just short of one-third of the world market in the period. Japanese exports
show resilience, while German and Swiss exports declined, and the Czech republic entered the
top five ranking of world exports. The last sector is wine, essentially Champagne. France’s
supremacy is uncontested in this sector, with a 85% world market share in 2009 (Table ST9).
4 Determinants of high end export flows
Empirical Strategy
We analyze the effect of standard gravity determinants on bilateral trade flows of high end
products. We focus first on the effect of distance and estimate the following equation:
Tijkt = α0+α1HighEndijkt+α2Distij+α3Distij×HighEndijkt+δit+µjt+τk+εijkt (1)
where Tijkt is the logarithm of the bilateral trade flow between origin country i and desti-
nation country j of the HS6 product k in year t. We include HighEndijkt, a dummy variable
that is equal to 1 if Tijkt is classified as a high-end trade flow8 and 0 otherwise. We control
also for the effect of the logarithm of the distance by introducing Distij . Then, we include
Distij ×HighEndijkt, an interaction term between the logarithm of the distance and the clas-
sification of the trade flow as a high-end variety. We capture the effect of the distance on trade
flows in high-end varieties with α2 + α3. This specification also includes fixed effects at the
country of origin and year levels, at the country of destination and year levels, and at the HS6
product level which controls for omitted variables and for multilateral resistance terms.
We also estimate the effect of the size (GDP) and the wealth (GDP per capita) of the export-
ing country on its exports of high-end products. We use the following specification:
8Tijkt is defined as a high-end trade flow if uijkt, its unit value, is above the “entry price” ukt. ukt is definedas the 9th decile of the unit value distribution, by HS product k and year t. The definition of high-end trade flowsis described and discussed in Section 3.
13
Tijkt = β0+β1HighEndijkt+β2Distij+β3GDPit+β4GDPCAPit+β5Distij×HighEndijkt
+ β6GDPit ×HighEndijkt + β7GDPCAPit ×HighEndijkt + λj + ηjkt + υijkt (2)
where GDPit (GDPCAPit) is the logarithm of the GDP (GDP per capita) of the exporting
country i in the year t. We also introduce the interaction between the logarithm of the GDP
(GDP per capita) of the country i in the year t and HighEndijkt to estimate the marginal effect
of the size (wealth) of the exporting country on its bilateral trade flows in high-end products.
We control for omitted variables and multilateral resistance terms including fixed effects at the
country i level and the country i, product k and year t level.
We then replicate this exercise focusing on destination country determinants, estimating:
Tijkt = γ0+γ1HighEndijkt+γ2Distij+γ3GDPjt+γ4GDPCAPjt+γ5Distij×HighEndijkt
+ γ6GDPjt ×HighEndijkt + γ7GDPCAPjt ×HighEndijkt + χi + ϕikt + ωijkt (3)
where GDPjt (GDPCAPjt) is the logarithm of the GDP (GDP per Capita) of the import-
ing country j in the year t, and GDPjt × HighEndijkt (GDPCAPjt × HighEndijkt) is the
interaction term between the logarithm of the GDP (GDP per capita) of the country j at the year
t and the classification of Tijkt as a high-end good or not, HighEndijkt. We also include fixed
effects at the country i level and the country i, product k and year t levels. All estimates are
clustered at the exporting country level.
In equation (2) , β3+β6 captures the effect of the size (resp. (β4+β7) for the effect of wealth)
of exporters on high-end trade bilateral flows. Similarly, in equation (3), γ3 + γ6 captures the
effect of the size (resp. (γ4 + γ7) for the effect of wealth) of importers on high-end trade
bilateral flows. Martin and Mayneris (2013) find a null effect of distance and a positive effect
of the exporter’s GDP per capita on the high-end export flows of French firms. They show also
that the positive effect of GDPCAPjt is significantly larger in the case of high-end varieties.
These results suggest that exports of high-end varieties are less sensitive to distance and respond
positively more to the wealth of destination countries.
14
Results
Results of the OLS estimation of equation (1) are shown in Table 2 column 1. We find that
distance has a negative impact on trade flows of non-high-end varieties, but less so for trade
flows of high-end varieties. This result supports the findings of Martin and Mayneris (2013). We
then introduce exporting country determinants of trade flows in column 2, estimating equation
(2). The effect of distance on both high-end and other products is similar to the results in
column 1, and the size (GDP) of the exporting country is found to have a positive and significant
effect, in the case of both high-end and other varieties. This result is very standard in the trade
literature. More interestingly, we study the effect of being a rich country on its export flows of
high-end goods. Our estimation confirms a negative and significant effect of the wealth (GDP
per capita) of the exporting country on its export flows of goods in general. This reflects the
shift in comparative advantage of these countries to services. In contrast, for high-end exports,
exporter’s wealth is found to almost compensate for this effect: the disadvantage of high income
countries almost disappears for high-end goods. Figure 7 suggests that countries with higher
GDP per capita are also larger exporters of high-end varieties. However, as we explained, this
is not what we observed, which might be because GDP per capita is correlated with variables
that positively influence high end flows, such as GDP.
Table 2 column 3 replicates this exercise, but introduces destination country specific ex-
planatory variables in place of exporter specific ones. We then estimate equation (3), using an
OLS estimator. The effect of distance on both types of trade flows is still robust. We observe
that trade flows of non-high-end products are positively driven toward large and rich countries:
the effects of GDPi and GDPCAPi are positive and significant. The effect of exporting coun-
try size is the same in the case of high-end flows. However, we find that trade flows of high-end
products are less sensitive to the destination country wealth. The total effect of the importer’s
GDP per capita on high-end trade flows is still positive, but significantly lower than in the case
of other products. This result contrasts with Martin and Mayneris (2013) findings for France
only, and may be driven by the difference in the sample of exporters (recall that we consider all
exporting countries shipping high-end products).
To investigate these apparently contradictory results further, we estimate equation (3) for
each exporting country. We include HS products and year fixed effects in place of controls
15
in column 3. Column 4 presents the results for France: all results are qualitatively similar
except for the effect of GDPCAPj × HighEnd. Indeed, in the special case of France, our
findings are similar to those of Martin and Mayneris (2013) using French customs data: ex-
ports from France are more sensitive to the of destination country wealth considering high-end
products compared to other goods. We present the results for three other large exporters of
high-end goods: Italy (column 5), Switzerland (column 6) and China (column 7). The effect
of GDPCAPj × HighEnd is positive and significant in the case of Italy and Switzerland.
However, it is negative and significant for China. In other words, China exports more to rich
countries, but exports a lower proportion of high-end products.
Finally, we investigate the potential origin country specific determinants that might explain
the different results for GDPCAPj × HighEnd. Anecdotal evidence provided by our four
largest exporters suggest that high-end industries in the leading European countries on the one
hand, and in China on the other hand, perform differently. We first characterize high-end indus-
tries in our set of exporting countries by the number of leading luxury brands associated with
them. The “top100 luxury brands” ranking of the World Luxury Association (WLA) provides
a convenient approximation for our analysis. We count the number of brands that appear in
this ranking by nationality. Figure 8 shows the heterogeneity in the number of top national
luxury brands across exporting countries. Large exporters of high-end products on average are
associated with at least one luxury brand in the top100 ranking of the WLA. However, even
among leading exporters of luxury goods, the number of brands they control differs widely
(from 1 in China and Japan, to 24 in France). Table 3 column 1 shows that the wealth of desti-
nation countries increases export flows more from countries with a higher number of top luxury
brands. This means that being associated with a higher number of leading luxury brands in-
creases the γ7 observed for a given exporting country. We also measure the size of exporters
of high-end products by calculating the total value of high-end trade flows by country over the
period. Larger exporters of high-end products are not found to be characterized by a larger γ7
(column 2). This conclusion holds also if we test for the effect of the wealth (GDP per capita)
of these exporting countries (column 3). These results are robust to the introduction of these
three explanatory variables in the same regression (column 4). They also hold when we use a
binary dependent variable that is equal to 1 if γ7 is positive and 0 otherwise (column 5). The
results are very similar also if we restrict our sample to the 67 γ7 that are significant at the 5%
16
level and use a dummy variable that is equal to 1 if γ7 is significantly positive (at the 5% level)
and zero otherwise (column 6). We find qualitatively the same effect using a non-linear (probit
or a logit) estimator.
These findings support the idea that exports of high-end products increase with the wealth
of the destination country. However, only a few exporting countries benefit more from wealthier
destination countries in the case of high-end products compared to other goods. These countries
are characterized by their association with leading luxury brands, and are mainly European
countries.
5 Conclusion
The upgrading of emerging countries’ capabilities combined with rapid export and GDP growth
has led to a profound redistribution of world market shares of manufactured goods since the mid
1900s. Against this background, European commercial performance (unlike that of the US and
Japan) was resilient until the crisis. This resilience was particularly noticeable in the upper
price range of the market. Many traditional sectors, requiring excellent skills, have managed
to keep alive European brands and know-how in industries that have been wiped out by com-
petition from cheap and abundant labor economies. We proposed a list at the HS 6-digit level
of the products of interest and reconstructed this high-end segment of international trade us-
ing information on the distribution of unit values of bilateral flows. Overall, we observe that a
combination of product differentiation, branding and specific skills explain the resilience of EU
producers in high-end products. Although Europe is still the main player in this arena, there
has been a shift in world market shares, and a sharp increase in Chinese textile exports. The
determinants of export performance in the high-end segment of the market are different from
those in other segments, as shown by a standard gravity framework. Overall, exporters of high-
end products suffer less from distance than exporters of other goods. Also, the positive effect
of the destination country wealth on exports is significantly larger for high-end products gen-
erally. However this result is driven by exporting countries benefitting from a large number of
luxury brands and capitalizing on their historical reputation in the production of luxury goods.
Finally, over the period studied, an exclusive club of exporting countries reaps relatively more
benefits from the increasing wealth in emerging importing countries, when exporting high-end
17

products.
18
References
Atwal, G. and A. Williams (2009). Luxury brand marketing - the experience is everything! The
Journal of Brand Management 16(5), 338–346.
Cheptea, A., L. Fontagne, and S. Zignago (2014). European export performance. Review of
World Economics (1), forthcoming.
Crozet, M., K. Head, and T. Mayer (2012, June). Quality sorting and trade: Firm-level evidence
for french wine. Review of Economic Studies 79(2), 704–723.
Doyle, P. (2002). Marketing Management and Strategy. 3rd edn., London: Prentice-Hall.
Dubois, B., S. Czellar, and G. Laurent (2005). Consumer segments based on attitudes toward
luxury: Empirical evidence from twenty countries. Marketing Letters 16(2), 115–128.
Falvey, R. and H. Kierzkowski (1987). Product Quality, Intra-industry Trade and (Im)perfect
Competition, in H. Kierzkowski (eds.), Protection and Competition in International Trade:
Essays in Honor of M. Corden. Basil Blackwell, Oxford and New York.
Fieler, A. (2011). Non-homotheticity and bilateral trade: Evidence and a quantitative explana-
tion. Econometrica 79(4), 1069–1101.
Flam, H. and E. Helpman (1987). Vertical product differentiation and north-south trade. Amer-
ican Economic Review 77(5), 810–822.
Fontagne, L., G. Gaulier, and S. Zignago (2008). Specialization across varieties and north-south
competition. Economic Policy 23(1), 51–91.
Gaulier, G. and S. Zignago (2010). Baci: International trade database at the product-level. the
1994-2007 version. CEPII Working paper 2010-23, CEPII.
Goldberg, P. and N. Pavcnik (2007). Distributional effects of globalization in developing coun-
tries. Journal of Economic Literature 45(1), 39–82.
Hallak, J. C. (2006). Product quality and the direction of trade. Journal of International Eco-
nomics 68(1), 238–265.
19
Hallak, J. C. (2010). A product-quality view of the linder hypothesis. The Review of Economics
and Statistics 92(3), 453–466.
Han, Y. J., J. C. Nunes, and X. Dreze (2010). Signaling status with luxury goods: The role of
brand prominence. Journal of Marketing 74, 15–30.
Hummels, D. and P. J. Klenow (2005). The variety and quality of a nations exports. American
Economic Review 95(3), 609–44.
Kapferer, J.-N. and V. Bastien (2009). The specificity of luxury management: Turning market-
ing upside down. The Journal of Brand Management 16(5), 311–322.
Krugman, P. (1980). Scale economies, product differentiation, and the pattern of trade. Ameri-
can Economic Review 70(5), 950–59.
Linder, S. (1961). An Essay on Trade and Transformation. Stockholm: Almqvist and Wiksell.
Markusen, J. (2013). Putting per-capita income back into trade theory. American Economic
Review 90(2), 255–265.
Martin, J. and F. Mayneris (2013). High-end variety exporters defying distance: Micro facts
and macroeconomic implications. mimeo.
Motta, M., J.-F. Thisse, and A. Cabrales (1997). On the persistence of leadership or leapfrogging
in international trade. International Economic Review 38(4), 809–824.
Ray, A. and A. Vatan (2013). The poor and luxury: Trade in luxury goods in the world of
income inequalities. mimeo.
Reimer, J. and T. Hertel (2010). Nonhomothetic preferences and international trade. Review of
International Economics 18(2), 408–425.
Schott, P. K. (2004). Across-product versus within-product specialization in international trade.
The Quarterly Journal of Economics 119(2), 646–677.
Simonovska, I. (2010). Income differences and prices of tradables. Globalization and Monetary
Policy Institute Working Paper 55, Federal Reserve Bank of Dallas.
20
Sinn, A. W. (2006). The pathological export boom and the bazaar effect: How to solve the
german puzzle. The World Economy 29(9), 1157–1175.
Verhoogen, E. A. (2008). Trade, quality upgrading, and wage inequality in the mexican manu-
facturing sector. Quarterly Journal of Economics 123(2), 489–530.
21
Graphs and Tables
Figure 1: Entry price in the high-end segment for two HS6 positions (1994-2009)
Source: BACI, authors calculation.
Figure 2: Annual growth rate of the world market (current value) for high-end products (percent)
Source: BACI, authors calculation.
22
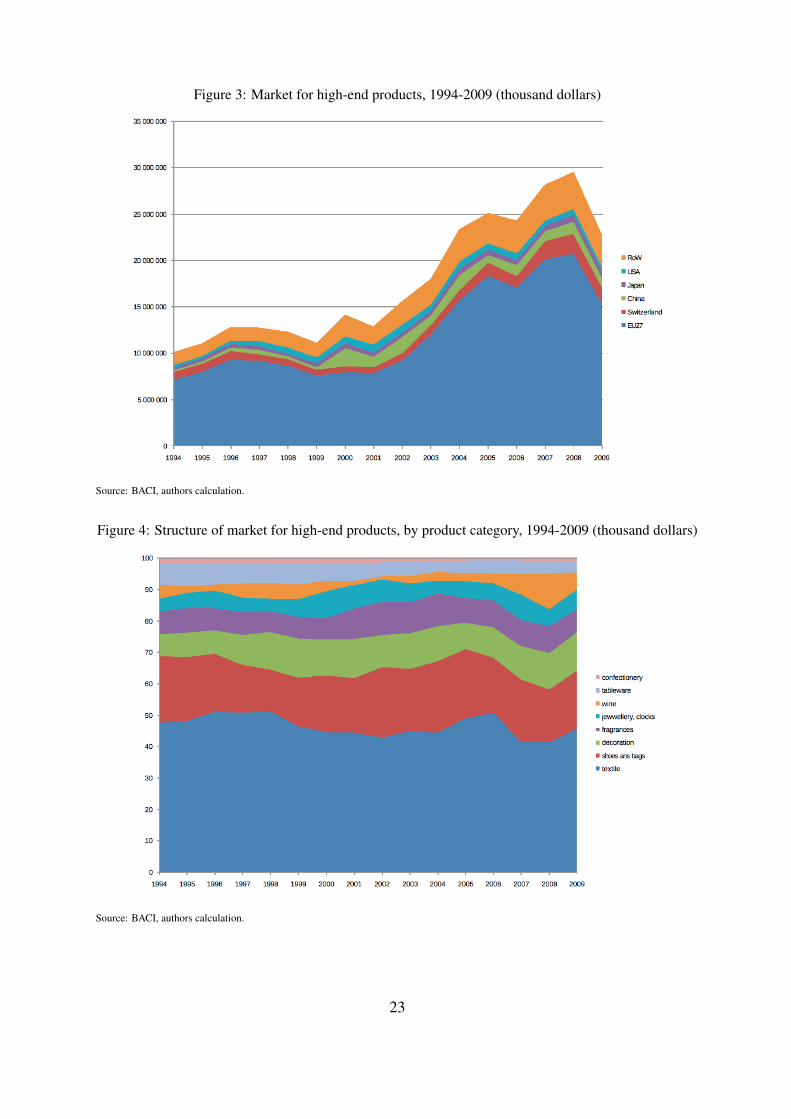
Figure 3: Market for high-end products, 1994-2009 (thousand dollars)
Source: BACI, authors calculation.
Figure 4: Structure of market for high-end products, by product category, 1994-2009 (thousand dollars)
Source: BACI, authors calculation.
23
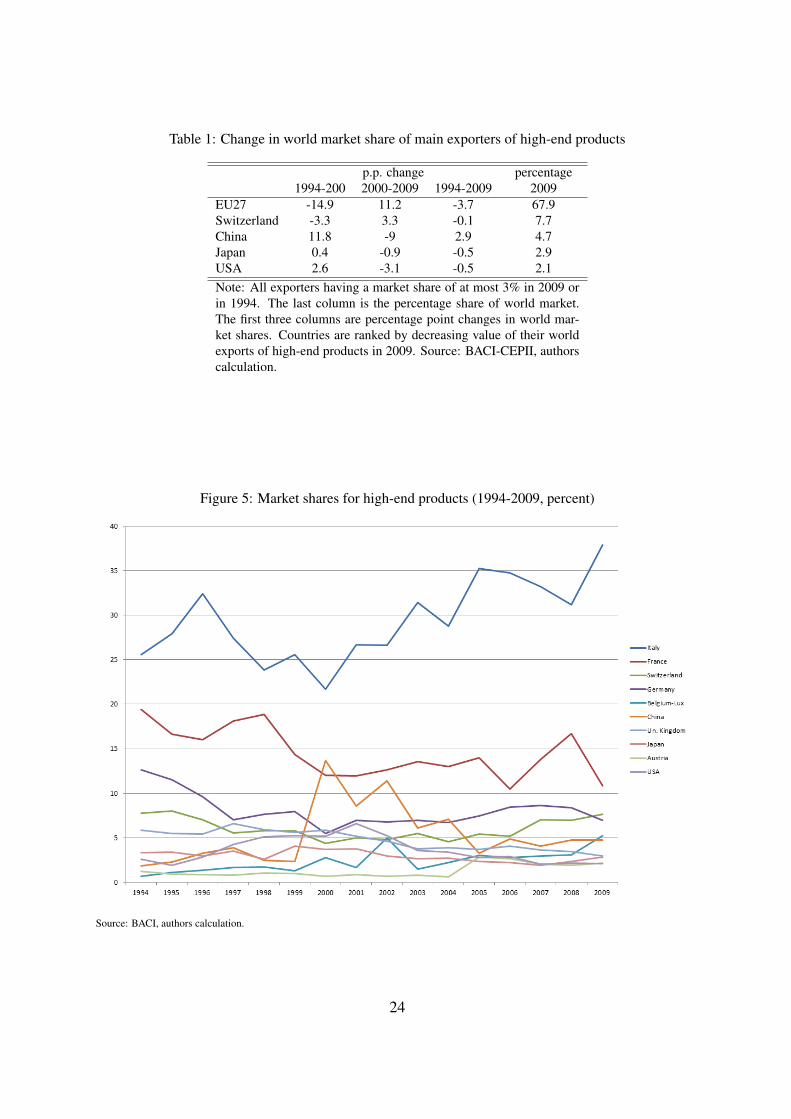
Table 1: Change in world market share of main exporters of high-end products
p.p. change percentage1994-200 2000-2009 1994-2009 2009
EU27 -14.9 11.2 -3.7 67.9Switzerland -3.3 3.3 -0.1 7.7China 11.8 -9 2.9 4.7Japan 0.4 -0.9 -0.5 2.9USA 2.6 -3.1 -0.5 2.1Note: All exporters having a market share of at most 3% in 2009 orin 1994. The last column is the percentage share of world market.The first three columns are percentage point changes in world mar-ket shares. Countries are ranked by decreasing value of their worldexports of high-end products in 2009. Source: BACI-CEPII, authorscalculation.
Figure 5: Market shares for high-end products (1994-2009, percent)
Source: BACI, authors calculation.
24
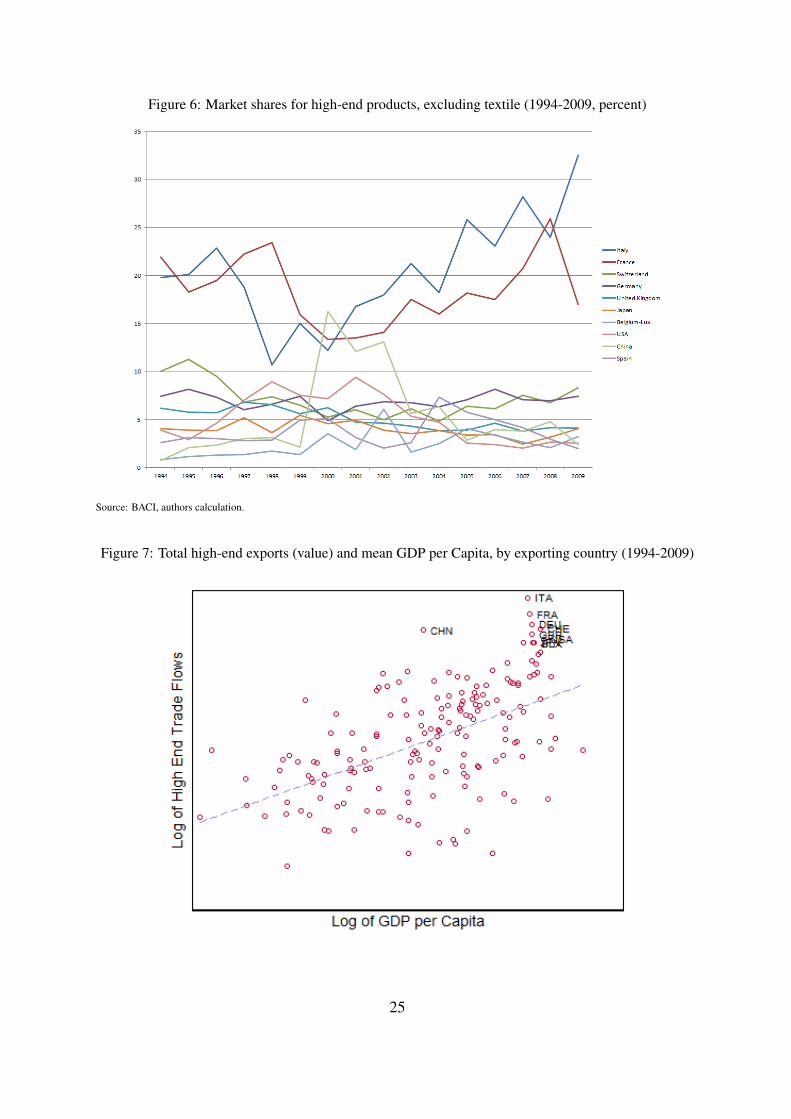
Figure 6: Market shares for high-end products, excluding textile (1994-2009, percent)
Source: BACI, authors calculation.
Figure 7: Total high-end exports (value) and mean GDP per Capita, by exporting country (1994-2009)
25
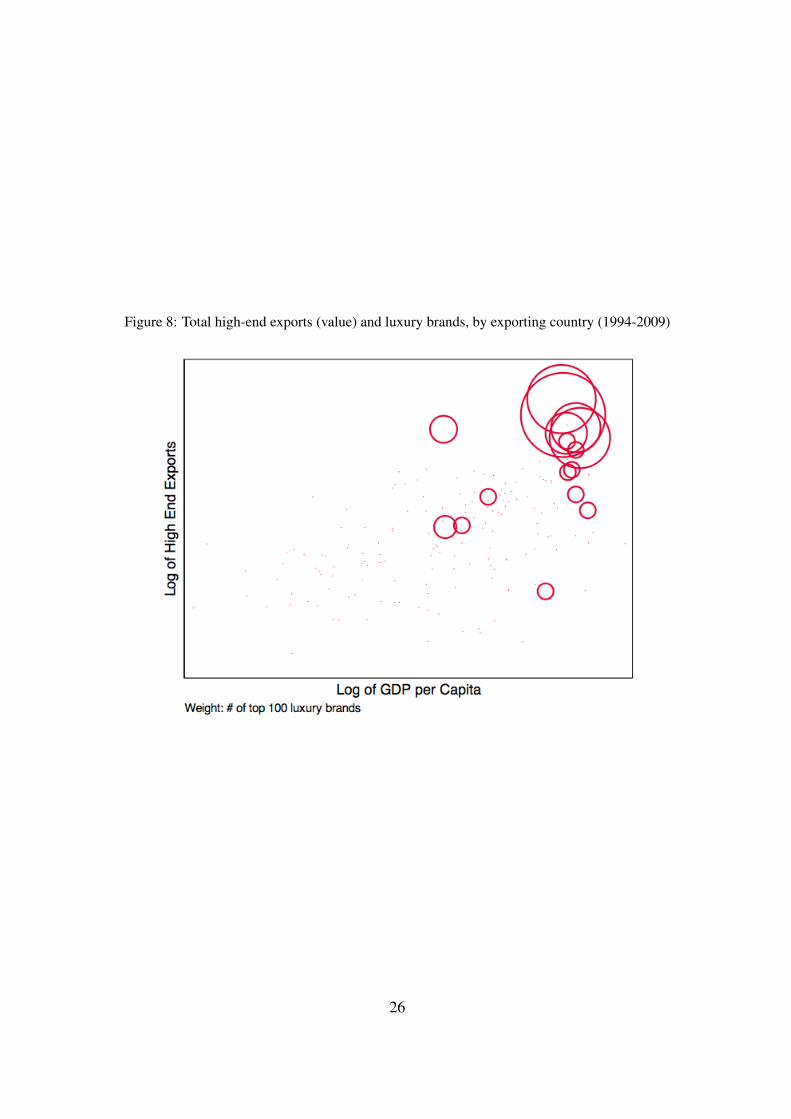
Figure 8: Total high-end exports (value) and luxury brands, by exporting country (1994-2009)
26
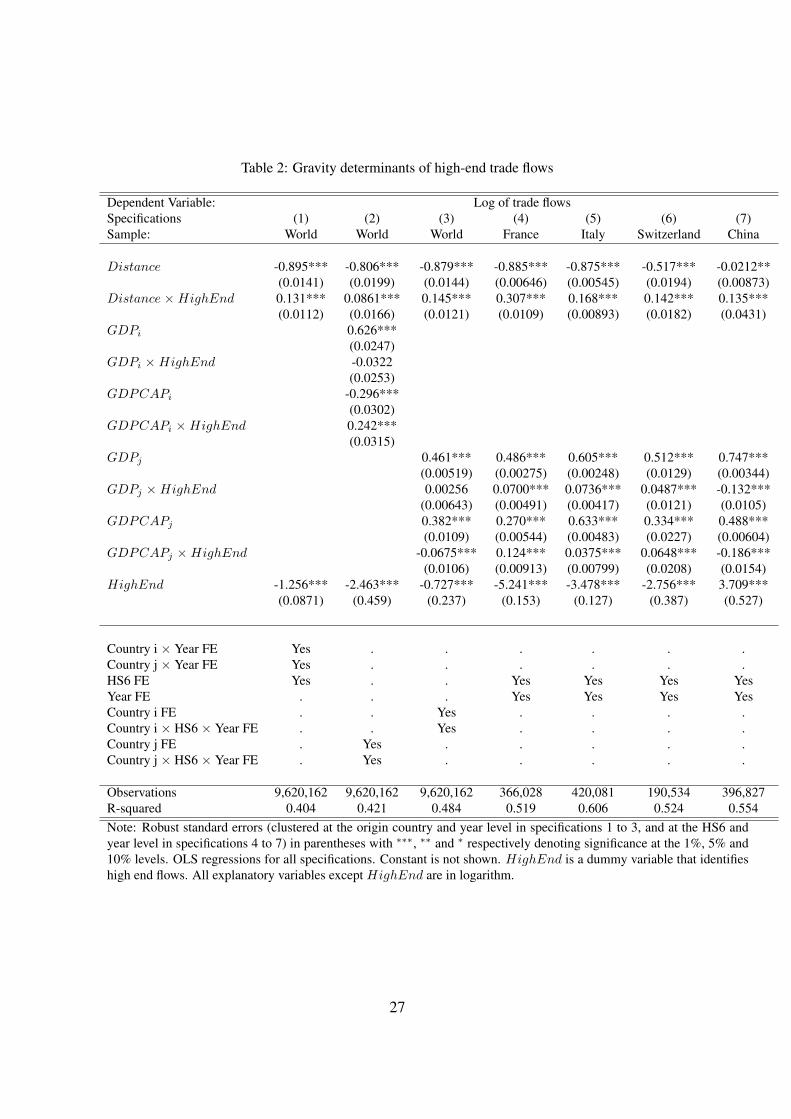
Table 2: Gravity determinants of high-end trade flows
Dependent Variable: Log of trade flowsSpecifications (1) (2) (3) (4) (5) (6) (7)Sample: World World World France Italy Switzerland China
Distance -0.895*** -0.806*** -0.879*** -0.885*** -0.875*** -0.517*** -0.0212**(0.0141) (0.0199) (0.0144) (0.00646) (0.00545) (0.0194) (0.00873)
Distance × HighEnd 0.131*** 0.0861*** 0.145*** 0.307*** 0.168*** 0.142*** 0.135***(0.0112) (0.0166) (0.0121) (0.0109) (0.00893) (0.0182) (0.0431)
GDPi 0.626***(0.0247)
GDPi × HighEnd -0.0322(0.0253)
GDPCAPi -0.296***(0.0302)
GDPCAPi × HighEnd 0.242***(0.0315)
GDPj 0.461*** 0.486*** 0.605*** 0.512*** 0.747***(0.00519) (0.00275) (0.00248) (0.0129) (0.00344)
GDPj × HighEnd 0.00256 0.0700*** 0.0736*** 0.0487*** -0.132***(0.00643) (0.00491) (0.00417) (0.0121) (0.0105)
GDPCAPj 0.382*** 0.270*** 0.633*** 0.334*** 0.488***(0.0109) (0.00544) (0.00483) (0.0227) (0.00604)
GDPCAPj × HighEnd -0.0675*** 0.124*** 0.0375*** 0.0648*** -0.186***(0.0106) (0.00913) (0.00799) (0.0208) (0.0154)
HighEnd -1.256*** -2.463*** -0.727*** -5.241*** -3.478*** -2.756*** 3.709***(0.0871) (0.459) (0.237) (0.153) (0.127) (0.387) (0.527)
Country i × Year FE Yes . . . . . .Country j × Year FE Yes . . . . . .HS6 FE Yes . . Yes Yes Yes YesYear FE . . . Yes Yes Yes YesCountry i FE . . Yes . . . .Country i × HS6 × Year FE . . Yes . . . .Country j FE . Yes . . . . .Country j × HS6 × Year FE . Yes . . . . .
Observations 9,620,162 9,620,162 9,620,162 366,028 420,081 190,534 396,827R-squared 0.404 0.421 0.484 0.519 0.606 0.524 0.554Note: Robust standard errors (clustered at the origin country and year level in specifications 1 to 3, and at the HS6 andyear level in specifications 4 to 7) in parentheses with ∗∗∗, ∗∗ and ∗ respectively denoting significance at the 1%, 5% and10% levels. OLS regressions for all specifications. Constant is not shown. HighEnd is a dummy variable that identifieshigh end flows. All explanatory variables except HighEnd are in logarithm.
27
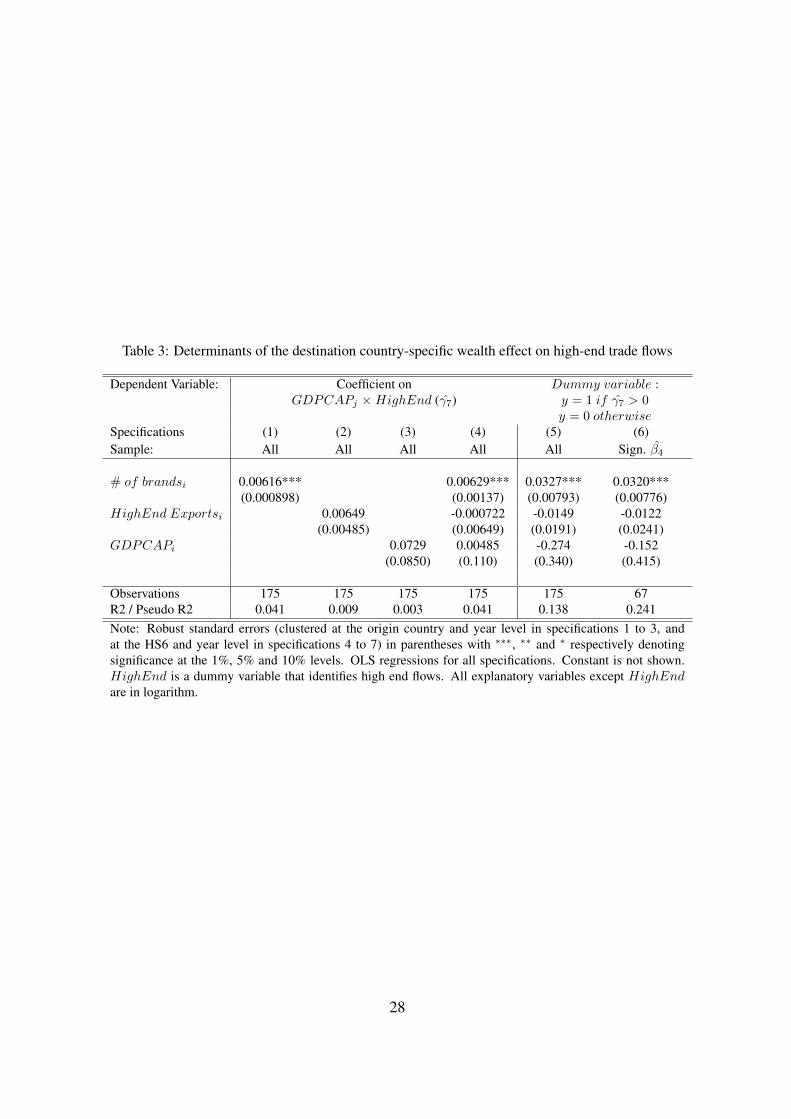
Table 3: Determinants of the destination country-specific wealth effect on high-end trade flows
Dependent Variable: Coefficient on Dummy variable :GDPCAPj × HighEnd (γ7) y = 1 if γ7 > 0
y = 0 otherwiseSpecifications (1) (2) (3) (4) (5) (6)Sample: All All All All All Sign. β4
# of brandsi 0.00616*** 0.00629*** 0.0327*** 0.0320***(0.000898) (0.00137) (0.00793) (0.00776)
HighEnd Exportsi 0.00649 -0.000722 -0.0149 -0.0122(0.00485) (0.00649) (0.0191) (0.0241)
GDPCAPi 0.0729 0.00485 -0.274 -0.152(0.0850) (0.110) (0.340) (0.415)
Observations 175 175 175 175 175 67R2 / Pseudo R2 0.041 0.009 0.003 0.041 0.138 0.241Note: Robust standard errors (clustered at the origin country and year level in specifications 1 to 3, andat the HS6 and year level in specifications 4 to 7) in parentheses with ∗∗∗, ∗∗ and ∗ respectively denotingsignificance at the 1%, 5% and 10% levels. OLS regressions for all specifications. Constant is not shown.HighEnd is a dummy variable that identifies high end flows. All explanatory variables except HighEndare in logarithm.
28
Appendix: Supplementary Tables
Table ST1: Determination of outliers and high-end products in BACI (1994-2009)
(1) (2) (3) (4) (5) (6)# of obs. % of total Trade value % of total Trade quantity % of total
# of obs. trade value trade quantity
Total trade 11,980,955 6,979,103,920 1,083,620,678
? extreme values = drop some percentiles of the whole distribution of unit valuesdrop 1st and 99th pctle 11,741,336 98.00 6,659,700,083 95.42 1,073,730,023 99.09high end = 10 % 1,171,109 9.97 281,730,157 4.23 2,882,867 0.27% of total trade 9.77 4.04 0.27drop 5th and 95th pctle 10,782,861 90.00 6,135,348,537 87.91 1,034,580,086 95.47high end = 10 % 1,075,071 9.97 282,853,180 4.61 3,987,900 0.37% of total trade 8.97 4.04 0.27drop 1st and 10th dcle 9,584,764 80.00 5,613,256,728 80.43 992,370,249 91.58high end = 10 % 954,974 9.96 298,237,051 5.31 5,545,479 0.56% of total trade 7.97 4.27 0.51
? extreme values = Hallak (2005) − > drop mean*5, /5drop > mean*5 11,729,659 97.90 6,896,016,719 98.81 1,083,412,021 99.98drop < mean /5 9,158,583 76.44 5,585,688,876 80.03 582,413,017 53.75total drop 8,907,287 74.35 5,502,601,675 78.84 582,204,360 53.73
? extreme values = Hallak (2005) − > drop mean*10, /10drop > mean*10 11,881,441 99.17 6,927,320,355 99.17 1,083,565,979 99.99drop < mean /10 10,254,654 85.59 6,029,206,529 86.39 668,105,524 61.65total drop 10,155,140 84.76 5,977,422,964 85.65 668,050,825 61.65
Note: observations are cumulated over the period in column 1. Values in the third columns are also cumulated andexpressed in thousands of dollar. Source: BACI-CEPII, authors calculation.
29
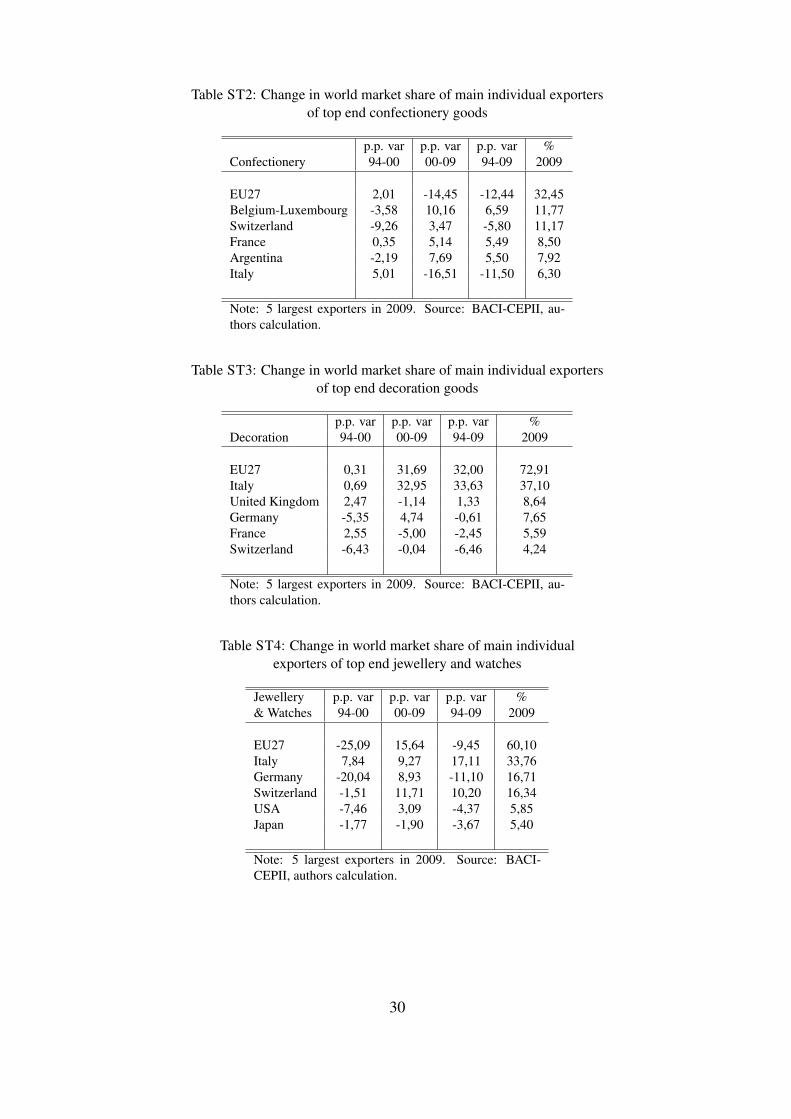
Table ST2: Change in world market share of main individual exportersof top end confectionery goods
p.p. var p.p. var p.p. var %Confectionery 94-00 00-09 94-09 2009
EU27 2,01 -14,45 -12,44 32,45Belgium-Luxembourg -3,58 10,16 6,59 11,77Switzerland -9,26 3,47 -5,80 11,17France 0,35 5,14 5,49 8,50Argentina -2,19 7,69 5,50 7,92Italy 5,01 -16,51 -11,50 6,30
Note: 5 largest exporters in 2009. Source: BACI-CEPII, au-thors calculation.
Table ST3: Change in world market share of main individual exportersof top end decoration goods
p.p. var p.p. var p.p. var %Decoration 94-00 00-09 94-09 2009
EU27 0,31 31,69 32,00 72,91Italy 0,69 32,95 33,63 37,10United Kingdom 2,47 -1,14 1,33 8,64Germany -5,35 4,74 -0,61 7,65France 2,55 -5,00 -2,45 5,59Switzerland -6,43 -0,04 -6,46 4,24
Note: 5 largest exporters in 2009. Source: BACI-CEPII, au-thors calculation.
Table ST4: Change in world market share of main individualexporters of top end jewellery and watches
Jewellery p.p. var p.p. var p.p. var %& Watches 94-00 00-09 94-09 2009
EU27 -25,09 15,64 -9,45 60,10Italy 7,84 9,27 17,11 33,76Germany -20,04 8,93 -11,10 16,71Switzerland -1,51 11,71 10,20 16,34USA -7,46 3,09 -4,37 5,85Japan -1,77 -1,90 -3,67 5,40
Note: 5 largest exporters in 2009. Source: BACI-CEPII, authors calculation.
30
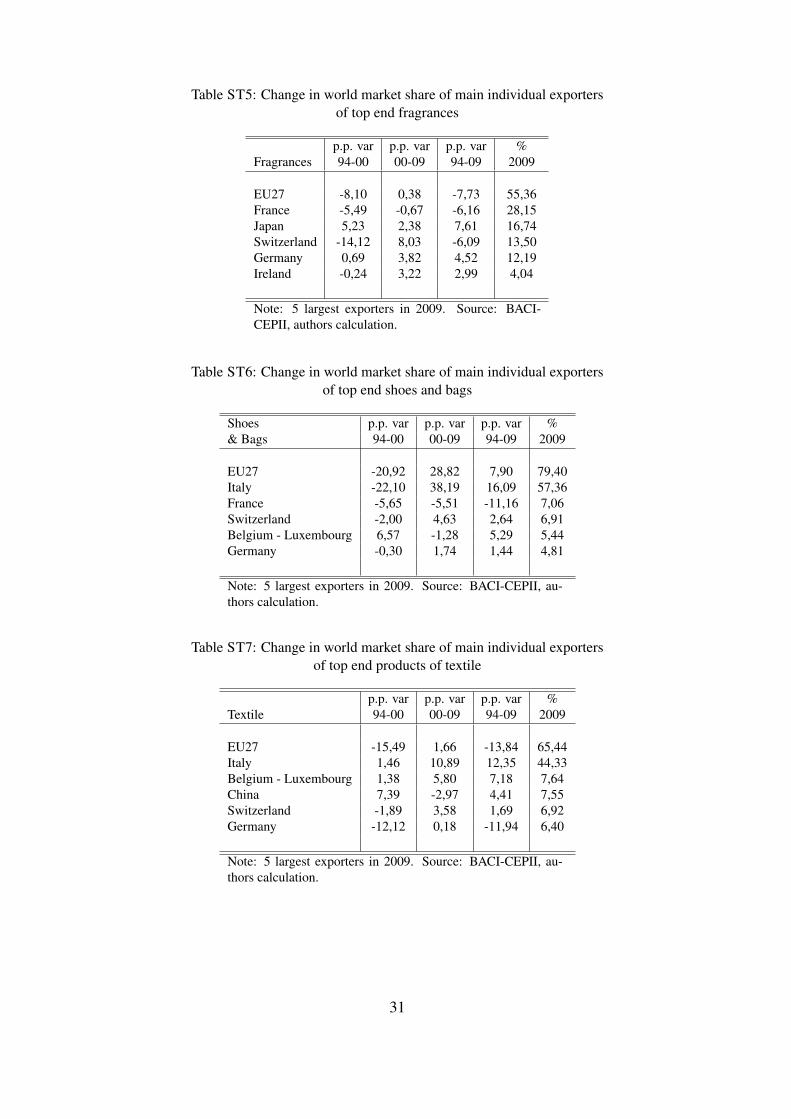
Table ST5: Change in world market share of main individual exportersof top end fragrances
p.p. var p.p. var p.p. var %Fragrances 94-00 00-09 94-09 2009
EU27 -8,10 0,38 -7,73 55,36France -5,49 -0,67 -6,16 28,15Japan 5,23 2,38 7,61 16,74Switzerland -14,12 8,03 -6,09 13,50Germany 0,69 3,82 4,52 12,19Ireland -0,24 3,22 2,99 4,04
Note: 5 largest exporters in 2009. Source: BACI-CEPII, authors calculation.
Table ST6: Change in world market share of main individual exportersof top end shoes and bags
Shoes p.p. var p.p. var p.p. var %& Bags 94-00 00-09 94-09 2009
EU27 -20,92 28,82 7,90 79,40Italy -22,10 38,19 16,09 57,36France -5,65 -5,51 -11,16 7,06Switzerland -2,00 4,63 2,64 6,91Belgium - Luxembourg 6,57 -1,28 5,29 5,44Germany -0,30 1,74 1,44 4,81
Note: 5 largest exporters in 2009. Source: BACI-CEPII, au-thors calculation.
Table ST7: Change in world market share of main individual exportersof top end products of textile
p.p. var p.p. var p.p. var %Textile 94-00 00-09 94-09 2009
EU27 -15,49 1,66 -13,84 65,44Italy 1,46 10,89 12,35 44,33Belgium - Luxembourg 1,38 5,80 7,18 7,64China 7,39 -2,97 4,41 7,55Switzerland -1,89 3,58 1,69 6,92Germany -12,12 0,18 -11,94 6,40
Note: 5 largest exporters in 2009. Source: BACI-CEPII, au-thors calculation.
31
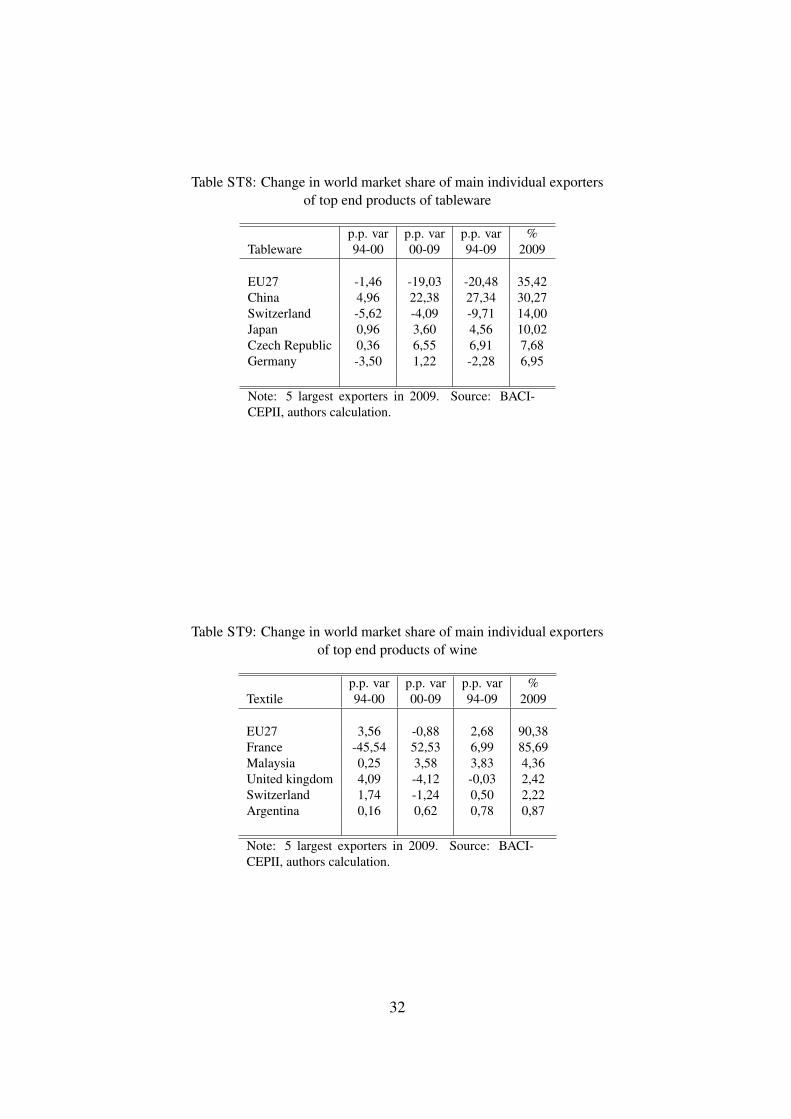
Table ST8: Change in world market share of main individual exportersof top end products of tableware
p.p. var p.p. var p.p. var %Tableware 94-00 00-09 94-09 2009
EU27 -1,46 -19,03 -20,48 35,42China 4,96 22,38 27,34 30,27Switzerland -5,62 -4,09 -9,71 14,00Japan 0,96 3,60 4,56 10,02Czech Republic 0,36 6,55 6,91 7,68Germany -3,50 1,22 -2,28 6,95
Note: 5 largest exporters in 2009. Source: BACI-CEPII, authors calculation.
Table ST9: Change in world market share of main individual exportersof top end products of wine
p.p. var p.p. var p.p. var %Textile 94-00 00-09 94-09 2009
EU27 3,56 -0,88 2,68 90,38France -45,54 52,53 6,99 85,69Malaysia 0,25 3,58 3,83 4,36United kingdom 4,09 -4,12 -0,03 2,42Switzerland 1,74 -1,24 0,50 2,22Argentina 0,16 0,62 0,78 0,87
Note: 5 largest exporters in 2009. Source: BACI-CEPII, authors calculation.
32
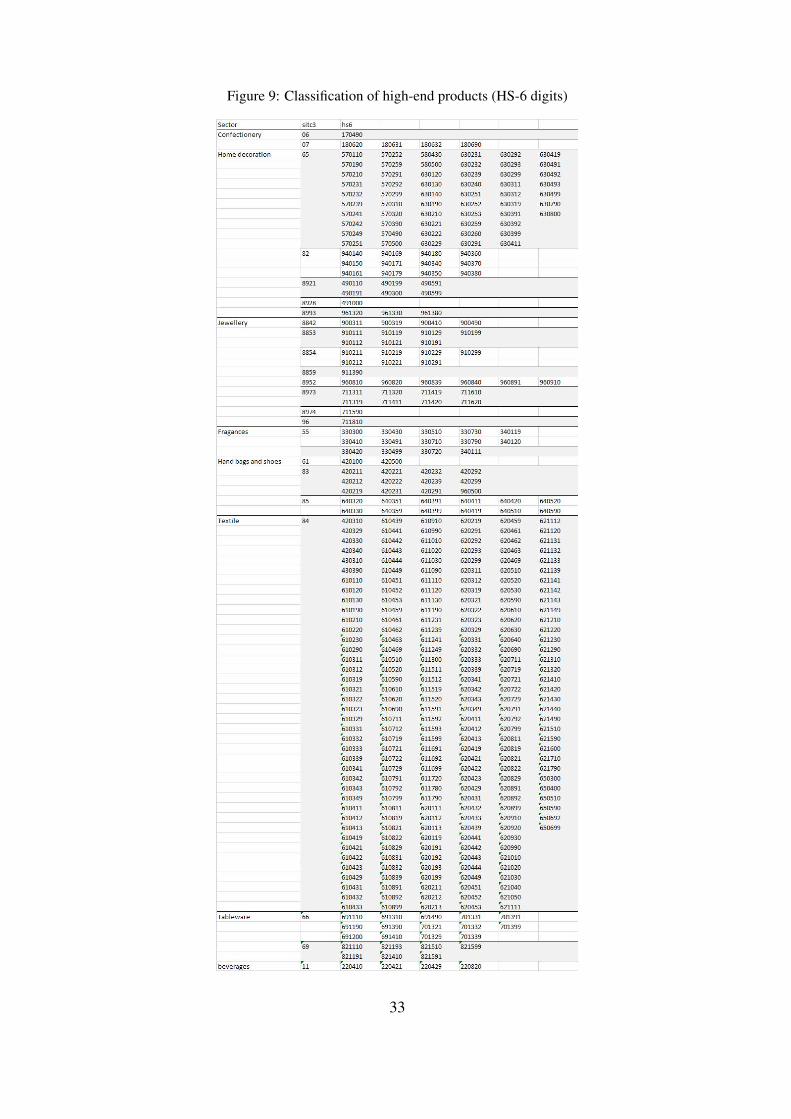
Figure 9: Classification of high-end products (HS-6 digits)
33