Embed Size (px)
Citation preview
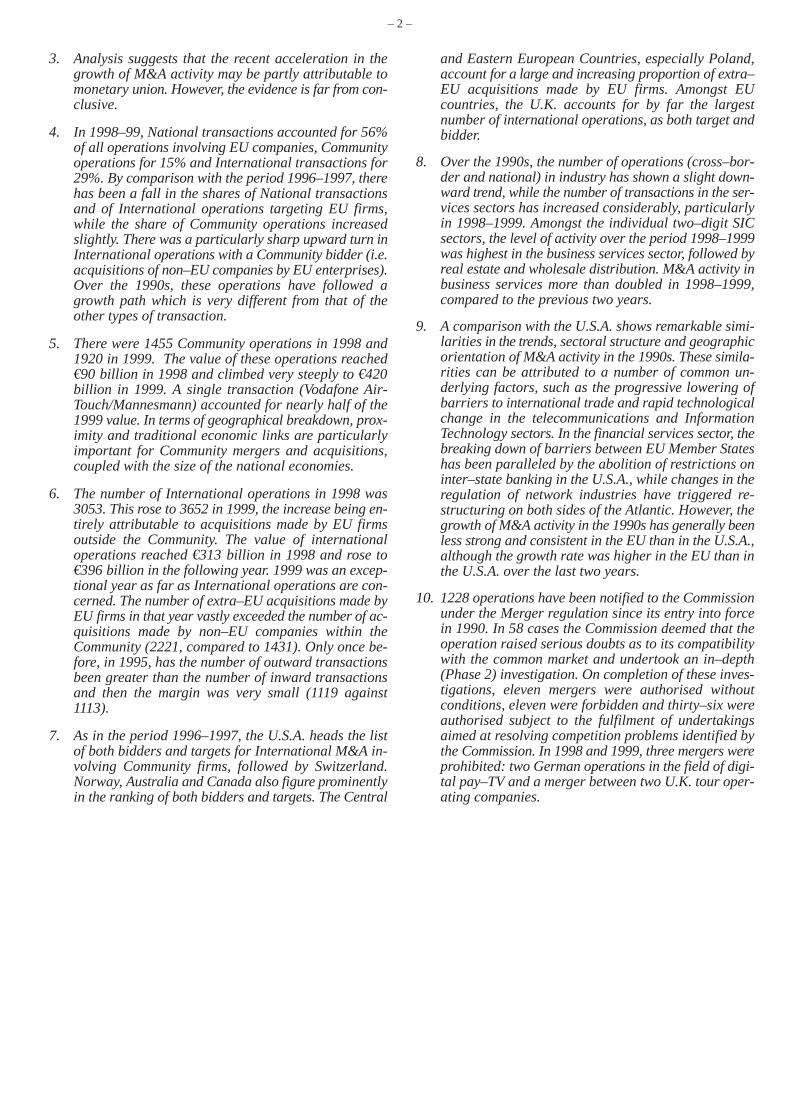
The European Commission’s Directorate–General for Economic and Financial Affairsmonitors activity in the field of mergers and acquisitions, with particular reference tooperations involving EU enterprises. The present issue of Supplement A is the sixth inthe series dealing with the subject.
Part A of this issue gives an overview of the evolution of mergers from 1991 to 1999,focusing on the period 1998–1999. Part B compares M&A activity in the EU and theU.S.A. and Part C summarises the largest deals carried out in 1998 and 1999. Lastly,Part D reports on Commission control of mergers. A box describes the sources of in-formation and presents the conventions used.
Previous editions have used data from the AMDATA data base, which has been discon-tinued. The statistical data required for this issue have therefore been drawn from theSDC M&A data base. SDC provides a somewhat more complete coverage than AMDA-TA, particularly in respect of national operations and transactions in the service sector.The average annual number of transactions involving EU firms is about 27% greaterin the SDC data base than in AMDATA and, in percentage terms, the year–to–yearfluctuations are less marked.
1. In 1998, the number of mergers and acquisitions involving an enterprise of theEuropean Union was over 10 000. This rose to nearly 12 800 in 1999, an increaseof 28%. The U.K. accounts for the largest share of M&A activity in the EU, followedby Germany, France and the Netherlands.
2. The distribution of aggregate M&A activity between Member States correlatesclosely with the stock market capitalisation of domestic firms. The latter variablereflects not only the size of the economy but also the extent to which companies makeuse of equity financing. Other factors do not seem to have a strong influence on therelative levels of M&A activity in different countries. Our analysis reveals no simpleexplanation of the evolution of the level of M&A activity over time during the 1990s.
Supplement AEconomic trendsNo 5/6 – 2000
In this number :Mergers and acquisitions
MERGERS AND ACQUISITIONS
SUMMARY AND MAIN POINTS
http://europa.eu.int/comm/economy_finance
– 2 –
3. Analysis suggests that the recent acceleration in thegrowth of M&A activity may be partly attributable tomonetary union. However, the evidence is far from con-clusive.
4. In 1998–99, National transactions accounted for 56%of all operations involving EU companies, Communityoperations for 15% and International transactions for29%. By comparison with the period 1996–1997, therehas been a fall in the shares of National transactionsand of International operations targeting EU firms,while the share of Community operations increasedslightly. There was a particularly sharp upward turn inInternational operations with a Community bidder (i.e.acquisitions of non–EU companies by EU enterprises).Over the 1990s, these operations have followed agrowth path which is very different from that of theother types of transaction.
5. There were 1455 Community operations in 1998 and1920 in 1999. The value of these operations reached90 billion in 1998 and climbed very steeply to 420
billion in 1999. A single transaction (Vodafone Air-Touch/Mannesmann) accounted for nearly half of the1999 value. In terms of geographical breakdown, prox-imity and traditional economic links are particularlyimportant for Community mergers and acquisitions,coupled with the size of the national economies.
6. The number of International operations in 1998 was3053. This rose to 3652 in 1999, the increase being en-tirely attributable to acquisitions made by EU firmsoutside the Community. The value of internationaloperations reached 313 billion in 1998 and rose to396 billion in the following year. 1999 was an excep-
tional year as far as International operations are con-cerned. The number of extra–EU acquisitions made byEU firms in that year vastly exceeded the number of ac-quisitions made by non–EU companies within theCommunity (2221, compared to 1431). Only once be-fore, in 1995, has the number of outward transactionsbeen greater than the number of inward transactionsand then the margin was very small (1119 against1113).
7. As in the period 1996–1997, the U.S.A. heads the listof both bidders and targets for International M&A in-volving Community firms, followed by Switzerland.Norway, Australia and Canada also figure prominentlyin the ranking of both bidders and targets. The Central
and Eastern European Countries, especially Poland,account for a large and increasing proportion of extra–EU acquisitions made by EU firms. Amongst EUcountries, the U.K. accounts for by far the largestnumber of international operations, as both target andbidder.
8. Over the 1990s, the number of operations (cross–bor-der and national) in industry has shown a slight down-ward trend, while the number of transactions in the ser-vices sectors has increased considerably, particularlyin 1998–1999. Amongst the individual two–digit SICsectors, the level of activity over the period 1998–1999was highest in the business services sector, followed byreal estate and wholesale distribution. M&A activity inbusiness services more than doubled in 1998–1999,compared to the previous two years.
9. A comparison with the U.S.A. shows remarkable simi-larities in the trends, sectoral structure and geographicorientation of M&A activity in the 1990s. These simila-rities can be attributed to a number of common un-derlying factors, such as the progressive lowering ofbarriers to international trade and rapid technologicalchange in the telecommunications and InformationTechnology sectors. In the financial services sector, thebreaking down of barriers between EU Member Stateshas been paralleled by the abolition of restrictions oninter–state banking in the U.S.A., while changes in theregulation of network industries have triggered re-structuring on both sides of the Atlantic. However, thegrowth of M&A activity in the 1990s has generally beenless strong and consistent in the EU than in the U.S.A.,although the growth rate was higher in the EU than inthe U.S.A. over the last two years.
10. 1228 operations have been notified to the Commissionunder the Merger regulation since its entry into forcein 1990. In 58 cases the Commission deemed that theoperation raised serious doubts as to its compatibilitywith the common market and undertook an in–depth(Phase 2) investigation. On completion of these inves-tigations, eleven mergers were authorised withoutconditions, eleven were forbidden and thirty–six wereauthorised subject to the fulfilment of undertakingsaimed at resolving competition problems identified bythe Commission. In 1998 and 1999, three mergers wereprohibited: two German operations in the field of digi-tal pay–TV and a merger between two U.K. tour oper-ating companies.
– 3 –
Box 1: Sources of statistical information and conventions
A variety of information sources are available to moni-tor mergers and acquisitions activity. The press plays akey role, together with other sources such as companyreports, announcements in official publications etc.Data base providers have established a network of ex-perts in several countries and devote considerable effortto collecting and cross–referencing information. Theseproviders include, for example, KPMG and SDC M&A.
There are certain differences between bases. Clearly,each provider endeavours to collect and present in-formation which is as full as possible, but the very natureof the information makes this somewhat arbitrary.Whereas major operations affecting publicly listedcompanies are often officially published and widely re-ported in the press, the large number of purchases ofsmaller or unlisted companies are more difficult to de-tect. In addition, subjective assessments are often inevi-table, e.g. as regards the date and sectoral classificationof a merger and acquisition operation. Providers mustalso make choices in defining the scope of their base:KPMG considers only cross–border operations butcovers the three main types of operation: outright ac-quisition, minority participation and joint ventures,whereas SDC M&A mainly considers acquisitions, butincludes purely domestic operations. Minimum thresh-olds are set for covering an operation. This can be a limiton turnover, transaction value, or percentage of sharestransferred.
Choices had to be made when drafting this SupplementA. Conventions were also established: they are listedbelow in italics, and apply throughout this issue unlessotherwise indicated.
We now use SDC M&A
In previous editions we used data from the AMDATAdata base of Acquisitions Monthly, which was takenover in 1998 by Thomson Financial Securities. SinceAMDATA was discontinued, we now use Thomson’sSDC data base. This base is very comprehensive. Itcovers all acquisitions of shareholdings of 5% or moreand with a value over US$1 million or an unknownvalue. The main differences between SDC and AMDA-TA are that the former has a more complete coverage ofdomestic transactions and operations in the service sec-tor. As a result, the average annual number of transac-tions involving EU companies is about 27% greater inthe SDC data base than in AMDATA and year–to–yearfluctuations are somewhat less marked in percentageterms, although they follow a similar pattern.
We take account of both completed and pending deals
Most pending deals are eventually completed but it issometimes difficult to obtain confirmation of comple-tion. The exclusion of pending deals would therefore
lead to some underestimation. In order to reduce themargin of error, we include pending deals in the data.
We consider only operations resulting in the change ofcontrol of an enterprise.
We equate change of control of an enterprise withmergers and acquisitions (M&A). Acquisitions of ma-jority holdings, which are clearly identified in SDCM&A, usually confer control. We include both mergersand acquisitions in this type of operation. Mergers arenot considered as a separate category, although theyconsist of two equal partners getting together and makethe distinction between purchaser and target enterprisedevoid of meaning.
We consider the target’s main activity.
Companies, and not only large conglomerates, are oftentoo diversified to be classified in a single sector. We usethe classification by main sector as proposed by the database. In general, as the target is smaller than the bidder,its main activity is usually better defined, and that activ-ity is probably the one which interests the bidder. That istherefore the sector in which the effects of an M&A willbe the greatest. The sectoral classification used by SDCM&A is an old version of the U.S. Standard IndustrialClassification (SIC). The numbering and, in some re-spects, the grouping of sectors differs from both theCommunity’s NACE classification and the U.N.’s ISICsystem.
– 4 –
PART A: TRENDS SINCE 1990
1. Total number of operations
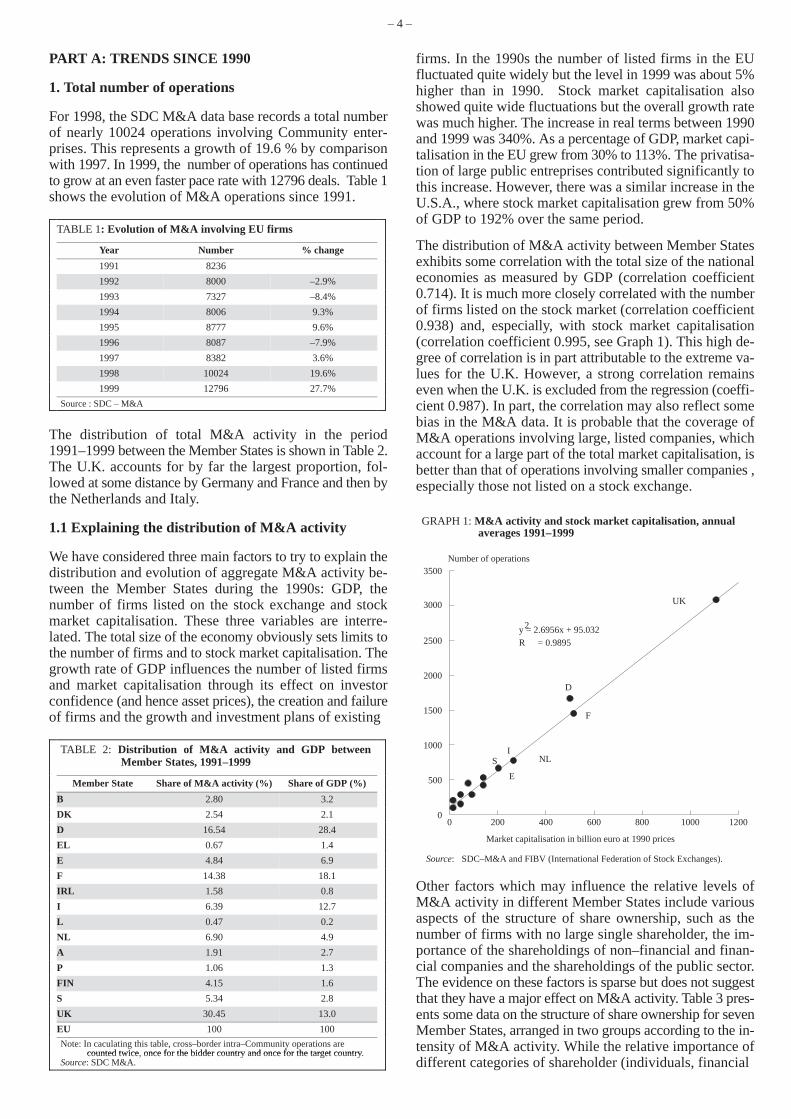
For 1998, the SDC M&A data base records a total numberof nearly 10024 operations involving Community enter-prises. This represents a growth of 19.6 % by comparisonwith 1997. In 1999, the number of operations has continuedto grow at an even faster pace rate with 12796 deals. Table 1shows the evolution of M&A operations since 1991.
TABLE 1: Evolution of M&A involving EU firms
Year Number % change
1991 8236
1992 8000 –2.9%
1993 7327 –8.4%
1994 8006 9.3%
1995 8777 9.6%
1996 8087 –7.9%
1997 8382 3.6%
1998 10024 19.6%
1999 12796 27.7%
Source : SDC – M&A
The distribution of total M&A activity in the period1991–1999 between the Member States is shown in Table 2.The U.K. accounts for by far the largest proportion, fol-lowed at some distance by Germany and France and then bythe Netherlands and Italy.
1.1 Explaining the distribution of M&A activity
We have considered three main factors to try to explain thedistribution and evolution of aggregate M&A activity be-tween the Member States during the 1990s: GDP, thenumber of firms listed on the stock exchange and stockmarket capitalisation. These three variables are interre-lated. The total size of the economy obviously sets limits tothe number of firms and to stock market capitalisation. Thegrowth rate of GDP influences the number of listed firmsand market capitalisation through its effect on investorconfidence (and hence asset prices), the creation and failureof firms and the growth and investment plans of existing
TABLE 2: Distribution of M&A activity and GDP betweenMember States, 1991–1999
Member State Share of M&A activity (%) Share of GDP (%)
B 2.80 3.2
DK 2.54 2.1
D 16.54 28.4
EL 0.67 1.4
E 4.84 6.9
F 14.38 18.1
IRL 1.58 0.8
I 6.39 12.7
L 0.47 0.2
NL 6.90 4.9
A 1.91 2.7
P 1.06 1.3
FIN 4.15 1.6
S 5.34 2.8
UK 30.45 13.0
EU 100 100
Note: In caculating this table, cross–border intra–Community operations arecounted twice once for the bidder country and once for the target countrycounted twice, once for the bidder country and once for the target country.
Source: SDC M&A.
firms. In the 1990s the number of listed firms in the EUfluctuated quite widely but the level in 1999 was about 5%higher than in 1990. Stock market capitalisation alsoshowed quite wide fluctuations but the overall growth ratewas much higher. The increase in real terms between 1990and 1999 was 340%. As a percentage of GDP, market capi-talisation in the EU grew from 30% to 113%. The privatisa-tion of large public entreprises contributed significantly tothis increase. However, there was a similar increase in theU.S.A., where stock market capitalisation grew from 50%of GDP to 192% over the same period.
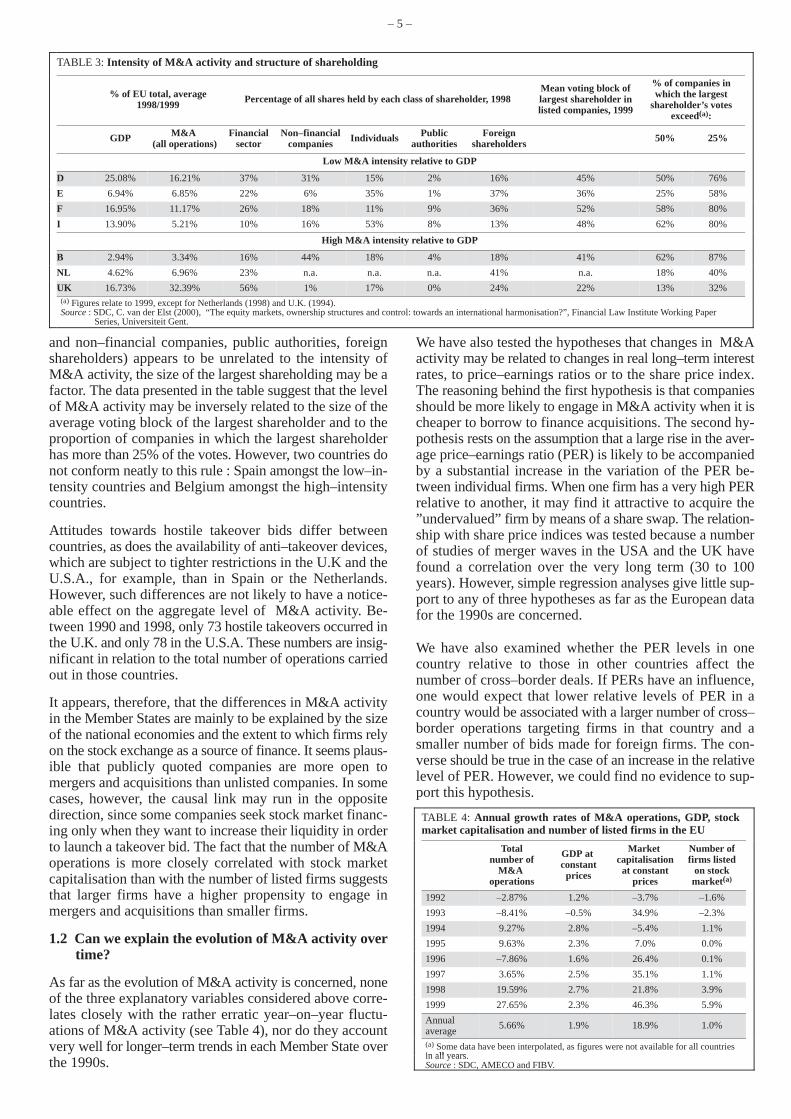
The distribution of M&A activity between Member Statesexhibits some correlation with the total size of the nationaleconomies as measured by GDP (correlation coefficient0.714). It is much more closely correlated with the numberof firms listed on the stock market (correlation coefficient0.938) and, especially, with stock market capitalisation(correlation coefficient 0.995, see Graph 1). This high de-gree of correlation is in part attributable to the extreme va-lues for the U.K. However, a strong correlation remainseven when the U.K. is excluded from the regression (coeffi-cient 0.987). In part, the correlation may also reflect somebias in the M&A data. It is probable that the coverage ofM&A operations involving large, listed companies, whichaccount for a large part of the total market capitalisation, isbetter than that of operations involving smaller companies ,especially those not listed on a stock exchange.
GRAPH 1: M&A activity and stock market capitalisation, annualaverages 1991–1999
Source: SDC–M&A and FIBV (International Federation of Stock Exchanges).
Number of operations
Market capitalisation in billion euro at 1990 prices
y = 2.6956x + 95.032R = 0.9895
0 200 400 600 800 1000 12000
500
1000
1500
2000
2500
3000
3500
UK
D
F
NLI
2
E
S
Other factors which may influence the relative levels ofM&A activity in different Member States include variousaspects of the structure of share ownership, such as thenumber of firms with no large single shareholder, the im-portance of the shareholdings of non–financial and finan-cial companies and the shareholdings of the public sector.The evidence on these factors is sparse but does not suggestthat they have a major effect on M&A activity. Table 3 pres-ents some data on the structure of share ownership for sevenMember States, arranged in two groups according to the in-tensity of M&A activity. While the relative importance ofdifferent categories of shareholder (individuals, financial
– 5 –
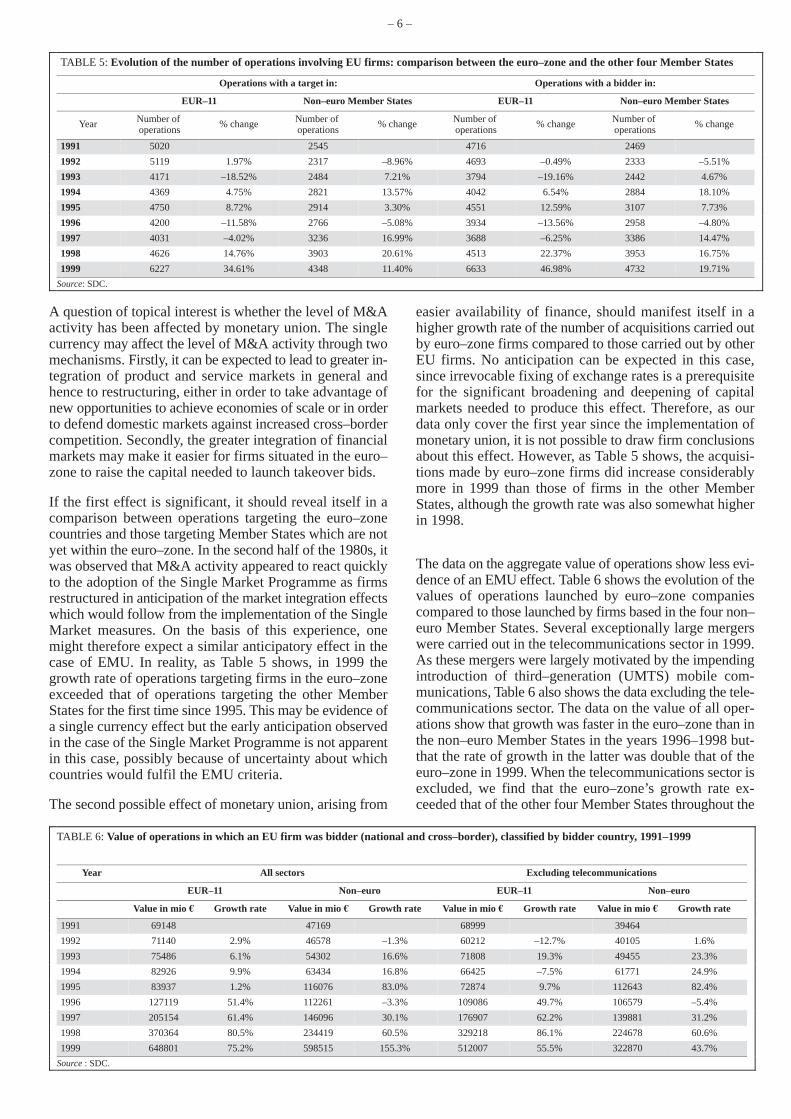
TABLE 3: Intensity of M&A activity and structure of shareholding
% of EU total, average1998/1999
Percentage of all shares held by each class of shareholder, 1998Mean voting block oflargest shareholder inlisted companies, 1999
% of companies inwhich the largest
shareholder’s votesexceed(a):
GDP M&A (all operations)
Financialsector
Non–financialcompanies
Individuals Publicauthorities
Foreignshareholders
50% 25%
Low M&A intensity relative to GDP
D 25.08% 16.21% 37% 31% 15% 2% 16% 45% 50% 76%
E 6.94% 6.85% 22% 6% 35% 1% 37% 36% 25% 58%
F 16.95% 11.17% 26% 18% 11% 9% 36% 52% 58% 80%
I 13.90% 5.21% 10% 16% 53% 8% 13% 48% 62% 80%
High M&A intensity relative to GDP
B 2.94% 3.34% 16% 44% 18% 4% 18% 41% 62% 87%
NL 4.62% 6.96% 23% n.a. n.a. n.a. 41% n.a. 18% 40%
UK 16.73% 32.39% 56% 1% 17% 0% 24% 22% 13% 32%(a) Figures relate to 1999, except for Netherlands (1998) and U.K. (1994).Source : SDC, C. van der Elst (2000), “The equity markets, ownership structures and control: towards an international harmonisation?”, Financial Law Institute Working Paper
Series, Universiteit Gent.
and non–financial companies, public authorities, foreignshareholders) appears to be unrelated to the intensity ofM&A activity, the size of the largest shareholding may be afactor. The data presented in the table suggest that the levelof M&A activity may be inversely related to the size of theaverage voting block of the largest shareholder and to theproportion of companies in which the largest shareholderhas more than 25% of the votes. However, two countries donot conform neatly to this rule : Spain amongst the low–in-tensity countries and Belgium amongst the high–intensitycountries.
Attitudes towards hostile takeover bids differ betweencountries, as does the availability of anti–takeover devices,which are subject to tighter restrictions in the U.K and theU.S.A., for example, than in Spain or the Netherlands.However, such differences are not likely to have a notice-able effect on the aggregate level of M&A activity. Be-tween 1990 and 1998, only 73 hostile takeovers occurred inthe U.K. and only 78 in the U.S.A. These numbers are insig-nificant in relation to the total number of operations carriedout in those countries.
It appears, therefore, that the differences in M&A activityin the Member States are mainly to be explained by the sizeof the national economies and the extent to which firms relyon the stock exchange as a source of finance. It seems plaus-ible that publicly quoted companies are more open tomergers and acquisitions than unlisted companies. In somecases, however, the causal link may run in the oppositedirection, since some companies seek stock market financ-ing only when they want to increase their liquidity in orderto launch a takeover bid. The fact that the number of M&Aoperations is more closely correlated with stock marketcapitalisation than with the number of listed firms suggeststhat larger firms have a higher propensity to engage inmergers and acquisitions than smaller firms.
1.2 Can we explain the evolution of M&A activity overtime?
As far as the evolution of M&A activity is concerned, noneof the three explanatory variables considered above corre-lates closely with the rather erratic year–on–year fluctu-ations of M&A activity (see Table 4), nor do they accountvery well for longer–term trends in each Member State overthe 1990s.
We have also tested the hypotheses that changes in M&Aactivity may be related to changes in real long–term interestrates, to price–earnings ratios or to the share price index.The reasoning behind the first hypothesis is that companiesshould be more likely to engage in M&A activity when it ischeaper to borrow to finance acquisitions. The second hy-pothesis rests on the assumption that a large rise in the aver-age price–earnings ratio (PER) is likely to be accompaniedby a substantial increase in the variation of the PER be-tween individual firms. When one firm has a very high PERrelative to another, it may find it attractive to acquire the”undervalued” firm by means of a share swap. The relation-ship with share price indices was tested because a numberof studies of merger waves in the USA and the UK havefound a correlation over the very long term (30 to 100years). However, simple regression analyses give little sup-port to any of three hypotheses as far as the European datafor the 1990s are concerned.
We have also examined whether the PER levels in onecountry relative to those in other countries affect thenumber of cross–border deals. If PERs have an influence,one would expect that lower relative levels of PER in acountry would be associated with a larger number of cross–border operations targeting firms in that country and asmaller number of bids made for foreign firms. The con-verse should be true in the case of an increase in the relativelevel of PER. However, we could find no evidence to sup-port this hypothesis.
TABLE 4: Annual growth rates of M&A operations, GDP, stockmarket capitalisation and number of listed firms in the EU
Totalnumber of
M&A operations
GDP at constantprices
Market capitalisationat constant
prices
Number offirms listed
on stockmarket(a)
1992 –2.87% 1.2% –3.7% –1.6%
1993 –8.41% –0.5% 34.9% –2.3%
1994 9.27% 2.8% –5.4% 1.1%
1995 9.63% 2.3% 7.0% 0.0%
1996 –7.86% 1.6% 26.4% 0.1%
1997 3.65% 2.5% 35.1% 1.1%
1998 19.59% 2.7% 21.8% 3.9%
1999 27.65% 2.3% 46.3% 5.9%
Annual average
5.66% 1.9% 18.9% 1.0%
(a) Some data have been interpolated, as figures were not available for all countriesin all years
p , gin all years.Source : SDC, AMECO and FIBV.
– 6 –
TABLE 5: Evolution of the number of operations involving EU firms: comparison between the euro–zone and the other four Member States
Operations with a target in: Operations with a bidder in:
EUR–11 Non–euro Member States EUR–11 Non–euro Member States
Year Number of operations
% change Number of operations
% change Number of operations
% change Number of operations
% change
1991 5020 2545 4716 2469
1992 5119 1.97% 2317 –8.96% 4693 –0.49% 2333 –5.51%
1993 4171 –18.52% 2484 7.21% 3794 –19.16% 2442 4.67%
1994 4369 4.75% 2821 13.57% 4042 6.54% 2884 18.10%
1995 4750 8.72% 2914 3.30% 4551 12.59% 3107 7.73%
1996 4200 –11.58% 2766 –5.08% 3934 –13.56% 2958 –4.80%
1997 4031 –4.02% 3236 16.99% 3688 –6.25% 3386 14.47%
1998 4626 14.76% 3903 20.61% 4513 22.37% 3953 16.75%
1999 6227 34.61% 4348 11.40% 6633 46.98% 4732 19.71%
Source: SDC.
A question of topical interest is whether the level of M&Aactivity has been affected by monetary union. The singlecurrency may affect the level of M&A activity through twomechanisms. Firstly, it can be expected to lead to greater in-tegration of product and service markets in general andhence to restructuring, either in order to take advantage ofnew opportunities to achieve economies of scale or in orderto defend domestic markets against increased cross–bordercompetition. Secondly, the greater integration of financialmarkets may make it easier for firms situated in the euro–zone to raise the capital needed to launch takeover bids.
If the first effect is significant, it should reveal itself in acomparison between operations targeting the euro–zonecountries and those targeting Member States which are notyet within the euro–zone. In the second half of the 1980s, itwas observed that M&A activity appeared to react quicklyto the adoption of the Single Market Programme as firmsrestructured in anticipation of the market integration effectswhich would follow from the implementation of the SingleMarket measures. On the basis of this experience, onemight therefore expect a similar anticipatory effect in thecase of EMU. In reality, as Table 5 shows, in 1999 thegrowth rate of operations targeting firms in the euro–zoneexceeded that of operations targeting the other MemberStates for the first time since 1995. This may be evidence ofa single currency effect but the early anticipation observedin the case of the Single Market Programme is not apparentin this case, possibly because of uncertainty about whichcountries would fulfil the EMU criteria.
The second possible effect of monetary union, arising from
easier availability of finance, should manifest itself in ahigher growth rate of the number of acquisitions carried outby euro–zone firms compared to those carried out by otherEU firms. No anticipation can be expected in this case,since irrevocable fixing of exchange rates is a prerequisitefor the significant broadening and deepening of capitalmarkets needed to produce this effect. Therefore, as ourdata only cover the first year since the implementation ofmonetary union, it is not possible to draw firm conclusionsabout this effect. However, as Table 5 shows, the acquisi-tions made by euro–zone firms did increase considerablymore in 1999 than those of firms in the other MemberStates, although the growth rate was also somewhat higherin 1998.
The data on the aggregate value of operations show less evi-dence of an EMU effect. Table 6 shows the evolution of thevalues of operations launched by euro–zone companiescompared to those launched by firms based in the four non–euro Member States. Several exceptionally large mergerswere carried out in the telecommunications sector in 1999.As these mergers were largely motivated by the impendingintroduction of third–generation (UMTS) mobile com-munications, Table 6 also shows the data excluding the tele-communications sector. The data on the value of all oper-ations show that growth was faster in the euro–zone than inthe non–euro Member States in the years 1996–1998 but-that the rate of growth in the latter was double that of theeuro–zone in 1999. When the telecommunications sector isexcluded, we find that the euro–zone’s growth rate ex-ceeded that of the other four Member States throughout the
TABLE 6: Value of operations in which an EU firm was bidder (national and cross–border), classified by bidder country, 1991–1999
Year All sectors Excluding telecommunications
EUR–11 Non–euro EUR–11 Non–euro
Value in mio Growth rate Value in mio Growth rate Value in mio Growth rate Value in mio Growth rate
1991 69148 47169 68999 39464
1992 71140 2.9% 46578 –1.3% 60212 –12.7% 40105 1.6%
1993 75486 6.1% 54302 16.6% 71808 19.3% 49455 23.3%
1994 82926 9.9% 63434 16.8% 66425 –7.5% 61771 24.9%
1995 83937 1.2% 116076 83.0% 72874 9.7% 112643 82.4%
1996 127119 51.4% 112261 –3.3% 109086 49.7% 106579 –5.4%
1997 205154 61.4% 146096 30.1% 176907 62.2% 139881 31.2%
1998 370364 80.5% 234419 60.5% 329218 86.1% 224678 60.6%
1999 648801 75.2% 598515 155.3% 512007 55.5% 322870 43.7%
Source : SDC.
– 7 –
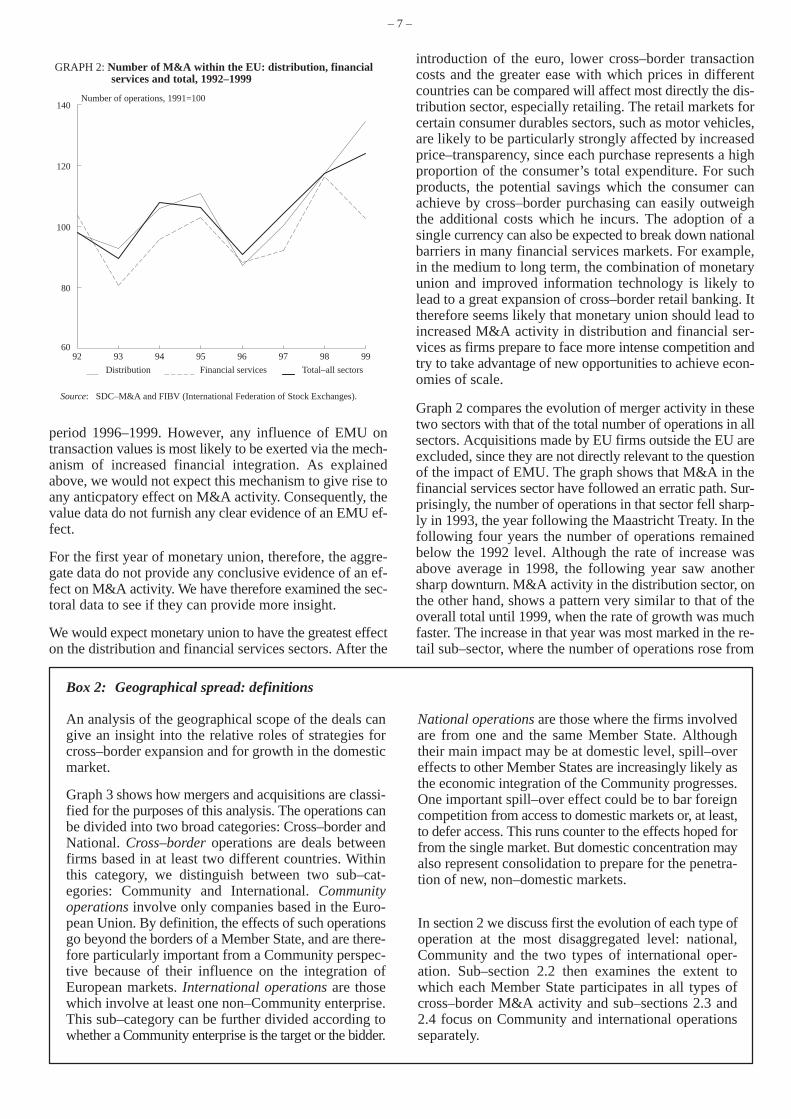
GRAPH 2: Number of M&A within the EU: distribution, financialservices and total, 1992–1999
Source: SDC–M&A and FIBV (International Federation of Stock Exchanges).
Number of operations, 1991=100
Distribution Financial services Total–all sectors
92 93 94 95 96 97 98 9960
80
100
120
140
period 1996–1999. However, any influence of EMU ontransaction values is most likely to be exerted via the mech-anism of increased financial integration. As explainedabove, we would not expect this mechanism to give rise toany anticpatory effect on M&A activity. Consequently, thevalue data do not furnish any clear evidence of an EMU ef-fect.
For the first year of monetary union, therefore, the aggre-gate data do not provide any conclusive evidence of an ef-fect on M&A activity. We have therefore examined the sec-toral data to see if they can provide more insight.
We would expect monetary union to have the greatest effecton the distribution and financial services sectors. After the
introduction of the euro, lower cross–border transactioncosts and the greater ease with which prices in differentcountries can be compared will affect most directly the dis-tribution sector, especially retailing. The retail markets forcertain consumer durables sectors, such as motor vehicles,are likely to be particularly strongly affected by increasedprice–transparency, since each purchase represents a highproportion of the consumer’s total expenditure. For suchproducts, the potential savings which the consumer canachieve by cross–border purchasing can easily outweighthe additional costs which he incurs. The adoption of asingle currency can also be expected to break down nationalbarriers in many financial services markets. For example,in the medium to long term, the combination of monetaryunion and improved information technology is likely tolead to a great expansion of cross–border retail banking. Ittherefore seems likely that monetary union should lead toincreased M&A activity in distribution and financial ser-vices as firms prepare to face more intense competition andtry to take advantage of new opportunities to achieve econ-omies of scale.
Graph 2 compares the evolution of merger activity in thesetwo sectors with that of the total number of operations in allsectors. Acquisitions made by EU firms outside the EU areexcluded, since they are not directly relevant to the questionof the impact of EMU. The graph shows that M&A in thefinancial services sector have followed an erratic path. Sur-prisingly, the number of operations in that sector fell sharp-ly in 1993, the year following the Maastricht Treaty. In thefollowing four years the number of operations remainedbelow the 1992 level. Although the rate of increase wasabove average in 1998, the following year saw anothersharp downturn. M&A activity in the distribution sector, onthe other hand, shows a pattern very similar to that of theoverall total until 1999, when the rate of growth was muchfaster. The increase in that year was most marked in the re-tail sub–sector, where the number of operations rose from
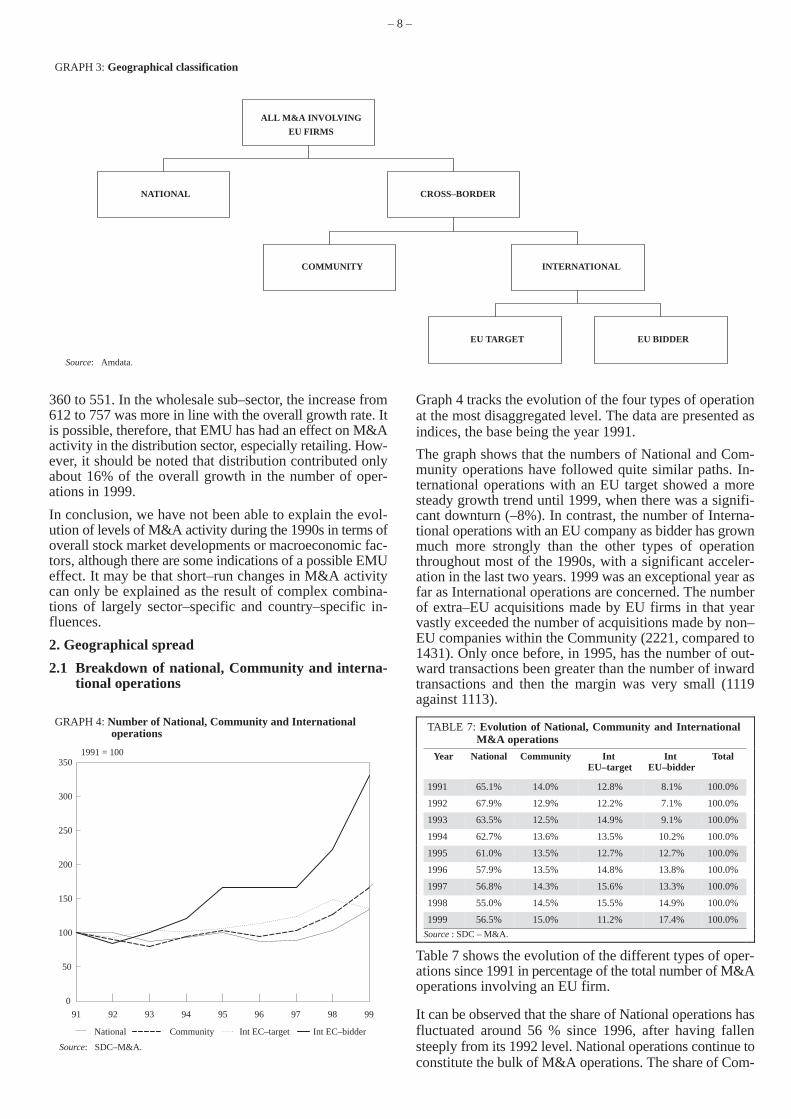
Box 2: Geographical spread: definitions
An analysis of the geographical scope of the deals cangive an insight into the relative roles of strategies forcross–border expansion and for growth in the domesticmarket.
Graph 3 shows how mergers and acquisitions are classi-fied for the purposes of this analysis. The operations canbe divided into two broad categories: Cross–border andNational. Cross–border operations are deals betweenfirms based in at least two different countries. Withinthis category, we distinguish between two sub–cat-egories: Community and International. Communityoperations involve only companies based in the Euro-pean Union. By definition, the effects of such operationsgo beyond the borders of a Member State, and are there-fore particularly important from a Community perspec-tive because of their influence on the integration ofEuropean markets. International operations are thosewhich involve at least one non–Community enterprise.This sub–category can be further divided according towhether a Community enterprise is the target or the bidder.
National operations are those where the firms involvedare from one and the same Member State. Althoughtheir main impact may be at domestic level, spill–overeffects to other Member States are increasingly likely asthe economic integration of the Community progresses.One important spill–over effect could be to bar foreigncompetition from access to domestic markets or, at least,to defer access. This runs counter to the effects hoped forfrom the single market. But domestic concentration mayalso represent consolidation to prepare for the penetra-tion of new, non–domestic markets.
In section 2 we discuss first the evolution of each type ofoperation at the most disaggregated level: national,Community and the two types of international oper-ation. Sub–section 2.2 then examines the extent towhich each Member State participates in all types ofcross–border M&A activity and sub–sections 2.3 and2.4 focus on Community and international operationsseparately.
– 8 –
GRAPH 3: Geographical classification
Source: Amdata.
ALL M&A INVOLVING
EU FIRMS
NATIONAL CROSS–BORDER
COMMUNITY INTERNATIONAL
EU TARGET EU BIDDER
360 to 551. In the wholesale sub–sector, the increase from612 to 757 was more in line with the overall growth rate. Itis possible, therefore, that EMU has had an effect on M&Aactivity in the distribution sector, especially retailing. How-ever, it should be noted that distribution contributed onlyabout 16% of the overall growth in the number of oper-ations in 1999.
In conclusion, we have not been able to explain the evol-ution of levels of M&A activity during the 1990s in terms ofoverall stock market developments or macroeconomic fac-tors, although there are some indications of a possible EMUeffect. It may be that short–run changes in M&A activitycan only be explained as the result of complex combina-tions of largely sector–specific and country–specific in-fluences.
2. Geographical spread
2.1 Breakdown of national, Community and interna-tional operations
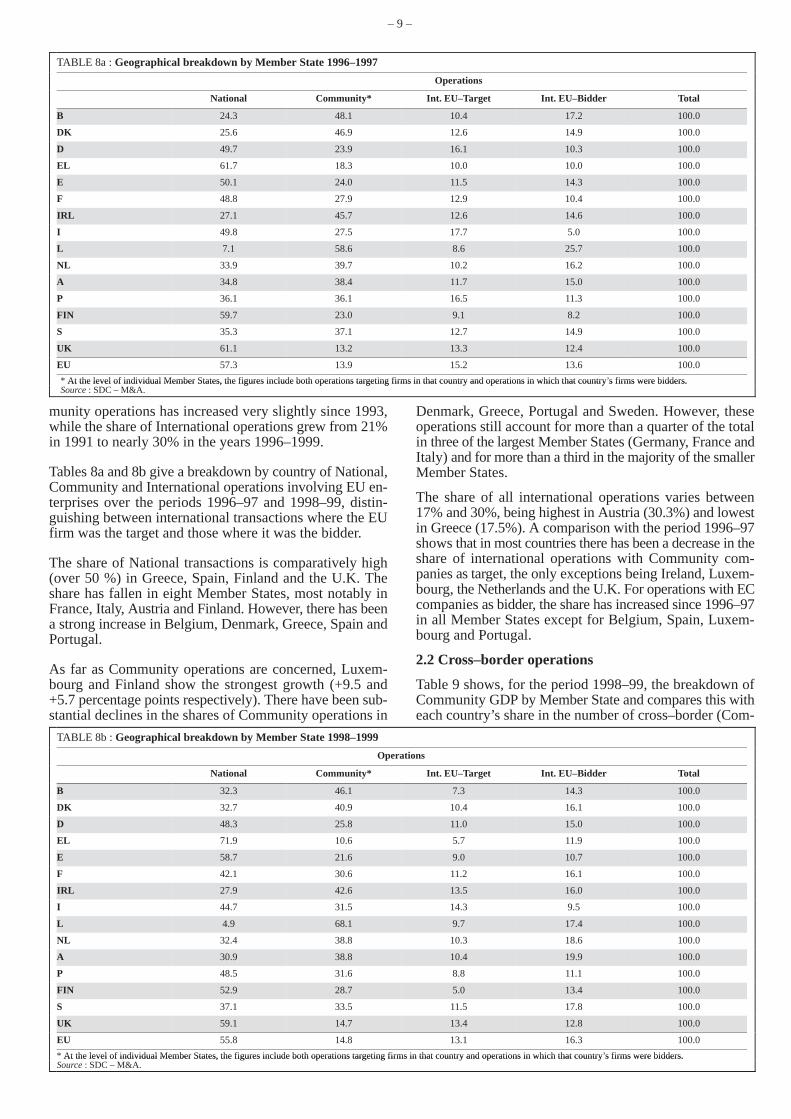
GRAPH 4: Number of National, Community and Internationaloperations
Source: SDC–M&A.
1991 = 100
91 92 93 94 95 96 97 98 99
0
50
100
150
200
250
300
350
National Community Int EC–target Int EC–bidder
Graph 4 tracks the evolution of the four types of operationat the most disaggregated level. The data are presented asindices, the base being the year 1991.
The graph shows that the numbers of National and Com-munity operations have followed quite similar paths. In-ternational operations with an EU target showed a moresteady growth trend until 1999, when there was a signifi-cant downturn (–8%). In contrast, the number of Interna-tional operations with an EU company as bidder has grownmuch more strongly than the other types of operationthroughout most of the 1990s, with a significant acceler-ation in the last two years. 1999 was an exceptional year asfar as International operations are concerned. The numberof extra–EU acquisitions made by EU firms in that yearvastly exceeded the number of acquisitions made by non–EU companies within the Community (2221, compared to1431). Only once before, in 1995, has the number of out-ward transactions been greater than the number of inwardtransactions and then the margin was very small (1119against 1113).
TABLE 7: Evolution of National, Community and InternationalM&A operations
Year National Community Int EU–target
Int EU–bidder
Total
1991 65.1% 14.0% 12.8% 8.1% 100.0%
1992 67.9% 12.9% 12.2% 7.1% 100.0%
1993 63.5% 12.5% 14.9% 9.1% 100.0%
1994 62.7% 13.6% 13.5% 10.2% 100.0%
1995 61.0% 13.5% 12.7% 12.7% 100.0%
1996 57.9% 13.5% 14.8% 13.8% 100.0%
1997 56.8% 14.3% 15.6% 13.3% 100.0%
1998 55.0% 14.5% 15.5% 14.9% 100.0%
1999 56.5% 15.0% 11.2% 17.4% 100.0%
Source : SDC – M&A.
Table 7 shows the evolution of the different types of oper-ations since 1991 in percentage of the total number of M&Aoperations involving an EU firm.
It can be observed that the share of National operations hasfluctuated around 56 % since 1996, after having fallensteeply from its 1992 level. National operations continue toconstitute the bulk of M&A operations. The share of Com-
– 9 –
TABLE 8a : Geographical breakdown by Member State 1996–1997
Operations
National Community* Int. EU–Target Int. EU–Bidder Total
B 24.3 48.1 10.4 17.2 100.0
DK 25.6 46.9 12.6 14.9 100.0
D 49.7 23.9 16.1 10.3 100.0
EL 61.7 18.3 10.0 10.0 100.0
E 50.1 24.0 11.5 14.3 100.0
F 48.8 27.9 12.9 10.4 100.0
IRL 27.1 45.7 12.6 14.6 100.0
I 49.8 27.5 17.7 5.0 100.0
L 7.1 58.6 8.6 25.7 100.0
NL 33.9 39.7 10.2 16.2 100.0
A 34.8 38.4 11.7 15.0 100.0
P 36.1 36.1 16.5 11.3 100.0
FIN 59.7 23.0 9.1 8.2 100.0
S 35.3 37.1 12.7 14.9 100.0
UK 61.1 13.2 13.3 12.4 100.0
EU 57.3 13.9 15.2 13.6 100.0
* At the level of individual Member States, the figures include both operations targeting firms in that country and operations in which that country’s firms were bidders.* At the level of individual Member States, the figures include both operations targeting firms in that country and operations in which that country s firms were bidders.Source : SDC – M&A.
munity operations has increased very slightly since 1993,while the share of International operations grew from 21%in 1991 to nearly 30% in the years 1996–1999.
Tables 8a and 8b give a breakdown by country of National,Community and International operations involving EU en-terprises over the periods 1996–97 and 1998–99, distin-guishing between international transactions where the EUfirm was the target and those where it was the bidder.
The share of National transactions is comparatively high(over 50 %) in Greece, Spain, Finland and the U.K. Theshare has fallen in eight Member States, most notably inFrance, Italy, Austria and Finland. However, there has beena strong increase in Belgium, Denmark, Greece, Spain andPortugal.
As far as Community operations are concerned, Luxem-bourg and Finland show the strongest growth (+9.5 and+5.7 percentage points respectively). There have been sub-stantial declines in the shares of Community operations in
Denmark, Greece, Portugal and Sweden. However, theseoperations still account for more than a quarter of the totalin three of the largest Member States (Germany, France andItaly) and for more than a third in the majority of the smallerMember States.
The share of all international operations varies between17% and 30%, being highest in Austria (30.3%) and lowestin Greece (17.5%). A comparison with the period 1996–97shows that in most countries there has been a decrease in theshare of international operations with Community com-panies as target, the only exceptions being Ireland, Luxem-bourg, the Netherlands and the U.K. For operations with ECcompanies as bidder, the share has increased since 1996–97in all Member States except for Belgium, Spain, Luxem-bourg and Portugal.
2.2 Cross–border operations
Table 9 shows, for the period 1998–99, the breakdown ofCommunity GDP by Member State and compares this witheach country’s share in the number of cross–border (Com-
TABLE 8b : Geographical breakdown by Member State 1998–1999
Operations
National Community* Int. EU–Target Int. EU–Bidder Total
B 32.3 46.1 7.3 14.3 100.0
DK 32.7 40.9 10.4 16.1 100.0
D 48.3 25.8 11.0 15.0 100.0
EL 71.9 10.6 5.7 11.9 100.0
E 58.7 21.6 9.0 10.7 100.0
F 42.1 30.6 11.2 16.1 100.0
IRL 27.9 42.6 13.5 16.0 100.0
I 44.7 31.5 14.3 9.5 100.0
L 4.9 68.1 9.7 17.4 100.0
NL 32.4 38.8 10.3 18.6 100.0
A 30.9 38.8 10.4 19.9 100.0
P 48.5 31.6 8.8 11.1 100.0
FIN 52.9 28.7 5.0 13.4 100.0
S 37.1 33.5 11.5 17.8 100.0
UK 59.1 14.7 13.4 12.8 100.0
EU 55.8 14.8 13.1 16.3 100.0
* At the level of individual Member States, the figures include both operations targeting firms in that country and operations in which that country’s firms were bidders.* At the level of individual Member States, the figures include both operations targeting firms in that country and operations in which that country s firms were bidders.Source : SDC – M&A.
– 10 –
TABLE 9: Breakdown by Member State of cross–border M&A operations (1998–1999) and GDP (1998)
Target Bidder T+B GDP T/GDP B/GDP T+B/GDP
B 3.91 4.88 4.43 2.95 1.33 1.66 1.50
DK 2.70 3.11 2.92 2.04 1.32 1.52 1.43
D 15.92 16.71 16.34 25.31 0.63 0.66 0.65
EL 0.69 0.92 0.81 1.43 0.48 0.64 0.57
E 7.29 3.88 5.48 6.85 1.06 0.57 0.80
F 13.14 12.09 12.58 17.03 0.77 0.71 0.74
IRL 2.07 2.70 2.40 1.00 2.08 2.70 2.41
I 7.40 3.99 5.59 14.01 0.53 0.28 0.40
L 0.83 1.18 1.02 0.22 3.86 5.47 4.72
NL 7.40 10.73 9.17 4.60 1.61 2.33 1.99
A 2.70 2.17 2.42 2.48 1.09 0.87 0.97
P 1.71 0.93 1.30 1.29 1.33 0.72 1.01
FIN 2.66 3.34 3.02 1.51 1.76 2.21 2.00
S 5.96 7.51 6.78 2.79 2.13 2.69 2.43
UK 25.61 25.88 25.75 16.49 1.55 1.57 1.56
EU 100 100 100 100
Source : SDC – M&A, Ameco.
munity and international) operations, distinguishing be-tween the country of the target enterprises and the countryof the purchasers. As an index of the relative intensity ofcross–border merger activity, we use the ratio of eachcountry’s share in the number of cross–border transactionsto its share of Community GDP.
In the smaller northern Member States and in the U.K.,shares of total cross–border M&A activity are higher thanmight be expected from the relative sizes of the nationaleconomies. Germany, France, Austria and the southernMember States (with the exception of Portugal) show alower intensity of M&A activity. Italy, Greece and Ger-many present the lowest ratios of 0.40, 0.57 and 0.65 re-spectively.
Considering the Member States as target countries, the ratioof cross–border transactions to GDP is highest for Luxem-bourg (3.86), Sweden (2.13) and Ireland (2.08). Belgium,Denmark, Spain, the Netherlands, Austria, Portugal, Fin-land and UK are in the same range (from 1 to 1.8). Thelowest ratios are those for Greece (0.48), Italy (0.53), Ger-many (0.63) and France (0.77).
When the Member States are considered as purchasercountries, the disparities are much greater and Luxem-bourg occupies the first place with 5.47, followed by Ire-land and Sweden with 2.7. The other countries with highratios are: the Netherlands (2.33), Finland (2.21), Belgium,Denmark and the U.K. with ratios between 1.5 and 1.7.Once again, Germany, Greece, France and Italy appearamongst the countries with low ratios, together with Spain,Austria and Portugal.
2.3 Community operations
2.3.1 Number of Community operations
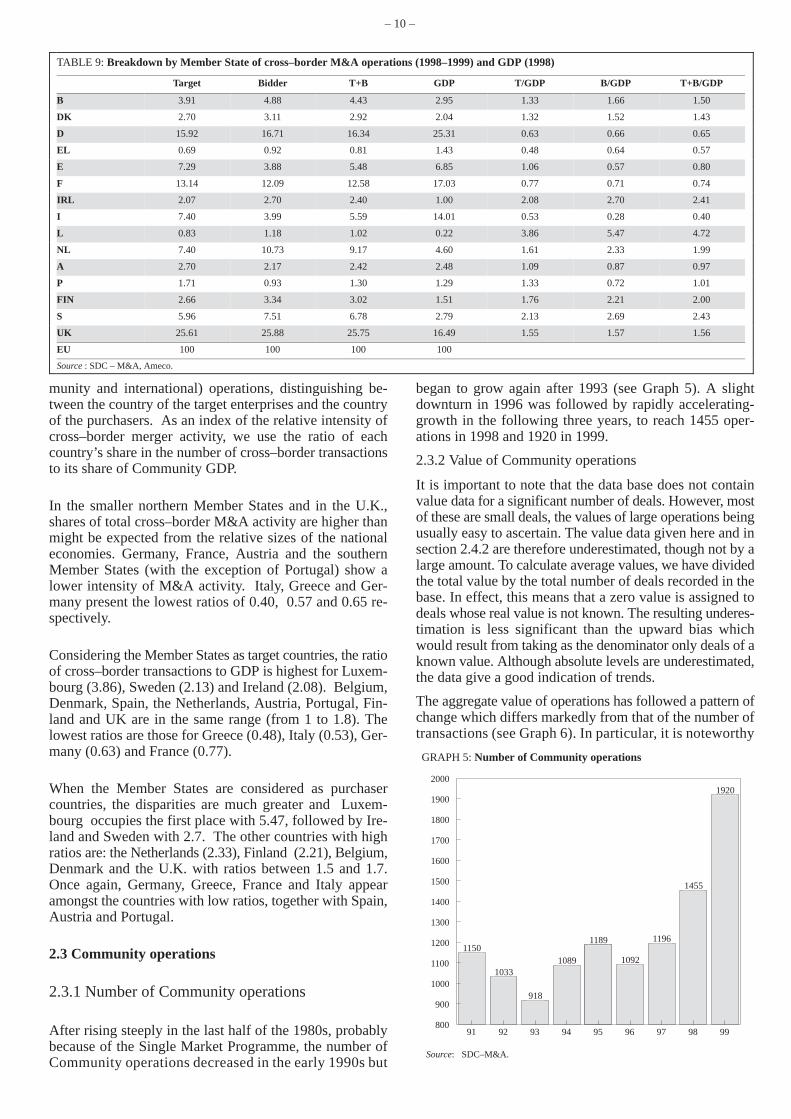
After rising steeply in the last half of the 1980s, probablybecause of the Single Market Programme, the number ofCommunity operations decreased in the early 1990s but
began to grow again after 1993 (see Graph 5). A slightdownturn in 1996 was followed by rapidly accelerating-growth in the following three years, to reach 1455 oper-ations in 1998 and 1920 in 1999.
2.3.2 Value of Community operations
It is important to note that the data base does not containvalue data for a significant number of deals. However, mostof these are small deals, the values of large operations beingusually easy to ascertain. The value data given here and insection 2.4.2 are therefore underestimated, though not by alarge amount. To calculate average values, we have dividedthe total value by the total number of deals recorded in thebase. In effect, this means that a zero value is assigned todeals whose real value is not known. The resulting underes-timation is less significant than the upward bias whichwould result from taking as the denominator only deals of aknown value. Although absolute levels are underestimated,the data give a good indication of trends.
The aggregate value of operations has followed a pattern ofchange which differs markedly from that of the number oftransactions (see Graph 6). In particular, it is noteworthy
GRAPH 5: Number of Community operations
Source: SDC–M&A.
1150
1033
918
1089
1189
1092
1196
1455
1920
91 92 93 94 95 96 97 98 99800
900
1000
1100
1200
1300
1400
1500
1600
1700
1800
1900
2000
– 11 –
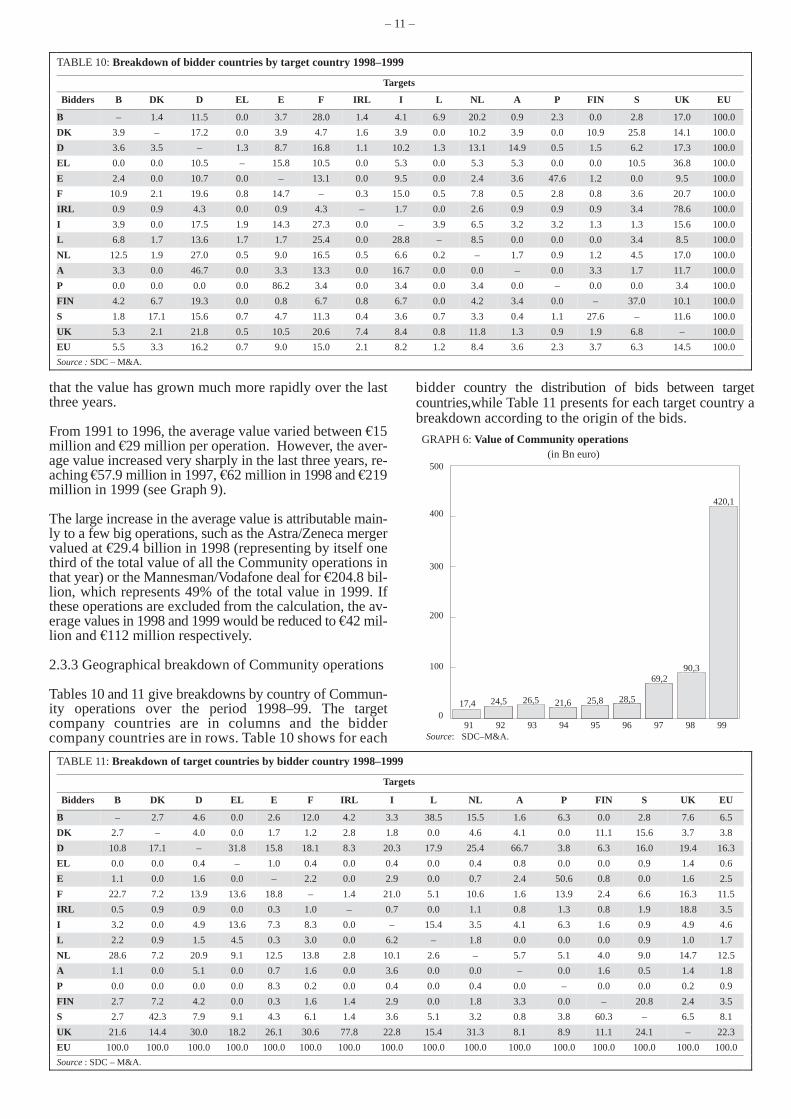
TABLE 10: Breakdown of bidder countries by target country 1998–1999
Targets
Bidders B DK D EL E F IRL I L NL A P FIN S UK EU
B – 1.4 11.5 0.0 3.7 28.0 1.4 4.1 6.9 20.2 0.9 2.3 0.0 2.8 17.0 100.0
DK 3.9 – 17.2 0.0 3.9 4.7 1.6 3.9 0.0 10.2 3.9 0.0 10.9 25.8 14.1 100.0
D 3.6 3.5 – 1.3 8.7 16.8 1.1 10.2 1.3 13.1 14.9 0.5 1.5 6.2 17.3 100.0
EL 0.0 0.0 10.5 – 15.8 10.5 0.0 5.3 0.0 5.3 5.3 0.0 0.0 10.5 36.8 100.0
E 2.4 0.0 10.7 0.0 – 13.1 0.0 9.5 0.0 2.4 3.6 47.6 1.2 0.0 9.5 100.0
F 10.9 2.1 19.6 0.8 14.7 – 0.3 15.0 0.5 7.8 0.5 2.8 0.8 3.6 20.7 100.0
IRL 0.9 0.9 4.3 0.0 0.9 4.3 – 1.7 0.0 2.6 0.9 0.9 0.9 3.4 78.6 100.0
I 3.9 0.0 17.5 1.9 14.3 27.3 0.0 – 3.9 6.5 3.2 3.2 1.3 1.3 15.6 100.0
L 6.8 1.7 13.6 1.7 1.7 25.4 0.0 28.8 – 8.5 0.0 0.0 0.0 3.4 8.5 100.0
NL 12.5 1.9 27.0 0.5 9.0 16.5 0.5 6.6 0.2 – 1.7 0.9 1.2 4.5 17.0 100.0
A 3.3 0.0 46.7 0.0 3.3 13.3 0.0 16.7 0.0 0.0 – 0.0 3.3 1.7 11.7 100.0
P 0.0 0.0 0.0 0.0 86.2 3.4 0.0 3.4 0.0 3.4 0.0 – 0.0 0.0 3.4 100.0
FIN 4.2 6.7 19.3 0.0 0.8 6.7 0.8 6.7 0.0 4.2 3.4 0.0 – 37.0 10.1 100.0
S 1.8 17.1 15.6 0.7 4.7 11.3 0.4 3.6 0.7 3.3 0.4 1.1 27.6 – 11.6 100.0
UK 5.3 2.1 21.8 0.5 10.5 20.6 7.4 8.4 0.8 11.8 1.3 0.9 1.9 6.8 – 100.0
EU 5.5 3.3 16.2 0.7 9.0 15.0 2.1 8.2 1.2 8.4 3.6 2.3 3.7 6.3 14.5 100.0
Source : SDC – M&A.
that the value has grown much more rapidly over the lastthree years.
From 1991 to 1996, the average value varied between 15million and 29 million per operation. However, the aver-age value increased very sharply in the last three years, re-aching 57.9 million in 1997, 62 million in 1998 and 219million in 1999 (see Graph 9).
The large increase in the average value is attributable main-ly to a few big operations, such as the Astra/Zeneca mergervalued at 29.4 billion in 1998 (representing by itself onethird of the total value of all the Community operations inthat year) or the Mannesman/Vodafone deal for 204.8 bil-lion, which represents 49% of the total value in 1999. Ifthese operations are excluded from the calculation, the av-erage values in 1998 and 1999 would be reduced to 42 mil-lion and 112 million respectively.
2.3.3 Geographical breakdown of Community operations
Tables 10 and 11 give breakdowns by country of Commun-ity operations over the period 1998–99. The targetcompany countries are in columns and the biddercompany countries are in rows. Table 10 shows for each
bidder country the distribution of bids between targetcountries,while Table 11 presents for each target country abreakdown according to the origin of the bids.GRAPH 6: Value of Community operations
Source: SDC–M&A.
(in Bn euro)
17,4 24,5 26,5 21,6 25,8 28,5
69,290,3
420,1
0
100
200
300
400
500
91 92 93 94 95 96 97 98 99
TABLE 11: Breakdown of target countries by bidder country 1998–1999
Targets
Bidders B DK D EL E F IRL I L NL A P FIN S UK EU
B – 2.7 4.6 0.0 2.6 12.0 4.2 3.3 38.5 15.5 1.6 6.3 0.0 2.8 7.6 6.5
DK 2.7 – 4.0 0.0 1.7 1.2 2.8 1.8 0.0 4.6 4.1 0.0 11.1 15.6 3.7 3.8
D 10.8 17.1 – 31.8 15.8 18.1 8.3 20.3 17.9 25.4 66.7 3.8 6.3 16.0 19.4 16.3
EL 0.0 0.0 0.4 – 1.0 0.4 0.0 0.4 0.0 0.4 0.8 0.0 0.0 0.9 1.4 0.6
E 1.1 0.0 1.6 0.0 – 2.2 0.0 2.9 0.0 0.7 2.4 50.6 0.8 0.0 1.6 2.5
F 22.7 7.2 13.9 13.6 18.8 – 1.4 21.0 5.1 10.6 1.6 13.9 2.4 6.6 16.3 11.5
IRL 0.5 0.9 0.9 0.0 0.3 1.0 – 0.7 0.0 1.1 0.8 1.3 0.8 1.9 18.8 3.5
I 3.2 0.0 4.9 13.6 7.3 8.3 0.0 – 15.4 3.5 4.1 6.3 1.6 0.9 4.9 4.6
L 2.2 0.9 1.5 4.5 0.3 3.0 0.0 6.2 – 1.8 0.0 0.0 0.0 0.9 1.0 1.7
NL 28.6 7.2 20.9 9.1 12.5 13.8 2.8 10.1 2.6 – 5.7 5.1 4.0 9.0 14.7 12.5
A 1.1 0.0 5.1 0.0 0.7 1.6 0.0 3.6 0.0 0.0 – 0.0 1.6 0.5 1.4 1.8
P 0.0 0.0 0.0 0.0 8.3 0.2 0.0 0.4 0.0 0.4 0.0 – 0.0 0.0 0.2 0.9
FIN 2.7 7.2 4.2 0.0 0.3 1.6 1.4 2.9 0.0 1.8 3.3 0.0 – 20.8 2.4 3.5
S 2.7 42.3 7.9 9.1 4.3 6.1 1.4 3.6 5.1 3.2 0.8 3.8 60.3 – 6.5 8.1
UK 21.6 14.4 30.0 18.2 26.1 30.6 77.8 22.8 15.4 31.3 8.1 8.9 11.1 24.1 – 22.3
EU 100.0 100.0 100.0 100.0 100.0 100.0 100.0 100.0 100.0 100.0 100.0 100.0 100.0 100.0 100.0 100.0
Source : SDC – M&A.
– 12 –
Together with the size of the economies of the countriesconcerned, proximity and traditional economic links re-main particularly important for cross–border mergers andacquisitions. For example, U.K. firms account for 79% ofcross–border acquisitions made in the Community by Irishcompanies. Conversely, 78% of Community operationstargeting Irish companies were carried out by U.K. firms.The latter percentage has increased sharply since 1996when U.K. firms accounted for less than 60% of all Com-munity operations in Ireland. A similar close relationshipexists between Sweden and Denmark. Acquisitions ofSwedish firms by Danish companies represent one quarterof Community operations launched by Danish companies,while 42 % of Community operations targeting Danishcompanies were carried out by Swedish firms. Finland andAustria are also more targeted by direct neighbours (i.e.Sweden and Germany respectively).
German companies were most often the target of Commun-ity operations (16% of the transactions). Given the size ofthe German economy this high number is unsurprising.Germany accounts for a high proportion of the acquisitionsmade by French, Italian, Dutch, Austrian and British firms.These countries also head the list of target countries foroperations launched by German companies.
France comes second as target country, with 15% of Com-munity operations. French firms were the main targets ofoperations undertaken by Belgian and Italian companiesand also accounted for a high proportion of bids made byGerman, Spanish and British firms. After the U.K., Ger-many, Italy, Spain and Belgium are the main countries of in-terest to French purchasers.
The U.K. occupies the third place amongst the targetcountries with 14.5% of the total. As noted above, Britishcompanies are particularly favoured by Irish purchasers,but they also feature in a prominent place amongst thetargets of Belgian, German, French and Dutch companies.Operations launched by U.K. firms concerned principallyGermany, France and the Netherlands.
Spain ranks fourth amongst the target countries, with 9% ofthe total, slightly ahead of the Netherlands and Italy, in spiteof the big differences in the size of the countries. Operationslaunched by Spanish firms concerned mainly Portugal,France and Germany. Operations launched by Dutch firmsconcerned mainly Germany, the UK, France and Belgium.
The four Member States whose companies make the mostcross–border bids within the Community are the U.K.(22.3%), Germany (16.3%), Netherlands (12.5%) andFrance (11.5%).
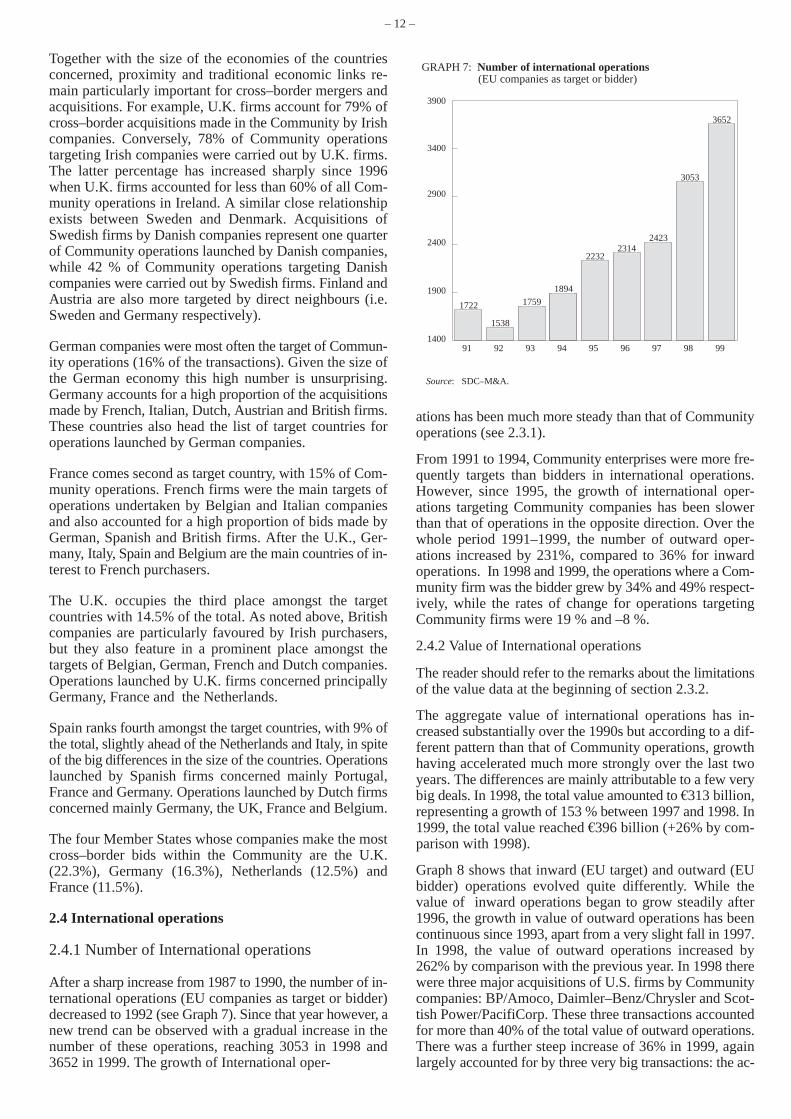
2.4 International operations
2.4.1 Number of International operations
After a sharp increase from 1987 to 1990, the number of in-ternational operations (EU companies as target or bidder)decreased to 1992 (see Graph 7). Since that year however, anew trend can be observed with a gradual increase in thenumber of these operations, reaching 3053 in 1998 and3652 in 1999. The growth of International oper-
GRAPH 7: Number of international operations (EU companies as target or bidder)
Source: SDC–M&A.
1722
1538
1759
1894
22322314
2423
3053
3652
91 92 93 94 95 96 97 98 991400
1900
2400
2900
3400
3900
ations has been much more steady than that of Communityoperations (see 2.3.1).
From 1991 to 1994, Community enterprises were more fre-quently targets than bidders in international operations.However, since 1995, the growth of international oper-ations targeting Community companies has been slowerthan that of operations in the opposite direction. Over thewhole period 1991–1999, the number of outward oper-ations increased by 231%, compared to 36% for inwardoperations. In 1998 and 1999, the operations where a Com-munity firm was the bidder grew by 34% and 49% respect-ively, while the rates of change for operations targetingCommunity firms were 19 % and –8 %.
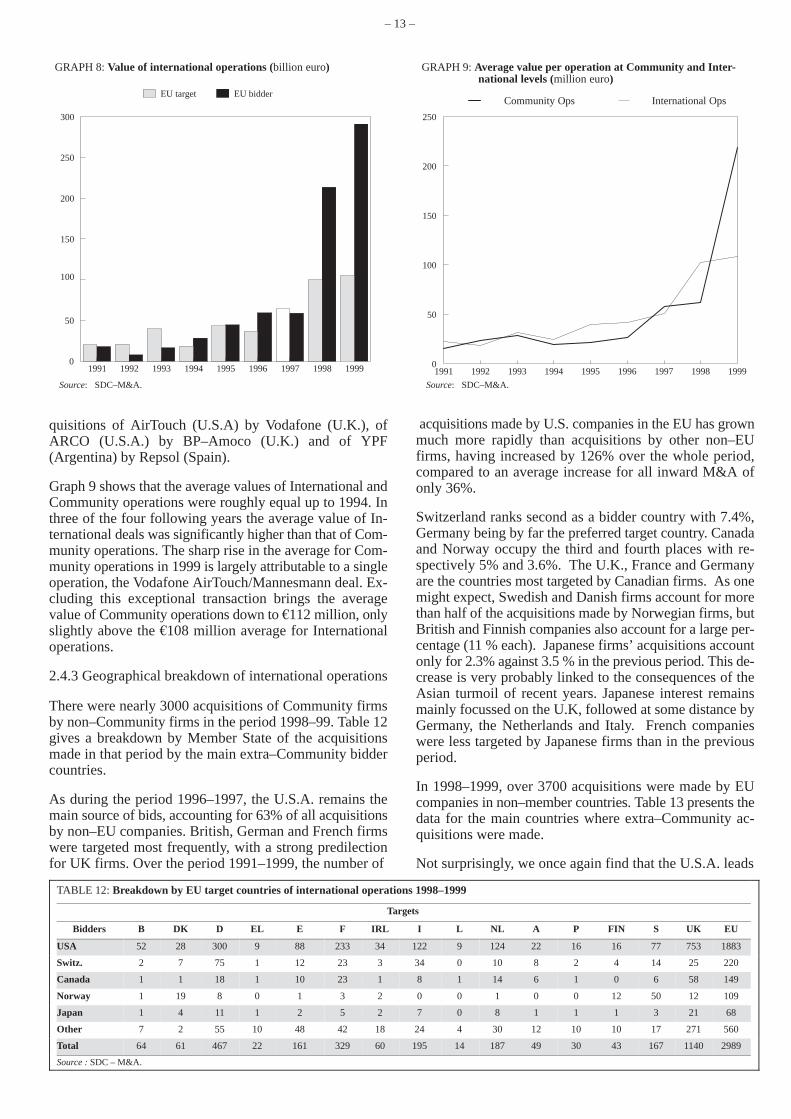
2.4.2 Value of International operations
The reader should refer to the remarks about the limitationsof the value data at the beginning of section 2.3.2.
The aggregate value of international operations has in-creased substantially over the 1990s but according to a dif-ferent pattern than that of Community operations, growthhaving accelerated much more strongly over the last twoyears. The differences are mainly attributable to a few verybig deals. In 1998, the total value amounted to 313 billion,representing a growth of 153 % between 1997 and 1998. In1999, the total value reached 396 billion (+26% by com-parison with 1998).
Graph 8 shows that inward (EU target) and outward (EUbidder) operations evolved quite differently. While thevalue of inward operations began to grow steadily after1996, the growth in value of outward operations has beencontinuous since 1993, apart from a very slight fall in 1997.In 1998, the value of outward operations increased by262% by comparison with the previous year. In 1998 therewere three major acquisitions of U.S. firms by Communitycompanies: BP/Amoco, Daimler–Benz/Chrysler and Scot-tish Power/PacifiCorp. These three transactions accountedfor more than 40% of the total value of outward operations.There was a further steep increase of 36% in 1999, againlargely accounted for by three very big transactions: the ac-
– 13 –
GRAPH 8: Value of international operations (billion euro)
Source: SDC–M&A.
EU target EU bidder
1991 1992 1993 1994 1995 1996 1997 1998 19990
50
100
150
200
250
300
quisitions of AirTouch (U.S.A) by Vodafone (U.K.), ofARCO (U.S.A.) by BP–Amoco (U.K.) and of YPF(Argentina) by Repsol (Spain).
Graph 9 shows that the average values of International andCommunity operations were roughly equal up to 1994. Inthree of the four following years the average value of In-ternational deals was significantly higher than that of Com-munity operations. The sharp rise in the average for Com-munity operations in 1999 is largely attributable to a singleoperation, the Vodafone AirTouch/Mannesmann deal. Ex-cluding this exceptional transaction brings the averagevalue of Community operations down to 112 million, onlyslightly above the 108 million average for Internationaloperations.
2.4.3 Geographical breakdown of international operations
There were nearly 3000 acquisitions of Community firmsby non–Community firms in the period 1998–99. Table 12gives a breakdown by Member State of the acquisitionsmade in that period by the main extra–Community biddercountries.
As during the period 1996–1997, the U.S.A. remains themain source of bids, accounting for 63% of all acquisitionsby non–EU companies. British, German and French firmswere targeted most frequently, with a strong predilectionfor UK firms. Over the period 1991–1999, the number of
GRAPH 9: Average value per operation at Community and Inter-national levels (million euro)
Source: SDC–M&A.
Community Ops International Ops
1991 1992 1993 1994 1995 1996 1997 1998 19990
50
100
150
200
250
acquisitions made by U.S. companies in the EU has grownmuch more rapidly than acquisitions by other non–EUfirms, having increased by 126% over the whole period,compared to an average increase for all inward M&A ofonly 36%.
Switzerland ranks second as a bidder country with 7.4%,Germany being by far the preferred target country. Canadaand Norway occupy the third and fourth places with re-spectively 5% and 3.6%. The U.K., France and Germanyare the countries most targeted by Canadian firms. As onemight expect, Swedish and Danish firms account for morethan half of the acquisitions made by Norwegian firms, butBritish and Finnish companies also account for a large per-centage (11 % each). Japanese firms’ acquisitions accountonly for 2.3% against 3.5 % in the previous period. This de-crease is very probably linked to the consequences of theAsian turmoil of recent years. Japanese interest remainsmainly focussed on the U.K, followed at some distance byGermany, the Netherlands and Italy. French companieswere less targeted by Japanese firms than in the previousperiod.
In 1998–1999, over 3700 acquisitions were made by EUcompanies in non–member countries. Table 13 presents thedata for the main countries where extra–Community ac-quisitions were made.
Not surprisingly, we once again find that the U.S.A. leads
TABLE 12: Breakdown by EU target countries of international operations 1998–1999
Targets
Bidders B DK D EL E F IRL I L NL A P FIN S UK EU
USA 52 28 300 9 88 233 34 122 9 124 22 16 16 77 753 1883
Switz. 2 7 75 1 12 23 3 34 0 10 8 2 4 14 25 220
Canada 1 1 18 1 10 23 1 8 1 14 6 1 0 6 58 149
Norway 1 19 8 0 1 3 2 0 0 1 0 0 12 50 12 109
Japan 1 4 11 1 2 5 2 7 0 8 1 1 1 3 21 68
Other 7 2 55 10 48 42 18 24 4 30 12 10 10 17 271 560
Total 64 61 467 22 161 329 60 195 14 187 49 30 43 167 1140 2989
Source : SDC – M&A.
– 14 –
TABLE 13: Breakdown by non–EU target countries of international operations 1998–1999
Targets
Bidders USA CEEC Switzerland Norway Australia Others Total
B 47 29 8 2 1 38 125
DK 13 31 9 25 2 14 94
D 194 149 80 9 8 196 636
EL 4 19 0 0 0 23 46
E 22 14 3 0 2 152 193
F 135 46 26 5 18 240 470
IRL 41 8 0 1 2 19 71
I 26 27 10 2 1 63 129
L 5 7 1 2 0 10 25
NL 101 68 20 9 11 129 338
A 11 55 10 2 1 15 94
P 0 5 0 0 0 33 38
FIN 27 52 3 20 0 12 114
S 54 68 8 62 6 61 259
UK 487 71 31 31 103 361 1084
EU 1167 649 209 170 155 1366 3716
Source : SDC – M&A.
by a large margin, with 31% of extra–Community acquisi-tions. The U.K. accounts for 42% of all these transactions,while Germany, France and the Netherlands also featureprominently. However, throughout the 1990s the number ofEU bids for U.S. firms has been growing more slowly thanother external acquisitions. Between 1991 and 1999 thenumber of acquisitions of U.S. firms increased by 158%,while there was a 231% increase in the total number of ex-ternal acquisitions.
We also find Switzerland again in second place with 5.6%of the total. The major part of these acquisitions were madeby German, British and French firms. Switzerland is fol-lowed by Poland, Australia, Norway, Brazil, Argentina andCanada. Japan occupies only the tenth place in the ranking.
Two other CEECs, the Czech Republic and Hungary, oc-cupy the seventh and eleventh places respectively. Alto-gether, the CEECs account for 17.5% of the total, represent-ing an increase of 3 percentage points by comparison withthe previous period.
3. Sectoral aspects
3.1 General aspects
As noted in the box, the sectoral analysis of mergers and ac-quisitions is complicated by the arbitrary nature of com-pany classification. The solution we have adopted is to takethe main activity of enterprises and to apply a sectoralbreakdown which is not too disaggregated. Graph 10shows the pattern of merger and acquisition operations inindustry and construction (US SIC sectors 1–3) and in ser-vices (US SIC sectors 4–9)1. As we wish to focus on the im-pact on the Internal Market, the data in this graph do not in-clude the acquisitions made by EU firms outside theCommunity.
Throughout the 1990s, there have been more mergers andacquisitions in the services sector than in industry. Thegrowth rate has also been stronger in services than in in-dustry. To some extent, this pattern may reflect the impactof two major policies of the EU: the Single Market program-
1 Throughout this supplement the sectoral codes used are those of the US SIC classifi–cation.
me and Economic and Monetary Union. Single Marketmeasures affecting manufacturing were adopted and im-plemented earlier than those affecting service sectors. Alarge part of the consequent restructuring of industry wastherefore completed by 1990. On the other hand, the libera-lisation of services in the context of the Single Market pro-gramme started slowly and has accelerated significantly inrecent years. Some Single Market measures in major ser-vice sectors (banking, insurance, financial services, trans-port) did not come into effect until the second half of the1990s. Furthermore, some services previously supplied bystate monopolies are becoming less and less restricted bylegislative provisions, government policy and financialconstraints. These factors may help to explain the fastergrowth of the number of operations in the service sectorduring the 1990s. However, it is interesting to note that thissector has also experienced a much faster growth of M&Aactivity in theU.S.A. (see section 4.5).
GRAPH 10: Number of M&A operations with an EU target (cross–border + national) in industry, including constructionand services
Source: SDC–M&A.
Service Industry
91 92 93 94 95 96 97 98 991500
2000
2500
3000
3500
4000
4500
5000
5500
6000
6500
7000
– 15 –
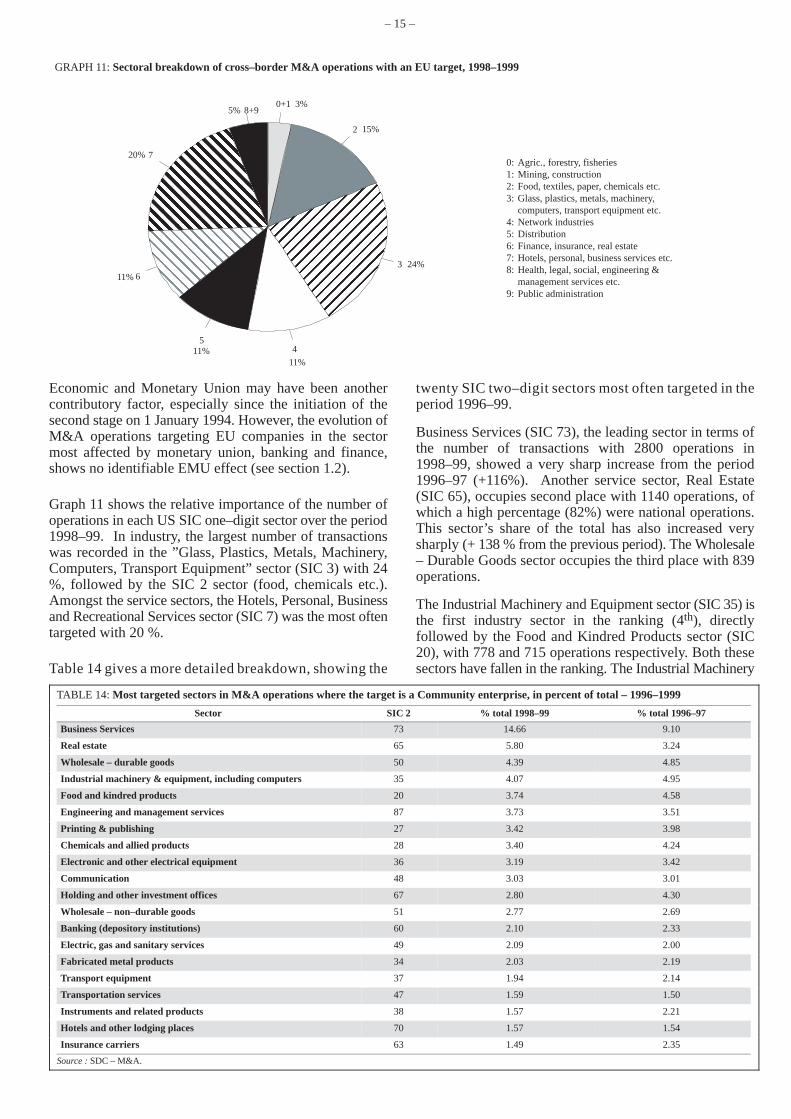
GRAPH 11: Sectoral breakdown of cross–border M&A operations with an EU target, 1998–1999
0: Agric., forestry, fisheries1: Mining, construction2: Food, textiles, paper, chemicals etc.3: Glass, plastics, metals, machinery,
computers, transport equipment etc.4: Network industries5: Distribution6: Finance, insurance, real estate7: Hotels, personal, business services etc.8: Health, legal, social, engineering &
management services etc.9: Public administration
ÈÈÈÈÈÈÈÈÈÈÈÈÈÈÈÈÈÈÈÈÈÈÈÈÈÈÈÈÈÈÈÈÈÈÈÈÈÈÈÈÈÈÇÇÇÇÇÇÇÇÇÇÇÇÇÇÇÇÇÇÇÇÇÇÇÇÇÇÇÇ
ÉÉÉÉÉÉÉÉÉÉÉÉÉÉÉÉÉÉÉÉÉÉÉÉÉÉÉÉÉÉÉÉÉÉÉÉÉÉÉÉÉÉÉÉÉÉÉÉ
8+95%
720%
611%
511% 4
11%
3 24%
2 15%
0+1 3%
Economic and Monetary Union may have been anothercontributory factor, especially since the initiation of thesecond stage on 1 January 1994. However, the evolution ofM&A operations targeting EU companies in the sectormost affected by monetary union, banking and finance,shows no identifiable EMU effect (see section 1.2).
Graph 11 shows the relative importance of the number ofoperations in each US SIC one–digit sector over the period1998–99. In industry, the largest number of transactionswas recorded in the ”Glass, Plastics, Metals, Machinery,Computers, Transport Equipment” sector (SIC 3) with 24%, followed by the SIC 2 sector (food, chemicals etc.).Amongst the service sectors, the Hotels, Personal, Businessand Recreational Services sector (SIC 7) was the most oftentargeted with 20 %.
Table 14 gives a more detailed breakdown, showing the
twenty SIC two–digit sectors most often targeted in theperiod 1996–99.
Business Services (SIC 73), the leading sector in terms ofthe number of transactions with 2800 operations in1998–99, showed a very sharp increase from the period1996–97 (+116%). Another service sector, Real Estate(SIC 65), occupies second place with 1140 operations, ofwhich a high percentage (82%) were national operations.This sector’s share of the total has also increased verysharply (+ 138 % from the previous period). The Wholesale– Durable Goods sector occupies the third place with 839operations.
The Industrial Machinery and Equipment sector (SIC 35) isthe first industry sector in the ranking (4th), directlyfollowed by the Food and Kindred Products sector (SIC20), with 778 and 715 operations respectively. Both thesesectors have fallen in the ranking. The Industrial Machinery
TABLE 14: Most targeted sectors in M&A operations where the target is a Community enterprise, in percent of total – 1996–1999
Sector SIC 2 % total 1998–99 % total 1996–97
Business Services 73 14.66 9.10
Real estate 65 5.80 3.24
Wholesale – durable goods 50 4.39 4.85
Industrial machinery & equipment, including computers 35 4.07 4.95
Food and kindred products 20 3.74 4.58
Engineering and management services 87 3.73 3.51
Printing & publishing 27 3.42 3.98
Chemicals and allied products 28 3.40 4.24
Electronic and other electrical equipment 36 3.19 3.42
Communication 48 3.03 3.01
Holding and other investment offices 67 2.80 4.30
Wholesale – non–durable goods 51 2.77 2.69
Banking (depository institutions) 60 2.10 2.33
Electric, gas and sanitary services 49 2.09 2.00
Fabricated metal products 34 2.03 2.19
Transport equipment 37 1.94 2.14
Transportation services 47 1.59 1.50
Instruments and related products 38 1.57 2.21
Hotels and other lodging places 70 1.57 1.54
Insurance carriers 63 1.49 2.35
Source : SDC – M&A.
– 16 –
and Equipment sector occupied the second place in1996–97, while the Food sector was fourth.
3.2 Focus on the most targeted industry and servicessectors (SIC 73 and SIC 35)
As Table 14 shows, the Business Services sector (SIC 73)and the Industrial Machinery & Equipment sector (SIC 35)are by far the most targeted sectors in their branches. Wehave therefore chosen to examine these two sectors in moredetail.
3.2.1 Business services
Within this sector, the most targeted sub–sector has beenComputer Programming Services (SIC 7371) with 1804operations, followed by the Detective, Guard and Ar-moured Car sub–sector (SIC 7381) with 326 operations(see Table 15).
By comparison with the period 1996–1997, Computer Pro-gramming Services were the only sub–sector to have in-creased its share. The main reasons that could explain thissharp increase are the development of e–commerce and thedevelopment of new commercial products and platformsfor business systems.
3.2.2 Industrial Machinery & Equipment industry
In the Industrial Machinery & Equipment industry (SIC35), the main targeted sub–sector was Electronic Com-puters (SIC 3571). The other well–represented sub–sectorswere Pumps and Pumping Equipment (SIC 3561), Con-struction Machinery (SIC 3531) and Textile Machinery(SIC 3552) (see Table 16).
By comparison with the period 1996–97, the share of theElectronic Computers sub–sector increased slightly in theyears 1998–99, while that of Pumps and Pumping Equip-ment increased rather more sharply. The main reason forthese increases may lie in the fragmentation of the sub–sec-tors in terms of diversity of products. Through the purchaseof small specialised companies, mergers allow companiesto avoid R&D efforts in each ”niche” and to offer a broaderrange of products to their customers.
PART B: COMPARISON WITH THE USA
In this section, we distinguish between intra–EU and extra–EU operations. Intra–EU operations include National andCommunity operations while extra–EU refers to interna-tional operations of EU firms (as targets or as bidders). Forthe USA, we will use the terms intra–US for national oper-ations and extra–US for international operations by USfirms (as targets or as bidders).
1. Evolution of M&A operations
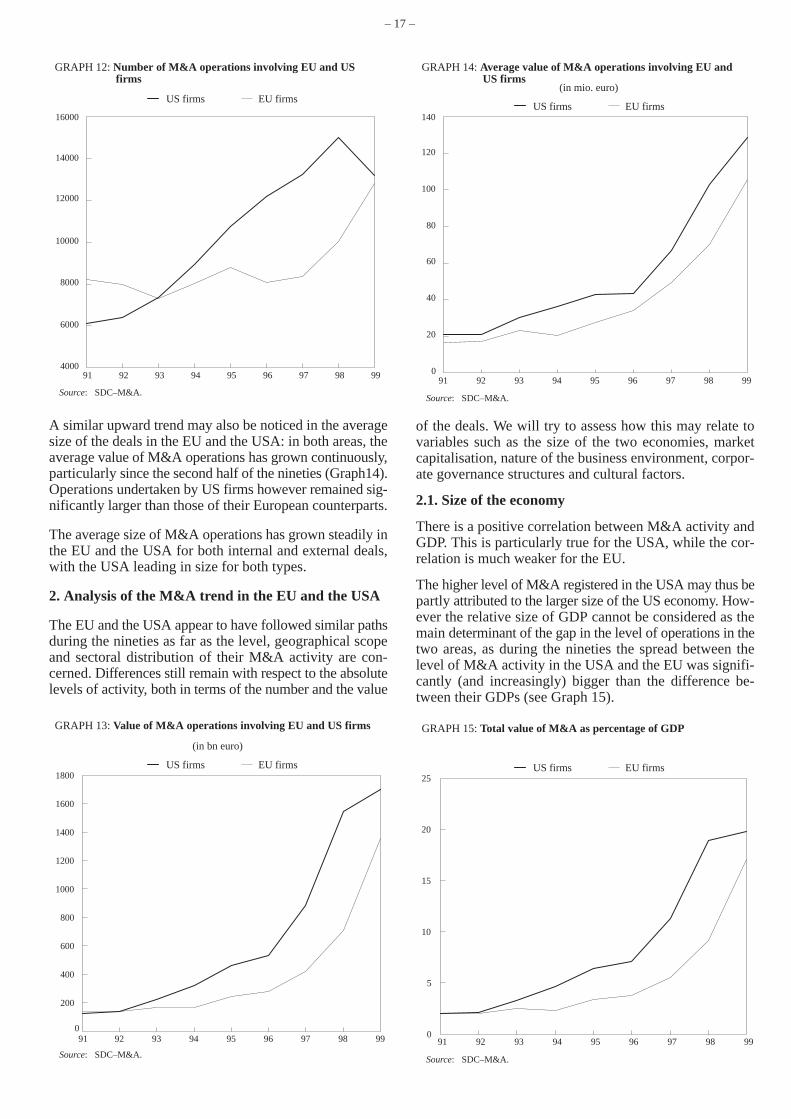
Over the nineties, M&A operations carried out by EU andUS firms displayed an overall similar and upward trend,particularly since 1993 (Graphs 12 and 13). US firmsnevertheless remained significantly more active than Euro-pean ones, in terms both of number and of value of M&Aoperations undertaken. The gap in the number and value ofoperations between the EU and the USA has been constant-ly increasing, with the exception of 1999, when M&A ac-tivity in the USA appears to have fallen suddenly2.
2 A more conclusive assessment of the trend will be possible when the data for 2000 are available, which will put the figures for 1999 in perspective.
TABLE 15: Targeted sector US SIC 73 – Business services (cross–border + national) 1998–99
Targeted sector SIC 4 Number 98–99 % total 98–99 % total 96–97
Computer programming services 7371 1804 64.43 53.47
Detective, guard and armoured car services 7381 326 11.64 17.21
Advertising agencies 7311 240 8.57 10.11
Employment agencies 7361 187 6.68 8.18
Medical equipment rental 7352 109 3.89 4.94
Disinfecting and pest control services 7342 80 2.86 2.78
Direct mail advertising services 7331 54 1.93 3.32
Total 2800 100.00 100.00
Source : SDC – M&A.
TABLE 16: Targeted sector US SIC 35 – machinery & computer equipment industry (cross–border + national) 1998–99
Targeted sector SIC 4 Number 98–99 % total 98–99 % total 96–97
Electronic computers 3571 138 17.74 17.60
Pumps and pumping equipment 3561 122 15.68 13.90
Construction machinery 3531 116 14.91 15.69
Textile machinery 3552 115 14.78 15.94
Automatic vending machines 3581 99 12.72 12.63
Machine tools, metal cutting types 3541 84 10.80 10.33
Others 3591 48 6.17 6.12
Turbines & turbine generator sets 3511 35 4.50 4.21
Farm machinery and equipment 3523 21 2.70 3.57
Total 778 100.00 100.00
Source : SDC – M&A.
– 17 –
GRAPH 12: Number of M&A operations involving EU and USfirms
Source: SDC–M&A.
US firms EU firms
91 92 93 94 95 96 97 98 994000
6000
8000
10000
12000
14000
16000
A similar upward trend may also be noticed in the averagesize of the deals in the EU and the USA: in both areas, theaverage value of M&A operations has grown continuously,particularly since the second half of the nineties (Graph14).Operations undertaken by US firms however remained sig-nificantly larger than those of their European counterparts.
The average size of M&A operations has grown steadily inthe EU and the USA for both internal and external deals,with the USA leading in size for both types.
2. Analysis of the M&A trend in the EU and the USA
The EU and the USA appear to have followed similar pathsduring the nineties as far as the level, geographical scopeand sectoral distribution of their M&A activity are con-cerned. Differences still remain with respect to the absolutelevels of activity, both in terms of the number and the value
GRAPH 13: Value of M&A operations involving EU and US firms
Source: SDC–M&A.
US firms EU firms
91 92 93 94 95 96 97 98 990
200
400
600
800
1000
1200
1400
1600
1800
(in bn euro)
GRAPH 14: Average value of M&A operations involving EU andUS firms
Source: SDC–M&A.
US firms EU firms
(in mio. euro)
91 92 93 94 95 96 97 98 990
20
40
60
80
100
120
140
of the deals. We will try to assess how this may relate tovariables such as the size of the two economies, marketcapitalisation, nature of the business environment, corpor-ate governance structures and cultural factors.
2.1. Size of the economy
There is a positive correlation between M&A activity andGDP. This is particularly true for the USA, while the cor-relation is much weaker for the EU.
The higher level of M&A registered in the USA may thus bepartly attributed to the larger size of the US economy. How-ever the relative size of GDP cannot be considered as themain determinant of the gap in the level of operations in thetwo areas, as during the nineties the spread between thelevel of M&A activity in the USA and the EU was signifi-cantly (and increasingly) bigger than the difference be-tween their GDPs (see Graph 15).
GRAPH 15: Total value of M&A as percentage of GDP
Source: SDC–M&A.
US firms EU firms
91 92 93 94 95 96 97 98 990
5
10
15
20
25
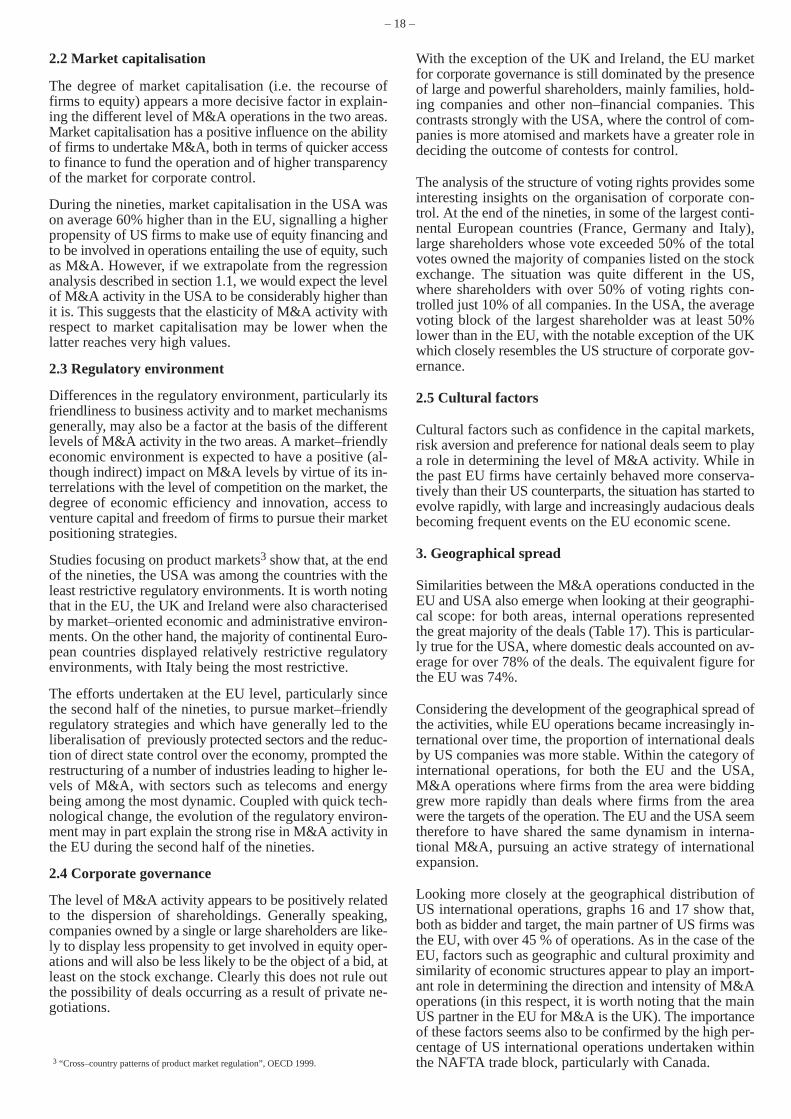
– 18 –
2.2 Market capitalisation
The degree of market capitalisation (i.e. the recourse offirms to equity) appears a more decisive factor in explain-ing the different level of M&A operations in the two areas.Market capitalisation has a positive influence on the abilityof firms to undertake M&A, both in terms of quicker accessto finance to fund the operation and of higher transparencyof the market for corporate control.
During the nineties, market capitalisation in the USA wason average 60% higher than in the EU, signalling a higherpropensity of US firms to make use of equity financing andto be involved in operations entailing the use of equity, suchas M&A. However, if we extrapolate from the regressionanalysis described in section 1.1, we would expect the levelof M&A activity in the USA to be considerably higher thanit is. This suggests that the elasticity of M&A activity withrespect to market capitalisation may be lower when thelatter reaches very high values.
2.3 Regulatory environment
Differences in the regulatory environment, particularly itsfriendliness to business activity and to market mechanismsgenerally, may also be a factor at the basis of the differentlevels of M&A activity in the two areas. A market–friendlyeconomic environment is expected to have a positive (al-though indirect) impact on M&A levels by virtue of its in-terrelations with the level of competition on the market, thedegree of economic efficiency and innovation, access toventure capital and freedom of firms to pursue their marketpositioning strategies.
Studies focusing on product markets3 show that, at the endof the nineties, the USA was among the countries with theleast restrictive regulatory environments. It is worth notingthat in the EU, the UK and Ireland were also characterisedby market–oriented economic and administrative environ-ments. On the other hand, the majority of continental Euro-pean countries displayed relatively restrictive regulatoryenvironments, with Italy being the most restrictive.
The efforts undertaken at the EU level, particularly sincethe second half of the nineties, to pursue market–friendlyregulatory strategies and which have generally led to theliberalisation of previously protected sectors and the reduc-tion of direct state control over the economy, prompted therestructuring of a number of industries leading to higher le-vels of M&A, with sectors such as telecoms and energybeing among the most dynamic. Coupled with quick tech-nological change, the evolution of the regulatory environ-ment may in part explain the strong rise in M&A activity inthe EU during the second half of the nineties.
2.4 Corporate governance
The level of M&A activity appears to be positively relatedto the dispersion of shareholdings. Generally speaking,companies owned by a single or large shareholders are like-ly to display less propensity to get involved in equity oper-ations and will also be less likely to be the object of a bid, atleast on the stock exchange. Clearly this does not rule outthe possibility of deals occurring as a result of private ne-gotiations.
3 “Cross–country patterns of product market regulation”, OECD 1999.
With the exception of the UK and Ireland, the EU marketfor corporate governance is still dominated by the presenceof large and powerful shareholders, mainly families, hold-ing companies and other non–financial companies. Thiscontrasts strongly with the USA, where the control of com-panies is more atomised and markets have a greater role indeciding the outcome of contests for control.
The analysis of the structure of voting rights provides someinteresting insights on the organisation of corporate con-trol. At the end of the nineties, in some of the largest conti-nental European countries (France, Germany and Italy),large shareholders whose vote exceeded 50% of the totalvotes owned the majority of companies listed on the stockexchange. The situation was quite different in the US,where shareholders with over 50% of voting rights con-trolled just 10% of all companies. In the USA, the averagevoting block of the largest shareholder was at least 50%lower than in the EU, with the notable exception of the UKwhich closely resembles the US structure of corporate gov-ernance.
2.5 Cultural factors
Cultural factors such as confidence in the capital markets,risk aversion and preference for national deals seem to playa role in determining the level of M&A activity. While inthe past EU firms have certainly behaved more conserva-tively than their US counterparts, the situation has started toevolve rapidly, with large and increasingly audacious dealsbecoming frequent events on the EU economic scene.
3. Geographical spread
Similarities between the M&A operations conducted in theEU and USA also emerge when looking at their geographi-cal scope: for both areas, internal operations representedthe great majority of the deals (Table 17). This is particular-ly true for the USA, where domestic deals accounted on av-erage for over 78% of the deals. The equivalent figure forthe EU was 74%.
Considering the development of the geographical spread ofthe activities, while EU operations became increasingly in-ternational over time, the proportion of international dealsby US companies was more stable. Within the category ofinternational operations, for both the EU and the USA,M&A operations where firms from the area were biddinggrew more rapidly than deals where firms from the areawere the targets of the operation. The EU and the USA seemtherefore to have shared the same dynamism in interna-tional M&A, pursuing an active strategy of internationalexpansion.
Looking more closely at the geographical distribution ofUS international operations, graphs 16 and 17 show that,both as bidder and target, the main partner of US firms wasthe EU, with over 45 % of operations. As in the case of theEU, factors such as geographic and cultural proximity andsimilarity of economic structures appear to play an import-ant role in determining the direction and intensity of M&Aoperations (in this respect, it is worth noting that the mainUS partner in the EU for M&A is the UK). The importanceof these factors seems also to be confirmed by the high per-centage of US international operations undertaken withinthe NAFTA trade block, particularly with Canada.
– 19 –
Table 17: Geographical distribution of US and EU mergers and acquisitions
USA EU
Total (number) Intra–USA (%) Extra–USA (%) Total (number) Intra–EU (%) Extra–EU (%)
1991 6131 75.9% 24.1% 8236 79.1% 20.9%
1992 6416 79.4% 20.6% 8000 80.8% 19.2%
1993 7364 79.9% 20.1% 7327 76.0% 24.0%
1994 8919 79.0% 21.0% 8006 76.3% 23.7%
1995 10763 79.6% 20.4% 8777 74.6% 25.4%
1996 12174 79.8% 20.2% 8087 71.4% 28.6%
1997 13251 79.1% 20.9% 8382 71.1% 28.9%
1998 15006 77.6% 22.4% 10024 69.5% 30.5%
1999 13207 74.1% 25.9% 12796 71.5% 28.5%
Source: SDC–M&A.
4. Sectoral aspects
As in Part A, we will here concentrate on the sectoral di-mension of M&A operations affecting the internal marketsof the EU and the US (i.e. excluding international dealswhere the firms of the area have acted as bidders). The aimis to assess how M&A have contributed to the evolution ofthe productive structure in the two areas.
Graph 18 shows M&A operations targeting the EU and theUS markets, distinguishing between the industry and ser-vices sectors. Here too, the similarity of the trends affectingthe internal EU and US markets may be noticed, particular-ly the significant increase of operations in the service sec-tor, while the industry sector shows less change. However,it is noteworthy that M&A activity in services began togrow rapidly in the U.S.A. from 1992 onwards, whereas inthe EU most of the growth occurred in the last two years.
A more in–depth analysis (Table 18) of the combined secto-ral and geographical breakdown of the operations carriedout in the EU and the USA also reveals striking similaritiesbetween the two areas: while operations in both the EU andthe USA were mainly conducted in the service sector (SICcategories 4–9), this is particularly true for deals under-taken within the trade block (i.e. intra–EU and intra–US
GRAPH 16: Geographical distribution of extra–US acquisitions byUS firms, 1998–1999
Source: SDC–M&A.
ÇÇÇÇÇÇÇÇÇÇÇÇÇÇÇÇÇÇÇÇÇÇÇÇÇÇÇÇÇÇ
ÉÉÉÉÉÉÉÉÉÉÉÉÉÉÉÉÉÉÉÉ
EU45,0%
Other8,0%
Asia14,0%
South America10,0%
NAFTA17,0%
Rest of Europe6,0%
GRAPH 17: Geographical breakdown of extra–US acquirers of USfirms, 1998–1999
Source: SDC–M&A.
ÉÉÉÉÉÉÉÉÉÉÉÉÉÉÉÉÉÉÉÉ
ÇÇÇÇÇÇÇÇÇÇÇÇÇÇÇÇÇÇÇÇÇÇÇÇÇÇÇÇÇÇÇÇÇÇÇÇÇÇÇÇ
EU47%
15%
S. America2%
Asia8%
NAFTA25%
Rest of Europe
3%Other
deals), for which services accounted for about 70% of thetotal operations.
GRAPH 18: Number of M&A operations in industry and serviceswith an EU or US target
Source: SDC–M&A.
EU industry EU services US industry US services
0
1000
2000
3000
4000
5000
6000
7000
8000
9000
10000
91 92 93 94 95 96 97 98 99
– 20 –
TABLE 18: Sectoral and geographical breakdown of M&A operations with a US or EU target, 1998–1999 (%)
Sector SIC Intra–USExtra–US
(USA as target)Intra–EU
Extra–EU
(EU as target)
0 (Agriculture, forestry, fisheries) 0.6 0.5 0.6 0.6
1 (Mining & construction) 4.7 5.3 3.5 2.5
2 (Food, textiles, paper, chemicals etc) 8.9 12.1 15.3 13.0
3 (Glass, plastics, metals, machinery, computers, transport equipment etc) 14.8 23.0 16.7 24.9
4 (Network industries) 10.4 9.2 10.0 10.0
5 (Wholesale & retail trade) 10.6 9.2 14.0 9.0
6 (Finance, insurance and real estate) 18.8 13.2 15.5 11.5
7 (Hotels, personal, business and recreational services etc) 22.8 20.5 18.8 21.8
8 (Health, legal, educational, social, engineering and management services) 8.4 6.9 5.6 6.6
9 (Public administration) 0.2 0.1 0.1 0.1
Total 100 100 100 100
Source : SDC – M&A.
On the other hand, a larger proportion of international oper-ations targeting EU and US companies took place in the in-dustry sector (around 40% of such operations were re-corded in the SIC categories 1–3).
For both the EU and the USA, the main sector affected byoperations taking place within the area was Hotels, Per-sonal, Business and Recreational Services (SIC 7). Interna-tional M&A targeting EU and US companies on the otherhand mainly concerned the production of manufacturingproducts belonging to the SIC 3 sector (glass, plastics, me-tals etc), although the SIC 7 services sector came a closesecond.
5. Conclusions
The above analysis shows how M&A in the EU and theUSA share important similarities with respect to the trendand the geographical and sectoral orientation of deals.These similarities can be attributed to a number of commonunderlying factors, such as the progressive lowering ofbarriers to international trade and rapid technologicalchange in the telecommunications and Information Tech-nology sectors. In the financial services sector, the breakingdown of barriers between EU Member States has been par-alleled by the abolition of restrictions on inter–state bank-ing in the U.S.A., while changes in the regulation of net-work industries have triggered restructuring on both sidesof the Atlantic.
The main difference between the two areas is the lower dy-namism of M&A activity in the EU, both in terms of
number and value of the deals, except at the end of theperiod. This appears to be the result of a combination of fac-tors, with business operating conditions (such as recourseto capital market, regulatory environment and structure ofcorporate governance) possibly playing a key role in en-couraging high levels of M&A activity.
PART C: LARGER DEALS IN 1998 AND 1999
1. Larger deals at world level
Tables 19a and 19b show the most important deals for 1998and 1999 at world level. In the 1998 world top ten, thetargets are purely American and only two bidders are Euro-pean. In 1999, only five deals were purely American, threepurely European and one purely Japanese.
The value of the operations in 1999 was very large. By com-parison, the top–ranking operation in 1998 would only bethe fourth in 1999. The largest operation involving a Com-munity enterprise is only seventh in 1998 but first in 1999with the Vodafone AirTouch/ Mannesmann deal.
During these two years, the telecommunications sector wasthe object of seven of the largest deals, more than any othersector. These include the record–breaking Vodafone Air-Touch/Mannesmann merger, valued at 204.8 billion.
The banking sector accounts for five of the twenty largestdeals in these two years, including notably the US deals be-tween Citicorp/Travelers Group and BankAmerica/Na-tionsbank in 1998.
TABLE 19a: Larger deals at world level in 1998
Target full name Bidder full name Sector Bid value in euros(Bn)
1 Mobil Corp. (US) Exxon Corp. (US) Oil 68.357
2 Citicorp (US) Travelers Group Inc. (US) Banking 67.246
3 BankAmerica Corp. (US) NationsBank Corp. (US) Banking 56.674
4 Ameritech Corp. (US) SBC Communications Inc. (US) Telecom 56.481
5 AT&T Broadband & Internet (US) AT&T Corp. (US) Telecom 48.787
6 GTE Corp. (US) Bell Atlantic Corp. (US) Telecom 48.199
7 Amoco Corp. (US) British Petroleum Co PLC. (UK) Oil 43.530
8 Chrysler Corp. (US) Daimler–Benz AG (GER) Motor 36.280
9 Monsanto Co (US) American Home Products Corp. (US) Chemicals 32.100
10 Wells Fargo & Company (US) Norwest Corp. (US) Banking 31.013
Source : SDC – M&A.
– 21 –
TABLE 19b: Larger deals at world level in 1999
Target full name Bidder full name Sector Bid value in euros(Bn)
1 Mannesmann AG (GER) Vodafone AirTouch PLC (UK) Telecom 204.792
2 Warner–Lambert (USA) Pfizer Inc. (USA) Pharma. 84.938
3 MediaOne Group Inc. (USA) AT&T Corp. (USA) Telecom 55.641
4 AirTouch Communications (USA) Vodafone Group PLC (UK) Telecom 53.107
5 Elf Aquitaine (FRA) Total Fina SA (FRA) Oil 51.676
6 Palm Inc (3Com Corp) (USA) Market purchase Business services 48.811
7 US WEST Inc. (USA) Qwest Commun Int Inc. (USA) Telecom 45.458
8 Dai–Ichi Kangyo Bank Ltd (JPN) Fuji Bank Ltd (JPN) Banking 39.799
9 National Westminster Bank PLC (UK) Royal Bank of Scotland Group (UK) Banking 39.460
10 CBS Corp (USA) Viacom Inc (USA) Television 37.332
Source : SDC – M&A.
There were three major operations in the oil sector. The ac-quisition of Amoco by British Petroleum for 43 billionwas the largest deal involving a Community enterprise in1998 while the largest deal at world level was concluded be-tween Mobil and Exxon for 68.36 billion. The purelyFrench deal between Elf Aquitaine and Total Fina for51.67 billion was the fifth largest deal in 1999.
In 1998, major deals also occurred in the motor vehiclessector with an operation involving a Community enterpriseas bidder (Chrysler–Daimler–Benz) and in chemicals withthe acquisition of Monsanto by American Home Products.In 1999, the top ten includes the deal in the pharmaceuticalsector between Warner–Lambert and Pfizer, valued at 84.9 billion, and the television broadcasting sector mergerbetween Viacom and CBS.
2. Larger deals involving Community enterprises
Tables 20a and 20b show the most important deals for 1998and 1999 where a Community enterprise was target or bid-der.
In 1998, the largest deal involving a Community enterprisewas the deal between Amoco (US) and British petroleum(UK) for 43.5 billion in the oil and gas extraction sectorfollowed by the deal between Chrysler (U.S.A.) andDaimler–Benz (Germany). The main targeted sectors werethe banking and insurance sector with 6 deals amongst the15 largest deals, the electricity sector with three, and phar-maceuticals with two.
As in 1997, the banking and insurance sector continued toaccount for the largest number of top M&A operations in1998. In the 15 largest deals, this sector accounts for a totalamount of 54.81 billion. Because banking and insuranceenterprises are typically very large, any operations whichtake place in this sector tend to appear high up in the rankingof deals by value.
In 1999, the telecommunications sector accounted for thelargest number of the top deals. These 6 operations repre-sent an amount of 344.5 billion. The largest deal was themerger between Mannesmann and Vodafone with a valueof 204.79 billion. This deal was also the largest at worldlevel. It was preceded by the second largest deal, Voda-fone’s acquisition of AirTouch Communications (U.S.A.)for 53.11 billion, and Mannesmann’s takeover of Orange(UK) for 30.24 billion4.
The other sectors included in the list are: electricity, oil andgas extraction, banking and chemicals.
PART D: COMMUNITY CONTROL OF MERGERS
1. Overview
By the end of 1999, a total of 1228 mergers had been noti-fied to the Commission under the Merger Regulation5,4 As a condition for approval of the Vodafone/Mannesmann merger, the parties were re-
quired to dispose of Orange.
5 Council Regulation (EEC) no. 4064/89 of 21 December 1989, OJ L395 of 30.12.1989, as amended by Council Regulation (EC) no. 1310/97 of 30 June 1997, OJ L180 of9.7.1997.
TABLE 20a: Main operations in 1998 where a Community enterprise is target or bidder
Target full name Bidder full name Sector Bid value in euros (Bn)
1 Amoco Corp. (US) British Petroleum Co PLC. (UK) Oil 43.53
2 Chrysler Corp. (US) Daimler–Benz AG (GER) Motor 36.28
3 Astra AB (SWE) Zeneca (UK) Pharma. 29.44
4 Generale de Banque SA (BEL) Fortis AG (BEL) Financial services 11.16
5 PacifiCorp. (US) Scottish Power PLC (UK) Electricity 10.79
6 General Accident PLC (UK) Commercial Union PLC (UK) Insurance 10.21
7 Unicredito SpA (ITA) Credito Italiano SpA (ITA) Banking 10.06
8 Energy Group PLC (UK) Texas Utilities Co (US) Electricity 9.70
9 Synthelabo SA (L’Oreal SA) (FRA) Sanofi SA (FRA) Pharma. 9.57
10 PolyGram NV (NED) Universal Studios Inc (US) Recording 9.39
11 Istituto Mobiliare Italiano (ITA) Istituto Bancario San Paolo (ITA) Banking 8.65
12 Bankers Trust New York Corp (US) Deutsche Bank AG (GER) Financial services 7.60
13 Alusuisse Lonza Group Ltd (SWI) VIAG AG (GER) Aluminium 7.43
14 Almanij–Banking and Insurance (BEL) Kredietbank NV (BEL) Banking 7.13
15 Endesa SA (ESP) Investors Electricity 7.01
– 22 –
TABLE 20b: Main operations in 1999 where a Community enterprise is target or bidder
Target full name Bidder full name Sector Bid value ineuros (Bn)
1 Mannesmann AG (GER) Vodafone AirTouch PLC (UK) Telecom 204.79
2 AirTouch Communications (US) Vodafone Group PLC (UK) Telecom 53.11
3 Elf Aquitaine (FRA) Total Fina SA (FRA) Oil 51.68
4 National Westminster Bank PLC (UK) Royal Bank of Scotland Group (UK) Banking 39.46
5 Telecom Italia SpA (ITA) Ing C Olivetti & Co SpA (ITA) Telecom 31.52
6 Orange PLC (UK) Mannesmann AG (GER) Telecom 30.24
7 ARCO (US) BP Amoco PLC (UK) Oil 25.34
8 Hoechst AG (GER) Rhone–Poulenc SA (FRA) Chemicals 20.55
9 Ente Nazionale per l’Energia (ITA) Investors Electricity 17.80
10 Promodes (FRA) Carrefour SA (FRA) Retailing 15.12
11 One 2 One (UK) Deutsche Telekom AG (GER) Telecom 12.60
12 VIAG AG (GER) VEBA AG (GER) Electricity 12.59
13 YPF SA (ARG) Repsol SA (ESP) Oil 12.40
14 Banca Commerciale Italiana SpA (ITA) Banca Intesa SpA (ITA) Banking 12.36
15 CWC Communications (UK) NTL Inc (US) Telecom 12.19
Source : SDC – M&A.
which came into force on 21 September 1990 (see Table21). 51 of these were found to fall wholly or partly outsidethe scope of the Regulation and 51 were later withdrawn.
The number of notifications has risen every year since 1993to reach 292 in 1999. However, the number of notifiablecases is very small in comparison with total M&A activitybecause of the narrow scope of the Merger Regulation,which only affects mergers involving very large firms andexcludes mergers between firms which each obtain morethan two–thirds of their turnover in the same Member State.
The Regulation provides for examination of mergers in twophases. In the first of these, the Commission must firstdetermine whether the operation falls within the scope ofthe Regulation. If the merger is caught by the Regulation,the Commission must then decide either that it does notraise serious doubts as to its effect on the conditions ofcompetition (Article 6(1)(b)) or that there are seriousdoubts necessitating the more detailed analysis of Phase 2(Article 6(1)(c)). A total of 1027 mergers were cleared inPhase 1, although in 45 cases the Commission only gave itsapproval after the parties had committed themselves tomeasures designed to eliminate potential harm to theconditions of competition.
The Phase 2 procedure was completed in 58 cases. In 11 ofthese the Commission decided on closer examination thatthere were no serious competition problems, while in 36cases the competition problems were resolved when theparties offered appropriate remedies. 11 mergers were for-bidden. These were:
Aérospatiale/De Havilland (1991)
MSG Media Service (1994),
Nordic Satellite Distribution (1995),
RTL/Veronica/Endemol (1995),
Gencor/Lonrho (1996),
Kesko/Tuko (1996),
Saint Gobain/Wacker Chemie/NOM (1996),
Blokker/Toys ‘R’ Us (1997),
Bertelsmann/Kirch/Premiere (1998),
Deutsche Telekom/Betaresearch (1998),
Airtours/First Choice (1999).
TABLE 21: Notifications and decisions under the Merger Regulation
1990 1991 1992 1993 1994 1995 1996 1997 1998 1999 Total
Cases notified 12 63 60 58 95 110 131 172 235 292 1228
Notifications withdrawn 0 0 3 2 6 4 6 9 9 12 51
Cases on which a final decision was taken1 7 60 60 57 90 109 125 134 235 268 1145
of which:
Article 6.1a (outside scope of Regulation) 2 5 9 4 5 9 6 4 6 1 51
Article 6.1b (Phase 1 clearance) without undertakings 5 47 43 49 78 90 109 118 207 236 982
Article 6.1b (Phase 1 clearance) with undertakings 0 3 4 0 2 3 0 2 12 19 45
Article 9 (full referral to national authorities) 0 0 0 1 0 0 3 1 1 3 9
Article 8.2 (clearance) without undertakings 0 1 1 1 2 2 1 1 2 0 11
Article 8.2 (clearance) with undertakings 0 3 3 2 2 3 3 7 5 8 36
Article 8.3 (prohibition) 0 1 0 0 1 2 3 1 2 1 11
1 Not all notifications were the subject of a decision or withdrawal in the same year. In two cases where mergers had already taken place, supplementary decisions were taken to re-quire the restoration of effective competition These decisions are not included here
j y g y p , pp yquire the restoration of effective competition. These decisions are not included here.Source: Commission services.
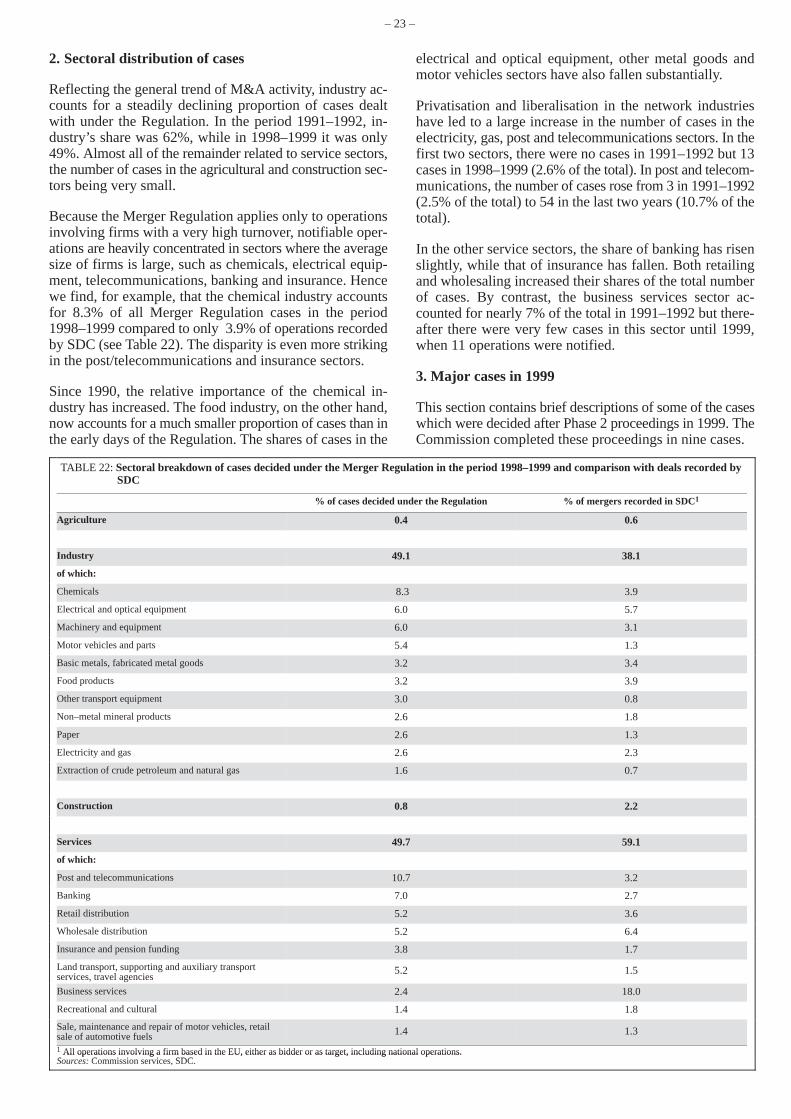
– 23 –
2. Sectoral distribution of cases
Reflecting the general trend of M&A activity, industry ac-counts for a steadily declining proportion of cases dealtwith under the Regulation. In the period 1991–1992, in-dustry’s share was 62%, while in 1998–1999 it was only49%. Almost all of the remainder related to service sectors,the number of cases in the agricultural and construction sec-tors being very small.
Because the Merger Regulation applies only to operationsinvolving firms with a very high turnover, notifiable oper-ations are heavily concentrated in sectors where the averagesize of firms is large, such as chemicals, electrical equip-ment, telecommunications, banking and insurance. Hencewe find, for example, that the chemical industry accountsfor 8.3% of all Merger Regulation cases in the period1998–1999 compared to only 3.9% of operations recordedby SDC (see Table 22). The disparity is even more strikingin the post/telecommunications and insurance sectors.
Since 1990, the relative importance of the chemical in-dustry has increased. The food industry, on the other hand,now accounts for a much smaller proportion of cases than inthe early days of the Regulation. The shares of cases in the
electrical and optical equipment, other metal goods andmotor vehicles sectors have also fallen substantially.
Privatisation and liberalisation in the network industrieshave led to a large increase in the number of cases in theelectricity, gas, post and telecommunications sectors. In thefirst two sectors, there were no cases in 1991–1992 but 13cases in 1998–1999 (2.6% of the total). In post and telecom-munications, the number of cases rose from 3 in 1991–1992(2.5% of the total) to 54 in the last two years (10.7% of thetotal).
In the other service sectors, the share of banking has risenslightly, while that of insurance has fallen. Both retailingand wholesaling increased their shares of the total numberof cases. By contrast, the business services sector ac-counted for nearly 7% of the total in 1991–1992 but there-after there were very few cases in this sector until 1999,when 11 operations were notified.
3. Major cases in 1999
This section contains brief descriptions of some of the caseswhich were decided after Phase 2 proceedings in 1999. TheCommission completed these proceedings in nine cases.
TABLE 22: Sectoral breakdown of cases decided under the Merger Regulation in the period 1998–1999 and comparison with deals recorded bySDC
% of cases decided under the Regulation % of mergers recorded in SDC1
Agriculture 0.4 0.6
Industry 49.1 38.1
of which:
Chemicals 8.3 3.9
Electrical and optical equipment 6.0 5.7
Machinery and equipment 6.0 3.1
Motor vehicles and parts 5.4 1.3
Basic metals, fabricated metal goods 3.2 3.4
Food products 3.2 3.9
Other transport equipment 3.0 0.8
Non–metal mineral products 2.6 1.8
Paper 2.6 1.3
Electricity and gas 2.6 2.3
Extraction of crude petroleum and natural gas 1.6 0.7
Construction 0.8 2.2
Services 49.7 59.1
of which:
Post and telecommunications 10.7 3.2
Banking 7.0 2.7
Retail distribution 5.2 3.6
Wholesale distribution 5.2 6.4
Insurance and pension funding 3.8 1.7
Land transport, supporting and auxiliary transport services, travel agencies
5.2 1.5
Business services 2.4 18.0
Recreational and cultural 1.4 1.8
Sale, maintenance and repair of motor vehicles, retailsale of automotive fuels 1.4 1.3
1 All operations involving a firm based in the EU, either as bidder or as target, including national operations.S C i i i SDC All operations involving a firm based in the EU, either as bidder or as target, including national operations.
Sources: Commission services, SDC.
– 24 –
One of these mergers was prohibited (Airtours/FirstChoice) and the other eight were authorised after the partieshad agreed to take measures to remedy the competitionproblems.
The largest merger in 1999 was Exxon/Mobil, with an ag-gregate world–wide turnover in 1998 of 168 billion. Theparties are involved in the vertical production chain ofcrude oil and natural gas. The Commission found that themerger would create or strengthen single or collectivedominant positions in the markets for (i) the wholesaletransmission of natural gas in the Netherlands, (ii) thewholesale transmission of natural gas in Germany, (iii) theunderground storage facilities for natural gas in the Southof Germany, (iv) Group I base oils (an ingredient of lubric-ants) in the EEA, (v) motor fuel retailing in Austria, Ger-many, Luxembourg, the Netherlands and the UK, (vi) avi-ation lubricants world–wide, (vii) aviation fuels at GatwickAirport.
The parties offered the following commitments which wereconsidered acceptable by the Commission:
(i) Gasunie, a company partly owned by Exxon, is domi-nant in the Dutch market for the wholesale transmission ofnatural gas. One of its two competitors is Mobil Europe GasInc., which the parties have committed to sell to maintainsome competition in the market.
(ii) The likelihood of collective dominance in the marketfor the wholesale transmission of natural gas in Germanyafter the merger is limited by accepting that Exxon sell itsinterest in one of the dominant companies (Thyssengas)and the parties reduce their voting rights in a potential com-petitor (Erdgas Münster).
(iii) The parties commit to offer Mobil’s interests in the de-pleted South German natural gas reservoirs at the marketprice, so that entry barriers into the market of undergroundstorage facilities are not increased as a result of the merger.
(iv) The parties will transfer the control of at least one com-pany producing base oils to BP/Amoco or other thirdparties.
(v) The parties will withdraw from the retail motor fuel acti-vities of the BP/Mobil joint venture.
(vi) Exxon will divest its assets in the field of aviation lu-bricants to commercial air companies.
(vii) The parties will sell pipeline capacity at Gatwick air-port equivalent to Mobil’s sales of aviation fuel at that air-port in 1998.
In the last two years there has been extensive restructuringin the oil industry. In 1998, the British Petroleum Companymerged with the Amoco Corporation. The following year,BP Amoco notified the take–over of Atlantic Richfield(Arco) and the investigation of this case was being carriedout at the same time as that of Exxon/Mobil. The Commis-sion found that the BP Amoco/Arco operation would createa dominant position in the market for the transport of unpro-cessed natural gas to the UK mainland through off–shorepipelines from fields in the Southern North Sea sector of theUK continental shelf. The Commission also considered that
the merged entity would be dominant in the market for pro-cessing natural gas in processing facilities on the UK main-land. The merger was approved after BP Amoco undertookto divest sufficient pipeline and processing interests to re-store the competitive status quo ante in these markets.
In the course of its investigations into the Exxon/Mobil andBP Amoco/Arco cases, the Commission consideredwhether the operations would lead to joint dominance by afew very large companies (the two merging companies andShell) in the markets for oil exploration and the develop-ment of oil fields. Given that there are still a number ofsmaller companies active in this field, the Commission con-cluded that countries with oil reserves would be capable ofpreventing these three companies from restricting produc-tion.
The only prohibition in 1999 concerned the proposed ac-quisition by the British tour operator Airtours of its domes-tic rival First Choice. This was the first prohibition decisionto be taken by the Commission on the ground of the creationof joint dominance by more than two firms. The parties’activities overlap mainly in the supply of leisure travel ser-vices in the UK and Ireland. Both parties are tour operatorsand they are also vertically integrated into the upstreammarket of airline operation and in the downstream activityof travel agency. The Commission considered that the mainimpact of the merger would be felt in the market for short–haul foreign package holidays sold in the U.K. In thismarket, Airtours/First Choice and two other leading verti-cally integrated tour operators would have had a position ofcollective dominance. The combined shares of these threefirms in the package holiday market would have been about85%, while no other firm has a market share above 5%. TheCommission found that there are significant barriers both tonew entry into the market and to the expansion of smallerfirms and that the merger was likely to raise these barriers. Itconsidered that upstream and downstream vertical integra-tion – ownership of charter airlines and travel agencies –gives the major tour operators a strong advantage. Verticalintegration also increases the transparency of the market,because operators buy aircraft seats from each other and useeach other’s travel agency networks to sell their packageholidays.
A peculiar feature of the market is that the supply of pack-age holidays is largely fixed well before sales begin (up toone year in advance), when the operators reserve aircraftseats and accommodation. Thereafter, an operator can in-crease its supply by, at most, 10% until February of the yearin which the holiday takes place. Moreover, the operator in-curs substantial cancellation charges if it reduces thenumber of holidays offered. Supply is therefore quite in-flexible once the selling season has begun. In these circum-stances, major tour operators have a strong incentive to re-strict supply rather than to compete aggressively to gainmarket share, because of the risk that the market will beoversupplied, leading to a sharp drop in prices and conse-quently to losses for all players in the market. The Commis-sion considered that this risk would be significantly in-creased by the reduction of the number of major operatorsfrom four to three and, hence, there would be an even
– 25 –
stronger incentive for the remaining three to adopt a com-mon strategy of restricting supply.
Two interesting cases occurred in the telecommunicationssector. Although the merger between Telia and Telenor wasaborted after the Commission’s clearance decision wastaken, it was important as it was the first case involving amerger between two incumbent national telecommunica-tions operators to be analysed under the Merger Regulation.It was proposed that the Swedish and the Norwegian gov-ernments would share joint control over the merged entity.
The Commission found that the merger would create orstrengthen a dominant position in the national telecom-munications markets in Sweden and Norway, in the mobiletelephony markets in Sweden, Norway and Ireland, and invarious sub–markets in the field of television, where thegeographical extent is at least national. Indeed, the result ofthe operation would have been the creation of an entity withdominant positions covering the whole value–chain of thetelephony and TV sectors. In particular, the Commissionemphasised the fact that Telia and Telenor were eachother’s closest actual or potential competitors in most ofthese markets, so that a merger would have removed amajor competitive constraint.
To avoid a prohibition decision, the parties offered wide–ranging remedies. In the field of television services, theconcerns due to the additional business activities that Teliawould have brought into the merged entity have been re-moved by divestiture of their cable TV business. In the fieldof telecommunications, Telia and Telenor agreed to allowcompetitors access to their respective local access networks(local loop unbundling). By granting new entrants the abil-ity to establish a unique customer relationship with their cli-ents, this undertaking would have ensured that the mergedentity would be subject to some degree of competition. Fi-nally, the overlapping businesses of the two companieswere to be divested. Telia was to sell Telia Norge, whichcompetes with Telenor in Norway, and Telenor woulddivest Telenordia, which competes with Telia in Sweden. Inthis way Telenordia and Telia Norge would be independentcompetitors after the merger, with the possibility of im-proving their foothold as a consequence of the commitmentto unbundle the local loop. However, for reasons uncon-nected with the conditions of approval, the parties later de-cided not to consummate the merger.
An important joint venture in the telecommunications sec-tor was established by BT and AT&T, respectively the fifthand the second biggest telecommunications operatorsworld–wide. The parties will contribute to the joint venturemost of the assets and facilities of their international net-work operations. The two main activities of the joint ven-ture will be the provision of global telecommunications ser-vices to multinational corporate customers (MNCs), as well
as international carrier services to carriers. In the mediumterm, the joint venture intends to develop Internet Protocol(IP) based services for a range of voice and data products.The joint venture will appoint BT and AT&T as its exclus-ive distributors, and the parties will no longer be indepen-dently active on the markets of the joint venture.
The Commission identified the following activities asbeing the relevant markets for the assessment of the oper-ation: the provision of global telecommunications servicesto multinational companies world–wide, the provision ofinternational carrier services at least Europe–wide andpossibly at the global level, the U.K. market for the provi-sion of international voice telephony services on the U.K.–U.S.A. route, and for certain U.K. services. In all markets,the Commission concluded that the operation would notlead to the creation or strengthening of a dominant position.
However, the creation of a joint venture may have the effectof coordination of the behaviour of the parent companies,and such coordination needs to be appraised. Candidatemarkets for coordination are those on which the joint ven-ture and at least two parent companies are active, or closelyrelated neighbouring markets where at least two parentcompanies remain active. The Commission raised issues ofcoordination in three instances:
(1) ACC UK is a subsidiary of ACC Corp, which is whollyowned by AT&T and which competes with BT on certainservices in the U.K. As a remedy, AT&T offered to divestACC to a suitable purchaser.
(2) Telewest is a U.K. cable television company which cur-rently competes with BT on the provision of telecommuni-cations services and dial–up Internet access services. 22%of Telewest belongs to TCI, which has been purchased byAT&T. To allay the concern about possible coordination be-tween BT and Telewest, AT&T committed itself to the cre-ation of a greater structural separation between AT&T andTelewest.
(3) AT&T Communications UK Ltd is the exclusive dis-tributor in the U.K. of voice and data services for AT&TUnisource Communications Services (AUCS) but it willcease trading after having contributed its U.K.–based acti-vities to the joint venture. AT&T could then have been inthe position to prevent AUCS from addressing U.K.–basedpotential customers, in order to encourage actual and poten-tial competitors to move to the joint venture. AT&T sub-mitted an undertaking to waive any right it may have to ob-ject to the appointment of a new U.K. distributor of AUCSservices.
14 November 2000

– 26 –

– 27 –
– 28 –
Principal economic policy measures – May 2000
Community (EU–15)3.5 The Commission adopts its convergence report 2000 in which it con-cludes that Greece fulfils the necessary conditions to adopt the euro. As re-gards Sweden, and with a view to the exchange rate criterion, the report con-cludes that there should be no change in the status as a Member State with aderogation. The convergence process in Denmark and the United Kingdomhas not been assessed. These countries with an opt–out arrangement have notnotified their intention to adopt the euro.8.5 The Ecofin Council examines the annual update of the Austrian stabilityprogramme. The Council notes in its Opinion that Austria envisages the gen-eral government deficit to fall to 1.3 % of GDP by 2003. The envisaged me-dium–term deficit net of one–off measures to meet the costs of an income taxreform is not fully in line with the requirements of the Stability and GrowthPact. It does not give a large enough safety margin to prevent the deficit frombreaching 3 % of GDP in case of a cyclical downturn. The Council urges toreduce the deficit targets in the next programme update.
Belgium (B)None.
Denmark (DK)None.
Germany (D)18.5 Tax reform package is approved by The German Bundestag. It involvescorporate and income tax cuts amounting to DEM 45 billion in tax relief be-tween 2001 and 2005.
Greece (EL)None.
Spain (E)None.
France (F)3.5 Prime Minister Jospin sends the ”lettre de cadrage” to his ministers. The”lettre de cadrage” is the first guideline for the preparation of the 2001budget. State spending is planned to increase by 0.3% in real terms in 2001,consistent with the updated stability programme, in which State spending inreal terms is projected to grow by a cumulative 1% in the years 2001–2003.
Ireland (IRL)None.
Italy (I)None.
Luxembourg (L)None.
Netherlands (NL)None.
Austria (A)18.5 The Parliament adopts the budget for the year 2000.23.5 The European Court of Justice rules against gender specific early retire-ment ages in cases of partial professional disability as not in line with EU law.As a consequence, the respective early retirement age will be set at 55 yearsfor men (previously 57 years) and women alike with immediate effect.
Portugal (P)12.5 In the coming months, the government plans to sell in auction about120 buildings, totalling a minimum revenue of 180 million (about 0.2% of
GDP). According to the Treasury Secretary of State, the total revenue fromprivatisations is likely to exceed the planned PTE 500 billion (2.3% of GDP)projected in the 2000 budget.17.5 The government announces that 4 UMTS licences will be sold in anopen competition in September, rather than in an auction. This seems to bemotivated by two reasons: i) to guarantee that a UMTS licence will be allo-cated to each of the current three mobile operators (TMN, Telecel and Opti-mus); and, ii) to curb final user prices, which might be higher after an auctionsale. Effectively, only one UMTS licence is open to competition. The prices tobe paid for the licences will be fixed in July.The government announces that local fixed–line telephony will be liberalisedin the first half of 2001.The government announces that an open competition will be held in thecoming months to sell a licence for a ground digital TV, the revenue fromwhich is estimated at more than PTE 100 billion (�% of GDP).The government announces important changes in personal income taxationto be introduced in the coming months, involving an overall broadening ofthe tax base.
Finland (FIN)16.5 The government decides on a supplementary budget, to be submitted toparliament on 19.5. The total amount is some FIM 19 billion (2.7% of GDP).The major part is made up of debt redemption and associated items, amount-ing to some FIM 17 billion. Over FIM 2 billion is allocated to extra adminis-trative expenses, mostly to cover this year’s civil service wage award. Afurther FIM ��billion is allocated to the state–owned venture capital firm. Onthe revenue side, over half the funding (FIM 10.4 billion) comes from priva-tisation receipts, mainly from sales of Sonera shares. Tax revenue estimateshave been revised up by FIM 6.5 billion, mainly corporate income tax. Esti-mated property income has been revised up by FIM 2.1 billion. The govern-ment proposes to cut employers’ national pension contributions for low wageearners from July.26.5 A government resolution is passed on the use of privatisation proceedsduring the government’s remaining three years in office (2000–2003). Thebulk of proceeds will be allocated to debt redemption. In addition, the Gov-ernment intends to accumulate funds in the State Pension Fund at a faster ratethan previously planned. Higher expenditure of approximately FIM 1 billionover 2000–2003 is also foreseen, mostly for universities, and to provide addi-tional funding to the Academy of Finland and for extending service provisionby means of information technology. The government is seeking Parliamentauthority to sell all State shares in Sonera Oy (telecoms company).30.5 The government decides that state shareholdings in all but two state–owned companies (dealing with defence equipment and peat production) canbe reduced to below 50% (including complete sales), and that sales can takeplace when “reasonable from an economic point of view”. Parliamentaryauthority is to be sought for selling remaining stakes in the companies Kemira(chemicals, at present 53% state–owned), Outokumpu (metals and mining,40%) Rautaruukki (steel, 40%); at present parliamentary authority exists toreduce stakes to a third. Parliamentary authority is also to be sought to reducethe state shareholding in Fortnum (energy, 75%) to a third and to reduceshareholdings in several smaller companies.
Sweden (S)17.5 The Parliament approves the government’s bill on the flotation of atmost 49% of the shares in Telia (the major and publicly–owned telecommuni-cations company). The price of the shares is set on 20–21 May.
United Kingdom (UK)None.