Embed Size (px)
Citation preview

EuropeanEconomic Forecast
EuropEan Economy 2|2014
Economic and Financial Affairs
Winter 2014
ISSN 1725-3217 (online)
ISSN 0379-0991 (print)
The European Economy series contains important reports and communications from the Commission to the Council and the Parliament on the economy and economic developments Unless otherwise indicated the texts are published under the responsibility of the European Commission Directorate-General for Economic and Financial Affairs Unit Communication B-1049 Brussels Belgium E-mail ecfin-infoeceuropa
LEGAL NOTICE Neither the European Commission nor any person acting on its behalf may be held responsible for the use which may be made of the information contained in this publication or for any errors which despite careful preparation and checking may appear This paper exists in English only and can be downloaded from httpeceuropaeueconomy_financepublications More information on the European Union is available on httpeuropaeu
KC-AR-14-002-EN-N (online) KC-AR-14-002-EN-C (print) ISBN 978-92-79-35344-4 (online) ISBN 978-92-79-36003-9 (print) doi10276575614 (online) doi10276576570 (print)
copy European Union 2014 Reproduction is authorised provided the source is acknowledged
European Commission Directorate-General for Economic and Financial Affairs
European Economic Forecast Winter 2014
EUROPEAN ECONOMY 22014
ABBREVIATIONS
ii
Countries and regions
EU European Union
EA euro area
BE Belgium
BG Bulgaria
CZ Czech Republic
DK Denmark
DE Germany
EE Estonia
IE Ireland
EL Greece
ES Spain
FR France
HR Croatia
IT Italy
CY Cyprus
LV Latvia
LT Lithuania
LU Luxemburg
HU Hungary
MT Malta
NL The Netherlands
AT Austria
PL Poland
PT Portugal
RO Romania
SI Slovenia
SK Slovakia
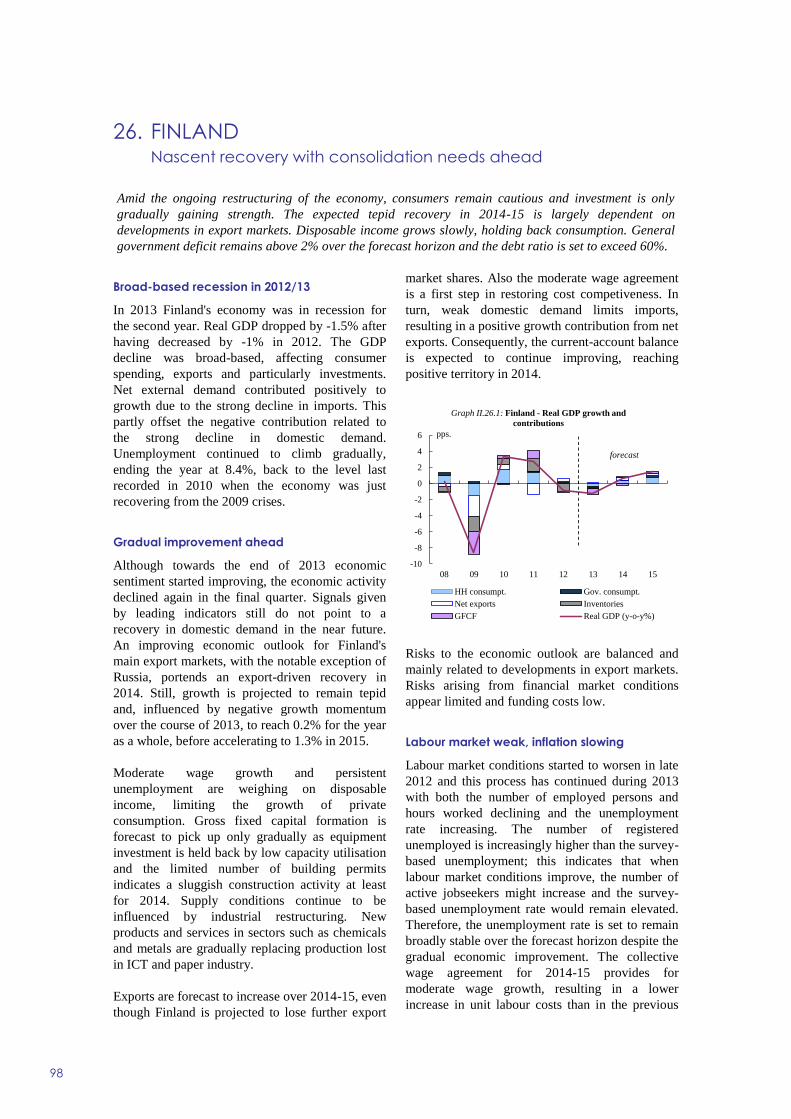
FI Finland
SE Sweden
UK United Kingdom
JP Japan
US United States of America
BRICS Brazil Russia India China and South Africa
CEE Central and Eastern Europe
CIS Commonwealth of Independent States
EFTA European Free Trade Association
MENA Middle East and North Africa
ROW Rest of the World
Economic variables and institutions
BCS Business and Consumer Surveys
CDS Credit Default Swaps
EDP Excessive Deficit Procedure
ESI Economic Sentiment Indicator
Euribor European Interbank Offered Rate
GDP Gross Domestic Product
GNI Gross National Income
HICP Harmonised Index of Consumer Prices
Libor London Interbank Offered Rate
iii
NAWRU Non-Accelerating Wage Rate of Unemployment
PMI Purchasing Managers Index
REER Real Effective Exchange Rate
SGP Stability and Growth Pact
VAT Value-Added Tax
CPB Centraal Planbureau the Netherlands Bureau for Economic Policy Analysis
ECB European Central Bank
EIB European Investment Bank
EFSF European Financial Stability Facility
EMU Economic and Monetary Union
ESM European Stability Mechanism
FOMC Federal Open Market Committee US
Fed Federal Reserve US
IMF International Monetary Fund
OBR Office for Budget Responsibility UK
OECD Organisation for Economic Cooperation and Development
WTO World Trade Organisation
Other abbreviations
AQR Asset Quality Review
BLS Bank Lending Survey
CFCI Composite Financing Cost Indicator
DSGE Dynamic stochastic general equilibrium [model]
FDI Foreign Direct Investment
FLS Funding for Lending Scheme UK
FY Financial year
JPA Job Protection Plan Hungary
LFS Labour Force Survey
LTRO Longer-Term Refinancing Operation
MRO Main Refinancing Operations
NFC Non-Financial Corporations
OMT Outright Monetary Transactions
SME Small and medium-sized enterprises
SMP Securities Market Programme ECB
QUEST Quarterly Estimation and Simulation Tool DG ECFINs DSGE model
GraphsTablesUnits
aa Annual average
bbl Barrel
bn Billion
bps Basis points
lhs Left hand scale
pp pps Percentage point points
pts Points
Q Quarter
q-o-q Quarter-on-quarter percentage change
rhs Right hand scale
SAAR Seasonally-Adjusted Annual Rate
tn Trillion
y-o-y Year-on-year percentage change
iv
Currencies
EUR Euro
ECU European currency unit
BGN Bulgarian lev
CNY Chinese yuan renminbi
CZK Czech koruna
DKK Danish krone
GBP Pound sterling
HUF Hungarian forint
HRK Croatian kuna
ISK Icelandic krona
LTL Lithuanian litas
LVL Latvian lats
MKD Macedonian denar
NOK Norwegian krone
PLN Polish zloty
RON New Romanian leu
RSD Serbian dinar
SEK Swedish krona
CHF Swiss franc
JPY Japanese yen
TRY Turkish lira
USD US dollar
CONTENTS
v
Overview 1
PART I EA and EU outlook 7
Recovery gaining ground 9
1 The recovery is firming in the EU 9
2 The external environment 11
3 Financial markets in Europe 13
4 GDP and components in the EU 15
5 Labour market conditions in the EU 21
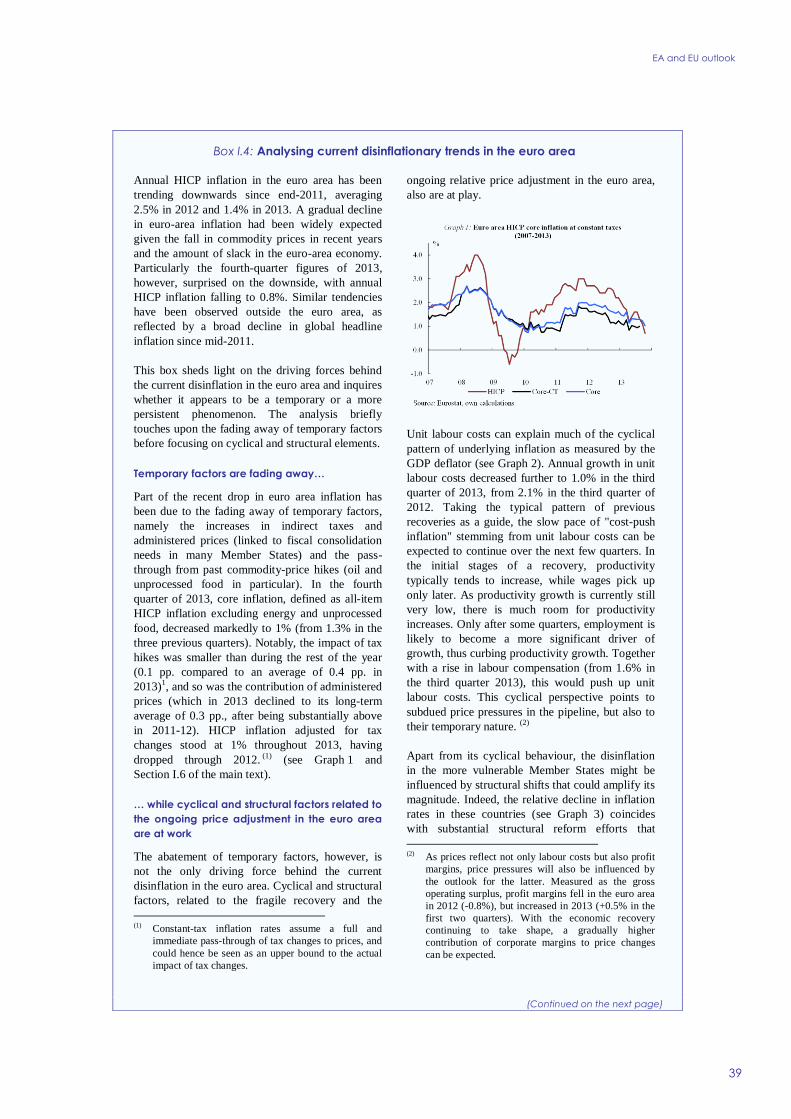
6 Inflation in the EU 23
7 Public finances in the EU 24
8 Risks 26
PART II Prospects by individual economy 45
Member States 47
1 Belgium Growth expectations up inflation down 48
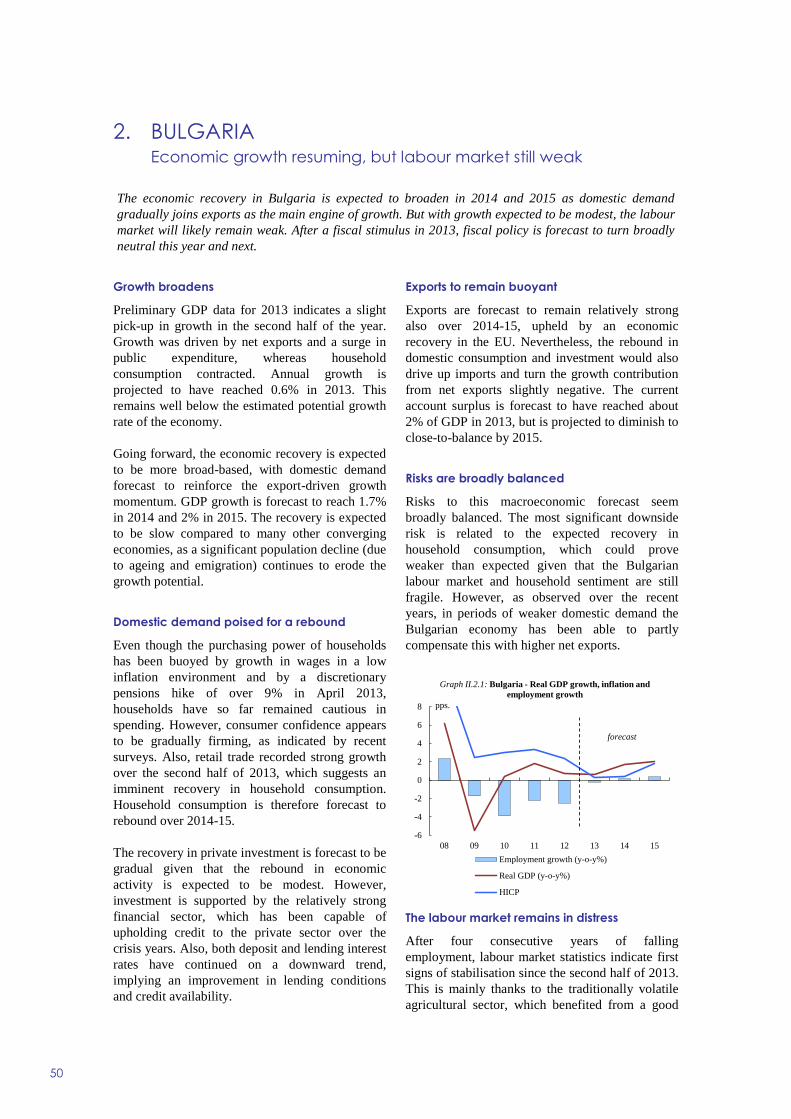
2 Bulgaria Economic growth resuming but labour market still
weak 50
3 The Czech Republic Economic activity to strengthen in 2014 52
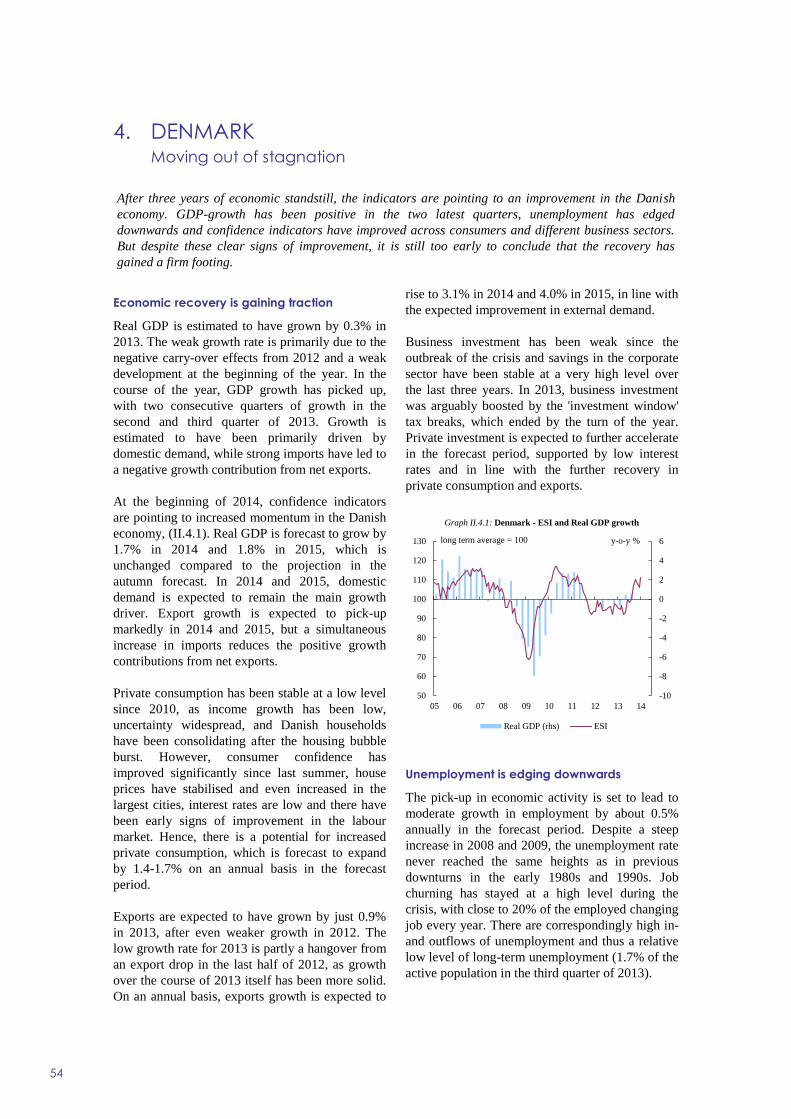
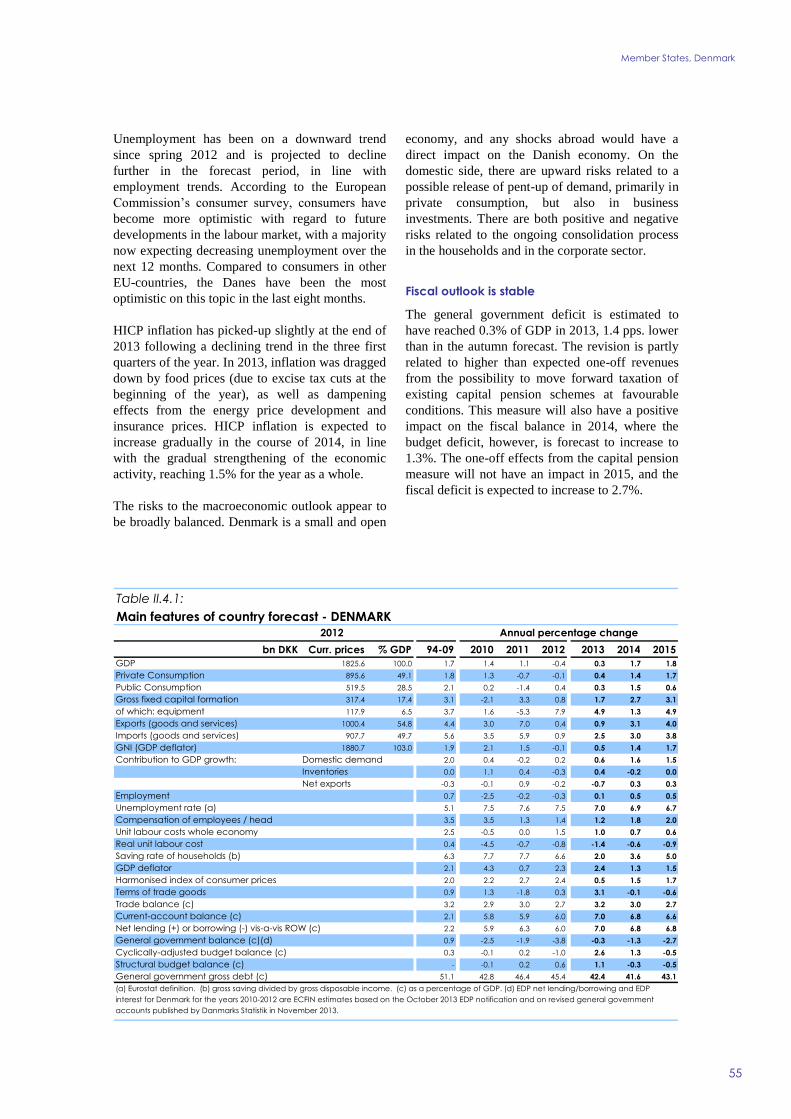
4 Denmark Moving out of stagnation 54
5 Germany Accelerated growth in the offing 56
6 Estonia GDP growth regaining momentum with recovering
exports 58
7 Ireland Adjustment supported by stronger economic growth 60
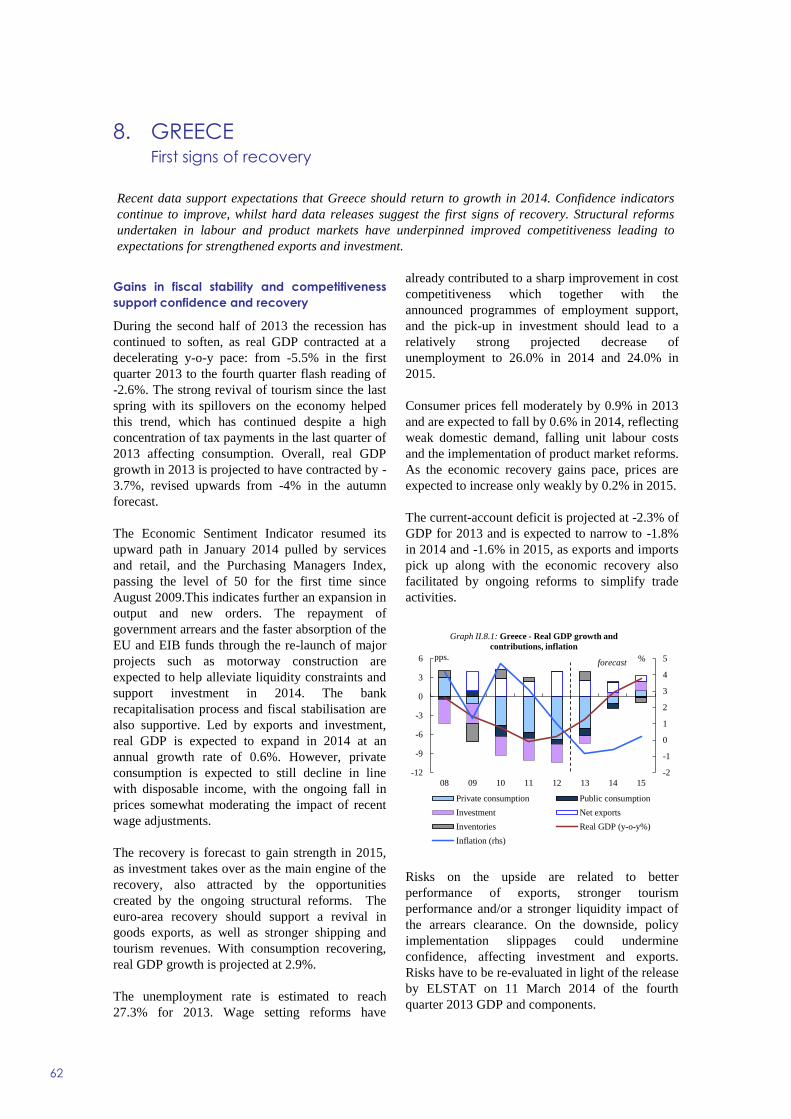
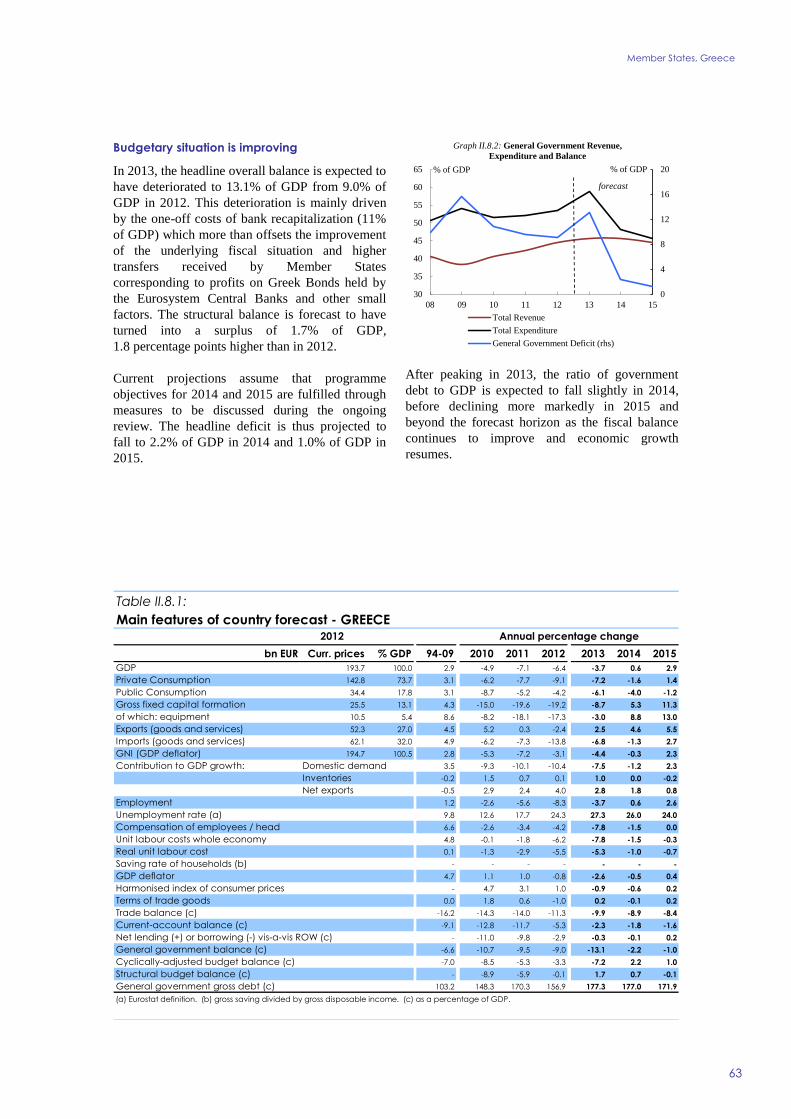
8 Greece First signs of recovery 62
9 Spain The recovery becomes firmer while the rebalancing of the
economy continues 64
10 France Recovery remains slow amid sizeable budget deficits 66
11 Croatia Muted growth prospects amid a high fiscal deficit and
rising debt 68
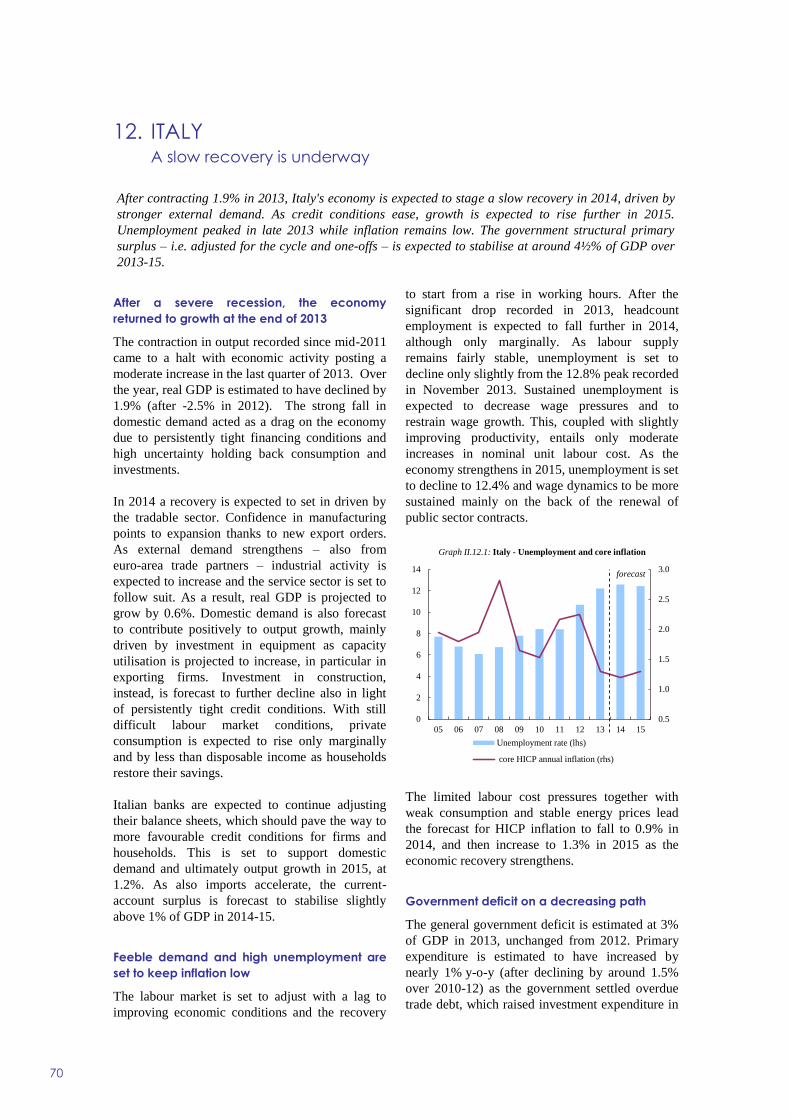
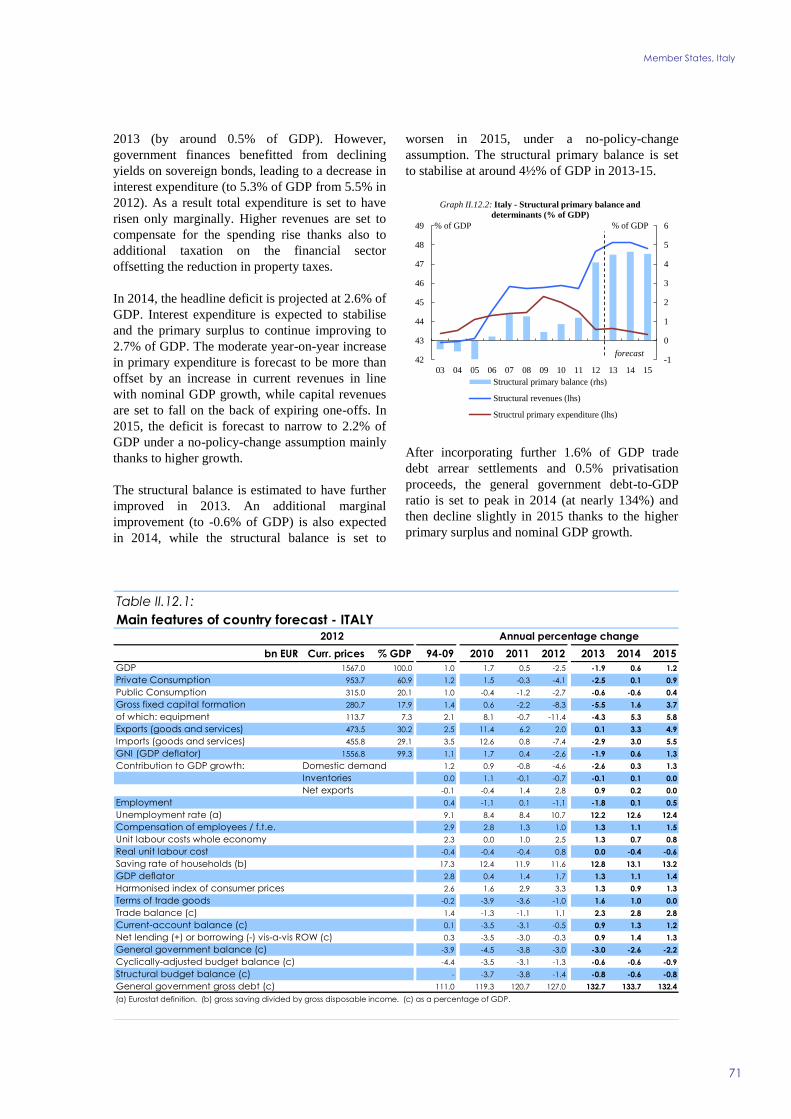
12 Italy A slow recovery is underway 70
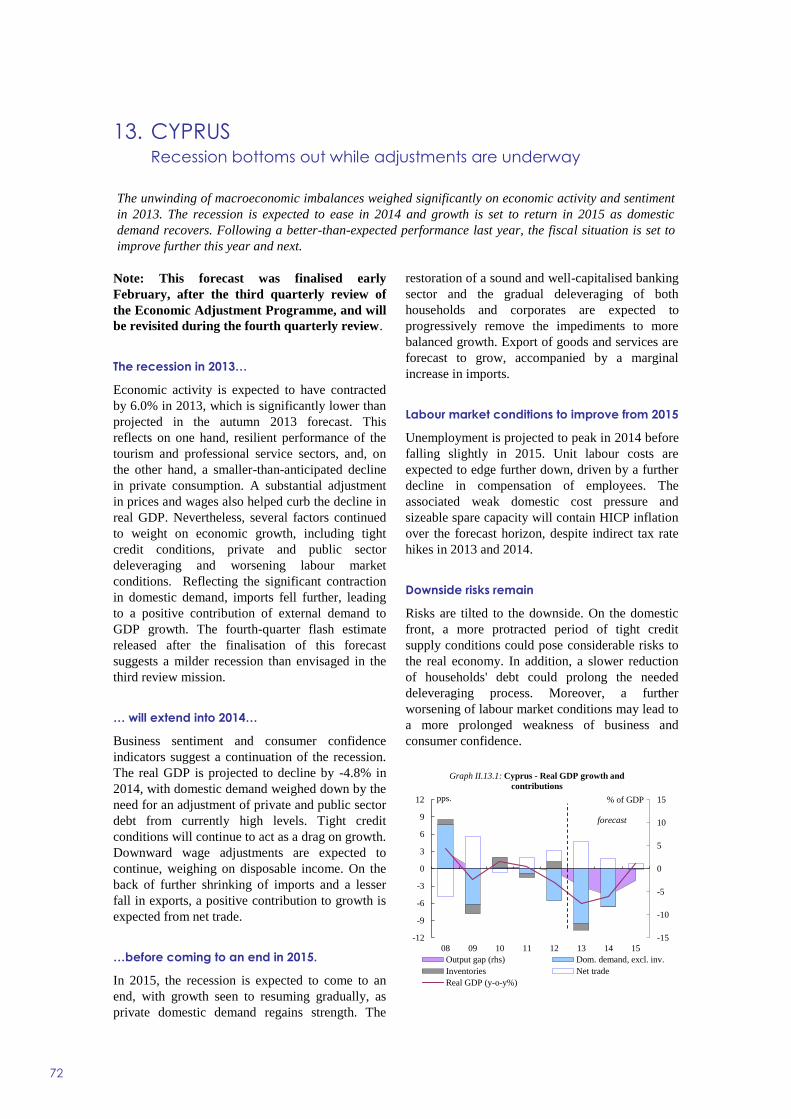
13 Cyprus Recession bottoms out while adjustments are underway 72
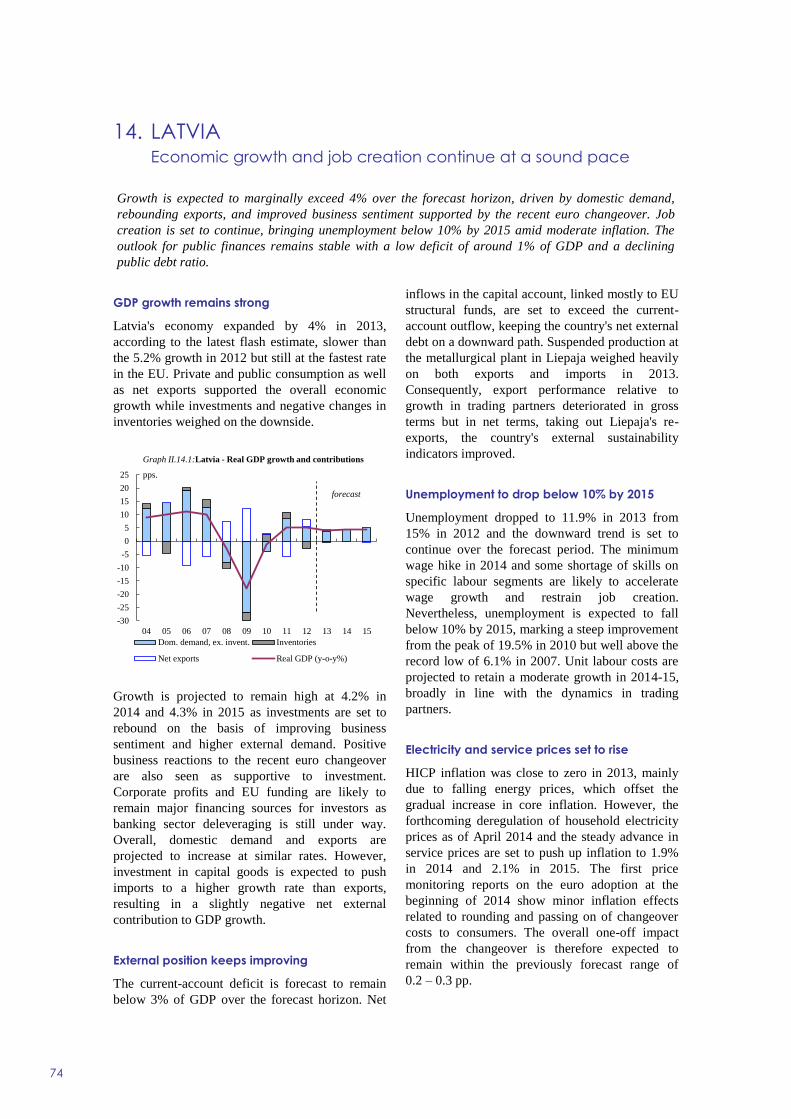
14 Latvia Economic growth and job creation continue at a sound
pace 74
15 Lithuania Solid growth continues in a context of
macroeconomic stability 76
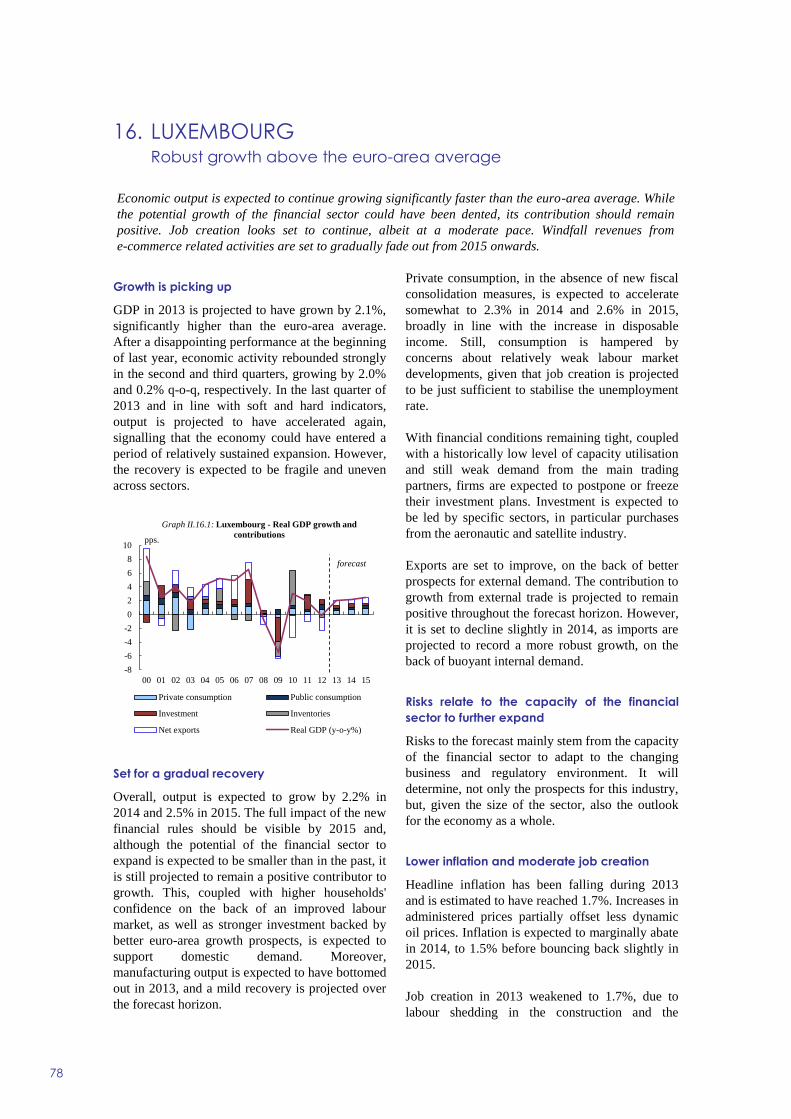
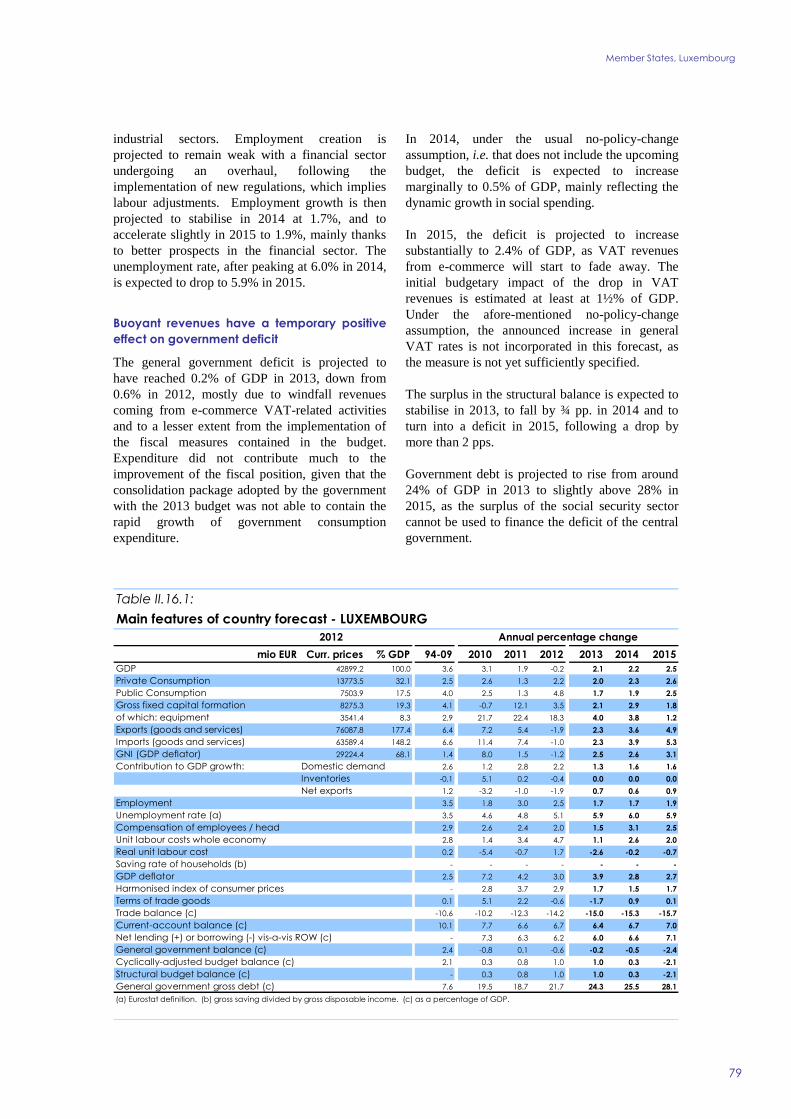
16 Luxembourg Robust growth above the euro-area average 78
17 Hungary A mild recovery sustained by domestic demand 80
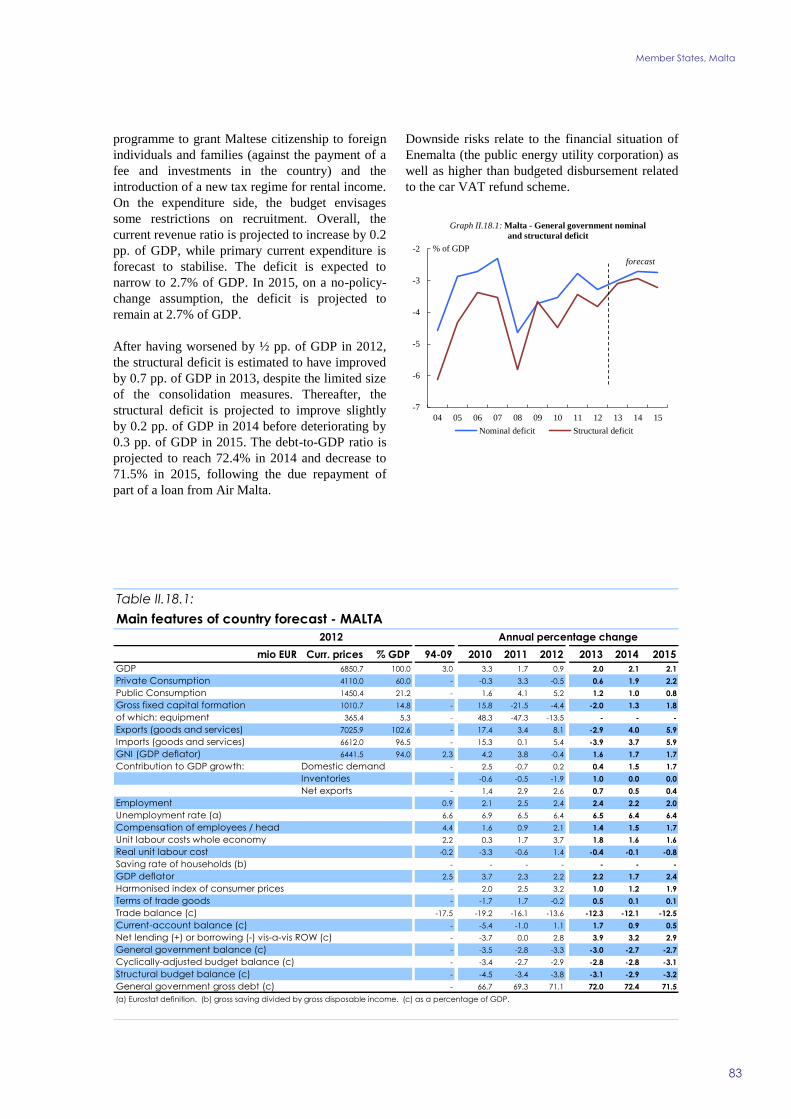
18 Malta Private consumption to drive growth 82
19 The Netherlands Economic recovery takes shape after two years
of recession 84
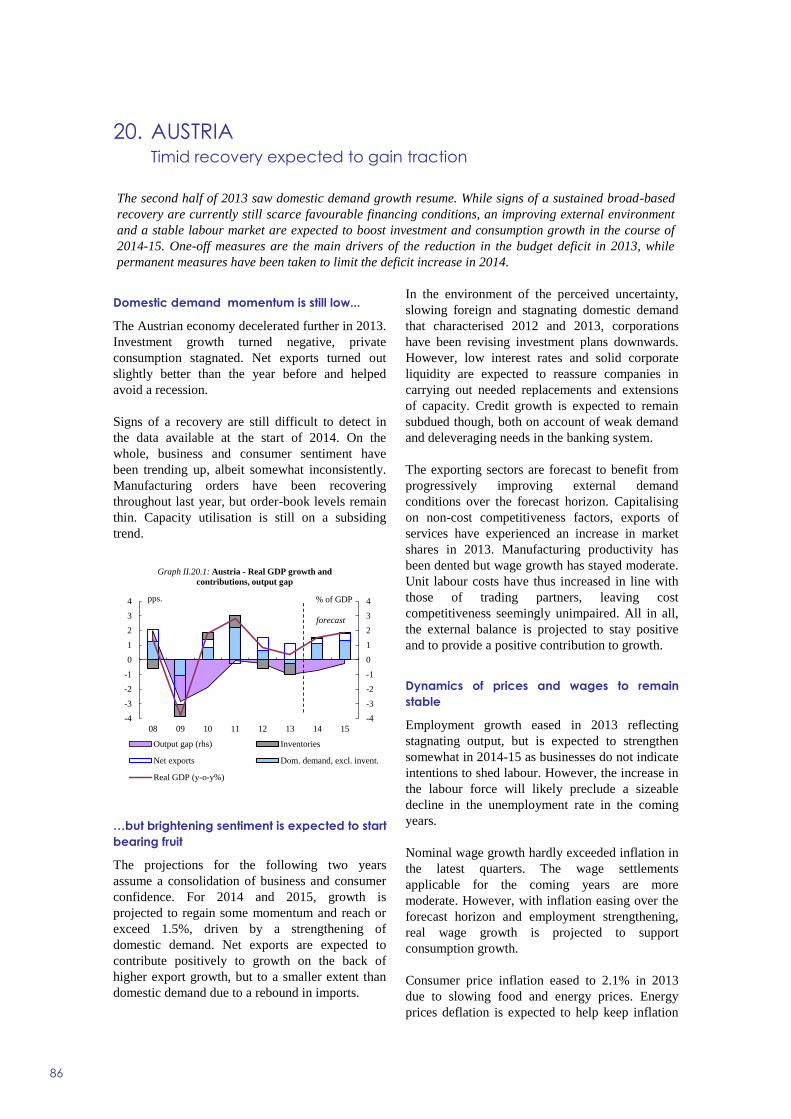
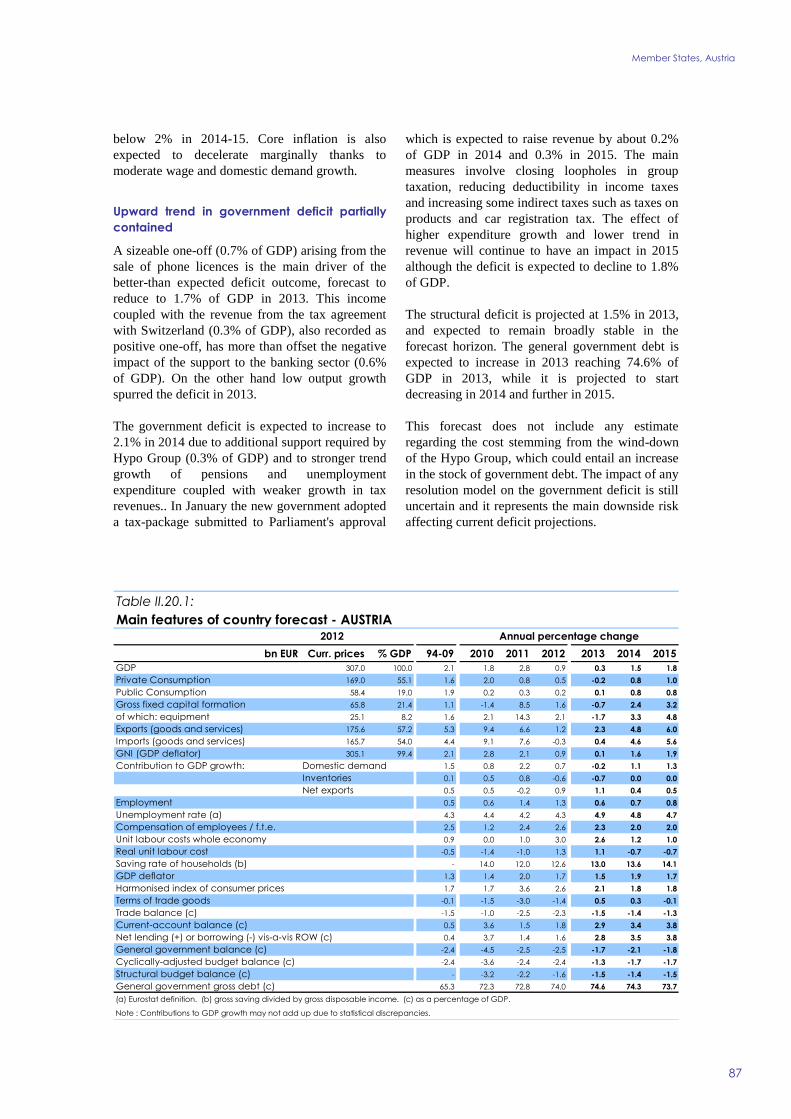
20 Austria Timid recovery expected to gain traction 86
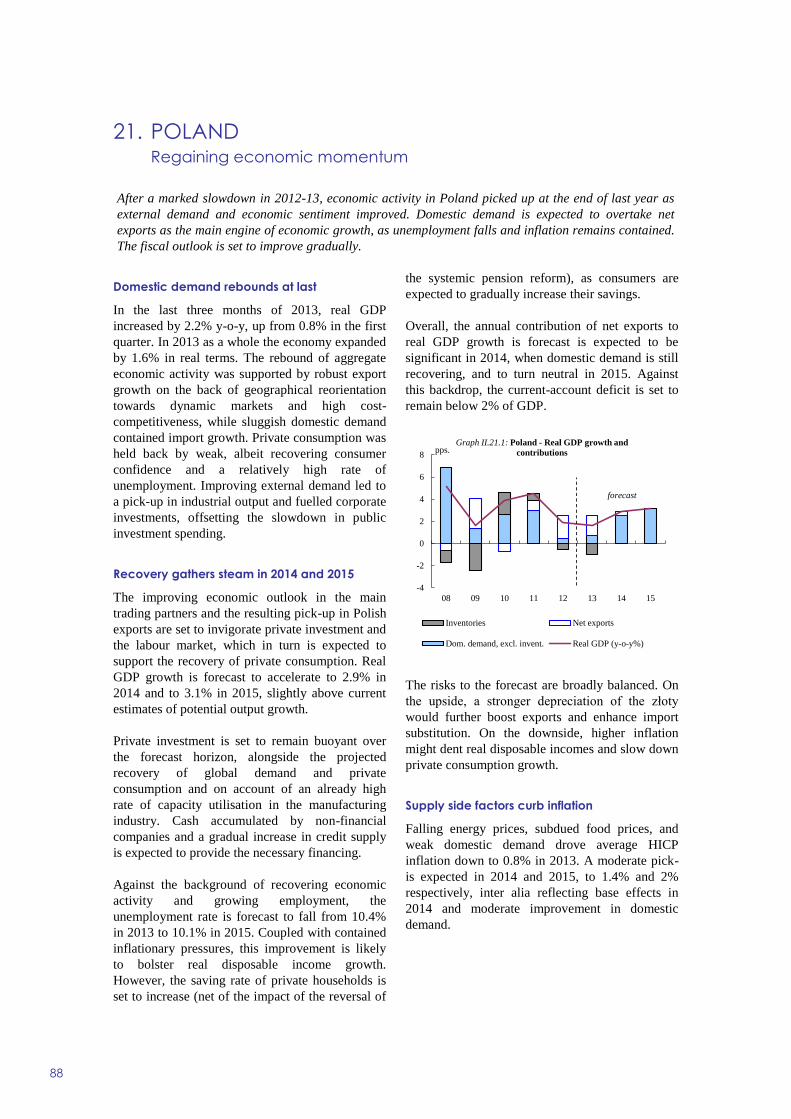
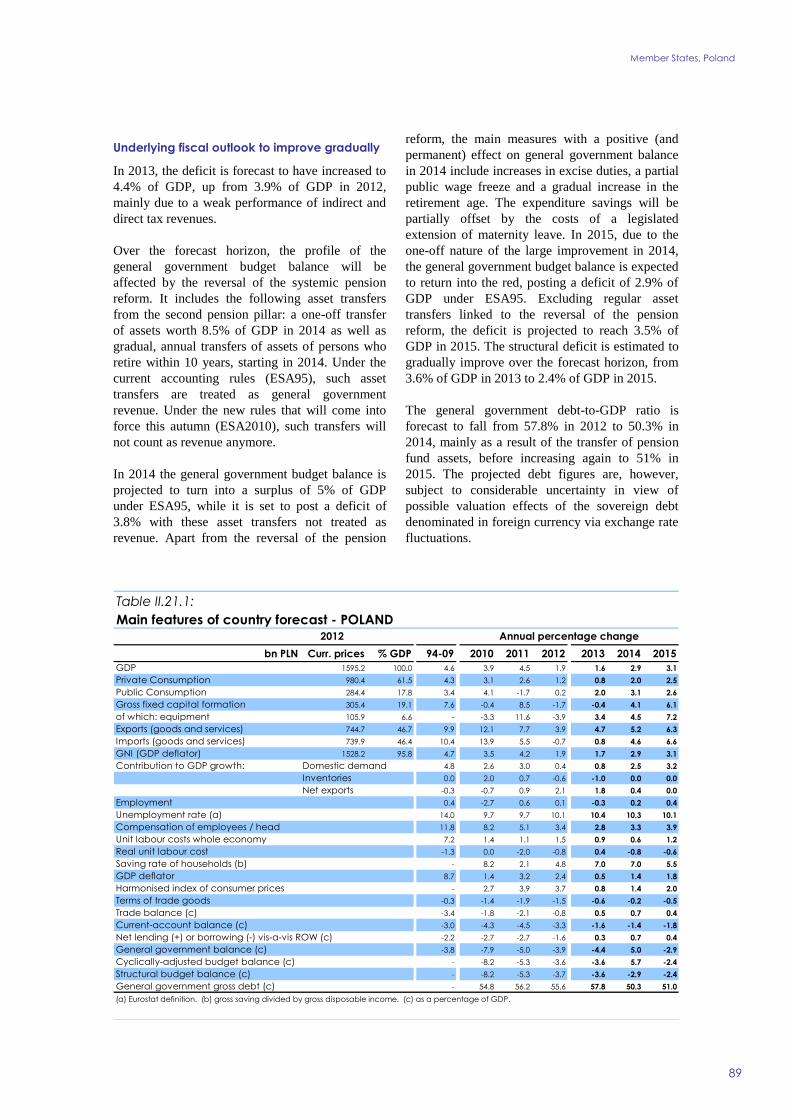
21 Poland Regaining economic momentum 88
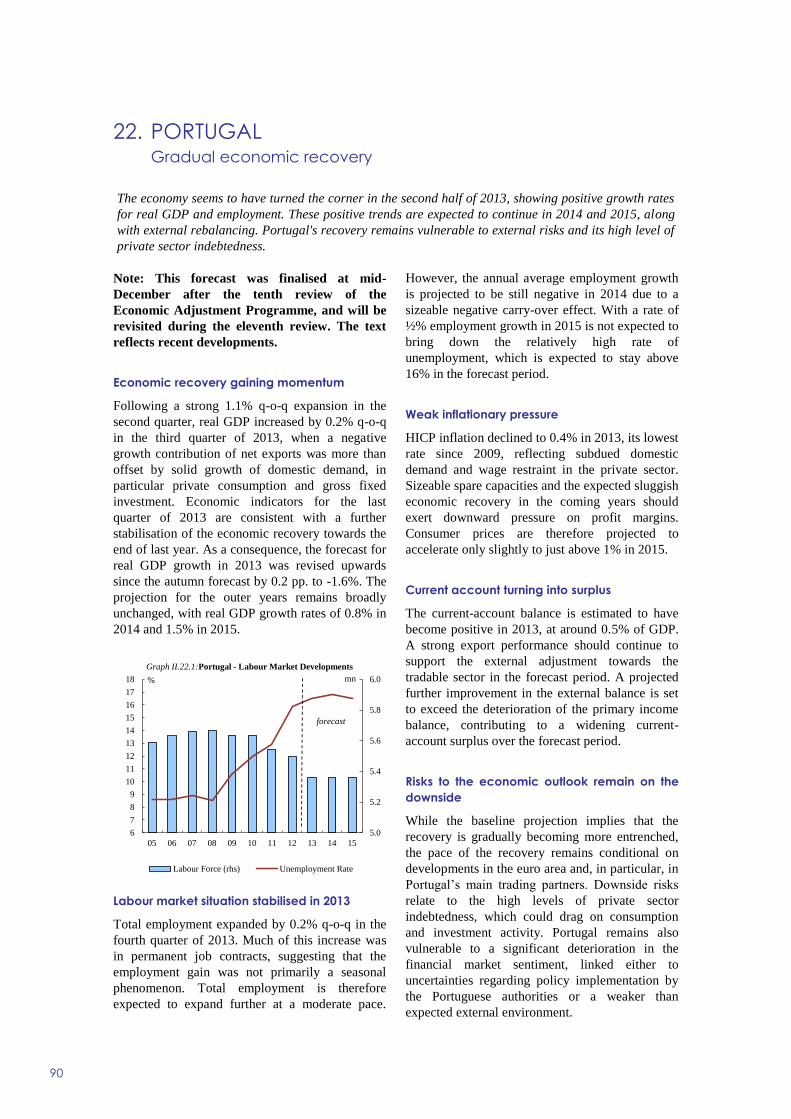
22 Portugal Gradual economic recovery 90
23 Romania Export-led rebound turning into a more broad-based
recovery 92
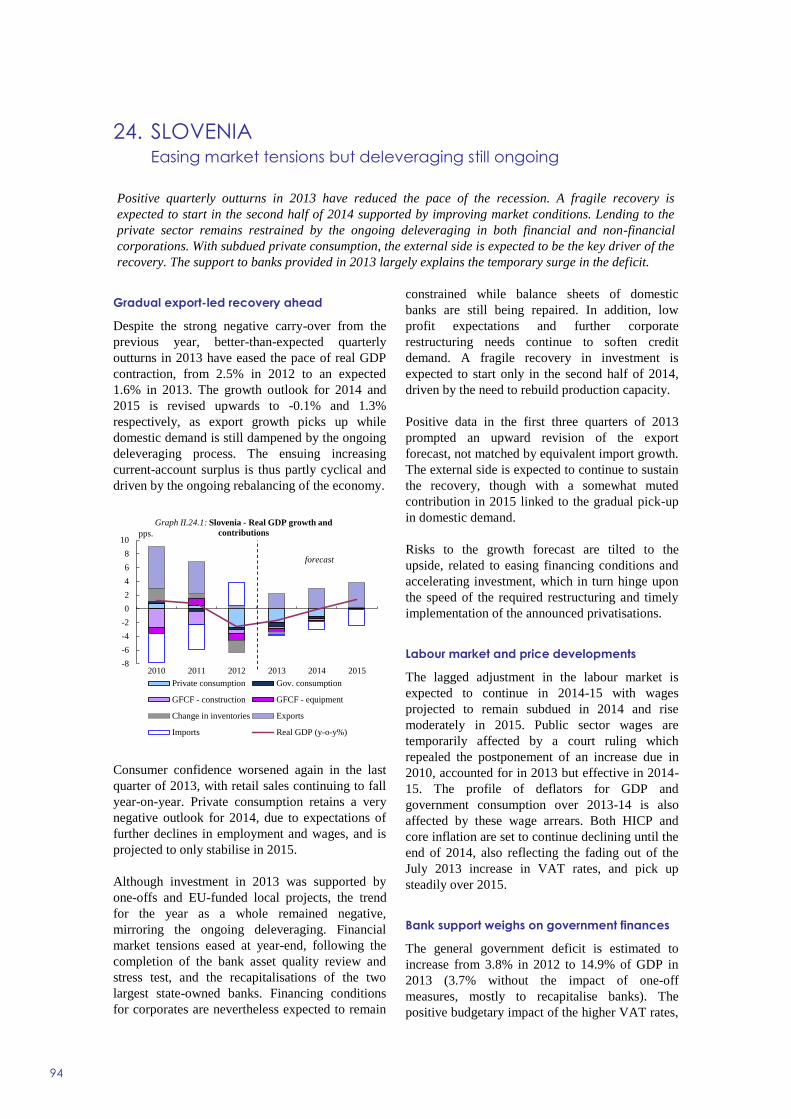
24 Slovenia Easing market tensions but deleveraging still ongoing 94
vi
25 Slovakia Growth to pick up in 2014 96
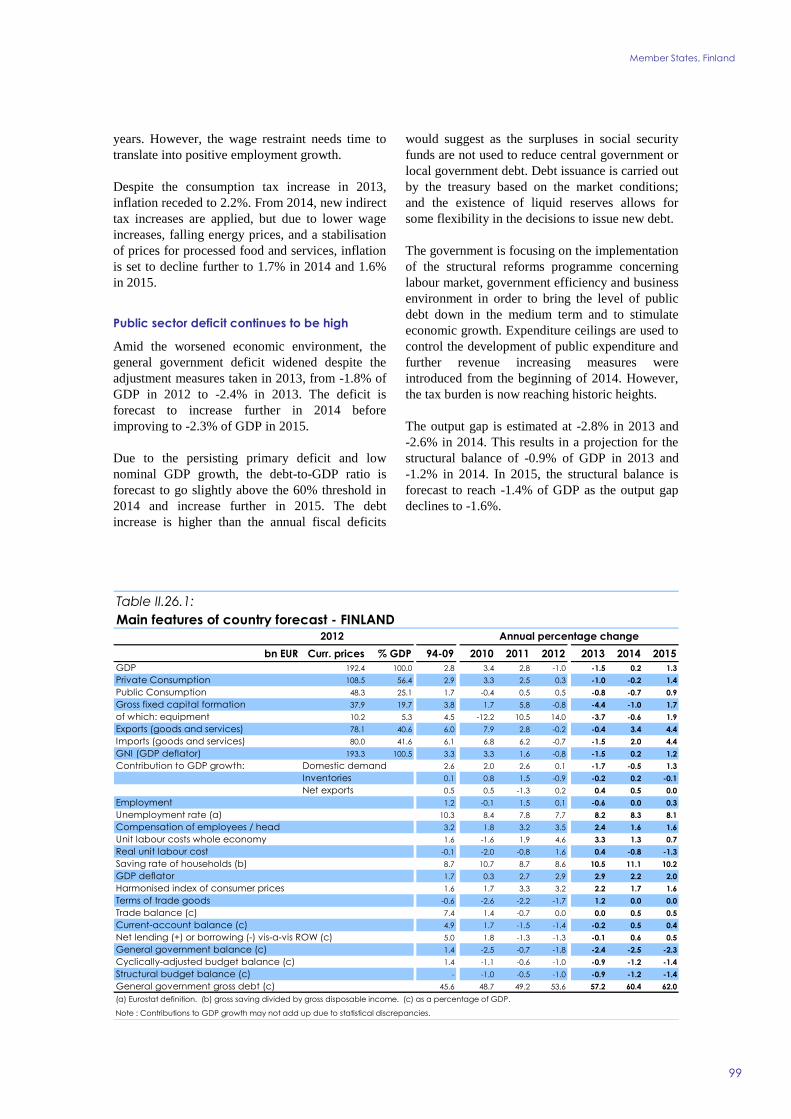
26 Finland Nascent recovery with consolidation needs ahead 98
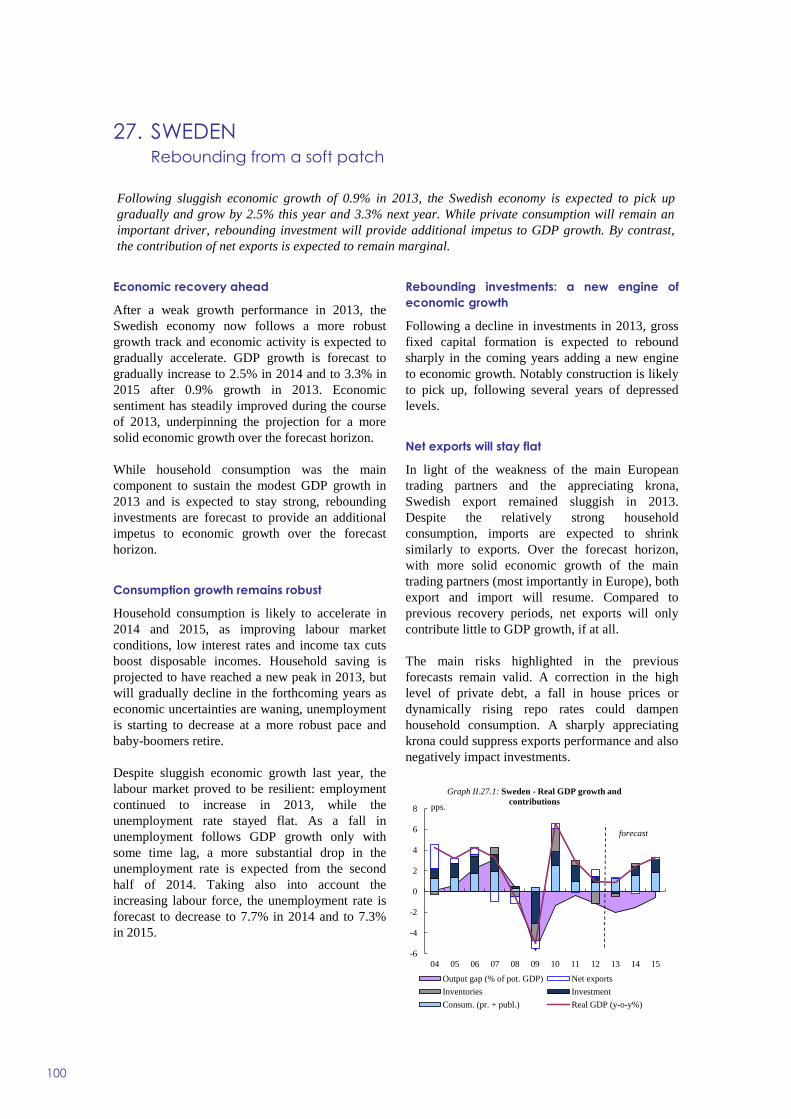
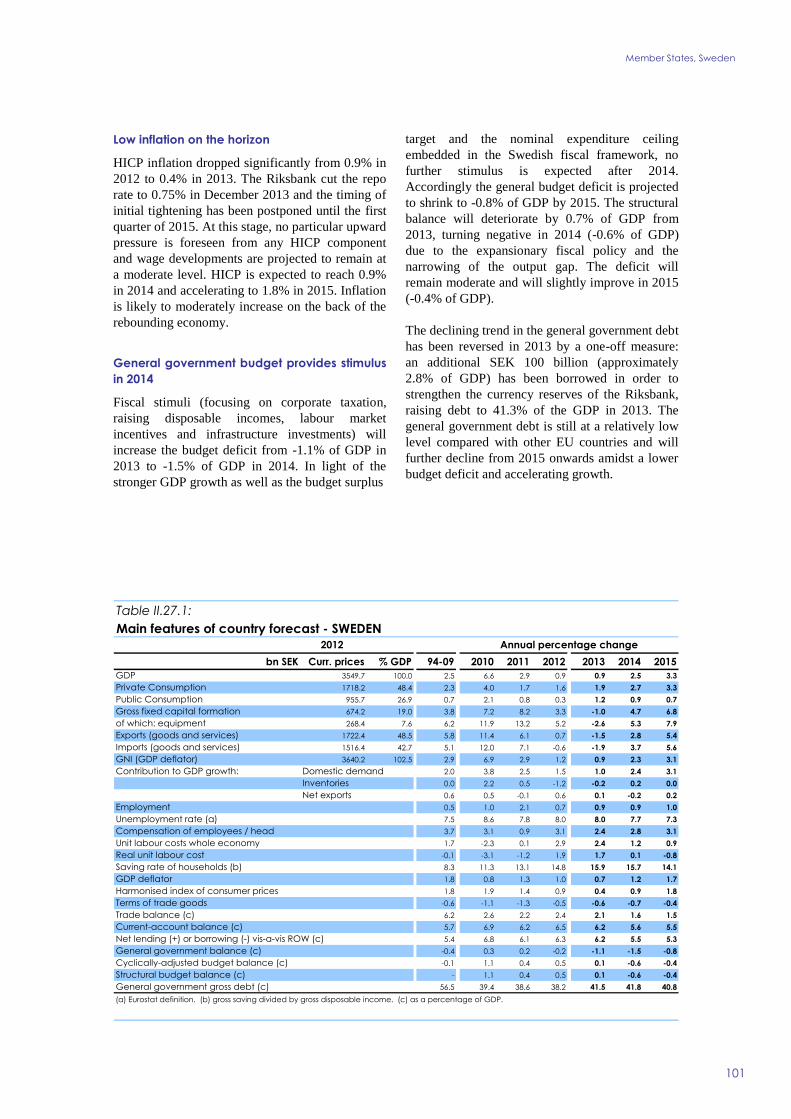
27 Sweden Rebounding from a soft patch 100
28 The United Kingdom Recovery takes hold fiscal imbalances still
sizeable 102
Candidate Countries 105
29 The former Yugoslav Republic of Macedonia Recovery is
gaining firm ground in spite of weaker Investment 106
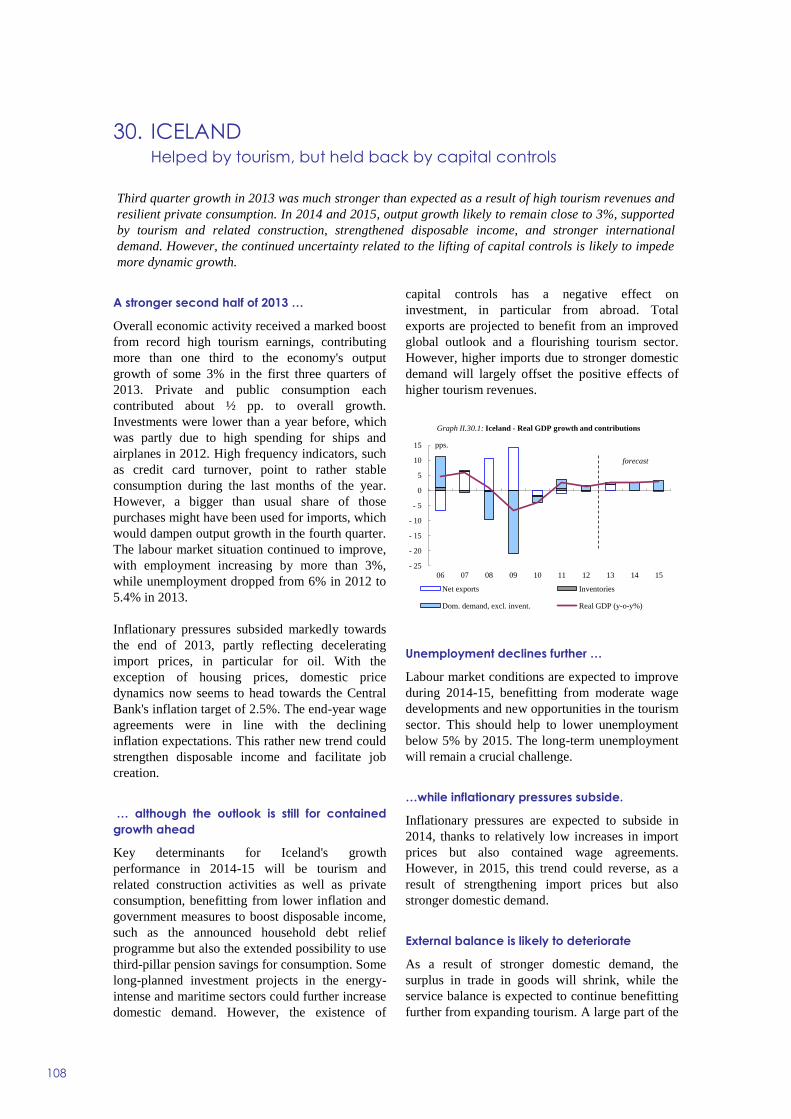
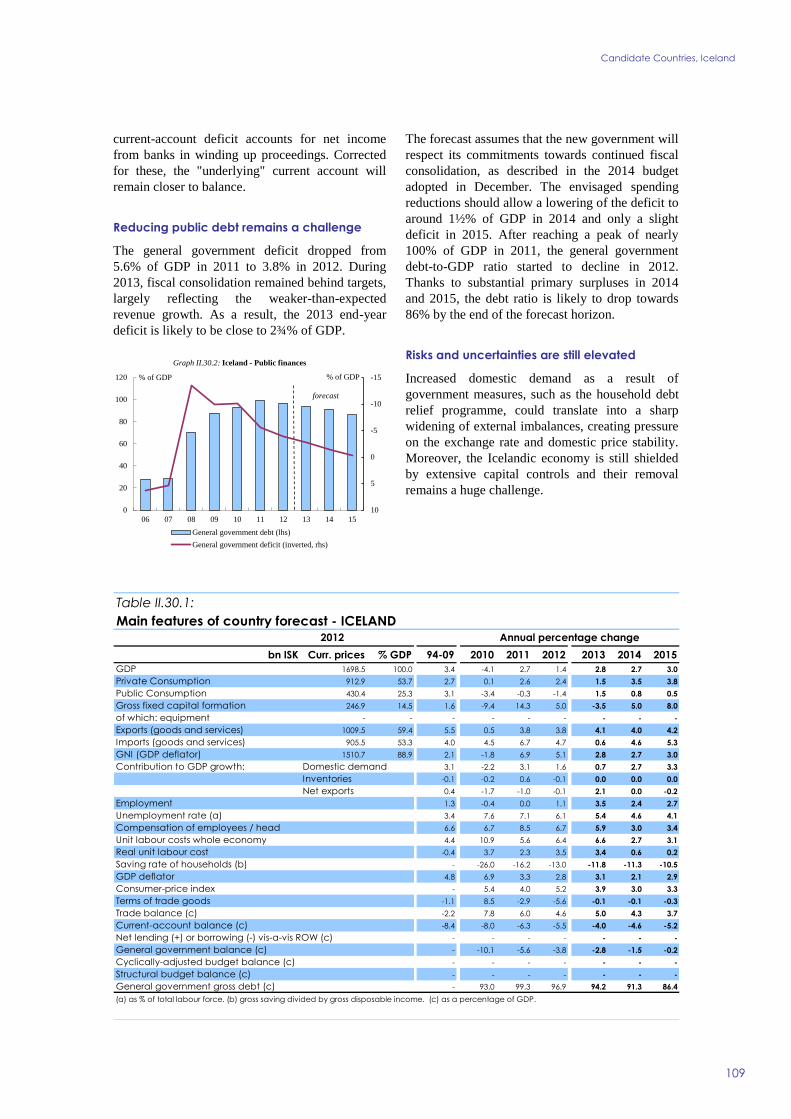
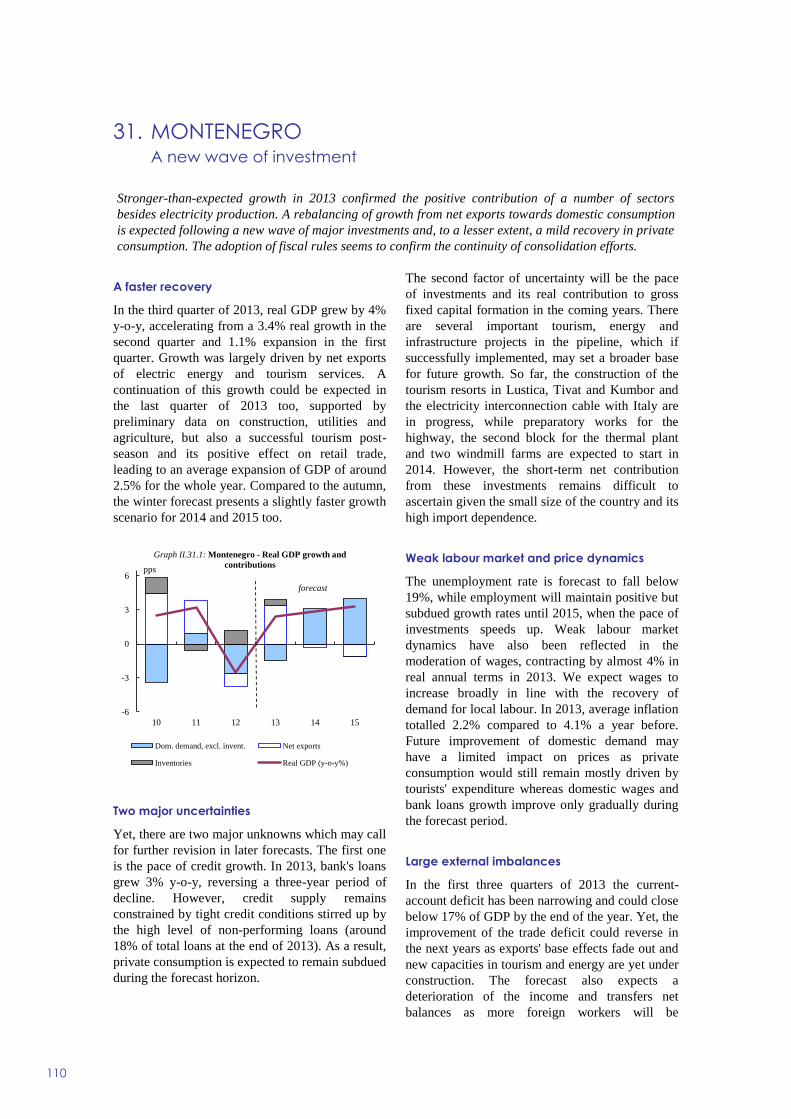
30 Iceland Helped by tourism but held back by capital controls 108
31 Montenegro A new wave of investment 110
32 Serbia Key reforms ahead 112
33 Turkey Depreciation monetary tightening and external
rebalancing 114
Other non-EU Countries 117
34 The United States of America Recovery gathering momentum 118
35 Japan A bumpy road ahead 120
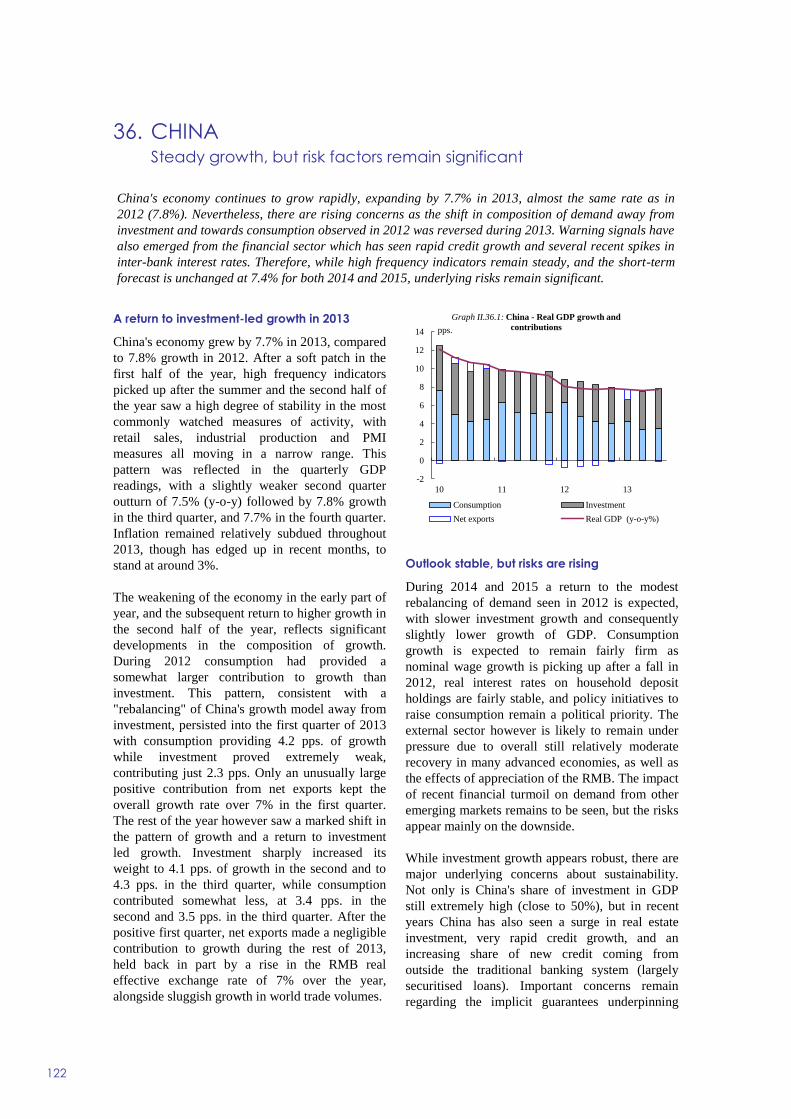
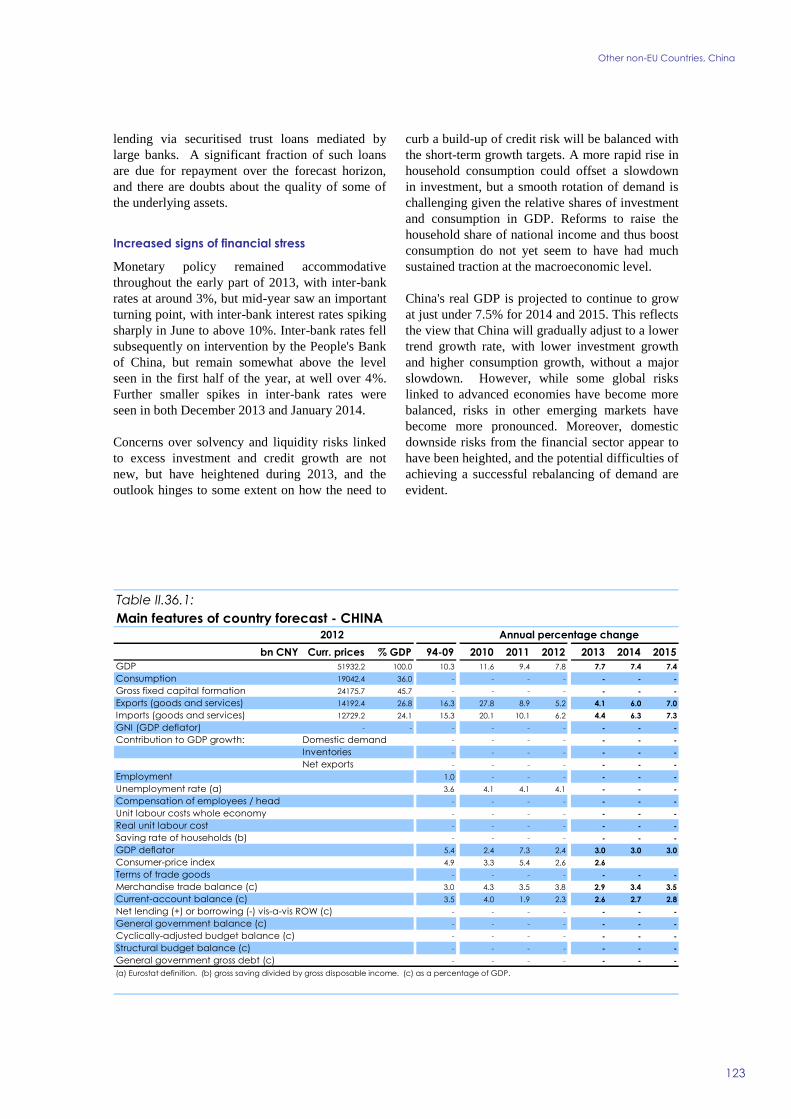
36 China Steady growth but risk factors remain significant 122
37 EFTA Outperformance comes with a risk 124
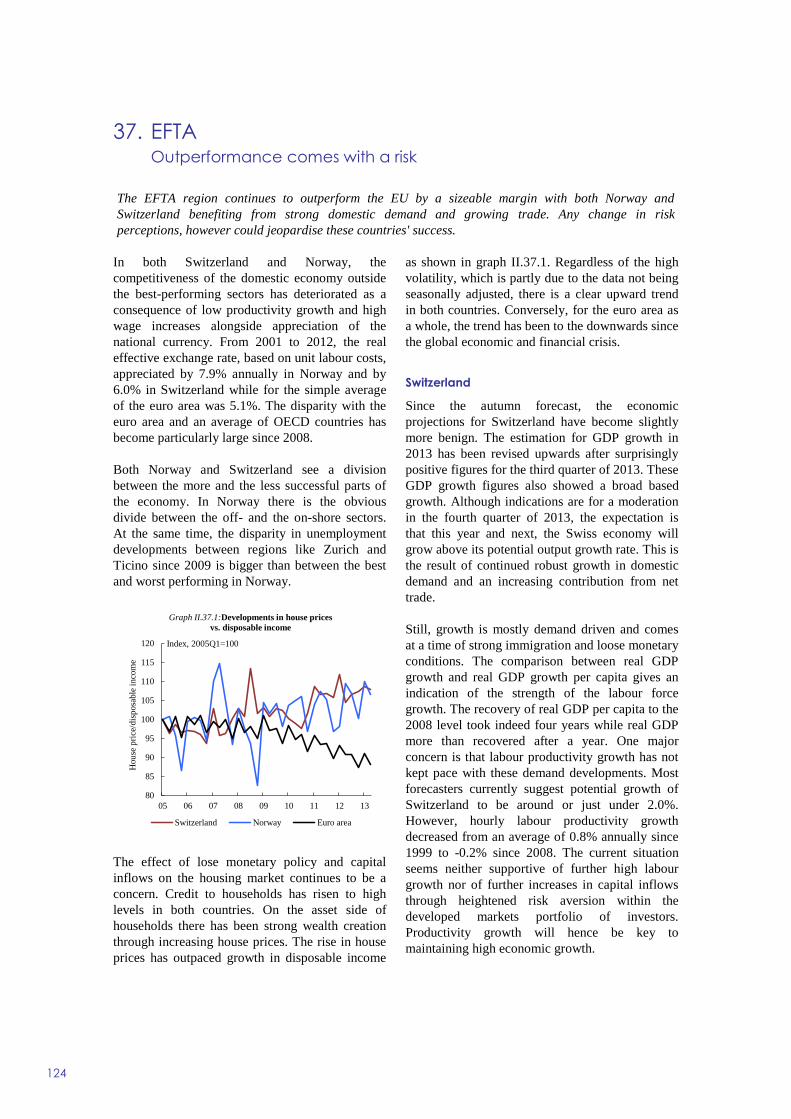
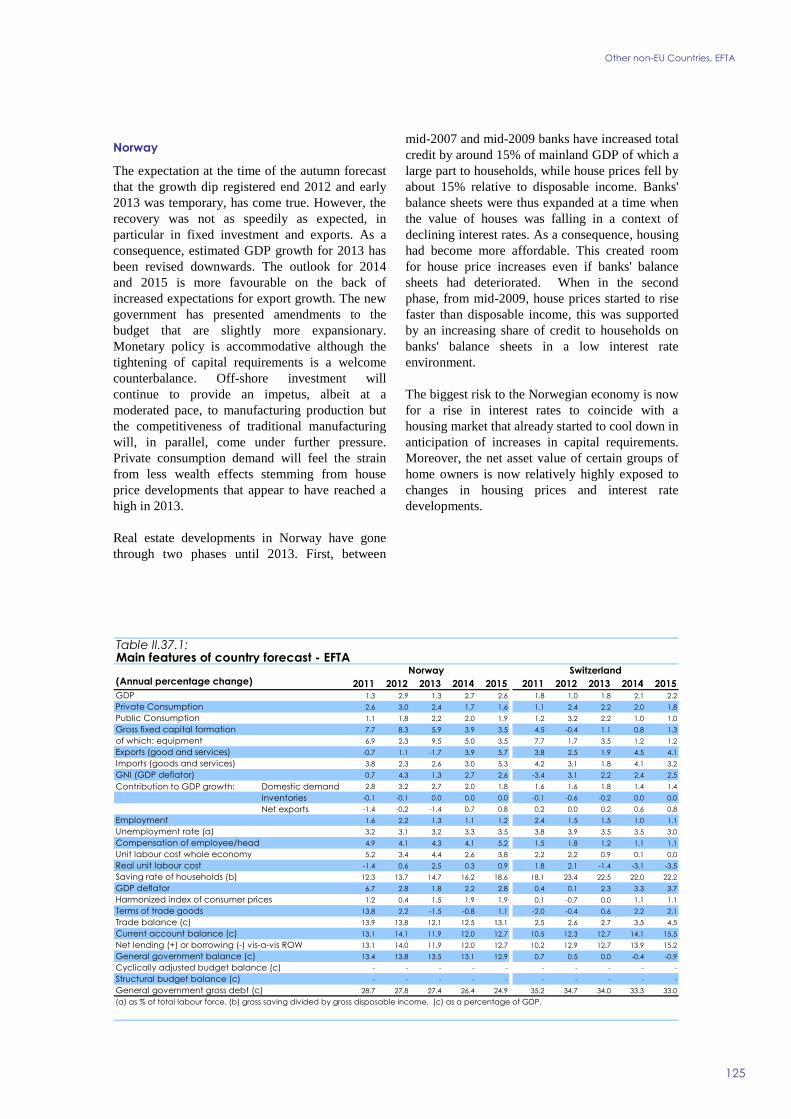
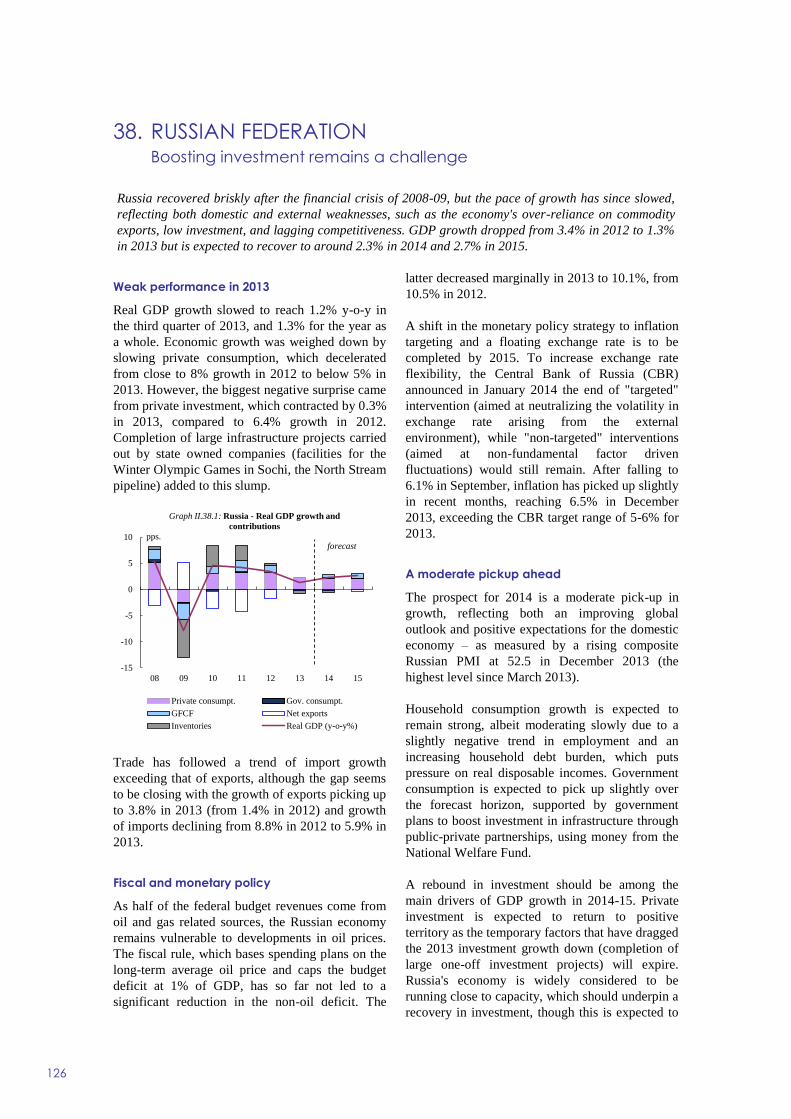
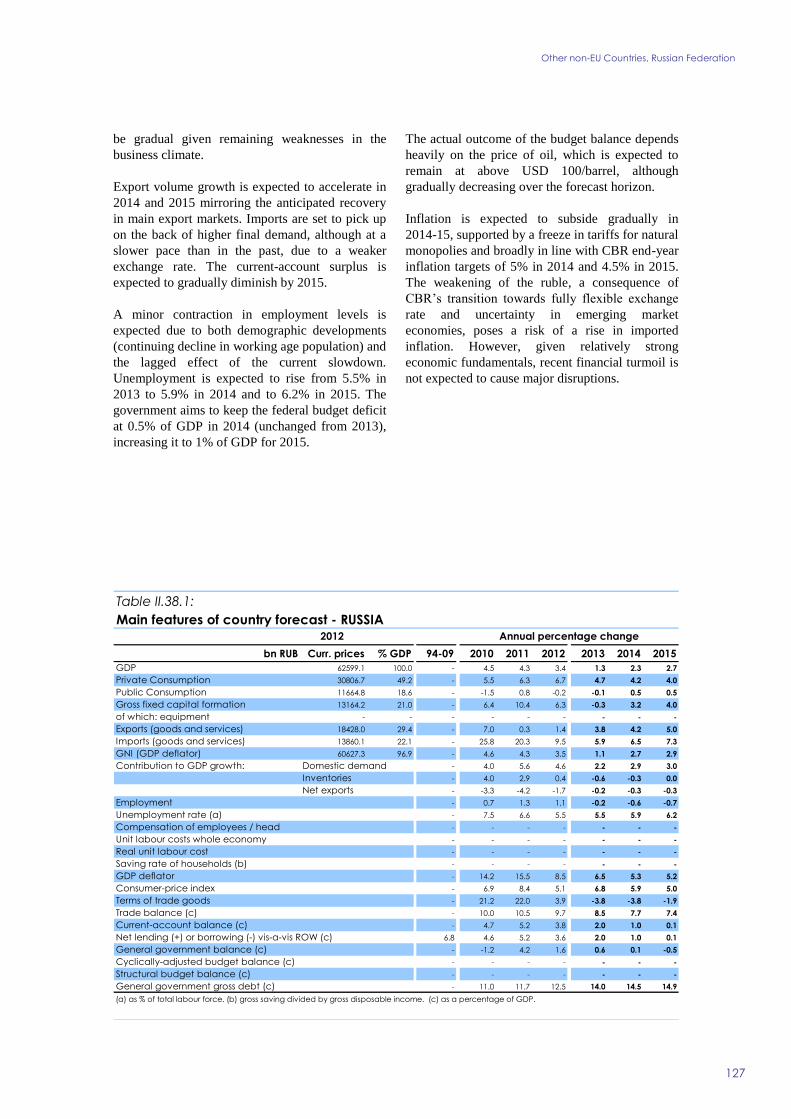
38 Russian Federation Boosting investment remains a challenge 126
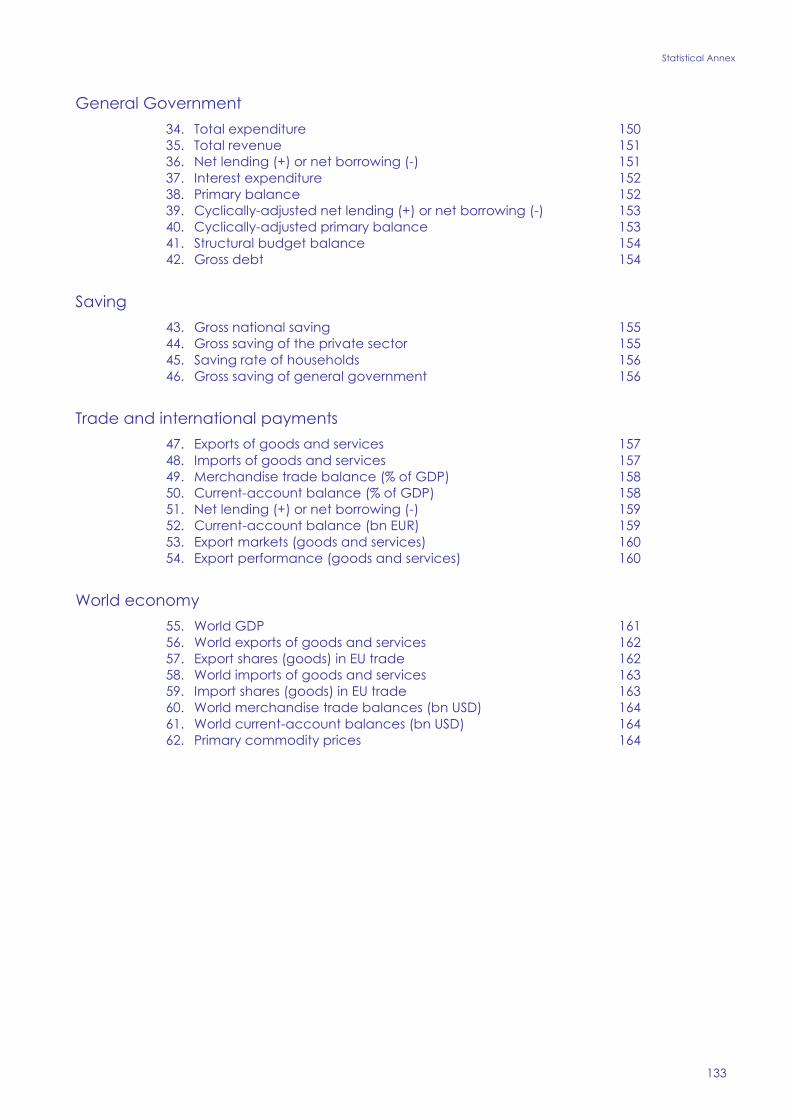
Statistical Annex 131
LIST OF TABLES
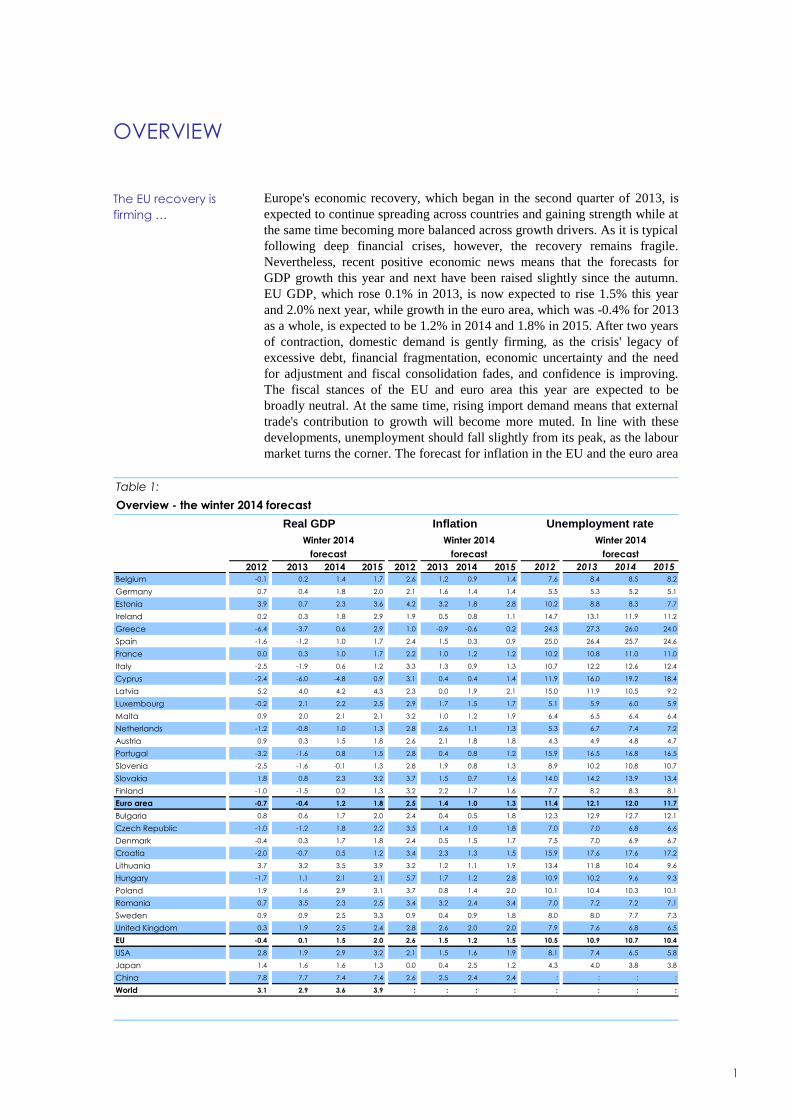
1 Overview - the winter 2014 forecast 1
I1 International environment 13
I2 Composition of growth - EU 16
I3 Composition of growth - euro area 17
I4 Labour market outlook - euro area and EU 22
I5 General Government budgetary position - euro area and EU 25
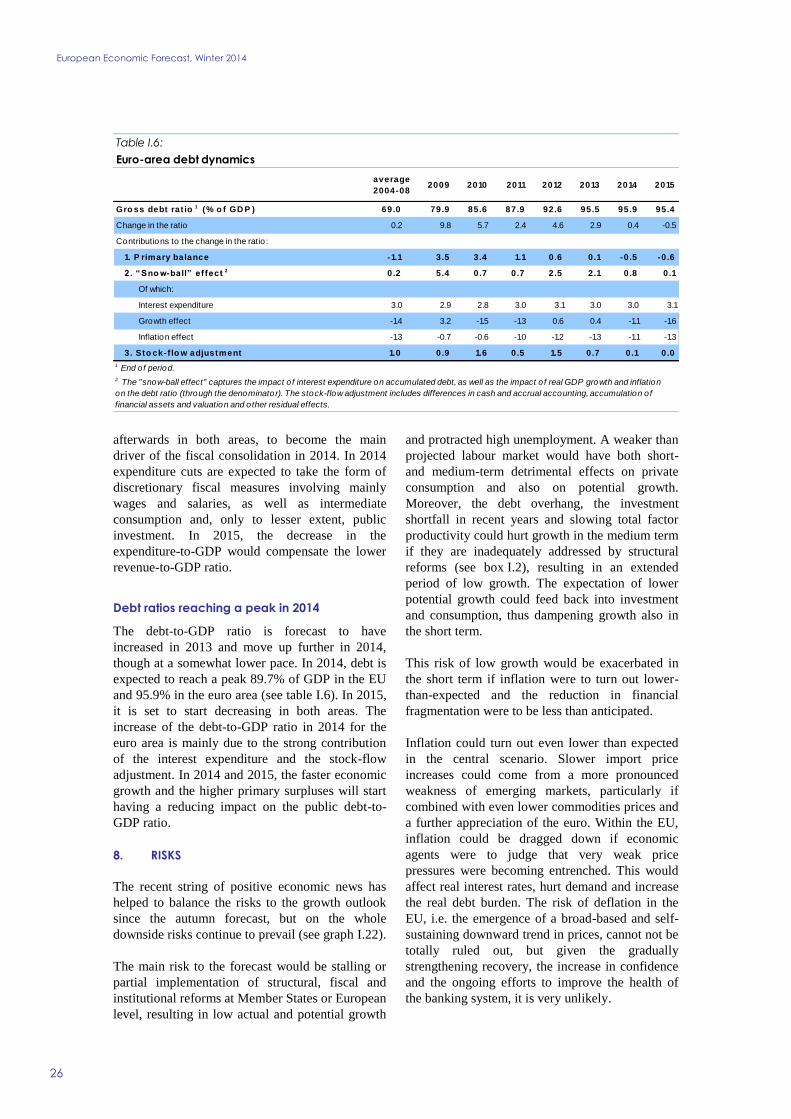
I6 Euro-area debt dynamics 26
LIST OF GRAPHS
I1 Real GDP EU 9
I2 HICP EU 9
I3 Interest rates on loans to enterprises (new businesses
maturity up to 1 year) 10
I4 Current-account balances euro area and Member States 11
I5 Contributions to World GDP growth from EU non-EU
advanced and emerging economies 12
I6 World trade and Global PMI manufacturing output 12
I7 Ten-year government-bond yield selected Member States 14
I8 Loans to enterprices (index of national stocks y-o-y growth
rate) 15
I9 Net changes in credit standards and credit demand for
loans to NFCs euro area 15
I10 Economic Sentiment Indicator and PMI Composite Output
Index EU 17
vii
I11 GDP growth and its components EU 18
I12 Equipment investment and capacity utilisation EU 18
I13 Private consumption and consumer confidence EU 19
I14 Global demand EU exports and new export orders 20
I15 Growth contributions in surplus and former deficit countries 21
I16 Employment expectations DG ECFIN surveys EU 21
I17 Employment growth and unemployment rate EU 22
I18 23
I19 Euro-area PPI and survey inflation expectations 24
I20 Budgetary developments EU 25
I21 General government revenues and expenditure EU 25
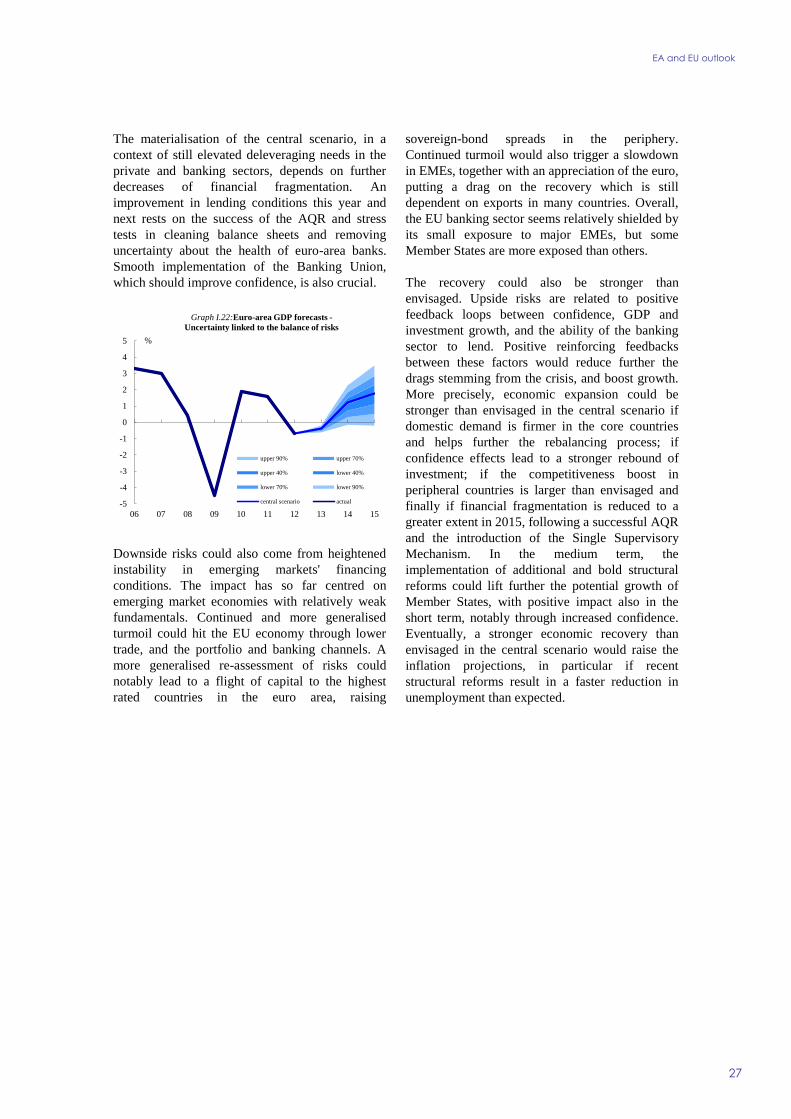
I22 Euro-area GDP forecasts - Uncertainty linked to the balance
of risks 27
LIST OF BOXES
I1 The economic effects of policy uncertainty 28
I2 Post-crisis total factor productivity trends in the EU 31
I3 The cyclical component of current-account balances 35
I4 Analysing current disinflationary trends in the euro area 39
I5 Some technical elements behind the forecast 42
EDITORIAL
ix
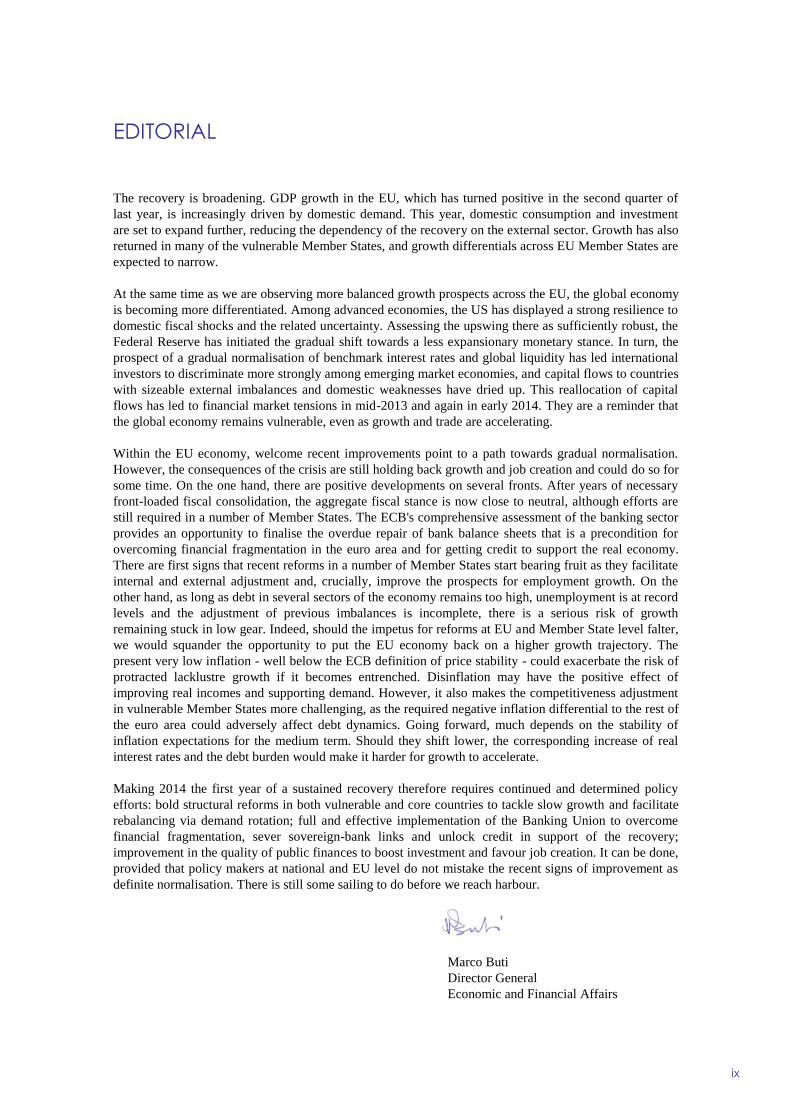
The recovery is broadening GDP growth in the EU which has turned positive in the second quarter of
last year is increasingly driven by domestic demand This year domestic consumption and investment
are set to expand further reducing the dependency of the recovery on the external sector Growth has also
returned in many of the vulnerable Member States and growth differentials across EU Member States are
expected to narrow
At the same time as we are observing more balanced growth prospects across the EU the global economy
is becoming more differentiated Among advanced economies the US has displayed a strong resilience to
domestic fiscal shocks and the related uncertainty Assessing the upswing there as sufficiently robust the
Federal Reserve has initiated the gradual shift towards a less expansionary monetary stance In turn the
prospect of a gradual normalisation of benchmark interest rates and global liquidity has led international
investors to discriminate more strongly among emerging market economies and capital flows to countries
with sizeable external imbalances and domestic weaknesses have dried up This reallocation of capital
flows has led to financial market tensions in mid-2013 and again in early 2014 They are a reminder that
the global economy remains vulnerable even as growth and trade are accelerating
Within the EU economy welcome recent improvements point to a path towards gradual normalisation
However the consequences of the crisis are still holding back growth and job creation and could do so for
some time On the one hand there are positive developments on several fronts After years of necessary
front-loaded fiscal consolidation the aggregate fiscal stance is now close to neutral although efforts are
still required in a number of Member States The ECBs comprehensive assessment of the banking sector
provides an opportunity to finalise the overdue repair of bank balance sheets that is a precondition for
overcoming financial fragmentation in the euro area and for getting credit to support the real economy
There are first signs that recent reforms in a number of Member States start bearing fruit as they facilitate
internal and external adjustment and crucially improve the prospects for employment growth On the
other hand as long as debt in several sectors of the economy remains too high unemployment is at record
levels and the adjustment of previous imbalances is incomplete there is a serious risk of growth
remaining stuck in low gear Indeed should the impetus for reforms at EU and Member State level falter
we would squander the opportunity to put the EU economy back on a higher growth trajectory The
present very low inflation - well below the ECB definition of price stability - could exacerbate the risk of
protracted lacklustre growth if it becomes entrenched Disinflation may have the positive effect of
improving real incomes and supporting demand However it also makes the competitiveness adjustment
in vulnerable Member States more challenging as the required negative inflation differential to the rest of
the euro area could adversely affect debt dynamics Going forward much depends on the stability of
inflation expectations for the medium term Should they shift lower the corresponding increase of real
interest rates and the debt burden would make it harder for growth to accelerate
Making 2014 the first year of a sustained recovery therefore requires continued and determined policy
efforts bold structural reforms in both vulnerable and core countries to tackle slow growth and facilitate
rebalancing via demand rotation full and effective implementation of the Banking Union to overcome
financial fragmentation sever sovereign-bank links and unlock credit in support of the recovery
improvement in the quality of public finances to boost investment and favour job creation It can be done
provided that policy makers at national and EU level do not mistake the recent signs of improvement as
definite normalisation There is still some sailing to do before we reach harbour
Marco Buti
Director General
Economic and Financial Affairs
OVERVIEW
1
Europes economic recovery which began in the second quarter of 2013 is
expected to continue spreading across countries and gaining strength while at
the same time becoming more balanced across growth drivers As it is typical
following deep financial crises however the recovery remains fragile
Nevertheless recent positive economic news means that the forecasts for
GDP growth this year and next have been raised slightly since the autumn
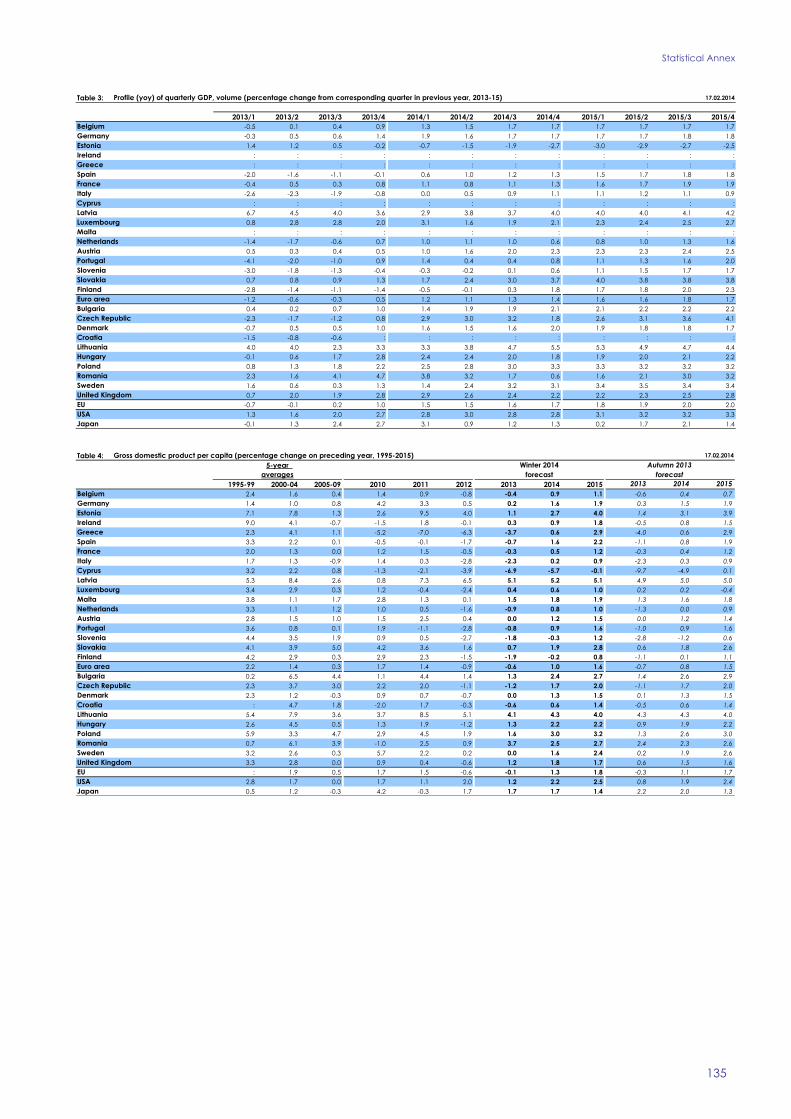
EU GDP which rose 01 in 2013 is now expected to rise 15 this year
and 20 next year while growth in the euro area which was -04 for 2013
as a whole is expected to be 12 in 2014 and 18 in 2015 After two years
of contraction domestic demand is gently firming as the crisis legacy of
excessive debt financial fragmentation economic uncertainty and the need
for adjustment and fiscal consolidation fades and confidence is improving
The fiscal stances of the EU and euro area this year are expected to be
broadly neutral At the same time rising import demand means that external
trades contribution to growth will become more muted In line with these
developments unemployment should fall slightly from its peak as the labour
market turns the corner The forecast for inflation in the EU and the euro area
The EU recovery is
firming hellip
2012 2013 2014 2015 2012 2013 2014 2015 2012 2013 2014 2015
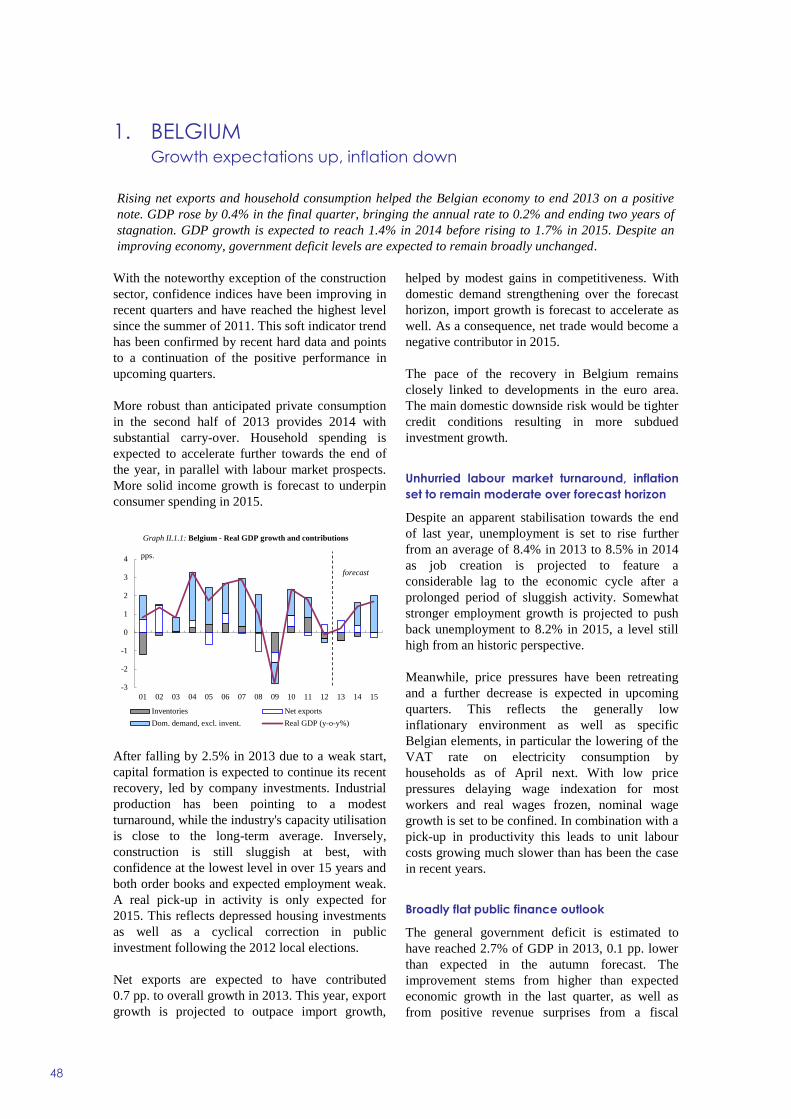
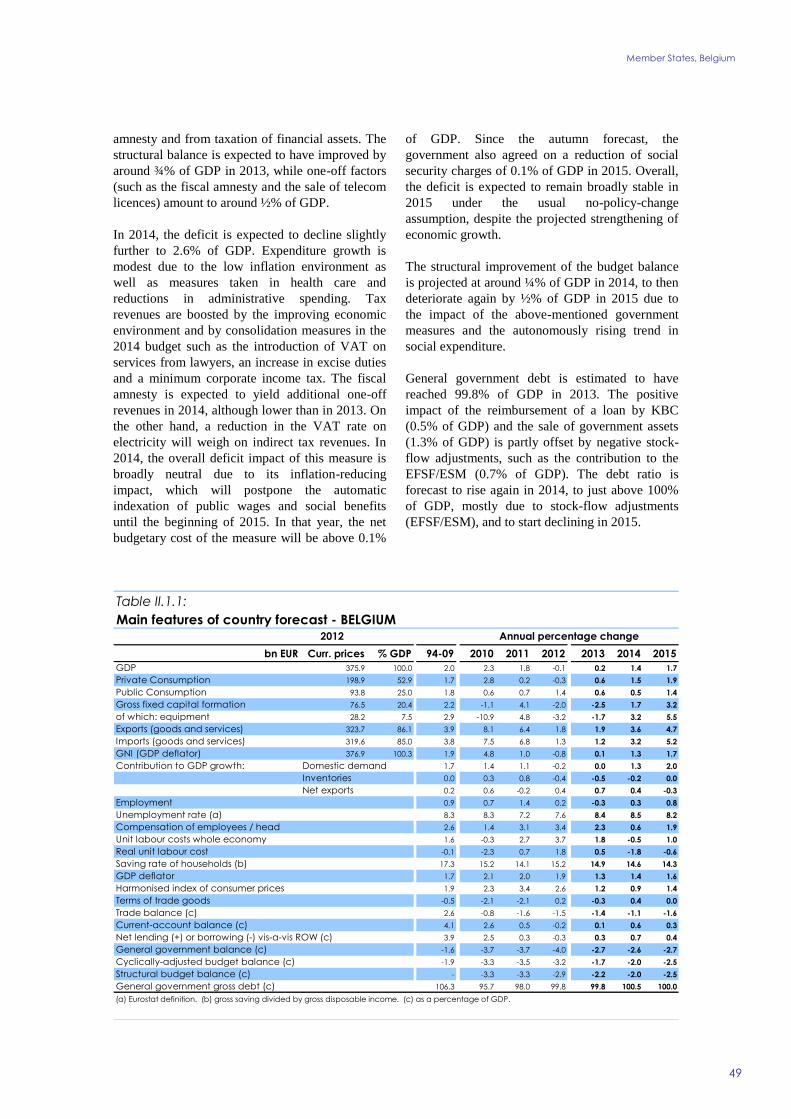
Belgium -01 02 14 17 26 12 09 14 76 84 85 82
Germany 07 04 18 20 21 16 14 14 55 53 52 51
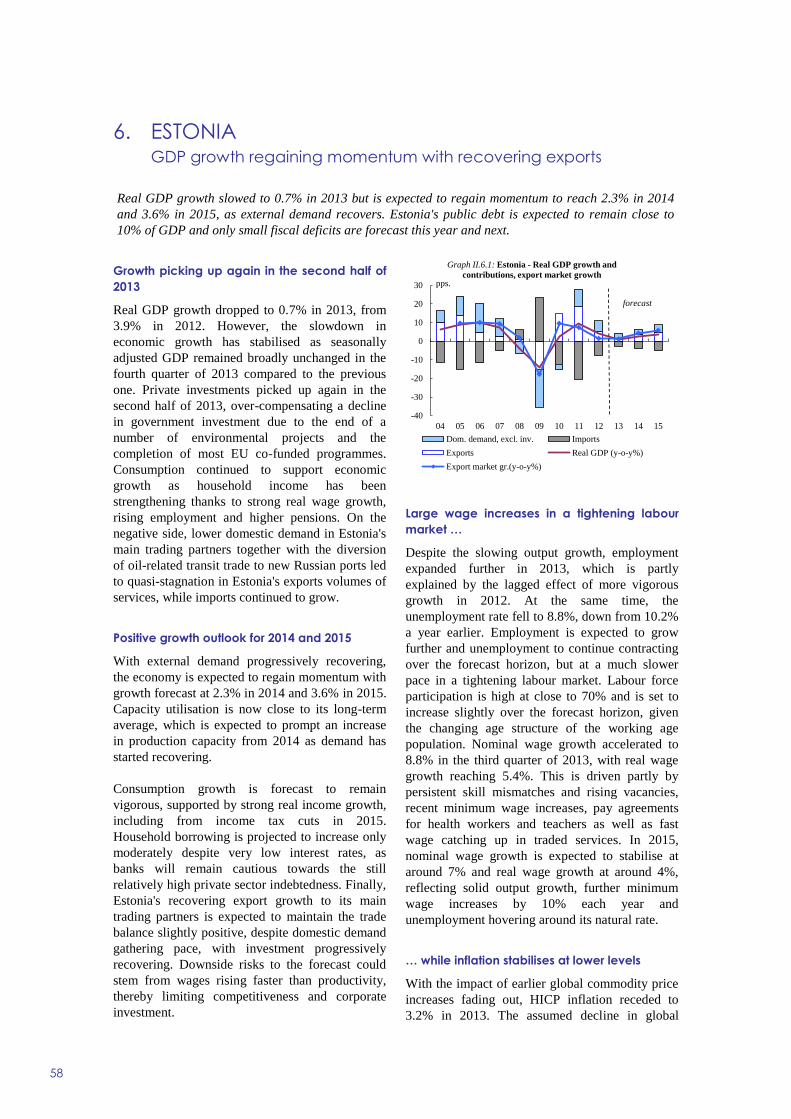
Estonia 39 07 23 36 42 32 18 28 102 88 83 77
Ireland 02 03 18 29 19 05 08 11 147 131 119 112
Greece -64 -37 06 29 10 -09 -06 02 243 273 260 240
Spain -16 -12 10 17 24 15 03 09 250 264 257 246
France 00 03 10 17 22 10 12 12 102 108 110 110
Italy -25 -19 06 12 33 13 09 13 107 122 126 124
Cyprus -24 -60 -48 09 31 04 04 14 119 160 192 184
Latvia 52 40 42 43 23 00 19 21 150 119 105 92
Luxembourg -02 21 22 25 29 17 15 17 51 59 60 59
Malta 09 20 21 21 32 10 12 19 64 65 64 64
Netherlands -12 -08 10 13 28 26 11 13 53 67 74 72
Austria 09 03 15 18 26 21 18 18 43 49 48 47
Portugal -32 -16 08 15 28 04 08 12 159 165 168 165
Slovenia -25 -16 -01 13 28 19 08 13 89 102 108 107
Slovakia 18 08 23 32 37 15 07 16 140 142 139 134
Finland -10 -15 02 13 32 22 17 16 77 82 83 81
Euro area -07 -04 12 18 25 14 10 13 114 121 120 117
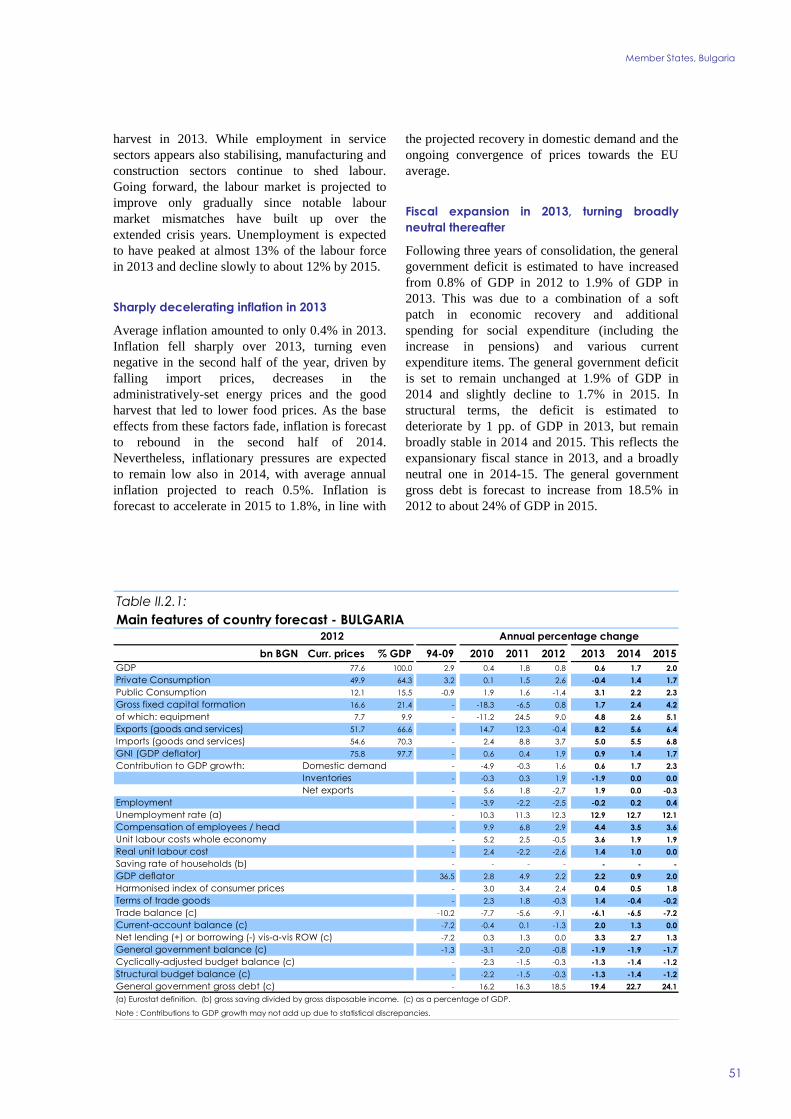
Bulgaria 08 06 17 20 24 04 05 18 123 129 127 121
Czech Republic -10 -12 18 22 35 14 10 18 70 70 68 66
Denmark -04 03 17 18 24 05 15 17 75 70 69 67
Croatia -20 -07 05 12 34 23 13 15 159 176 176 172
Lithuania 37 32 35 39 32 12 11 19 134 118 104 96
Hungary -17 11 21 21 57 17 12 28 109 102 96 93
Poland 19 16 29 31 37 08 14 20 101 104 103 101
Romania 07 35 23 25 34 32 24 34 70 72 72 71
Sweden 09 09 25 33 09 04 09 18 80 80 77 73
United Kingdom 03 19 25 24 28 26 20 20 79 76 68 65
EU -04 01 15 20 26 15 12 15 105 109 107 104
USA 28 19 29 32 21 15 16 19 81 74 65 58
Japan 14 16 16 13 00 04 25 12 43 40 38 38
China 78 77 74 74 26 25 24 24
World 31 29 36 39
Real GDP
Table 1
forecast
Overview - the winter 2014 forecast
Winter 2014 Winter 2014
forecast
Inflation
forecast
Unemployment rate
Winter 2014
European Economic Forecast Winter 2014
2
has been lowered significantly since the autumn Inflation in the EU is now
expected to dip to 12 in 2014 before rising again to 15 in 2015 In the
euro area inflation is seen at 10 in 2014 and 13 in 2015
The world economy picked up in the second half of last year driven by
stronger growth in advanced economies especially in the US but also by a
rebound in some emerging market economies Growth is expected to
accelerate for most advanced economies outside the EU In the US where the
headwinds from fiscal policy have been waning private consumption is
gaining speed benefitting from robust job creation and rising house prices
while the Federal Reserve has initiated a gradual shift towards less
accommodative monetary policy In Japan growth is expected to remain
relatively stable in 2014 Among emerging market economies the picture is
uneven There are continued signs of weakness in Russia and Brazil some
stabilisation at more sustainable growth rates in China and an improved
outlook for India Recent financial tensions have so far mostly affected
emerging markets with relatively weak macroeconomic fundamentals such
as Argentina Turkey and South Africa while the EU Member States have
been largely spared so far
After lacklustre 2013 economic activity outside the EU is expected to
accelerate to about 4 this year and 4frac12 in 2015 Global trade is forecast to
rise more than GDP with world import growth doubling from 2frac12 in 2013
to about 5 in 2014 and rising to 6 in 2015 reflecting both the
strengthening of the global recovery and the impetus from trade-intensive
sectors Over the forecast horizon oil prices are forecast to continue
declining along the same path as assumed in November supported by
adequate supply The nominal exchange rate of the euro against main trading
partners (based on the technical assumption of unchanged nominal exchange
rates) is now projected about 2 higher than last autumn
The recovery in Europe is expected to be broad-based across EU Member
States as activity has also started to strengthen in the vulnerable countries of
the euro-area periphery Growth differentials persist but the gap is projected
to narrow In 2014 only Cyprus and Slovenia are still expected to register
negative annual GDP growth rates By 2015 all EU economies are expected
to be growing again Internal and external adjustment in vulnerable Member
States is progressing underpinned in many cases by significant structural
reforms that are starting bearing fruit Ireland has successfully completed its
financial assistance programme in December 2013 Driven by strong exports
growth is significantly firming in Spain and Portugal while a moderate
rebound is expected in Greece Among the bigger economies a steady
domestic demand-driven expansion is expected over the forecast horizon in
Germany while in France economic growth is only slowly recovering
supported by a timid pick up in private consumption Mild economic
recoveries in the Netherlands and in Italy are set to be driven by net exports
and investment Strong growth is foreseen in the United Kingdom and in
Poland on the back of increasingly robust domestic demand
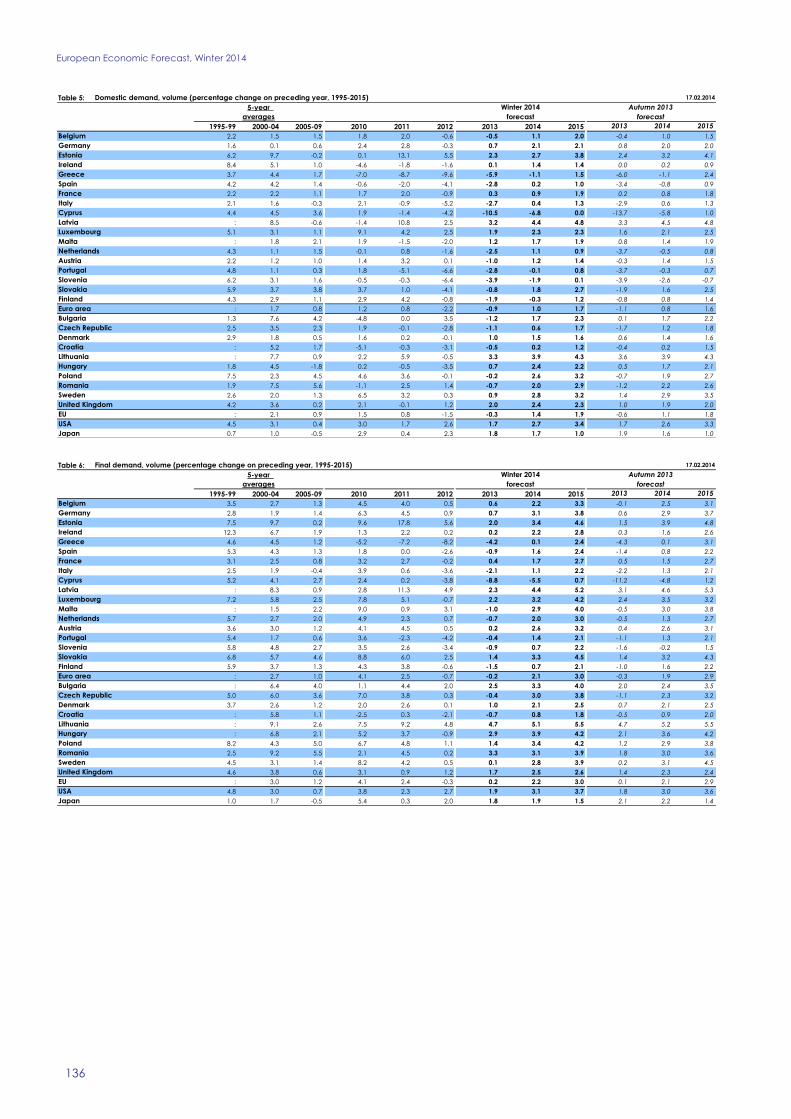
The rebalancing of Europes growth engines is confirmed as domestic
demand overtakes exports as main thruster The strengthening of domestic
demand though still expected to be modest in 2014 will be fuelled by all
components both private and public
Investment growth in particular investment in equipment is projected to
significantly strengthen as the main impediments to firms demand and
hellipwhile the global
environment is
differentiated
Adjustments within the
EU begin to bear fruit
Final demand is
rebalancing hellip
Overview
3
profits (uncertainty financing conditions deleveraging needs) are slowly
receding and the improvement in the economic outlook is confirmed
Uncertainty has significantly receded over the past year and a half and should
continue to do so under the assumption of smooth policy implementation at
the EU and Member-State levels Financing conditions are also expected to
improve and to support further investment spending
Private consumption showed only marginal growth at the onset of the
recovery but is expected to gain momentum over 2014-2015 as the labour
market slightly improves real disposable incomes benefits from low
consumer price inflation and the drag of fiscal consolidation diminishes In
line with improved confidence and lower precautionary savings households
are expected to spend most of the increase in real income Public
consumption is also expected to pick up as fiscal consolidation needs become
less acute
The current-account surpluses of both the EU and the euro area increased in
2013 and are expected to remain broadly stable (at respectively 1frac12 and
2frac14 of GDP) this year and next Most of the recent strengthening is the
result of significant adjustment involving improved exports but also a largely
permanent contraction in domestic demand in the euro-area Member States
that previously recorded high deficits This external rebalancing is supported
by enhanced price competitiveness resulting from lower unit labour costs
High external indebtedness however requires the external adjustment in
some Member States to go further still
Financial market conditions in the EU improved in 2013 as a result of the
better macroeconomic outlook and sustained low-interest rate environment
Financial fragmentation considerably receded in the sovereign- and
corporate-debt markets with most bond spreads of vulnerable Member States
continuing to narrow thanks to investor confidence in the success of the
ongoing fiscal adjustment and economic reforms However despite some
normalisation in bank funding conditions financial fragmentation on the
euro-area lending market continues to impair the transmission of monetary
policy hurting mainly small and medium-sized enterprises The ECBs
comprehensive assessment of banks balance sheets and a smooth
implementation of the Banking Union should further reinforce confidence in
European banks and fan the recovery
Substantial improvements in public finances have been achieved in the EU
since 2011 On the basis of policy measures already approved by national
parliaments or known with sufficient detail the fiscal stance is expected to be
close to neutral over the forecast horizon The fiscal effort this year
measured in terms of change of the structural balance is indeed expected to
be broadly neutral in the EU and in the euro area At the same time fiscal
consolidation is expected to move gradually from revenue measures to
expenditure control Headline fiscal deficits are set to shrink further in 2014
(to around 2frac34 of GDP in the EU and 2frac12 of GDP in the euro area) before
stabilising in 2015 under the assumption of no policy change The debt-to-
GDP ratio is expected to peak in 2014 at 90 in the EU and at 96 in the
euro area
Labour market conditions stabilised in mid-2013 but only a small
improvement is expected in 2014 and 2015 because labour markets typically
react with a certain lag to rebounds in economic activity and the recovery
remains modest In the early phase of the recovery private employment
hellipand external
imbalances are
receding in vulnerable
Member States
Financial market
conditions are
improvinghellip
hellipand the fiscal
stance is now close to
neutral
Labour markets
improve only slowly hellip
European Economic Forecast Winter 2014
4
growth is expected to be dampened by the usual adjustment in working
hours Decisive structural reforms implemented in some Member States may
shorten this period and help prevent the very high level of unemployment
from becoming structural Employment in the EU and the euro area is
expected to start rising modestly in 2014 by frac12 and about frac14 respectively
slightly better than projected last autumn This increase will not yet be
sufficient to meaningfully curb unemployment in the EU but it will trigger a
stabilisation of the unemployment rate in the euro area In 2015 employment
growth is set to accelerate to frac34 in both areas resulting in a slight reduction
of unemployment to 104 in the EU and 117 in the euro area Labour
markets will continue to perform differently across Member States
Headline inflation decreased markedly over the course of 2013 particularly
in the last quarter of the year due to falling energy and commodity prices
weak demand the fading impact of some temporary factors and the
continued appreciation of the euro The expectation that the output gap will
close only slowly suggests that weak demand will continue to contribute to
low inflation Subdued pressures are expected to keep consumer price
inflation down to 12 in the EU and 10 in euro area in 2014 Only a
slight increase is expected for 2015 when economic growth gains
momentum Low inflation is expected to support private consumption
because it boosts real disposable incomes However since inflation
expectations have been sagging real interest rates have actually risen since
the autumn Moreover low aggregate inflation makes it harder for vulnerable
countries to gain price competitiveness and increases the real value of both
public and private debts
Risks to the growth outlook have become slightly more balanced but still
weigh more heavily on the downside The main risk to the forecast would be
stalling or partial implementation of structural fiscal and institutional
reforms at Member States or European level resulting in low actual and
potential growth and protracted high unemployment A weaker than projected
labour market would have both short- and medium-term detrimental effects
on private consumption and also on potential growth Moreover the debt
overhang the investment shortfall in recent years and slowing total factor
productivity could hurt growth in the medium term if they are inadequately
addressed by structural reforms resulting in an extended period of low
growth The risk of low growth would be exacerbated in the short term by
lower than expected inflation and a slower reduction in financial
fragmentation
Inflation could turn out lower than the current forecast if economic agents
were to perceive the current very weak price pressures as becoming
entrenched Lower inflation would increase real interest rates with negative
effects on growth and on the real debt burden However confidence is rising
and growth is picking up so there is only a marginal probability of shocks
large enough to initiate outright EU or euro-area wide deflation
Credit growth could remain anaemic if the implementation of the Banking
Union and the Asset Quality Review (AQR) and stress tests were to fail to
clean up balance sheets and restore confidence also given the still elevated
deleveraging needs in the private sector The resulting prolonged weakness of
credit supply would impose a limit on the recovery of investment Downside
risks could also stem from heightened financial instability in emerging
markets
hellipand inflation
remains subdued
A risk of protracted
low growth
Overview
5
The recovery could also be stronger than envisaged if firmer domestic
demand in the core countries helps further the rebalancing process while the
competitiveness boost in peripheral countries is larger than envisaged In the
medium-term the implementation of additional and bold structural reforms
could lift further the potential growth of Member States with positive impact
also in the short-term notably through increased confidence Positive
confidence effects could lead to a stronger rebound of investment in
particular if financial fragmentation is reduced to a greater extent following a
successful AQR and the introduction of the Single Supervisory Mechanism
PART I EA and EU outlook
RECOVERY GAINING GROUND
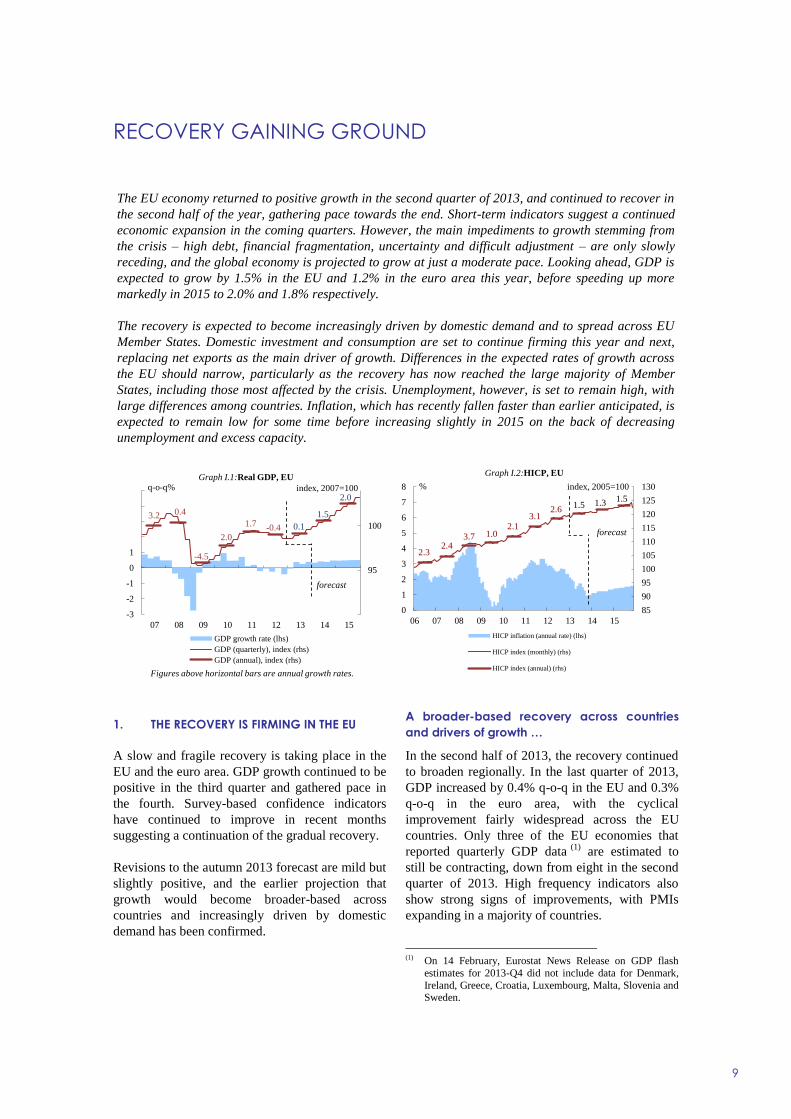
9
1 THE RECOVERY IS FIRMING IN THE EU
A slow and fragile recovery is taking place in the
EU and the euro area GDP growth continued to be
positive in the third quarter and gathered pace in
the fourth Survey-based confidence indicators
have continued to improve in recent months
suggesting a continuation of the gradual recovery
Revisions to the autumn 2013 forecast are mild but
slightly positive and the earlier projection that
growth would become broader-based across
countries and increasingly driven by domestic
demand has been confirmed
A broader-based recovery across countries
and drivers of growth hellip
In the second half of 2013 the recovery continued
to broaden regionally In the last quarter of 2013
GDP increased by 04 q-o-q in the EU and 03
q-o-q in the euro area with the cyclical
improvement fairly widespread across the EU
countries Only three of the EU economies that
reported quarterly GDP data (1)
are estimated to
still be contracting down from eight in the second
quarter of 2013 High frequency indicators also
show strong signs of improvements with PMIs
expanding in a majority of countries
(1) On 14 February Eurostat News Release on GDP flash
estimates for 2013-Q4 did not include data for Denmark
Ireland Greece Croatia Luxembourg Malta Slovenia and Sweden
The EU economy returned to positive growth in the second quarter of 2013 and continued to recover in
the second half of the year gathering pace towards the end Short-term indicators suggest a continued
economic expansion in the coming quarters However the main impediments to growth stemming from
the crisis ndash high debt financial fragmentation uncertainty and difficult adjustment ndash are only slowly
receding and the global economy is projected to grow at just a moderate pace Looking ahead GDP is
expected to grow by 15 in the EU and 12 in the euro area this year before speeding up more
markedly in 2015 to 20 and 18 respectively
The recovery is expected to become increasingly driven by domestic demand and to spread across EU
Member States Domestic investment and consumption are set to continue firming this year and next
replacing net exports as the main driver of growth Differences in the expected rates of growth across
the EU should narrow particularly as the recovery has now reached the large majority of Member
States including those most affected by the crisis Unemployment however is set to remain high with
large differences among countries Inflation which has recently fallen faster than earlier anticipated is
expected to remain low for some time before increasing slightly in 2015 on the back of decreasing
unemployment and excess capacity
90
95
100
-3
-2
-1
0
1
2
3
4
5
07 08 09 10 11 12 13 14 15
GDP growth rate (lhs)
GDP (quarterly) index (rhs)
GDP (annual) index (rhs)
Graph I1Real GDP EU
forecast
q-o-q index 2007=100
32 04
-45
17-04 01
Figures above horizontal bars are annual growth rates
15
20
20
85
90
95
100
105
110
115
120
125
130
0
1
2
3
4
5
6
7
8
06 07 08 09 10 11 12 13 14 15
HICP inflation (annual rate) (lhs)
HICP index (monthly) (rhs)
HICP index (annual) (rhs)
Graph I2HICP EU
forecast
index 2005=100
2437 10
2131
2613
23
F
1515
European Economic Forecast Winter 2014
10
Growth differentials among euro-area Member
States have fallen back to their 2010 levels but
remain larger than they were between 2000 and
2007 before the crisis The remaining differentials
are a reflection of countries different experiences
during the crisis and their related adjustment
needs including in the financial sector
Unaddressed rigidities in labour and product
markets also play a role in a number of Member
States As the recovery proceeds growth
differentials are expected to decrease further as the
drags on growth that weighted particularly on
vulnerable Member States recede and domestic
demand firms up
Growth is becoming less dependent on external
demand As anticipated in the autumn forecast
domestic demand is firming though its dynamics
now appear slightly stronger than previously
expected All components of domestic demand
showed positive growth rates in the third quarter of
2013 and are expected to have increased further in
the fourth quarter (2)
with investment notably
starting to pick-up more firmly However the
investment to GDP ratio in the EU stabilised at
around 189 in the third quarter of 2013 and
remains far below its share of about 21 in the
early 2000s The fall in investment between 2008
and 2013 was extremely severe compared with
previous downturns particularly driven by sharp
declines in business investment and in some
countries where there were housing bubbles
construction investment
In most Member States investment growth is
expected to strengthen more significantly over the
forecast horizon Business investment which
should be one of the main drivers of growth in a
period of recovery contracted in recent years
because of weak fundamental factors such as low
demand and profits as well as abundant spare
capacity Those weaknesses coupled with legacies
from the financial crisis such as high uncertainty
tight financing conditions and the deleveraging
needs of firms are gradually fading and this is
unlocking business investment
hellip as impediments to growth are slowly
receding
As pointed out in previous forecasts recoveries
from deep financial crises are slower and more
fragile than typical cyclical recoveries Public and
(2) The break-down by GDP components for the fourth quarter
will be released by Eurostat on 5 March 2014
private balance-sheet adjustment financial
fragmentation uncertainty and resource
reallocation during internal and external
rebalancing have temporarily dampened
investment and consumption and this is fading
only gradually
In particular the recovery of domestic demand has
so far coexisted with a continued contraction of
bank credit in the euro area The absence of credit
growth has been a symptom of low cyclical
demand compounded by non-financial
corporations deleveraging During the early phase
of the recovery creditless growth is therefore not
necessarily a major issue at the aggregate level (3)
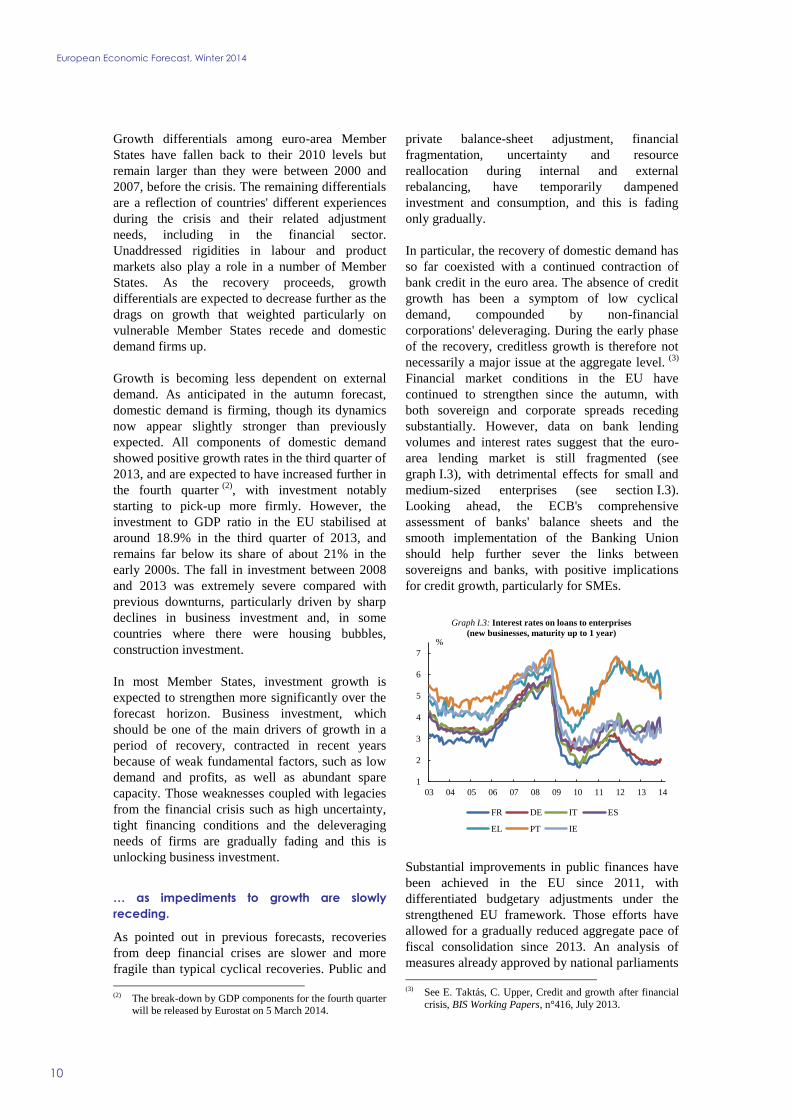
Financial market conditions in the EU have
continued to strengthen since the autumn with
both sovereign and corporate spreads receding
substantially However data on bank lending
volumes and interest rates suggest that the euro-
area lending market is still fragmented (see
graph I3) with detrimental effects for small and
medium-sized enterprises (see section I3)
Looking ahead the ECBs comprehensive
assessment of banks balance sheets and the
smooth implementation of the Banking Union
should help further sever the links between
sovereigns and banks with positive implications
for credit growth particularly for SMEs
1
2
3
4
5
6
7
03 04 05 06 07 08 09 10 11 12 13 14
Graph I3 Interest rates on loans to enterprises
(new businesses maturity up to 1 year)
FR DE IT ES
EL PT IE
Substantial improvements in public finances have
been achieved in the EU since 2011 with
differentiated budgetary adjustments under the
strengthened EU framework Those efforts have
allowed for a gradually reduced aggregate pace of
fiscal consolidation since 2013 An analysis of
measures already approved by national parliaments
(3) See E Taktaacutes C Upper Credit and growth after financial
crisis BIS Working Papers ndeg416 July 2013
EA and EU outlook
11
or adequately detailed shows that the pace of
fiscal consolidation is set to further decrease The
need for front-loaded fiscal consolidation in the
countries under market pressure had a detrimental
impact on growth in the short term but the benefits
are expected in the medium term
The negative impact of extreme uncertainty has
been fading but further reductions would release
additional demand of goods and services Policy
uncertainty became extremely high in the euro area
in 2011 and remained at high levels in the first half
of 2012 when the integrity of the euro area was
questioned Since then decisive crisis-
management measures reforms of the euro areas
economic governance and further steps towards
Banking Union have significantly reduced
uncertainty At the start of this year policy
uncertainty stood well below its average during the
crisis years of 2008-13 but still above pre-crisis
levels Assuming smooth and continued policy
implementation uncertainty should continue
declining encouraging consumption and
investment decisions (4)
This would also have
immediate positive effects on manufacturing in the
euro area through increased industrial new orders
(see box I1)
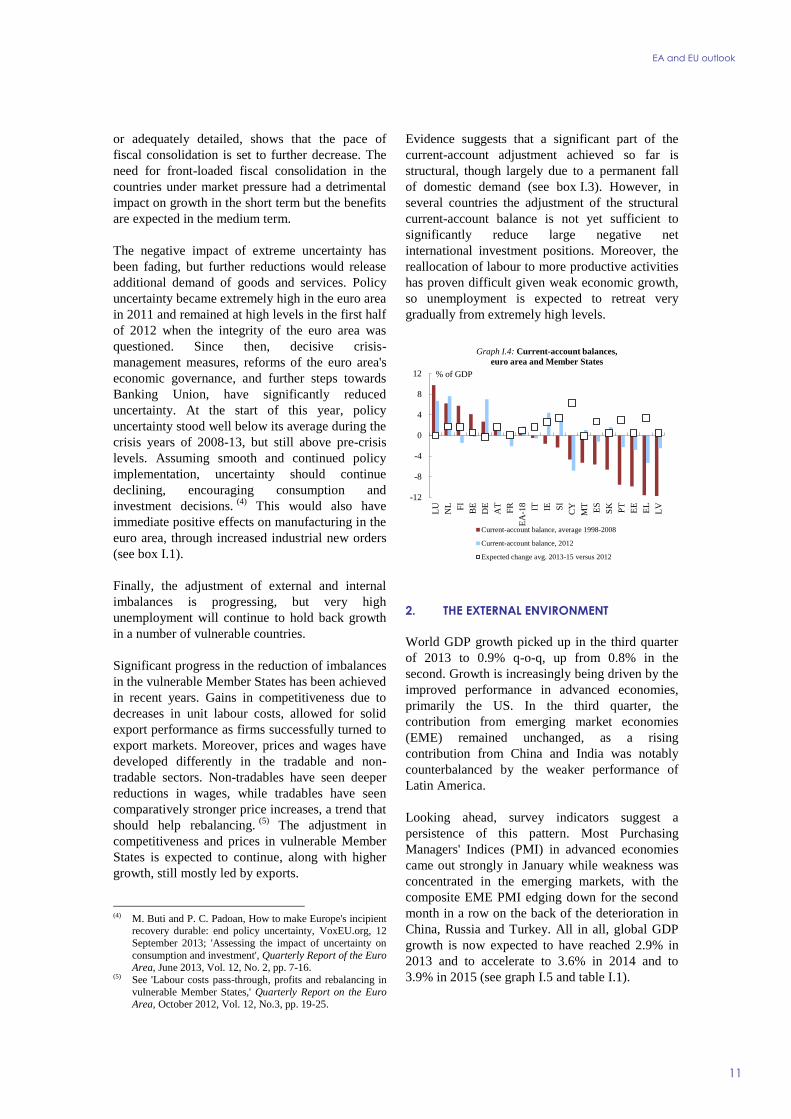
Finally the adjustment of external and internal
imbalances is progressing but very high
unemployment will continue to hold back growth
in a number of vulnerable countries
Significant progress in the reduction of imbalances
in the vulnerable Member States has been achieved
in recent years Gains in competitiveness due to
decreases in unit labour costs allowed for solid
export performance as firms successfully turned to
export markets Moreover prices and wages have
developed differently in the tradable and non-
tradable sectors Non-tradables have seen deeper
reductions in wages while tradables have seen
comparatively stronger price increases a trend that
should help rebalancing (5)
The adjustment in
competitiveness and prices in vulnerable Member
States is expected to continue along with higher
growth still mostly led by exports
(4) M Buti and P C Padoan How to make Europes incipient
recovery durable end policy uncertainty VoxEUorg 12
September 2013 Assessing the impact of uncertainty on
consumption and investment Quarterly Report of the Euro Area June 2013 Vol 12 No 2 pp 7-16
(5) See Labour costs pass-through profits and rebalancing in
vulnerable Member States Quarterly Report on the Euro Area October 2012 Vol 12 No3 pp 19-25
Evidence suggests that a significant part of the
current-account adjustment achieved so far is
structural though largely due to a permanent fall
of domestic demand (see box I3) However in
several countries the adjustment of the structural
current-account balance is not yet sufficient to
significantly reduce large negative net
international investment positions Moreover the
reallocation of labour to more productive activities
has proven difficult given weak economic growth
so unemployment is expected to retreat very
gradually from extremely high levels
-12
-8
-4
0
4
8
12
LU
NL FI
BE
DE
AT
FR
EA
-18 IT IE SI
CY
MT
ES
SK PT
EE
EL
LV
of GDP
Graph I4 Current-account balances
euro area and Member States
Current-account balance average 1998-2008
Current-account balance 2012
Expected change avg 2013-15 versus 2012
2 THE EXTERNAL ENVIRONMENT
World GDP growth picked up in the third quarter
of 2013 to 09 q-o-q up from 08 in the
second Growth is increasingly being driven by the
improved performance in advanced economies
primarily the US In the third quarter the
contribution from emerging market economies
(EME) remained unchanged as a rising
contribution from China and India was notably
counterbalanced by the weaker performance of
Latin America
Looking ahead survey indicators suggest a
persistence of this pattern Most Purchasing
Managers Indices (PMI) in advanced economies
came out strongly in January while weakness was
concentrated in the emerging markets with the
composite EME PMI edging down for the second
month in a row on the back of the deterioration in
China Russia and Turkey All in all global GDP
growth is now expected to have reached 29 in
2013 and to accelerate to 36 in 2014 and to
39 in 2015 (see graph I5 and table I1)
European Economic Forecast Winter 2014
12
-2
-1
0
1
2
3
4
5
6
09 10 11 12 13 14 15
EU
Non-EU advanced economies
Emerging and developing countries
World
Graph I5Contributions to World GDP growth from
EU non-EU advanced and emerging economies
forecast
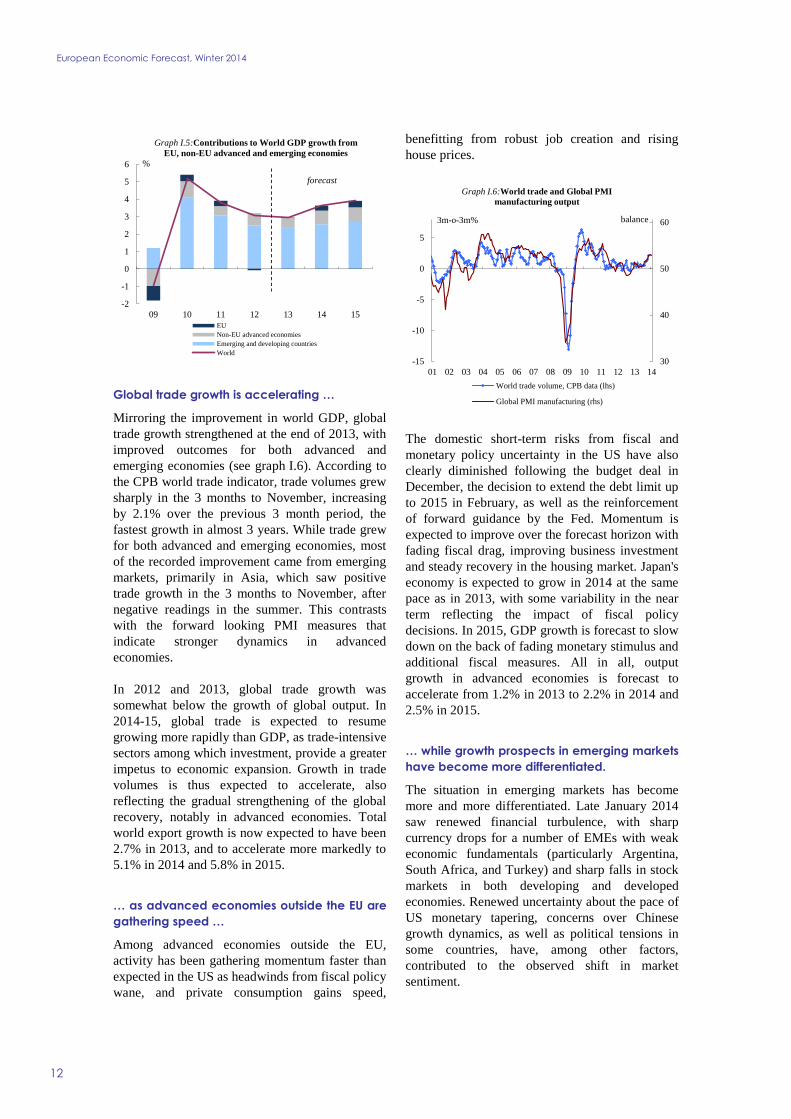
Global trade growth is accelerating hellip
Mirroring the improvement in world GDP global
trade growth strengthened at the end of 2013 with
improved outcomes for both advanced and
emerging economies (see graph I6) According to
the CPB world trade indicator trade volumes grew
sharply in the 3 months to November increasing
by 21 over the previous 3 month period the
fastest growth in almost 3 years While trade grew
for both advanced and emerging economies most
of the recorded improvement came from emerging
markets primarily in Asia which saw positive
trade growth in the 3 months to November after
negative readings in the summer This contrasts
with the forward looking PMI measures that
indicate stronger dynamics in advanced
economies
In 2012 and 2013 global trade growth was
somewhat below the growth of global output In
2014-15 global trade is expected to resume
growing more rapidly than GDP as trade-intensive
sectors among which investment provide a greater
impetus to economic expansion Growth in trade
volumes is thus expected to accelerate also
reflecting the gradual strengthening of the global
recovery notably in advanced economies Total
world export growth is now expected to have been
27 in 2013 and to accelerate more markedly to
51 in 2014 and 58 in 2015
hellip as advanced economies outside the EU are
gathering speed hellip
Among advanced economies outside the EU
activity has been gathering momentum faster than
expected in the US as headwinds from fiscal policy
wane and private consumption gains speed
benefitting from robust job creation and rising
house prices
30
40
50
60
-15
-10
-5
0
5
01 02 03 04 05 06 07 08 09 10 11 12 13 14
World trade volume CPB data (lhs)
Global PMI manufacturing (rhs)
3m-o-3m balance
Graph I6World trade and Global PMI
manufacturing output
The domestic short-term risks from fiscal and
monetary policy uncertainty in the US have also
clearly diminished following the budget deal in
December the decision to extend the debt limit up
to 2015 in February as well as the reinforcement
of forward guidance by the Fed Momentum is
expected to improve over the forecast horizon with
fading fiscal drag improving business investment
and steady recovery in the housing market Japans
economy is expected to grow in 2014 at the same
pace as in 2013 with some variability in the near
term reflecting the impact of fiscal policy
decisions In 2015 GDP growth is forecast to slow
down on the back of fading monetary stimulus and
additional fiscal measures All in all output
growth in advanced economies is forecast to
accelerate from 12 in 2013 to 22 in 2014 and
25 in 2015
hellip while growth prospects in emerging markets
have become more differentiated
The situation in emerging markets has become
more and more differentiated Late January 2014
saw renewed financial turbulence with sharp
currency drops for a number of EMEs with weak
economic fundamentals (particularly Argentina
South Africa and Turkey) and sharp falls in stock
markets in both developing and developed
economies Renewed uncertainty about the pace of
US monetary tapering concerns over Chinese
growth dynamics as well as political tensions in
some countries have among other factors
contributed to the observed shift in market
sentiment
EA and EU outlook
13
This variation in cyclical and structural
vulnerabilities is also reflected in revisions to the
forecast While the outlook for Turkey and Russia
has deteriorated recently on the back of tightened
financial conditions mirroring macro-economic
vulnerabilities and weak policy frameworks it has
improved for other EU candidate countries and
India Chinas economy continued to grow rapidly
in 2013 at 77 with investment recovering
sharply from a weak first quarter to provide the
major contribution to growth In 2014-15 Chinas
growth is forecast to slow down to around 7frac12 as
the composition of demand shifts away from
investment towards higher consumption However
achieving a smooth rotation of demand remains a
challenge particularly in the context of a fragile
financial system Emerging markets as a group are
expected to grow at 5 in 2014 and 53 in 2015
following growth of 46 in 2013
Moderation of commodity prices ahead
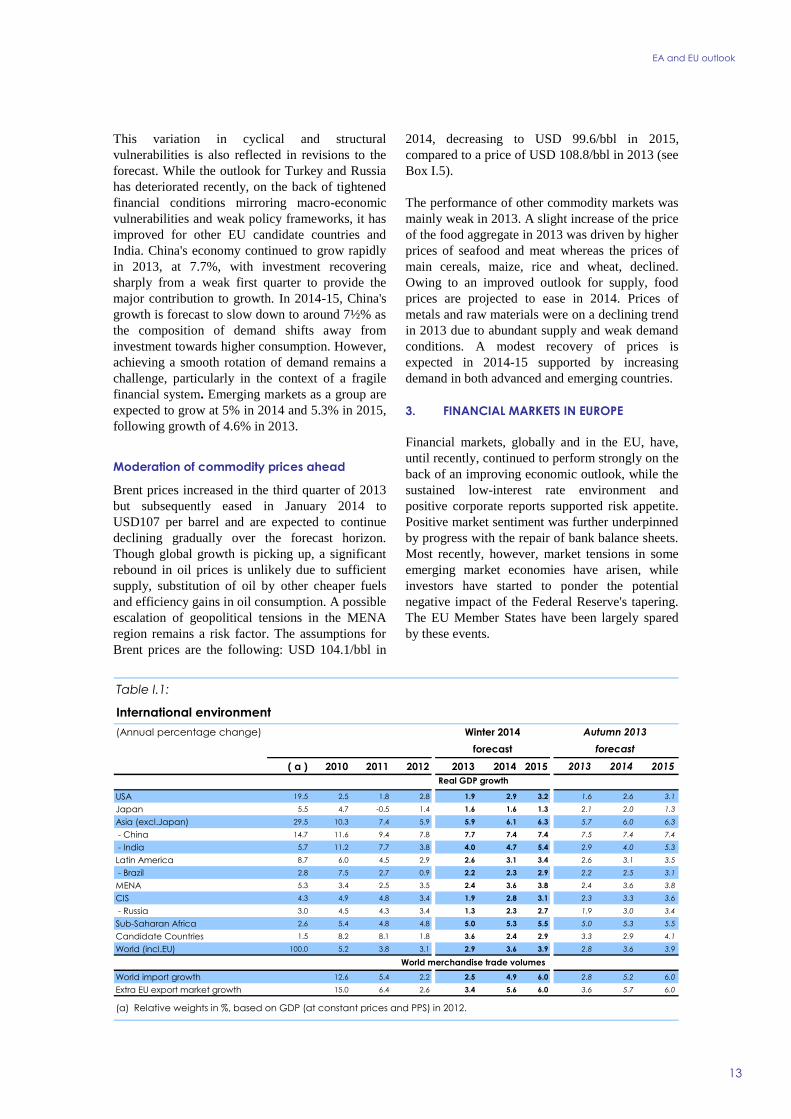
Brent prices increased in the third quarter of 2013
but subsequently eased in January 2014 to
USD107 per barrel and are expected to continue
declining gradually over the forecast horizon
Though global growth is picking up a significant
rebound in oil prices is unlikely due to sufficient
supply substitution of oil by other cheaper fuels
and efficiency gains in oil consumption A possible
escalation of geopolitical tensions in the MENA
region remains a risk factor The assumptions for
Brent prices are the following USD 1041bbl in
2014 decreasing to USD 996bbl in 2015
compared to a price of USD 1088bbl in 2013 (see
Box I5)
The performance of other commodity markets was
mainly weak in 2013 A slight increase of the price
of the food aggregate in 2013 was driven by higher
prices of seafood and meat whereas the prices of
main cereals maize rice and wheat declined
Owing to an improved outlook for supply food
prices are projected to ease in 2014 Prices of
metals and raw materials were on a declining trend
in 2013 due to abundant supply and weak demand
conditions A modest recovery of prices is
expected in 2014-15 supported by increasing
demand in both advanced and emerging countries
3 FINANCIAL MARKETS IN EUROPE
Financial markets globally and in the EU have
until recently continued to perform strongly on the
back of an improving economic outlook while the
sustained low-interest rate environment and
positive corporate reports supported risk appetite
Positive market sentiment was further underpinned
by progress with the repair of bank balance sheets
Most recently however market tensions in some
emerging market economies have arisen while
investors have started to ponder the potential
negative impact of the Federal Reserves tapering
The EU Member States have been largely spared
by these events
( a ) 2010 2011 2012 2013 2014 2015 2013 2014 2015
USA 195 25 18 28 19 29 32 16 26 31
Japan 55 47 -05 14 16 16 13 21 20 13
Asia (exclJapan) 295 103 74 59 59 61 63 57 60 63
- China 147 116 94 78 77 74 74 75 74 74
- India 57 112 77 38 40 47 54 29 40 53
Latin America 87 60 45 29 26 31 34 26 31 35
- Brazil 28 75 27 09 22 23 29 22 25 31
MENA 53 34 25 35 24 36 38 24 36 38
CIS 43 49 48 34 19 28 31 23 33 36
- Russia 30 45 43 34 13 23 27 19 30 34
Sub-Saharan Africa 26 54 48 48 50 53 55 50 53 55
Candidate Countries 15 82 81 18 36 24 29 33 29 41
World (inclEU) 1000 52 38 31 29 36 39 28 36 39
World import growth 126 54 22 25 49 60 28 52 60
Extra EU export market growth 150 64 26 34 56 60 36 57 60
(a) Relative weights in based on GDP (at constant prices and PPS) in 2012
forecast
Table I1
International environment
Real GDP growth
Winter 2014
World merchandise trade volumes
(Annual percentage change)
forecast
Autumn 2013
European Economic Forecast Winter 2014
14
The ECB further eased monetary policy hellip
While the phasing out of unconventional monetary
stimulus started end-2013 in the US and market
expectations of interest rate hikes in the UK
increased the ECB lowered its main policy rate
(MRO) by 25bps in November amid a subdued
outlook for inflation in the euro area It extended
its fixed-rate tender procedures with full allotment
at least until the end of the second quarter of 2015
thereby ensuring that euro-area banks would retain
access to central- bank liquidity at the MRO rate
well after the end of the two 3-year LTROs In
addition the Governing Council reiterated its
forward guidance and committed to maintain a
high degree of monetary accommodation by taking
further decisive action if needed
hellip which contributes to keeping benchmark
funding costs very low in the euro area
Reflecting the tapering of the asset purchase
programme by the US Federal Reserve and the
more muted outlook for inflation in the euro area
the gap between the US 10-year Treasury yield and
the German 10-year Bund yield increased
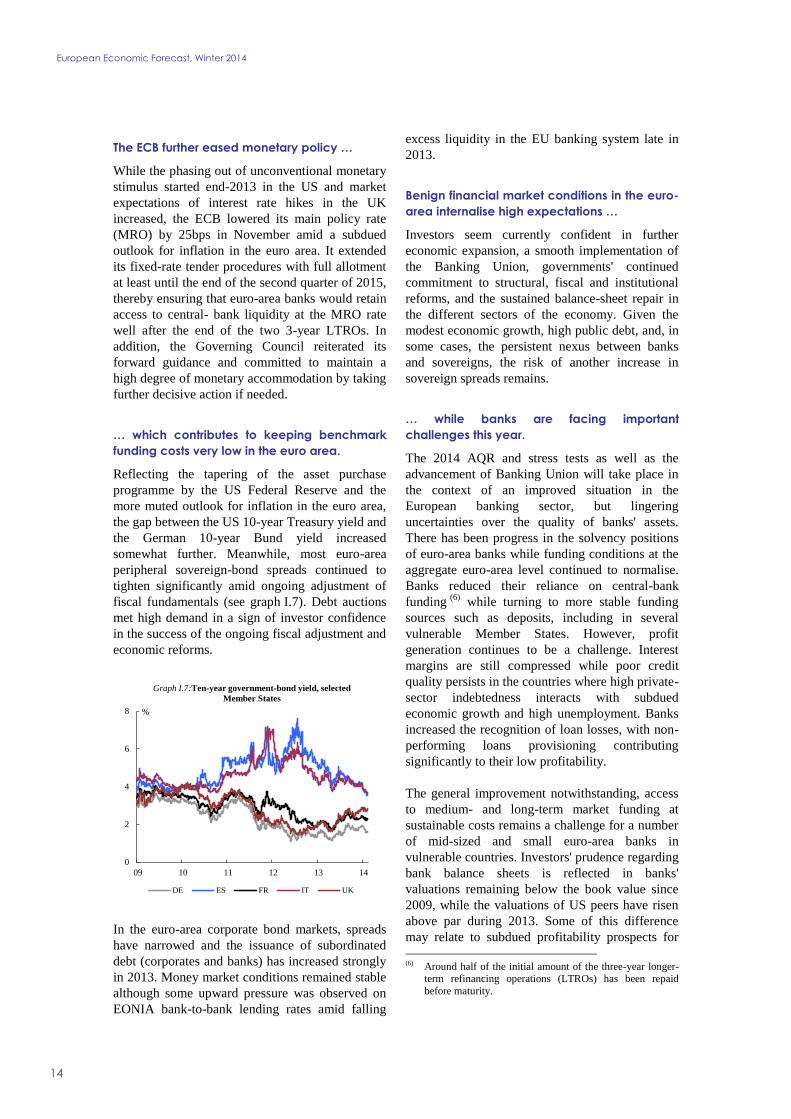
somewhat further Meanwhile most euro-area
peripheral sovereign-bond spreads continued to
tighten significantly amid ongoing adjustment of
fiscal fundamentals (see graph I7) Debt auctions
met high demand in a sign of investor confidence
in the success of the ongoing fiscal adjustment and
economic reforms
0
2
4
6
8
09 10 11 12 13 14
DE ES FR IT UK
Graph I7Ten-year government-bond yield selected
Member States
In the euro-area corporate bond markets spreads
have narrowed and the issuance of subordinated
debt (corporates and banks) has increased strongly
in 2013 Money market conditions remained stable
although some upward pressure was observed on
EONIA bank-to-bank lending rates amid falling
excess liquidity in the EU banking system late in
2013
Benign financial market conditions in the euro-
area internalise high expectations hellip
Investors seem currently confident in further
economic expansion a smooth implementation of
the Banking Union governments continued
commitment to structural fiscal and institutional
reforms and the sustained balance-sheet repair in
the different sectors of the economy Given the
modest economic growth high public debt and in
some cases the persistent nexus between banks
and sovereigns the risk of another increase in
sovereign spreads remains
hellip while banks are facing important
challenges this year
The 2014 AQR and stress tests as well as the
advancement of Banking Union will take place in
the context of an improved situation in the
European banking sector but lingering
uncertainties over the quality of banks assets
There has been progress in the solvency positions
of euro-area banks while funding conditions at the
aggregate euro-area level continued to normalise
Banks reduced their reliance on central-bank
funding (6)
while turning to more stable funding
sources such as deposits including in several
vulnerable Member States However profit
generation continues to be a challenge Interest
margins are still compressed while poor credit
quality persists in the countries where high private-
sector indebtedness interacts with subdued
economic growth and high unemployment Banks
increased the recognition of loan losses with non-
performing loans provisioning contributing
significantly to their low profitability
The general improvement notwithstanding access
to medium- and long-term market funding at
sustainable costs remains a challenge for a number
of mid-sized and small euro-area banks in
vulnerable countries Investors prudence regarding
bank balance sheets is reflected in banks
valuations remaining below the book value since
2009 while the valuations of US peers have risen
above par during 2013 Some of this difference
may relate to subdued profitability prospects for
(6) Around half of the initial amount of the three-year longer-
term refinancing operations (LTROs) has been repaid
before maturity
EA and EU outlook
15
euro-area banks but it also relates to investor
uncertainty over the quality of banks assets
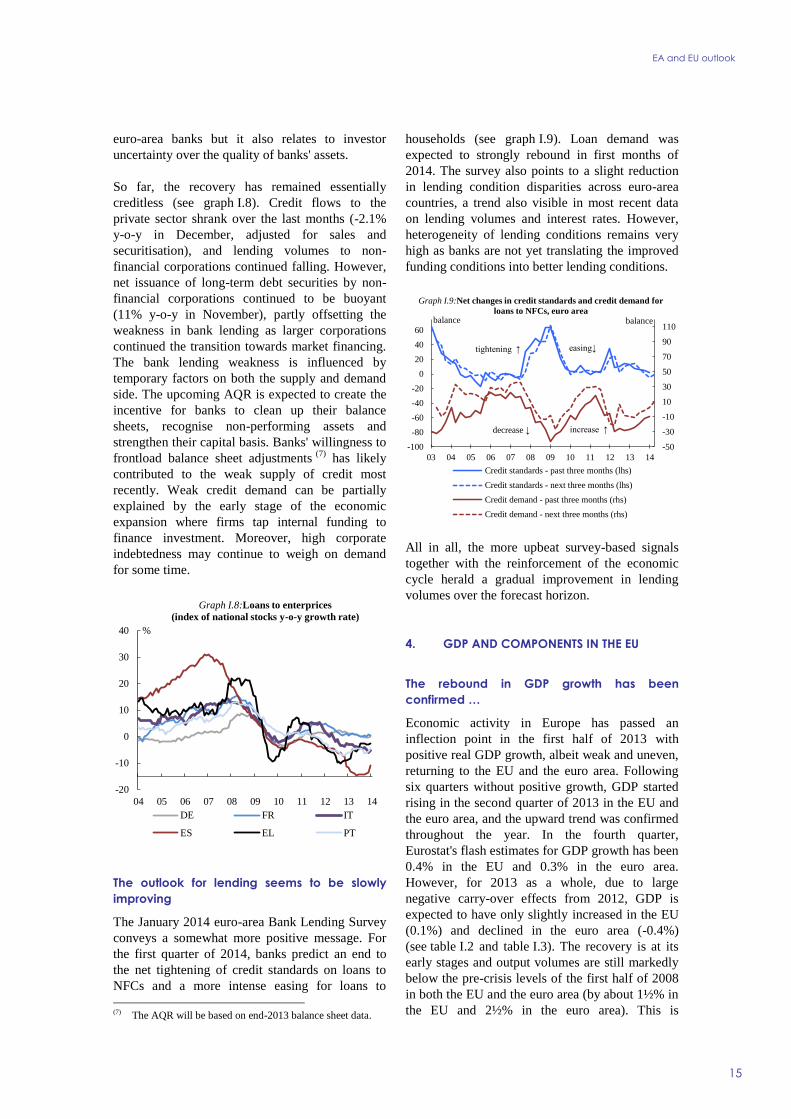
So far the recovery has remained essentially
creditless (see graph I8) Credit flows to the
private sector shrank over the last months (-21
y-o-y in December adjusted for sales and
securitisation) and lending volumes to non-
financial corporations continued falling However
net issuance of long-term debt securities by non-
financial corporations continued to be buoyant
(11 y-o-y in November) partly offsetting the
weakness in bank lending as larger corporations
continued the transition towards market financing
The bank lending weakness is influenced by
temporary factors on both the supply and demand
side The upcoming AQR is expected to create the
incentive for banks to clean up their balance
sheets recognise non-performing assets and
strengthen their capital basis Banks willingness to
frontload balance sheet adjustments (7)
has likely
contributed to the weak supply of credit most
recently Weak credit demand can be partially
explained by the early stage of the economic
expansion where firms tap internal funding to
finance investment Moreover high corporate
indebtedness may continue to weigh on demand
for some time
-20
-10
0
10
20
30
40
04 05 06 07 08 09 10 11 12 13 14
DE FR IT
ES EL PT
Graph I8Loans to enterprices
(index of national stocks y-o-y growth rate)
The outlook for lending seems to be slowly
improving
The January 2014 euro-area Bank Lending Survey
conveys a somewhat more positive message For
the first quarter of 2014 banks predict an end to
the net tightening of credit standards on loans to
NFCs and a more intense easing for loans to
(7) The AQR will be based on end-2013 balance sheet data
households (see graph I9) Loan demand was
expected to strongly rebound in first months of
2014 The survey also points to a slight reduction
in lending condition disparities across euro-area
countries a trend also visible in most recent data
on lending volumes and interest rates However
heterogeneity of lending conditions remains very
high as banks are not yet translating the improved
funding conditions into better lending conditions
-50
-30
-10
10
30
50
70
90
110
-100
-80
-60
-40
-20
0
20
40
60
03 04 05 06 07 08 09 10 11 12 13 14
Credit standards - past three months (lhs)
Credit standards - next three months (lhs)
Credit demand - past three months (rhs)
Credit demand - next three months (rhs)
tightening uarr easingdarr
increase uarr decrease darr
Graph I9Net changes in credit standards and credit demand for
loans to NFCs euro areabalance balance
All in all the more upbeat survey-based signals
together with the reinforcement of the economic
cycle herald a gradual improvement in lending
volumes over the forecast horizon
4 GDP AND COMPONENTS IN THE EU
The rebound in GDP growth has been
confirmed hellip
Economic activity in Europe has passed an
inflection point in the first half of 2013 with
positive real GDP growth albeit weak and uneven
returning to the EU and the euro area Following
six quarters without positive growth GDP started
rising in the second quarter of 2013 in the EU and
the euro area and the upward trend was confirmed
throughout the year In the fourth quarter
Eurostats flash estimates for GDP growth has been
04 in the EU and 03 in the euro area
However for 2013 as a whole due to large
negative carry-over effects from 2012 GDP is
expected to have only slightly increased in the EU
(01) and declined in the euro area (-04)
(see table I2 and table I3) The recovery is at its
early stages and output volumes are still markedly
below the pre-crisis levels of the first half of 2008
in both the EU and the euro area (by about 1frac12 in
the EU and 2frac12 in the euro area) This is
European Economic Forecast Winter 2014
16
nevertheless in line with empirical evidence of full
recoveries following deep financial crisis (8)
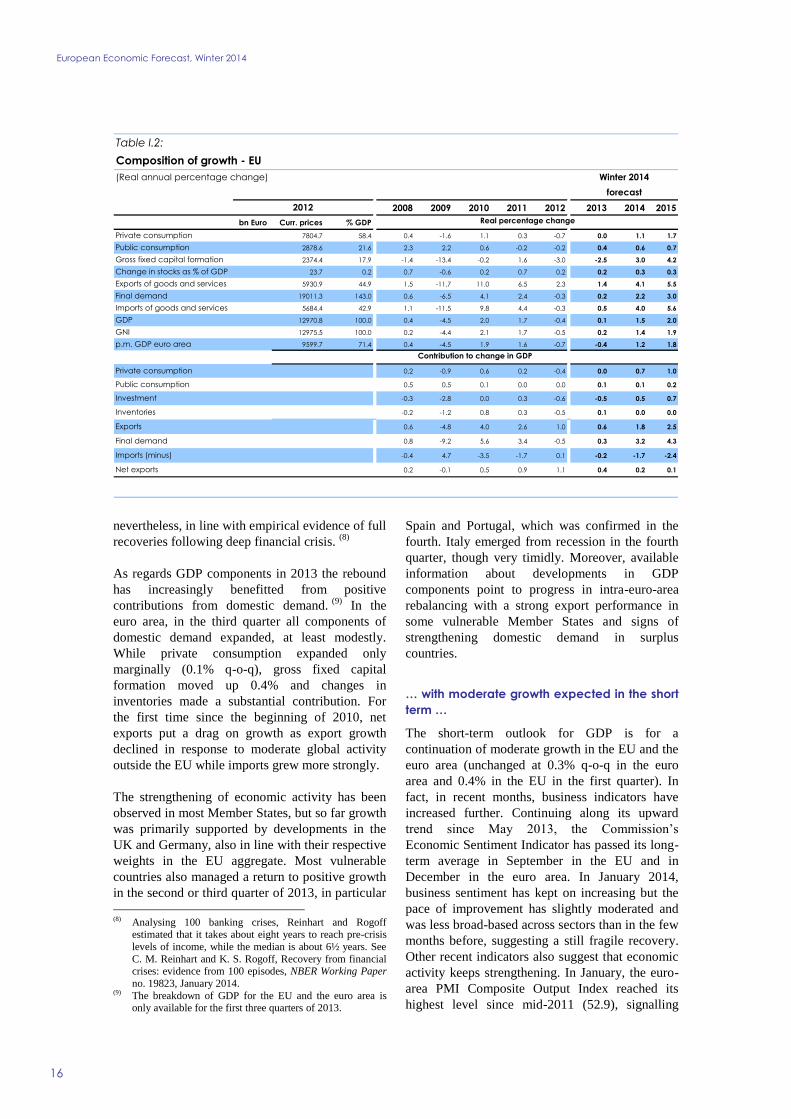
As regards GDP components in 2013 the rebound
has increasingly benefitted from positive
contributions from domestic demand (9)
In the
euro area in the third quarter all components of
domestic demand expanded at least modestly
While private consumption expanded only
marginally (01 q-o-q) gross fixed capital
formation moved up 04 and changes in
inventories made a substantial contribution For
the first time since the beginning of 2010 net
exports put a drag on growth as export growth
declined in response to moderate global activity
outside the EU while imports grew more strongly
The strengthening of economic activity has been
observed in most Member States but so far growth
was primarily supported by developments in the
UK and Germany also in line with their respective
weights in the EU aggregate Most vulnerable
countries also managed a return to positive growth
in the second or third quarter of 2013 in particular
(8) Analysing 100 banking crises Reinhart and Rogoff
estimated that it takes about eight years to reach pre-crisis
levels of income while the median is about 6frac12 years See
C M Reinhart and K S Rogoff Recovery from financial crises evidence from 100 episodes NBER Working Paper
no 19823 January 2014 (9) The breakdown of GDP for the EU and the euro area is
only available for the first three quarters of 2013
Spain and Portugal which was confirmed in the
fourth Italy emerged from recession in the fourth
quarter though very timidly Moreover available
information about developments in GDP
components point to progress in intra-euro-area
rebalancing with a strong export performance in
some vulnerable Member States and signs of
strengthening domestic demand in surplus
countries
hellip with moderate growth expected in the short
term hellip
The short-term outlook for GDP is for a
continuation of moderate growth in the EU and the
euro area (unchanged at 03 q-o-q in the euro
area and 04 in the EU in the first quarter) In
fact in recent months business indicators have
increased further Continuing along its upward
trend since May 2013 the Commissionrsquos
Economic Sentiment Indicator has passed its long-
term average in September in the EU and in
December in the euro area In January 2014
business sentiment has kept on increasing but the
pace of improvement has slightly moderated and
was less broad-based across sectors than in the few
months before suggesting a still fragile recovery
Other recent indicators also suggest that economic
activity keeps strengthening In January the euro-
area PMI Composite Output Index reached its
highest level since mid-2011 (529) signalling
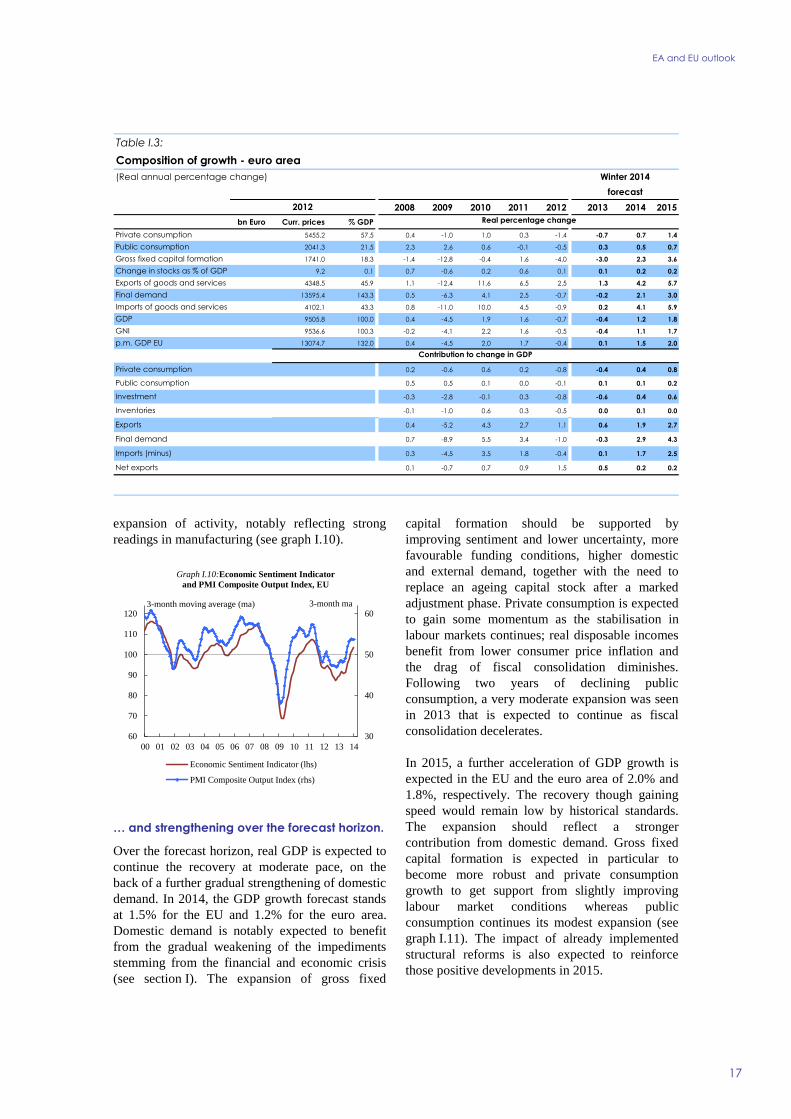
2008 2009 2010 2011 2012 2013 2014 2015
bn Euro Curr prices GDP
78047 584 04 -16 11 03 -07 00 11 17
28786 216 23 22 06 -02 -02 04 06 07
23744 179 -14 -134 -02 16 -30 -25 30 42
237 02 07 -06 02 07 02 02 03 03
59309 449 15 -117 110 65 23 14 41 55
190113 1430 06 -65 41 24 -03 02 22 30
56844 429 11 -115 98 44 -03 05 40 56
129708 1000 04 -45 20 17 -04 01 15 20
129755 1000 02 -44 21 17 -05 02 14 19
95997 714 04 -45 19 16 -07 -04 12 18
02 -09 06 02 -04 00 07 10
05 05 01 00 00 01 01 02
-03 -28 00 03 -06 -05 05 07
-02 -12 08 03 -05 01 00 00
06 -48 40 26 10 06 18 25
08 -92 56 34 -05 03 32 43
-04 47 -35 -17 01 -02 -17 -24
02 -01 05 09 11 04 02 01
Gross fixed capital formation
(Real annual percentage change)
2012
Final demand
GDP
Public consumption
Change in stocks as of GDP
Imports (minus)
GNI
Investment
Exports of goods and services
Table I2
Contribution to change in GDP
Private consumption
Winter 2014
Net exports
pm GDP euro area
Final demand
Inventories
forecast
Composition of growth - EU
Public consumption
Real percentage change
Imports of goods and services
Exports
Private consumption
EA and EU outlook
17
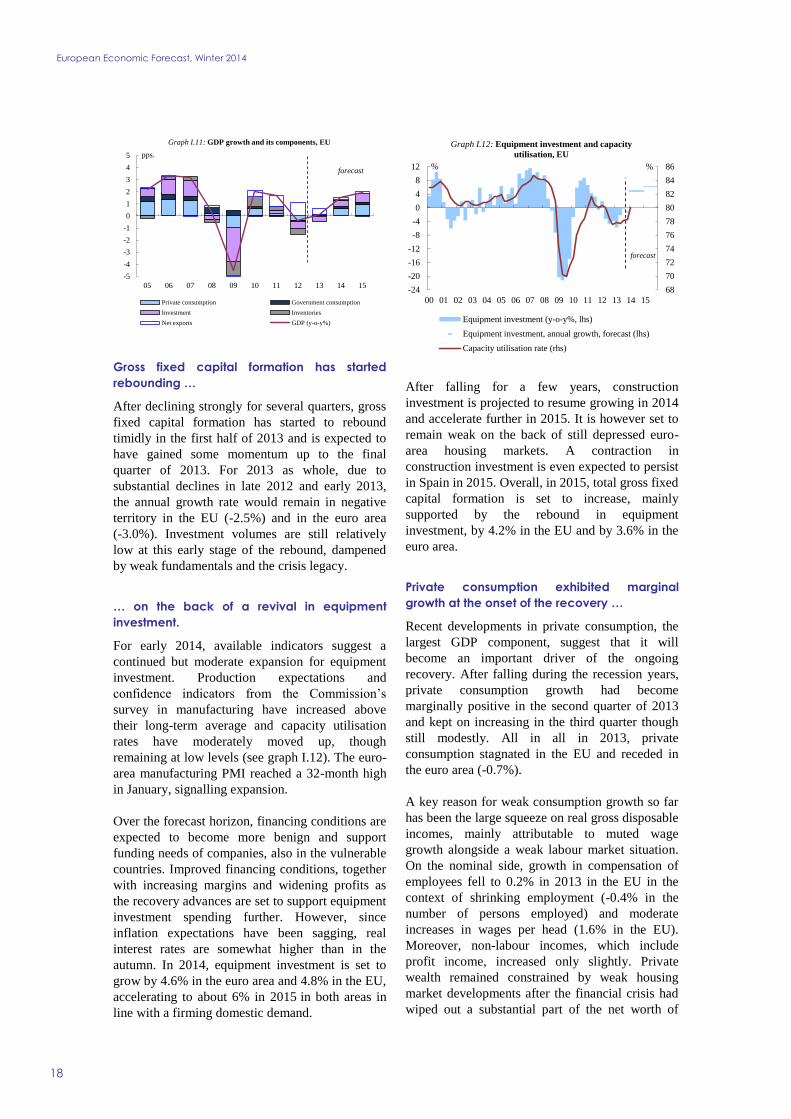
expansion of activity notably reflecting strong
readings in manufacturing (see graph I10)
30
40
50
60
60
70
80
90
100
110
120
00 01 02 03 04 05 06 07 08 09 10 11 12 13 14
Economic Sentiment Indicator (lhs)
PMI Composite Output Index (rhs)
3-month moving average (ma) 3-month ma
Graph I10Economic Sentiment Indicator
and PMI Composite Output Index EU
hellip and strengthening over the forecast horizon
Over the forecast horizon real GDP is expected to
continue the recovery at moderate pace on the
back of a further gradual strengthening of domestic
demand In 2014 the GDP growth forecast stands
at 15 for the EU and 12 for the euro area
Domestic demand is notably expected to benefit
from the gradual weakening of the impediments
stemming from the financial and economic crisis
(see section I) The expansion of gross fixed
capital formation should be supported by
improving sentiment and lower uncertainty more
favourable funding conditions higher domestic
and external demand together with the need to
replace an ageing capital stock after a marked
adjustment phase Private consumption is expected
to gain some momentum as the stabilisation in
labour markets continues real disposable incomes
benefit from lower consumer price inflation and
the drag of fiscal consolidation diminishes
Following two years of declining public
consumption a very moderate expansion was seen
in 2013 that is expected to continue as fiscal
consolidation decelerates
In 2015 a further acceleration of GDP growth is
expected in the EU and the euro area of 20 and
18 respectively The recovery though gaining
speed would remain low by historical standards
The expansion should reflect a stronger
contribution from domestic demand Gross fixed
capital formation is expected in particular to
become more robust and private consumption
growth to get support from slightly improving
labour market conditions whereas public
consumption continues its modest expansion (see
graph I11) The impact of already implemented
structural reforms is also expected to reinforce
those positive developments in 2015
2008 2009 2010 2011 2012 2013 2014 2015
bn Euro Curr prices GDP
54552 575 04 -10 10 03 -14 -07 07 14
20413 215 23 26 06 -01 -05 03 05 07
17410 183 -14 -128 -04 16 -40 -30 23 36
92 01 07 -06 02 06 01 01 02 02
43485 459 11 -124 116 65 25 13 42 57
135954 1433 05 -63 41 25 -07 -02 21 30
41021 433 08 -110 100 45 -09 02 41 59
95058 1000 04 -45 19 16 -07 -04 12 18
95366 1003 -02 -41 22 16 -05 -04 11 17
130747 1320 04 -45 20 17 -04 01 15 20
02 -06 06 02 -08 -04 04 08
05 05 01 00 -01 01 01 02
-03 -28 -01 03 -08 -06 04 06
-01 -10 06 03 -05 00 01 00
04 -52 43 27 11 06 19 27
07 -89 55 34 -10 -03 29 43
03 -45 35 18 -04 01 17 25
01 -07 07 09 15 05 02 02
Table I3
Contribution to change in GDP
Private consumption
Winter 2014
Net exports
pm GDP EU
Final demand
Inventories
forecast
Composition of growth - euro area
Public consumption
Real percentage change
Imports of goods and services
Exports
Private consumption
Gross fixed capital formation
(Real annual percentage change)
2012
Final demand
GDP
Public consumption
Change in stocks as of GDP
Imports (minus)
GNI
Investment
Exports of goods and services
European Economic Forecast Winter 2014
18
-5
-4
-3
-2
-1
0
1
2
3
4
5
05 06 07 08 09 10 11 12 13 14 15
pps
Graph I11 GDP growth and its components EU
Private consumption Government consumption
Investment Inventories
Net exports GDP (y-o-y)
forecast
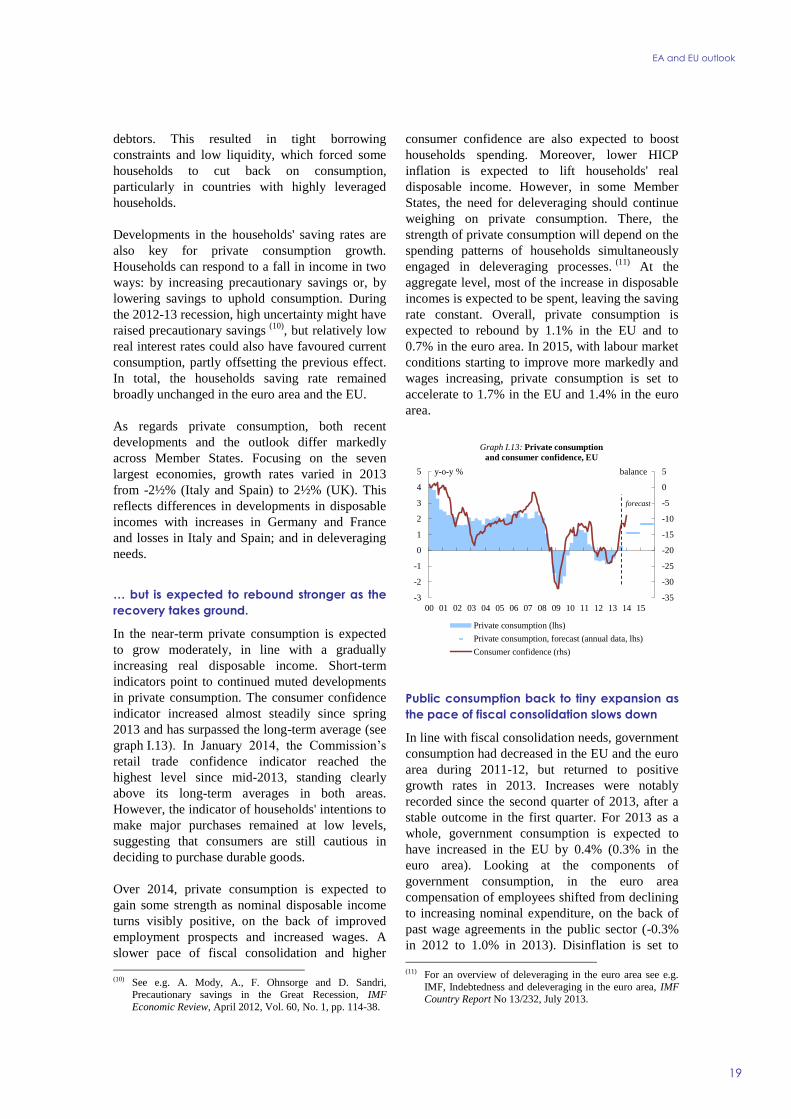
Gross fixed capital formation has started
rebounding hellip
After declining strongly for several quarters gross
fixed capital formation has started to rebound
timidly in the first half of 2013 and is expected to
have gained some momentum up to the final
quarter of 2013 For 2013 as whole due to
substantial declines in late 2012 and early 2013
the annual growth rate would remain in negative
territory in the EU (-25) and in the euro area
(-30) Investment volumes are still relatively
low at this early stage of the rebound dampened
by weak fundamentals and the crisis legacy
hellip on the back of a revival in equipment
investment
For early 2014 available indicators suggest a
continued but moderate expansion for equipment
investment Production expectations and
confidence indicators from the Commissionrsquos
survey in manufacturing have increased above
their long-term average and capacity utilisation
rates have moderately moved up though
remaining at low levels (see graph I12) The euro-
area manufacturing PMI reached a 32-month high
in January signalling expansion
Over the forecast horizon financing conditions are
expected to become more benign and support
funding needs of companies also in the vulnerable
countries Improved financing conditions together
with increasing margins and widening profits as
the recovery advances are set to support equipment
investment spending further However since
inflation expectations have been sagging real
interest rates are somewhat higher than in the
autumn In 2014 equipment investment is set to
grow by 46 in the euro area and 48 in the EU
accelerating to about 6 in 2015 in both areas in
line with a firming domestic demand
68
70
72
74
76
78
80
82
84
86
-24
-20
-16
-12
-8
-4
0
4
8
12
00 01 02 03 04 05 06 07 08 09 10 11 12 13 14 15
Graph I12 Equipment investment and capacity
utilisation EU
Equipment investment (y-o-y lhs)
Equipment investment annual growth forecast (lhs)
Capacity utilisation rate (rhs)
forecast
After falling for a few years construction
investment is projected to resume growing in 2014
and accelerate further in 2015 It is however set to
remain weak on the back of still depressed euro-
area housing markets A contraction in
construction investment is even expected to persist
in Spain in 2015 Overall in 2015 total gross fixed
capital formation is set to increase mainly
supported by the rebound in equipment
investment by 42 in the EU and by 36 in the
euro area
Private consumption exhibited marginal
growth at the onset of the recovery hellip
Recent developments in private consumption the
largest GDP component suggest that it will
become an important driver of the ongoing
recovery After falling during the recession years
private consumption growth had become
marginally positive in the second quarter of 2013
and kept on increasing in the third quarter though
still modestly All in all in 2013 private
consumption stagnated in the EU and receded in
the euro area (-07)
A key reason for weak consumption growth so far
has been the large squeeze on real gross disposable
incomes mainly attributable to muted wage
growth alongside a weak labour market situation
On the nominal side growth in compensation of
employees fell to 02 in 2013 in the EU in the
context of shrinking employment (-04 in the
number of persons employed) and moderate
increases in wages per head (16 in the EU)
Moreover non-labour incomes which include
profit income increased only slightly Private
wealth remained constrained by weak housing
market developments after the financial crisis had
wiped out a substantial part of the net worth of
EA and EU outlook
19
debtors This resulted in tight borrowing
constraints and low liquidity which forced some
households to cut back on consumption
particularly in countries with highly leveraged
households
Developments in the households saving rates are
also key for private consumption growth
Households can respond to a fall in income in two
ways by increasing precautionary savings or by
lowering savings to uphold consumption During
the 2012-13 recession high uncertainty might have
raised precautionary savings (10)
but relatively low
real interest rates could also have favoured current
consumption partly offsetting the previous effect
In total the households saving rate remained
broadly unchanged in the euro area and the EU
As regards private consumption both recent
developments and the outlook differ markedly
across Member States Focusing on the seven
largest economies growth rates varied in 2013
from -2frac12 (Italy and Spain) to 2frac12 (UK) This
reflects differences in developments in disposable
incomes with increases in Germany and France
and losses in Italy and Spain and in deleveraging
needs
hellip but is expected to rebound stronger as the
recovery takes ground
In the near-term private consumption is expected
to grow moderately in line with a gradually
increasing real disposable income Short-term
indicators point to continued muted developments
in private consumption The consumer confidence
indicator increased almost steadily since spring
2013 and has surpassed the long-term average (see
graph I13) In January 2014 the Commissionrsquos
retail trade confidence indicator reached the
highest level since mid-2013 standing clearly
above its long-term averages in both areas
However the indicator of households intentions to
make major purchases remained at low levels
suggesting that consumers are still cautious in
deciding to purchase durable goods
Over 2014 private consumption is expected to
gain some strength as nominal disposable income
turns visibly positive on the back of improved
employment prospects and increased wages A
slower pace of fiscal consolidation and higher
(10) See eg A Mody A F Ohnsorge and D Sandri
Precautionary savings in the Great Recession IMF
Economic Review April 2012 Vol 60 No 1 pp 114-38
consumer confidence are also expected to boost
households spending Moreover lower HICP
inflation is expected to lift households real
disposable income However in some Member
States the need for deleveraging should continue
weighing on private consumption There the
strength of private consumption will depend on the
spending patterns of households simultaneously
engaged in deleveraging processes (11)
At the
aggregate level most of the increase in disposable
incomes is expected to be spent leaving the saving
rate constant Overall private consumption is
expected to rebound by 11 in the EU and to
07 in the euro area In 2015 with labour market
conditions starting to improve more markedly and
wages increasing private consumption is set to
accelerate to 17 in the EU and 14 in the euro
area
-35
-30
-25
-20
-15
-10
-5
0
5
-3
-2
-1
0
1
2
3
4
5
00 01 02 03 04 05 06 07 08 09 10 11 12 13 14 15
balancey-o-y
Graph I13 Private consumption
and consumer confidence EU
Private consumption (lhs)
Private consumption forecast (annual data lhs)
Consumer confidence (rhs)
forecast
Public consumption back to tiny expansion as
the pace of fiscal consolidation slows down
In line with fiscal consolidation needs government
consumption had decreased in the EU and the euro
area during 2011-12 but returned to positive
growth rates in 2013 Increases were notably
recorded since the second quarter of 2013 after a
stable outcome in the first quarter For 2013 as a
whole government consumption is expected to
have increased in the EU by 04 (03 in the
euro area) Looking at the components of
government consumption in the euro area
compensation of employees shifted from declining
to increasing nominal expenditure on the back of
past wage agreements in the public sector (-03
in 2012 to 10 in 2013) Disinflation is set to
(11) For an overview of deleveraging in the euro area see eg
IMF Indebtedness and deleveraging in the euro area IMF Country Report No 13232 July 2013
European Economic Forecast Winter 2014
20
amplify the impact on real government
consumption
Over the forecast horizon with weaker
consolidation needs public consumption is
expected to gain traction in the EU and the euro
area However declines in public consumption in
2014 and 2015 are still expected in Ireland
Greece Spain Cyprus and Portugal The forecast
for 2015 is based on the no-policy-change
assumption which implies that only measures
adopted by national parliaments or known in
sufficient details are accounted for
Net exports supported the rebound in GDP in
the first half of 2013 hellip
Following the very strong expansion of exports of
goods and services by about 2 (q-o-q) in the
second quarter of 2013 in both the EU and the euro
area the third quarter saw exports stagnating in the
EU and growing by just frac14 in the euro area The
latest decline in export growth was mainly driven
by slowing extra-EU demand but also by the
nominal appreciation of the euro The growth of
total imports had also turned positive in both areas
in the second and third quarters (1frac12 and 1frac14
respectively) reflecting the strengthening of
domestic demand With imports growing more
strongly than exports the contribution from net
exports to GDP growth turned negative in the third
quarter
hellip but will diminish over the forecast horizon hellip
In the short term further export growth is expected
in line with the increasing foreign demand for EU
products In fact manufacturing export order
books from the Commissions surveys have
improved further in the latest months being above
their long-term averages and so did new export
orders in the manufacturing PMI (see graph I14)
For the year 2013 as a whole EU export growth is
expected to have slowed to 1frac12 before
accelerating in 2014 (4) and 2015 (5frac12) on the
back of a rebound in economic activity outside the
EU Following moderate growth in 2013
(frac12) import growth is expected to expand almost
in parallel to exports This is also related to the
expected acceleration in investment which is more
import intensive than other GDP components (12)
30
35
40
45
50
55
60
65
70
-12
-8
-4
0
4
8
12
00 01 02 03 04 05 06 07 08 09 10 11 12 13 14 15
Graph I14 Global demand EU exports
and new export orders
Exports (q-o-q lhs)
Exports forecast (annual data y-o-y lhs)
Output index (Global PMI composite rhs)
New export orders (PMI Manuf EU rhs)
3-month moving average
forecast
Export growth outperformed import growth in
2013 and net exports should have contributed
positively to GDP growth This picture is expected
to change over the forecast as imports strengthen
in line with the pick-up in domestic demand Net
exports contribution would be more than halved in
2014-15 compared to 2013 though remaining
slightly positive
hellip with some cross-country differences
The ongoing restructuring of the corporate sector
in vulnerable Member States is supporting their
performance on foreign markets and enables them
to take advantage of the expansion of world trade
This has already been visible in recent export
growth rates with vulnerable countries
outperforming others (see graph I15) However
due to still relative small export shares in some of
these countries the positive impact on overall
GDP growth remains limited
Strengthening current-account surplus in the
euro area
The trade balances of the euro area and the EU
were positively affected by the increase in export
volumes in 2013 Moreover the long-lasting
weakening of economic activity in the EU and
shrinking private consumption volumes have left
their mark on imports Import prices declining
faster than export prices supported the widening of
(12) See eg M Bussiegravere et al Estimating trade elasticites
demand composition and the trade collapse American Economic Journal Macroeconomics July 2013 Vol 5
No 3 pp 118-151
EA and EU outlook
21
the surplus in the adjusted merchandise trade
balance in 2013
-5
-4
-3
-2
-1
0
1
2
3
4
10 11 12 13 14 15 10 11 12 13 14 15
Graph I15Growth contributions in surplus and former
deficit countries
Net exports Domestic demand GDP growth
Former deficit countriesSurplus countries
BE DE AT LU NL FI IE EL ES CY MT PT SI
After years of having a roughly balanced external
position the current-account balance of both the
EU and the euro area has now shifted into a more
marked surplus (in adjusted terms) and is expected
to have been close to 1frac14 and 2frac14 of GDP
respectively in 2013 Moreover it is forecast to
stay broadly at those levels in 2014 and 2015
Most of the strengthening in the euro-area current
account is the result of significant adjustment in
the vulnerable countries which previously
recorded high deficits External rebalancing in
vulnerable euro-area Member States is supported
by gains in price competiveness due to lower unit
labour costs as well as by the permanent
contraction of domestic demand induced by
reductions in overblown construction investments
corrections in future income expectations and
increases in structural unemployment (see box I3)
Going forward the expected recovery in domestic
demand is set to slow down the growth of net
exports so that the pace of improvement in current
accounts of vulnerable Member Sates starts
reducing
5 LABOUR MARKET CONDITIONS IN THE EU
After declining for almost two years employment
(ie the number of persons employed) stabilised in
the second quarter of 2013 and remained
unchanged in the third quarter while
unemployment rates have stopped increasing since
mid-2013
Labour market conditions have stabilised since
the second half of 2013 hellip
In the second half of 2013 the unemployment rate
remained broadly unchanged in the EU and the
euro area after being on the rise for the last five
years In December the unemployment rate
declined very timidly in the EU to 107 (from
108 in November) while it stood unchanged at
120 in the euro area (after peaking at 121 in
the summer) remaining in both areas at
historically high levels Since the summer the
youth unemployment rate has also started to recede
in the EU and to stabilise in the euro area but this
partly reflects a falling participation rate In
December 2013 it reached 232 in the EU and
239 in the euro area compared to 237 and
242 a year earlier
With output growth accelerating only slowly and
in view of the lagged response of employment to
the cycle little net job creation is expected to take
place in the short term Most of the latest survey
measures of hiring intentions have continued to
increase in recent months but remain at low levels
According to Commission surveys in industry
employment expectations in the EU and euro area
have steadily increased up to January 2014 and
slightly exceed the long-term average whereas
expectations in the services sector despite being on
an upward trend remain low In the construction
sector hiring intentions have been more volatile
and are still below their long-term average
Consumers unemployment fears have almost
steadily declined from the peaks observed in late
2012 having fallen below their long-term averages
(see graph I16)
0
10
20
30
40
50
60
70-50
-40
-30
-20
-10
0
10
20
07 08 09 10 11 12 13 14
Employment exp in industry next 3 months (lhs)
Employment exp in services next 3 months (lhs)
Consumers unempl exp next 12 months (inverted rhs)
Graph I16Employment expectations
DG ECFIN surveys EU
level level
European Economic Forecast Winter 2014
22
hellip and limited improvements are expected in
2014-15
The subdued recovery of economic activity is
expected to lead to only a minor positive impact on
employment in 2014 (03 and 05 respectively
in the euro area and the EU) but more visible ones
in 2015 (07 in both zones) (see table I4)
Private employment growth is projected to still be
dampened by the scope for firms to increase hours
per employee which are still below their pre-crisis
level before hiring new staff Besides the limited
access to funding for SMEs in some countries
could also negatively impact their hiring decisions
and those firms usually have a leading role in
employment creation
The labour force in the EU and the euro area is
estimated to grow moderately in 2013-15 in line
with population of working age The added
worker effect (resulting from the need of an
additional income for households hit by the crisis)
which characterised the response of participation
until 2012 is set to be more than offset by stronger
discouragement effects and falling participation of
the youth in particular in the countries with high
long-term unemployment rates (13)
Unemployment is set to decline timidly at the
end of the forecast horizon hellip
After being on the rise since 2009 the
unemployment rate is expected to remain
unchanged in 2014 at 120 in the euro area
while slightly receding to 107 in the EU In
2015 the unemployment rate is expected to
slightly decline in both areas to 117 in the euro
area and 104 in the EU remaining at historically
high levels (see graph I17) Such a slow decline
(13) See European Commission (DG ECFIN) Labour Market
Developments in Europe 2013 European Economy
62013
mirrors first the fragility of the economic recovery
but could reflect inter-alia a higher structural
unemployment than in the pre-crisis years Low
productivity gains the impact of long-term
unemployment on skills and future employability
of youth labour market mismatches due to the
sectoral adjustment process in some countries
together with a decline in production capacity are
preventing unemployment declining markedly
This is also mirrored by the rise in the NAWRU
which according to the Commission estimates has
increased substantially since 2008 (14)
6
7
8
9
10
11
12
-10
-08
-06
-04
-02
00
02
04
06
08
00 01 02 03 04 05 06 07 08 09 10 11 12 13 14 15
Graph I17 Employment growth and unemployment
rate EU
Employment (q-o-q lhs) forecast (y-o-y lhs)
Unemployment rate (rhs) forecast (rhs)
of the labour force
forecast
Forecast figures are annual data
hellip with marked differences across Member
States
While growth differentials are expected to narrow
over the forecast horizon large differences in
labour market performances are set to persist In
2015 unemployment rates are expected to range
from 47 in Austria to 246 in Spain reflecting
(14) However variations in the NAWRU might also reflect
some cyclical factors
(Annual percentage change)
2012 2013 2014 2015 2013 2014 2015 2012 2013 2014 2015 2013 2014 2015
Population of working age (15-64) 00 00 00 00 01 01 01 00 01 01 01 01 01 01
Labour force 07 -01 -01 03 00 02 02 07 01 00 04 02 02 03
Employment -08 -09 03 07 -09 02 07 -03 -04 05 07 -04 03 07
Employment (change in million) -06 -08 02 07 -09 02 07 -02 -04 04 07 -04 03 07
Unemployment (levels in millions) 182 193 192 186 195 196 190 255 266 261 254 270 269 261
Unemployment rate ( of labour force) 114 121 120 117 122 122 118 105 109 107 104 111 110 107
Labour productivity whole economy 02 05 09 10 04 08 10 -01 05 10 12 04 10 12
Employment rate (a) 583 578 580 584 578 579 582 584 581 583 586 579 580 583
(a) As a percentage of population of working age Definition according to structural indicators
See also note 6 in the Statistical Annex
Autumn 2013
Table I4
forecast
Labour market outlook - euro area and EU
EUEuro area
Autumn 2013
forecast
EA and EU outlook
23
divergent output developments as well as different
responses of employment to output However the
unemployment rate should see a decline in most of
the EU Member States by the end of the forecast
horizon
The variable labour market conditions across
countries are also reflected in diverging wage
developments Since 2011 real wage increases
have lagged behind productivity growth in most
high-unemployment countries facing substantial
internal and external adjustment needs Looking
ahead wage moderation is set to continue in
vulnerable Member States allowing for a further
gradual improvement in price competitiveness On
the other hand a notable rise in unit labour costs
was observed in countries with relatively low
unemployment and real wages per head are set to
grow faster than in the pre-crisis years notably in
Germany
6 INFLATION IN THE EU
Inflation slowed down in 2013 hellip
In the EU and the euro area consumer-price
inflation has been trending downwards throughout
2013 on the back of falling energy prices together
with still weak economic conditions In 2013
HICP inflation averaged 15 and 14
respectively in the EU and the euro area compared
to 26 and 25 in 2012 (see Graph I18) The
easing of price pressures was accentuated towards
the end of the year by the fading impact of
temporary factors ndash past increases in taxation in a
number of Member States linked to fiscal
consolidation needs and some volatility in
commodity prices Also a marked appreciation of
the euro contributed to decreasing price pressures
from imported goods in 2013
-1
0
1
2
3
4
5
07 08 09 10 11 12 13 14 15
Energy and unprocessed food [pps]
Other components (core inflation) [pps]
HICP all items
forecast
hellip and so did underlying inflation
Core inflation ie all-item HICP inflation
excluding energy and unprocessed food remained
quite persistent in the first three quarters of 2013
(at 15 in the EU and 13 in the euro area over
that period) as the underlying inflation pressures
were still distorted by second-round effects from
previous hikes in energy prices and changes in
taxation in a number of Member States In the
fourth quarter as those factors faded away core
inflation decreased to 11 in the EU and 10 in
the euro area Notably the impact of tax hikes and
administrated prices was smaller in the fourth
quarter than during the rest of 2013 The inflation
measure adjusted for tax changes (15)
stood at 11
in the EU and 1 in the euro area in 2013
Moreover the theoretical impact of changes in
taxation on inflation varied in 2013 from
-01 pp in Denmark and Lithuania to 14 pps in
Spain masking somewhat the underlying price
pressures
A protracted period of low inflation hellip
Looking ahead with the underlying price trend
likely to remain subdued and continued downward
trend in commodity prices average annual HICP
inflation in 2014 is predicted to ease further to
around 1 in both areas on the back of weak
demand in the current cyclical phase reinforced by
relative price adjustments Inflation appears to
have become more reactive to the output gap
recently possibly driven by a reduction of nominal
rigidities in particular in vulnerable Member
States that have implemented significant structural
reforms in the recent past (see Box I4)
With a gradual reduction of the output gap over the
forecast horizon the dampening cyclical impact on
price pressures is likely to fade and a muted
increase in HICP inflation is expected in the course
of 2015 Average HICP inflation in 2015 in the EU
and euro area is set to increase slightly to 15 and
13 respectively
hellip driven by restrained wage pressures hellip
On average in 2013 compensation per employee
in the euro area rose at a muted pace (1frac12 in the
three first quarters of 2013) As labour productivity
growth gained momentum in the course of 2013
(15) This measure assumes full and immediate pass-through of
tax changes to prices It may therefore overestimate the
impact of tax changes on inflation
European Economic Forecast Winter 2014
24
the growth in unit labour costs has decelerated
substantially to 10 in the third quarter of 2013
With improved economic prospects ahead
productivity gains are set to accelerate towards the
end of the forecast horizon to 1 in the euro area
and 12 in the EU Combined with a modest
recovery in wage growth (to about 2 in 2015 in
both areas) growth in unit-labour-cost is set to
stabilise below 1 per year indicating modest
inflation pressures from the labour market
However the overall outlook for wage pressures
masks quite divergent situations across Member
States
hellip and producer price inflation turning
negative
The subdued inflation outlook is corroborated by
developments in upstream price pressures which
have been declining since spring 2011 Producer
prices excluding construction fell further and
turned negative in mid-2013 both in the EU and
the euro area In December they declined by 06
y-o-y in the EU Assuming a partial pass-through
of producer prices to consumer prices this
foreshadows continuing disinflationary pressures
in the months ahead given the overall weakness in
economic conditions and the assumptions for
commodity-price developments
Stable long-run inflation expectations
Survey indicators of producer and consumer price
expectations seem to signal low but positive
inflation developments in the short term As
regards producers expectations the PMI
manufacturing input price index after recording a
trough in mid-2013 revived substantially and
stands slightly above the 50-mark in January
indicating an increase in future prices amid better
economic news By contrast output price
expectations (ie selling prices) proved very stable
over the same period hovering around the 50-mark
suggesting a feeble pricing power of companies
due to weak demand prospects In the course of
2013 consumers inflation expectations followed
the inflation trend downward and suggest low
inflation in the short term (see graph I19)
The market-based euro-area inflation expectations
seem to corroborate the survey-based indications
Inflation expectations derived from swap rates
have been trending downwards at all maturities
since spring 2011 although an uptick is visible
since mid-December 2013 Taken at face value
the spot rates of inflation-linked swaps observed in
January 2014 imply an average annual inflation
rate of 11 over 2014-16 Over the medium term
inflation expectations derived from inflation-linked
swap rates at the three-years-forward-three-years-
ahead horizon imply an average inflation rate of
17 in 2017-19 At the same time five-year
inflation-linked swap rates five years ahead the
most widely used measure of long-term inflation
expectations have been relatively stable at slightly
above 2 The marked-based indicators suggest
that long-term inflation expectations are being
well-anchored at the current juncture on the back
of high central bank credibility In the short to
medium term however markets expect inflation to
remain low
-10
-5
0
5
10
-20
-10
0
10
20
30
40
50
60
70
80
90
07 08 09 10 11 12 13
level
Graph I19 Euro-area PPI and survey inflation
expectations
PMI manufacturing input prices
PMI manufacturing output prices
ESI consumer inflation expectations
PPI industry excl construction (rhs)
7 PUBLIC FINANCES IN THE EU
Consolidation of public finances continuing but
at a slower pace
After significant fiscal consolidation in recent
years headline deficits are projected to keep
falling although at a gradually slowing pace over
the forecast horizon This pattern of consolidation
is consistent with the ongoing correction of
excessive deficits (16)
The reduction in the headline deficit in 2013
stemmed mainly from continuous underlying fiscal
effort as the uptick in economic activity remained
modest in 2013 As a result of the significant fiscal
consolidation achieved by several Member States
(16) With regard to EU budgetary surveillance all Member
States except Bulgaria Estonia Finland Germany Hungary Italy Latvia Lithuania Luxemburg Romania
and Sweden are currently subject to the Excessive Deficit
Procedure (EDP)
EA and EU outlook
25
the deficit-to-GDP ratio in 2013 is forecast to have
decreased by 03 pp in the EU and by 04 pp in
the euro area reaching 35 and 31 of GDP
respectively (see table I5)
Headline deficits are set to shrink further in 2014
and to stabilise in 2015 as the recovery slowly
broadens and given further deficit-reducing
measures included by Member States in their
budgets for this year While showing some
differentiation reflecting varying degrees of
financial and fiscal stress the improvement in
budget balances is likely to be broad-based across
Member States in 2014 As a result the fiscal
deficit is expected to fall to 27 of GDP in 2014
in the EU and to 26 in the euro area and to
remain roughly at these levels in 2015 (see
graph I20)
-7
-6
-5
-4
-3
-2
-1
0
1
2
-7
-6
-5
-4
-3
-2
-1
0
1
2
09 10 11 12 13 14 15
Graph I20 Budgetary developments
EU
General goverment balance (lhs)
Changes in structural balance (rhs)
forecast
of GDP pps
Structural deficit to decline more slowly
The fiscal policy stance is expected to be close to
neutral over the forecast horizon The reduction of
the structural budget deficit ie the general
government deficit corrected for cyclical factors
one-offs and other temporary measures is forecast
to have remained at above frac12 pp of GDP in both
areas in 2013 but it is expected to slow down in
2014 In 2015 under the usual no-policy-change
assumption the structural deficit is expected to
widen
Fiscal consolidation moving from revenue
increases to expenditure-based
The fiscal adjustment in 2013 has been mainly
revenue-based in both the EU and the euro area as
it was the case in the previous two years The
increase in public revenues has been driven by tax
receipts on income and wealth and as a result the
revenue-to-GDP ratio is set to have risen further
before reaching a peak in 2014 in the EU and euro
area at 459 and 468 respectively Further
ahead the revenue-to-GDP ratio is forecast to
decline reflecting the phasing-out of temporary
tax-increasing measures and some tax cuts planned
in a number of Member States (see graph I21)
42
43
44
45
46
47
48
49
50
51
52
09 10 11 12 13 14 15
Total revenues Total expenditure
forecast
Graph I21General government revenues and
expenditure EU
of GDP
The expenditure-to-GDP ratio has remained
broadly stable in 2013 and is expected to decrease
( of GDP)
2012 2013 2014 2015 2013 2014 2015 2012 2013 2014 2015 2013 2014 2015
Total receipts (1) 462 468 468 465 467 467 464 454 457 459 453 456 458 452
Total expenditure (2) 499 499 494 490 498 493 488 493 492 485 480 491 485 479
Actual balance (3) = (1)-(2) -37 -31 -26 -25 -31 -25 -24 -39 -35 -27 -27 -35 -27 -26
Interest expenditure (4) 31 30 30 31 30 30 31 29 29 28 29 29 29 29
Primary balance (5) = (3)+(4) -06 -01 05 06 -01 05 07 -10 -06 02 02 -07 02 02
Cyclically-adjusted budget balance -26 -16 -13 -18 -16 -13 -16 -27 -20 -16 -21 -21 -15 -20
Cyclically-adjusted primary balance 05 14 17 13 14 18 15 02 08 12 07 08 13 09
Structural budget balance -21 -15 -13 -17 -15 -13 -15 -26 -20 -19 -21 -21 -18 -19
Change in structural budget balance 15 06 01 -04 06 02 -03 12 06 01 -02 06 03 -01
Gross debt 926 955 959 954 955 959 954 866 894 897 895 898 902 901
Table I5
forecastEuro area
General Government budgetary position - euro area and EU
The structural budget balance is the cyclically-adjusted budget balance net of one-off and other temporary measures estimated
by the European Commission
EU
Autumn 2013
forecast
Autumn 2013
European Economic Forecast Winter 2014
26
afterwards in both areas to become the main
driver of the fiscal consolidation in 2014 In 2014
expenditure cuts are expected to take the form of
discretionary fiscal measures involving mainly
wages and salaries as well as intermediate
consumption and only to lesser extent public
investment In 2015 the decrease in the
expenditure-to-GDP would compensate the lower
revenue-to-GDP ratio
Debt ratios reaching a peak in 2014
The debt-to-GDP ratio is forecast to have
increased in 2013 and move up further in 2014
though at a somewhat lower pace In 2014 debt is
expected to reach a peak 897 of GDP in the EU
and 959 in the euro area (see table I6) In 2015
it is set to start decreasing in both areas The
increase of the debt-to-GDP ratio in 2014 for the
euro area is mainly due to the strong contribution
of the interest expenditure and the stock-flow
adjustment In 2014 and 2015 the faster economic
growth and the higher primary surpluses will start
having a reducing impact on the public debt-to-
GDP ratio
8 RISKS
The recent string of positive economic news has
helped to balance the risks to the growth outlook
since the autumn forecast but on the whole
downside risks continue to prevail (see graph I22)
The main risk to the forecast would be stalling or
partial implementation of structural fiscal and
institutional reforms at Member States or European
level resulting in low actual and potential growth
and protracted high unemployment A weaker than
projected labour market would have both short-
and medium-term detrimental effects on private
consumption and also on potential growth
Moreover the debt overhang the investment
shortfall in recent years and slowing total factor
productivity could hurt growth in the medium term
if they are inadequately addressed by structural
reforms (see box I2) resulting in an extended
period of low growth The expectation of lower
potential growth could feed back into investment
and consumption thus dampening growth also in
the short term
This risk of low growth would be exacerbated in
the short term if inflation were to turn out lower-
than-expected and the reduction in financial
fragmentation were to be less than anticipated
Inflation could turn out even lower than expected
in the central scenario Slower import price
increases could come from a more pronounced
weakness of emerging markets particularly if
combined with even lower commodities prices and
a further appreciation of the euro Within the EU
inflation could be dragged down if economic
agents were to judge that very weak price
pressures were becoming entrenched This would
affect real interest rates hurt demand and increase
the real debt burden The risk of deflation in the
EU ie the emergence of a broad-based and self-
sustaining downward trend in prices cannot not be
totally ruled out but given the gradually
strengthening recovery the increase in confidence
and the ongoing efforts to improve the health of
the banking system it is very unlikely
Table I6
Euro-area debt dynamics
average
2004-082009 2010 2011 2012 2013 2014 2015
Gro ss debt rat io 1 ( o f GD P ) 690 799 856 879 926 955 959 954
Change in the ratio 02 98 57 24 46 29 04 -05
Contributions to the change in the ratio
1 P rimary balance -11 35 34 11 06 01 -05 -06
2 ldquo Sno w-ballrdquo ef fect 2 02 54 07 07 25 21 08 01
Of which
Interest expenditure 30 29 28 30 31 30 30 31
Growth effect -14 32 -15 -13 06 04 -11 -16
Inflation effect -13 -07 -06 -10 -12 -13 -11 -13
3 Sto ck-f lo w adjustment 10 09 16 05 15 07 01 00
1 End of period
2 The snow-ball effect captures the impact of interest expenditure on accumulated debt as well as the impact of real GDP growth and inflation
on the debt ratio (through the denominator) The stock-flow adjustment includes differences in cash and accrual accounting accumulation of
financial assets and valuation and other residual effects
EA and EU outlook
27
The materialisation of the central scenario in a
context of still elevated deleveraging needs in the
private and banking sectors depends on further
decreases of financial fragmentation An
improvement in lending conditions this year and
next rests on the success of the AQR and stress
tests in cleaning balance sheets and removing
uncertainty about the health of euro-area banks
Smooth implementation of the Banking Union
which should improve confidence is also crucial
-5
-4
-3
-2
-1
0
1
2
3
4
5
06 07 08 09 10 11 12 13 14 15
upper 90 upper 70
upper 40 lower 40
lower 70 lower 90
central scenario actual
Graph I22Euro-area GDP forecasts -
Uncertainty linked to the balance of risks
Downside risks could also come from heightened
instability in emerging markets financing
conditions The impact has so far centred on
emerging market economies with relatively weak
fundamentals Continued and more generalised
turmoil could hit the EU economy through lower
trade and the portfolio and banking channels A
more generalised re-assessment of risks could
notably lead to a flight of capital to the highest
rated countries in the euro area raising
sovereign-bond spreads in the periphery
Continued turmoil would also trigger a slowdown
in EMEs together with an appreciation of the euro
putting a drag on the recovery which is still
dependent on exports in many countries Overall
the EU banking sector seems relatively shielded by
its small exposure to major EMEs but some
Member States are more exposed than others
The recovery could also be stronger than
envisaged Upside risks are related to positive
feedback loops between confidence GDP and
investment growth and the ability of the banking
sector to lend Positive reinforcing feedbacks
between these factors would reduce further the
drags stemming from the crisis and boost growth
More precisely economic expansion could be
stronger than envisaged in the central scenario if
domestic demand is firmer in the core countries
and helps further the rebalancing process if
confidence effects lead to a stronger rebound of
investment if the competitiveness boost in
peripheral countries is larger than envisaged and
finally if financial fragmentation is reduced to a
greater extent in 2015 following a successful AQR
and the introduction of the Single Supervisory
Mechanism In the medium term the
implementation of additional and bold structural
reforms could lift further the potential growth of
Member States with positive impact also in the
short term notably through increased confidence
Eventually a stronger economic recovery than
envisaged in the central scenario would raise the
inflation projections in particular if recent
structural reforms result in a faster reduction in
unemployment than expected
European Economic Forecast Winter 2014
28
Box I1 The economic effects of policy uncertainty
Since the outbreak of the crisis the interest in the
effects of uncertainty on the real economy has
dramatically increased Whereas most studies focus
on the effects of uncertainty on GDP (1) or
investment and consumption (2) decisions this box
attempts to assess its impact on industrial new
orders which is a variable commonly agreed to be
leading the business cycle It is assumed that
increased uncertainty induces companies to lower
their orders in anticipation of lower demand from
investors and consumers (3) While economic agents
can be confronted with uncertainty from a number
of different sources this box focusses on the effect
of uncertainty generated by major events related to
the financial and sovereign-debt crisis The analysis
suggests that there are immediate statistically
significant and economically sizeable negative
effects from crisis-related uncertainty on new
orders
How to measure uncertainty produced by the
financial and sovereign-debt crisis
In the absence of an indicator that directly maps
major events and decisions related to the financial
(1) Denis S Kannan P 2013 The Impact of
Uncertainty Shocks on the UK Economy IMF
Working Paper 1366 (2) Quarterly report on the Euro Area Volume 12 No 2
(2013) DG ECFIN European Commission (3) According to economic theory high uncertainty gives
agents an incentive to postpone or cancel their
investment consumption or employment decisions
when the latter are costly to revert (eg due to fixed
and adjustment costs) thereby depressing economic
activity See eg Bernanke B 1983 Irreversibility
uncertainty and cyclical investment The Quarterly
Journal of Economics MIT Press Vol 98(1) pp 85-
106 February
and sovereign-debt crisis the analysis relies on the
Economic Policy Uncertainty Index (EPUI) for
the EU developed at Stanford University (4) This
index combines a news-based indicator (counting
crisis-related words that appear in EU newspapers)
with others based on the dispersion of consumer-
price budget-deficit forecasts
Graph 1 shows that the EPUI adequately captures
the uncertainty caused by major crisis-related
events Furthermore Graph 2 suggests that
uncertainty significantly and negatively weighs on
important macro-economic variables such as
investment
It can be noted that after the peak at the end of
2011 the index has been following a downward
path the current level of uncertainty however is
still significantly higher than it was on average in
the pre-crisis period
An appropriate framework to analyse the effect
of uncertainty on new orders
To distil the effect of uncertainty on industrial new
orders the EPUI is added as an explanatory
variable in the model developed by de Bondt
Dieden Muzikarova and Vincze (BDMV) which is
used by the ECB to produce official estimates of
(4) Baker S N Bloom and S Davis 2013 Measuring
economic policy uncertainty Chicago Booth
Research Paper 13-02
0
50
100
150
200
250
07 08 09 10 11 12 13
Economic Policy Uncertainty Index EU
Graph 1Policy Uncertainty EUinterbank lending slows down
Lehmann Brothers bankrupt
EL gov deficit revised upwards
(from 5 to 127)
EL seeks ext fin support
IE requests
programme
voluntary PSI
for Greece
market rumours about possible rejection of ESM
resignation of EL PM new IT gov ES elections
ES applies for programme
EP Council
Commission
agree on SSM
ECB introduces
6-month LTROsECB starts sequence of 7 interest
rate cuts in 8 months
agreement on EFSF
establishment
2nd EL adjustment programme
approved
ECB announces
OMTs
(Continued on the next page)
EA and EU outlook
29
Box (continued)
new orders (5) The augmented model reads as
follows
not = β0 + β1Δ3obt + β2ΔΔ3obt + β3μtPMI + β4μtΔPMI + β5tot + β6tot-1 + β7(not-1tot-1) + β8not-1 + β9not-2 + β10epuit + εt
where no ob to and epui stand for new orders
(m-o-m growth) manufacturing managers
assessment of order books (from EU BCS survey)
industrial turnover (m-o-m growth) and the
Economic Policy Uncertainty Index respectively t
indexes time while Δ is the first difference operator
and Δ3 indicates 3-month changes The term μtPMI (μtΔPMI) is the residual from regressing the (first
difference of the) manufacturing PMI new orders
index on the (first difference of the) 3-month
change in manufacturing managers assessment of
order books (6) finally εt is a residual term
The analysis is conducted for the euro area as well
as its three largest Member States (Germany
France Italy) which are likely to be affected by the
financialeuro crisis to different degrees
(5) Several Member States discontinued the production
of official data on industrial new orders in 2012 The
ECB stepped in with a model producing estimates of
new orders for these countries These are then
combined with hard-data series on new orders from
Member States still collecting such data through their
statistical institutes See de Bondt et al 2013
Introducing the ECB indicator on euro area
industrial new orders ECB Occasional Paper Series
No 149 June 2013 The resulting aggregate euro-
area new orders indicator can be downloaded from
the ECB Statistical Data Warehouse (6) Using the regression residuals is necessary since the
PMI new orders index and the EU BCS question on
order books are potentially multi-collinear By
contrast no multi-collinearity was found between the
Economic Policy Uncertainty Index and the 3-month
change of the BCS question on order books (as well
as its first difference)
Uncertainty matters for new orders
We find that the EPUI has a significantly negative
contemporaneous impact on new orders growth in
case of all entities examined Adding the
uncertainty indicator to the baseline BDMV
model (7) drives up the adjusted R2 by 4-5 points
The results are robust to the inclusion of a dummy
for the period 2008m1-2009m12 in order to control
for the effects of the global recession Thus the
diagnosed uncertainty effect is not just a result of
extreme increases in uncertainty registered in the
years 200809 which coincided with sharp drops in
new orders growth
The magnitude of the uncertainty coefficient (over
the full sample 1997-2013) is quite similar for the
euro area aggregate and Germany while the Italian
coefficient is around two and the French 2frac12 times
larger (see Table 1 ndash first row) One would indeed
expect core countries like Germany which are
supposedly less exposed to the euro crisis to
register a considerably lower uncertainty effect
than a more vulnerable country like Italy A
seemingly surprising finding is that the effect of
EU uncertainty on French new orders growth is
slightly higher than in Italy This result must be put
into the context of the volatility level of new orders
growth which substantially differs among the
examined countries The standard deviation of new
orders growth in France for example is
particularly high owing to the significant impact of
new orders in the aircraft industry Re-running the
regressions with the dependent variable in
standardised form changes the picture Germany
registers the lowest uncertainty effect and is
followed by France the euro area and Italy
Uncertainty exerts substantial and immediate
effects on new orders
Using the baseline results (Table 1 ndash first row) it is
possible to get a flavour of the sizeable negative
impact that uncertainty can have on new orders
growth Applying the sharpest month-on-month
rise registered since the outbreak of the financial
crisis (bankruptcy of Lehman Brothers) to the
estimated coefficients suggests that new orders
growth would contract by around 1 pp in the euro
area and Germany and 2 to 2frac12 pps in Italy and
France (see Table 1 ndash second row)
(7) Depending on data availability the sample period
starts between 1997m72000m3 and ends in 2013m9
In the case of France the sample period ends in
2012m12 when France discontinued the collection of
data on new orders
0
50
100
150
200
25017
18
18
19
19
20
20
21
21
22
22
00 01 02 03 04 05 06 07 08 09 10 11 12 13 14
Graph 2 Investment and policy uncertainty EU
Investment (lhs)
Economic Policy Uncertainty Index EU (rhs inverted)
of GDP index
Source Eurostat and Baker Bloom and Davis at wwwPolicyUncertaintycom
(Continued on the next page)
European Economic Forecast Winter 2014
30
Box (continued)
To check for the speed of the uncertainty effects on
new orders growth lags of EPUI are included into
the baseline model In all countries examined the
effects of uncertainty are exclusively
contemporaneous When re-conducting the analysis
for the pre-crisis period prior to 2008 and
afterwards the results do not significantly change
Taken together this suggests that (i) uncertainty has
a very fast effect on new orders and (ii) there is no
evidence that the speed of the effect has changed
during the crisis
Vanishing uncertainty could drive up orders
Considering the magnitude of the uncertainty
effects described above and the (still high) current
level of the EPUI new orders growth could
substantially increase once uncertainty eases from
its current to the average pre-crisis level Applying
the coefficients of Table 1 new orders growth in
the EA and Germany could gain around frac12 pp
m-o-m (ie some 6 pps over the year) while Italy
and France would potentially see order growth
increasing by 1 ndash 1frac12 pps m-o-m (ie 12ndash18 pps
over the year) These findings underline the
potential benefits of further policy action to reduce
uncertainty
Table 1
The effect of the Stanford Policy Uncertainty Index (EU) on new orders
(m-o-m growth rates)
Euro area Germany France Italy
Effect of Stanford Policy Uncertainty Index (EU) -0020 -0019 -0051 -0038
If the sharpest m-o-m rise since 2006 (+5097)
repeated itself new orders would decline byhellip -102 pps -097 pp -260 pps -194 pps
If uncertainty eased from the January 2014 level
(11843) to the average pre-crisis level (9024)
new orders would increase byhellip
+056 pp +054 pp +144 pps +107 pps
R2 with uncertainty (R2 without uncertainty) 055 (051) 043 (038) 041 (037) 050 (044)
significant at 1 level significant at 5 level significant at 10 level
EA and EU outlook
31
Box I2 Post-crisis total factor productivity trends in the EU
Introduction
This box looks at the impact the crisis is likely to
have on the longer-term total factor productivity
trends in the EU Increasing total factor
productivity ie the increase of GDP that is not
explained by the expansion of either labour or
capital inputs is the key driver of long-run changes
in living standards (1) Consequently the likely
impact of the crisis on its current and future
development is the subject of close scrutiny by the
economics profession Unfortunately however
theory does not give a clear answer as to what the
expected impact of the crisis on long-run TFP
might be (2) Besides a number of mechanisms that
tend to dampen TFP in the aftermath of a crisis
(including pro-cyclical RampD spending and rising
risk aversion resulting in more expensive bank
lending drying capital markets and higher risk
premiums for venture capital financing) there are
also arguments that downturns can have a positive
TFP impact as they can induce a process of
essential restructuring and cleansing in the
economy
Consequently ex ante the expected effect of the
crisis on TFP is ambiguous with a range of specific
factors making any definitive assessment of the
fallout from the current crisis particularly
uncertain These factors include the need to allow
(1) See for instance the overview in Hulten C R Total
factor productivity A short biography New
developments in productivity analysis University of
Chicago Press 2001 1-54 (2) Eg Abiad A R Balakrishnan P Koeva-Brooks D
Leigh and I Tytell (2009) Whatrsquos the Damage
Medium-term Output Dynamics After Banking
Crises IMF Working Paper No 09245
on the one hand for the expected one-off
downward shifts in the level of TFP associated with
industrial restructuring with some crisis-related
industries (eg financial services and construction)
likely to experience permanent reductions in the
level of their activities as a result of the crisis and
on the other hand potential upwards shifts due to
freeing scarce resources having been locked into
relatively unproductive activities the difficulty in
estimating realistic capital obsolescence rates the
uncertainties regarding the financial crisis impact
on RampD spending and on the financing of RampD
and finally the possibility of a crisis-induced shift
away from the relatively-high-TFP growth
manufacturing sector towards services In summary
therefore the impact of the crisis on TFP is largely
an empirical question with the extent to which
individual EU countries are affected by the
different factors listed earlier dictating their relative
TFP performance in the post-crisis period
Overview for the EU as a whole
Graph 1 shows the latest winter 2014 forecasts for
trend TFP growth in the EU28 and the euro area as
well as the evolution of the labour capital and TFP
components of potential growth since 2000 in the
euro area (the patterns are similar for EU28) Graph
1 illustrates that the TFP results support the a priori
assumption that the final impact of the crisis is
dependent on a range of offsetting positive and
negative factors with this balancing act appearing
to produce a slightly negative overall impact from
the crisis so far (ie over the period 2008-13)
However it is still too early to establish whether
this small decline in the EUs underlying TFP
growth rate is genuinely linked to the crisis itself
(due to some combination of factors discussed
-05
00
05
10
15
20
25
30
00 01 02 03 04 05 06 07 08 09 10 11 12 13 14 15
Contributions to Potential Output
Labour PotOutput growth Capital TFP
00
02
04
06
08
10
12
14
16
00 01 02 03 04 05 06 07 08 09 10 11 12 13 14 15
TFP Growth
EA17 smoothed EU28 smoothed
Graph 1TFP and non-TFP contributions to EU Potential Growth 2000-15
(Continued on the next page)
European Economic Forecast Winter 2014
32
Box (continued)
above) or whether it simply reflects a continuation
of the well-established downward pre-crisis trend
(part of which reflects developments in both the
knowledge drivers of TFP and in the skills
composition of the EUs labour force)
Whilst a definitive understanding of post-crisis TFP
trends is still elusive what is not in doubt however
is that the halving in potential growth rates
following the crisis has much more to do with the
sharp deterioration in the contributions from capital
and labour than from any negative drag from TFP
In addition the short run forecasts for 2014 and
2015 suggest trend TFP growth rates will remain
relatively stable and close to their pre-crisis rates
whereas the sluggish recovery in both investment
and labour market trends from the impact of the
crisis will ensure that their contributions to overall
potential growth will remain substantially lower
than in the pre-crisis period The small slowdown
in trend TFP growth rates across the EU has
necessarily had an impact on the level of TFP
However the level of trend TFP has been
substantially less affected than the level of actual
TFP since by definition it has been corrected for
the effects of the cycle Indeed as shown in
Graph 2 the level of actual TFP in the EU28 fell by
a total of 11 during the crisis (ie over the period
2008-13) whereas the level of trend TFP is
estimated to have increased by 22 over the same
time period
This gap between the actual TFP level and its trend
level the so called TFP gap (see Graph 2) captures
that part of the TFP slowdown which is of a purely
cyclical nature According to the theory behind the
TFP trend estimation methodology applied in DG
ECFIN the cyclical part of TFP should be closely
linked to capacity utilisation (CU) fluctuations in
Graph 2TFP levels and TFP gap
-12
-8
-4
0
4
8
12
16
20
24
28
32
36
40
94
96
98
100
102
104
106
108
110
112
00 01 02 03 04 05 06 07 08 09 10 11 12 13
EA17
TFP gap (rhs) TFP trend (lhs)
TFP (lhs) CU (rhs)
-12
-8
-4
0
4
8
12
16
20
24
28
32
36
40
94
96
98
100
102
104
106
108
110
112
00 01 02 03 04 05 06 07 08 09 10 11 12 13
EU28
TFP gap (rhs) TFP trend (lhs)
TFP (lhs) CU (rhs)
2000
2001
20022003
20042005
20062007
2008
2009
2010
2011
20122013
Rsup2 = 08527
-12
-10
-8
-6
-4
-2
0
2
4
6
-3 -2 -1 0 1 2 3
EA17
TFP gap
Cap
acit
y u
tili
sati
on
2000
2001
2002
2003
20042005
20062007
2008
2009
2010
2011
20122013
Rsup2 = 08652
-12
-10
-8
-6
-4
-2
0
2
4
6
-3 -2 -1 0 1 2 3
EU28
TFP gap
Cap
acit
y u
tili
sati
on
Graph 3Capacity utilisation (CU) versus TFP
(Continued on the next page)
EA and EU outlook
33
Box (continued)
the same period (3) Hence one test of the
effectiveness of the methodology is to check how
much of the observed widening of the gap is
explained by the reduction in capacity utilisation
during the crisis It can be calculated that capacity
utilisation explains about 81 of the observed
increase in the TFP gap in the EU28 (and above
95 in the EA17) (4) The very strong link between
the capacity utilisation indicator used in the
estimation and the TFP gap is illustrated in
Graph 3 Clearly the cyclical movements in TFP
across time are very well reflected in changes in the
utilisation of productive capacity by companies
The trend TFP growth rates for the individual EU
Member States for the historical 2000-07 and
2008-13 periods as well as the forecasts for
2014-15 are given in Table 1
Some factors correlating with TFP performances
of individual EU countries since the crisis
It is yet too early (and much beyond the scope of
this box) to investigate the impact on the future
TFP performance of the identified in the
introduction various mechanisms that are at work
during the crisis It is nonetheless interesting to
highlight two clear data regularities that seem to
have emerged during the crisis in the EU15
countries (5)
1 Graph 4 plots TFP trend growth rates
differentials (average TFP trend growth rate
in 2008-13 minus average TFP trend growth
rate in 2003-07) against tradable
(3) For the details of the methodology see DAuria F
C Denis K Havik K Mc Morrow C Planas R
Raciborski W Roumlger and A Rossi (2010) The
production function methodology for calculating
potential growth rates and output gaps ECFIN
Economic Papers No 420 (4) According to the methodology used for extracting
trend TFP for each country it must hold that
tfp-tfp_trend=tfp_gap=(1beta)timescapacity_utiliza-
tion+error where the estimated coefficient beta
measures the country-specific strength of the link
between the capacity utilisation and TFP gap From
the above identity it follows that for the method to
explain the data well it is required that the ratio of
(1beta)timescapacity_utilisation and the growth rate of
the TFP gap to be close to 100 which would be
consistent with a small estimation error The EU-
wide ratios are found by using a weighted average of
national betas (5) Unfortunately due to their extreme heterogeneity a
scatter plot analysis similar to that carried out for the
EU15 Member States was not possible for the new
Member States
Table 1
2000-07 2008-13 2014-15
Austria 12 05 04
Belgium 06 02 02
Bulgaria 22 07 08
Cyprus 06 -03 -04
Czech Republic 28 11 08
Germany 10 06 07
Denmark 07 13 06
Estonia 23 07 11
Greece 24 -08 -13
Spain 02 08 07
Finland 18 00 02
France 08 04 04
Croatia 11 -06 02
Hungary 19 02 03
Ireland 18 04 08
Italy 01 -01 0
Lithuania 37 15 16
Luxembourg 06 -13 -09
Latv ia 36 12 15
Malta 01 -01 02
Netherlands 11 01 00
Poland 25 12 11
Portugal 04 09 09
Romania 43 05 05
Sweden 18 06 08
Slovenia 17 04 03
Slovakia 33 24 21
UK 15 -01 01
EU-28 12 04 04
Trend TFP growth rates for Member States and EU
sector employment share differentials
between both periods (calculated
analogically) for 14 EU Member
States (6)
Two facts are worth emphasizing First
compared with the period before the crisis
the share of employed in the tradable sector
in total employed has dropped in all
considered countries which indicates closing
up of the EU economies during the crisis
Second countries in which this share has
fallen relatively less are also characterized by
relatively more benign dynamics of trend
TFP (the trend line on the graph has a slope
of 075 which is significant on the 5
confidence level the Rsup2 coefficient is 033)
(6) Tradable goods are goods produced in Agriculture
Forestry and Fishing (ISIC A-B) Industry (ISIC C-E)
and Trade Transport and Communication (ISIC G-I)
Greece was found to be a clear outlier and was
excluded from this and the following calculations
(Continued on the next page)
European Economic Forecast Winter 2014
34
Box (continued)
This is in line with the economic intuition
that sectors open to competition from abroad
will tend to be more efficient More
generally these findings support the
hypothesis that sectoral shifts currently taking
place in the EU and in particular shrinking of
the tradable sector in virtually all EU
Member States bear on the performance of
aggregate productivity
BE DE
DK
ES
FRIE
IT
LU
NLAT
PT
FI
SE
UK
-25
-20
-15
-10
-05
00
05
10
-5 -4 -3 -2 -1 0
TF
P
Employment share in tradable
Graph 4 TFP vs employment share in tradable
(growth differentials)
2 Graph 5 illustrates a close relationship
between TFP trend growth rate differentials
and total hours worked (7) A highly
significant negative slope and a very high
coefficient R2=056 suggest that TFP slowed
down less during the crisis in those Member
States in which hours worked fell more In so
far as hours worked losses are in a significant
part due to firms default this finding is in
line with the prediction that these are the less
efficient firms that are more likely to default
during the crisis and that the cleansing
process contributes to a more benign
dynamics of TFP trend during a crisis A
complementary explanation based on the
discipline device role of unemployment
hypothesis (eg Riggi 2012) (8) would posit
that employees tend to increase their effort at
work when the risk of becoming unemployed
increases
(7) Calculated as the average of log total hours worked in
2008-13 minus the average log total hours worked in
2003-07 (8) Riggi M (2012) Capital Destruction Jobless
Recoveries and the Discipline Device Role of
Unemployment Bank of Italy Temi di Discussione
(Working Paper) No 871
BEDE
DK
ES
FR
IE
IT
LU
NLAT
PT
FI
SE
UK
-25
-20
-15
-10
-05
00
05
10
-10 -5 0 5 10 15
TF
P
Total hours worked
Graph 5 TFP vs total hours worked (growth
differentials)
Concluding remarks
This box shows that at the EU level the effect of
the crisis on TFP has so far been relatively muted
with negative and positive effects broadly
balancing each other out This generally stable
performance at the EU level is not necessarily
replicated at the individual Member State level
with some countries seeing positive shifts in their
TFP trends over the crisis period whereas others
have experienced significant setbacks Among the
28 Member States there are only three countries
(Denmark Spain and Portugal) which have
managed to have a TFP growth rate over the period
2008-13 which was higher than in the pre-crisis
period but only Spain and Portugal are forecast to
sustain this good performance in 2014 and 2015
As the analysis on sectoral employment shares and
on hours worked in the EU15 Member States has
highlighted those countries which have managed
to shift resources out of relatively low productivity
sectors towards the tradables sector whilst at the
same time improving overall labour efficiency
appear to be emerging from the crisis in a much
healthier economic condition The cleansing
benefits of the crisis are particularly in evidence in
Spain and Portugal with their ongoing positive
TFP performances reflecting the fact that they have
wisely used the crisis to carry out essential
economic restructuring
EA and EU outlook
35
Box I3 The cyclical component of current-account balances
This box shows data on the cyclically-adjusted
current-account balances in the EU Member States
These data are particularly useful to the discussion
of the nature of the adjustment in the vulnerable
euro-area countries (Ireland Greece Spain
Cyprus Portugal and Slovenia) For these
countries a key policy question is whether the
current-account adjustment over the latest number
of years has been cyclical (ie transitory) or non-
cyclical (ie more permanent) If most of the
reduction in the current-account deficits were
cyclical then one would expect the large deficits to
reappear as soon as their economies recover and
output gaps close The available estimates suggest
that most of the adjustment in the euro-area
periphery has been non-cyclical Therefore one
should not expect the current-account deficits in
these countries to deteriorate over the foreseeable
future to levels any close to those observed before
the crisis (1)
The cycle output and demand
The business cycle consists of temporary
movements in output and demand The difference
between output and domestic demand constitutes
the trade balance which in turn is the most
important part of the current account In that sense
the cyclical component of the trade balance directly
follows from the cyclical components of changes in
output and domestic demand However the trade
balance is not only affected by the cyclical changes
in domestic aggregates but also by the cyclical
movements in foreign demand and output (2) In this
manner imports reflect the cyclical component of
domestic demand and foreign output In contrast
(1) For a similar assessment see Guillemette Y and D
Turner (2013) Policy Options to Durably Resolve
Euro Area Imbalances OECD Economics Department Working Paper 1035 Mersch Y (2013)
The Overhaul of the Architecture of the Euro Area
and the Return of Investor Confidence speech at the CFA Institute London and ECB Monthly Bulletin
(Jan 2014 47-50) For a somehow different
perspective see IMF World Economic Outlook (Oct 2013 45-8 and Ollivaud P and C Schwellnus
(2013) The Post-crisis Narrowing of International
ImbalancesndashCyclical or Durable OECD Economics Department Working Paper 1062
(2) The current account also adjusts in response to other
factors (such as interest rates or the terms of trade) that also reflect the cycle But usually the cyclical
component of the current account is estimated given
the response of real aggregates (supply and demand)
exports reflect (inter alia) cyclical effects in
domestic output and foreign demand
Table 1
( of GDP)
2007 2009 2011 2013 Δ07-13 2007 2009 2011 2013 Δ07-13
BE 39 07 05 01 -39 39 24 13 04 -34
BG -252 -90 01 20 273 -208 -83 00 28 237
CZ -51 -33 -35 -24 28 -20 -18 -30 -37 -18
DK 14 34 59 70 56 21 28 41 49 28
DE 75 61 63 70 -05 67 57 76 78 11
EE -157 40 03 -21 136 -65 00 31 21 86
IE -55 -23 12 70 125 -44 -32 14 85 129
EL -176 -144 -117 -23 153 -168 -141 -158 -72 96
ES -100 -48 -40 11 111 -100 -52 -56 -02 98
FR -14 -18 -25 -19 -06 -12 -16 -25 -23 -11
HR -69 -45 -11 08 77 -53 -40 -17 08 61
IT -13 -20 -31 09 22 -10 -21 -32 -01 09
CY -116 -107 -35 -17 99 -112 -90 -16 -14 99
LV -224 86 -23 -16 208 -141 34 -74 -01 140
LT -150 21 -39 01 151 -82 -24 -67 17 99
LU 101 73 66 64 -36 129 56 58 62 -67
HU -74 -01 06 29 103 -71 -15 -13 14 85
MT -40 -89 -10 17 57 -48 -66 05 42 90
NL 84 32 74 92 08 75 44 74 78 03
AT 40 27 15 29 -11 33 32 21 37 05
PL -61 -31 -45 -16 45 -61 -05 -35 -15 46
PT -102 -108 -72 04 106 -107 -107 -75 -08 99
RO -136 -42 -45 -10 126 -108 -25 -51 -04 103
SI -46 -04 02 49 95 -13 -11 -07 33 46
SK -56 -25 -26 20 77 01 -09 -38 01 00
FI 42 20 -15 -02 -44 53 08 -16 -16 -69
SE 86 69 62 62 -23 84 57 68 63 -21
UK -22 -14 -15 -38 -16 -20 -23 -27 -41 -21
Source European Commission estimates
Cycl-adj Current-account balanceCurrent-account balance
Current-account and cyclically-adjusted current-account balances
Table 1 displays the non-adjusted and the
cyclically-adjusted current-account balances (3)
which would prevail if both the country in question
and its trading partners closed their output gaps
Accounting for the cyclical component leads to a
higher surplus or smaller deficit in 2013 in the
economies whose output gap exceeds that of their
trading partners taking into account their external
openness For 2013 this is the case of Bulgaria
Germany Estonia Ireland Latvia Lithuania
Luxembourg Malta and a few others For the
countries for which their output gap is inferior to
the output gap of their trading partners the closing
of domestic and foreign output gaps would lead to
smaller surpluses or larger deficits this is notably
the case of the Czech Republic Denmark Greece
Spain Cyprus Hungary Netherlands Portugal
Slovakia and a few others
(3) These are estimates based on the methodology
described in Salto M and A Turrini (2010)
Comparing Alternative Methodologies for Real Exchange Rate Assessment European Economy-
Economic Papers 427 The assessment is based on the Commission estimates for output gaps (see Table
14 of the statistical annex) output gaps for trading
partners not available in AMECO are from the OECD Estimates on the basis of IMF data and
methodology (Phillips S et al (2013) The External
Balance Assessment (EBA) Methodology IMF Working Paper 13272) point to similar figures
(Continued on the next page)
European Economic Forecast Winter 2014
36
Box (continued)
Adjustment in vulnerable countries
In 2007-13 there has been a substantial adjustment
in the euro-area vulnerable Member States (4) On
average the current-account balances of Ireland
Greece Spain Cyprus Portugal and Slovenia
improved by more than 9 pps and Spain Ireland
Portugal and Slovenia now run surpluses This
adjustment is forecast to continue through 2015
(see Table 50 of the statistical annex) though with
differences among these countries
To discuss whether the adjustment of current-
account deficits in the euro-area periphery has been
cyclical or not raises two key questions (1) Has the
adjustment been rather due to a decline in domestic
demand (and by implication imports) ndash or to
changes in foreign demand (and thus exports and
output) (2) To what extent have these changes in
domestic demand output and foreign demand been
cyclical The data show that most of the
rebalancing in the vulnerable economies has been
due to a contraction in their domestic demand (and
thus imports) But much of this contraction has
been non-cyclical which may seem counter-
intuitive at first sight
The rebalancing of trade (and thus current-account)
balances in the vulnerable countries is reflected in
domestic demand declining faster than output
(Graph 1 illustrates this for Spain) Contracting
private investment particularly construction was
the main driver of this decline private consumption
has generally declined more than GDP and
contributed to raising saving rates (5) The counter-
cyclical increases in fiscal deficits initially slowed
the narrowing of current-account deficits in a
number of vulnerable countries but fiscal
consolidation has contributed to improving their
current-account balances since 2009-10
In several vulnerable euro-area countries
rebalancing and output also benefited from robust
(4) Here the reference year is 2007 is used since it was
the last year of the pre-crisis boom in global trade In
contrast 2008 figures are partly affected by the trade
slump in response to the crisis (5) This behaviour runs counter the textbook response to
a negative cyclical shock consumption smoothing
would entail a widening rather than a narrowing of the current-account deficit Instead the behaviour is
consistent with a structural break in potential GDP
(see for a discussion Aguiar M and G Gopinath (2007) Emerging Market Business Cycles The
Cycle Is the Trend Journal of Political Economy
115(1) 69-102)
exports despite sluggish world demand thanks to
gains in price and cost competitiveness (changes in
relative prices) and non-cost competitiveness
Relative price developments within and among
economies facilitate the necessary reallocation of
resources from non-tradable to tradable sectors In
all the vulnerable countries GDP deflators have
risen at a slower pace than export prices which in
turn rise slower than import prices reflecting those
relative changes in prices (6) This pattern is likely
to be maintained for some years with the terms of
trade therefore expected to support
competitiveness
850
900
950
1000
1050
04 05 06 07 08 09 10 11 12 13 14
Graph 1 Spain Output and Demand
Trade balance
Domestic demand
Output (GDP)
Source European Commission
Constant 2005 EUR mn
Graph 2 shows the sizeable contribution from real
export growth to current-account adjustment in
most vulnerable countries (7) Portugal Spain and
Ireland outperformed average real export growth in
the euro area in 2007-13 though their real exports
grew slightly less than Germanys In Greece and
Cyprus real exports did decline in 2007-13 (though
less than GDP thus leading to the positive
contribution to the changes in current account
depicted in the graph)
(6) See Labour Costs Pass-Through Profits and
Rebalancing in Vulnerable Member States Quarterly Report on the Euro Area (2013-3)19-25 Ongoing
Adjustment in the Euro Area Periphery box I1 in
the autumn 2012 forecasts and Labour Costs Margins and Prices in Rebalancing Economies box
I3 in the spring 2013 forecasts (7) The Graph is based on differentials with respect to
GDP growth Ie exports growing faster (or
declining more slowly) than GDP contribute
positively to the change in the current-account balance (in of GDP) Likewise imports
contracting faster than GDP result into a positive
contribution
(Continued on the next page)
EA and EU outlook
37
Box (continued)
In contrast to exports the vulnerable countries
imports have differed markedly from the patterns
observed in the core euro-area countries as well as
from their pre-crisis trends (8) In the vulnerable
countries real imports receded strongly in 2007-13
which resulted in the positive contribution visible
in Graph 2 (9) A combined reading thus implies
that the slump in domestic demand and imports
dominates the adjustment in the vulnerable
economies (10) though some of them also benefitted
from improved export performance
-15
-10
-5
0
5
10
15
20
25
LV EL EE IE ES PT CY SI SK MT IT NL DE FR AT LU BE FI
Ch
ange
CA
GD
P 2
00
7 to C
AG
DP
20
13
Graph 2 Euro-area Member States contributions to
current-account adjustment 2007-13
Real exports contribution
Real imports contribution
Terms of trade impact
Income and transfers balance contribution
CAGDP change 2007-13 pp of GDP
Source European Commission
pps
Non-cyclical is not the same as good news
While much of the current-account adjustment has
been induced by domestic demand contractions the
question is how much of this stems from cyclical
factors knowing that demand changes are typically
associated with cyclical fluctuations This may
have led some observers to conclude that the
current adjustment has been largely cyclical
During most business cycles domestic demand
fluctuates more than output thus generating
(8) See also Kang and Shambaugh (2013) The
Evolution of Current Account Deficits in the Euro
Area Periphery and the Baltics Many Paths to the
Same Endpoint IMF Working Papers 13169 (9) In Spain for instance real exports growth slowed
from cumulated +29 over 2001-07 to +14 during
2007-13 (compare with +36 and +9 in the euro area) In contrast the Spanish real import growth of
+55 during 2001-07 was followed by a decline
of -21 during 2007-13 (compare with +36 and +2 in the euro area)
(10) Note that a certain part of imported intermediate
goods and services serves just to sustain exports
(This import content of exports varies between 22
for Spain and 43 in Ireland) In that sense the
decline in imports hides an even stronger impact coming from the contraction in domestic final
demand
cyclical movements in current-account balances
However the boom years before 2007 saw not only
inflated domestic demand in the euro-area
periphery potential output also swelled (in
particular in the construction sector) due to overly
optimistic expectations resting on abundant credit
and soaring asset prices Arguably the correction
of these growth expectations driven by the
reassessment of risk premia is permanent The large
domestic demand declines during the crisis have
been mirrored in a significant slowdown of
potential output Consequently the output gap
measured against the estimated potential output is
much smaller than the gap against the pre-crisis
growth trend Moreover the output gap
developments in the vulnerable countries do not
differ much from their trading partners ndash but their
current-account balances do For example in
Ireland and Portugal output gaps dropped between
5 and 5frac12 pps in 2007-13 which is as much or
even less than in economies with milder gyrations
of macroeconomic aggregates such as France the
Netherlands or Denmark Hence current-account
adjustment in most vulnerable countries appears
largely non-cyclical because it is associated mainly
with the deceleration in their potential output
Graph 3 illustrates this for Spain where the
deviation of actual GDP from its pre-crisis trend
has been much more substantial than the decline
from the 2007 peak Moreover only part of the
growth gap between Spain and its partners is due to
output gap differentials Instead most of this
growth divergence is due to the relative changes in
potential GDP The rebalancing thus owes a lot to
the contraction in domestic demand which in turn
reflects a structural break in potential output (11)
Outlook
Once domestic output reaches or exceeds potential
again the ensuing demand will lead to a cyclical
worsening of current-account balances This could
be particularly strong if output in these countries
recovers faster than in their main partners For
(11) Greece has in this respect been an exception Much
more of its output decline is currently attributed to cyclical factors Its output gap declined from +3frac14
of GDP in 2007 to -12frac34 2013 a number that
exceeds the euro-area output gap by almost 10 pps As a result much more of its adjustment is estimated
to be due to cyclical factors This shows that
conclusions on the cyclical and non-cyclical nature of
rebalancing crucially hinge on the correctness of
output gap estimates
(Continued on the next page)
European Economic Forecast Winter 2014
38
Box (continued)
instance the output gap in Ireland already closed
vis-agrave-vis its partners thus inducing a current-
account balance that is slightly below its surplus in
cyclically-adjusted terms However such cyclical
worsening is unlikely to bring current-account
balances to the pre-crisis levels any time soon
90
95
100
105
110
115
120
125
99 00 01 02 03 04 05 06 07 08 09 10 11 12 13TP (42) real GDP TP (42) potential GDP
ES real GDP ES potential GDP
ES pre-crisis trend GDPSource European Commission estimates
Graph 3Potential output Spain (ES) and trade partners (TP)
index 2004=100
The boom-and-crisis has left the euro-area
periphery with a large stock of outstanding external
debt Among the vulnerable Member States the
current-account adjustment is only now stabilising
their negative international investment position and
external debt with respect to GDP But the debt
stocks continue to constrain the borrowing capacity
and demand prospects of the private and public
sectors in these economies A return of large
current-account deficits is thus unlikely as it would
further rack up external debt Instead the
vulnerable economies may require current-account
surpluses over the medium term to bring down
external indebtedness to sounder levels The
required extent of such surpluses in turn depends
on the countries growth prospects
The question is thus not whether deficits reappear
but whether the surpluses will be sustained by
permanently compressed imports and demand or
by expanding exports and output This in turn will
depend on the reforms in these countries as well as
the behaviour of domestic demand in trading
partners in the euro area and beyond In view of
deleveraging pressures on domestic demand
exports and export-oriented investment are the
demand components with scope to underpin a
resumption of potential growth and employment in
the medium run However an export-led recovery
requires further reallocation of labour and capital in
the structural composition of the economy
Structural reforms that facilitate such re-orientation
and changes in relative prices will boost potential
output and export capacity ndash and thus relieve the
pressure on imports to offset negative income
balances (12)
(12) See The Euro Areas Growth Prospects over the
Coming Decade and The Growth Impact of Structural Reforms Quarterly Report on the Euro
Area 2013 (4) 7-16 and 17-27
EA and EU outlook
39
Box I4 Analysing current disinflationary trends in the euro area
Annual HICP inflation in the euro area has been
trending downwards since end-2011 averaging
25 in 2012 and 14 in 2013 A gradual decline
in euro-area inflation had been widely expected
given the fall in commodity prices in recent years
and the amount of slack in the euro-area economy
Particularly the fourth-quarter figures of 2013
however surprised on the downside with annual
HICP inflation falling to 08 Similar tendencies
have been observed outside the euro area as
reflected by a broad decline in global headline
inflation since mid-2011
This box sheds light on the driving forces behind
the current disinflation in the euro area and inquires
whether it appears to be a temporary or a more
persistent phenomenon The analysis briefly
touches upon the fading away of temporary factors
before focusing on cyclical and structural elements
Temporary factors are fading awayhellip
Part of the recent drop in euro area inflation has
been due to the fading away of temporary factors
namely the increases in indirect taxes and
administered prices (linked to fiscal consolidation
needs in many Member States) and the pass-
through from past commodity-price hikes (oil and
unprocessed food in particular) In the fourth
quarter of 2013 core inflation defined as all-item
HICP inflation excluding energy and unprocessed
food decreased markedly to 1 (from 13 in the
three previous quarters) Notably the impact of tax
hikes was smaller than during the rest of the year
(01 pp compared to an average of 04 pp in
2013)1 and so was the contribution of administered
prices (which in 2013 declined to its long-term
average of 03 pp after being substantially above
in 2011-12) HICP inflation adjusted for tax
changes stood at 1 throughout 2013 having
dropped through 2012 (1) (see Graph 1 and
Section I6 of the main text)
hellip while cyclical and structural factors related to
the ongoing price adjustment in the euro area
are at work
The abatement of temporary factors however is
not the only driving force behind the current
disinflation in the euro area Cyclical and structural
factors related to the fragile recovery and the
(1) Constant-tax inflation rates assume a full and
immediate pass-through of tax changes to prices and
could hence be seen as an upper bound to the actual
impact of tax changes
ongoing relative price adjustment in the euro area
also are at play
Unit labour costs can explain much of the cyclical
pattern of underlying inflation as measured by the
GDP deflator (see Graph 2) Annual growth in unit
labour costs decreased further to 10 in the third
quarter of 2013 from 21 in the third quarter of
2012 Taking the typical pattern of previous
recoveries as a guide the slow pace of cost-push
inflation stemming from unit labour costs can be
expected to continue over the next few quarters In
the initial stages of a recovery productivity
typically tends to increase while wages pick up
only later As productivity growth is currently still
very low there is much room for productivity
increases Only after some quarters employment is
likely to become a more significant driver of
growth thus curbing productivity growth Together
with a rise in labour compensation (from 16 in
the third quarter 2013) this would push up unit
labour costs This cyclical perspective points to
subdued price pressures in the pipeline but also to
their temporary nature (2)
Apart from its cyclical behaviour the disinflation
in the more vulnerable Member States might be
influenced by structural shifts that could amplify its
magnitude Indeed the relative decline in inflation
rates in these countries (see Graph 3) coincides
with substantial structural reform efforts that
(2) As prices reflect not only labour costs but also profit
margins price pressures will also be influenced by
the outlook for the latter Measured as the gross
operating surplus profit margins fell in the euro area
in 2012 (-08) but increased in 2013 (+05 in the
first two quarters) With the economic recovery
continuing to take shape a gradually higher
contribution of corporate margins to price changes
can be expected
(Continued on the next page)
European Economic Forecast Winter 2014
40
Box (continued)
explicitly targeted nominal rigidities in prices and
wages (3)
At the same time the current disinflation in the
euro area may be related to an increasing impact of
the output gap on inflation Empirical evidence
suggests that the Phillips curve which describes the
relation between the output gap and inflation had
flattened over the last two decades Various
measures of inflation had become less sensitive to
the slack in the economy (4) In recent years
however the output gap elasticity of inflation
appears to have increased again This could
possibly mirror non-linearity ie inflation might
only react significantly to the output gap if it is
large and persistent Alternatively the steepening
(3) It seems however too early to draw clear
conclusions about the precise impact of these
structural reforms on price and wage dynamics (4) See IMF (2013) The dog that didnt bark Has
inflation been muzzled or was it just sleeping IMF
World Economic Outlook Chapter 3 April and
Acedo-Montoya L B Doehring (2011) The
improbable renaissance of the Phillips curve The
crisis and euro area inflation dynamics European
Commission Economic Papers No 446 October
of the Phillips curve could be the result of the
elements described above such as enhanced wage
flexibility or its previous disguise by temporary
factors like hikes in indirect taxes (5) The recent
steepening of the curve has however not
completely reversed the long-term flattening trend
A simple framework based on a New Keynesian
Phillips curve with time-varying parameters of
euro-area inflation at the aggregate level offers
useful insights (6) The estimates use quarterly data
on exchange-rate-adjusted oil prices the output
gap past inflation and inflation expectations based
on inflation swaps (7)
The estimation results suggest that the output gap
plays a more important role in accounting for
inflation developments than before the crisis
During the past two years the inflation elasticity of
the output gap appears to have surged particularly
in vulnerable Member States arguably due to
structural reforms (8) The assumption that the
output gap will continue to close only slowly points
to a continuing drag of weak demand on inflation
but does not necessarily add further disinflationary
momentum
The Phillips-curve estimates also suggest a
gradually increasing role of inflation expectations
in explaining price developments Market-based
euro-area inflation expectations (see Graph 4)
derived from swap rates have been trending
downwards at all maturities since spring 2011
Taken at face value the spot rates of inflation-
linked swaps observed in January 2014 imply an
average annual inflation rate of 11 over 2014-16
Regarding the medium-term outlook inflation
expectations derived from inflation-linked swap
rates at the three-years-forward-three-years-ahead
horizon imply an average inflation rate of 17 in
2017-19 At the same time five-year inflation-
linked swap rates five years ahead the most widely
(5) Oinonen S M Paloviita and L Vilmi (2013) How
have inflation dynamics changed over time
Evidence from the euro area and the US Bank of
Finland Research Discussion Paper 62013 (6) The Phillips curve
ttttttt
BL
ttt
FL
tt oilegapE )ln(11 is
estimated by using state-space methods that apply the
Kalman filter and allow parameters to vary over time
Parameters are assumed to follow random walk
processes with uncorrelated and normally distributed
error terms (7) The output gap is based on the European
Commissions production function approach (8) While tax increases in vulnerable Member States may
also contribute to the explanation the timing of their
fading out is different from the timing of the rise of
the inflation elasticity of the output gap
(Continued on the next page)
EA and EU outlook
41
Box (continued)
used measure of long-term inflation expectations
have been broadly stable at slightly above 2 (all
January 2014 averages)
Market-based indicators hence suggest that in the
short- to medium-term markets expect inflation in
the euro area to remain well below 2 and to only
slowly return to that level over time At the same
time long-term inflation expectations remain well-
anchored on the back of high central bank
credibility Yet as the Japanese experience with a
long-lasting period of mostly mild deflation since
the mid-1990s shows long-term inflation
expectations do not necessarily provide full
assurance on future inflation developments Most
available measures suggest that long-term inflation
expectations in Japan (six to ten years ahead)
declined only gradually in the early 1990s and
remained positive throughout the last two decades
despite a prolonged period of negative or very low
inflation In contrast to the euro area however
long-term inflation expectations did not appear
well-anchored in Japan reflecting inter alia the
absence of a quantitative inflation target at the
time
Deflation risks low
On the basis of the above considerations the
baseline scenario is one of a protracted period of
low inflation in the quarters ahead Only a muted
increase in inflation is expected within the forecast
horizon in line with the ongoing recovery
For a scenario of outright euro-area-wide deflation
ie the emergence of a broad-based and self-
sustaining downward trend in the price level to
materialise a strong shock to the forecast
assumptions would be required driving underlying
inflation in the euro-area core to unprecedented
near-zero levels At the same time in the context of
continuing disinflationary pressures in many
Member States and the current downward trend in
commodity prices the sensitivity of the inflation
outlook to shocks appears to have increased Low
core inflation and sizeable output gaps as well as a
reduction in nominal rigidities in some Member
States may well have reduced some of the
downward stickiness that inflation in the euro area
experienced at low levels in the past
Even in the absence of outright deflation an
inflation rate persistently below the ECBs
definition of price stability over the medium term
defined as a year-on-year increase in the HICP for
the euro area of below but close to 2 would
not be without risks for the Member States at the
lower range of the inflation dispersion A
protracted period of very low inflation increases the
real value of both public and private debt and
results in higher real interest rates making the
ongoing internal adjustment in a number of
Member States more difficult and the deleveraging
process more challenging (9)
(9) See for instance King M (1994)rdquoDebt-Deflation
Theory and Evidencerdquo European Economic Review
Vol 38(3-4) pp 419-45
European Economic Forecast Winter 2014
42
Box I5 Some technical elements behind the forecast
The cut-off date for taking new information into
account in this European Economic Forecast was
17 February The forecast incorporates validated
public finance data as published in Eurostats News
Release 1522013 of 21 October 2013
External assumptions
This forecast is based on a set of external
assumptions reflecting market expectations at the
time of the forecast To shield the assumptions
from possible volatility during any given trading
day averages from a 10-day reference period
(between 31 January and 13 February) were used
for exchange and interest rates and for oil prices
Exchange and interest rates
The technical assumption as regards exchange rates
was standardised using fixed nominal exchange
rates for all currencies This technical assumption
leads to an implied average USDEUR rate of 136
in 2014 and 2015 The average JPYEUR rates are
13858 in 2014 and 13831 in 2015
Interest-rate assumptions are market-based
Short-term interest rates for the euro area are
derived from futures contracts Long-term interest
rates for the euro area as well as short- and
long-term interest rates for other Member States are
calculated using implicit forward swap rates
corrected for the current spread between the
interest rate and swap rate In cases where no
market instrument is available the fixed spread
vis-agrave-vis the euro-area interest rate is taken for both
short- and long-term rates As a result short-term
interest rates are assumed to be 03 on average in
2014 and 04 in 2015 in the euro area Long-term
euro-area interest rates are assumed to be 18 on
average in 2014 and 21 in 2015
Commodity prices
Commodity price assumptions are also as far as
possible based on market conditions According to
futures markets prices for Brent oil are projected to
be on average 1041 USDbbl in 2014 and
996 USDbbl in 2015 This would correspond to an
oil price of 765 EURbbl in 2014 and
732 EURbbl in 2015
Budgetary data
Data up to 2012 are based on data notified by
Member States to the European Commission on
1 October and validated by Eurostat on 21 October
2013
Eurostat has expressed its reservation on the quality
of the data reported by Austria due to uncertainties
on the statistical impact of the conclusions of the
Federal Audit Offices report on the Land Salzburg
published on 9 October 2013 The report revealed
deficiencies with regard to financial management
and to completeness of the public accounts of the
Land Salzburg The statistical implications of the
audit for EDP data are being investigated by
Statistics Austria in collaboration with Eurostat in
order to clarify the precise impacts on 2012 and
also on preceding years It is possible that this will
lead to an upward revision of government debt of
up to half a percent of GDP with more minor
revisions to the government deficit based on the
information available at the time of the validation
For the forecast measures in support of financial
stability have been recorded in line with the
Eurostat Decision of 15 July 2009 (1) Unless
reported otherwise by the Member State concerned
capital injections known in sufficient detail have
been included in the forecast as financial
transactions ie increasing the debt but not the
deficit State guarantees on bank liabilities and
deposits are not included as government
expenditure unless there is evidence that they have
been called on at the time the forecast was
finalised Note however that loans granted to
banks by the government or by other entities
classified in the government sector usually add to
government debt
For 2014 budgets adopted or presented to national
parliaments and all other measures known in
sufficient detail are taken into consideration In
particular all the information included in the Draft
Budgetary Plans submitted by 15 October is
reflected in this forecast For 2015 the no-policy-
change assumption used in the forecasts implies
the extrapolation of revenue and expenditure trends
and the inclusion of measures that are known in
sufficient detail
The general government balances that are relevant
for the Excessive Deficit Procedure may be slightly
different from those published in the national
accounts The difference concerns settlements
under swaps and forward rate agreements (FRA)
(1)
Eurostat News Release Ndeg 1032009
(Continued on the next page)
EA and EU outlook
43
Box (continued)
According to ESA95 (amended by regulation No
25582001) swap- and FRA-related flows are
financial transactions and therefore excluded from
the calculation of the government balance
However for the purposes of the excessive deficit
procedure such flows are recorded as net interest
expenditure European aggregates for general
government debt in the forecast years 2013-15 are
published on a non-consolidated basis (ie not
corrected for intergovernmental loans) To ensure
consistency in the time series historical data are
also published on the same basis For 2012 this
implies a debt-to-GDP ratio in the euro area which
is 21 pp (15 pp in the EU) higher than the
consolidated general government debt ratio
published by Eurostat in its news release 1522013
of 21 October 2013 General government debt
projections for individual Member States in
2013-15 include the impact of guarantees to the
EFSF (2) bilateral loans to other Member States
(2)
In line with the Eurostat decision of 27 January 2011
on the statistical recording of operations undertaken by the European Financial Stability Facility available at
httpeppeurostateceuropaeucacheITY_PUBLIC2-27012011-APEN2-27012011-AP-ENPDF
and the participation in the capital of the ESM as
planned on the cut-off date of the forecast (subject
to approval)
Calendar effects on GDP growth and output
gaps
The number of working days may differ from one
year to another The Commissions annual GDP
forecasts are not adjusted for the number of
working days but quarterly forecasts are
However the working-day effect in the EU and the
euro area is estimated to be limited over the
forecast horizon implying that adjusted and
unadjusted growth rates differ only marginally (by
up to plusmn01 pp) The calculation of potential growth
and the output gap does not adjust for working
days Since the working-day effect is considered as
temporary it should not affect the cyclically -
adjusted balances
PART II Prospects by individual economy
Member States
1 BELGIUM Growth expectations up inflation down
48
With the noteworthy exception of the construction
sector confidence indices have been improving in
recent quarters and have reached the highest level
since the summer of 2011 This soft indicator trend
has been confirmed by recent hard data and points
to a continuation of the positive performance in
upcoming quarters
More robust than anticipated private consumption
in the second half of 2013 provides 2014 with
substantial carry-over Household spending is
expected to accelerate further towards the end of
the year in parallel with labour market prospects
More solid income growth is forecast to underpin
consumer spending in 2015
-3
-2
-1
0
1
2
3
4
01 02 03 04 05 06 07 08 09 10 11 12 13 14 15
pps
Graph II11 Belgium - Real GDP growth and contributions
Inventories Net exports
Dom demand excl invent Real GDP (y-o-y)
forecast
After falling by 25 in 2013 due to a weak start
capital formation is expected to continue its recent
recovery led by company investments Industrial
production has been pointing to a modest
turnaround while the industrys capacity utilisation
is close to the long-term average Inversely
construction is still sluggish at best with
confidence at the lowest level in over 15 years and
both order books and expected employment weak
A real pick-up in activity is only expected for
2015 This reflects depressed housing investments
as well as a cyclical correction in public
investment following the 2012 local elections
Net exports are expected to have contributed
07 pp to overall growth in 2013 This year export
growth is projected to outpace import growth
helped by modest gains in competitiveness With
domestic demand strengthening over the forecast
horizon import growth is forecast to accelerate as
well As a consequence net trade would become a
negative contributor in 2015
The pace of the recovery in Belgium remains
closely linked to developments in the euro area
The main domestic downside risk would be tighter
credit conditions resulting in more subdued
investment growth
Unhurried labour market turnaround inflation
set to remain moderate over forecast horizon
Despite an apparent stabilisation towards the end
of last year unemployment is set to rise further
from an average of 84 in 2013 to 85 in 2014
as job creation is projected to feature a
considerable lag to the economic cycle after a
prolonged period of sluggish activity Somewhat
stronger employment growth is projected to push
back unemployment to 82 in 2015 a level still
high from an historic perspective
Meanwhile price pressures have been retreating
and a further decrease is expected in upcoming
quarters This reflects the generally low
inflationary environment as well as specific
Belgian elements in particular the lowering of the
VAT rate on electricity consumption by
households as of April next With low price
pressures delaying wage indexation for most
workers and real wages frozen nominal wage
growth is set to be confined In combination with a
pick-up in productivity this leads to unit labour
costs growing much slower than has been the case
in recent years
Broadly flat public finance outlook
The general government deficit is estimated to
have reached 27 of GDP in 2013 01 pp lower
than expected in the autumn forecast The
improvement stems from higher than expected
economic growth in the last quarter as well as
from positive revenue surprises from a fiscal
Rising net exports and household consumption helped the Belgian economy to end 2013 on a positive
note GDP rose by 04 in the final quarter bringing the annual rate to 02 and ending two years of
stagnation GDP growth is expected to reach 14 in 2014 before rising to 17 in 2015 Despite an
improving economy government deficit levels are expected to remain broadly unchanged
Member States Belgium
49
amnesty and from taxation of financial assets The
structural balance is expected to have improved by
around frac34 of GDP in 2013 while one-off factors
(such as the fiscal amnesty and the sale of telecom
licences) amount to around frac12 of GDP
In 2014 the deficit is expected to decline slightly
further to 26 of GDP Expenditure growth is
modest due to the low inflation environment as
well as measures taken in health care and
reductions in administrative spending Tax
revenues are boosted by the improving economic
environment and by consolidation measures in the
2014 budget such as the introduction of VAT on
services from lawyers an increase in excise duties
and a minimum corporate income tax The fiscal
amnesty is expected to yield additional one-off
revenues in 2014 although lower than in 2013 On
the other hand a reduction in the VAT rate on
electricity will weigh on indirect tax revenues In
2014 the overall deficit impact of this measure is
broadly neutral due to its inflation-reducing
impact which will postpone the automatic
indexation of public wages and social benefits
until the beginning of 2015 In that year the net
budgetary cost of the measure will be above 01
of GDP Since the autumn forecast the
government also agreed on a reduction of social
security charges of 01 of GDP in 2015 Overall
the deficit is expected to remain broadly stable in
2015 under the usual no-policy-change
assumption despite the projected strengthening of
economic growth
The structural improvement of the budget balance
is projected at around frac14 of GDP in 2014 to then
deteriorate again by frac12 of GDP in 2015 due to
the impact of the above-mentioned government
measures and the autonomously rising trend in
social expenditure
General government debt is estimated to have
reached 998 of GDP in 2013 The positive
impact of the reimbursement of a loan by KBC
(05 of GDP) and the sale of government assets
(13 of GDP) is partly offset by negative stock-
flow adjustments such as the contribution to the
EFSFESM (07 of GDP) The debt ratio is
forecast to rise again in 2014 to just above 100
of GDP mostly due to stock-flow adjustments
(EFSFESM) and to start declining in 2015
bn EUR Curr prices GDP 94-09 2010 2011 2012 2013 2014 2015
3759 1000 20 23 18 -01 02 14 17
1989 529 17 28 02 -03 06 15 19
938 250 18 06 07 14 06 05 14
765 204 22 -11 41 -20 -25 17 32
282 75 29 -109 48 -32 -17 32 55
3237 861 39 81 64 18 19 36 47
3196 850 38 75 68 13 12 32 52
3769 1003 19 48 10 -08 01 13 17
17 14 11 -02 00 13 20
00 03 08 -04 -05 -02 00
02 06 -02 04 07 04 -03
09 07 14 02 -03 03 08
83 83 72 76 84 85 82
26 14 31 34 23 06 19
16 -03 27 37 18 -05 10
-01 -23 07 18 05 -18 -06
173 152 141 152 149 146 143
17 21 20 19 13 14 16
19 23 34 26 12 09 14
-05 -21 -21 02 -03 04 00
26 -08 -16 -15 -14 -11 -16
41 26 05 -02 01 06 03
39 25 03 -03 03 07 04
-16 -37 -37 -40 -27 -26 -27
-19 -33 -35 -32 -17 -20 -25
- -33 -33 -29 -22 -20 -25
1063 957 980 998 998 1005 1000
Net lending (+) or borrowing (-) vis-a-vis ROW (c)
(a) Eurostat definition (b) gross saving divided by gross disposable income (c) as a percentage of GDP
Cyclically-adjusted budget balance (c)
Real unit labour cost
Imports (goods and services)
General government balance (c)
Unit labour costs whole economy
Inventories
Terms of trade goods
Table II11
Net exports
Public Consumption
Trade balance (c)
Employment
Annual percentage change2012
GDP
Private Consumption
Exports (goods and services)
GNI (GDP deflator)
Structural budget balance (c)
Saving rate of households (b)
Main features of country forecast - BELGIUM
Unemployment rate (a)
Gross fixed capital formation
Current-account balance (c)
Contribution to GDP growth
General government gross debt (c)
GDP deflator
Compensation of employees head
of which equipment
Domestic demand
Harmonised index of consumer prices
2 BULGARIA Economic growth resuming but labour market still weak
50
Growth broadens
Preliminary GDP data for 2013 indicates a slight
pick-up in growth in the second half of the year
Growth was driven by net exports and a surge in
public expenditure whereas household
consumption contracted Annual growth is
projected to have reached 06 in 2013 This
remains well below the estimated potential growth
rate of the economy
Going forward the economic recovery is expected
to be more broad-based with domestic demand
forecast to reinforce the export-driven growth
momentum GDP growth is forecast to reach 17
in 2014 and 2 in 2015 The recovery is expected
to be slow compared to many other converging
economies as a significant population decline (due
to ageing and emigration) continues to erode the
growth potential
Domestic demand poised for a rebound
Even though the purchasing power of households
has been buoyed by growth in wages in a low
inflation environment and by a discretionary
pensions hike of over 9 in April 2013
households have so far remained cautious in
spending However consumer confidence appears
to be gradually firming as indicated by recent
surveys Also retail trade recorded strong growth
over the second half of 2013 which suggests an
imminent recovery in household consumption
Household consumption is therefore forecast to
rebound over 2014-15
The recovery in private investment is forecast to be
gradual given that the rebound in economic
activity is expected to be modest However
investment is supported by the relatively strong
financial sector which has been capable of
upholding credit to the private sector over the
crisis years Also both deposit and lending interest
rates have continued on a downward trend
implying an improvement in lending conditions
and credit availability
Exports to remain buoyant
Exports are forecast to remain relatively strong
also over 2014-15 upheld by an economic
recovery in the EU Nevertheless the rebound in
domestic consumption and investment would also
drive up imports and turn the growth contribution
from net exports slightly negative The current
account surplus is forecast to have reached about
2 of GDP in 2013 but is projected to diminish to
close-to-balance by 2015
Risks are broadly balanced
Risks to this macroeconomic forecast seem
broadly balanced The most significant downside
risk is related to the expected recovery in
household consumption which could prove
weaker than expected given that the Bulgarian
labour market and household sentiment are still
fragile However as observed over the recent
years in periods of weaker domestic demand the
Bulgarian economy has been able to partly
compensate this with higher net exports
-6
-4
-2
0
2
4
6
8
08 09 10 11 12 13 14 15
pps
Graph II21 Bulgaria - Real GDP growth inflation and
employment growth
Employment growth (y-o-y)
Real GDP (y-o-y)
HICP
forecast
The labour market remains in distress
After four consecutive years of falling
employment labour market statistics indicate first
signs of stabilisation since the second half of 2013
This is mainly thanks to the traditionally volatile
agricultural sector which benefited from a good
The economic recovery in Bulgaria is expected to broaden in 2014 and 2015 as domestic demand
gradually joins exports as the main engine of growth But with growth expected to be modest the labour
market will likely remain weak After a fiscal stimulus in 2013 fiscal policy is forecast to turn broadly
neutral this year and next
Member States Bulgaria
51
harvest in 2013 While employment in service
sectors appears also stabilising manufacturing and
construction sectors continue to shed labour
Going forward the labour market is projected to
improve only gradually since notable labour
market mismatches have built up over the
extended crisis years Unemployment is expected
to have peaked at almost 13 of the labour force
in 2013 and decline slowly to about 12 by 2015
Sharply decelerating inflation in 2013
Average inflation amounted to only 04 in 2013
Inflation fell sharply over 2013 turning even
negative in the second half of the year driven by
falling import prices decreases in the
administratively-set energy prices and the good
harvest that led to lower food prices As the base
effects from these factors fade inflation is forecast
to rebound in the second half of 2014
Nevertheless inflationary pressures are expected
to remain low also in 2014 with average annual
inflation projected to reach 05 Inflation is
forecast to accelerate in 2015 to 18 in line with
the projected recovery in domestic demand and the
ongoing convergence of prices towards the EU
average
Fiscal expansion in 2013 turning broadly
neutral thereafter
Following three years of consolidation the general
government deficit is estimated to have increased
from 08 of GDP in 2012 to 19 of GDP in
2013 This was due to a combination of a soft
patch in economic recovery and additional
spending for social expenditure (including the
increase in pensions) and various current
expenditure items The general government deficit
is set to remain unchanged at 19 of GDP in
2014 and slightly decline to 17 in 2015 In
structural terms the deficit is estimated to
deteriorate by 1 pp of GDP in 2013 but remain
broadly stable in 2014 and 2015 This reflects the
expansionary fiscal stance in 2013 and a broadly
neutral one in 2014-15 The general government
gross debt is forecast to increase from 185 in
2012 to about 24 of GDP in 2015
bn BGN Curr prices GDP 94-09 2010 2011 2012 2013 2014 2015
776 1000 29 04 18 08 06 17 20
499 643 32 01 15 26 -04 14 17
121 155 -09 19 16 -14 31 22 23
166 214 - -183 -65 08 17 24 42
77 99 - -112 245 90 48 26 51
517 666 - 147 123 -04 82 56 64
546 703 - 24 88 37 50 55 68
758 977 - 06 04 19 09 14 17
- -49 -03 16 06 17 23
- -03 03 19 -19 00 00
- 56 18 -27 19 00 -03
- -39 -22 -25 -02 02 04
- 103 113 123 129 127 121
- 99 68 29 44 35 36
- 52 25 -05 36 19 19
- 24 -22 -26 14 10 00
- - - - - - -
365 28 49 22 22 09 20
- 30 34 24 04 05 18
- 23 18 -03 14 -04 -02
-102 -77 -56 -91 -61 -65 -72
-72 -04 01 -13 20 13 00
-72 03 13 00 33 27 13
-13 -31 -20 -08 -19 -19 -17
- -23 -15 -03 -13 -14 -12
- -22 -15 -03 -13 -14 -12
- 162 163 185 194 227 241
Net lending (+) or borrowing (-) vis-a-vis ROW (c)
(a) Eurostat definition (b) gross saving divided by gross disposable income (c) as a percentage of GDP
Cyclically-adjusted budget balance (c)
Real unit labour cost
Imports (goods and services)
General government balance (c)
Unit labour costs whole economy
Inventories
Terms of trade goods
Table II21
Net exports
Public Consumption
Trade balance (c)
Employment
Annual percentage change2012
GDP
Private Consumption
Exports (goods and services)
Note Contributions to GDP growth may not add up due to statistical discrepancies
GNI (GDP deflator)
Structural budget balance (c)
Saving rate of households (b)
Main features of country forecast - BULGARIA
Unemployment rate (a)
Gross fixed capital formation
Current-account balance (c)
Contribution to GDP growth
General government gross debt (c)
GDP deflator
Compensation of employees head
of which equipment
Domestic demand
Harmonised index of consumer prices
3 THE CZECH REPUBLIC Economic activity to strengthen in 2014
52
The recovery is firming up
In the third quarter of 2013 real GDP expanded at
a modest pace of 02 confirming the recovery
that had started in the second quarter A significant
weakening of the koruna in November 2013 is
expected to have propped up domestic demand
growth in the fourth quarter of 2013 as in
particular investment purchases were advanced in
response to expectations of increased prices
According to the flash release of 14 February by
the Czech Statistical Office real GDP grew by
16 in the fourth quarter Economic activity
supported by a brightening outlook for the global
economy is expected to continue improving in the
following quarters
-6
-3
0
3
6
08 09 10 11 12 13 14 15
pps
Graph II31 Czech Republic - Real GDP growth and
contributions
Inventories Net exports
Dom demand excl invent Real GDP (y-o-y)
forecast
Exports to drive growth in 2014
While signs confirming the inversion in the cycle
have already been discernible in high-frequency
indicators for a few months value added growth in
manufacturing and other industry still remains
subdued Looking ahead industrial production is
forecast to pick up in 2014 benefitting from
further improvement in confidence a sustained
inflow of new orders and restored profit margins
On the back of the weakened koruna and a gradual
acceleration in economic growth of its main EU
trading partners export-oriented sectors are
expected to be the main drivers of growth in 2014
Lingering effects from the crisis are likely to
persist in construction but declining unit labour
cost in this sector is expected to buttress its
recovery
while domestic demand is set to strengthen
appreciably in 2015
Household consumption is firming but it is
expected to grow somewhat less dynamically than
envisaged in the autumn in view of still weak
growth in real disposable income Stabilisation of
labour market conditions in 2014 and moderate
improvement over the forecast horizon will be a
supportive factor but the projected fall in the
population of working age is set to become a
permanent drag on employment growth In a
context of spare production capacities and limited
credit growth which only very recently started
picking up the contribution of gross fixed capital
formation to GDP growth is expected to remain
subdued in 2014
Looking further ahead growth is expected to
rebalance towards domestic drivers in 2015 along
with strengthening confidence in both the
corporate and household sectors The associated
rise in imports is projected to decrease the
contribution of net exports to growth and to slow
the ongoing improvement in the current-account
balance
Inflation
The Czech National Bank loosened further its
monetary policy in November by weakening the
koruna and has signalled its intention to maintain a
supportive policy stance at least throughout 2014
The latest inflation figures show that the pass-
through from the exchange rate to prices is fairly
quick with inflation as measured by the HICP
rising from 09 in October to 14 in December
2013 However the fading out of past increases in
indirect taxes together with a drop in regulated
prices of electricity are set to dampen price growth
throughout 2014 Stronger domestic demand is
expected to stoke up inflation in 2015
The economic recovery that started in the second quarter of 2013 is expected to strengthen in 2014
sustained by the improving global economy The labour market is set to improve while the general
government deficit is forecast to worsen slightly mainly because of higher government consumption
expenditure and a planned labour tax reform in 2015
Member States The Czech Republic
53
General government deficit to worsen slightly
The general government deficit is expected to have
reached 27 of GDP in 2013 This outcome
results from consolidation measures of
approximately 07 of GDP and a projected year-
on-year decline in public investment by more than
9 Public investment has been on a steep
declining path for four consecutive years and its
share on GDP declined to 29 in 2013 compared
with a long-term average of 42 The available
cash data indicate lower-than-expected revenues
from corporate income taxes and excise duties but
strong VAT revenues
The general government deficit will stabilise at
28 of GDP in 2014 Growth in government
consumption is set to remain strong on account of
the planned increase in the public sector wage bill
and in the intermediate consumption (total fiscal
impact of approximately 02 of GDP) The
forecast also factors in a moderate rebound in
public investment and the planned withdrawal of
earlier consolidation measures (02 of GDP) The
main deficit-reducing measures include lower
indexation of pensions an increase in excise duties
and one-off revenue from the sale of newly
released frequency ranges (total fiscal impact of
approximately 05 of GDP) The structural
balance is forecast to deteriorate in the context of a
narrowing output gap
On unchanged policies the deficit is expected to
widen to 33 of GDP and the structural balance is
forecast to deteriorate further The already adopted
reform of the personal income tax entering in force
in 2015 will be the main deficit-increasing
measure (04 of GDP)
The debt-to-GDP ratio stabilised at around 46 in
2013 due to the sale of financial assets amounting
to approximately 3 of GDP The ratio is
expected to increase over the forecast horizon
reaching 486 in 2015
bn CZK Curr prices GDP 94-09 2010 2011 2012 2013 2014 2015
38459 1000 31 25 18 -10 -12 18 22
19442 506 31 09 05 -21 -04 04 20
7888 205 17 02 -27 -19 14 15 08
8879 231 42 10 04 -45 -40 12 22
3937 102 55 37 67 -56 -07 20 27
30009 780 84 154 95 45 04 57 61
27856 724 85 154 70 23 07 46 58
35610 926 26 15 27 -17 -12 17 21
31 08 -02 -26 -08 08 16
00 10 01 -01 -02 -02 -01
00 06 19 17 -02 12 06
01 -10 00 04 10 02 06
65 73 67 70 70 68 66
84 31 23 23 -10 20 22
52 -04 05 38 11 05 07
07 12 14 21 -02 -09 -12
103 107 99 106 106 108 107
45 -16 -09 16 13 13 19
- 12 21 35 14 10 18
04 -23 -21 -06 06 02 05
-22 15 24 38 45 56 63
-36 -50 -35 -26 -24 -15 -09
-33 -29 -16 -14 -09 -01 06
- -47 -32 -44 -27 -28 -33
- -43 -31 -37 -14 -19 -29
- -45 -31 -19 -13 -22 -29
- 384 414 462 461 472 486
Net lending (+) or borrowing (-) vis-a-vis ROW (c)
(a) Eurostat definition (b) gross saving divided by gross disposable income (c) as a percentage of GDP
Cyclically-adjusted budget balance (c)
Real unit labour cost
Imports (goods and services)
General government balance (c)
Unit labour costs whole economy
Inventories
Terms of trade goods
Table II31
Net exports
Public Consumption
Trade balance (c)
Employment
Annual percentage change2012
GDP
Private Consumption
Exports (goods and services)
GNI (GDP deflator)
Structural budget balance (c)
Saving rate of households (b)
Main features of country forecast - CZECH REPUBLIC
Unemployment rate (a)
Gross fixed capital formation
Current-account balance (c)
Contribution to GDP growth
General government gross debt (c)
GDP deflator
Compensation of employees head
of which equipment
Domestic demand
Harmonised index of consumer prices
4 DENMARK Moving out of stagnation
54
Economic recovery is gaining traction
Real GDP is estimated to have grown by 03 in
2013 The weak growth rate is primarily due to the
negative carry-over effects from 2012 and a weak
development at the beginning of the year In the
course of the year GDP growth has picked up
with two consecutive quarters of growth in the
second and third quarter of 2013 Growth is
estimated to have been primarily driven by
domestic demand while strong imports have led to
a negative growth contribution from net exports
At the beginning of 2014 confidence indicators
are pointing to increased momentum in the Danish
economy (II41) Real GDP is forecast to grow by
17 in 2014 and 18 in 2015 which is
unchanged compared to the projection in the
autumn forecast In 2014 and 2015 domestic
demand is expected to remain the main growth
driver Export growth is expected to pick-up
markedly in 2014 and 2015 but a simultaneous
increase in imports reduces the positive growth
contributions from net exports
Private consumption has been stable at a low level
since 2010 as income growth has been low
uncertainty widespread and Danish households
have been consolidating after the housing bubble
burst However consumer confidence has
improved significantly since last summer house
prices have stabilised and even increased in the
largest cities interest rates are low and there have
been early signs of improvement in the labour
market Hence there is a potential for increased
private consumption which is forecast to expand
by 14-17 on an annual basis in the forecast
period
Exports are expected to have grown by just 09
in 2013 after even weaker growth in 2012 The
low growth rate for 2013 is partly a hangover from
an export drop in the last half of 2012 as growth
over the course of 2013 itself has been more solid
On an annual basis exports growth is expected to
rise to 31 in 2014 and 40 in 2015 in line with
the expected improvement in external demand
Business investment has been weak since the
outbreak of the crisis and savings in the corporate
sector have been stable at a very high level over
the last three years In 2013 business investment
was arguably boosted by the investment window
tax breaks which ended by the turn of the year
Private investment is expected to further accelerate
in the forecast period supported by low interest
rates and in line with the further recovery in
private consumption and exports
-10
-8
-6
-4
-2
0
2
4
6
50
60
70
80
90
100
110
120
130
05 06 07 08 09 10 11 12 13 14
Graph II41 Denmark - ESI and Real GDP growth
Real GDP (rhs) ESI
long term average = 100 y-o-y
Unemployment is edging downwards
The pick-up in economic activity is set to lead to
moderate growth in employment by about 05
annually in the forecast period Despite a steep
increase in 2008 and 2009 the unemployment rate
never reached the same heights as in previous
downturns in the early 1980s and 1990s Job
churning has stayed at a high level during the
crisis with close to 20 of the employed changing
job every year There are correspondingly high in-
and outflows of unemployment and thus a relative
low level of long-term unemployment (17 of the
active population in the third quarter of 2013)
After three years of economic standstill the indicators are pointing to an improvement in the Danish
economy GDP-growth has been positive in the two latest quarters unemployment has edged
downwards and confidence indicators have improved across consumers and different business sectors
But despite these clear signs of improvement it is still too early to conclude that the recovery has
gained a firm footing
Member States Denmark
55
Unemployment has been on a downward trend
since spring 2012 and is projected to decline
further in the forecast period in line with
employment trends According to the European
Commissionrsquos consumer survey consumers have
become more optimistic with regard to future
developments in the labour market with a majority
now expecting decreasing unemployment over the
next 12 months Compared to consumers in other
EU-countries the Danes have been the most
optimistic on this topic in the last eight months
HICP inflation has picked-up slightly at the end of
2013 following a declining trend in the three first
quarters of the year In 2013 inflation was dragged
down by food prices (due to excise tax cuts at the
beginning of the year) as well as dampening
effects from the energy price development and
insurance prices HICP inflation is expected to
increase gradually in the course of 2014 in line
with the gradual strengthening of the economic
activity reaching 15 for the year as a whole
The risks to the macroeconomic outlook appear to
be broadly balanced Denmark is a small and open
economy and any shocks abroad would have a
direct impact on the Danish economy On the
domestic side there are upward risks related to a
possible release of pent-up of demand primarily in
private consumption but also in business
investments There are both positive and negative
risks related to the ongoing consolidation process
in the households and in the corporate sector
Fiscal outlook is stable
The general government deficit is estimated to
have reached 03 of GDP in 2013 14 pps lower
than in the autumn forecast The revision is partly
related to higher than expected one-off revenues
from the possibility to move forward taxation of
existing capital pension schemes at favourable
conditions This measure will also have a positive
impact on the fiscal balance in 2014 where the
budget deficit however is forecast to increase to
13 The one-off effects from the capital pension
measure will not have an impact in 2015 and the
fiscal deficit is expected to increase to 27
bn DKK Curr prices GDP 94-09 2010 2011 2012 2013 2014 2015
18256 1000 17 14 11 -04 03 17 18
8956 491 18 13 -07 -01 04 14 17
5195 285 21 02 -14 04 03 15 06
3174 174 31 -21 33 08 17 27 31
1179 65 37 16 -53 79 49 13 49
10004 548 44 30 70 04 09 31 40
9077 497 56 35 59 09 25 30 38
18807 1030 19 21 15 -01 05 14 17
20 04 -02 02 06 16 15
00 11 04 -03 04 -02 00
-03 -01 09 -02 -07 03 03
07 -25 -02 -03 01 05 05
51 75 76 75 70 69 67
35 35 13 14 12 18 20
25 -05 00 15 10 07 06
04 -45 -07 -08 -14 -06 -09
63 77 77 66 20 36 50
21 43 07 23 24 13 15
20 22 27 24 05 15 17
09 13 -18 03 31 -01 -06
32 29 30 27 32 30 27
21 58 59 60 70 68 66
22 59 63 60 70 68 68
09 -25 -19 -38 -03 -13 -27
03 -01 02 -10 26 13 -05
- -01 02 06 11 -03 -05
511 428 464 454 424 416 431
Net lending (+) or borrowing (-) vis-a-vis ROW (c)
(a) Eurostat definition (b) gross saving divided by gross disposable income (c) as a percentage of GDP (d) EDP net lendingborrowing and EDP
interest for Denmark for the years 2010-2012 are ECFIN estimates based on the October 2013 EDP notification and on revised general government
accounts published by Danmarks Statistik in November 2013
Cyclically-adjusted budget balance (c)
Real unit labour cost
Imports (goods and services)
General government balance (c)(d)
Unit labour costs whole economy
Inventories
Terms of trade goods
Table II41
Net exports
Public Consumption
Trade balance (c)
Employment
Annual percentage change2012
GDP
Private Consumption
Exports (goods and services)
GNI (GDP deflator)
Structural budget balance (c)
Saving rate of households (b)
Main features of country forecast - DENMARK
Unemployment rate (a)
Gross fixed capital formation
Current-account balance (c)
Contribution to GDP growth
General government gross debt (c)
GDP deflator
Compensation of employees head
of which equipment
Domestic demand
Harmonised index of consumer prices
5 GERMANY Accelerated growth in the offing
56
Marked growth this year and next
Following uneven economic activity in the first
half of 2013 real GDP growth broadly stabilised
in the second half of the year The third quarter
saw a 03 (q-o-q seasonally and working-day
adjusted) increase and was followed by a 04
expansion in the final quarter according to the
official flash estimate In 2013 as a whole real
GDP rose by 04 Annual growth was driven by
private and government consumption Investment
continued to show weakness and together with net
external trade contributed negatively to growth
For the first quarter of 2014 and beyond indicators
point to some acceleration of economic growth
followed by stabilisation at quite robust rates
Business expectations reveal high optimism in the
economy as a whole and orders as well as
production expectations indicate significant growth
contributions from manufacturing Compared to
the autumn projection growth contributions are
expected to remain broadly unchanged from net
exports and to increase from domestic demand
Real GDP is projected to expand by 18 in 2014
and by 20 in 2015 The acceleration of activity
in 2015 is almost entirely due to more working
days than this year
Robust consumption and labour market
Real private consumption is supported by low
interest rates and weaker than previously projected
consumer price increases Robust labour market
developments underpin households high
propensity to buy Rising labour supply largely
due to high net migration is set to be more than
offset by labour demand This is reflected in a
gradual reduction in the unemployment rate and
reaccelerating wage growth this year and next
Investment on a rising path
The investment outlook is favourable Following a
protracted decline investment in equipment saw a
moderate turnaround in mid-2013 An upward
trend in domestic orders of capital goods and a
continued rise in firms investment plans amid
dissipating uncertainty and favourable financing
conditions suggest a further pick-up Corporate
construction investment should move in line with
investment in equipment in the medium term
while vibrant housing investment is expected to
reduce its pace of expansion somewhat
Import growth fuelled by domestic demand
Rising industrial orders from abroad and optimistic
export expectations indicate slightly stronger
export growth than projected in the autumn Along
with reaccelerating investment in equipment
imports are set to rise more dynamically than
exports hence contributing to a limited narrowing
of the current-account surplus
-6
-4
-2
0
2
4
6
-6
-4
-2
0
2
4
6
05 06 07 08 09 10 11 12 13 14 15
Graph II51 Germany - real GDP growth and
contributions output gap
Output gap (rhs) Net exports
Investment Priv consumption
Gov consumption Inventories
Real GDP (y-o-y)
of pot GDP
forecast
pps
Inflation broadly stable at moderate levels
Inflation dropped markedly at the end of 2013 The
lowering impact of further easing food and energy
price pressure on headline inflation is expected to
be largely offset by gradually rising core inflation
on the back of a narrowing output gap and rising
labour costs Overall consumer prices are
projected to increase by 14 per year in 2014 and
2015
Economic growth is expected to accelerate powered by domestic demand Favourable financing
conditions and dissipating uncertainty should lead to a gradual recovery in investment in equipment
after disappointing outcomes in 2012-13 while low interest rates and a robust labour market should
further support private consumption and housing investment The general government budget is forecast
to remain balanced and the gross debt-to-GDP ratio to decline
Member States Germany
57
Fiscal stance turning slightly expansionary
According to the preliminary official estimate the
general government budget remained broadly
balanced with a slight deficit of 01 of GDP in
2013 after a surplus of 01 in 2012
Given the outlook for more dynamic economic
activity compared to recent years revenue growth
is projected to accelerate somewhat over the
forecast horizon despite the second step of the
increase in the minimum income tax allowance
this year
Expenditure is projected to increase equally in
particular due to higher pension increases the
restructuring fund set up in response to last years
flood disaster wage increases in the public sector
and the new childcare allowance for parents not
making use of childcare facilities The projections
also include pension reform proposals of the new
federal government that foresee additional benefits
for certain groups of pensioners Consequently the
pension contribution rate has not been further
lowered this year as planned in autumn Further
expenditure measures announced in the coalition
agreement of the new federal government such as
increased spending on childcare facilities transport
infrastructure and research have not yet been
sufficiently specified and hence not been taken
into account but should not change substantially
the projections Overall the general government
budget is forecast to remain broadly balanced and
the structural balance to remain in surplus though
decreasing slightly over the forecast horizon
resulting in a declining gross debt-to-GDP ratio
The ongoing winding up of bad banks could
further reduce the debt stock
50
55
60
65
70
75
80
85
-5
-4
-3
-2
-1
0
1
2
3
4
5
99 00 01 02 03 04 05 06 07 08 09 10 11 12 13 14 15
of GDP
Gross debt (rhs) Budget balance (lhs)
forecast
of GDP
Graph II52Germany - General government
budget balance and gross debt
bn EUR Curr prices GDP 94-09 2010 2011 2012 2013 2014 2015
26664 1000 12 40 33 07 04 18 20
15339 575 09 10 23 08 09 15 18
5144 193 14 13 10 10 11 15 12
4706 176 04 57 69 -21 -08 41 44
1750 66 22 100 58 -40 -22 48 71
13810 518 62 152 80 32 06 49 68
12231 459 55 125 74 14 13 59 76
27301 1024 13 37 34 08 03 17 19
09 19 27 02 05 19 20
00 04 -01 -05 01 01 00
03 17 07 10 -03 -02 00
04 05 14 11 06 05 06
90 71 59 55 53 52 51
13 24 30 26 20 28 31
05 -11 10 31 22 16 17
-04 -21 -02 16 -01 00 00
162 169 164 164 161 160 159
09 10 12 15 22 16 17
- 12 25 21 16 14 14
02 -25 -27 -04 19 05 00
50 63 59 67 68 66 66
20 64 63 70 70 67 64
20 64 61 70 70 66 64
-27 -42 -08 01 -01 00 00
-26 -34 -12 01 05 04 02
- -22 -10 03 06 05 02
623 825 800 810 796 773 745
Net lending (+) or borrowing (-) vis-a-vis ROW (c)
(a) Eurostat definition (b) gross saving divided by gross disposable income (c) as a percentage of GDP
Cyclically-adjusted budget balance (c)
Real unit labour cost
Imports (goods and services)
General government balance (c)
Unit labour costs whole economy
Inventories
Terms of trade goods
Table II51
Net exports
Public Consumption
Trade balance (c)
Employment
Annual percentage change2012
GDP
Private Consumption
Exports (goods and services)
GNI (GDP deflator)
Structural budget balance (c)
Saving rate of households (b)
Main features of country forecast - GERMANY
Unemployment rate (a)
Gross fixed capital formation
Current-account balance (c)
Contribution to GDP growth
General government gross debt (c)
GDP deflator
Compensation of employees head
of which equipment
Domestic demand
Harmonised index of consumer prices
6 ESTONIA GDP growth regaining momentum with recovering exports
58
Growth picking up again in the second half of
2013
Real GDP growth dropped to 07 in 2013 from
39 in 2012 However the slowdown in
economic growth has stabilised as seasonally
adjusted GDP remained broadly unchanged in the
fourth quarter of 2013 compared to the previous
one Private investments picked up again in the
second half of 2013 over-compensating a decline
in government investment due to the end of a
number of environmental projects and the
completion of most EU co-funded programmes
Consumption continued to support economic
growth as household income has been
strengthening thanks to strong real wage growth
rising employment and higher pensions On the
negative side lower domestic demand in Estonias
main trading partners together with the diversion
of oil-related transit trade to new Russian ports led
to quasi-stagnation in Estonias exports volumes of
services while imports continued to grow
Positive growth outlook for 2014 and 2015
With external demand progressively recovering
the economy is expected to regain momentum with
growth forecast at 23 in 2014 and 36 in 2015
Capacity utilisation is now close to its long-term
average which is expected to prompt an increase
in production capacity from 2014 as demand has
started recovering
Consumption growth is forecast to remain
vigorous supported by strong real income growth
including from income tax cuts in 2015
Household borrowing is projected to increase only
moderately despite very low interest rates as
banks will remain cautious towards the still
relatively high private sector indebtedness Finally
Estonias recovering export growth to its main
trading partners is expected to maintain the trade
balance slightly positive despite domestic demand
gathering pace with investment progressively
recovering Downside risks to the forecast could
stem from wages rising faster than productivity
thereby limiting competitiveness and corporate
investment
-40
-30
-20
-10
0
10
20
30
04 05 06 07 08 09 10 11 12 13 14 15
Graph II61 Estonia - Real GDP growth and
contributions export market growth
Dom demand excl inv Imports
Exports Real GDP (y-o-y)
Export market gr(y-o-y)
forecast
pps
Large wage increases in a tightening labour
market hellip
Despite the slowing output growth employment
expanded further in 2013 which is partly
explained by the lagged effect of more vigorous
growth in 2012 At the same time the
unemployment rate fell to 88 down from 102
a year earlier Employment is expected to grow
further and unemployment to continue contracting
over the forecast horizon but at a much slower
pace in a tightening labour market Labour force
participation is high at close to 70 and is set to
increase slightly over the forecast horizon given
the changing age structure of the working age
population Nominal wage growth accelerated to
88 in the third quarter of 2013 with real wage
growth reaching 54 This is driven partly by
persistent skill mismatches and rising vacancies
recent minimum wage increases pay agreements
for health workers and teachers as well as fast
wage catching up in traded services In 2015
nominal wage growth is expected to stabilise at
around 7 and real wage growth at around 4
reflecting solid output growth further minimum
wage increases by 10 each year and
unemployment hovering around its natural rate
hellip while inflation stabilises at lower levels
With the impact of earlier global commodity price
increases fading out HICP inflation receded to
32 in 2013 The assumed decline in global
Real GDP growth slowed to 07 in 2013 but is expected to regain momentum to reach 23 in 2014
and 36 in 2015 as external demand recovers Estonias public debt is expected to remain close to
10 of GDP and only small fiscal deficits are forecast this year and next
Member States Estonia
59
commodity prices is expected to ensure that
inflation will continue its slow decline just below
20 in 2014 However rising core inflation
reflecting strong wage growth and a further excise
tax increase on alcohol are set to push inflation
back to around 3 in 2015
Small fiscal deficit continuing
The general government balance is forecast to
show a small deficit of 04 of GDP in 2013 The
postponement of the dividend distribution from
state owned companies to the government had a
negative effect on the fiscal outcome However
tax revenue remained strong despite relatively
slow real GDP growth
In 2014 the deficit is projected to remain
unchanged at 04 of GDP On the one hand the
public wage bill is projected to increase by 51
and pensions by 58 while the compensation
mechanism for the second pillar pension
contributions will negatively affect the revenue
On the other hand a sizeable revenue-enhancing
package will enter into force that is expected to
compensate the expenditure increase This includes
further excise tax increases and a rescheduling of
dividend distribution from state-owned companies
However some implementation risks have
appeared for VAT-enhancing measures initially
planned to take effect as of mid-2014
On a no-policy-change basis an unchanged
government balance is projected for 2015 In the
course of the year public investment is expected to
revert to growth as the 2014-20 package of EU
funds will start being implemented The income
tax rate cut by 1 pp to 20 scheduled for
1 January 2015 will contribute to a decline in the
tax burden
In structural terms the fiscal position is forecast to
have deteriorated by 03 pp in 2013 and to
improve by 04 pp of GDP in 2014 in 2015 on a
no-policy-change basis it is expected to
deteriorate by 03 pp of GDP The debt-to-GDP
ratio is expected to remain close to 10 of GDP in
2014-15
bn EUR Curr prices GDP 94-09 2010 2011 2012 2013 2014 2015
174 1000 43 26 96 39 07 23 36
89 512 54 -26 38 49 45 43 42
33 192 26 -08 13 38 09 10 12
44 252 68 -73 376 109 14 17 54
20 115 - -162 1228 117 65 60 80
158 906 62 237 234 56 17 41 56
157 903 70 211 284 88 30 46 58
166 952 41 00 99 45 16 23 39
58 -31 94 58 28 29 38
00 32 28 -05 -06 -02 00
-14 28 -20 -26 -12 -04 -02
-12 -48 70 22 14 02 03
95 169 125 102 88 83 77
170 23 05 60 67 60 68
108 -50 -18 42 75 39 34
04 -53 -47 09 24 09 00
17 101 111 45 52 53 53
104 03 30 33 50 30 35
- 27 51 42 32 18 28
04 -16 -22 -19 11 02 02
-155 -25 -44 -66 -52 -51 -50
-87 35 03 -28 -21 -24 -23
-79 70 44 07 08 01 01
05 02 11 -02 -04 -04 -04
- 21 08 -12 -08 -04 -05
- -09 -08 -02 -05 -01 -04
- 67 61 98 100 101 98
Net lending (+) or borrowing (-) vis-a-vis ROW (c)
(a) Eurostat definition (b) gross saving divided by gross disposable income (c) as a percentage of GDP
Cyclically-adjusted budget balance (c)
Real unit labour cost
Imports (goods and services)
General government balance (c)
Unit labour costs whole economy
Inventories
Terms of trade goods
Table II61
Net exports
Public Consumption
Trade balance (c)
Employment
Annual percentage change2012
GDP
Private Consumption
Exports (goods and services)
Note Contributions to GDP growth may not add up due to statistical discrepancies
GNI (GDP deflator)
Structural budget balance (c)
Saving rate of households (b)
Main features of country forecast - ESTONIA
Unemployment rate (a)
Gross fixed capital formation
Current-account balance (c)
Contribution to GDP growth
General government gross debt (c)
GDP deflator
Compensation of employees head
of which equipment
Domestic demand
Harmonised index of consumer prices
7 IRELAND Adjustment supported by stronger economic growth
60
Virtuous cycle of domestic recovery builds up
After a slow start to 2013 growth began to pick up
in the third quarter High-frequency data suggest
that further improvements can be expected in the
final quarter and this underpins the forecast annual
growth of 03 for 2013 There are indications
domestic demand is starting to perform more
strongly as the labour market has continued along
a steady path of improvement across different
sectors
-20
-15
-10
-5
0
5
10
15
20
02 03 04 05 06 07 08 09 10 11 12 13 14 15
pps
Graph II71 Ireland - Real GDP growth and
contributions
Private consumption Government consumption
Investment Exports
Imports Real GDP (y-o-y)
forecast
Unemployment fell to 124 in December 2013
its lowest level since June 2009 Employment
gains seen earlier in 2013 mainly in the part-time
and casual sectors of the labour force have moved
into full-time employment gains although this has
not yet translated into wage pressure Inflation
remains below the euro-area average extending
recent improvements in competitiveness
Real GDP growth in 2014 is forecast at 18 as
economic recovery in key trading partners is
expected to sustain positive export growth
particularly for services while further
improvements in the labour market and a rise in
investment from low levels are expected to
support domestic demand Growth is forecast to
rise further in 2015 to 29 on foot of a
stabilisation of domestic demand and better net
trade as conditions improve in key export markets
Balanced macroeconomic risks
Persistent weakness in merchandise trade
highlights the importance for growth of sustaining
the ongoing recovery in service exports as well as
a stronger contribution to growth from domestic
demand The dependence of goods export on the
performance of the pharmaceutical sector
constitutes a risk to net exports especially if the
effects of patent expiry on trade volumes are not
sufficiently offset by growth in new product lines
Given the importance of UK trade in particular for
indigenous Irish firms the accelerated rate of UK
recovery represents an important upside risk for
growth employment and the current-account
position
The lack of wage pressure while beneficial to
competitiveness heightens the challenge of
reducing private sector indebtedness which
although on a gradual downward path continues to
weigh on growth A stronger contribution from
investment to growth will depend on
improvements in the supply of new credit
especially to SMEs and to the construction sector
for which output must begin to rise in centres of
economic activity in order to satisfy medium-term
housing and commercial property demand
Deficit correction stabilises public debt
The 2013 fiscal deficit is estimated at 72 of
GDP based on end-year cash data which were
slightly better than expected Consumption-related
revenue continued to be weak while direct tax
revenue on labour and corporate income fared
better Overall the expenditure outturn was
broadly in line with budget plans while some
overruns in the health sector were offset by savings
elsewhere The forecast assumes that a dividend
payment from Allied Irish Bank (AIB) in ordinary
shares to the government improves the 2013 deficit
by 02 of GDP but the statistical treatment of
this transaction will be reviewed by Eurostat in
April 2014
A modest pick-up in economic growth is expected in 2014 and the labour market is continuing to show
welcome signs of improvement Fiscal adjustment is on track but includes temporary deficit-improving
factors in 2014 and is not yet fully specified for 2015
Member States Ireland
61
In 2014 the general government deficit is
projected at 48 of GDP The forecast includes
the discretionary measures presented in the
2014 budget of 15 of GDP and other deficit
improving elements some of which are temporary
Discretionary measures include tax increases on
alcohol and tobacco on bank deposits on pension
fund assets and on financial institutions
Expenditure measures include further public sector
wage savings and tighter eligibility for social
benefits and medical services
In 2015 following established practice the general
government deficit is projected at 43 of GDP on
a no-policy-change assumption that is it includes
consolidation measures that had been announced
with a sufficient degree of detail at the cut-off date
of the forecast Specifically the forecast assumes
tax revenues will grow in line with the respective
tax base and that nominal expenditure is kept
constant in level terms with the exception of some
adjustments for demographic factors The 2015
deficit forecast includes a negative carry-over of
around 04 of GDP largely due to one-off
measures having impact on 2014 and the reduction
in the pension fund levy The cyclically-adjusted
budget balance net of one-off and other temporary
measures is projected to decline from 65 of
GDP in 2013 to 47 in 2015 (17)
Government debt is estimated to have peaked at
122 of GDP in 2013 and is projected to decline
to 120 in 2014 due to a fall in high precautionary
cash balances Given the no-policy-change
assumption the debt ratio will stabilise at 120
for 2015 as a primary surplus is partly offset by
a negative growth-interest differential
Uncertainty over growth is among the main risks
to the fiscal forecast Further risks relate to
effective implementation of the 2014 budget in
particular in the health sector given past overruns
Also the government may have to compensate any
possible shortfall in the asset sales linked to the
winding-up of the Irish Banking Resolution
Corporation (IBRC)
(17) One-off measures include one-off guarantee payments
related to the liquidation of IBRC in 2013 (07 of GDP)
one-off revenue from the sale of mobile telephone licenses
in 2013 (04 of GDP) one-off revenue from the sale of the National Lottery licence in 2014 (02 of GDP) as
well as one-off financial sector measures for credit unions
in 2014 and 2015 (less than 01 of GDP in each year)
bn EUR Curr prices GDP 94-09 2010 2011 2012 2013 2014 2015
1639 1000 57 -11 22 02 03 18 29
783 478 49 04 -14 -03 -06 08 10
294 180 46 -49 -29 -32 -10 -28 -04
175 107 54 -227 -91 -06 38 105 54
68 42 65 -112 -15 23 92 120 65
1767 1078 97 64 54 16 03 28 37
1370 836 90 36 -04 00 01 28 26
1339 817 51 -02 -14 08 27 10 21
43 -28 -35 -15 -01 11 11
01 -11 21 03 02 00 00
17 31 57 16 02 07 18
31 -41 -18 -06 22 15 14
72 139 147 147 131 119 112
47 -38 -01 08 -03 -06 06
21 -67 -40 00 16 -08 -08
-04 -53 -46 -06 10 -15 -19
- 132 112 102 127 113 120
26 -15 07 07 06 07 11
- -16 12 19 05 08 11
01 -36 -62 -07 02 02 -01
199 226 226 222 204 189 185
-05 11 12 44 70 68 72
-01 07 11 32 68 72 69
-05 -306 -131 -82 -72 -48 -43
-08 -282 -122 -77 -66 -47 -47
- -89 -81 -77 -64 -49 -46
470 912 1041 1174 1223 1203 1197
Net lending (+) or borrowing (-) vis-a-vis ROW (c)
(a) Eurostat definition (b) gross saving divided by gross disposable income (c) as a percentage of GDP
Cyclically-adjusted budget balance (c)
Real unit labour cost
Imports (goods and services)
General government balance (c)
Unit labour costs whole economy
Inventories
Terms of trade goods
Table II71
Net exports
Public Consumption
Trade balance (c)
Employment
Annual percentage change2012
GDP
Private Consumption
Exports (goods and services)
GNI (GDP deflator)
Structural budget balance (c)
Saving rate of households (b)
Main features of country forecast - IRELAND
Unemployment rate (a)
Gross fixed capital formation
Current-account balance (c)
Contribution to GDP growth
General government gross debt (c)
GDP deflator
Compensation of employees head
of which equipment
Domestic demand
Harmonised index of consumer prices
8 GREECE First signs of recovery
62
Gains in fiscal stability and competitiveness
support confidence and recovery
During the second half of 2013 the recession has
continued to soften as real GDP contracted at a
decelerating y-o-y pace from -55 in the first
quarter 2013 to the fourth quarter flash reading of
-26 The strong revival of tourism since the last
spring with its spillovers on the economy helped
this trend which has continued despite a high
concentration of tax payments in the last quarter of
2013 affecting consumption Overall real GDP
growth in 2013 is projected to have contracted by -
37 revised upwards from -4 in the autumn
forecast
The Economic Sentiment Indicator resumed its
upward path in January 2014 pulled by services
and retail and the Purchasing Managers Index
passing the level of 50 for the first time since
August 2009This indicates further an expansion in
output and new orders The repayment of
government arrears and the faster absorption of the
EU and EIB funds through the re-launch of major
projects such as motorway construction are
expected to help alleviate liquidity constraints and
support investment in 2014 The bank
recapitalisation process and fiscal stabilisation are
also supportive Led by exports and investment
real GDP is expected to expand in 2014 at an
annual growth rate of 06 However private
consumption is expected to still decline in line
with disposable income with the ongoing fall in
prices somewhat moderating the impact of recent
wage adjustments
The recovery is forecast to gain strength in 2015
as investment takes over as the main engine of the
recovery also attracted by the opportunities
created by the ongoing structural reforms The
euro-area recovery should support a revival in
goods exports as well as stronger shipping and
tourism revenues With consumption recovering
real GDP growth is projected at 29
The unemployment rate is estimated to reach
273 for 2013 Wage setting reforms have
already contributed to a sharp improvement in cost
competitiveness which together with the
announced programmes of employment support
and the pick-up in investment should lead to a
relatively strong projected decrease of
unemployment to 260 in 2014 and 240 in
2015
Consumer prices fell moderately by 09 in 2013
and are expected to fall by 06 in 2014 reflecting
weak domestic demand falling unit labour costs
and the implementation of product market reforms
As the economic recovery gains pace prices are
expected to increase only weakly by 02 in 2015
The current-account deficit is projected at -23 of
GDP for 2013 and is expected to narrow to -18
in 2014 and -16 in 2015 as exports and imports
pick up along with the economic recovery also
facilitated by ongoing reforms to simplify trade
activities
-2
-1
0
1
2
3
4
5
-12
-9
-6
-3
0
3
6
08 09 10 11 12 13 14 15
Graph II81 Greece - Real GDP growth and
contributions inflation
Private consumption Public consumption
Investment Net exports
Inventories Real GDP (y-o-y)
Inflation (rhs)
forecastpps
Risks on the upside are related to better
performance of exports stronger tourism
performance andor a stronger liquidity impact of
the arrears clearance On the downside policy
implementation slippages could undermine
confidence affecting investment and exports
Risks have to be re-evaluated in light of the release
by ELSTAT on 11 March 2014 of the fourth
quarter 2013 GDP and components
Recent data support expectations that Greece should return to growth in 2014 Confidence indicators
continue to improve whilst hard data releases suggest the first signs of recovery Structural reforms
undertaken in labour and product markets have underpinned improved competitiveness leading to
expectations for strengthened exports and investment
Member States Greece
63
Budgetary situation is improving
In 2013 the headline overall balance is expected to
have deteriorated to 131 of GDP from 90 of
GDP in 2012 This deterioration is mainly driven
by the one-off costs of bank recapitalization (11
of GDP) which more than offsets the improvement
of the underlying fiscal situation and higher
transfers received by Member States
corresponding to profits on Greek Bonds held by
the Eurosystem Central Banks and other small
factors The structural balance is forecast to have
turned into a surplus of 17 of GDP
18 percentage points higher than in 2012
Current projections assume that programme
objectives for 2014 and 2015 are fulfilled through
measures to be discussed during the ongoing
review The headline deficit is thus projected to
fall to 22 of GDP in 2014 and 10 of GDP in
2015
0
4
8
12
16
20
30
35
40
45
50
55
60
65
08 09 10 11 12 13 14 15
of GDP of GDP
Graph II82 General Government Revenue
Expenditure and Balance
Total Revenue
Total Expenditure
General Government Deficit (rhs)
forecast
After peaking in 2013 the ratio of government
debt to GDP is expected to fall slightly in 2014
before declining more markedly in 2015 and
beyond the forecast horizon as the fiscal balance
continues to improve and economic growth
resumes
bn EUR Curr prices GDP 94-09 2010 2011 2012 2013 2014 2015
1937 1000 29 -49 -71 -64 -37 06 29
1428 737 31 -62 -77 -91 -72 -16 14
344 178 31 -87 -52 -42 -61 -40 -12
255 131 43 -150 -196 -192 -87 53 113
105 54 86 -82 -181 -173 -30 88 130
523 270 45 52 03 -24 25 46 55
621 320 49 -62 -73 -138 -68 -13 27
1947 1005 28 -53 -72 -31 -44 -03 23
35 -93 -101 -104 -75 -12 23
-02 15 07 01 10 00 -02
-05 29 24 40 28 18 08
12 -26 -56 -83 -37 06 26
98 126 177 243 273 260 240
66 -26 -34 -42 -78 -15 00
48 -01 -18 -62 -78 -15 -03
01 -13 -29 -55 -53 -10 -07
- - - - - - -
47 11 10 -08 -26 -05 04
- 47 31 10 -09 -06 02
00 18 06 -10 02 -01 02
-162 -143 -140 -113 -99 -89 -84
-91 -128 -117 -53 -23 -18 -16
- -110 -98 -29 -03 -01 02
-66 -107 -95 -90 -131 -22 -10
-70 -85 -53 -33 -72 22 10
- -89 -59 -01 17 07 -01
1032 1483 1703 1569 1773 1770 1719
Net lending (+) or borrowing (-) vis-a-vis ROW (c)
(a) Eurostat definition (b) gross saving divided by gross disposable income (c) as a percentage of GDP
Cyclically-adjusted budget balance (c)
Real unit labour cost
Imports (goods and services)
General government balance (c)
Unit labour costs whole economy
Inventories
Terms of trade goods
Table II81
Net exports
Public Consumption
Trade balance (c)
Employment
Annual percentage change2012
GDP
Private Consumption
Exports (goods and services)
GNI (GDP deflator)
Structural budget balance (c)
Saving rate of households (b)
Main features of country forecast - GREECE
Unemployment rate (a)
Gross fixed capital formation
Current-account balance (c)
Contribution to GDP growth
General government gross debt (c)
GDP deflator
Compensation of employees head
of which equipment
Domestic demand
Harmonised index of consumer prices
9 SPAIN The recovery becomes firmer while the rebalancing of the economy
continues
64
Spain returned to positive growth territory since
the third quarter of 2013 amidst improved
confidence and some relaxation of financial
conditions Spain successfully exited the Financial
Assistance Programme for the Recapitalisation of
Financial Institutions and the stabilisation of
Spanish financial markets continues with
sovereign-bond yields at new lows In general
financing conditions have improved although they
remain onerous for some borrowers especially for
SMEs Despite these improvements the still large
debt levels and high unemployment weigh on
growth prospects and a source of vulnerability to
adverse shocks
Domestic demand to offset narrowing net
exports
GDP growth accelerated to 03 q-o-q in the last
quarter of 2013 and the recovery is foreseen to
consolidate gradually over 2014 While GDP
contracted by 12 in 2013 it is expected to grow
by 1 in 2014 and to gain some further
momentum in 2015
-9
-7
-5
-3
-1
1
3
5
7
06 07 08 09 10 11 12 13 14 15
pps
Graph II91 Spain - Real GDP growth and
contributions
Net external demand
Domestic demand incl inventories
Real GDP (y-o-y)
forecast
The narrowing contribution from the external
sector in the second half of 2013 has been more
than offset by a less negative contribution from
domestic demand This more balanced growth
composition is expected to continue over the
coming quarters with domestic demand gaining
some momentum while net external demand
provides a positive but declining contribution
Deleveraging in the private sector will continue to
constrain private consumption and investment
Nevertheless private consumption is forecast to
rise backed by increases in disposable income
improved employment prospects and higher
confidence The projected increase in real gross
disposable income also helped by low inflation
(03 in 2014) should also allow for a rising ndash
albeit still low ndash household saving rate over the
forecast horizon
Private investment in equipment is foreseen to
benefit from the improved economic outlook and
the relative strength of exports which is one of its
most important drivers By contrast the adjustment
of residential investment while well advanced has
not reached its inflection point yet with building
permits at historical lows and still falling Housing
transactions seem to have stabilised at very low
levels
Despite a recent deceleration export growth is set
to remain robust backed by ongoing
improvements in price and cost-competitiveness
and healthy foreign markets growth At the same
time imports are forecast to accelerate in line with
final demand As a result of the rising current-
account surplus Spains net lending is projected to
expand over the forecast horizon to around 23
of GDP in 2015
Employment growth back to positive territory
Having peaked at 272 in the first quarter of
2013 the unemployment rate retreated to 26 at
the end of last year mainly due to the decline in
the labour force whereas employment kept falling
However the process of job destruction is
bottoming out and employment is expected to start
registering positive growth rates in 2014
The incipient economic recovery is forecast to get firmer in the coming quarters backed by improved
confidence and some easing of financing conditions While the rebalancing of the economy is expected
to continue the growth contribution from external demand is expected to narrow Employment is
forecast to start growing and the unemployment rate to retreat gradually amidst continued moderation
in unit labour costs The budget deficit is set to narrow in 2014 but government debt will still rise
Member States Spain
65
contributing to a moderate fall in unemployment
Although productivity growth is expected to
decelerate wage moderation should allow for
further improvements in nominal unit labour costs
and competitiveness gains
Downside risks to the growth forecast include a
possible stronger-than-expected slowdown of
emerging economies and in particular South
America where the exposure of the banking sector
is significant On the upside a faster-than-expected
easing of financing conditions could boost
domestic demand
Budget deficit reduction set to continue
helped by recovery
Outturn data for 2013 suggest that fiscal
consolidation continued last year but at a more
moderate pace than in 2012 The general
government deficit is expected to reach 67 of
GDP for the full year (net of bank recapitalisation
costs of about 05 of GDP) as the latest data
indicate that current revenues may underperform
expectations and some expenditure posts might not
have fallen as much as planned inter alia
government investment
The slightly improved macroeconomic outlook
contributes to the expected reduction in the general
government deficit to 58 of GDP in 2014 In
addition to the measures presented in the 2014
Budget further measures of about frac14 of GDP
have been announced at the end of last year
including a widening of the base for social security
contributions to previously exempt benefits in kind
such as transportation aid lunch vouchers and
company cars as well as the introduction of direct
billing On the expenditure side cuts were
announced regarding some severance payments
While interest and pension expenditure are
expected to rise further falling unemployment and
the change in the pension indexation formula
should contribute to a deceleration of social
transfers in 2014
Under the no-policy-change assumption the
headline deficit is expected to widen to 65 of
GDP in 2015 This projection assumes that some
temporary tax measures will expire in 2014 The
structural deficit is estimated to be close to 4frac14 of
GDP in both 2013 and 2014 before rising to 5frac34
in 2015 Large public deficits and low nominal
GDP growth are projected to push the general
government gross debt to 99 of GDP in 2014 and
103 of GDP in 2015
bn EUR Curr prices GDP 94-09 2010 2011 2012 2013 2014 2015
10290 1000 29 -02 01 -16 -12 10 17
6104 593 27 02 -12 -28 -24 06 11
2077 202 40 15 -05 -48 -11 -09 -02
1975 192 36 -55 -54 -70 -56 01 20
607 59 43 50 55 -39 12 58 67
3360 327 58 117 76 21 49 54 64
3283 319 67 93 -01 -57 02 33 49
10170 988 28 04 -07 -08 -08 05 13
32 -09 -20 -41 -27 02 09
00 03 -01 00 00 00 00
-03 04 21 25 16 08 07
20 -23 -22 -48 -33 01 11
137 201 217 250 264 257 246
35 04 13 02 05 06 06
28 -17 -10 -30 -16 -04 00
-05 -18 -10 -29 -19 -09 -07
- 139 127 104 104 106 109
34 01 00 00 03 05 07
30 20 31 24 15 03 09
04 -23 -35 -23 06 13 -01
-53 -46 -42 -25 -12 -04 -02
-43 -44 -40 -12 11 16 18
-34 -38 -35 -06 19 22 23
- -96 -96 -106 -72 -58 -65
- -74 -75 -82 -47 -43 -63
- -74 -72 -51 -43 -42 -58
537 617 705 860 943 989 1033
Net lending (+) or borrowing (-) vis-a-vis ROW (c)
(a) Eurostat definition (b) gross saving divided by gross disposable income (c) as a percentage of GDP
Cyclically-adjusted budget balance (c)
Real unit labour cost
Imports (goods and services)
General government balance (c)
Unit labour costs whole economy
Inventories
Terms of trade goods
Table II91
Net exports
Public Consumption
Trade balance (c)
Employment
Annual percentage change2012
GDP
Private Consumption
Exports (goods and services)
GNI (GDP deflator)
Structural budget balance (c)
Saving rate of households (b)
Main features of country forecast - SPAIN
Unemployment rate (a)
Gross fixed capital formation
Current-account balance (c)
Contribution to GDP growth
General government gross debt (c)
GDP deflator
Compensation of employees fte
of which equipment
Domestic demand
Harmonised index of consumer prices
10 FRANCE Recovery remains slow amid sizeable budget deficits
66
A long way towards recovery
After eight quarters of economic stagnation GDP
rebounded at the end of 2013 although partly
driven by temporary factors Activity is thus
expected to slow down during the first quarter of
this year before accelerating again at first
stimulated by stronger external demand relieved
afterwards by private consumption supported by
improved confidence and in turn by firms
investment All in all after 03 in 2013 real
GDP growth is forecast to accelerate gradually to
10 in 2014 and under the no-policy-change
assumption 17 in 2015
-5
-4
-3
-2
-1
0
1
2
3
4
5
05 06 07 08 09 10 11 12 13 14 15
Graph II101 France - Real GDP growth and
contributions
Inventories Net exports
Domestic demand (excl Inv) Real GDP (y-o-y)
pps
forecast
Improving consumer confidence
Private consumption the traditional growth driver
of the French economy is expected to keep
accelerating growing by 06 in 2014 and 16
in 2015 largely explaining GDP growth
projections as a whole In 2014 and driven by the
expected stabilisation of unemployment
household confidence should further improve
pushing down the saving rate slightly This
coupled with low inflation levels helps explain the
projected private consumption growth
Entrepreneurs slowly gaining confidence
After two years of contraction the rebound in
investment in equipment observed since mid-2013
is expected to continue eased by favourable
corporate lending conditions The unexpected
relative resilience of economic growth in 2013 as a
whole seems to have boosted business confidence
and the tax credit for competitiveness is expected
to have gradually a positive effect on firms
financial situation However the full impact of this
measure on investment may take some time to
materialise The expected rise in aggregate demand
and in capacity utilisation is set to translate into a
firm turnaround in investment only from 2015 The
Responsibility Pact announced in January 2014
has not been taken into account in this forecast as
it is not sufficiently specified yet
Limited improvement in export performance
Exports are projected to accelerate from 2014 on
the back of the assumed rebound in world demand
The recent competitiveness reforms could
gradually reduce the pace of losses in export
market shares albeit without reversing the trend
Export growth is projected to remain slightly
below that of world demand over the forecast
horizon With imports picking up due to the
gradual increase in domestic demand net exports
are expected to provide a nil contribution to
growth in 2014 and to dampen it again in 2015
Decelerating unemployment low inflation
In a context of subdued growth employers are
likely to favour increasing productivity over job
creation throughout 2014 In addition the potential
positive impact of the recent labour market reform
is only expected to be visible from 2015 Only
subsidised job schemes in the public sector are
assumed to stimulate total employment in 2014
Meanwhile the persistent expansion of the labour
force should maintain the unemployment rate at a
high level over the forecast horizon
The incipient recovery is expected to firm up somewhat in the course of 2014 and in 2015 mainly
supported by a timid pick-up in domestic demand on the back of increasing confidence Unemployment
is set to decelerate and inflation to remain low but no improvement in the current account balance is in
sight The general government balance is expected to improve only slightly in 2014
Member States France
67
The moderate price increase at the end of 2013
(08 y-o-y in December) contracting energy
prices and still modest activity growth are set to
mitigate the impact of the VAT increases on
inflation which is set to reach 12 in 2014 after
having bottomed out at 10 in 2013 In 2015
inflation is expected to stabilise on the back of a
gradual closure of the output gap
Room for measured optimism
In case of a job-richer recovery private
consumption could accelerate further In addition
an earlier specification of the announced
Responsibility Pact could improve business
confidence with positive impact on investment
Deficit targets at risk
In 2013 the general government deficit is expected
to have decreased to 42 of GDP based on the
latest data available In particular the outcome for
the state budget showed a 01 of GDP deviation
from the forecast underpinning the draft budget for
2014 Shortfalls in tax revenue proved higher than
expected while spending was kept under control
In addition preliminary information suggests that
healthcare spending was slightly below target
In 2014 the deficit is set to decrease further on the
back of the measures adopted notably as part of the
budget On top of existing spending rules (central
government and healthcare) measures include new
provisions on how annual pension increases are
linked to inflation In addition the 2010 pension
reform which will (with some exceptions)
gradually lead to an increase in the minimum
retirement age from 60 to 62 will bring additional
savings Contrary to previous years the tax burden
is forecast to remain broadly unchanged at around
46 of GDP Overall the deficit is forecast to
reach 40 of GDP in 2014
The structural balance is estimated to improve by
frac34 and frac12 of GDP in 2013 and 2014
respectively Overall the structural effort is
projected to fall short of the levels recommended
by the Council in both years Under the no-policy-
change assumption the general government
balance is set to improve in 2015 reflecting
recovering tax revenues partly offset by projected
expenditure developments
The general government debt to GDP ratio which
is projected to have almost reached 94 of GDP in
2013 will continue to rise on the back of still high
public deficits relative to nominal GDP growth
bn EUR Curr prices GDP 94-09 2010 2011 2012 2013 2014 2015
20323 1000 17 17 20 00 03 10 17
11723 577 19 16 06 -03 04 06 16
5027 247 13 18 04 14 17 12 14
4018 198 23 14 29 -12 -19 09 33
1054 52 30 112 82 -30 -20 32 51
5576 274 38 95 54 24 06 44 56
6026 297 47 89 51 -11 07 40 58
20672 1017 18 19 21 -04 02 09 17
18 16 10 -01 03 08 19
01 01 11 -08 01 01 00
-02 00 00 10 -01 00 -02
07 00 07 00 -04 03 05
95 97 96 102 108 110 110
25 25 25 22 16 13 16
15 07 12 21 10 07 04
-01 -03 -01 06 -01 -06 -09
150 156 156 152 150 147 146
16 10 13 15 11 13 13
17 17 23 22 10 12 12
00 -23 -26 -10 06 -09 -01
-01 -26 -36 -31 -28 -29 -31
04 -19 -25 -21 -19 -20 -22
04 -18 -25 -22 -19 -20 -21
-35 -71 -53 -48 -42 -40 -39
-38 -59 -46 -36 -26 -25 -27
- -57 -47 -36 -28 -23 -27
616 824 858 902 939 961 973
Net lending (+) or borrowing (-) vis-a-vis ROW (c)
(a) Eurostat definition (b) gross saving divided by gross disposable income (c) as a percentage of GDP
Cyclically-adjusted budget balance (c)
Real unit labour cost
Imports (goods and services)
General government balance (c)
Unit labour costs whole economy
Inventories
Terms of trade goods
Table II101
Net exports
Public Consumption
Trade balance (c)
Employment
Annual percentage change2012
GDP
Private Consumption
Exports (goods and services)
GNI (GDP deflator)
Structural budget balance (c)
Saving rate of households (b)
Main features of country forecast - FRANCE
Unemployment rate (a)
Gross fixed capital formation
Current-account balance (c)
Contribution to GDP growth
General government gross debt (c)
GDP deflator
Compensation of employees fte
of which equipment
Domestic demand
Harmonised index of consumer prices
11 CROATIA Muted growth prospects amid a high fiscal deficit and rising debt
68
Economic activity declines further
Real GDP is forecast to have contracted by 07
in 2013 which would be the fifth year of
recession with real GDP being almost 12 lower
compared to 2008 Both domestic demand and net
exports are expected to have contributed
negatively to growth in 2013
After decreasing by 06 y-o-y in the third quarter
of 2013 real GDP is expected to have remained
negative in the fourth quarter according to
available indicators Retail trade activity fell
markedly in the fourth quarter while monthly trade
data also showed sharp declines By contrast after
a decline in the second and third quarter industrial
production improved slightly in the fourth quarter
Muted recovery in 2014
In 2014 real GDP is forecast to grow by 05 on
current policies Net exports of goods and services
and investment are expected to be the main
contributors to growth The projected pick-up in
investment in 2014 is expected to be led by the
public sector assuming increased recourse to EU
funds Growth in private investment is expected to
remain constrained due to fragile domestic demand
and ongoing bank deleveraging Croatian exports
are forecast to benefit from the gradual economic
recovery in the EU but to a limited extent because
of comparatively less favourable developments in
Italy and Slovenia two of the countryrsquos major
trading partners Furthermore goods exports will
be held back by the narrow manufacturing base
and still ongoing restructuring in some important
industries
Private consumption is expected to contribute
negatively to growth in 2014 due to a worsening
labour market situation and ongoing deleveraging
of households Employment fell in the last part of
2013 and is expected to stagnate in 2014 Wage
growth dynamics would remain weak in view of
the muted recovery However low inflation is
forecast to provide a partial cushion limiting
losses in purchasing power
In 2015 a modest recovery is expected on the back
of a mild upturn in domestic demand Recent
legislative changes to improve the business
conditions and the increased availability of EU
funds are expected to underpin investment activity
Owing to a high foreign component the foreseen
pick-up of investment in 2015 is expected to drive
up imports
-12
-10
-8
-6
-4
-2
0
2
4
6
09 10 11 12 13 14 15
pps
Graph II111 Croatia - Real GDP growth and
contributions
Inventories Net exports
Dom demand excl invent Real GDP (y-o-y)
forecast
Inflation expected to remain low
Weak economic activity is set to lead to stagnation
in employment in 2014 followed by a mild
improvement in 2015 the unemployment rate is
expected to stabilise in 2014 at around 176 and
to decline somewhat in 2015
Inflation slowed down significantly towards the
end of the year This reflects the combined effect
of absence of import price pressures weak
domestic demand and lower processed food prices
Producer prices have also been declining on a
y-o-y basis since August It is expected that
consumer price inflation will remain low over the
forecast horizon It is forecast to be at 13 in
2014 partly owing to the fading out of the impact
of the preferential VAT rate increase from 0 to
5 in January 2013 and increase slightly in 2015
The hike in the intermediate VAT rate from 10
to 13 in January 2014 is expected to lead to a
limited upward impact on prices
After five years of recession Croatias real GDP is forecast to grow by 05 in 2014 supported by
exports and investments Growth is expected to strengthen in 2015 as a result of a mild upturn in
domestic demand The headline general government deficit is expected to improve in 2014 and 2015
mainly due to one off effects
Member States Croatia
69
Risks are mainly on the downside
Heightened competitive pressures in the wake of
EU accession are already apparent in some sectors
of the economy like retail trade and it may take
longer to restore trade flows affected by the exit
from the CEFTA area A further contraction in
domestic credit especially to SMEs may also pose
a growth risk Furthermore the capacity to absorb
EU funds in the near-term will be a key factor
determining the achievability of projected
investment gains
High fiscal deficit and rising debt
The general government deficit is expected to have
reached 60 of GDP in 2013 On the revenue side
this deterioration mainly reflects shortfalls in
corporate income tax and social contributions and
on the expenditure side increases in social benefits
and interest expenses Measures such as the
reduction in public sector wage bill dampened the
expenditure increase in 2013
For 2014 this forecast incorporates the 2014
budget act and the legislative changes to the
pension system adopted by parliament in January
but not the budget revision or any additional
measures still under discussion Under the ESA95
accounting rules the headline general government
deficit is expected to improve to 54 and 48 of
GDP in 2014 and 2015 respectively mainly as a
result of the one off effect of transferring a part of
the second pillar to the first pillar in these two
years Under the new accounting rules that will
come into force this autumn (ESA2010) such
transfers will not count as revenue anymore The
structural balance is expected to deteriorate in
2014 due to the combination of increases in
general government expenditure such as
investment and interest expenditure On the
revenue side the collection of indirect taxes is
expected to recover somewhat
The ratio of public debt to GDP is forecast to
increase over the forecast period from 555 in
2012 to 687 in 2015 on the back of persistently
high deficits and subdued nominal GDP growth
Risks to the fiscal forecast seem skewed to the
downside mainly owing to worse than expected
macro-economic prospects
bn HRK Curr prices GDP 94-09 2010 2011 2012 2013 2014 2015
3302 1000 - -23 00 -20 -07 05 12
1987 602 - -13 02 -29 -07 -05 05
653 198 - -21 -06 -08 00 03 05
607 184 - -150 -64 -46 -03 20 40
- - - - - - - - -
1433 434 - 48 20 04 -13 25 30
1409 427 - -28 13 -21 -07 17 32
3187 965 - -19 -08 -19 04 04 07
- -50 -14 -28 -05 02 12
- -01 11 -02 00 00 00
- 29 03 11 -03 03 00
- -51 -23 -39 -25 -02 05
- 118 135 159 176 176 172
- 19 30 32 22 10 18
- -11 07 12 04 03 11
- -19 -13 -08 -14 -11 -06
- - - - - - -
- 08 20 20 19 14 18
82 11 22 34 23 13 15
- 04 07 00 07 10 05
- -139 -145 -143 -147 -144 -146
- -09 -11 -02 08 13 09
- -09 -11 -02 08 13 09
- -64 -78 -50 -60 -54 -48
- -51 -71 -40 -52 -49 -44
- -51 -71 -40 -47 -57 -50
- 449 516 555 649 674 687
Net lending (+) or borrowing (-) vis-a-vis ROW (c)
(a) as of total labour force (b) gross saving divided by gross disposable income (c) as a percentage of GDP
Cyclically-adjusted budget balance (c)
Real unit labour cost
Imports (goods and services)
General government balance (c)
Unit labour costs whole economy
Inventories
Terms of trade goods
Table II111
Net exports
Public Consumption
Trade balance (c)
Employment
Annual percentage change2012
GDP
Private Consumption
Exports (goods and services)
GNI (GDP deflator)
Structural budget balance (c)
Saving rate of households (b)
Main features of country forecast - CROATIA
Unemployment rate (a)
Gross fixed capital formation
Current-account balance (c)
Contribution to GDP growth
General government gross debt (c)
GDP deflator
Compensation of employees head
of which equipment
Domestic demand
Harmonised index of consumer prices
12 ITALY A slow recovery is underway
70
After a severe recession the economy
returned to growth at the end of 2013
The contraction in output recorded since mid-2011
came to a halt with economic activity posting a
moderate increase in the last quarter of 2013 Over
the year real GDP is estimated to have declined by
19 (after -25 in 2012) The strong fall in
domestic demand acted as a drag on the economy
due to persistently tight financing conditions and
high uncertainty holding back consumption and
investments
In 2014 a recovery is expected to set in driven by
the tradable sector Confidence in manufacturing
points to expansion thanks to new export orders
As external demand strengthens ndash also from
euro-area trade partners ndash industrial activity is
expected to increase and the service sector is set to
follow suit As a result real GDP is projected to
grow by 06 Domestic demand is also forecast
to contribute positively to output growth mainly
driven by investment in equipment as capacity
utilisation is projected to increase in particular in
exporting firms Investment in construction
instead is forecast to further decline also in light
of persistently tight credit conditions With still
difficult labour market conditions private
consumption is expected to rise only marginally
and by less than disposable income as households
restore their savings
Italian banks are expected to continue adjusting
their balance sheets which should pave the way to
more favourable credit conditions for firms and
households This is set to support domestic
demand and ultimately output growth in 2015 at
12 As also imports accelerate the current-
account surplus is forecast to stabilise slightly
above 1 of GDP in 2014-15
Feeble demand and high unemployment are
set to keep inflation low
The labour market is set to adjust with a lag to
improving economic conditions and the recovery
to start from a rise in working hours After the
significant drop recorded in 2013 headcount
employment is expected to fall further in 2014
although only marginally As labour supply
remains fairly stable unemployment is set to
decline only slightly from the 128 peak recorded
in November 2013 Sustained unemployment is
expected to decrease wage pressures and to
restrain wage growth This coupled with slightly
improving productivity entails only moderate
increases in nominal unit labour cost As the
economy strengthens in 2015 unemployment is set
to decline to 124 and wage dynamics to be more
sustained mainly on the back of the renewal of
public sector contracts
05
10
15
20
25
30
0
2
4
6
8
10
12
14
05 06 07 08 09 10 11 12 13 14 15
Graph II121 Italy - Unemployment and core inflation
Unemployment rate (lhs)
core HICP annual inflation (rhs)
forecast
The limited labour cost pressures together with
weak consumption and stable energy prices lead
the forecast for HICP inflation to fall to 09 in
2014 and then increase to 13 in 2015 as the
economic recovery strengthens
Government deficit on a decreasing path
The general government deficit is estimated at 3
of GDP in 2013 unchanged from 2012 Primary
expenditure is estimated to have increased by
nearly 1 y-o-y (after declining by around 15
over 2010-12) as the government settled overdue
trade debt which raised investment expenditure in
After contracting 19 in 2013 Italys economy is expected to stage a slow recovery in 2014 driven by
stronger external demand As credit conditions ease growth is expected to rise further in 2015
Unemployment peaked in late 2013 while inflation remains low The government structural primary
surplus ndash ie adjusted for the cycle and one-offs ndash is expected to stabilise at around 4frac12 of GDP over
2013-15
Member States Italy
71
2013 (by around 05 of GDP) However
government finances benefitted from declining
yields on sovereign bonds leading to a decrease in
interest expenditure (to 53 of GDP from 55 in
2012) As a result total expenditure is set to have
risen only marginally Higher revenues are set to
compensate for the spending rise thanks also to
additional taxation on the financial sector
offsetting the reduction in property taxes
In 2014 the headline deficit is projected at 26 of
GDP Interest expenditure is expected to stabilise
and the primary surplus to continue improving to
27 of GDP The moderate year-on-year increase
in primary expenditure is forecast to be more than
offset by an increase in current revenues in line
with nominal GDP growth while capital revenues
are set to fall on the back of expiring one-offs In
2015 the deficit is forecast to narrow to 22 of
GDP under a no-policy-change assumption mainly
thanks to higher growth
The structural balance is estimated to have further
improved in 2013 An additional marginal
improvement (to -06 of GDP) is also expected
in 2014 while the structural balance is set to
worsen in 2015 under a no-policy-change
assumption The structural primary balance is set
to stabilise at around 4frac12 of GDP in 2013-15
-1
0
1
2
3
4
5
6
42
43
44
45
46
47
48
49
03 04 05 06 07 08 09 10 11 12 13 14 15
Graph II122 Italy - Structural primary balance and
determinants ( of GDP)
Structural primary balance (rhs)
Structural revenues (lhs)
Structrul primary expenditure (lhs)
forecast
of GDP of GDP
After incorporating further 16 of GDP trade
debt arrear settlements and 05 privatisation
proceeds the general government debt-to-GDP
ratio is set to peak in 2014 (at nearly 134) and
then decline slightly in 2015 thanks to the higher
primary surplus and nominal GDP growth
bn EUR Curr prices GDP 94-09 2010 2011 2012 2013 2014 2015
15670 1000 10 17 05 -25 -19 06 12
9537 609 12 15 -03 -41 -25 01 09
3150 201 10 -04 -12 -27 -06 -06 04
2807 179 14 06 -22 -83 -55 16 37
1137 73 21 81 -07 -114 -43 53 58
4735 302 25 114 62 20 01 33 49
4558 291 35 126 08 -74 -29 30 55
15568 993 11 17 04 -26 -19 06 13
12 09 -08 -46 -26 03 13
00 11 -01 -07 -01 01 00
-01 -04 14 28 09 02 00
04 -11 01 -11 -18 01 05
91 84 84 107 122 126 124
29 28 13 10 13 11 15
23 00 10 25 13 07 08
-04 -04 -04 08 00 -04 -06
173 124 119 116 128 131 132
28 04 14 17 13 11 14
26 16 29 33 13 09 13
-02 -39 -36 -10 16 10 00
14 -13 -11 11 23 28 28
01 -35 -31 -05 09 13 12
03 -35 -30 -03 09 14 13
-39 -45 -38 -30 -30 -26 -22
-44 -35 -31 -13 -06 -06 -09
- -37 -38 -14 -08 -06 -08
1110 1193 1207 1270 1327 1337 1324
Net lending (+) or borrowing (-) vis-a-vis ROW (c)
(a) Eurostat definition (b) gross saving divided by gross disposable income (c) as a percentage of GDP
Cyclically-adjusted budget balance (c)
Real unit labour cost
Imports (goods and services)
General government balance (c)
Unit labour costs whole economy
Inventories
Terms of trade goods
Table II121
Net exports
Public Consumption
Trade balance (c)
Employment
Annual percentage change2012
GDP
Private Consumption
Exports (goods and services)
GNI (GDP deflator)
Structural budget balance (c)
Saving rate of households (b)
Main features of country forecast - ITALY
Unemployment rate (a)
Gross fixed capital formation
Current-account balance (c)
Contribution to GDP growth
General government gross debt (c)
GDP deflator
Compensation of employees fte
of which equipment
Domestic demand
Harmonised index of consumer prices
13 CYPRUS Recession bottoms out while adjustments are underway
72
Note This forecast was finalised early
February after the third quarterly review of
the Economic Adjustment Programme and will
be revisited during the fourth quarterly review
The recession in 2013hellip
Economic activity is expected to have contracted
by 60 in 2013 which is significantly lower than
projected in the autumn 2013 forecast This
reflects on one hand resilient performance of the
tourism and professional service sectors and on
the other hand a smaller-than-anticipated decline
in private consumption A substantial adjustment
in prices and wages also helped curb the decline in
real GDP Nevertheless several factors continued
to weight on economic growth including tight
credit conditions private and public sector
deleveraging and worsening labour market
conditions Reflecting the significant contraction
in domestic demand imports fell further leading
to a positive contribution of external demand to
GDP growth The fourth-quarter flash estimate
released after the finalisation of this forecast
suggests a milder recession than envisaged in the
third review mission
hellip will extend into 2014hellip
Business sentiment and consumer confidence
indicators suggest a continuation of the recession
The real GDP is projected to decline by -48 in
2014 with domestic demand weighed down by the
need for an adjustment of private and public sector
debt from currently high levels Tight credit
conditions will continue to act as a drag on growth
Downward wage adjustments are expected to
continue weighing on disposable income On the
back of further shrinking of imports and a lesser
fall in exports a positive contribution to growth is
expected from net trade
hellipbefore coming to an end in 2015
In 2015 the recession is expected to come to an
end with growth seen to resuming gradually as
private domestic demand regains strength The
restoration of a sound and well-capitalised banking
sector and the gradual deleveraging of both
households and corporates are expected to
progressively remove the impediments to more
balanced growth Export of goods and services are
forecast to grow accompanied by a marginal
increase in imports
Labour market conditions to improve from 2015
Unemployment is projected to peak in 2014 before
falling slightly in 2015 Unit labour costs are
expected to edge further down driven by a further
decline in compensation of employees The
associated weak domestic cost pressure and
sizeable spare capacity will contain HICP inflation
over the forecast horizon despite indirect tax rate
hikes in 2013 and 2014
Downside risks remain
Risks are tilted to the downside On the domestic
front a more protracted period of tight credit
supply conditions could pose considerable risks to
the real economy In addition a slower reduction
of households debt could prolong the needed
deleveraging process Moreover a further
worsening of labour market conditions may lead to
a more prolonged weakness of business and
consumer confidence
-15
-10
-5
0
5
10
15
-12
-9
-6
-3
0
3
6
9
12
08 09 10 11 12 13 14 15
Graph II131 Cyprus - Real GDP growth and
contributions
Output gap (rhs) Dom demand excl inv
Inventories Net trade
Real GDP (y-o-y)
forecast
pps of GDP
The unwinding of macroeconomic imbalances weighed significantly on economic activity and sentiment
in 2013 The recession is expected to ease in 2014 and growth is set to return in 2015 as domestic
demand recovers Following a better-than-expected performance last year the fiscal situation is set to
improve further this year and next
Member States Cyprus
73
Fiscal adjustment underway
Against the background of the milder recession
and thanks to the significant consolidation efforts
undertaken in line with the programme
requirements the general government deficit for
2013 is estimated to be significantly better than
projected earlier reaching 55 of GDP However
the deficit is project to widen slightly to -58 of
GDP in 2014 This is mainly due to falling profits
as well as declining wages and employment in the
private and public sectors that are expected to
translate into lower revenues from direct taxes
Further drop in private consumption is set to weigh
on the revenues from indirect taxes On the
expenditure side further effort to reduce the public
sector wage bill intermediate consumption and
other current expenditure is projected to outweigh
the increase in social transfers driven by the further
worsening labour market conditions
In 2015 the improving macroeconomic situation
and better labour market conditions are expected to
support revenue from taxes and social
contributions while total expenditure is projected
to remain largely unchanged with higher pension
payments in the private pension scheme largely
offset by a deceleration of the retirement wave in
the public sector
After a sharp increase in 2013 the debt-to-GDP
ratio is expected to further increase in 2014 and
2015 broadly reflecting the macroeconomic
conditions
mio EUR Curr prices GDP 94-09 2010 2011 2012 2013 2014 2015
178868 1000 38 13 04 -24 -60 -48 09
120873 676 - 15 13 -25 -75 -63 07
34382 192 - 10 -02 -31 -60 -15 -27
24300 136 - -49 -87 -196 -240 -181 13
7573 42 - -69 -154 -155 -225 -140 30
77102 431 - 38 44 -27 -48 -27 19
81801 457 - 48 -02 -64 -147 -72 02
172962 967 37 24 56 -73 -58 -62 22
- 02 -08 -56 -98 -67 01
- 18 -07 12 -06 01 00
- -07 19 19 47 19 08
- -02 05 -42 -57 -44 08
- 63 79 119 160 192 184
- 26 25 -09 -50 -30 09
- 11 25 -27 -47 -26 08
- -09 -03 -46 -25 -32 -07
- 192 152 128 99 122 147
29 19 28 19 -23 06 15
- 26 35 31 04 04 14
- -09 -18 -11 -13 -04 -05
- -268 -242 -215 -183 -169 -167
- -92 -35 -68 -17 00 04
- -90 -33 -67 02 10 13
- -53 -63 -63 -55 -58 -61
- -53 -64 -60 -40 -35 -52
- -53 -62 -64 -38 -45 -52
- 613 711 858 1120 1215 1258
Net lending (+) or borrowing (-) vis-a-vis ROW (c)
(a) Eurostat definition (b) gross saving divided by gross disposable income (c) as a percentage of GDP
Cyclically-adjusted budget balance (c)
Real unit labour cost
Imports (goods and services)
General government balance (c)
Unit labour costs whole economy
Inventories
Terms of trade goods
Table II131
Net exports
Public Consumption
Trade balance (c)
Employment
Annual percentage change2012
GDP
Private Consumption
Exports (goods and services)
GNI (GDP deflator)
Structural budget balance (c)
Saving rate of households (b)
Main features of country forecast - CYPRUS
Unemployment rate (a)
Gross fixed capital formation
Current-account balance (c)
Contribution to GDP growth
General government gross debt (c)
GDP deflator
Compensation of employees head
of which equipment
Domestic demand
Harmonised index of consumer prices
14 LATVIA Economic growth and job creation continue at a sound pace
74
GDP growth remains strong
Latvias economy expanded by 4 in 2013
according to the latest flash estimate slower than
the 52 growth in 2012 but still at the fastest rate
in the EU Private and public consumption as well
as net exports supported the overall economic
growth while investments and negative changes in
inventories weighed on the downside
-30
-25
-20
-15
-10
-5
0
5
10
15
20
25
04 05 06 07 08 09 10 11 12 13 14 15
pps
Dom demand ex invent Inventories
Net exports Real GDP (y-o-y)
forecast
Graph II141Latvia - Real GDP growth and contributions
Growth is projected to remain high at 42 in
2014 and 43 in 2015 as investments are set to
rebound on the basis of improving business
sentiment and higher external demand Positive
business reactions to the recent euro changeover
are also seen as supportive to investment
Corporate profits and EU funding are likely to
remain major financing sources for investors as
banking sector deleveraging is still under way
Overall domestic demand and exports are
projected to increase at similar rates However
investment in capital goods is expected to push
imports to a higher growth rate than exports
resulting in a slightly negative net external
contribution to GDP growth
External position keeps improving
The current-account deficit is forecast to remain
below 3 of GDP over the forecast horizon Net
inflows in the capital account linked mostly to EU
structural funds are set to exceed the current-
account outflow keeping the countrys net external
debt on a downward path Suspended production at
the metallurgical plant in Liepaja weighed heavily
on both exports and imports in 2013
Consequently export performance relative to
growth in trading partners deteriorated in gross
terms but in net terms taking out Liepajas re-
exports the countrys external sustainability
indicators improved
Unemployment to drop below 10 by 2015
Unemployment dropped to 119 in 2013 from
15 in 2012 and the downward trend is set to
continue over the forecast period The minimum
wage hike in 2014 and some shortage of skills on
specific labour segments are likely to accelerate
wage growth and restrain job creation
Nevertheless unemployment is expected to fall
below 10 by 2015 marking a steep improvement
from the peak of 195 in 2010 but well above the
record low of 61 in 2007 Unit labour costs are
projected to retain a moderate growth in 2014-15
broadly in line with the dynamics in trading
partners
Electricity and service prices set to rise
HICP inflation was close to zero in 2013 mainly
due to falling energy prices which offset the
gradual increase in core inflation However the
forthcoming deregulation of household electricity
prices as of April 2014 and the steady advance in
service prices are set to push up inflation to 19
in 2014 and 21 in 2015 The first price
monitoring reports on the euro adoption at the
beginning of 2014 show minor inflation effects
related to rounding and passing on of changeover
costs to consumers The overall one-off impact
from the changeover is therefore expected to
remain within the previously forecast range of
02 ndash 03 pp
Growth is expected to marginally exceed 4 over the forecast horizon driven by domestic demand
rebounding exports and improved business sentiment supported by the recent euro changeover Job
creation is set to continue bringing unemployment below 10 by 2015 amid moderate inflation The
outlook for public finances remains stable with a low deficit of around 1 of GDP and a declining
public debt ratio
Member States Latvia
75
Favourable borrowing conditions reflect
markets confidence
In the last months of 2013 the cash balance of the
general government expectedly turned negative
resulting in an annual cash deficit of 05 of GDP
This cash deficit is mostly attributable to local
governments whereas the central governments
position was near-balanced The adjusted general
government deficit according to EDP reporting
requirements is expected to be higher at 13 of
GDP reflecting notably a guarantee call of 03
of GDP involving the Liepaja metallurgical plant
that is currently in a standstill as well as other
adjustments
The general government deficit is expected to
stabilise at around 1 of GDP in 2014 and 2015
based on current policies For 2014 these policies
are fixed in the 2014 budget law that was adopted
by the Parliament on 7 November 2013 For 2015
the planned measures include a 1 pp cut in the
personal income tax rate and a 1 pp increase in
state contributions to the privately managed funded
pension scheme These revenue-reducing measures
are partly offset by a conservative pension
indexation rule It is however not excluded that
this rule could be revised in the context of 2015
budget negotiations Falling interest expenditure
from 2015 provides another significant cause of
decline in the expenditure-to-GDP ratio
As borrowing initially planned for the end of 2013
took place only in early 2014 the debt-to-GDP
ratio did not increase in 2013 as previously
expected In January 2014 the authorities issued a
7-year bond in the amount of EUR 1 billion
(around 4 of GDP) with a favourable yield of
2815 The issuance aims to finance the first
repayment covering one-third of the outstanding
obligations to the EU under the balance-of-
payments facility This repayment is due in March
2014 Subject to continuous favourable market
sentiment the authorities intend to borrow further
in the course of 2014 in order to pre-finance
another large repayment to the EU due in 2015
After this repayment will be made and the need to
keep the current high level of precautionary
financial buffers elapses debt is expected to
decline to around 33 of GDP by end-2015
mio EUR Curr prices GDP 94-09 2010 2011 2012 2013 2014 2015
220826 1000 41 -13 53 52 40 42 43
137723 624 - 23 48 58 55 49 51
35428 160 - -79 11 -02 27 20 17
50330 228 - -181 279 87 -02 52 69
18674 85 - - - - - - -
136004 616 - 125 124 94 09 45 59
144709 655 - 118 223 45 -03 48 67
220545 999 46 -65 38 45 40 40 42
- -40 83 54 38 45 50
- 26 26 -28 -05 00 00
- 01 -56 26 07 -03 -07
-18 -67 15 14 21 20 20
132 195 162 150 119 105 92
153 -49 50 73 43 50 46
88 -101 12 35 23 28 23
-04 -93 -46 01 07 05 00
- - - - - - -
93 -09 60 33 16 23 23
- -12 42 23 00 19 21
- 11 58 -38 03 00 00
-159 -70 -108 -104 -92 -93 -98
-79 29 -23 -25 -16 -19 -25
-66 49 -02 05 09 06 00
-19 -81 -36 -13 -13 -10 -10
- -47 -17 -07 -13 -15 -18
- -30 -15 -02 -13 -15 -18
- 444 419 406 384 387 327
Net lending (+) or borrowing (-) vis-a-vis ROW (c)
(a) Eurostat definition (b) gross saving divided by gross disposable income (c) as a percentage of GDP
Cyclically-adjusted budget balance (c)
Real unit labour cost
Imports (goods and services)
General government balance (c)
Unit labour costs whole economy
Inventories
Terms of trade goods
Table II141
Net exports
Public Consumption
Trade balance (c)
Employment
Annual percentage change2012
GDP
Private Consumption
Exports (goods and services)
GNI (GDP deflator)
Structural budget balance (c)
Saving rate of households (b)
Main features of country forecast - LATVIA
Unemployment rate (a)
Gross fixed capital formation
Current-account balance (c)
Contribution to GDP growth
General government gross debt (c)
GDP deflator
Compensation of employees head
of which equipment
Domestic demand
Harmonised index of consumer prices
15 LITHUANIA Solid growth continues in a context of macroeconomic stability
76
In 2013 domestic demand gradually replaced
net exports as the main growth engine
GDP growth remained strong in 2013 and is
estimated to have reached 32 despite a
slowdown in the second half of the year While in
the first quarter net exports were the main growth
driver the situation reversed in the second quarter
when the trade contribution turned negative and
domestic demand took over as the main engine for
growth Private consumption strengthened
supported by a substantial increase in wages low
inflation a robust labour market and strong
confidence indicators Investment soared in the
second half of the year on the back of high
capacity utilisation rates and positive sentiment
-15
-10
-5
0
5
-30
-25
-20
-15
-10
-5
0
5
10
15
08 09 10 11 12 13 14 15
pps
Graph II151 Lithuania - Real GDP growth and
contributions output gap
Output gap (rhs) Inventories
Net exports Dom demand excl invent
Real GDP (y-o-y)
forecast
Growth is set to accelerate on the back of
robust domestic demand
Looking ahead GDP is forecast to grow by 35
in 2014 and 39 in 2015 Private consumption is
set to continue benefitting from further increases in
disposable income of households due to the
recovering labour market accelerating wage
growth and low inflation Investment is expected
to grow as interest rates are low and companies
have significant financial reserves to finance
investments Moreover EU co-financed projects
will continue to support public investment over the
forecast horizon
Risks to the growth forecast are broadly balanced
a further slowdown in Russia might hamper
sentiment and exports while investment growth
might stall as some of it ndash both public and private
ndash was of a one-off nature connected to regulatory
changes and the Lithuanian EU Presidency On the
upside credit growth could pick-up
Net exports likely to remain a drag on growth
Export growth is set to remain subdued in early
2014 before picking up in accordance with an
improving external environment The positive
effect of the strong 2012 harvest on exports came
to an end in the second quarter of 2013 In
addition in the second half of 2013 the weak
performance of the fertiliser and refined petroleum
product industry started weighing on export
performance
Import growth has been fairly stable and is
expected to increase as private consumption and
investment strengthen Overall the contribution of
net exports to growth is expected to remain
negative over the forecast horizon The current
account is expected to show a slight surplus in
2013 before reverting to a moderate deficit in
2014 and 2015
Inflation set to remain below the long-term
average
HICP Inflation slowed to 12 in 2013 due to
exceptionally weak energy and food price
developments This trend is forecast to continue in
early 2014 with a slight pick-up expected
thereafter Inflation in the service sector is likely to
accelerate on the back of sustained wage growth
while energy and food inflation are set to remain
below average levels Overall HICP is forecast to
grow by 11 in 2014 and 19 in 2015
Financial sector ndash credit growth still subdued
Private sector deposits continued to grow in 2013
but credit to households stayed flat while credit to
enterprises marginally contracted Thus despite
Growth remained strong in 2013 and is set to continue at a steady pace in 2014 and 2015 with strong
domestic demand as the main growth engine Unemployment is forecast to decline but remain high
while inflation which slowed significantly in 2013 due to weak energy and food prices is set to pick up
moderately
Member States Lithuania
77
sufficient liquidity banks remain cautious in their
lending However households and enterprises
were able to finance a large amount of investments
from their own resources
Fiscal consolidation continues
In 2013 fiscal consolidation was supported by a
solid increase in direct taxes in particular
corporate income tax which compensated for a
shortfall in indirect taxes while expenditure
growth at central government level was ultimately
contained Fiscal results of local governments
however are expected to be weaker than a year
before An improving situation in the labour
market led to a smaller-than-planned deficit of the
social insurance fund Overall the general
government deficit is set to reach 27 of GDP in
2013
Going forward the deficit is forecast to decrease to
23 of GDP in 2014 mainly because of limited
expenditure increase Revenue losses from an
increase in non-taxable allowance are set to be
only partially compensated by an increase in
excise taxes on alcohol and tobacco products in
spring For 2015 under a no-policy-change
assumption the general government deficit is set
to reach 17 of GDP
Following the judgement of the Lithuanian
constitutional court on the compensation of
pension and public wage cuts the Lithuanian
government is expected to specify this spring when
and how it intends to compensate Thus there is a
risk that the general government deficit may turn
out higher than currently projected
The structural deficit is estimated to have
decreased from 3 of GDP in 2012 to 25 in
2013 and to continue decreasing over the forecast
horizon to 18 in 2015 General government
debt is estimated to have decreased slightly from
405 of GDP in 2012 to 395 in 2013 It is
projected to increase to 422 in 2014 due to the
pre-financing of a 2015 eurobond redemption
before falling back to 414 in 2015
bn LTL Curr prices GDP 94-09 2010 2011 2012 2013 2014 2015
1137 1000 36 16 60 37 32 35 39
720 633 - -36 48 39 47 38 43
200 176 - -34 03 06 15 16 17
189 166 - 19 207 -36 72 65 69
61 54 - 206 372 -48 135 90 97
955 839 - 174 141 118 65 66 69
945 831 - 179 137 61 66 70 74
1101 968 - -22 42 42 50 31 37
- -29 65 19 44 39 43
- 51 -05 -25 -12 00 00
- -06 00 42 00 -03 -03
-08 -119 05 18 15 15 13
102 178 154 134 118 104 96
163 72 63 38 44 38 46
114 -70 07 19 26 17 19
16 -91 -44 -07 09 01 -06
- 82 42 09 - - -
95 23 54 26 17 16 25
- 12 41 32 12 11 19
- 14 -06 -10 04 01 03
-105 -48 -58 -28 -25 -28 -30
- -04 -39 -11 01 -05 -07
- 34 -06 19 30 23 20
-31 -72 -55 -32 -27 -23 -17
- -48 -45 -29 -26 -23 -19
- -48 -45 -30 -25 -22 -18
- 378 383 405 395 422 414
Net lending (+) or borrowing (-) vis-a-vis ROW (c)
(a) Eurostat definition (b) gross saving divided by gross disposable income (c) as a percentage of GDP
Cyclically-adjusted budget balance (c)
Real unit labour cost
Imports (goods and services)
General government balance (c)
Unit labour costs whole economy
Inventories
Terms of trade goods
Table II151
Net exports
Public Consumption
Trade balance (c)
Employment
Annual percentage change2012
GDP
Private Consumption
Exports (goods and services)
GNI (GDP deflator)
Structural budget balance (c)
Saving rate of households (b)
Main features of country forecast - LITHUANIA
Unemployment rate (a)
Gross fixed capital formation
Current-account balance (c)
Contribution to GDP growth
General government gross debt (c)
GDP deflator
Compensation of employees head
of which equipment
Domestic demand
Harmonised index of consumer prices
16 LUXEMBOURG Robust growth above the euro-area average
78
Growth is picking up
GDP in 2013 is projected to have grown by 21
significantly higher than the euro-area average
After a disappointing performance at the beginning
of last year economic activity rebounded strongly
in the second and third quarters growing by 20
and 02 q-o-q respectively In the last quarter of
2013 and in line with soft and hard indicators
output is projected to have accelerated again
signalling that the economy could have entered a
period of relatively sustained expansion However
the recovery is expected to be fragile and uneven
across sectors
-8
-6
-4
-2
0
2
4
6
8
10
00 01 02 03 04 05 06 07 08 09 10 11 12 13 14 15
pps
Graph II161 Luxembourg - Real GDP growth and
contributions
Private consumption Public consumption
Investment Inventories
Net exports Real GDP (y-o-y)
forecast
Set for a gradual recovery
Overall output is expected to grow by 22 in
2014 and 25 in 2015 The full impact of the new
financial rules should be visible by 2015 and
although the potential of the financial sector to
expand is expected to be smaller than in the past it
is still projected to remain a positive contributor to
growth This coupled with higher households
confidence on the back of an improved labour
market as well as stronger investment backed by
better euro-area growth prospects is expected to
support domestic demand Moreover
manufacturing output is expected to have bottomed
out in 2013 and a mild recovery is projected over
the forecast horizon
Private consumption in the absence of new fiscal
consolidation measures is expected to accelerate
somewhat to 23 in 2014 and 26 in 2015
broadly in line with the increase in disposable
income Still consumption is hampered by
concerns about relatively weak labour market
developments given that job creation is projected
to be just sufficient to stabilise the unemployment
rate
With financial conditions remaining tight coupled
with a historically low level of capacity utilisation
and still weak demand from the main trading
partners firms are expected to postpone or freeze
their investment plans Investment is expected to
be led by specific sectors in particular purchases
from the aeronautic and satellite industry
Exports are set to improve on the back of better
prospects for external demand The contribution to
growth from external trade is projected to remain
positive throughout the forecast horizon However
it is set to decline slightly in 2014 as imports are
projected to record a more robust growth on the
back of buoyant internal demand
Risks relate to the capacity of the financial
sector to further expand
Risks to the forecast mainly stem from the capacity
of the financial sector to adapt to the changing
business and regulatory environment It will
determine not only the prospects for this industry
but given the size of the sector also the outlook
for the economy as a whole
Lower inflation and moderate job creation
Headline inflation has been falling during 2013
and is estimated to have reached 17 Increases in
administered prices partially offset less dynamic
oil prices Inflation is expected to marginally abate
in 2014 to 15 before bouncing back slightly in
2015
Job creation in 2013 weakened to 17 due to
labour shedding in the construction and the
Economic output is expected to continue growing significantly faster than the euro-area average While
the potential growth of the financial sector could have been dented its contribution should remain
positive Job creation looks set to continue albeit at a moderate pace Windfall revenues from
e-commerce related activities are set to gradually fade out from 2015 onwards
Member States Luxembourg
79
industrial sectors Employment creation is
projected to remain weak with a financial sector
undergoing an overhaul following the
implementation of new regulations which implies
labour adjustments Employment growth is then
projected to stabilise in 2014 at 17 and to
accelerate slightly in 2015 to 19 mainly thanks
to better prospects in the financial sector The
unemployment rate after peaking at 60 in 2014
is expected to drop to 59 in 2015
Buoyant revenues have a temporary positive
effect on government deficit
The general government deficit is projected to
have reached 02 of GDP in 2013 down from
06 in 2012 mostly due to windfall revenues
coming from e-commerce VAT-related activities
and to a lesser extent from the implementation of
the fiscal measures contained in the budget
Expenditure did not contribute much to the
improvement of the fiscal position given that the
consolidation package adopted by the government
with the 2013 budget was not able to contain the
rapid growth of government consumption
expenditure
In 2014 under the usual no-policy-change
assumption ie that does not include the upcoming
budget the deficit is expected to increase
marginally to 05 of GDP mainly reflecting the
dynamic growth in social spending
In 2015 the deficit is projected to increase
substantially to 24 of GDP as VAT revenues
from e-commerce will start to fade away The
initial budgetary impact of the drop in VAT
revenues is estimated at least at 1frac12 of GDP
Under the afore-mentioned no-policy-change
assumption the announced increase in general
VAT rates is not incorporated in this forecast as
the measure is not yet sufficiently specified
The surplus in the structural balance is expected to
stabilise in 2013 to fall by frac34 pp in 2014 and to
turn into a deficit in 2015 following a drop by
more than 2 pps
Government debt is projected to rise from around
24 of GDP in 2013 to slightly above 28 in
2015 as the surplus of the social security sector
cannot be used to finance the deficit of the central
government
mio EUR Curr prices GDP 94-09 2010 2011 2012 2013 2014 2015
428992 1000 36 31 19 -02 21 22 25
137735 321 25 26 13 22 20 23 26
75039 175 40 25 13 48 17 19 25
82753 193 41 -07 121 35 21 29 18
35414 83 29 217 224 183 40 38 12
760878 1774 64 72 54 -19 23 36 49
635894 1482 66 114 74 -10 23 39 53
292244 681 14 80 15 -12 25 26 31
26 12 28 22 13 16 16
-01 51 02 -04 00 00 00
12 -32 -10 -19 07 06 09
35 18 30 25 17 17 19
35 46 48 51 59 60 59
29 26 24 20 15 31 25
28 14 34 47 11 26 20
02 -54 -07 17 -26 -02 -07
- - - - - - -
25 72 42 30 39 28 27
- 28 37 29 17 15 17
01 51 22 -06 -17 09 01
-106 -102 -123 -142 -150 -153 -157
101 77 66 67 64 67 70
- 73 63 62 60 66 71
24 -08 01 -06 -02 -05 -24
21 03 08 10 10 03 -21
- 03 08 10 10 03 -21
76 195 187 217 243 255 281
Net lending (+) or borrowing (-) vis-a-vis ROW (c)
(a) Eurostat definition (b) gross saving divided by gross disposable income (c) as a percentage of GDP
Cyclically-adjusted budget balance (c)
Real unit labour cost
Imports (goods and services)
General government balance (c)
Unit labour costs whole economy
Inventories
Terms of trade goods
Table II161
Net exports
Public Consumption
Trade balance (c)
Employment
Annual percentage change2012
GDP
Private Consumption
Exports (goods and services)
GNI (GDP deflator)
Structural budget balance (c)
Saving rate of households (b)
Main features of country forecast - LUXEMBOURG
Unemployment rate (a)
Gross fixed capital formation
Current-account balance (c)
Contribution to GDP growth
General government gross debt (c)
GDP deflator
Compensation of employees head
of which equipment
Domestic demand
Harmonised index of consumer prices
17 HUNGARY A mild recovery sustained by domestic demand
80
Continued economic growth partially boosted
by indirect fiscal stimuli
After re-entering into recession in 2012 with a
17 decline Hungary experienced a real GDP
growth of 11 in 2013 partly reflecting the
correction of one-off adverse developments in
agriculture In 2013 investment turned positive
mainly as a result of public investment but
corporate investment also started to accelerate on
the back of the acceleration in the absorption of
EU funds and to some extent the central banks
extended Funding for Growth Scheme (FGS
providing subsidised lending to SMEs) A sharp
decline in inflation contributed to increasing
households real disposable income but the still
high unemployment and ongoing deleveraging
continued to put a drag on consumer spending
Altogether domestic demand became the main
driver of growth in 2013
Real GDP growth is expected to reach 21 both
in 2014 and 2015 driven by a further pick-up in
domestic demand while net exports are projected
to provide a nil contribution Yearly household
consumption is expected to return to positive
territory from 2014 due to further improvements in
real disposable income partly linked to the
regulated price cuts and increasing public sector
wages but also looser lending conditions as a
consequence of new subsidised mortgage schemes
However due to an oversupply in the market
housing investment is forecast to recover only
modestly Credit supply conditions to the corporate
sector will be only temporarily eased by the FGS
and together with a high absorption of EU funds
will contribute to a pick-up in investment activity
as well as a slight growth in firms net borrowing
Decreasing unemployment and low inflation
Despite a continuous increase in the participation
rate unemployment dropped below 10 by the
fourth quarter of 2013 as Labour Force Survey
(LFS) based employment increased by 16 in
2013 The continuous expansion of the Public
Work Scheme the increasing number of frontier
workers and the whitening of the economy
contributed to the improvement in the labour
market (18)
As the economy recovers domestic
employment in the private sector is also expected
to pick up and the unemployment rate is projected
to fall further below 10 over the forecast period
Inflation reached a historically low rate of 07 in
the last quarter of 2013 reflecting three successive
waves of cuts in regulated energy and other utility
prices Underlying inflation has also been on a
downward trend due to a negative output gap and
declining imported inflation However as the
output gap closes and the effect of utility price cuts
fades away inflation is expected to increase
gradually towards the central banks 3 target by
2015 The recent depreciation of the forint entails
some upward risk to the inflation projections
Risks to the GDP forecast are overall tilted to the
downside A tightening in global monetary
conditions may generate significant headwinds for
Hungary most notably through the revaluation of
FX denominated debt The main domestic risk is
related to the possible adoption of a new
comprehensive FX relief scheme with potential
negative effects on the banking sector and
investors sentiment As an upside risk stimulus
measures could have a bigger-than-expected effect
on investment
Government deficit expected to rebound to
3 of GDP
Cash-flow data for 2013 point to an
overachievement of the 27 of GDP deficit
target with the general government deficit
expected to reach 24 of GDP ie 05 lower
than in the autumn forecast (19)
The deficit-
(18) The effects of the latter two factors can be derived from the
difference between the LFS-based and GDP-consistent
employment figures as the latter which do not include
these effects grew at a slower pace The table below provides the GDP-consistent employment figures
(19) It is assumed that the budgetary transfer of 045 of GDP
to the integration body of the savings cooperatives will be recorded as a transfer within the government sector
However this is still subject to confirmation by Eurostat
Hungary emerged from recession in 2013 with GDP growing by 11 Growth is expected to accelerate
to around 2 in 2014 and 2015 primarily driven by domestic demand Preliminary annual data
indicate a government deficit at around 2frac12 in 2013 but it is forecast to rebound to around 3 of
GDP this year and next
Member States Hungary
81
decreasing developments include higher tax and
social security contribution proceeds (015 of
GDP) one-off revenue resulting from the shift of
the accounting method from public to total cost for
national co-payments for EU funds (01 of GDP)
as well as the end-year savings by budgetary
institutions and chapters (02 of GDP)
The 2014 deficit is projected to reach 30 of
GDP ie slightly above the target of 29 of
GDP The better-than-expected budgetary outturn
in 2013 has only a limited base effect which is
offset by additional spending measures rising
interest outlays and the modest nominal private
consumption growth Compared to the budgeted
figures tax revenues are projected to be lower by
over 03 of GDP due to a lower-than-expected
inflation as well as a more cautious assessment of
measures aiming to enhance tax administration
The forecast is based on the assumption that the
special reserve (03 of GDP) will not be spent
In 2015 the deficit is expected to decrease
somewhat to 29 of GDP The effect of economic
recovery and the assumed decline of public
investment linked to the electoral cycle will largely
be offset by the fall in one-off revenues from the
sale of telecommunication licenses
Regarding risks in 2013 the possibly higher local
government surplus could have further decreased
the deficit but the increased arrears in accrual
terms could have had an opposite effect For 2014
and beyond the revenue effect of the change of
method for the calculation of the national co-
financing represents a positive risk while a deficit-
increasing effect could result from a further
slowdown in inflation as well as an increase in
sovereign yields
After a moderate decrease of frac14 pp in 2013 the
structural balance is forecast to deteriorate further
in 2014 by more than 1 pp and to improve slightly
in 2015 The debt-to-GDP ratio is forecast to have
decreased in 2013 by 2 pps to 778 of GDP
exclusively on account of the end-year reduction in
the state cash deposits Thereafter it is projected to
increase again due to the revaluation of the FX
component
bn HUF Curr prices GDP 94-09 2010 2011 2012 2013 2014 2015
280481 1000 23 11 16 -17 11 21 21
153724 548 - -30 04 -16 00 15 16
57201 204 -01 -12 00 -12 11 15 20
48808 174 37 -85 -59 -37 32 60 44
21828 78 - -31 60 38 50 70 47
265517 947 129 113 84 17 51 53 61
244908 873 107 109 64 -01 50 59 66
265415 946 20 07 10 -18 21 22 21
18 -37 -09 -18 08 22 21
-01 38 04 -15 -01 00 00
07 09 21 16 04 -01 00
- 08 03 01 03 06 06
- 112 109 109 102 96 93
- -05 36 08 24 35 32
- -07 23 27 16 20 17
- -30 -03 -05 -05 -01 -06
- 108 107 74 90 90 79
104 24 26 32 22 21 23
- 47 39 57 17 12 28
- -02 -17 -12 03 01 01
-34 25 31 36 40 37 35
-62 04 06 11 29 27 26
-58 22 29 37 61 56 53
- -43 43 -20 -24 -30 -29
- -26 54 -02 -09 -20 -24
- -33 -41 -09 -11 -24 -23
- 822 821 798 778 791 789
Net lending (+) or borrowing (-) vis-a-vis ROW (c)
(a) Eurostat definition (b) gross saving divided by gross disposable income (c) as a percentage of GDP
Cyclically-adjusted budget balance (c)
Real unit labour cost
Imports (goods and services)
General government balance (c)
Unit labour costs whole economy
Inventories
Terms of trade goods
Table II171
Net exports
Public Consumption
Trade balance (c)
Employment
Annual percentage change2012
GDP
Private Consumption
Exports (goods and services)
GNI (GDP deflator)
Structural budget balance (c)
Saving rate of households (b)
Main features of country forecast - HUNGARY
Unemployment rate (a)
Gross fixed capital formation
Current-account balance (c)
Contribution to GDP growth
General government gross debt (c)
GDP deflator
Compensation of employees head
of which equipment
Domestic demand
Harmonised index of consumer prices
18 MALTA Private consumption to drive growth
82
Economic growth is projected to remain stable
Real GDP growth was relatively strong in the first
three quarters of 2013 largely on the back of the
change in inventories component which is used as
a residual item in national accounts Gains in
household consumption were offset by a further
decline in investment activity which is estimated
to have contracted for the third consecutive year
Trade volumes surprised on the downside but the
decline in exports was milder than that in imports
and thus external trade are seen to have had a
slightly positive contribution to growth Real GDP
is estimated to have increased by 2 in 2013 as a
whole up from a mild 09 growth in 2012
Real GDP growth is projected to remain largely
unchanged averaging 21 in 2014-15 Labour
market participation is set to remain on an upward
path largely reflecting higher activity by women
and older workers The job market is expected to
be able to fully absorb this inflow and the
unemployment rate is set to decline slightly
Favourable labour market conditions and the
positive impact of the announced reduction of
electricity tariffs are projected to support a further
improvement in household consumption With
capacity utilisation exceeding its long-term
average investment is projected to improve The
recovery however is set to be rather cautious in
an environment of low credit growth and higher
interest rates compared to the euro area
Improving domestic demand is expected to boost
import growth but overall net exports are
projected to continue to contribute positively to
real GDP growth and the current account is
forecast to remain in surplus over the forecast
horizon
Risks to the macroeconomic scenario are broadly
balanced The forecast assumes a stabilisation of
the investment-to-GDP ratio and thus a
continuation of the downward trend observed in
recent years would present a downside risk At the
same time the structural reforms that the
government has committed to enact in the energy
sector could lower costs for the economy and boost
domestic demand thus constituting an upside risk
particularly in 2015 No significant change in
financing conditions is projected to occur over the
forecast period
Price inflation gradually picks up
HICP inflation came in slightly below expectations
at 1 for the year as a whole in 2013 slowing
down from 32 in 2012 Deceleration came on
the back of lower prices of services offered in
restaurants and hotels This explains why the local
measure of inflation the Retail Price Index which
puts less emphasis on tourist services decelerated
less than HICP inflation Energy prices also
declined slightly in line with developments on
international markets
In 2014 the reduction in electricity tariffs is
projected to offset a rebound in services inflation
and keep overall price inflation at a relatively
moderate by Maltas historical standards 12
With the output gap estimated to have closed in
2014 the HICP is forecast to accelerate further to
19 in 2015 above the euro-area average
Budget deficit to stabilise
From 33 of GDP in 2012 the budget deficit is
expected to decrease to 30 of GDP in 2013
Current primary expenditure relative to GDP is
forecast to increase by 05 pp despite the spending
review at ministry level that started in July 2013
On the capital side net expenditure including the
planned additional equity injection into Air Malta
(06 of GDP) is expected to stabilise Indirect
taxes relative to GDP are projected to increase by
03 pp driven also by the recovery in
consumption in the second half of the year
Corporate profitability as well as a favourable
labour market outlook is expected to drive income
taxes despite measures to gradually reduce the
overall income tax levels
The 2014 budget includes mostly revenue-
increasing measures among which increases in
indirect taxation (mainly excise duties) a new
Real GDP growth is estimated to have reached 2 in 2013 and projected to maintain the same pace in
2014-15 Domestic demand is seen becoming the main driver of growth largely on the back of
recovering household consumption The general government deficit is projected to stabilise below 3 of
GDP
Member States Malta
83
programme to grant Maltese citizenship to foreign
individuals and families (against the payment of a
fee and investments in the country) and the
introduction of a new tax regime for rental income
On the expenditure side the budget envisages
some restrictions on recruitment Overall the
current revenue ratio is projected to increase by 02
pp of GDP while primary current expenditure is
forecast to stabilise The deficit is expected to
narrow to 27 of GDP In 2015 on a no-policy-
change assumption the deficit is projected to
remain at 27 of GDP
After having worsened by frac12 pp of GDP in 2012
the structural deficit is estimated to have improved
by 07 pp of GDP in 2013 despite the limited size
of the consolidation measures Thereafter the
structural deficit is projected to improve slightly
by 02 pp of GDP in 2014 before deteriorating by
03 pp of GDP in 2015 The debt-to-GDP ratio is
projected to reach 724 in 2014 and decrease to
715 in 2015 following the due repayment of
part of a loan from Air Malta
Downside risks relate to the financial situation of
Enemalta (the public energy utility corporation) as
well as higher than budgeted disbursement related
to the car VAT refund scheme
-7
-6
-5
-4
-3
-2
04 05 06 07 08 09 10 11 12 13 14 15
of GDP
Graph II181 Malta - General government nominal
and structural deficit
Nominal deficit Structural deficit
forecast
mio EUR Curr prices GDP 94-09 2010 2011 2012 2013 2014 2015
68507 1000 30 33 17 09 20 21 21
41100 600 - -03 33 -05 06 19 22
14504 212 - 16 41 52 12 10 08
10107 148 - 158 -215 -44 -20 13 18
3654 53 - 483 -473 -135 - - -
70259 1026 - 174 34 81 -29 40 59
66120 965 - 153 01 54 -39 37 59
64415 940 23 42 38 -04 16 17 17
- 25 -07 02 04 15 17
- -06 -05 -19 10 00 00
- 14 29 26 07 05 04
09 21 25 24 24 22 20
66 69 65 64 65 64 64
44 16 09 21 14 15 17
22 03 17 37 18 16 16
-02 -33 -06 14 -04 -01 -08
- - - - - - -
25 37 23 22 22 17 24
- 20 25 32 10 12 19
- -17 17 -02 05 01 01
-175 -192 -161 -136 -123 -121 -125
- -54 -10 11 17 09 05
- -37 00 28 39 32 29
- -35 -28 -33 -30 -27 -27
- -34 -27 -29 -28 -28 -31
- -45 -34 -38 -31 -29 -32
- 667 693 711 720 724 715
Net lending (+) or borrowing (-) vis-a-vis ROW (c)
(a) Eurostat definition (b) gross saving divided by gross disposable income (c) as a percentage of GDP
Cyclically-adjusted budget balance (c)
Real unit labour cost
Imports (goods and services)
General government balance (c)
Unit labour costs whole economy
Inventories
Terms of trade goods
Table II181
Net exports
Public Consumption
Trade balance (c)
Employment
Annual percentage change2012
GDP
Private Consumption
Exports (goods and services)
GNI (GDP deflator)
Structural budget balance (c)
Saving rate of households (b)
Main features of country forecast - MALTA
Unemployment rate (a)
Gross fixed capital formation
Current-account balance (c)
Contribution to GDP growth
General government gross debt (c)
GDP deflator
Compensation of employees head
of which equipment
Domestic demand
Harmonised index of consumer prices
19 THE NETHERLANDS Economic recovery takes shape after two years of recession
84
2013 the economy turning
In 2013 real GDP contracted by 08 due to weak
economic activity in the beginning of the year and
the negative impact of contraction in 2012 The
quarter-on-quarter economic growth turned
positive in the second and third quarters and
strengthened significantly in the fourth quarter
Growth of 07 was partly driven by exceptional
factors such as high investment in vehicles in
anticipation of a change in taxation as of this year
In 2014 quarterly growth is projected to remain in
positive territory albeit with modest quarterly
increases Real GDP growth is forecast to reach
10 in 2014
The fragile transition towards positive growth in
2013 was chiefly supported by net exports By
contrast domestic demand remained a drag on
activity despite gross fixed capital formation
rebounding in line with an improved business
outlook and is projected to remain sluggish in
2014 Private consumption will be still held back
by the unfavourable development of employment
and the incurred negative wealth effects over the
past years However from the second half of 2013
onwards soft indicators including consumer
confidence have shown an almost continuous
improvement which support an improved
economic outlook In 2014 domestic demand is
expected to gradually move towards positive
territory and to overtake net exports as the main
growth driver In particular investments are
picking up especially in the private sector
Private consumption is forecast to continue
shrinking but at a rate of 05 the decline is much
lower than in the past three years Private
consumption is projected to bottom out towards
the end of 2014 reflecting the positive effects
stemming from a gradually recovering housing
market as well as from lower taxes on labour and
lower pension and health care premiums
Following several years of negative developments
real disposable income is expected to modestly
increase
The forecast improvement of the economic
situation in the euro area provides a boost to Dutch
exports which are expected to grow by 29 in
2014 compared to 13 in 2013 Imports would
pick up in line with final demand Net exports are
expected to show a higher contribution to
economic growth in 2015
-4
-3
-2
-1
0
1
2
3
09 10 11 12 13 14 15
pps
Graph II191 Netherlands - Real GDP growth and
contributions
Inventories Net exports
Dom demand excl invent Real GDP (y-o-y)
forecastforecast
Risks to the macroeconomic scenario stemming
from domestic developments are predominantly on
the downside Higher than expected uncertainties
on the policy side regarding the implementation
and effects of foreseen measures in particular
related to health care and the labour market may
hamper the expected recovery of domestic
demand However a faster stabilisation of the
housing market could provide an additional boost
Initially rising unemployment subdued inflation
Unemployment rose sharply in the beginning of
2013 as a result of declining employment coupled
with an increase in labour supply (added worker
effect) Since mid-2013 the unemployment rate
has been relatively stable but mainly due to a
supply effect as unemployed massively retreated
from the labour market in response to negative
prospects for an economic recovery (discouraged
worker effect) The unemployment rate reached
67 in 2013 In view of the lagged response of
the labour market to the cycle the employment
Economic growth turned positive in the second quarter of 2013 and is projected to gain momentum in
2014 and 2015 Driven mainly by investments in 2014 growth will accelerate in 2015 thanks to rising
household consumption Unemployment is set to level off before slowly decreasing at the end of the
forecast horizon The budget deficit of the government will remain close to 3 of GDP
Member States The Netherlands
85
outlook remains fairly negative The
unemployment rate is forecast to increase in 2014
to 74 mainly as a result of negative
employment developments in the government and
health care sectors The unemployment rate is
projected to only ease slightly in 2015 to 72
In 2012 and most of 2013 HICP inflation stood
close to 3 notably due to higher energy prices
and the increased VAT rate as of October 2012 In
October 2013 inflation fell markedly to 13 as
the previous energy and tax increases dropped out
of the figures In line with the slow pickup in
domestic demand over the forecast horizon
inflation is expected to ease further to 11 in
2014 before increasing slightly to 13 in 2015
Deficit just below 3 of GDP in 2015
In 2014 the general government deficit is expected
to rise slightly to 32 of GDP from 31 in
2013 This rise masks ongoing fiscal tightening as
the 2013 headline deficit figures benefited from
positive one-offs (notably the sale of 4G telecom
licenses) Despite an additional consolidation
package of around 1 of GDP the 2014 general
government deficit would slightly worsen in
nominal terms reflecting sluggish economic
activity and the non-recurrence of temporary fiscal
measures impacting 2013 In addition the decision
to lower natural gas production in the coming
years is expected to have a limited deficit-
increasing impact of about 01 of GDP in both
2014 and 2015 On the back of ongoing
consolidation efforts and the expected
improvement in economic activity the headline
deficit is forecast to decline to 29 of GDP in
2015 Following an improvement of 09 of GDP
in 2013 the structural balance is expected to
stabilise in 2014 and 2015 The gross government
debt ratio is expected to increase from 743 of
GDP in 2013 to around 756 of GDP in 2015
Risks to the fiscal forecast mirror uncertainties on
the macroeconomic outlook However there are
also risks for the expected revenue from some of
the fiscal measures in 2014 (notably the temporary
tax reduction on accrued severance payments) and
planned expenditure savings in 2015
bn EUR Curr prices GDP 94-09 2010 2011 2012 2013 2014 2015
5993 1000 24 15 09 -12 -08 10 13
2733 456 20 03 -11 -16 -21 -05 10
1706 285 28 05 02 -07 -07 03 -09
1020 170 25 -74 61 -40 -49 57 31
358 60 38 -30 95 15 -50 57 40
5276 880 54 116 41 32 13 29 50
4772 796 56 103 42 33 -05 32 50
6050 1009 22 24 28 -06 -09 10 13
22 -11 06 -17 -20 07 07
00 11 01 02 -03 02 01
02 16 02 02 15 01 05
10 -06 05 -03 -12 -04 06
44 45 44 53 67 74 72
33 15 16 19 02 19 13
20 -06 12 29 -03 05 06
-02 -14 00 15 -20 -03 -16
145 105 116 107 102 109 110
22 08 11 13 17 08 22
21 09 25 28 26 11 13
05 -14 02 -04 11 -01 10
63 71 75 77 93 91 98
59 50 74 77 92 91 100
56 45 70 74 89 82 99
-13 -51 -43 -41 -31 -32 -29
-12 -43 -37 -27 -12 -17 -18
- -41 -37 -27 -18 -18 -18
590 634 657 713 743 753 756
Net lending (+) or borrowing (-) vis-a-vis ROW (c)
(a) Eurostat definition (b) gross saving divided by gross disposable income (c) as a percentage of GDP
Cyclically-adjusted budget balance (c)
Real unit labour cost
Imports (goods and services)
General government balance (c)
Unit labour costs whole economy
Inventories
Terms of trade goods
Table II191
Net exports
Public Consumption
Trade balance (c)
Employment
Annual percentage change2012
GDP
Private Consumption
Exports (goods and services)
GNI (GDP deflator)
Structural budget balance (c)
Saving rate of households (b)
Main features of country forecast - NETHERLANDS
Unemployment rate (a)
Gross fixed capital formation
Current-account balance (c)
Contribution to GDP growth
General government gross debt (c)
GDP deflator
Compensation of employees fte
of which equipment
Domestic demand
Harmonised index of consumer prices
20 AUSTRIA Timid recovery expected to gain traction
86
Domestic demand momentum is still low
The Austrian economy decelerated further in 2013
Investment growth turned negative private
consumption stagnated Net exports turned out
slightly better than the year before and helped
avoid a recession
Signs of a recovery are still difficult to detect in
the data available at the start of 2014 On the
whole business and consumer sentiment have
been trending up albeit somewhat inconsistently
Manufacturing orders have been recovering
throughout last year but order-book levels remain
thin Capacity utilisation is still on a subsiding
trend
-4
-3
-2
-1
0
1
2
3
4
-4
-3
-2
-1
0
1
2
3
4
08 09 10 11 12 13 14 15
of GDPpps
Graph II201 Austria - Real GDP growth and
contributions output gap
Output gap (rhs) Inventories
Net exports Dom demand excl invent
Real GDP (y-o-y)
forecast
hellipbut brightening sentiment is expected to start
bearing fruit
The projections for the following two years
assume a consolidation of business and consumer
confidence For 2014 and 2015 growth is
projected to regain some momentum and reach or
exceed 15 driven by a strengthening of
domestic demand Net exports are expected to
contribute positively to growth on the back of
higher export growth but to a smaller extent than
domestic demand due to a rebound in imports
In the environment of the perceived uncertainty
slowing foreign and stagnating domestic demand
that characterised 2012 and 2013 corporations
have been revising investment plans downwards
However low interest rates and solid corporate
liquidity are expected to reassure companies in
carrying out needed replacements and extensions
of capacity Credit growth is expected to remain
subdued though both on account of weak demand
and deleveraging needs in the banking system
The exporting sectors are forecast to benefit from
progressively improving external demand
conditions over the forecast horizon Capitalising
on non-cost competitiveness factors exports of
services have experienced an increase in market
shares in 2013 Manufacturing productivity has
been dented but wage growth has stayed moderate
Unit labour costs have thus increased in line with
those of trading partners leaving cost
competitiveness seemingly unimpaired All in all
the external balance is projected to stay positive
and to provide a positive contribution to growth
Dynamics of prices and wages to remain
stable
Employment growth eased in 2013 reflecting
stagnating output but is expected to strengthen
somewhat in 2014-15 as businesses do not indicate
intentions to shed labour However the increase in
the labour force will likely preclude a sizeable
decline in the unemployment rate in the coming
years
Nominal wage growth hardly exceeded inflation in
the latest quarters The wage settlements
applicable for the coming years are more
moderate However with inflation easing over the
forecast horizon and employment strengthening
real wage growth is projected to support
consumption growth
Consumer price inflation eased to 21 in 2013
due to slowing food and energy prices Energy
prices deflation is expected to help keep inflation
The second half of 2013 saw domestic demand growth resume While signs of a sustained broad-based
recovery are currently still scarce favourable financing conditions an improving external environment
and a stable labour market are expected to boost investment and consumption growth in the course of
2014-15 One-off measures are the main drivers of the reduction in the budget deficit in 2013 while
permanent measures have been taken to limit the deficit increase in 2014
Member States Austria
87
below 2 in 2014-15 Core inflation is also
expected to decelerate marginally thanks to
moderate wage and domestic demand growth
Upward trend in government deficit partially
contained
A sizeable one-off (07 of GDP) arising from the
sale of phone licences is the main driver of the
better-than expected deficit outcome forecast to
reduce to 17 of GDP in 2013 This income
coupled with the revenue from the tax agreement
with Switzerland (03 of GDP) also recorded as
positive one-off has more than offset the negative
impact of the support to the banking sector (06
of GDP) On the other hand low output growth
spurred the deficit in 2013
The government deficit is expected to increase to
21 in 2014 due to additional support required by
Hypo Group (03 of GDP) and to stronger trend
growth of pensions and unemployment
expenditure coupled with weaker growth in tax
revenues In January the new government adopted
a tax-package submitted to Parliaments approval
which is expected to raise revenue by about 02
of GDP in 2014 and 03 in 2015 The main
measures involve closing loopholes in group
taxation reducing deductibility in income taxes
and increasing some indirect taxes such as taxes on
products and car registration tax The effect of
higher expenditure growth and lower trend in
revenue will continue to have an impact in 2015
although the deficit is expected to decline to 18
of GDP
The structural deficit is projected at 15 in 2013
and expected to remain broadly stable in the
forecast horizon The general government debt is
expected to increase in 2013 reaching 746 of
GDP in 2013 while it is projected to start
decreasing in 2014 and further in 2015
This forecast does not include any estimate
regarding the cost stemming from the wind-down
of the Hypo Group which could entail an increase
in the stock of government debt The impact of any
resolution model on the government deficit is still
uncertain and it represents the main downside risk
affecting current deficit projections
bn EUR Curr prices GDP 94-09 2010 2011 2012 2013 2014 2015
3070 1000 21 18 28 09 03 15 18
1690 551 16 20 08 05 -02 08 10
584 190 19 02 03 02 01 08 08
658 214 11 -14 85 16 -07 24 32
251 82 16 21 143 21 -17 33 48
1756 572 53 94 66 12 23 48 60
1657 540 44 91 76 -03 04 46 56
3051 994 21 28 21 09 01 16 19
15 08 22 07 -02 11 13
01 05 08 -06 -07 00 00
05 05 -02 09 11 04 05
05 06 14 13 06 07 08
43 44 42 43 49 48 47
25 12 24 26 23 20 20
09 00 10 30 26 12 10
-05 -14 -10 13 11 -07 -07
- 140 120 126 130 136 141
13 14 20 17 15 19 17
17 17 36 26 21 18 18
-01 -15 -30 -14 05 03 -01
-15 -10 -25 -23 -15 -14 -13
05 36 15 18 29 34 38
04 37 14 16 28 35 38
-24 -45 -25 -25 -17 -21 -18
-24 -36 -24 -24 -13 -17 -17
- -32 -22 -16 -15 -14 -15
653 723 728 740 746 743 737
Net lending (+) or borrowing (-) vis-a-vis ROW (c)
(a) Eurostat definition (b) gross saving divided by gross disposable income (c) as a percentage of GDP
Cyclically-adjusted budget balance (c)
Real unit labour cost
Imports (goods and services)
General government balance (c)
Unit labour costs whole economy
Inventories
Terms of trade goods
Table II201
Net exports
Public Consumption
Trade balance (c)
Employment
Annual percentage change2012
GDP
Private Consumption
Exports (goods and services)
Note Contributions to GDP growth may not add up due to statistical discrepancies
GNI (GDP deflator)
Structural budget balance (c)
Saving rate of households (b)
Main features of country forecast - AUSTRIA
Unemployment rate (a)
Gross fixed capital formation
Current-account balance (c)
Contribution to GDP growth
General government gross debt (c)
GDP deflator
Compensation of employees fte
of which equipment
Domestic demand
Harmonised index of consumer prices
21 POLAND Regaining economic momentum
88
Domestic demand rebounds at last
In the last three months of 2013 real GDP
increased by 22 y-o-y up from 08 in the first
quarter In 2013 as a whole the economy expanded
by 16 in real terms The rebound of aggregate
economic activity was supported by robust export
growth on the back of geographical reorientation
towards dynamic markets and high cost-
competitiveness while sluggish domestic demand
contained import growth Private consumption was
held back by weak albeit recovering consumer
confidence and a relatively high rate of
unemployment Improving external demand led to
a pick-up in industrial output and fuelled corporate
investments offsetting the slowdown in public
investment spending
Recovery gathers steam in 2014 and 2015
The improving economic outlook in the main
trading partners and the resulting pick-up in Polish
exports are set to invigorate private investment and
the labour market which in turn is expected to
support the recovery of private consumption Real
GDP growth is forecast to accelerate to 29 in
2014 and to 31 in 2015 slightly above current
estimates of potential output growth
Private investment is set to remain buoyant over
the forecast horizon alongside the projected
recovery of global demand and private
consumption and on account of an already high
rate of capacity utilisation in the manufacturing
industry Cash accumulated by non-financial
companies and a gradual increase in credit supply
is expected to provide the necessary financing
Against the background of recovering economic
activity and growing employment the
unemployment rate is forecast to fall from 104
in 2013 to 101 in 2015 Coupled with contained
inflationary pressures this improvement is likely
to bolster real disposable income growth
However the saving rate of private households is
set to increase (net of the impact of the reversal of
the systemic pension reform) as consumers are
expected to gradually increase their savings
Overall the annual contribution of net exports to
real GDP growth is forecast is expected to be
significant in 2014 when domestic demand is still
recovering and to turn neutral in 2015 Against
this backdrop the current-account deficit is set to
remain below 2 of GDP
-4
-2
0
2
4
6
8
08 09 10 11 12 13 14 15
Graph II211 Poland - Real GDP growth and
contributions
Inventories Net exports
Dom demand excl invent Real GDP (y-o-y)
forecast
pps
The risks to the forecast are broadly balanced On
the upside a stronger depreciation of the złoty
would further boost exports and enhance import
substitution On the downside higher inflation
might dent real disposable incomes and slow down
private consumption growth
Supply side factors curb inflation
Falling energy prices subdued food prices and
weak domestic demand drove average HICP
inflation down to 08 in 2013 A moderate pick-
is expected in 2014 and 2015 to 14 and 2
respectively inter alia reflecting base effects in
2014 and moderate improvement in domestic
demand
After a marked slowdown in 2012-13 economic activity in Poland picked up at the end of last year as
external demand and economic sentiment improved Domestic demand is expected to overtake net
exports as the main engine of economic growth as unemployment falls and inflation remains contained
The fiscal outlook is set to improve gradually
Member States Poland
89
Underlying fiscal outlook to improve gradually
In 2013 the deficit is forecast to have increased to
44 of GDP up from 39 of GDP in 2012
mainly due to a weak performance of indirect and
direct tax revenues
Over the forecast horizon the profile of the
general government budget balance will be
affected by the reversal of the systemic pension
reform It includes the following asset transfers
from the second pension pillar a one-off transfer
of assets worth 85 of GDP in 2014 as well as
gradual annual transfers of assets of persons who
retire within 10 years starting in 2014 Under the
current accounting rules (ESA95) such asset
transfers are treated as general government
revenue Under the new rules that will come into
force this autumn (ESA2010) such transfers will
not count as revenue anymore
In 2014 the general government budget balance is
projected to turn into a surplus of 5 of GDP
under ESA95 while it is set to post a deficit of
38 with these asset transfers not treated as
revenue Apart from the reversal of the pension
reform the main measures with a positive (and
permanent) effect on general government balance
in 2014 include increases in excise duties a partial
public wage freeze and a gradual increase in the
retirement age The expenditure savings will be
partially offset by the costs of a legislated
extension of maternity leave In 2015 due to the
one-off nature of the large improvement in 2014
the general government budget balance is expected
to return into the red posting a deficit of 29 of
GDP under ESA95 Excluding regular asset
transfers linked to the reversal of the pension
reform the deficit is projected to reach 35 of
GDP in 2015 The structural deficit is estimated to
gradually improve over the forecast horizon from
36 of GDP in 2013 to 24 of GDP in 2015
The general government debt-to-GDP ratio is
forecast to fall from 578 in 2012 to 503 in
2014 mainly as a result of the transfer of pension
fund assets before increasing again to 51 in
2015 The projected debt figures are however
subject to considerable uncertainty in view of
possible valuation effects of the sovereign debt
denominated in foreign currency via exchange rate
fluctuations
bn PLN Curr prices GDP 94-09 2010 2011 2012 2013 2014 2015
15952 1000 46 39 45 19 16 29 31
9804 615 43 31 26 12 08 20 25
2844 178 34 41 -17 02 20 31 26
3054 191 76 -04 85 -17 -04 41 61
1059 66 - -33 116 -39 34 45 72
7447 467 99 121 77 39 47 52 63
7399 464 104 139 55 -07 08 46 66
15282 958 47 35 42 19 17 29 31
48 26 30 04 08 25 32
00 20 07 -06 -10 00 00
-03 -07 09 21 18 04 00
04 -27 06 01 -03 02 04
140 97 97 101 104 103 101
118 82 51 34 28 33 39
72 14 11 15 09 06 12
-13 00 -20 -08 04 -08 -06
- 82 21 48 70 70 55
87 14 32 24 05 14 18
- 27 39 37 08 14 20
-03 -14 -19 -15 -06 -02 -05
-34 -18 -21 -08 05 07 04
-30 -43 -45 -33 -16 -14 -18
-22 -27 -27 -16 03 07 04
-38 -79 -50 -39 -44 50 -29
- -82 -53 -36 -36 57 -24
- -82 -53 -37 -36 -29 -24
- 548 562 556 578 503 510
Net lending (+) or borrowing (-) vis-a-vis ROW (c)
(a) Eurostat definition (b) gross saving divided by gross disposable income (c) as a percentage of GDP
Cyclically-adjusted budget balance (c)
Real unit labour cost
Imports (goods and services)
General government balance (c)
Unit labour costs whole economy
Inventories
Terms of trade goods
Table II211
Net exports
Public Consumption
Trade balance (c)
Employment
Annual percentage change2012
GDP
Private Consumption
Exports (goods and services)
GNI (GDP deflator)
Structural budget balance (c)
Saving rate of households (b)
Main features of country forecast - POLAND
Unemployment rate (a)
Gross fixed capital formation
Current-account balance (c)
Contribution to GDP growth
General government gross debt (c)
GDP deflator
Compensation of employees head
of which equipment
Domestic demand
Harmonised index of consumer prices
22 PORTUGAL Gradual economic recovery
90
Note This forecast was finalised at mid-
December after the tenth review of the
Economic Adjustment Programme and will be
revisited during the eleventh review The text
reflects recent developments
Economic recovery gaining momentum
Following a strong 11 q-o-q expansion in the
second quarter real GDP increased by 02 q-o-q
in the third quarter of 2013 when a negative
growth contribution of net exports was more than
offset by solid growth of domestic demand in
particular private consumption and gross fixed
investment Economic indicators for the last
quarter of 2013 are consistent with a further
stabilisation of the economic recovery towards the
end of last year As a consequence the forecast for
real GDP growth in 2013 was revised upwards
since the autumn forecast by 02 pp to -16 The
projection for the outer years remains broadly
unchanged with real GDP growth rates of 08 in
2014 and 15 in 2015
50
52
54
56
58
60
6
7
8
9
10
11
12
13
14
15
16
17
18
05 06 07 08 09 10 11 12 13 14 15
mn
Labour Force (rhs) Unemployment Rate
forecast
Graph II221Portugal - Labour Market Developments
Labour market situation stabilised in 2013
Total employment expanded by 02 q-o-q in the
fourth quarter of 2013 Much of this increase was
in permanent job contracts suggesting that the
employment gain was not primarily a seasonal
phenomenon Total employment is therefore
expected to expand further at a moderate pace
However the annual average employment growth
is projected to be still negative in 2014 due to a
sizeable negative carry-over effect With a rate of
frac12 employment growth in 2015 is not expected to
bring down the relatively high rate of
unemployment which is expected to stay above
16 in the forecast period
Weak inflationary pressure
HICP inflation declined to 04 in 2013 its lowest
rate since 2009 reflecting subdued domestic
demand and wage restraint in the private sector
Sizeable spare capacities and the expected sluggish
economic recovery in the coming years should
exert downward pressure on profit margins
Consumer prices are therefore projected to
accelerate only slightly to just above 1 in 2015
Current account turning into surplus
The current-account balance is estimated to have
become positive in 2013 at around 05 of GDP
A strong export performance should continue to
support the external adjustment towards the
tradable sector in the forecast period A projected
further improvement in the external balance is set
to exceed the deterioration of the primary income
balance contributing to a widening current-
account surplus over the forecast period
Risks to the economic outlook remain on the
downside
While the baseline projection implies that the
recovery is gradually becoming more entrenched
the pace of the recovery remains conditional on
developments in the euro area and in particular in
Portugalrsquos main trading partners Downside risks
relate to the high levels of private sector
indebtedness which could drag on consumption
and investment activity Portugal remains also
vulnerable to a significant deterioration in the
financial market sentiment linked either to
uncertainties regarding policy implementation by
the Portuguese authorities or a weaker than
expected external environment
The economy seems to have turned the corner in the second half of 2013 showing positive growth rates
for real GDP and employment These positive trends are expected to continue in 2014 and 2015 along
with external rebalancing Portugals recovery remains vulnerable to external risks and its high level of
private sector indebtedness
Member States Portugal
91
Fiscal outlook
The tenth review of the Portuguese adjustment
programme forecast a general government deficit
of 55 of GDP in 2013 (excluding bank
recapitalisation costs 59 including them) On
the back of the latest outturn data an over-
performance and some positive carry-over into
2014 cannot be excluded Budget execution was
supported by robust tax-revenue collection which
more than compensated expenditure growth and
shortfalls on non-tax revenues during the year
The 2014 Budget and other supporting legislation
include discretionary measures worth 23 of
GDP which are expected to bring the headline
deficit down to 4 of GDP The measures are
mostly permanent and expenditure reducing aimed
mainly at the reduction of the public sector wage
bill reforms of the public pension systems and
expenditure cuts across line ministries The
remaining effort is expected to be achieved
through smaller-scale measures worth 05 of
GDP including some one-off operations The
forecast is also underpinned by the measures that
the Government has taken to replace the provision
of the pension reform ruled unconstitutional in
December 2013 worth about 02 of GDP In
2015 the fiscal balance is expected to reach -25
of GDP in 2015 The forecast is based on the
assumption of discretionary measures worth about
12 of GDP which the Government plans to
specify in the context of the Reform of the State
These projections are consistent with a cumulated
improvement in the structural balance of 25 of
GDP over 2013-15
The debt-to-GDP ratio is expected to peak at
nearly 129frac12 in 2013 and to decline thereafter
The upward revision vis-agrave-vis the autumn forecast
is mostly explained by a substantial increase in the
Treasurys cash balance at the end of the year
Downside risks to the fiscal projection are mostly
of legal nature as key elements of the 2014 budget
have been submitted to the Constitutional Court
for review In addition implementation risks
remain elevated in light of the ambitious reform
package On the other hand a tax-richer
environment might boost revenue collection
beyond the budgeted levels The fiscal outlook will
be revisited at the eleventh programme review
bn EUR Curr prices GDP 94-09 2010 2011 2012 2013 2014 2015
1651 1000 19 19 -13 -32 -16 08 15
1085 657 21 25 -33 -53 -18 01 08
301 182 26 01 -50 -47 -20 -25 -19
265 160 16 -31 -105 -144 -80 12 37
82 50 33 -26 -112 -98 16 60 77
639 387 48 102 69 32 58 50 53
649 393 49 80 -53 -66 26 30 38
1606 972 16 26 -15 -23 -10 00 09
23 10 -53 -70 -28 -02 07
00 09 -02 00 00 01 00
-05 00 42 38 12 08 07
05 -15 -15 -42 -32 -04 04
71 120 129 159 165 168 165
46 20 -06 -20 27 -08 10
32 -14 -09 -30 10 -19 -01
00 -21 -11 -27 -07 -28 -11
- 101 97 120 124 118 114
33 06 03 -03 17 09 10
28 14 36 28 04 08 12
02 01 -10 02 11 10 04
-102 -106 -77 -47 -36 -28 -22
-86 -104 -72 -22 04 08 11
-67 -90 -56 -01 23 27 30
-47 -98 -43 -64 -59 -40 -25
-48 -94 -34 -47 -37 -25 -18
- -87 -64 -40 -36 -26 -18
610 940 1082 1241 1294 1266 1258
Net lending (+) or borrowing (-) vis-a-vis ROW (c)
(a) Eurostat definition (b) gross saving divided by gross disposable income (c) as a percentage of GDP
Cyclically-adjusted budget balance (c)
Real unit labour cost
Imports (goods and services)
General government balance (c)
Unit labour costs whole economy
Inventories
Terms of trade goods
Table II221
Net exports
Public Consumption
Trade balance (c)
Employment
Annual percentage change2012
GDP
Private Consumption
Exports (goods and services)
GNI (GDP deflator)
Structural budget balance (c)
Saving rate of households (b)
Main features of country forecast - PORTUGAL
Unemployment rate (a)
Gross fixed capital formation
Current-account balance (c)
Contribution to GDP growth
General government gross debt (c)
GDP deflator
Compensation of employees head
of which equipment
Domestic demand
Harmonised index of consumer prices
23 ROMANIA Export-led rebound turning into a more broad-based recovery
92
Stable outlook for growth and exports
Real GDP growth in 2013 has come out at 35
thanks to a strong export performance driven by a
robust industrial output and an abundant harvest
Growth is forecast to decelerate in 2014 to 23
before slightly recovering to 25 in 2015 It is
projected to remain above potential over the
forecast horizon reflecting improved confidence
and more supportive international conditions but
also the payoff of product and labour market
reforms implemented under the financial support
programmes Growth drivers are expected to
gradually switch from (net) exports to domestic
demand over the forecast horizon
Rebalancing of growth towards investment
Investment is projected to regain momentum
supported by better absorption of EU funds(20)
as
major infrastructure projects gain traction Credit
growth stayed in negative territory in 2013 It is
expected to remain constrained by households
ongoing needs to repair their balance sheets and by
the deleveraging process of the banking sector
after a long period of deteriorating asset quality
-20
-15
-10
-5
0
5
10
15
08 09 10 11 12 13 14 15
pps
Graph II231 Romania- Real GDP growth and
contributions
Inventories Net exports
Dom demand excl invent Real GDP (y-o-y)
forecast
(20) EU structural and cohesion funds absorption increased in
2013 to reach 337 at end-December 2013
hellipand moderate improvement in private
consumptionhellip
Private consumption is projected to pick up
moderately on the back of improving consumer
confidence and increasing disposable income as
employment grows and real wages are expected to
increase by up to 3 in 2014
hellipsupport a gradual pick up in imports
The growth contribution of net exports is forecast
to fade out in 2014 and turn negative in 2015
Imports are projected to pick up over the forecast
horizon alongside domestic demand slightly
outpacing export growth in 2015 Nonetheless the
external environment is expected to improve and
to support continued albeit slower export growth
This follows a strong trade balance adjustment of
41 of GDP in 2013 on account of both strong
exports and subdued imports
Historically low inflation expected in the first
half of 2014
HICP inflation sharply declined in the second half
of 2013 to reach 13 (y-o-y) in December This
can be ascribed to a very good harvest a reduction
in VAT on flour and bakery products (applied in
September 2013) and lower inflation expectations
Annual average inflation is projected to decelerate
from 32 in 2013 to 24 in 2014 mainly due to
falling food prices leading to historical lows in the
first half of 2014 It is expected to return to the
upper part of the central banks target band
(25plusmn1pp) in the second half of the year In
2015 a gradual recovery in domestic demand and
continued price convergence towards the EU
average are expected to translate into higher
inflation averaging 34
Limited prospects for labour market
improvement in 2014
In 2013 the unemployment rate has risen
somewhat to 72 It is expected to remain at
broadly the same level in 2014 before coming
In 2013 strong growth of 35 was driven by exports and an abundant harvest A gradual rebalancing
of growth towards domestic demand is expected in 2014 and 2015 with real GDP growth forecast to be
above 2 Annual average inflation is projected to decelerate to 24 in 2014 while unemployment is
expected to decrease only in 2015 The fiscal adjustment is forecast to continue
Member States Romania
93
down slightly in 2015 when policy measures
especially those targeted at youth unemployment
would start showing effects While the number of
employment contracts marginally increased in
2013 the number of self-employed fell leaving
overall employment broadly unchanged in 2013
Given the expected slowdown in GDP growth in
2014 employment is projected to grow only
slowly Compensation per employee has grown
moderately in 2013 driven by public sector wage
increases The trend is projected to be reversed in
2014 with private sector compensation growth
overtaking the public sector The increase in the
minimum wage notwithstanding overall
compensation growth is forecast to remain
moderate
Fiscal adjustment to continue
The budget deficit in Romania is estimated to have
been reduced to 26 of GDP in 2013 from 3 in
2012 It is slightly higher than previously
projected as it accommodates higher co-financing
expenditure to support EU funds absorption
For 2014 the budget deficit is forecast at 22 of
GDP higher than previously projected again
reflecting higher co-financing expenditure for EU
funds The projection includes the indexation of
pensions foreseen by law a two-step increase in
the minimum wage from 800 to 900 RON and
another limited and targeted raise in public sector
salaries On the revenue side the forecast takes
into account the inflation indexation of excise
duties the excise rate hike for energy products
and the broadening of the basis for property tax
For 2015 benefiting from the expected
acceleration in economic activity and based on the
customary no-policy-change assumption the
deficit is projected to decrease further to 18 of
GDP The structural budget balance is expected to
mildly improve over the forecast horizon by about
05 of GDP Government debt is forecast to peak
at just above 39 of GDP in 2014
The main risks to the budget relate to (i) less tax-
rich growth associated with weak domestic
demand (ii) reduced expenditure control and
(iii) limited progress with restructuring state-
owned enterprises that could result in renewed
pressure on the budget
bn RON Curr prices GDP 94-09 2010 2011 2012 2013 2014 2015
5867 1000 32 -11 22 07 35 23 25
3729 636 57 -03 11 11 09 15 25
890 152 08 -47 02 17 -15 18 15
1543 263 70 -18 73 49 -27 34 45
598 102 78 -191 236 41 -20 35 45
2385 406 102 132 103 -30 136 57 63
2661 454 123 111 100 -09 29 50 73
5762 982 32 -10 21 02 25 23 26
61 -15 27 29 -04 21 29
-09 04 -01 -14 -03 00 00
-19 00 -05 -08 42 02 -05
-21 -03 -08 13 02 04 07
64 73 74 70 72 72 71
433 -33 -41 83 58 56 45
359 -24 -68 90 24 36 27
-03 -77 -106 42 -12 07 -01
- -38 -70 -62 -59 -51 -63
363 57 42 46 36 29 27
- 61 58 34 32 24 34
21 10 26 32 -03 -07 -01
-75 -61 -56 -56 -24 -25 -29
- -44 -45 -44 -10 -12 -16
-58 -42 -39 -30 00 -03 -07
- -68 -55 -30 -26 -22 -18
- -60 -50 -20 -21 -18 -16
- -61 -38 -25 -21 -18 -16
- 305 347 380 383 393 392
Net lending (+) or borrowing (-) vis-a-vis ROW (c)
(a) Eurostat definition (b) gross saving divided by gross disposable income (c) as a percentage of GDP
Cyclically-adjusted budget balance (c)
Real unit labour cost
Imports (goods and services)
General government balance (c)
Unit labour costs whole economy
Inventories
Terms of trade goods
Table II231
Net exports
Public Consumption
Trade balance (c)
Employment
Annual percentage change2012
GDP
Private Consumption
Exports (goods and services)
GNI (GDP deflator)
Structural budget balance (c)
Saving rate of households (b)
Main features of country forecast - ROMANIA
Unemployment rate (a)
Gross fixed capital formation
Current-account balance (c)
Contribution to GDP growth
General government gross debt (c)
GDP deflator
Compensation of employees head
of which equipment
Domestic demand
Harmonised index of consumer prices
24 SLOVENIA Easing market tensions but deleveraging still ongoing
94
Gradual export-led recovery ahead
Despite the strong negative carry-over from the
previous year better-than-expected quarterly
outturns in 2013 have eased the pace of real GDP
contraction from 25 in 2012 to an expected
16 in 2013 The growth outlook for 2014 and
2015 is revised upwards to -01 and 13
respectively as export growth picks up while
domestic demand is still dampened by the ongoing
deleveraging process The ensuing increasing
current-account surplus is thus partly cyclical and
driven by the ongoing rebalancing of the economy
-8
-6
-4
-2
0
2
4
6
8
10
2010 2011 2012 2013 2014 2015
Graph II241 Slovenia - Real GDP growth and
contributions
Private consumption Gov consumption
GFCF - construction GFCF - equipment
Change in inventories Exports
Imports Real GDP (y-o-y)
forecast
pps
Consumer confidence worsened again in the last
quarter of 2013 with retail sales continuing to fall
year-on-year Private consumption retains a very
negative outlook for 2014 due to expectations of
further declines in employment and wages and is
projected to only stabilise in 2015
Although investment in 2013 was supported by
one-offs and EU-funded local projects the trend
for the year as a whole remained negative
mirroring the ongoing deleveraging Financial
market tensions eased at year-end following the
completion of the bank asset quality review and
stress test and the recapitalisations of the two
largest state-owned banks Financing conditions
for corporates are nevertheless expected to remain
constrained while balance sheets of domestic
banks are still being repaired In addition low
profit expectations and further corporate
restructuring needs continue to soften credit
demand A fragile recovery in investment is
expected to start only in the second half of 2014
driven by the need to rebuild production capacity
Positive data in the first three quarters of 2013
prompted an upward revision of the export
forecast not matched by equivalent import growth
The external side is expected to continue to sustain
the recovery though with a somewhat muted
contribution in 2015 linked to the gradual pick-up
in domestic demand
Risks to the growth forecast are tilted to the
upside related to easing financing conditions and
accelerating investment which in turn hinge upon
the speed of the required restructuring and timely
implementation of the announced privatisations
Labour market and price developments
The lagged adjustment in the labour market is
expected to continue in 2014-15 with wages
projected to remain subdued in 2014 and rise
moderately in 2015 Public sector wages are
temporarily affected by a court ruling which
repealed the postponement of an increase due in
2010 accounted for in 2013 but effective in 2014-
15 The profile of deflators for GDP and
government consumption over 2013-14 is also
affected by these wage arrears Both HICP and
core inflation are set to continue declining until the
end of 2014 also reflecting the fading out of the
July 2013 increase in VAT rates and pick up
steadily over 2015
Bank support weighs on government finances
The general government deficit is estimated to
increase from 38 in 2012 to 149 of GDP in
2013 (37 without the impact of one-off
measures mostly to recapitalise banks) The
positive budgetary impact of the higher VAT rates
Positive quarterly outturns in 2013 have reduced the pace of the recession A fragile recovery is
expected to start in the second half of 2014 supported by improving market conditions Lending to the
private sector remains restrained by the ongoing deleveraging in both financial and non-financial
corporations With subdued private consumption the external side is expected to be the key driver of the
recovery The support to banks provided in 2013 largely explains the temporary surge in the deficit
Member States Slovenia
95
cuts to public wages and social benefits adopted in
2013 are estimated to have been largely offset by
higher interest and pension expenditure The ruling
on the public wage repeal and the new law
providing for the compensation of persons
removed from the register of residents after
independence added 09 pp of GDP to the one-off
deficit-increasing measures
-5
0
5
10
15
20
2009 2010 2011 2012 2013 2014 2015
Graph II242 Slovenia - Determinants of debt
dynamics
Gov balance net of one-offs One-off measures
Snow-ball effect Stock-flow adjustment
Change in gov debt
forecast
of GDP
For 2014 the recapitalisation of the third-largest
state owned bank Abanka which is subject to
state aid approval is set to add 07pp of GDP to
the underlying deficit of 33 The real estate tax
introduced on 1 January 2014 and the temporary
de-indexation of personal income tax allowances
and tax brackets are set to increase the tax burden
Without new budgetary measures ie under the
no-policy-change assumption the deficit would
stand at 33 of GDP in 2015
However the structural balance is estimated to
improve by only around 23 pp over 2013-14 to
-2 of GDP then based on existing policies will
revert to -25 of GDP in 2015 Public debt is set
to have increased to 719 of GDP in 2013 from
544 in 2012 reflecting bank recapitalisations
and the transfer of non-performing loans to the
Bank Asset Management Company in December
2013 as well as negative output growth The debt
is forecast to increase to 78 in 2015 mainly due
to primary deficits including a further announced
bank recapitalisation subdued growth and higher
debt servicing costs The forecast does not include
receipts from privatisations and the planned
auction of network frequencies
bn EUR Curr prices GDP 94-09 2010 2011 2012 2013 2014 2015353 1000 35 13 07 -25 -16 -01 13
201 569 34 15 08 -48 -35 -20 -01
73 208 32 13 -16 -13 -27 -16 03
63 178 60 -153 -55 -82 -39 -21 07
27 76 76 -93 142 -83 -41 -07 12
269 761 62 102 70 06 29 38 45
252 713 66 74 56 -47 02 17 33
349 989 34 17 09 -26 -20 -03 12
38 -24 -09 -45 -32 -18 01
00 19 06 -18 -04 00 00
-02 18 10 38 20 17 12
- -22 -16 -08 -20 -11 -03
- 73 82 89 102 108 107
- 39 16 -10 10 -03 09
- 04 -07 08 07 -13 -07
- 15 -19 05 -09 -19 -20
- 129 121 119 135 148 154
76 -11 12 02 16 07 13
- 21 21 28 19 08 13
04 -48 -16 -12 00 08 00
-38 -24 -27 -04 10 27 36
-15 -02 02 31 49 69 78
-16 -01 00 29 49 75 86
- -59 -63 -38 -149 -39 -33
- -47 -58 -26 -135 -27 -25
- -47 -48 -26 -22 -20 -25
- 387 471 544 719 754 780
Net lending (+) or borrowing (-) vis-a-vis ROW (c)
(a) Eurostat definition (b) gross saving divided by gross disposable income (c) as a percentage of GDP
Cyclically-adjusted budget balance (c)
Real unit labour cost
Imports (goods and services)
General government balance (c)
Unit labour costs whole economy
Inventories
Terms of trade goods
Table II241
Net exports
Public Consumption
Trade balance (c)
Employment
Annual percentage change2012
GDP
Private Consumption
Exports (goods and services)
GNI (GDP deflator)
Structural budget balance (c)
Saving rate of households (b)
Main features of country forecast - SLOVENIA
Unemployment rate (a)
Gross fixed capital formation
Current-account balance (c)
Contribution to GDP growth
General government gross debt (c)
GDP deflator
Compensation of employees head
of which equipment
Domestic demand
Harmonised index of consumer prices
25 SLOVAKIA Growth to pick up in 2014
96
Gradual recovery expected in 2014hellip
After robust growth in 2012 the Slovak economy
slowed down in 2013 with real GDP increasing by
08 Domestic demand continued to act as a drag
on growth mainly due to still falling investment
and stagnating private consumption Net exports
continued to grow albeit at a slower pace and
remained the main contributor to the overall
positive growth rate Over the forecast horizon
domestic demand is expected to recover and play a
leading role in generating growth that is projected
to accelerate to 23 in 2014 and 32 in 2015
The unemployment rate will stay above 13
-10
-5
0
5
10
08 09 10 11 12 13 14 15
pps
Graph II251 Slovakia- Real GDP growth and
contributions
Dom demand excl invent Net exports
Inventories Real GDP (y-o-y)
forecast
hellipas domestic demand becomes the main
driver of growth
Following a strong rise in the second quarter of
2013 in the third quarter household consumption
fell by 04 q-o-q As a consequence private
consumption is expected to decline slightly for the
year as a whole Nevertheless consumer
confidence has steadily improved over the second
half of 2013 reflecting a marked improvement in
households expectations about the future and is
now above its long-run average Given the likely
rise in real disposable income due to lower-than-
expected inflation and some improvements on the
labour market private consumption is set to
increase gradually in 2014 and 2015
Investment collapsed at the beginning of 2013 and
remained weak for the first three quarters of the
year Despite an expansion in equipment in the
automotive industry in the fourth quarter
investment continued to decrease over the year as a
whole The credit outlook for firms remains poor
as the net flow of loans to non-financial
corporations was negative in 2013 While a
positive impulse is foreseen from motorway
construction investment is projected to stagnate in
2014 and a more substantial pickup is only
expected in 2015
Very strong export growth in the second quarter of
2013 led to a correction in the third quarter as
exports declined Nevertheless exports of both
goods and services are projected to have increased
in the last quarter of 2013 Export growth in 2014
and 2015 will be boosted by declining export
prices and improving demand in Slovakias main
trading partners Imports are expected to increase
in line with exports and for 2014 and 2015 net
exports are likely to give way to domestic demand
as the main driver of growth
The country-specific risks to the forecast are
balanced Downside risks could come from
possible delays in the implementation of large
infrastructure projects Residential construction
poses upside risks as residential property prices
seem to have bottomed out in 2013 and loans to
households have been growing at a robust rate
Inflation decreases in 2014
Inflation decreased significantly in the second half
of 2013 mainly due to the continued fall in energy
prices while pressures in the prices of foodstuff
especially unprocessed food abated Given
declining commodity prices the envisaged
reduction of regulated energy prices for
households and weak demand-pull pressures
inflation as measured by the HICP is projected to
be only 07 in 2014 For 2015 given the foreseen
recovery in domestic demand inflation is expected
to increase to 16
The Slovak economy slowed down in 2013 but growth is expected to gather pace reaching 23 in 2014
and 32 in 2015 The composition of growth will become more balanced as the main driving force
shifts from net exports to domestic demand Employment will grow only modestly over the forecast
horizon and inflation will remain low
Member States Slovakia
97
Public finances at a critical juncture
The general government deficit in 2013 is
estimated to have reached 25 of GDP Higher-
than-budgeted VAT collection together with
lower-than-budgeted public investment is expected
to have contributed to this result Moreover a pay-
out of dividends originally planned for 2014 took
place already in 2013 The deficit outcome may be
affected by the classification currently under
examination by Eurostat of the governments sale
of emergency oil reserves in national accounts
The pick-up in household consumption and
improved collection of VAT as a result of the
measures to fight tax fraud are projected to
support tax revenues in 2014 The net effect of the
introduction of a minimum lump-sum payment for
the corporate income tax and the parallel reduction
in the corporate income tax rate by 1 pp is
projected to be marginally positive Moreover the
special levy on high-profit companies operating in
a regulated environment originally envisaged to
expire in 2013 was retained The sale of telecom
licenses will be an additional (one-off) revenue
source On the expenditure side measures to
achieve envisaged large savings in the healthcare
sector have not been sufficiently specified In
addition major savings from the reform of the
public administration (ESO) are subject to
implementation risks Therefore the savings
projected by the government are not taken on
board in full in 2014
Overall also due to the fact that the impact of one-
off measures in 2014 is lower than initially
envisaged and lower than in 2013 on current
policies the headline deficit is expected to increase
again to 33 of GDP in 2014
A slight deterioration in the headline deficit is
projected 2015 as the growth in tax revenue
supported by faster economic activity will not
compensate for the expiry of the one-off revenues
of 2014 and for the planned reduction in the VAT
rate by 1 pp (conditional upon the deficit outcome
in 2013) While the structural balance improved in
2013 it is set to slightly worsen afterwards
The general government debt is estimated to rise
above 58 of GDP by the end of the forecast
horizon assuming that the planned sale of
governments shares in the telecom sector in 2015
will be used for debt reduction
bn EUR Curr prices GDP 94-09 2010 2011 2012 2013 2014 2015
711 1000 45 44 30 18 08 23 32
410 577 - -07 -05 -02 -01 12 23
125 176 25 10 -43 -11 13 56 34
143 201 29 65 142 -105 -67 02 33
68 96 - 117 383 -115 -60 -28 34
687 966 80 160 122 99 35 48 62
650 914 69 149 97 33 20 45 60
694 976 45 26 34 16 09 21 32
38 11 19 -27 -12 17 26
02 26 -08 -14 05 00 00
04 07 20 59 15 06 06
- -15 18 01 -08 05 07
- 145 137 140 142 139 134
- 51 20 28 09 29 30
- -09 08 10 -08 12 05
- -14 -08 -02 -14 05 -05
- 103 94 82 79 77 77
52 05 16 13 06 07 10
- 07 41 37 15 07 16
- -08 -15 -13 -06 -01 -05
-52 08 10 47 54 52 51
-54 -37 -26 16 20 19 23
-54 -21 -09 31 32 36 37
-55 -77 -51 -45 -25 -33 -34
- -74 -45 -38 -13 -21 -25
- -73 -49 -39 -23 -25 -25
- 410 434 522 543 578 584
Net lending (+) or borrowing (-) vis-a-vis ROW (c)
(a) Eurostat definition (b) gross saving divided by gross disposable income (c) as a percentage of GDP
Cyclically-adjusted budget balance (c)
Real unit labour cost
Imports (goods and services)
General government balance (c)
Unit labour costs whole economy
Inventories
Terms of trade goods
Table II251
Net exports
Public Consumption
Trade balance (c)
Employment
Annual percentage change2012
GDP
Private Consumption
Exports (goods and services)
GNI (GDP deflator)
Structural budget balance (c)
Saving rate of households (b)
Main features of country forecast - SLOVAKIA
Unemployment rate (a)
Gross fixed capital formation
Current-account balance (c)
Contribution to GDP growth
General government gross debt (c)
GDP deflator
Compensation of employees head
of which equipment
Domestic demand
Harmonised index of consumer prices
26 FINLAND Nascent recovery with consolidation needs ahead
98
Broad-based recession in 201213
In 2013 Finlands economy was in recession for
the second year Real GDP dropped by -15 after
having decreased by -1 in 2012 The GDP
decline was broad-based affecting consumer
spending exports and particularly investments
Net external demand contributed positively to
growth due to the strong decline in imports This
partly offset the negative contribution related to
the strong decline in domestic demand
Unemployment continued to climb gradually
ending the year at 84 back to the level last
recorded in 2010 when the economy was just
recovering from the 2009 crises
Gradual improvement ahead
Although towards the end of 2013 economic
sentiment started improving the economic activity
declined again in the final quarter Signals given
by leading indicators still do not point to a
recovery in domestic demand in the near future
An improving economic outlook for Finlands
main export markets with the notable exception of
Russia portends an export-driven recovery in
2014 Still growth is projected to remain tepid
and influenced by negative growth momentum
over the course of 2013 to reach 02 for the year
as a whole before accelerating to 13 in 2015
Moderate wage growth and persistent
unemployment are weighing on disposable
income limiting the growth of private
consumption Gross fixed capital formation is
forecast to pick up only gradually as equipment
investment is held back by low capacity utilisation
and the limited number of building permits
indicates a sluggish construction activity at least
for 2014 Supply conditions continue to be
influenced by industrial restructuring New
products and services in sectors such as chemicals
and metals are gradually replacing production lost
in ICT and paper industry
Exports are forecast to increase over 2014-15 even
though Finland is projected to lose further export
market shares Also the moderate wage agreement
is a first step in restoring cost competiveness In
turn weak domestic demand limits imports
resulting in a positive growth contribution from net
exports Consequently the current-account balance
is expected to continue improving reaching
positive territory in 2014
-10
-8
-6
-4
-2
0
2
4
6
08 09 10 11 12 13 14 15
pps
Graph II261 Finland - Real GDP growth and
contributions
HH consumpt Gov consumpt
Net exports Inventories
GFCF Real GDP (y-o-y)
forecast
Risks to the economic outlook are balanced and
mainly related to developments in export markets
Risks arising from financial market conditions
appear limited and funding costs low
Labour market weak inflation slowing
Labour market conditions started to worsen in late
2012 and this process has continued during 2013
with both the number of employed persons and
hours worked declining and the unemployment
rate increasing The number of registered
unemployed is increasingly higher than the survey-
based unemployment this indicates that when
labour market conditions improve the number of
active jobseekers might increase and the survey-
based unemployment rate would remain elevated
Therefore the unemployment rate is set to remain
broadly stable over the forecast horizon despite the
gradual economic improvement The collective
wage agreement for 2014-15 provides for
moderate wage growth resulting in a lower
increase in unit labour costs than in the previous
Amid the ongoing restructuring of the economy consumers remain cautious and investment is only
gradually gaining strength The expected tepid recovery in 2014-15 is largely dependent on
developments in export markets Disposable income grows slowly holding back consumption General
government deficit remains above 2 over the forecast horizon and the debt ratio is set to exceed 60
Member States Finland
99
years However the wage restraint needs time to
translate into positive employment growth
Despite the consumption tax increase in 2013
inflation receded to 22 From 2014 new indirect
tax increases are applied but due to lower wage
increases falling energy prices and a stabilisation
of prices for processed food and services inflation
is set to decline further to 17 in 2014 and 16
in 2015
Public sector deficit continues to be high
Amid the worsened economic environment the
general government deficit widened despite the
adjustment measures taken in 2013 from -18 of
GDP in 2012 to -24 in 2013 The deficit is
forecast to increase further in 2014 before
improving to -23 of GDP in 2015
Due to the persisting primary deficit and low
nominal GDP growth the debt-to-GDP ratio is
forecast to go slightly above the 60 threshold in
2014 and increase further in 2015 The debt
increase is higher than the annual fiscal deficits
would suggest as the surpluses in social security
funds are not used to reduce central government or
local government debt Debt issuance is carried out
by the treasury based on the market conditions
and the existence of liquid reserves allows for
some flexibility in the decisions to issue new debt
The government is focusing on the implementation
of the structural reforms programme concerning
labour market government efficiency and business
environment in order to bring the level of public
debt down in the medium term and to stimulate
economic growth Expenditure ceilings are used to
control the development of public expenditure and
further revenue increasing measures were
introduced from the beginning of 2014 However
the tax burden is now reaching historic heights
The output gap is estimated at -28 in 2013 and
-26 in 2014 This results in a projection for the
structural balance of -09 of GDP in 2013 and
-12 in 2014 In 2015 the structural balance is
forecast to reach -14 of GDP as the output gap
declines to -16
bn EUR Curr prices GDP 94-09 2010 2011 2012 2013 2014 2015
1924 1000 28 34 28 -10 -15 02 13
1085 564 29 33 25 03 -10 -02 14
483 251 17 -04 05 05 -08 -07 09
379 197 38 17 58 -08 -44 -10 17
102 53 45 -122 105 140 -37 -06 19
781 406 60 79 28 -02 -04 34 44
800 416 61 68 62 -07 -15 20 44
1933 1005 33 33 16 -08 -15 02 12
26 20 26 01 -17 -05 13
01 08 15 -09 -02 02 -01
05 05 -13 02 04 05 00
12 -01 15 01 -06 00 03
103 84 78 77 82 83 81
32 18 32 35 24 16 16
16 -16 19 46 33 13 07
-01 -20 -08 16 04 -08 -13
87 107 87 86 105 111 102
17 03 27 29 29 22 20
16 17 33 32 22 17 16
-06 -26 -22 -17 12 00 00
74 14 -07 00 00 05 05
49 17 -15 -14 -02 05 04
50 18 -13 -13 -01 06 05
14 -25 -07 -18 -24 -25 -23
14 -11 -06 -10 -09 -12 -14
- -10 -05 -10 -09 -12 -14
456 487 492 536 572 604 620
Net lending (+) or borrowing (-) vis-a-vis ROW (c)
(a) Eurostat definition (b) gross saving divided by gross disposable income (c) as a percentage of GDP
Cyclically-adjusted budget balance (c)
Real unit labour cost
Imports (goods and services)
General government balance (c)
Unit labour costs whole economy
Inventories
Terms of trade goods
Table II261
Net exports
Public Consumption
Trade balance (c)
Employment
Annual percentage change2012
GDP
Private Consumption
Exports (goods and services)
Note Contributions to GDP growth may not add up due to statistical discrepancies
GNI (GDP deflator)
Structural budget balance (c)
Saving rate of households (b)
Main features of country forecast - FINLAND
Unemployment rate (a)
Gross fixed capital formation
Current-account balance (c)
Contribution to GDP growth
General government gross debt (c)
GDP deflator
Compensation of employees head
of which equipment
Domestic demand
Harmonised index of consumer prices
27 SWEDEN Rebounding from a soft patch
100
Economic recovery ahead
After a weak growth performance in 2013 the
Swedish economy now follows a more robust
growth track and economic activity is expected to
gradually accelerate GDP growth is forecast to
gradually increase to 25 in 2014 and to 33 in
2015 after 09 growth in 2013 Economic
sentiment has steadily improved during the course
of 2013 underpinning the projection for a more
solid economic growth over the forecast horizon
While household consumption was the main
component to sustain the modest GDP growth in
2013 and is expected to stay strong rebounding
investments are forecast to provide an additional
impetus to economic growth over the forecast
horizon
Consumption growth remains robust
Household consumption is likely to accelerate in
2014 and 2015 as improving labour market
conditions low interest rates and income tax cuts
boost disposable incomes Household saving is
projected to have reached a new peak in 2013 but
will gradually decline in the forthcoming years as
economic uncertainties are waning unemployment
is starting to decrease at a more robust pace and
baby-boomers retire
Despite sluggish economic growth last year the
labour market proved to be resilient employment
continued to increase in 2013 while the
unemployment rate stayed flat As a fall in
unemployment follows GDP growth only with
some time lag a more substantial drop in the
unemployment rate is expected from the second
half of 2014 Taking also into account the
increasing labour force the unemployment rate is
forecast to decrease to 77 in 2014 and to 73
in 2015
Rebounding investments a new engine of
economic growth
Following a decline in investments in 2013 gross
fixed capital formation is expected to rebound
sharply in the coming years adding a new engine
to economic growth Notably construction is likely
to pick up following several years of depressed
levels
Net exports will stay flat
In light of the weakness of the main European
trading partners and the appreciating krona
Swedish export remained sluggish in 2013
Despite the relatively strong household
consumption imports are expected to shrink
similarly to exports Over the forecast horizon
with more solid economic growth of the main
trading partners (most importantly in Europe) both
export and import will resume Compared to
previous recovery periods net exports will only
contribute little to GDP growth if at all
The main risks highlighted in the previous
forecasts remain valid A correction in the high
level of private debt a fall in house prices or
dynamically rising repo rates could dampen
household consumption A sharply appreciating
krona could suppress exports performance and also
negatively impact investments
-6
-4
-2
0
2
4
6
8
04 05 06 07 08 09 10 11 12 13 14 15
Graph II271 Sweden - Real GDP growth and
contributions
Output gap ( of pot GDP) Net exports
Inventories Investment
Consum (pr + publ) Real GDP (y-o-y)
forecast
pps
Following sluggish economic growth of 09 in 2013 the Swedish economy is expected to pick up
gradually and grow by 25 this year and 33 next year While private consumption will remain an
important driver rebounding investment will provide additional impetus to GDP growth By contrast
the contribution of net exports is expected to remain marginal
Member States Sweden
101
Low inflation on the horizon
HICP inflation dropped significantly from 09 in
2012 to 04 in 2013 The Riksbank cut the repo
rate to 075 in December 2013 and the timing of
initial tightening has been postponed until the first
quarter of 2015 At this stage no particular upward
pressure is foreseen from any HICP component
and wage developments are projected to remain at
a moderate level HICP is expected to reach 09
in 2014 and accelerating to 18 in 2015 Inflation
is likely to moderately increase on the back of the
rebounding economy
General government budget provides stimulus
in 2014
Fiscal stimuli (focusing on corporate taxation
raising disposable incomes labour market
incentives and infrastructure investments) will
increase the budget deficit from -11 of GDP in
2013 to -15 of GDP in 2014 In light of the
stronger GDP growth as well as the budget surplus
target and the nominal expenditure ceiling
embedded in the Swedish fiscal framework no
further stimulus is expected after 2014
Accordingly the general budget deficit is projected
to shrink to -08 of GDP by 2015 The structural
balance will deteriorate by 07 of GDP from
2013 turning negative in 2014 (-06 of GDP)
due to the expansionary fiscal policy and the
narrowing of the output gap The deficit will
remain moderate and will slightly improve in 2015
(-04 of GDP)
The declining trend in the general government debt
has been reversed in 2013 by a one-off measure
an additional SEK 100 billion (approximately
28 of GDP) has been borrowed in order to
strengthen the currency reserves of the Riksbank
raising debt to 413 of the GDP in 2013 The
general government debt is still at a relatively low
level compared with other EU countries and will
further decline from 2015 onwards amidst a lower
budget deficit and accelerating growth
bn SEK Curr prices GDP 94-09 2010 2011 2012 2013 2014 2015
35497 1000 25 66 29 09 09 25 33
17182 484 23 40 17 16 19 27 33
9557 269 07 21 08 03 12 09 07
6742 190 38 72 82 33 -10 47 68
2684 76 62 119 132 52 -26 53 79
17224 485 58 114 61 07 -15 28 54
15164 427 51 120 71 -06 -19 37 56
36402 1025 29 69 29 12 09 23 31
20 38 25 15 10 24 31
00 22 05 -12 -02 02 00
06 05 -01 06 01 -02 02
05 10 21 07 09 09 10
75 86 78 80 80 77 73
37 31 09 31 24 28 31
17 -23 01 29 24 12 09
-01 -31 -12 19 17 01 -08
83 113 131 148 159 157 141
18 08 13 10 07 12 17
18 19 14 09 04 09 18
-06 -11 -13 -05 -06 -07 -04
62 26 22 24 21 16 15
57 69 62 65 62 56 55
54 68 61 63 62 55 53
-04 03 02 -02 -11 -15 -08
-01 11 04 05 01 -06 -04
- 11 04 05 01 -06 -04
565 394 386 382 415 418 408
Net lending (+) or borrowing (-) vis-a-vis ROW (c)
(a) Eurostat definition (b) gross saving divided by gross disposable income (c) as a percentage of GDP
Cyclically-adjusted budget balance (c)
Real unit labour cost
Imports (goods and services)
General government balance (c)
Unit labour costs whole economy
Inventories
Terms of trade goods
Table II271
Net exports
Public Consumption
Trade balance (c)
Employment
Annual percentage change2012
GDP
Private Consumption
Exports (goods and services)
GNI (GDP deflator)
Structural budget balance (c)
Saving rate of households (b)
Main features of country forecast - SWEDEN
Unemployment rate (a)
Gross fixed capital formation
Current-account balance (c)
Contribution to GDP growth
General government gross debt (c)
GDP deflator
Compensation of employees head
of which equipment
Domestic demand
Harmonised index of consumer prices
28 THE UNITED KINGDOM Recovery takes hold fiscal imbalances still sizeable
102
Strong growth finally making an appearance
Growth became more firmly established in 2013
with four continuous quarters of positive growth to
leave the annual figure at 19 Domestic demand
was again the principal contributor to growth as
had been the case for the marginally upward-
revised 03 annual growth of 2012 Net trade is
likely to have contributed somewhat negatively to
growth over the year
-6
-5
-4
-3
-2
-1
0
1
2
3
4
5
-6
-5
-4
-3
-2
-1
0
1
2
3
4
5
04 05 06 07 08 09 10 11 12 13 14 15
pps
Graph II281 The United Kindom - Output gap and
contributions to real GDP growth
Output gap (rhs) Net exports
Inventories Dom demand excl inv
Real GDP (y-o-y)
forecast
of pot GDP
The outlook for growth is now stronger than has
been in recent years although growth is likely to
continue to come almost exclusively from
domestic demand with private consumption being
the main contributor and investment playing a
more important role as time progresses In 2014
and 2015 growth is estimated at 25 and 24
respectively Net exports are expected to remain
weak and improve only very slowly There are
both upside and downside risks to the forecast
Domestic demand may be more dynamic than
estimated as sentiment indicators are high
However the upturn in investment may fail to
materialise and private consumption may decline
sizeably as a result of continued weak wage
growth interest rate rises or the household debt
burden weighing down on spending
Consumption is crucial
Economic growth in 2013 has been driven by
private consumption and its contribution is likely
to have been approximately three-quarters Despite
negative real wage growth consumers are running
down their savings in order to sustain their
spending habits Robust employment rates are
likely to be the reason for this behaviour The
expectation is that consumers will continue
spending though less vigorously than was seen at
the end of 2013 as inflation falls and real wage
growth turns positive towards the end of 2014 and
into 2015
Strengthening investment
The first three quarters of 2013 saw positive
though modest growth for investment
Nevertheless this bodes well for the future as it
was the first run of three expanding quarters since
early 2007 albeit from low levels Equipment
investment was strongest earlier in the year but
construction took over thereafter The soft
indicators reached highs during the second half of
2013 Combining this with the credit easing
measures in place strong cash reserves and
returning confidence suggests that investment is
likely to pick up more sturdily in 2014 and should
be reinforced in 2015
Weak net exports
Following a strongly negative contribution to
growth in 2012 of -07 pp and given the outturns
to date in 2013 it is likely that net exports did not
contribute positively to growth That said the
outlook is that net exports will improve somewhat
and at least not be such a drag on growth in 2014
and 2015 as trading partnersrsquo growth picks up
Growing exports to Ireland and China (the latter
from low levels) should aid this improvement
Inflation approaching target
During 2013 inflation fell steadily to reach 21
in the final quarter of 2013 The quick decline in
prices was due to weak commodity and energy
price growth lower-than-expected increases in
education costs weak wage growth and an
appreciation of sterling dampening import prices
Growth finally took hold in the UK in 2013 with strong domestic demand supressing the negative effect
of weak export performance UK GDP grew 19 in 2013 and is expected to grow by 25 in 2014 and
24 in 2015 Inflation declined throughout the year as did unemployment Some progress has also
been made on the fiscal side but the debt ratio has yet to peak
Member States The United Kingdom
103
The outlook is for inflation to fall further and settle
around the Bank of Englandrsquos target of 2 given
the spare capacity in the economy an expectation
of low inflation growth and only slowly increasing
wage growth The forecast estimates inflation at
20 in both 2014 and 2015
Robust employment growth
The labour market has remained resilient since
2010 despite weak economic growth and
redundancies in the public sector with 2013 being
no exception The average growth rate of total
employment in the first three quarters of 2013 was
13 The unemployment rate continued falling to
75 in the third quarter of 2013 and the outlook is
for the rate to decline further though at a more
subdued rate This is likely as labour productivity
is expected to recover in the short term and the
slack in the system should allow activity to pick up
through longer working hours without having to
hire new staff The forecast is for the
unemployment rate to fall to 68 in 2014 and
65 in 2015
Ongoing fiscal consolidation
The government continued with its original fiscal
consolidation plans in the Autumn Statement 2013
The main taxation measures announced were a
cancelation of the fuel duty rise in 2014 and of the
employer national insurance contributions for
employees less than 21 years and an increase in
the bank levy from January 2014 Further
reductions on departmental spending were
announced along with a cap on overall welfare
spending excluding the basic state pension which
was increased marginally and job seekerrsquos
allowance As a result of revisions to GDP growth
and borrowing estimates the deficit is expected to
reach 51 in 2014-15 and 42 in 2015-16 The
structural balance is forecast at 40 in the latter
year with the debt rate continuing to rise
Table II281
General government projections on a financial-year basis
2011-12 2012-13 2013-14 2014-15 2015-16
General government balance -76 -52 -59 -51 -42
Structural budget balance -60 -56 -49 -45 -40
General government gross debt 849 881 900 922 947
Actual
Includes one-off transfer of Royal Mail pension fund and sale of 4G mobile phone licences
Forecast
bn GBP Curr prices GDP 94-09 2010 2011 2012 2013 2014 2015
15672 1000 26 17 11 03 19 25 24
10327 659 29 10 -04 15 24 24 22
3411 218 22 05 00 16 05 05 04
2252 144 27 28 -24 07 -18 65 71
481 31 17 99 -217 129 28 87 79
4943 315 44 67 45 11 08 29 37
5279 337 49 79 03 31 12 26 33
15628 997 28 12 17 -13 19 25 24
28 09 -06 14 14 26 25
00 13 05 -02 06 -01 -01
-02 -05 12 -07 -02 00 01
08 02 05 12 10 13 10
62 78 80 79 76 68 65
39 31 20 19 19 21 28
21 17 14 29 10 09 14
00 -14 -09 12 -06 -10 -07
54 73 67 72 64 61 57
22 31 23 17 17 19 21
19 33 45 28 26 20 20
-02 08 -13 -04 04 04 07
-39 -66 -65 -69 -69 -67 -66
-16 -27 -15 -37 -38 -33 -32
-14 -24 -12 -35 -36 -31 -30
-30 -101 -77 -61 -63 -52 -42
-31 -81 -61 -44 -51 -48 -43
- -81 -61 -62 -53 -48 -43
454 784 843 886 914 934 945
Net lending (+) or borrowing (-) vis-a-vis ROW (c)
(a) Eurostat definition (b) gross saving divided by gross disposable income (c) as a percentage of GDP
Cyclically-adjusted budget balance (c)
Real unit labour cost
Imports (goods and services)
General government balance (c)
Unit labour costs whole economy
Inventories
Terms of trade goods
Table II282
Net exports
Public Consumption
Trade balance (c)
Employment
Annual percentage change2012
GDP
Private Consumption
Exports (goods and services)
GNI (GDP deflator)
Structural budget balance (c)
Saving rate of households (b)
Main features of country forecast - UNITED KINGDOM
Unemployment rate (a)
Gross fixed capital formation
Current-account balance (c)
Contribution to GDP growth
General government gross debt (c)
GDP deflator
Compensation of employees head
of which equipment
Domestic demand
Harmonised index of consumer prices
Candidate Countries
29 THE FORMER YUGOSLAV REPUBLIC OF MACEDONIA Recovery is gaining firm ground in spite of weaker Investment
106
Support from external sector to firming
recovery in 2013hellip
The feeble recovery of output growth which had
begun in the second half of 2012 gained firm
ground in the first three quarters of 2013 Real
GDP increased by 32 compared to the previous
year with net exports and private consumption
taking over from investment as growth drivers
Contrary to earlier official estimates gross capital
formation declined in each of the three quarters in
annual terms and by a total of 15 on the year
24
26
28
30
32
34
36
38
-5
-4
-3
-2
-1
0
1
2
3
4
5
6
7
08 09 10 11 12 13 14 15
y-o-y
Graph II291 The former Yugoslav Republic of
Macedonia - Labour market
Unemployment rate (rhs)
Employment growth
Real GDP
forecast
of labour force
Stimulated by supportive fiscal measures private
consumption increased by an accumulated 51 in
the first three quarters Supported by a benign
external environment and by new foreign direct
investment net exports of goods and services
contributed positively to output growth for the first
time since 2010 Among the sectors the
construction industry largely outperformed
manufacturing and grew by 33 on the year after
average growth of 48 in 2012
hellipis not likely to be sustained
The profile of growth is expected to change again
over the forecast horizon with a renewed pick-up
in gross capital formation and further gains in
household consumption taking the lead Both
public and foreign direct investment are projected
to increase coupled with gradual strengthening in
credit extension to the corporate sector Household
consumption is likely to post resilient growth rates
over the horizon in line with expectations for
disposable income deriving from a positive
employment trend higher social transfers and
stable remittances With new foreign investors
taking up production over the horizon the forecast
expects a renewed strengthening of import
demand Notwithstanding the further improvement
in major export markets a renewed gradual
deterioration of the merchandise balance is likely
Hence net exports would impact negatively on
growth in both years This drag could prove
sizeable if FDI the main source of the countrys
exports evolves less vigorously than expected
Slight labour market stimulation will continue
Aided by the firming recovery and official
employment programmes the number of
unemployed had decreased by 45 at the end of
September 2013 compared to a year earlier With
a significantly smaller increase in the labour force
this lowered the unemployment rate to 287
down from 306 a year earlier The number of
employed persons increased by 4 bringing the
employment rate to 408 up by 17pp from a
year earlier with virtually no change in the total
working age population However the
unemployment rate for 15 to 24 olds remained
largely unchanged at 52 over the year Driven
primarily by the expected pick up of public and
foreign direct investment as well as by a
continuation of active labour market policies
employment is expected to rise further albeit less
strongly while the unemployment rate would drop
further over the forecast horizon
Current account still balanced but
deteriorating
While the current-account deficit presumably
narrowed somewhat in 2013 due to an improving
trade balance in spite of lower private transfers
The economic recovery strengthened in the first three quarters of 2013 and was supported by a strong
contribution from net exports Despite a remarkable pick up in private consumption domestic demand
provided only a small contribution to growth given the major slump in investment In line with
projected developments in foreign direct investment the forecast expects a turnaround in this profile for
2014 and 2015 with investment strengthening again and the foreign balance proving a drag on growth
Candidate Countries The former Yugoslav Republic of Macedonia
107
the forecast expects it to deteriorate again due to
renewed widening of the merchandise deficit
However the need for external borrowing to
finance the current-account deficit was mitigated
in 2013 by a renewed pick up in FDI and is likely
to remain so over the forecast horizon At the end
of the third quarter FDI inflows reached 33 of
accumulated GDP compared to 09 at the same
time in 2012 Given the increasingly benign
investment trends in the countrys major trade
partners and the governments active recruitment
the forecast expects FDI to remain elevated
Lower deficits needed to sustain public debt
The general government deficit for 2013 was
revised in the autumn from 36 to 39
following the adoption of a supplementary budget
In view of anticipated consolidation measures the
forecast expects the deficit to gradually narrow to
around 36 in 2015 After having jumped in 2012
by 56pp to 34 of GDP the general government
debt ratio is expected to have increased by
somewhat less in 2013 However overall public
debt which includes the debt of state-owned
enterprises public agencies and public financial
institutions is likely to be significantly higher
10
15
20
25
30
35
40
-5
-4
-3
-2
-1
0
1
2
3
06 07 08 09 10 11 12 13 14 15
of GDP
Graph II292 The former Yugoslav Republic of
Macedonia - Public finances
Central government debt (rhs)
General government deficit
forecast
of GDP
It would also comprise the newly established
Public Enterprise for State Roads through which
the government channels the increasingly
important road infrastructure expenditure ndash and
which can borrow on its own behalf with its debt
guaranteed by the government In conclusion in
order for general government debt levels to
stabilise fiscal deficits would have to decrease
more substantially than targeted This is likely to
prove difficult in view of recently implemented
pension increases public wage rises as of this year
and an increase in social transfers
bn MKD Curr prices GDP 94-09 2010 2011 2012 2013 2014 2015
4586 1000 22 29 28 -04 32 25 26
3428 747 - 21 29 -30 44 25 27
848 185 - -20 06 -14 -28 10 12
1054 230 - -27 123 160 -90 73 77
- - - - - - - - -
2459 536 - 236 105 00 37 64 66
3498 763 - 95 104 42 -08 61 65
4495 980 - 34 24 -06 30 23 24
- 07 46 08 07 35 37
- -06 00 00 00 00 00
- 34 -19 -31 26 -10 -12
- 15 31 09 27 20 15
- 318 316 311 289 278 269
- 60 -21 28 41 48 33
- 46 -17 41 36 42 22
- 18 -46 40 20 24 06
- - - - - - -
105 27 31 01 15 18 16
83 16 39 33 28 33 30
- -14 14 -71 00 00 00
- -208 -225 -239 -208 -209 -213
- -07 -14 -27 -23 -26 -30
- - - - - - -
- -68 -31 -39 -40 -38 -36
- - - - - - -
- - - - - - -
- 258 284 340 354 374 389
Net lending (+) or borrowing (-) vis-a-vis ROW (c)
(a) as of total labour force (b) gross saving divided by gross disposable income (c) as a percentage of GDP
Cyclically-adjusted budget balance (c)
Real unit labour cost
Imports (goods and services)
General government balance (c)
Unit labour costs whole economy
Inventories
Terms of trade goods
Table II291
Net exports
Public Consumption
Trade balance (c)
Employment
Annual percentage change2012
GDP
Private Consumption
Exports (goods and services)
GNI (GDP deflator)
Structural budget balance (c)
Saving rate of households (b)
Main features of country forecast - THE FORMER YUGOSLAV REPUBLIC OF MACEDONIA
Unemployment rate (a)
Gross fixed capital formation
Current-account balance (c)
Contribution to GDP growth
General government gross debt (c)
GDP deflator
Compensation of employees head
of which equipment
Domestic demand
Consumer-price index
30 ICELAND Helped by tourism but held back by capital controls
108
A stronger second half of 2013 hellip
Overall economic activity received a marked boost
from record high tourism earnings contributing
more than one third to the economys output
growth of some 3 in the first three quarters of
2013 Private and public consumption each
contributed about frac12 pp to overall growth
Investments were lower than a year before which
was partly due to high spending for ships and
airplanes in 2012 High frequency indicators such
as credit card turnover point to rather stable
consumption during the last months of the year
However a bigger than usual share of those
purchases might have been used for imports which
would dampen output growth in the fourth quarter
The labour market situation continued to improve
with employment increasing by more than 3
while unemployment dropped from 6 in 2012 to
54 in 2013
Inflationary pressures subsided markedly towards
the end of 2013 partly reflecting decelerating
import prices in particular for oil With the
exception of housing prices domestic price
dynamics now seems to head towards the Central
Banks inflation target of 25 The end-year wage
agreements were in line with the declining
inflation expectations This rather new trend could
strengthen disposable income and facilitate job
creation
hellip although the outlook is still for contained
growth ahead
Key determinants for Icelands growth
performance in 2014-15 will be tourism and
related construction activities as well as private
consumption benefitting from lower inflation and
government measures to boost disposable income
such as the announced household debt relief
programme but also the extended possibility to use
third-pillar pension savings for consumption Some
long-planned investment projects in the energy-
intense and maritime sectors could further increase
domestic demand However the existence of
capital controls has a negative effect on
investment in particular from abroad Total
exports are projected to benefit from an improved
global outlook and a flourishing tourism sector
However higher imports due to stronger domestic
demand will largely offset the positive effects of
higher tourism revenues
- 25
- 20
- 15
- 10
- 5
0
5
10
15
06 07 08 09 10 11 12 13 14 15
pps
Graph II301 Iceland - Real GDP growth and contributions
Net exports Inventories
Dom demand excl invent Real GDP (y-o-y)
forecast
Unemployment declines further hellip
Labour market conditions are expected to improve
during 2014-15 benefitting from moderate wage
developments and new opportunities in the tourism
sector This should help to lower unemployment
below 5 by 2015 The long-term unemployment
will remain a crucial challenge
hellipwhile inflationary pressures subside
Inflationary pressures are expected to subside in
2014 thanks to relatively low increases in import
prices but also contained wage agreements
However in 2015 this trend could reverse as a
result of strengthening import prices but also
stronger domestic demand
External balance is likely to deteriorate
As a result of stronger domestic demand the
surplus in trade in goods will shrink while the
service balance is expected to continue benefitting
further from expanding tourism A large part of the
Third quarter growth in 2013 was much stronger than expected as a result of high tourism revenues and
resilient private consumption In 2014 and 2015 output growth likely to remain close to 3 supported
by tourism and related construction strengthened disposable income and stronger international
demand However the continued uncertainty related to the lifting of capital controls is likely to impede
more dynamic growth
Candidate Countries Iceland
109
current-account deficit accounts for net income
from banks in winding up proceedings Corrected
for these the underlying current account will
remain closer to balance
Reducing public debt remains a challenge
The general government deficit dropped from
56 of GDP in 2011 to 38 in 2012 During
2013 fiscal consolidation remained behind targets
largely reflecting the weaker-than-expected
revenue growth As a result the 2013 end-year
deficit is likely to be close to 2frac34 of GDP
-15
-10
-5
0
5
100
20
40
60
80
100
120
06 07 08 09 10 11 12 13 14 15
of GDP
Graph II302 Iceland - Public finances
General government debt (lhs)
General government deficit (inverted rhs)
forecast
of GDP
The forecast assumes that the new government will
respect its commitments towards continued fiscal
consolidation as described in the 2014 budget
adopted in December The envisaged spending
reductions should allow a lowering of the deficit to
around 1frac12 of GDP in 2014 and only a slight
deficit in 2015 After reaching a peak of nearly
100 of GDP in 2011 the general government
debt-to-GDP ratio started to decline in 2012
Thanks to substantial primary surpluses in 2014
and 2015 the debt ratio is likely to drop towards
86 by the end of the forecast horizon
Risks and uncertainties are still elevated
Increased domestic demand as a result of
government measures such as the household debt
relief programme could translate into a sharp
widening of external imbalances creating pressure
on the exchange rate and domestic price stability
Moreover the Icelandic economy is still shielded
by extensive capital controls and their removal
remains a huge challenge
bn ISK Curr prices GDP 94-09 2010 2011 2012 2013 2014 2015
16985 1000 34 -41 27 14 28 27 30
9129 537 27 01 26 24 15 35 38
4304 253 31 -34 -03 -14 15 08 05
2469 145 16 -94 143 50 -35 50 80
- - - - - - - - -
10095 594 55 05 38 38 41 40 42
9055 533 40 45 67 47 06 46 53
15107 889 21 -18 69 51 28 27 30
31 -22 31 16 07 27 33
-01 -02 06 -01 00 00 00
04 -17 -10 -01 21 00 -02
13 -04 00 11 35 24 27
34 76 71 61 54 46 41
66 67 85 67 59 30 34
44 109 56 64 66 27 31
-04 37 23 35 34 06 02
- -260 -162 -130 -118 -113 -105
48 69 33 28 31 21 29
- 54 40 52 39 30 33
-11 85 -29 -56 -01 -01 -03
-22 78 60 46 50 43 37
-84 -80 -63 -55 -40 -46 -52
- - - - - - -
- -101 -56 -38 -28 -15 -02
- - - - - - -
- - - - - - -
- 930 993 969 942 913 864
Net lending (+) or borrowing (-) vis-a-vis ROW (c)
(a) as of total labour force (b) gross saving divided by gross disposable income (c) as a percentage of GDP
Cyclically-adjusted budget balance (c)
Real unit labour cost
Imports (goods and services)
General government balance (c)
Unit labour costs whole economy
Inventories
Terms of trade goods
Table II301
Net exports
Public Consumption
Trade balance (c)
Employment
Annual percentage change2012
GDP
Private Consumption
Exports (goods and services)
GNI (GDP deflator)
Structural budget balance (c)
Saving rate of households (b)
Main features of country forecast - ICELAND
Unemployment rate (a)
Gross fixed capital formation
Current-account balance (c)
Contribution to GDP growth
General government gross debt (c)
GDP deflator
Compensation of employees head
of which equipment
Domestic demand
Consumer-price index
31 MONTENEGRO A new wave of investment
110
A faster recovery
In the third quarter of 2013 real GDP grew by 4
y-o-y accelerating from a 34 real growth in the
second quarter and 11 expansion in the first
quarter Growth was largely driven by net exports
of electric energy and tourism services A
continuation of this growth could be expected in
the last quarter of 2013 too supported by
preliminary data on construction utilities and
agriculture but also a successful tourism post-
season and its positive effect on retail trade
leading to an average expansion of GDP of around
25 for the whole year Compared to the autumn
the winter forecast presents a slightly faster growth
scenario for 2014 and 2015 too
-6
-3
0
3
6
10 11 12 13 14 15
Graph II311 Montenegro - Real GDP growth and
contributions
Dom demand excl invent Net exports
Inventories Real GDP (y-o-y)
forecast
pps
Two major uncertainties
Yet there are two major unknowns which may call
for further revision in later forecasts The first one
is the pace of credit growth In 2013 banks loans
grew 3 y-o-y reversing a three-year period of
decline However credit supply remains
constrained by tight credit conditions stirred up by
the high level of non-performing loans (around
18 of total loans at the end of 2013) As a result
private consumption is expected to remain subdued
during the forecast horizon
The second factor of uncertainty will be the pace
of investments and its real contribution to gross
fixed capital formation in the coming years There
are several important tourism energy and
infrastructure projects in the pipeline which if
successfully implemented may set a broader base
for future growth So far the construction of the
tourism resorts in Lustica Tivat and Kumbor and
the electricity interconnection cable with Italy are
in progress while preparatory works for the
highway the second block for the thermal plant
and two windmill farms are expected to start in
2014 However the short-term net contribution
from these investments remains difficult to
ascertain given the small size of the country and its
high import dependence
Weak labour market and price dynamics
The unemployment rate is forecast to fall below
19 while employment will maintain positive but
subdued growth rates until 2015 when the pace of
investments speeds up Weak labour market
dynamics have also been reflected in the
moderation of wages contracting by almost 4 in
real annual terms in 2013 We expect wages to
increase broadly in line with the recovery of
demand for local labour In 2013 average inflation
totalled 22 compared to 41 a year before
Future improvement of domestic demand may
have a limited impact on prices as private
consumption would still remain mostly driven by
tourists expenditure whereas domestic wages and
bank loans growth improve only gradually during
the forecast period
Large external imbalances
In the first three quarters of 2013 the current-
account deficit has been narrowing and could close
below 17 of GDP by the end of the year Yet the
improvement of the trade deficit could reverse in
the next years as exports base effects fade out and
new capacities in tourism and energy are yet under
construction The forecast also expects a
deterioration of the income and transfers net
balances as more foreign workers will be
Stronger-than-expected growth in 2013 confirmed the positive contribution of a number of sectors
besides electricity production A rebalancing of growth from net exports towards domestic consumption
is expected following a new wave of major investments and to a lesser extent a mild recovery in private
consumption The adoption of fiscal rules seems to confirm the continuity of consolidation efforts
Candidate Countries Montenegro
111
employed in construction The external gap would
continue being fully financed by FDI inflows
By mid-2014 the authorities could put into
practice a voluntary financial restructuring
programme to reduce payment arrears between
companies banks and tax administration
reinforcing the sustainability of the banking sector
public finances and real sector liquidity The
recovery of domestic demand could benefit to the
extent that this programme proves successful
Meanwhile the re-emergence of investors risk
aversion to emerging markets following the
indications from the Federal Reserversquos tapering of
monetary stimulus might also delay some
investments in Montenegro
Sustained fiscal consolidation efforts
In the autumn forecast we anticipated the
government would borrow additional EUR 100
million to close the budget gap after paying in
August two bank loans to cover the guarantees of
the bankrupt aluminium factory (KAP) However
budget performance improved markedly during
2013 supported by increases of the personal
income tax and VAT rates resulting in a 10
average expansion of revenue compared to a year
before As a result the government avoided a
rebalance of the budget to increase the borrowing
ceiling to pay for those guarantees (totalling 32
of GDP) Yet despite the freezing of pensions and
public sector wages the budget deficit reached 4
of GDP at the end of 2013
We foresee the broadening of the tax base to have
lasting effects throughout the next two years and
therefore budget deficits to fade by the end of
2015 However this scenario will depend on the
extent to which GDP growth (ie denominator
effect) might outpace the expansion of public
spending and debt as the government starts
borrowing to finance the highway project
In our view further expansion of the public debt
remains a serious risk Apart from relying on
growth the government also plans for 2014 a
major overhaul of the stock of public debt
(especially two Eurobonds issues maturing in 2015
and 2016) to improve debt sustainability through
more favourable terms
mio EUR Curr prices GDP 94-09 2010 2011 2012 2013 2014 2015
31489 1000 - 25 32 -25 24 27 30
26320 836 - 20 42 -32 -17 20 25
6791 216 - -03 -16 31 -19 11 13
5838 185 - -185 -103 -33 17 67 93
- - - - - - - - -
13894 441 - 75 141 -12 51 22 20
21664 688 - -31 31 09 -17 20 30
32031 1017 - 59 38 -07 23 25 36
- -34 09 -26 -15 31 40
- 14 -06 12 05 00 00
- 45 29 -11 34 -03 -11
- -19 -64 28 18 23 27
- 197 197 196 196 192 185
- 23 09 07 -10 14 18
- - - - - - -
- - - - - - -
- 196 172 210 209 192 185
- -08 -07 -10 -01 03 01
- 05 31 41 22 23 26
- - - - - - -
- -408 -404 -441 -408 -409 -419
- -229 -177 -186 -151 -153 -158
- - - - - - -
- -49 -54 -56 -41 -25 -11
- - - - - - -
- - - - - - -
- 409 460 540 568 579 590
Net lending (+) or borrowing (-) vis-a-vis ROW (c)
(a) as of total labour force (b) gross saving divided by gross disposable income (c) as a percentage of GDP
Cyclically-adjusted budget balance (c)
Real unit labour cost
Imports (goods and services)
General government balance (c)
Unit labour costs whole economy
Inventories
Terms of trade goods
Table II311
Net exports
Public Consumption
Trade balance (c)
Employment
Annual percentage change2012
GDP
Private Consumption
Exports (goods and services)
GNI (GDP deflator)
Structural budget balance (c)
Saving rate of households (b)
Main features of country forecast - MONTENEGRO
Unemployment rate (a)
Gross fixed capital formation
Current-account balance (c)
Contribution to GDP growth
General government gross debt (c)
GDP deflator
Compensation of employees head
of which equipment
Domestic demand
Consumer-price index
32 SERBIA Key reforms ahead
112
Growth in 2013 stronger than expected
The exports driven growth accelerated strongly to
37 (y-o-y) in the third quarter following an
upward revision of data in the first two quarters to
30 and 06 However domestic demand
remained weak with a steady fall in private
consumption and more pronounced drop in
investments There was also a significant revision
of 2012 data in particular regarding growth of
investments (from -34 to 144) exports (from
45 to 18) and imports (from 42 to 19)
The robust economic performance is estimated to
have continued in the last quarter of 2013 bringing
the annual growth above 2 higher than expected
Households consumption is likely to have
stabilised in the last quarter of the year but its
recovery is poised to be slow and uneven impeded
by a weak labour market and bouts of fiscal
consolidation efforts The latter are also expected
to keep public consumption growth negative
throughout the forecast period
Continuing rebalancing towards exports and
investments
The ongoing rebalancing of the economy away
from consumption is expected to continue with
investments playing an increasingly important role
However this process may be uneven as it is
linked to pursuing the announced far-reaching
structural reforms which are subject to significant
implementation risks
Base effects are expected to drive exports growth
temporarily down in 2014 but improving external
demand would be supporting an overall robust
exports performance over the forecast horizon The
beginning of EU accession negotiations and
increased membership prospects supported by
stronger FDI and reforms improving the business
environment are foreseen to lead to a pronounced
hike in investment activity albeit from a very low
level Gross capital formation is also likely to be
supported by higher government investments after
they have hit a bottom at 23 of GDP in 2013 In
line with growing demand imports are envisaged
to slowly catch-up turning the net exports
contribution to growth slightly negative in the
outer year of the forecast
hellipbut major hurdles ahead
The forecast assumes that Serbia would move on
with the implementation of a number of already
announced major structural reforms as of the
second half of this year However the actual
timing and sequencing of these reforms brings
uncertainty to the forecast scenario especially with
regard to investments labour market and budget
performance
As economic activity strengthens the labour
market is foreseen to become more dynamic
although any gains in employment are likely to be
largely offset by job losses in the public sector As
a result the unemployment rate would remain very
high Discrepancies between different sources of
data on the labour market have increased as the
Labour force survey registered a significant drop
in unemployment while registered unemployment
continued to rise
0
5
10
15
20
25
30
-10
-8
-6
-4
-2
0
2
4
6
8
09 10 11 12 13 14 15
y-o-y
Graph II321 Serbia - Labour market
Unemployment rate (rhs) Employment growth (lhs)
Real GDP growth (lhs)
forecast
of labour force
Since early December the dinar has depreciated
slightly against the euro Over the forecast horizon
it is expected to balance between medium-term
appreciation pressures related to increased
After a year of strong export-led growth Serbias economy is expected to slow down in 2014 before
picking up again in 2015 driven by increased investment linked to the countrys EU accession prospects
and reforms Early parliamentary elections scheduled for mid-March however are delaying the
implementation of key reforms While exports are expected to remain robust households consumption is
poised to recover slowly hampered by fiscal consolidation measures and low net employment creation
Candidate Countries Serbia
113
portfolio and foreign direct investment inflows
and transient depreciation episodes linked to
external factors or bouts of domestic policy
uncertainty Thus it is likely to provide a major
anchor for inflation expectations and along with
weak domestic demand reduce inflation volatility
Despite solid exports growth the space for
improving the current-account deficit is expected
to be exhausted by 2015 as domestic demand and
imports start to slowly recover
20
30
40
50
60
70
80
-7
-6
-5
-4
-3
-2
-1
0
1
2
3
09 10 11 12 13 14 15
of GDP
Graph II322 Serbia - Public finances
General government debt (rhs)
General government balance (lhs)
forecast
of GDP
Fiscal consolidation still a long way to go
The 2013 budget deficit turned out below the
revised budget target and much lower than
expected in the autumn Although revenue
underperformed significant across-the-board
current and investment expenditure cuts have
contained the overall deficit to an estimated 49
of GDP
The 2014 budget foresees new consolidation
measures almost equally split between the revenue
and expenditure side A hiring freeze in the public
sector would also contribute to containing
expenditure pressures However higher interest
and investment spending and social expenditure
related to the envisaged restructuring of public
enterprises are expected to keep total spending and
the budget deficit high Despite more prudent
planning there are also important downside risks
to budget execution The revenue-poor structure of
growth and lower GDP deflator may threaten
revenue collection and delaying key reforms could
create additional risks to meeting the deficit target
Absent further consolidation measures the deficit
would remain high and together with payments on
bank recapitalisations and activated government
guarantees would be keeping government debt on
an upward trajectory
bn RSD Curr prices GDP 94-09 2010 2011 2012 2013 2014 2015
33487 1000 - 10 16 -15 21 13 22
25790 770 - -09 -11 -18 -16 -07 01
6660 199 - 04 10 17 -19 -14 -07
7172 214 - -55 84 144 -87 67 112
- - - - - - - - -
13483 403 - 153 34 18 159 49 57
19501 582 - 31 70 19 21 26 49
32606 974 - 03 15 -19 16 09 19
- -17 08 16 -35 05 23
- -03 33 -28 03 00 01
- 30 -25 -03 52 07 -01
- -84 -60 -11 37 00 08
- 192 230 239 221 223 214
- - - - - - -
- - - - - - -
- - - - - - -
- - - - - - -
- 49 96 60 63 45 50
- 61 111 73 79 43 50
- -18 46 14 13 -03 00
- -171 -169 -185 -125 -119 -118
- -76 -88 -106 -49 -47 -48
- - - - - - -
- -47 -49 -65 -49 -59 -52
- - - - - - -
- - - - - - -
- 445 482 600 634 700 728
Net lending (+) or borrowing (-) vis-a-vis ROW (c)
(a) Eurostat definition (b) gross saving divided by gross disposable income (c) as a percentage of GDP
Cyclically-adjusted budget balance (c)
Real unit labour cost
Imports (goods and services)
General government balance (c)
Unit labour costs whole economy
Inventories
Terms of trade goods
Table II321
Net exports
Public Consumption
Trade balance (c)
Employment
Annual percentage change2012
GDP
Private Consumption
Exports (goods and services)
GNI (GDP deflator)
Structural budget balance (c)
Saving rate of households (b)
Main features of country forecast - SERBIA
Unemployment rate (a)
Gross fixed capital formation
Current-account balance (c)
Contribution to GDP growth
General government gross debt (c)
GDP deflator
Compensation of employees head
of which equipment
Domestic demand
Consumer-price index
33 TURKEY Depreciation monetary tightening and external rebalancing
114
Domestic-demand based growth in 2013
Following a pronounced slowdown in 2012
Turkeys economy re-accelerated in the first half of
2013 This was helped by monetary policy
accommodation and a relatively large increase in
public spending particularly investment In the
third quarter the quarter-on-quarter growth slowed
to 09 as public spending was reined in Monthly
data suggest a further moderate slowdown in the
fourth quarter
For 2013 as a whole GDP growth is projected at
38 Consumer spending ndash fuelled by sharply
higher bank lending and substantial employment
growth ndash made the largest contribution Net
exports of goods and services subtracted from
overall growth due to a sharp turnaround in
Turkeys trade in non-monetary gold related to
international sanctions on Iran Net imports of gold
worth 14 of GDP widened Turkeys current-
account deficit to 78 of GDP in 2013 In terms
of GDP growth gold imports were partly offset by
the related positive contribution from inventories
Depreciation and tighter financial conditions
Turkeys financial markets and the lira have been
under strong downward pressure since May 2013
in the context of the Federal Reserves tapering of
asset purchases two domestic political crises and
geo-political tensions related to the Syrian civil
war By mid-February the yield on the two-year
benchmark government note had risen by
600 basis points to close to 11 and the major
index on the Istanbul stock exchange had fallen by
30 The lira depreciated by 164 in real
effective terms between April 2013 and January
2014
In addition to heavy lira-supporting interventions
in the foreign exchange market the central bank
has reacted to the market turmoil by tightening
monetary policy Following initial moves last
summer towards a less accommodative monetary
policy stance the central bank took more
aggressive action in January The overnight
lending rate was raised from 775 to 12 and the
one-week repo rate was hiked from 45 to 10
The central bank has signalled that it will maintain
a tight monetary policy stance until there is a
significant improvement in the inflation outlook
-8
-6
-4
-2
0
2
4
6
8
10
12
14
08 09 10 11 12 13 14 15
Graph II331 Turkey- Real GDP growth and
contributions
Inventories Net exports
Dom demand excl invent Real GDP (y-o-y)
forecast
pps
Rebalancing towards external demand
Looking forward final domestic demand will be
significantly dampened by recent developments
The pass-through of the lira depreciation to
domestic prices will reduce both private and public
consumption in real terms Consumer spending
will also be hit by higher interest rates recent
macro-prudential measures to lower household
borrowing some indirect tax hikes a negative
wealth effect and declining confidence Business
investment will be curbed by higher interest rates
by higher funding costs due the stock market
correction and by deteriorating balance sheets for
companies with debt in foreign exchange
On the external side the liras depreciation will
improve the international price competitiveness of
Turkish goods and services thereby re-directing
economic activity towards exports and import-
substituting output This combined with the
recovery in Turkeys export markets will gradually
offset the reduction in domestic demand growth
and lead to some rebalancing of the economy
Growth was somewhat faster than expected in 2013 but the outlook for economic activity over the next
two years has deteriorated against the background of recent developments Monetary conditions have
tightened and the stock market has suffered a major correction The liras sharp depreciation is stoking
inflation and curbing consumers purchasing power but should also help the economy to rebalance
gradually towards external demand
Candidate Countries Turkey
115
Slower growth higher inflation but a smaller
current-account deficit
In 2014 the economy is projected to continue the
slowdown already noticeable in the second half of
2013 The annual GDP growth rate is projected at
25 with net exports starting to contribute
positively In 2015 growth is expected to increase
to 30 as domestic demand recovers gradually
Considering the domestic political uncertainty and
the possibility of a further sell-off in Turkish
financial assets in context of a normalisation of
monetary conditions in developed markets the
risks to this growth projection are biased to the
downside
Annual inflation will be pushed up to 87 in 2014
spurred mainly by the pass-through from the recent
currency depreciation but also by some
adjustments of indirect taxes When these effects
peter out below-potential output growth will help
to lower inflation somewhat Nevertheless in view
of the current inflation expectations the inflation
rate is projected to remain significantly above the
central banks 5 medium-term target throughout
the forecast period
Employment growth already slowed in the second
half of 2013 Given the structural increase of the
labour force the unemployment rate is projected to
rise to 105 in 2014 before levelling off The lira
depreciation and the rebalancing of the economy
are projected to narrow the current-account deficit
gradually to 44 of GDP by 2015
Public debt ratio raised by the depreciation
In 2013 the fiscal deficit of general government
was held in check by surging revenues partly
resulting from earlier changes to indirect taxation
and the social security regime The forecast
projects the deficit to widen to almost 3 of GDP
in 2014 due to much slower revenue growth Some
narrowing of the deficit is forecast for 2015 when
economic activity and revenue growth pick up
again The debt ratio of general government has
suffered from the recent lira depreciation which
has increased the book value of foreign currency
debt This in conjunction with the upwardly
revised deficit projection implies a stabilisation of
the debt ratio around 36 of GDP rather than a
continued downward trend as previously forecast
bn TRY Curr prices GDP 94-09 2010 2011 2012 2013 2014 2015
14158 1000 32 92 88 22 38 25 30
9943 702 35 67 77 -06 42 00 12
2102 148 41 20 47 61 51 32 27
2869 203 21 305 180 -27 34 13 30
- - - - - - - - -
3732 264 78 34 79 167 07 74 90
4461 315 63 207 107 -03 69 07 33
14030 991 32 96 87 23 35 24 29
35 104 98 -02 42 07 18
-02 27 00 -12 11 02 -02
01 -40 -10 36 -16 16 14
09 62 67 30 30 20 27
83 119 98 92 98 105 104
388 70 -21 118 107 78 81
357 41 -39 127 99 73 78
-28 -15 -115 55 42 -01 -03
- - - - - - -
399 57 86 68 54 74 81
- 86 65 89 75 87 74
-09 -32 -44 -11 -03 -05 17
-53 -78 -113 -81 -96 -88 -68
-21 -63 -95 -59 -78 -65 -44
- -63 -95 -59 -78 -65 -44
- -29 -08 -15 -16 -29 -25
- - - - - - -
- - - - - - -
- 431 399 362 360 367 362
Net lending (+) or borrowing (-) vis-a-vis ROW (c)
(a) as of total labour force (b) gross saving divided by gross disposable income (c) as a percentage of GDP
Cyclically-adjusted budget balance (c)
Real unit labour cost
Imports (goods and services)
General government balance (c)
Unit labour costs whole economy
Inventories
Terms of trade goods
Table II331
Net exports
Public Consumption
Trade balance (c)
Employment
Annual percentage change2012
GDP
Private Consumption
Exports (goods and services)
GNI (GDP deflator)
Structural budget balance (c)
Saving rate of households (b)
Main features of country forecast - TURKEY
Unemployment rate (a)
Gross fixed capital formation
Current-account balance (c)
Contribution to GDP growth
General government gross debt (c)
GDP deflator
Compensation of employees head
of which equipment
Domestic demand
Consumer-price index
Other non-EU Countries
34 THE UNITED STATES OF AMERICA Recovery gathering momentum
118
Recovery firming amid waning fiscal drag and
continued support from monetary policy
Economic activity in the US is gathering
momentum as the headwinds from fiscal policy
wane and household consumption gains speed
benefitting from robust job creation recovering
house prices and buoyant stock markets Over the
forecast horizon the recovery is expected to
consolidate and broaden to encompass business
investment which has yet to recover to pre-crisis
levels With the continued support of near-zero
interest rates and firming external demand this
should reinforce virtuous circles between
construction activity household spending and
employment expansion bringing GDP growth
back to around potential by 2015
Real GDP growth strengthened to 10 q-o-q in
the third quarter and 08 in the fourth despite
significant fiscal drag and uncertainty related to
the government shutdown and the debt-ceiling
standoff in October Growth in the second half of
the year was driven by private consumption
sizeable inventory investment (third quarter) and
net exports (fourth quarter)
-5
-4
-3
-2
-1
0
1
2
3
4
5
05 06 07 08 09 10 11 12 13 14 15
Graph II341 US - Real GDP growth and contributions
Private consumption Public consumption
Investment Net exports
Inventories Real GDP (y-o-y)
forecastpps
The brighter outlook for the US economy
combined with still subdued inflation led the Fed
in December to decide to gradually reduce its asset
purchases from January with a view of finishing
the programme by the end of 2014 The decision to
unwind quantitative easing was complemented by
reinforced forward guidance on the interest rate
which is now likely to remain near-zero well past
the time that the unemployment declines below
6frac12 Most recent Fed projections would
therefore suggest that the federal funds rate is
unlikely to be raised before 2015
An increasingly broad-based recovery
Private consumption accelerated gradually in the
course of the year to 06 q-o-q in the fourth
quarter (the fastest rate in three years) This is in
line with rising consumer confidence which
recovered quickly after a temporary shake-up in
the autumn linked with the fiscal policy
uncertainty Consumption is projected to gather
speed in 2014 and 2015 underpinned by the steady
recovery of the labour and housing market and
robust household incomes
Government spending continued to weigh down on
GDP subtracting 04 pp from growth in 2013 as a
whole as tax increases imposed by the fiscal-cliff-
deal interacted with sequestration-related
expenditure cuts to produce the second-steepest
consolidation in post-war history However
headwinds from fiscal policy are expected to wane
over the forecast horizon with fiscal consolidation
easing to less than 1 of GDP in 2014 and 05 in
2015 in terms of headline balances Moreover
thanks to the recent budget and debt ceiling deals
the policy outlook has become much clearer
Nevertheless the debt-to-GDP ratio will continue
to exceed 100 over the forecast horizon
Business investment remained feeble throughout
2013 expanding by a mere 26 the weakest
since 2010 likely depressed by continued
monetary and fiscal policy uncertainty and severe
federal spending cuts As this uncertainty recedes
investment is expected to gradually accelerate to
rates more than double the GDP growth ndash driven
by expanding domestic and external demand
The outlook for the US economy has improved since the autumn forecast as the negative impact of last
Octobers budget crisis proved much less severe than expected and the recent budget and debt ceiling
agreements dissipated fiscal policy uncertainty boosting confidence Growth is now expected to climb
from 19 in 2013 to 29 this year and 32 next year 03 pp and 01 pp higher than previously
forecast reflecting the waning fiscal drag firming investment and a steady housing market recovery
Other non-EU Countries The United States of America
119
Despite continuously rising home prices
construction activity and property sales stalled in
the summer of 2013 as rising mortgage rates
began to curb demand Momentum in the sector
resumed towards the end of the year but housing
investment posted its first negative growth
contribution in the fourth quarter in more than
three years Going forward activity and sales are
expected to gradually resume their robust pace
supported by historically low inventory levels
steady population growth and progress in
household deleveraging as mortgage debt (as a
share of disposable income) fell by 23 pps from its
early-2009 peak until the third quarter
Falling unemployment and participation rates
The labour market continued its recovery
throughout 2013 but job growth weakened
markedly in December (partly due to harsh
weather conditions) and in January 2014 The
unemployment rate continued to fall reaching
66 in January 2014 (the lowest since October
2008) However this reduction occurred against
the background of persistently low and falling
labour force participation predominantly due to
demographic reasons Employment is expected to
advance in 2014 and 2015 driving the
unemployment rate down amid a mild cyclical
recovery in labour participation (from 2015)
Inflationary pressures remain subdued
Headline consumer inflation fell to a four-year low
in October (07 and 10 for the PCE deflator and
the CPI respectively) While consumer prices
accelerated somewhat since then inflation remains
well below the Feds 2 target and is not expected
to reach it until mid-2015 Real wages remained
subdued in 2013 rising by a mere 15 but are
projected to pick up gradually over the forecast
horizon in line with the shrinking labour market
slack
Some downside risks prevail
Recently observed weaker dynamics in the labour
and housing market could have partly been
weather-related but also raise some uncertainty
about the underlying strength of the economic
recovery If these concerns persist they could spill
over to household confidence and consumption
and contribute to a more gradual recovery than
currently expected
bn USD Curr prices GDP 94-09 2010 2011 2012 2013 2014 2015
162446 1000 26 25 18 28 19 29 32
111496 686 30 20 25 22 20 27 30
25480 157 18 01 -27 -02 -21 -02 11
30281 186 27 11 34 55 33 52 78
10633 65 41 128 96 63 24 63 80
21959 135 47 115 71 35 28 62 57
27431 169 55 128 49 22 14 47 63
164975 1016 28 29 22 27 19 29 32
29 16 20 25 16 28 38
-01 14 -02 01 02 00 -03
-02 -05 01 01 01 01 -02
08 -06 06 18 10 15 16
54 96 89 81 74 65 58
36 28 31 21 17 24 32
18 -03 18 11 08 10 15
-03 -15 -02 -06 -07 -05 -03
103 113 111 109 94 92 91
20 12 20 17 15 15 18
25 16 31 21 15 16 19
-02 -16 -11 -01 09 -01 -04
-41 -45 -49 -47 -43 -41 -43
-35 -33 -26 -26 -23 -21 -23
-35 -33 -26 -26 -23 -21 -23
-38 -120 -106 -92 -62 -54 -48
- - - - - - -
- - - - - - -
645 952 994 1027 1038 1048 1045
Net lending (+) or borrowing (-) vis-a-vis ROW (c)
(a) as of total labour force (b) gross saving divided by gross disposable income (c) as a percentage of GDP
Cyclically-adjusted budget balance (c)
Real unit labour cost
Imports (goods and services)
General government balance (c)
Unit labour costs whole economy
Inventories
Terms of trade goods
Table II341
Net exports
Public Consumption
Trade balance (c)
Employment
Annual percentage change2012
GDP
Private Consumption
Exports (goods and services)
() Employment data from the BLS household survey
GNI (GDP deflator)
Structural budget balance (c)
Saving rate of households (b)
Main features of country forecast - USA
Unemployment rate (a)
Gross fixed capital formation
Current-account balance (c)
Contribution to GDP growth
General government gross debt (c)
GDP deflator
Compensation of employees fte
of which equipment
Domestic demand
Consumer-price index
35 JAPAN A bumpy road ahead
120
Short-term dynamics driven by fiscal policy
measures
The near-term outlook is largely driven by
announced fiscal policy changes Private
consumption is expected to support growth on the
back of the front-loading of expenditure ahead of
the consumption tax hike in April 2014 A similar
consumption pattern should materialise before the
expected October 2015 tax hike The negative
growth effects from the 2014 tax hike should be
partly offset by a yen55 tn (around 1 of GDP)
stimulus package expected to support private and
public investment and low-income earners Over
the forecast horizon uncertainty surrounding
structural reforms may hold back private non-
residential investment whilst households may
scale down consumption should wage growth fail
to pick up consistently
Monetary policy remains accommodative
Japans accommodative monetary stance has
remained unchanged since the inception of the
Bank of Japans Quantitative and Qualitative
Monetary Easing in April 2013 Monetary policy
and financial conditions are expected to remain
broadly supportive over the forecast horizon
Average lending rates are below 1 and persist on
a mildly downward trend despite rising
inflationary pressures while lending volumes keep
growing
Regarding inflation core-core CPI inflation
(excluding food and energy) is trending upward
(07 y-o-y in December after 06 in
November) and both survey- and market-based
measures of inflation expectations support further
inflationary pressures ahead Front-loaded
consumption in the run-up to Aprils tax hike and
tightening labour market conditions should
maintain upward pressure on prices Total cash
earnings are expected to gradually pick up over the
medium term and prop up CPI inflation towards
the stated inflation target of 2
Continued subdued real income growth in
conjunction with the scheduled consumption tax
hikes represents however a tangible downside risk
to the effectiveness of ongoing reflationary efforts
Private consumption is being front-loadedhellip
High-frequency indicators point to an acceleration
in private consumption in anticipation of the April
tax hike Retail sales ended the year on an upward
momentum reaching their highest level since 2001
on an annual basis Consumer confidence remains
relatively strong but has been trending downward
recently
15
20
25
30
35
40
45
50
-10
-8
-6
-4
-2
0
2
4
6
8
10
12
08 09 10 11 12 13
Graph II351 Japan - Retail sales (lhs) and consumer
confidence index (rhs)
Retail sales (lhs) Consumer confidence index (rhs)
Source METI Cabinet Office
y-o-y level
Labour market conditions are improving steadily
and are expected to remain tight However nominal
wages remain sticky and have failed to
significantly pick up so far Total cash earnings
should gradually accelerate and underpin private
consumption in the medium term But the basic
wage component is likely to remain stickier for
some time due to reluctance of employers to
permanently raise labour costs The recent
downward trend in consumer confidence may
reflect a concern that the April tax hike will further
depress real incomes in the absence of higher wage
growth This corroborates the expected slump in
private consumption in the second quarter of 2014
Japans economy is expected to sustain its current rate of growth in 2014 thanks to continued monetary
expansion and fiscal stimulus Fiscal policy decisions have the potential to cause some variability in the
near term while in the medium term additional consolidation measures and the uncertainty
surrounding structural reforms are expected to dampen growth in 2015
Other non-EU Countries Japan
121
hellipbut the outlook for investment and net
exports remains uncertain
Private non-residential investment picked up over
the last three quarters of 2013 and investment
conditions remain favourable with restored
corporate profitability buoyed by the weaker yen
and continued ultra-loose financial conditions
Machinery orders are on a near-term upward trend
which supports the view that business investment
recovery is ongoing and should firm up over the
coming quarters Residential investment should
remain resilient in the run-up to Aprils tax hike
before being scaled back in its immediate
aftermath and gradually recover in the run-up to
the October 2015 tax hike Public investment is
expected to remain sustained over the forecast
horizon underpinned by fiscal stimulus measures
Net exports contributed positively to growth over
the first two quarters of 2013 (05 and 03
respectively) but sluggish exports to Asia (excl
China) and resilient energy imports implied a
negative growth contribution in the second half of
the year Exports are expected to keep recovering
in the near term in line with latest survey
indicators on export orders In the medium term
exports are expected to gradually improve on the
back of ongoing recovery in the US and EU
economies and robust demand from China
Imports should also remain sustained on the back
of continued resilience of fossil fuel imports with
imports of consumer goods possibly impacted by
the scaling back of households consumption
decisions in the aftermath of Aprils tax hike
Overall net exports should add to growth over the
forecast horizon as export demand is expected to
gather pace and fully adjust to restored export
competitiveness
Risks remain elevated
Uncertainty surrounding the scope and depth of
structural reform measures to be expected over the
forecast horizon may drag on investment decisions
ahead and weigh on productivity growth
Continued negative or anaemic real wage growth
would squeeze households disposable incomes
over the forecast horizon with negative effects on
consumption and inflation On the external side
slower than expected recovery in the US and the
EU and deterioration in Japan-China bilateral trade
potentially spurred by a slowdown in the Chinese
economy remain possible downside risks
bn JPY Curr prices GDP 94-09 2010 2011 2012 2013 2014 2015
4737771 1000 06 47 -05 14 16 16 13
2876968 607 09 28 03 20 20 05 06
969404 205 22 19 12 17 21 15 09
1000677 211 -14 -02 14 34 27 52 25
- - 06 26 34 - - - -
697748 147 35 244 -04 -01 16 34 40
791565 167 30 111 59 53 34 45 22
4888219 1032 07 46 00 15 21 20 16
05 20 07 23 22 17 11
-01 09 -02 01 -03 02 00
02 17 -09 -09 -03 -03 02
-02 -04 -02 00 04 05 03
43 51 46 43 40 38 38
-06 04 06 -01 00 15 09
-15 -45 08 -16 -11 04 -02
-05 -24 27 -06 -06 -13 -14
121 87 90 78 67 58 51
-09 -22 -19 -09 -06 17 12
00 -07 -03 00 04 25 12
-22 -70 -88 -19 -18 -18 00
22 17 -03 -12 -19 -24 -22
29 37 20 10 07 05 10
28 36 20 10 06 05 10
-56 -83 -88 -87 -90 -75 -62
- - - - - - -
- - - - - - -
1497 2160 2303 2380 2447 2449 2457
Net lending (+) or borrowing (-) vis-a-vis ROW (c)
(a) as of total labour force (b) gross saving divided by gross disposable income (c) as a percentage of GDP
Cyclically-adjusted budget balance (c)
Real unit labour cost
Imports (goods and services)
General government balance (c)
Unit labour costs whole economy
Inventories
Terms of trade goods
Table II351
Net exports
Public Consumption
Trade balance (c)
Employment
Annual percentage change2012
GDP
Private Consumption
Exports (goods and services)
GNI (GDP deflator)
Structural budget balance (c)
Saving rate of households (b)
Main features of country forecast - JAPAN
Unemployment rate (a)
Gross fixed capital formation
Current-account balance (c)
Contribution to GDP growth
General government gross debt (c)
GDP deflator
Compensation of employees head
of which equipment
Domestic demand
Consumer-price index
36 CHINA Steady growth but risk factors remain significant
122
A return to investment-led growth in 2013
Chinas economy grew by 77 in 2013 compared
to 78 growth in 2012 After a soft patch in the
first half of the year high frequency indicators
picked up after the summer and the second half of
the year saw a high degree of stability in the most
commonly watched measures of activity with
retail sales industrial production and PMI
measures all moving in a narrow range This
pattern was reflected in the quarterly GDP
readings with a slightly weaker second quarter
outturn of 75 (y-o-y) followed by 78 growth
in the third quarter and 77 in the fourth quarter
Inflation remained relatively subdued throughout
2013 though has edged up in recent months to
stand at around 3
The weakening of the economy in the early part of
year and the subsequent return to higher growth in
the second half of the year reflects significant
developments in the composition of growth
During 2012 consumption had provided a
somewhat larger contribution to growth than
investment This pattern consistent with a
rebalancing of Chinas growth model away from
investment persisted into the first quarter of 2013
with consumption providing 42 pps of growth
while investment proved extremely weak
contributing just 23 pps Only an unusually large
positive contribution from net exports kept the
overall growth rate over 7 in the first quarter
The rest of the year however saw a marked shift in
the pattern of growth and a return to investment
led growth Investment sharply increased its
weight to 41 pps of growth in the second and to
43 pps in the third quarter while consumption
contributed somewhat less at 34 pps in the
second and 35 pps in the third quarter After the
positive first quarter net exports made a negligible
contribution to growth during the rest of 2013
held back in part by a rise in the RMB real
effective exchange rate of 7 over the year
alongside sluggish growth in world trade volumes
-2
0
2
4
6
8
10
12
14
10 11 12 13
Graph II361 China - Real GDP growth and
contributions
Consumption Investment
Net exports Real GDP (y-o-y)
pps
Outlook stable but risks are rising
During 2014 and 2015 a return to the modest
rebalancing of demand seen in 2012 is expected
with slower investment growth and consequently
slightly lower growth of GDP Consumption
growth is expected to remain fairly firm as
nominal wage growth is picking up after a fall in
2012 real interest rates on household deposit
holdings are fairly stable and policy initiatives to
raise consumption remain a political priority The
external sector however is likely to remain under
pressure due to overall still relatively moderate
recovery in many advanced economies as well as
the effects of appreciation of the RMB The impact
of recent financial turmoil on demand from other
emerging markets remains to be seen but the risks
appear mainly on the downside
While investment growth appears robust there are
major underlying concerns about sustainability
Not only is Chinas share of investment in GDP
still extremely high (close to 50) but in recent
years China has also seen a surge in real estate
investment very rapid credit growth and an
increasing share of new credit coming from
outside the traditional banking system (largely
securitised loans) Important concerns remain
regarding the implicit guarantees underpinning
Chinas economy continues to grow rapidly expanding by 77 in 2013 almost the same rate as in
2012 (78) Nevertheless there are rising concerns as the shift in composition of demand away from
investment and towards consumption observed in 2012 was reversed during 2013 Warning signals have
also emerged from the financial sector which has seen rapid credit growth and several recent spikes in
inter-bank interest rates Therefore while high frequency indicators remain steady and the short-term
forecast is unchanged at 74 for both 2014 and 2015 underlying risks remain significant
Other non-EU Countries China
123
lending via securitised trust loans mediated by
large banks A significant fraction of such loans
are due for repayment over the forecast horizon
and there are doubts about the quality of some of
the underlying assets
Increased signs of financial stress
Monetary policy remained accommodative
throughout the early part of 2013 with inter-bank
rates at around 3 but mid-year saw an important
turning point with inter-bank interest rates spiking
sharply in June to above 10 Inter-bank rates fell
subsequently on intervention by the Peoples Bank
of China but remain somewhat above the level
seen in the first half of the year at well over 4
Further smaller spikes in inter-bank rates were
seen in both December 2013 and January 2014
Concerns over solvency and liquidity risks linked
to excess investment and credit growth are not
new but have heightened during 2013 and the
outlook hinges to some extent on how the need to
curb a build-up of credit risk will be balanced with
the short-term growth targets A more rapid rise in
household consumption could offset a slowdown
in investment but a smooth rotation of demand is
challenging given the relative shares of investment
and consumption in GDP Reforms to raise the
household share of national income and thus boost
consumption do not yet seem to have had much
sustained traction at the macroeconomic level
Chinas real GDP is projected to continue to grow
at just under 75 for 2014 and 2015 This reflects
the view that China will gradually adjust to a lower
trend growth rate with lower investment growth
and higher consumption growth without a major
slowdown However while some global risks
linked to advanced economies have become more
balanced risks in other emerging markets have
become more pronounced Moreover domestic
downside risks from the financial sector appear to
have been heighted and the potential difficulties of
achieving a successful rebalancing of demand are
evident
bn CNY Curr prices GDP 94-09 2010 2011 2012 2013 2014 2015
519322 1000 103 116 94 78 77 74 74
190424 360 - - - - - - -
241757 457 - - - - - - -
141924 268 163 278 89 52 41 60 70
127292 241 153 201 101 62 44 63 73
- - - - - - - - -
- - - - - - -
- - - - - - -
- - - - - - -
10 - - - - - -
36 41 41 41 - - -
- - - - - - -
- - - - - - -
- - - - - - -
- - - - - - -
54 24 73 24 30 30 30
49 33 54 26 26
- - - - - - -
30 43 35 38 29 34 35
35 40 19 23 26 27 28
- - - - - - -
- - - - - - -
- - - - - - -
- - - - - - -
- - - - - - -
Cyclically-adjusted budget balance (c)
Real unit labour cost
Imports (goods and services)
General government balance (c)
Unit labour costs whole economy
Terms of trade goods
Table II361
Net exports
Gross fixed capital formation
Merchandise trade balance (c)
Employment
Annual percentage change2012
GDP
Consumption
Exports (goods and services)
Inventories
GNI (GDP deflator)
Structural budget balance (c)
Saving rate of households (b)
Main features of country forecast - CHINA
Unemployment rate (a)
Current-account balance (c)
Contribution to GDP growth
General government gross debt (c)
GDP deflator
Compensation of employees head
Domestic demand
Consumer-price index
Net lending (+) or borrowing (-) vis-a-vis ROW (c)
(a) Eurostat definition (b) gross saving divided by gross disposable income (c) as a percentage of GDP
37 EFTA Outperformance comes with a risk
124
In both Switzerland and Norway the
competitiveness of the domestic economy outside
the best-performing sectors has deteriorated as a
consequence of low productivity growth and high
wage increases alongside appreciation of the
national currency From 2001 to 2012 the real
effective exchange rate based on unit labour costs
appreciated by 79 annually in Norway and by
60 in Switzerland while for the simple average
of the euro area was 51 The disparity with the
euro area and an average of OECD countries has
become particularly large since 2008
Both Norway and Switzerland see a division
between the more and the less successful parts of
the economy In Norway there is the obvious
divide between the off- and the on-shore sectors
At the same time the disparity in unemployment
developments between regions like Zurich and
Ticino since 2009 is bigger than between the best
and worst performing in Norway
80
85
90
95
100
105
110
115
120
05 06 07 08 09 10 11 12 13
Hou
se p
rice
dis
posa
ble
in
com
e
Switzerland Norway Euro area
Index 2005Q1=100
Graph II371Developments in house prices
vs disposable income
The effect of lose monetary policy and capital
inflows on the housing market continues to be a
concern Credit to households has risen to high
levels in both countries On the asset side of
households there has been strong wealth creation
through increasing house prices The rise in house
prices has outpaced growth in disposable income
as shown in graph II371 Regardless of the high
volatility which is partly due to the data not being
seasonally adjusted there is a clear upward trend
in both countries Conversely for the euro area as
a whole the trend has been to the downwards since
the global economic and financial crisis
Switzerland
Since the autumn forecast the economic
projections for Switzerland have become slightly
more benign The estimation for GDP growth in
2013 has been revised upwards after surprisingly
positive figures for the third quarter of 2013 These
GDP growth figures also showed a broad based
growth Although indications are for a moderation
in the fourth quarter of 2013 the expectation is
that this year and next the Swiss economy will
grow above its potential output growth rate This is
the result of continued robust growth in domestic
demand and an increasing contribution from net
trade
Still growth is mostly demand driven and comes
at a time of strong immigration and loose monetary
conditions The comparison between real GDP
growth and real GDP growth per capita gives an
indication of the strength of the labour force
growth The recovery of real GDP per capita to the
2008 level took indeed four years while real GDP
more than recovered after a year One major
concern is that labour productivity growth has not
kept pace with these demand developments Most
forecasters currently suggest potential growth of
Switzerland to be around or just under 20
However hourly labour productivity growth
decreased from an average of 08 annually since
1999 to -02 since 2008 The current situation
seems neither supportive of further high labour
growth nor of further increases in capital inflows
through heightened risk aversion within the
developed markets portfolio of investors
Productivity growth will hence be key to
maintaining high economic growth
The EFTA region continues to outperform the EU by a sizeable margin with both Norway and
Switzerland benefiting from strong domestic demand and growing trade Any change in risk
perceptions however could jeopardise these countries success
Other non-EU Countries EFTA
125
Norway
The expectation at the time of the autumn forecast
that the growth dip registered end 2012 and early
2013 was temporary has come true However the
recovery was not as speedily as expected in
particular in fixed investment and exports As a
consequence estimated GDP growth for 2013 has
been revised downwards The outlook for 2014
and 2015 is more favourable on the back of
increased expectations for export growth The new
government has presented amendments to the
budget that are slightly more expansionary
Monetary policy is accommodative although the
tightening of capital requirements is a welcome
counterbalance Off-shore investment will
continue to provide an impetus albeit at a
moderated pace to manufacturing production but
the competitiveness of traditional manufacturing
will in parallel come under further pressure
Private consumption demand will feel the strain
from less wealth effects stemming from house
price developments that appear to have reached a
high in 2013
Real estate developments in Norway have gone
through two phases until 2013 First between
mid-2007 and mid-2009 banks have increased total
credit by around 15 of mainland GDP of which a
large part to households while house prices fell by
about 15 relative to disposable income Banks
balance sheets were thus expanded at a time when
the value of houses was falling in a context of
declining interest rates As a consequence housing
had become more affordable This created room
for house price increases even if banks balance
sheets had deteriorated When in the second
phase from mid-2009 house prices started to rise
faster than disposable income this was supported
by an increasing share of credit to households on
banks balance sheets in a low interest rate
environment
The biggest risk to the Norwegian economy is now
for a rise in interest rates to coincide with a
housing market that already started to cool down in
anticipation of increases in capital requirements
Moreover the net asset value of certain groups of
home owners is now relatively highly exposed to
changes in housing prices and interest rate
developments
(Annual percentage change) 2011 2012 2013 2014 2015 2011 2012 2013 2014 201513 29 13 27 26 18 10 18 21 22
26 30 24 17 16 11 24 22 20 18
11 18 22 20 19 12 32 22 10 10
77 83 59 39 35 45 -04 11 08 13
69 23 95 50 35 77 17 35 12 12
-07 11 -17 39 57 38 25 19 45 41
38 23 26 30 53 42 31 18 41 32
07 43 13 27 26 -34 31 22 24 25
Contribution to GDP growth Domestic demand 28 32 27 20 18 16 16 18 14 14
Inventories -01 -01 00 00 00 -01 -06 -02 00 00
Net exports -14 -02 -14 07 08 02 00 02 06 08
16 22 13 11 12 24 15 15 10 11
32 31 32 33 35 38 39 35 35 30
49 41 43 41 52 15 18 12 11 11
52 34 44 26 38 22 22 09 01 00
-14 06 25 03 09 18 21 -14 -31 -35
123 137 147 162 186 181 234 225 220 222
67 28 18 22 28 04 01 23 33 37
12 04 15 19 19 01 -07 00 11 11
138 22 -15 -08 11 -20 -04 06 22 21
139 138 121 125 131 25 26 27 35 45
131 141 119 120 127 105 123 127 141 155
131 140 119 120 127 102 129 127 139 152
134 138 135 131 129 07 05 00 -04 -09
- - - - - - - - - -
- - - - - - - - - -
287 278 274 264 249 352 347 340 333 330
Unit labour cost whole economy
Exports (good and services)
Terms of trade goods
Private Consumption
(a) as of total labour force (b) gross saving divided by gross disposable income (c) as a percentage of GDP
Net lending (+) or borrowing (-) vis-a-vis ROW
Harmonized index of consumer prices
Structural budget balance (c)
Saving rate of households (b)
Current account balance (c)
Cyclically adjusted budget balance (c)
Trade balance (c)
General government balance (c)
Table II371
General government gross debt (c)
GDP deflator
Compensation of employeehead
of which equipment
Unemployment rate (a)
Gross fixed capital formation
Main features of country forecast - EFTA
Real unit labour cost
Imports (goods and services)
Switzerland
Public Consumption
Employment
GNI (GDP deflator)
Norway
GDP
38 RUSSIAN FEDERATION Boosting investment remains a challenge
126
Weak performance in 2013
Real GDP growth slowed to reach 12 y-o-y in
the third quarter of 2013 and 13 for the year as
a whole Economic growth was weighed down by
slowing private consumption which decelerated
from close to 8 growth in 2012 to below 5 in
2013 However the biggest negative surprise came
from private investment which contracted by 03
in 2013 compared to 64 growth in 2012
Completion of large infrastructure projects carried
out by state owned companies (facilities for the
Winter Olympic Games in Sochi the North Stream
pipeline) added to this slump
-15
-10
-5
0
5
10
08 09 10 11 12 13 14 15
Graph II381 Russia - Real GDP growth and
contributions
Private consumpt Gov consumpt
GFCF Net exports
Inventories Real GDP (y-o-y)
forecastpps
Trade has followed a trend of import growth
exceeding that of exports although the gap seems
to be closing with the growth of exports picking up
to 38 in 2013 (from 14 in 2012) and growth
of imports declining from 88 in 2012 to 59 in
2013
Fiscal and monetary policy
As half of the federal budget revenues come from
oil and gas related sources the Russian economy
remains vulnerable to developments in oil prices
The fiscal rule which bases spending plans on the
long-term average oil price and caps the budget
deficit at 1 of GDP has so far not led to a
significant reduction in the non-oil deficit The
latter decreased marginally in 2013 to 101 from
105 in 2012
A shift in the monetary policy strategy to inflation
targeting and a floating exchange rate is to be
completed by 2015 To increase exchange rate
flexibility the Central Bank of Russia (CBR)
announced in January 2014 the end of targeted
intervention (aimed at neutralizing the volatility in
exchange rate arising from the external
environment) while non-targeted interventions
(aimed at non-fundamental factor driven
fluctuations) would still remain After falling to
61 in September inflation has picked up slightly
in recent months reaching 65 in December
2013 exceeding the CBR target range of 5-6 for
2013
A moderate pickup ahead
The prospect for 2014 is a moderate pick-up in
growth reflecting both an improving global
outlook and positive expectations for the domestic
economy ndash as measured by a rising composite
Russian PMI at 525 in December 2013 (the
highest level since March 2013)
Household consumption growth is expected to
remain strong albeit moderating slowly due to a
slightly negative trend in employment and an
increasing household debt burden which puts
pressure on real disposable incomes Government
consumption is expected to pick up slightly over
the forecast horizon supported by government
plans to boost investment in infrastructure through
public-private partnerships using money from the
National Welfare Fund
A rebound in investment should be among the
main drivers of GDP growth in 2014-15 Private
investment is expected to return to positive
territory as the temporary factors that have dragged
the 2013 investment growth down (completion of
large one-off investment projects) will expire
Russias economy is widely considered to be
running close to capacity which should underpin a
recovery in investment though this is expected to
Russia recovered briskly after the financial crisis of 2008-09 but the pace of growth has since slowed
reflecting both domestic and external weaknesses such as the economys over-reliance on commodity
exports low investment and lagging competitiveness GDP growth dropped from 34 in 2012 to 13
in 2013 but is expected to recover to around 23 in 2014 and 27 in 2015
Other non-EU Countries Russian Federation
127
be gradual given remaining weaknesses in the
business climate
Export volume growth is expected to accelerate in
2014 and 2015 mirroring the anticipated recovery
in main export markets Imports are set to pick up
on the back of higher final demand although at a
slower pace than in the past due to a weaker
exchange rate The current-account surplus is
expected to gradually diminish by 2015
A minor contraction in employment levels is
expected due to both demographic developments
(continuing decline in working age population) and
the lagged effect of the current slowdown
Unemployment is expected to rise from 55 in
2013 to 59 in 2014 and to 62 in 2015 The
government aims to keep the federal budget deficit
at 05 of GDP in 2014 (unchanged from 2013)
increasing it to 1 of GDP for 2015
The actual outcome of the budget balance depends
heavily on the price of oil which is expected to
remain at above USD 100barrel although
gradually decreasing over the forecast horizon
Inflation is expected to subside gradually in
2014-15 supported by a freeze in tariffs for natural
monopolies and broadly in line with CBR end-year
inflation targets of 5 in 2014 and 45 in 2015
The weakening of the ruble a consequence of
CBRrsquos transition towards fully flexible exchange
rate and uncertainty in emerging market
economies poses a risk of a rise in imported
inflation However given relatively strong
economic fundamentals recent financial turmoil is
not expected to cause major disruptions
bn RUB Curr prices GDP 94-09 2010 2011 2012 2013 2014 2015
625991 1000 - 45 43 34 13 23 27
308067 492 - 55 63 67 47 42 40
116648 186 - -15 08 -02 -01 05 05
131642 210 - 64 104 63 -03 32 40
- - - - - - - - -
184280 294 - 70 03 14 38 42 50
138601 221 - 258 203 95 59 65 73
606273 969 - 46 43 35 11 27 29
- 40 56 46 22 29 30
- 40 29 04 -06 -03 00
- -33 -42 -17 -02 -03 -03
- 07 13 11 -02 -06 -07
- 75 66 55 55 59 62
- - - - - - -
- - - - - - -
- - - - - - -
- - - - - - -
- 142 155 85 65 53 52
- 69 84 51 68 59 50
- 212 220 39 -38 -38 -19
- 100 105 97 85 77 74
- 47 52 38 20 10 01
68 46 52 36 20 10 01
- -12 42 16 06 01 -05
- - - - - - -
- - - - - - -
- 110 117 125 140 145 149
Net lending (+) or borrowing (-) vis-a-vis ROW (c)
(a) as of total labour force (b) gross saving divided by gross disposable income (c) as a percentage of GDP
Cyclically-adjusted budget balance (c)
Real unit labour cost
Imports (goods and services)
General government balance (c)
Unit labour costs whole economy
Inventories
Terms of trade goods
Table II381
Net exports
Public Consumption
Trade balance (c)
Employment
Annual percentage change2012
GDP
Private Consumption
Exports (goods and services)
GNI (GDP deflator)
Structural budget balance (c)
Saving rate of households (b)
Main features of country forecast - RUSSIA
Unemployment rate (a)
Gross fixed capital formation
Current-account balance (c)
Contribution to GDP growth
General government gross debt (c)
GDP deflator
Compensation of employees head
of which equipment
Domestic demand
Consumer-price index
ACKNOWLEDGEMENTS
129
This report was prepared in the Directorate-General for Economic and Financial Affairs under the
direction of Marco Buti ndash Director-General Servaas Deroose ndash Deputy Director-General and Elena
Flores ndash Director Policy strategy and co-ordination
Executive responsibilities were attached to Bjoumlrn Doumlhring ndash Head of Unit Economic situation forecasts
business and consumer surveys Evelyne Hespel ndash Head of Sector Macro-economic forecasts and short-
term economic developments and the forecast coordinators ndash Marco Fioramanti and Michał Narożny
The Overview was prepared by Evelyne Hespel Chapter 1 on The EU economy Recovery gaining
ground was prepared by Suzanne Casaux under the responsibility of Bjoumlrn Doumlhring This chapter
benefited from contributions by Chris Bosma Oliver Dieckmann Salvador Ferrandis Vallterra Marco
Fioramanti Marco Iezzi Joao Liborio Michał Narożny Bartosz Przywara Bjorn Roelstraete Rupert
Willis Przemysław Woźniak and Alexandru Zeana Boxes were contributed by Andreas Breitenfellner
Christina Jordan Kieran Mc Morrow Cecilia Moretti Rafal Raciborski Andreas Reuter and Stefan
Zeugner
The sections on Member States were prepared under the supervision of Matthias Mors Istvaacuten Paacutel
Szeacutekely and Peter Weiss Directors for the Economies of the Member States These sections benefited
from contributions by Frode Aasen Hanna Aspegren Wojciech Balcerowicz Davide Balestra Antonino
Barbera Mazzola Paolo Battaglia Barbara Bernardi Piotr Bogumił Ivan Csaba Nicolae Dragos Biea
Peghe Braila Raphaeumll Canceacute Jakob Christensen Ben Deboeck Francisco de Castro Gatis Eglitis
Riccardo Ercoli Raffaele Fargnoli Miroslav Floriaacuten Norbert Gaaacutel Ana Aguacutendez Garciacutea Julien Genet
Svetoslava Georgieva Michael Grams Oskar Grevesmuumlhl Valeska Gronert Renata Hrůzovaacute Michiel
Humblet Duy Huynh-Olesen Laacuteszloacute Jankovics Alexandra Janovskaia Markita Kamerta Csanaacuted Saacutendor
Kiss Mitja Košmrl Bozhil Kostov Mihaacutely Kovaacutecs Robert Kraemer Radoslav Krastev Bettina Cvetan
Kyulanov Vileta Kyviene Baudouin Lamine Jessica Larsson Julia Lendvai Joanna Leszczuk Milan
Lisickyacute Erki Lohmuste Mart Maivaumlli Janis Malzubris Anton Mangov Helena Marrez Dan Matei
Fabrizio Melcarne Olivia Mollen Alexander Molzahn Daniel Monteiro Magdalena Morgese Borys
Radostin Neykov Stelios Panagiotou Christos Paschalides Presiyan Petkov Nicolas Philiponnet
Dominik Pripužić Alexandra Puţinelu Diana Radu Vito Ernesto Reitano David Marco Riquelme
Alexia Schmiliver Ralph Schmitt-Nilson Martin Schroeder Giedrius Sidlauskas Peeter Soidla Vladimiacuter
Solanič Klara Stoviček Graham Stull Alina Tănasă-Troaşe Ingrid Toming Roberta Torre Tsvetan
Tsalinski Christoph Ungerer Thomas Usher Henk Van Noten Rafał Wielądek and Andreas Zenthoumlfer
Coordination and editorial support was provided by Barbara Kauffmann Head of Unit Coordination of
country-specific policy surveillance Judit Antal Kai Behrens Paolo Biraschi Martin Dederke Tiziana
Fabris Joumlrn Griesse Paz Guzman Caso de los Cobos Joao Liborio and Bartosz Przywara
The sections on Candidate Countries and Other non-EU countries were prepared under the
supervision of Peter Bekx Director of the International economic and financial relations global
governance These sections and forecasts for all other non-EU economies benefited from contributions
by Concha Artola Eglė Bajorinienė Bernhard Boumlhm Davide Cicero Hans Feddersen Matteo Fumerio
Clara Galliani Plamen Kaloyanchev Willem Kooi Safwan Naser Roxanne Rua Antonio Sanchez
Pareja Barbara Stearns-Blasing Rupert Willis and Przemysław Woźniak
Support on the communication and publication of this report by Sabine Berger Robert Gangl Anne-
Franccediloise Knuts Jens Matthiessen Irena Novakova Yasmina Quertinmont and Roman Schoumlnwiesner is
gratefully acknowledged IT support was provided by Youssef Tiani and Rudy Druine
Follow-up calculations were performed by Karel Havik Kieran Mc Morrow Fabrice Orlandi Rafał
Raciborski Werner Roumlger Anna-Elisabeth Thum and Valerie Vandermeulen Forecast assumptions were
prepared by Lucian Briciu Roberta Friz Clara Galliani Dalia Grigonyte Gerda Symens Andreacute
130
Verbanck and Przemysław Woźniak Statistical support for the production of the forecast tables was
provided by Antoine Avdoulos Noeumll Doyle Salvador Ferrandis and Bjorn Roelstrate Further statistical
and layout assistance was provided by Yves Bouquiaux Paolo Covelli Andrzej Erdmann Laszlo Elod
Fejer Georgios Gavanas Julien Genet Michel Gerday Susanne Hoffmann Jan Kattevilder Johann
Korner Oscar Gomez Lacalle Anders Lindqvist Vasiliki Michou Simona Pojar Daniela Porubskaacute
Ulrike Stierle-von Schuetz Jacek Szelożyński Zinovia Tsikalaki and Tomasz Zdrodowski
Valuable comments and suggestions by Ronald Albers Christopher Allen Alfonso Arpaia Laura
Bardone Moreno Bertoldi Gerrit Bethuyne Suzanne Casaux Nathalie Darnaut Oliver Dieckmann
Marie Donnay Patrick DSouza Marco Fioramanti Jakob Wegener Friis Carole Garnier Gabriele
Giudice Peter Grasmann Heinz Jansen Marco Iezzi Barbara Kauffmann Joost Kuhlmann Stefan
Kuhnert Martin Larch Geacuteraldine Mahieu Mary McCarthy Cecilia Moretti Michał Narożny Elena
Reitano Uwe Stamm Michael Stierle Massimo Suardi Michael Thiel Alessandro Turrini Charlotte
Van Hooydonk Christian Weise Peter Weiss Norbert Wunner and Javier Yaniz Igal are gratefully
acknowledged
Secretarial support for the finalisation of this report was provided by Kaacuteroly Csiszar and Els Varblane
Comments on the report would be gratefully received and should be sent to
Directorate-General for Economic and Financial Affairs
Unit A4 Economic situation forecasts business and consumer surveys
European Commission
B-1049 Brussels
E-mail ecfin-forecastseceuropaeu
Statistical Annex European Economic Forecast ndash Winter 2014
Contents
132
Output GDP and its components
1 Gross domestic product 134
2 Profiles (q-o-q) of quarterly GDP 134
3 Profiles (y-o-y) of quarterly GDP 135
4 GDP per capita 135
5 Final domestic demand 136
6 Final demand 136
7 Private consumption expenditure 137
8 Government consumption expenditure 137
9 Total investment 138
10 Investment in construction 138
11 Investment in equipment 139
12 Public investment 139
13 Potential GDP 140
14 Output gap relative to potential GDP 140
Prices
15 Deflator of GDP 141
16 Deflator of private consumption 141
17 Consumer prices index 142
18 Consumer prices quarterly profiles 142
19 Deflator of exports of goods 143
20 Deflator of imports of goods 143
21 Terms of trade of goods 144
Wages population and labour market
22 Total population 144
23 Total employment 145
24 Unemployment rate 145
25 Compensation of employees per head 146
26 Real compensation of employees per head 146
27 Labour productivity 147
28 Unit labour costs whole economy 147
29 Real unit labour costs 148
Exchange rates
30 Nominal bilateral exchange rates 148
31 Nominal effective exchange rates 149
32 Relative unit labour costs 149
33 Real effective exchange rates 150
Statistical Annex
133
General Government
34 Total expenditure 150
35 Total revenue 151
36 Net lending (+) or net borrowing (-) 151
37 Interest expenditure 152
38 Primary balance 152
39 Cyclically-adjusted net lending (+) or net borrowing (-) 153
40 Cyclically-adjusted primary balance 153
41 Structural budget balance 154
42 Gross debt 154
Saving
43 Gross national saving 155
44 Gross saving of the private sector 155
45 Saving rate of households 156
46 Gross saving of general government 156
Trade and international payments
47 Exports of goods and services 157
48 Imports of goods and services 157
49 Merchandise trade balance ( of GDP) 158
50 Current-account balance ( of GDP) 158
51 Net lending (+) or net borrowing (-) 159
52 Current-account balance (bn EUR) 159
53 Export markets (goods and services) 160
54 Export performance (goods and services) 160
World economy
55 World GDP 161
56 World exports of goods and services 162
57 Export shares (goods) in EU trade 162
58 World imports of goods and services 163
59 Import shares (goods) in EU trade 163
60 World merchandise trade balances (bn USD) 164
61 World current-account balances (bn USD) 164
62 Primary commodity prices 164
European Economic Forecast Winter 2014
134
Table 1
5-year
1995-99 2000-04 2005-09 2010 2011 2012 2013 2014 2015 2013 2014 2015
26 20 11 23 18 -01 02 14 17 01 11 14
16 11 07 40 33 07 04 18 20 05 17 19
57 73 12 26 96 39 07 23 36 13 30 39
101 58 15 -11 22 02 03 18 29 03 17 25
30 45 16 -49 -71 -64 -37 06 29 -40 06 29
36 36 16 -02 01 -16 -12 10 17 -13 05 17
24 20 06 17 20 00 03 10 17 02 09 17
18 15 -04 17 05 -25 -19 06 12 -18 07 12
47 34 29 13 04 -24 -60 -48 09 -87 -39 11
42 73 15 -13 53 52 40 42 43 40 41 42
47 42 20 31 19 -02 21 22 25 19 18 11
45 18 22 33 17 09 20 21 21 18 19 20
39 17 15 15 09 -12 -08 10 13 -10 02 12
30 19 14 18 28 09 03 15 18 04 16 18
39 14 03 19 -13 -32 -16 08 15 -18 08 15
43 37 23 13 07 -25 -16 -01 13 -27 -10 07
43 38 51 44 30 18 08 23 32 09 21 29
45 31 08 34 28 -10 -15 02 13 -06 06 16
24 19 07 19 16 -07 -04 12 18 -04 11 17
-03 54 39 04 18 08 06 17 20 05 15 18
22 36 35 25 18 -10 -12 18 22 -10 18 22
28 15 01 14 11 -04 03 17 18 03 17 18
44 18 -23 00 -20 -07 05 12 -07 05 12
46 69 23 16 60 37 32 35 39 34 36 39
24 42 03 11 16 -17 11 21 21 07 18 21
60 32 47 39 45 19 16 29 31 13 25 29
05 54 37 -11 22 07 35 23 25 22 21 24
34 29 10 66 29 09 09 25 33 11 28 35
36 32 06 17 11 03 19 25 24 13 22 24
22 09 20 17 -04 01 15 20 00 14 19
41 27 09 25 18 28 19 29 32 16 26 31
08 14 -03 47 -05 14 16 16 13 21 20 13
EU
averages
Cyprus
forecast
Romania
Spain
Croatia
Germany
Bulgaria
17022014
Lithuania
Estonia
Czech Republic
Austria
Gross domestic product volume (percentage change on preceding year 1995-2015)
Luxembourg
France
Autumn 2013
Ireland
Denmark
Finland
Belgium
forecast
Portugal
Italy
Slovakia
Netherlands
Winter 2014
USA
Latvia
Japan
Sweden
Hungary
United Kingdom
Poland
Greece
Euro area
Slovenia
Malta
Table 2 17022014
20131 20132 20133 20134 20141 20142 20143 20144 20151 20152 20153 20154
00 02 03 04 04 05 04 04 05 05 04 04
00 07 03 04 05 05 04 04 04 05 05 05
-03 -03 05 -01 05 09 10 10 09 08 07 07
-04 -01 01 03 04 03 04 04 05 05 05 04
00 06 00 03 02 03 03 05 05 04 05 05
-06 -03 00 01 03 03 04 04 03 03 02 02
17 00 12 07 10 10 11 11 10 10 11 11
-07 20 02 04 04 05 05 06 06 06 06 07
-03 01 03 07 00 01 02 03 03 04 05 06
01 00 02 03 06 06 06 06 06 06 07 07
-04 11 02 00 01 02 02 03 04 04 05 06
-03 -01 00 00 -01 00 03 04 04 04 04 05
03 03 03 04 06 09 08 10 08 07 08 09
-04 00 -02 -08 04 03 02 02 03 03 03 04
-02 03 01 03 03 04 04 05 05 05 05 05
01 -01 05 04 05 05 06 06 05 06 06 06
-13 03 02 16 03 06 06 07 08 09 09 10
-01 05 04 02 05 05 05 05 04 04 04 05
00 -02 -01
10 08 03 12 16 17 17 18 14 15 15 16
11 03 08 06 04 04 04 04 05 05 05 05
04 06 07 05 07 08 08 08 07 07 08 08
06 08 16 17 -04 02 02 05 06 08 10 08
05 -01 01 08 06 08 08 08 09 09 08 07
05 08 08 07 06 06 05 05 06 07 07 08
00 04 03 04 04 05 04 05 05 05 05 06
03 06 10 08 04 08 08 08 07 08 09 09
11 09 03 03 15 -11 06 04 04 04 09 -02
Estonia
EU
Czech Republic
Malta
Italy
Poland
Slovakia
Netherlands
Ireland
USA
Denmark
Cyprus
Profiles (qoq) of quarterly GDP volume (percentage change from previous quarter 2013-15)
United Kingdom
Bulgaria
Luxembourg
Germany
Hungary
Slovenia
France
Greece
Croatia
Euro area
Latvia
Belgium
Sweden
Lithuania
Portugal
Romania
Finland
Austria
Spain
Japan
Statistical Annex
135
Table 3 17022014
20131 20132 20133 20134 20141 20142 20143 20144 20151 20152 20153 20154
-05 01 04 09 13 15 17 17 17 17 17 17
-03 05 06 14 19 16 17 17 17 17 18 18
14 12 05 -02 -07 -15 -19 -27 -30 -29 -27 -25
-20 -16 -11 -01 06 10 12 13 15 17 18 18
-04 05 03 08 11 08 11 13 16 17 19 19
-26 -23 -19 -08 00 05 09 11 11 12 11 09
67 45 40 36 29 38 37 40 40 40 41 42
08 28 28 20 31 16 19 21 23 24 25 27
-14 -17 -06 07 10 11 10 06 08 10 13 16
05 03 04 05 10 16 20 23 23 23 24 25
-41 -20 -10 09 14 04 04 08 11 13 16 20
-30 -18 -13 -04 -03 -02 01 06 11 15 17 17
07 08 09 13 17 24 30 37 40 38 38 38
-28 -14 -11 -14 -05 -01 03 18 17 18 20 23
-12 -06 -03 05 12 11 13 14 16 16 18 17
04 02 07 10 14 19 19 21 21 22 22 22
-23 -17 -12 08 29 30 32 18 26 31 36 41
-07 05 05 10 16 15 16 20 19 18 18 17
-15 -08 -06
40 40 23 33 33 38 47 55 53 49 47 44
-01 06 17 28 24 24 20 18 19 20 21 22
08 13 18 22 25 28 30 33 33 32 32 32
23 16 41 47 38 32 17 06 16 21 30 32
16 06 03 13 14 24 32 31 34 35 34 34
07 20 19 28 29 26 24 22 22 23 25 28
-07 -01 02 10 15 15 16 17 18 19 20 20
13 16 20 27 28 30 28 28 31 32 32 33
-01 13 24 27 31 09 12 13 02 17 21 14
Estonia
EU
Czech Republic
Malta
Italy
Poland
Slovakia
Netherlands
Ireland
USA
Denmark
Cyprus
Profile (yoy) of quarterly GDP volume (percentage change from corresponding quarter in previous year 2013-15)
United Kingdom
Bulgaria
Luxembourg
Germany
Hungary
Slovenia
France
Greece
Croatia
Euro area
Latvia
Belgium
Sweden
Lithuania
Portugal
Romania
Finland
Austria
Spain
Japan
Table 4
5-year
1995-99 2000-04 2005-09 2010 2011 2012 2013 2014 2015 2013 2014 2015
24 16 04 14 09 -08 -04 09 11 -06 04 07
14 10 08 42 33 05 02 16 19 03 15 19
71 78 13 26 95 40 11 27 40 14 31 39
90 41 -07 -15 18 -01 03 09 18 -05 08 15
23 41 11 -52 -70 -63 -37 06 29 -40 06 29
33 22 01 -05 -01 -17 -07 16 22 -11 08 19
20 13 00 12 15 -05 -03 05 12 -03 04 12
17 13 -09 14 03 -28 -23 02 09 -23 03 09
32 22 08 -13 -21 -39 -69 -57 -01 -97 -49 01
53 84 26 08 73 65 51 52 51 49 50 50
34 29 03 12 -04 -24 04 06 10 02 02 -04
38 11 17 28 13 01 15 18 19 13 16 18
33 11 12 10 05 -16 -09 08 10 -13 00 09
28 15 10 15 25 04 00 12 15 00 12 14
36 08 01 19 -11 -28 -08 09 16 -10 09 16
44 35 19 09 05 -27 -18 -03 12 -28 -12 06
41 39 50 42 36 16 07 19 28 06 18 26
42 29 03 29 23 -15 -19 -02 08 -11 01 11
22 14 03 17 14 -09 -06 10 16 -07 08 15
02 65 44 11 44 14 13 24 27 14 26 29
23 37 30 22 20 -11 -12 17 20 -11 17 20
23 12 -03 09 07 -07 00 13 15 01 13 15
47 18 -20 17 -03 -06 06 14 -05 06 14
54 79 36 37 85 51 41 43 40 43 43 40
26 45 05 13 19 -12 13 22 22 09 19 22
59 33 47 29 45 19 16 30 32 13 26 30
07 61 39 -10 25 09 37 25 27 24 23 26
32 26 03 57 22 02 00 16 24 02 19 26
33 28 00 09 04 -06 12 18 17 06 15 16
19 05 17 15 -06 -01 13 18 -03 11 17
28 17 00 17 11 20 12 22 25 08 19 24
05 12 -03 42 -03 17 17 17 14 22 20 13
EU
averages
Cyprus
forecast
Romania
Spain
Croatia
Germany
Bulgaria
17022014
Lithuania
Estonia
Czech Republic
Austria
Gross domestic product per capita (percentage change on preceding year 1995-2015)
Luxembourg
France
Autumn 2013
Ireland
Denmark
Finland
Belgium
forecast
Portugal
Italy
Slovakia
Netherlands
Winter 2014
USA
Latvia
Japan
Sweden
Hungary
United Kingdom
Poland
Greece
Euro area
Slovenia
Malta
European Economic Forecast Winter 2014
136
Table 5
5-year
1995-99 2000-04 2005-09 2010 2011 2012 2013 2014 2015 2013 2014 2015
22 15 15 18 20 -06 -05 11 20 -04 10 15
16 01 06 24 28 -03 07 21 21 08 20 20
62 97 -02 01 131 55 23 27 38 24 32 41
84 51 10 -46 -18 -16 01 14 14 00 02 09
37 44 17 -70 -87 -96 -59 -11 15 -60 -11 24
42 42 14 -06 -20 -41 -28 02 10 -34 -08 09
22 22 11 17 20 -09 03 09 19 02 08 18
21 16 -03 21 -09 -52 -27 04 13 -29 06 13
44 45 36 19 -14 -42 -105 -68 00 -137 -58 10
85 -06 -14 108 25 32 44 48 33 45 48
51 31 11 91 42 25 19 23 23 16 21 25
18 21 19 -15 -20 12 17 19 08 14 19
43 11 15 -01 08 -16 -25 11 09 -37 -05 08
22 12 10 14 32 01 -10 12 14 -03 14 15
48 11 03 18 -51 -66 -28 -01 08 -37 -03 07
62 31 16 -05 -03 -64 -39 -19 01 -39 -26 -07
59 37 38 37 10 -41 -08 18 27 -19 16 25
43 29 11 29 42 -08 -19 -03 12 -08 08 14
17 08 12 08 -22 -09 10 17 -11 08 16
13 76 42 -48 00 35 -12 17 23 01 17 22
25 35 23 19 -01 -28 -11 06 17 -17 12 18
29 18 05 16 02 -01 10 15 16 06 14 16
52 17 -51 -03 -31 -05 02 12 -04 02 15
77 09 22 59 -05 33 39 43 36 39 43
18 45 -18 02 -05 -35 07 24 22 05 17 21
75 23 45 46 36 -01 -02 26 32 -07 19 27
19 75 56 -11 25 14 -07 20 29 -12 22 26
26 20 13 65 32 03 09 28 32 14 29 35
42 36 02 21 -01 12 20 24 23 10 19 20
21 09 15 08 -15 -03 14 19 -06 11 18
45 31 04 30 17 26 17 27 34 17 26 33
07 10 -05 29 04 23 18 17 10 19 16 10
EU
averages
Cyprus
forecast
Romania
Spain
Croatia
Germany
Bulgaria
17022014
Lithuania
Estonia
Czech Republic
Austria
Domestic demand volume (percentage change on preceding year 1995-2015)
Luxembourg
France
Autumn 2013
Ireland
Denmark
Finland
Belgium
forecast
Portugal
Italy
Slovakia
Netherlands
Winter 2014
USA
Latvia
Japan
Sweden
Hungary
United Kingdom
Poland
Greece
Euro area
Slovenia
Malta
Table 6
5-year
1995-99 2000-04 2005-09 2010 2011 2012 2013 2014 2015 2013 2014 2015
35 27 13 45 40 05 06 22 33 -01 25 31
28 19 14 63 45 09 07 31 38 06 29 37
75 97 02 96 178 56 20 34 46 15 39 48
123 67 19 13 22 02 02 22 28 03 16 26
46 45 12 -52 -72 -82 -42 01 24 -43 01 31
53 43 13 18 00 -26 -09 16 24 -14 08 22
31 25 08 32 27 -02 04 17 27 05 15 27
25 19 -04 39 06 -36 -21 11 22 -22 13 21
52 41 27 24 02 -38 -88 -55 07 -112 -48 12
83 09 28 113 49 23 44 52 31 46 53
72 58 25 78 51 -07 22 32 42 24 35 32
15 22 90 09 31 -10 29 40 -05 30 38
57 27 20 49 23 07 -07 20 30 -05 13 27
36 30 12 41 45 05 02 26 32 04 26 31
54 17 06 36 -23 -42 -04 14 21 -11 13 21
58 48 27 35 26 -34 -09 07 22 -16 -02 15
68 57 46 88 60 25 14 33 45 14 32 43
59 37 13 43 38 -06 -15 07 21 -10 16 22
27 10 41 25 -07 -02 21 30 -03 19 29
64 40 11 44 20 25 33 40 20 24 35
50 60 36 70 38 03 -04 30 38 -11 23 32
37 26 12 20 26 01 10 21 25 07 21 25
58 11 -25 03 -21 -07 08 18 -05 09 20
91 26 75 92 48 47 51 55 47 52 55
68 21 52 37 -09 29 39 42 21 36 42
82 43 50 67 48 11 14 34 42 12 29 38
25 92 55 21 45 02 33 31 39 18 30 36
45 31 14 82 42 05 01 28 39 02 31 45
46 38 06 31 09 12 17 25 26 14 23 24
30 12 41 24 -03 02 22 30 01 21 29
48 30 07 38 23 27 19 31 37 18 30 36
10 17 -05 54 03 20 18 19 15 21 22 14
EU
averages
Cyprus
forecast
Romania
Spain
Croatia
Germany
Bulgaria
17022014
Lithuania
Estonia
Czech Republic
Austria
Final demand volume (percentage change on preceding year 1995-2015)
Luxembourg
France
Autumn 2013
Ireland
Denmark
Finland
Belgium
forecast
Portugal
Italy
Slovakia
Netherlands
Winter 2014
USA
Latvia
Japan
Sweden
Hungary
United Kingdom
Poland
Greece
Euro area
Slovenia
Malta
Statistical Annex
137
Table 7
5-year
1995-99 2000-04 2005-09 2010 2011 2012 2013 2014 2015 2013 2014 2015
20 14 14 28 02 -03 06 15 19 05 12 15
15 07 05 10 23 08 09 15 18 09 14 16
70 83 18 -26 38 49 45 43 42 47 38 45
69 50 29 04 -14 -03 -06 08 10 -06 05 10
28 38 30 -62 -77 -91 -72 -16 14 -67 -16 14
34 36 14 02 -12 -28 -24 06 11 -26 01 10
21 22 15 16 06 -03 04 06 16 05 06 16
24 10 03 15 -03 -41 -25 01 09 -23 03 08
73 43 35 15 13 -25 -75 -63 07 -124 -57 16
79 24 23 48 58 55 49 51 60 49 50
36 22 13 26 13 22 20 23 26 12 14 23
27 23 -03 33 -05 06 19 22 06 17 22
42 14 03 03 -11 -16 -21 -05 10 -21 -11 07
16 17 13 20 08 05 -02 08 10 00 09 10
38 18 10 25 -33 -53 -18 01 08 -25 01 07
49 25 26 15 08 -48 -35 -20 -01 -35 -26 -12
52 39 50 -07 -05 -02 -01 12 23 08 09 19
38 32 19 33 25 03 -10 -02 14 -06 03 14
17 10 10 03 -14 -07 07 14 -07 06 13
03 66 38 01 15 26 -04 14 17 -03 13 16
29 31 29 09 05 -21 -04 04 20 03 10 20
17 15 13 13 -07 -01 04 14 17 03 14 17
46 14 -13 02 -29 -07 -05 05 -05 -05 05
80 30 -36 48 39 47 38 43 48 38 45
52 -05 -30 04 -16 00 15 16 05 12 15
61 31 39 31 26 12 08 20 25 06 16 20
35 81 64 -03 11 11 09 15 25 03 16 22
26 27 18 40 17 16 19 27 33 20 33 37
42 39 05 10 -04 15 24 24 22 16 17 19
23 11 11 03 -07 00 11 17 -01 09 15
42 34 13 20 25 22 20 27 30 19 23 28
10 10 04 28 03 20 20 05 06 19 08 08
EU
averages
Cyprus
forecast
Romania
Spain
Croatia
Germany
Bulgaria
17022014
Lithuania
Estonia
Czech Republic
Austria
Private consumption expenditure volume (percentage change on preceding year 1995-2015)
Luxembourg
France
Autumn 2013
Ireland
Denmark
Finland
Belgium
forecast
Portugal
Italy
Slovakia
Netherlands
Winter 2014
USA
Latvia
Japan
Sweden
Hungary
United Kingdom
Poland
Greece
Euro area
Slovenia
Malta
Table 8
5-year
1995-99 2000-04 2005-09 2010 2011 2012 2013 2014 2015 2013 2014 2015
17 21 17 06 07 14 06 05 14 04 05 07
16 06 18 13 10 10 11 15 12 11 15 12
20 22 33 -08 13 38 09 10 12 02 02 02
49 60 29 -49 -29 -32 -10 -28 -04 -10 -28 -25
26 49 27 -87 -52 -42 -61 -40 -12 -49 -40 -12
27 50 51 15 -05 -48 -11 -09 -02 -30 -21 -01
08 18 16 18 04 14 17 12 14 17 12 14
-01 27 09 -04 -12 -27 -06 -06 04 -12 -09 07
46 23 49 10 -02 -31 -60 -15 -27 -89 -37 -17
12 07 -79 11 -02 27 20 17 17 20 17
48 49 28 25 13 48 17 19 25 32 28 25
28 29 16 41 52 12 10 08 12 10 08
19 25 42 05 02 -07 -07 03 -09 -07 00 -05
29 05 22 02 03 02 01 08 08 09 08 08
37 25 17 01 -50 -47 -20 -25 -19 -40 -28 -22
34 31 33 13 -16 -13 -27 -16 03 -27 -25 -01
25 29 49 10 -43 -11 13 56 34 01 42 28
24 15 13 -04 05 05 -08 -07 09 07 09 08
20 22 06 -01 -05 03 05 07 00 03 07
-46 51 -07 19 16 -14 31 22 23 30 22 21
05 28 13 02 -27 -19 14 15 08 13 12 10
25 18 19 02 -14 04 03 15 06 04 06 06
09 24 -21 -06 -08 00 03 05 -10 05 05
22 12 -34 03 06 15 16 17 14 16 16
-18 32 00 -12 00 -12 11 15 20 08 15 20
29 28 49 41 -17 02 20 31 26 17 19 23
07 -20 19 -47 02 17 -15 18 15 00 18 13
09 04 11 21 08 03 12 09 07 10 11 07
16 38 16 05 00 16 05 05 04 00 -01 02
23 20 06 -02 -02 04 06 07 01 03 07
14 25 19 01 -27 -02 -21 -02 11 -18 -02 02
26 29 08 19 12 17 21 15 09 14 06 05
EU
averages
Cyprus
forecast
Romania
Spain
Croatia
Germany
Bulgaria
17022014
Lithuania
Estonia
Czech Republic
Austria
Government consumption expenditure volume (percentage change on preceding year 1995-2015)
Luxembourg
France
Autumn 2013
Ireland
Denmark
Finland
Belgium
forecast
Portugal
Italy
Slovakia
Netherlands
Winter 2014
USA
Latvia
Japan
Sweden
Hungary
United Kingdom
Poland
Greece
Euro area
Slovenia
Malta
European Economic Forecast Winter 2014
138
Table 9
5-year
1995-99 2000-04 2005-09 2010 2011 2012 2013 2014 2015 2013 2014 2015
34 18 16 -11 41 -20 -25 17 32 -26 10 27
17 -17 04 57 69 -21 -08 41 44 -09 44 44
96 152 -39 -73 376 109 14 17 54 00 36 57
149 50 -40 -227 -91 -06 38 105 54 29 44 54
79 68 -05 -150 -196 -192 -87 53 113 -59 53 113
74 52 -13 -55 -54 -70 -56 01 20 -66 -24 19
37 25 07 14 29 -12 -19 09 33 -23 06 34
36 26 -20 06 -22 -83 -55 16 37 -52 27 38
11 57 45 -49 -87 -196 -240 -181 13 -295 -119 22
140 -35 -181 279 87 -02 52 69 03 55 69
81 36 15 -07 121 35 21 29 18 11 27 31
27 -23 158 -215 -44 -20 13 18 -20 05 18
77 -14 16 -74 61 -40 -49 57 31 -85 09 27
19 10 -06 -14 85 16 -07 24 32 -17 22 30
82 -12 -17 -31 -105 -144 -80 12 37 -85 12 37
123 33 10 -153 -55 -82 -39 -21 07 -42 -27 04
66 08 26 65 142 -105 -67 02 33 -53 12 37
97 26 01 17 58 -08 -44 -10 17 -11 10 20
14 -03 -04 16 -40 -30 23 36 -33 19 36
27 143 107 -183 -65 08 17 24 42 21 24 42
41 37 33 10 04 -45 -40 12 22 -44 03 22
71 20 -06 -21 33 08 17 27 31 02 27 31
90 31 -150 -64 -46 -03 20 40 00 20 55
147 86 -15 19 207 -36 72 65 69 49 68 68
53 48 -07 -85 -59 -37 32 60 44 -04 38 43
156 -16 93 -04 85 -17 -04 41 61 -38 29 57
12 90 84 -18 73 49 -27 34 45 -20 35 44
65 24 20 72 82 33 -10 47 68 -26 51 75
70 23 -18 28 -24 07 -18 65 71 -08 50 53
17 00 -02 16 -30 -25 30 42 -29 25 40
75 27 -25 11 34 55 33 52 78 35 63 78
-05 -12 -25 -02 14 34 27 52 25 29 46 24
EU
averages
Cyprus
forecast
Romania
Spain
Croatia
Germany
Bulgaria
17022014
Lithuania
Estonia
Czech Republic
Austria
Total investment volume (percentage change on preceding year 1995-2015)
Luxembourg
France
Autumn 2013
Ireland
Denmark
Finland
Belgium
forecast
Portugal
Italy
Slovakia
Netherlands
Winter 2014
USA
Latvia
Japan
Sweden
Hungary
United Kingdom
Poland
Greece
Euro area
Slovenia
Malta
Table 10
5-year
1995-99 2000-04 2005-09 2010 2011 2012 2013 2014 2015 2013 2014 2015
11 05 14 60 39 -24 -29 07 18 -33 07 24
-11 -39 -05 32 78 -14 -03 36 28 -01 41 27
142 -21 -30 38 105 -29 -22 29 -60 -06 34
141 66 -57 -296 -156 -41 -14 89 25 -22 08 26
50 41 -30 -192 -210 -227 -135 24 99 -100 25 99
47 62 -17 -99 -108 -97 -100 -41 -19 -105 -58 -09
09 27 09 -32 14 -08 -25 -08 15 -26 -08 18
11 40 -19 -45 -37 -64 -68 -14 18 -62 08 10
55 34 -48 -79 -203 -249 -138 14 -309 -112 28
56 58 19 -100 40 -61 06 23 24 -04 23 30
-29 06 -87 -47
31 -09 12 -119 49 -76 -47 55 25 -84 04 19
01 02 -13 -39 25 25 02 19 22 04 15 20
73 -15 -36 -42 -115 -181 -136 -22 09 -148 -16 00
93 16 16 -205 -185 -65 -37 -34 02 -54 -44 01
-17 53 -77 74 -85 -69 20 34 -45 24 34
83 29 -04 72 49 -52 -36 -12 16 -11 06 20
12 12 -07 -41 -03 -42 -39 06 18 -40 06 18
122 178 -216 -222 -62 -10 24 34 -20 14 21
19 13 18 -01 -50 -53 -75 03 17 -62 -10 17
56 15 -27 -71 96 -54 -16 45 11 -19 48 38
50 08 -74 143 -40 41 50 50 18 48 48
60 -17 -137 -133 -91 43 56 42 -18 37 43
-16 88 22 78 -10 -27 39 54 -67 35 59
08 81 97 113 -43 35 -34 36 46 -31 33 44
-01 40 11 45 35 07 07 40 55 -12 40 60
47 14 -14 22 36 -40 -28 65 71 -13 43 56
17 13 -04 -31 04 -40 -35 17 28 -36 14 27
44 22 -66 -74 -16 77 38 46 77 34 54 75
-34 -35 -45 -31 -01
EU
averages
Cyprus
forecast
Romania
Spain
Croatia
Germany
Bulgaria
17022014
Lithuania
Estonia
Czech Republic
Austria
Investment in construction volume (percentage change on preceding year 1995-2015)
Luxembourg
France
Autumn 2013
Ireland
Denmark
Finland
Belgium
forecast
Portugal
Italy
Slovakia
Netherlands
Winter 2014
USA
Latvia
Japan
Sweden
Hungary
United Kingdom
Poland
Greece
Euro area
Slovenia
Malta
Statistical Annex
139
Table 11
5-year
1995-99 2000-04 2005-09 2010 2011 2012 2013 2014 2015 2013 2014 2015
64 22 14 -109 48 -32 -17 32 55 -21 16 29
60 07 07 100 58 -40 -22 48 71 -27 50 71
164 -84 -162 1228 117 65 60 80 64 80 80
173 13 09 -112 -15 23 92 120 65 92 85 65
147 106 26 -82 -181 -173 -30 88 130 -21 89 130
121 20 -11 50 55 -39 12 58 67 -03 26 60
78 17 -08 112 82 -30 -20 32 51 -37 11 51
60 15 -25 81 -07 -114 -43 53 58 -40 52 70
61 52 64 -69 -154 -155 -225 -140 30 -260 -143 14
129 -09 12 217 224 183 40 38 12 30 35 35
-47 483 -473 -135
115 -14 22 -30 95 15 -50 57 40 -86 18 40
34 11 00 21 143 21 -17 33 48 -45 34 48
112 -14 17 -26 -112 -98 16 60 77 10 49 81
148 59 -03 -93 142 -83 -41 -07 12 -24 -12 08
60 27 01 117 383 -115 -60 -28 34 -63 -05 43
115 11 10 -122 105 140 -37 -06 19 -11 18 19
75 13 -03 56 47 -48 -22 46 60 -29 37 61
162 13 -112 245 90 48 26 51 100 110 130
55 50 50 37 67 -56 -07 20 27 -26 15 27
67 19 07 16 -53 79 49 13 49 22 06 28
136 -79 206 372 -48 135 90 97 97 98 98
34 -04 -31 60 38 50 70 47 07 40 45
-19 97 -33 116 -39 34 45 72 10 20 55
24 97 86 -191 236 41 -20 35 45 -03 40 45
118 14 23 119 132 52 -26 53 79 -39 62 89
78 11 -34 99 -217 129 28 87 79 33 69 48
78 14 00 51 34 -28 -13 48 62 -20 39 60
102 23 -10 128 96 63 24 63 80 35 77 82
24 10 -08 26 34
EU
averages
Cyprus
forecast
Romania
Spain
Croatia
Germany
Bulgaria
17022014
Lithuania
Estonia
Czech Republic
Austria
Investment in equipment volume (percentage change on preceding year 1995-2015)
Luxembourg
France
Autumn 2013
Ireland
Denmark
Finland
Belgium
forecast
Portugal
Italy
Slovakia
Netherlands
Winter 2014
USA
Latvia
Japan
Sweden
Hungary
United Kingdom
Poland
Greece
Euro area
Slovenia
Malta
Table 12
5-year
1995-99 2000-04 2005-09 2010 2011 2012 2013 2014 2015 2013 2014 2015
18 17 16 16 18 18 17 16 16 17 17 17
20 17 15 17 17 15 16 16 16 15 15 16
46 43 48 39 41 54 44 40 40 46 41 39
26 38 42 34 24 19 18 17 16 18 17 17
30 35 33 23 17 18 23 25 22 20 20 20
33 34 40 40 30 17 16 14 14 14 12 12
30 30 33 31 31 31 32 31 30 32 31 30
22 23 24 21 20 19 20 19 17 20 18 17
31 33 33 38 35 25 21 23 23 19 17 17
16 18 45 37 43 42 43 40 36 43 40 37
41 44 37 41 38 38 33 33 32 35 35 35
37 39 34 21 25 31 28 28 29 30 31 31
31 33 34 36 33 33 33 33 33 33 33 33
23 13 11 11 10 10 10 10 10 10 10 10
46 41 30 38 26 17 19 18 17 19 18 17
31 32 40 45 36 32 34 35 35 31 35 35
37 28 21 26 23 19 12 13 13 16 13 13
28 26 25 25 25 26 26 26 26 26 26 25
25 25 26 26 24 21 21 21 20 21 20 20
21 32 46 46 34 34 37 39 38 40 42 44
41 41 45 42 36 32 29 29 29 32 32 32
18 18 19 22 22 26 24 25 22 23 24 23
24 23 20 21 25 28 21 24 27
26 28 43 46 44 37 36 36 35 35 35 34
20 38 36 34 31 34 41 49 44 41 48 44
36 32 43 56 57 46 39 40 39 36 35 33
28 32 55 57 55 47 45 44 44 45 44 46
33 29 32 35 34 35 35 35 33 35 34 33
14 15 19 25 22 22 20 20 20 22 22 22
27 25 23 23 23 22 23 22 22
37 37 39 41 38 36 27 27 26 27 26 26
58 46 33 33 31 32 35 38 38 39 40 40
EU
averages
Cyprus
forecast
Romania
Spain
Croatia
Germany
Bulgaria
17022014
Lithuania
Estonia
Czech Republic
Austria
Public investment (as a percentage of GDP 1995-2015)
Luxembourg
France
Autumn 2013
Ireland
Denmark
Finland
Belgium
forecast
Portugal
Italy
Slovakia
Netherlands
Winter 2014
USA
Latvia
Japan
Sweden
Hungary
United Kingdom
Poland
Greece
Euro area
Slovenia
Malta
European Economic Forecast Winter 2014
140
Table 13
5-year
1995-99 2000-04 2005-09 2010 2011 2012 2013 2014 2015 2013 2014 2015
22 20 16 12 13 09 06 07 11 07 09 09
16 14 12 10 13 14 15 15 16 14 15 15
58 39 -06 14 17 28 33 35 29 35 37
88 66 24 -12 -10 -06 04 09 17 -01 08 16
28 47 19 -17 -29 -31 -31 -28 -26 -34 -30 -27
26 37 26 03 -02 -08 -13 -11 -11 -13 -13 -11
18 19 16 10 11 10 10 10 10 10 10 10
15 14 05 -02 01 -09 -05 -02 00 -05 -01 01
36 29 11 02 -14 -27 -29 -27 -31 -32 -31
66 46 -20 -04 07 20 26 32 18 26 35
43 48 30 03 11 16 14 12 14 12 09 11
23 21 23 15 17 15 14 15 14 12 11
33 24 16 04 05 02 02 04 05 00 01 03
25 23 18 08 09 11 11 12 14 11 13 14
31 22 07 02 -01 -14 -07 -07 -03 -08 -05 -01
37 33 -01 -07 -10 -12 -05 01 -19 -09 -05
38 54 34 39 26 22 21 23 22 21 23
33 35 18 03 04 02 -01 00 03 03 04 06
21 15 06 06 04 04 05 07 04 05 07
38 49 11 08 09 11 15 18 11 15 18
30 40 17 11 05 04 07 10 06 08 11
23 16 13 06 07 07 06 10 12 09 12 16
24 -11 -16 -14 -09 -03 06 -10 -03 05
55 48 02 10 14 25 30 34 28 30 32
35 18 01 01 00 04 08 11 03 07 09
40 42 41 46 34 29 27 26 27 25 25
36 44 14 17 18 19 20 21 16 18 20
27 31 22 18 19 18 18 20 22 19 22 24
34 32 18 05 04 04 07 10 13 08 10 13
16 07 07 05 06 08 09 06 07 09
37 28 19 12 14 17 20 23 26 20 24 27
EU
averages
Cyprus
forecast
Romania
Spain
Croatia
Germany
Bulgaria
17022014
Lithuania
Estonia
Czech Republic
Austria
Potential GDP volume (percentage change on preceding year 1995-2015)
Luxembourg
France
Autumn 2013
Ireland
Denmark
Finland
Belgium
forecast
Portugal
Italy
Slovakia
Netherlands
Winter 2014
USA
Latvia
Japan
Sweden
Hungary
United Kingdom
Poland
Greece
Euro area
Slovenia
Malta
Table 14
5-year
1995-99 2000-04 2005-09 2010 2011 2012 2013 2014 2015 2013 2014 2015
-01 07 10 -08 -03 -13 -17 -11 -04 -17 -15 -10
-03 -01 -05 -13 06 -01 -11 -08 -04 -10 -07 -04
23 42 -65 11 32 12 03 04 12 07 08
15 18 04 -48 -18 -10 -12 -03 09 -09 -01 08
12 04 11 -47 -88 -119 -124 -94 -42 -128 -95 -43
-09 18 02 -47 -44 -52 -51 -31 -04 -52 -34 -07
-07 20 11 -21 -12 -22 -29 -29 -22 -29 -30 -23
06 16 10 -17 -14 -30 -43 -36 -24 -45 -37 -26
06 15 00 03 -07 -35 -53 -19 -58 -65 -25
02 39 -112 -61 -19 01 17 28 02 16 24
-10 20 05 -24 -16 -33 -27 -18 -07 -22 -12 -12
-03 -01 08 -03 -01 -10 -04 02 09 -05 02 11
01 -04 00 -15 -10 -25 -33 -27 -19 -34 -32 -23
-02 01 02 -19 00 -03 -10 -07 -03 -10 -07 -03
07 11 -05 -09 -21 -38 -46 -33 -15 -46 -34 -19
08 24 -25 -11 -27 -31 -28 -16 -31 -32 -20
-18 33 -07 -16 -24 -37 -35 -27 -33 -34 -27
-02 03 09 -26 -02 -15 -28 -26 -16 -27 -25 -16
09 04 -21 -12 -22 -30 -24 -13 -29 -24 -14
-45 09 36 -24 -14 -15 -19 -17 -15 -17 -17 -16
01 34 -10 -03 -18 -33 -23 -12 -34 -25 -14
10 11 13 -40 -36 -46 -49 -42 -36 -47 -43 -40
22 -34 -19 -24 -22 -15 -09 -21 -13 -07
-15 43 -79 -33 -11 -05 01 05 00 05 12
12 20 -37 -23 -39 -32 -20 -11 -35 -24 -13
-13 14 07 06 -08 -20 -19 -14 -21 -20 -16
-11 46 -23 -17 -29 -14 -11 -08 -18 -15 -12
-11 00 01 -14 -04 -12 -21 -16 -05 -23 -17 -06
08 02 00 -40 -33 -34 -24 -09 02 -22 -11 00
05 -24 -15 -24 -28 -21 -11 -28 -22 -12
-02 03 05 -23 -19 -09 -09 -04 03 -12 -10 -06
EU
averages
Cyprus
forecast
Romania
Spain
Croatia
Germany
Bulgaria
17022014
Lithuania
Estonia
Czech Republic
Austria
Output gap relative to potential GDP sup1 (deviation of actual output from potential output as of potential GDP 1995-2015)
Luxembourg
France
Autumn 2013
Ireland
Denmark
Finland
Belgium
forecast
Portugal
Italy
Slovakia
Netherlands
Winter 2014
USA
Latvia
Japan
Sweden
Hungary
sup1 When comparing output gaps between the spring and the autumn forecast it has to be taken into account that the overall revisions to the forecast may have led to changes in the estimates for potential output
United Kingdom
Poland
Greece
Euro area
Slovenia
Malta
Statistical Annex
141
Table 15
5-year
1995-99 2000-04 2005-09 2010 2011 2012 2013 2014 2015 2013 2014 2015
09 20 21 21 20 19 13 14 16 21 12 16
07 08 09 10 12 15 22 16 17 22 17 18
151 49 63 03 30 33 50 30 35 49 34 33
33 46 01 -15 07 07 06 07 11 07 08 11
64 34 31 11 10 -08 -26 -05 04 -17 -05 04
32 40 28 01 00 00 03 05 07 04 06 07
10 19 20 10 13 15 11 13 13 15 16 15
33 27 21 04 14 17 13 11 14 13 14 14
20 33 31 19 28 19 -23 06 15 06 11 15
87 40 104 -09 60 33 16 23 23 16 22 22
16 24 33 72 42 30 39 28 27 36 27 26
19 25 28 37 23 22 22 17 24 22 23 23
19 32 17 08 11 13 17 08 22 16 14 27
06 14 18 14 20 17 15 19 17 21 17 17
38 32 21 06 03 -03 17 09 10 19 09 10
111 60 31 -11 12 02 16 07 13 17 11 08
65 59 16 05 16 13 06 07 10 15 18 18
21 13 17 03 27 29 29 22 20 23 22 20
18 21 18 08 12 13 14 12 14 16 14 15
1160 48 72 28 49 22 22 09 20 29 19 22
78 27 15 -16 -09 16 13 13 19 12 08 13
16 24 24 43 07 23 24 13 15 14 15 16
40 40 08 20 20 19 14 18 17 19 19
145 05 55 23 54 26 17 16 25 18 24 28
179 80 40 24 26 32 22 21 23 28 27 23
151 35 30 14 32 24 05 14 18 10 18 19
591 281 111 57 42 46 36 29 27 42 30 26
15 15 22 08 13 10 07 12 17 14 11 14
22 20 25 31 23 17 17 19 21 12 14 15
23 21 12 15 15 14 14 16 15 15 16
16 22 23 12 20 17 15 15 18 14 13 18
-04 -14 -10 -22 -19 -09 -06 17 12 -03 20 12
EU
averages
Cyprus
forecast
Romania
Spain
Croatia
Germany
Bulgaria
17022014
Lithuania
Estonia
Czech Republic
Austria
Deflator of gross domestic product (percentage change on preceding year 1995-2015)
Luxembourg
France
Autumn 2013
Ireland
Denmark
Finland
Belgium
forecast
Portugal
Italy
Slovakia
Netherlands
Winter 2014
USA
Latvia
Japan
Sweden
Hungary
United Kingdom
Poland
Greece
Euro area
Slovenia
Malta
Table 16
5-year
1995-99 2000-04 2005-09 2010 2011 2012 2013 2014 2015 2013 2014 2015
10 21 22 20 31 24 12 08 15 11 12 13
09 13 12 20 21 16 16 15 16 17 17 18
137 36 49 24 49 36 36 18 28 32 26 29
31 40 02 -21 17 05 04 07 10 08 09 11
59 38 29 40 34 09 -13 -04 03 -10 -04 03
30 34 25 19 25 25 15 04 09 17 08 08
07 19 16 11 21 18 07 13 12 10 16 13
32 28 20 15 28 28 13 09 13 15 16 15
13 27 29 21 33 24 02 06 15 09 14 15
35 88 -17 49 31 00 18 20 04 20 20
18 22 24 14 26 16 17 17 18 17 19 18
15 25 30 09 21 10 12 19 11 18 21
21 29 13 15 24 22 22 14 15 28 20 22
13 17 20 18 36 26 22 17 18 22 18 18
31 31 18 13 25 15 05 10 12 06 10 12
111 60 30 15 17 16 11 05 13 21 19 16
73 61 29 10 38 34 15 08 15 15 18 20
14 17 19 19 35 29 19 18 18 19 18 18
22 18 16 24 21 13 11 14 15 15 15
1116 36 53 24 46 35 09 11 22 10 17 24
74 23 22 -02 05 27 12 13 18 10 06 16
17 19 18 27 27 28 08 17 19 09 15 15
33 37 16 26 35 26 13 18 26 18 20
-03 56 13 41 31 12 11 19 14 19 24
72 46 39 42 61 17 12 28 20 22 30
152 40 25 25 49 37 08 13 20 10 20 22
579 238 60 77 45 44 36 27 32 42 29 30
14 14 18 15 17 12 06 11 18 10 15 17
21 11 26 40 39 26 24 21 21 24 21 20
22 20 21 28 22 14 13 16 16 16 16
16 20 22 17 24 18 11 14 19 11 13 17
00 -10 -08 -17 -08 -08 -02 25 15 05 28 15
EU
averages
Cyprus
forecast
Romania
Spain
Croatia
Germany
Bulgaria
17022014
Lithuania
Estonia
Czech Republic
Austria
Price deflator of private consumption (percentage change on preceding year 1995-2015)
Luxembourg
France
Autumn 2013
Ireland
Denmark
Finland
Belgium
forecast
Portugal
Italy
Slovakia
Netherlands
Winter 2014
USA
Latvia
Japan
Sweden
Hungary
United Kingdom
Poland
Greece
Euro area
Slovenia
Malta
European Economic Forecast Winter 2014
142
Table 17 17022014
5-year
1995-99 2000-04 2005-09 2010 2011 2012 2013 2014 2015 2013 2014 2015
13 20 22 23 34 26 12 09 14 13 13 15
15 18 12 25 21 16 14 14 17 17 16
35 52 27 51 42 32 18 28 34 28 31
22 41 18 -16 12 19 05 08 11 08 09 12
58 34 31 47 31 10 -09 -06 02 -08 -04 03
28 32 27 20 31 24 15 03 09 18 09 06
13 20 17 17 23 22 10 12 12 10 14 13
30 25 21 16 29 33 13 09 13 15 16 15
31 22 26 35 31 04 04 14 10 12 16
32 84 -12 42 23 00 19 21 03 21 21
28 27 28 37 29 17 15 17 18 17 16
26 25 20 25 32 10 12 19 11 18 21
17 30 16 09 25 28 26 11 13 27 17 16
12 18 19 17 36 26 21 18 18 22 18 18
26 33 19 14 36 28 04 08 12 06 10 12
69 30 21 21 28 19 08 13 21 19 15
78 28 07 41 37 15 07 16 17 16 19
11 18 18 17 33 32 22 17 16 22 19 18
23 20 16 27 25 14 10 13 15 15 14
64 71 30 34 24 04 05 18 05 14 21
25 27 12 21 35 14 10 18 14 05 16
19 21 20 22 27 24 05 15 17 06 15 17
43 32 34 11 22 34 23 13 15 26 18 20
06 55 12 41 32 12 11 19 14 19 24
71 51 47 39 57 17 12 28 21 22 30
43 28 27 39 37 08 14 20 10 20 22
260 68 61 58 34 32 24 34 33 25 34
14 19 19 19 14 09 04 09 18 06 13 18
20 12 25 33 45 28 26 20 20 26 23 21
27 23 21 31 26 15 12 15 17 16 16
25 26 16 31 21 15 16 19 15 19 21
-02 -01 00 -07 -03 00 04 25 12 03 26 12
Harmonised index of consumer prices (national index if not available) (percentage change on preceding year 1995-2015)
Belgium
Hungary
forecast
Germany
Bulgaria
Italy
Greece
Euro area
Slovenia
Malta
Cyprus
Spain
Winter 2014
Estonia
Czech Republic
Slovakia
Japan
Croatia
Ireland
Denmark
Finland
United Kingdom
Poland
EU
Romania
Netherlands
USA
Latvia
Lithuania
Austria
Luxembourg
Sweden
France
Autumn 2013
forecast
Portugal
averages
Table 18 17022014
20131 20132 20133 20134 20141 20142 20143 20144 20151 20152 20153 20154
14 12 12 09 12 09 07 08 10 13 16 17
18 15 17 13 14 14 13 13 13 13 14 14
38 37 34 21 19 15 13 25 26 28 29 30
11 06 02 04 13 09 06 05 08 11 13 17
00 -04 -08 -22 -11 -07 -04 00 01 02 03 03
28 18 13 02 01 06 00 04 06 09 10 11
12 09 11 08 12 12 11 11 12 12 12 12
21 13 11 07 06 09 10 11 14 13 14 14
17 04 03 -08 00 03 07 09 12 14 15 16
04 -01 00 -02 08 22 23 23 22 21 20 21
22 17 17 12 12 15 14 17 17 18 17 18
19 08 07 06 13 09 12 13 15 20 20 21
32 30 28 13 09 07 12 14 11 10 12 17
26 22 20 16 16 17 18 19 18 18 18 18
04 08 04 01 07 05 07 11 12 12 12 12
27 18 22 11 08 11 06 08 11 12 13 14
22 17 14 05 03 05 07 12 15 16 16 18
25 24 21 18 18 18 18 13 12 15 15 20
18 14 14 08 10 11 10 11 12 12 13 14
21 11 -07 -10 -09 00 11 17 19 19 18 17
17 15 12 11 06 09 11 13 18 18 18 19
09 05 02 04 10 16 16 18 17 17 18 17
42 24 22 06 13 14 13 14 15 13 15 15
22 14 05 05 05 07 13 17 21 20 18 19
27 19 16 07 06 11 11 18 27 27 29 29
13 05 09 06 08 13 15 18 20 21 21 20
48 44 24 13 12 17 32 35 33 34 34 35
06 03 07 03 05 08 10 11 15 18 19 19
28 27 27 21 20 20 20 21 20 20 21 21
20 16 15 10 11 12 12 13 14 15 15 16
16 12 16 12 13 17 15 18 18 19 19 20
-06 -03 09 14 16 32 28 24 23 02 03 18
Estonia
EU
Czech Republic
Malta
Italy
Poland
Slovakia
Netherlands
Ireland
USA
Denmark
Cyprus
Harmonised index of consumer prices (national index if not available) (percentage change on preceding year 2013-15)
United Kingdom
Bulgaria
Luxembourg
Germany
Hungary
Slovenia
France
Greece
Croatia
Euro area
Latvia
Belgium
Sweden
Lithuania
Portugal
Romania
Finland
Austria
Spain
Japan
Statistical Annex
143
Table 19
5-year
1995-99 2000-04 2005-09 2010 2011 2012 2013 2014 2015 2013 2014 2015
-01 09 13 49 44 16 -08 01 13 06 04 13
00 02 02 24 32 12 -06 -03 09 -04 01 09
75 27 35 43 38 05 02 09 17 04 11 20
15 -07 -09 11 -09 47 01 05 11 10 12 11
41 34 21 79 82 38 -17 -04 01 -10 -04 01
19 14 16 25 51 20 -12 06 08 -14 03 09
01 -06 08 23 38 11 -04 -04 11 00 10 15
22 17 13 29 42 18 -03 01 12 -03 03 12
11 28 13 12 10 04 04 08 09 11 14
50 60 87 122 38 12 11 14 21 12 14
-04 14 27 61 48 29 -18 15 11 -03 15 11
-02 13 08 107 -23 20 -01 16 -15 -01 16
-01 05 08 64 53 22 -05 -09 20 -10 -01 20
05 03 12 27 30 06 -11 00 11 -10 00 11
10 08 07 51 68 16 -03 10 10 -06 08 10
58 53 12 22 45 10 -03 06 14 10 13 12
30 53 -02 31 39 09 -20 -16 10 15 14 15
-09 -11 -14 48 51 08 -06 -01 10 02 08 12
05 07 33 39 15 -06 -02 11 -03 04 12
28 46 110 117 37 -25 -02 14 20 28 32
37 -04 -19 -13 09 31 12 32 15 14 06 11
03 14 21 55 51 31 05 01 12 03 20 22
44 24 21 65 37 09 15 20 09 21 24
16 29 124 135 36 -17 -04 18 -02 15 22
09 07 17 34 30 05 06 06 07 16 19
97 45 26 04 74 42 -01 08 13 08 08 13
539 223 58 72 97 93 -26 09 12 -05 07 15
-05 -03 25 -08 -16 -22 -37 05 06 -22 01 02
-17 00 33 62 73 -11 01 05 10 -07 -03 01
06 11 33 42 15 -06 00 11 -03 04 11
-15 12 16 50 76 04 -03 -01 06 -02 09 14
-11 -19 -17 -18 -21 -21 90 10 10 120 10 10
EU
averages
Cyprus
forecast
Romania
Spain
Croatia
Germany
Bulgaria
17022014
Lithuania
Estonia
Czech Republic
Austria
Price deflator of exports of goods in national currency (percentage change on preceding year 1995-2015)
Luxembourg
France
Autumn 2013
Ireland
Denmark
Finland
Belgium
forecast
Portugal
Italy
Slovakia
Netherlands
Winter 2014
USA
Latvia
Japan
Sweden
Hungary
United Kingdom
Poland
Greece
Euro area
Slovenia
Malta
Table 20
5-year
1995-99 2000-04 2005-09 2010 2011 2012 2013 2014 2015 2013 2014 2015
05 16 12 71 67 14 -05 -03 12 -02 05 12
-06 05 00 51 61 16 -25 -07 09 -20 -02 09
95 06 22 60 61 25 -09 07 15 -03 09 20
-01 -09 01 48 56 54 -01 03 12 13 15 12
40 34 29 59 76 48 -19 -03 -01 -12 -03 -01
11 14 09 49 89 44 -18 -07 09 -12 04 10
-01 -03 05 47 65 20 -10 05 12 -16 09 13
13 24 18 70 81 28 -19 -09 12 -16 -01 13
16 24 22 30 21 17 08 13 25 21 18
59 59 76 61 80 09 11 14 16 14 15
10 14 12 10 25 35 -01 06 10 -01 06 10
08 48 25 89 -22 15 -02 15 -14 -02 15
-07 -02 09 80 51 27 -15 -08 10 -15 00 10
09 01 15 43 62 21 -16 -03 12 -17 03 12
06 12 04 50 79 14 -15 01 06 -22 01 06
47 55 13 73 61 22 -02 -02 14 06 17 22
41 49 09 40 55 22 -14 -15 15 15 15 15
-13 -03 05 76 75 26 -18 -01 10 -05 07 16
08 08 57 66 23 -17 -05 10 -14 02 11
26 47 85 97 40 -38 02 16 -05 28 36
30 -06 -12 10 31 37 06 30 10 07 05 12
-07 03 13 42 70 28 -25 02 18 -10 19 21
25 19 16 58 36 02 05 15 07 10 15
-15 37 109 142 46 -21 -05 15 -05 12 21
17 15 19 51 42 02 05 04 04 15 20
122 52 16 18 95 58 05 10 18 08 12 18
523 205 07 61 69 60 -23 17 13 -06 13 16
01 10 25 03 -03 -18 -31 12 10 -19 12 12
-20 -04 43 54 87 -07 -03 01 03 -03 01 03
09 13 52 67 21 -14 -02 10 -11 04 11
-20 17 24 67 88 06 -12 01 09 -09 14 20
01 05 19 57 73 -02 110 28 10 155 28 10
EU
averages
Cyprus
forecast
Romania
Spain
Croatia
Germany
Bulgaria
17022014
Lithuania
Estonia
Czech Republic
Austria
Price deflator of imports of goods in national currency (percentage change on preceding year 1995-2015)
Luxembourg
France
Autumn 2013
Ireland
Denmark
Finland
Belgium
forecast
Portugal
Italy
Slovakia
Netherlands
Winter 2014
USA
Latvia
Japan
Sweden
Hungary
United Kingdom
Poland
Greece
Euro area
Slovenia
Malta
European Economic Forecast Winter 2014
144
Table 21
5-year
1995-99 2000-04 2005-09 2010 2011 2012 2013 2014 2015 2013 2014 2015
-07 -07 01 -21 -21 02 -03 04 00 09 -01 00
06 -02 02 -25 -27 -04 19 05 00 16 04 00
-19 21 13 -16 -22 -19 11 02 02 07 02 00
16 02 -10 -36 -62 -07 02 02 -01 -03 -03 -01
01 00 -08 18 06 -10 02 -01 02 02 -01 03
08 00 07 -23 -35 -23 06 13 -01 -02 -01 -01
02 -03 03 -23 -26 -10 06 -09 -01 17 02 01
09 -07 -04 -39 -36 -10 16 10 00 13 04 -01
-05 04 -09 -18 -11 -13 -04 -05 -16 -10 -04
-08 01 11 58 -38 03 00 00 05 -02 -01
-14 00 15 51 22 -06 -17 09 01 -02 09 01
-10 -33 -17 17 -02 05 01 01 -01 01 01
07 07 00 -14 02 -04 11 -01 10 05 -01 10
-04 02 -02 -15 -30 -14 05 03 -01 07 -03 -01
04 -04 04 01 -10 02 11 10 04 16 08 04
11 -01 00 -48 -16 -12 00 08 00 04 -04 -10
-10 04 -11 -08 -15 -13 -06 -01 -05 00 -01 00
04 -08 -19 -26 -22 -17 12 00 00 07 01 -04
-03 -01 -23 -25 -07 12 03 01 12 02 01
02 -01 23 18 -03 14 -04 -02 25 00 -04
08 02 -07 -23 -21 -06 06 02 05 07 01 -01
11 11 08 13 -18 03 31 -01 -06 13 01 01
18 05 04 07 00 07 10 05 01 11 09
31 -08 14 -06 -10 04 01 03 03 03 01
-08 -08 -02 -17 -12 03 01 01 03 01 -01
-22 -06 10 -14 -19 -15 -06 -02 -05 00 -04 -05
11 15 51 10 26 32 -03 -07 -01 01 -06 -01
-06 -13 01 -11 -13 -05 -06 -07 -04 -03 -11 -10
03 05 -09 08 -13 -04 04 04 07 -04 -04 -02
-02 00 -18 -22 -07 11 02 01 11 00 01
05 -04 -08 -16 -11 -01 09 -01 -04 07 -04 -06
-13 -24 -36 -70 -88 -19 -18 -18 00 -30 -18 00
EU
averages
Cyprus
forecast
Romania
Spain
Croatia
Germany
Bulgaria
17022014
Lithuania
Estonia
Czech Republic
Austria
Terms of trade of goods (percentage change on preceding year 1995-2015)
Luxembourg
France
Autumn 2013
Ireland
Denmark
Finland
Belgium
forecast
Portugal
Italy
Slovakia
Netherlands
Winter 2014
USA
Latvia
Japan
Sweden
Hungary
United Kingdom
Poland
Greece
Euro area
Slovenia
Malta
Table 22
5-year
1995-99 2000-04 2005-09 2010 2011 2012 2013 2014 2015 2013 2014 2015
02 04 07 09 09 07 06 05 06 07 07 06
02 01 -02 -01 00 02 02 02 01 02 02 01
-14 -04 -02 00 00 00 -04 -04 -04 -01 -01 -01
10 16 22 05 04 03 00 09 10 08 09 10
06 03 04 02 -01 -01 00 00 00 00 00 00
03 13 15 03 01 01 -05 -05 -06 -02 -02 -02
04 07 06 05 05 05 05 05 05 05 05 05
00 03 05 03 02 03 04 04 03 04 04 03
14 12 21 26 26 15 10 10 10 10 10 10
-11 -11 -11 -21 -18 -12 -10 -09 -08 -09 -09 -08
13 12 17 19 23 23 17 16 15 17 16 15
07 07 06 05 04 08 05 03 02 05 03 02
06 06 03 05 05 04 01 03 03 03 03 03
01 04 04 02 03 05 03 03 03 04 04 04
03 06 02 00 -01 -04 -07 -01 -01 -07 -01 -01
-01 01 04 04 02 02 02 02 02 02 02 02
02 00 01 02 -06 02 01 03 03 03 03 03
03 02 04 05 05 05 05 05 05 05 05 05
02 05 05 02 02 02 02 02 02 02 02 02
-06 -11 -05 -07 -25 -06 -07 -07 -07 -09 -11 -10
-01 -01 06 02 -02 01 00 00 01 00 00 01
04 03 04 04 04 04 02 04 03 02 04 03
-06 -03 -01 -03 -17 -17 -01 -02 -02 -01 -02 -02
-07 -08 -13 -21 -22 -13 -08 -07 -01 -08 -07 -01
-02 -03 -02 -02 -03 -05 -02 -01 -01 -01 -01 -01
00 00 00 10 00 00 00 00 -01 00 -01 -01
-02 -07 -02 -02 -04 -02 -03 -02 -02 -03 -02 -02
02 03 07 09 08 07 09 09 09 09 09 09
03 04 06 08 08 08 07 07 07 08 08 08
02 03 04 03 02 02 02 02 02 02 02 02
12 10 09 08 07 07 07 07 07 07 07 07
03 02 00 04 -02 -02 -02 -01 -01 -01 00 00
EU
averages
Cyprus
forecast
Romania
Spain
Croatia
Germany
Bulgaria
17022014
Lithuania
Estonia
Czech Republic
Austria
Total population (percentage change on preceding year 1995-2015)
Luxembourg
France
Autumn 2013
Ireland
Denmark
Finland
Belgium
forecast
Portugal
Italy
Slovakia
Netherlands
Winter 2014
USA
Latvia
Japan
Sweden
Hungary
United Kingdom
Poland
Greece
Euro area
Slovenia
Malta
Statistical Annex
145
Table 23
5-year
1995-99 2000-04 2005-09 2010 2011 2012 2013 2014 2015 2013 2014 2015
11 08 12 07 14 02 -03 03 08 -05 04 08
06 02 07 05 14 11 06 05 06 05 05 06
-30 04 -03 -48 70 22 14 02 03 16 03 08
56 29 11 -41 -18 -06 22 15 14 12 13 13
07 13 14 -26 -56 -83 -37 06 26 -35 06 26
31 32 07 -23 -22 -48 -33 01 11 -36 -07 09
09 11 04 00 07 00 -04 03 05 -02 03 04
04 12 -01 -11 01 -11 -18 01 05 -16 02 05
27 21 -02 05 -42 -57 -44 08 -78 -37 10
-20 08 -20 -67 15 14 21 20 20 25 20 20
35 37 34 18 30 25 17 17 19 17 15 17
11 02 15 21 25 24 24 22 20 23 18 18
25 02 09 -06 05 -03 -12 -04 06 -12 -05 06
05 04 07 06 14 13 06 07 08 05 07 08
15 08 -04 -15 -15 -42 -32 -04 04 -39 -05 04
08 10 -22 -16 -08 -20 -11 -03 -24 -13 -05
-01 14 -15 18 01 -08 05 07 -03 03 05
22 10 11 -01 15 01 -06 00 03 -06 00 03
10 05 -06 02 -08 -09 03 07 -09 02 07
05 20 -39 -22 -25 -02 02 04 -10 02 05
-07 -03 12 -10 00 04 10 02 06 11 00 06
11 00 08 -25 -02 -03 01 05 05 00 04 05
12 15 -51 -23 -39 -25 -02 05 -17 01 05
-07 -04 -01 -119 05 18 15 15 13 15 14 12
00 -07 08 03 01 03 06 06 01 08 05
02 -14 28 -27 06 01 -03 02 04 -04 01 04
-34 -27 -05 -03 -08 13 02 04 07 06 06 07
07 07 05 10 21 07 09 09 10 08 09 10
13 09 03 02 05 12 10 13 10 07 09 10
06 06 -08 02 -03 -04 05 07 -04 03 07
16 08 01 -06 06 18 10 15 16 11 13 15
-03 -04 -01 -04 -02 00 04 05 03 04 05 03
EU
averages
Cyprus
forecast
Romania
Spain
Croatia
Germany
Bulgaria
17022014
Lithuania
Estonia
Czech Republic
Austria
Total employment (percentage change on preceding year 1995-2015)
Luxembourg
France
Autumn 2013
Ireland
Denmark
Finland
Belgium
forecast
Portugal
Italy
Slovakia
Netherlands
Winter 2014
USA
Latvia
Japan
Sweden
Hungary
United Kingdom
Poland
Greece
Euro area
Slovenia
Malta
Table 24
5-year
1995-99 2000-04 2005-09 2010 2011 2012 2013 2014 2015 2013 2014 2015
92 75 78 83 72 76 84 85 82 86 87 84
90 90 91 71 59 55 53 52 51 54 53 51
100 113 75 169 125 102 88 83 77 93 90 82
94 43 64 139 147 147 131 119 112 133 123 117
103 105 89 126 177 243 273 260 240 270 260 240
172 112 111 201 217 250 264 257 246 266 264 253
107 87 88 97 96 102 108 110 110 110 112 113
112 88 70 84 84 107 122 126 124 122 124 121
32 42 46 63 79 119 160 192 184 167 192 184
165 127 97 195 162 150 119 105 92 117 103 90
27 31 47 46 48 51 59 60 59 57 64 65
59 73 66 69 65 64 65 64 64 64 63 63
54 36 40 45 44 53 67 74 72 70 80 77
42 41 46 44 42 43 49 48 47 51 50 47
63 59 90 120 129 159 165 168 165 174 177 173
71 64 55 73 82 89 102 108 107 111 116 116
132 187 126 145 137 140 142 139 134 139 137 133
129 92 75 84 78 77 82 83 81 82 83 81
88 85 102 102 114 121 120 117 122 122 118
133 160 77 103 113 123 129 127 121 129 124 117
56 81 63 73 67 70 70 68 66 71 70 67
57 49 44 75 76 75 70 69 67 73 72 70
149 103 118 135 159 176 176 172 169 167 161
98 144 76 178 154 134 118 104 96 117 104 95
89 59 80 112 109 109 102 96 93 110 104 101
120 187 113 97 97 101 104 103 101 107 108 105
53 71 67 73 74 70 72 72 71 73 71 70
86 63 71 86 78 80 80 77 73 81 79 74
70 50 57 78 80 79 76 68 65 77 75 73
90 81 97 97 105 109 107 104 111 110 107
49 52 59 96 89 81 74 65 58 75 69 65
37 50 43 51 46 43 40 38 38 40 39 38
EU
averages
Cyprus
forecast
Romania
Spain
Croatia
Germany
Bulgaria
17022014
Lithuania
Estonia
Czech Republic
Austria
Unemployment rate sup1 (number of unemployed as a percentage of total labour force 1995-2015)
Luxembourg
France
Autumn 2013
Ireland
Denmark
Finland
Belgium
forecast
Portugal
Italy
Slovakia
Netherlands
Winter 2014
USA
Latvia
Japan
Sweden
Hungary
sup1 Series following Eurostat definition based on the labour force survey
United Kingdom
Poland
Greece
Euro area
Slovenia
Malta
European Economic Forecast Winter 2014
146
Table 25
5-year
1995-99 2000-04 2005-09 2010 2011 2012 2013 2014 2015 2013 2014 2015
21 26 27 14 31 34 23 06 19 22 11 15
14 13 08 24 30 26 20 28 31 19 27 31
221 114 109 23 05 60 67 60 68 67 69 70
42 65 39 -38 -01 08 -03 -06 06 00 -06 -03
94 63 34 -26 -34 -42 -78 -15 00 -70 -15 00
28 32 46 04 13 02 05 06 06 10 01 01
21 28 27 25 25 22 16 13 16 14 13 15
31 30 27 28 13 10 13 11 15 13 12 16
49 28 26 25 -09 -50 -30 09 -95 -46 -14
123 79 180 -49 50 73 43 50 46 43 50 46
21 33 32 26 24 20 15 31 25 08 29 23
46 48 34 16 09 21 14 15 17 21 17 20
27 47 27 15 16 19 02 19 13 -01 17 14
23 19 30 12 24 26 23 20 20 23 19 19
65 40 32 20 -06 -20 27 -08 10 25 -08 -02
91 53 39 16 -10 10 -03 09 -02 00 11
87 70 51 20 28 09 29 30 20 30 30
30 33 34 18 32 35 24 16 16 24 16 16
26 25 20 22 20 15 16 19 15 16 18
79 106 99 68 29 44 35 36 35 36 35
112 80 39 31 23 23 -10 20 22 -09 17 19
38 37 35 35 13 14 12 18 20 14 18 21
57 45 19 30 32 22 10 18 10 15 20
266 61 88 72 63 38 44 38 46 43 38 45
128 47 -05 36 08 24 35 32 -05 41 39
216 53 41 82 51 34 28 33 39 25 31 34
679 349 180 -33 -41 83 58 56 45 58 44 46
37 43 27 31 09 31 24 28 31 26 30 34
45 45 35 31 20 19 19 21 28 13 17 28
34 27 26 21 20 16 19 22 15 17 22
43 36 27 28 31 21 17 24 32 15 25 31
03 -12 -13 04 06 -01 00 15 09 -07 25 13
EU
averages
Cyprus
forecast
Romania
Spain
Croatia
Germany
Bulgaria
17022014
Lithuania
Estonia
Czech Republic
Austria
Compensation of employees per head (percentage change on preceding year 1995-2015)
Luxembourg
France
Autumn 2013
Ireland
Denmark
Finland
Belgium
forecast
Portugal
Italy
Slovakia
Netherlands
Winter 2014
USA
Latvia
Japan
Sweden
Hungary
United Kingdom
Poland
Greece
Euro area
Slovenia
Malta
Table 26
5-year
1995-99 2000-04 2005-09 2010 2011 2012 2013 2014 2015 2013 2014 2015
11 05 05 -06 00 09 11 -01 04 11 -01 02
05 00 -04 04 09 10 04 13 14 02 10 13
74 75 58 -01 -42 22 30 42 39 34 42 40
11 24 37 -17 -18 03 -07 -13 -04 -08 -14 -14
33 24 04 -63 -65 -51 -66 -11 -03 -61 -11 -03
-02 -01 20 -15 -11 -22 -10 02 -03 -07 -07 -07
14 08 11 13 04 04 09 00 03 04 -03 02
-01 02 07 13 -15 -17 00 02 02 -02 -04 01
22 -01 04 -08 -33 -51 -36 -06 -103 -59 -29
42 84 -33 01 41 43 32 26 38 30 26
04 10 08 13 -02 04 -02 14 07 -09 10 04
32 08 -14 00 00 04 03 -02 10 -01 -01
07 17 13 00 -08 -04 -20 06 -02 -29 -03 -08
09 02 10 -06 -12 00 02 03 02 01 01 01
33 09 14 07 -30 -34 23 -17 -03 19 -17 -14
29 23 24 00 -25 -01 -08 -04 -23 -18 -05
24 40 41 -18 -06 -06 21 15 05 12 10
16 15 15 -01 -03 05 05 -02 -02 05 -02 -02
04 07 03 -03 00 03 05 05 00 01 04
41 50 73 21 -06 35 24 14 25 18 11
35 55 17 33 19 -03 -22 07 04 -19 10 03
21 18 17 08 -14 -13 04 01 01 05 03 06
23 07 03 05 -02 -04 -03 00 -15 -02 00
65 30 59 21 06 32 27 26 29 18 21
52 01 -42 -06 -49 07 23 04 -25 19 09
56 12 16 56 02 -03 19 19 19 15 10 12
63 89 113 -102 -82 37 20 28 12 15 14 15
22 29 09 16 -07 19 18 16 13 16 14 17
24 33 10 -08 -19 -06 -05 00 07 -11 -04 08
12 07 05 -06 -03 01 05 06 -01 01 05
27 15 05 11 07 03 05 09 12 04 12 13
03 -03 -05 21 14 07 02 -10 -06 -12 -03 -02
EU
averages
Cyprus
forecast
Romania
Spain
Croatia
Germany
Bulgaria
17022014
Lithuania
Estonia
Czech Republic
Austria
Real compensation of employees per head sup1 (percentage change on preceding year 1995-2015)
Luxembourg
France
Autumn 2013
Ireland
Denmark
Finland
Belgium
forecast
Portugal
Italy
Note See note 6 on concepts and sources where countries using full time equivalents are listed
Slovakia
Netherlands
Winter 2014
USA
Latvia
Japan
Sweden
Hungary
sup1 Deflated by the price deflator of private consumption
United Kingdom
Poland
Greece
Euro area
Slovenia
Malta
Statistical Annex
147
Table 27
5-year
1995-99 2000-04 2005-09 2010 2011 2012 2013 2014 2015 2013 2014 2015
14 11 -01 16 04 -03 05 11 09 06 07 06
10 09 00 35 19 -04 -01 12 14 -01 12 13
89 69 17 77 24 17 -07 21 33 -03 27 31
43 28 05 31 40 08 -19 02 14 -09 04 12
23 32 02 -24 -16 21 00 00 03 -05 00 03
05 03 10 22 23 33 21 10 06 24 12 08
15 08 03 18 13 01 06 06 12 04 06 13
13 03 -03 28 03 -15 00 04 07 -02 05 07
07 09 15 00 18 -03 -04 01 -10 -02 01
64 64 38 57 37 37 19 22 23 14 20 22
12 05 -13 13 -10 -26 04 05 06 02 03 -05
34 17 07 12 -08 -15 -04 -01 01 -05 01 03
14 15 06 21 04 -10 04 14 07 02 07 06
24 15 07 11 14 -04 -03 08 11 -01 09 10
23 07 07 35 03 10 17 11 11 22 13 10
29 13 35 24 -17 04 10 17 -02 03 12
39 37 60 12 17 16 18 25 12 18 24
23 21 -03 34 13 -11 -09 02 10 -01 06 13
09 02 26 14 02 05 09 10 04 08 10
48 19 44 41 34 08 16 16 15 12 14
30 39 23 35 19 -14 -21 15 16 -21 17 16
17 15 -07 39 13 00 02 11 13 02 13 13
31 03 30 24 20 18 07 06 11 04 07
53 74 24 153 55 19 17 21 26 19 21 27
43 10 02 13 -18 08 14 15 06 10 16
58 47 18 67 39 18 19 27 27 17 24 25
41 84 42 -09 30 -06 33 19 17 16 15 17
27 23 04 55 08 02 00 15 22 03 19 25
23 22 03 15 06 -09 08 12 14 06 13 14
17 03 28 14 -01 05 10 12 04 10 12
25 18 08 31 13 10 09 14 16 05 13 16
11 18 -02 51 -03 14 12 11 10 17 15 10
EU
averages
Cyprus
forecast
Romania
Spain
Croatia
Germany
Bulgaria
17022014
Lithuania
Estonia
Czech Republic
Austria
Labour productivity (real GDP per occupied person) (percentage change on preceding year 1995-2015)
Luxembourg
France
Autumn 2013
Ireland
Denmark
Finland
Belgium
forecast
Portugal
Italy
Slovakia
Netherlands
Winter 2014
USA
Latvia
Japan
Sweden
Hungary
United Kingdom
Poland
Greece
Euro area
Slovenia
Malta
Table 28
5-year
1995-99 2000-04 2005-09 2010 2011 2012 2013 2014 2015 2013 2014 2015
07 15 28 -03 27 37 18 -05 10 16 04 09
04 04 08 -11 10 31 22 16 17 20 15 18
121 42 91 -50 -18 42 75 39 34 70 41 39
-01 36 34 -67 -40 00 16 -08 -08 09 -10 -15
70 30 32 -01 -18 -62 -78 -15 -03 -65 -15 -03
23 29 36 -17 -10 -30 -16 -04 00 -13 -11 -06
06 19 24 07 12 21 10 07 04 10 07 03
17 27 30 00 10 25 13 07 08 16 07 09
41 19 11 25 -27 -47 -26 08 -85 -44 -15
55 14 136 -101 12 35 23 28 23 28 29 24
10 27 46 14 34 47 11 26 20 07 26 28
11 31 26 03 17 37 18 16 16 26 16 17
14 31 20 -06 12 29 -03 05 06 -04 09 08
-01 03 22 00 10 30 26 12 10 25 09 08
41 33 24 -14 -09 -30 10 -19 -01 03 -21 -12
60 40 04 -07 08 07 -13 -07 00 -03 -02
46 32 -09 08 10 -08 12 05 08 13 06
07 11 37 -16 19 46 33 13 07 25 10 04
18 23 -06 07 18 10 07 08 11 07 08
29 85 52 25 -05 36 19 19 20 23 21
80 39 16 -04 05 38 11 05 07 12 -01 02
21 22 42 -05 00 15 10 07 06 11 05 08
26 41 -11 07 12 04 03 11 00 11 13
202 -12 62 -70 07 19 26 17 19 24 16 18
82 36 -07 23 27 16 20 17 -11 31 23
149 06 22 14 11 15 09 06 12 08 06 09
613 244 133 -24 -68 90 24 36 27 41 29 29
09 20 23 -23 01 29 24 12 09 23 10 09
22 22 32 17 14 29 10 09 14 07 03 14
22 26 -03 07 20 10 08 09 10 07 09
18 18 19 -03 18 11 08 10 15 10 12 14
-08 -30 -10 -45 08 -16 -11 04 -02 -23 10 03
EU
averages
Cyprus
forecast
Romania
Spain
Croatia
Germany
Bulgaria
17022014
Lithuania
Estonia
Czech Republic
Austria
Unit labour costs whole economy sup1 (percentage change on preceding year 1995-2015)
Luxembourg
France
Autumn 2013
Ireland
Denmark
Finland
Belgium
forecast
Portugal
Italy
Note See note 6 on concepts and sources where countries using full time equivalents are listed
Slovakia
Netherlands
Winter 2014
USA
Latvia
Japan
Sweden
Hungary
sup1 Compensation of employees per head divided by labour productivity per head defined as GDP in volume divided by total employment
United Kingdom
Poland
Greece
Euro area
Slovenia
Malta
European Economic Forecast Winter 2014
148
Table 29
5-year
1995-99 2000-04 2005-09 2010 2011 2012 2013 2014 2015 2013 2014 2015
-03 -06 07 -23 07 18 05 -18 -06 -04 -09 -06
-04 -04 -01 -21 -02 16 -01 00 00 -02 -02 00
-26 -06 26 -53 -47 09 24 09 00 21 07 06
-32 -09 33 -53 -46 -06 10 -15 -19 01 -19 -25
05 -03 01 -13 -29 -55 -53 -10 -07 -49 -10 -07
-09 -11 08 -18 -10 -29 -19 -09 -07 -17 -17 -13
-03 00 05 -03 -01 06 -01 -06 -09 -05 -09 -12
-16 -01 09 -04 -04 08 00 -04 -06 02 -07 -05
09 -11 -09 -03 -46 -25 -32 -07 -90 -54 -30
-30 -25 30 -93 -46 01 07 05 00 12 07 02
-07 04 13 -54 -07 17 -26 -02 -07 -28 -01 02
-08 06 -01 -33 -06 14 -04 -01 -08 03 -07 -06
-06 00 04 -14 00 15 -20 -03 -16 -19 -05 -19
-07 -10 04 -14 -10 13 11 -07 -07 04 -08 -09
03 00 03 -21 -11 -27 -07 -28 -11 -16 -30 -22
00 09 15 -19 05 -09 -19 -20 -17 -14 -10
-12 16 -14 -08 -02 -14 05 -05 -06 -05 -12
-14 -02 19 -20 -08 16 04 -08 -13 02 -11 -16
-03 05 -14 -05 04 -03 -05 -06 -05 -07 -07
-18 12 24 -22 -26 14 10 00 -09 04 -01
02 12 00 12 14 21 -02 -09 -12 00 -09 -11
05 -02 17 -45 -07 -08 -14 -06 -09 -03 -10 -08
-14 01 -19 -13 -08 -14 -11 -06 -17 -07 -06
49 -17 07 -91 -44 -07 09 01 -06 05 -08 -10
02 -04 -30 -03 -05 -05 -01 -06 -38 04 01
-02 -28 -07 00 -20 -08 04 -08 -06 -02 -11 -10
14 -29 20 -77 -106 42 -12 07 -01 -01 -01 02
-06 05 01 -31 -12 19 17 01 -08 09 -01 -05
00 02 07 -14 -09 12 -06 -10 -07 -06 -11 -01
-03 05 -15 -07 05 -04 -05 -06 -05 -08 -06
02 -04 -04 -15 -02 -06 -07 -05 -03 -04 00 -04
-04 -16 00 -24 27 -06 -06 -13 -14 -21 -10 -09
EU
averages
Cyprus
forecast
Romania
Spain
Croatia
Germany
Bulgaria
17022014
Lithuania
Estonia
Czech Republic
Austria
Real unit labour costs sup1 (percentage change on preceding year 1995-2015)
Luxembourg
France
Autumn 2013
Ireland
Denmark
Finland
Belgium
forecast
Portugal
Italy
Note See note 6 on concepts and sources where countries using full time equivalents are listed
Slovakia
Netherlands
Winter 2014
USA
Latvia
Japan
Sweden
Hungary
sup1 Nominal unit labour costs divided by GDP price deflator
United Kingdom
Poland
Greece
Euro area
Slovenia
Malta
Table 30
5-year
1995-99 2000-04 2005-09 2010 2011 2012 2013 2014 2015 2013 2014 2015
09883
09891
09889
09981
09241 09976
09895
09998
10224
09992 09879 09930
09489 08555 09963 10084 10049 09921 09981 09965
09883
10330 09644 10003
09868
09892
09902
07412 09377 09999
13249 13949 11352
09871
12279 19504 19558 19558 19558 19558 19558 19558 19558 19558 19558 19558
356033 328417 274541 252840 245898 251491 259798 275227 275261 257140 256034 256034
74212 74414 74528 74473 74506 74437 74579 74610 74610 74579 74592 74592
70843 75206 73254 72891 74390 75217 75786 76274 76274 75760 76170 76170
47191 35285 34528 34528 34528 34528 34528 34528 34528 34528 34528 34528
2126594 2529736 2591018 2754805 2793726 2892494 2968700 3092900 3099400 2963621 2953624 2953624
36904 40928 39085 39947 41206 41847 41975 41679 41678 41984 41873 41873
08205 31051 36809 42122 42391 44593 44190 45154 45155 44190 44502 44502
88443 90220 96042 95373 90298 87041 86515 88591 88590 86286 87695 87695
07340 06462 07474 08578 08679 08109 08493 08299 08299 08505 08463 08463
11797 10280 13471 13257 13920 12848 13281 13620 13619 13274 13572 13572
1331808 1183271 1453816 1162386 1109586 1024919 1296627 1422212 1422150 1287548 1327554 1327554Japan
Nominal bilateral exchange rates against Ecueuro (1995-2015)
Luxembourg
Sweden
France
Hungary
Ireland
Denmark
Finland
Belgium
forecast
Portugal
United Kingdom
Italy
Poland
Greece
17022014
Lithuania
Estonia
Czech Republic
Austria
Autumn 2013
Euro area
Slovenia
Malta
averages
Cyprus
forecast
Spain
Croatia
Germany
Bulgaria
Slovakia
Netherlands
Winter 2014
USA
Latvia
EU
Romania
Statistical Annex
149
Table 31
5-year
1995-99 2000-04 2005-09 2010 2011 2012 2013 2014 2015 2013 2014 2015
00 09 09 -24 03 -20 23 12 00 22 06 00
08 12 09 -36 01 -23 31 17 00 30 08 00
09 06 10 -30 -04 -15 14 14 00 13 06 00
-02 13 15 -35 08 -36 31 12 00 31 08 00
14 13 09 -24 10 -14 21 18 00 21 08 00
-02 11 09 -24 04 -18 21 12 00 20 06 00
07 11 10 -31 02 -24 30 15 00 29 08 00
11 14 09 -32 04 -21 28 17 00 28 08 00
75 14 11 -25 02 -20 25 11 00 24 05 00
27 -08 -05 -29 04 01 10 10 00 09 04 00
01 05 07 -20 00 -15 16 07 00 15 03 00
08 11 10 -36 03 -21 26 10 00 26 05 00
01 08 09 -24 02 -17 20 10 00 20 05 00
11 08 05 -25 -01 -13 20 12 00 19 05 00
-02 06 07 -18 03 -15 15 08 00 15 04 00
-34 -34 03 -17 04 -06 13 11 00 13 04 00
-08 24 63 -22 02 -04 13 11 00 12 03 00
14 12 10 -39 -01 -27 31 20 00 30 10 00
16 24 21 -67 05 -44 61 33 00 59 16 00
-468 33 09 -22 13 -07 21 22 00 20 10 00
03 36 43 26 31 -32 -19 -49 00 -10 04 00
07 09 11 -40 -04 -25 25 16 00 24 08 00
04 12 09 -12 -16 -22 09 03 00 09 00 00
50 56 07 -26 04 -14 17 12 00 16 06 00
-115 09 -16 -02 -10 -45 -09 -29 -02 -10 01 00
-76 -08 15 62 -28 -27 13 12 00 09 00 00
-323 -152 -02 -13 04 -59 28 05 01 27 -01 00
13 05 -21 74 59 11 36 -01 00 41 04 00
41 07 -48 03 -09 44 -18 46 00 -19 21 00
26 35 07 -73 10 -52 82 60 -01 80 30 00
45 -14 -12 -31 -53 40 32 25 00 31 00 00
-04 -04 22 61 59 32 -185 -41 02 -180 -15 00
EU
averages
Cyprus
forecast
Romania
Spain
Croatia
Germany
Bulgaria
17022014
Lithuania
Estonia
Czech Republic
Austria
Nominal effective exchange rates to rest of a group sup1 of industrialised countries (percentage change on preceding year 1995-2015)
Luxembourg
France
Autumn 2013
Ireland
Denmark
Finland
Belgium
forecast
Portugal
Italy
Slovakia
Netherlands
Winter 2014
USA
Latvia
Japan
Sweden
Hungary
sup1 37 countries EU TR CH NO US CA JP AU MX and NZ
United Kingdom
Poland
Greece
Euro area
Slovenia
Malta
Table 32
5-year
1995-99 2000-04 2005-09 2010 2011 2012 2013 2014 2015 2013 2014 2015
-04 05 00 17 16 06 -15 -01 05 -07
-18 -18 -08 00 11 11 07 06 10 05
24 56 -35 -29 13 53 25 21 52 28
18 11 -65 -52 -18 06 -17 -20 -01 -20
-02 01 -02 -25 -85 -91 -27 -18 -77 -26
06 11 -16 -19 -49 -29 -12 -11 -25 -20
-01 00 12 03 02 -01 -03 -08 -01 -03
05 05 03 01 05 01 -03 -04 05 -03
15 -09 12 22 -32 -41 -32 -01 -81 -49
-03 103 -87 04 09 04 15 08 11 16
09 21 17 24 23 -02 17 08 -05 17
16 06 07 08 18 10 08 05 19 08
14 -03 -02 02 06 -17 -05 -07 -17 00
-16 -01 06 01 06 12 01 -03 12 -02
12 -02 -09 -15 -42 04 -26 -10 -04 -26
40 14 08 -15 -17 -08 -24 -20 -14 -14
25 09 -06 00 -16 -22 01 -07 -05 02
-08 12 -11 09 24 19 02 -06 11 -02
-07 -06 -07 -01 01 -01 -06 -06 -01 -06
-11 52 55 27 -31 23 05 03 06 09
22 -07 01 -05 13 -03 -06 -06 -01 -12
05 17 00 -12 -08 -05 -04 -06 -02 -06
02 15 -08 -02 -12 -10 -07 -01 -14 00
-32 28 -58 -02 -07 09 04 04 08 03
61 11 -02 18 00 02 09 04 -26 19
-13 -02 20 03 -10 -06 -06 -01 -06 -05
208 103 -24 -75 62 07 23 12 24 15
01 -05 -21 -12 06 09 01 -05 09 -02
03 09 23 04 11 -01 00 03 -04 -07
-04 02 -03 -03 04 -03 -08 -09 -04 -12
-02 -05 01 02 -07 -06 -04 00 -02 -03
-49 -34 -48 -07 -34 -24 -07 -16 -38 -04
EU
averages
Cyprus
forecast
Romania
Spain
Croatia
Germany
Bulgaria
17022014
Lithuania
Estonia
Czech Republic
Austria
Relative unit labour costs to rest of a groupsup1 of industrialized countries (nat curr) (percentage change over preceding year 1995-2015)
Luxembourg
France
Autumn 2013
Ireland
Denmark
Finland
Belgium
forecast
Portugal
Italy
Note See note 6 on concepts and sources where countries using full time equivalents are listed
Slovakia
Netherlands
Winter 2014
USA
Latvia
Japan
Sweden
Hungary
sup1 37 countries EU TR CH NO US CA JP AU MX and NZ
United Kingdom
Poland
Greece
Euro area
Slovenia
Malta
European Economic Forecast Winter 2014
150
Table 33
5-year
1995-99 2000-04 2005-09 2010 2011 2012 2013 2014 2015 2013 2014 2015
05 13 -24 20 -04 29 -04 -01 28 -01
-06 -09 -44 01 -12 42 24 06 40 13
31 66 -64 -33 -02 68 39 21 65 34
32 26 -98 -45 -54 37 -05 -20 30 -12
11 10 -25 -14 -98 -72 -09 -18 -57 -18
17 21 -39 -15 -66 -09 00 -11 -05 -14
10 10 -19 05 -21 29 13 -08 28 05
19 14 -29 05 -16 30 14 -04 32 05
29 02 -13 24 -51 -17 -21 -01 -59 -44
-11 98 -114 08 10 13 25 08 20 20
14 29 -03 24 08 14 24 08 10 20
27 16 -29 11 -04 36 18 05 45 13
22 06 -26 04 -11 03 05 -07 03 04
-08 05 -20 00 -07 33 13 -03 31 03
19 06 -27 -12 -56 19 -17 -10 11 -22
04 17 -09 -12 -23 05 -13 -20 -01 -10
50 73 -28 02 -20 -10 12 -07 07 05
05 22 -50 08 -04 50 22 -07 42 07
17 15 -74 03 -43 59 27 -06 58 09
21 62 32 41 -38 44 28 03 26 19
59 36 27 26 -19 -22 -55 -06 -11 -08
14 29 -40 -16 -33 20 12 -07 22 02
14 25 -21 -17 -34 00 -04 -01 -05 00
22 35 -83 02 -21 26 17 04 24 08
71 -06 -04 08 -45 -07 -21 01 -36 20
-21 12 83 -25 -37 06 07 -01 03 -05
25 101 -37 -71 -01 35 28 13 52 14
06 -26 51 46 18 45 00 -05 51 02
10 -39 27 -05 55 -19 46 03 -23 13
31 09 -76 07 -48 79 52 -09 76 17
-16 -17 -30 -52 33 26 21 00 29 -04
-53 -12 10 52 -02 -204 -48 -14 -211 -19
EU
averages
Cyprus
forecast
Romania
Spain
Croatia
Germany
Bulgaria
17022014
Lithuania
Estonia
Czech Republic
Austria
Real effective exchange rate ulc relative to rest of a group sup1 of industrialised countries (USD) ( change on preceding year 1995-2015)
Luxembourg
France
Autumn 2013
Ireland
Denmark
Finland
Belgium
forecast
Portugal
Italy
Note See note 6 on concepts and sources where countries using full time equivalents are listed
Slovakia
Netherlands
Winter 2014
USA
Latvia
Japan
Sweden
Hungary
sup1 37 countries EU TR CH NO US CA JP AU MX and NZ
United Kingdom
Poland
Greece
Euro area
Slovenia
Malta
Table 34
5-year
1995-99 2000-04 2005-09 2010 2011 2012 2013 2014 2015 2013 2014 2015
512 496 503 524 533 549 544 539 539 540 540 539
497 472 456 479 452 447 447 446 445 447 445 442
395 351 371 405 376 395 387 383 377 386 376 367
372 330 392 655 472 427 425 403 391 423 401 376
447 455 482 513 519 536 588 480 455 582 471 451
421 388 407 463 457 478 449 438 433 446 438 432
537 526 538 565 559 566 572 571 570 570 568 566
502 472 489 505 499 507 511 505 500 512 505 501
357 404 431 462 460 453 461 473 463 481 480 460
385 359 386 434 384 364 362 357 351 362 357 352
403 403 401 435 426 443 434 433 435 440 440 447
409 423 428 416 416 433 442 444 442 445 443 445
482 458 466 514 499 505 499 504 493 502 510 495
544 516 498 528 508 517 516 518 515 521 517 513
418 435 461 515 493 474 491 468 453 491 468 453
465 464 449 494 499 481 599 493 480 501 520 484
490 439 370 400 384 378 369 377 373 360 370 362
566 491 503 555 548 563 576 578 579 575 580 579
498 472 476 510 495 499 499 494 490 498 493 488
414 398 381 374 356 359 380 386 387 376 381 384
445 449 424 438 432 445 432 430 428 434 432 431
573 543 529 575 576 592 569 563 554 580 570 562
469 479 455 462 473 472 459 475 482
406 361 373 422 387 360 356 348 338 355 345 334
517 492 508 499 500 486 501 513 500 502 508 496
464 433 435 454 434 422 418 413 410 415 407 403
354 354 376 401 394 367 362 361 360 363 362 363
611 549 527 520 513 518 528 524 513 525 517 507
404 403 456 499 480 479 471 460 447 472 461 449
506 490 493 492 485 480 491 485 479
355 355 383 426 415 400 388 384 384 375 371 367
374 378 374 407 419 419 424 423 419 443 435 430
EU
averages
Cyprus
forecast
Romania
Spain
Croatia
Germany
Bulgaria
17022014
Lithuania
Estonia
Czech Republic
Austria
Total expenditure general government (as a percentage of GDP 1995-2015)
Luxembourg
France
Autumn 2013
Ireland
Denmark
Finland
Belgium
forecast
Portugal
Italy
Slovakia
Netherlands
Winter 2014
USA
Latvia
Japan
Sweden
Hungary
United Kingdom
Poland
Greece
Euro area
Slovenia
Malta
Statistical Annex
151
Table 35
5-year
1995-99 2000-04 2005-09 2010 2011 2012 2013 2014 2015 2013 2014 2015
487 496 486 487 496 510 517 513 512 512 514 514
458 445 440 437 443 448 446 446 445 446 445 444
392 358 374 406 387 392 383 379 373 382 375 367
378 344 359 349 340 345 353 354 348 349 351 347
390 403 396 406 424 446 457 458 444 446 451 440
379 384 387 367 362 371 377 380 368 378 378 366
502 497 500 495 506 518 531 531 531 529 530 529
458 444 454 461 461 477 482 480 477 481 478 476
322 365 420 409 397 390 406 415 402 398 396 397
376 339 355 353 349 351 349 347 341 348 347 342
432 430 417 427 427 438 432 428 411 432 430 420
337 361 396 381 388 400 412 416 415 410 410 410
467 447 457 463 456 464 469 472 464 469 476 466
512 500 480 483 483 492 498 497 496 496 497 498
376 397 405 416 450 409 432 428 427 432 428 427
431 434 427 436 436 442 450 453 447 443 450 446
426 375 335 323 333 332 344 345 340 330 337 323
551 534 532 530 541 545 552 553 556 552 557 558
461 451 450 448 453 462 468 468 465 467 467 464
380 400 384 343 336 352 361 367 370 355 361 366
389 398 395 391 400 401 405 402 395 405 403 396
565 555 560 550 557 555 566 551 527 563 554 534
405 401 406 402 418 424 404 410 420
361 338 343 350 332 327 329 325 320 325 320 316
452 432 446 456 543 466 477 482 471 472 478 469
423 383 393 375 384 383 374 462 380 367 453 369
319 328 334 333 339 337 336 339 342 339 342 345
590 556 546 523 515 516 518 509 505 516 505 503
381 393 406 398 403 418 409 407 405 408 408 406
441 446 454 457 459 453 456 458 452
336 322 322 306 309 308 325 330 335 311 314 318
310 307 336 324 331 332 334 348 357 348 362 372
EU
averages
Cyprus
forecast
Romania
Spain
Croatia
Germany
Bulgaria
17022014
Lithuania
Estonia
Czech Republic
Austria
Total revenue general government (as a percentage of GDP 1995-2015)
Luxembourg
France
Autumn 2013
Ireland
Denmark
Finland
Belgium
forecast
Portugal
Italy
Slovakia
Netherlands
Winter 2014
USA
Latvia
Japan
Sweden
Hungary
United Kingdom
Poland
Greece
Euro area
Slovenia
Malta
Table 36
5-year
1995-99 2000-04 2005-09 2010 2011 2012 2013 2014 2015 2013 2014 2015
-25 00 -17 -37 -37 -40 -27 -26 -27 -28 -26 -25
-39 -27 -16 -42 -08 01 -01 00 00 00 01 02
-02 07 03 02 11 -02 -04 -04 -04 -04 -01 -01
06 14 -33 -306 -131 -82 -72 -48 -43 -74 -50 -30
-57 -52 -87 -107 -95 -90 -131 -22 -10 -135 -20 -11
-42 -04 -20 -96 -96 -106 -72 -58 -65 -68 -59 -66
-34 -28 -38 -71 -53 -48 -42 -40 -39 -41 -38 -37
-44 -28 -35 -45 -38 -30 -30 -26 -22 -30 -27 -25
-35 -39 -11 -53 -63 -63 -55 -58 -61 -83 -84 -63
-09 -19 -31 -81 -36 -13 -13 -10 -10 -14 -10 -10
28 27 15 -08 01 -06 -02 -05 -24 -09 -10 -27
-71 -63 -32 -35 -28 -33 -30 -27 -27 -34 -34 -35
-16 -10 -09 -51 -43 -41 -31 -32 -29 -33 -33 -30
-32 -17 -18 -45 -25 -25 -17 -21 -18 -25 -19 -15
-42 -38 -56 -98 -43 -64 -59 -40 -25 -59 -40 -25
-34 -30 -22 -59 -63 -38 -149 -39 -33 -58 -71 -38
-65 -64 -36 -77 -51 -45 -25 -33 -34 -30 -32 -38
-15 43 29 -25 -07 -18 -24 -25 -23 -22 -23 -20
-36 -22 -26 -62 -42 -37 -31 -26 -25 -31 -25 -24
-34 02 03 -31 -20 -08 -19 -19 -17 -20 -20 -18
-56 -51 -29 -47 -32 -44 -27 -28 -33 -29 -30 -35
-09 13 32 -25 -19 -38 -03 -13 -27 -17 -17 -27
-64 -78 -50 -60 -54 -48 -54 -65 -62
-45 -23 -29 -72 -55 -32 -27 -23 -17 -30 -25 -19
-65 -60 -62 -43 43 -20 -24 -30 -29 -29 -30 -27
-41 -50 -41 -79 -50 -39 -44 50 -29 -48 46 -33
-35 -26 -42 -68 -55 -30 -26 -22 -18 -25 -20 -18
-21 07 19 03 02 -02 -11 -15 -08 -09 -12 -05
-23 -10 -51 -101 -77 -61 -63 -52 -42 -64 -53 -43
-65 -44 -39 -35 -27 -27 -35 -27 -26
-18 -33 -61 -120 -106 -92 -62 -54 -48 -64 -57 -49
-64 -71 -38 -83 -88 -87 -90 -75 -62 -96 -72 -58
EU
averages
Cyprus
forecast
Romania
Spain
Croatia
Germany
Bulgaria
17022014
Lithuania
Estonia
Czech Republic
Austria
Net lending (+) or net borrowing (-) general government (as a percentage of GDP 1995-2015)
Luxembourg
France
Autumn 2013
Ireland
Denmark (a)
Finland
Belgium
forecast
Portugal
Italy
Slovakia
Netherlands
Winter 2014
USA
Latvia
Japan
Sweden
Hungary
(a) EDP net lendingborrowing and EDP interest for Denmark for the years 2010-2012 are ECFIN estimates based on the October 2013 EDP notification and on revised general government accounts published by Danmarks Statistik in November 2013
United Kingdom
Poland
Greece
Euro area
Slovenia
Malta
European Economic Forecast Winter 2014
152
Table 37
5-year
1995-99 2000-04 2005-09 2010 2011 2012 2013 2014 2015 2013 2014 2015
78 57 39 34 33 34 32 31 31 32 31 31
34 30 28 25 25 24 23 22 21 23 22 21
04 02 02 01 01 02 02 01 01 02 01 01
39 15 13 31 33 37 48 48 50 46 48 50
93 58 47 58 71 50 42 49 51 41 48 52
45 27 17 19 25 30 35 36 36 34 36 36
33 29 26 24 26 25 24 24 25 24 24 25
93 56 48 46 50 55 53 53 53 54 55 56
26 34 30 22 24 31 37 41 40 41 41 42
09 08 07 14 15 13 14 14 13 15 15 14
04 03 03 04 05 05 06 05 06 06 05 06
27 34 33 29 30 31 31 30 30 31 31 32
50 29 22 21 21 19 19 21 27 19 19 18
37 31 27 27 26 26 26 26 27 26 26 26
40 28 28 28 40 43 43 44 44 43 44 44
22 21 13 16 19 22 27 30 32 27 31 32
26 33 15 13 16 19 16 15 15 19 18 18
38 22 14 11 11 10 11 11 11 10 10 10
49 35 29 28 30 31 30 30 31 30 30 31
102 30 12 07 07 09 10 11 11 08 09 09
11 10 11 14 14 15 15 15 15 16 16 16
50 30 17 17 18 16 14 13 13 16 14 14
22 26 30 34 37 39 35 41 47
09 13 08 18 18 18 17 16 16 18 17 16
83 45 42 41 41 43 42 39 39 42 40 39
44 30 25 27 27 28 27 22 22 27 22 22
34 26 10 15 16 18 18 17 17 18 18 18
49 25 15 08 10 07 09 09 08 09 09 08
33 22 21 30 33 30 30 29 28 30 30 29
27 29 29 29 28 29 29 29 29
49 35 35 37 39 38 37 38 40 39 41 41
34 29 19 20 21 21 21 21 20 20 19 18
EU
averages
Cyprus
forecast
Romania
Spain
Croatia
Germany
Bulgaria
17022014
Lithuania
Estonia
Czech Republic
Austria
Interest expenditure general government (as a percentage of GDP 1995-2015)
Luxembourg
France
Autumn 2013
Ireland
Denmark
Finland
Belgium
forecast
Portugal
Italy
Slovakia
Netherlands
Winter 2014
USA
Latvia
Japan
Sweden
Hungary
United Kingdom
Poland
Greece
Euro area
Slovenia
Malta
Table 38
5-year
1995-99 2000-04 2005-09 2010 2011 2012 2013 2014 2015 2013 2014 2015
54 57 21 -04 -04 -06 05 05 04 03 05 05
-05 03 12 -16 17 25 22 21 21 23 22 23
02 09 05 03 13 -01 -02 -02 -03 -02 01 01
45 29 -20 -275 -99 -45 -24 00 07 -28 -02 20
36 06 -39 -49 -24 -40 -88 27 41 -94 28 41
03 22 -03 -77 -70 -76 -37 -22 -28 -33 -24 -30
-01 01 -11 -47 -27 -23 -18 -16 -14 -18 -14 -11
50 27 13 01 11 25 23 27 31 23 28 31
-09 -06 20 -30 -39 -32 -18 -18 -21 -42 -43 -21
00 -11 -24 -67 -21 00 01 04 03 01 05 04
32 30 18 -04 05 -01 04 00 -17 -03 -05 -20
-44 -29 01 -06 03 -02 01 03 02 -03 -03 -04
34 19 13 -31 -23 -22 -12 -11 -02 -14 -15 -11
04 15 09 -18 02 01 09 06 08 02 07 11
-01 -10 -28 -70 -03 -21 -15 03 19 -16 03 18
-12 -09 -09 -42 -44 -17 -122 -09 -01 -30 -40 -06
-38 -32 -21 -63 -35 -27 -09 -17 -18 -11 -14 -20
23 65 43 -14 04 -08 -13 -14 -12 -12 -13 -11
12 13 03 -34 -11 -06 -01 05 06 -01 05 07
68 31 14 -24 -12 01 -09 -09 -07 -12 -11 -09
-45 -40 -18 -33 -18 -29 -12 -13 -18 -13 -14 -19
42 43 48 -09 -01 -22 11 01 -14 -01 -02 -13
-42 -52 -19 -26 -17 -09 -19 -24 -15
-36 -09 -21 -54 -37 -14 -10 -07 -02 -12 -08 -02
18 -14 -19 -02 85 22 18 09 10 13 09 12
03 -20 -16 -52 -23 -11 -18 72 -07 -22 67 -11
-02 00 -32 -53 -39 -12 -08 -04 -01 -07 -03 00
28 32 34 11 12 05 -02 -06 01 00 -03 04
11 11 -30 -71 -44 -31 -33 -23 -14 -34 -24 -14
13 13 -01 -38 -15 -10 -06 02 02 -07 02 02
30 02 -26 -83 -67 -53 -25 -15 -09 -25 -16 -08
-30 -42 -19 -63 -67 -66 -69 -54 -42 -76 -54 -40
EU
averages
Cyprus
forecast
Romania
Spain
Croatia
Germany
Bulgaria
17022014
Lithuania
Estonia
Czech Republic
Austria
Primary balance general government sup1 (as a percentage of GDP 1995-2015)
Luxembourg
France
Autumn 2013
Ireland
Denmark
Finland
Belgium
forecast
Portugal
Italy
Slovakia
Netherlands
Winter 2014
USA
Latvia
Japan
Sweden
Hungary
sup1 Net lendingborrowing excluding interest expenditure
United Kingdom
Poland
Greece
Euro area
Slovenia
Malta
Statistical Annex
153
Table 39
5-year
1995-99 2000-04 2005-09 2010 2011 2012 2013 2014 2015 2013 2014 2015
-24 -04 -23 -33 -35 -32 -17 -20 -25 -19 -18 -20
-37 -27 -13 -34 -12 01 05 04 02 05 05 04
00 -09 21 08 -12 -08 -04 -05 -07 -03 -03
-01 06 -35 -282 -122 -77 -66 -47 -47 -69 -50 -34
-63 -54 -92 -85 -53 -33 -72 22 10 -75 26 09
-38 -13 -21 -74 -75 -82 -47 -43 -63 -43 -43 -62
-31 -39 -44 -59 -46 -36 -26 -25 -27 -25 -22 -24
-47 -37 -41 -35 -31 -13 -06 -06 -09 -06 -07 -11
-42 -17 -53 -64 -60 -40 -35 -52 -57 -55 -52
-20 -42 -47 -17 -07 -13 -15 -18 -15 -15 -17
33 17 13 03 08 10 10 03 -21 02 -04 -21
-70 -62 -35 -34 -27 -29 -28 -28 -31 -32 -35 -40
-17 -08 -09 -43 -37 -27 -12 -17 -18 -15 -15 -16
-31 -17 -19 -36 -24 -24 -13 -17 -17 -20 -16 -14
-45 -43 -54 -94 -34 -47 -37 -25 -18 -38 -25 -17
-34 -34 -47 -58 -26 -135 -27 -25 -43 -56 -28
-58 -47 -74 -45 -38 -13 -21 -25 -19 -21 -29
-14 41 24 -11 -06 -10 -09 -12 -14 -08 -10 -12
-35 -27 -28 -51 -36 -26 -16 -13 -18 -16 -13 -16
-20 -01 -09 -23 -15 -03 -13 -14 -12 -15 -15 -13
-51 -42 -43 -31 -37 -14 -19 -29 -16 -20 -30
-14 06 23 -01 02 -10 26 13 -05 11 09 -03
-51 -71 -40 -52 -49 -44 -46 -60 -59
-18 -42 -48 -45 -29 -26 -23 -19 -30 -27 -22
-65 -71 -26 54 -02 -09 -20 -24 -13 -19 -21
-45 -47 -82 -53 -36 -36 57 -24 -40 54 -27
-22 -57 -60 -50 -20 -21 -18 -16 -19 -15 -14
-15 07 18 11 04 05 01 -06 -04 05 -02 -01
-26 -11 -51 -81 -61 -44 -51 -48 -43 -53 -48 -43
-53 -37 -27 -20 -16 -21 -21 -15 -20
Luxembourg
Sweden
France
Hungary
Denmark
Finland
Portugal
United Kingdom
Italy
Poland
Euro area
Slovenia
Malta
EU
Cyprus
sup1 Cyclically-adjusted variables for Croatia are based on provisional values for fiscal semi-elasticities and subject to further revisions
17022014
Latvia
Lithuania
Estonia
Czech Republic
Austria
Autumn 2013
Ireland
Belgium
forecast
Greece
averages forecast
Romania
Spain
Croatia
Germany
Bulgaria
Slovakia
Cyclically-adjusted net lending (+) or net borrowing (-) general governmentsup1 (as a percentage of GDP 1995-2015)
Netherlands
Winter 2014
Table 40
5-year
1995-99 2000-04 2005-09 2010 2011 2012 2013 2014 2015 2013 2014 2015
54 54 16 01 -02 02 14 11 06 13 13 11
-04 03 15 -09 13 25 28 26 23 28 26 25
02 -07 23 09 -10 -06 -03 -04 -06 -01 -02
38 20 -22 -250 -90 -40 -19 02 03 -23 -02 16
30 04 -45 -27 18 16 -29 71 61 -34 73 61
08 14 -04 -54 -49 -51 -13 -07 -26 -09 -07 -26
03 -10 -17 -35 -20 -11 -02 00 -01 -02 02 01
46 19 07 11 19 42 47 47 44 48 48 46
-08 13 -31 -40 -29 -03 06 -13 -16 -15 -10
-12 -36 -33 -02 06 01 -01 -05 00 -01 -03
37 20 15 07 13 15 16 08 -14 07 01 -15
-43 -28 -02 -05 03 02 02 02 -01 -01 -04 -08
33 21 13 -22 -17 -08 07 04 09 05 03 02
05 14 08 -09 02 02 14 09 10 07 10 13
-05 -16 -25 -66 07 -04 06 18 26 06 19 27
-13 -20 -31 -39 -04 -108 03 07 -16 -25 03
-26 -32 -61 -30 -19 03 -05 -09 00 -03 -11
24 63 38 00 05 00 02 00 -03 02 01 -02
13 08 01 -23 -05 05 14 17 13 14 18 15
82 28 03 -16 -08 06 -02 -03 -02 -06 -06 -04
-41 -31 -29 -17 -22 01 -04 -14 00 -04 -14
36 36 40 15 21 06 41 26 07 28 24 11
-29 -45 -10 -18 -12 -05 -11 -19 -12
-05 -34 -30 -27 -11 -09 -07 -03 -12 -10 -06
-20 -29 16 95 41 33 19 15 29 20 18
-15 -22 -55 -26 -08 -09 79 -02 -13 76 -05
04 -47 -45 -34 -02 -04 00 02 -01 02 03
34 32 33 19 14 12 10 03 04 14 07 07
07 11 -30 -52 -28 -14 -21 -19 -15 -23 -19 -14
13 09 -04 -26 -08 02 08 12 07 08 13 09
Luxembourg
Sweden
France
Hungary
Denmark
Finland
Portugal
United Kingdom
Italy
Poland
Euro area
Slovenia
Malta
EU
Cyprus
sup1 Cyclically-adjusted variables for Croatia are based on provisional values for fiscal semi-elasticities and subject to further revisions
17022014
Latvia
Lithuania
Estonia
Czech Republic
Austria
Autumn 2013
Ireland
Belgium
forecast
Greece
averages forecast
Romania
Spain
Croatia
Germany
Bulgaria
Slovakia
Cyclically-adjusted primary balance general governmentsup1 (as a percentage of GDP 1995-2015)
Netherlands
Winter 2014
European Economic Forecast Winter 2014
154
Table 41
5-year
1995-99 2000-04 2005-09 2010 2011 2012 2013 2014 2015 2013 2014 2015
-19 -33 -33 -29 -22 -20 -25 -22 -18 -20
-12 -22 -10 03 06 05 02 05 05 04
-16 -09 -08 -02 -05 -01 -04 -05 00 -02
-31 -89 -81 -77 -64 -49 -46 -67 -52 -33
-91 -89 -59 -01 17 07 -01 12 10 -01
-21 -74 -72 -51 -43 -42 -58 -41 -42 -58
-46 -57 -47 -36 -28 -23 -27 -27 -20 -24
-43 -37 -38 -14 -08 -06 -08 -08 -07 -09
-17 -53 -62 -64 -38 -45 -52 -55 -55 -52
-41 -30 -15 -02 -13 -15 -18 -15 -15 -17
13 03 08 10 10 03 -21 02 -04 -21
-41 -45 -34 -38 -31 -29 -32 -35 -36 -41
-09 -41 -37 -27 -18 -18 -18 -21 -17 -16
-19 -32 -22 -16 -15 -14 -15 -16 -15 -12
-53 -87 -64 -40 -36 -26 -18 -37 -26 -17
-33 -47 -48 -26 -22 -20 -25 -29 -21 -28
-45 -73 -49 -39 -23 -25 -25 -23 -31 -29
24 -10 -05 -10 -09 -12 -14 -08 -10 -12
-29 -44 -36 -21 -15 -13 -17 -15 -13 -15
-08 -22 -15 -03 -13 -14 -12 -15 -15 -13
-40 -45 -31 -19 -13 -22 -29 -15 -22 -30
23 -01 02 06 11 -03 -05 01 -01 -03
-51 -71 -40 -47 -57 -50 -41 -60 -59
-42 -48 -45 -30 -25 -22 -18 -30 -26 -22
-68 -33 -41 -09 -11 -24 -23 -14 -23 -21
-48 -82 -53 -37 -36 -29 -24 -40 -32 -27
-56 -61 -38 -25 -21 -18 -16 -19 -15 -14
18 11 04 05 01 -06 -04 05 -02 -01
-50 -81 -61 -62 -53 -48 -43 -57 -48 -43
-31 -48 -38 -26 -20 -19 -21 -21 -18 -19
Luxembourg
Sweden
France
Hungary
Denmark
Finland
Portugal
United Kingdom
Italy
Poland
Euro area
Slovenia
Malta
EU
Cyprus
sup1 Cyclically-adjusted variables for Croatia are based on provisional values for fiscal semi-elasticities and subject to further revisions
17022014
Latvia
Lithuania
Estonia
Czech Republic
Austria
Autumn 2013
Ireland
Belgium
forecast
Greece
averages forecast
Romania
Spain
Croatia
Germany
Bulgaria
Slovakia
Structural budget balance general governmentsup1 (as a percentage of GDP 1995-2015)
Netherlands
Winter 2014
Table 42
5-year
1995-99 2000-04 2005-09 2010 2011 2012 2013 2014 2015 2013 2014 2015
1221 1020 898 957 980 998 998 1005 1000 1004 1013 1010
591 621 686 825 800 810 796 773 745 796 771 741
71 53 49 67 61 98 100 101 98 100 97 91
632 327 371 912 1041 1174 1223 1203 1197 1244 1208 1191
963 1010 1135 1483 1703 1569 1773 1770 1719 1762 1759 1709
647 525 427 617 705 860 943 989 1033 948 999 1043
583 604 685 824 858 902 939 961 973 935 953 960
1172 1060 1076 1193 1207 1270 1327 1337 1324 1330 1340 1331
562 653 601 613 711 858 1120 1215 1258 1160 1244 1274
124 139 178 444 419 406 384 387 327 425 393 334
72 63 99 195 187 217 243 255 281 245 257 287
453 613 637 667 693 711 720 724 715 726 733 741
690 519 527 634 657 713 743 753 756 748 764 769
663 658 639 723 728 740 746 743 737 748 745 735
552 565 722 940 1082 1241 1294 1266 1258 1278 1267 1257
220 270 267 387 471 544 719 754 780 632 701 742
338 453 315 410 434 524 543 578 584 543 572 581
523 433 388 487 492 536 572 604 620 584 610 625
727 689 711 856 879 926 955 959 954 955 959 954
544 189 162 163 185 194 227 241 194 226 241
138 253 296 384 414 462 461 472 486 490 506 523
654 488 342 428 464 454 424 416 431 443 437 451
449 516 555 649 674 687 596 647 690
160 218 196 378 383 405 395 422 414 399 402 396
685 566 695 822 821 798 778 791 789 807 799 794
428 418 476 549 562 556 578 503 510 582 510 525
141 227 156 305 347 380 383 393 392 385 391 395
703 526 434 394 386 382 415 418 408 413 419 410
476 388 494 784 843 886 914 934 945 943 969 986
800 828 866 894 897 895 897 902 900
Luxembourg
Sweden
France
Hungary
Denmark
Finland
Portugal
United Kingdom
Italy
Poland
Euro area
Slovenia
Malta
EU
Cyprus
17022014
Latvia
Lithuania
Estonia
Czech Republic
Austria
Autumn 2013
Ireland
Belgium
forecast
Greece
averages forecast
Romania
Spain
Croatia
Germany
Bulgaria
Slovakia
Gross debt general government (as a percentage of GDP 1995-2015)
Netherlands
Winter 2014
Statistical Annex
155
Table 43
5-year
1995-99 2000-04 2005-09 2010 2011 2012 2013 2014 2015 2013 2014 2015
255 255 247 233 225 208 201 206 205 210 210 212
209 206 243 237 245 243 240 240 241 240 241 242
209 223 227 234 268 266 258 253 257 267 268 273
224 223 196 139 132 145 177 185 193 147 154 162
159 115 82 48 44 83 108 120 131 108 120 131
220 226 207 184 173 185 193 195 197 195 199 205
196 200 194 174 183 177 176 179 181 175 178 182
219 207 194 165 167 174 179 187 192 179 185 189
183 142 113 106 130 81 98 100 106 104 110 111
156 191 205 228 225 230 225 220 217 223 218 215
321 331 293 275 278 280 270 271 271 275 274 266
200 150 134 146 142 139 145 143 142 149 147 142
269 268 262 228 255 252 255 264 277 249 253 264
228 244 258 247 248 245 245 252 258 246 252 258
202 169 116 98 113 144 157 164 173 159 160 167
238 246 254 204 204 206 214 230 240 216 223 230
248 211 201 188 213 211 204 199 205 213 211 225
234 272 249 202 191 181 183 190 190 176 179 182
215 213 214 195 200 202 204 208 212 204 207 211
153 148 225 220 225 239 234 227 235 235 233
267 239 242 198 210 207 199 203 206 197 200 201
210 231 242 227 237 234 246 243 243 226 231 234
148 200 219 201 193 191 201 208 210 196 204 206
128 143 152 169 174 172 180 182 187 175 179 181
200 177 165 196 198 186 201 205 210 200 198 194
203 172 176 167 176 171 175 180 182 172 176 180
140 176 177 212 224 215 227 232 231 236 240 241
213 233 265 256 261 253 243 243 246 244 244 247
168 153 150 123 135 108 106 114 120 100 104 108
202 205 187 193 189 191 195 199 190 193 197
202 186 168 151 158 164 162 169 172 159 164 170
294 262 259 235 222 218 217 224 230 220 232 239
EU
averages
Cyprus
forecast
Romania
Spain
Croatia
Germany
Bulgaria
17022014
Lithuania
Estonia
Czech Republic
Austria
Gross national saving (as a percentage of GDP 1995-2015)
Luxembourg
France
Autumn 2013
Ireland
Denmark
Finland
Belgium
forecast
Portugal
Italy
Slovakia
Netherlands
Winter 2014
USA
Latvia
Japan
Sweden
Hungary
United Kingdom
Poland
Greece
Euro area
Slovenia
Malta
Table 44
5-year
1995-99 2000-04 2005-09 2010 2011 2012 2013 2014 2015 2013 2014 2015
255 238 240 252 240 222 214 216 216 222 219 219
207 210 235 244 229 221 220 220 221 220 220 220
165 174 178 212 235 224 225 222 227 232 235 241
193 174 184 214 199 205 225 219 218 197 189 176
184 127 141 137 132 132 116 128 125 126 126 124
219 189 179 230 226 231 240 232 241 240 240 252
192 193 195 208 199 189 182 185 186 180 181 185
231 206 191 180 181 176 182 185 189 181 185 188
182 145 85 107 149 107 136 130 138 165 163 144
143 179 184 264 224 210 207 204 202 206 201 201
242 253 229 230 229 237 230 234 254 238 239 247
238 172 146 164 155 157 160 155 152 168 165 159
254 244 236 234 260 254 254 257 273 250 243 256
221 225 245 251 238 231 228 236 240 232 235 238
201 179 145 168 162 195 200 195 189 202 190 183
214 233 229 214 215 210 225 234 244 224 227 236
234 217 205 235 237 234 217 219 222 230 228 245
213 204 196 205 176 177 185 192 190 176 180 182
213 204 206 218 212 207 207 208 211 206 206 210
115 101 222 216 210 234 228 219 227 225 219
224 215 214 203 205 198 194 202 208 191 197 201
199 204 193 230 232 230 223 231 249 220 224 240
210 215 212 235 243 235 226 242 240
109 127 145 218 203 188 188 185 185 187 185 181
209 177 184 220 222 187 202 207 214 205 201 197
199 183 171 195 181 174 186 185 181 191 189 189
139 157 158 221 206 196 201 204 200 211 211 209
202 199 215 222 226 225 223 224 221 223 223 219
171 148 170 189 184 159 145 143 138 139 132 126
214 208 199 198 198 200 197 196 198
186 183 188 226 223 219 198 196 195 196 195 194
275 276 270 289 275 267 265 253 246 273 261 252
EU
averages
Cyprus
forecast
Romania
Spain
Croatia
Germany
Bulgaria
17022014
Lithuania
Estonia
Czech Republic
Austria
Gross saving private sector (as a percentage of GDP 1995-2015)
Luxembourg
France
Autumn 2013
Ireland
Denmark
Finland
Belgium
forecast
Portugal
Italy
Slovakia
Netherlands
Winter 2014
USA
Latvia
Japan
Sweden
Hungary
United Kingdom
Poland
Greece
Euro area
Slovenia
Malta
European Economic Forecast Winter 2014
156
Table 45
5-year
1995-99 2000-04 2005-09 2010 2011 2012 2013 2014 2015 2013 2014 2015
183 168 163 152 141 152 149 146 143 150 146 146
160 156 168 169 164 164 161 160 159 161 159 158
37 02 01 101 111 45 52 53 53 54 59 62
107 132 112 102 127 113 120 135 141 137
132 113 126 139 127 104 104 106 109 105 105 114
150 151 151 156 156 152 150 147 146 144 138 137
194 159 154 124 119 116 128 131 132 124 126 127
127 136 137 192 152 128 99 122 147 33 74 50
170 134 124 105 116 107 102 109 110 97 94 100
144 135 157 140 120 126 130 136 141 130 133 133
112 104 86 101 97 120 124 118 114 122 115 106
131 152 155 129 121 119 135 148 154 119 122 126
121 82 65 103 94 82 79 77 77 58 68 72
92 85 84 107 87 86 105 111 102 102 100 88
141 142 138 132 129 130 131 131 131 130 130
115 96 102 107 99 106 106 108 107 105 107 107
58 79 54 77 77 66 20 36 50 56 57 76
28 36 04 82 42 09
168 103 100 108 107 74 90 90 79 48 54 60
145 110 71 82 21 48 70 70 55 25 29 31
26 -31 -80 -38 -70 -62 -59 -51 -63
62 83 101 113 131 148 159 157 141 154 146 133
74 46 35 73 67 72 64 61 57 62 61 60
118 114 119 113 113 113 112 110 119 117 117
107 99 100 113 111 109 94 92 91 38 49 58
160 107 83 87 90 78 67 58 51 66 57 52
EU
averages
Cyprus
forecast
Romania
Spain
Croatia
Germany
Bulgaria
17022014
Lithuania
Estonia
Czech Republic
Austria
Saving rate of households (1995-2015)
Luxembourg
France
Autumn 2013
Ireland
Denmark
Finland
Belgium
forecast
Portugal
Italy
Slovakia
Netherlands
Winter 2014
USA
Latvia
Japan
Sweden
Hungary
United Kingdom
Poland
Greece
Euro area
Slovenia
Malta
Table 46
5-year
1995-99 2000-04 2005-09 2010 2011 2012 2013 2014 2015 2013 2014 2015
00 17 07 -19 -15 -14 -13 -10 -11 -12 -09 -08
02 -04 08 -07 16 22 20 20 20 20 21 22
45 49 50 22 33 42 33 31 29 35 33 32
31 49 12 -75 -67 -60 -49 -33 -25 -51 -34 -14
-26 -12 -59 -90 -88 -50 -07 -08 06 -18 -06 06
02 37 28 -46 -54 -45 -46 -37 -44 -45 -40 -47
04 07 00 -34 -16 -12 -05 -05 -05 -05 -03 -03
-12 01 03 -15 -13 -02 -02 02 03 -02 00 01
01 -04 29 -01 -19 -26 -38 -30 -33 -61 -53 -33
13 13 21 -37 02 20 18 16 14 17 17 14
79 78 65 45 49 43 40 37 18 37 35 18
-38 -22 -12 -19 -13 -18 -15 -12 -10 -19 -17 -16
14 23 26 -06 -05 -02 01 07 03 -01 10 08
07 19 14 -04 10 14 17 16 18 14 16 20
00 -10 -28 -70 -49 -51 -43 -30 -16 -43 -30 -16
24 13 25 -10 -12 -03 -11 -04 -04 -08 -03 -06
14 -06 -03 -46 -24 -24 -13 -19 -18 -17 -17 -21
22 68 52 -03 15 04 -01 -02 00 -01 -01 00
01 09 08 -23 -12 -05 -02 00 00 -03 01 01
-11 38 47 03 04 15 06 07 08 08 10 14
43 24 28 -05 05 09 05 01 -02 06 03 -01
11 27 49 -03 05 03 23 13 -05 06 07 -06
-09 -21 -20 -34 -34 -25 -30 -38 -34
19 16 07 -48 -29 -16 -09 -04 02 -12 -06 00
-09 00 -19 -24 -24 -01 00 -02 -04 -05 -03 -03
04 -11 05 -28 -06 -03 -11 -05 01 -18 -13 -09
01 19 19 -09 18 20 25 28 31 26 28 32
11 35 50 34 35 29 20 19 25 21 21 28
-03 05 -20 -66 -49 -52 -38 -28 -18 -39 -29 -19
-27 -15 -10 -06 -03 -02 -07 -03 -01
15 03 -19 -75 -64 -54 -36 -28 -23 -37 -31 -23
19 -14 -12 -54 -53 -49 -47 -29 -16 -52 -28 -13
EU
averages
Cyprus
forecast
Romania
Spain
Croatia
Germany
Bulgaria
17022014
Lithuania
Estonia
Czech Republic
Austria
Gross saving general government (as a percentage of GDP 1995-2015)
Luxembourg
France
Autumn 2013
Ireland
Denmark
Finland
Belgium
forecast
Portugal
Italy
Slovakia
Netherlands
Winter 2014
USA
Latvia
Japan
Sweden
Hungary
United Kingdom
Poland
Greece
Euro area
Slovenia
Malta
Statistical Annex
157
Table 47
5-year
1995-99 2000-04 2005-09 2010 2011 2012 2013 2014 2015 2013 2014 2015
56 43 11 81 64 18 19 36 47 02 42 48
75 73 33 152 80 32 06 49 68 03 46 68
88 97 07 237 234 56 17 41 56 05 48 55
177 83 25 64 54 16 03 28 37 05 25 37
97 48 -13 52 03 -24 25 46 55 25 46 55
100 48 08 117 76 21 49 54 64 45 52 57
74 39 -06 95 54 24 06 44 56 14 43 56
40 31 -09 114 62 20 01 33 49 01 36 48
65 32 05 38 44 -27 -48 -27 19 -54 -25 17
78 49 125 124 94 09 45 59 28 47 62
86 73 32 72 54 -19 23 36 49 27 40 35
14 23 174 34 81 -29 40 59 -16 45 56
80 50 26 116 41 32 13 29 50 28 32 45
76 69 15 94 66 12 23 48 60 16 47 58
80 42 14 102 69 32 58 50 53 58 50 53
47 83 43 102 70 06 29 38 45 13 26 39
82 88 56 160 122 99 35 48 62 46 46 60
97 55 16 79 28 -02 -04 34 44 -14 35 44
55 16 116 65 25 13 42 57 13 42 56
39 38 147 123 -04 82 56 64 49 34 55
104 104 55 154 95 45 04 57 61 -03 38 48
55 43 25 30 70 04 09 31 40 08 34 40
77 -06 48 20 04 -13 25 30 -07 25 30
122 57 174 141 118 65 66 69 59 67 69
209 104 76 113 84 17 51 53 61 37 53 61
115 116 61 121 77 39 47 52 63 54 51 59
88 150 54 132 103 -30 136 57 63 96 50 61
91 56 15 114 61 07 -15 28 54 -21 35 65
61 42 20 67 45 11 08 29 37 27 34 36
56 20 110 65 23 14 41 55 15 41 54
74 22 39 115 71 35 28 62 57 30 56 58
39 71 -05 244 -04 -01 16 34 40 36 58 37
EU
averages
Cyprus
forecast
Romania
Spain
Croatia
Germany
Bulgaria
17022014
Lithuania
Estonia
Czech Republic
Austria
Exports of goods and services volume (percentage change on preceding year 1995-2015)
Luxembourg
France
Autumn 2013
Ireland
Denmark
Finland
Belgium
forecast
Portugal
Italy
Slovakia
Netherlands
Winter 2014
USA
Latvia
Japan
Sweden
Hungary
United Kingdom
Poland
Greece
Euro area
Slovenia
Malta
Table 48
5-year
1995-99 2000-04 2005-09 2010 2011 2012 2013 2014 2015 2013 2014 2015
52 38 17 75 68 13 12 32 52 -04 41 50
76 48 36 125 74 14 13 59 76 10 57 76
95 127 -16 211 284 88 30 46 58 17 50 58
170 75 18 36 -04 00 01 28 26 02 14 27
108 46 02 -62 -73 -138 -68 -13 27 -71 -13 27
123 70 01 93 -01 -57 02 33 49 -19 15 40
71 50 13 89 51 -11 07 40 58 14 35 58
63 37 -02 126 08 -74 -29 30 55 -35 36 54
60 54 21 48 -02 -64 -147 -72 02 -165 -67 17
102 -05 118 223 45 -03 48 67 18 54 71
97 71 29 114 74 -10 23 39 53 27 46 47
14 22 153 01 54 -39 37 59 -27 42 56
91 44 29 103 42 33 -05 32 50 01 27 45
56 59 07 91 76 -03 04 46 56 04 45 56
98 26 13 80 -53 -66 26 30 38 08 25 37
83 70 32 74 56 -47 02 17 33 -02 08 25
111 83 39 149 97 33 20 45 60 19 43 58
80 62 27 68 62 -07 -15 20 44 -19 41 39
50 19 100 45 -09 02 41 59 -01 39 57
80 43 24 88 37 50 55 68 41 37 59
106 101 36 154 70 23 07 46 58 -12 32 46
64 56 36 35 59 09 25 30 38 16 31 38
89 -04 -28 13 -21 -07 17 32 00 18 38
129 31 179 137 61 66 70 74 62 71 74
176 106 45 109 64 -01 50 59 66 37 55 65
183 74 57 139 55 -07 08 46 66 11 38 58
116 193 92 111 100 -09 29 50 73 08 51 65
78 37 24 120 71 -06 -19 37 56 -21 39 69
84 58 03 79 03 31 12 26 33 19 23 24
54 20 98 44 -03 05 40 56 02 37 53
106 56 -06 128 49 22 14 47 63 22 56 62
44 47 -12 111 59 53 34 45 22 26 40 24
EU
averages
Cyprus
forecast
Romania
Spain
Croatia
Germany
Bulgaria
17022014
Lithuania
Estonia
Czech Republic
Austria
Imports of goods and services volume (percentage change on preceding year 1995-2015)
Luxembourg
France
Autumn 2013
Ireland
Denmark
Finland
Belgium
forecast
Portugal
Italy
Slovakia
Netherlands
Winter 2014
USA
Latvia
Japan
Sweden
Hungary
United Kingdom
Poland
Greece
Euro area
Slovenia
Malta
European Economic Forecast Winter 2014
158
Table 49
5-year
1995-99 2000-04 2005-09 2010 2011 2012 2013 2014 2015 2013 2014 2015
35 08 -08 -16 -15 -14 -11 -16 -04 -06 -09
54 70 63 59 67 68 66 66 68 65 65
-147 -129 -25 -44 -66 -52 -51 -50 -61 -59 -61
249 148 226 226 222 204 189 185 206 201 192
-183 -143 -140 -113 -99 -89 -84 -96 -87 -82
-57 -73 -46 -42 -25 -12 -04 -02 -08 02 07
00 -20 -26 -36 -31 -28 -29 -31 -25 -24 -24
10 -01 -13 -11 11 23 28 28 24 25 25
-263 -280 -268 -242 -215 -183 -169 -167 -179 -165 -167
-168 -187 -70 -108 -104 -92 -93 -98 -94 -99 -105
-111 -99 -102 -123 -142 -150 -153 -157 -140 -140 -142
-135 -186 -192 -161 -136 -123 -121 -125 -124 -124 -127
64 74 71 75 77 93 91 98 99 101 107
-08 -03 -10 -25 -23 -15 -14 -13 -17 -18 -19
-105 -112 -106 -77 -47 -36 -28 -22 -29 -20 -14
-32 -40 -24 -27 -04 10 27 36 07 16 19
-62 -26 08 10 47 54 52 51 73 76 80
88 41 14 -07 00 00 05 05 03 02 02
19 06 05 03 14 21 22 22 23 24 25
11 02 01 00 10 17 18 19 19 20 21
-119 -210 -77 -56 -91 -61 -65 -72 -74 -77 -86
-23 15 15 24 38 45 56 63 46 49 50
44 14 29 30 27 32 30 27 26 27 26
-227 -215 -139 -145 -143 -147 -144 -146 -148 -147 -152
-95 -113 -48 -58 -28 -25 -28 -30 -27 -28 -31
-44 -10 25 31 36 40 37 35 38 38 35
-39 -26 -18 -21 -08 05 07 04 09 12 11
-68 -111 -61 -56 -56 -24 -25 -29 -28 -30 -33
68 47 26 22 24 21 16 15 19 15 11
-42 -59 -66 -65 -69 -69 -67 -66 -64 -61 -59
07 -06 -06 -07 00 06 07 07 09 10 10
-05 -13 -11 -12 -04 02 02 03 04 06 06
-46 -55 -45 -49 -47 -43 -41 -43 -45 -46 -48
25 23 16 17 -03 -12 -19 -24 -22 -16 -17 -15
sup2 See note 8 on concepts and sources
forecast
Portugal
Sweden
Italy
Hungary
Greece
Euro area
USA
Slovenia
Malta
United Kingdom
averages
Cyprus
forecast
Poland
Netherlands
sup1 See note 7 on concepts and sources
Austria
EU adjustedsup2
Luxembourg
Romania
Lithuania
Czech Republic
Finland
Denmark
Japan
Winter 2014
17022014
EU
Latvia
Croatia
Estonia
Bulgaria
France
Autumn 2013
Ireland
Belgium
Spain
Germany
Euro area adjustedsup2
Slovakia
Merchandise trade balancesup1 (fob-fob as a percentage of GDP 1995-2015)
Table 50
5-year
1995-99 2000-04 2005-09 2010 2011 2012 2013 2014 2015 2013 2014 2015
46 49 25 26 05 -02 01 06 03 09 09 08
-09 13 63 64 63 70 70 67 64 70 66 64
-85 -87 -92 35 03 -28 -21 -24 -23 -21 -22 -22
19 -01 -40 11 12 44 70 68 72 41 46 49
-26 -119 -149 -128 -117 -53 -23 -18 -16 -23 -19 -16
-08 -44 -82 -44 -40 -12 11 16 18 14 26 31
18 08 -13 -19 -25 -21 -19 -20 -22 -18 -15 -15
22 -03 -17 -35 -31 -05 09 13 12 10 12 11
-12 -38 -96 -92 -35 -68 -17 00 04 -20 -06 -09
-58 -80 -124 29 -23 -25 -16 -19 -25 -16 -20 -26
103 105 89 77 66 67 64 67 70 67 68 58
-73 -44 -72 -54 -10 11 17 09 05 18 14 06
47 65 66 50 74 77 92 91 100 96 100 110
-22 10 34 36 15 18 29 34 38 25 28 31
-61 -90 -109 -104 -72 -22 04 08 11 09 09 10
-12 -12 -30 -02 02 31 49 69 78 50 60 65
-60 -61 -63 -37 -26 16 20 19 23 43 43 54
49 72 35 17 -15 -14 -02 05 04 -12 -13 -11
07 04 01 03 04 18 27 27 27 27 29 30
00 -03 00 01 14 22 23 23 23 25 26
-02 -50 -173 -04 01 -13 20 13 00 03 00 -06
-38 -45 -32 -50 -35 -26 -24 -15 -09 -16 -11 -10
08 27 30 58 59 60 70 68 66 54 56 58
-52 -38 -62 -09 -11 -02 08 13 09 01 07 01
-100 -60 -87 -04 -39 -11 01 -05 -07 -05 -08 -14
-48 -76 -60 04 06 11 29 27 26 30 27 18
-24 -34 -42 -43 -45 -33 -16 -14 -18 -15 -13 -14
-59 -43 -97 -44 -45 -44 -10 -12 -16 -12 -15 -17
43 57 78 69 62 65 62 56 55 59 56 53
-09 -22 -18 -27 -15 -37 -38 -33 -32 -43 -44 -43
04 -01 -03 -01 02 09 17 17 17 16 17 18
-07 -12 -06 -03 05 13 14 14 13 14 14
-21 -37 -46 -33 -26 -26 -23 -21 -23 -26 -27 -30
23 29 37 37 20 10 07 05 10 12 18 23
sup2 See note 8 on concepts and sources
forecast
Portugal
Sweden
Italy
Hungary
Greece
Euro area
USA
Slovenia
Malta
United Kingdom
averages
Cyprus
forecast
Poland
Netherlands
sup1 See note 7 on concepts and sources
Austria
EU adjustedsup2
Luxembourg
Romania
Lithuania
Czech Republic
Finland
Denmark
Japan
Winter 2014
17022014
EU
Latvia
Croatia
Estonia
Bulgaria
France
Autumn 2013
Ireland
Belgium
Spain
Germany
Euro area adjustedsup2
Slovakia
Current-account balancesup1 (as a percentage of GDP 1995-2015)
Statistical Annex
159
Table 51
5-year
1995-99 2000-04 2005-09 2010 2011 2012 2013 2014 2015 2013 2014 2015
45 48 22 25 03 -03 03 07 04 11 10 09
-09 14 62 64 61 70 70 66 64 69 66 63
-79 -82 -75 70 44 07 08 01 01 08 03 02
29 04 -41 07 11 32 68 72 69 30 41 47
-12 -103 -132 -110 -98 -29 -03 -01 02 -04 -01 02
02 -34 -76 -38 -35 -06 19 22 23 24 33 37
19 08 -13 -18 -25 -22 -19 -20 -21 -18 -14 -14
24 -01 -16 -35 -30 -03 09 14 13 11 12 11
-12 -34 -94 -90 -33 -67 02 10 13 -11 -08 -10
-57 -75 -107 49 -02 05 09 06 00 15 11 04
90 73 63 62 60 66 71 70 71 63
-66 -39 -53 -37 00 28 39 32 29 40 37 29
44 62 62 45 70 74 89 82 99 93 92 108
-23 09 33 37 14 16 28 35 38 25 28 31
-37 -72 -96 -90 -56 -01 23 27 30 36 36 35
-12 -15 -32 -01 00 29 49 75 86 31 25 68
-62 -65 -58 -21 -09 31 32 36 37 56 54 60
50 73 36 18 -13 -13 -01 06 05 -11 -12 -11
02 04 05 19 28 29 29 29 30 31
-02 01 01 15 24 25 25 25 26 27
-07 -48 -169 03 13 00 33 27 13 18 17 12
-38 -42 -25 -29 -16 -14 -09 -01 06 -02 03 05
09 27 30 59 63 60 70 68 68 55 57 60
-52 -38 -62 -09 -11 -02 08 13 09 01 07 01
-101 -57 -65 34 -06 19 30 23 20 18 14 08
-48 -74 -52 22 29 37 61 56 53 62 58 50
-23 -33 -34 -27 -27 -16 03 07 04 00 06 03
-56 -38 -92 -42 -39 -30 00 -03 -07 -02 -06 -08
38 56 77 68 61 63 62 55 53 60 54 52
-08 -20 -17 -24 -12 -35 -36 -31 -30 -41 -42 -42
-02 02 04 11 19 20 20 19 19 20
-10 -03 -01 08 16 17 17 15 16 17
-21 -37 -46 -33 -26 -26 -23 -21 -23 -26 -27 -30
21 28 36 36 20 10 06 05 10 12 18 23
sup2 See note 8 on concepts and sources
forecast
Portugal
Sweden
Italy
Hungary
Greece
Euro area
USA
Slovenia
Malta
United Kingdom
averages
Cyprus
forecast
Poland
Netherlands
sup1 See note 7 on concepts and sources
Austria
EU adjustedsup2
Luxembourg
Romania
Lithuania
Czech Republic
Finland
Denmark
Japan
Winter 2014
17022014
EU
Latvia
Croatia
Estonia
Bulgaria
France
Autumn 2013
Ireland
Belgium
Spain
Germany
Euro area adjustedsup2
Slovakia
Net lending (+) or net borrowing (-) of the nationsup1 (as a percentage of GDP 1995-2015)
Table 52
2007 2008 2009 2010 2011 2012 2013 2014 2015 2013 2014 2015
132 37 24 93 17 -09 02 25 12 36 37 33
1825 1521 1451 1595 1632 1879 1921 1883 1885 1918 1872 1875
-25 -14 06 05 00 -05 -04 -05 -05 -04 -04 -05
-104 -102 -38 18 20 73 116 115 126 68 77 86
-393 -419 -332 -284 -245 -103 -42 -33 -30 -43 -34 -31
-1052 -1043 -500 -457 -416 -125 113 166 191 147 264 328
-257 -366 -332 -361 -491 -424 -399 -428 -472 -362 -308 -318
-201 -449 -302 -545 -483 -84 136 200 197 153 184 177
-19 -21 -18 -16 -06 -12 -03 00 01 -03 -01 -01
-47 -30 16 05 -05 -06 -04 -05 -07 -04 -05 -07
38 20 26 30 28 29 29 32 35 30 32 28
-02 -03 -05 -03 -01 01 01 01 00 01 01 00
481 281 182 296 443 459 557 558 639 581 614 699
109 137 74 103 46 55 90 110 127 80 92 106
-172 -217 -182 -179 -123 -37 07 14 19 15 15 17
-16 -23 -01 -01 01 11 17 24 28 18 21 23
-31 -40 -16 -25 -18 12 15 14 18 31 32 43
76 58 34 30 -27 -27 -03 10 09 -24 -26 -24
340 -672 87 303 372 1685 2549 2684 2775 2639 2862 3030
83 -1426 -216 06 55 1281 2143 2279 2372 2219 2444 2614
-78 -82 -31 -01 00 -05 08 05 00 01 00 -03
-68 -45 -46 -75 -54 -40 -35 -22 -14 -24 -18 -16
31 68 76 138 143 147 176 175 176 134 145 153
-30 -39 -20 -04 -05 -01 03 06 04 00 03 00
-43 -42 05 -01 -12 -04 00 -02 -03 -02 -03 -05
-74 -73 -01 03 06 11 28 28 28 29 28 19
-189 -205 -96 -152 -166 -125 -62 -57 -76 -60 -51 -60
-170 -160 -49 -55 -59 -59 -15 -17 -24 -17 -22 -26
290 294 201 242 240 263 260 238 243 248 241 242
-456 -173 -225 -466 -259 -721 -717 -680 -682 -803 -864 -883
-446 -1129 -101 -67 206 1151 2197 2357 2427 2146 2322 2452
-1340 -2767 -823 -687 -353 691 1736 1896 1966 1650 1823 1957
-5321 -5286 -3251 -3753 -2897 -3285 -2949 -2694 -3174 -3241 -3517 -4046
1546 1093 1054 1539 861 471 246 186 359 439 679 900
sup2 See note 8 on concepts and sources
Autumn 2013
United Kingdom
Cyprus
Poland
Spain
Denmark
forecast
Germany
France
Lithuania
Ireland
Czech Republic
Finland
Latvia
17022014
Winter 2014
Belgium
Portugal
sup1 See note 7 on concepts and sources
Sweden
Italy
Hungary
Greece
Euro area
USA
Slovenia
Malta
Current-account balancesup1 (in billions of euro 2007-15)
Luxembourg
Romania
Estonia
Bulgaria
forecast
Austria
Euro area adjustedsup2
Japan
Slovakia
Netherlands
EU
EU adjustedsup2
Croatia
European Economic Forecast Winter 2014
160
Table 53
2007 2008 2009 2010 2011 2012 2013 2014 2015 2013 2014 2015
53 21 -106 103 50 11 13 44 58 14 43 58
68 22 -117 105 52 12 17 43 56 17 44 56
93 18 -177 96 74 15 12 43 59 14 49 61
41 12 -115 107 46 13 19 43 54 17 41 51
57 17 -124 104 49 11 21 41 57 18 41 55
50 19 -106 98 42 05 19 43 56 19 42 55
59 18 -111 103 49 10 19 45 57 17 46 57
66 27 -110 99 54 16 21 46 58 21 46 59
67 22 -136 81 74 13 35 57 72 22 43 52
89 38 -170 125 104 39 27 49 61 27 53 63
49 16 -112 101 42 04 16 40 51 14 36 49
52 18 -117 103 44 08 22 43 55 20 42 53
55 23 -112 104 52 09 15 45 59 12 45 58
68 28 -115 113 59 11 17 48 62 14 47 62
55 09 -126 97 39 -03 18 43 55 14 39 54
73 27 -131 98 55 04 10 44 59 09 45 60
83 32 -123 117 62 08 13 48 62 09 46 61
87 36 -122 119 77 27 22 48 61 23 50 62
61 22 -113 104 51 11 17 44 57 16 45 57
85 24 -128 94 56 00 16 40 58 13 43 60
70 32 -123 112 59 13 15 49 63 13 48 63
64 24 -114 114 54 15 17 44 58 16 44 57
69 15 -127 104 53 -04 14 41 56 08 38 54
111 25 -166 112 98 35 16 47 60 19 51 63
78 35 -125 110 61 13 14 47 61 12 46 61
80 35 -124 114 62 17 14 46 60 12 47 61
70 17 -124 102 54 07 15 44 59 15 46 61
59 23 -119 97 50 17 20 41 55 20 43 55
62 16 -111 105 50 14 19 45 56 19 45 57
62 22 -115 105 52 12 17 44 57 16 45 57
72 35 -112 131 66 33 33 51 56 36 51 58
77 37 -90 148 70 34 33 55 65 38 58 65
forecast
Germany
Winter 2014
Belgium
Portugal
Austria
Ireland
Spain
France
Latvia
17022014
United Kingdom
Italy
Poland
Export markets (a) (percentage change on preceding year 2007-15)
Greece
Euro area (b)
Slovenia
Malta
Autumn 2013
Cyprus
Romania
Estonia
Czech Republic
forecast
(b) Intra- and extra-EU trade
Japan
Luxembourg
Sweden
(a) Imports of goods and services to the various markets (incl EU-markets) weighted according to their share in countrys exports of goods and services
USA
Slovakia
Netherlands
EU (b)
Lithuania
Croatia
Hungary
Denmark
Finland
Bulgaria
Table 54
2007 2008 2009 2010 2011 2012 2013 2014 2015 2013 2014 2015
-01 -07 14 -20 13 07 07 -08 -10 -12 -02 -09
11 06 -14 42 27 20 -10 06 12 -14 02 12
-52 -08 -43 129 149 41 05 -02 -03 -08 -01 -05
41 -23 87 -39 07 02 -17 -14 -16 -12 -16 -13
13 00 -80 -47 -44 -35 03 05 -01 06 05 00
16 -29 07 17 33 16 29 11 08 25 09 02
-34 -21 -11 -08 05 14 -14 -01 00 -03 -03 -01
-03 -54 -73 13 08 04 -19 -12 -08 -19 -09 -09
-05 -27 34 -40 -28 -40 -81 -79 -49 -75 -65 -33
25 -14 47 00 18 52 -18 -04 -01 01 -06 -01
39 28 -19 -26 12 -24 07 -04 -02 13 04 -13
-14 03 37 64 -10 73 -50 -03 04 -35 04 03
08 -03 39 11 -11 23 -02 -15 -08 16 -13 -13
19 -13 -46 -17 07 01 06 00 -02 02 00 -03
19 -10 19 05 29 34 40 08 -02 44 11 00
60 13 -34 03 14 02 19 -06 -13 03 -18 -20
55 -01 -45 39 56 90 21 00 00 36 00 00
-05 21 -104 -36 -46 -28 -26 -14 -16 -36 -14 -17
05 -11 -12 11 13 14 -05 -02 00 -03 -03 -01
-22 06 18 49 63 -03 65 15 06 36 -09 -05
39 07 16 38 34 31 -10 08 -02 -16 -10 -14
-34 09 22 -75 15 -11 -07 -13 -16 -06 -09 -16
-30 02 -40 -50 -31 08 -27 -15 -25 -15 -13 -23
-72 87 48 56 39 80 48 18 08 39 15 05
66 21 26 03 22 03 36 06 00 25 07 00
10 34 64 06 14 22 32 05 02 41 03 -02
08 65 68 27 59 -21 118 12 04 81 04 00
-02 -05 -22 15 10 -10 -34 -13 00 -40 -07 10
-78 -05 27 -35 -05 -03 -12 -16 -18 09 -09 -19
-05 -07 -02 04 12 11 -03 -03 -02 -01 -03 -03
16 22 24 -14 04 02 -04 11 01 -06 05 01
09 -22 -167 83 -69 -34 -16 -20 -23 00 00 -26
forecast
Germany
Winter 2014
Belgium
Portugal
Austria
Ireland
Spain
France
Latvia
17022014
United Kingdom
Italy
Poland
Export performance (a) (percentage change on preceding year 2007-15)
Greece
Euro area (b)
Slovenia
Malta
Autumn 2013
Cyprus
Romania
Estonia
Czech Republic
forecast
(b) Intra- and extra-EU trade
Japan
Luxembourg
Sweden
(a) Index for exports of goods and services divided by an index for growth of markets
USA
Slovakia
Netherlands
EU (b)
Lithuania
Croatia
Hungary
Denmark
Finland
Bulgaria
Statistical Annex
161
Table 55
( a ) 2009 2010 2011 2012 2013 2014 2015 2013 2014 2015
187 -45 20 17 -04 01 16 20 00 14 19
132 -45 19 15 -07 -04 12 18 -04 11 17
05 -28 23 18 -01 02 14 17 01 11 14
01 -55 04 18 08 06 17 20 05 15 18
03 -45 25 18 -10 -12 18 22 -10 18 22
02 -57 14 11 -04 03 17 18 03 17 18
37 -51 40 33 07 04 18 20 05 17 19
00 -141 26 96 39 07 23 36 13 30 39
02 -64 -11 22 02 03 18 29 03 17 25
03 -31 -49 -71 -64 -37 06 29 -40 06 29
16 -38 -02 01 -16 -12 10 17 -13 05 17
26 -31 17 20 00 03 10 17 02 09 17
01 -69 -23 00 -20 -07 05 12 -07 05 12
21 -55 17 05 -25 -19 06 12 -18 07 12
00 -19 13 04 -24 -60 -48 09 -87 -39 11
00 -177 -13 53 52 40 42 43 40 41 42
01 -148 16 60 37 32 35 39 34 36 39
00 -56 31 19 -02 21 22 25 19 18 11
02 -68 11 16 -17 11 21 21 07 18 21
00 -28 33 17 09 20 21 21 18 19 20
08 -37 15 09 -12 -08 10 13 -10 02 12
04 -38 18 28 09 03 15 18 04 16 18
09 16 39 45 19 16 29 31 13 25 29
03 -29 19 -13 -32 -16 08 15 -18 08 15
03 -66 -11 22 07 35 23 25 22 21 24
01 -79 13 07 -25 -16 -01 13 -27 -10 07
02 -49 44 30 18 08 23 32 09 21 29
02 -85 34 28 -10 -15 02 13 -06 06 16
05 -50 66 29 09 09 25 33 11 28 35
27 -52 17 11 03 19 25 24 13 22 24
15 -47 82 81 18 36 24 29 33 29 41
13 -48 92 88 22 38 25 30 35 30 43
00 -09 29 28 -04 32 25 26 21 25 28
00 -66 -41 27 14 28 27 30 17 23 25
00 -57 25 32 -25 24 27 30 19 23 31
01 -35 10 16 -15 21 13 22 17 15 20
01 03 25 24 04 11 22 30 15 25 31
193 -28 25 18 28 19 29 32 16 26 31
55 -55 47 -05 14 16 16 13 21 20 13
18 -28 32 24 18 17 22 23 18 21 23
03 -16 05 13 29 13 27 26 19 26 27
04 -19 30 18 10 18 21 22 17 18 19
12 21 24 34 35 25 28 30 26 28 28
02 08 12 13 36 28 31 28 29 26 26
487 -37 27 17 13 12 22 25 11 21 24
43 -67 49 48 34 19 28 31 23 33 36
30 -78 45 43 34 13 23 27 19 30 34
13 -40 60 60 32 33 40 42 33 40 42
53 15 34 25 35 24 36 38 24 36 38
303 54 103 74 59 59 61 63 57 60 63
154 92 116 94 78 77 74 74 75 74 74
57 50 112 77 38 40 47 54 29 40 53
04 -25 68 49 15 30 33 34 30 33 34
19 03 63 37 20 28 37 38 28 37 38
15 46 62 65 62 58 60 63 58 60 63
86 -13 60 45 29 26 31 34 26 31 35
28 -03 75 27 09 22 23 29 22 25 31
21 -47 52 39 39 13 32 37 13 31 37
27 27 54 48 48 50 53 55 50 53 55
513 24 80 60 49 46 50 53 45 50 53
1000 -09 52 38 31 29 36 39 28 36 39
813 01 61 44 39 36 41 44 35 41 44
868 -03 58 42 37 35 40 43 33 39 43
17022014
Winter 2014
EU
- Brazil
- Serbia
Cyprus
Asia
Sweden
Estonia
- Russia
Slovenia
Czech Republic
Canada
Hungary
- Korea
Potential Candidates
World GDP volume (percentage change on preceding year 2009-15)
Spain
Finland
Germany
CIS
Romania
Bulgaria
Australia
Japan
Austria
Luxembourg
- The former Yugoslav Republic of
Macedonia
Latvia
France
Autumn 2013
forecast
Italy
- Hong Kong
MENA
- Turkey
- China
United Kingdom
Ireland
- Other CIS
New Zealand
Slovakia
Denmark
Poland
forecast
Euro area
Greece
World excluding euro area
Belgium
Switzerland
Netherlands
Latin America
- Montenegro
Emerging and developing economies
World
(a) Relative weights in based on GDP (at constant prices and PPS) in 2012
- Mexico
World excluding EU
Lithuania
Croatia
- India
Candidate Countries
Advanced economies
Portugal
Norway
Malta
Sub-Saharan Africa
- Indonesia
USA
- Iceland
European Economic Forecast Winter 2014
162
Table 56
( a ) 2009 2010 2011 2012 2013 2014 2015 2013 2014 2015
348 -117 110 65 23 14 41 55 15 41 54
262 -124 116 65 25 13 42 57 13 42 56
11 -53 46 75 145 19 70 85 30 63 75
09 -50 34 79 167 07 74 90 22 66 79
00 -158 236 105 00 37 64 66 45 55 60
00 70 05 38 38 41 40 42 25 33 40
00 -224 75 141 -12 51 22 20 30 19 25
01 -80 153 34 18 159 49 57 129 51 59
101 -91 115 71 35 28 62 57 30 56 58
35 -242 244 -04 -01 16 34 40 36 58 37
26 -130 56 50 09 25 54 50 27 50 50
09 -42 04 -07 11 -17 39 57 13 32 50
15 -77 77 38 25 19 45 41 21 37 40
14 21 57 -06 58 47 57 58 38 57 58
02 24 39 24 23 17 31 35 30 38 38
563 -116 112 56 26 18 46 55 21 46 53
40 -138 105 80 05 27 45 49 16 49 50
27 -47 70 03 14 38 42 50 21 49 52
14 -317 174 237 -13 06 49 46 06 49 46
54 -160 89 73 28 45 50 53 45 50 53
264 -81 203 74 35 42 60 68 43 62 68
107 -103 278 89 52 41 60 70 41 60 70
21 -69 127 128 81 31 44 64 39 64 74
26 -100 168 39 19 63 79 81 63 79 81
31 -12 147 91 42 43 58 59 50 58 60
10 78 87 58 -10 50 78 92 50 78 92
58 -100 126 63 32 40 56 63 37 55 63
13 -36 113 49 34 25 39 52 25 42 54
18 -136 210 76 45 31 61 74 21 57 74
20 -322 171 137 -104 28 56 53 28 56 53
437 -113 169 76 24 40 57 63 39 58 63
1000 -115 134 64 25 27 51 58 29 51 58
652 -113 150 64 26 34 56 60 36 57 60
738 -111 142 64 25 33 54 59 34 55 58
(b) Intra- and extra-EU trade
Autumn 2013
Sub-Saharan Africa
USA
Latin America
- Iceland
- India
forecast
Euro area (b)
- Montenegro
- Korea
- Turkey
- China
- Russia
Japan
17022014
Winter 2014
EU (b)
New Zealand
(a) Relative weights in based on exports of goods and services (at current prices and current exchange rates) in 2012
- Mexico
- Serbia
- Indonesia
- The former Yugoslav Republic of
Macedonia
- Other CIS
World excluding EU
Advanced economies
Norway
World exports of goods and services volume (percentage change on preceding year 2009-15)
Canada
- Brazil
Candidate Countries
Asia
forecast
Australia
MENA
World excluding euro area
CIS
Switzerland
Emerging and developing economies
World
- Hong Kong
17022014
EU Euro Area
Candidate
Countries USA Japan
Other
Advanced
Economies China Rest of Asia CIS MENA
Latin
America
Sub-
Saharan
Africa
EU 649 483 20 63 13 55 33 46 33 43 27 16
Euro area 645 477 19 63 14 54 36 46 30 46 29 17
Belgium 745 612 12 49 09 30 21 49 16 36 15 19
Bulgaria 621 464 149 19 03 18 31 20 64 55 07 13
Czech Republic 821 649 16 24 05 27 13 16 46 18 07 06
Denmark 654 371 12 68 22 89 28 45 25 27 23 07
Germany 593 390 20 72 15 71 60 51 39 35 31 12
Estonia 699 395 20 34 11 49 09 34 116 10 10 09
Ireland 578 383 07 208 27 77 22 28 10 18 16 09
Greece 500 340 173 36 03 18 15 44 32 159 09 12
Spain 654 532 23 41 12 42 20 28 19 78 65 18
France 592 469 17 66 20 51 38 67 24 69 30 27
Croatia 663 560 110 47 08 23 06 11 59 51 09 11
Italy 546 411 32 73 17 77 29 54 37 81 40 14
Cyprus 491 326 01 12 04 11 21 214 28 206 01 10
Latvia 672 340 15 15 06 36 05 26 163 53 07 02
Lithuania 655 465 09 31 04 32 03 09 219 22 04 11
Luxembourg 823 699 19 25 04 42 13 20 19 19 08 09
Hungary 781 558 30 27 07 19 18 18 54 25 11 10
Malta 434 342 38 39 17 18 107 180 14 126 13 13
Netherlands 788 627 10 37 07 29 15 34 17 27 19 16
Austria 714 544 16 51 10 65 25 31 37 22 22 07
Poland 783 541 21 21 04 30 11 15 86 14 10 06
Portugal 696 599 10 44 06 23 22 14 09 39 39 97
Romania 692 509 77 24 06 17 13 22 64 63 12 10
Slovenia 766 552 59 17 02 21 08 15 67 36 06 04
Slovakia 858 469 19 17 02 21 26 05 40 06 04 02
Finland 544 320 15 66 19 71 49 56 96 31 37 18
Sweden 604 403 14 58 14 122 36 46 23 36 29 18
United Kingdom 551 488 15 117 15 70 30 83 19 48 23 27
Table 57 Export shares in EU trade (goods only - 2012)
Statistical Annex
163
Table 58
( a ) 2009 2010 2011 2012 2013 2014 2015 2013 2014 2015
330 -115 98 44 -03 05 40 56 02 37 53
244 -110 100 45 -09 02 41 59 -01 39 57
14 -154 177 102 01 61 11 36 71 54 85
12 -143 207 107 -03 69 07 33 80 57 91
00 -143 95 104 42 -08 61 65 30 57 62
00 -240 45 67 47 06 46 53 00 42 45
00 -302 -31 31 09 -17 20 30 -06 10 24
01 -191 31 70 19 21 26 49 11 25 49
124 -137 128 49 22 14 47 63 22 56 62
42 -157 111 59 53 34 45 22 26 40 24
27 -120 99 55 02 30 45 48 30 44 48
06 -125 90 38 23 26 30 53 30 30 53
12 -52 84 42 31 18 41 32 18 37 38
15 -90 143 108 62 14 48 56 40 56 64
02 -144 108 66 20 49 54 40 50 50 50
574 -122 107 49 09 13 41 54 13 43 53
34 -277 191 183 54 36 62 66 50 76 77
21 -304 258 203 95 59 65 73 82 87 90
13 -238 96 153 -11 -02 56 55 -02 56 55
50 -30 05 -04 24 48 56 57 48 56 56
260 -60 194 44 52 38 60 70 46 64 71
98 42 201 101 62 44 63 73 44 63 73
25 -06 154 -207 118 -27 29 64 43 68 75
28 -90 174 46 28 64 78 79 64 78 79
29 -80 173 61 25 35 50 57 42 55 56
10 -106 271 135 140 20 57 74 20 57 74
59 -178 182 120 26 53 66 71 58 66 71
14 -135 277 74 -16 57 69 74 57 70 75
19 -176 183 73 49 42 64 76 57 63 76
22 -181 57 113 -36 61 59 62 61 59 62
426 -99 157 63 41 43 60 68 49 64 69
1000 -114 126 54 22 25 49 60 28 52 60
670 -113 143 60 36 35 54 61 41 59 63
756 -115 136 58 33 33 52 60 38 56 61
- India
forecast
Euro area (b)
forecast
Australia
World
World imports of goods and services volume (percentage change on preceding year 2009-15)
Canada
- Brazil
- Montenegro
- Korea
- Turkey
- China
- Russia
Emerging and developing economies
Autumn 2013
Sub-Saharan Africa
USA
Latin America
- Iceland
17022014
Winter 2014
EU (b)
New Zealand
Japan
Switzerland
(b) Intra- and extra-EU trade
- Hong Kong
Candidate Countries
Asia
(a) Relative weights in based on imports of goods and services (at current prices and current exchange rates) in 2012
- Mexico
- Serbia
- Indonesia
- The former Yugoslav Republic of
Macedonia
- Other CIS
World excluding EU
Advanced economies
Norway
MENA
World excluding euro area
CIS
17022014
EU Euro Area
Candidate
Countries USA Japan
Other
Advanced
Economies China Rest of Asia CIS MENA
Latin
America
Sub-
Saharan
Africa
EU 629 485 13 43 14 54 62 47 58 38 24 19
Euro area 627 481 12 43 14 47 61 47 57 45 27 20
Belgium 691 585 08 67 17 37 40 51 20 32 23 15
Bulgaria 605 435 68 07 02 15 32 16 220 14 20 02
Czech Republic 783 622 08 14 12 18 56 42 60 03 02 02
Denmark 720 475 13 25 04 80 68 37 16 14 19 05
Germany 664 468 14 40 18 69 65 45 40 15 18 12
Estonia 741 433 06 09 07 22 50 20 136 01 03 05
Ireland 702 259 05 122 13 43 35 34 03 19 19 05
Greece 481 379 30 12 03 22 53 64 137 177 15 05
Spain 563 470 13 29 08 27 57 42 34 104 77 47
France 694 583 10 43 10 44 45 40 30 50 14 21
Croatia 680 537 43 21 06 24 76 28 84 09 22 06
Italy 562 455 17 33 08 41 61 42 89 100 26 20
Cyprus 579 464 01 12 12 16 66 66 125 108 14 01
Latvia 580 298 05 14 02 13 39 20 322 02 03 00
Lithuania 604 401 09 17 01 14 40 15 288 04 04 04
Luxembourg 793 754 02 76 08 19 71 11 00 01 18 00
Hungary 730 568 11 15 13 12 70 40 95 03 10 01
Malta 452 372 46 22 25 18 109 203 104 14 04 02
Netherlands 447 328 08 62 25 50 105 71 108 44 48 31
Austria 802 667 11 20 06 53 22 21 40 15 02 08
Poland 709 567 10 15 07 19 58 35 132 05 08 03
Portugal 711 642 05 15 05 17 30 21 35 55 40 66
Romania 747 521 40 13 05 14 40 22 96 09 09 04
Slovenia 753 591 46 12 02 16 46 60 13 22 25 05
Slovakia 775 413 10 05 07 07 36 63 94 02 01 00
Finland 617 374 04 27 07 49 69 35 162 02 20 08
Sweden 701 489 08 33 11 91 46 33 50 04 12 11
United Kingdom 524 444 15 77 19 122 77 64 23 29 22 28
Table 59 Import shares in EU trade (goods only - 2012)
European Economic Forecast Winter 2014
164
Table 60
2008 2009 2010 2011 2012 2013 2014 2015 2013 2014 2015
-2217 -587 -902 -1195 79 1127 1264 1326 1484 1780 1927
-3446 -1335 -1781 -2106 -725 295 415 478 777 1058 1212
231 732 670 452 1744 2655 2921 3056 2904 3222 3415
-297 357 119 -23 1265 2158 2423 2564 2357 2667 2865
-694 -355 -657 -982 -739 -867 -772 -684 -840 -864 -989
-8486 -5226 -6729 -7610 -7585 -7230 -7166 -7818 -7497 -7991 -8705
389 432 910 -203 -729 -946 -1127 -1047 -820 -865 -784
789 457 500 681 692 618 635 707 657 677 733
110 125 127 163 165 179 253 340 193 254 318
-9750 -5247 -6647 -8824 -8281 -7221 -6920 -7116 -7023 -7152 -7622
1951 1097 1641 2318 2297 2106 1998 2027 2051 2064 2114
1782 1110 1519 1986 1954 1808 1680 1732 1753 1746 1819
1970 -261 1053 2131 1975 1697 1438 1224 1753 1456 1185
2179 2337 1745 783 558 1418 1927 2339 998 1163 1175
2970 1976 1821 1563 2312 3013 3518 4148 3003 3466 4036
410 505 482 881 654 427 233 114 306 99 -31
665 224 546 692 402 237 139 -34 237 139 -34
7175 3901 5467 6805 5887 5885 5735 5670 5346 4920 4409
-2574 -1346 -1180 -2019 -2394 -1336 -1185 -1446 -1677 -2232 -3213
17022014
- Russia
Euro area
forecast
Norway
forecast
World merchandise trade balances (fob-fob in billions of US dollar 2008-15)
Euro area adjustedsup1
Switzerland
Winter 2014
sup1 See note 8 on concepts and sources
CIS
Japan
Latin America
Autumn 2013
Sub-Saharan Africa
MENA
Emerging and developing economies
Asia
Candidate Countries
World
Advanced economies
EU
- China
USA
EU adjustedsup1
Table 61
2008 2009 2010 2011 2012 2013 2014 2015 2013 2014 2015
-1661 -140 -89 286 1479 2918 3199 3294 2849 3151 3328
-4070 -1148 -911 -492 887 2306 2583 2678 2191 2475 2657
-988 121 402 518 2165 3385 3643 3766 3503 3885 4113
-2097 -301 07 77 1646 2846 3104 3231 2945 3317 3548
-565 -188 -510 -788 -521 -667 -545 -420 -607 -603 -709
-7775 -4534 -4976 -4033 -4220 -3917 -3657 -4308 -4302 -4773 -5492
1607 1470 2040 1198 605 327 252 487 583 922 1221
730 446 502 646 703 609 614 681 679 689 747
129 585 839 691 777 848 1007 1175 733 870 1014
-8090 -3254 -3178 -2886 -2449 -1006 -163 -53 -1295 -925 -1049
1060 414 703 1067 786 708 534 340 793 691 608
1023 487 710 994 775 428 212 32 512 369 300
1384 -1056 239 1286 1163 1141 939 759 1189 951 718
5229 4208 3805 2618 2519 3407 3736 4040 2749 2850 2798
4206 2433 2378 1361 1931 2446 2821 3296 2436 2770 3184
-352 -281 -584 -756 -994 -1005 -1245 -1390 -1124 -1378 -1535
-79 -322 -65 -102 -377 -246 -431 -423 -246 -431 -423
7242 2962 4098 4113 3097 4006 3534 3326 3362 2683 2166
-848 -292 920 1227 647 3000 3371 3273 2067 1758 1117
17022014
- Russia
Euro area
forecast
Norway
forecast
World current-account balances (in billions of US dollar 2008-15)
Euro area adjustedsup1
Switzerland
Winter 2014
sup1 See note 8 on concepts and sources
CIS
Japan
Latin America
Autumn 2013
Sub-Saharan Africa
MENA
Emerging and developing economies
Asia
Candidate Countries
World
Advanced economies
EU
- China
USA
EU adjustedsup1
Table 62 17022014
2008 2009 2010 2011 2012 2013 2014 2015 2013 2014 2015
216 -111 115 175 -27 19 -50 12 -03 -62 -07
88 -236 398 191 -143 -48 14 14 -47 20 25
77 -202 295 259 -118 -48 16 06 -55 10 10
30 -103 62 90 -58 07 02 14 24 27 20
95 -257 466 152 -158 -48 12 19 -42 26 35
381 -367 263 380 13 -29 -41 -40 -28 -25 -56
362 -369 288 383 08 -27 -43 -43 -27 -27 -58
141 -180 262 185 -94 -18 -16 13 -27 -18 11
339 -340 263 345 -04 -27 -37 -33 -28 -24 -46
986 623 802 1109 1118 1088 1041 996 1088 1058 997
671 446 605 797 870 819 765 732 820 780 734Brent (euro)
Autumn 2013
- Total excluding fuels
- of which
STIC
Classification
Fuel products
forecast
- Total including fuels
Agricultures non-food
- of which
Brent (usd)
Wood and pulp
Basic materials
forecast
Crude petroleum - price per barrel
Primary Commodities
Minerals and metals
- of which
Primary commodity prices (in US dollar percentage change on preceding year 2008-15)
Crude petroleum
Food
Winter 2014
Statistical Annex
165
Asia
aggregation is carried out on the basis of current exchange rates
FTE data as this is regarded as more representative of diverse patterns of working time
All countries in that region except the African MENA countries
These forecasts cover the principal macroeconomic
3 Tables 5 and 6 on domestic demand and final demand respectively
the capital stock and the difference between actual unemployment
reduced border controls and formalities and accordingly the
All countries in that region
MENA (Middle East and Northern Africa)
2 Data for 2013 2014 and 2015 are forecasts
Albania Bosnia-Herzegovina and Kosovo
In the calculation of EU and euro-area aggregates priority is given to
6 Employment data used in tables 23-29 and 32-33 are based on
reporting errors The creation of the internal market in 1993
output as estimated via a production function where the increase in
4 In Tables 17 and 18 the data are based on the national index for USA
Tunisia and the United Arab Emirates
Switzerland Australia and New Zealand
Potential candidates
EU28 (EA18 BG CZ DK HR LT HU PL RO SE and UK)
of payments statistics may arise due to methodological differences
absence of FTE data employment is based on numbers of persons
international environment
Note on concepts and sources
full-time-equivalents (FTEs) where available Currently Spain France
adjusted balances are Eurostat estimates for EU and ECB
For the USA and Japan the definitions are as in the SNA
now introduced chain-linking in their national accounts to measure
Candidate countries
EA18 (BE DE EE IE EL ES FR IT CY LV LU MT NL AT PT SI SK and FI)
unless otherwise stated The source for all tables is the European Commission
5 The potential output gap is calculated with reference to potential
the European Union as a whole the euro area and the
Latin America
and Japan and for EU Member States and aggregates prior to 1996
Advanced economies
Turkey the former Yugoslav Republic of Macedonia
the Asian MENA countries
Lebanon Libya Morocco Oman Qatar Saudi Arabia Syria
Sub-Saharan Africa
All countries in that region except Japan and
Algeria Bahrain Egypt Iran Iraq Israel Jordan Kuwait
Historical data for the Member States are based on the European
present data including inventories
and revision schedules
the development of economic aggregates in volume terms
observed in 2012
leading to an overestimation of the surplus For the past the
estimates for the euro area For the future they are ECFINs
scope and precision of intra-EU trade coverage Typically
and the NAWRU play a key role
the individual countries in the EU or the euro area However
forecasts based on the extrapolation of the discrepancies
intra-EU imports are underestimated compared to intra-EU exports
intra-EU or intra-euro-area balances are non-zero because of ECFIN) produces under its own responsibility short-term fully-
Tables 49 - 52 60 and 61 show also EU and euro-area adjusted
third countries should be identical to the sum of the balances of
Euro area
In the tables on world trade and international payments the
fledged economic forecasts in Winter Spring and Autumn
System of Accounting (ESA 1995) Most Member States have
aggregates for the Member States the candidate countries
1 The directorate general for economic and financial affairs (DG
Italy the Netherlands and Austria report FTE data In the
8 EU and euro-area data are aggregated using exchange rates
7 Source National Accounts (ESA95) Discrepancies with balance
EU candidate countries USA Japan Canada Norway
Iceland Montenegro and Serbia
European Union
9 Geographical zones are defined as follows
balances Theoretically balances of EU and euro area vis-agrave-vis
World GDP is aggregated using Purchasing Power Standards (PPS)
EUROPEAN ECONOMY SERIES
Previous titles in the European Economy series can be accessed and downloaded free of charge from the following address httpeceuropaeueconomy_financepublicationseuropean_economyindex_enhtm Alternatively hard copies may be ordered via the ldquoPrint-on-demandrdquo service offered by the EU Bookshop httpbookshopeuropaeu
2013
1-2013 bull European Economic Forecast ndash Winter 2013
2-2013 bull European Economic Forecast ndash Spring 2013
3-2013 bull Convergence Report 2013 on Latvia
4-2013 bull Public finances in EMU ndash 2013
5-2013 bull Tax reforms in EU Member States ndash 2013 - Tax policy challenges for
economic growth and fiscal sustainability
6-2013 bull Labour Market Developments in Europe ndash 2013
7-2013 bull European Economic Forecast - Autumn 2013
8-2013 bull Product Market Review 2013 - Financing the real economy
2014
1-2014 bull Energy Economic Developments in Europe
2-2014 bull European Economic Forecast ndash Winter 2014
HOW TO OBTAIN EU PUBLICATIONS Free publications bull one copy
via EU Bookshop (httpbookshopeuropaeu) bull more than one copy or postersmaps
from the European Unionrsquos representations (httpeceuropaeurepresent_enhtm) from the delegations in non-EU countries (httpeeaseuropaeudelegationsindex_enhtm) by contacting the Europe Direct service (httpeuropaeueuropedirectindex_enhtm) or calling 00 800 6 7 8 9 10 11 (freephone number from anywhere in the EU) () () The information given is free as are most calls (though some operators phone boxes or hotels may charge you)
Priced publications bull via EU Bookshop (httpbookshopeuropaeu) Priced subscriptions bull via one of the sales agents of the Publications Office of the European Union
(httppublicationseuropaeuothersagentsindex_enhtm)
KC-AR-14-002-EN-N

The European Economy series contains important reports and communications from the Commission to the Council and the Parliament on the economy and economic developments Unless otherwise indicated the texts are published under the responsibility of the European Commission Directorate-General for Economic and Financial Affairs Unit Communication B-1049 Brussels Belgium E-mail ecfin-infoeceuropa
LEGAL NOTICE Neither the European Commission nor any person acting on its behalf may be held responsible for the use which may be made of the information contained in this publication or for any errors which despite careful preparation and checking may appear This paper exists in English only and can be downloaded from httpeceuropaeueconomy_financepublications More information on the European Union is available on httpeuropaeu
KC-AR-14-002-EN-N (online) KC-AR-14-002-EN-C (print) ISBN 978-92-79-35344-4 (online) ISBN 978-92-79-36003-9 (print) doi10276575614 (online) doi10276576570 (print)
copy European Union 2014 Reproduction is authorised provided the source is acknowledged
European Commission Directorate-General for Economic and Financial Affairs
European Economic Forecast Winter 2014
EUROPEAN ECONOMY 22014
ABBREVIATIONS
ii
Countries and regions
EU European Union
EA euro area
BE Belgium
BG Bulgaria
CZ Czech Republic
DK Denmark
DE Germany
EE Estonia
IE Ireland
EL Greece
ES Spain
FR France
HR Croatia
IT Italy
CY Cyprus
LV Latvia
LT Lithuania
LU Luxemburg
HU Hungary
MT Malta
NL The Netherlands
AT Austria
PL Poland
PT Portugal
RO Romania
SI Slovenia
SK Slovakia
FI Finland
SE Sweden
UK United Kingdom
JP Japan
US United States of America
BRICS Brazil Russia India China and South Africa
CEE Central and Eastern Europe
CIS Commonwealth of Independent States
EFTA European Free Trade Association
MENA Middle East and North Africa
ROW Rest of the World
Economic variables and institutions
BCS Business and Consumer Surveys
CDS Credit Default Swaps
EDP Excessive Deficit Procedure
ESI Economic Sentiment Indicator
Euribor European Interbank Offered Rate
GDP Gross Domestic Product
GNI Gross National Income
HICP Harmonised Index of Consumer Prices
Libor London Interbank Offered Rate
iii
NAWRU Non-Accelerating Wage Rate of Unemployment
PMI Purchasing Managers Index
REER Real Effective Exchange Rate
SGP Stability and Growth Pact
VAT Value-Added Tax
CPB Centraal Planbureau the Netherlands Bureau for Economic Policy Analysis
ECB European Central Bank
EIB European Investment Bank
EFSF European Financial Stability Facility
EMU Economic and Monetary Union
ESM European Stability Mechanism
FOMC Federal Open Market Committee US
Fed Federal Reserve US
IMF International Monetary Fund
OBR Office for Budget Responsibility UK
OECD Organisation for Economic Cooperation and Development
WTO World Trade Organisation
Other abbreviations
AQR Asset Quality Review
BLS Bank Lending Survey
CFCI Composite Financing Cost Indicator
DSGE Dynamic stochastic general equilibrium [model]
FDI Foreign Direct Investment
FLS Funding for Lending Scheme UK
FY Financial year
JPA Job Protection Plan Hungary
LFS Labour Force Survey
LTRO Longer-Term Refinancing Operation
MRO Main Refinancing Operations
NFC Non-Financial Corporations
OMT Outright Monetary Transactions
SME Small and medium-sized enterprises
SMP Securities Market Programme ECB
QUEST Quarterly Estimation and Simulation Tool DG ECFINs DSGE model
GraphsTablesUnits
aa Annual average
bbl Barrel
bn Billion
bps Basis points
lhs Left hand scale
pp pps Percentage point points
pts Points
Q Quarter
q-o-q Quarter-on-quarter percentage change
rhs Right hand scale
SAAR Seasonally-Adjusted Annual Rate
tn Trillion
y-o-y Year-on-year percentage change
iv
Currencies
EUR Euro
ECU European currency unit
BGN Bulgarian lev
CNY Chinese yuan renminbi
CZK Czech koruna
DKK Danish krone
GBP Pound sterling
HUF Hungarian forint
HRK Croatian kuna
ISK Icelandic krona
LTL Lithuanian litas
LVL Latvian lats
MKD Macedonian denar
NOK Norwegian krone
PLN Polish zloty
RON New Romanian leu
RSD Serbian dinar
SEK Swedish krona
CHF Swiss franc
JPY Japanese yen
TRY Turkish lira
USD US dollar
CONTENTS
v
Overview 1
PART I EA and EU outlook 7
Recovery gaining ground 9
1 The recovery is firming in the EU 9
2 The external environment 11
3 Financial markets in Europe 13
4 GDP and components in the EU 15
5 Labour market conditions in the EU 21
6 Inflation in the EU 23
7 Public finances in the EU 24
8 Risks 26
PART II Prospects by individual economy 45
Member States 47
1 Belgium Growth expectations up inflation down 48
2 Bulgaria Economic growth resuming but labour market still
weak 50
3 The Czech Republic Economic activity to strengthen in 2014 52
4 Denmark Moving out of stagnation 54
5 Germany Accelerated growth in the offing 56
6 Estonia GDP growth regaining momentum with recovering
exports 58
7 Ireland Adjustment supported by stronger economic growth 60
8 Greece First signs of recovery 62
9 Spain The recovery becomes firmer while the rebalancing of the
economy continues 64
10 France Recovery remains slow amid sizeable budget deficits 66
11 Croatia Muted growth prospects amid a high fiscal deficit and
rising debt 68
12 Italy A slow recovery is underway 70
13 Cyprus Recession bottoms out while adjustments are underway 72
14 Latvia Economic growth and job creation continue at a sound
pace 74
15 Lithuania Solid growth continues in a context of
macroeconomic stability 76
16 Luxembourg Robust growth above the euro-area average 78
17 Hungary A mild recovery sustained by domestic demand 80
18 Malta Private consumption to drive growth 82
19 The Netherlands Economic recovery takes shape after two years
of recession 84
20 Austria Timid recovery expected to gain traction 86
21 Poland Regaining economic momentum 88
22 Portugal Gradual economic recovery 90
23 Romania Export-led rebound turning into a more broad-based
recovery 92
24 Slovenia Easing market tensions but deleveraging still ongoing 94
vi
25 Slovakia Growth to pick up in 2014 96
26 Finland Nascent recovery with consolidation needs ahead 98
27 Sweden Rebounding from a soft patch 100
28 The United Kingdom Recovery takes hold fiscal imbalances still
sizeable 102
Candidate Countries 105
29 The former Yugoslav Republic of Macedonia Recovery is
gaining firm ground in spite of weaker Investment 106
30 Iceland Helped by tourism but held back by capital controls 108
31 Montenegro A new wave of investment 110
32 Serbia Key reforms ahead 112
33 Turkey Depreciation monetary tightening and external
rebalancing 114
Other non-EU Countries 117
34 The United States of America Recovery gathering momentum 118
35 Japan A bumpy road ahead 120
36 China Steady growth but risk factors remain significant 122
37 EFTA Outperformance comes with a risk 124
38 Russian Federation Boosting investment remains a challenge 126
Statistical Annex 131
LIST OF TABLES
1 Overview - the winter 2014 forecast 1
I1 International environment 13
I2 Composition of growth - EU 16
I3 Composition of growth - euro area 17
I4 Labour market outlook - euro area and EU 22
I5 General Government budgetary position - euro area and EU 25
I6 Euro-area debt dynamics 26
LIST OF GRAPHS
I1 Real GDP EU 9
I2 HICP EU 9
I3 Interest rates on loans to enterprises (new businesses
maturity up to 1 year) 10
I4 Current-account balances euro area and Member States 11
I5 Contributions to World GDP growth from EU non-EU
advanced and emerging economies 12
I6 World trade and Global PMI manufacturing output 12
I7 Ten-year government-bond yield selected Member States 14
I8 Loans to enterprices (index of national stocks y-o-y growth
rate) 15
I9 Net changes in credit standards and credit demand for
loans to NFCs euro area 15
I10 Economic Sentiment Indicator and PMI Composite Output
Index EU 17
vii
I11 GDP growth and its components EU 18
I12 Equipment investment and capacity utilisation EU 18
I13 Private consumption and consumer confidence EU 19
I14 Global demand EU exports and new export orders 20
I15 Growth contributions in surplus and former deficit countries 21
I16 Employment expectations DG ECFIN surveys EU 21
I17 Employment growth and unemployment rate EU 22
I18 23
I19 Euro-area PPI and survey inflation expectations 24
I20 Budgetary developments EU 25
I21 General government revenues and expenditure EU 25
I22 Euro-area GDP forecasts - Uncertainty linked to the balance
of risks 27
LIST OF BOXES
I1 The economic effects of policy uncertainty 28
I2 Post-crisis total factor productivity trends in the EU 31
I3 The cyclical component of current-account balances 35
I4 Analysing current disinflationary trends in the euro area 39
I5 Some technical elements behind the forecast 42
EDITORIAL
ix
The recovery is broadening GDP growth in the EU which has turned positive in the second quarter of
last year is increasingly driven by domestic demand This year domestic consumption and investment
are set to expand further reducing the dependency of the recovery on the external sector Growth has also
returned in many of the vulnerable Member States and growth differentials across EU Member States are
expected to narrow
At the same time as we are observing more balanced growth prospects across the EU the global economy
is becoming more differentiated Among advanced economies the US has displayed a strong resilience to
domestic fiscal shocks and the related uncertainty Assessing the upswing there as sufficiently robust the
Federal Reserve has initiated the gradual shift towards a less expansionary monetary stance In turn the
prospect of a gradual normalisation of benchmark interest rates and global liquidity has led international
investors to discriminate more strongly among emerging market economies and capital flows to countries
with sizeable external imbalances and domestic weaknesses have dried up This reallocation of capital
flows has led to financial market tensions in mid-2013 and again in early 2014 They are a reminder that
the global economy remains vulnerable even as growth and trade are accelerating
Within the EU economy welcome recent improvements point to a path towards gradual normalisation
However the consequences of the crisis are still holding back growth and job creation and could do so for
some time On the one hand there are positive developments on several fronts After years of necessary
front-loaded fiscal consolidation the aggregate fiscal stance is now close to neutral although efforts are
still required in a number of Member States The ECBs comprehensive assessment of the banking sector
provides an opportunity to finalise the overdue repair of bank balance sheets that is a precondition for
overcoming financial fragmentation in the euro area and for getting credit to support the real economy
There are first signs that recent reforms in a number of Member States start bearing fruit as they facilitate
internal and external adjustment and crucially improve the prospects for employment growth On the
other hand as long as debt in several sectors of the economy remains too high unemployment is at record
levels and the adjustment of previous imbalances is incomplete there is a serious risk of growth
remaining stuck in low gear Indeed should the impetus for reforms at EU and Member State level falter
we would squander the opportunity to put the EU economy back on a higher growth trajectory The
present very low inflation - well below the ECB definition of price stability - could exacerbate the risk of
protracted lacklustre growth if it becomes entrenched Disinflation may have the positive effect of
improving real incomes and supporting demand However it also makes the competitiveness adjustment
in vulnerable Member States more challenging as the required negative inflation differential to the rest of
the euro area could adversely affect debt dynamics Going forward much depends on the stability of
inflation expectations for the medium term Should they shift lower the corresponding increase of real
interest rates and the debt burden would make it harder for growth to accelerate
Making 2014 the first year of a sustained recovery therefore requires continued and determined policy
efforts bold structural reforms in both vulnerable and core countries to tackle slow growth and facilitate
rebalancing via demand rotation full and effective implementation of the Banking Union to overcome
financial fragmentation sever sovereign-bank links and unlock credit in support of the recovery
improvement in the quality of public finances to boost investment and favour job creation It can be done
provided that policy makers at national and EU level do not mistake the recent signs of improvement as
definite normalisation There is still some sailing to do before we reach harbour
Marco Buti
Director General
Economic and Financial Affairs
OVERVIEW
1
Europes economic recovery which began in the second quarter of 2013 is
expected to continue spreading across countries and gaining strength while at
the same time becoming more balanced across growth drivers As it is typical
following deep financial crises however the recovery remains fragile
Nevertheless recent positive economic news means that the forecasts for
GDP growth this year and next have been raised slightly since the autumn
EU GDP which rose 01 in 2013 is now expected to rise 15 this year
and 20 next year while growth in the euro area which was -04 for 2013
as a whole is expected to be 12 in 2014 and 18 in 2015 After two years
of contraction domestic demand is gently firming as the crisis legacy of
excessive debt financial fragmentation economic uncertainty and the need
for adjustment and fiscal consolidation fades and confidence is improving
The fiscal stances of the EU and euro area this year are expected to be
broadly neutral At the same time rising import demand means that external
trades contribution to growth will become more muted In line with these
developments unemployment should fall slightly from its peak as the labour
market turns the corner The forecast for inflation in the EU and the euro area
The EU recovery is
firming hellip
2012 2013 2014 2015 2012 2013 2014 2015 2012 2013 2014 2015
Belgium -01 02 14 17 26 12 09 14 76 84 85 82
Germany 07 04 18 20 21 16 14 14 55 53 52 51
Estonia 39 07 23 36 42 32 18 28 102 88 83 77
Ireland 02 03 18 29 19 05 08 11 147 131 119 112
Greece -64 -37 06 29 10 -09 -06 02 243 273 260 240
Spain -16 -12 10 17 24 15 03 09 250 264 257 246
France 00 03 10 17 22 10 12 12 102 108 110 110
Italy -25 -19 06 12 33 13 09 13 107 122 126 124
Cyprus -24 -60 -48 09 31 04 04 14 119 160 192 184
Latvia 52 40 42 43 23 00 19 21 150 119 105 92
Luxembourg -02 21 22 25 29 17 15 17 51 59 60 59
Malta 09 20 21 21 32 10 12 19 64 65 64 64
Netherlands -12 -08 10 13 28 26 11 13 53 67 74 72
Austria 09 03 15 18 26 21 18 18 43 49 48 47
Portugal -32 -16 08 15 28 04 08 12 159 165 168 165
Slovenia -25 -16 -01 13 28 19 08 13 89 102 108 107
Slovakia 18 08 23 32 37 15 07 16 140 142 139 134
Finland -10 -15 02 13 32 22 17 16 77 82 83 81
Euro area -07 -04 12 18 25 14 10 13 114 121 120 117
Bulgaria 08 06 17 20 24 04 05 18 123 129 127 121
Czech Republic -10 -12 18 22 35 14 10 18 70 70 68 66
Denmark -04 03 17 18 24 05 15 17 75 70 69 67
Croatia -20 -07 05 12 34 23 13 15 159 176 176 172
Lithuania 37 32 35 39 32 12 11 19 134 118 104 96
Hungary -17 11 21 21 57 17 12 28 109 102 96 93
Poland 19 16 29 31 37 08 14 20 101 104 103 101
Romania 07 35 23 25 34 32 24 34 70 72 72 71
Sweden 09 09 25 33 09 04 09 18 80 80 77 73
United Kingdom 03 19 25 24 28 26 20 20 79 76 68 65
EU -04 01 15 20 26 15 12 15 105 109 107 104
USA 28 19 29 32 21 15 16 19 81 74 65 58
Japan 14 16 16 13 00 04 25 12 43 40 38 38
China 78 77 74 74 26 25 24 24
World 31 29 36 39
Real GDP
Table 1
forecast
Overview - the winter 2014 forecast
Winter 2014 Winter 2014
forecast
Inflation
forecast
Unemployment rate
Winter 2014
European Economic Forecast Winter 2014
2
has been lowered significantly since the autumn Inflation in the EU is now
expected to dip to 12 in 2014 before rising again to 15 in 2015 In the
euro area inflation is seen at 10 in 2014 and 13 in 2015
The world economy picked up in the second half of last year driven by
stronger growth in advanced economies especially in the US but also by a
rebound in some emerging market economies Growth is expected to
accelerate for most advanced economies outside the EU In the US where the
headwinds from fiscal policy have been waning private consumption is
gaining speed benefitting from robust job creation and rising house prices
while the Federal Reserve has initiated a gradual shift towards less
accommodative monetary policy In Japan growth is expected to remain
relatively stable in 2014 Among emerging market economies the picture is
uneven There are continued signs of weakness in Russia and Brazil some
stabilisation at more sustainable growth rates in China and an improved
outlook for India Recent financial tensions have so far mostly affected
emerging markets with relatively weak macroeconomic fundamentals such
as Argentina Turkey and South Africa while the EU Member States have
been largely spared so far
After lacklustre 2013 economic activity outside the EU is expected to
accelerate to about 4 this year and 4frac12 in 2015 Global trade is forecast to
rise more than GDP with world import growth doubling from 2frac12 in 2013
to about 5 in 2014 and rising to 6 in 2015 reflecting both the
strengthening of the global recovery and the impetus from trade-intensive
sectors Over the forecast horizon oil prices are forecast to continue
declining along the same path as assumed in November supported by
adequate supply The nominal exchange rate of the euro against main trading
partners (based on the technical assumption of unchanged nominal exchange
rates) is now projected about 2 higher than last autumn
The recovery in Europe is expected to be broad-based across EU Member
States as activity has also started to strengthen in the vulnerable countries of
the euro-area periphery Growth differentials persist but the gap is projected
to narrow In 2014 only Cyprus and Slovenia are still expected to register
negative annual GDP growth rates By 2015 all EU economies are expected
to be growing again Internal and external adjustment in vulnerable Member
States is progressing underpinned in many cases by significant structural
reforms that are starting bearing fruit Ireland has successfully completed its
financial assistance programme in December 2013 Driven by strong exports
growth is significantly firming in Spain and Portugal while a moderate
rebound is expected in Greece Among the bigger economies a steady
domestic demand-driven expansion is expected over the forecast horizon in
Germany while in France economic growth is only slowly recovering
supported by a timid pick up in private consumption Mild economic
recoveries in the Netherlands and in Italy are set to be driven by net exports
and investment Strong growth is foreseen in the United Kingdom and in
Poland on the back of increasingly robust domestic demand
The rebalancing of Europes growth engines is confirmed as domestic
demand overtakes exports as main thruster The strengthening of domestic
demand though still expected to be modest in 2014 will be fuelled by all
components both private and public
Investment growth in particular investment in equipment is projected to
significantly strengthen as the main impediments to firms demand and
hellipwhile the global
environment is
differentiated
Adjustments within the
EU begin to bear fruit
Final demand is
rebalancing hellip
Overview
3
profits (uncertainty financing conditions deleveraging needs) are slowly
receding and the improvement in the economic outlook is confirmed
Uncertainty has significantly receded over the past year and a half and should
continue to do so under the assumption of smooth policy implementation at
the EU and Member-State levels Financing conditions are also expected to
improve and to support further investment spending
Private consumption showed only marginal growth at the onset of the
recovery but is expected to gain momentum over 2014-2015 as the labour
market slightly improves real disposable incomes benefits from low
consumer price inflation and the drag of fiscal consolidation diminishes In
line with improved confidence and lower precautionary savings households
are expected to spend most of the increase in real income Public
consumption is also expected to pick up as fiscal consolidation needs become
less acute
The current-account surpluses of both the EU and the euro area increased in
2013 and are expected to remain broadly stable (at respectively 1frac12 and
2frac14 of GDP) this year and next Most of the recent strengthening is the
result of significant adjustment involving improved exports but also a largely
permanent contraction in domestic demand in the euro-area Member States
that previously recorded high deficits This external rebalancing is supported
by enhanced price competitiveness resulting from lower unit labour costs
High external indebtedness however requires the external adjustment in
some Member States to go further still
Financial market conditions in the EU improved in 2013 as a result of the
better macroeconomic outlook and sustained low-interest rate environment
Financial fragmentation considerably receded in the sovereign- and
corporate-debt markets with most bond spreads of vulnerable Member States
continuing to narrow thanks to investor confidence in the success of the
ongoing fiscal adjustment and economic reforms However despite some
normalisation in bank funding conditions financial fragmentation on the
euro-area lending market continues to impair the transmission of monetary
policy hurting mainly small and medium-sized enterprises The ECBs
comprehensive assessment of banks balance sheets and a smooth
implementation of the Banking Union should further reinforce confidence in
European banks and fan the recovery
Substantial improvements in public finances have been achieved in the EU
since 2011 On the basis of policy measures already approved by national
parliaments or known with sufficient detail the fiscal stance is expected to be
close to neutral over the forecast horizon The fiscal effort this year
measured in terms of change of the structural balance is indeed expected to
be broadly neutral in the EU and in the euro area At the same time fiscal
consolidation is expected to move gradually from revenue measures to
expenditure control Headline fiscal deficits are set to shrink further in 2014
(to around 2frac34 of GDP in the EU and 2frac12 of GDP in the euro area) before
stabilising in 2015 under the assumption of no policy change The debt-to-
GDP ratio is expected to peak in 2014 at 90 in the EU and at 96 in the
euro area
Labour market conditions stabilised in mid-2013 but only a small
improvement is expected in 2014 and 2015 because labour markets typically
react with a certain lag to rebounds in economic activity and the recovery
remains modest In the early phase of the recovery private employment
hellipand external
imbalances are
receding in vulnerable
Member States
Financial market
conditions are
improvinghellip
hellipand the fiscal
stance is now close to
neutral
Labour markets
improve only slowly hellip
European Economic Forecast Winter 2014
4
growth is expected to be dampened by the usual adjustment in working
hours Decisive structural reforms implemented in some Member States may
shorten this period and help prevent the very high level of unemployment
from becoming structural Employment in the EU and the euro area is
expected to start rising modestly in 2014 by frac12 and about frac14 respectively
slightly better than projected last autumn This increase will not yet be
sufficient to meaningfully curb unemployment in the EU but it will trigger a
stabilisation of the unemployment rate in the euro area In 2015 employment
growth is set to accelerate to frac34 in both areas resulting in a slight reduction
of unemployment to 104 in the EU and 117 in the euro area Labour
markets will continue to perform differently across Member States
Headline inflation decreased markedly over the course of 2013 particularly
in the last quarter of the year due to falling energy and commodity prices
weak demand the fading impact of some temporary factors and the
continued appreciation of the euro The expectation that the output gap will
close only slowly suggests that weak demand will continue to contribute to
low inflation Subdued pressures are expected to keep consumer price
inflation down to 12 in the EU and 10 in euro area in 2014 Only a
slight increase is expected for 2015 when economic growth gains
momentum Low inflation is expected to support private consumption
because it boosts real disposable incomes However since inflation
expectations have been sagging real interest rates have actually risen since
the autumn Moreover low aggregate inflation makes it harder for vulnerable
countries to gain price competitiveness and increases the real value of both
public and private debts
Risks to the growth outlook have become slightly more balanced but still
weigh more heavily on the downside The main risk to the forecast would be
stalling or partial implementation of structural fiscal and institutional
reforms at Member States or European level resulting in low actual and
potential growth and protracted high unemployment A weaker than projected
labour market would have both short- and medium-term detrimental effects
on private consumption and also on potential growth Moreover the debt
overhang the investment shortfall in recent years and slowing total factor
productivity could hurt growth in the medium term if they are inadequately
addressed by structural reforms resulting in an extended period of low
growth The risk of low growth would be exacerbated in the short term by
lower than expected inflation and a slower reduction in financial
fragmentation
Inflation could turn out lower than the current forecast if economic agents
were to perceive the current very weak price pressures as becoming
entrenched Lower inflation would increase real interest rates with negative
effects on growth and on the real debt burden However confidence is rising
and growth is picking up so there is only a marginal probability of shocks
large enough to initiate outright EU or euro-area wide deflation
Credit growth could remain anaemic if the implementation of the Banking
Union and the Asset Quality Review (AQR) and stress tests were to fail to
clean up balance sheets and restore confidence also given the still elevated
deleveraging needs in the private sector The resulting prolonged weakness of
credit supply would impose a limit on the recovery of investment Downside
risks could also stem from heightened financial instability in emerging
markets
hellipand inflation
remains subdued
A risk of protracted
low growth
Overview
5
The recovery could also be stronger than envisaged if firmer domestic
demand in the core countries helps further the rebalancing process while the
competitiveness boost in peripheral countries is larger than envisaged In the
medium-term the implementation of additional and bold structural reforms
could lift further the potential growth of Member States with positive impact
also in the short-term notably through increased confidence Positive
confidence effects could lead to a stronger rebound of investment in
particular if financial fragmentation is reduced to a greater extent following a
successful AQR and the introduction of the Single Supervisory Mechanism
PART I EA and EU outlook
RECOVERY GAINING GROUND
9
1 THE RECOVERY IS FIRMING IN THE EU
A slow and fragile recovery is taking place in the
EU and the euro area GDP growth continued to be
positive in the third quarter and gathered pace in
the fourth Survey-based confidence indicators
have continued to improve in recent months
suggesting a continuation of the gradual recovery
Revisions to the autumn 2013 forecast are mild but
slightly positive and the earlier projection that
growth would become broader-based across
countries and increasingly driven by domestic
demand has been confirmed
A broader-based recovery across countries
and drivers of growth hellip
In the second half of 2013 the recovery continued
to broaden regionally In the last quarter of 2013
GDP increased by 04 q-o-q in the EU and 03
q-o-q in the euro area with the cyclical
improvement fairly widespread across the EU
countries Only three of the EU economies that
reported quarterly GDP data (1)
are estimated to
still be contracting down from eight in the second
quarter of 2013 High frequency indicators also
show strong signs of improvements with PMIs
expanding in a majority of countries
(1) On 14 February Eurostat News Release on GDP flash
estimates for 2013-Q4 did not include data for Denmark
Ireland Greece Croatia Luxembourg Malta Slovenia and Sweden
The EU economy returned to positive growth in the second quarter of 2013 and continued to recover in
the second half of the year gathering pace towards the end Short-term indicators suggest a continued
economic expansion in the coming quarters However the main impediments to growth stemming from
the crisis ndash high debt financial fragmentation uncertainty and difficult adjustment ndash are only slowly
receding and the global economy is projected to grow at just a moderate pace Looking ahead GDP is
expected to grow by 15 in the EU and 12 in the euro area this year before speeding up more
markedly in 2015 to 20 and 18 respectively
The recovery is expected to become increasingly driven by domestic demand and to spread across EU
Member States Domestic investment and consumption are set to continue firming this year and next
replacing net exports as the main driver of growth Differences in the expected rates of growth across
the EU should narrow particularly as the recovery has now reached the large majority of Member
States including those most affected by the crisis Unemployment however is set to remain high with
large differences among countries Inflation which has recently fallen faster than earlier anticipated is
expected to remain low for some time before increasing slightly in 2015 on the back of decreasing
unemployment and excess capacity
90
95
100
-3
-2
-1
0
1
2
3
4
5
07 08 09 10 11 12 13 14 15
GDP growth rate (lhs)
GDP (quarterly) index (rhs)
GDP (annual) index (rhs)
Graph I1Real GDP EU
forecast
q-o-q index 2007=100
32 04
-45
17-04 01
Figures above horizontal bars are annual growth rates
15
20
20
85
90
95
100
105
110
115
120
125
130
0
1
2
3
4
5
6
7
8
06 07 08 09 10 11 12 13 14 15
HICP inflation (annual rate) (lhs)
HICP index (monthly) (rhs)
HICP index (annual) (rhs)
Graph I2HICP EU
forecast
index 2005=100
2437 10
2131
2613
23
F
1515
European Economic Forecast Winter 2014
10
Growth differentials among euro-area Member
States have fallen back to their 2010 levels but
remain larger than they were between 2000 and
2007 before the crisis The remaining differentials
are a reflection of countries different experiences
during the crisis and their related adjustment
needs including in the financial sector
Unaddressed rigidities in labour and product
markets also play a role in a number of Member
States As the recovery proceeds growth
differentials are expected to decrease further as the
drags on growth that weighted particularly on
vulnerable Member States recede and domestic
demand firms up
Growth is becoming less dependent on external
demand As anticipated in the autumn forecast
domestic demand is firming though its dynamics
now appear slightly stronger than previously
expected All components of domestic demand
showed positive growth rates in the third quarter of
2013 and are expected to have increased further in
the fourth quarter (2)
with investment notably
starting to pick-up more firmly However the
investment to GDP ratio in the EU stabilised at
around 189 in the third quarter of 2013 and
remains far below its share of about 21 in the
early 2000s The fall in investment between 2008
and 2013 was extremely severe compared with
previous downturns particularly driven by sharp
declines in business investment and in some
countries where there were housing bubbles
construction investment
In most Member States investment growth is
expected to strengthen more significantly over the
forecast horizon Business investment which
should be one of the main drivers of growth in a
period of recovery contracted in recent years
because of weak fundamental factors such as low
demand and profits as well as abundant spare
capacity Those weaknesses coupled with legacies
from the financial crisis such as high uncertainty
tight financing conditions and the deleveraging
needs of firms are gradually fading and this is
unlocking business investment
hellip as impediments to growth are slowly
receding
As pointed out in previous forecasts recoveries
from deep financial crises are slower and more
fragile than typical cyclical recoveries Public and
(2) The break-down by GDP components for the fourth quarter
will be released by Eurostat on 5 March 2014
private balance-sheet adjustment financial
fragmentation uncertainty and resource
reallocation during internal and external
rebalancing have temporarily dampened
investment and consumption and this is fading
only gradually
In particular the recovery of domestic demand has
so far coexisted with a continued contraction of
bank credit in the euro area The absence of credit
growth has been a symptom of low cyclical
demand compounded by non-financial
corporations deleveraging During the early phase
of the recovery creditless growth is therefore not
necessarily a major issue at the aggregate level (3)
Financial market conditions in the EU have
continued to strengthen since the autumn with
both sovereign and corporate spreads receding
substantially However data on bank lending
volumes and interest rates suggest that the euro-
area lending market is still fragmented (see
graph I3) with detrimental effects for small and
medium-sized enterprises (see section I3)
Looking ahead the ECBs comprehensive
assessment of banks balance sheets and the
smooth implementation of the Banking Union
should help further sever the links between
sovereigns and banks with positive implications
for credit growth particularly for SMEs
1
2
3
4
5
6
7
03 04 05 06 07 08 09 10 11 12 13 14
Graph I3 Interest rates on loans to enterprises
(new businesses maturity up to 1 year)
FR DE IT ES
EL PT IE
Substantial improvements in public finances have
been achieved in the EU since 2011 with
differentiated budgetary adjustments under the
strengthened EU framework Those efforts have
allowed for a gradually reduced aggregate pace of
fiscal consolidation since 2013 An analysis of
measures already approved by national parliaments
(3) See E Taktaacutes C Upper Credit and growth after financial
crisis BIS Working Papers ndeg416 July 2013
EA and EU outlook
11
or adequately detailed shows that the pace of
fiscal consolidation is set to further decrease The
need for front-loaded fiscal consolidation in the
countries under market pressure had a detrimental
impact on growth in the short term but the benefits
are expected in the medium term
The negative impact of extreme uncertainty has
been fading but further reductions would release
additional demand of goods and services Policy
uncertainty became extremely high in the euro area
in 2011 and remained at high levels in the first half
of 2012 when the integrity of the euro area was
questioned Since then decisive crisis-
management measures reforms of the euro areas
economic governance and further steps towards
Banking Union have significantly reduced
uncertainty At the start of this year policy
uncertainty stood well below its average during the
crisis years of 2008-13 but still above pre-crisis
levels Assuming smooth and continued policy
implementation uncertainty should continue
declining encouraging consumption and
investment decisions (4)
This would also have
immediate positive effects on manufacturing in the
euro area through increased industrial new orders
(see box I1)
Finally the adjustment of external and internal
imbalances is progressing but very high
unemployment will continue to hold back growth
in a number of vulnerable countries
Significant progress in the reduction of imbalances
in the vulnerable Member States has been achieved
in recent years Gains in competitiveness due to
decreases in unit labour costs allowed for solid
export performance as firms successfully turned to
export markets Moreover prices and wages have
developed differently in the tradable and non-
tradable sectors Non-tradables have seen deeper
reductions in wages while tradables have seen
comparatively stronger price increases a trend that
should help rebalancing (5)
The adjustment in
competitiveness and prices in vulnerable Member
States is expected to continue along with higher
growth still mostly led by exports
(4) M Buti and P C Padoan How to make Europes incipient
recovery durable end policy uncertainty VoxEUorg 12
September 2013 Assessing the impact of uncertainty on
consumption and investment Quarterly Report of the Euro Area June 2013 Vol 12 No 2 pp 7-16
(5) See Labour costs pass-through profits and rebalancing in
vulnerable Member States Quarterly Report on the Euro Area October 2012 Vol 12 No3 pp 19-25
Evidence suggests that a significant part of the
current-account adjustment achieved so far is
structural though largely due to a permanent fall
of domestic demand (see box I3) However in
several countries the adjustment of the structural
current-account balance is not yet sufficient to
significantly reduce large negative net
international investment positions Moreover the
reallocation of labour to more productive activities
has proven difficult given weak economic growth
so unemployment is expected to retreat very
gradually from extremely high levels
-12
-8
-4
0
4
8
12
LU
NL FI
BE
DE
AT
FR
EA
-18 IT IE SI
CY
MT
ES
SK PT
EE
EL
LV
of GDP
Graph I4 Current-account balances
euro area and Member States
Current-account balance average 1998-2008
Current-account balance 2012
Expected change avg 2013-15 versus 2012
2 THE EXTERNAL ENVIRONMENT
World GDP growth picked up in the third quarter
of 2013 to 09 q-o-q up from 08 in the
second Growth is increasingly being driven by the
improved performance in advanced economies
primarily the US In the third quarter the
contribution from emerging market economies
(EME) remained unchanged as a rising
contribution from China and India was notably
counterbalanced by the weaker performance of
Latin America
Looking ahead survey indicators suggest a
persistence of this pattern Most Purchasing
Managers Indices (PMI) in advanced economies
came out strongly in January while weakness was
concentrated in the emerging markets with the
composite EME PMI edging down for the second
month in a row on the back of the deterioration in
China Russia and Turkey All in all global GDP
growth is now expected to have reached 29 in
2013 and to accelerate to 36 in 2014 and to
39 in 2015 (see graph I5 and table I1)
European Economic Forecast Winter 2014
12
-2
-1
0
1
2
3
4
5
6
09 10 11 12 13 14 15
EU
Non-EU advanced economies
Emerging and developing countries
World
Graph I5Contributions to World GDP growth from
EU non-EU advanced and emerging economies
forecast
Global trade growth is accelerating hellip
Mirroring the improvement in world GDP global
trade growth strengthened at the end of 2013 with
improved outcomes for both advanced and
emerging economies (see graph I6) According to
the CPB world trade indicator trade volumes grew
sharply in the 3 months to November increasing
by 21 over the previous 3 month period the
fastest growth in almost 3 years While trade grew
for both advanced and emerging economies most
of the recorded improvement came from emerging
markets primarily in Asia which saw positive
trade growth in the 3 months to November after
negative readings in the summer This contrasts
with the forward looking PMI measures that
indicate stronger dynamics in advanced
economies
In 2012 and 2013 global trade growth was
somewhat below the growth of global output In
2014-15 global trade is expected to resume
growing more rapidly than GDP as trade-intensive
sectors among which investment provide a greater
impetus to economic expansion Growth in trade
volumes is thus expected to accelerate also
reflecting the gradual strengthening of the global
recovery notably in advanced economies Total
world export growth is now expected to have been
27 in 2013 and to accelerate more markedly to
51 in 2014 and 58 in 2015
hellip as advanced economies outside the EU are
gathering speed hellip
Among advanced economies outside the EU
activity has been gathering momentum faster than
expected in the US as headwinds from fiscal policy
wane and private consumption gains speed
benefitting from robust job creation and rising
house prices
30
40
50
60
-15
-10
-5
0
5
01 02 03 04 05 06 07 08 09 10 11 12 13 14
World trade volume CPB data (lhs)
Global PMI manufacturing (rhs)
3m-o-3m balance
Graph I6World trade and Global PMI
manufacturing output
The domestic short-term risks from fiscal and
monetary policy uncertainty in the US have also
clearly diminished following the budget deal in
December the decision to extend the debt limit up
to 2015 in February as well as the reinforcement
of forward guidance by the Fed Momentum is
expected to improve over the forecast horizon with
fading fiscal drag improving business investment
and steady recovery in the housing market Japans
economy is expected to grow in 2014 at the same
pace as in 2013 with some variability in the near
term reflecting the impact of fiscal policy
decisions In 2015 GDP growth is forecast to slow
down on the back of fading monetary stimulus and
additional fiscal measures All in all output
growth in advanced economies is forecast to
accelerate from 12 in 2013 to 22 in 2014 and
25 in 2015
hellip while growth prospects in emerging markets
have become more differentiated
The situation in emerging markets has become
more and more differentiated Late January 2014
saw renewed financial turbulence with sharp
currency drops for a number of EMEs with weak
economic fundamentals (particularly Argentina
South Africa and Turkey) and sharp falls in stock
markets in both developing and developed
economies Renewed uncertainty about the pace of
US monetary tapering concerns over Chinese
growth dynamics as well as political tensions in
some countries have among other factors
contributed to the observed shift in market
sentiment
EA and EU outlook
13
This variation in cyclical and structural
vulnerabilities is also reflected in revisions to the
forecast While the outlook for Turkey and Russia
has deteriorated recently on the back of tightened
financial conditions mirroring macro-economic
vulnerabilities and weak policy frameworks it has
improved for other EU candidate countries and
India Chinas economy continued to grow rapidly
in 2013 at 77 with investment recovering
sharply from a weak first quarter to provide the
major contribution to growth In 2014-15 Chinas
growth is forecast to slow down to around 7frac12 as
the composition of demand shifts away from
investment towards higher consumption However
achieving a smooth rotation of demand remains a
challenge particularly in the context of a fragile
financial system Emerging markets as a group are
expected to grow at 5 in 2014 and 53 in 2015
following growth of 46 in 2013
Moderation of commodity prices ahead
Brent prices increased in the third quarter of 2013
but subsequently eased in January 2014 to
USD107 per barrel and are expected to continue
declining gradually over the forecast horizon
Though global growth is picking up a significant
rebound in oil prices is unlikely due to sufficient
supply substitution of oil by other cheaper fuels
and efficiency gains in oil consumption A possible
escalation of geopolitical tensions in the MENA
region remains a risk factor The assumptions for
Brent prices are the following USD 1041bbl in
2014 decreasing to USD 996bbl in 2015
compared to a price of USD 1088bbl in 2013 (see
Box I5)
The performance of other commodity markets was
mainly weak in 2013 A slight increase of the price
of the food aggregate in 2013 was driven by higher
prices of seafood and meat whereas the prices of
main cereals maize rice and wheat declined
Owing to an improved outlook for supply food
prices are projected to ease in 2014 Prices of
metals and raw materials were on a declining trend
in 2013 due to abundant supply and weak demand
conditions A modest recovery of prices is
expected in 2014-15 supported by increasing
demand in both advanced and emerging countries
3 FINANCIAL MARKETS IN EUROPE
Financial markets globally and in the EU have
until recently continued to perform strongly on the
back of an improving economic outlook while the
sustained low-interest rate environment and
positive corporate reports supported risk appetite
Positive market sentiment was further underpinned
by progress with the repair of bank balance sheets
Most recently however market tensions in some
emerging market economies have arisen while
investors have started to ponder the potential
negative impact of the Federal Reserves tapering
The EU Member States have been largely spared
by these events
( a ) 2010 2011 2012 2013 2014 2015 2013 2014 2015
USA 195 25 18 28 19 29 32 16 26 31
Japan 55 47 -05 14 16 16 13 21 20 13
Asia (exclJapan) 295 103 74 59 59 61 63 57 60 63
- China 147 116 94 78 77 74 74 75 74 74
- India 57 112 77 38 40 47 54 29 40 53
Latin America 87 60 45 29 26 31 34 26 31 35
- Brazil 28 75 27 09 22 23 29 22 25 31
MENA 53 34 25 35 24 36 38 24 36 38
CIS 43 49 48 34 19 28 31 23 33 36
- Russia 30 45 43 34 13 23 27 19 30 34
Sub-Saharan Africa 26 54 48 48 50 53 55 50 53 55
Candidate Countries 15 82 81 18 36 24 29 33 29 41
World (inclEU) 1000 52 38 31 29 36 39 28 36 39
World import growth 126 54 22 25 49 60 28 52 60
Extra EU export market growth 150 64 26 34 56 60 36 57 60
(a) Relative weights in based on GDP (at constant prices and PPS) in 2012
forecast
Table I1
International environment
Real GDP growth
Winter 2014
World merchandise trade volumes
(Annual percentage change)
forecast
Autumn 2013
European Economic Forecast Winter 2014
14
The ECB further eased monetary policy hellip
While the phasing out of unconventional monetary
stimulus started end-2013 in the US and market
expectations of interest rate hikes in the UK
increased the ECB lowered its main policy rate
(MRO) by 25bps in November amid a subdued
outlook for inflation in the euro area It extended
its fixed-rate tender procedures with full allotment
at least until the end of the second quarter of 2015
thereby ensuring that euro-area banks would retain
access to central- bank liquidity at the MRO rate
well after the end of the two 3-year LTROs In
addition the Governing Council reiterated its
forward guidance and committed to maintain a
high degree of monetary accommodation by taking
further decisive action if needed
hellip which contributes to keeping benchmark
funding costs very low in the euro area
Reflecting the tapering of the asset purchase
programme by the US Federal Reserve and the
more muted outlook for inflation in the euro area
the gap between the US 10-year Treasury yield and
the German 10-year Bund yield increased
somewhat further Meanwhile most euro-area
peripheral sovereign-bond spreads continued to
tighten significantly amid ongoing adjustment of
fiscal fundamentals (see graph I7) Debt auctions
met high demand in a sign of investor confidence
in the success of the ongoing fiscal adjustment and
economic reforms
0
2
4
6
8
09 10 11 12 13 14
DE ES FR IT UK
Graph I7Ten-year government-bond yield selected
Member States
In the euro-area corporate bond markets spreads
have narrowed and the issuance of subordinated
debt (corporates and banks) has increased strongly
in 2013 Money market conditions remained stable
although some upward pressure was observed on
EONIA bank-to-bank lending rates amid falling
excess liquidity in the EU banking system late in
2013
Benign financial market conditions in the euro-
area internalise high expectations hellip
Investors seem currently confident in further
economic expansion a smooth implementation of
the Banking Union governments continued
commitment to structural fiscal and institutional
reforms and the sustained balance-sheet repair in
the different sectors of the economy Given the
modest economic growth high public debt and in
some cases the persistent nexus between banks
and sovereigns the risk of another increase in
sovereign spreads remains
hellip while banks are facing important
challenges this year
The 2014 AQR and stress tests as well as the
advancement of Banking Union will take place in
the context of an improved situation in the
European banking sector but lingering
uncertainties over the quality of banks assets
There has been progress in the solvency positions
of euro-area banks while funding conditions at the
aggregate euro-area level continued to normalise
Banks reduced their reliance on central-bank
funding (6)
while turning to more stable funding
sources such as deposits including in several
vulnerable Member States However profit
generation continues to be a challenge Interest
margins are still compressed while poor credit
quality persists in the countries where high private-
sector indebtedness interacts with subdued
economic growth and high unemployment Banks
increased the recognition of loan losses with non-
performing loans provisioning contributing
significantly to their low profitability
The general improvement notwithstanding access
to medium- and long-term market funding at
sustainable costs remains a challenge for a number
of mid-sized and small euro-area banks in
vulnerable countries Investors prudence regarding
bank balance sheets is reflected in banks
valuations remaining below the book value since
2009 while the valuations of US peers have risen
above par during 2013 Some of this difference
may relate to subdued profitability prospects for
(6) Around half of the initial amount of the three-year longer-
term refinancing operations (LTROs) has been repaid
before maturity
EA and EU outlook
15
euro-area banks but it also relates to investor
uncertainty over the quality of banks assets
So far the recovery has remained essentially
creditless (see graph I8) Credit flows to the
private sector shrank over the last months (-21
y-o-y in December adjusted for sales and
securitisation) and lending volumes to non-
financial corporations continued falling However
net issuance of long-term debt securities by non-
financial corporations continued to be buoyant
(11 y-o-y in November) partly offsetting the
weakness in bank lending as larger corporations
continued the transition towards market financing
The bank lending weakness is influenced by
temporary factors on both the supply and demand
side The upcoming AQR is expected to create the
incentive for banks to clean up their balance
sheets recognise non-performing assets and
strengthen their capital basis Banks willingness to
frontload balance sheet adjustments (7)
has likely
contributed to the weak supply of credit most
recently Weak credit demand can be partially
explained by the early stage of the economic
expansion where firms tap internal funding to
finance investment Moreover high corporate
indebtedness may continue to weigh on demand
for some time
-20
-10
0
10
20
30
40
04 05 06 07 08 09 10 11 12 13 14
DE FR IT
ES EL PT
Graph I8Loans to enterprices
(index of national stocks y-o-y growth rate)
The outlook for lending seems to be slowly
improving
The January 2014 euro-area Bank Lending Survey
conveys a somewhat more positive message For
the first quarter of 2014 banks predict an end to
the net tightening of credit standards on loans to
NFCs and a more intense easing for loans to
(7) The AQR will be based on end-2013 balance sheet data
households (see graph I9) Loan demand was
expected to strongly rebound in first months of
2014 The survey also points to a slight reduction
in lending condition disparities across euro-area
countries a trend also visible in most recent data
on lending volumes and interest rates However
heterogeneity of lending conditions remains very
high as banks are not yet translating the improved
funding conditions into better lending conditions
-50
-30
-10
10
30
50
70
90
110
-100
-80
-60
-40
-20
0
20
40
60
03 04 05 06 07 08 09 10 11 12 13 14
Credit standards - past three months (lhs)
Credit standards - next three months (lhs)
Credit demand - past three months (rhs)
Credit demand - next three months (rhs)
tightening uarr easingdarr
increase uarr decrease darr
Graph I9Net changes in credit standards and credit demand for
loans to NFCs euro areabalance balance
All in all the more upbeat survey-based signals
together with the reinforcement of the economic
cycle herald a gradual improvement in lending
volumes over the forecast horizon
4 GDP AND COMPONENTS IN THE EU
The rebound in GDP growth has been
confirmed hellip
Economic activity in Europe has passed an
inflection point in the first half of 2013 with
positive real GDP growth albeit weak and uneven
returning to the EU and the euro area Following
six quarters without positive growth GDP started
rising in the second quarter of 2013 in the EU and
the euro area and the upward trend was confirmed
throughout the year In the fourth quarter
Eurostats flash estimates for GDP growth has been
04 in the EU and 03 in the euro area
However for 2013 as a whole due to large
negative carry-over effects from 2012 GDP is
expected to have only slightly increased in the EU
(01) and declined in the euro area (-04)
(see table I2 and table I3) The recovery is at its
early stages and output volumes are still markedly
below the pre-crisis levels of the first half of 2008
in both the EU and the euro area (by about 1frac12 in
the EU and 2frac12 in the euro area) This is
European Economic Forecast Winter 2014
16
nevertheless in line with empirical evidence of full
recoveries following deep financial crisis (8)
As regards GDP components in 2013 the rebound
has increasingly benefitted from positive
contributions from domestic demand (9)
In the
euro area in the third quarter all components of
domestic demand expanded at least modestly
While private consumption expanded only
marginally (01 q-o-q) gross fixed capital
formation moved up 04 and changes in
inventories made a substantial contribution For
the first time since the beginning of 2010 net
exports put a drag on growth as export growth
declined in response to moderate global activity
outside the EU while imports grew more strongly
The strengthening of economic activity has been
observed in most Member States but so far growth
was primarily supported by developments in the
UK and Germany also in line with their respective
weights in the EU aggregate Most vulnerable
countries also managed a return to positive growth
in the second or third quarter of 2013 in particular
(8) Analysing 100 banking crises Reinhart and Rogoff
estimated that it takes about eight years to reach pre-crisis
levels of income while the median is about 6frac12 years See
C M Reinhart and K S Rogoff Recovery from financial crises evidence from 100 episodes NBER Working Paper
no 19823 January 2014 (9) The breakdown of GDP for the EU and the euro area is
only available for the first three quarters of 2013
Spain and Portugal which was confirmed in the
fourth Italy emerged from recession in the fourth
quarter though very timidly Moreover available
information about developments in GDP
components point to progress in intra-euro-area
rebalancing with a strong export performance in
some vulnerable Member States and signs of
strengthening domestic demand in surplus
countries
hellip with moderate growth expected in the short
term hellip
The short-term outlook for GDP is for a
continuation of moderate growth in the EU and the
euro area (unchanged at 03 q-o-q in the euro
area and 04 in the EU in the first quarter) In
fact in recent months business indicators have
increased further Continuing along its upward
trend since May 2013 the Commissionrsquos
Economic Sentiment Indicator has passed its long-
term average in September in the EU and in
December in the euro area In January 2014
business sentiment has kept on increasing but the
pace of improvement has slightly moderated and
was less broad-based across sectors than in the few
months before suggesting a still fragile recovery
Other recent indicators also suggest that economic
activity keeps strengthening In January the euro-
area PMI Composite Output Index reached its
highest level since mid-2011 (529) signalling
2008 2009 2010 2011 2012 2013 2014 2015
bn Euro Curr prices GDP
78047 584 04 -16 11 03 -07 00 11 17
28786 216 23 22 06 -02 -02 04 06 07
23744 179 -14 -134 -02 16 -30 -25 30 42
237 02 07 -06 02 07 02 02 03 03
59309 449 15 -117 110 65 23 14 41 55
190113 1430 06 -65 41 24 -03 02 22 30
56844 429 11 -115 98 44 -03 05 40 56
129708 1000 04 -45 20 17 -04 01 15 20
129755 1000 02 -44 21 17 -05 02 14 19
95997 714 04 -45 19 16 -07 -04 12 18
02 -09 06 02 -04 00 07 10
05 05 01 00 00 01 01 02
-03 -28 00 03 -06 -05 05 07
-02 -12 08 03 -05 01 00 00
06 -48 40 26 10 06 18 25
08 -92 56 34 -05 03 32 43
-04 47 -35 -17 01 -02 -17 -24
02 -01 05 09 11 04 02 01
Gross fixed capital formation
(Real annual percentage change)
2012
Final demand
GDP
Public consumption
Change in stocks as of GDP
Imports (minus)
GNI
Investment
Exports of goods and services
Table I2
Contribution to change in GDP
Private consumption
Winter 2014
Net exports
pm GDP euro area
Final demand
Inventories
forecast
Composition of growth - EU
Public consumption
Real percentage change
Imports of goods and services
Exports
Private consumption
EA and EU outlook
17
expansion of activity notably reflecting strong
readings in manufacturing (see graph I10)
30
40
50
60
60
70
80
90
100
110
120
00 01 02 03 04 05 06 07 08 09 10 11 12 13 14
Economic Sentiment Indicator (lhs)
PMI Composite Output Index (rhs)
3-month moving average (ma) 3-month ma
Graph I10Economic Sentiment Indicator
and PMI Composite Output Index EU
hellip and strengthening over the forecast horizon
Over the forecast horizon real GDP is expected to
continue the recovery at moderate pace on the
back of a further gradual strengthening of domestic
demand In 2014 the GDP growth forecast stands
at 15 for the EU and 12 for the euro area
Domestic demand is notably expected to benefit
from the gradual weakening of the impediments
stemming from the financial and economic crisis
(see section I) The expansion of gross fixed
capital formation should be supported by
improving sentiment and lower uncertainty more
favourable funding conditions higher domestic
and external demand together with the need to
replace an ageing capital stock after a marked
adjustment phase Private consumption is expected
to gain some momentum as the stabilisation in
labour markets continues real disposable incomes
benefit from lower consumer price inflation and
the drag of fiscal consolidation diminishes
Following two years of declining public
consumption a very moderate expansion was seen
in 2013 that is expected to continue as fiscal
consolidation decelerates
In 2015 a further acceleration of GDP growth is
expected in the EU and the euro area of 20 and
18 respectively The recovery though gaining
speed would remain low by historical standards
The expansion should reflect a stronger
contribution from domestic demand Gross fixed
capital formation is expected in particular to
become more robust and private consumption
growth to get support from slightly improving
labour market conditions whereas public
consumption continues its modest expansion (see
graph I11) The impact of already implemented
structural reforms is also expected to reinforce
those positive developments in 2015
2008 2009 2010 2011 2012 2013 2014 2015
bn Euro Curr prices GDP
54552 575 04 -10 10 03 -14 -07 07 14
20413 215 23 26 06 -01 -05 03 05 07
17410 183 -14 -128 -04 16 -40 -30 23 36
92 01 07 -06 02 06 01 01 02 02
43485 459 11 -124 116 65 25 13 42 57
135954 1433 05 -63 41 25 -07 -02 21 30
41021 433 08 -110 100 45 -09 02 41 59
95058 1000 04 -45 19 16 -07 -04 12 18
95366 1003 -02 -41 22 16 -05 -04 11 17
130747 1320 04 -45 20 17 -04 01 15 20
02 -06 06 02 -08 -04 04 08
05 05 01 00 -01 01 01 02
-03 -28 -01 03 -08 -06 04 06
-01 -10 06 03 -05 00 01 00
04 -52 43 27 11 06 19 27
07 -89 55 34 -10 -03 29 43
03 -45 35 18 -04 01 17 25
01 -07 07 09 15 05 02 02
Table I3
Contribution to change in GDP
Private consumption
Winter 2014
Net exports
pm GDP EU
Final demand
Inventories
forecast
Composition of growth - euro area
Public consumption
Real percentage change
Imports of goods and services
Exports
Private consumption
Gross fixed capital formation
(Real annual percentage change)
2012
Final demand
GDP
Public consumption
Change in stocks as of GDP
Imports (minus)
GNI
Investment
Exports of goods and services
European Economic Forecast Winter 2014
18
-5
-4
-3
-2
-1
0
1
2
3
4
5
05 06 07 08 09 10 11 12 13 14 15
pps
Graph I11 GDP growth and its components EU
Private consumption Government consumption
Investment Inventories
Net exports GDP (y-o-y)
forecast
Gross fixed capital formation has started
rebounding hellip
After declining strongly for several quarters gross
fixed capital formation has started to rebound
timidly in the first half of 2013 and is expected to
have gained some momentum up to the final
quarter of 2013 For 2013 as whole due to
substantial declines in late 2012 and early 2013
the annual growth rate would remain in negative
territory in the EU (-25) and in the euro area
(-30) Investment volumes are still relatively
low at this early stage of the rebound dampened
by weak fundamentals and the crisis legacy
hellip on the back of a revival in equipment
investment
For early 2014 available indicators suggest a
continued but moderate expansion for equipment
investment Production expectations and
confidence indicators from the Commissionrsquos
survey in manufacturing have increased above
their long-term average and capacity utilisation
rates have moderately moved up though
remaining at low levels (see graph I12) The euro-
area manufacturing PMI reached a 32-month high
in January signalling expansion
Over the forecast horizon financing conditions are
expected to become more benign and support
funding needs of companies also in the vulnerable
countries Improved financing conditions together
with increasing margins and widening profits as
the recovery advances are set to support equipment
investment spending further However since
inflation expectations have been sagging real
interest rates are somewhat higher than in the
autumn In 2014 equipment investment is set to
grow by 46 in the euro area and 48 in the EU
accelerating to about 6 in 2015 in both areas in
line with a firming domestic demand
68
70
72
74
76
78
80
82
84
86
-24
-20
-16
-12
-8
-4
0
4
8
12
00 01 02 03 04 05 06 07 08 09 10 11 12 13 14 15
Graph I12 Equipment investment and capacity
utilisation EU
Equipment investment (y-o-y lhs)
Equipment investment annual growth forecast (lhs)
Capacity utilisation rate (rhs)
forecast
After falling for a few years construction
investment is projected to resume growing in 2014
and accelerate further in 2015 It is however set to
remain weak on the back of still depressed euro-
area housing markets A contraction in
construction investment is even expected to persist
in Spain in 2015 Overall in 2015 total gross fixed
capital formation is set to increase mainly
supported by the rebound in equipment
investment by 42 in the EU and by 36 in the
euro area
Private consumption exhibited marginal
growth at the onset of the recovery hellip
Recent developments in private consumption the
largest GDP component suggest that it will
become an important driver of the ongoing
recovery After falling during the recession years
private consumption growth had become
marginally positive in the second quarter of 2013
and kept on increasing in the third quarter though
still modestly All in all in 2013 private
consumption stagnated in the EU and receded in
the euro area (-07)
A key reason for weak consumption growth so far
has been the large squeeze on real gross disposable
incomes mainly attributable to muted wage
growth alongside a weak labour market situation
On the nominal side growth in compensation of
employees fell to 02 in 2013 in the EU in the
context of shrinking employment (-04 in the
number of persons employed) and moderate
increases in wages per head (16 in the EU)
Moreover non-labour incomes which include
profit income increased only slightly Private
wealth remained constrained by weak housing
market developments after the financial crisis had
wiped out a substantial part of the net worth of
EA and EU outlook
19
debtors This resulted in tight borrowing
constraints and low liquidity which forced some
households to cut back on consumption
particularly in countries with highly leveraged
households
Developments in the households saving rates are
also key for private consumption growth
Households can respond to a fall in income in two
ways by increasing precautionary savings or by
lowering savings to uphold consumption During
the 2012-13 recession high uncertainty might have
raised precautionary savings (10)
but relatively low
real interest rates could also have favoured current
consumption partly offsetting the previous effect
In total the households saving rate remained
broadly unchanged in the euro area and the EU
As regards private consumption both recent
developments and the outlook differ markedly
across Member States Focusing on the seven
largest economies growth rates varied in 2013
from -2frac12 (Italy and Spain) to 2frac12 (UK) This
reflects differences in developments in disposable
incomes with increases in Germany and France
and losses in Italy and Spain and in deleveraging
needs
hellip but is expected to rebound stronger as the
recovery takes ground
In the near-term private consumption is expected
to grow moderately in line with a gradually
increasing real disposable income Short-term
indicators point to continued muted developments
in private consumption The consumer confidence
indicator increased almost steadily since spring
2013 and has surpassed the long-term average (see
graph I13) In January 2014 the Commissionrsquos
retail trade confidence indicator reached the
highest level since mid-2013 standing clearly
above its long-term averages in both areas
However the indicator of households intentions to
make major purchases remained at low levels
suggesting that consumers are still cautious in
deciding to purchase durable goods
Over 2014 private consumption is expected to
gain some strength as nominal disposable income
turns visibly positive on the back of improved
employment prospects and increased wages A
slower pace of fiscal consolidation and higher
(10) See eg A Mody A F Ohnsorge and D Sandri
Precautionary savings in the Great Recession IMF
Economic Review April 2012 Vol 60 No 1 pp 114-38
consumer confidence are also expected to boost
households spending Moreover lower HICP
inflation is expected to lift households real
disposable income However in some Member
States the need for deleveraging should continue
weighing on private consumption There the
strength of private consumption will depend on the
spending patterns of households simultaneously
engaged in deleveraging processes (11)
At the
aggregate level most of the increase in disposable
incomes is expected to be spent leaving the saving
rate constant Overall private consumption is
expected to rebound by 11 in the EU and to
07 in the euro area In 2015 with labour market
conditions starting to improve more markedly and
wages increasing private consumption is set to
accelerate to 17 in the EU and 14 in the euro
area
-35
-30
-25
-20
-15
-10
-5
0
5
-3
-2
-1
0
1
2
3
4
5
00 01 02 03 04 05 06 07 08 09 10 11 12 13 14 15
balancey-o-y
Graph I13 Private consumption
and consumer confidence EU
Private consumption (lhs)
Private consumption forecast (annual data lhs)
Consumer confidence (rhs)
forecast
Public consumption back to tiny expansion as
the pace of fiscal consolidation slows down
In line with fiscal consolidation needs government
consumption had decreased in the EU and the euro
area during 2011-12 but returned to positive
growth rates in 2013 Increases were notably
recorded since the second quarter of 2013 after a
stable outcome in the first quarter For 2013 as a
whole government consumption is expected to
have increased in the EU by 04 (03 in the
euro area) Looking at the components of
government consumption in the euro area
compensation of employees shifted from declining
to increasing nominal expenditure on the back of
past wage agreements in the public sector (-03
in 2012 to 10 in 2013) Disinflation is set to
(11) For an overview of deleveraging in the euro area see eg
IMF Indebtedness and deleveraging in the euro area IMF Country Report No 13232 July 2013
European Economic Forecast Winter 2014
20
amplify the impact on real government
consumption
Over the forecast horizon with weaker
consolidation needs public consumption is
expected to gain traction in the EU and the euro
area However declines in public consumption in
2014 and 2015 are still expected in Ireland
Greece Spain Cyprus and Portugal The forecast
for 2015 is based on the no-policy-change
assumption which implies that only measures
adopted by national parliaments or known in
sufficient details are accounted for
Net exports supported the rebound in GDP in
the first half of 2013 hellip
Following the very strong expansion of exports of
goods and services by about 2 (q-o-q) in the
second quarter of 2013 in both the EU and the euro
area the third quarter saw exports stagnating in the
EU and growing by just frac14 in the euro area The
latest decline in export growth was mainly driven
by slowing extra-EU demand but also by the
nominal appreciation of the euro The growth of
total imports had also turned positive in both areas
in the second and third quarters (1frac12 and 1frac14
respectively) reflecting the strengthening of
domestic demand With imports growing more
strongly than exports the contribution from net
exports to GDP growth turned negative in the third
quarter
hellip but will diminish over the forecast horizon hellip
In the short term further export growth is expected
in line with the increasing foreign demand for EU
products In fact manufacturing export order
books from the Commissions surveys have
improved further in the latest months being above
their long-term averages and so did new export
orders in the manufacturing PMI (see graph I14)
For the year 2013 as a whole EU export growth is
expected to have slowed to 1frac12 before
accelerating in 2014 (4) and 2015 (5frac12) on the
back of a rebound in economic activity outside the
EU Following moderate growth in 2013
(frac12) import growth is expected to expand almost
in parallel to exports This is also related to the
expected acceleration in investment which is more
import intensive than other GDP components (12)
30
35
40
45
50
55
60
65
70
-12
-8
-4
0
4
8
12
00 01 02 03 04 05 06 07 08 09 10 11 12 13 14 15
Graph I14 Global demand EU exports
and new export orders
Exports (q-o-q lhs)
Exports forecast (annual data y-o-y lhs)
Output index (Global PMI composite rhs)
New export orders (PMI Manuf EU rhs)
3-month moving average
forecast
Export growth outperformed import growth in
2013 and net exports should have contributed
positively to GDP growth This picture is expected
to change over the forecast as imports strengthen
in line with the pick-up in domestic demand Net
exports contribution would be more than halved in
2014-15 compared to 2013 though remaining
slightly positive
hellip with some cross-country differences
The ongoing restructuring of the corporate sector
in vulnerable Member States is supporting their
performance on foreign markets and enables them
to take advantage of the expansion of world trade
This has already been visible in recent export
growth rates with vulnerable countries
outperforming others (see graph I15) However
due to still relative small export shares in some of
these countries the positive impact on overall
GDP growth remains limited
Strengthening current-account surplus in the
euro area
The trade balances of the euro area and the EU
were positively affected by the increase in export
volumes in 2013 Moreover the long-lasting
weakening of economic activity in the EU and
shrinking private consumption volumes have left
their mark on imports Import prices declining
faster than export prices supported the widening of
(12) See eg M Bussiegravere et al Estimating trade elasticites
demand composition and the trade collapse American Economic Journal Macroeconomics July 2013 Vol 5
No 3 pp 118-151
EA and EU outlook
21
the surplus in the adjusted merchandise trade
balance in 2013
-5
-4
-3
-2
-1
0
1
2
3
4
10 11 12 13 14 15 10 11 12 13 14 15
Graph I15Growth contributions in surplus and former
deficit countries
Net exports Domestic demand GDP growth
Former deficit countriesSurplus countries
BE DE AT LU NL FI IE EL ES CY MT PT SI
After years of having a roughly balanced external
position the current-account balance of both the
EU and the euro area has now shifted into a more
marked surplus (in adjusted terms) and is expected
to have been close to 1frac14 and 2frac14 of GDP
respectively in 2013 Moreover it is forecast to
stay broadly at those levels in 2014 and 2015
Most of the strengthening in the euro-area current
account is the result of significant adjustment in
the vulnerable countries which previously
recorded high deficits External rebalancing in
vulnerable euro-area Member States is supported
by gains in price competiveness due to lower unit
labour costs as well as by the permanent
contraction of domestic demand induced by
reductions in overblown construction investments
corrections in future income expectations and
increases in structural unemployment (see box I3)
Going forward the expected recovery in domestic
demand is set to slow down the growth of net
exports so that the pace of improvement in current
accounts of vulnerable Member Sates starts
reducing
5 LABOUR MARKET CONDITIONS IN THE EU
After declining for almost two years employment
(ie the number of persons employed) stabilised in
the second quarter of 2013 and remained
unchanged in the third quarter while
unemployment rates have stopped increasing since
mid-2013
Labour market conditions have stabilised since
the second half of 2013 hellip
In the second half of 2013 the unemployment rate
remained broadly unchanged in the EU and the
euro area after being on the rise for the last five
years In December the unemployment rate
declined very timidly in the EU to 107 (from
108 in November) while it stood unchanged at
120 in the euro area (after peaking at 121 in
the summer) remaining in both areas at
historically high levels Since the summer the
youth unemployment rate has also started to recede
in the EU and to stabilise in the euro area but this
partly reflects a falling participation rate In
December 2013 it reached 232 in the EU and
239 in the euro area compared to 237 and
242 a year earlier
With output growth accelerating only slowly and
in view of the lagged response of employment to
the cycle little net job creation is expected to take
place in the short term Most of the latest survey
measures of hiring intentions have continued to
increase in recent months but remain at low levels
According to Commission surveys in industry
employment expectations in the EU and euro area
have steadily increased up to January 2014 and
slightly exceed the long-term average whereas
expectations in the services sector despite being on
an upward trend remain low In the construction
sector hiring intentions have been more volatile
and are still below their long-term average
Consumers unemployment fears have almost
steadily declined from the peaks observed in late
2012 having fallen below their long-term averages
(see graph I16)
0
10
20
30
40
50
60
70-50
-40
-30
-20
-10
0
10
20
07 08 09 10 11 12 13 14
Employment exp in industry next 3 months (lhs)
Employment exp in services next 3 months (lhs)
Consumers unempl exp next 12 months (inverted rhs)
Graph I16Employment expectations
DG ECFIN surveys EU
level level
European Economic Forecast Winter 2014
22
hellip and limited improvements are expected in
2014-15
The subdued recovery of economic activity is
expected to lead to only a minor positive impact on
employment in 2014 (03 and 05 respectively
in the euro area and the EU) but more visible ones
in 2015 (07 in both zones) (see table I4)
Private employment growth is projected to still be
dampened by the scope for firms to increase hours
per employee which are still below their pre-crisis
level before hiring new staff Besides the limited
access to funding for SMEs in some countries
could also negatively impact their hiring decisions
and those firms usually have a leading role in
employment creation
The labour force in the EU and the euro area is
estimated to grow moderately in 2013-15 in line
with population of working age The added
worker effect (resulting from the need of an
additional income for households hit by the crisis)
which characterised the response of participation
until 2012 is set to be more than offset by stronger
discouragement effects and falling participation of
the youth in particular in the countries with high
long-term unemployment rates (13)
Unemployment is set to decline timidly at the
end of the forecast horizon hellip
After being on the rise since 2009 the
unemployment rate is expected to remain
unchanged in 2014 at 120 in the euro area
while slightly receding to 107 in the EU In
2015 the unemployment rate is expected to
slightly decline in both areas to 117 in the euro
area and 104 in the EU remaining at historically
high levels (see graph I17) Such a slow decline
(13) See European Commission (DG ECFIN) Labour Market
Developments in Europe 2013 European Economy
62013
mirrors first the fragility of the economic recovery
but could reflect inter-alia a higher structural
unemployment than in the pre-crisis years Low
productivity gains the impact of long-term
unemployment on skills and future employability
of youth labour market mismatches due to the
sectoral adjustment process in some countries
together with a decline in production capacity are
preventing unemployment declining markedly
This is also mirrored by the rise in the NAWRU
which according to the Commission estimates has
increased substantially since 2008 (14)
6
7
8
9
10
11
12
-10
-08
-06
-04
-02
00
02
04
06
08
00 01 02 03 04 05 06 07 08 09 10 11 12 13 14 15
Graph I17 Employment growth and unemployment
rate EU
Employment (q-o-q lhs) forecast (y-o-y lhs)
Unemployment rate (rhs) forecast (rhs)
of the labour force
forecast
Forecast figures are annual data
hellip with marked differences across Member
States
While growth differentials are expected to narrow
over the forecast horizon large differences in
labour market performances are set to persist In
2015 unemployment rates are expected to range
from 47 in Austria to 246 in Spain reflecting
(14) However variations in the NAWRU might also reflect
some cyclical factors
(Annual percentage change)
2012 2013 2014 2015 2013 2014 2015 2012 2013 2014 2015 2013 2014 2015
Population of working age (15-64) 00 00 00 00 01 01 01 00 01 01 01 01 01 01
Labour force 07 -01 -01 03 00 02 02 07 01 00 04 02 02 03
Employment -08 -09 03 07 -09 02 07 -03 -04 05 07 -04 03 07
Employment (change in million) -06 -08 02 07 -09 02 07 -02 -04 04 07 -04 03 07
Unemployment (levels in millions) 182 193 192 186 195 196 190 255 266 261 254 270 269 261
Unemployment rate ( of labour force) 114 121 120 117 122 122 118 105 109 107 104 111 110 107
Labour productivity whole economy 02 05 09 10 04 08 10 -01 05 10 12 04 10 12
Employment rate (a) 583 578 580 584 578 579 582 584 581 583 586 579 580 583
(a) As a percentage of population of working age Definition according to structural indicators
See also note 6 in the Statistical Annex
Autumn 2013
Table I4
forecast
Labour market outlook - euro area and EU
EUEuro area
Autumn 2013
forecast
EA and EU outlook
23
divergent output developments as well as different
responses of employment to output However the
unemployment rate should see a decline in most of
the EU Member States by the end of the forecast
horizon
The variable labour market conditions across
countries are also reflected in diverging wage
developments Since 2011 real wage increases
have lagged behind productivity growth in most
high-unemployment countries facing substantial
internal and external adjustment needs Looking
ahead wage moderation is set to continue in
vulnerable Member States allowing for a further
gradual improvement in price competitiveness On
the other hand a notable rise in unit labour costs
was observed in countries with relatively low
unemployment and real wages per head are set to
grow faster than in the pre-crisis years notably in
Germany
6 INFLATION IN THE EU
Inflation slowed down in 2013 hellip
In the EU and the euro area consumer-price
inflation has been trending downwards throughout
2013 on the back of falling energy prices together
with still weak economic conditions In 2013
HICP inflation averaged 15 and 14
respectively in the EU and the euro area compared
to 26 and 25 in 2012 (see Graph I18) The
easing of price pressures was accentuated towards
the end of the year by the fading impact of
temporary factors ndash past increases in taxation in a
number of Member States linked to fiscal
consolidation needs and some volatility in
commodity prices Also a marked appreciation of
the euro contributed to decreasing price pressures
from imported goods in 2013
-1
0
1
2
3
4
5
07 08 09 10 11 12 13 14 15
Energy and unprocessed food [pps]
Other components (core inflation) [pps]
HICP all items
forecast
hellip and so did underlying inflation
Core inflation ie all-item HICP inflation
excluding energy and unprocessed food remained
quite persistent in the first three quarters of 2013
(at 15 in the EU and 13 in the euro area over
that period) as the underlying inflation pressures
were still distorted by second-round effects from
previous hikes in energy prices and changes in
taxation in a number of Member States In the
fourth quarter as those factors faded away core
inflation decreased to 11 in the EU and 10 in
the euro area Notably the impact of tax hikes and
administrated prices was smaller in the fourth
quarter than during the rest of 2013 The inflation
measure adjusted for tax changes (15)
stood at 11
in the EU and 1 in the euro area in 2013
Moreover the theoretical impact of changes in
taxation on inflation varied in 2013 from
-01 pp in Denmark and Lithuania to 14 pps in
Spain masking somewhat the underlying price
pressures
A protracted period of low inflation hellip
Looking ahead with the underlying price trend
likely to remain subdued and continued downward
trend in commodity prices average annual HICP
inflation in 2014 is predicted to ease further to
around 1 in both areas on the back of weak
demand in the current cyclical phase reinforced by
relative price adjustments Inflation appears to
have become more reactive to the output gap
recently possibly driven by a reduction of nominal
rigidities in particular in vulnerable Member
States that have implemented significant structural
reforms in the recent past (see Box I4)
With a gradual reduction of the output gap over the
forecast horizon the dampening cyclical impact on
price pressures is likely to fade and a muted
increase in HICP inflation is expected in the course
of 2015 Average HICP inflation in 2015 in the EU
and euro area is set to increase slightly to 15 and
13 respectively
hellip driven by restrained wage pressures hellip
On average in 2013 compensation per employee
in the euro area rose at a muted pace (1frac12 in the
three first quarters of 2013) As labour productivity
growth gained momentum in the course of 2013
(15) This measure assumes full and immediate pass-through of
tax changes to prices It may therefore overestimate the
impact of tax changes on inflation
European Economic Forecast Winter 2014
24
the growth in unit labour costs has decelerated
substantially to 10 in the third quarter of 2013
With improved economic prospects ahead
productivity gains are set to accelerate towards the
end of the forecast horizon to 1 in the euro area
and 12 in the EU Combined with a modest
recovery in wage growth (to about 2 in 2015 in
both areas) growth in unit-labour-cost is set to
stabilise below 1 per year indicating modest
inflation pressures from the labour market
However the overall outlook for wage pressures
masks quite divergent situations across Member
States
hellip and producer price inflation turning
negative
The subdued inflation outlook is corroborated by
developments in upstream price pressures which
have been declining since spring 2011 Producer
prices excluding construction fell further and
turned negative in mid-2013 both in the EU and
the euro area In December they declined by 06
y-o-y in the EU Assuming a partial pass-through
of producer prices to consumer prices this
foreshadows continuing disinflationary pressures
in the months ahead given the overall weakness in
economic conditions and the assumptions for
commodity-price developments
Stable long-run inflation expectations
Survey indicators of producer and consumer price
expectations seem to signal low but positive
inflation developments in the short term As
regards producers expectations the PMI
manufacturing input price index after recording a
trough in mid-2013 revived substantially and
stands slightly above the 50-mark in January
indicating an increase in future prices amid better
economic news By contrast output price
expectations (ie selling prices) proved very stable
over the same period hovering around the 50-mark
suggesting a feeble pricing power of companies
due to weak demand prospects In the course of
2013 consumers inflation expectations followed
the inflation trend downward and suggest low
inflation in the short term (see graph I19)
The market-based euro-area inflation expectations
seem to corroborate the survey-based indications
Inflation expectations derived from swap rates
have been trending downwards at all maturities
since spring 2011 although an uptick is visible
since mid-December 2013 Taken at face value
the spot rates of inflation-linked swaps observed in
January 2014 imply an average annual inflation
rate of 11 over 2014-16 Over the medium term
inflation expectations derived from inflation-linked
swap rates at the three-years-forward-three-years-
ahead horizon imply an average inflation rate of
17 in 2017-19 At the same time five-year
inflation-linked swap rates five years ahead the
most widely used measure of long-term inflation
expectations have been relatively stable at slightly
above 2 The marked-based indicators suggest
that long-term inflation expectations are being
well-anchored at the current juncture on the back
of high central bank credibility In the short to
medium term however markets expect inflation to
remain low
-10
-5
0
5
10
-20
-10
0
10
20
30
40
50
60
70
80
90
07 08 09 10 11 12 13
level
Graph I19 Euro-area PPI and survey inflation
expectations
PMI manufacturing input prices
PMI manufacturing output prices
ESI consumer inflation expectations
PPI industry excl construction (rhs)
7 PUBLIC FINANCES IN THE EU
Consolidation of public finances continuing but
at a slower pace
After significant fiscal consolidation in recent
years headline deficits are projected to keep
falling although at a gradually slowing pace over
the forecast horizon This pattern of consolidation
is consistent with the ongoing correction of
excessive deficits (16)
The reduction in the headline deficit in 2013
stemmed mainly from continuous underlying fiscal
effort as the uptick in economic activity remained
modest in 2013 As a result of the significant fiscal
consolidation achieved by several Member States
(16) With regard to EU budgetary surveillance all Member
States except Bulgaria Estonia Finland Germany Hungary Italy Latvia Lithuania Luxemburg Romania
and Sweden are currently subject to the Excessive Deficit
Procedure (EDP)
EA and EU outlook
25
the deficit-to-GDP ratio in 2013 is forecast to have
decreased by 03 pp in the EU and by 04 pp in
the euro area reaching 35 and 31 of GDP
respectively (see table I5)
Headline deficits are set to shrink further in 2014
and to stabilise in 2015 as the recovery slowly
broadens and given further deficit-reducing
measures included by Member States in their
budgets for this year While showing some
differentiation reflecting varying degrees of
financial and fiscal stress the improvement in
budget balances is likely to be broad-based across
Member States in 2014 As a result the fiscal
deficit is expected to fall to 27 of GDP in 2014
in the EU and to 26 in the euro area and to
remain roughly at these levels in 2015 (see
graph I20)
-7
-6
-5
-4
-3
-2
-1
0
1
2
-7
-6
-5
-4
-3
-2
-1
0
1
2
09 10 11 12 13 14 15
Graph I20 Budgetary developments
EU
General goverment balance (lhs)
Changes in structural balance (rhs)
forecast
of GDP pps
Structural deficit to decline more slowly
The fiscal policy stance is expected to be close to
neutral over the forecast horizon The reduction of
the structural budget deficit ie the general
government deficit corrected for cyclical factors
one-offs and other temporary measures is forecast
to have remained at above frac12 pp of GDP in both
areas in 2013 but it is expected to slow down in
2014 In 2015 under the usual no-policy-change
assumption the structural deficit is expected to
widen
Fiscal consolidation moving from revenue
increases to expenditure-based
The fiscal adjustment in 2013 has been mainly
revenue-based in both the EU and the euro area as
it was the case in the previous two years The
increase in public revenues has been driven by tax
receipts on income and wealth and as a result the
revenue-to-GDP ratio is set to have risen further
before reaching a peak in 2014 in the EU and euro
area at 459 and 468 respectively Further
ahead the revenue-to-GDP ratio is forecast to
decline reflecting the phasing-out of temporary
tax-increasing measures and some tax cuts planned
in a number of Member States (see graph I21)
42
43
44
45
46
47
48
49
50
51
52
09 10 11 12 13 14 15
Total revenues Total expenditure
forecast
Graph I21General government revenues and
expenditure EU
of GDP
The expenditure-to-GDP ratio has remained
broadly stable in 2013 and is expected to decrease
( of GDP)
2012 2013 2014 2015 2013 2014 2015 2012 2013 2014 2015 2013 2014 2015
Total receipts (1) 462 468 468 465 467 467 464 454 457 459 453 456 458 452
Total expenditure (2) 499 499 494 490 498 493 488 493 492 485 480 491 485 479
Actual balance (3) = (1)-(2) -37 -31 -26 -25 -31 -25 -24 -39 -35 -27 -27 -35 -27 -26
Interest expenditure (4) 31 30 30 31 30 30 31 29 29 28 29 29 29 29
Primary balance (5) = (3)+(4) -06 -01 05 06 -01 05 07 -10 -06 02 02 -07 02 02
Cyclically-adjusted budget balance -26 -16 -13 -18 -16 -13 -16 -27 -20 -16 -21 -21 -15 -20
Cyclically-adjusted primary balance 05 14 17 13 14 18 15 02 08 12 07 08 13 09
Structural budget balance -21 -15 -13 -17 -15 -13 -15 -26 -20 -19 -21 -21 -18 -19
Change in structural budget balance 15 06 01 -04 06 02 -03 12 06 01 -02 06 03 -01
Gross debt 926 955 959 954 955 959 954 866 894 897 895 898 902 901
Table I5
forecastEuro area
General Government budgetary position - euro area and EU
The structural budget balance is the cyclically-adjusted budget balance net of one-off and other temporary measures estimated
by the European Commission
EU
Autumn 2013
forecast
Autumn 2013
European Economic Forecast Winter 2014
26
afterwards in both areas to become the main
driver of the fiscal consolidation in 2014 In 2014
expenditure cuts are expected to take the form of
discretionary fiscal measures involving mainly
wages and salaries as well as intermediate
consumption and only to lesser extent public
investment In 2015 the decrease in the
expenditure-to-GDP would compensate the lower
revenue-to-GDP ratio
Debt ratios reaching a peak in 2014
The debt-to-GDP ratio is forecast to have
increased in 2013 and move up further in 2014
though at a somewhat lower pace In 2014 debt is
expected to reach a peak 897 of GDP in the EU
and 959 in the euro area (see table I6) In 2015
it is set to start decreasing in both areas The
increase of the debt-to-GDP ratio in 2014 for the
euro area is mainly due to the strong contribution
of the interest expenditure and the stock-flow
adjustment In 2014 and 2015 the faster economic
growth and the higher primary surpluses will start
having a reducing impact on the public debt-to-
GDP ratio
8 RISKS
The recent string of positive economic news has
helped to balance the risks to the growth outlook
since the autumn forecast but on the whole
downside risks continue to prevail (see graph I22)
The main risk to the forecast would be stalling or
partial implementation of structural fiscal and
institutional reforms at Member States or European
level resulting in low actual and potential growth
and protracted high unemployment A weaker than
projected labour market would have both short-
and medium-term detrimental effects on private
consumption and also on potential growth
Moreover the debt overhang the investment
shortfall in recent years and slowing total factor
productivity could hurt growth in the medium term
if they are inadequately addressed by structural
reforms (see box I2) resulting in an extended
period of low growth The expectation of lower
potential growth could feed back into investment
and consumption thus dampening growth also in
the short term
This risk of low growth would be exacerbated in
the short term if inflation were to turn out lower-
than-expected and the reduction in financial
fragmentation were to be less than anticipated
Inflation could turn out even lower than expected
in the central scenario Slower import price
increases could come from a more pronounced
weakness of emerging markets particularly if
combined with even lower commodities prices and
a further appreciation of the euro Within the EU
inflation could be dragged down if economic
agents were to judge that very weak price
pressures were becoming entrenched This would
affect real interest rates hurt demand and increase
the real debt burden The risk of deflation in the
EU ie the emergence of a broad-based and self-
sustaining downward trend in prices cannot not be
totally ruled out but given the gradually
strengthening recovery the increase in confidence
and the ongoing efforts to improve the health of
the banking system it is very unlikely
Table I6
Euro-area debt dynamics
average
2004-082009 2010 2011 2012 2013 2014 2015
Gro ss debt rat io 1 ( o f GD P ) 690 799 856 879 926 955 959 954
Change in the ratio 02 98 57 24 46 29 04 -05
Contributions to the change in the ratio
1 P rimary balance -11 35 34 11 06 01 -05 -06
2 ldquo Sno w-ballrdquo ef fect 2 02 54 07 07 25 21 08 01
Of which
Interest expenditure 30 29 28 30 31 30 30 31
Growth effect -14 32 -15 -13 06 04 -11 -16
Inflation effect -13 -07 -06 -10 -12 -13 -11 -13
3 Sto ck-f lo w adjustment 10 09 16 05 15 07 01 00
1 End of period
2 The snow-ball effect captures the impact of interest expenditure on accumulated debt as well as the impact of real GDP growth and inflation
on the debt ratio (through the denominator) The stock-flow adjustment includes differences in cash and accrual accounting accumulation of
financial assets and valuation and other residual effects
EA and EU outlook
27
The materialisation of the central scenario in a
context of still elevated deleveraging needs in the
private and banking sectors depends on further
decreases of financial fragmentation An
improvement in lending conditions this year and
next rests on the success of the AQR and stress
tests in cleaning balance sheets and removing
uncertainty about the health of euro-area banks
Smooth implementation of the Banking Union
which should improve confidence is also crucial
-5
-4
-3
-2
-1
0
1
2
3
4
5
06 07 08 09 10 11 12 13 14 15
upper 90 upper 70
upper 40 lower 40
lower 70 lower 90
central scenario actual
Graph I22Euro-area GDP forecasts -
Uncertainty linked to the balance of risks
Downside risks could also come from heightened
instability in emerging markets financing
conditions The impact has so far centred on
emerging market economies with relatively weak
fundamentals Continued and more generalised
turmoil could hit the EU economy through lower
trade and the portfolio and banking channels A
more generalised re-assessment of risks could
notably lead to a flight of capital to the highest
rated countries in the euro area raising
sovereign-bond spreads in the periphery
Continued turmoil would also trigger a slowdown
in EMEs together with an appreciation of the euro
putting a drag on the recovery which is still
dependent on exports in many countries Overall
the EU banking sector seems relatively shielded by
its small exposure to major EMEs but some
Member States are more exposed than others
The recovery could also be stronger than
envisaged Upside risks are related to positive
feedback loops between confidence GDP and
investment growth and the ability of the banking
sector to lend Positive reinforcing feedbacks
between these factors would reduce further the
drags stemming from the crisis and boost growth
More precisely economic expansion could be
stronger than envisaged in the central scenario if
domestic demand is firmer in the core countries
and helps further the rebalancing process if
confidence effects lead to a stronger rebound of
investment if the competitiveness boost in
peripheral countries is larger than envisaged and
finally if financial fragmentation is reduced to a
greater extent in 2015 following a successful AQR
and the introduction of the Single Supervisory
Mechanism In the medium term the
implementation of additional and bold structural
reforms could lift further the potential growth of
Member States with positive impact also in the
short term notably through increased confidence
Eventually a stronger economic recovery than
envisaged in the central scenario would raise the
inflation projections in particular if recent
structural reforms result in a faster reduction in
unemployment than expected
European Economic Forecast Winter 2014
28
Box I1 The economic effects of policy uncertainty
Since the outbreak of the crisis the interest in the
effects of uncertainty on the real economy has
dramatically increased Whereas most studies focus
on the effects of uncertainty on GDP (1) or
investment and consumption (2) decisions this box
attempts to assess its impact on industrial new
orders which is a variable commonly agreed to be
leading the business cycle It is assumed that
increased uncertainty induces companies to lower
their orders in anticipation of lower demand from
investors and consumers (3) While economic agents
can be confronted with uncertainty from a number
of different sources this box focusses on the effect
of uncertainty generated by major events related to
the financial and sovereign-debt crisis The analysis
suggests that there are immediate statistically
significant and economically sizeable negative
effects from crisis-related uncertainty on new
orders
How to measure uncertainty produced by the
financial and sovereign-debt crisis
In the absence of an indicator that directly maps
major events and decisions related to the financial
(1) Denis S Kannan P 2013 The Impact of
Uncertainty Shocks on the UK Economy IMF
Working Paper 1366 (2) Quarterly report on the Euro Area Volume 12 No 2
(2013) DG ECFIN European Commission (3) According to economic theory high uncertainty gives
agents an incentive to postpone or cancel their
investment consumption or employment decisions
when the latter are costly to revert (eg due to fixed
and adjustment costs) thereby depressing economic
activity See eg Bernanke B 1983 Irreversibility
uncertainty and cyclical investment The Quarterly
Journal of Economics MIT Press Vol 98(1) pp 85-
106 February
and sovereign-debt crisis the analysis relies on the
Economic Policy Uncertainty Index (EPUI) for
the EU developed at Stanford University (4) This
index combines a news-based indicator (counting
crisis-related words that appear in EU newspapers)
with others based on the dispersion of consumer-
price budget-deficit forecasts
Graph 1 shows that the EPUI adequately captures
the uncertainty caused by major crisis-related
events Furthermore Graph 2 suggests that
uncertainty significantly and negatively weighs on
important macro-economic variables such as
investment
It can be noted that after the peak at the end of
2011 the index has been following a downward
path the current level of uncertainty however is
still significantly higher than it was on average in
the pre-crisis period
An appropriate framework to analyse the effect
of uncertainty on new orders
To distil the effect of uncertainty on industrial new
orders the EPUI is added as an explanatory
variable in the model developed by de Bondt
Dieden Muzikarova and Vincze (BDMV) which is
used by the ECB to produce official estimates of
(4) Baker S N Bloom and S Davis 2013 Measuring
economic policy uncertainty Chicago Booth
Research Paper 13-02
0
50
100
150
200
250
07 08 09 10 11 12 13
Economic Policy Uncertainty Index EU
Graph 1Policy Uncertainty EUinterbank lending slows down
Lehmann Brothers bankrupt
EL gov deficit revised upwards
(from 5 to 127)
EL seeks ext fin support
IE requests
programme
voluntary PSI
for Greece
market rumours about possible rejection of ESM
resignation of EL PM new IT gov ES elections
ES applies for programme
EP Council
Commission
agree on SSM
ECB introduces
6-month LTROsECB starts sequence of 7 interest
rate cuts in 8 months
agreement on EFSF
establishment
2nd EL adjustment programme
approved
ECB announces
OMTs
(Continued on the next page)
EA and EU outlook
29
Box (continued)
new orders (5) The augmented model reads as
follows
not = β0 + β1Δ3obt + β2ΔΔ3obt + β3μtPMI + β4μtΔPMI + β5tot + β6tot-1 + β7(not-1tot-1) + β8not-1 + β9not-2 + β10epuit + εt
where no ob to and epui stand for new orders
(m-o-m growth) manufacturing managers
assessment of order books (from EU BCS survey)
industrial turnover (m-o-m growth) and the
Economic Policy Uncertainty Index respectively t
indexes time while Δ is the first difference operator
and Δ3 indicates 3-month changes The term μtPMI (μtΔPMI) is the residual from regressing the (first
difference of the) manufacturing PMI new orders
index on the (first difference of the) 3-month
change in manufacturing managers assessment of
order books (6) finally εt is a residual term
The analysis is conducted for the euro area as well
as its three largest Member States (Germany
France Italy) which are likely to be affected by the
financialeuro crisis to different degrees
(5) Several Member States discontinued the production
of official data on industrial new orders in 2012 The
ECB stepped in with a model producing estimates of
new orders for these countries These are then
combined with hard-data series on new orders from
Member States still collecting such data through their
statistical institutes See de Bondt et al 2013
Introducing the ECB indicator on euro area
industrial new orders ECB Occasional Paper Series
No 149 June 2013 The resulting aggregate euro-
area new orders indicator can be downloaded from
the ECB Statistical Data Warehouse (6) Using the regression residuals is necessary since the
PMI new orders index and the EU BCS question on
order books are potentially multi-collinear By
contrast no multi-collinearity was found between the
Economic Policy Uncertainty Index and the 3-month
change of the BCS question on order books (as well
as its first difference)
Uncertainty matters for new orders
We find that the EPUI has a significantly negative
contemporaneous impact on new orders growth in
case of all entities examined Adding the
uncertainty indicator to the baseline BDMV
model (7) drives up the adjusted R2 by 4-5 points
The results are robust to the inclusion of a dummy
for the period 2008m1-2009m12 in order to control
for the effects of the global recession Thus the
diagnosed uncertainty effect is not just a result of
extreme increases in uncertainty registered in the
years 200809 which coincided with sharp drops in
new orders growth
The magnitude of the uncertainty coefficient (over
the full sample 1997-2013) is quite similar for the
euro area aggregate and Germany while the Italian
coefficient is around two and the French 2frac12 times
larger (see Table 1 ndash first row) One would indeed
expect core countries like Germany which are
supposedly less exposed to the euro crisis to
register a considerably lower uncertainty effect
than a more vulnerable country like Italy A
seemingly surprising finding is that the effect of
EU uncertainty on French new orders growth is
slightly higher than in Italy This result must be put
into the context of the volatility level of new orders
growth which substantially differs among the
examined countries The standard deviation of new
orders growth in France for example is
particularly high owing to the significant impact of
new orders in the aircraft industry Re-running the
regressions with the dependent variable in
standardised form changes the picture Germany
registers the lowest uncertainty effect and is
followed by France the euro area and Italy
Uncertainty exerts substantial and immediate
effects on new orders
Using the baseline results (Table 1 ndash first row) it is
possible to get a flavour of the sizeable negative
impact that uncertainty can have on new orders
growth Applying the sharpest month-on-month
rise registered since the outbreak of the financial
crisis (bankruptcy of Lehman Brothers) to the
estimated coefficients suggests that new orders
growth would contract by around 1 pp in the euro
area and Germany and 2 to 2frac12 pps in Italy and
France (see Table 1 ndash second row)
(7) Depending on data availability the sample period
starts between 1997m72000m3 and ends in 2013m9
In the case of France the sample period ends in
2012m12 when France discontinued the collection of
data on new orders
0
50
100
150
200
25017
18
18
19
19
20
20
21
21
22
22
00 01 02 03 04 05 06 07 08 09 10 11 12 13 14
Graph 2 Investment and policy uncertainty EU
Investment (lhs)
Economic Policy Uncertainty Index EU (rhs inverted)
of GDP index
Source Eurostat and Baker Bloom and Davis at wwwPolicyUncertaintycom
(Continued on the next page)
European Economic Forecast Winter 2014
30
Box (continued)
To check for the speed of the uncertainty effects on
new orders growth lags of EPUI are included into
the baseline model In all countries examined the
effects of uncertainty are exclusively
contemporaneous When re-conducting the analysis
for the pre-crisis period prior to 2008 and
afterwards the results do not significantly change
Taken together this suggests that (i) uncertainty has
a very fast effect on new orders and (ii) there is no
evidence that the speed of the effect has changed
during the crisis
Vanishing uncertainty could drive up orders
Considering the magnitude of the uncertainty
effects described above and the (still high) current
level of the EPUI new orders growth could
substantially increase once uncertainty eases from
its current to the average pre-crisis level Applying
the coefficients of Table 1 new orders growth in
the EA and Germany could gain around frac12 pp
m-o-m (ie some 6 pps over the year) while Italy
and France would potentially see order growth
increasing by 1 ndash 1frac12 pps m-o-m (ie 12ndash18 pps
over the year) These findings underline the
potential benefits of further policy action to reduce
uncertainty
Table 1
The effect of the Stanford Policy Uncertainty Index (EU) on new orders
(m-o-m growth rates)
Euro area Germany France Italy
Effect of Stanford Policy Uncertainty Index (EU) -0020 -0019 -0051 -0038
If the sharpest m-o-m rise since 2006 (+5097)
repeated itself new orders would decline byhellip -102 pps -097 pp -260 pps -194 pps
If uncertainty eased from the January 2014 level
(11843) to the average pre-crisis level (9024)
new orders would increase byhellip
+056 pp +054 pp +144 pps +107 pps
R2 with uncertainty (R2 without uncertainty) 055 (051) 043 (038) 041 (037) 050 (044)
significant at 1 level significant at 5 level significant at 10 level
EA and EU outlook
31
Box I2 Post-crisis total factor productivity trends in the EU
Introduction
This box looks at the impact the crisis is likely to
have on the longer-term total factor productivity
trends in the EU Increasing total factor
productivity ie the increase of GDP that is not
explained by the expansion of either labour or
capital inputs is the key driver of long-run changes
in living standards (1) Consequently the likely
impact of the crisis on its current and future
development is the subject of close scrutiny by the
economics profession Unfortunately however
theory does not give a clear answer as to what the
expected impact of the crisis on long-run TFP
might be (2) Besides a number of mechanisms that
tend to dampen TFP in the aftermath of a crisis
(including pro-cyclical RampD spending and rising
risk aversion resulting in more expensive bank
lending drying capital markets and higher risk
premiums for venture capital financing) there are
also arguments that downturns can have a positive
TFP impact as they can induce a process of
essential restructuring and cleansing in the
economy
Consequently ex ante the expected effect of the
crisis on TFP is ambiguous with a range of specific
factors making any definitive assessment of the
fallout from the current crisis particularly
uncertain These factors include the need to allow
(1) See for instance the overview in Hulten C R Total
factor productivity A short biography New
developments in productivity analysis University of
Chicago Press 2001 1-54 (2) Eg Abiad A R Balakrishnan P Koeva-Brooks D
Leigh and I Tytell (2009) Whatrsquos the Damage
Medium-term Output Dynamics After Banking
Crises IMF Working Paper No 09245
on the one hand for the expected one-off
downward shifts in the level of TFP associated with
industrial restructuring with some crisis-related
industries (eg financial services and construction)
likely to experience permanent reductions in the
level of their activities as a result of the crisis and
on the other hand potential upwards shifts due to
freeing scarce resources having been locked into
relatively unproductive activities the difficulty in
estimating realistic capital obsolescence rates the
uncertainties regarding the financial crisis impact
on RampD spending and on the financing of RampD
and finally the possibility of a crisis-induced shift
away from the relatively-high-TFP growth
manufacturing sector towards services In summary
therefore the impact of the crisis on TFP is largely
an empirical question with the extent to which
individual EU countries are affected by the
different factors listed earlier dictating their relative
TFP performance in the post-crisis period
Overview for the EU as a whole
Graph 1 shows the latest winter 2014 forecasts for
trend TFP growth in the EU28 and the euro area as
well as the evolution of the labour capital and TFP
components of potential growth since 2000 in the
euro area (the patterns are similar for EU28) Graph
1 illustrates that the TFP results support the a priori
assumption that the final impact of the crisis is
dependent on a range of offsetting positive and
negative factors with this balancing act appearing
to produce a slightly negative overall impact from
the crisis so far (ie over the period 2008-13)
However it is still too early to establish whether
this small decline in the EUs underlying TFP
growth rate is genuinely linked to the crisis itself
(due to some combination of factors discussed
-05
00
05
10
15
20
25
30
00 01 02 03 04 05 06 07 08 09 10 11 12 13 14 15
Contributions to Potential Output
Labour PotOutput growth Capital TFP
00
02
04
06
08
10
12
14
16
00 01 02 03 04 05 06 07 08 09 10 11 12 13 14 15
TFP Growth
EA17 smoothed EU28 smoothed
Graph 1TFP and non-TFP contributions to EU Potential Growth 2000-15
(Continued on the next page)
European Economic Forecast Winter 2014
32
Box (continued)
above) or whether it simply reflects a continuation
of the well-established downward pre-crisis trend
(part of which reflects developments in both the
knowledge drivers of TFP and in the skills
composition of the EUs labour force)
Whilst a definitive understanding of post-crisis TFP
trends is still elusive what is not in doubt however
is that the halving in potential growth rates
following the crisis has much more to do with the
sharp deterioration in the contributions from capital
and labour than from any negative drag from TFP
In addition the short run forecasts for 2014 and
2015 suggest trend TFP growth rates will remain
relatively stable and close to their pre-crisis rates
whereas the sluggish recovery in both investment
and labour market trends from the impact of the
crisis will ensure that their contributions to overall
potential growth will remain substantially lower
than in the pre-crisis period The small slowdown
in trend TFP growth rates across the EU has
necessarily had an impact on the level of TFP
However the level of trend TFP has been
substantially less affected than the level of actual
TFP since by definition it has been corrected for
the effects of the cycle Indeed as shown in
Graph 2 the level of actual TFP in the EU28 fell by
a total of 11 during the crisis (ie over the period
2008-13) whereas the level of trend TFP is
estimated to have increased by 22 over the same
time period
This gap between the actual TFP level and its trend
level the so called TFP gap (see Graph 2) captures
that part of the TFP slowdown which is of a purely
cyclical nature According to the theory behind the
TFP trend estimation methodology applied in DG
ECFIN the cyclical part of TFP should be closely
linked to capacity utilisation (CU) fluctuations in
Graph 2TFP levels and TFP gap
-12
-8
-4
0
4
8
12
16
20
24
28
32
36
40
94
96
98
100
102
104
106
108
110
112
00 01 02 03 04 05 06 07 08 09 10 11 12 13
EA17
TFP gap (rhs) TFP trend (lhs)
TFP (lhs) CU (rhs)
-12
-8
-4
0
4
8
12
16
20
24
28
32
36
40
94
96
98
100
102
104
106
108
110
112
00 01 02 03 04 05 06 07 08 09 10 11 12 13
EU28
TFP gap (rhs) TFP trend (lhs)
TFP (lhs) CU (rhs)
2000
2001
20022003
20042005
20062007
2008
2009
2010
2011
20122013
Rsup2 = 08527
-12
-10
-8
-6
-4
-2
0
2
4
6
-3 -2 -1 0 1 2 3
EA17
TFP gap
Cap
acit
y u
tili
sati
on
2000
2001
2002
2003
20042005
20062007
2008
2009
2010
2011
20122013
Rsup2 = 08652
-12
-10
-8
-6
-4
-2
0
2
4
6
-3 -2 -1 0 1 2 3
EU28
TFP gap
Cap
acit
y u
tili
sati
on
Graph 3Capacity utilisation (CU) versus TFP
(Continued on the next page)
EA and EU outlook
33
Box (continued)
the same period (3) Hence one test of the
effectiveness of the methodology is to check how
much of the observed widening of the gap is
explained by the reduction in capacity utilisation
during the crisis It can be calculated that capacity
utilisation explains about 81 of the observed
increase in the TFP gap in the EU28 (and above
95 in the EA17) (4) The very strong link between
the capacity utilisation indicator used in the
estimation and the TFP gap is illustrated in
Graph 3 Clearly the cyclical movements in TFP
across time are very well reflected in changes in the
utilisation of productive capacity by companies
The trend TFP growth rates for the individual EU
Member States for the historical 2000-07 and
2008-13 periods as well as the forecasts for
2014-15 are given in Table 1
Some factors correlating with TFP performances
of individual EU countries since the crisis
It is yet too early (and much beyond the scope of
this box) to investigate the impact on the future
TFP performance of the identified in the
introduction various mechanisms that are at work
during the crisis It is nonetheless interesting to
highlight two clear data regularities that seem to
have emerged during the crisis in the EU15
countries (5)
1 Graph 4 plots TFP trend growth rates
differentials (average TFP trend growth rate
in 2008-13 minus average TFP trend growth
rate in 2003-07) against tradable
(3) For the details of the methodology see DAuria F
C Denis K Havik K Mc Morrow C Planas R
Raciborski W Roumlger and A Rossi (2010) The
production function methodology for calculating
potential growth rates and output gaps ECFIN
Economic Papers No 420 (4) According to the methodology used for extracting
trend TFP for each country it must hold that
tfp-tfp_trend=tfp_gap=(1beta)timescapacity_utiliza-
tion+error where the estimated coefficient beta
measures the country-specific strength of the link
between the capacity utilisation and TFP gap From
the above identity it follows that for the method to
explain the data well it is required that the ratio of
(1beta)timescapacity_utilisation and the growth rate of
the TFP gap to be close to 100 which would be
consistent with a small estimation error The EU-
wide ratios are found by using a weighted average of
national betas (5) Unfortunately due to their extreme heterogeneity a
scatter plot analysis similar to that carried out for the
EU15 Member States was not possible for the new
Member States
Table 1
2000-07 2008-13 2014-15
Austria 12 05 04
Belgium 06 02 02
Bulgaria 22 07 08
Cyprus 06 -03 -04
Czech Republic 28 11 08
Germany 10 06 07
Denmark 07 13 06
Estonia 23 07 11
Greece 24 -08 -13
Spain 02 08 07
Finland 18 00 02
France 08 04 04
Croatia 11 -06 02
Hungary 19 02 03
Ireland 18 04 08
Italy 01 -01 0
Lithuania 37 15 16
Luxembourg 06 -13 -09
Latv ia 36 12 15
Malta 01 -01 02
Netherlands 11 01 00
Poland 25 12 11
Portugal 04 09 09
Romania 43 05 05
Sweden 18 06 08
Slovenia 17 04 03
Slovakia 33 24 21
UK 15 -01 01
EU-28 12 04 04
Trend TFP growth rates for Member States and EU
sector employment share differentials
between both periods (calculated
analogically) for 14 EU Member
States (6)
Two facts are worth emphasizing First
compared with the period before the crisis
the share of employed in the tradable sector
in total employed has dropped in all
considered countries which indicates closing
up of the EU economies during the crisis
Second countries in which this share has
fallen relatively less are also characterized by
relatively more benign dynamics of trend
TFP (the trend line on the graph has a slope
of 075 which is significant on the 5
confidence level the Rsup2 coefficient is 033)
(6) Tradable goods are goods produced in Agriculture
Forestry and Fishing (ISIC A-B) Industry (ISIC C-E)
and Trade Transport and Communication (ISIC G-I)
Greece was found to be a clear outlier and was
excluded from this and the following calculations
(Continued on the next page)
European Economic Forecast Winter 2014
34
Box (continued)
This is in line with the economic intuition
that sectors open to competition from abroad
will tend to be more efficient More
generally these findings support the
hypothesis that sectoral shifts currently taking
place in the EU and in particular shrinking of
the tradable sector in virtually all EU
Member States bear on the performance of
aggregate productivity
BE DE
DK
ES
FRIE
IT
LU
NLAT
PT
FI
SE
UK
-25
-20
-15
-10
-05
00
05
10
-5 -4 -3 -2 -1 0
TF
P
Employment share in tradable
Graph 4 TFP vs employment share in tradable
(growth differentials)
2 Graph 5 illustrates a close relationship
between TFP trend growth rate differentials
and total hours worked (7) A highly
significant negative slope and a very high
coefficient R2=056 suggest that TFP slowed
down less during the crisis in those Member
States in which hours worked fell more In so
far as hours worked losses are in a significant
part due to firms default this finding is in
line with the prediction that these are the less
efficient firms that are more likely to default
during the crisis and that the cleansing
process contributes to a more benign
dynamics of TFP trend during a crisis A
complementary explanation based on the
discipline device role of unemployment
hypothesis (eg Riggi 2012) (8) would posit
that employees tend to increase their effort at
work when the risk of becoming unemployed
increases
(7) Calculated as the average of log total hours worked in
2008-13 minus the average log total hours worked in
2003-07 (8) Riggi M (2012) Capital Destruction Jobless
Recoveries and the Discipline Device Role of
Unemployment Bank of Italy Temi di Discussione
(Working Paper) No 871
BEDE
DK
ES
FR
IE
IT
LU
NLAT
PT
FI
SE
UK
-25
-20
-15
-10
-05
00
05
10
-10 -5 0 5 10 15
TF
P
Total hours worked
Graph 5 TFP vs total hours worked (growth
differentials)
Concluding remarks
This box shows that at the EU level the effect of
the crisis on TFP has so far been relatively muted
with negative and positive effects broadly
balancing each other out This generally stable
performance at the EU level is not necessarily
replicated at the individual Member State level
with some countries seeing positive shifts in their
TFP trends over the crisis period whereas others
have experienced significant setbacks Among the
28 Member States there are only three countries
(Denmark Spain and Portugal) which have
managed to have a TFP growth rate over the period
2008-13 which was higher than in the pre-crisis
period but only Spain and Portugal are forecast to
sustain this good performance in 2014 and 2015
As the analysis on sectoral employment shares and
on hours worked in the EU15 Member States has
highlighted those countries which have managed
to shift resources out of relatively low productivity
sectors towards the tradables sector whilst at the
same time improving overall labour efficiency
appear to be emerging from the crisis in a much
healthier economic condition The cleansing
benefits of the crisis are particularly in evidence in
Spain and Portugal with their ongoing positive
TFP performances reflecting the fact that they have
wisely used the crisis to carry out essential
economic restructuring
EA and EU outlook
35
Box I3 The cyclical component of current-account balances
This box shows data on the cyclically-adjusted
current-account balances in the EU Member States
These data are particularly useful to the discussion
of the nature of the adjustment in the vulnerable
euro-area countries (Ireland Greece Spain
Cyprus Portugal and Slovenia) For these
countries a key policy question is whether the
current-account adjustment over the latest number
of years has been cyclical (ie transitory) or non-
cyclical (ie more permanent) If most of the
reduction in the current-account deficits were
cyclical then one would expect the large deficits to
reappear as soon as their economies recover and
output gaps close The available estimates suggest
that most of the adjustment in the euro-area
periphery has been non-cyclical Therefore one
should not expect the current-account deficits in
these countries to deteriorate over the foreseeable
future to levels any close to those observed before
the crisis (1)
The cycle output and demand
The business cycle consists of temporary
movements in output and demand The difference
between output and domestic demand constitutes
the trade balance which in turn is the most
important part of the current account In that sense
the cyclical component of the trade balance directly
follows from the cyclical components of changes in
output and domestic demand However the trade
balance is not only affected by the cyclical changes
in domestic aggregates but also by the cyclical
movements in foreign demand and output (2) In this
manner imports reflect the cyclical component of
domestic demand and foreign output In contrast
(1) For a similar assessment see Guillemette Y and D
Turner (2013) Policy Options to Durably Resolve
Euro Area Imbalances OECD Economics Department Working Paper 1035 Mersch Y (2013)
The Overhaul of the Architecture of the Euro Area
and the Return of Investor Confidence speech at the CFA Institute London and ECB Monthly Bulletin
(Jan 2014 47-50) For a somehow different
perspective see IMF World Economic Outlook (Oct 2013 45-8 and Ollivaud P and C Schwellnus
(2013) The Post-crisis Narrowing of International
ImbalancesndashCyclical or Durable OECD Economics Department Working Paper 1062
(2) The current account also adjusts in response to other
factors (such as interest rates or the terms of trade) that also reflect the cycle But usually the cyclical
component of the current account is estimated given
the response of real aggregates (supply and demand)
exports reflect (inter alia) cyclical effects in
domestic output and foreign demand
Table 1
( of GDP)
2007 2009 2011 2013 Δ07-13 2007 2009 2011 2013 Δ07-13
BE 39 07 05 01 -39 39 24 13 04 -34
BG -252 -90 01 20 273 -208 -83 00 28 237
CZ -51 -33 -35 -24 28 -20 -18 -30 -37 -18
DK 14 34 59 70 56 21 28 41 49 28
DE 75 61 63 70 -05 67 57 76 78 11
EE -157 40 03 -21 136 -65 00 31 21 86
IE -55 -23 12 70 125 -44 -32 14 85 129
EL -176 -144 -117 -23 153 -168 -141 -158 -72 96
ES -100 -48 -40 11 111 -100 -52 -56 -02 98
FR -14 -18 -25 -19 -06 -12 -16 -25 -23 -11
HR -69 -45 -11 08 77 -53 -40 -17 08 61
IT -13 -20 -31 09 22 -10 -21 -32 -01 09
CY -116 -107 -35 -17 99 -112 -90 -16 -14 99
LV -224 86 -23 -16 208 -141 34 -74 -01 140
LT -150 21 -39 01 151 -82 -24 -67 17 99
LU 101 73 66 64 -36 129 56 58 62 -67
HU -74 -01 06 29 103 -71 -15 -13 14 85
MT -40 -89 -10 17 57 -48 -66 05 42 90
NL 84 32 74 92 08 75 44 74 78 03
AT 40 27 15 29 -11 33 32 21 37 05
PL -61 -31 -45 -16 45 -61 -05 -35 -15 46
PT -102 -108 -72 04 106 -107 -107 -75 -08 99
RO -136 -42 -45 -10 126 -108 -25 -51 -04 103
SI -46 -04 02 49 95 -13 -11 -07 33 46
SK -56 -25 -26 20 77 01 -09 -38 01 00
FI 42 20 -15 -02 -44 53 08 -16 -16 -69
SE 86 69 62 62 -23 84 57 68 63 -21
UK -22 -14 -15 -38 -16 -20 -23 -27 -41 -21
Source European Commission estimates
Cycl-adj Current-account balanceCurrent-account balance
Current-account and cyclically-adjusted current-account balances
Table 1 displays the non-adjusted and the
cyclically-adjusted current-account balances (3)
which would prevail if both the country in question
and its trading partners closed their output gaps
Accounting for the cyclical component leads to a
higher surplus or smaller deficit in 2013 in the
economies whose output gap exceeds that of their
trading partners taking into account their external
openness For 2013 this is the case of Bulgaria
Germany Estonia Ireland Latvia Lithuania
Luxembourg Malta and a few others For the
countries for which their output gap is inferior to
the output gap of their trading partners the closing
of domestic and foreign output gaps would lead to
smaller surpluses or larger deficits this is notably
the case of the Czech Republic Denmark Greece
Spain Cyprus Hungary Netherlands Portugal
Slovakia and a few others
(3) These are estimates based on the methodology
described in Salto M and A Turrini (2010)
Comparing Alternative Methodologies for Real Exchange Rate Assessment European Economy-
Economic Papers 427 The assessment is based on the Commission estimates for output gaps (see Table
14 of the statistical annex) output gaps for trading
partners not available in AMECO are from the OECD Estimates on the basis of IMF data and
methodology (Phillips S et al (2013) The External
Balance Assessment (EBA) Methodology IMF Working Paper 13272) point to similar figures
(Continued on the next page)
European Economic Forecast Winter 2014
36
Box (continued)
Adjustment in vulnerable countries
In 2007-13 there has been a substantial adjustment
in the euro-area vulnerable Member States (4) On
average the current-account balances of Ireland
Greece Spain Cyprus Portugal and Slovenia
improved by more than 9 pps and Spain Ireland
Portugal and Slovenia now run surpluses This
adjustment is forecast to continue through 2015
(see Table 50 of the statistical annex) though with
differences among these countries
To discuss whether the adjustment of current-
account deficits in the euro-area periphery has been
cyclical or not raises two key questions (1) Has the
adjustment been rather due to a decline in domestic
demand (and by implication imports) ndash or to
changes in foreign demand (and thus exports and
output) (2) To what extent have these changes in
domestic demand output and foreign demand been
cyclical The data show that most of the
rebalancing in the vulnerable economies has been
due to a contraction in their domestic demand (and
thus imports) But much of this contraction has
been non-cyclical which may seem counter-
intuitive at first sight
The rebalancing of trade (and thus current-account)
balances in the vulnerable countries is reflected in
domestic demand declining faster than output
(Graph 1 illustrates this for Spain) Contracting
private investment particularly construction was
the main driver of this decline private consumption
has generally declined more than GDP and
contributed to raising saving rates (5) The counter-
cyclical increases in fiscal deficits initially slowed
the narrowing of current-account deficits in a
number of vulnerable countries but fiscal
consolidation has contributed to improving their
current-account balances since 2009-10
In several vulnerable euro-area countries
rebalancing and output also benefited from robust
(4) Here the reference year is 2007 is used since it was
the last year of the pre-crisis boom in global trade In
contrast 2008 figures are partly affected by the trade
slump in response to the crisis (5) This behaviour runs counter the textbook response to
a negative cyclical shock consumption smoothing
would entail a widening rather than a narrowing of the current-account deficit Instead the behaviour is
consistent with a structural break in potential GDP
(see for a discussion Aguiar M and G Gopinath (2007) Emerging Market Business Cycles The
Cycle Is the Trend Journal of Political Economy
115(1) 69-102)
exports despite sluggish world demand thanks to
gains in price and cost competitiveness (changes in
relative prices) and non-cost competitiveness
Relative price developments within and among
economies facilitate the necessary reallocation of
resources from non-tradable to tradable sectors In
all the vulnerable countries GDP deflators have
risen at a slower pace than export prices which in
turn rise slower than import prices reflecting those
relative changes in prices (6) This pattern is likely
to be maintained for some years with the terms of
trade therefore expected to support
competitiveness
850
900
950
1000
1050
04 05 06 07 08 09 10 11 12 13 14
Graph 1 Spain Output and Demand
Trade balance
Domestic demand
Output (GDP)
Source European Commission
Constant 2005 EUR mn
Graph 2 shows the sizeable contribution from real
export growth to current-account adjustment in
most vulnerable countries (7) Portugal Spain and
Ireland outperformed average real export growth in
the euro area in 2007-13 though their real exports
grew slightly less than Germanys In Greece and
Cyprus real exports did decline in 2007-13 (though
less than GDP thus leading to the positive
contribution to the changes in current account
depicted in the graph)
(6) See Labour Costs Pass-Through Profits and
Rebalancing in Vulnerable Member States Quarterly Report on the Euro Area (2013-3)19-25 Ongoing
Adjustment in the Euro Area Periphery box I1 in
the autumn 2012 forecasts and Labour Costs Margins and Prices in Rebalancing Economies box
I3 in the spring 2013 forecasts (7) The Graph is based on differentials with respect to
GDP growth Ie exports growing faster (or
declining more slowly) than GDP contribute
positively to the change in the current-account balance (in of GDP) Likewise imports
contracting faster than GDP result into a positive
contribution
(Continued on the next page)
EA and EU outlook
37
Box (continued)
In contrast to exports the vulnerable countries
imports have differed markedly from the patterns
observed in the core euro-area countries as well as
from their pre-crisis trends (8) In the vulnerable
countries real imports receded strongly in 2007-13
which resulted in the positive contribution visible
in Graph 2 (9) A combined reading thus implies
that the slump in domestic demand and imports
dominates the adjustment in the vulnerable
economies (10) though some of them also benefitted
from improved export performance
-15
-10
-5
0
5
10
15
20
25
LV EL EE IE ES PT CY SI SK MT IT NL DE FR AT LU BE FI
Ch
ange
CA
GD
P 2
00
7 to C
AG
DP
20
13
Graph 2 Euro-area Member States contributions to
current-account adjustment 2007-13
Real exports contribution
Real imports contribution
Terms of trade impact
Income and transfers balance contribution
CAGDP change 2007-13 pp of GDP
Source European Commission
pps
Non-cyclical is not the same as good news
While much of the current-account adjustment has
been induced by domestic demand contractions the
question is how much of this stems from cyclical
factors knowing that demand changes are typically
associated with cyclical fluctuations This may
have led some observers to conclude that the
current adjustment has been largely cyclical
During most business cycles domestic demand
fluctuates more than output thus generating
(8) See also Kang and Shambaugh (2013) The
Evolution of Current Account Deficits in the Euro
Area Periphery and the Baltics Many Paths to the
Same Endpoint IMF Working Papers 13169 (9) In Spain for instance real exports growth slowed
from cumulated +29 over 2001-07 to +14 during
2007-13 (compare with +36 and +9 in the euro area) In contrast the Spanish real import growth of
+55 during 2001-07 was followed by a decline
of -21 during 2007-13 (compare with +36 and +2 in the euro area)
(10) Note that a certain part of imported intermediate
goods and services serves just to sustain exports
(This import content of exports varies between 22
for Spain and 43 in Ireland) In that sense the
decline in imports hides an even stronger impact coming from the contraction in domestic final
demand
cyclical movements in current-account balances
However the boom years before 2007 saw not only
inflated domestic demand in the euro-area
periphery potential output also swelled (in
particular in the construction sector) due to overly
optimistic expectations resting on abundant credit
and soaring asset prices Arguably the correction
of these growth expectations driven by the
reassessment of risk premia is permanent The large
domestic demand declines during the crisis have
been mirrored in a significant slowdown of
potential output Consequently the output gap
measured against the estimated potential output is
much smaller than the gap against the pre-crisis
growth trend Moreover the output gap
developments in the vulnerable countries do not
differ much from their trading partners ndash but their
current-account balances do For example in
Ireland and Portugal output gaps dropped between
5 and 5frac12 pps in 2007-13 which is as much or
even less than in economies with milder gyrations
of macroeconomic aggregates such as France the
Netherlands or Denmark Hence current-account
adjustment in most vulnerable countries appears
largely non-cyclical because it is associated mainly
with the deceleration in their potential output
Graph 3 illustrates this for Spain where the
deviation of actual GDP from its pre-crisis trend
has been much more substantial than the decline
from the 2007 peak Moreover only part of the
growth gap between Spain and its partners is due to
output gap differentials Instead most of this
growth divergence is due to the relative changes in
potential GDP The rebalancing thus owes a lot to
the contraction in domestic demand which in turn
reflects a structural break in potential output (11)
Outlook
Once domestic output reaches or exceeds potential
again the ensuing demand will lead to a cyclical
worsening of current-account balances This could
be particularly strong if output in these countries
recovers faster than in their main partners For
(11) Greece has in this respect been an exception Much
more of its output decline is currently attributed to cyclical factors Its output gap declined from +3frac14
of GDP in 2007 to -12frac34 2013 a number that
exceeds the euro-area output gap by almost 10 pps As a result much more of its adjustment is estimated
to be due to cyclical factors This shows that
conclusions on the cyclical and non-cyclical nature of
rebalancing crucially hinge on the correctness of
output gap estimates
(Continued on the next page)
European Economic Forecast Winter 2014
38
Box (continued)
instance the output gap in Ireland already closed
vis-agrave-vis its partners thus inducing a current-
account balance that is slightly below its surplus in
cyclically-adjusted terms However such cyclical
worsening is unlikely to bring current-account
balances to the pre-crisis levels any time soon
90
95
100
105
110
115
120
125
99 00 01 02 03 04 05 06 07 08 09 10 11 12 13TP (42) real GDP TP (42) potential GDP
ES real GDP ES potential GDP
ES pre-crisis trend GDPSource European Commission estimates
Graph 3Potential output Spain (ES) and trade partners (TP)
index 2004=100
The boom-and-crisis has left the euro-area
periphery with a large stock of outstanding external
debt Among the vulnerable Member States the
current-account adjustment is only now stabilising
their negative international investment position and
external debt with respect to GDP But the debt
stocks continue to constrain the borrowing capacity
and demand prospects of the private and public
sectors in these economies A return of large
current-account deficits is thus unlikely as it would
further rack up external debt Instead the
vulnerable economies may require current-account
surpluses over the medium term to bring down
external indebtedness to sounder levels The
required extent of such surpluses in turn depends
on the countries growth prospects
The question is thus not whether deficits reappear
but whether the surpluses will be sustained by
permanently compressed imports and demand or
by expanding exports and output This in turn will
depend on the reforms in these countries as well as
the behaviour of domestic demand in trading
partners in the euro area and beyond In view of
deleveraging pressures on domestic demand
exports and export-oriented investment are the
demand components with scope to underpin a
resumption of potential growth and employment in
the medium run However an export-led recovery
requires further reallocation of labour and capital in
the structural composition of the economy
Structural reforms that facilitate such re-orientation
and changes in relative prices will boost potential
output and export capacity ndash and thus relieve the
pressure on imports to offset negative income
balances (12)
(12) See The Euro Areas Growth Prospects over the
Coming Decade and The Growth Impact of Structural Reforms Quarterly Report on the Euro
Area 2013 (4) 7-16 and 17-27
EA and EU outlook
39
Box I4 Analysing current disinflationary trends in the euro area
Annual HICP inflation in the euro area has been
trending downwards since end-2011 averaging
25 in 2012 and 14 in 2013 A gradual decline
in euro-area inflation had been widely expected
given the fall in commodity prices in recent years
and the amount of slack in the euro-area economy
Particularly the fourth-quarter figures of 2013
however surprised on the downside with annual
HICP inflation falling to 08 Similar tendencies
have been observed outside the euro area as
reflected by a broad decline in global headline
inflation since mid-2011
This box sheds light on the driving forces behind
the current disinflation in the euro area and inquires
whether it appears to be a temporary or a more
persistent phenomenon The analysis briefly
touches upon the fading away of temporary factors
before focusing on cyclical and structural elements
Temporary factors are fading awayhellip
Part of the recent drop in euro area inflation has
been due to the fading away of temporary factors
namely the increases in indirect taxes and
administered prices (linked to fiscal consolidation
needs in many Member States) and the pass-
through from past commodity-price hikes (oil and
unprocessed food in particular) In the fourth
quarter of 2013 core inflation defined as all-item
HICP inflation excluding energy and unprocessed
food decreased markedly to 1 (from 13 in the
three previous quarters) Notably the impact of tax
hikes was smaller than during the rest of the year
(01 pp compared to an average of 04 pp in
2013)1 and so was the contribution of administered
prices (which in 2013 declined to its long-term
average of 03 pp after being substantially above
in 2011-12) HICP inflation adjusted for tax
changes stood at 1 throughout 2013 having
dropped through 2012 (1) (see Graph 1 and
Section I6 of the main text)
hellip while cyclical and structural factors related to
the ongoing price adjustment in the euro area
are at work
The abatement of temporary factors however is
not the only driving force behind the current
disinflation in the euro area Cyclical and structural
factors related to the fragile recovery and the
(1) Constant-tax inflation rates assume a full and
immediate pass-through of tax changes to prices and
could hence be seen as an upper bound to the actual
impact of tax changes
ongoing relative price adjustment in the euro area
also are at play
Unit labour costs can explain much of the cyclical
pattern of underlying inflation as measured by the
GDP deflator (see Graph 2) Annual growth in unit
labour costs decreased further to 10 in the third
quarter of 2013 from 21 in the third quarter of
2012 Taking the typical pattern of previous
recoveries as a guide the slow pace of cost-push
inflation stemming from unit labour costs can be
expected to continue over the next few quarters In
the initial stages of a recovery productivity
typically tends to increase while wages pick up
only later As productivity growth is currently still
very low there is much room for productivity
increases Only after some quarters employment is
likely to become a more significant driver of
growth thus curbing productivity growth Together
with a rise in labour compensation (from 16 in
the third quarter 2013) this would push up unit
labour costs This cyclical perspective points to
subdued price pressures in the pipeline but also to
their temporary nature (2)
Apart from its cyclical behaviour the disinflation
in the more vulnerable Member States might be
influenced by structural shifts that could amplify its
magnitude Indeed the relative decline in inflation
rates in these countries (see Graph 3) coincides
with substantial structural reform efforts that
(2) As prices reflect not only labour costs but also profit
margins price pressures will also be influenced by
the outlook for the latter Measured as the gross
operating surplus profit margins fell in the euro area
in 2012 (-08) but increased in 2013 (+05 in the
first two quarters) With the economic recovery
continuing to take shape a gradually higher
contribution of corporate margins to price changes
can be expected
(Continued on the next page)
European Economic Forecast Winter 2014
40
Box (continued)
explicitly targeted nominal rigidities in prices and
wages (3)
At the same time the current disinflation in the
euro area may be related to an increasing impact of
the output gap on inflation Empirical evidence
suggests that the Phillips curve which describes the
relation between the output gap and inflation had
flattened over the last two decades Various
measures of inflation had become less sensitive to
the slack in the economy (4) In recent years
however the output gap elasticity of inflation
appears to have increased again This could
possibly mirror non-linearity ie inflation might
only react significantly to the output gap if it is
large and persistent Alternatively the steepening
(3) It seems however too early to draw clear
conclusions about the precise impact of these
structural reforms on price and wage dynamics (4) See IMF (2013) The dog that didnt bark Has
inflation been muzzled or was it just sleeping IMF
World Economic Outlook Chapter 3 April and
Acedo-Montoya L B Doehring (2011) The
improbable renaissance of the Phillips curve The
crisis and euro area inflation dynamics European
Commission Economic Papers No 446 October
of the Phillips curve could be the result of the
elements described above such as enhanced wage
flexibility or its previous disguise by temporary
factors like hikes in indirect taxes (5) The recent
steepening of the curve has however not
completely reversed the long-term flattening trend
A simple framework based on a New Keynesian
Phillips curve with time-varying parameters of
euro-area inflation at the aggregate level offers
useful insights (6) The estimates use quarterly data
on exchange-rate-adjusted oil prices the output
gap past inflation and inflation expectations based
on inflation swaps (7)
The estimation results suggest that the output gap
plays a more important role in accounting for
inflation developments than before the crisis
During the past two years the inflation elasticity of
the output gap appears to have surged particularly
in vulnerable Member States arguably due to
structural reforms (8) The assumption that the
output gap will continue to close only slowly points
to a continuing drag of weak demand on inflation
but does not necessarily add further disinflationary
momentum
The Phillips-curve estimates also suggest a
gradually increasing role of inflation expectations
in explaining price developments Market-based
euro-area inflation expectations (see Graph 4)
derived from swap rates have been trending
downwards at all maturities since spring 2011
Taken at face value the spot rates of inflation-
linked swaps observed in January 2014 imply an
average annual inflation rate of 11 over 2014-16
Regarding the medium-term outlook inflation
expectations derived from inflation-linked swap
rates at the three-years-forward-three-years-ahead
horizon imply an average inflation rate of 17 in
2017-19 At the same time five-year inflation-
linked swap rates five years ahead the most widely
(5) Oinonen S M Paloviita and L Vilmi (2013) How
have inflation dynamics changed over time
Evidence from the euro area and the US Bank of
Finland Research Discussion Paper 62013 (6) The Phillips curve
ttttttt
BL
ttt
FL
tt oilegapE )ln(11 is
estimated by using state-space methods that apply the
Kalman filter and allow parameters to vary over time
Parameters are assumed to follow random walk
processes with uncorrelated and normally distributed
error terms (7) The output gap is based on the European
Commissions production function approach (8) While tax increases in vulnerable Member States may
also contribute to the explanation the timing of their
fading out is different from the timing of the rise of
the inflation elasticity of the output gap
(Continued on the next page)
EA and EU outlook
41
Box (continued)
used measure of long-term inflation expectations
have been broadly stable at slightly above 2 (all
January 2014 averages)
Market-based indicators hence suggest that in the
short- to medium-term markets expect inflation in
the euro area to remain well below 2 and to only
slowly return to that level over time At the same
time long-term inflation expectations remain well-
anchored on the back of high central bank
credibility Yet as the Japanese experience with a
long-lasting period of mostly mild deflation since
the mid-1990s shows long-term inflation
expectations do not necessarily provide full
assurance on future inflation developments Most
available measures suggest that long-term inflation
expectations in Japan (six to ten years ahead)
declined only gradually in the early 1990s and
remained positive throughout the last two decades
despite a prolonged period of negative or very low
inflation In contrast to the euro area however
long-term inflation expectations did not appear
well-anchored in Japan reflecting inter alia the
absence of a quantitative inflation target at the
time
Deflation risks low
On the basis of the above considerations the
baseline scenario is one of a protracted period of
low inflation in the quarters ahead Only a muted
increase in inflation is expected within the forecast
horizon in line with the ongoing recovery
For a scenario of outright euro-area-wide deflation
ie the emergence of a broad-based and self-
sustaining downward trend in the price level to
materialise a strong shock to the forecast
assumptions would be required driving underlying
inflation in the euro-area core to unprecedented
near-zero levels At the same time in the context of
continuing disinflationary pressures in many
Member States and the current downward trend in
commodity prices the sensitivity of the inflation
outlook to shocks appears to have increased Low
core inflation and sizeable output gaps as well as a
reduction in nominal rigidities in some Member
States may well have reduced some of the
downward stickiness that inflation in the euro area
experienced at low levels in the past
Even in the absence of outright deflation an
inflation rate persistently below the ECBs
definition of price stability over the medium term
defined as a year-on-year increase in the HICP for
the euro area of below but close to 2 would
not be without risks for the Member States at the
lower range of the inflation dispersion A
protracted period of very low inflation increases the
real value of both public and private debt and
results in higher real interest rates making the
ongoing internal adjustment in a number of
Member States more difficult and the deleveraging
process more challenging (9)
(9) See for instance King M (1994)rdquoDebt-Deflation
Theory and Evidencerdquo European Economic Review
Vol 38(3-4) pp 419-45
European Economic Forecast Winter 2014
42
Box I5 Some technical elements behind the forecast
The cut-off date for taking new information into
account in this European Economic Forecast was
17 February The forecast incorporates validated
public finance data as published in Eurostats News
Release 1522013 of 21 October 2013
External assumptions
This forecast is based on a set of external
assumptions reflecting market expectations at the
time of the forecast To shield the assumptions
from possible volatility during any given trading
day averages from a 10-day reference period
(between 31 January and 13 February) were used
for exchange and interest rates and for oil prices
Exchange and interest rates
The technical assumption as regards exchange rates
was standardised using fixed nominal exchange
rates for all currencies This technical assumption
leads to an implied average USDEUR rate of 136
in 2014 and 2015 The average JPYEUR rates are
13858 in 2014 and 13831 in 2015
Interest-rate assumptions are market-based
Short-term interest rates for the euro area are
derived from futures contracts Long-term interest
rates for the euro area as well as short- and
long-term interest rates for other Member States are
calculated using implicit forward swap rates
corrected for the current spread between the
interest rate and swap rate In cases where no
market instrument is available the fixed spread
vis-agrave-vis the euro-area interest rate is taken for both
short- and long-term rates As a result short-term
interest rates are assumed to be 03 on average in
2014 and 04 in 2015 in the euro area Long-term
euro-area interest rates are assumed to be 18 on
average in 2014 and 21 in 2015
Commodity prices
Commodity price assumptions are also as far as
possible based on market conditions According to
futures markets prices for Brent oil are projected to
be on average 1041 USDbbl in 2014 and
996 USDbbl in 2015 This would correspond to an
oil price of 765 EURbbl in 2014 and
732 EURbbl in 2015
Budgetary data
Data up to 2012 are based on data notified by
Member States to the European Commission on
1 October and validated by Eurostat on 21 October
2013
Eurostat has expressed its reservation on the quality
of the data reported by Austria due to uncertainties
on the statistical impact of the conclusions of the
Federal Audit Offices report on the Land Salzburg
published on 9 October 2013 The report revealed
deficiencies with regard to financial management
and to completeness of the public accounts of the
Land Salzburg The statistical implications of the
audit for EDP data are being investigated by
Statistics Austria in collaboration with Eurostat in
order to clarify the precise impacts on 2012 and
also on preceding years It is possible that this will
lead to an upward revision of government debt of
up to half a percent of GDP with more minor
revisions to the government deficit based on the
information available at the time of the validation
For the forecast measures in support of financial
stability have been recorded in line with the
Eurostat Decision of 15 July 2009 (1) Unless
reported otherwise by the Member State concerned
capital injections known in sufficient detail have
been included in the forecast as financial
transactions ie increasing the debt but not the
deficit State guarantees on bank liabilities and
deposits are not included as government
expenditure unless there is evidence that they have
been called on at the time the forecast was
finalised Note however that loans granted to
banks by the government or by other entities
classified in the government sector usually add to
government debt
For 2014 budgets adopted or presented to national
parliaments and all other measures known in
sufficient detail are taken into consideration In
particular all the information included in the Draft
Budgetary Plans submitted by 15 October is
reflected in this forecast For 2015 the no-policy-
change assumption used in the forecasts implies
the extrapolation of revenue and expenditure trends
and the inclusion of measures that are known in
sufficient detail
The general government balances that are relevant
for the Excessive Deficit Procedure may be slightly
different from those published in the national
accounts The difference concerns settlements
under swaps and forward rate agreements (FRA)
(1)
Eurostat News Release Ndeg 1032009
(Continued on the next page)
EA and EU outlook
43
Box (continued)
According to ESA95 (amended by regulation No
25582001) swap- and FRA-related flows are
financial transactions and therefore excluded from
the calculation of the government balance
However for the purposes of the excessive deficit
procedure such flows are recorded as net interest
expenditure European aggregates for general
government debt in the forecast years 2013-15 are
published on a non-consolidated basis (ie not
corrected for intergovernmental loans) To ensure
consistency in the time series historical data are
also published on the same basis For 2012 this
implies a debt-to-GDP ratio in the euro area which
is 21 pp (15 pp in the EU) higher than the
consolidated general government debt ratio
published by Eurostat in its news release 1522013
of 21 October 2013 General government debt
projections for individual Member States in
2013-15 include the impact of guarantees to the
EFSF (2) bilateral loans to other Member States
(2)
In line with the Eurostat decision of 27 January 2011
on the statistical recording of operations undertaken by the European Financial Stability Facility available at
httpeppeurostateceuropaeucacheITY_PUBLIC2-27012011-APEN2-27012011-AP-ENPDF
and the participation in the capital of the ESM as
planned on the cut-off date of the forecast (subject
to approval)
Calendar effects on GDP growth and output
gaps
The number of working days may differ from one
year to another The Commissions annual GDP
forecasts are not adjusted for the number of
working days but quarterly forecasts are
However the working-day effect in the EU and the
euro area is estimated to be limited over the
forecast horizon implying that adjusted and
unadjusted growth rates differ only marginally (by
up to plusmn01 pp) The calculation of potential growth
and the output gap does not adjust for working
days Since the working-day effect is considered as
temporary it should not affect the cyclically -
adjusted balances
PART II Prospects by individual economy
Member States
1 BELGIUM Growth expectations up inflation down
48
With the noteworthy exception of the construction
sector confidence indices have been improving in
recent quarters and have reached the highest level
since the summer of 2011 This soft indicator trend
has been confirmed by recent hard data and points
to a continuation of the positive performance in
upcoming quarters
More robust than anticipated private consumption
in the second half of 2013 provides 2014 with
substantial carry-over Household spending is
expected to accelerate further towards the end of
the year in parallel with labour market prospects
More solid income growth is forecast to underpin
consumer spending in 2015
-3
-2
-1
0
1
2
3
4
01 02 03 04 05 06 07 08 09 10 11 12 13 14 15
pps
Graph II11 Belgium - Real GDP growth and contributions
Inventories Net exports
Dom demand excl invent Real GDP (y-o-y)
forecast
After falling by 25 in 2013 due to a weak start
capital formation is expected to continue its recent
recovery led by company investments Industrial
production has been pointing to a modest
turnaround while the industrys capacity utilisation
is close to the long-term average Inversely
construction is still sluggish at best with
confidence at the lowest level in over 15 years and
both order books and expected employment weak
A real pick-up in activity is only expected for
2015 This reflects depressed housing investments
as well as a cyclical correction in public
investment following the 2012 local elections
Net exports are expected to have contributed
07 pp to overall growth in 2013 This year export
growth is projected to outpace import growth
helped by modest gains in competitiveness With
domestic demand strengthening over the forecast
horizon import growth is forecast to accelerate as
well As a consequence net trade would become a
negative contributor in 2015
The pace of the recovery in Belgium remains
closely linked to developments in the euro area
The main domestic downside risk would be tighter
credit conditions resulting in more subdued
investment growth
Unhurried labour market turnaround inflation
set to remain moderate over forecast horizon
Despite an apparent stabilisation towards the end
of last year unemployment is set to rise further
from an average of 84 in 2013 to 85 in 2014
as job creation is projected to feature a
considerable lag to the economic cycle after a
prolonged period of sluggish activity Somewhat
stronger employment growth is projected to push
back unemployment to 82 in 2015 a level still
high from an historic perspective
Meanwhile price pressures have been retreating
and a further decrease is expected in upcoming
quarters This reflects the generally low
inflationary environment as well as specific
Belgian elements in particular the lowering of the
VAT rate on electricity consumption by
households as of April next With low price
pressures delaying wage indexation for most
workers and real wages frozen nominal wage
growth is set to be confined In combination with a
pick-up in productivity this leads to unit labour
costs growing much slower than has been the case
in recent years
Broadly flat public finance outlook
The general government deficit is estimated to
have reached 27 of GDP in 2013 01 pp lower
than expected in the autumn forecast The
improvement stems from higher than expected
economic growth in the last quarter as well as
from positive revenue surprises from a fiscal
Rising net exports and household consumption helped the Belgian economy to end 2013 on a positive
note GDP rose by 04 in the final quarter bringing the annual rate to 02 and ending two years of
stagnation GDP growth is expected to reach 14 in 2014 before rising to 17 in 2015 Despite an
improving economy government deficit levels are expected to remain broadly unchanged
Member States Belgium
49
amnesty and from taxation of financial assets The
structural balance is expected to have improved by
around frac34 of GDP in 2013 while one-off factors
(such as the fiscal amnesty and the sale of telecom
licences) amount to around frac12 of GDP
In 2014 the deficit is expected to decline slightly
further to 26 of GDP Expenditure growth is
modest due to the low inflation environment as
well as measures taken in health care and
reductions in administrative spending Tax
revenues are boosted by the improving economic
environment and by consolidation measures in the
2014 budget such as the introduction of VAT on
services from lawyers an increase in excise duties
and a minimum corporate income tax The fiscal
amnesty is expected to yield additional one-off
revenues in 2014 although lower than in 2013 On
the other hand a reduction in the VAT rate on
electricity will weigh on indirect tax revenues In
2014 the overall deficit impact of this measure is
broadly neutral due to its inflation-reducing
impact which will postpone the automatic
indexation of public wages and social benefits
until the beginning of 2015 In that year the net
budgetary cost of the measure will be above 01
of GDP Since the autumn forecast the
government also agreed on a reduction of social
security charges of 01 of GDP in 2015 Overall
the deficit is expected to remain broadly stable in
2015 under the usual no-policy-change
assumption despite the projected strengthening of
economic growth
The structural improvement of the budget balance
is projected at around frac14 of GDP in 2014 to then
deteriorate again by frac12 of GDP in 2015 due to
the impact of the above-mentioned government
measures and the autonomously rising trend in
social expenditure
General government debt is estimated to have
reached 998 of GDP in 2013 The positive
impact of the reimbursement of a loan by KBC
(05 of GDP) and the sale of government assets
(13 of GDP) is partly offset by negative stock-
flow adjustments such as the contribution to the
EFSFESM (07 of GDP) The debt ratio is
forecast to rise again in 2014 to just above 100
of GDP mostly due to stock-flow adjustments
(EFSFESM) and to start declining in 2015
bn EUR Curr prices GDP 94-09 2010 2011 2012 2013 2014 2015
3759 1000 20 23 18 -01 02 14 17
1989 529 17 28 02 -03 06 15 19
938 250 18 06 07 14 06 05 14
765 204 22 -11 41 -20 -25 17 32
282 75 29 -109 48 -32 -17 32 55
3237 861 39 81 64 18 19 36 47
3196 850 38 75 68 13 12 32 52
3769 1003 19 48 10 -08 01 13 17
17 14 11 -02 00 13 20
00 03 08 -04 -05 -02 00
02 06 -02 04 07 04 -03
09 07 14 02 -03 03 08
83 83 72 76 84 85 82
26 14 31 34 23 06 19
16 -03 27 37 18 -05 10
-01 -23 07 18 05 -18 -06
173 152 141 152 149 146 143
17 21 20 19 13 14 16
19 23 34 26 12 09 14
-05 -21 -21 02 -03 04 00
26 -08 -16 -15 -14 -11 -16
41 26 05 -02 01 06 03
39 25 03 -03 03 07 04
-16 -37 -37 -40 -27 -26 -27
-19 -33 -35 -32 -17 -20 -25
- -33 -33 -29 -22 -20 -25
1063 957 980 998 998 1005 1000
Net lending (+) or borrowing (-) vis-a-vis ROW (c)
(a) Eurostat definition (b) gross saving divided by gross disposable income (c) as a percentage of GDP
Cyclically-adjusted budget balance (c)
Real unit labour cost
Imports (goods and services)
General government balance (c)
Unit labour costs whole economy
Inventories
Terms of trade goods
Table II11
Net exports
Public Consumption
Trade balance (c)
Employment
Annual percentage change2012
GDP
Private Consumption
Exports (goods and services)
GNI (GDP deflator)
Structural budget balance (c)
Saving rate of households (b)
Main features of country forecast - BELGIUM
Unemployment rate (a)
Gross fixed capital formation
Current-account balance (c)
Contribution to GDP growth
General government gross debt (c)
GDP deflator
Compensation of employees head
of which equipment
Domestic demand
Harmonised index of consumer prices
2 BULGARIA Economic growth resuming but labour market still weak
50
Growth broadens
Preliminary GDP data for 2013 indicates a slight
pick-up in growth in the second half of the year
Growth was driven by net exports and a surge in
public expenditure whereas household
consumption contracted Annual growth is
projected to have reached 06 in 2013 This
remains well below the estimated potential growth
rate of the economy
Going forward the economic recovery is expected
to be more broad-based with domestic demand
forecast to reinforce the export-driven growth
momentum GDP growth is forecast to reach 17
in 2014 and 2 in 2015 The recovery is expected
to be slow compared to many other converging
economies as a significant population decline (due
to ageing and emigration) continues to erode the
growth potential
Domestic demand poised for a rebound
Even though the purchasing power of households
has been buoyed by growth in wages in a low
inflation environment and by a discretionary
pensions hike of over 9 in April 2013
households have so far remained cautious in
spending However consumer confidence appears
to be gradually firming as indicated by recent
surveys Also retail trade recorded strong growth
over the second half of 2013 which suggests an
imminent recovery in household consumption
Household consumption is therefore forecast to
rebound over 2014-15
The recovery in private investment is forecast to be
gradual given that the rebound in economic
activity is expected to be modest However
investment is supported by the relatively strong
financial sector which has been capable of
upholding credit to the private sector over the
crisis years Also both deposit and lending interest
rates have continued on a downward trend
implying an improvement in lending conditions
and credit availability
Exports to remain buoyant
Exports are forecast to remain relatively strong
also over 2014-15 upheld by an economic
recovery in the EU Nevertheless the rebound in
domestic consumption and investment would also
drive up imports and turn the growth contribution
from net exports slightly negative The current
account surplus is forecast to have reached about
2 of GDP in 2013 but is projected to diminish to
close-to-balance by 2015
Risks are broadly balanced
Risks to this macroeconomic forecast seem
broadly balanced The most significant downside
risk is related to the expected recovery in
household consumption which could prove
weaker than expected given that the Bulgarian
labour market and household sentiment are still
fragile However as observed over the recent
years in periods of weaker domestic demand the
Bulgarian economy has been able to partly
compensate this with higher net exports
-6
-4
-2
0
2
4
6
8
08 09 10 11 12 13 14 15
pps
Graph II21 Bulgaria - Real GDP growth inflation and
employment growth
Employment growth (y-o-y)
Real GDP (y-o-y)
HICP
forecast
The labour market remains in distress
After four consecutive years of falling
employment labour market statistics indicate first
signs of stabilisation since the second half of 2013
This is mainly thanks to the traditionally volatile
agricultural sector which benefited from a good
The economic recovery in Bulgaria is expected to broaden in 2014 and 2015 as domestic demand
gradually joins exports as the main engine of growth But with growth expected to be modest the labour
market will likely remain weak After a fiscal stimulus in 2013 fiscal policy is forecast to turn broadly
neutral this year and next
Member States Bulgaria
51
harvest in 2013 While employment in service
sectors appears also stabilising manufacturing and
construction sectors continue to shed labour
Going forward the labour market is projected to
improve only gradually since notable labour
market mismatches have built up over the
extended crisis years Unemployment is expected
to have peaked at almost 13 of the labour force
in 2013 and decline slowly to about 12 by 2015
Sharply decelerating inflation in 2013
Average inflation amounted to only 04 in 2013
Inflation fell sharply over 2013 turning even
negative in the second half of the year driven by
falling import prices decreases in the
administratively-set energy prices and the good
harvest that led to lower food prices As the base
effects from these factors fade inflation is forecast
to rebound in the second half of 2014
Nevertheless inflationary pressures are expected
to remain low also in 2014 with average annual
inflation projected to reach 05 Inflation is
forecast to accelerate in 2015 to 18 in line with
the projected recovery in domestic demand and the
ongoing convergence of prices towards the EU
average
Fiscal expansion in 2013 turning broadly
neutral thereafter
Following three years of consolidation the general
government deficit is estimated to have increased
from 08 of GDP in 2012 to 19 of GDP in
2013 This was due to a combination of a soft
patch in economic recovery and additional
spending for social expenditure (including the
increase in pensions) and various current
expenditure items The general government deficit
is set to remain unchanged at 19 of GDP in
2014 and slightly decline to 17 in 2015 In
structural terms the deficit is estimated to
deteriorate by 1 pp of GDP in 2013 but remain
broadly stable in 2014 and 2015 This reflects the
expansionary fiscal stance in 2013 and a broadly
neutral one in 2014-15 The general government
gross debt is forecast to increase from 185 in
2012 to about 24 of GDP in 2015
bn BGN Curr prices GDP 94-09 2010 2011 2012 2013 2014 2015
776 1000 29 04 18 08 06 17 20
499 643 32 01 15 26 -04 14 17
121 155 -09 19 16 -14 31 22 23
166 214 - -183 -65 08 17 24 42
77 99 - -112 245 90 48 26 51
517 666 - 147 123 -04 82 56 64
546 703 - 24 88 37 50 55 68
758 977 - 06 04 19 09 14 17
- -49 -03 16 06 17 23
- -03 03 19 -19 00 00
- 56 18 -27 19 00 -03
- -39 -22 -25 -02 02 04
- 103 113 123 129 127 121
- 99 68 29 44 35 36
- 52 25 -05 36 19 19
- 24 -22 -26 14 10 00
- - - - - - -
365 28 49 22 22 09 20
- 30 34 24 04 05 18
- 23 18 -03 14 -04 -02
-102 -77 -56 -91 -61 -65 -72
-72 -04 01 -13 20 13 00
-72 03 13 00 33 27 13
-13 -31 -20 -08 -19 -19 -17
- -23 -15 -03 -13 -14 -12
- -22 -15 -03 -13 -14 -12
- 162 163 185 194 227 241
Net lending (+) or borrowing (-) vis-a-vis ROW (c)
(a) Eurostat definition (b) gross saving divided by gross disposable income (c) as a percentage of GDP
Cyclically-adjusted budget balance (c)
Real unit labour cost
Imports (goods and services)
General government balance (c)
Unit labour costs whole economy
Inventories
Terms of trade goods
Table II21
Net exports
Public Consumption
Trade balance (c)
Employment
Annual percentage change2012
GDP
Private Consumption
Exports (goods and services)
Note Contributions to GDP growth may not add up due to statistical discrepancies
GNI (GDP deflator)
Structural budget balance (c)
Saving rate of households (b)
Main features of country forecast - BULGARIA
Unemployment rate (a)
Gross fixed capital formation
Current-account balance (c)
Contribution to GDP growth
General government gross debt (c)
GDP deflator
Compensation of employees head
of which equipment
Domestic demand
Harmonised index of consumer prices
3 THE CZECH REPUBLIC Economic activity to strengthen in 2014
52
The recovery is firming up
In the third quarter of 2013 real GDP expanded at
a modest pace of 02 confirming the recovery
that had started in the second quarter A significant
weakening of the koruna in November 2013 is
expected to have propped up domestic demand
growth in the fourth quarter of 2013 as in
particular investment purchases were advanced in
response to expectations of increased prices
According to the flash release of 14 February by
the Czech Statistical Office real GDP grew by
16 in the fourth quarter Economic activity
supported by a brightening outlook for the global
economy is expected to continue improving in the
following quarters
-6
-3
0
3
6
08 09 10 11 12 13 14 15
pps
Graph II31 Czech Republic - Real GDP growth and
contributions
Inventories Net exports
Dom demand excl invent Real GDP (y-o-y)
forecast
Exports to drive growth in 2014
While signs confirming the inversion in the cycle
have already been discernible in high-frequency
indicators for a few months value added growth in
manufacturing and other industry still remains
subdued Looking ahead industrial production is
forecast to pick up in 2014 benefitting from
further improvement in confidence a sustained
inflow of new orders and restored profit margins
On the back of the weakened koruna and a gradual
acceleration in economic growth of its main EU
trading partners export-oriented sectors are
expected to be the main drivers of growth in 2014
Lingering effects from the crisis are likely to
persist in construction but declining unit labour
cost in this sector is expected to buttress its
recovery
while domestic demand is set to strengthen
appreciably in 2015
Household consumption is firming but it is
expected to grow somewhat less dynamically than
envisaged in the autumn in view of still weak
growth in real disposable income Stabilisation of
labour market conditions in 2014 and moderate
improvement over the forecast horizon will be a
supportive factor but the projected fall in the
population of working age is set to become a
permanent drag on employment growth In a
context of spare production capacities and limited
credit growth which only very recently started
picking up the contribution of gross fixed capital
formation to GDP growth is expected to remain
subdued in 2014
Looking further ahead growth is expected to
rebalance towards domestic drivers in 2015 along
with strengthening confidence in both the
corporate and household sectors The associated
rise in imports is projected to decrease the
contribution of net exports to growth and to slow
the ongoing improvement in the current-account
balance
Inflation
The Czech National Bank loosened further its
monetary policy in November by weakening the
koruna and has signalled its intention to maintain a
supportive policy stance at least throughout 2014
The latest inflation figures show that the pass-
through from the exchange rate to prices is fairly
quick with inflation as measured by the HICP
rising from 09 in October to 14 in December
2013 However the fading out of past increases in
indirect taxes together with a drop in regulated
prices of electricity are set to dampen price growth
throughout 2014 Stronger domestic demand is
expected to stoke up inflation in 2015
The economic recovery that started in the second quarter of 2013 is expected to strengthen in 2014
sustained by the improving global economy The labour market is set to improve while the general
government deficit is forecast to worsen slightly mainly because of higher government consumption
expenditure and a planned labour tax reform in 2015
Member States The Czech Republic
53
General government deficit to worsen slightly
The general government deficit is expected to have
reached 27 of GDP in 2013 This outcome
results from consolidation measures of
approximately 07 of GDP and a projected year-
on-year decline in public investment by more than
9 Public investment has been on a steep
declining path for four consecutive years and its
share on GDP declined to 29 in 2013 compared
with a long-term average of 42 The available
cash data indicate lower-than-expected revenues
from corporate income taxes and excise duties but
strong VAT revenues
The general government deficit will stabilise at
28 of GDP in 2014 Growth in government
consumption is set to remain strong on account of
the planned increase in the public sector wage bill
and in the intermediate consumption (total fiscal
impact of approximately 02 of GDP) The
forecast also factors in a moderate rebound in
public investment and the planned withdrawal of
earlier consolidation measures (02 of GDP) The
main deficit-reducing measures include lower
indexation of pensions an increase in excise duties
and one-off revenue from the sale of newly
released frequency ranges (total fiscal impact of
approximately 05 of GDP) The structural
balance is forecast to deteriorate in the context of a
narrowing output gap
On unchanged policies the deficit is expected to
widen to 33 of GDP and the structural balance is
forecast to deteriorate further The already adopted
reform of the personal income tax entering in force
in 2015 will be the main deficit-increasing
measure (04 of GDP)
The debt-to-GDP ratio stabilised at around 46 in
2013 due to the sale of financial assets amounting
to approximately 3 of GDP The ratio is
expected to increase over the forecast horizon
reaching 486 in 2015
bn CZK Curr prices GDP 94-09 2010 2011 2012 2013 2014 2015
38459 1000 31 25 18 -10 -12 18 22
19442 506 31 09 05 -21 -04 04 20
7888 205 17 02 -27 -19 14 15 08
8879 231 42 10 04 -45 -40 12 22
3937 102 55 37 67 -56 -07 20 27
30009 780 84 154 95 45 04 57 61
27856 724 85 154 70 23 07 46 58
35610 926 26 15 27 -17 -12 17 21
31 08 -02 -26 -08 08 16
00 10 01 -01 -02 -02 -01
00 06 19 17 -02 12 06
01 -10 00 04 10 02 06
65 73 67 70 70 68 66
84 31 23 23 -10 20 22
52 -04 05 38 11 05 07
07 12 14 21 -02 -09 -12
103 107 99 106 106 108 107
45 -16 -09 16 13 13 19
- 12 21 35 14 10 18
04 -23 -21 -06 06 02 05
-22 15 24 38 45 56 63
-36 -50 -35 -26 -24 -15 -09
-33 -29 -16 -14 -09 -01 06
- -47 -32 -44 -27 -28 -33
- -43 -31 -37 -14 -19 -29
- -45 -31 -19 -13 -22 -29
- 384 414 462 461 472 486
Net lending (+) or borrowing (-) vis-a-vis ROW (c)
(a) Eurostat definition (b) gross saving divided by gross disposable income (c) as a percentage of GDP
Cyclically-adjusted budget balance (c)
Real unit labour cost
Imports (goods and services)
General government balance (c)
Unit labour costs whole economy
Inventories
Terms of trade goods
Table II31
Net exports
Public Consumption
Trade balance (c)
Employment
Annual percentage change2012
GDP
Private Consumption
Exports (goods and services)
GNI (GDP deflator)
Structural budget balance (c)
Saving rate of households (b)
Main features of country forecast - CZECH REPUBLIC
Unemployment rate (a)
Gross fixed capital formation
Current-account balance (c)
Contribution to GDP growth
General government gross debt (c)
GDP deflator
Compensation of employees head
of which equipment
Domestic demand
Harmonised index of consumer prices
4 DENMARK Moving out of stagnation
54
Economic recovery is gaining traction
Real GDP is estimated to have grown by 03 in
2013 The weak growth rate is primarily due to the
negative carry-over effects from 2012 and a weak
development at the beginning of the year In the
course of the year GDP growth has picked up
with two consecutive quarters of growth in the
second and third quarter of 2013 Growth is
estimated to have been primarily driven by
domestic demand while strong imports have led to
a negative growth contribution from net exports
At the beginning of 2014 confidence indicators
are pointing to increased momentum in the Danish
economy (II41) Real GDP is forecast to grow by
17 in 2014 and 18 in 2015 which is
unchanged compared to the projection in the
autumn forecast In 2014 and 2015 domestic
demand is expected to remain the main growth
driver Export growth is expected to pick-up
markedly in 2014 and 2015 but a simultaneous
increase in imports reduces the positive growth
contributions from net exports
Private consumption has been stable at a low level
since 2010 as income growth has been low
uncertainty widespread and Danish households
have been consolidating after the housing bubble
burst However consumer confidence has
improved significantly since last summer house
prices have stabilised and even increased in the
largest cities interest rates are low and there have
been early signs of improvement in the labour
market Hence there is a potential for increased
private consumption which is forecast to expand
by 14-17 on an annual basis in the forecast
period
Exports are expected to have grown by just 09
in 2013 after even weaker growth in 2012 The
low growth rate for 2013 is partly a hangover from
an export drop in the last half of 2012 as growth
over the course of 2013 itself has been more solid
On an annual basis exports growth is expected to
rise to 31 in 2014 and 40 in 2015 in line with
the expected improvement in external demand
Business investment has been weak since the
outbreak of the crisis and savings in the corporate
sector have been stable at a very high level over
the last three years In 2013 business investment
was arguably boosted by the investment window
tax breaks which ended by the turn of the year
Private investment is expected to further accelerate
in the forecast period supported by low interest
rates and in line with the further recovery in
private consumption and exports
-10
-8
-6
-4
-2
0
2
4
6
50
60
70
80
90
100
110
120
130
05 06 07 08 09 10 11 12 13 14
Graph II41 Denmark - ESI and Real GDP growth
Real GDP (rhs) ESI
long term average = 100 y-o-y
Unemployment is edging downwards
The pick-up in economic activity is set to lead to
moderate growth in employment by about 05
annually in the forecast period Despite a steep
increase in 2008 and 2009 the unemployment rate
never reached the same heights as in previous
downturns in the early 1980s and 1990s Job
churning has stayed at a high level during the
crisis with close to 20 of the employed changing
job every year There are correspondingly high in-
and outflows of unemployment and thus a relative
low level of long-term unemployment (17 of the
active population in the third quarter of 2013)
After three years of economic standstill the indicators are pointing to an improvement in the Danish
economy GDP-growth has been positive in the two latest quarters unemployment has edged
downwards and confidence indicators have improved across consumers and different business sectors
But despite these clear signs of improvement it is still too early to conclude that the recovery has
gained a firm footing
Member States Denmark
55
Unemployment has been on a downward trend
since spring 2012 and is projected to decline
further in the forecast period in line with
employment trends According to the European
Commissionrsquos consumer survey consumers have
become more optimistic with regard to future
developments in the labour market with a majority
now expecting decreasing unemployment over the
next 12 months Compared to consumers in other
EU-countries the Danes have been the most
optimistic on this topic in the last eight months
HICP inflation has picked-up slightly at the end of
2013 following a declining trend in the three first
quarters of the year In 2013 inflation was dragged
down by food prices (due to excise tax cuts at the
beginning of the year) as well as dampening
effects from the energy price development and
insurance prices HICP inflation is expected to
increase gradually in the course of 2014 in line
with the gradual strengthening of the economic
activity reaching 15 for the year as a whole
The risks to the macroeconomic outlook appear to
be broadly balanced Denmark is a small and open
economy and any shocks abroad would have a
direct impact on the Danish economy On the
domestic side there are upward risks related to a
possible release of pent-up of demand primarily in
private consumption but also in business
investments There are both positive and negative
risks related to the ongoing consolidation process
in the households and in the corporate sector
Fiscal outlook is stable
The general government deficit is estimated to
have reached 03 of GDP in 2013 14 pps lower
than in the autumn forecast The revision is partly
related to higher than expected one-off revenues
from the possibility to move forward taxation of
existing capital pension schemes at favourable
conditions This measure will also have a positive
impact on the fiscal balance in 2014 where the
budget deficit however is forecast to increase to
13 The one-off effects from the capital pension
measure will not have an impact in 2015 and the
fiscal deficit is expected to increase to 27
bn DKK Curr prices GDP 94-09 2010 2011 2012 2013 2014 2015
18256 1000 17 14 11 -04 03 17 18
8956 491 18 13 -07 -01 04 14 17
5195 285 21 02 -14 04 03 15 06
3174 174 31 -21 33 08 17 27 31
1179 65 37 16 -53 79 49 13 49
10004 548 44 30 70 04 09 31 40
9077 497 56 35 59 09 25 30 38
18807 1030 19 21 15 -01 05 14 17
20 04 -02 02 06 16 15
00 11 04 -03 04 -02 00
-03 -01 09 -02 -07 03 03
07 -25 -02 -03 01 05 05
51 75 76 75 70 69 67
35 35 13 14 12 18 20
25 -05 00 15 10 07 06
04 -45 -07 -08 -14 -06 -09
63 77 77 66 20 36 50
21 43 07 23 24 13 15
20 22 27 24 05 15 17
09 13 -18 03 31 -01 -06
32 29 30 27 32 30 27
21 58 59 60 70 68 66
22 59 63 60 70 68 68
09 -25 -19 -38 -03 -13 -27
03 -01 02 -10 26 13 -05
- -01 02 06 11 -03 -05
511 428 464 454 424 416 431
Net lending (+) or borrowing (-) vis-a-vis ROW (c)
(a) Eurostat definition (b) gross saving divided by gross disposable income (c) as a percentage of GDP (d) EDP net lendingborrowing and EDP
interest for Denmark for the years 2010-2012 are ECFIN estimates based on the October 2013 EDP notification and on revised general government
accounts published by Danmarks Statistik in November 2013
Cyclically-adjusted budget balance (c)
Real unit labour cost
Imports (goods and services)
General government balance (c)(d)
Unit labour costs whole economy
Inventories
Terms of trade goods
Table II41
Net exports
Public Consumption
Trade balance (c)
Employment
Annual percentage change2012
GDP
Private Consumption
Exports (goods and services)
GNI (GDP deflator)
Structural budget balance (c)
Saving rate of households (b)
Main features of country forecast - DENMARK
Unemployment rate (a)
Gross fixed capital formation
Current-account balance (c)
Contribution to GDP growth
General government gross debt (c)
GDP deflator
Compensation of employees head
of which equipment
Domestic demand
Harmonised index of consumer prices
5 GERMANY Accelerated growth in the offing
56
Marked growth this year and next
Following uneven economic activity in the first
half of 2013 real GDP growth broadly stabilised
in the second half of the year The third quarter
saw a 03 (q-o-q seasonally and working-day
adjusted) increase and was followed by a 04
expansion in the final quarter according to the
official flash estimate In 2013 as a whole real
GDP rose by 04 Annual growth was driven by
private and government consumption Investment
continued to show weakness and together with net
external trade contributed negatively to growth
For the first quarter of 2014 and beyond indicators
point to some acceleration of economic growth
followed by stabilisation at quite robust rates
Business expectations reveal high optimism in the
economy as a whole and orders as well as
production expectations indicate significant growth
contributions from manufacturing Compared to
the autumn projection growth contributions are
expected to remain broadly unchanged from net
exports and to increase from domestic demand
Real GDP is projected to expand by 18 in 2014
and by 20 in 2015 The acceleration of activity
in 2015 is almost entirely due to more working
days than this year
Robust consumption and labour market
Real private consumption is supported by low
interest rates and weaker than previously projected
consumer price increases Robust labour market
developments underpin households high
propensity to buy Rising labour supply largely
due to high net migration is set to be more than
offset by labour demand This is reflected in a
gradual reduction in the unemployment rate and
reaccelerating wage growth this year and next
Investment on a rising path
The investment outlook is favourable Following a
protracted decline investment in equipment saw a
moderate turnaround in mid-2013 An upward
trend in domestic orders of capital goods and a
continued rise in firms investment plans amid
dissipating uncertainty and favourable financing
conditions suggest a further pick-up Corporate
construction investment should move in line with
investment in equipment in the medium term
while vibrant housing investment is expected to
reduce its pace of expansion somewhat
Import growth fuelled by domestic demand
Rising industrial orders from abroad and optimistic
export expectations indicate slightly stronger
export growth than projected in the autumn Along
with reaccelerating investment in equipment
imports are set to rise more dynamically than
exports hence contributing to a limited narrowing
of the current-account surplus
-6
-4
-2
0
2
4
6
-6
-4
-2
0
2
4
6
05 06 07 08 09 10 11 12 13 14 15
Graph II51 Germany - real GDP growth and
contributions output gap
Output gap (rhs) Net exports
Investment Priv consumption
Gov consumption Inventories
Real GDP (y-o-y)
of pot GDP
forecast
pps
Inflation broadly stable at moderate levels
Inflation dropped markedly at the end of 2013 The
lowering impact of further easing food and energy
price pressure on headline inflation is expected to
be largely offset by gradually rising core inflation
on the back of a narrowing output gap and rising
labour costs Overall consumer prices are
projected to increase by 14 per year in 2014 and
2015
Economic growth is expected to accelerate powered by domestic demand Favourable financing
conditions and dissipating uncertainty should lead to a gradual recovery in investment in equipment
after disappointing outcomes in 2012-13 while low interest rates and a robust labour market should
further support private consumption and housing investment The general government budget is forecast
to remain balanced and the gross debt-to-GDP ratio to decline
Member States Germany
57
Fiscal stance turning slightly expansionary
According to the preliminary official estimate the
general government budget remained broadly
balanced with a slight deficit of 01 of GDP in
2013 after a surplus of 01 in 2012
Given the outlook for more dynamic economic
activity compared to recent years revenue growth
is projected to accelerate somewhat over the
forecast horizon despite the second step of the
increase in the minimum income tax allowance
this year
Expenditure is projected to increase equally in
particular due to higher pension increases the
restructuring fund set up in response to last years
flood disaster wage increases in the public sector
and the new childcare allowance for parents not
making use of childcare facilities The projections
also include pension reform proposals of the new
federal government that foresee additional benefits
for certain groups of pensioners Consequently the
pension contribution rate has not been further
lowered this year as planned in autumn Further
expenditure measures announced in the coalition
agreement of the new federal government such as
increased spending on childcare facilities transport
infrastructure and research have not yet been
sufficiently specified and hence not been taken
into account but should not change substantially
the projections Overall the general government
budget is forecast to remain broadly balanced and
the structural balance to remain in surplus though
decreasing slightly over the forecast horizon
resulting in a declining gross debt-to-GDP ratio
The ongoing winding up of bad banks could
further reduce the debt stock
50
55
60
65
70
75
80
85
-5
-4
-3
-2
-1
0
1
2
3
4
5
99 00 01 02 03 04 05 06 07 08 09 10 11 12 13 14 15
of GDP
Gross debt (rhs) Budget balance (lhs)
forecast
of GDP
Graph II52Germany - General government
budget balance and gross debt
bn EUR Curr prices GDP 94-09 2010 2011 2012 2013 2014 2015
26664 1000 12 40 33 07 04 18 20
15339 575 09 10 23 08 09 15 18
5144 193 14 13 10 10 11 15 12
4706 176 04 57 69 -21 -08 41 44
1750 66 22 100 58 -40 -22 48 71
13810 518 62 152 80 32 06 49 68
12231 459 55 125 74 14 13 59 76
27301 1024 13 37 34 08 03 17 19
09 19 27 02 05 19 20
00 04 -01 -05 01 01 00
03 17 07 10 -03 -02 00
04 05 14 11 06 05 06
90 71 59 55 53 52 51
13 24 30 26 20 28 31
05 -11 10 31 22 16 17
-04 -21 -02 16 -01 00 00
162 169 164 164 161 160 159
09 10 12 15 22 16 17
- 12 25 21 16 14 14
02 -25 -27 -04 19 05 00
50 63 59 67 68 66 66
20 64 63 70 70 67 64
20 64 61 70 70 66 64
-27 -42 -08 01 -01 00 00
-26 -34 -12 01 05 04 02
- -22 -10 03 06 05 02
623 825 800 810 796 773 745
Net lending (+) or borrowing (-) vis-a-vis ROW (c)
(a) Eurostat definition (b) gross saving divided by gross disposable income (c) as a percentage of GDP
Cyclically-adjusted budget balance (c)
Real unit labour cost
Imports (goods and services)
General government balance (c)
Unit labour costs whole economy
Inventories
Terms of trade goods
Table II51
Net exports
Public Consumption
Trade balance (c)
Employment
Annual percentage change2012
GDP
Private Consumption
Exports (goods and services)
GNI (GDP deflator)
Structural budget balance (c)
Saving rate of households (b)
Main features of country forecast - GERMANY
Unemployment rate (a)
Gross fixed capital formation
Current-account balance (c)
Contribution to GDP growth
General government gross debt (c)
GDP deflator
Compensation of employees head
of which equipment
Domestic demand
Harmonised index of consumer prices
6 ESTONIA GDP growth regaining momentum with recovering exports
58
Growth picking up again in the second half of
2013
Real GDP growth dropped to 07 in 2013 from
39 in 2012 However the slowdown in
economic growth has stabilised as seasonally
adjusted GDP remained broadly unchanged in the
fourth quarter of 2013 compared to the previous
one Private investments picked up again in the
second half of 2013 over-compensating a decline
in government investment due to the end of a
number of environmental projects and the
completion of most EU co-funded programmes
Consumption continued to support economic
growth as household income has been
strengthening thanks to strong real wage growth
rising employment and higher pensions On the
negative side lower domestic demand in Estonias
main trading partners together with the diversion
of oil-related transit trade to new Russian ports led
to quasi-stagnation in Estonias exports volumes of
services while imports continued to grow
Positive growth outlook for 2014 and 2015
With external demand progressively recovering
the economy is expected to regain momentum with
growth forecast at 23 in 2014 and 36 in 2015
Capacity utilisation is now close to its long-term
average which is expected to prompt an increase
in production capacity from 2014 as demand has
started recovering
Consumption growth is forecast to remain
vigorous supported by strong real income growth
including from income tax cuts in 2015
Household borrowing is projected to increase only
moderately despite very low interest rates as
banks will remain cautious towards the still
relatively high private sector indebtedness Finally
Estonias recovering export growth to its main
trading partners is expected to maintain the trade
balance slightly positive despite domestic demand
gathering pace with investment progressively
recovering Downside risks to the forecast could
stem from wages rising faster than productivity
thereby limiting competitiveness and corporate
investment
-40
-30
-20
-10
0
10
20
30
04 05 06 07 08 09 10 11 12 13 14 15
Graph II61 Estonia - Real GDP growth and
contributions export market growth
Dom demand excl inv Imports
Exports Real GDP (y-o-y)
Export market gr(y-o-y)
forecast
pps
Large wage increases in a tightening labour
market hellip
Despite the slowing output growth employment
expanded further in 2013 which is partly
explained by the lagged effect of more vigorous
growth in 2012 At the same time the
unemployment rate fell to 88 down from 102
a year earlier Employment is expected to grow
further and unemployment to continue contracting
over the forecast horizon but at a much slower
pace in a tightening labour market Labour force
participation is high at close to 70 and is set to
increase slightly over the forecast horizon given
the changing age structure of the working age
population Nominal wage growth accelerated to
88 in the third quarter of 2013 with real wage
growth reaching 54 This is driven partly by
persistent skill mismatches and rising vacancies
recent minimum wage increases pay agreements
for health workers and teachers as well as fast
wage catching up in traded services In 2015
nominal wage growth is expected to stabilise at
around 7 and real wage growth at around 4
reflecting solid output growth further minimum
wage increases by 10 each year and
unemployment hovering around its natural rate
hellip while inflation stabilises at lower levels
With the impact of earlier global commodity price
increases fading out HICP inflation receded to
32 in 2013 The assumed decline in global
Real GDP growth slowed to 07 in 2013 but is expected to regain momentum to reach 23 in 2014
and 36 in 2015 as external demand recovers Estonias public debt is expected to remain close to
10 of GDP and only small fiscal deficits are forecast this year and next
Member States Estonia
59
commodity prices is expected to ensure that
inflation will continue its slow decline just below
20 in 2014 However rising core inflation
reflecting strong wage growth and a further excise
tax increase on alcohol are set to push inflation
back to around 3 in 2015
Small fiscal deficit continuing
The general government balance is forecast to
show a small deficit of 04 of GDP in 2013 The
postponement of the dividend distribution from
state owned companies to the government had a
negative effect on the fiscal outcome However
tax revenue remained strong despite relatively
slow real GDP growth
In 2014 the deficit is projected to remain
unchanged at 04 of GDP On the one hand the
public wage bill is projected to increase by 51
and pensions by 58 while the compensation
mechanism for the second pillar pension
contributions will negatively affect the revenue
On the other hand a sizeable revenue-enhancing
package will enter into force that is expected to
compensate the expenditure increase This includes
further excise tax increases and a rescheduling of
dividend distribution from state-owned companies
However some implementation risks have
appeared for VAT-enhancing measures initially
planned to take effect as of mid-2014
On a no-policy-change basis an unchanged
government balance is projected for 2015 In the
course of the year public investment is expected to
revert to growth as the 2014-20 package of EU
funds will start being implemented The income
tax rate cut by 1 pp to 20 scheduled for
1 January 2015 will contribute to a decline in the
tax burden
In structural terms the fiscal position is forecast to
have deteriorated by 03 pp in 2013 and to
improve by 04 pp of GDP in 2014 in 2015 on a
no-policy-change basis it is expected to
deteriorate by 03 pp of GDP The debt-to-GDP
ratio is expected to remain close to 10 of GDP in
2014-15
bn EUR Curr prices GDP 94-09 2010 2011 2012 2013 2014 2015
174 1000 43 26 96 39 07 23 36
89 512 54 -26 38 49 45 43 42
33 192 26 -08 13 38 09 10 12
44 252 68 -73 376 109 14 17 54
20 115 - -162 1228 117 65 60 80
158 906 62 237 234 56 17 41 56
157 903 70 211 284 88 30 46 58
166 952 41 00 99 45 16 23 39
58 -31 94 58 28 29 38
00 32 28 -05 -06 -02 00
-14 28 -20 -26 -12 -04 -02
-12 -48 70 22 14 02 03
95 169 125 102 88 83 77
170 23 05 60 67 60 68
108 -50 -18 42 75 39 34
04 -53 -47 09 24 09 00
17 101 111 45 52 53 53
104 03 30 33 50 30 35
- 27 51 42 32 18 28
04 -16 -22 -19 11 02 02
-155 -25 -44 -66 -52 -51 -50
-87 35 03 -28 -21 -24 -23
-79 70 44 07 08 01 01
05 02 11 -02 -04 -04 -04
- 21 08 -12 -08 -04 -05
- -09 -08 -02 -05 -01 -04
- 67 61 98 100 101 98
Net lending (+) or borrowing (-) vis-a-vis ROW (c)
(a) Eurostat definition (b) gross saving divided by gross disposable income (c) as a percentage of GDP
Cyclically-adjusted budget balance (c)
Real unit labour cost
Imports (goods and services)
General government balance (c)
Unit labour costs whole economy
Inventories
Terms of trade goods
Table II61
Net exports
Public Consumption
Trade balance (c)
Employment
Annual percentage change2012
GDP
Private Consumption
Exports (goods and services)
Note Contributions to GDP growth may not add up due to statistical discrepancies
GNI (GDP deflator)
Structural budget balance (c)
Saving rate of households (b)
Main features of country forecast - ESTONIA
Unemployment rate (a)
Gross fixed capital formation
Current-account balance (c)
Contribution to GDP growth
General government gross debt (c)
GDP deflator
Compensation of employees head
of which equipment
Domestic demand
Harmonised index of consumer prices
7 IRELAND Adjustment supported by stronger economic growth
60
Virtuous cycle of domestic recovery builds up
After a slow start to 2013 growth began to pick up
in the third quarter High-frequency data suggest
that further improvements can be expected in the
final quarter and this underpins the forecast annual
growth of 03 for 2013 There are indications
domestic demand is starting to perform more
strongly as the labour market has continued along
a steady path of improvement across different
sectors
-20
-15
-10
-5
0
5
10
15
20
02 03 04 05 06 07 08 09 10 11 12 13 14 15
pps
Graph II71 Ireland - Real GDP growth and
contributions
Private consumption Government consumption
Investment Exports
Imports Real GDP (y-o-y)
forecast
Unemployment fell to 124 in December 2013
its lowest level since June 2009 Employment
gains seen earlier in 2013 mainly in the part-time
and casual sectors of the labour force have moved
into full-time employment gains although this has
not yet translated into wage pressure Inflation
remains below the euro-area average extending
recent improvements in competitiveness
Real GDP growth in 2014 is forecast at 18 as
economic recovery in key trading partners is
expected to sustain positive export growth
particularly for services while further
improvements in the labour market and a rise in
investment from low levels are expected to
support domestic demand Growth is forecast to
rise further in 2015 to 29 on foot of a
stabilisation of domestic demand and better net
trade as conditions improve in key export markets
Balanced macroeconomic risks
Persistent weakness in merchandise trade
highlights the importance for growth of sustaining
the ongoing recovery in service exports as well as
a stronger contribution to growth from domestic
demand The dependence of goods export on the
performance of the pharmaceutical sector
constitutes a risk to net exports especially if the
effects of patent expiry on trade volumes are not
sufficiently offset by growth in new product lines
Given the importance of UK trade in particular for
indigenous Irish firms the accelerated rate of UK
recovery represents an important upside risk for
growth employment and the current-account
position
The lack of wage pressure while beneficial to
competitiveness heightens the challenge of
reducing private sector indebtedness which
although on a gradual downward path continues to
weigh on growth A stronger contribution from
investment to growth will depend on
improvements in the supply of new credit
especially to SMEs and to the construction sector
for which output must begin to rise in centres of
economic activity in order to satisfy medium-term
housing and commercial property demand
Deficit correction stabilises public debt
The 2013 fiscal deficit is estimated at 72 of
GDP based on end-year cash data which were
slightly better than expected Consumption-related
revenue continued to be weak while direct tax
revenue on labour and corporate income fared
better Overall the expenditure outturn was
broadly in line with budget plans while some
overruns in the health sector were offset by savings
elsewhere The forecast assumes that a dividend
payment from Allied Irish Bank (AIB) in ordinary
shares to the government improves the 2013 deficit
by 02 of GDP but the statistical treatment of
this transaction will be reviewed by Eurostat in
April 2014
A modest pick-up in economic growth is expected in 2014 and the labour market is continuing to show
welcome signs of improvement Fiscal adjustment is on track but includes temporary deficit-improving
factors in 2014 and is not yet fully specified for 2015
Member States Ireland
61
In 2014 the general government deficit is
projected at 48 of GDP The forecast includes
the discretionary measures presented in the
2014 budget of 15 of GDP and other deficit
improving elements some of which are temporary
Discretionary measures include tax increases on
alcohol and tobacco on bank deposits on pension
fund assets and on financial institutions
Expenditure measures include further public sector
wage savings and tighter eligibility for social
benefits and medical services
In 2015 following established practice the general
government deficit is projected at 43 of GDP on
a no-policy-change assumption that is it includes
consolidation measures that had been announced
with a sufficient degree of detail at the cut-off date
of the forecast Specifically the forecast assumes
tax revenues will grow in line with the respective
tax base and that nominal expenditure is kept
constant in level terms with the exception of some
adjustments for demographic factors The 2015
deficit forecast includes a negative carry-over of
around 04 of GDP largely due to one-off
measures having impact on 2014 and the reduction
in the pension fund levy The cyclically-adjusted
budget balance net of one-off and other temporary
measures is projected to decline from 65 of
GDP in 2013 to 47 in 2015 (17)
Government debt is estimated to have peaked at
122 of GDP in 2013 and is projected to decline
to 120 in 2014 due to a fall in high precautionary
cash balances Given the no-policy-change
assumption the debt ratio will stabilise at 120
for 2015 as a primary surplus is partly offset by
a negative growth-interest differential
Uncertainty over growth is among the main risks
to the fiscal forecast Further risks relate to
effective implementation of the 2014 budget in
particular in the health sector given past overruns
Also the government may have to compensate any
possible shortfall in the asset sales linked to the
winding-up of the Irish Banking Resolution
Corporation (IBRC)
(17) One-off measures include one-off guarantee payments
related to the liquidation of IBRC in 2013 (07 of GDP)
one-off revenue from the sale of mobile telephone licenses
in 2013 (04 of GDP) one-off revenue from the sale of the National Lottery licence in 2014 (02 of GDP) as
well as one-off financial sector measures for credit unions
in 2014 and 2015 (less than 01 of GDP in each year)
bn EUR Curr prices GDP 94-09 2010 2011 2012 2013 2014 2015
1639 1000 57 -11 22 02 03 18 29
783 478 49 04 -14 -03 -06 08 10
294 180 46 -49 -29 -32 -10 -28 -04
175 107 54 -227 -91 -06 38 105 54
68 42 65 -112 -15 23 92 120 65
1767 1078 97 64 54 16 03 28 37
1370 836 90 36 -04 00 01 28 26
1339 817 51 -02 -14 08 27 10 21
43 -28 -35 -15 -01 11 11
01 -11 21 03 02 00 00
17 31 57 16 02 07 18
31 -41 -18 -06 22 15 14
72 139 147 147 131 119 112
47 -38 -01 08 -03 -06 06
21 -67 -40 00 16 -08 -08
-04 -53 -46 -06 10 -15 -19
- 132 112 102 127 113 120
26 -15 07 07 06 07 11
- -16 12 19 05 08 11
01 -36 -62 -07 02 02 -01
199 226 226 222 204 189 185
-05 11 12 44 70 68 72
-01 07 11 32 68 72 69
-05 -306 -131 -82 -72 -48 -43
-08 -282 -122 -77 -66 -47 -47
- -89 -81 -77 -64 -49 -46
470 912 1041 1174 1223 1203 1197
Net lending (+) or borrowing (-) vis-a-vis ROW (c)
(a) Eurostat definition (b) gross saving divided by gross disposable income (c) as a percentage of GDP
Cyclically-adjusted budget balance (c)
Real unit labour cost
Imports (goods and services)
General government balance (c)
Unit labour costs whole economy
Inventories
Terms of trade goods
Table II71
Net exports
Public Consumption
Trade balance (c)
Employment
Annual percentage change2012
GDP
Private Consumption
Exports (goods and services)
GNI (GDP deflator)
Structural budget balance (c)
Saving rate of households (b)
Main features of country forecast - IRELAND
Unemployment rate (a)
Gross fixed capital formation
Current-account balance (c)
Contribution to GDP growth
General government gross debt (c)
GDP deflator
Compensation of employees head
of which equipment
Domestic demand
Harmonised index of consumer prices
8 GREECE First signs of recovery
62
Gains in fiscal stability and competitiveness
support confidence and recovery
During the second half of 2013 the recession has
continued to soften as real GDP contracted at a
decelerating y-o-y pace from -55 in the first
quarter 2013 to the fourth quarter flash reading of
-26 The strong revival of tourism since the last
spring with its spillovers on the economy helped
this trend which has continued despite a high
concentration of tax payments in the last quarter of
2013 affecting consumption Overall real GDP
growth in 2013 is projected to have contracted by -
37 revised upwards from -4 in the autumn
forecast
The Economic Sentiment Indicator resumed its
upward path in January 2014 pulled by services
and retail and the Purchasing Managers Index
passing the level of 50 for the first time since
August 2009This indicates further an expansion in
output and new orders The repayment of
government arrears and the faster absorption of the
EU and EIB funds through the re-launch of major
projects such as motorway construction are
expected to help alleviate liquidity constraints and
support investment in 2014 The bank
recapitalisation process and fiscal stabilisation are
also supportive Led by exports and investment
real GDP is expected to expand in 2014 at an
annual growth rate of 06 However private
consumption is expected to still decline in line
with disposable income with the ongoing fall in
prices somewhat moderating the impact of recent
wage adjustments
The recovery is forecast to gain strength in 2015
as investment takes over as the main engine of the
recovery also attracted by the opportunities
created by the ongoing structural reforms The
euro-area recovery should support a revival in
goods exports as well as stronger shipping and
tourism revenues With consumption recovering
real GDP growth is projected at 29
The unemployment rate is estimated to reach
273 for 2013 Wage setting reforms have
already contributed to a sharp improvement in cost
competitiveness which together with the
announced programmes of employment support
and the pick-up in investment should lead to a
relatively strong projected decrease of
unemployment to 260 in 2014 and 240 in
2015
Consumer prices fell moderately by 09 in 2013
and are expected to fall by 06 in 2014 reflecting
weak domestic demand falling unit labour costs
and the implementation of product market reforms
As the economic recovery gains pace prices are
expected to increase only weakly by 02 in 2015
The current-account deficit is projected at -23 of
GDP for 2013 and is expected to narrow to -18
in 2014 and -16 in 2015 as exports and imports
pick up along with the economic recovery also
facilitated by ongoing reforms to simplify trade
activities
-2
-1
0
1
2
3
4
5
-12
-9
-6
-3
0
3
6
08 09 10 11 12 13 14 15
Graph II81 Greece - Real GDP growth and
contributions inflation
Private consumption Public consumption
Investment Net exports
Inventories Real GDP (y-o-y)
Inflation (rhs)
forecastpps
Risks on the upside are related to better
performance of exports stronger tourism
performance andor a stronger liquidity impact of
the arrears clearance On the downside policy
implementation slippages could undermine
confidence affecting investment and exports
Risks have to be re-evaluated in light of the release
by ELSTAT on 11 March 2014 of the fourth
quarter 2013 GDP and components
Recent data support expectations that Greece should return to growth in 2014 Confidence indicators
continue to improve whilst hard data releases suggest the first signs of recovery Structural reforms
undertaken in labour and product markets have underpinned improved competitiveness leading to
expectations for strengthened exports and investment
Member States Greece
63
Budgetary situation is improving
In 2013 the headline overall balance is expected to
have deteriorated to 131 of GDP from 90 of
GDP in 2012 This deterioration is mainly driven
by the one-off costs of bank recapitalization (11
of GDP) which more than offsets the improvement
of the underlying fiscal situation and higher
transfers received by Member States
corresponding to profits on Greek Bonds held by
the Eurosystem Central Banks and other small
factors The structural balance is forecast to have
turned into a surplus of 17 of GDP
18 percentage points higher than in 2012
Current projections assume that programme
objectives for 2014 and 2015 are fulfilled through
measures to be discussed during the ongoing
review The headline deficit is thus projected to
fall to 22 of GDP in 2014 and 10 of GDP in
2015
0
4
8
12
16
20
30
35
40
45
50
55
60
65
08 09 10 11 12 13 14 15
of GDP of GDP
Graph II82 General Government Revenue
Expenditure and Balance
Total Revenue
Total Expenditure
General Government Deficit (rhs)
forecast
After peaking in 2013 the ratio of government
debt to GDP is expected to fall slightly in 2014
before declining more markedly in 2015 and
beyond the forecast horizon as the fiscal balance
continues to improve and economic growth
resumes
bn EUR Curr prices GDP 94-09 2010 2011 2012 2013 2014 2015
1937 1000 29 -49 -71 -64 -37 06 29
1428 737 31 -62 -77 -91 -72 -16 14
344 178 31 -87 -52 -42 -61 -40 -12
255 131 43 -150 -196 -192 -87 53 113
105 54 86 -82 -181 -173 -30 88 130
523 270 45 52 03 -24 25 46 55
621 320 49 -62 -73 -138 -68 -13 27
1947 1005 28 -53 -72 -31 -44 -03 23
35 -93 -101 -104 -75 -12 23
-02 15 07 01 10 00 -02
-05 29 24 40 28 18 08
12 -26 -56 -83 -37 06 26
98 126 177 243 273 260 240
66 -26 -34 -42 -78 -15 00
48 -01 -18 -62 -78 -15 -03
01 -13 -29 -55 -53 -10 -07
- - - - - - -
47 11 10 -08 -26 -05 04
- 47 31 10 -09 -06 02
00 18 06 -10 02 -01 02
-162 -143 -140 -113 -99 -89 -84
-91 -128 -117 -53 -23 -18 -16
- -110 -98 -29 -03 -01 02
-66 -107 -95 -90 -131 -22 -10
-70 -85 -53 -33 -72 22 10
- -89 -59 -01 17 07 -01
1032 1483 1703 1569 1773 1770 1719
Net lending (+) or borrowing (-) vis-a-vis ROW (c)
(a) Eurostat definition (b) gross saving divided by gross disposable income (c) as a percentage of GDP
Cyclically-adjusted budget balance (c)
Real unit labour cost
Imports (goods and services)
General government balance (c)
Unit labour costs whole economy
Inventories
Terms of trade goods
Table II81
Net exports
Public Consumption
Trade balance (c)
Employment
Annual percentage change2012
GDP
Private Consumption
Exports (goods and services)
GNI (GDP deflator)
Structural budget balance (c)
Saving rate of households (b)
Main features of country forecast - GREECE
Unemployment rate (a)
Gross fixed capital formation
Current-account balance (c)
Contribution to GDP growth
General government gross debt (c)
GDP deflator
Compensation of employees head
of which equipment
Domestic demand
Harmonised index of consumer prices
9 SPAIN The recovery becomes firmer while the rebalancing of the economy
continues
64
Spain returned to positive growth territory since
the third quarter of 2013 amidst improved
confidence and some relaxation of financial
conditions Spain successfully exited the Financial
Assistance Programme for the Recapitalisation of
Financial Institutions and the stabilisation of
Spanish financial markets continues with
sovereign-bond yields at new lows In general
financing conditions have improved although they
remain onerous for some borrowers especially for
SMEs Despite these improvements the still large
debt levels and high unemployment weigh on
growth prospects and a source of vulnerability to
adverse shocks
Domestic demand to offset narrowing net
exports
GDP growth accelerated to 03 q-o-q in the last
quarter of 2013 and the recovery is foreseen to
consolidate gradually over 2014 While GDP
contracted by 12 in 2013 it is expected to grow
by 1 in 2014 and to gain some further
momentum in 2015
-9
-7
-5
-3
-1
1
3
5
7
06 07 08 09 10 11 12 13 14 15
pps
Graph II91 Spain - Real GDP growth and
contributions
Net external demand
Domestic demand incl inventories
Real GDP (y-o-y)
forecast
The narrowing contribution from the external
sector in the second half of 2013 has been more
than offset by a less negative contribution from
domestic demand This more balanced growth
composition is expected to continue over the
coming quarters with domestic demand gaining
some momentum while net external demand
provides a positive but declining contribution
Deleveraging in the private sector will continue to
constrain private consumption and investment
Nevertheless private consumption is forecast to
rise backed by increases in disposable income
improved employment prospects and higher
confidence The projected increase in real gross
disposable income also helped by low inflation
(03 in 2014) should also allow for a rising ndash
albeit still low ndash household saving rate over the
forecast horizon
Private investment in equipment is foreseen to
benefit from the improved economic outlook and
the relative strength of exports which is one of its
most important drivers By contrast the adjustment
of residential investment while well advanced has
not reached its inflection point yet with building
permits at historical lows and still falling Housing
transactions seem to have stabilised at very low
levels
Despite a recent deceleration export growth is set
to remain robust backed by ongoing
improvements in price and cost-competitiveness
and healthy foreign markets growth At the same
time imports are forecast to accelerate in line with
final demand As a result of the rising current-
account surplus Spains net lending is projected to
expand over the forecast horizon to around 23
of GDP in 2015
Employment growth back to positive territory
Having peaked at 272 in the first quarter of
2013 the unemployment rate retreated to 26 at
the end of last year mainly due to the decline in
the labour force whereas employment kept falling
However the process of job destruction is
bottoming out and employment is expected to start
registering positive growth rates in 2014
The incipient economic recovery is forecast to get firmer in the coming quarters backed by improved
confidence and some easing of financing conditions While the rebalancing of the economy is expected
to continue the growth contribution from external demand is expected to narrow Employment is
forecast to start growing and the unemployment rate to retreat gradually amidst continued moderation
in unit labour costs The budget deficit is set to narrow in 2014 but government debt will still rise
Member States Spain
65
contributing to a moderate fall in unemployment
Although productivity growth is expected to
decelerate wage moderation should allow for
further improvements in nominal unit labour costs
and competitiveness gains
Downside risks to the growth forecast include a
possible stronger-than-expected slowdown of
emerging economies and in particular South
America where the exposure of the banking sector
is significant On the upside a faster-than-expected
easing of financing conditions could boost
domestic demand
Budget deficit reduction set to continue
helped by recovery
Outturn data for 2013 suggest that fiscal
consolidation continued last year but at a more
moderate pace than in 2012 The general
government deficit is expected to reach 67 of
GDP for the full year (net of bank recapitalisation
costs of about 05 of GDP) as the latest data
indicate that current revenues may underperform
expectations and some expenditure posts might not
have fallen as much as planned inter alia
government investment
The slightly improved macroeconomic outlook
contributes to the expected reduction in the general
government deficit to 58 of GDP in 2014 In
addition to the measures presented in the 2014
Budget further measures of about frac14 of GDP
have been announced at the end of last year
including a widening of the base for social security
contributions to previously exempt benefits in kind
such as transportation aid lunch vouchers and
company cars as well as the introduction of direct
billing On the expenditure side cuts were
announced regarding some severance payments
While interest and pension expenditure are
expected to rise further falling unemployment and
the change in the pension indexation formula
should contribute to a deceleration of social
transfers in 2014
Under the no-policy-change assumption the
headline deficit is expected to widen to 65 of
GDP in 2015 This projection assumes that some
temporary tax measures will expire in 2014 The
structural deficit is estimated to be close to 4frac14 of
GDP in both 2013 and 2014 before rising to 5frac34
in 2015 Large public deficits and low nominal
GDP growth are projected to push the general
government gross debt to 99 of GDP in 2014 and
103 of GDP in 2015
bn EUR Curr prices GDP 94-09 2010 2011 2012 2013 2014 2015
10290 1000 29 -02 01 -16 -12 10 17
6104 593 27 02 -12 -28 -24 06 11
2077 202 40 15 -05 -48 -11 -09 -02
1975 192 36 -55 -54 -70 -56 01 20
607 59 43 50 55 -39 12 58 67
3360 327 58 117 76 21 49 54 64
3283 319 67 93 -01 -57 02 33 49
10170 988 28 04 -07 -08 -08 05 13
32 -09 -20 -41 -27 02 09
00 03 -01 00 00 00 00
-03 04 21 25 16 08 07
20 -23 -22 -48 -33 01 11
137 201 217 250 264 257 246
35 04 13 02 05 06 06
28 -17 -10 -30 -16 -04 00
-05 -18 -10 -29 -19 -09 -07
- 139 127 104 104 106 109
34 01 00 00 03 05 07
30 20 31 24 15 03 09
04 -23 -35 -23 06 13 -01
-53 -46 -42 -25 -12 -04 -02
-43 -44 -40 -12 11 16 18
-34 -38 -35 -06 19 22 23
- -96 -96 -106 -72 -58 -65
- -74 -75 -82 -47 -43 -63
- -74 -72 -51 -43 -42 -58
537 617 705 860 943 989 1033
Net lending (+) or borrowing (-) vis-a-vis ROW (c)
(a) Eurostat definition (b) gross saving divided by gross disposable income (c) as a percentage of GDP
Cyclically-adjusted budget balance (c)
Real unit labour cost
Imports (goods and services)
General government balance (c)
Unit labour costs whole economy
Inventories
Terms of trade goods
Table II91
Net exports
Public Consumption
Trade balance (c)
Employment
Annual percentage change2012
GDP
Private Consumption
Exports (goods and services)
GNI (GDP deflator)
Structural budget balance (c)
Saving rate of households (b)
Main features of country forecast - SPAIN
Unemployment rate (a)
Gross fixed capital formation
Current-account balance (c)
Contribution to GDP growth
General government gross debt (c)
GDP deflator
Compensation of employees fte
of which equipment
Domestic demand
Harmonised index of consumer prices
10 FRANCE Recovery remains slow amid sizeable budget deficits
66
A long way towards recovery
After eight quarters of economic stagnation GDP
rebounded at the end of 2013 although partly
driven by temporary factors Activity is thus
expected to slow down during the first quarter of
this year before accelerating again at first
stimulated by stronger external demand relieved
afterwards by private consumption supported by
improved confidence and in turn by firms
investment All in all after 03 in 2013 real
GDP growth is forecast to accelerate gradually to
10 in 2014 and under the no-policy-change
assumption 17 in 2015
-5
-4
-3
-2
-1
0
1
2
3
4
5
05 06 07 08 09 10 11 12 13 14 15
Graph II101 France - Real GDP growth and
contributions
Inventories Net exports
Domestic demand (excl Inv) Real GDP (y-o-y)
pps
forecast
Improving consumer confidence
Private consumption the traditional growth driver
of the French economy is expected to keep
accelerating growing by 06 in 2014 and 16
in 2015 largely explaining GDP growth
projections as a whole In 2014 and driven by the
expected stabilisation of unemployment
household confidence should further improve
pushing down the saving rate slightly This
coupled with low inflation levels helps explain the
projected private consumption growth
Entrepreneurs slowly gaining confidence
After two years of contraction the rebound in
investment in equipment observed since mid-2013
is expected to continue eased by favourable
corporate lending conditions The unexpected
relative resilience of economic growth in 2013 as a
whole seems to have boosted business confidence
and the tax credit for competitiveness is expected
to have gradually a positive effect on firms
financial situation However the full impact of this
measure on investment may take some time to
materialise The expected rise in aggregate demand
and in capacity utilisation is set to translate into a
firm turnaround in investment only from 2015 The
Responsibility Pact announced in January 2014
has not been taken into account in this forecast as
it is not sufficiently specified yet
Limited improvement in export performance
Exports are projected to accelerate from 2014 on
the back of the assumed rebound in world demand
The recent competitiveness reforms could
gradually reduce the pace of losses in export
market shares albeit without reversing the trend
Export growth is projected to remain slightly
below that of world demand over the forecast
horizon With imports picking up due to the
gradual increase in domestic demand net exports
are expected to provide a nil contribution to
growth in 2014 and to dampen it again in 2015
Decelerating unemployment low inflation
In a context of subdued growth employers are
likely to favour increasing productivity over job
creation throughout 2014 In addition the potential
positive impact of the recent labour market reform
is only expected to be visible from 2015 Only
subsidised job schemes in the public sector are
assumed to stimulate total employment in 2014
Meanwhile the persistent expansion of the labour
force should maintain the unemployment rate at a
high level over the forecast horizon
The incipient recovery is expected to firm up somewhat in the course of 2014 and in 2015 mainly
supported by a timid pick-up in domestic demand on the back of increasing confidence Unemployment
is set to decelerate and inflation to remain low but no improvement in the current account balance is in
sight The general government balance is expected to improve only slightly in 2014
Member States France
67
The moderate price increase at the end of 2013
(08 y-o-y in December) contracting energy
prices and still modest activity growth are set to
mitigate the impact of the VAT increases on
inflation which is set to reach 12 in 2014 after
having bottomed out at 10 in 2013 In 2015
inflation is expected to stabilise on the back of a
gradual closure of the output gap
Room for measured optimism
In case of a job-richer recovery private
consumption could accelerate further In addition
an earlier specification of the announced
Responsibility Pact could improve business
confidence with positive impact on investment
Deficit targets at risk
In 2013 the general government deficit is expected
to have decreased to 42 of GDP based on the
latest data available In particular the outcome for
the state budget showed a 01 of GDP deviation
from the forecast underpinning the draft budget for
2014 Shortfalls in tax revenue proved higher than
expected while spending was kept under control
In addition preliminary information suggests that
healthcare spending was slightly below target
In 2014 the deficit is set to decrease further on the
back of the measures adopted notably as part of the
budget On top of existing spending rules (central
government and healthcare) measures include new
provisions on how annual pension increases are
linked to inflation In addition the 2010 pension
reform which will (with some exceptions)
gradually lead to an increase in the minimum
retirement age from 60 to 62 will bring additional
savings Contrary to previous years the tax burden
is forecast to remain broadly unchanged at around
46 of GDP Overall the deficit is forecast to
reach 40 of GDP in 2014
The structural balance is estimated to improve by
frac34 and frac12 of GDP in 2013 and 2014
respectively Overall the structural effort is
projected to fall short of the levels recommended
by the Council in both years Under the no-policy-
change assumption the general government
balance is set to improve in 2015 reflecting
recovering tax revenues partly offset by projected
expenditure developments
The general government debt to GDP ratio which
is projected to have almost reached 94 of GDP in
2013 will continue to rise on the back of still high
public deficits relative to nominal GDP growth
bn EUR Curr prices GDP 94-09 2010 2011 2012 2013 2014 2015
20323 1000 17 17 20 00 03 10 17
11723 577 19 16 06 -03 04 06 16
5027 247 13 18 04 14 17 12 14
4018 198 23 14 29 -12 -19 09 33
1054 52 30 112 82 -30 -20 32 51
5576 274 38 95 54 24 06 44 56
6026 297 47 89 51 -11 07 40 58
20672 1017 18 19 21 -04 02 09 17
18 16 10 -01 03 08 19
01 01 11 -08 01 01 00
-02 00 00 10 -01 00 -02
07 00 07 00 -04 03 05
95 97 96 102 108 110 110
25 25 25 22 16 13 16
15 07 12 21 10 07 04
-01 -03 -01 06 -01 -06 -09
150 156 156 152 150 147 146
16 10 13 15 11 13 13
17 17 23 22 10 12 12
00 -23 -26 -10 06 -09 -01
-01 -26 -36 -31 -28 -29 -31
04 -19 -25 -21 -19 -20 -22
04 -18 -25 -22 -19 -20 -21
-35 -71 -53 -48 -42 -40 -39
-38 -59 -46 -36 -26 -25 -27
- -57 -47 -36 -28 -23 -27
616 824 858 902 939 961 973
Net lending (+) or borrowing (-) vis-a-vis ROW (c)
(a) Eurostat definition (b) gross saving divided by gross disposable income (c) as a percentage of GDP
Cyclically-adjusted budget balance (c)
Real unit labour cost
Imports (goods and services)
General government balance (c)
Unit labour costs whole economy
Inventories
Terms of trade goods
Table II101
Net exports
Public Consumption
Trade balance (c)
Employment
Annual percentage change2012
GDP
Private Consumption
Exports (goods and services)
GNI (GDP deflator)
Structural budget balance (c)
Saving rate of households (b)
Main features of country forecast - FRANCE
Unemployment rate (a)
Gross fixed capital formation
Current-account balance (c)
Contribution to GDP growth
General government gross debt (c)
GDP deflator
Compensation of employees fte
of which equipment
Domestic demand
Harmonised index of consumer prices
11 CROATIA Muted growth prospects amid a high fiscal deficit and rising debt
68
Economic activity declines further
Real GDP is forecast to have contracted by 07
in 2013 which would be the fifth year of
recession with real GDP being almost 12 lower
compared to 2008 Both domestic demand and net
exports are expected to have contributed
negatively to growth in 2013
After decreasing by 06 y-o-y in the third quarter
of 2013 real GDP is expected to have remained
negative in the fourth quarter according to
available indicators Retail trade activity fell
markedly in the fourth quarter while monthly trade
data also showed sharp declines By contrast after
a decline in the second and third quarter industrial
production improved slightly in the fourth quarter
Muted recovery in 2014
In 2014 real GDP is forecast to grow by 05 on
current policies Net exports of goods and services
and investment are expected to be the main
contributors to growth The projected pick-up in
investment in 2014 is expected to be led by the
public sector assuming increased recourse to EU
funds Growth in private investment is expected to
remain constrained due to fragile domestic demand
and ongoing bank deleveraging Croatian exports
are forecast to benefit from the gradual economic
recovery in the EU but to a limited extent because
of comparatively less favourable developments in
Italy and Slovenia two of the countryrsquos major
trading partners Furthermore goods exports will
be held back by the narrow manufacturing base
and still ongoing restructuring in some important
industries
Private consumption is expected to contribute
negatively to growth in 2014 due to a worsening
labour market situation and ongoing deleveraging
of households Employment fell in the last part of
2013 and is expected to stagnate in 2014 Wage
growth dynamics would remain weak in view of
the muted recovery However low inflation is
forecast to provide a partial cushion limiting
losses in purchasing power
In 2015 a modest recovery is expected on the back
of a mild upturn in domestic demand Recent
legislative changes to improve the business
conditions and the increased availability of EU
funds are expected to underpin investment activity
Owing to a high foreign component the foreseen
pick-up of investment in 2015 is expected to drive
up imports
-12
-10
-8
-6
-4
-2
0
2
4
6
09 10 11 12 13 14 15
pps
Graph II111 Croatia - Real GDP growth and
contributions
Inventories Net exports
Dom demand excl invent Real GDP (y-o-y)
forecast
Inflation expected to remain low
Weak economic activity is set to lead to stagnation
in employment in 2014 followed by a mild
improvement in 2015 the unemployment rate is
expected to stabilise in 2014 at around 176 and
to decline somewhat in 2015
Inflation slowed down significantly towards the
end of the year This reflects the combined effect
of absence of import price pressures weak
domestic demand and lower processed food prices
Producer prices have also been declining on a
y-o-y basis since August It is expected that
consumer price inflation will remain low over the
forecast horizon It is forecast to be at 13 in
2014 partly owing to the fading out of the impact
of the preferential VAT rate increase from 0 to
5 in January 2013 and increase slightly in 2015
The hike in the intermediate VAT rate from 10
to 13 in January 2014 is expected to lead to a
limited upward impact on prices
After five years of recession Croatias real GDP is forecast to grow by 05 in 2014 supported by
exports and investments Growth is expected to strengthen in 2015 as a result of a mild upturn in
domestic demand The headline general government deficit is expected to improve in 2014 and 2015
mainly due to one off effects
Member States Croatia
69
Risks are mainly on the downside
Heightened competitive pressures in the wake of
EU accession are already apparent in some sectors
of the economy like retail trade and it may take
longer to restore trade flows affected by the exit
from the CEFTA area A further contraction in
domestic credit especially to SMEs may also pose
a growth risk Furthermore the capacity to absorb
EU funds in the near-term will be a key factor
determining the achievability of projected
investment gains
High fiscal deficit and rising debt
The general government deficit is expected to have
reached 60 of GDP in 2013 On the revenue side
this deterioration mainly reflects shortfalls in
corporate income tax and social contributions and
on the expenditure side increases in social benefits
and interest expenses Measures such as the
reduction in public sector wage bill dampened the
expenditure increase in 2013
For 2014 this forecast incorporates the 2014
budget act and the legislative changes to the
pension system adopted by parliament in January
but not the budget revision or any additional
measures still under discussion Under the ESA95
accounting rules the headline general government
deficit is expected to improve to 54 and 48 of
GDP in 2014 and 2015 respectively mainly as a
result of the one off effect of transferring a part of
the second pillar to the first pillar in these two
years Under the new accounting rules that will
come into force this autumn (ESA2010) such
transfers will not count as revenue anymore The
structural balance is expected to deteriorate in
2014 due to the combination of increases in
general government expenditure such as
investment and interest expenditure On the
revenue side the collection of indirect taxes is
expected to recover somewhat
The ratio of public debt to GDP is forecast to
increase over the forecast period from 555 in
2012 to 687 in 2015 on the back of persistently
high deficits and subdued nominal GDP growth
Risks to the fiscal forecast seem skewed to the
downside mainly owing to worse than expected
macro-economic prospects
bn HRK Curr prices GDP 94-09 2010 2011 2012 2013 2014 2015
3302 1000 - -23 00 -20 -07 05 12
1987 602 - -13 02 -29 -07 -05 05
653 198 - -21 -06 -08 00 03 05
607 184 - -150 -64 -46 -03 20 40
- - - - - - - - -
1433 434 - 48 20 04 -13 25 30
1409 427 - -28 13 -21 -07 17 32
3187 965 - -19 -08 -19 04 04 07
- -50 -14 -28 -05 02 12
- -01 11 -02 00 00 00
- 29 03 11 -03 03 00
- -51 -23 -39 -25 -02 05
- 118 135 159 176 176 172
- 19 30 32 22 10 18
- -11 07 12 04 03 11
- -19 -13 -08 -14 -11 -06
- - - - - - -
- 08 20 20 19 14 18
82 11 22 34 23 13 15
- 04 07 00 07 10 05
- -139 -145 -143 -147 -144 -146
- -09 -11 -02 08 13 09
- -09 -11 -02 08 13 09
- -64 -78 -50 -60 -54 -48
- -51 -71 -40 -52 -49 -44
- -51 -71 -40 -47 -57 -50
- 449 516 555 649 674 687
Net lending (+) or borrowing (-) vis-a-vis ROW (c)
(a) as of total labour force (b) gross saving divided by gross disposable income (c) as a percentage of GDP
Cyclically-adjusted budget balance (c)
Real unit labour cost
Imports (goods and services)
General government balance (c)
Unit labour costs whole economy
Inventories
Terms of trade goods
Table II111
Net exports
Public Consumption
Trade balance (c)
Employment
Annual percentage change2012
GDP
Private Consumption
Exports (goods and services)
GNI (GDP deflator)
Structural budget balance (c)
Saving rate of households (b)
Main features of country forecast - CROATIA
Unemployment rate (a)
Gross fixed capital formation
Current-account balance (c)
Contribution to GDP growth
General government gross debt (c)
GDP deflator
Compensation of employees head
of which equipment
Domestic demand
Harmonised index of consumer prices
12 ITALY A slow recovery is underway
70
After a severe recession the economy
returned to growth at the end of 2013
The contraction in output recorded since mid-2011
came to a halt with economic activity posting a
moderate increase in the last quarter of 2013 Over
the year real GDP is estimated to have declined by
19 (after -25 in 2012) The strong fall in
domestic demand acted as a drag on the economy
due to persistently tight financing conditions and
high uncertainty holding back consumption and
investments
In 2014 a recovery is expected to set in driven by
the tradable sector Confidence in manufacturing
points to expansion thanks to new export orders
As external demand strengthens ndash also from
euro-area trade partners ndash industrial activity is
expected to increase and the service sector is set to
follow suit As a result real GDP is projected to
grow by 06 Domestic demand is also forecast
to contribute positively to output growth mainly
driven by investment in equipment as capacity
utilisation is projected to increase in particular in
exporting firms Investment in construction
instead is forecast to further decline also in light
of persistently tight credit conditions With still
difficult labour market conditions private
consumption is expected to rise only marginally
and by less than disposable income as households
restore their savings
Italian banks are expected to continue adjusting
their balance sheets which should pave the way to
more favourable credit conditions for firms and
households This is set to support domestic
demand and ultimately output growth in 2015 at
12 As also imports accelerate the current-
account surplus is forecast to stabilise slightly
above 1 of GDP in 2014-15
Feeble demand and high unemployment are
set to keep inflation low
The labour market is set to adjust with a lag to
improving economic conditions and the recovery
to start from a rise in working hours After the
significant drop recorded in 2013 headcount
employment is expected to fall further in 2014
although only marginally As labour supply
remains fairly stable unemployment is set to
decline only slightly from the 128 peak recorded
in November 2013 Sustained unemployment is
expected to decrease wage pressures and to
restrain wage growth This coupled with slightly
improving productivity entails only moderate
increases in nominal unit labour cost As the
economy strengthens in 2015 unemployment is set
to decline to 124 and wage dynamics to be more
sustained mainly on the back of the renewal of
public sector contracts
05
10
15
20
25
30
0
2
4
6
8
10
12
14
05 06 07 08 09 10 11 12 13 14 15
Graph II121 Italy - Unemployment and core inflation
Unemployment rate (lhs)
core HICP annual inflation (rhs)
forecast
The limited labour cost pressures together with
weak consumption and stable energy prices lead
the forecast for HICP inflation to fall to 09 in
2014 and then increase to 13 in 2015 as the
economic recovery strengthens
Government deficit on a decreasing path
The general government deficit is estimated at 3
of GDP in 2013 unchanged from 2012 Primary
expenditure is estimated to have increased by
nearly 1 y-o-y (after declining by around 15
over 2010-12) as the government settled overdue
trade debt which raised investment expenditure in
After contracting 19 in 2013 Italys economy is expected to stage a slow recovery in 2014 driven by
stronger external demand As credit conditions ease growth is expected to rise further in 2015
Unemployment peaked in late 2013 while inflation remains low The government structural primary
surplus ndash ie adjusted for the cycle and one-offs ndash is expected to stabilise at around 4frac12 of GDP over
2013-15
Member States Italy
71
2013 (by around 05 of GDP) However
government finances benefitted from declining
yields on sovereign bonds leading to a decrease in
interest expenditure (to 53 of GDP from 55 in
2012) As a result total expenditure is set to have
risen only marginally Higher revenues are set to
compensate for the spending rise thanks also to
additional taxation on the financial sector
offsetting the reduction in property taxes
In 2014 the headline deficit is projected at 26 of
GDP Interest expenditure is expected to stabilise
and the primary surplus to continue improving to
27 of GDP The moderate year-on-year increase
in primary expenditure is forecast to be more than
offset by an increase in current revenues in line
with nominal GDP growth while capital revenues
are set to fall on the back of expiring one-offs In
2015 the deficit is forecast to narrow to 22 of
GDP under a no-policy-change assumption mainly
thanks to higher growth
The structural balance is estimated to have further
improved in 2013 An additional marginal
improvement (to -06 of GDP) is also expected
in 2014 while the structural balance is set to
worsen in 2015 under a no-policy-change
assumption The structural primary balance is set
to stabilise at around 4frac12 of GDP in 2013-15
-1
0
1
2
3
4
5
6
42
43
44
45
46
47
48
49
03 04 05 06 07 08 09 10 11 12 13 14 15
Graph II122 Italy - Structural primary balance and
determinants ( of GDP)
Structural primary balance (rhs)
Structural revenues (lhs)
Structrul primary expenditure (lhs)
forecast
of GDP of GDP
After incorporating further 16 of GDP trade
debt arrear settlements and 05 privatisation
proceeds the general government debt-to-GDP
ratio is set to peak in 2014 (at nearly 134) and
then decline slightly in 2015 thanks to the higher
primary surplus and nominal GDP growth
bn EUR Curr prices GDP 94-09 2010 2011 2012 2013 2014 2015
15670 1000 10 17 05 -25 -19 06 12
9537 609 12 15 -03 -41 -25 01 09
3150 201 10 -04 -12 -27 -06 -06 04
2807 179 14 06 -22 -83 -55 16 37
1137 73 21 81 -07 -114 -43 53 58
4735 302 25 114 62 20 01 33 49
4558 291 35 126 08 -74 -29 30 55
15568 993 11 17 04 -26 -19 06 13
12 09 -08 -46 -26 03 13
00 11 -01 -07 -01 01 00
-01 -04 14 28 09 02 00
04 -11 01 -11 -18 01 05
91 84 84 107 122 126 124
29 28 13 10 13 11 15
23 00 10 25 13 07 08
-04 -04 -04 08 00 -04 -06
173 124 119 116 128 131 132
28 04 14 17 13 11 14
26 16 29 33 13 09 13
-02 -39 -36 -10 16 10 00
14 -13 -11 11 23 28 28
01 -35 -31 -05 09 13 12
03 -35 -30 -03 09 14 13
-39 -45 -38 -30 -30 -26 -22
-44 -35 -31 -13 -06 -06 -09
- -37 -38 -14 -08 -06 -08
1110 1193 1207 1270 1327 1337 1324
Net lending (+) or borrowing (-) vis-a-vis ROW (c)
(a) Eurostat definition (b) gross saving divided by gross disposable income (c) as a percentage of GDP
Cyclically-adjusted budget balance (c)
Real unit labour cost
Imports (goods and services)
General government balance (c)
Unit labour costs whole economy
Inventories
Terms of trade goods
Table II121
Net exports
Public Consumption
Trade balance (c)
Employment
Annual percentage change2012
GDP
Private Consumption
Exports (goods and services)
GNI (GDP deflator)
Structural budget balance (c)
Saving rate of households (b)
Main features of country forecast - ITALY
Unemployment rate (a)
Gross fixed capital formation
Current-account balance (c)
Contribution to GDP growth
General government gross debt (c)
GDP deflator
Compensation of employees fte
of which equipment
Domestic demand
Harmonised index of consumer prices
13 CYPRUS Recession bottoms out while adjustments are underway
72
Note This forecast was finalised early
February after the third quarterly review of
the Economic Adjustment Programme and will
be revisited during the fourth quarterly review
The recession in 2013hellip
Economic activity is expected to have contracted
by 60 in 2013 which is significantly lower than
projected in the autumn 2013 forecast This
reflects on one hand resilient performance of the
tourism and professional service sectors and on
the other hand a smaller-than-anticipated decline
in private consumption A substantial adjustment
in prices and wages also helped curb the decline in
real GDP Nevertheless several factors continued
to weight on economic growth including tight
credit conditions private and public sector
deleveraging and worsening labour market
conditions Reflecting the significant contraction
in domestic demand imports fell further leading
to a positive contribution of external demand to
GDP growth The fourth-quarter flash estimate
released after the finalisation of this forecast
suggests a milder recession than envisaged in the
third review mission
hellip will extend into 2014hellip
Business sentiment and consumer confidence
indicators suggest a continuation of the recession
The real GDP is projected to decline by -48 in
2014 with domestic demand weighed down by the
need for an adjustment of private and public sector
debt from currently high levels Tight credit
conditions will continue to act as a drag on growth
Downward wage adjustments are expected to
continue weighing on disposable income On the
back of further shrinking of imports and a lesser
fall in exports a positive contribution to growth is
expected from net trade
hellipbefore coming to an end in 2015
In 2015 the recession is expected to come to an
end with growth seen to resuming gradually as
private domestic demand regains strength The
restoration of a sound and well-capitalised banking
sector and the gradual deleveraging of both
households and corporates are expected to
progressively remove the impediments to more
balanced growth Export of goods and services are
forecast to grow accompanied by a marginal
increase in imports
Labour market conditions to improve from 2015
Unemployment is projected to peak in 2014 before
falling slightly in 2015 Unit labour costs are
expected to edge further down driven by a further
decline in compensation of employees The
associated weak domestic cost pressure and
sizeable spare capacity will contain HICP inflation
over the forecast horizon despite indirect tax rate
hikes in 2013 and 2014
Downside risks remain
Risks are tilted to the downside On the domestic
front a more protracted period of tight credit
supply conditions could pose considerable risks to
the real economy In addition a slower reduction
of households debt could prolong the needed
deleveraging process Moreover a further
worsening of labour market conditions may lead to
a more prolonged weakness of business and
consumer confidence
-15
-10
-5
0
5
10
15
-12
-9
-6
-3
0
3
6
9
12
08 09 10 11 12 13 14 15
Graph II131 Cyprus - Real GDP growth and
contributions
Output gap (rhs) Dom demand excl inv
Inventories Net trade
Real GDP (y-o-y)
forecast
pps of GDP
The unwinding of macroeconomic imbalances weighed significantly on economic activity and sentiment
in 2013 The recession is expected to ease in 2014 and growth is set to return in 2015 as domestic
demand recovers Following a better-than-expected performance last year the fiscal situation is set to
improve further this year and next
Member States Cyprus
73
Fiscal adjustment underway
Against the background of the milder recession
and thanks to the significant consolidation efforts
undertaken in line with the programme
requirements the general government deficit for
2013 is estimated to be significantly better than
projected earlier reaching 55 of GDP However
the deficit is project to widen slightly to -58 of
GDP in 2014 This is mainly due to falling profits
as well as declining wages and employment in the
private and public sectors that are expected to
translate into lower revenues from direct taxes
Further drop in private consumption is set to weigh
on the revenues from indirect taxes On the
expenditure side further effort to reduce the public
sector wage bill intermediate consumption and
other current expenditure is projected to outweigh
the increase in social transfers driven by the further
worsening labour market conditions
In 2015 the improving macroeconomic situation
and better labour market conditions are expected to
support revenue from taxes and social
contributions while total expenditure is projected
to remain largely unchanged with higher pension
payments in the private pension scheme largely
offset by a deceleration of the retirement wave in
the public sector
After a sharp increase in 2013 the debt-to-GDP
ratio is expected to further increase in 2014 and
2015 broadly reflecting the macroeconomic
conditions
mio EUR Curr prices GDP 94-09 2010 2011 2012 2013 2014 2015
178868 1000 38 13 04 -24 -60 -48 09
120873 676 - 15 13 -25 -75 -63 07
34382 192 - 10 -02 -31 -60 -15 -27
24300 136 - -49 -87 -196 -240 -181 13
7573 42 - -69 -154 -155 -225 -140 30
77102 431 - 38 44 -27 -48 -27 19
81801 457 - 48 -02 -64 -147 -72 02
172962 967 37 24 56 -73 -58 -62 22
- 02 -08 -56 -98 -67 01
- 18 -07 12 -06 01 00
- -07 19 19 47 19 08
- -02 05 -42 -57 -44 08
- 63 79 119 160 192 184
- 26 25 -09 -50 -30 09
- 11 25 -27 -47 -26 08
- -09 -03 -46 -25 -32 -07
- 192 152 128 99 122 147
29 19 28 19 -23 06 15
- 26 35 31 04 04 14
- -09 -18 -11 -13 -04 -05
- -268 -242 -215 -183 -169 -167
- -92 -35 -68 -17 00 04
- -90 -33 -67 02 10 13
- -53 -63 -63 -55 -58 -61
- -53 -64 -60 -40 -35 -52
- -53 -62 -64 -38 -45 -52
- 613 711 858 1120 1215 1258
Net lending (+) or borrowing (-) vis-a-vis ROW (c)
(a) Eurostat definition (b) gross saving divided by gross disposable income (c) as a percentage of GDP
Cyclically-adjusted budget balance (c)
Real unit labour cost
Imports (goods and services)
General government balance (c)
Unit labour costs whole economy
Inventories
Terms of trade goods
Table II131
Net exports
Public Consumption
Trade balance (c)
Employment
Annual percentage change2012
GDP
Private Consumption
Exports (goods and services)
GNI (GDP deflator)
Structural budget balance (c)
Saving rate of households (b)
Main features of country forecast - CYPRUS
Unemployment rate (a)
Gross fixed capital formation
Current-account balance (c)
Contribution to GDP growth
General government gross debt (c)
GDP deflator
Compensation of employees head
of which equipment
Domestic demand
Harmonised index of consumer prices
14 LATVIA Economic growth and job creation continue at a sound pace
74
GDP growth remains strong
Latvias economy expanded by 4 in 2013
according to the latest flash estimate slower than
the 52 growth in 2012 but still at the fastest rate
in the EU Private and public consumption as well
as net exports supported the overall economic
growth while investments and negative changes in
inventories weighed on the downside
-30
-25
-20
-15
-10
-5
0
5
10
15
20
25
04 05 06 07 08 09 10 11 12 13 14 15
pps
Dom demand ex invent Inventories
Net exports Real GDP (y-o-y)
forecast
Graph II141Latvia - Real GDP growth and contributions
Growth is projected to remain high at 42 in
2014 and 43 in 2015 as investments are set to
rebound on the basis of improving business
sentiment and higher external demand Positive
business reactions to the recent euro changeover
are also seen as supportive to investment
Corporate profits and EU funding are likely to
remain major financing sources for investors as
banking sector deleveraging is still under way
Overall domestic demand and exports are
projected to increase at similar rates However
investment in capital goods is expected to push
imports to a higher growth rate than exports
resulting in a slightly negative net external
contribution to GDP growth
External position keeps improving
The current-account deficit is forecast to remain
below 3 of GDP over the forecast horizon Net
inflows in the capital account linked mostly to EU
structural funds are set to exceed the current-
account outflow keeping the countrys net external
debt on a downward path Suspended production at
the metallurgical plant in Liepaja weighed heavily
on both exports and imports in 2013
Consequently export performance relative to
growth in trading partners deteriorated in gross
terms but in net terms taking out Liepajas re-
exports the countrys external sustainability
indicators improved
Unemployment to drop below 10 by 2015
Unemployment dropped to 119 in 2013 from
15 in 2012 and the downward trend is set to
continue over the forecast period The minimum
wage hike in 2014 and some shortage of skills on
specific labour segments are likely to accelerate
wage growth and restrain job creation
Nevertheless unemployment is expected to fall
below 10 by 2015 marking a steep improvement
from the peak of 195 in 2010 but well above the
record low of 61 in 2007 Unit labour costs are
projected to retain a moderate growth in 2014-15
broadly in line with the dynamics in trading
partners
Electricity and service prices set to rise
HICP inflation was close to zero in 2013 mainly
due to falling energy prices which offset the
gradual increase in core inflation However the
forthcoming deregulation of household electricity
prices as of April 2014 and the steady advance in
service prices are set to push up inflation to 19
in 2014 and 21 in 2015 The first price
monitoring reports on the euro adoption at the
beginning of 2014 show minor inflation effects
related to rounding and passing on of changeover
costs to consumers The overall one-off impact
from the changeover is therefore expected to
remain within the previously forecast range of
02 ndash 03 pp
Growth is expected to marginally exceed 4 over the forecast horizon driven by domestic demand
rebounding exports and improved business sentiment supported by the recent euro changeover Job
creation is set to continue bringing unemployment below 10 by 2015 amid moderate inflation The
outlook for public finances remains stable with a low deficit of around 1 of GDP and a declining
public debt ratio
Member States Latvia
75
Favourable borrowing conditions reflect
markets confidence
In the last months of 2013 the cash balance of the
general government expectedly turned negative
resulting in an annual cash deficit of 05 of GDP
This cash deficit is mostly attributable to local
governments whereas the central governments
position was near-balanced The adjusted general
government deficit according to EDP reporting
requirements is expected to be higher at 13 of
GDP reflecting notably a guarantee call of 03
of GDP involving the Liepaja metallurgical plant
that is currently in a standstill as well as other
adjustments
The general government deficit is expected to
stabilise at around 1 of GDP in 2014 and 2015
based on current policies For 2014 these policies
are fixed in the 2014 budget law that was adopted
by the Parliament on 7 November 2013 For 2015
the planned measures include a 1 pp cut in the
personal income tax rate and a 1 pp increase in
state contributions to the privately managed funded
pension scheme These revenue-reducing measures
are partly offset by a conservative pension
indexation rule It is however not excluded that
this rule could be revised in the context of 2015
budget negotiations Falling interest expenditure
from 2015 provides another significant cause of
decline in the expenditure-to-GDP ratio
As borrowing initially planned for the end of 2013
took place only in early 2014 the debt-to-GDP
ratio did not increase in 2013 as previously
expected In January 2014 the authorities issued a
7-year bond in the amount of EUR 1 billion
(around 4 of GDP) with a favourable yield of
2815 The issuance aims to finance the first
repayment covering one-third of the outstanding
obligations to the EU under the balance-of-
payments facility This repayment is due in March
2014 Subject to continuous favourable market
sentiment the authorities intend to borrow further
in the course of 2014 in order to pre-finance
another large repayment to the EU due in 2015
After this repayment will be made and the need to
keep the current high level of precautionary
financial buffers elapses debt is expected to
decline to around 33 of GDP by end-2015
mio EUR Curr prices GDP 94-09 2010 2011 2012 2013 2014 2015
220826 1000 41 -13 53 52 40 42 43
137723 624 - 23 48 58 55 49 51
35428 160 - -79 11 -02 27 20 17
50330 228 - -181 279 87 -02 52 69
18674 85 - - - - - - -
136004 616 - 125 124 94 09 45 59
144709 655 - 118 223 45 -03 48 67
220545 999 46 -65 38 45 40 40 42
- -40 83 54 38 45 50
- 26 26 -28 -05 00 00
- 01 -56 26 07 -03 -07
-18 -67 15 14 21 20 20
132 195 162 150 119 105 92
153 -49 50 73 43 50 46
88 -101 12 35 23 28 23
-04 -93 -46 01 07 05 00
- - - - - - -
93 -09 60 33 16 23 23
- -12 42 23 00 19 21
- 11 58 -38 03 00 00
-159 -70 -108 -104 -92 -93 -98
-79 29 -23 -25 -16 -19 -25
-66 49 -02 05 09 06 00
-19 -81 -36 -13 -13 -10 -10
- -47 -17 -07 -13 -15 -18
- -30 -15 -02 -13 -15 -18
- 444 419 406 384 387 327
Net lending (+) or borrowing (-) vis-a-vis ROW (c)
(a) Eurostat definition (b) gross saving divided by gross disposable income (c) as a percentage of GDP
Cyclically-adjusted budget balance (c)
Real unit labour cost
Imports (goods and services)
General government balance (c)
Unit labour costs whole economy
Inventories
Terms of trade goods
Table II141
Net exports
Public Consumption
Trade balance (c)
Employment
Annual percentage change2012
GDP
Private Consumption
Exports (goods and services)
GNI (GDP deflator)
Structural budget balance (c)
Saving rate of households (b)
Main features of country forecast - LATVIA
Unemployment rate (a)
Gross fixed capital formation
Current-account balance (c)
Contribution to GDP growth
General government gross debt (c)
GDP deflator
Compensation of employees head
of which equipment
Domestic demand
Harmonised index of consumer prices
15 LITHUANIA Solid growth continues in a context of macroeconomic stability
76
In 2013 domestic demand gradually replaced
net exports as the main growth engine
GDP growth remained strong in 2013 and is
estimated to have reached 32 despite a
slowdown in the second half of the year While in
the first quarter net exports were the main growth
driver the situation reversed in the second quarter
when the trade contribution turned negative and
domestic demand took over as the main engine for
growth Private consumption strengthened
supported by a substantial increase in wages low
inflation a robust labour market and strong
confidence indicators Investment soared in the
second half of the year on the back of high
capacity utilisation rates and positive sentiment
-15
-10
-5
0
5
-30
-25
-20
-15
-10
-5
0
5
10
15
08 09 10 11 12 13 14 15
pps
Graph II151 Lithuania - Real GDP growth and
contributions output gap
Output gap (rhs) Inventories
Net exports Dom demand excl invent
Real GDP (y-o-y)
forecast
Growth is set to accelerate on the back of
robust domestic demand
Looking ahead GDP is forecast to grow by 35
in 2014 and 39 in 2015 Private consumption is
set to continue benefitting from further increases in
disposable income of households due to the
recovering labour market accelerating wage
growth and low inflation Investment is expected
to grow as interest rates are low and companies
have significant financial reserves to finance
investments Moreover EU co-financed projects
will continue to support public investment over the
forecast horizon
Risks to the growth forecast are broadly balanced
a further slowdown in Russia might hamper
sentiment and exports while investment growth
might stall as some of it ndash both public and private
ndash was of a one-off nature connected to regulatory
changes and the Lithuanian EU Presidency On the
upside credit growth could pick-up
Net exports likely to remain a drag on growth
Export growth is set to remain subdued in early
2014 before picking up in accordance with an
improving external environment The positive
effect of the strong 2012 harvest on exports came
to an end in the second quarter of 2013 In
addition in the second half of 2013 the weak
performance of the fertiliser and refined petroleum
product industry started weighing on export
performance
Import growth has been fairly stable and is
expected to increase as private consumption and
investment strengthen Overall the contribution of
net exports to growth is expected to remain
negative over the forecast horizon The current
account is expected to show a slight surplus in
2013 before reverting to a moderate deficit in
2014 and 2015
Inflation set to remain below the long-term
average
HICP Inflation slowed to 12 in 2013 due to
exceptionally weak energy and food price
developments This trend is forecast to continue in
early 2014 with a slight pick-up expected
thereafter Inflation in the service sector is likely to
accelerate on the back of sustained wage growth
while energy and food inflation are set to remain
below average levels Overall HICP is forecast to
grow by 11 in 2014 and 19 in 2015
Financial sector ndash credit growth still subdued
Private sector deposits continued to grow in 2013
but credit to households stayed flat while credit to
enterprises marginally contracted Thus despite
Growth remained strong in 2013 and is set to continue at a steady pace in 2014 and 2015 with strong
domestic demand as the main growth engine Unemployment is forecast to decline but remain high
while inflation which slowed significantly in 2013 due to weak energy and food prices is set to pick up
moderately
Member States Lithuania
77
sufficient liquidity banks remain cautious in their
lending However households and enterprises
were able to finance a large amount of investments
from their own resources
Fiscal consolidation continues
In 2013 fiscal consolidation was supported by a
solid increase in direct taxes in particular
corporate income tax which compensated for a
shortfall in indirect taxes while expenditure
growth at central government level was ultimately
contained Fiscal results of local governments
however are expected to be weaker than a year
before An improving situation in the labour
market led to a smaller-than-planned deficit of the
social insurance fund Overall the general
government deficit is set to reach 27 of GDP in
2013
Going forward the deficit is forecast to decrease to
23 of GDP in 2014 mainly because of limited
expenditure increase Revenue losses from an
increase in non-taxable allowance are set to be
only partially compensated by an increase in
excise taxes on alcohol and tobacco products in
spring For 2015 under a no-policy-change
assumption the general government deficit is set
to reach 17 of GDP
Following the judgement of the Lithuanian
constitutional court on the compensation of
pension and public wage cuts the Lithuanian
government is expected to specify this spring when
and how it intends to compensate Thus there is a
risk that the general government deficit may turn
out higher than currently projected
The structural deficit is estimated to have
decreased from 3 of GDP in 2012 to 25 in
2013 and to continue decreasing over the forecast
horizon to 18 in 2015 General government
debt is estimated to have decreased slightly from
405 of GDP in 2012 to 395 in 2013 It is
projected to increase to 422 in 2014 due to the
pre-financing of a 2015 eurobond redemption
before falling back to 414 in 2015
bn LTL Curr prices GDP 94-09 2010 2011 2012 2013 2014 2015
1137 1000 36 16 60 37 32 35 39
720 633 - -36 48 39 47 38 43
200 176 - -34 03 06 15 16 17
189 166 - 19 207 -36 72 65 69
61 54 - 206 372 -48 135 90 97
955 839 - 174 141 118 65 66 69
945 831 - 179 137 61 66 70 74
1101 968 - -22 42 42 50 31 37
- -29 65 19 44 39 43
- 51 -05 -25 -12 00 00
- -06 00 42 00 -03 -03
-08 -119 05 18 15 15 13
102 178 154 134 118 104 96
163 72 63 38 44 38 46
114 -70 07 19 26 17 19
16 -91 -44 -07 09 01 -06
- 82 42 09 - - -
95 23 54 26 17 16 25
- 12 41 32 12 11 19
- 14 -06 -10 04 01 03
-105 -48 -58 -28 -25 -28 -30
- -04 -39 -11 01 -05 -07
- 34 -06 19 30 23 20
-31 -72 -55 -32 -27 -23 -17
- -48 -45 -29 -26 -23 -19
- -48 -45 -30 -25 -22 -18
- 378 383 405 395 422 414
Net lending (+) or borrowing (-) vis-a-vis ROW (c)
(a) Eurostat definition (b) gross saving divided by gross disposable income (c) as a percentage of GDP
Cyclically-adjusted budget balance (c)
Real unit labour cost
Imports (goods and services)
General government balance (c)
Unit labour costs whole economy
Inventories
Terms of trade goods
Table II151
Net exports
Public Consumption
Trade balance (c)
Employment
Annual percentage change2012
GDP
Private Consumption
Exports (goods and services)
GNI (GDP deflator)
Structural budget balance (c)
Saving rate of households (b)
Main features of country forecast - LITHUANIA
Unemployment rate (a)
Gross fixed capital formation
Current-account balance (c)
Contribution to GDP growth
General government gross debt (c)
GDP deflator
Compensation of employees head
of which equipment
Domestic demand
Harmonised index of consumer prices
16 LUXEMBOURG Robust growth above the euro-area average
78
Growth is picking up
GDP in 2013 is projected to have grown by 21
significantly higher than the euro-area average
After a disappointing performance at the beginning
of last year economic activity rebounded strongly
in the second and third quarters growing by 20
and 02 q-o-q respectively In the last quarter of
2013 and in line with soft and hard indicators
output is projected to have accelerated again
signalling that the economy could have entered a
period of relatively sustained expansion However
the recovery is expected to be fragile and uneven
across sectors
-8
-6
-4
-2
0
2
4
6
8
10
00 01 02 03 04 05 06 07 08 09 10 11 12 13 14 15
pps
Graph II161 Luxembourg - Real GDP growth and
contributions
Private consumption Public consumption
Investment Inventories
Net exports Real GDP (y-o-y)
forecast
Set for a gradual recovery
Overall output is expected to grow by 22 in
2014 and 25 in 2015 The full impact of the new
financial rules should be visible by 2015 and
although the potential of the financial sector to
expand is expected to be smaller than in the past it
is still projected to remain a positive contributor to
growth This coupled with higher households
confidence on the back of an improved labour
market as well as stronger investment backed by
better euro-area growth prospects is expected to
support domestic demand Moreover
manufacturing output is expected to have bottomed
out in 2013 and a mild recovery is projected over
the forecast horizon
Private consumption in the absence of new fiscal
consolidation measures is expected to accelerate
somewhat to 23 in 2014 and 26 in 2015
broadly in line with the increase in disposable
income Still consumption is hampered by
concerns about relatively weak labour market
developments given that job creation is projected
to be just sufficient to stabilise the unemployment
rate
With financial conditions remaining tight coupled
with a historically low level of capacity utilisation
and still weak demand from the main trading
partners firms are expected to postpone or freeze
their investment plans Investment is expected to
be led by specific sectors in particular purchases
from the aeronautic and satellite industry
Exports are set to improve on the back of better
prospects for external demand The contribution to
growth from external trade is projected to remain
positive throughout the forecast horizon However
it is set to decline slightly in 2014 as imports are
projected to record a more robust growth on the
back of buoyant internal demand
Risks relate to the capacity of the financial
sector to further expand
Risks to the forecast mainly stem from the capacity
of the financial sector to adapt to the changing
business and regulatory environment It will
determine not only the prospects for this industry
but given the size of the sector also the outlook
for the economy as a whole
Lower inflation and moderate job creation
Headline inflation has been falling during 2013
and is estimated to have reached 17 Increases in
administered prices partially offset less dynamic
oil prices Inflation is expected to marginally abate
in 2014 to 15 before bouncing back slightly in
2015
Job creation in 2013 weakened to 17 due to
labour shedding in the construction and the
Economic output is expected to continue growing significantly faster than the euro-area average While
the potential growth of the financial sector could have been dented its contribution should remain
positive Job creation looks set to continue albeit at a moderate pace Windfall revenues from
e-commerce related activities are set to gradually fade out from 2015 onwards
Member States Luxembourg
79
industrial sectors Employment creation is
projected to remain weak with a financial sector
undergoing an overhaul following the
implementation of new regulations which implies
labour adjustments Employment growth is then
projected to stabilise in 2014 at 17 and to
accelerate slightly in 2015 to 19 mainly thanks
to better prospects in the financial sector The
unemployment rate after peaking at 60 in 2014
is expected to drop to 59 in 2015
Buoyant revenues have a temporary positive
effect on government deficit
The general government deficit is projected to
have reached 02 of GDP in 2013 down from
06 in 2012 mostly due to windfall revenues
coming from e-commerce VAT-related activities
and to a lesser extent from the implementation of
the fiscal measures contained in the budget
Expenditure did not contribute much to the
improvement of the fiscal position given that the
consolidation package adopted by the government
with the 2013 budget was not able to contain the
rapid growth of government consumption
expenditure
In 2014 under the usual no-policy-change
assumption ie that does not include the upcoming
budget the deficit is expected to increase
marginally to 05 of GDP mainly reflecting the
dynamic growth in social spending
In 2015 the deficit is projected to increase
substantially to 24 of GDP as VAT revenues
from e-commerce will start to fade away The
initial budgetary impact of the drop in VAT
revenues is estimated at least at 1frac12 of GDP
Under the afore-mentioned no-policy-change
assumption the announced increase in general
VAT rates is not incorporated in this forecast as
the measure is not yet sufficiently specified
The surplus in the structural balance is expected to
stabilise in 2013 to fall by frac34 pp in 2014 and to
turn into a deficit in 2015 following a drop by
more than 2 pps
Government debt is projected to rise from around
24 of GDP in 2013 to slightly above 28 in
2015 as the surplus of the social security sector
cannot be used to finance the deficit of the central
government
mio EUR Curr prices GDP 94-09 2010 2011 2012 2013 2014 2015
428992 1000 36 31 19 -02 21 22 25
137735 321 25 26 13 22 20 23 26
75039 175 40 25 13 48 17 19 25
82753 193 41 -07 121 35 21 29 18
35414 83 29 217 224 183 40 38 12
760878 1774 64 72 54 -19 23 36 49
635894 1482 66 114 74 -10 23 39 53
292244 681 14 80 15 -12 25 26 31
26 12 28 22 13 16 16
-01 51 02 -04 00 00 00
12 -32 -10 -19 07 06 09
35 18 30 25 17 17 19
35 46 48 51 59 60 59
29 26 24 20 15 31 25
28 14 34 47 11 26 20
02 -54 -07 17 -26 -02 -07
- - - - - - -
25 72 42 30 39 28 27
- 28 37 29 17 15 17
01 51 22 -06 -17 09 01
-106 -102 -123 -142 -150 -153 -157
101 77 66 67 64 67 70
- 73 63 62 60 66 71
24 -08 01 -06 -02 -05 -24
21 03 08 10 10 03 -21
- 03 08 10 10 03 -21
76 195 187 217 243 255 281
Net lending (+) or borrowing (-) vis-a-vis ROW (c)
(a) Eurostat definition (b) gross saving divided by gross disposable income (c) as a percentage of GDP
Cyclically-adjusted budget balance (c)
Real unit labour cost
Imports (goods and services)
General government balance (c)
Unit labour costs whole economy
Inventories
Terms of trade goods
Table II161
Net exports
Public Consumption
Trade balance (c)
Employment
Annual percentage change2012
GDP
Private Consumption
Exports (goods and services)
GNI (GDP deflator)
Structural budget balance (c)
Saving rate of households (b)
Main features of country forecast - LUXEMBOURG
Unemployment rate (a)
Gross fixed capital formation
Current-account balance (c)
Contribution to GDP growth
General government gross debt (c)
GDP deflator
Compensation of employees head
of which equipment
Domestic demand
Harmonised index of consumer prices
17 HUNGARY A mild recovery sustained by domestic demand
80
Continued economic growth partially boosted
by indirect fiscal stimuli
After re-entering into recession in 2012 with a
17 decline Hungary experienced a real GDP
growth of 11 in 2013 partly reflecting the
correction of one-off adverse developments in
agriculture In 2013 investment turned positive
mainly as a result of public investment but
corporate investment also started to accelerate on
the back of the acceleration in the absorption of
EU funds and to some extent the central banks
extended Funding for Growth Scheme (FGS
providing subsidised lending to SMEs) A sharp
decline in inflation contributed to increasing
households real disposable income but the still
high unemployment and ongoing deleveraging
continued to put a drag on consumer spending
Altogether domestic demand became the main
driver of growth in 2013
Real GDP growth is expected to reach 21 both
in 2014 and 2015 driven by a further pick-up in
domestic demand while net exports are projected
to provide a nil contribution Yearly household
consumption is expected to return to positive
territory from 2014 due to further improvements in
real disposable income partly linked to the
regulated price cuts and increasing public sector
wages but also looser lending conditions as a
consequence of new subsidised mortgage schemes
However due to an oversupply in the market
housing investment is forecast to recover only
modestly Credit supply conditions to the corporate
sector will be only temporarily eased by the FGS
and together with a high absorption of EU funds
will contribute to a pick-up in investment activity
as well as a slight growth in firms net borrowing
Decreasing unemployment and low inflation
Despite a continuous increase in the participation
rate unemployment dropped below 10 by the
fourth quarter of 2013 as Labour Force Survey
(LFS) based employment increased by 16 in
2013 The continuous expansion of the Public
Work Scheme the increasing number of frontier
workers and the whitening of the economy
contributed to the improvement in the labour
market (18)
As the economy recovers domestic
employment in the private sector is also expected
to pick up and the unemployment rate is projected
to fall further below 10 over the forecast period
Inflation reached a historically low rate of 07 in
the last quarter of 2013 reflecting three successive
waves of cuts in regulated energy and other utility
prices Underlying inflation has also been on a
downward trend due to a negative output gap and
declining imported inflation However as the
output gap closes and the effect of utility price cuts
fades away inflation is expected to increase
gradually towards the central banks 3 target by
2015 The recent depreciation of the forint entails
some upward risk to the inflation projections
Risks to the GDP forecast are overall tilted to the
downside A tightening in global monetary
conditions may generate significant headwinds for
Hungary most notably through the revaluation of
FX denominated debt The main domestic risk is
related to the possible adoption of a new
comprehensive FX relief scheme with potential
negative effects on the banking sector and
investors sentiment As an upside risk stimulus
measures could have a bigger-than-expected effect
on investment
Government deficit expected to rebound to
3 of GDP
Cash-flow data for 2013 point to an
overachievement of the 27 of GDP deficit
target with the general government deficit
expected to reach 24 of GDP ie 05 lower
than in the autumn forecast (19)
The deficit-
(18) The effects of the latter two factors can be derived from the
difference between the LFS-based and GDP-consistent
employment figures as the latter which do not include
these effects grew at a slower pace The table below provides the GDP-consistent employment figures
(19) It is assumed that the budgetary transfer of 045 of GDP
to the integration body of the savings cooperatives will be recorded as a transfer within the government sector
However this is still subject to confirmation by Eurostat
Hungary emerged from recession in 2013 with GDP growing by 11 Growth is expected to accelerate
to around 2 in 2014 and 2015 primarily driven by domestic demand Preliminary annual data
indicate a government deficit at around 2frac12 in 2013 but it is forecast to rebound to around 3 of
GDP this year and next
Member States Hungary
81
decreasing developments include higher tax and
social security contribution proceeds (015 of
GDP) one-off revenue resulting from the shift of
the accounting method from public to total cost for
national co-payments for EU funds (01 of GDP)
as well as the end-year savings by budgetary
institutions and chapters (02 of GDP)
The 2014 deficit is projected to reach 30 of
GDP ie slightly above the target of 29 of
GDP The better-than-expected budgetary outturn
in 2013 has only a limited base effect which is
offset by additional spending measures rising
interest outlays and the modest nominal private
consumption growth Compared to the budgeted
figures tax revenues are projected to be lower by
over 03 of GDP due to a lower-than-expected
inflation as well as a more cautious assessment of
measures aiming to enhance tax administration
The forecast is based on the assumption that the
special reserve (03 of GDP) will not be spent
In 2015 the deficit is expected to decrease
somewhat to 29 of GDP The effect of economic
recovery and the assumed decline of public
investment linked to the electoral cycle will largely
be offset by the fall in one-off revenues from the
sale of telecommunication licenses
Regarding risks in 2013 the possibly higher local
government surplus could have further decreased
the deficit but the increased arrears in accrual
terms could have had an opposite effect For 2014
and beyond the revenue effect of the change of
method for the calculation of the national co-
financing represents a positive risk while a deficit-
increasing effect could result from a further
slowdown in inflation as well as an increase in
sovereign yields
After a moderate decrease of frac14 pp in 2013 the
structural balance is forecast to deteriorate further
in 2014 by more than 1 pp and to improve slightly
in 2015 The debt-to-GDP ratio is forecast to have
decreased in 2013 by 2 pps to 778 of GDP
exclusively on account of the end-year reduction in
the state cash deposits Thereafter it is projected to
increase again due to the revaluation of the FX
component
bn HUF Curr prices GDP 94-09 2010 2011 2012 2013 2014 2015
280481 1000 23 11 16 -17 11 21 21
153724 548 - -30 04 -16 00 15 16
57201 204 -01 -12 00 -12 11 15 20
48808 174 37 -85 -59 -37 32 60 44
21828 78 - -31 60 38 50 70 47
265517 947 129 113 84 17 51 53 61
244908 873 107 109 64 -01 50 59 66
265415 946 20 07 10 -18 21 22 21
18 -37 -09 -18 08 22 21
-01 38 04 -15 -01 00 00
07 09 21 16 04 -01 00
- 08 03 01 03 06 06
- 112 109 109 102 96 93
- -05 36 08 24 35 32
- -07 23 27 16 20 17
- -30 -03 -05 -05 -01 -06
- 108 107 74 90 90 79
104 24 26 32 22 21 23
- 47 39 57 17 12 28
- -02 -17 -12 03 01 01
-34 25 31 36 40 37 35
-62 04 06 11 29 27 26
-58 22 29 37 61 56 53
- -43 43 -20 -24 -30 -29
- -26 54 -02 -09 -20 -24
- -33 -41 -09 -11 -24 -23
- 822 821 798 778 791 789
Net lending (+) or borrowing (-) vis-a-vis ROW (c)
(a) Eurostat definition (b) gross saving divided by gross disposable income (c) as a percentage of GDP
Cyclically-adjusted budget balance (c)
Real unit labour cost
Imports (goods and services)
General government balance (c)
Unit labour costs whole economy
Inventories
Terms of trade goods
Table II171
Net exports
Public Consumption
Trade balance (c)
Employment
Annual percentage change2012
GDP
Private Consumption
Exports (goods and services)
GNI (GDP deflator)
Structural budget balance (c)
Saving rate of households (b)
Main features of country forecast - HUNGARY
Unemployment rate (a)
Gross fixed capital formation
Current-account balance (c)
Contribution to GDP growth
General government gross debt (c)
GDP deflator
Compensation of employees head
of which equipment
Domestic demand
Harmonised index of consumer prices
18 MALTA Private consumption to drive growth
82
Economic growth is projected to remain stable
Real GDP growth was relatively strong in the first
three quarters of 2013 largely on the back of the
change in inventories component which is used as
a residual item in national accounts Gains in
household consumption were offset by a further
decline in investment activity which is estimated
to have contracted for the third consecutive year
Trade volumes surprised on the downside but the
decline in exports was milder than that in imports
and thus external trade are seen to have had a
slightly positive contribution to growth Real GDP
is estimated to have increased by 2 in 2013 as a
whole up from a mild 09 growth in 2012
Real GDP growth is projected to remain largely
unchanged averaging 21 in 2014-15 Labour
market participation is set to remain on an upward
path largely reflecting higher activity by women
and older workers The job market is expected to
be able to fully absorb this inflow and the
unemployment rate is set to decline slightly
Favourable labour market conditions and the
positive impact of the announced reduction of
electricity tariffs are projected to support a further
improvement in household consumption With
capacity utilisation exceeding its long-term
average investment is projected to improve The
recovery however is set to be rather cautious in
an environment of low credit growth and higher
interest rates compared to the euro area
Improving domestic demand is expected to boost
import growth but overall net exports are
projected to continue to contribute positively to
real GDP growth and the current account is
forecast to remain in surplus over the forecast
horizon
Risks to the macroeconomic scenario are broadly
balanced The forecast assumes a stabilisation of
the investment-to-GDP ratio and thus a
continuation of the downward trend observed in
recent years would present a downside risk At the
same time the structural reforms that the
government has committed to enact in the energy
sector could lower costs for the economy and boost
domestic demand thus constituting an upside risk
particularly in 2015 No significant change in
financing conditions is projected to occur over the
forecast period
Price inflation gradually picks up
HICP inflation came in slightly below expectations
at 1 for the year as a whole in 2013 slowing
down from 32 in 2012 Deceleration came on
the back of lower prices of services offered in
restaurants and hotels This explains why the local
measure of inflation the Retail Price Index which
puts less emphasis on tourist services decelerated
less than HICP inflation Energy prices also
declined slightly in line with developments on
international markets
In 2014 the reduction in electricity tariffs is
projected to offset a rebound in services inflation
and keep overall price inflation at a relatively
moderate by Maltas historical standards 12
With the output gap estimated to have closed in
2014 the HICP is forecast to accelerate further to
19 in 2015 above the euro-area average
Budget deficit to stabilise
From 33 of GDP in 2012 the budget deficit is
expected to decrease to 30 of GDP in 2013
Current primary expenditure relative to GDP is
forecast to increase by 05 pp despite the spending
review at ministry level that started in July 2013
On the capital side net expenditure including the
planned additional equity injection into Air Malta
(06 of GDP) is expected to stabilise Indirect
taxes relative to GDP are projected to increase by
03 pp driven also by the recovery in
consumption in the second half of the year
Corporate profitability as well as a favourable
labour market outlook is expected to drive income
taxes despite measures to gradually reduce the
overall income tax levels
The 2014 budget includes mostly revenue-
increasing measures among which increases in
indirect taxation (mainly excise duties) a new
Real GDP growth is estimated to have reached 2 in 2013 and projected to maintain the same pace in
2014-15 Domestic demand is seen becoming the main driver of growth largely on the back of
recovering household consumption The general government deficit is projected to stabilise below 3 of
GDP
Member States Malta
83
programme to grant Maltese citizenship to foreign
individuals and families (against the payment of a
fee and investments in the country) and the
introduction of a new tax regime for rental income
On the expenditure side the budget envisages
some restrictions on recruitment Overall the
current revenue ratio is projected to increase by 02
pp of GDP while primary current expenditure is
forecast to stabilise The deficit is expected to
narrow to 27 of GDP In 2015 on a no-policy-
change assumption the deficit is projected to
remain at 27 of GDP
After having worsened by frac12 pp of GDP in 2012
the structural deficit is estimated to have improved
by 07 pp of GDP in 2013 despite the limited size
of the consolidation measures Thereafter the
structural deficit is projected to improve slightly
by 02 pp of GDP in 2014 before deteriorating by
03 pp of GDP in 2015 The debt-to-GDP ratio is
projected to reach 724 in 2014 and decrease to
715 in 2015 following the due repayment of
part of a loan from Air Malta
Downside risks relate to the financial situation of
Enemalta (the public energy utility corporation) as
well as higher than budgeted disbursement related
to the car VAT refund scheme
-7
-6
-5
-4
-3
-2
04 05 06 07 08 09 10 11 12 13 14 15
of GDP
Graph II181 Malta - General government nominal
and structural deficit
Nominal deficit Structural deficit
forecast
mio EUR Curr prices GDP 94-09 2010 2011 2012 2013 2014 2015
68507 1000 30 33 17 09 20 21 21
41100 600 - -03 33 -05 06 19 22
14504 212 - 16 41 52 12 10 08
10107 148 - 158 -215 -44 -20 13 18
3654 53 - 483 -473 -135 - - -
70259 1026 - 174 34 81 -29 40 59
66120 965 - 153 01 54 -39 37 59
64415 940 23 42 38 -04 16 17 17
- 25 -07 02 04 15 17
- -06 -05 -19 10 00 00
- 14 29 26 07 05 04
09 21 25 24 24 22 20
66 69 65 64 65 64 64
44 16 09 21 14 15 17
22 03 17 37 18 16 16
-02 -33 -06 14 -04 -01 -08
- - - - - - -
25 37 23 22 22 17 24
- 20 25 32 10 12 19
- -17 17 -02 05 01 01
-175 -192 -161 -136 -123 -121 -125
- -54 -10 11 17 09 05
- -37 00 28 39 32 29
- -35 -28 -33 -30 -27 -27
- -34 -27 -29 -28 -28 -31
- -45 -34 -38 -31 -29 -32
- 667 693 711 720 724 715
Net lending (+) or borrowing (-) vis-a-vis ROW (c)
(a) Eurostat definition (b) gross saving divided by gross disposable income (c) as a percentage of GDP
Cyclically-adjusted budget balance (c)
Real unit labour cost
Imports (goods and services)
General government balance (c)
Unit labour costs whole economy
Inventories
Terms of trade goods
Table II181
Net exports
Public Consumption
Trade balance (c)
Employment
Annual percentage change2012
GDP
Private Consumption
Exports (goods and services)
GNI (GDP deflator)
Structural budget balance (c)
Saving rate of households (b)
Main features of country forecast - MALTA
Unemployment rate (a)
Gross fixed capital formation
Current-account balance (c)
Contribution to GDP growth
General government gross debt (c)
GDP deflator
Compensation of employees head
of which equipment
Domestic demand
Harmonised index of consumer prices
19 THE NETHERLANDS Economic recovery takes shape after two years of recession
84
2013 the economy turning
In 2013 real GDP contracted by 08 due to weak
economic activity in the beginning of the year and
the negative impact of contraction in 2012 The
quarter-on-quarter economic growth turned
positive in the second and third quarters and
strengthened significantly in the fourth quarter
Growth of 07 was partly driven by exceptional
factors such as high investment in vehicles in
anticipation of a change in taxation as of this year
In 2014 quarterly growth is projected to remain in
positive territory albeit with modest quarterly
increases Real GDP growth is forecast to reach
10 in 2014
The fragile transition towards positive growth in
2013 was chiefly supported by net exports By
contrast domestic demand remained a drag on
activity despite gross fixed capital formation
rebounding in line with an improved business
outlook and is projected to remain sluggish in
2014 Private consumption will be still held back
by the unfavourable development of employment
and the incurred negative wealth effects over the
past years However from the second half of 2013
onwards soft indicators including consumer
confidence have shown an almost continuous
improvement which support an improved
economic outlook In 2014 domestic demand is
expected to gradually move towards positive
territory and to overtake net exports as the main
growth driver In particular investments are
picking up especially in the private sector
Private consumption is forecast to continue
shrinking but at a rate of 05 the decline is much
lower than in the past three years Private
consumption is projected to bottom out towards
the end of 2014 reflecting the positive effects
stemming from a gradually recovering housing
market as well as from lower taxes on labour and
lower pension and health care premiums
Following several years of negative developments
real disposable income is expected to modestly
increase
The forecast improvement of the economic
situation in the euro area provides a boost to Dutch
exports which are expected to grow by 29 in
2014 compared to 13 in 2013 Imports would
pick up in line with final demand Net exports are
expected to show a higher contribution to
economic growth in 2015
-4
-3
-2
-1
0
1
2
3
09 10 11 12 13 14 15
pps
Graph II191 Netherlands - Real GDP growth and
contributions
Inventories Net exports
Dom demand excl invent Real GDP (y-o-y)
forecastforecast
Risks to the macroeconomic scenario stemming
from domestic developments are predominantly on
the downside Higher than expected uncertainties
on the policy side regarding the implementation
and effects of foreseen measures in particular
related to health care and the labour market may
hamper the expected recovery of domestic
demand However a faster stabilisation of the
housing market could provide an additional boost
Initially rising unemployment subdued inflation
Unemployment rose sharply in the beginning of
2013 as a result of declining employment coupled
with an increase in labour supply (added worker
effect) Since mid-2013 the unemployment rate
has been relatively stable but mainly due to a
supply effect as unemployed massively retreated
from the labour market in response to negative
prospects for an economic recovery (discouraged
worker effect) The unemployment rate reached
67 in 2013 In view of the lagged response of
the labour market to the cycle the employment
Economic growth turned positive in the second quarter of 2013 and is projected to gain momentum in
2014 and 2015 Driven mainly by investments in 2014 growth will accelerate in 2015 thanks to rising
household consumption Unemployment is set to level off before slowly decreasing at the end of the
forecast horizon The budget deficit of the government will remain close to 3 of GDP
Member States The Netherlands
85
outlook remains fairly negative The
unemployment rate is forecast to increase in 2014
to 74 mainly as a result of negative
employment developments in the government and
health care sectors The unemployment rate is
projected to only ease slightly in 2015 to 72
In 2012 and most of 2013 HICP inflation stood
close to 3 notably due to higher energy prices
and the increased VAT rate as of October 2012 In
October 2013 inflation fell markedly to 13 as
the previous energy and tax increases dropped out
of the figures In line with the slow pickup in
domestic demand over the forecast horizon
inflation is expected to ease further to 11 in
2014 before increasing slightly to 13 in 2015
Deficit just below 3 of GDP in 2015
In 2014 the general government deficit is expected
to rise slightly to 32 of GDP from 31 in
2013 This rise masks ongoing fiscal tightening as
the 2013 headline deficit figures benefited from
positive one-offs (notably the sale of 4G telecom
licenses) Despite an additional consolidation
package of around 1 of GDP the 2014 general
government deficit would slightly worsen in
nominal terms reflecting sluggish economic
activity and the non-recurrence of temporary fiscal
measures impacting 2013 In addition the decision
to lower natural gas production in the coming
years is expected to have a limited deficit-
increasing impact of about 01 of GDP in both
2014 and 2015 On the back of ongoing
consolidation efforts and the expected
improvement in economic activity the headline
deficit is forecast to decline to 29 of GDP in
2015 Following an improvement of 09 of GDP
in 2013 the structural balance is expected to
stabilise in 2014 and 2015 The gross government
debt ratio is expected to increase from 743 of
GDP in 2013 to around 756 of GDP in 2015
Risks to the fiscal forecast mirror uncertainties on
the macroeconomic outlook However there are
also risks for the expected revenue from some of
the fiscal measures in 2014 (notably the temporary
tax reduction on accrued severance payments) and
planned expenditure savings in 2015
bn EUR Curr prices GDP 94-09 2010 2011 2012 2013 2014 2015
5993 1000 24 15 09 -12 -08 10 13
2733 456 20 03 -11 -16 -21 -05 10
1706 285 28 05 02 -07 -07 03 -09
1020 170 25 -74 61 -40 -49 57 31
358 60 38 -30 95 15 -50 57 40
5276 880 54 116 41 32 13 29 50
4772 796 56 103 42 33 -05 32 50
6050 1009 22 24 28 -06 -09 10 13
22 -11 06 -17 -20 07 07
00 11 01 02 -03 02 01
02 16 02 02 15 01 05
10 -06 05 -03 -12 -04 06
44 45 44 53 67 74 72
33 15 16 19 02 19 13
20 -06 12 29 -03 05 06
-02 -14 00 15 -20 -03 -16
145 105 116 107 102 109 110
22 08 11 13 17 08 22
21 09 25 28 26 11 13
05 -14 02 -04 11 -01 10
63 71 75 77 93 91 98
59 50 74 77 92 91 100
56 45 70 74 89 82 99
-13 -51 -43 -41 -31 -32 -29
-12 -43 -37 -27 -12 -17 -18
- -41 -37 -27 -18 -18 -18
590 634 657 713 743 753 756
Net lending (+) or borrowing (-) vis-a-vis ROW (c)
(a) Eurostat definition (b) gross saving divided by gross disposable income (c) as a percentage of GDP
Cyclically-adjusted budget balance (c)
Real unit labour cost
Imports (goods and services)
General government balance (c)
Unit labour costs whole economy
Inventories
Terms of trade goods
Table II191
Net exports
Public Consumption
Trade balance (c)
Employment
Annual percentage change2012
GDP
Private Consumption
Exports (goods and services)
GNI (GDP deflator)
Structural budget balance (c)
Saving rate of households (b)
Main features of country forecast - NETHERLANDS
Unemployment rate (a)
Gross fixed capital formation
Current-account balance (c)
Contribution to GDP growth
General government gross debt (c)
GDP deflator
Compensation of employees fte
of which equipment
Domestic demand
Harmonised index of consumer prices
20 AUSTRIA Timid recovery expected to gain traction
86
Domestic demand momentum is still low
The Austrian economy decelerated further in 2013
Investment growth turned negative private
consumption stagnated Net exports turned out
slightly better than the year before and helped
avoid a recession
Signs of a recovery are still difficult to detect in
the data available at the start of 2014 On the
whole business and consumer sentiment have
been trending up albeit somewhat inconsistently
Manufacturing orders have been recovering
throughout last year but order-book levels remain
thin Capacity utilisation is still on a subsiding
trend
-4
-3
-2
-1
0
1
2
3
4
-4
-3
-2
-1
0
1
2
3
4
08 09 10 11 12 13 14 15
of GDPpps
Graph II201 Austria - Real GDP growth and
contributions output gap
Output gap (rhs) Inventories
Net exports Dom demand excl invent
Real GDP (y-o-y)
forecast
hellipbut brightening sentiment is expected to start
bearing fruit
The projections for the following two years
assume a consolidation of business and consumer
confidence For 2014 and 2015 growth is
projected to regain some momentum and reach or
exceed 15 driven by a strengthening of
domestic demand Net exports are expected to
contribute positively to growth on the back of
higher export growth but to a smaller extent than
domestic demand due to a rebound in imports
In the environment of the perceived uncertainty
slowing foreign and stagnating domestic demand
that characterised 2012 and 2013 corporations
have been revising investment plans downwards
However low interest rates and solid corporate
liquidity are expected to reassure companies in
carrying out needed replacements and extensions
of capacity Credit growth is expected to remain
subdued though both on account of weak demand
and deleveraging needs in the banking system
The exporting sectors are forecast to benefit from
progressively improving external demand
conditions over the forecast horizon Capitalising
on non-cost competitiveness factors exports of
services have experienced an increase in market
shares in 2013 Manufacturing productivity has
been dented but wage growth has stayed moderate
Unit labour costs have thus increased in line with
those of trading partners leaving cost
competitiveness seemingly unimpaired All in all
the external balance is projected to stay positive
and to provide a positive contribution to growth
Dynamics of prices and wages to remain
stable
Employment growth eased in 2013 reflecting
stagnating output but is expected to strengthen
somewhat in 2014-15 as businesses do not indicate
intentions to shed labour However the increase in
the labour force will likely preclude a sizeable
decline in the unemployment rate in the coming
years
Nominal wage growth hardly exceeded inflation in
the latest quarters The wage settlements
applicable for the coming years are more
moderate However with inflation easing over the
forecast horizon and employment strengthening
real wage growth is projected to support
consumption growth
Consumer price inflation eased to 21 in 2013
due to slowing food and energy prices Energy
prices deflation is expected to help keep inflation
The second half of 2013 saw domestic demand growth resume While signs of a sustained broad-based
recovery are currently still scarce favourable financing conditions an improving external environment
and a stable labour market are expected to boost investment and consumption growth in the course of
2014-15 One-off measures are the main drivers of the reduction in the budget deficit in 2013 while
permanent measures have been taken to limit the deficit increase in 2014
Member States Austria
87
below 2 in 2014-15 Core inflation is also
expected to decelerate marginally thanks to
moderate wage and domestic demand growth
Upward trend in government deficit partially
contained
A sizeable one-off (07 of GDP) arising from the
sale of phone licences is the main driver of the
better-than expected deficit outcome forecast to
reduce to 17 of GDP in 2013 This income
coupled with the revenue from the tax agreement
with Switzerland (03 of GDP) also recorded as
positive one-off has more than offset the negative
impact of the support to the banking sector (06
of GDP) On the other hand low output growth
spurred the deficit in 2013
The government deficit is expected to increase to
21 in 2014 due to additional support required by
Hypo Group (03 of GDP) and to stronger trend
growth of pensions and unemployment
expenditure coupled with weaker growth in tax
revenues In January the new government adopted
a tax-package submitted to Parliaments approval
which is expected to raise revenue by about 02
of GDP in 2014 and 03 in 2015 The main
measures involve closing loopholes in group
taxation reducing deductibility in income taxes
and increasing some indirect taxes such as taxes on
products and car registration tax The effect of
higher expenditure growth and lower trend in
revenue will continue to have an impact in 2015
although the deficit is expected to decline to 18
of GDP
The structural deficit is projected at 15 in 2013
and expected to remain broadly stable in the
forecast horizon The general government debt is
expected to increase in 2013 reaching 746 of
GDP in 2013 while it is projected to start
decreasing in 2014 and further in 2015
This forecast does not include any estimate
regarding the cost stemming from the wind-down
of the Hypo Group which could entail an increase
in the stock of government debt The impact of any
resolution model on the government deficit is still
uncertain and it represents the main downside risk
affecting current deficit projections
bn EUR Curr prices GDP 94-09 2010 2011 2012 2013 2014 2015
3070 1000 21 18 28 09 03 15 18
1690 551 16 20 08 05 -02 08 10
584 190 19 02 03 02 01 08 08
658 214 11 -14 85 16 -07 24 32
251 82 16 21 143 21 -17 33 48
1756 572 53 94 66 12 23 48 60
1657 540 44 91 76 -03 04 46 56
3051 994 21 28 21 09 01 16 19
15 08 22 07 -02 11 13
01 05 08 -06 -07 00 00
05 05 -02 09 11 04 05
05 06 14 13 06 07 08
43 44 42 43 49 48 47
25 12 24 26 23 20 20
09 00 10 30 26 12 10
-05 -14 -10 13 11 -07 -07
- 140 120 126 130 136 141
13 14 20 17 15 19 17
17 17 36 26 21 18 18
-01 -15 -30 -14 05 03 -01
-15 -10 -25 -23 -15 -14 -13
05 36 15 18 29 34 38
04 37 14 16 28 35 38
-24 -45 -25 -25 -17 -21 -18
-24 -36 -24 -24 -13 -17 -17
- -32 -22 -16 -15 -14 -15
653 723 728 740 746 743 737
Net lending (+) or borrowing (-) vis-a-vis ROW (c)
(a) Eurostat definition (b) gross saving divided by gross disposable income (c) as a percentage of GDP
Cyclically-adjusted budget balance (c)
Real unit labour cost
Imports (goods and services)
General government balance (c)
Unit labour costs whole economy
Inventories
Terms of trade goods
Table II201
Net exports
Public Consumption
Trade balance (c)
Employment
Annual percentage change2012
GDP
Private Consumption
Exports (goods and services)
Note Contributions to GDP growth may not add up due to statistical discrepancies
GNI (GDP deflator)
Structural budget balance (c)
Saving rate of households (b)
Main features of country forecast - AUSTRIA
Unemployment rate (a)
Gross fixed capital formation
Current-account balance (c)
Contribution to GDP growth
General government gross debt (c)
GDP deflator
Compensation of employees fte
of which equipment
Domestic demand
Harmonised index of consumer prices
21 POLAND Regaining economic momentum
88
Domestic demand rebounds at last
In the last three months of 2013 real GDP
increased by 22 y-o-y up from 08 in the first
quarter In 2013 as a whole the economy expanded
by 16 in real terms The rebound of aggregate
economic activity was supported by robust export
growth on the back of geographical reorientation
towards dynamic markets and high cost-
competitiveness while sluggish domestic demand
contained import growth Private consumption was
held back by weak albeit recovering consumer
confidence and a relatively high rate of
unemployment Improving external demand led to
a pick-up in industrial output and fuelled corporate
investments offsetting the slowdown in public
investment spending
Recovery gathers steam in 2014 and 2015
The improving economic outlook in the main
trading partners and the resulting pick-up in Polish
exports are set to invigorate private investment and
the labour market which in turn is expected to
support the recovery of private consumption Real
GDP growth is forecast to accelerate to 29 in
2014 and to 31 in 2015 slightly above current
estimates of potential output growth
Private investment is set to remain buoyant over
the forecast horizon alongside the projected
recovery of global demand and private
consumption and on account of an already high
rate of capacity utilisation in the manufacturing
industry Cash accumulated by non-financial
companies and a gradual increase in credit supply
is expected to provide the necessary financing
Against the background of recovering economic
activity and growing employment the
unemployment rate is forecast to fall from 104
in 2013 to 101 in 2015 Coupled with contained
inflationary pressures this improvement is likely
to bolster real disposable income growth
However the saving rate of private households is
set to increase (net of the impact of the reversal of
the systemic pension reform) as consumers are
expected to gradually increase their savings
Overall the annual contribution of net exports to
real GDP growth is forecast is expected to be
significant in 2014 when domestic demand is still
recovering and to turn neutral in 2015 Against
this backdrop the current-account deficit is set to
remain below 2 of GDP
-4
-2
0
2
4
6
8
08 09 10 11 12 13 14 15
Graph II211 Poland - Real GDP growth and
contributions
Inventories Net exports
Dom demand excl invent Real GDP (y-o-y)
forecast
pps
The risks to the forecast are broadly balanced On
the upside a stronger depreciation of the złoty
would further boost exports and enhance import
substitution On the downside higher inflation
might dent real disposable incomes and slow down
private consumption growth
Supply side factors curb inflation
Falling energy prices subdued food prices and
weak domestic demand drove average HICP
inflation down to 08 in 2013 A moderate pick-
is expected in 2014 and 2015 to 14 and 2
respectively inter alia reflecting base effects in
2014 and moderate improvement in domestic
demand
After a marked slowdown in 2012-13 economic activity in Poland picked up at the end of last year as
external demand and economic sentiment improved Domestic demand is expected to overtake net
exports as the main engine of economic growth as unemployment falls and inflation remains contained
The fiscal outlook is set to improve gradually
Member States Poland
89
Underlying fiscal outlook to improve gradually
In 2013 the deficit is forecast to have increased to
44 of GDP up from 39 of GDP in 2012
mainly due to a weak performance of indirect and
direct tax revenues
Over the forecast horizon the profile of the
general government budget balance will be
affected by the reversal of the systemic pension
reform It includes the following asset transfers
from the second pension pillar a one-off transfer
of assets worth 85 of GDP in 2014 as well as
gradual annual transfers of assets of persons who
retire within 10 years starting in 2014 Under the
current accounting rules (ESA95) such asset
transfers are treated as general government
revenue Under the new rules that will come into
force this autumn (ESA2010) such transfers will
not count as revenue anymore
In 2014 the general government budget balance is
projected to turn into a surplus of 5 of GDP
under ESA95 while it is set to post a deficit of
38 with these asset transfers not treated as
revenue Apart from the reversal of the pension
reform the main measures with a positive (and
permanent) effect on general government balance
in 2014 include increases in excise duties a partial
public wage freeze and a gradual increase in the
retirement age The expenditure savings will be
partially offset by the costs of a legislated
extension of maternity leave In 2015 due to the
one-off nature of the large improvement in 2014
the general government budget balance is expected
to return into the red posting a deficit of 29 of
GDP under ESA95 Excluding regular asset
transfers linked to the reversal of the pension
reform the deficit is projected to reach 35 of
GDP in 2015 The structural deficit is estimated to
gradually improve over the forecast horizon from
36 of GDP in 2013 to 24 of GDP in 2015
The general government debt-to-GDP ratio is
forecast to fall from 578 in 2012 to 503 in
2014 mainly as a result of the transfer of pension
fund assets before increasing again to 51 in
2015 The projected debt figures are however
subject to considerable uncertainty in view of
possible valuation effects of the sovereign debt
denominated in foreign currency via exchange rate
fluctuations
bn PLN Curr prices GDP 94-09 2010 2011 2012 2013 2014 2015
15952 1000 46 39 45 19 16 29 31
9804 615 43 31 26 12 08 20 25
2844 178 34 41 -17 02 20 31 26
3054 191 76 -04 85 -17 -04 41 61
1059 66 - -33 116 -39 34 45 72
7447 467 99 121 77 39 47 52 63
7399 464 104 139 55 -07 08 46 66
15282 958 47 35 42 19 17 29 31
48 26 30 04 08 25 32
00 20 07 -06 -10 00 00
-03 -07 09 21 18 04 00
04 -27 06 01 -03 02 04
140 97 97 101 104 103 101
118 82 51 34 28 33 39
72 14 11 15 09 06 12
-13 00 -20 -08 04 -08 -06
- 82 21 48 70 70 55
87 14 32 24 05 14 18
- 27 39 37 08 14 20
-03 -14 -19 -15 -06 -02 -05
-34 -18 -21 -08 05 07 04
-30 -43 -45 -33 -16 -14 -18
-22 -27 -27 -16 03 07 04
-38 -79 -50 -39 -44 50 -29
- -82 -53 -36 -36 57 -24
- -82 -53 -37 -36 -29 -24
- 548 562 556 578 503 510
Net lending (+) or borrowing (-) vis-a-vis ROW (c)
(a) Eurostat definition (b) gross saving divided by gross disposable income (c) as a percentage of GDP
Cyclically-adjusted budget balance (c)
Real unit labour cost
Imports (goods and services)
General government balance (c)
Unit labour costs whole economy
Inventories
Terms of trade goods
Table II211
Net exports
Public Consumption
Trade balance (c)
Employment
Annual percentage change2012
GDP
Private Consumption
Exports (goods and services)
GNI (GDP deflator)
Structural budget balance (c)
Saving rate of households (b)
Main features of country forecast - POLAND
Unemployment rate (a)
Gross fixed capital formation
Current-account balance (c)
Contribution to GDP growth
General government gross debt (c)
GDP deflator
Compensation of employees head
of which equipment
Domestic demand
Harmonised index of consumer prices
22 PORTUGAL Gradual economic recovery
90
Note This forecast was finalised at mid-
December after the tenth review of the
Economic Adjustment Programme and will be
revisited during the eleventh review The text
reflects recent developments
Economic recovery gaining momentum
Following a strong 11 q-o-q expansion in the
second quarter real GDP increased by 02 q-o-q
in the third quarter of 2013 when a negative
growth contribution of net exports was more than
offset by solid growth of domestic demand in
particular private consumption and gross fixed
investment Economic indicators for the last
quarter of 2013 are consistent with a further
stabilisation of the economic recovery towards the
end of last year As a consequence the forecast for
real GDP growth in 2013 was revised upwards
since the autumn forecast by 02 pp to -16 The
projection for the outer years remains broadly
unchanged with real GDP growth rates of 08 in
2014 and 15 in 2015
50
52
54
56
58
60
6
7
8
9
10
11
12
13
14
15
16
17
18
05 06 07 08 09 10 11 12 13 14 15
mn
Labour Force (rhs) Unemployment Rate
forecast
Graph II221Portugal - Labour Market Developments
Labour market situation stabilised in 2013
Total employment expanded by 02 q-o-q in the
fourth quarter of 2013 Much of this increase was
in permanent job contracts suggesting that the
employment gain was not primarily a seasonal
phenomenon Total employment is therefore
expected to expand further at a moderate pace
However the annual average employment growth
is projected to be still negative in 2014 due to a
sizeable negative carry-over effect With a rate of
frac12 employment growth in 2015 is not expected to
bring down the relatively high rate of
unemployment which is expected to stay above
16 in the forecast period
Weak inflationary pressure
HICP inflation declined to 04 in 2013 its lowest
rate since 2009 reflecting subdued domestic
demand and wage restraint in the private sector
Sizeable spare capacities and the expected sluggish
economic recovery in the coming years should
exert downward pressure on profit margins
Consumer prices are therefore projected to
accelerate only slightly to just above 1 in 2015
Current account turning into surplus
The current-account balance is estimated to have
become positive in 2013 at around 05 of GDP
A strong export performance should continue to
support the external adjustment towards the
tradable sector in the forecast period A projected
further improvement in the external balance is set
to exceed the deterioration of the primary income
balance contributing to a widening current-
account surplus over the forecast period
Risks to the economic outlook remain on the
downside
While the baseline projection implies that the
recovery is gradually becoming more entrenched
the pace of the recovery remains conditional on
developments in the euro area and in particular in
Portugalrsquos main trading partners Downside risks
relate to the high levels of private sector
indebtedness which could drag on consumption
and investment activity Portugal remains also
vulnerable to a significant deterioration in the
financial market sentiment linked either to
uncertainties regarding policy implementation by
the Portuguese authorities or a weaker than
expected external environment
The economy seems to have turned the corner in the second half of 2013 showing positive growth rates
for real GDP and employment These positive trends are expected to continue in 2014 and 2015 along
with external rebalancing Portugals recovery remains vulnerable to external risks and its high level of
private sector indebtedness
Member States Portugal
91
Fiscal outlook
The tenth review of the Portuguese adjustment
programme forecast a general government deficit
of 55 of GDP in 2013 (excluding bank
recapitalisation costs 59 including them) On
the back of the latest outturn data an over-
performance and some positive carry-over into
2014 cannot be excluded Budget execution was
supported by robust tax-revenue collection which
more than compensated expenditure growth and
shortfalls on non-tax revenues during the year
The 2014 Budget and other supporting legislation
include discretionary measures worth 23 of
GDP which are expected to bring the headline
deficit down to 4 of GDP The measures are
mostly permanent and expenditure reducing aimed
mainly at the reduction of the public sector wage
bill reforms of the public pension systems and
expenditure cuts across line ministries The
remaining effort is expected to be achieved
through smaller-scale measures worth 05 of
GDP including some one-off operations The
forecast is also underpinned by the measures that
the Government has taken to replace the provision
of the pension reform ruled unconstitutional in
December 2013 worth about 02 of GDP In
2015 the fiscal balance is expected to reach -25
of GDP in 2015 The forecast is based on the
assumption of discretionary measures worth about
12 of GDP which the Government plans to
specify in the context of the Reform of the State
These projections are consistent with a cumulated
improvement in the structural balance of 25 of
GDP over 2013-15
The debt-to-GDP ratio is expected to peak at
nearly 129frac12 in 2013 and to decline thereafter
The upward revision vis-agrave-vis the autumn forecast
is mostly explained by a substantial increase in the
Treasurys cash balance at the end of the year
Downside risks to the fiscal projection are mostly
of legal nature as key elements of the 2014 budget
have been submitted to the Constitutional Court
for review In addition implementation risks
remain elevated in light of the ambitious reform
package On the other hand a tax-richer
environment might boost revenue collection
beyond the budgeted levels The fiscal outlook will
be revisited at the eleventh programme review
bn EUR Curr prices GDP 94-09 2010 2011 2012 2013 2014 2015
1651 1000 19 19 -13 -32 -16 08 15
1085 657 21 25 -33 -53 -18 01 08
301 182 26 01 -50 -47 -20 -25 -19
265 160 16 -31 -105 -144 -80 12 37
82 50 33 -26 -112 -98 16 60 77
639 387 48 102 69 32 58 50 53
649 393 49 80 -53 -66 26 30 38
1606 972 16 26 -15 -23 -10 00 09
23 10 -53 -70 -28 -02 07
00 09 -02 00 00 01 00
-05 00 42 38 12 08 07
05 -15 -15 -42 -32 -04 04
71 120 129 159 165 168 165
46 20 -06 -20 27 -08 10
32 -14 -09 -30 10 -19 -01
00 -21 -11 -27 -07 -28 -11
- 101 97 120 124 118 114
33 06 03 -03 17 09 10
28 14 36 28 04 08 12
02 01 -10 02 11 10 04
-102 -106 -77 -47 -36 -28 -22
-86 -104 -72 -22 04 08 11
-67 -90 -56 -01 23 27 30
-47 -98 -43 -64 -59 -40 -25
-48 -94 -34 -47 -37 -25 -18
- -87 -64 -40 -36 -26 -18
610 940 1082 1241 1294 1266 1258
Net lending (+) or borrowing (-) vis-a-vis ROW (c)
(a) Eurostat definition (b) gross saving divided by gross disposable income (c) as a percentage of GDP
Cyclically-adjusted budget balance (c)
Real unit labour cost
Imports (goods and services)
General government balance (c)
Unit labour costs whole economy
Inventories
Terms of trade goods
Table II221
Net exports
Public Consumption
Trade balance (c)
Employment
Annual percentage change2012
GDP
Private Consumption
Exports (goods and services)
GNI (GDP deflator)
Structural budget balance (c)
Saving rate of households (b)
Main features of country forecast - PORTUGAL
Unemployment rate (a)
Gross fixed capital formation
Current-account balance (c)
Contribution to GDP growth
General government gross debt (c)
GDP deflator
Compensation of employees head
of which equipment
Domestic demand
Harmonised index of consumer prices
23 ROMANIA Export-led rebound turning into a more broad-based recovery
92
Stable outlook for growth and exports
Real GDP growth in 2013 has come out at 35
thanks to a strong export performance driven by a
robust industrial output and an abundant harvest
Growth is forecast to decelerate in 2014 to 23
before slightly recovering to 25 in 2015 It is
projected to remain above potential over the
forecast horizon reflecting improved confidence
and more supportive international conditions but
also the payoff of product and labour market
reforms implemented under the financial support
programmes Growth drivers are expected to
gradually switch from (net) exports to domestic
demand over the forecast horizon
Rebalancing of growth towards investment
Investment is projected to regain momentum
supported by better absorption of EU funds(20)
as
major infrastructure projects gain traction Credit
growth stayed in negative territory in 2013 It is
expected to remain constrained by households
ongoing needs to repair their balance sheets and by
the deleveraging process of the banking sector
after a long period of deteriorating asset quality
-20
-15
-10
-5
0
5
10
15
08 09 10 11 12 13 14 15
pps
Graph II231 Romania- Real GDP growth and
contributions
Inventories Net exports
Dom demand excl invent Real GDP (y-o-y)
forecast
(20) EU structural and cohesion funds absorption increased in
2013 to reach 337 at end-December 2013
hellipand moderate improvement in private
consumptionhellip
Private consumption is projected to pick up
moderately on the back of improving consumer
confidence and increasing disposable income as
employment grows and real wages are expected to
increase by up to 3 in 2014
hellipsupport a gradual pick up in imports
The growth contribution of net exports is forecast
to fade out in 2014 and turn negative in 2015
Imports are projected to pick up over the forecast
horizon alongside domestic demand slightly
outpacing export growth in 2015 Nonetheless the
external environment is expected to improve and
to support continued albeit slower export growth
This follows a strong trade balance adjustment of
41 of GDP in 2013 on account of both strong
exports and subdued imports
Historically low inflation expected in the first
half of 2014
HICP inflation sharply declined in the second half
of 2013 to reach 13 (y-o-y) in December This
can be ascribed to a very good harvest a reduction
in VAT on flour and bakery products (applied in
September 2013) and lower inflation expectations
Annual average inflation is projected to decelerate
from 32 in 2013 to 24 in 2014 mainly due to
falling food prices leading to historical lows in the
first half of 2014 It is expected to return to the
upper part of the central banks target band
(25plusmn1pp) in the second half of the year In
2015 a gradual recovery in domestic demand and
continued price convergence towards the EU
average are expected to translate into higher
inflation averaging 34
Limited prospects for labour market
improvement in 2014
In 2013 the unemployment rate has risen
somewhat to 72 It is expected to remain at
broadly the same level in 2014 before coming
In 2013 strong growth of 35 was driven by exports and an abundant harvest A gradual rebalancing
of growth towards domestic demand is expected in 2014 and 2015 with real GDP growth forecast to be
above 2 Annual average inflation is projected to decelerate to 24 in 2014 while unemployment is
expected to decrease only in 2015 The fiscal adjustment is forecast to continue
Member States Romania
93
down slightly in 2015 when policy measures
especially those targeted at youth unemployment
would start showing effects While the number of
employment contracts marginally increased in
2013 the number of self-employed fell leaving
overall employment broadly unchanged in 2013
Given the expected slowdown in GDP growth in
2014 employment is projected to grow only
slowly Compensation per employee has grown
moderately in 2013 driven by public sector wage
increases The trend is projected to be reversed in
2014 with private sector compensation growth
overtaking the public sector The increase in the
minimum wage notwithstanding overall
compensation growth is forecast to remain
moderate
Fiscal adjustment to continue
The budget deficit in Romania is estimated to have
been reduced to 26 of GDP in 2013 from 3 in
2012 It is slightly higher than previously
projected as it accommodates higher co-financing
expenditure to support EU funds absorption
For 2014 the budget deficit is forecast at 22 of
GDP higher than previously projected again
reflecting higher co-financing expenditure for EU
funds The projection includes the indexation of
pensions foreseen by law a two-step increase in
the minimum wage from 800 to 900 RON and
another limited and targeted raise in public sector
salaries On the revenue side the forecast takes
into account the inflation indexation of excise
duties the excise rate hike for energy products
and the broadening of the basis for property tax
For 2015 benefiting from the expected
acceleration in economic activity and based on the
customary no-policy-change assumption the
deficit is projected to decrease further to 18 of
GDP The structural budget balance is expected to
mildly improve over the forecast horizon by about
05 of GDP Government debt is forecast to peak
at just above 39 of GDP in 2014
The main risks to the budget relate to (i) less tax-
rich growth associated with weak domestic
demand (ii) reduced expenditure control and
(iii) limited progress with restructuring state-
owned enterprises that could result in renewed
pressure on the budget
bn RON Curr prices GDP 94-09 2010 2011 2012 2013 2014 2015
5867 1000 32 -11 22 07 35 23 25
3729 636 57 -03 11 11 09 15 25
890 152 08 -47 02 17 -15 18 15
1543 263 70 -18 73 49 -27 34 45
598 102 78 -191 236 41 -20 35 45
2385 406 102 132 103 -30 136 57 63
2661 454 123 111 100 -09 29 50 73
5762 982 32 -10 21 02 25 23 26
61 -15 27 29 -04 21 29
-09 04 -01 -14 -03 00 00
-19 00 -05 -08 42 02 -05
-21 -03 -08 13 02 04 07
64 73 74 70 72 72 71
433 -33 -41 83 58 56 45
359 -24 -68 90 24 36 27
-03 -77 -106 42 -12 07 -01
- -38 -70 -62 -59 -51 -63
363 57 42 46 36 29 27
- 61 58 34 32 24 34
21 10 26 32 -03 -07 -01
-75 -61 -56 -56 -24 -25 -29
- -44 -45 -44 -10 -12 -16
-58 -42 -39 -30 00 -03 -07
- -68 -55 -30 -26 -22 -18
- -60 -50 -20 -21 -18 -16
- -61 -38 -25 -21 -18 -16
- 305 347 380 383 393 392
Net lending (+) or borrowing (-) vis-a-vis ROW (c)
(a) Eurostat definition (b) gross saving divided by gross disposable income (c) as a percentage of GDP
Cyclically-adjusted budget balance (c)
Real unit labour cost
Imports (goods and services)
General government balance (c)
Unit labour costs whole economy
Inventories
Terms of trade goods
Table II231
Net exports
Public Consumption
Trade balance (c)
Employment
Annual percentage change2012
GDP
Private Consumption
Exports (goods and services)
GNI (GDP deflator)
Structural budget balance (c)
Saving rate of households (b)
Main features of country forecast - ROMANIA
Unemployment rate (a)
Gross fixed capital formation
Current-account balance (c)
Contribution to GDP growth
General government gross debt (c)
GDP deflator
Compensation of employees head
of which equipment
Domestic demand
Harmonised index of consumer prices
24 SLOVENIA Easing market tensions but deleveraging still ongoing
94
Gradual export-led recovery ahead
Despite the strong negative carry-over from the
previous year better-than-expected quarterly
outturns in 2013 have eased the pace of real GDP
contraction from 25 in 2012 to an expected
16 in 2013 The growth outlook for 2014 and
2015 is revised upwards to -01 and 13
respectively as export growth picks up while
domestic demand is still dampened by the ongoing
deleveraging process The ensuing increasing
current-account surplus is thus partly cyclical and
driven by the ongoing rebalancing of the economy
-8
-6
-4
-2
0
2
4
6
8
10
2010 2011 2012 2013 2014 2015
Graph II241 Slovenia - Real GDP growth and
contributions
Private consumption Gov consumption
GFCF - construction GFCF - equipment
Change in inventories Exports
Imports Real GDP (y-o-y)
forecast
pps
Consumer confidence worsened again in the last
quarter of 2013 with retail sales continuing to fall
year-on-year Private consumption retains a very
negative outlook for 2014 due to expectations of
further declines in employment and wages and is
projected to only stabilise in 2015
Although investment in 2013 was supported by
one-offs and EU-funded local projects the trend
for the year as a whole remained negative
mirroring the ongoing deleveraging Financial
market tensions eased at year-end following the
completion of the bank asset quality review and
stress test and the recapitalisations of the two
largest state-owned banks Financing conditions
for corporates are nevertheless expected to remain
constrained while balance sheets of domestic
banks are still being repaired In addition low
profit expectations and further corporate
restructuring needs continue to soften credit
demand A fragile recovery in investment is
expected to start only in the second half of 2014
driven by the need to rebuild production capacity
Positive data in the first three quarters of 2013
prompted an upward revision of the export
forecast not matched by equivalent import growth
The external side is expected to continue to sustain
the recovery though with a somewhat muted
contribution in 2015 linked to the gradual pick-up
in domestic demand
Risks to the growth forecast are tilted to the
upside related to easing financing conditions and
accelerating investment which in turn hinge upon
the speed of the required restructuring and timely
implementation of the announced privatisations
Labour market and price developments
The lagged adjustment in the labour market is
expected to continue in 2014-15 with wages
projected to remain subdued in 2014 and rise
moderately in 2015 Public sector wages are
temporarily affected by a court ruling which
repealed the postponement of an increase due in
2010 accounted for in 2013 but effective in 2014-
15 The profile of deflators for GDP and
government consumption over 2013-14 is also
affected by these wage arrears Both HICP and
core inflation are set to continue declining until the
end of 2014 also reflecting the fading out of the
July 2013 increase in VAT rates and pick up
steadily over 2015
Bank support weighs on government finances
The general government deficit is estimated to
increase from 38 in 2012 to 149 of GDP in
2013 (37 without the impact of one-off
measures mostly to recapitalise banks) The
positive budgetary impact of the higher VAT rates
Positive quarterly outturns in 2013 have reduced the pace of the recession A fragile recovery is
expected to start in the second half of 2014 supported by improving market conditions Lending to the
private sector remains restrained by the ongoing deleveraging in both financial and non-financial
corporations With subdued private consumption the external side is expected to be the key driver of the
recovery The support to banks provided in 2013 largely explains the temporary surge in the deficit
Member States Slovenia
95
cuts to public wages and social benefits adopted in
2013 are estimated to have been largely offset by
higher interest and pension expenditure The ruling
on the public wage repeal and the new law
providing for the compensation of persons
removed from the register of residents after
independence added 09 pp of GDP to the one-off
deficit-increasing measures
-5
0
5
10
15
20
2009 2010 2011 2012 2013 2014 2015
Graph II242 Slovenia - Determinants of debt
dynamics
Gov balance net of one-offs One-off measures
Snow-ball effect Stock-flow adjustment
Change in gov debt
forecast
of GDP
For 2014 the recapitalisation of the third-largest
state owned bank Abanka which is subject to
state aid approval is set to add 07pp of GDP to
the underlying deficit of 33 The real estate tax
introduced on 1 January 2014 and the temporary
de-indexation of personal income tax allowances
and tax brackets are set to increase the tax burden
Without new budgetary measures ie under the
no-policy-change assumption the deficit would
stand at 33 of GDP in 2015
However the structural balance is estimated to
improve by only around 23 pp over 2013-14 to
-2 of GDP then based on existing policies will
revert to -25 of GDP in 2015 Public debt is set
to have increased to 719 of GDP in 2013 from
544 in 2012 reflecting bank recapitalisations
and the transfer of non-performing loans to the
Bank Asset Management Company in December
2013 as well as negative output growth The debt
is forecast to increase to 78 in 2015 mainly due
to primary deficits including a further announced
bank recapitalisation subdued growth and higher
debt servicing costs The forecast does not include
receipts from privatisations and the planned
auction of network frequencies
bn EUR Curr prices GDP 94-09 2010 2011 2012 2013 2014 2015353 1000 35 13 07 -25 -16 -01 13
201 569 34 15 08 -48 -35 -20 -01
73 208 32 13 -16 -13 -27 -16 03
63 178 60 -153 -55 -82 -39 -21 07
27 76 76 -93 142 -83 -41 -07 12
269 761 62 102 70 06 29 38 45
252 713 66 74 56 -47 02 17 33
349 989 34 17 09 -26 -20 -03 12
38 -24 -09 -45 -32 -18 01
00 19 06 -18 -04 00 00
-02 18 10 38 20 17 12
- -22 -16 -08 -20 -11 -03
- 73 82 89 102 108 107
- 39 16 -10 10 -03 09
- 04 -07 08 07 -13 -07
- 15 -19 05 -09 -19 -20
- 129 121 119 135 148 154
76 -11 12 02 16 07 13
- 21 21 28 19 08 13
04 -48 -16 -12 00 08 00
-38 -24 -27 -04 10 27 36
-15 -02 02 31 49 69 78
-16 -01 00 29 49 75 86
- -59 -63 -38 -149 -39 -33
- -47 -58 -26 -135 -27 -25
- -47 -48 -26 -22 -20 -25
- 387 471 544 719 754 780
Net lending (+) or borrowing (-) vis-a-vis ROW (c)
(a) Eurostat definition (b) gross saving divided by gross disposable income (c) as a percentage of GDP
Cyclically-adjusted budget balance (c)
Real unit labour cost
Imports (goods and services)
General government balance (c)
Unit labour costs whole economy
Inventories
Terms of trade goods
Table II241
Net exports
Public Consumption
Trade balance (c)
Employment
Annual percentage change2012
GDP
Private Consumption
Exports (goods and services)
GNI (GDP deflator)
Structural budget balance (c)
Saving rate of households (b)
Main features of country forecast - SLOVENIA
Unemployment rate (a)
Gross fixed capital formation
Current-account balance (c)
Contribution to GDP growth
General government gross debt (c)
GDP deflator
Compensation of employees head
of which equipment
Domestic demand
Harmonised index of consumer prices
25 SLOVAKIA Growth to pick up in 2014
96
Gradual recovery expected in 2014hellip
After robust growth in 2012 the Slovak economy
slowed down in 2013 with real GDP increasing by
08 Domestic demand continued to act as a drag
on growth mainly due to still falling investment
and stagnating private consumption Net exports
continued to grow albeit at a slower pace and
remained the main contributor to the overall
positive growth rate Over the forecast horizon
domestic demand is expected to recover and play a
leading role in generating growth that is projected
to accelerate to 23 in 2014 and 32 in 2015
The unemployment rate will stay above 13
-10
-5
0
5
10
08 09 10 11 12 13 14 15
pps
Graph II251 Slovakia- Real GDP growth and
contributions
Dom demand excl invent Net exports
Inventories Real GDP (y-o-y)
forecast
hellipas domestic demand becomes the main
driver of growth
Following a strong rise in the second quarter of
2013 in the third quarter household consumption
fell by 04 q-o-q As a consequence private
consumption is expected to decline slightly for the
year as a whole Nevertheless consumer
confidence has steadily improved over the second
half of 2013 reflecting a marked improvement in
households expectations about the future and is
now above its long-run average Given the likely
rise in real disposable income due to lower-than-
expected inflation and some improvements on the
labour market private consumption is set to
increase gradually in 2014 and 2015
Investment collapsed at the beginning of 2013 and
remained weak for the first three quarters of the
year Despite an expansion in equipment in the
automotive industry in the fourth quarter
investment continued to decrease over the year as a
whole The credit outlook for firms remains poor
as the net flow of loans to non-financial
corporations was negative in 2013 While a
positive impulse is foreseen from motorway
construction investment is projected to stagnate in
2014 and a more substantial pickup is only
expected in 2015
Very strong export growth in the second quarter of
2013 led to a correction in the third quarter as
exports declined Nevertheless exports of both
goods and services are projected to have increased
in the last quarter of 2013 Export growth in 2014
and 2015 will be boosted by declining export
prices and improving demand in Slovakias main
trading partners Imports are expected to increase
in line with exports and for 2014 and 2015 net
exports are likely to give way to domestic demand
as the main driver of growth
The country-specific risks to the forecast are
balanced Downside risks could come from
possible delays in the implementation of large
infrastructure projects Residential construction
poses upside risks as residential property prices
seem to have bottomed out in 2013 and loans to
households have been growing at a robust rate
Inflation decreases in 2014
Inflation decreased significantly in the second half
of 2013 mainly due to the continued fall in energy
prices while pressures in the prices of foodstuff
especially unprocessed food abated Given
declining commodity prices the envisaged
reduction of regulated energy prices for
households and weak demand-pull pressures
inflation as measured by the HICP is projected to
be only 07 in 2014 For 2015 given the foreseen
recovery in domestic demand inflation is expected
to increase to 16
The Slovak economy slowed down in 2013 but growth is expected to gather pace reaching 23 in 2014
and 32 in 2015 The composition of growth will become more balanced as the main driving force
shifts from net exports to domestic demand Employment will grow only modestly over the forecast
horizon and inflation will remain low
Member States Slovakia
97
Public finances at a critical juncture
The general government deficit in 2013 is
estimated to have reached 25 of GDP Higher-
than-budgeted VAT collection together with
lower-than-budgeted public investment is expected
to have contributed to this result Moreover a pay-
out of dividends originally planned for 2014 took
place already in 2013 The deficit outcome may be
affected by the classification currently under
examination by Eurostat of the governments sale
of emergency oil reserves in national accounts
The pick-up in household consumption and
improved collection of VAT as a result of the
measures to fight tax fraud are projected to
support tax revenues in 2014 The net effect of the
introduction of a minimum lump-sum payment for
the corporate income tax and the parallel reduction
in the corporate income tax rate by 1 pp is
projected to be marginally positive Moreover the
special levy on high-profit companies operating in
a regulated environment originally envisaged to
expire in 2013 was retained The sale of telecom
licenses will be an additional (one-off) revenue
source On the expenditure side measures to
achieve envisaged large savings in the healthcare
sector have not been sufficiently specified In
addition major savings from the reform of the
public administration (ESO) are subject to
implementation risks Therefore the savings
projected by the government are not taken on
board in full in 2014
Overall also due to the fact that the impact of one-
off measures in 2014 is lower than initially
envisaged and lower than in 2013 on current
policies the headline deficit is expected to increase
again to 33 of GDP in 2014
A slight deterioration in the headline deficit is
projected 2015 as the growth in tax revenue
supported by faster economic activity will not
compensate for the expiry of the one-off revenues
of 2014 and for the planned reduction in the VAT
rate by 1 pp (conditional upon the deficit outcome
in 2013) While the structural balance improved in
2013 it is set to slightly worsen afterwards
The general government debt is estimated to rise
above 58 of GDP by the end of the forecast
horizon assuming that the planned sale of
governments shares in the telecom sector in 2015
will be used for debt reduction
bn EUR Curr prices GDP 94-09 2010 2011 2012 2013 2014 2015
711 1000 45 44 30 18 08 23 32
410 577 - -07 -05 -02 -01 12 23
125 176 25 10 -43 -11 13 56 34
143 201 29 65 142 -105 -67 02 33
68 96 - 117 383 -115 -60 -28 34
687 966 80 160 122 99 35 48 62
650 914 69 149 97 33 20 45 60
694 976 45 26 34 16 09 21 32
38 11 19 -27 -12 17 26
02 26 -08 -14 05 00 00
04 07 20 59 15 06 06
- -15 18 01 -08 05 07
- 145 137 140 142 139 134
- 51 20 28 09 29 30
- -09 08 10 -08 12 05
- -14 -08 -02 -14 05 -05
- 103 94 82 79 77 77
52 05 16 13 06 07 10
- 07 41 37 15 07 16
- -08 -15 -13 -06 -01 -05
-52 08 10 47 54 52 51
-54 -37 -26 16 20 19 23
-54 -21 -09 31 32 36 37
-55 -77 -51 -45 -25 -33 -34
- -74 -45 -38 -13 -21 -25
- -73 -49 -39 -23 -25 -25
- 410 434 522 543 578 584
Net lending (+) or borrowing (-) vis-a-vis ROW (c)
(a) Eurostat definition (b) gross saving divided by gross disposable income (c) as a percentage of GDP
Cyclically-adjusted budget balance (c)
Real unit labour cost
Imports (goods and services)
General government balance (c)
Unit labour costs whole economy
Inventories
Terms of trade goods
Table II251
Net exports
Public Consumption
Trade balance (c)
Employment
Annual percentage change2012
GDP
Private Consumption
Exports (goods and services)
GNI (GDP deflator)
Structural budget balance (c)
Saving rate of households (b)
Main features of country forecast - SLOVAKIA
Unemployment rate (a)
Gross fixed capital formation
Current-account balance (c)
Contribution to GDP growth
General government gross debt (c)
GDP deflator
Compensation of employees head
of which equipment
Domestic demand
Harmonised index of consumer prices
26 FINLAND Nascent recovery with consolidation needs ahead
98
Broad-based recession in 201213
In 2013 Finlands economy was in recession for
the second year Real GDP dropped by -15 after
having decreased by -1 in 2012 The GDP
decline was broad-based affecting consumer
spending exports and particularly investments
Net external demand contributed positively to
growth due to the strong decline in imports This
partly offset the negative contribution related to
the strong decline in domestic demand
Unemployment continued to climb gradually
ending the year at 84 back to the level last
recorded in 2010 when the economy was just
recovering from the 2009 crises
Gradual improvement ahead
Although towards the end of 2013 economic
sentiment started improving the economic activity
declined again in the final quarter Signals given
by leading indicators still do not point to a
recovery in domestic demand in the near future
An improving economic outlook for Finlands
main export markets with the notable exception of
Russia portends an export-driven recovery in
2014 Still growth is projected to remain tepid
and influenced by negative growth momentum
over the course of 2013 to reach 02 for the year
as a whole before accelerating to 13 in 2015
Moderate wage growth and persistent
unemployment are weighing on disposable
income limiting the growth of private
consumption Gross fixed capital formation is
forecast to pick up only gradually as equipment
investment is held back by low capacity utilisation
and the limited number of building permits
indicates a sluggish construction activity at least
for 2014 Supply conditions continue to be
influenced by industrial restructuring New
products and services in sectors such as chemicals
and metals are gradually replacing production lost
in ICT and paper industry
Exports are forecast to increase over 2014-15 even
though Finland is projected to lose further export
market shares Also the moderate wage agreement
is a first step in restoring cost competiveness In
turn weak domestic demand limits imports
resulting in a positive growth contribution from net
exports Consequently the current-account balance
is expected to continue improving reaching
positive territory in 2014
-10
-8
-6
-4
-2
0
2
4
6
08 09 10 11 12 13 14 15
pps
Graph II261 Finland - Real GDP growth and
contributions
HH consumpt Gov consumpt
Net exports Inventories
GFCF Real GDP (y-o-y)
forecast
Risks to the economic outlook are balanced and
mainly related to developments in export markets
Risks arising from financial market conditions
appear limited and funding costs low
Labour market weak inflation slowing
Labour market conditions started to worsen in late
2012 and this process has continued during 2013
with both the number of employed persons and
hours worked declining and the unemployment
rate increasing The number of registered
unemployed is increasingly higher than the survey-
based unemployment this indicates that when
labour market conditions improve the number of
active jobseekers might increase and the survey-
based unemployment rate would remain elevated
Therefore the unemployment rate is set to remain
broadly stable over the forecast horizon despite the
gradual economic improvement The collective
wage agreement for 2014-15 provides for
moderate wage growth resulting in a lower
increase in unit labour costs than in the previous
Amid the ongoing restructuring of the economy consumers remain cautious and investment is only
gradually gaining strength The expected tepid recovery in 2014-15 is largely dependent on
developments in export markets Disposable income grows slowly holding back consumption General
government deficit remains above 2 over the forecast horizon and the debt ratio is set to exceed 60
Member States Finland
99
years However the wage restraint needs time to
translate into positive employment growth
Despite the consumption tax increase in 2013
inflation receded to 22 From 2014 new indirect
tax increases are applied but due to lower wage
increases falling energy prices and a stabilisation
of prices for processed food and services inflation
is set to decline further to 17 in 2014 and 16
in 2015
Public sector deficit continues to be high
Amid the worsened economic environment the
general government deficit widened despite the
adjustment measures taken in 2013 from -18 of
GDP in 2012 to -24 in 2013 The deficit is
forecast to increase further in 2014 before
improving to -23 of GDP in 2015
Due to the persisting primary deficit and low
nominal GDP growth the debt-to-GDP ratio is
forecast to go slightly above the 60 threshold in
2014 and increase further in 2015 The debt
increase is higher than the annual fiscal deficits
would suggest as the surpluses in social security
funds are not used to reduce central government or
local government debt Debt issuance is carried out
by the treasury based on the market conditions
and the existence of liquid reserves allows for
some flexibility in the decisions to issue new debt
The government is focusing on the implementation
of the structural reforms programme concerning
labour market government efficiency and business
environment in order to bring the level of public
debt down in the medium term and to stimulate
economic growth Expenditure ceilings are used to
control the development of public expenditure and
further revenue increasing measures were
introduced from the beginning of 2014 However
the tax burden is now reaching historic heights
The output gap is estimated at -28 in 2013 and
-26 in 2014 This results in a projection for the
structural balance of -09 of GDP in 2013 and
-12 in 2014 In 2015 the structural balance is
forecast to reach -14 of GDP as the output gap
declines to -16
bn EUR Curr prices GDP 94-09 2010 2011 2012 2013 2014 2015
1924 1000 28 34 28 -10 -15 02 13
1085 564 29 33 25 03 -10 -02 14
483 251 17 -04 05 05 -08 -07 09
379 197 38 17 58 -08 -44 -10 17
102 53 45 -122 105 140 -37 -06 19
781 406 60 79 28 -02 -04 34 44
800 416 61 68 62 -07 -15 20 44
1933 1005 33 33 16 -08 -15 02 12
26 20 26 01 -17 -05 13
01 08 15 -09 -02 02 -01
05 05 -13 02 04 05 00
12 -01 15 01 -06 00 03
103 84 78 77 82 83 81
32 18 32 35 24 16 16
16 -16 19 46 33 13 07
-01 -20 -08 16 04 -08 -13
87 107 87 86 105 111 102
17 03 27 29 29 22 20
16 17 33 32 22 17 16
-06 -26 -22 -17 12 00 00
74 14 -07 00 00 05 05
49 17 -15 -14 -02 05 04
50 18 -13 -13 -01 06 05
14 -25 -07 -18 -24 -25 -23
14 -11 -06 -10 -09 -12 -14
- -10 -05 -10 -09 -12 -14
456 487 492 536 572 604 620
Net lending (+) or borrowing (-) vis-a-vis ROW (c)
(a) Eurostat definition (b) gross saving divided by gross disposable income (c) as a percentage of GDP
Cyclically-adjusted budget balance (c)
Real unit labour cost
Imports (goods and services)
General government balance (c)
Unit labour costs whole economy
Inventories
Terms of trade goods
Table II261
Net exports
Public Consumption
Trade balance (c)
Employment
Annual percentage change2012
GDP
Private Consumption
Exports (goods and services)
Note Contributions to GDP growth may not add up due to statistical discrepancies
GNI (GDP deflator)
Structural budget balance (c)
Saving rate of households (b)
Main features of country forecast - FINLAND
Unemployment rate (a)
Gross fixed capital formation
Current-account balance (c)
Contribution to GDP growth
General government gross debt (c)
GDP deflator
Compensation of employees head
of which equipment
Domestic demand
Harmonised index of consumer prices
27 SWEDEN Rebounding from a soft patch
100
Economic recovery ahead
After a weak growth performance in 2013 the
Swedish economy now follows a more robust
growth track and economic activity is expected to
gradually accelerate GDP growth is forecast to
gradually increase to 25 in 2014 and to 33 in
2015 after 09 growth in 2013 Economic
sentiment has steadily improved during the course
of 2013 underpinning the projection for a more
solid economic growth over the forecast horizon
While household consumption was the main
component to sustain the modest GDP growth in
2013 and is expected to stay strong rebounding
investments are forecast to provide an additional
impetus to economic growth over the forecast
horizon
Consumption growth remains robust
Household consumption is likely to accelerate in
2014 and 2015 as improving labour market
conditions low interest rates and income tax cuts
boost disposable incomes Household saving is
projected to have reached a new peak in 2013 but
will gradually decline in the forthcoming years as
economic uncertainties are waning unemployment
is starting to decrease at a more robust pace and
baby-boomers retire
Despite sluggish economic growth last year the
labour market proved to be resilient employment
continued to increase in 2013 while the
unemployment rate stayed flat As a fall in
unemployment follows GDP growth only with
some time lag a more substantial drop in the
unemployment rate is expected from the second
half of 2014 Taking also into account the
increasing labour force the unemployment rate is
forecast to decrease to 77 in 2014 and to 73
in 2015
Rebounding investments a new engine of
economic growth
Following a decline in investments in 2013 gross
fixed capital formation is expected to rebound
sharply in the coming years adding a new engine
to economic growth Notably construction is likely
to pick up following several years of depressed
levels
Net exports will stay flat
In light of the weakness of the main European
trading partners and the appreciating krona
Swedish export remained sluggish in 2013
Despite the relatively strong household
consumption imports are expected to shrink
similarly to exports Over the forecast horizon
with more solid economic growth of the main
trading partners (most importantly in Europe) both
export and import will resume Compared to
previous recovery periods net exports will only
contribute little to GDP growth if at all
The main risks highlighted in the previous
forecasts remain valid A correction in the high
level of private debt a fall in house prices or
dynamically rising repo rates could dampen
household consumption A sharply appreciating
krona could suppress exports performance and also
negatively impact investments
-6
-4
-2
0
2
4
6
8
04 05 06 07 08 09 10 11 12 13 14 15
Graph II271 Sweden - Real GDP growth and
contributions
Output gap ( of pot GDP) Net exports
Inventories Investment
Consum (pr + publ) Real GDP (y-o-y)
forecast
pps
Following sluggish economic growth of 09 in 2013 the Swedish economy is expected to pick up
gradually and grow by 25 this year and 33 next year While private consumption will remain an
important driver rebounding investment will provide additional impetus to GDP growth By contrast
the contribution of net exports is expected to remain marginal
Member States Sweden
101
Low inflation on the horizon
HICP inflation dropped significantly from 09 in
2012 to 04 in 2013 The Riksbank cut the repo
rate to 075 in December 2013 and the timing of
initial tightening has been postponed until the first
quarter of 2015 At this stage no particular upward
pressure is foreseen from any HICP component
and wage developments are projected to remain at
a moderate level HICP is expected to reach 09
in 2014 and accelerating to 18 in 2015 Inflation
is likely to moderately increase on the back of the
rebounding economy
General government budget provides stimulus
in 2014
Fiscal stimuli (focusing on corporate taxation
raising disposable incomes labour market
incentives and infrastructure investments) will
increase the budget deficit from -11 of GDP in
2013 to -15 of GDP in 2014 In light of the
stronger GDP growth as well as the budget surplus
target and the nominal expenditure ceiling
embedded in the Swedish fiscal framework no
further stimulus is expected after 2014
Accordingly the general budget deficit is projected
to shrink to -08 of GDP by 2015 The structural
balance will deteriorate by 07 of GDP from
2013 turning negative in 2014 (-06 of GDP)
due to the expansionary fiscal policy and the
narrowing of the output gap The deficit will
remain moderate and will slightly improve in 2015
(-04 of GDP)
The declining trend in the general government debt
has been reversed in 2013 by a one-off measure
an additional SEK 100 billion (approximately
28 of GDP) has been borrowed in order to
strengthen the currency reserves of the Riksbank
raising debt to 413 of the GDP in 2013 The
general government debt is still at a relatively low
level compared with other EU countries and will
further decline from 2015 onwards amidst a lower
budget deficit and accelerating growth
bn SEK Curr prices GDP 94-09 2010 2011 2012 2013 2014 2015
35497 1000 25 66 29 09 09 25 33
17182 484 23 40 17 16 19 27 33
9557 269 07 21 08 03 12 09 07
6742 190 38 72 82 33 -10 47 68
2684 76 62 119 132 52 -26 53 79
17224 485 58 114 61 07 -15 28 54
15164 427 51 120 71 -06 -19 37 56
36402 1025 29 69 29 12 09 23 31
20 38 25 15 10 24 31
00 22 05 -12 -02 02 00
06 05 -01 06 01 -02 02
05 10 21 07 09 09 10
75 86 78 80 80 77 73
37 31 09 31 24 28 31
17 -23 01 29 24 12 09
-01 -31 -12 19 17 01 -08
83 113 131 148 159 157 141
18 08 13 10 07 12 17
18 19 14 09 04 09 18
-06 -11 -13 -05 -06 -07 -04
62 26 22 24 21 16 15
57 69 62 65 62 56 55
54 68 61 63 62 55 53
-04 03 02 -02 -11 -15 -08
-01 11 04 05 01 -06 -04
- 11 04 05 01 -06 -04
565 394 386 382 415 418 408
Net lending (+) or borrowing (-) vis-a-vis ROW (c)
(a) Eurostat definition (b) gross saving divided by gross disposable income (c) as a percentage of GDP
Cyclically-adjusted budget balance (c)
Real unit labour cost
Imports (goods and services)
General government balance (c)
Unit labour costs whole economy
Inventories
Terms of trade goods
Table II271
Net exports
Public Consumption
Trade balance (c)
Employment
Annual percentage change2012
GDP
Private Consumption
Exports (goods and services)
GNI (GDP deflator)
Structural budget balance (c)
Saving rate of households (b)
Main features of country forecast - SWEDEN
Unemployment rate (a)
Gross fixed capital formation
Current-account balance (c)
Contribution to GDP growth
General government gross debt (c)
GDP deflator
Compensation of employees head
of which equipment
Domestic demand
Harmonised index of consumer prices
28 THE UNITED KINGDOM Recovery takes hold fiscal imbalances still sizeable
102
Strong growth finally making an appearance
Growth became more firmly established in 2013
with four continuous quarters of positive growth to
leave the annual figure at 19 Domestic demand
was again the principal contributor to growth as
had been the case for the marginally upward-
revised 03 annual growth of 2012 Net trade is
likely to have contributed somewhat negatively to
growth over the year
-6
-5
-4
-3
-2
-1
0
1
2
3
4
5
-6
-5
-4
-3
-2
-1
0
1
2
3
4
5
04 05 06 07 08 09 10 11 12 13 14 15
pps
Graph II281 The United Kindom - Output gap and
contributions to real GDP growth
Output gap (rhs) Net exports
Inventories Dom demand excl inv
Real GDP (y-o-y)
forecast
of pot GDP
The outlook for growth is now stronger than has
been in recent years although growth is likely to
continue to come almost exclusively from
domestic demand with private consumption being
the main contributor and investment playing a
more important role as time progresses In 2014
and 2015 growth is estimated at 25 and 24
respectively Net exports are expected to remain
weak and improve only very slowly There are
both upside and downside risks to the forecast
Domestic demand may be more dynamic than
estimated as sentiment indicators are high
However the upturn in investment may fail to
materialise and private consumption may decline
sizeably as a result of continued weak wage
growth interest rate rises or the household debt
burden weighing down on spending
Consumption is crucial
Economic growth in 2013 has been driven by
private consumption and its contribution is likely
to have been approximately three-quarters Despite
negative real wage growth consumers are running
down their savings in order to sustain their
spending habits Robust employment rates are
likely to be the reason for this behaviour The
expectation is that consumers will continue
spending though less vigorously than was seen at
the end of 2013 as inflation falls and real wage
growth turns positive towards the end of 2014 and
into 2015
Strengthening investment
The first three quarters of 2013 saw positive
though modest growth for investment
Nevertheless this bodes well for the future as it
was the first run of three expanding quarters since
early 2007 albeit from low levels Equipment
investment was strongest earlier in the year but
construction took over thereafter The soft
indicators reached highs during the second half of
2013 Combining this with the credit easing
measures in place strong cash reserves and
returning confidence suggests that investment is
likely to pick up more sturdily in 2014 and should
be reinforced in 2015
Weak net exports
Following a strongly negative contribution to
growth in 2012 of -07 pp and given the outturns
to date in 2013 it is likely that net exports did not
contribute positively to growth That said the
outlook is that net exports will improve somewhat
and at least not be such a drag on growth in 2014
and 2015 as trading partnersrsquo growth picks up
Growing exports to Ireland and China (the latter
from low levels) should aid this improvement
Inflation approaching target
During 2013 inflation fell steadily to reach 21
in the final quarter of 2013 The quick decline in
prices was due to weak commodity and energy
price growth lower-than-expected increases in
education costs weak wage growth and an
appreciation of sterling dampening import prices
Growth finally took hold in the UK in 2013 with strong domestic demand supressing the negative effect
of weak export performance UK GDP grew 19 in 2013 and is expected to grow by 25 in 2014 and
24 in 2015 Inflation declined throughout the year as did unemployment Some progress has also
been made on the fiscal side but the debt ratio has yet to peak
Member States The United Kingdom
103
The outlook is for inflation to fall further and settle
around the Bank of Englandrsquos target of 2 given
the spare capacity in the economy an expectation
of low inflation growth and only slowly increasing
wage growth The forecast estimates inflation at
20 in both 2014 and 2015
Robust employment growth
The labour market has remained resilient since
2010 despite weak economic growth and
redundancies in the public sector with 2013 being
no exception The average growth rate of total
employment in the first three quarters of 2013 was
13 The unemployment rate continued falling to
75 in the third quarter of 2013 and the outlook is
for the rate to decline further though at a more
subdued rate This is likely as labour productivity
is expected to recover in the short term and the
slack in the system should allow activity to pick up
through longer working hours without having to
hire new staff The forecast is for the
unemployment rate to fall to 68 in 2014 and
65 in 2015
Ongoing fiscal consolidation
The government continued with its original fiscal
consolidation plans in the Autumn Statement 2013
The main taxation measures announced were a
cancelation of the fuel duty rise in 2014 and of the
employer national insurance contributions for
employees less than 21 years and an increase in
the bank levy from January 2014 Further
reductions on departmental spending were
announced along with a cap on overall welfare
spending excluding the basic state pension which
was increased marginally and job seekerrsquos
allowance As a result of revisions to GDP growth
and borrowing estimates the deficit is expected to
reach 51 in 2014-15 and 42 in 2015-16 The
structural balance is forecast at 40 in the latter
year with the debt rate continuing to rise
Table II281
General government projections on a financial-year basis
2011-12 2012-13 2013-14 2014-15 2015-16
General government balance -76 -52 -59 -51 -42
Structural budget balance -60 -56 -49 -45 -40
General government gross debt 849 881 900 922 947
Actual
Includes one-off transfer of Royal Mail pension fund and sale of 4G mobile phone licences
Forecast
bn GBP Curr prices GDP 94-09 2010 2011 2012 2013 2014 2015
15672 1000 26 17 11 03 19 25 24
10327 659 29 10 -04 15 24 24 22
3411 218 22 05 00 16 05 05 04
2252 144 27 28 -24 07 -18 65 71
481 31 17 99 -217 129 28 87 79
4943 315 44 67 45 11 08 29 37
5279 337 49 79 03 31 12 26 33
15628 997 28 12 17 -13 19 25 24
28 09 -06 14 14 26 25
00 13 05 -02 06 -01 -01
-02 -05 12 -07 -02 00 01
08 02 05 12 10 13 10
62 78 80 79 76 68 65
39 31 20 19 19 21 28
21 17 14 29 10 09 14
00 -14 -09 12 -06 -10 -07
54 73 67 72 64 61 57
22 31 23 17 17 19 21
19 33 45 28 26 20 20
-02 08 -13 -04 04 04 07
-39 -66 -65 -69 -69 -67 -66
-16 -27 -15 -37 -38 -33 -32
-14 -24 -12 -35 -36 -31 -30
-30 -101 -77 -61 -63 -52 -42
-31 -81 -61 -44 -51 -48 -43
- -81 -61 -62 -53 -48 -43
454 784 843 886 914 934 945
Net lending (+) or borrowing (-) vis-a-vis ROW (c)
(a) Eurostat definition (b) gross saving divided by gross disposable income (c) as a percentage of GDP
Cyclically-adjusted budget balance (c)
Real unit labour cost
Imports (goods and services)
General government balance (c)
Unit labour costs whole economy
Inventories
Terms of trade goods
Table II282
Net exports
Public Consumption
Trade balance (c)
Employment
Annual percentage change2012
GDP
Private Consumption
Exports (goods and services)
GNI (GDP deflator)
Structural budget balance (c)
Saving rate of households (b)
Main features of country forecast - UNITED KINGDOM
Unemployment rate (a)
Gross fixed capital formation
Current-account balance (c)
Contribution to GDP growth
General government gross debt (c)
GDP deflator
Compensation of employees head
of which equipment
Domestic demand
Harmonised index of consumer prices
Candidate Countries
29 THE FORMER YUGOSLAV REPUBLIC OF MACEDONIA Recovery is gaining firm ground in spite of weaker Investment
106
Support from external sector to firming
recovery in 2013hellip
The feeble recovery of output growth which had
begun in the second half of 2012 gained firm
ground in the first three quarters of 2013 Real
GDP increased by 32 compared to the previous
year with net exports and private consumption
taking over from investment as growth drivers
Contrary to earlier official estimates gross capital
formation declined in each of the three quarters in
annual terms and by a total of 15 on the year
24
26
28
30
32
34
36
38
-5
-4
-3
-2
-1
0
1
2
3
4
5
6
7
08 09 10 11 12 13 14 15
y-o-y
Graph II291 The former Yugoslav Republic of
Macedonia - Labour market
Unemployment rate (rhs)
Employment growth
Real GDP
forecast
of labour force
Stimulated by supportive fiscal measures private
consumption increased by an accumulated 51 in
the first three quarters Supported by a benign
external environment and by new foreign direct
investment net exports of goods and services
contributed positively to output growth for the first
time since 2010 Among the sectors the
construction industry largely outperformed
manufacturing and grew by 33 on the year after
average growth of 48 in 2012
hellipis not likely to be sustained
The profile of growth is expected to change again
over the forecast horizon with a renewed pick-up
in gross capital formation and further gains in
household consumption taking the lead Both
public and foreign direct investment are projected
to increase coupled with gradual strengthening in
credit extension to the corporate sector Household
consumption is likely to post resilient growth rates
over the horizon in line with expectations for
disposable income deriving from a positive
employment trend higher social transfers and
stable remittances With new foreign investors
taking up production over the horizon the forecast
expects a renewed strengthening of import
demand Notwithstanding the further improvement
in major export markets a renewed gradual
deterioration of the merchandise balance is likely
Hence net exports would impact negatively on
growth in both years This drag could prove
sizeable if FDI the main source of the countrys
exports evolves less vigorously than expected
Slight labour market stimulation will continue
Aided by the firming recovery and official
employment programmes the number of
unemployed had decreased by 45 at the end of
September 2013 compared to a year earlier With
a significantly smaller increase in the labour force
this lowered the unemployment rate to 287
down from 306 a year earlier The number of
employed persons increased by 4 bringing the
employment rate to 408 up by 17pp from a
year earlier with virtually no change in the total
working age population However the
unemployment rate for 15 to 24 olds remained
largely unchanged at 52 over the year Driven
primarily by the expected pick up of public and
foreign direct investment as well as by a
continuation of active labour market policies
employment is expected to rise further albeit less
strongly while the unemployment rate would drop
further over the forecast horizon
Current account still balanced but
deteriorating
While the current-account deficit presumably
narrowed somewhat in 2013 due to an improving
trade balance in spite of lower private transfers
The economic recovery strengthened in the first three quarters of 2013 and was supported by a strong
contribution from net exports Despite a remarkable pick up in private consumption domestic demand
provided only a small contribution to growth given the major slump in investment In line with
projected developments in foreign direct investment the forecast expects a turnaround in this profile for
2014 and 2015 with investment strengthening again and the foreign balance proving a drag on growth
Candidate Countries The former Yugoslav Republic of Macedonia
107
the forecast expects it to deteriorate again due to
renewed widening of the merchandise deficit
However the need for external borrowing to
finance the current-account deficit was mitigated
in 2013 by a renewed pick up in FDI and is likely
to remain so over the forecast horizon At the end
of the third quarter FDI inflows reached 33 of
accumulated GDP compared to 09 at the same
time in 2012 Given the increasingly benign
investment trends in the countrys major trade
partners and the governments active recruitment
the forecast expects FDI to remain elevated
Lower deficits needed to sustain public debt
The general government deficit for 2013 was
revised in the autumn from 36 to 39
following the adoption of a supplementary budget
In view of anticipated consolidation measures the
forecast expects the deficit to gradually narrow to
around 36 in 2015 After having jumped in 2012
by 56pp to 34 of GDP the general government
debt ratio is expected to have increased by
somewhat less in 2013 However overall public
debt which includes the debt of state-owned
enterprises public agencies and public financial
institutions is likely to be significantly higher
10
15
20
25
30
35
40
-5
-4
-3
-2
-1
0
1
2
3
06 07 08 09 10 11 12 13 14 15
of GDP
Graph II292 The former Yugoslav Republic of
Macedonia - Public finances
Central government debt (rhs)
General government deficit
forecast
of GDP
It would also comprise the newly established
Public Enterprise for State Roads through which
the government channels the increasingly
important road infrastructure expenditure ndash and
which can borrow on its own behalf with its debt
guaranteed by the government In conclusion in
order for general government debt levels to
stabilise fiscal deficits would have to decrease
more substantially than targeted This is likely to
prove difficult in view of recently implemented
pension increases public wage rises as of this year
and an increase in social transfers
bn MKD Curr prices GDP 94-09 2010 2011 2012 2013 2014 2015
4586 1000 22 29 28 -04 32 25 26
3428 747 - 21 29 -30 44 25 27
848 185 - -20 06 -14 -28 10 12
1054 230 - -27 123 160 -90 73 77
- - - - - - - - -
2459 536 - 236 105 00 37 64 66
3498 763 - 95 104 42 -08 61 65
4495 980 - 34 24 -06 30 23 24
- 07 46 08 07 35 37
- -06 00 00 00 00 00
- 34 -19 -31 26 -10 -12
- 15 31 09 27 20 15
- 318 316 311 289 278 269
- 60 -21 28 41 48 33
- 46 -17 41 36 42 22
- 18 -46 40 20 24 06
- - - - - - -
105 27 31 01 15 18 16
83 16 39 33 28 33 30
- -14 14 -71 00 00 00
- -208 -225 -239 -208 -209 -213
- -07 -14 -27 -23 -26 -30
- - - - - - -
- -68 -31 -39 -40 -38 -36
- - - - - - -
- - - - - - -
- 258 284 340 354 374 389
Net lending (+) or borrowing (-) vis-a-vis ROW (c)
(a) as of total labour force (b) gross saving divided by gross disposable income (c) as a percentage of GDP
Cyclically-adjusted budget balance (c)
Real unit labour cost
Imports (goods and services)
General government balance (c)
Unit labour costs whole economy
Inventories
Terms of trade goods
Table II291
Net exports
Public Consumption
Trade balance (c)
Employment
Annual percentage change2012
GDP
Private Consumption
Exports (goods and services)
GNI (GDP deflator)
Structural budget balance (c)
Saving rate of households (b)
Main features of country forecast - THE FORMER YUGOSLAV REPUBLIC OF MACEDONIA
Unemployment rate (a)
Gross fixed capital formation
Current-account balance (c)
Contribution to GDP growth
General government gross debt (c)
GDP deflator
Compensation of employees head
of which equipment
Domestic demand
Consumer-price index
30 ICELAND Helped by tourism but held back by capital controls
108
A stronger second half of 2013 hellip
Overall economic activity received a marked boost
from record high tourism earnings contributing
more than one third to the economys output
growth of some 3 in the first three quarters of
2013 Private and public consumption each
contributed about frac12 pp to overall growth
Investments were lower than a year before which
was partly due to high spending for ships and
airplanes in 2012 High frequency indicators such
as credit card turnover point to rather stable
consumption during the last months of the year
However a bigger than usual share of those
purchases might have been used for imports which
would dampen output growth in the fourth quarter
The labour market situation continued to improve
with employment increasing by more than 3
while unemployment dropped from 6 in 2012 to
54 in 2013
Inflationary pressures subsided markedly towards
the end of 2013 partly reflecting decelerating
import prices in particular for oil With the
exception of housing prices domestic price
dynamics now seems to head towards the Central
Banks inflation target of 25 The end-year wage
agreements were in line with the declining
inflation expectations This rather new trend could
strengthen disposable income and facilitate job
creation
hellip although the outlook is still for contained
growth ahead
Key determinants for Icelands growth
performance in 2014-15 will be tourism and
related construction activities as well as private
consumption benefitting from lower inflation and
government measures to boost disposable income
such as the announced household debt relief
programme but also the extended possibility to use
third-pillar pension savings for consumption Some
long-planned investment projects in the energy-
intense and maritime sectors could further increase
domestic demand However the existence of
capital controls has a negative effect on
investment in particular from abroad Total
exports are projected to benefit from an improved
global outlook and a flourishing tourism sector
However higher imports due to stronger domestic
demand will largely offset the positive effects of
higher tourism revenues
- 25
- 20
- 15
- 10
- 5
0
5
10
15
06 07 08 09 10 11 12 13 14 15
pps
Graph II301 Iceland - Real GDP growth and contributions
Net exports Inventories
Dom demand excl invent Real GDP (y-o-y)
forecast
Unemployment declines further hellip
Labour market conditions are expected to improve
during 2014-15 benefitting from moderate wage
developments and new opportunities in the tourism
sector This should help to lower unemployment
below 5 by 2015 The long-term unemployment
will remain a crucial challenge
hellipwhile inflationary pressures subside
Inflationary pressures are expected to subside in
2014 thanks to relatively low increases in import
prices but also contained wage agreements
However in 2015 this trend could reverse as a
result of strengthening import prices but also
stronger domestic demand
External balance is likely to deteriorate
As a result of stronger domestic demand the
surplus in trade in goods will shrink while the
service balance is expected to continue benefitting
further from expanding tourism A large part of the
Third quarter growth in 2013 was much stronger than expected as a result of high tourism revenues and
resilient private consumption In 2014 and 2015 output growth likely to remain close to 3 supported
by tourism and related construction strengthened disposable income and stronger international
demand However the continued uncertainty related to the lifting of capital controls is likely to impede
more dynamic growth
Candidate Countries Iceland
109
current-account deficit accounts for net income
from banks in winding up proceedings Corrected
for these the underlying current account will
remain closer to balance
Reducing public debt remains a challenge
The general government deficit dropped from
56 of GDP in 2011 to 38 in 2012 During
2013 fiscal consolidation remained behind targets
largely reflecting the weaker-than-expected
revenue growth As a result the 2013 end-year
deficit is likely to be close to 2frac34 of GDP
-15
-10
-5
0
5
100
20
40
60
80
100
120
06 07 08 09 10 11 12 13 14 15
of GDP
Graph II302 Iceland - Public finances
General government debt (lhs)
General government deficit (inverted rhs)
forecast
of GDP
The forecast assumes that the new government will
respect its commitments towards continued fiscal
consolidation as described in the 2014 budget
adopted in December The envisaged spending
reductions should allow a lowering of the deficit to
around 1frac12 of GDP in 2014 and only a slight
deficit in 2015 After reaching a peak of nearly
100 of GDP in 2011 the general government
debt-to-GDP ratio started to decline in 2012
Thanks to substantial primary surpluses in 2014
and 2015 the debt ratio is likely to drop towards
86 by the end of the forecast horizon
Risks and uncertainties are still elevated
Increased domestic demand as a result of
government measures such as the household debt
relief programme could translate into a sharp
widening of external imbalances creating pressure
on the exchange rate and domestic price stability
Moreover the Icelandic economy is still shielded
by extensive capital controls and their removal
remains a huge challenge
bn ISK Curr prices GDP 94-09 2010 2011 2012 2013 2014 2015
16985 1000 34 -41 27 14 28 27 30
9129 537 27 01 26 24 15 35 38
4304 253 31 -34 -03 -14 15 08 05
2469 145 16 -94 143 50 -35 50 80
- - - - - - - - -
10095 594 55 05 38 38 41 40 42
9055 533 40 45 67 47 06 46 53
15107 889 21 -18 69 51 28 27 30
31 -22 31 16 07 27 33
-01 -02 06 -01 00 00 00
04 -17 -10 -01 21 00 -02
13 -04 00 11 35 24 27
34 76 71 61 54 46 41
66 67 85 67 59 30 34
44 109 56 64 66 27 31
-04 37 23 35 34 06 02
- -260 -162 -130 -118 -113 -105
48 69 33 28 31 21 29
- 54 40 52 39 30 33
-11 85 -29 -56 -01 -01 -03
-22 78 60 46 50 43 37
-84 -80 -63 -55 -40 -46 -52
- - - - - - -
- -101 -56 -38 -28 -15 -02
- - - - - - -
- - - - - - -
- 930 993 969 942 913 864
Net lending (+) or borrowing (-) vis-a-vis ROW (c)
(a) as of total labour force (b) gross saving divided by gross disposable income (c) as a percentage of GDP
Cyclically-adjusted budget balance (c)
Real unit labour cost
Imports (goods and services)
General government balance (c)
Unit labour costs whole economy
Inventories
Terms of trade goods
Table II301
Net exports
Public Consumption
Trade balance (c)
Employment
Annual percentage change2012
GDP
Private Consumption
Exports (goods and services)
GNI (GDP deflator)
Structural budget balance (c)
Saving rate of households (b)
Main features of country forecast - ICELAND
Unemployment rate (a)
Gross fixed capital formation
Current-account balance (c)
Contribution to GDP growth
General government gross debt (c)
GDP deflator
Compensation of employees head
of which equipment
Domestic demand
Consumer-price index
31 MONTENEGRO A new wave of investment
110
A faster recovery
In the third quarter of 2013 real GDP grew by 4
y-o-y accelerating from a 34 real growth in the
second quarter and 11 expansion in the first
quarter Growth was largely driven by net exports
of electric energy and tourism services A
continuation of this growth could be expected in
the last quarter of 2013 too supported by
preliminary data on construction utilities and
agriculture but also a successful tourism post-
season and its positive effect on retail trade
leading to an average expansion of GDP of around
25 for the whole year Compared to the autumn
the winter forecast presents a slightly faster growth
scenario for 2014 and 2015 too
-6
-3
0
3
6
10 11 12 13 14 15
Graph II311 Montenegro - Real GDP growth and
contributions
Dom demand excl invent Net exports
Inventories Real GDP (y-o-y)
forecast
pps
Two major uncertainties
Yet there are two major unknowns which may call
for further revision in later forecasts The first one
is the pace of credit growth In 2013 banks loans
grew 3 y-o-y reversing a three-year period of
decline However credit supply remains
constrained by tight credit conditions stirred up by
the high level of non-performing loans (around
18 of total loans at the end of 2013) As a result
private consumption is expected to remain subdued
during the forecast horizon
The second factor of uncertainty will be the pace
of investments and its real contribution to gross
fixed capital formation in the coming years There
are several important tourism energy and
infrastructure projects in the pipeline which if
successfully implemented may set a broader base
for future growth So far the construction of the
tourism resorts in Lustica Tivat and Kumbor and
the electricity interconnection cable with Italy are
in progress while preparatory works for the
highway the second block for the thermal plant
and two windmill farms are expected to start in
2014 However the short-term net contribution
from these investments remains difficult to
ascertain given the small size of the country and its
high import dependence
Weak labour market and price dynamics
The unemployment rate is forecast to fall below
19 while employment will maintain positive but
subdued growth rates until 2015 when the pace of
investments speeds up Weak labour market
dynamics have also been reflected in the
moderation of wages contracting by almost 4 in
real annual terms in 2013 We expect wages to
increase broadly in line with the recovery of
demand for local labour In 2013 average inflation
totalled 22 compared to 41 a year before
Future improvement of domestic demand may
have a limited impact on prices as private
consumption would still remain mostly driven by
tourists expenditure whereas domestic wages and
bank loans growth improve only gradually during
the forecast period
Large external imbalances
In the first three quarters of 2013 the current-
account deficit has been narrowing and could close
below 17 of GDP by the end of the year Yet the
improvement of the trade deficit could reverse in
the next years as exports base effects fade out and
new capacities in tourism and energy are yet under
construction The forecast also expects a
deterioration of the income and transfers net
balances as more foreign workers will be
Stronger-than-expected growth in 2013 confirmed the positive contribution of a number of sectors
besides electricity production A rebalancing of growth from net exports towards domestic consumption
is expected following a new wave of major investments and to a lesser extent a mild recovery in private
consumption The adoption of fiscal rules seems to confirm the continuity of consolidation efforts
Candidate Countries Montenegro
111
employed in construction The external gap would
continue being fully financed by FDI inflows
By mid-2014 the authorities could put into
practice a voluntary financial restructuring
programme to reduce payment arrears between
companies banks and tax administration
reinforcing the sustainability of the banking sector
public finances and real sector liquidity The
recovery of domestic demand could benefit to the
extent that this programme proves successful
Meanwhile the re-emergence of investors risk
aversion to emerging markets following the
indications from the Federal Reserversquos tapering of
monetary stimulus might also delay some
investments in Montenegro
Sustained fiscal consolidation efforts
In the autumn forecast we anticipated the
government would borrow additional EUR 100
million to close the budget gap after paying in
August two bank loans to cover the guarantees of
the bankrupt aluminium factory (KAP) However
budget performance improved markedly during
2013 supported by increases of the personal
income tax and VAT rates resulting in a 10
average expansion of revenue compared to a year
before As a result the government avoided a
rebalance of the budget to increase the borrowing
ceiling to pay for those guarantees (totalling 32
of GDP) Yet despite the freezing of pensions and
public sector wages the budget deficit reached 4
of GDP at the end of 2013
We foresee the broadening of the tax base to have
lasting effects throughout the next two years and
therefore budget deficits to fade by the end of
2015 However this scenario will depend on the
extent to which GDP growth (ie denominator
effect) might outpace the expansion of public
spending and debt as the government starts
borrowing to finance the highway project
In our view further expansion of the public debt
remains a serious risk Apart from relying on
growth the government also plans for 2014 a
major overhaul of the stock of public debt
(especially two Eurobonds issues maturing in 2015
and 2016) to improve debt sustainability through
more favourable terms
mio EUR Curr prices GDP 94-09 2010 2011 2012 2013 2014 2015
31489 1000 - 25 32 -25 24 27 30
26320 836 - 20 42 -32 -17 20 25
6791 216 - -03 -16 31 -19 11 13
5838 185 - -185 -103 -33 17 67 93
- - - - - - - - -
13894 441 - 75 141 -12 51 22 20
21664 688 - -31 31 09 -17 20 30
32031 1017 - 59 38 -07 23 25 36
- -34 09 -26 -15 31 40
- 14 -06 12 05 00 00
- 45 29 -11 34 -03 -11
- -19 -64 28 18 23 27
- 197 197 196 196 192 185
- 23 09 07 -10 14 18
- - - - - - -
- - - - - - -
- 196 172 210 209 192 185
- -08 -07 -10 -01 03 01
- 05 31 41 22 23 26
- - - - - - -
- -408 -404 -441 -408 -409 -419
- -229 -177 -186 -151 -153 -158
- - - - - - -
- -49 -54 -56 -41 -25 -11
- - - - - - -
- - - - - - -
- 409 460 540 568 579 590
Net lending (+) or borrowing (-) vis-a-vis ROW (c)
(a) as of total labour force (b) gross saving divided by gross disposable income (c) as a percentage of GDP
Cyclically-adjusted budget balance (c)
Real unit labour cost
Imports (goods and services)
General government balance (c)
Unit labour costs whole economy
Inventories
Terms of trade goods
Table II311
Net exports
Public Consumption
Trade balance (c)
Employment
Annual percentage change2012
GDP
Private Consumption
Exports (goods and services)
GNI (GDP deflator)
Structural budget balance (c)
Saving rate of households (b)
Main features of country forecast - MONTENEGRO
Unemployment rate (a)
Gross fixed capital formation
Current-account balance (c)
Contribution to GDP growth
General government gross debt (c)
GDP deflator
Compensation of employees head
of which equipment
Domestic demand
Consumer-price index
32 SERBIA Key reforms ahead
112
Growth in 2013 stronger than expected
The exports driven growth accelerated strongly to
37 (y-o-y) in the third quarter following an
upward revision of data in the first two quarters to
30 and 06 However domestic demand
remained weak with a steady fall in private
consumption and more pronounced drop in
investments There was also a significant revision
of 2012 data in particular regarding growth of
investments (from -34 to 144) exports (from
45 to 18) and imports (from 42 to 19)
The robust economic performance is estimated to
have continued in the last quarter of 2013 bringing
the annual growth above 2 higher than expected
Households consumption is likely to have
stabilised in the last quarter of the year but its
recovery is poised to be slow and uneven impeded
by a weak labour market and bouts of fiscal
consolidation efforts The latter are also expected
to keep public consumption growth negative
throughout the forecast period
Continuing rebalancing towards exports and
investments
The ongoing rebalancing of the economy away
from consumption is expected to continue with
investments playing an increasingly important role
However this process may be uneven as it is
linked to pursuing the announced far-reaching
structural reforms which are subject to significant
implementation risks
Base effects are expected to drive exports growth
temporarily down in 2014 but improving external
demand would be supporting an overall robust
exports performance over the forecast horizon The
beginning of EU accession negotiations and
increased membership prospects supported by
stronger FDI and reforms improving the business
environment are foreseen to lead to a pronounced
hike in investment activity albeit from a very low
level Gross capital formation is also likely to be
supported by higher government investments after
they have hit a bottom at 23 of GDP in 2013 In
line with growing demand imports are envisaged
to slowly catch-up turning the net exports
contribution to growth slightly negative in the
outer year of the forecast
hellipbut major hurdles ahead
The forecast assumes that Serbia would move on
with the implementation of a number of already
announced major structural reforms as of the
second half of this year However the actual
timing and sequencing of these reforms brings
uncertainty to the forecast scenario especially with
regard to investments labour market and budget
performance
As economic activity strengthens the labour
market is foreseen to become more dynamic
although any gains in employment are likely to be
largely offset by job losses in the public sector As
a result the unemployment rate would remain very
high Discrepancies between different sources of
data on the labour market have increased as the
Labour force survey registered a significant drop
in unemployment while registered unemployment
continued to rise
0
5
10
15
20
25
30
-10
-8
-6
-4
-2
0
2
4
6
8
09 10 11 12 13 14 15
y-o-y
Graph II321 Serbia - Labour market
Unemployment rate (rhs) Employment growth (lhs)
Real GDP growth (lhs)
forecast
of labour force
Since early December the dinar has depreciated
slightly against the euro Over the forecast horizon
it is expected to balance between medium-term
appreciation pressures related to increased
After a year of strong export-led growth Serbias economy is expected to slow down in 2014 before
picking up again in 2015 driven by increased investment linked to the countrys EU accession prospects
and reforms Early parliamentary elections scheduled for mid-March however are delaying the
implementation of key reforms While exports are expected to remain robust households consumption is
poised to recover slowly hampered by fiscal consolidation measures and low net employment creation
Candidate Countries Serbia
113
portfolio and foreign direct investment inflows
and transient depreciation episodes linked to
external factors or bouts of domestic policy
uncertainty Thus it is likely to provide a major
anchor for inflation expectations and along with
weak domestic demand reduce inflation volatility
Despite solid exports growth the space for
improving the current-account deficit is expected
to be exhausted by 2015 as domestic demand and
imports start to slowly recover
20
30
40
50
60
70
80
-7
-6
-5
-4
-3
-2
-1
0
1
2
3
09 10 11 12 13 14 15
of GDP
Graph II322 Serbia - Public finances
General government debt (rhs)
General government balance (lhs)
forecast
of GDP
Fiscal consolidation still a long way to go
The 2013 budget deficit turned out below the
revised budget target and much lower than
expected in the autumn Although revenue
underperformed significant across-the-board
current and investment expenditure cuts have
contained the overall deficit to an estimated 49
of GDP
The 2014 budget foresees new consolidation
measures almost equally split between the revenue
and expenditure side A hiring freeze in the public
sector would also contribute to containing
expenditure pressures However higher interest
and investment spending and social expenditure
related to the envisaged restructuring of public
enterprises are expected to keep total spending and
the budget deficit high Despite more prudent
planning there are also important downside risks
to budget execution The revenue-poor structure of
growth and lower GDP deflator may threaten
revenue collection and delaying key reforms could
create additional risks to meeting the deficit target
Absent further consolidation measures the deficit
would remain high and together with payments on
bank recapitalisations and activated government
guarantees would be keeping government debt on
an upward trajectory
bn RSD Curr prices GDP 94-09 2010 2011 2012 2013 2014 2015
33487 1000 - 10 16 -15 21 13 22
25790 770 - -09 -11 -18 -16 -07 01
6660 199 - 04 10 17 -19 -14 -07
7172 214 - -55 84 144 -87 67 112
- - - - - - - - -
13483 403 - 153 34 18 159 49 57
19501 582 - 31 70 19 21 26 49
32606 974 - 03 15 -19 16 09 19
- -17 08 16 -35 05 23
- -03 33 -28 03 00 01
- 30 -25 -03 52 07 -01
- -84 -60 -11 37 00 08
- 192 230 239 221 223 214
- - - - - - -
- - - - - - -
- - - - - - -
- - - - - - -
- 49 96 60 63 45 50
- 61 111 73 79 43 50
- -18 46 14 13 -03 00
- -171 -169 -185 -125 -119 -118
- -76 -88 -106 -49 -47 -48
- - - - - - -
- -47 -49 -65 -49 -59 -52
- - - - - - -
- - - - - - -
- 445 482 600 634 700 728
Net lending (+) or borrowing (-) vis-a-vis ROW (c)
(a) Eurostat definition (b) gross saving divided by gross disposable income (c) as a percentage of GDP
Cyclically-adjusted budget balance (c)
Real unit labour cost
Imports (goods and services)
General government balance (c)
Unit labour costs whole economy
Inventories
Terms of trade goods
Table II321
Net exports
Public Consumption
Trade balance (c)
Employment
Annual percentage change2012
GDP
Private Consumption
Exports (goods and services)
GNI (GDP deflator)
Structural budget balance (c)
Saving rate of households (b)
Main features of country forecast - SERBIA
Unemployment rate (a)
Gross fixed capital formation
Current-account balance (c)
Contribution to GDP growth
General government gross debt (c)
GDP deflator
Compensation of employees head
of which equipment
Domestic demand
Consumer-price index
33 TURKEY Depreciation monetary tightening and external rebalancing
114
Domestic-demand based growth in 2013
Following a pronounced slowdown in 2012
Turkeys economy re-accelerated in the first half of
2013 This was helped by monetary policy
accommodation and a relatively large increase in
public spending particularly investment In the
third quarter the quarter-on-quarter growth slowed
to 09 as public spending was reined in Monthly
data suggest a further moderate slowdown in the
fourth quarter
For 2013 as a whole GDP growth is projected at
38 Consumer spending ndash fuelled by sharply
higher bank lending and substantial employment
growth ndash made the largest contribution Net
exports of goods and services subtracted from
overall growth due to a sharp turnaround in
Turkeys trade in non-monetary gold related to
international sanctions on Iran Net imports of gold
worth 14 of GDP widened Turkeys current-
account deficit to 78 of GDP in 2013 In terms
of GDP growth gold imports were partly offset by
the related positive contribution from inventories
Depreciation and tighter financial conditions
Turkeys financial markets and the lira have been
under strong downward pressure since May 2013
in the context of the Federal Reserves tapering of
asset purchases two domestic political crises and
geo-political tensions related to the Syrian civil
war By mid-February the yield on the two-year
benchmark government note had risen by
600 basis points to close to 11 and the major
index on the Istanbul stock exchange had fallen by
30 The lira depreciated by 164 in real
effective terms between April 2013 and January
2014
In addition to heavy lira-supporting interventions
in the foreign exchange market the central bank
has reacted to the market turmoil by tightening
monetary policy Following initial moves last
summer towards a less accommodative monetary
policy stance the central bank took more
aggressive action in January The overnight
lending rate was raised from 775 to 12 and the
one-week repo rate was hiked from 45 to 10
The central bank has signalled that it will maintain
a tight monetary policy stance until there is a
significant improvement in the inflation outlook
-8
-6
-4
-2
0
2
4
6
8
10
12
14
08 09 10 11 12 13 14 15
Graph II331 Turkey- Real GDP growth and
contributions
Inventories Net exports
Dom demand excl invent Real GDP (y-o-y)
forecast
pps
Rebalancing towards external demand
Looking forward final domestic demand will be
significantly dampened by recent developments
The pass-through of the lira depreciation to
domestic prices will reduce both private and public
consumption in real terms Consumer spending
will also be hit by higher interest rates recent
macro-prudential measures to lower household
borrowing some indirect tax hikes a negative
wealth effect and declining confidence Business
investment will be curbed by higher interest rates
by higher funding costs due the stock market
correction and by deteriorating balance sheets for
companies with debt in foreign exchange
On the external side the liras depreciation will
improve the international price competitiveness of
Turkish goods and services thereby re-directing
economic activity towards exports and import-
substituting output This combined with the
recovery in Turkeys export markets will gradually
offset the reduction in domestic demand growth
and lead to some rebalancing of the economy
Growth was somewhat faster than expected in 2013 but the outlook for economic activity over the next
two years has deteriorated against the background of recent developments Monetary conditions have
tightened and the stock market has suffered a major correction The liras sharp depreciation is stoking
inflation and curbing consumers purchasing power but should also help the economy to rebalance
gradually towards external demand
Candidate Countries Turkey
115
Slower growth higher inflation but a smaller
current-account deficit
In 2014 the economy is projected to continue the
slowdown already noticeable in the second half of
2013 The annual GDP growth rate is projected at
25 with net exports starting to contribute
positively In 2015 growth is expected to increase
to 30 as domestic demand recovers gradually
Considering the domestic political uncertainty and
the possibility of a further sell-off in Turkish
financial assets in context of a normalisation of
monetary conditions in developed markets the
risks to this growth projection are biased to the
downside
Annual inflation will be pushed up to 87 in 2014
spurred mainly by the pass-through from the recent
currency depreciation but also by some
adjustments of indirect taxes When these effects
peter out below-potential output growth will help
to lower inflation somewhat Nevertheless in view
of the current inflation expectations the inflation
rate is projected to remain significantly above the
central banks 5 medium-term target throughout
the forecast period
Employment growth already slowed in the second
half of 2013 Given the structural increase of the
labour force the unemployment rate is projected to
rise to 105 in 2014 before levelling off The lira
depreciation and the rebalancing of the economy
are projected to narrow the current-account deficit
gradually to 44 of GDP by 2015
Public debt ratio raised by the depreciation
In 2013 the fiscal deficit of general government
was held in check by surging revenues partly
resulting from earlier changes to indirect taxation
and the social security regime The forecast
projects the deficit to widen to almost 3 of GDP
in 2014 due to much slower revenue growth Some
narrowing of the deficit is forecast for 2015 when
economic activity and revenue growth pick up
again The debt ratio of general government has
suffered from the recent lira depreciation which
has increased the book value of foreign currency
debt This in conjunction with the upwardly
revised deficit projection implies a stabilisation of
the debt ratio around 36 of GDP rather than a
continued downward trend as previously forecast
bn TRY Curr prices GDP 94-09 2010 2011 2012 2013 2014 2015
14158 1000 32 92 88 22 38 25 30
9943 702 35 67 77 -06 42 00 12
2102 148 41 20 47 61 51 32 27
2869 203 21 305 180 -27 34 13 30
- - - - - - - - -
3732 264 78 34 79 167 07 74 90
4461 315 63 207 107 -03 69 07 33
14030 991 32 96 87 23 35 24 29
35 104 98 -02 42 07 18
-02 27 00 -12 11 02 -02
01 -40 -10 36 -16 16 14
09 62 67 30 30 20 27
83 119 98 92 98 105 104
388 70 -21 118 107 78 81
357 41 -39 127 99 73 78
-28 -15 -115 55 42 -01 -03
- - - - - - -
399 57 86 68 54 74 81
- 86 65 89 75 87 74
-09 -32 -44 -11 -03 -05 17
-53 -78 -113 -81 -96 -88 -68
-21 -63 -95 -59 -78 -65 -44
- -63 -95 -59 -78 -65 -44
- -29 -08 -15 -16 -29 -25
- - - - - - -
- - - - - - -
- 431 399 362 360 367 362
Net lending (+) or borrowing (-) vis-a-vis ROW (c)
(a) as of total labour force (b) gross saving divided by gross disposable income (c) as a percentage of GDP
Cyclically-adjusted budget balance (c)
Real unit labour cost
Imports (goods and services)
General government balance (c)
Unit labour costs whole economy
Inventories
Terms of trade goods
Table II331
Net exports
Public Consumption
Trade balance (c)
Employment
Annual percentage change2012
GDP
Private Consumption
Exports (goods and services)
GNI (GDP deflator)
Structural budget balance (c)
Saving rate of households (b)
Main features of country forecast - TURKEY
Unemployment rate (a)
Gross fixed capital formation
Current-account balance (c)
Contribution to GDP growth
General government gross debt (c)
GDP deflator
Compensation of employees head
of which equipment
Domestic demand
Consumer-price index
Other non-EU Countries
34 THE UNITED STATES OF AMERICA Recovery gathering momentum
118
Recovery firming amid waning fiscal drag and
continued support from monetary policy
Economic activity in the US is gathering
momentum as the headwinds from fiscal policy
wane and household consumption gains speed
benefitting from robust job creation recovering
house prices and buoyant stock markets Over the
forecast horizon the recovery is expected to
consolidate and broaden to encompass business
investment which has yet to recover to pre-crisis
levels With the continued support of near-zero
interest rates and firming external demand this
should reinforce virtuous circles between
construction activity household spending and
employment expansion bringing GDP growth
back to around potential by 2015
Real GDP growth strengthened to 10 q-o-q in
the third quarter and 08 in the fourth despite
significant fiscal drag and uncertainty related to
the government shutdown and the debt-ceiling
standoff in October Growth in the second half of
the year was driven by private consumption
sizeable inventory investment (third quarter) and
net exports (fourth quarter)
-5
-4
-3
-2
-1
0
1
2
3
4
5
05 06 07 08 09 10 11 12 13 14 15
Graph II341 US - Real GDP growth and contributions
Private consumption Public consumption
Investment Net exports
Inventories Real GDP (y-o-y)
forecastpps
The brighter outlook for the US economy
combined with still subdued inflation led the Fed
in December to decide to gradually reduce its asset
purchases from January with a view of finishing
the programme by the end of 2014 The decision to
unwind quantitative easing was complemented by
reinforced forward guidance on the interest rate
which is now likely to remain near-zero well past
the time that the unemployment declines below
6frac12 Most recent Fed projections would
therefore suggest that the federal funds rate is
unlikely to be raised before 2015
An increasingly broad-based recovery
Private consumption accelerated gradually in the
course of the year to 06 q-o-q in the fourth
quarter (the fastest rate in three years) This is in
line with rising consumer confidence which
recovered quickly after a temporary shake-up in
the autumn linked with the fiscal policy
uncertainty Consumption is projected to gather
speed in 2014 and 2015 underpinned by the steady
recovery of the labour and housing market and
robust household incomes
Government spending continued to weigh down on
GDP subtracting 04 pp from growth in 2013 as a
whole as tax increases imposed by the fiscal-cliff-
deal interacted with sequestration-related
expenditure cuts to produce the second-steepest
consolidation in post-war history However
headwinds from fiscal policy are expected to wane
over the forecast horizon with fiscal consolidation
easing to less than 1 of GDP in 2014 and 05 in
2015 in terms of headline balances Moreover
thanks to the recent budget and debt ceiling deals
the policy outlook has become much clearer
Nevertheless the debt-to-GDP ratio will continue
to exceed 100 over the forecast horizon
Business investment remained feeble throughout
2013 expanding by a mere 26 the weakest
since 2010 likely depressed by continued
monetary and fiscal policy uncertainty and severe
federal spending cuts As this uncertainty recedes
investment is expected to gradually accelerate to
rates more than double the GDP growth ndash driven
by expanding domestic and external demand
The outlook for the US economy has improved since the autumn forecast as the negative impact of last
Octobers budget crisis proved much less severe than expected and the recent budget and debt ceiling
agreements dissipated fiscal policy uncertainty boosting confidence Growth is now expected to climb
from 19 in 2013 to 29 this year and 32 next year 03 pp and 01 pp higher than previously
forecast reflecting the waning fiscal drag firming investment and a steady housing market recovery
Other non-EU Countries The United States of America
119
Despite continuously rising home prices
construction activity and property sales stalled in
the summer of 2013 as rising mortgage rates
began to curb demand Momentum in the sector
resumed towards the end of the year but housing
investment posted its first negative growth
contribution in the fourth quarter in more than
three years Going forward activity and sales are
expected to gradually resume their robust pace
supported by historically low inventory levels
steady population growth and progress in
household deleveraging as mortgage debt (as a
share of disposable income) fell by 23 pps from its
early-2009 peak until the third quarter
Falling unemployment and participation rates
The labour market continued its recovery
throughout 2013 but job growth weakened
markedly in December (partly due to harsh
weather conditions) and in January 2014 The
unemployment rate continued to fall reaching
66 in January 2014 (the lowest since October
2008) However this reduction occurred against
the background of persistently low and falling
labour force participation predominantly due to
demographic reasons Employment is expected to
advance in 2014 and 2015 driving the
unemployment rate down amid a mild cyclical
recovery in labour participation (from 2015)
Inflationary pressures remain subdued
Headline consumer inflation fell to a four-year low
in October (07 and 10 for the PCE deflator and
the CPI respectively) While consumer prices
accelerated somewhat since then inflation remains
well below the Feds 2 target and is not expected
to reach it until mid-2015 Real wages remained
subdued in 2013 rising by a mere 15 but are
projected to pick up gradually over the forecast
horizon in line with the shrinking labour market
slack
Some downside risks prevail
Recently observed weaker dynamics in the labour
and housing market could have partly been
weather-related but also raise some uncertainty
about the underlying strength of the economic
recovery If these concerns persist they could spill
over to household confidence and consumption
and contribute to a more gradual recovery than
currently expected
bn USD Curr prices GDP 94-09 2010 2011 2012 2013 2014 2015
162446 1000 26 25 18 28 19 29 32
111496 686 30 20 25 22 20 27 30
25480 157 18 01 -27 -02 -21 -02 11
30281 186 27 11 34 55 33 52 78
10633 65 41 128 96 63 24 63 80
21959 135 47 115 71 35 28 62 57
27431 169 55 128 49 22 14 47 63
164975 1016 28 29 22 27 19 29 32
29 16 20 25 16 28 38
-01 14 -02 01 02 00 -03
-02 -05 01 01 01 01 -02
08 -06 06 18 10 15 16
54 96 89 81 74 65 58
36 28 31 21 17 24 32
18 -03 18 11 08 10 15
-03 -15 -02 -06 -07 -05 -03
103 113 111 109 94 92 91
20 12 20 17 15 15 18
25 16 31 21 15 16 19
-02 -16 -11 -01 09 -01 -04
-41 -45 -49 -47 -43 -41 -43
-35 -33 -26 -26 -23 -21 -23
-35 -33 -26 -26 -23 -21 -23
-38 -120 -106 -92 -62 -54 -48
- - - - - - -
- - - - - - -
645 952 994 1027 1038 1048 1045
Net lending (+) or borrowing (-) vis-a-vis ROW (c)
(a) as of total labour force (b) gross saving divided by gross disposable income (c) as a percentage of GDP
Cyclically-adjusted budget balance (c)
Real unit labour cost
Imports (goods and services)
General government balance (c)
Unit labour costs whole economy
Inventories
Terms of trade goods
Table II341
Net exports
Public Consumption
Trade balance (c)
Employment
Annual percentage change2012
GDP
Private Consumption
Exports (goods and services)
() Employment data from the BLS household survey
GNI (GDP deflator)
Structural budget balance (c)
Saving rate of households (b)
Main features of country forecast - USA
Unemployment rate (a)
Gross fixed capital formation
Current-account balance (c)
Contribution to GDP growth
General government gross debt (c)
GDP deflator
Compensation of employees fte
of which equipment
Domestic demand
Consumer-price index
35 JAPAN A bumpy road ahead
120
Short-term dynamics driven by fiscal policy
measures
The near-term outlook is largely driven by
announced fiscal policy changes Private
consumption is expected to support growth on the
back of the front-loading of expenditure ahead of
the consumption tax hike in April 2014 A similar
consumption pattern should materialise before the
expected October 2015 tax hike The negative
growth effects from the 2014 tax hike should be
partly offset by a yen55 tn (around 1 of GDP)
stimulus package expected to support private and
public investment and low-income earners Over
the forecast horizon uncertainty surrounding
structural reforms may hold back private non-
residential investment whilst households may
scale down consumption should wage growth fail
to pick up consistently
Monetary policy remains accommodative
Japans accommodative monetary stance has
remained unchanged since the inception of the
Bank of Japans Quantitative and Qualitative
Monetary Easing in April 2013 Monetary policy
and financial conditions are expected to remain
broadly supportive over the forecast horizon
Average lending rates are below 1 and persist on
a mildly downward trend despite rising
inflationary pressures while lending volumes keep
growing
Regarding inflation core-core CPI inflation
(excluding food and energy) is trending upward
(07 y-o-y in December after 06 in
November) and both survey- and market-based
measures of inflation expectations support further
inflationary pressures ahead Front-loaded
consumption in the run-up to Aprils tax hike and
tightening labour market conditions should
maintain upward pressure on prices Total cash
earnings are expected to gradually pick up over the
medium term and prop up CPI inflation towards
the stated inflation target of 2
Continued subdued real income growth in
conjunction with the scheduled consumption tax
hikes represents however a tangible downside risk
to the effectiveness of ongoing reflationary efforts
Private consumption is being front-loadedhellip
High-frequency indicators point to an acceleration
in private consumption in anticipation of the April
tax hike Retail sales ended the year on an upward
momentum reaching their highest level since 2001
on an annual basis Consumer confidence remains
relatively strong but has been trending downward
recently
15
20
25
30
35
40
45
50
-10
-8
-6
-4
-2
0
2
4
6
8
10
12
08 09 10 11 12 13
Graph II351 Japan - Retail sales (lhs) and consumer
confidence index (rhs)
Retail sales (lhs) Consumer confidence index (rhs)
Source METI Cabinet Office
y-o-y level
Labour market conditions are improving steadily
and are expected to remain tight However nominal
wages remain sticky and have failed to
significantly pick up so far Total cash earnings
should gradually accelerate and underpin private
consumption in the medium term But the basic
wage component is likely to remain stickier for
some time due to reluctance of employers to
permanently raise labour costs The recent
downward trend in consumer confidence may
reflect a concern that the April tax hike will further
depress real incomes in the absence of higher wage
growth This corroborates the expected slump in
private consumption in the second quarter of 2014
Japans economy is expected to sustain its current rate of growth in 2014 thanks to continued monetary
expansion and fiscal stimulus Fiscal policy decisions have the potential to cause some variability in the
near term while in the medium term additional consolidation measures and the uncertainty
surrounding structural reforms are expected to dampen growth in 2015
Other non-EU Countries Japan
121
hellipbut the outlook for investment and net
exports remains uncertain
Private non-residential investment picked up over
the last three quarters of 2013 and investment
conditions remain favourable with restored
corporate profitability buoyed by the weaker yen
and continued ultra-loose financial conditions
Machinery orders are on a near-term upward trend
which supports the view that business investment
recovery is ongoing and should firm up over the
coming quarters Residential investment should
remain resilient in the run-up to Aprils tax hike
before being scaled back in its immediate
aftermath and gradually recover in the run-up to
the October 2015 tax hike Public investment is
expected to remain sustained over the forecast
horizon underpinned by fiscal stimulus measures
Net exports contributed positively to growth over
the first two quarters of 2013 (05 and 03
respectively) but sluggish exports to Asia (excl
China) and resilient energy imports implied a
negative growth contribution in the second half of
the year Exports are expected to keep recovering
in the near term in line with latest survey
indicators on export orders In the medium term
exports are expected to gradually improve on the
back of ongoing recovery in the US and EU
economies and robust demand from China
Imports should also remain sustained on the back
of continued resilience of fossil fuel imports with
imports of consumer goods possibly impacted by
the scaling back of households consumption
decisions in the aftermath of Aprils tax hike
Overall net exports should add to growth over the
forecast horizon as export demand is expected to
gather pace and fully adjust to restored export
competitiveness
Risks remain elevated
Uncertainty surrounding the scope and depth of
structural reform measures to be expected over the
forecast horizon may drag on investment decisions
ahead and weigh on productivity growth
Continued negative or anaemic real wage growth
would squeeze households disposable incomes
over the forecast horizon with negative effects on
consumption and inflation On the external side
slower than expected recovery in the US and the
EU and deterioration in Japan-China bilateral trade
potentially spurred by a slowdown in the Chinese
economy remain possible downside risks
bn JPY Curr prices GDP 94-09 2010 2011 2012 2013 2014 2015
4737771 1000 06 47 -05 14 16 16 13
2876968 607 09 28 03 20 20 05 06
969404 205 22 19 12 17 21 15 09
1000677 211 -14 -02 14 34 27 52 25
- - 06 26 34 - - - -
697748 147 35 244 -04 -01 16 34 40
791565 167 30 111 59 53 34 45 22
4888219 1032 07 46 00 15 21 20 16
05 20 07 23 22 17 11
-01 09 -02 01 -03 02 00
02 17 -09 -09 -03 -03 02
-02 -04 -02 00 04 05 03
43 51 46 43 40 38 38
-06 04 06 -01 00 15 09
-15 -45 08 -16 -11 04 -02
-05 -24 27 -06 -06 -13 -14
121 87 90 78 67 58 51
-09 -22 -19 -09 -06 17 12
00 -07 -03 00 04 25 12
-22 -70 -88 -19 -18 -18 00
22 17 -03 -12 -19 -24 -22
29 37 20 10 07 05 10
28 36 20 10 06 05 10
-56 -83 -88 -87 -90 -75 -62
- - - - - - -
- - - - - - -
1497 2160 2303 2380 2447 2449 2457
Net lending (+) or borrowing (-) vis-a-vis ROW (c)
(a) as of total labour force (b) gross saving divided by gross disposable income (c) as a percentage of GDP
Cyclically-adjusted budget balance (c)
Real unit labour cost
Imports (goods and services)
General government balance (c)
Unit labour costs whole economy
Inventories
Terms of trade goods
Table II351
Net exports
Public Consumption
Trade balance (c)
Employment
Annual percentage change2012
GDP
Private Consumption
Exports (goods and services)
GNI (GDP deflator)
Structural budget balance (c)
Saving rate of households (b)
Main features of country forecast - JAPAN
Unemployment rate (a)
Gross fixed capital formation
Current-account balance (c)
Contribution to GDP growth
General government gross debt (c)
GDP deflator
Compensation of employees head
of which equipment
Domestic demand
Consumer-price index
36 CHINA Steady growth but risk factors remain significant
122
A return to investment-led growth in 2013
Chinas economy grew by 77 in 2013 compared
to 78 growth in 2012 After a soft patch in the
first half of the year high frequency indicators
picked up after the summer and the second half of
the year saw a high degree of stability in the most
commonly watched measures of activity with
retail sales industrial production and PMI
measures all moving in a narrow range This
pattern was reflected in the quarterly GDP
readings with a slightly weaker second quarter
outturn of 75 (y-o-y) followed by 78 growth
in the third quarter and 77 in the fourth quarter
Inflation remained relatively subdued throughout
2013 though has edged up in recent months to
stand at around 3
The weakening of the economy in the early part of
year and the subsequent return to higher growth in
the second half of the year reflects significant
developments in the composition of growth
During 2012 consumption had provided a
somewhat larger contribution to growth than
investment This pattern consistent with a
rebalancing of Chinas growth model away from
investment persisted into the first quarter of 2013
with consumption providing 42 pps of growth
while investment proved extremely weak
contributing just 23 pps Only an unusually large
positive contribution from net exports kept the
overall growth rate over 7 in the first quarter
The rest of the year however saw a marked shift in
the pattern of growth and a return to investment
led growth Investment sharply increased its
weight to 41 pps of growth in the second and to
43 pps in the third quarter while consumption
contributed somewhat less at 34 pps in the
second and 35 pps in the third quarter After the
positive first quarter net exports made a negligible
contribution to growth during the rest of 2013
held back in part by a rise in the RMB real
effective exchange rate of 7 over the year
alongside sluggish growth in world trade volumes
-2
0
2
4
6
8
10
12
14
10 11 12 13
Graph II361 China - Real GDP growth and
contributions
Consumption Investment
Net exports Real GDP (y-o-y)
pps
Outlook stable but risks are rising
During 2014 and 2015 a return to the modest
rebalancing of demand seen in 2012 is expected
with slower investment growth and consequently
slightly lower growth of GDP Consumption
growth is expected to remain fairly firm as
nominal wage growth is picking up after a fall in
2012 real interest rates on household deposit
holdings are fairly stable and policy initiatives to
raise consumption remain a political priority The
external sector however is likely to remain under
pressure due to overall still relatively moderate
recovery in many advanced economies as well as
the effects of appreciation of the RMB The impact
of recent financial turmoil on demand from other
emerging markets remains to be seen but the risks
appear mainly on the downside
While investment growth appears robust there are
major underlying concerns about sustainability
Not only is Chinas share of investment in GDP
still extremely high (close to 50) but in recent
years China has also seen a surge in real estate
investment very rapid credit growth and an
increasing share of new credit coming from
outside the traditional banking system (largely
securitised loans) Important concerns remain
regarding the implicit guarantees underpinning
Chinas economy continues to grow rapidly expanding by 77 in 2013 almost the same rate as in
2012 (78) Nevertheless there are rising concerns as the shift in composition of demand away from
investment and towards consumption observed in 2012 was reversed during 2013 Warning signals have
also emerged from the financial sector which has seen rapid credit growth and several recent spikes in
inter-bank interest rates Therefore while high frequency indicators remain steady and the short-term
forecast is unchanged at 74 for both 2014 and 2015 underlying risks remain significant
Other non-EU Countries China
123
lending via securitised trust loans mediated by
large banks A significant fraction of such loans
are due for repayment over the forecast horizon
and there are doubts about the quality of some of
the underlying assets
Increased signs of financial stress
Monetary policy remained accommodative
throughout the early part of 2013 with inter-bank
rates at around 3 but mid-year saw an important
turning point with inter-bank interest rates spiking
sharply in June to above 10 Inter-bank rates fell
subsequently on intervention by the Peoples Bank
of China but remain somewhat above the level
seen in the first half of the year at well over 4
Further smaller spikes in inter-bank rates were
seen in both December 2013 and January 2014
Concerns over solvency and liquidity risks linked
to excess investment and credit growth are not
new but have heightened during 2013 and the
outlook hinges to some extent on how the need to
curb a build-up of credit risk will be balanced with
the short-term growth targets A more rapid rise in
household consumption could offset a slowdown
in investment but a smooth rotation of demand is
challenging given the relative shares of investment
and consumption in GDP Reforms to raise the
household share of national income and thus boost
consumption do not yet seem to have had much
sustained traction at the macroeconomic level
Chinas real GDP is projected to continue to grow
at just under 75 for 2014 and 2015 This reflects
the view that China will gradually adjust to a lower
trend growth rate with lower investment growth
and higher consumption growth without a major
slowdown However while some global risks
linked to advanced economies have become more
balanced risks in other emerging markets have
become more pronounced Moreover domestic
downside risks from the financial sector appear to
have been heighted and the potential difficulties of
achieving a successful rebalancing of demand are
evident
bn CNY Curr prices GDP 94-09 2010 2011 2012 2013 2014 2015
519322 1000 103 116 94 78 77 74 74
190424 360 - - - - - - -
241757 457 - - - - - - -
141924 268 163 278 89 52 41 60 70
127292 241 153 201 101 62 44 63 73
- - - - - - - - -
- - - - - - -
- - - - - - -
- - - - - - -
10 - - - - - -
36 41 41 41 - - -
- - - - - - -
- - - - - - -
- - - - - - -
- - - - - - -
54 24 73 24 30 30 30
49 33 54 26 26
- - - - - - -
30 43 35 38 29 34 35
35 40 19 23 26 27 28
- - - - - - -
- - - - - - -
- - - - - - -
- - - - - - -
- - - - - - -
Cyclically-adjusted budget balance (c)
Real unit labour cost
Imports (goods and services)
General government balance (c)
Unit labour costs whole economy
Terms of trade goods
Table II361
Net exports
Gross fixed capital formation
Merchandise trade balance (c)
Employment
Annual percentage change2012
GDP
Consumption
Exports (goods and services)
Inventories
GNI (GDP deflator)
Structural budget balance (c)
Saving rate of households (b)
Main features of country forecast - CHINA
Unemployment rate (a)
Current-account balance (c)
Contribution to GDP growth
General government gross debt (c)
GDP deflator
Compensation of employees head
Domestic demand
Consumer-price index
Net lending (+) or borrowing (-) vis-a-vis ROW (c)
(a) Eurostat definition (b) gross saving divided by gross disposable income (c) as a percentage of GDP
37 EFTA Outperformance comes with a risk
124
In both Switzerland and Norway the
competitiveness of the domestic economy outside
the best-performing sectors has deteriorated as a
consequence of low productivity growth and high
wage increases alongside appreciation of the
national currency From 2001 to 2012 the real
effective exchange rate based on unit labour costs
appreciated by 79 annually in Norway and by
60 in Switzerland while for the simple average
of the euro area was 51 The disparity with the
euro area and an average of OECD countries has
become particularly large since 2008
Both Norway and Switzerland see a division
between the more and the less successful parts of
the economy In Norway there is the obvious
divide between the off- and the on-shore sectors
At the same time the disparity in unemployment
developments between regions like Zurich and
Ticino since 2009 is bigger than between the best
and worst performing in Norway
80
85
90
95
100
105
110
115
120
05 06 07 08 09 10 11 12 13
Hou
se p
rice
dis
posa
ble
in
com
e
Switzerland Norway Euro area
Index 2005Q1=100
Graph II371Developments in house prices
vs disposable income
The effect of lose monetary policy and capital
inflows on the housing market continues to be a
concern Credit to households has risen to high
levels in both countries On the asset side of
households there has been strong wealth creation
through increasing house prices The rise in house
prices has outpaced growth in disposable income
as shown in graph II371 Regardless of the high
volatility which is partly due to the data not being
seasonally adjusted there is a clear upward trend
in both countries Conversely for the euro area as
a whole the trend has been to the downwards since
the global economic and financial crisis
Switzerland
Since the autumn forecast the economic
projections for Switzerland have become slightly
more benign The estimation for GDP growth in
2013 has been revised upwards after surprisingly
positive figures for the third quarter of 2013 These
GDP growth figures also showed a broad based
growth Although indications are for a moderation
in the fourth quarter of 2013 the expectation is
that this year and next the Swiss economy will
grow above its potential output growth rate This is
the result of continued robust growth in domestic
demand and an increasing contribution from net
trade
Still growth is mostly demand driven and comes
at a time of strong immigration and loose monetary
conditions The comparison between real GDP
growth and real GDP growth per capita gives an
indication of the strength of the labour force
growth The recovery of real GDP per capita to the
2008 level took indeed four years while real GDP
more than recovered after a year One major
concern is that labour productivity growth has not
kept pace with these demand developments Most
forecasters currently suggest potential growth of
Switzerland to be around or just under 20
However hourly labour productivity growth
decreased from an average of 08 annually since
1999 to -02 since 2008 The current situation
seems neither supportive of further high labour
growth nor of further increases in capital inflows
through heightened risk aversion within the
developed markets portfolio of investors
Productivity growth will hence be key to
maintaining high economic growth
The EFTA region continues to outperform the EU by a sizeable margin with both Norway and
Switzerland benefiting from strong domestic demand and growing trade Any change in risk
perceptions however could jeopardise these countries success
Other non-EU Countries EFTA
125
Norway
The expectation at the time of the autumn forecast
that the growth dip registered end 2012 and early
2013 was temporary has come true However the
recovery was not as speedily as expected in
particular in fixed investment and exports As a
consequence estimated GDP growth for 2013 has
been revised downwards The outlook for 2014
and 2015 is more favourable on the back of
increased expectations for export growth The new
government has presented amendments to the
budget that are slightly more expansionary
Monetary policy is accommodative although the
tightening of capital requirements is a welcome
counterbalance Off-shore investment will
continue to provide an impetus albeit at a
moderated pace to manufacturing production but
the competitiveness of traditional manufacturing
will in parallel come under further pressure
Private consumption demand will feel the strain
from less wealth effects stemming from house
price developments that appear to have reached a
high in 2013
Real estate developments in Norway have gone
through two phases until 2013 First between
mid-2007 and mid-2009 banks have increased total
credit by around 15 of mainland GDP of which a
large part to households while house prices fell by
about 15 relative to disposable income Banks
balance sheets were thus expanded at a time when
the value of houses was falling in a context of
declining interest rates As a consequence housing
had become more affordable This created room
for house price increases even if banks balance
sheets had deteriorated When in the second
phase from mid-2009 house prices started to rise
faster than disposable income this was supported
by an increasing share of credit to households on
banks balance sheets in a low interest rate
environment
The biggest risk to the Norwegian economy is now
for a rise in interest rates to coincide with a
housing market that already started to cool down in
anticipation of increases in capital requirements
Moreover the net asset value of certain groups of
home owners is now relatively highly exposed to
changes in housing prices and interest rate
developments
(Annual percentage change) 2011 2012 2013 2014 2015 2011 2012 2013 2014 201513 29 13 27 26 18 10 18 21 22
26 30 24 17 16 11 24 22 20 18
11 18 22 20 19 12 32 22 10 10
77 83 59 39 35 45 -04 11 08 13
69 23 95 50 35 77 17 35 12 12
-07 11 -17 39 57 38 25 19 45 41
38 23 26 30 53 42 31 18 41 32
07 43 13 27 26 -34 31 22 24 25
Contribution to GDP growth Domestic demand 28 32 27 20 18 16 16 18 14 14
Inventories -01 -01 00 00 00 -01 -06 -02 00 00
Net exports -14 -02 -14 07 08 02 00 02 06 08
16 22 13 11 12 24 15 15 10 11
32 31 32 33 35 38 39 35 35 30
49 41 43 41 52 15 18 12 11 11
52 34 44 26 38 22 22 09 01 00
-14 06 25 03 09 18 21 -14 -31 -35
123 137 147 162 186 181 234 225 220 222
67 28 18 22 28 04 01 23 33 37
12 04 15 19 19 01 -07 00 11 11
138 22 -15 -08 11 -20 -04 06 22 21
139 138 121 125 131 25 26 27 35 45
131 141 119 120 127 105 123 127 141 155
131 140 119 120 127 102 129 127 139 152
134 138 135 131 129 07 05 00 -04 -09
- - - - - - - - - -
- - - - - - - - - -
287 278 274 264 249 352 347 340 333 330
Unit labour cost whole economy
Exports (good and services)
Terms of trade goods
Private Consumption
(a) as of total labour force (b) gross saving divided by gross disposable income (c) as a percentage of GDP
Net lending (+) or borrowing (-) vis-a-vis ROW
Harmonized index of consumer prices
Structural budget balance (c)
Saving rate of households (b)
Current account balance (c)
Cyclically adjusted budget balance (c)
Trade balance (c)
General government balance (c)
Table II371
General government gross debt (c)
GDP deflator
Compensation of employeehead
of which equipment
Unemployment rate (a)
Gross fixed capital formation
Main features of country forecast - EFTA
Real unit labour cost
Imports (goods and services)
Switzerland
Public Consumption
Employment
GNI (GDP deflator)
Norway
GDP
38 RUSSIAN FEDERATION Boosting investment remains a challenge
126
Weak performance in 2013
Real GDP growth slowed to reach 12 y-o-y in
the third quarter of 2013 and 13 for the year as
a whole Economic growth was weighed down by
slowing private consumption which decelerated
from close to 8 growth in 2012 to below 5 in
2013 However the biggest negative surprise came
from private investment which contracted by 03
in 2013 compared to 64 growth in 2012
Completion of large infrastructure projects carried
out by state owned companies (facilities for the
Winter Olympic Games in Sochi the North Stream
pipeline) added to this slump
-15
-10
-5
0
5
10
08 09 10 11 12 13 14 15
Graph II381 Russia - Real GDP growth and
contributions
Private consumpt Gov consumpt
GFCF Net exports
Inventories Real GDP (y-o-y)
forecastpps
Trade has followed a trend of import growth
exceeding that of exports although the gap seems
to be closing with the growth of exports picking up
to 38 in 2013 (from 14 in 2012) and growth
of imports declining from 88 in 2012 to 59 in
2013
Fiscal and monetary policy
As half of the federal budget revenues come from
oil and gas related sources the Russian economy
remains vulnerable to developments in oil prices
The fiscal rule which bases spending plans on the
long-term average oil price and caps the budget
deficit at 1 of GDP has so far not led to a
significant reduction in the non-oil deficit The
latter decreased marginally in 2013 to 101 from
105 in 2012
A shift in the monetary policy strategy to inflation
targeting and a floating exchange rate is to be
completed by 2015 To increase exchange rate
flexibility the Central Bank of Russia (CBR)
announced in January 2014 the end of targeted
intervention (aimed at neutralizing the volatility in
exchange rate arising from the external
environment) while non-targeted interventions
(aimed at non-fundamental factor driven
fluctuations) would still remain After falling to
61 in September inflation has picked up slightly
in recent months reaching 65 in December
2013 exceeding the CBR target range of 5-6 for
2013
A moderate pickup ahead
The prospect for 2014 is a moderate pick-up in
growth reflecting both an improving global
outlook and positive expectations for the domestic
economy ndash as measured by a rising composite
Russian PMI at 525 in December 2013 (the
highest level since March 2013)
Household consumption growth is expected to
remain strong albeit moderating slowly due to a
slightly negative trend in employment and an
increasing household debt burden which puts
pressure on real disposable incomes Government
consumption is expected to pick up slightly over
the forecast horizon supported by government
plans to boost investment in infrastructure through
public-private partnerships using money from the
National Welfare Fund
A rebound in investment should be among the
main drivers of GDP growth in 2014-15 Private
investment is expected to return to positive
territory as the temporary factors that have dragged
the 2013 investment growth down (completion of
large one-off investment projects) will expire
Russias economy is widely considered to be
running close to capacity which should underpin a
recovery in investment though this is expected to
Russia recovered briskly after the financial crisis of 2008-09 but the pace of growth has since slowed
reflecting both domestic and external weaknesses such as the economys over-reliance on commodity
exports low investment and lagging competitiveness GDP growth dropped from 34 in 2012 to 13
in 2013 but is expected to recover to around 23 in 2014 and 27 in 2015
Other non-EU Countries Russian Federation
127
be gradual given remaining weaknesses in the
business climate
Export volume growth is expected to accelerate in
2014 and 2015 mirroring the anticipated recovery
in main export markets Imports are set to pick up
on the back of higher final demand although at a
slower pace than in the past due to a weaker
exchange rate The current-account surplus is
expected to gradually diminish by 2015
A minor contraction in employment levels is
expected due to both demographic developments
(continuing decline in working age population) and
the lagged effect of the current slowdown
Unemployment is expected to rise from 55 in
2013 to 59 in 2014 and to 62 in 2015 The
government aims to keep the federal budget deficit
at 05 of GDP in 2014 (unchanged from 2013)
increasing it to 1 of GDP for 2015
The actual outcome of the budget balance depends
heavily on the price of oil which is expected to
remain at above USD 100barrel although
gradually decreasing over the forecast horizon
Inflation is expected to subside gradually in
2014-15 supported by a freeze in tariffs for natural
monopolies and broadly in line with CBR end-year
inflation targets of 5 in 2014 and 45 in 2015
The weakening of the ruble a consequence of
CBRrsquos transition towards fully flexible exchange
rate and uncertainty in emerging market
economies poses a risk of a rise in imported
inflation However given relatively strong
economic fundamentals recent financial turmoil is
not expected to cause major disruptions
bn RUB Curr prices GDP 94-09 2010 2011 2012 2013 2014 2015
625991 1000 - 45 43 34 13 23 27
308067 492 - 55 63 67 47 42 40
116648 186 - -15 08 -02 -01 05 05
131642 210 - 64 104 63 -03 32 40
- - - - - - - - -
184280 294 - 70 03 14 38 42 50
138601 221 - 258 203 95 59 65 73
606273 969 - 46 43 35 11 27 29
- 40 56 46 22 29 30
- 40 29 04 -06 -03 00
- -33 -42 -17 -02 -03 -03
- 07 13 11 -02 -06 -07
- 75 66 55 55 59 62
- - - - - - -
- - - - - - -
- - - - - - -
- - - - - - -
- 142 155 85 65 53 52
- 69 84 51 68 59 50
- 212 220 39 -38 -38 -19
- 100 105 97 85 77 74
- 47 52 38 20 10 01
68 46 52 36 20 10 01
- -12 42 16 06 01 -05
- - - - - - -
- - - - - - -
- 110 117 125 140 145 149
Net lending (+) or borrowing (-) vis-a-vis ROW (c)
(a) as of total labour force (b) gross saving divided by gross disposable income (c) as a percentage of GDP
Cyclically-adjusted budget balance (c)
Real unit labour cost
Imports (goods and services)
General government balance (c)
Unit labour costs whole economy
Inventories
Terms of trade goods
Table II381
Net exports
Public Consumption
Trade balance (c)
Employment
Annual percentage change2012
GDP
Private Consumption
Exports (goods and services)
GNI (GDP deflator)
Structural budget balance (c)
Saving rate of households (b)
Main features of country forecast - RUSSIA
Unemployment rate (a)
Gross fixed capital formation
Current-account balance (c)
Contribution to GDP growth
General government gross debt (c)
GDP deflator
Compensation of employees head
of which equipment
Domestic demand
Consumer-price index
ACKNOWLEDGEMENTS
129
This report was prepared in the Directorate-General for Economic and Financial Affairs under the
direction of Marco Buti ndash Director-General Servaas Deroose ndash Deputy Director-General and Elena
Flores ndash Director Policy strategy and co-ordination
Executive responsibilities were attached to Bjoumlrn Doumlhring ndash Head of Unit Economic situation forecasts
business and consumer surveys Evelyne Hespel ndash Head of Sector Macro-economic forecasts and short-
term economic developments and the forecast coordinators ndash Marco Fioramanti and Michał Narożny
The Overview was prepared by Evelyne Hespel Chapter 1 on The EU economy Recovery gaining
ground was prepared by Suzanne Casaux under the responsibility of Bjoumlrn Doumlhring This chapter
benefited from contributions by Chris Bosma Oliver Dieckmann Salvador Ferrandis Vallterra Marco
Fioramanti Marco Iezzi Joao Liborio Michał Narożny Bartosz Przywara Bjorn Roelstraete Rupert
Willis Przemysław Woźniak and Alexandru Zeana Boxes were contributed by Andreas Breitenfellner
Christina Jordan Kieran Mc Morrow Cecilia Moretti Rafal Raciborski Andreas Reuter and Stefan
Zeugner
The sections on Member States were prepared under the supervision of Matthias Mors Istvaacuten Paacutel
Szeacutekely and Peter Weiss Directors for the Economies of the Member States These sections benefited
from contributions by Frode Aasen Hanna Aspegren Wojciech Balcerowicz Davide Balestra Antonino
Barbera Mazzola Paolo Battaglia Barbara Bernardi Piotr Bogumił Ivan Csaba Nicolae Dragos Biea
Peghe Braila Raphaeumll Canceacute Jakob Christensen Ben Deboeck Francisco de Castro Gatis Eglitis
Riccardo Ercoli Raffaele Fargnoli Miroslav Floriaacuten Norbert Gaaacutel Ana Aguacutendez Garciacutea Julien Genet
Svetoslava Georgieva Michael Grams Oskar Grevesmuumlhl Valeska Gronert Renata Hrůzovaacute Michiel
Humblet Duy Huynh-Olesen Laacuteszloacute Jankovics Alexandra Janovskaia Markita Kamerta Csanaacuted Saacutendor
Kiss Mitja Košmrl Bozhil Kostov Mihaacutely Kovaacutecs Robert Kraemer Radoslav Krastev Bettina Cvetan
Kyulanov Vileta Kyviene Baudouin Lamine Jessica Larsson Julia Lendvai Joanna Leszczuk Milan
Lisickyacute Erki Lohmuste Mart Maivaumlli Janis Malzubris Anton Mangov Helena Marrez Dan Matei
Fabrizio Melcarne Olivia Mollen Alexander Molzahn Daniel Monteiro Magdalena Morgese Borys
Radostin Neykov Stelios Panagiotou Christos Paschalides Presiyan Petkov Nicolas Philiponnet
Dominik Pripužić Alexandra Puţinelu Diana Radu Vito Ernesto Reitano David Marco Riquelme
Alexia Schmiliver Ralph Schmitt-Nilson Martin Schroeder Giedrius Sidlauskas Peeter Soidla Vladimiacuter
Solanič Klara Stoviček Graham Stull Alina Tănasă-Troaşe Ingrid Toming Roberta Torre Tsvetan
Tsalinski Christoph Ungerer Thomas Usher Henk Van Noten Rafał Wielądek and Andreas Zenthoumlfer
Coordination and editorial support was provided by Barbara Kauffmann Head of Unit Coordination of
country-specific policy surveillance Judit Antal Kai Behrens Paolo Biraschi Martin Dederke Tiziana
Fabris Joumlrn Griesse Paz Guzman Caso de los Cobos Joao Liborio and Bartosz Przywara
The sections on Candidate Countries and Other non-EU countries were prepared under the
supervision of Peter Bekx Director of the International economic and financial relations global
governance These sections and forecasts for all other non-EU economies benefited from contributions
by Concha Artola Eglė Bajorinienė Bernhard Boumlhm Davide Cicero Hans Feddersen Matteo Fumerio
Clara Galliani Plamen Kaloyanchev Willem Kooi Safwan Naser Roxanne Rua Antonio Sanchez
Pareja Barbara Stearns-Blasing Rupert Willis and Przemysław Woźniak
Support on the communication and publication of this report by Sabine Berger Robert Gangl Anne-
Franccediloise Knuts Jens Matthiessen Irena Novakova Yasmina Quertinmont and Roman Schoumlnwiesner is
gratefully acknowledged IT support was provided by Youssef Tiani and Rudy Druine
Follow-up calculations were performed by Karel Havik Kieran Mc Morrow Fabrice Orlandi Rafał
Raciborski Werner Roumlger Anna-Elisabeth Thum and Valerie Vandermeulen Forecast assumptions were
prepared by Lucian Briciu Roberta Friz Clara Galliani Dalia Grigonyte Gerda Symens Andreacute
130
Verbanck and Przemysław Woźniak Statistical support for the production of the forecast tables was
provided by Antoine Avdoulos Noeumll Doyle Salvador Ferrandis and Bjorn Roelstrate Further statistical
and layout assistance was provided by Yves Bouquiaux Paolo Covelli Andrzej Erdmann Laszlo Elod
Fejer Georgios Gavanas Julien Genet Michel Gerday Susanne Hoffmann Jan Kattevilder Johann
Korner Oscar Gomez Lacalle Anders Lindqvist Vasiliki Michou Simona Pojar Daniela Porubskaacute
Ulrike Stierle-von Schuetz Jacek Szelożyński Zinovia Tsikalaki and Tomasz Zdrodowski
Valuable comments and suggestions by Ronald Albers Christopher Allen Alfonso Arpaia Laura
Bardone Moreno Bertoldi Gerrit Bethuyne Suzanne Casaux Nathalie Darnaut Oliver Dieckmann
Marie Donnay Patrick DSouza Marco Fioramanti Jakob Wegener Friis Carole Garnier Gabriele
Giudice Peter Grasmann Heinz Jansen Marco Iezzi Barbara Kauffmann Joost Kuhlmann Stefan
Kuhnert Martin Larch Geacuteraldine Mahieu Mary McCarthy Cecilia Moretti Michał Narożny Elena
Reitano Uwe Stamm Michael Stierle Massimo Suardi Michael Thiel Alessandro Turrini Charlotte
Van Hooydonk Christian Weise Peter Weiss Norbert Wunner and Javier Yaniz Igal are gratefully
acknowledged
Secretarial support for the finalisation of this report was provided by Kaacuteroly Csiszar and Els Varblane
Comments on the report would be gratefully received and should be sent to
Directorate-General for Economic and Financial Affairs
Unit A4 Economic situation forecasts business and consumer surveys
European Commission
B-1049 Brussels
E-mail ecfin-forecastseceuropaeu
Statistical Annex European Economic Forecast ndash Winter 2014
Contents
132
Output GDP and its components
1 Gross domestic product 134
2 Profiles (q-o-q) of quarterly GDP 134
3 Profiles (y-o-y) of quarterly GDP 135
4 GDP per capita 135
5 Final domestic demand 136
6 Final demand 136
7 Private consumption expenditure 137
8 Government consumption expenditure 137
9 Total investment 138
10 Investment in construction 138
11 Investment in equipment 139
12 Public investment 139
13 Potential GDP 140
14 Output gap relative to potential GDP 140
Prices
15 Deflator of GDP 141
16 Deflator of private consumption 141
17 Consumer prices index 142
18 Consumer prices quarterly profiles 142
19 Deflator of exports of goods 143
20 Deflator of imports of goods 143
21 Terms of trade of goods 144
Wages population and labour market
22 Total population 144
23 Total employment 145
24 Unemployment rate 145
25 Compensation of employees per head 146
26 Real compensation of employees per head 146
27 Labour productivity 147
28 Unit labour costs whole economy 147
29 Real unit labour costs 148
Exchange rates
30 Nominal bilateral exchange rates 148
31 Nominal effective exchange rates 149
32 Relative unit labour costs 149
33 Real effective exchange rates 150
Statistical Annex
133
General Government
34 Total expenditure 150
35 Total revenue 151
36 Net lending (+) or net borrowing (-) 151
37 Interest expenditure 152
38 Primary balance 152
39 Cyclically-adjusted net lending (+) or net borrowing (-) 153
40 Cyclically-adjusted primary balance 153
41 Structural budget balance 154
42 Gross debt 154
Saving
43 Gross national saving 155
44 Gross saving of the private sector 155
45 Saving rate of households 156
46 Gross saving of general government 156
Trade and international payments
47 Exports of goods and services 157
48 Imports of goods and services 157
49 Merchandise trade balance ( of GDP) 158
50 Current-account balance ( of GDP) 158
51 Net lending (+) or net borrowing (-) 159
52 Current-account balance (bn EUR) 159
53 Export markets (goods and services) 160
54 Export performance (goods and services) 160
World economy
55 World GDP 161
56 World exports of goods and services 162
57 Export shares (goods) in EU trade 162
58 World imports of goods and services 163
59 Import shares (goods) in EU trade 163
60 World merchandise trade balances (bn USD) 164
61 World current-account balances (bn USD) 164
62 Primary commodity prices 164
European Economic Forecast Winter 2014
134
Table 1
5-year
1995-99 2000-04 2005-09 2010 2011 2012 2013 2014 2015 2013 2014 2015
26 20 11 23 18 -01 02 14 17 01 11 14
16 11 07 40 33 07 04 18 20 05 17 19
57 73 12 26 96 39 07 23 36 13 30 39
101 58 15 -11 22 02 03 18 29 03 17 25
30 45 16 -49 -71 -64 -37 06 29 -40 06 29
36 36 16 -02 01 -16 -12 10 17 -13 05 17
24 20 06 17 20 00 03 10 17 02 09 17
18 15 -04 17 05 -25 -19 06 12 -18 07 12
47 34 29 13 04 -24 -60 -48 09 -87 -39 11
42 73 15 -13 53 52 40 42 43 40 41 42
47 42 20 31 19 -02 21 22 25 19 18 11
45 18 22 33 17 09 20 21 21 18 19 20
39 17 15 15 09 -12 -08 10 13 -10 02 12
30 19 14 18 28 09 03 15 18 04 16 18
39 14 03 19 -13 -32 -16 08 15 -18 08 15
43 37 23 13 07 -25 -16 -01 13 -27 -10 07
43 38 51 44 30 18 08 23 32 09 21 29
45 31 08 34 28 -10 -15 02 13 -06 06 16
24 19 07 19 16 -07 -04 12 18 -04 11 17
-03 54 39 04 18 08 06 17 20 05 15 18
22 36 35 25 18 -10 -12 18 22 -10 18 22
28 15 01 14 11 -04 03 17 18 03 17 18
44 18 -23 00 -20 -07 05 12 -07 05 12
46 69 23 16 60 37 32 35 39 34 36 39
24 42 03 11 16 -17 11 21 21 07 18 21
60 32 47 39 45 19 16 29 31 13 25 29
05 54 37 -11 22 07 35 23 25 22 21 24
34 29 10 66 29 09 09 25 33 11 28 35
36 32 06 17 11 03 19 25 24 13 22 24
22 09 20 17 -04 01 15 20 00 14 19
41 27 09 25 18 28 19 29 32 16 26 31
08 14 -03 47 -05 14 16 16 13 21 20 13
EU
averages
Cyprus
forecast
Romania
Spain
Croatia
Germany
Bulgaria
17022014
Lithuania
Estonia
Czech Republic
Austria
Gross domestic product volume (percentage change on preceding year 1995-2015)
Luxembourg
France
Autumn 2013
Ireland
Denmark
Finland
Belgium
forecast
Portugal
Italy
Slovakia
Netherlands
Winter 2014
USA
Latvia
Japan
Sweden
Hungary
United Kingdom
Poland
Greece
Euro area
Slovenia
Malta
Table 2 17022014
20131 20132 20133 20134 20141 20142 20143 20144 20151 20152 20153 20154
00 02 03 04 04 05 04 04 05 05 04 04
00 07 03 04 05 05 04 04 04 05 05 05
-03 -03 05 -01 05 09 10 10 09 08 07 07
-04 -01 01 03 04 03 04 04 05 05 05 04
00 06 00 03 02 03 03 05 05 04 05 05
-06 -03 00 01 03 03 04 04 03 03 02 02
17 00 12 07 10 10 11 11 10 10 11 11
-07 20 02 04 04 05 05 06 06 06 06 07
-03 01 03 07 00 01 02 03 03 04 05 06
01 00 02 03 06 06 06 06 06 06 07 07
-04 11 02 00 01 02 02 03 04 04 05 06
-03 -01 00 00 -01 00 03 04 04 04 04 05
03 03 03 04 06 09 08 10 08 07 08 09
-04 00 -02 -08 04 03 02 02 03 03 03 04
-02 03 01 03 03 04 04 05 05 05 05 05
01 -01 05 04 05 05 06 06 05 06 06 06
-13 03 02 16 03 06 06 07 08 09 09 10
-01 05 04 02 05 05 05 05 04 04 04 05
00 -02 -01
10 08 03 12 16 17 17 18 14 15 15 16
11 03 08 06 04 04 04 04 05 05 05 05
04 06 07 05 07 08 08 08 07 07 08 08
06 08 16 17 -04 02 02 05 06 08 10 08
05 -01 01 08 06 08 08 08 09 09 08 07
05 08 08 07 06 06 05 05 06 07 07 08
00 04 03 04 04 05 04 05 05 05 05 06
03 06 10 08 04 08 08 08 07 08 09 09
11 09 03 03 15 -11 06 04 04 04 09 -02
Estonia
EU
Czech Republic
Malta
Italy
Poland
Slovakia
Netherlands
Ireland
USA
Denmark
Cyprus
Profiles (qoq) of quarterly GDP volume (percentage change from previous quarter 2013-15)
United Kingdom
Bulgaria
Luxembourg
Germany
Hungary
Slovenia
France
Greece
Croatia
Euro area
Latvia
Belgium
Sweden
Lithuania
Portugal
Romania
Finland
Austria
Spain
Japan
Statistical Annex
135
Table 3 17022014
20131 20132 20133 20134 20141 20142 20143 20144 20151 20152 20153 20154
-05 01 04 09 13 15 17 17 17 17 17 17
-03 05 06 14 19 16 17 17 17 17 18 18
14 12 05 -02 -07 -15 -19 -27 -30 -29 -27 -25
-20 -16 -11 -01 06 10 12 13 15 17 18 18
-04 05 03 08 11 08 11 13 16 17 19 19
-26 -23 -19 -08 00 05 09 11 11 12 11 09
67 45 40 36 29 38 37 40 40 40 41 42
08 28 28 20 31 16 19 21 23 24 25 27
-14 -17 -06 07 10 11 10 06 08 10 13 16
05 03 04 05 10 16 20 23 23 23 24 25
-41 -20 -10 09 14 04 04 08 11 13 16 20
-30 -18 -13 -04 -03 -02 01 06 11 15 17 17
07 08 09 13 17 24 30 37 40 38 38 38
-28 -14 -11 -14 -05 -01 03 18 17 18 20 23
-12 -06 -03 05 12 11 13 14 16 16 18 17
04 02 07 10 14 19 19 21 21 22 22 22
-23 -17 -12 08 29 30 32 18 26 31 36 41
-07 05 05 10 16 15 16 20 19 18 18 17
-15 -08 -06
40 40 23 33 33 38 47 55 53 49 47 44
-01 06 17 28 24 24 20 18 19 20 21 22
08 13 18 22 25 28 30 33 33 32 32 32
23 16 41 47 38 32 17 06 16 21 30 32
16 06 03 13 14 24 32 31 34 35 34 34
07 20 19 28 29 26 24 22 22 23 25 28
-07 -01 02 10 15 15 16 17 18 19 20 20
13 16 20 27 28 30 28 28 31 32 32 33
-01 13 24 27 31 09 12 13 02 17 21 14
Estonia
EU
Czech Republic
Malta
Italy
Poland
Slovakia
Netherlands
Ireland
USA
Denmark
Cyprus
Profile (yoy) of quarterly GDP volume (percentage change from corresponding quarter in previous year 2013-15)
United Kingdom
Bulgaria
Luxembourg
Germany
Hungary
Slovenia
France
Greece
Croatia
Euro area
Latvia
Belgium
Sweden
Lithuania
Portugal
Romania
Finland
Austria
Spain
Japan
Table 4
5-year
1995-99 2000-04 2005-09 2010 2011 2012 2013 2014 2015 2013 2014 2015
24 16 04 14 09 -08 -04 09 11 -06 04 07
14 10 08 42 33 05 02 16 19 03 15 19
71 78 13 26 95 40 11 27 40 14 31 39
90 41 -07 -15 18 -01 03 09 18 -05 08 15
23 41 11 -52 -70 -63 -37 06 29 -40 06 29
33 22 01 -05 -01 -17 -07 16 22 -11 08 19
20 13 00 12 15 -05 -03 05 12 -03 04 12
17 13 -09 14 03 -28 -23 02 09 -23 03 09
32 22 08 -13 -21 -39 -69 -57 -01 -97 -49 01
53 84 26 08 73 65 51 52 51 49 50 50
34 29 03 12 -04 -24 04 06 10 02 02 -04
38 11 17 28 13 01 15 18 19 13 16 18
33 11 12 10 05 -16 -09 08 10 -13 00 09
28 15 10 15 25 04 00 12 15 00 12 14
36 08 01 19 -11 -28 -08 09 16 -10 09 16
44 35 19 09 05 -27 -18 -03 12 -28 -12 06
41 39 50 42 36 16 07 19 28 06 18 26
42 29 03 29 23 -15 -19 -02 08 -11 01 11
22 14 03 17 14 -09 -06 10 16 -07 08 15
02 65 44 11 44 14 13 24 27 14 26 29
23 37 30 22 20 -11 -12 17 20 -11 17 20
23 12 -03 09 07 -07 00 13 15 01 13 15
47 18 -20 17 -03 -06 06 14 -05 06 14
54 79 36 37 85 51 41 43 40 43 43 40
26 45 05 13 19 -12 13 22 22 09 19 22
59 33 47 29 45 19 16 30 32 13 26 30
07 61 39 -10 25 09 37 25 27 24 23 26
32 26 03 57 22 02 00 16 24 02 19 26
33 28 00 09 04 -06 12 18 17 06 15 16
19 05 17 15 -06 -01 13 18 -03 11 17
28 17 00 17 11 20 12 22 25 08 19 24
05 12 -03 42 -03 17 17 17 14 22 20 13
EU
averages
Cyprus
forecast
Romania
Spain
Croatia
Germany
Bulgaria
17022014
Lithuania
Estonia
Czech Republic
Austria
Gross domestic product per capita (percentage change on preceding year 1995-2015)
Luxembourg
France
Autumn 2013
Ireland
Denmark
Finland
Belgium
forecast
Portugal
Italy
Slovakia
Netherlands
Winter 2014
USA
Latvia
Japan
Sweden
Hungary
United Kingdom
Poland
Greece
Euro area
Slovenia
Malta
European Economic Forecast Winter 2014
136
Table 5
5-year
1995-99 2000-04 2005-09 2010 2011 2012 2013 2014 2015 2013 2014 2015
22 15 15 18 20 -06 -05 11 20 -04 10 15
16 01 06 24 28 -03 07 21 21 08 20 20
62 97 -02 01 131 55 23 27 38 24 32 41
84 51 10 -46 -18 -16 01 14 14 00 02 09
37 44 17 -70 -87 -96 -59 -11 15 -60 -11 24
42 42 14 -06 -20 -41 -28 02 10 -34 -08 09
22 22 11 17 20 -09 03 09 19 02 08 18
21 16 -03 21 -09 -52 -27 04 13 -29 06 13
44 45 36 19 -14 -42 -105 -68 00 -137 -58 10
85 -06 -14 108 25 32 44 48 33 45 48
51 31 11 91 42 25 19 23 23 16 21 25
18 21 19 -15 -20 12 17 19 08 14 19
43 11 15 -01 08 -16 -25 11 09 -37 -05 08
22 12 10 14 32 01 -10 12 14 -03 14 15
48 11 03 18 -51 -66 -28 -01 08 -37 -03 07
62 31 16 -05 -03 -64 -39 -19 01 -39 -26 -07
59 37 38 37 10 -41 -08 18 27 -19 16 25
43 29 11 29 42 -08 -19 -03 12 -08 08 14
17 08 12 08 -22 -09 10 17 -11 08 16
13 76 42 -48 00 35 -12 17 23 01 17 22
25 35 23 19 -01 -28 -11 06 17 -17 12 18
29 18 05 16 02 -01 10 15 16 06 14 16
52 17 -51 -03 -31 -05 02 12 -04 02 15
77 09 22 59 -05 33 39 43 36 39 43
18 45 -18 02 -05 -35 07 24 22 05 17 21
75 23 45 46 36 -01 -02 26 32 -07 19 27
19 75 56 -11 25 14 -07 20 29 -12 22 26
26 20 13 65 32 03 09 28 32 14 29 35
42 36 02 21 -01 12 20 24 23 10 19 20
21 09 15 08 -15 -03 14 19 -06 11 18
45 31 04 30 17 26 17 27 34 17 26 33
07 10 -05 29 04 23 18 17 10 19 16 10
EU
averages
Cyprus
forecast
Romania
Spain
Croatia
Germany
Bulgaria
17022014
Lithuania
Estonia
Czech Republic
Austria
Domestic demand volume (percentage change on preceding year 1995-2015)
Luxembourg
France
Autumn 2013
Ireland
Denmark
Finland
Belgium
forecast
Portugal
Italy
Slovakia
Netherlands
Winter 2014
USA
Latvia
Japan
Sweden
Hungary
United Kingdom
Poland
Greece
Euro area
Slovenia
Malta
Table 6
5-year
1995-99 2000-04 2005-09 2010 2011 2012 2013 2014 2015 2013 2014 2015
35 27 13 45 40 05 06 22 33 -01 25 31
28 19 14 63 45 09 07 31 38 06 29 37
75 97 02 96 178 56 20 34 46 15 39 48
123 67 19 13 22 02 02 22 28 03 16 26
46 45 12 -52 -72 -82 -42 01 24 -43 01 31
53 43 13 18 00 -26 -09 16 24 -14 08 22
31 25 08 32 27 -02 04 17 27 05 15 27
25 19 -04 39 06 -36 -21 11 22 -22 13 21
52 41 27 24 02 -38 -88 -55 07 -112 -48 12
83 09 28 113 49 23 44 52 31 46 53
72 58 25 78 51 -07 22 32 42 24 35 32
15 22 90 09 31 -10 29 40 -05 30 38
57 27 20 49 23 07 -07 20 30 -05 13 27
36 30 12 41 45 05 02 26 32 04 26 31
54 17 06 36 -23 -42 -04 14 21 -11 13 21
58 48 27 35 26 -34 -09 07 22 -16 -02 15
68 57 46 88 60 25 14 33 45 14 32 43
59 37 13 43 38 -06 -15 07 21 -10 16 22
27 10 41 25 -07 -02 21 30 -03 19 29
64 40 11 44 20 25 33 40 20 24 35
50 60 36 70 38 03 -04 30 38 -11 23 32
37 26 12 20 26 01 10 21 25 07 21 25
58 11 -25 03 -21 -07 08 18 -05 09 20
91 26 75 92 48 47 51 55 47 52 55
68 21 52 37 -09 29 39 42 21 36 42
82 43 50 67 48 11 14 34 42 12 29 38
25 92 55 21 45 02 33 31 39 18 30 36
45 31 14 82 42 05 01 28 39 02 31 45
46 38 06 31 09 12 17 25 26 14 23 24
30 12 41 24 -03 02 22 30 01 21 29
48 30 07 38 23 27 19 31 37 18 30 36
10 17 -05 54 03 20 18 19 15 21 22 14
EU
averages
Cyprus
forecast
Romania
Spain
Croatia
Germany
Bulgaria
17022014
Lithuania
Estonia
Czech Republic
Austria
Final demand volume (percentage change on preceding year 1995-2015)
Luxembourg
France
Autumn 2013
Ireland
Denmark
Finland
Belgium
forecast
Portugal
Italy
Slovakia
Netherlands
Winter 2014
USA
Latvia
Japan
Sweden
Hungary
United Kingdom
Poland
Greece
Euro area
Slovenia
Malta
Statistical Annex
137
Table 7
5-year
1995-99 2000-04 2005-09 2010 2011 2012 2013 2014 2015 2013 2014 2015
20 14 14 28 02 -03 06 15 19 05 12 15
15 07 05 10 23 08 09 15 18 09 14 16
70 83 18 -26 38 49 45 43 42 47 38 45
69 50 29 04 -14 -03 -06 08 10 -06 05 10
28 38 30 -62 -77 -91 -72 -16 14 -67 -16 14
34 36 14 02 -12 -28 -24 06 11 -26 01 10
21 22 15 16 06 -03 04 06 16 05 06 16
24 10 03 15 -03 -41 -25 01 09 -23 03 08
73 43 35 15 13 -25 -75 -63 07 -124 -57 16
79 24 23 48 58 55 49 51 60 49 50
36 22 13 26 13 22 20 23 26 12 14 23
27 23 -03 33 -05 06 19 22 06 17 22
42 14 03 03 -11 -16 -21 -05 10 -21 -11 07
16 17 13 20 08 05 -02 08 10 00 09 10
38 18 10 25 -33 -53 -18 01 08 -25 01 07
49 25 26 15 08 -48 -35 -20 -01 -35 -26 -12
52 39 50 -07 -05 -02 -01 12 23 08 09 19
38 32 19 33 25 03 -10 -02 14 -06 03 14
17 10 10 03 -14 -07 07 14 -07 06 13
03 66 38 01 15 26 -04 14 17 -03 13 16
29 31 29 09 05 -21 -04 04 20 03 10 20
17 15 13 13 -07 -01 04 14 17 03 14 17
46 14 -13 02 -29 -07 -05 05 -05 -05 05
80 30 -36 48 39 47 38 43 48 38 45
52 -05 -30 04 -16 00 15 16 05 12 15
61 31 39 31 26 12 08 20 25 06 16 20
35 81 64 -03 11 11 09 15 25 03 16 22
26 27 18 40 17 16 19 27 33 20 33 37
42 39 05 10 -04 15 24 24 22 16 17 19
23 11 11 03 -07 00 11 17 -01 09 15
42 34 13 20 25 22 20 27 30 19 23 28
10 10 04 28 03 20 20 05 06 19 08 08
EU
averages
Cyprus
forecast
Romania
Spain
Croatia
Germany
Bulgaria
17022014
Lithuania
Estonia
Czech Republic
Austria
Private consumption expenditure volume (percentage change on preceding year 1995-2015)
Luxembourg
France
Autumn 2013
Ireland
Denmark
Finland
Belgium
forecast
Portugal
Italy
Slovakia
Netherlands
Winter 2014
USA
Latvia
Japan
Sweden
Hungary
United Kingdom
Poland
Greece
Euro area
Slovenia
Malta
Table 8
5-year
1995-99 2000-04 2005-09 2010 2011 2012 2013 2014 2015 2013 2014 2015
17 21 17 06 07 14 06 05 14 04 05 07
16 06 18 13 10 10 11 15 12 11 15 12
20 22 33 -08 13 38 09 10 12 02 02 02
49 60 29 -49 -29 -32 -10 -28 -04 -10 -28 -25
26 49 27 -87 -52 -42 -61 -40 -12 -49 -40 -12
27 50 51 15 -05 -48 -11 -09 -02 -30 -21 -01
08 18 16 18 04 14 17 12 14 17 12 14
-01 27 09 -04 -12 -27 -06 -06 04 -12 -09 07
46 23 49 10 -02 -31 -60 -15 -27 -89 -37 -17
12 07 -79 11 -02 27 20 17 17 20 17
48 49 28 25 13 48 17 19 25 32 28 25
28 29 16 41 52 12 10 08 12 10 08
19 25 42 05 02 -07 -07 03 -09 -07 00 -05
29 05 22 02 03 02 01 08 08 09 08 08
37 25 17 01 -50 -47 -20 -25 -19 -40 -28 -22
34 31 33 13 -16 -13 -27 -16 03 -27 -25 -01
25 29 49 10 -43 -11 13 56 34 01 42 28
24 15 13 -04 05 05 -08 -07 09 07 09 08
20 22 06 -01 -05 03 05 07 00 03 07
-46 51 -07 19 16 -14 31 22 23 30 22 21
05 28 13 02 -27 -19 14 15 08 13 12 10
25 18 19 02 -14 04 03 15 06 04 06 06
09 24 -21 -06 -08 00 03 05 -10 05 05
22 12 -34 03 06 15 16 17 14 16 16
-18 32 00 -12 00 -12 11 15 20 08 15 20
29 28 49 41 -17 02 20 31 26 17 19 23
07 -20 19 -47 02 17 -15 18 15 00 18 13
09 04 11 21 08 03 12 09 07 10 11 07
16 38 16 05 00 16 05 05 04 00 -01 02
23 20 06 -02 -02 04 06 07 01 03 07
14 25 19 01 -27 -02 -21 -02 11 -18 -02 02
26 29 08 19 12 17 21 15 09 14 06 05
EU
averages
Cyprus
forecast
Romania
Spain
Croatia
Germany
Bulgaria
17022014
Lithuania
Estonia
Czech Republic
Austria
Government consumption expenditure volume (percentage change on preceding year 1995-2015)
Luxembourg
France
Autumn 2013
Ireland
Denmark
Finland
Belgium
forecast
Portugal
Italy
Slovakia
Netherlands
Winter 2014
USA
Latvia
Japan
Sweden
Hungary
United Kingdom
Poland
Greece
Euro area
Slovenia
Malta
European Economic Forecast Winter 2014
138
Table 9
5-year
1995-99 2000-04 2005-09 2010 2011 2012 2013 2014 2015 2013 2014 2015
34 18 16 -11 41 -20 -25 17 32 -26 10 27
17 -17 04 57 69 -21 -08 41 44 -09 44 44
96 152 -39 -73 376 109 14 17 54 00 36 57
149 50 -40 -227 -91 -06 38 105 54 29 44 54
79 68 -05 -150 -196 -192 -87 53 113 -59 53 113
74 52 -13 -55 -54 -70 -56 01 20 -66 -24 19
37 25 07 14 29 -12 -19 09 33 -23 06 34
36 26 -20 06 -22 -83 -55 16 37 -52 27 38
11 57 45 -49 -87 -196 -240 -181 13 -295 -119 22
140 -35 -181 279 87 -02 52 69 03 55 69
81 36 15 -07 121 35 21 29 18 11 27 31
27 -23 158 -215 -44 -20 13 18 -20 05 18
77 -14 16 -74 61 -40 -49 57 31 -85 09 27
19 10 -06 -14 85 16 -07 24 32 -17 22 30
82 -12 -17 -31 -105 -144 -80 12 37 -85 12 37
123 33 10 -153 -55 -82 -39 -21 07 -42 -27 04
66 08 26 65 142 -105 -67 02 33 -53 12 37
97 26 01 17 58 -08 -44 -10 17 -11 10 20
14 -03 -04 16 -40 -30 23 36 -33 19 36
27 143 107 -183 -65 08 17 24 42 21 24 42
41 37 33 10 04 -45 -40 12 22 -44 03 22
71 20 -06 -21 33 08 17 27 31 02 27 31
90 31 -150 -64 -46 -03 20 40 00 20 55
147 86 -15 19 207 -36 72 65 69 49 68 68
53 48 -07 -85 -59 -37 32 60 44 -04 38 43
156 -16 93 -04 85 -17 -04 41 61 -38 29 57
12 90 84 -18 73 49 -27 34 45 -20 35 44
65 24 20 72 82 33 -10 47 68 -26 51 75
70 23 -18 28 -24 07 -18 65 71 -08 50 53
17 00 -02 16 -30 -25 30 42 -29 25 40
75 27 -25 11 34 55 33 52 78 35 63 78
-05 -12 -25 -02 14 34 27 52 25 29 46 24
EU
averages
Cyprus
forecast
Romania
Spain
Croatia
Germany
Bulgaria
17022014
Lithuania
Estonia
Czech Republic
Austria
Total investment volume (percentage change on preceding year 1995-2015)
Luxembourg
France
Autumn 2013
Ireland
Denmark
Finland
Belgium
forecast
Portugal
Italy
Slovakia
Netherlands
Winter 2014
USA
Latvia
Japan
Sweden
Hungary
United Kingdom
Poland
Greece
Euro area
Slovenia
Malta
Table 10
5-year
1995-99 2000-04 2005-09 2010 2011 2012 2013 2014 2015 2013 2014 2015
11 05 14 60 39 -24 -29 07 18 -33 07 24
-11 -39 -05 32 78 -14 -03 36 28 -01 41 27
142 -21 -30 38 105 -29 -22 29 -60 -06 34
141 66 -57 -296 -156 -41 -14 89 25 -22 08 26
50 41 -30 -192 -210 -227 -135 24 99 -100 25 99
47 62 -17 -99 -108 -97 -100 -41 -19 -105 -58 -09
09 27 09 -32 14 -08 -25 -08 15 -26 -08 18
11 40 -19 -45 -37 -64 -68 -14 18 -62 08 10
55 34 -48 -79 -203 -249 -138 14 -309 -112 28
56 58 19 -100 40 -61 06 23 24 -04 23 30
-29 06 -87 -47
31 -09 12 -119 49 -76 -47 55 25 -84 04 19
01 02 -13 -39 25 25 02 19 22 04 15 20
73 -15 -36 -42 -115 -181 -136 -22 09 -148 -16 00
93 16 16 -205 -185 -65 -37 -34 02 -54 -44 01
-17 53 -77 74 -85 -69 20 34 -45 24 34
83 29 -04 72 49 -52 -36 -12 16 -11 06 20
12 12 -07 -41 -03 -42 -39 06 18 -40 06 18
122 178 -216 -222 -62 -10 24 34 -20 14 21
19 13 18 -01 -50 -53 -75 03 17 -62 -10 17
56 15 -27 -71 96 -54 -16 45 11 -19 48 38
50 08 -74 143 -40 41 50 50 18 48 48
60 -17 -137 -133 -91 43 56 42 -18 37 43
-16 88 22 78 -10 -27 39 54 -67 35 59
08 81 97 113 -43 35 -34 36 46 -31 33 44
-01 40 11 45 35 07 07 40 55 -12 40 60
47 14 -14 22 36 -40 -28 65 71 -13 43 56
17 13 -04 -31 04 -40 -35 17 28 -36 14 27
44 22 -66 -74 -16 77 38 46 77 34 54 75
-34 -35 -45 -31 -01
EU
averages
Cyprus
forecast
Romania
Spain
Croatia
Germany
Bulgaria
17022014
Lithuania
Estonia
Czech Republic
Austria
Investment in construction volume (percentage change on preceding year 1995-2015)
Luxembourg
France
Autumn 2013
Ireland
Denmark
Finland
Belgium
forecast
Portugal
Italy
Slovakia
Netherlands
Winter 2014
USA
Latvia
Japan
Sweden
Hungary
United Kingdom
Poland
Greece
Euro area
Slovenia
Malta
Statistical Annex
139
Table 11
5-year
1995-99 2000-04 2005-09 2010 2011 2012 2013 2014 2015 2013 2014 2015
64 22 14 -109 48 -32 -17 32 55 -21 16 29
60 07 07 100 58 -40 -22 48 71 -27 50 71
164 -84 -162 1228 117 65 60 80 64 80 80
173 13 09 -112 -15 23 92 120 65 92 85 65
147 106 26 -82 -181 -173 -30 88 130 -21 89 130
121 20 -11 50 55 -39 12 58 67 -03 26 60
78 17 -08 112 82 -30 -20 32 51 -37 11 51
60 15 -25 81 -07 -114 -43 53 58 -40 52 70
61 52 64 -69 -154 -155 -225 -140 30 -260 -143 14
129 -09 12 217 224 183 40 38 12 30 35 35
-47 483 -473 -135
115 -14 22 -30 95 15 -50 57 40 -86 18 40
34 11 00 21 143 21 -17 33 48 -45 34 48
112 -14 17 -26 -112 -98 16 60 77 10 49 81
148 59 -03 -93 142 -83 -41 -07 12 -24 -12 08
60 27 01 117 383 -115 -60 -28 34 -63 -05 43
115 11 10 -122 105 140 -37 -06 19 -11 18 19
75 13 -03 56 47 -48 -22 46 60 -29 37 61
162 13 -112 245 90 48 26 51 100 110 130
55 50 50 37 67 -56 -07 20 27 -26 15 27
67 19 07 16 -53 79 49 13 49 22 06 28
136 -79 206 372 -48 135 90 97 97 98 98
34 -04 -31 60 38 50 70 47 07 40 45
-19 97 -33 116 -39 34 45 72 10 20 55
24 97 86 -191 236 41 -20 35 45 -03 40 45
118 14 23 119 132 52 -26 53 79 -39 62 89
78 11 -34 99 -217 129 28 87 79 33 69 48
78 14 00 51 34 -28 -13 48 62 -20 39 60
102 23 -10 128 96 63 24 63 80 35 77 82
24 10 -08 26 34
EU
averages
Cyprus
forecast
Romania
Spain
Croatia
Germany
Bulgaria
17022014
Lithuania
Estonia
Czech Republic
Austria
Investment in equipment volume (percentage change on preceding year 1995-2015)
Luxembourg
France
Autumn 2013
Ireland
Denmark
Finland
Belgium
forecast
Portugal
Italy
Slovakia
Netherlands
Winter 2014
USA
Latvia
Japan
Sweden
Hungary
United Kingdom
Poland
Greece
Euro area
Slovenia
Malta
Table 12
5-year
1995-99 2000-04 2005-09 2010 2011 2012 2013 2014 2015 2013 2014 2015
18 17 16 16 18 18 17 16 16 17 17 17
20 17 15 17 17 15 16 16 16 15 15 16
46 43 48 39 41 54 44 40 40 46 41 39
26 38 42 34 24 19 18 17 16 18 17 17
30 35 33 23 17 18 23 25 22 20 20 20
33 34 40 40 30 17 16 14 14 14 12 12
30 30 33 31 31 31 32 31 30 32 31 30
22 23 24 21 20 19 20 19 17 20 18 17
31 33 33 38 35 25 21 23 23 19 17 17
16 18 45 37 43 42 43 40 36 43 40 37
41 44 37 41 38 38 33 33 32 35 35 35
37 39 34 21 25 31 28 28 29 30 31 31
31 33 34 36 33 33 33 33 33 33 33 33
23 13 11 11 10 10 10 10 10 10 10 10
46 41 30 38 26 17 19 18 17 19 18 17
31 32 40 45 36 32 34 35 35 31 35 35
37 28 21 26 23 19 12 13 13 16 13 13
28 26 25 25 25 26 26 26 26 26 26 25
25 25 26 26 24 21 21 21 20 21 20 20
21 32 46 46 34 34 37 39 38 40 42 44
41 41 45 42 36 32 29 29 29 32 32 32
18 18 19 22 22 26 24 25 22 23 24 23
24 23 20 21 25 28 21 24 27
26 28 43 46 44 37 36 36 35 35 35 34
20 38 36 34 31 34 41 49 44 41 48 44
36 32 43 56 57 46 39 40 39 36 35 33
28 32 55 57 55 47 45 44 44 45 44 46
33 29 32 35 34 35 35 35 33 35 34 33
14 15 19 25 22 22 20 20 20 22 22 22
27 25 23 23 23 22 23 22 22
37 37 39 41 38 36 27 27 26 27 26 26
58 46 33 33 31 32 35 38 38 39 40 40
EU
averages
Cyprus
forecast
Romania
Spain
Croatia
Germany
Bulgaria
17022014
Lithuania
Estonia
Czech Republic
Austria
Public investment (as a percentage of GDP 1995-2015)
Luxembourg
France
Autumn 2013
Ireland
Denmark
Finland
Belgium
forecast
Portugal
Italy
Slovakia
Netherlands
Winter 2014
USA
Latvia
Japan
Sweden
Hungary
United Kingdom
Poland
Greece
Euro area
Slovenia
Malta
European Economic Forecast Winter 2014
140
Table 13
5-year
1995-99 2000-04 2005-09 2010 2011 2012 2013 2014 2015 2013 2014 2015
22 20 16 12 13 09 06 07 11 07 09 09
16 14 12 10 13 14 15 15 16 14 15 15
58 39 -06 14 17 28 33 35 29 35 37
88 66 24 -12 -10 -06 04 09 17 -01 08 16
28 47 19 -17 -29 -31 -31 -28 -26 -34 -30 -27
26 37 26 03 -02 -08 -13 -11 -11 -13 -13 -11
18 19 16 10 11 10 10 10 10 10 10 10
15 14 05 -02 01 -09 -05 -02 00 -05 -01 01
36 29 11 02 -14 -27 -29 -27 -31 -32 -31
66 46 -20 -04 07 20 26 32 18 26 35
43 48 30 03 11 16 14 12 14 12 09 11
23 21 23 15 17 15 14 15 14 12 11
33 24 16 04 05 02 02 04 05 00 01 03
25 23 18 08 09 11 11 12 14 11 13 14
31 22 07 02 -01 -14 -07 -07 -03 -08 -05 -01
37 33 -01 -07 -10 -12 -05 01 -19 -09 -05
38 54 34 39 26 22 21 23 22 21 23
33 35 18 03 04 02 -01 00 03 03 04 06
21 15 06 06 04 04 05 07 04 05 07
38 49 11 08 09 11 15 18 11 15 18
30 40 17 11 05 04 07 10 06 08 11
23 16 13 06 07 07 06 10 12 09 12 16
24 -11 -16 -14 -09 -03 06 -10 -03 05
55 48 02 10 14 25 30 34 28 30 32
35 18 01 01 00 04 08 11 03 07 09
40 42 41 46 34 29 27 26 27 25 25
36 44 14 17 18 19 20 21 16 18 20
27 31 22 18 19 18 18 20 22 19 22 24
34 32 18 05 04 04 07 10 13 08 10 13
16 07 07 05 06 08 09 06 07 09
37 28 19 12 14 17 20 23 26 20 24 27
EU
averages
Cyprus
forecast
Romania
Spain
Croatia
Germany
Bulgaria
17022014
Lithuania
Estonia
Czech Republic
Austria
Potential GDP volume (percentage change on preceding year 1995-2015)
Luxembourg
France
Autumn 2013
Ireland
Denmark
Finland
Belgium
forecast
Portugal
Italy
Slovakia
Netherlands
Winter 2014
USA
Latvia
Japan
Sweden
Hungary
United Kingdom
Poland
Greece
Euro area
Slovenia
Malta
Table 14
5-year
1995-99 2000-04 2005-09 2010 2011 2012 2013 2014 2015 2013 2014 2015
-01 07 10 -08 -03 -13 -17 -11 -04 -17 -15 -10
-03 -01 -05 -13 06 -01 -11 -08 -04 -10 -07 -04
23 42 -65 11 32 12 03 04 12 07 08
15 18 04 -48 -18 -10 -12 -03 09 -09 -01 08
12 04 11 -47 -88 -119 -124 -94 -42 -128 -95 -43
-09 18 02 -47 -44 -52 -51 -31 -04 -52 -34 -07
-07 20 11 -21 -12 -22 -29 -29 -22 -29 -30 -23
06 16 10 -17 -14 -30 -43 -36 -24 -45 -37 -26
06 15 00 03 -07 -35 -53 -19 -58 -65 -25
02 39 -112 -61 -19 01 17 28 02 16 24
-10 20 05 -24 -16 -33 -27 -18 -07 -22 -12 -12
-03 -01 08 -03 -01 -10 -04 02 09 -05 02 11
01 -04 00 -15 -10 -25 -33 -27 -19 -34 -32 -23
-02 01 02 -19 00 -03 -10 -07 -03 -10 -07 -03
07 11 -05 -09 -21 -38 -46 -33 -15 -46 -34 -19
08 24 -25 -11 -27 -31 -28 -16 -31 -32 -20
-18 33 -07 -16 -24 -37 -35 -27 -33 -34 -27
-02 03 09 -26 -02 -15 -28 -26 -16 -27 -25 -16
09 04 -21 -12 -22 -30 -24 -13 -29 -24 -14
-45 09 36 -24 -14 -15 -19 -17 -15 -17 -17 -16
01 34 -10 -03 -18 -33 -23 -12 -34 -25 -14
10 11 13 -40 -36 -46 -49 -42 -36 -47 -43 -40
22 -34 -19 -24 -22 -15 -09 -21 -13 -07
-15 43 -79 -33 -11 -05 01 05 00 05 12
12 20 -37 -23 -39 -32 -20 -11 -35 -24 -13
-13 14 07 06 -08 -20 -19 -14 -21 -20 -16
-11 46 -23 -17 -29 -14 -11 -08 -18 -15 -12
-11 00 01 -14 -04 -12 -21 -16 -05 -23 -17 -06
08 02 00 -40 -33 -34 -24 -09 02 -22 -11 00
05 -24 -15 -24 -28 -21 -11 -28 -22 -12
-02 03 05 -23 -19 -09 -09 -04 03 -12 -10 -06
EU
averages
Cyprus
forecast
Romania
Spain
Croatia
Germany
Bulgaria
17022014
Lithuania
Estonia
Czech Republic
Austria
Output gap relative to potential GDP sup1 (deviation of actual output from potential output as of potential GDP 1995-2015)
Luxembourg
France
Autumn 2013
Ireland
Denmark
Finland
Belgium
forecast
Portugal
Italy
Slovakia
Netherlands
Winter 2014
USA
Latvia
Japan
Sweden
Hungary
sup1 When comparing output gaps between the spring and the autumn forecast it has to be taken into account that the overall revisions to the forecast may have led to changes in the estimates for potential output
United Kingdom
Poland
Greece
Euro area
Slovenia
Malta
Statistical Annex
141
Table 15
5-year
1995-99 2000-04 2005-09 2010 2011 2012 2013 2014 2015 2013 2014 2015
09 20 21 21 20 19 13 14 16 21 12 16
07 08 09 10 12 15 22 16 17 22 17 18
151 49 63 03 30 33 50 30 35 49 34 33
33 46 01 -15 07 07 06 07 11 07 08 11
64 34 31 11 10 -08 -26 -05 04 -17 -05 04
32 40 28 01 00 00 03 05 07 04 06 07
10 19 20 10 13 15 11 13 13 15 16 15
33 27 21 04 14 17 13 11 14 13 14 14
20 33 31 19 28 19 -23 06 15 06 11 15
87 40 104 -09 60 33 16 23 23 16 22 22
16 24 33 72 42 30 39 28 27 36 27 26
19 25 28 37 23 22 22 17 24 22 23 23
19 32 17 08 11 13 17 08 22 16 14 27
06 14 18 14 20 17 15 19 17 21 17 17
38 32 21 06 03 -03 17 09 10 19 09 10
111 60 31 -11 12 02 16 07 13 17 11 08
65 59 16 05 16 13 06 07 10 15 18 18
21 13 17 03 27 29 29 22 20 23 22 20
18 21 18 08 12 13 14 12 14 16 14 15
1160 48 72 28 49 22 22 09 20 29 19 22
78 27 15 -16 -09 16 13 13 19 12 08 13
16 24 24 43 07 23 24 13 15 14 15 16
40 40 08 20 20 19 14 18 17 19 19
145 05 55 23 54 26 17 16 25 18 24 28
179 80 40 24 26 32 22 21 23 28 27 23
151 35 30 14 32 24 05 14 18 10 18 19
591 281 111 57 42 46 36 29 27 42 30 26
15 15 22 08 13 10 07 12 17 14 11 14
22 20 25 31 23 17 17 19 21 12 14 15
23 21 12 15 15 14 14 16 15 15 16
16 22 23 12 20 17 15 15 18 14 13 18
-04 -14 -10 -22 -19 -09 -06 17 12 -03 20 12
EU
averages
Cyprus
forecast
Romania
Spain
Croatia
Germany
Bulgaria
17022014
Lithuania
Estonia
Czech Republic
Austria
Deflator of gross domestic product (percentage change on preceding year 1995-2015)
Luxembourg
France
Autumn 2013
Ireland
Denmark
Finland
Belgium
forecast
Portugal
Italy
Slovakia
Netherlands
Winter 2014
USA
Latvia
Japan
Sweden
Hungary
United Kingdom
Poland
Greece
Euro area
Slovenia
Malta
Table 16
5-year
1995-99 2000-04 2005-09 2010 2011 2012 2013 2014 2015 2013 2014 2015
10 21 22 20 31 24 12 08 15 11 12 13
09 13 12 20 21 16 16 15 16 17 17 18
137 36 49 24 49 36 36 18 28 32 26 29
31 40 02 -21 17 05 04 07 10 08 09 11
59 38 29 40 34 09 -13 -04 03 -10 -04 03
30 34 25 19 25 25 15 04 09 17 08 08
07 19 16 11 21 18 07 13 12 10 16 13
32 28 20 15 28 28 13 09 13 15 16 15
13 27 29 21 33 24 02 06 15 09 14 15
35 88 -17 49 31 00 18 20 04 20 20
18 22 24 14 26 16 17 17 18 17 19 18
15 25 30 09 21 10 12 19 11 18 21
21 29 13 15 24 22 22 14 15 28 20 22
13 17 20 18 36 26 22 17 18 22 18 18
31 31 18 13 25 15 05 10 12 06 10 12
111 60 30 15 17 16 11 05 13 21 19 16
73 61 29 10 38 34 15 08 15 15 18 20
14 17 19 19 35 29 19 18 18 19 18 18
22 18 16 24 21 13 11 14 15 15 15
1116 36 53 24 46 35 09 11 22 10 17 24
74 23 22 -02 05 27 12 13 18 10 06 16
17 19 18 27 27 28 08 17 19 09 15 15
33 37 16 26 35 26 13 18 26 18 20
-03 56 13 41 31 12 11 19 14 19 24
72 46 39 42 61 17 12 28 20 22 30
152 40 25 25 49 37 08 13 20 10 20 22
579 238 60 77 45 44 36 27 32 42 29 30
14 14 18 15 17 12 06 11 18 10 15 17
21 11 26 40 39 26 24 21 21 24 21 20
22 20 21 28 22 14 13 16 16 16 16
16 20 22 17 24 18 11 14 19 11 13 17
00 -10 -08 -17 -08 -08 -02 25 15 05 28 15
EU
averages
Cyprus
forecast
Romania
Spain
Croatia
Germany
Bulgaria
17022014
Lithuania
Estonia
Czech Republic
Austria
Price deflator of private consumption (percentage change on preceding year 1995-2015)
Luxembourg
France
Autumn 2013
Ireland
Denmark
Finland
Belgium
forecast
Portugal
Italy
Slovakia
Netherlands
Winter 2014
USA
Latvia
Japan
Sweden
Hungary
United Kingdom
Poland
Greece
Euro area
Slovenia
Malta
European Economic Forecast Winter 2014
142
Table 17 17022014
5-year
1995-99 2000-04 2005-09 2010 2011 2012 2013 2014 2015 2013 2014 2015
13 20 22 23 34 26 12 09 14 13 13 15
15 18 12 25 21 16 14 14 17 17 16
35 52 27 51 42 32 18 28 34 28 31
22 41 18 -16 12 19 05 08 11 08 09 12
58 34 31 47 31 10 -09 -06 02 -08 -04 03
28 32 27 20 31 24 15 03 09 18 09 06
13 20 17 17 23 22 10 12 12 10 14 13
30 25 21 16 29 33 13 09 13 15 16 15
31 22 26 35 31 04 04 14 10 12 16
32 84 -12 42 23 00 19 21 03 21 21
28 27 28 37 29 17 15 17 18 17 16
26 25 20 25 32 10 12 19 11 18 21
17 30 16 09 25 28 26 11 13 27 17 16
12 18 19 17 36 26 21 18 18 22 18 18
26 33 19 14 36 28 04 08 12 06 10 12
69 30 21 21 28 19 08 13 21 19 15
78 28 07 41 37 15 07 16 17 16 19
11 18 18 17 33 32 22 17 16 22 19 18
23 20 16 27 25 14 10 13 15 15 14
64 71 30 34 24 04 05 18 05 14 21
25 27 12 21 35 14 10 18 14 05 16
19 21 20 22 27 24 05 15 17 06 15 17
43 32 34 11 22 34 23 13 15 26 18 20
06 55 12 41 32 12 11 19 14 19 24
71 51 47 39 57 17 12 28 21 22 30
43 28 27 39 37 08 14 20 10 20 22
260 68 61 58 34 32 24 34 33 25 34
14 19 19 19 14 09 04 09 18 06 13 18
20 12 25 33 45 28 26 20 20 26 23 21
27 23 21 31 26 15 12 15 17 16 16
25 26 16 31 21 15 16 19 15 19 21
-02 -01 00 -07 -03 00 04 25 12 03 26 12
Harmonised index of consumer prices (national index if not available) (percentage change on preceding year 1995-2015)
Belgium
Hungary
forecast
Germany
Bulgaria
Italy
Greece
Euro area
Slovenia
Malta
Cyprus
Spain
Winter 2014
Estonia
Czech Republic
Slovakia
Japan
Croatia
Ireland
Denmark
Finland
United Kingdom
Poland
EU
Romania
Netherlands
USA
Latvia
Lithuania
Austria
Luxembourg
Sweden
France
Autumn 2013
forecast
Portugal
averages
Table 18 17022014
20131 20132 20133 20134 20141 20142 20143 20144 20151 20152 20153 20154
14 12 12 09 12 09 07 08 10 13 16 17
18 15 17 13 14 14 13 13 13 13 14 14
38 37 34 21 19 15 13 25 26 28 29 30
11 06 02 04 13 09 06 05 08 11 13 17
00 -04 -08 -22 -11 -07 -04 00 01 02 03 03
28 18 13 02 01 06 00 04 06 09 10 11
12 09 11 08 12 12 11 11 12 12 12 12
21 13 11 07 06 09 10 11 14 13 14 14
17 04 03 -08 00 03 07 09 12 14 15 16
04 -01 00 -02 08 22 23 23 22 21 20 21
22 17 17 12 12 15 14 17 17 18 17 18
19 08 07 06 13 09 12 13 15 20 20 21
32 30 28 13 09 07 12 14 11 10 12 17
26 22 20 16 16 17 18 19 18 18 18 18
04 08 04 01 07 05 07 11 12 12 12 12
27 18 22 11 08 11 06 08 11 12 13 14
22 17 14 05 03 05 07 12 15 16 16 18
25 24 21 18 18 18 18 13 12 15 15 20
18 14 14 08 10 11 10 11 12 12 13 14
21 11 -07 -10 -09 00 11 17 19 19 18 17
17 15 12 11 06 09 11 13 18 18 18 19
09 05 02 04 10 16 16 18 17 17 18 17
42 24 22 06 13 14 13 14 15 13 15 15
22 14 05 05 05 07 13 17 21 20 18 19
27 19 16 07 06 11 11 18 27 27 29 29
13 05 09 06 08 13 15 18 20 21 21 20
48 44 24 13 12 17 32 35 33 34 34 35
06 03 07 03 05 08 10 11 15 18 19 19
28 27 27 21 20 20 20 21 20 20 21 21
20 16 15 10 11 12 12 13 14 15 15 16
16 12 16 12 13 17 15 18 18 19 19 20
-06 -03 09 14 16 32 28 24 23 02 03 18
Estonia
EU
Czech Republic
Malta
Italy
Poland
Slovakia
Netherlands
Ireland
USA
Denmark
Cyprus
Harmonised index of consumer prices (national index if not available) (percentage change on preceding year 2013-15)
United Kingdom
Bulgaria
Luxembourg
Germany
Hungary
Slovenia
France
Greece
Croatia
Euro area
Latvia
Belgium
Sweden
Lithuania
Portugal
Romania
Finland
Austria
Spain
Japan
Statistical Annex
143
Table 19
5-year
1995-99 2000-04 2005-09 2010 2011 2012 2013 2014 2015 2013 2014 2015
-01 09 13 49 44 16 -08 01 13 06 04 13
00 02 02 24 32 12 -06 -03 09 -04 01 09
75 27 35 43 38 05 02 09 17 04 11 20
15 -07 -09 11 -09 47 01 05 11 10 12 11
41 34 21 79 82 38 -17 -04 01 -10 -04 01
19 14 16 25 51 20 -12 06 08 -14 03 09
01 -06 08 23 38 11 -04 -04 11 00 10 15
22 17 13 29 42 18 -03 01 12 -03 03 12
11 28 13 12 10 04 04 08 09 11 14
50 60 87 122 38 12 11 14 21 12 14
-04 14 27 61 48 29 -18 15 11 -03 15 11
-02 13 08 107 -23 20 -01 16 -15 -01 16
-01 05 08 64 53 22 -05 -09 20 -10 -01 20
05 03 12 27 30 06 -11 00 11 -10 00 11
10 08 07 51 68 16 -03 10 10 -06 08 10
58 53 12 22 45 10 -03 06 14 10 13 12
30 53 -02 31 39 09 -20 -16 10 15 14 15
-09 -11 -14 48 51 08 -06 -01 10 02 08 12
05 07 33 39 15 -06 -02 11 -03 04 12
28 46 110 117 37 -25 -02 14 20 28 32
37 -04 -19 -13 09 31 12 32 15 14 06 11
03 14 21 55 51 31 05 01 12 03 20 22
44 24 21 65 37 09 15 20 09 21 24
16 29 124 135 36 -17 -04 18 -02 15 22
09 07 17 34 30 05 06 06 07 16 19
97 45 26 04 74 42 -01 08 13 08 08 13
539 223 58 72 97 93 -26 09 12 -05 07 15
-05 -03 25 -08 -16 -22 -37 05 06 -22 01 02
-17 00 33 62 73 -11 01 05 10 -07 -03 01
06 11 33 42 15 -06 00 11 -03 04 11
-15 12 16 50 76 04 -03 -01 06 -02 09 14
-11 -19 -17 -18 -21 -21 90 10 10 120 10 10
EU
averages
Cyprus
forecast
Romania
Spain
Croatia
Germany
Bulgaria
17022014
Lithuania
Estonia
Czech Republic
Austria
Price deflator of exports of goods in national currency (percentage change on preceding year 1995-2015)
Luxembourg
France
Autumn 2013
Ireland
Denmark
Finland
Belgium
forecast
Portugal
Italy
Slovakia
Netherlands
Winter 2014
USA
Latvia
Japan
Sweden
Hungary
United Kingdom
Poland
Greece
Euro area
Slovenia
Malta
Table 20
5-year
1995-99 2000-04 2005-09 2010 2011 2012 2013 2014 2015 2013 2014 2015
05 16 12 71 67 14 -05 -03 12 -02 05 12
-06 05 00 51 61 16 -25 -07 09 -20 -02 09
95 06 22 60 61 25 -09 07 15 -03 09 20
-01 -09 01 48 56 54 -01 03 12 13 15 12
40 34 29 59 76 48 -19 -03 -01 -12 -03 -01
11 14 09 49 89 44 -18 -07 09 -12 04 10
-01 -03 05 47 65 20 -10 05 12 -16 09 13
13 24 18 70 81 28 -19 -09 12 -16 -01 13
16 24 22 30 21 17 08 13 25 21 18
59 59 76 61 80 09 11 14 16 14 15
10 14 12 10 25 35 -01 06 10 -01 06 10
08 48 25 89 -22 15 -02 15 -14 -02 15
-07 -02 09 80 51 27 -15 -08 10 -15 00 10
09 01 15 43 62 21 -16 -03 12 -17 03 12
06 12 04 50 79 14 -15 01 06 -22 01 06
47 55 13 73 61 22 -02 -02 14 06 17 22
41 49 09 40 55 22 -14 -15 15 15 15 15
-13 -03 05 76 75 26 -18 -01 10 -05 07 16
08 08 57 66 23 -17 -05 10 -14 02 11
26 47 85 97 40 -38 02 16 -05 28 36
30 -06 -12 10 31 37 06 30 10 07 05 12
-07 03 13 42 70 28 -25 02 18 -10 19 21
25 19 16 58 36 02 05 15 07 10 15
-15 37 109 142 46 -21 -05 15 -05 12 21
17 15 19 51 42 02 05 04 04 15 20
122 52 16 18 95 58 05 10 18 08 12 18
523 205 07 61 69 60 -23 17 13 -06 13 16
01 10 25 03 -03 -18 -31 12 10 -19 12 12
-20 -04 43 54 87 -07 -03 01 03 -03 01 03
09 13 52 67 21 -14 -02 10 -11 04 11
-20 17 24 67 88 06 -12 01 09 -09 14 20
01 05 19 57 73 -02 110 28 10 155 28 10
EU
averages
Cyprus
forecast
Romania
Spain
Croatia
Germany
Bulgaria
17022014
Lithuania
Estonia
Czech Republic
Austria
Price deflator of imports of goods in national currency (percentage change on preceding year 1995-2015)
Luxembourg
France
Autumn 2013
Ireland
Denmark
Finland
Belgium
forecast
Portugal
Italy
Slovakia
Netherlands
Winter 2014
USA
Latvia
Japan
Sweden
Hungary
United Kingdom
Poland
Greece
Euro area
Slovenia
Malta
European Economic Forecast Winter 2014
144
Table 21
5-year
1995-99 2000-04 2005-09 2010 2011 2012 2013 2014 2015 2013 2014 2015
-07 -07 01 -21 -21 02 -03 04 00 09 -01 00
06 -02 02 -25 -27 -04 19 05 00 16 04 00
-19 21 13 -16 -22 -19 11 02 02 07 02 00
16 02 -10 -36 -62 -07 02 02 -01 -03 -03 -01
01 00 -08 18 06 -10 02 -01 02 02 -01 03
08 00 07 -23 -35 -23 06 13 -01 -02 -01 -01
02 -03 03 -23 -26 -10 06 -09 -01 17 02 01
09 -07 -04 -39 -36 -10 16 10 00 13 04 -01
-05 04 -09 -18 -11 -13 -04 -05 -16 -10 -04
-08 01 11 58 -38 03 00 00 05 -02 -01
-14 00 15 51 22 -06 -17 09 01 -02 09 01
-10 -33 -17 17 -02 05 01 01 -01 01 01
07 07 00 -14 02 -04 11 -01 10 05 -01 10
-04 02 -02 -15 -30 -14 05 03 -01 07 -03 -01
04 -04 04 01 -10 02 11 10 04 16 08 04
11 -01 00 -48 -16 -12 00 08 00 04 -04 -10
-10 04 -11 -08 -15 -13 -06 -01 -05 00 -01 00
04 -08 -19 -26 -22 -17 12 00 00 07 01 -04
-03 -01 -23 -25 -07 12 03 01 12 02 01
02 -01 23 18 -03 14 -04 -02 25 00 -04
08 02 -07 -23 -21 -06 06 02 05 07 01 -01
11 11 08 13 -18 03 31 -01 -06 13 01 01
18 05 04 07 00 07 10 05 01 11 09
31 -08 14 -06 -10 04 01 03 03 03 01
-08 -08 -02 -17 -12 03 01 01 03 01 -01
-22 -06 10 -14 -19 -15 -06 -02 -05 00 -04 -05
11 15 51 10 26 32 -03 -07 -01 01 -06 -01
-06 -13 01 -11 -13 -05 -06 -07 -04 -03 -11 -10
03 05 -09 08 -13 -04 04 04 07 -04 -04 -02
-02 00 -18 -22 -07 11 02 01 11 00 01
05 -04 -08 -16 -11 -01 09 -01 -04 07 -04 -06
-13 -24 -36 -70 -88 -19 -18 -18 00 -30 -18 00
EU
averages
Cyprus
forecast
Romania
Spain
Croatia
Germany
Bulgaria
17022014
Lithuania
Estonia
Czech Republic
Austria
Terms of trade of goods (percentage change on preceding year 1995-2015)
Luxembourg
France
Autumn 2013
Ireland
Denmark
Finland
Belgium
forecast
Portugal
Italy
Slovakia
Netherlands
Winter 2014
USA
Latvia
Japan
Sweden
Hungary
United Kingdom
Poland
Greece
Euro area
Slovenia
Malta
Table 22
5-year
1995-99 2000-04 2005-09 2010 2011 2012 2013 2014 2015 2013 2014 2015
02 04 07 09 09 07 06 05 06 07 07 06
02 01 -02 -01 00 02 02 02 01 02 02 01
-14 -04 -02 00 00 00 -04 -04 -04 -01 -01 -01
10 16 22 05 04 03 00 09 10 08 09 10
06 03 04 02 -01 -01 00 00 00 00 00 00
03 13 15 03 01 01 -05 -05 -06 -02 -02 -02
04 07 06 05 05 05 05 05 05 05 05 05
00 03 05 03 02 03 04 04 03 04 04 03
14 12 21 26 26 15 10 10 10 10 10 10
-11 -11 -11 -21 -18 -12 -10 -09 -08 -09 -09 -08
13 12 17 19 23 23 17 16 15 17 16 15
07 07 06 05 04 08 05 03 02 05 03 02
06 06 03 05 05 04 01 03 03 03 03 03
01 04 04 02 03 05 03 03 03 04 04 04
03 06 02 00 -01 -04 -07 -01 -01 -07 -01 -01
-01 01 04 04 02 02 02 02 02 02 02 02
02 00 01 02 -06 02 01 03 03 03 03 03
03 02 04 05 05 05 05 05 05 05 05 05
02 05 05 02 02 02 02 02 02 02 02 02
-06 -11 -05 -07 -25 -06 -07 -07 -07 -09 -11 -10
-01 -01 06 02 -02 01 00 00 01 00 00 01
04 03 04 04 04 04 02 04 03 02 04 03
-06 -03 -01 -03 -17 -17 -01 -02 -02 -01 -02 -02
-07 -08 -13 -21 -22 -13 -08 -07 -01 -08 -07 -01
-02 -03 -02 -02 -03 -05 -02 -01 -01 -01 -01 -01
00 00 00 10 00 00 00 00 -01 00 -01 -01
-02 -07 -02 -02 -04 -02 -03 -02 -02 -03 -02 -02
02 03 07 09 08 07 09 09 09 09 09 09
03 04 06 08 08 08 07 07 07 08 08 08
02 03 04 03 02 02 02 02 02 02 02 02
12 10 09 08 07 07 07 07 07 07 07 07
03 02 00 04 -02 -02 -02 -01 -01 -01 00 00
EU
averages
Cyprus
forecast
Romania
Spain
Croatia
Germany
Bulgaria
17022014
Lithuania
Estonia
Czech Republic
Austria
Total population (percentage change on preceding year 1995-2015)
Luxembourg
France
Autumn 2013
Ireland
Denmark
Finland
Belgium
forecast
Portugal
Italy
Slovakia
Netherlands
Winter 2014
USA
Latvia
Japan
Sweden
Hungary
United Kingdom
Poland
Greece
Euro area
Slovenia
Malta
Statistical Annex
145
Table 23
5-year
1995-99 2000-04 2005-09 2010 2011 2012 2013 2014 2015 2013 2014 2015
11 08 12 07 14 02 -03 03 08 -05 04 08
06 02 07 05 14 11 06 05 06 05 05 06
-30 04 -03 -48 70 22 14 02 03 16 03 08
56 29 11 -41 -18 -06 22 15 14 12 13 13
07 13 14 -26 -56 -83 -37 06 26 -35 06 26
31 32 07 -23 -22 -48 -33 01 11 -36 -07 09
09 11 04 00 07 00 -04 03 05 -02 03 04
04 12 -01 -11 01 -11 -18 01 05 -16 02 05
27 21 -02 05 -42 -57 -44 08 -78 -37 10
-20 08 -20 -67 15 14 21 20 20 25 20 20
35 37 34 18 30 25 17 17 19 17 15 17
11 02 15 21 25 24 24 22 20 23 18 18
25 02 09 -06 05 -03 -12 -04 06 -12 -05 06
05 04 07 06 14 13 06 07 08 05 07 08
15 08 -04 -15 -15 -42 -32 -04 04 -39 -05 04
08 10 -22 -16 -08 -20 -11 -03 -24 -13 -05
-01 14 -15 18 01 -08 05 07 -03 03 05
22 10 11 -01 15 01 -06 00 03 -06 00 03
10 05 -06 02 -08 -09 03 07 -09 02 07
05 20 -39 -22 -25 -02 02 04 -10 02 05
-07 -03 12 -10 00 04 10 02 06 11 00 06
11 00 08 -25 -02 -03 01 05 05 00 04 05
12 15 -51 -23 -39 -25 -02 05 -17 01 05
-07 -04 -01 -119 05 18 15 15 13 15 14 12
00 -07 08 03 01 03 06 06 01 08 05
02 -14 28 -27 06 01 -03 02 04 -04 01 04
-34 -27 -05 -03 -08 13 02 04 07 06 06 07
07 07 05 10 21 07 09 09 10 08 09 10
13 09 03 02 05 12 10 13 10 07 09 10
06 06 -08 02 -03 -04 05 07 -04 03 07
16 08 01 -06 06 18 10 15 16 11 13 15
-03 -04 -01 -04 -02 00 04 05 03 04 05 03
EU
averages
Cyprus
forecast
Romania
Spain
Croatia
Germany
Bulgaria
17022014
Lithuania
Estonia
Czech Republic
Austria
Total employment (percentage change on preceding year 1995-2015)
Luxembourg
France
Autumn 2013
Ireland
Denmark
Finland
Belgium
forecast
Portugal
Italy
Slovakia
Netherlands
Winter 2014
USA
Latvia
Japan
Sweden
Hungary
United Kingdom
Poland
Greece
Euro area
Slovenia
Malta
Table 24
5-year
1995-99 2000-04 2005-09 2010 2011 2012 2013 2014 2015 2013 2014 2015
92 75 78 83 72 76 84 85 82 86 87 84
90 90 91 71 59 55 53 52 51 54 53 51
100 113 75 169 125 102 88 83 77 93 90 82
94 43 64 139 147 147 131 119 112 133 123 117
103 105 89 126 177 243 273 260 240 270 260 240
172 112 111 201 217 250 264 257 246 266 264 253
107 87 88 97 96 102 108 110 110 110 112 113
112 88 70 84 84 107 122 126 124 122 124 121
32 42 46 63 79 119 160 192 184 167 192 184
165 127 97 195 162 150 119 105 92 117 103 90
27 31 47 46 48 51 59 60 59 57 64 65
59 73 66 69 65 64 65 64 64 64 63 63
54 36 40 45 44 53 67 74 72 70 80 77
42 41 46 44 42 43 49 48 47 51 50 47
63 59 90 120 129 159 165 168 165 174 177 173
71 64 55 73 82 89 102 108 107 111 116 116
132 187 126 145 137 140 142 139 134 139 137 133
129 92 75 84 78 77 82 83 81 82 83 81
88 85 102 102 114 121 120 117 122 122 118
133 160 77 103 113 123 129 127 121 129 124 117
56 81 63 73 67 70 70 68 66 71 70 67
57 49 44 75 76 75 70 69 67 73 72 70
149 103 118 135 159 176 176 172 169 167 161
98 144 76 178 154 134 118 104 96 117 104 95
89 59 80 112 109 109 102 96 93 110 104 101
120 187 113 97 97 101 104 103 101 107 108 105
53 71 67 73 74 70 72 72 71 73 71 70
86 63 71 86 78 80 80 77 73 81 79 74
70 50 57 78 80 79 76 68 65 77 75 73
90 81 97 97 105 109 107 104 111 110 107
49 52 59 96 89 81 74 65 58 75 69 65
37 50 43 51 46 43 40 38 38 40 39 38
EU
averages
Cyprus
forecast
Romania
Spain
Croatia
Germany
Bulgaria
17022014
Lithuania
Estonia
Czech Republic
Austria
Unemployment rate sup1 (number of unemployed as a percentage of total labour force 1995-2015)
Luxembourg
France
Autumn 2013
Ireland
Denmark
Finland
Belgium
forecast
Portugal
Italy
Slovakia
Netherlands
Winter 2014
USA
Latvia
Japan
Sweden
Hungary
sup1 Series following Eurostat definition based on the labour force survey
United Kingdom
Poland
Greece
Euro area
Slovenia
Malta
European Economic Forecast Winter 2014
146
Table 25
5-year
1995-99 2000-04 2005-09 2010 2011 2012 2013 2014 2015 2013 2014 2015
21 26 27 14 31 34 23 06 19 22 11 15
14 13 08 24 30 26 20 28 31 19 27 31
221 114 109 23 05 60 67 60 68 67 69 70
42 65 39 -38 -01 08 -03 -06 06 00 -06 -03
94 63 34 -26 -34 -42 -78 -15 00 -70 -15 00
28 32 46 04 13 02 05 06 06 10 01 01
21 28 27 25 25 22 16 13 16 14 13 15
31 30 27 28 13 10 13 11 15 13 12 16
49 28 26 25 -09 -50 -30 09 -95 -46 -14
123 79 180 -49 50 73 43 50 46 43 50 46
21 33 32 26 24 20 15 31 25 08 29 23
46 48 34 16 09 21 14 15 17 21 17 20
27 47 27 15 16 19 02 19 13 -01 17 14
23 19 30 12 24 26 23 20 20 23 19 19
65 40 32 20 -06 -20 27 -08 10 25 -08 -02
91 53 39 16 -10 10 -03 09 -02 00 11
87 70 51 20 28 09 29 30 20 30 30
30 33 34 18 32 35 24 16 16 24 16 16
26 25 20 22 20 15 16 19 15 16 18
79 106 99 68 29 44 35 36 35 36 35
112 80 39 31 23 23 -10 20 22 -09 17 19
38 37 35 35 13 14 12 18 20 14 18 21
57 45 19 30 32 22 10 18 10 15 20
266 61 88 72 63 38 44 38 46 43 38 45
128 47 -05 36 08 24 35 32 -05 41 39
216 53 41 82 51 34 28 33 39 25 31 34
679 349 180 -33 -41 83 58 56 45 58 44 46
37 43 27 31 09 31 24 28 31 26 30 34
45 45 35 31 20 19 19 21 28 13 17 28
34 27 26 21 20 16 19 22 15 17 22
43 36 27 28 31 21 17 24 32 15 25 31
03 -12 -13 04 06 -01 00 15 09 -07 25 13
EU
averages
Cyprus
forecast
Romania
Spain
Croatia
Germany
Bulgaria
17022014
Lithuania
Estonia
Czech Republic
Austria
Compensation of employees per head (percentage change on preceding year 1995-2015)
Luxembourg
France
Autumn 2013
Ireland
Denmark
Finland
Belgium
forecast
Portugal
Italy
Slovakia
Netherlands
Winter 2014
USA
Latvia
Japan
Sweden
Hungary
United Kingdom
Poland
Greece
Euro area
Slovenia
Malta
Table 26
5-year
1995-99 2000-04 2005-09 2010 2011 2012 2013 2014 2015 2013 2014 2015
11 05 05 -06 00 09 11 -01 04 11 -01 02
05 00 -04 04 09 10 04 13 14 02 10 13
74 75 58 -01 -42 22 30 42 39 34 42 40
11 24 37 -17 -18 03 -07 -13 -04 -08 -14 -14
33 24 04 -63 -65 -51 -66 -11 -03 -61 -11 -03
-02 -01 20 -15 -11 -22 -10 02 -03 -07 -07 -07
14 08 11 13 04 04 09 00 03 04 -03 02
-01 02 07 13 -15 -17 00 02 02 -02 -04 01
22 -01 04 -08 -33 -51 -36 -06 -103 -59 -29
42 84 -33 01 41 43 32 26 38 30 26
04 10 08 13 -02 04 -02 14 07 -09 10 04
32 08 -14 00 00 04 03 -02 10 -01 -01
07 17 13 00 -08 -04 -20 06 -02 -29 -03 -08
09 02 10 -06 -12 00 02 03 02 01 01 01
33 09 14 07 -30 -34 23 -17 -03 19 -17 -14
29 23 24 00 -25 -01 -08 -04 -23 -18 -05
24 40 41 -18 -06 -06 21 15 05 12 10
16 15 15 -01 -03 05 05 -02 -02 05 -02 -02
04 07 03 -03 00 03 05 05 00 01 04
41 50 73 21 -06 35 24 14 25 18 11
35 55 17 33 19 -03 -22 07 04 -19 10 03
21 18 17 08 -14 -13 04 01 01 05 03 06
23 07 03 05 -02 -04 -03 00 -15 -02 00
65 30 59 21 06 32 27 26 29 18 21
52 01 -42 -06 -49 07 23 04 -25 19 09
56 12 16 56 02 -03 19 19 19 15 10 12
63 89 113 -102 -82 37 20 28 12 15 14 15
22 29 09 16 -07 19 18 16 13 16 14 17
24 33 10 -08 -19 -06 -05 00 07 -11 -04 08
12 07 05 -06 -03 01 05 06 -01 01 05
27 15 05 11 07 03 05 09 12 04 12 13
03 -03 -05 21 14 07 02 -10 -06 -12 -03 -02
EU
averages
Cyprus
forecast
Romania
Spain
Croatia
Germany
Bulgaria
17022014
Lithuania
Estonia
Czech Republic
Austria
Real compensation of employees per head sup1 (percentage change on preceding year 1995-2015)
Luxembourg
France
Autumn 2013
Ireland
Denmark
Finland
Belgium
forecast
Portugal
Italy
Note See note 6 on concepts and sources where countries using full time equivalents are listed
Slovakia
Netherlands
Winter 2014
USA
Latvia
Japan
Sweden
Hungary
sup1 Deflated by the price deflator of private consumption
United Kingdom
Poland
Greece
Euro area
Slovenia
Malta
Statistical Annex
147
Table 27
5-year
1995-99 2000-04 2005-09 2010 2011 2012 2013 2014 2015 2013 2014 2015
14 11 -01 16 04 -03 05 11 09 06 07 06
10 09 00 35 19 -04 -01 12 14 -01 12 13
89 69 17 77 24 17 -07 21 33 -03 27 31
43 28 05 31 40 08 -19 02 14 -09 04 12
23 32 02 -24 -16 21 00 00 03 -05 00 03
05 03 10 22 23 33 21 10 06 24 12 08
15 08 03 18 13 01 06 06 12 04 06 13
13 03 -03 28 03 -15 00 04 07 -02 05 07
07 09 15 00 18 -03 -04 01 -10 -02 01
64 64 38 57 37 37 19 22 23 14 20 22
12 05 -13 13 -10 -26 04 05 06 02 03 -05
34 17 07 12 -08 -15 -04 -01 01 -05 01 03
14 15 06 21 04 -10 04 14 07 02 07 06
24 15 07 11 14 -04 -03 08 11 -01 09 10
23 07 07 35 03 10 17 11 11 22 13 10
29 13 35 24 -17 04 10 17 -02 03 12
39 37 60 12 17 16 18 25 12 18 24
23 21 -03 34 13 -11 -09 02 10 -01 06 13
09 02 26 14 02 05 09 10 04 08 10
48 19 44 41 34 08 16 16 15 12 14
30 39 23 35 19 -14 -21 15 16 -21 17 16
17 15 -07 39 13 00 02 11 13 02 13 13
31 03 30 24 20 18 07 06 11 04 07
53 74 24 153 55 19 17 21 26 19 21 27
43 10 02 13 -18 08 14 15 06 10 16
58 47 18 67 39 18 19 27 27 17 24 25
41 84 42 -09 30 -06 33 19 17 16 15 17
27 23 04 55 08 02 00 15 22 03 19 25
23 22 03 15 06 -09 08 12 14 06 13 14
17 03 28 14 -01 05 10 12 04 10 12
25 18 08 31 13 10 09 14 16 05 13 16
11 18 -02 51 -03 14 12 11 10 17 15 10
EU
averages
Cyprus
forecast
Romania
Spain
Croatia
Germany
Bulgaria
17022014
Lithuania
Estonia
Czech Republic
Austria
Labour productivity (real GDP per occupied person) (percentage change on preceding year 1995-2015)
Luxembourg
France
Autumn 2013
Ireland
Denmark
Finland
Belgium
forecast
Portugal
Italy
Slovakia
Netherlands
Winter 2014
USA
Latvia
Japan
Sweden
Hungary
United Kingdom
Poland
Greece
Euro area
Slovenia
Malta
Table 28
5-year
1995-99 2000-04 2005-09 2010 2011 2012 2013 2014 2015 2013 2014 2015
07 15 28 -03 27 37 18 -05 10 16 04 09
04 04 08 -11 10 31 22 16 17 20 15 18
121 42 91 -50 -18 42 75 39 34 70 41 39
-01 36 34 -67 -40 00 16 -08 -08 09 -10 -15
70 30 32 -01 -18 -62 -78 -15 -03 -65 -15 -03
23 29 36 -17 -10 -30 -16 -04 00 -13 -11 -06
06 19 24 07 12 21 10 07 04 10 07 03
17 27 30 00 10 25 13 07 08 16 07 09
41 19 11 25 -27 -47 -26 08 -85 -44 -15
55 14 136 -101 12 35 23 28 23 28 29 24
10 27 46 14 34 47 11 26 20 07 26 28
11 31 26 03 17 37 18 16 16 26 16 17
14 31 20 -06 12 29 -03 05 06 -04 09 08
-01 03 22 00 10 30 26 12 10 25 09 08
41 33 24 -14 -09 -30 10 -19 -01 03 -21 -12
60 40 04 -07 08 07 -13 -07 00 -03 -02
46 32 -09 08 10 -08 12 05 08 13 06
07 11 37 -16 19 46 33 13 07 25 10 04
18 23 -06 07 18 10 07 08 11 07 08
29 85 52 25 -05 36 19 19 20 23 21
80 39 16 -04 05 38 11 05 07 12 -01 02
21 22 42 -05 00 15 10 07 06 11 05 08
26 41 -11 07 12 04 03 11 00 11 13
202 -12 62 -70 07 19 26 17 19 24 16 18
82 36 -07 23 27 16 20 17 -11 31 23
149 06 22 14 11 15 09 06 12 08 06 09
613 244 133 -24 -68 90 24 36 27 41 29 29
09 20 23 -23 01 29 24 12 09 23 10 09
22 22 32 17 14 29 10 09 14 07 03 14
22 26 -03 07 20 10 08 09 10 07 09
18 18 19 -03 18 11 08 10 15 10 12 14
-08 -30 -10 -45 08 -16 -11 04 -02 -23 10 03
EU
averages
Cyprus
forecast
Romania
Spain
Croatia
Germany
Bulgaria
17022014
Lithuania
Estonia
Czech Republic
Austria
Unit labour costs whole economy sup1 (percentage change on preceding year 1995-2015)
Luxembourg
France
Autumn 2013
Ireland
Denmark
Finland
Belgium
forecast
Portugal
Italy
Note See note 6 on concepts and sources where countries using full time equivalents are listed
Slovakia
Netherlands
Winter 2014
USA
Latvia
Japan
Sweden
Hungary
sup1 Compensation of employees per head divided by labour productivity per head defined as GDP in volume divided by total employment
United Kingdom
Poland
Greece
Euro area
Slovenia
Malta
European Economic Forecast Winter 2014
148
Table 29
5-year
1995-99 2000-04 2005-09 2010 2011 2012 2013 2014 2015 2013 2014 2015
-03 -06 07 -23 07 18 05 -18 -06 -04 -09 -06
-04 -04 -01 -21 -02 16 -01 00 00 -02 -02 00
-26 -06 26 -53 -47 09 24 09 00 21 07 06
-32 -09 33 -53 -46 -06 10 -15 -19 01 -19 -25
05 -03 01 -13 -29 -55 -53 -10 -07 -49 -10 -07
-09 -11 08 -18 -10 -29 -19 -09 -07 -17 -17 -13
-03 00 05 -03 -01 06 -01 -06 -09 -05 -09 -12
-16 -01 09 -04 -04 08 00 -04 -06 02 -07 -05
09 -11 -09 -03 -46 -25 -32 -07 -90 -54 -30
-30 -25 30 -93 -46 01 07 05 00 12 07 02
-07 04 13 -54 -07 17 -26 -02 -07 -28 -01 02
-08 06 -01 -33 -06 14 -04 -01 -08 03 -07 -06
-06 00 04 -14 00 15 -20 -03 -16 -19 -05 -19
-07 -10 04 -14 -10 13 11 -07 -07 04 -08 -09
03 00 03 -21 -11 -27 -07 -28 -11 -16 -30 -22
00 09 15 -19 05 -09 -19 -20 -17 -14 -10
-12 16 -14 -08 -02 -14 05 -05 -06 -05 -12
-14 -02 19 -20 -08 16 04 -08 -13 02 -11 -16
-03 05 -14 -05 04 -03 -05 -06 -05 -07 -07
-18 12 24 -22 -26 14 10 00 -09 04 -01
02 12 00 12 14 21 -02 -09 -12 00 -09 -11
05 -02 17 -45 -07 -08 -14 -06 -09 -03 -10 -08
-14 01 -19 -13 -08 -14 -11 -06 -17 -07 -06
49 -17 07 -91 -44 -07 09 01 -06 05 -08 -10
02 -04 -30 -03 -05 -05 -01 -06 -38 04 01
-02 -28 -07 00 -20 -08 04 -08 -06 -02 -11 -10
14 -29 20 -77 -106 42 -12 07 -01 -01 -01 02
-06 05 01 -31 -12 19 17 01 -08 09 -01 -05
00 02 07 -14 -09 12 -06 -10 -07 -06 -11 -01
-03 05 -15 -07 05 -04 -05 -06 -05 -08 -06
02 -04 -04 -15 -02 -06 -07 -05 -03 -04 00 -04
-04 -16 00 -24 27 -06 -06 -13 -14 -21 -10 -09
EU
averages
Cyprus
forecast
Romania
Spain
Croatia
Germany
Bulgaria
17022014
Lithuania
Estonia
Czech Republic
Austria
Real unit labour costs sup1 (percentage change on preceding year 1995-2015)
Luxembourg
France
Autumn 2013
Ireland
Denmark
Finland
Belgium
forecast
Portugal
Italy
Note See note 6 on concepts and sources where countries using full time equivalents are listed
Slovakia
Netherlands
Winter 2014
USA
Latvia
Japan
Sweden
Hungary
sup1 Nominal unit labour costs divided by GDP price deflator
United Kingdom
Poland
Greece
Euro area
Slovenia
Malta
Table 30
5-year
1995-99 2000-04 2005-09 2010 2011 2012 2013 2014 2015 2013 2014 2015
09883
09891
09889
09981
09241 09976
09895
09998
10224
09992 09879 09930
09489 08555 09963 10084 10049 09921 09981 09965
09883
10330 09644 10003
09868
09892
09902
07412 09377 09999
13249 13949 11352
09871
12279 19504 19558 19558 19558 19558 19558 19558 19558 19558 19558 19558
356033 328417 274541 252840 245898 251491 259798 275227 275261 257140 256034 256034
74212 74414 74528 74473 74506 74437 74579 74610 74610 74579 74592 74592
70843 75206 73254 72891 74390 75217 75786 76274 76274 75760 76170 76170
47191 35285 34528 34528 34528 34528 34528 34528 34528 34528 34528 34528
2126594 2529736 2591018 2754805 2793726 2892494 2968700 3092900 3099400 2963621 2953624 2953624
36904 40928 39085 39947 41206 41847 41975 41679 41678 41984 41873 41873
08205 31051 36809 42122 42391 44593 44190 45154 45155 44190 44502 44502
88443 90220 96042 95373 90298 87041 86515 88591 88590 86286 87695 87695
07340 06462 07474 08578 08679 08109 08493 08299 08299 08505 08463 08463
11797 10280 13471 13257 13920 12848 13281 13620 13619 13274 13572 13572
1331808 1183271 1453816 1162386 1109586 1024919 1296627 1422212 1422150 1287548 1327554 1327554Japan
Nominal bilateral exchange rates against Ecueuro (1995-2015)
Luxembourg
Sweden
France
Hungary
Ireland
Denmark
Finland
Belgium
forecast
Portugal
United Kingdom
Italy
Poland
Greece
17022014
Lithuania
Estonia
Czech Republic
Austria
Autumn 2013
Euro area
Slovenia
Malta
averages
Cyprus
forecast
Spain
Croatia
Germany
Bulgaria
Slovakia
Netherlands
Winter 2014
USA
Latvia
EU
Romania
Statistical Annex
149
Table 31
5-year
1995-99 2000-04 2005-09 2010 2011 2012 2013 2014 2015 2013 2014 2015
00 09 09 -24 03 -20 23 12 00 22 06 00
08 12 09 -36 01 -23 31 17 00 30 08 00
09 06 10 -30 -04 -15 14 14 00 13 06 00
-02 13 15 -35 08 -36 31 12 00 31 08 00
14 13 09 -24 10 -14 21 18 00 21 08 00
-02 11 09 -24 04 -18 21 12 00 20 06 00
07 11 10 -31 02 -24 30 15 00 29 08 00
11 14 09 -32 04 -21 28 17 00 28 08 00
75 14 11 -25 02 -20 25 11 00 24 05 00
27 -08 -05 -29 04 01 10 10 00 09 04 00
01 05 07 -20 00 -15 16 07 00 15 03 00
08 11 10 -36 03 -21 26 10 00 26 05 00
01 08 09 -24 02 -17 20 10 00 20 05 00
11 08 05 -25 -01 -13 20 12 00 19 05 00
-02 06 07 -18 03 -15 15 08 00 15 04 00
-34 -34 03 -17 04 -06 13 11 00 13 04 00
-08 24 63 -22 02 -04 13 11 00 12 03 00
14 12 10 -39 -01 -27 31 20 00 30 10 00
16 24 21 -67 05 -44 61 33 00 59 16 00
-468 33 09 -22 13 -07 21 22 00 20 10 00
03 36 43 26 31 -32 -19 -49 00 -10 04 00
07 09 11 -40 -04 -25 25 16 00 24 08 00
04 12 09 -12 -16 -22 09 03 00 09 00 00
50 56 07 -26 04 -14 17 12 00 16 06 00
-115 09 -16 -02 -10 -45 -09 -29 -02 -10 01 00
-76 -08 15 62 -28 -27 13 12 00 09 00 00
-323 -152 -02 -13 04 -59 28 05 01 27 -01 00
13 05 -21 74 59 11 36 -01 00 41 04 00
41 07 -48 03 -09 44 -18 46 00 -19 21 00
26 35 07 -73 10 -52 82 60 -01 80 30 00
45 -14 -12 -31 -53 40 32 25 00 31 00 00
-04 -04 22 61 59 32 -185 -41 02 -180 -15 00
EU
averages
Cyprus
forecast
Romania
Spain
Croatia
Germany
Bulgaria
17022014
Lithuania
Estonia
Czech Republic
Austria
Nominal effective exchange rates to rest of a group sup1 of industrialised countries (percentage change on preceding year 1995-2015)
Luxembourg
France
Autumn 2013
Ireland
Denmark
Finland
Belgium
forecast
Portugal
Italy
Slovakia
Netherlands
Winter 2014
USA
Latvia
Japan
Sweden
Hungary
sup1 37 countries EU TR CH NO US CA JP AU MX and NZ
United Kingdom
Poland
Greece
Euro area
Slovenia
Malta
Table 32
5-year
1995-99 2000-04 2005-09 2010 2011 2012 2013 2014 2015 2013 2014 2015
-04 05 00 17 16 06 -15 -01 05 -07
-18 -18 -08 00 11 11 07 06 10 05
24 56 -35 -29 13 53 25 21 52 28
18 11 -65 -52 -18 06 -17 -20 -01 -20
-02 01 -02 -25 -85 -91 -27 -18 -77 -26
06 11 -16 -19 -49 -29 -12 -11 -25 -20
-01 00 12 03 02 -01 -03 -08 -01 -03
05 05 03 01 05 01 -03 -04 05 -03
15 -09 12 22 -32 -41 -32 -01 -81 -49
-03 103 -87 04 09 04 15 08 11 16
09 21 17 24 23 -02 17 08 -05 17
16 06 07 08 18 10 08 05 19 08
14 -03 -02 02 06 -17 -05 -07 -17 00
-16 -01 06 01 06 12 01 -03 12 -02
12 -02 -09 -15 -42 04 -26 -10 -04 -26
40 14 08 -15 -17 -08 -24 -20 -14 -14
25 09 -06 00 -16 -22 01 -07 -05 02
-08 12 -11 09 24 19 02 -06 11 -02
-07 -06 -07 -01 01 -01 -06 -06 -01 -06
-11 52 55 27 -31 23 05 03 06 09
22 -07 01 -05 13 -03 -06 -06 -01 -12
05 17 00 -12 -08 -05 -04 -06 -02 -06
02 15 -08 -02 -12 -10 -07 -01 -14 00
-32 28 -58 -02 -07 09 04 04 08 03
61 11 -02 18 00 02 09 04 -26 19
-13 -02 20 03 -10 -06 -06 -01 -06 -05
208 103 -24 -75 62 07 23 12 24 15
01 -05 -21 -12 06 09 01 -05 09 -02
03 09 23 04 11 -01 00 03 -04 -07
-04 02 -03 -03 04 -03 -08 -09 -04 -12
-02 -05 01 02 -07 -06 -04 00 -02 -03
-49 -34 -48 -07 -34 -24 -07 -16 -38 -04
EU
averages
Cyprus
forecast
Romania
Spain
Croatia
Germany
Bulgaria
17022014
Lithuania
Estonia
Czech Republic
Austria
Relative unit labour costs to rest of a groupsup1 of industrialized countries (nat curr) (percentage change over preceding year 1995-2015)
Luxembourg
France
Autumn 2013
Ireland
Denmark
Finland
Belgium
forecast
Portugal
Italy
Note See note 6 on concepts and sources where countries using full time equivalents are listed
Slovakia
Netherlands
Winter 2014
USA
Latvia
Japan
Sweden
Hungary
sup1 37 countries EU TR CH NO US CA JP AU MX and NZ
United Kingdom
Poland
Greece
Euro area
Slovenia
Malta
European Economic Forecast Winter 2014
150
Table 33
5-year
1995-99 2000-04 2005-09 2010 2011 2012 2013 2014 2015 2013 2014 2015
05 13 -24 20 -04 29 -04 -01 28 -01
-06 -09 -44 01 -12 42 24 06 40 13
31 66 -64 -33 -02 68 39 21 65 34
32 26 -98 -45 -54 37 -05 -20 30 -12
11 10 -25 -14 -98 -72 -09 -18 -57 -18
17 21 -39 -15 -66 -09 00 -11 -05 -14
10 10 -19 05 -21 29 13 -08 28 05
19 14 -29 05 -16 30 14 -04 32 05
29 02 -13 24 -51 -17 -21 -01 -59 -44
-11 98 -114 08 10 13 25 08 20 20
14 29 -03 24 08 14 24 08 10 20
27 16 -29 11 -04 36 18 05 45 13
22 06 -26 04 -11 03 05 -07 03 04
-08 05 -20 00 -07 33 13 -03 31 03
19 06 -27 -12 -56 19 -17 -10 11 -22
04 17 -09 -12 -23 05 -13 -20 -01 -10
50 73 -28 02 -20 -10 12 -07 07 05
05 22 -50 08 -04 50 22 -07 42 07
17 15 -74 03 -43 59 27 -06 58 09
21 62 32 41 -38 44 28 03 26 19
59 36 27 26 -19 -22 -55 -06 -11 -08
14 29 -40 -16 -33 20 12 -07 22 02
14 25 -21 -17 -34 00 -04 -01 -05 00
22 35 -83 02 -21 26 17 04 24 08
71 -06 -04 08 -45 -07 -21 01 -36 20
-21 12 83 -25 -37 06 07 -01 03 -05
25 101 -37 -71 -01 35 28 13 52 14
06 -26 51 46 18 45 00 -05 51 02
10 -39 27 -05 55 -19 46 03 -23 13
31 09 -76 07 -48 79 52 -09 76 17
-16 -17 -30 -52 33 26 21 00 29 -04
-53 -12 10 52 -02 -204 -48 -14 -211 -19
EU
averages
Cyprus
forecast
Romania
Spain
Croatia
Germany
Bulgaria
17022014
Lithuania
Estonia
Czech Republic
Austria
Real effective exchange rate ulc relative to rest of a group sup1 of industrialised countries (USD) ( change on preceding year 1995-2015)
Luxembourg
France
Autumn 2013
Ireland
Denmark
Finland
Belgium
forecast
Portugal
Italy
Note See note 6 on concepts and sources where countries using full time equivalents are listed
Slovakia
Netherlands
Winter 2014
USA
Latvia
Japan
Sweden
Hungary
sup1 37 countries EU TR CH NO US CA JP AU MX and NZ
United Kingdom
Poland
Greece
Euro area
Slovenia
Malta
Table 34
5-year
1995-99 2000-04 2005-09 2010 2011 2012 2013 2014 2015 2013 2014 2015
512 496 503 524 533 549 544 539 539 540 540 539
497 472 456 479 452 447 447 446 445 447 445 442
395 351 371 405 376 395 387 383 377 386 376 367
372 330 392 655 472 427 425 403 391 423 401 376
447 455 482 513 519 536 588 480 455 582 471 451
421 388 407 463 457 478 449 438 433 446 438 432
537 526 538 565 559 566 572 571 570 570 568 566
502 472 489 505 499 507 511 505 500 512 505 501
357 404 431 462 460 453 461 473 463 481 480 460
385 359 386 434 384 364 362 357 351 362 357 352
403 403 401 435 426 443 434 433 435 440 440 447
409 423 428 416 416 433 442 444 442 445 443 445
482 458 466 514 499 505 499 504 493 502 510 495
544 516 498 528 508 517 516 518 515 521 517 513
418 435 461 515 493 474 491 468 453 491 468 453
465 464 449 494 499 481 599 493 480 501 520 484
490 439 370 400 384 378 369 377 373 360 370 362
566 491 503 555 548 563 576 578 579 575 580 579
498 472 476 510 495 499 499 494 490 498 493 488
414 398 381 374 356 359 380 386 387 376 381 384
445 449 424 438 432 445 432 430 428 434 432 431
573 543 529 575 576 592 569 563 554 580 570 562
469 479 455 462 473 472 459 475 482
406 361 373 422 387 360 356 348 338 355 345 334
517 492 508 499 500 486 501 513 500 502 508 496
464 433 435 454 434 422 418 413 410 415 407 403
354 354 376 401 394 367 362 361 360 363 362 363
611 549 527 520 513 518 528 524 513 525 517 507
404 403 456 499 480 479 471 460 447 472 461 449
506 490 493 492 485 480 491 485 479
355 355 383 426 415 400 388 384 384 375 371 367
374 378 374 407 419 419 424 423 419 443 435 430
EU
averages
Cyprus
forecast
Romania
Spain
Croatia
Germany
Bulgaria
17022014
Lithuania
Estonia
Czech Republic
Austria
Total expenditure general government (as a percentage of GDP 1995-2015)
Luxembourg
France
Autumn 2013
Ireland
Denmark
Finland
Belgium
forecast
Portugal
Italy
Slovakia
Netherlands
Winter 2014
USA
Latvia
Japan
Sweden
Hungary
United Kingdom
Poland
Greece
Euro area
Slovenia
Malta
Statistical Annex
151
Table 35
5-year
1995-99 2000-04 2005-09 2010 2011 2012 2013 2014 2015 2013 2014 2015
487 496 486 487 496 510 517 513 512 512 514 514
458 445 440 437 443 448 446 446 445 446 445 444
392 358 374 406 387 392 383 379 373 382 375 367
378 344 359 349 340 345 353 354 348 349 351 347
390 403 396 406 424 446 457 458 444 446 451 440
379 384 387 367 362 371 377 380 368 378 378 366
502 497 500 495 506 518 531 531 531 529 530 529
458 444 454 461 461 477 482 480 477 481 478 476
322 365 420 409 397 390 406 415 402 398 396 397
376 339 355 353 349 351 349 347 341 348 347 342
432 430 417 427 427 438 432 428 411 432 430 420
337 361 396 381 388 400 412 416 415 410 410 410
467 447 457 463 456 464 469 472 464 469 476 466
512 500 480 483 483 492 498 497 496 496 497 498
376 397 405 416 450 409 432 428 427 432 428 427
431 434 427 436 436 442 450 453 447 443 450 446
426 375 335 323 333 332 344 345 340 330 337 323
551 534 532 530 541 545 552 553 556 552 557 558
461 451 450 448 453 462 468 468 465 467 467 464
380 400 384 343 336 352 361 367 370 355 361 366
389 398 395 391 400 401 405 402 395 405 403 396
565 555 560 550 557 555 566 551 527 563 554 534
405 401 406 402 418 424 404 410 420
361 338 343 350 332 327 329 325 320 325 320 316
452 432 446 456 543 466 477 482 471 472 478 469
423 383 393 375 384 383 374 462 380 367 453 369
319 328 334 333 339 337 336 339 342 339 342 345
590 556 546 523 515 516 518 509 505 516 505 503
381 393 406 398 403 418 409 407 405 408 408 406
441 446 454 457 459 453 456 458 452
336 322 322 306 309 308 325 330 335 311 314 318
310 307 336 324 331 332 334 348 357 348 362 372
EU
averages
Cyprus
forecast
Romania
Spain
Croatia
Germany
Bulgaria
17022014
Lithuania
Estonia
Czech Republic
Austria
Total revenue general government (as a percentage of GDP 1995-2015)
Luxembourg
France
Autumn 2013
Ireland
Denmark
Finland
Belgium
forecast
Portugal
Italy
Slovakia
Netherlands
Winter 2014
USA
Latvia
Japan
Sweden
Hungary
United Kingdom
Poland
Greece
Euro area
Slovenia
Malta
Table 36
5-year
1995-99 2000-04 2005-09 2010 2011 2012 2013 2014 2015 2013 2014 2015
-25 00 -17 -37 -37 -40 -27 -26 -27 -28 -26 -25
-39 -27 -16 -42 -08 01 -01 00 00 00 01 02
-02 07 03 02 11 -02 -04 -04 -04 -04 -01 -01
06 14 -33 -306 -131 -82 -72 -48 -43 -74 -50 -30
-57 -52 -87 -107 -95 -90 -131 -22 -10 -135 -20 -11
-42 -04 -20 -96 -96 -106 -72 -58 -65 -68 -59 -66
-34 -28 -38 -71 -53 -48 -42 -40 -39 -41 -38 -37
-44 -28 -35 -45 -38 -30 -30 -26 -22 -30 -27 -25
-35 -39 -11 -53 -63 -63 -55 -58 -61 -83 -84 -63
-09 -19 -31 -81 -36 -13 -13 -10 -10 -14 -10 -10
28 27 15 -08 01 -06 -02 -05 -24 -09 -10 -27
-71 -63 -32 -35 -28 -33 -30 -27 -27 -34 -34 -35
-16 -10 -09 -51 -43 -41 -31 -32 -29 -33 -33 -30
-32 -17 -18 -45 -25 -25 -17 -21 -18 -25 -19 -15
-42 -38 -56 -98 -43 -64 -59 -40 -25 -59 -40 -25
-34 -30 -22 -59 -63 -38 -149 -39 -33 -58 -71 -38
-65 -64 -36 -77 -51 -45 -25 -33 -34 -30 -32 -38
-15 43 29 -25 -07 -18 -24 -25 -23 -22 -23 -20
-36 -22 -26 -62 -42 -37 -31 -26 -25 -31 -25 -24
-34 02 03 -31 -20 -08 -19 -19 -17 -20 -20 -18
-56 -51 -29 -47 -32 -44 -27 -28 -33 -29 -30 -35
-09 13 32 -25 -19 -38 -03 -13 -27 -17 -17 -27
-64 -78 -50 -60 -54 -48 -54 -65 -62
-45 -23 -29 -72 -55 -32 -27 -23 -17 -30 -25 -19
-65 -60 -62 -43 43 -20 -24 -30 -29 -29 -30 -27
-41 -50 -41 -79 -50 -39 -44 50 -29 -48 46 -33
-35 -26 -42 -68 -55 -30 -26 -22 -18 -25 -20 -18
-21 07 19 03 02 -02 -11 -15 -08 -09 -12 -05
-23 -10 -51 -101 -77 -61 -63 -52 -42 -64 -53 -43
-65 -44 -39 -35 -27 -27 -35 -27 -26
-18 -33 -61 -120 -106 -92 -62 -54 -48 -64 -57 -49
-64 -71 -38 -83 -88 -87 -90 -75 -62 -96 -72 -58
EU
averages
Cyprus
forecast
Romania
Spain
Croatia
Germany
Bulgaria
17022014
Lithuania
Estonia
Czech Republic
Austria
Net lending (+) or net borrowing (-) general government (as a percentage of GDP 1995-2015)
Luxembourg
France
Autumn 2013
Ireland
Denmark (a)
Finland
Belgium
forecast
Portugal
Italy
Slovakia
Netherlands
Winter 2014
USA
Latvia
Japan
Sweden
Hungary
(a) EDP net lendingborrowing and EDP interest for Denmark for the years 2010-2012 are ECFIN estimates based on the October 2013 EDP notification and on revised general government accounts published by Danmarks Statistik in November 2013
United Kingdom
Poland
Greece
Euro area
Slovenia
Malta
European Economic Forecast Winter 2014
152
Table 37
5-year
1995-99 2000-04 2005-09 2010 2011 2012 2013 2014 2015 2013 2014 2015
78 57 39 34 33 34 32 31 31 32 31 31
34 30 28 25 25 24 23 22 21 23 22 21
04 02 02 01 01 02 02 01 01 02 01 01
39 15 13 31 33 37 48 48 50 46 48 50
93 58 47 58 71 50 42 49 51 41 48 52
45 27 17 19 25 30 35 36 36 34 36 36
33 29 26 24 26 25 24 24 25 24 24 25
93 56 48 46 50 55 53 53 53 54 55 56
26 34 30 22 24 31 37 41 40 41 41 42
09 08 07 14 15 13 14 14 13 15 15 14
04 03 03 04 05 05 06 05 06 06 05 06
27 34 33 29 30 31 31 30 30 31 31 32
50 29 22 21 21 19 19 21 27 19 19 18
37 31 27 27 26 26 26 26 27 26 26 26
40 28 28 28 40 43 43 44 44 43 44 44
22 21 13 16 19 22 27 30 32 27 31 32
26 33 15 13 16 19 16 15 15 19 18 18
38 22 14 11 11 10 11 11 11 10 10 10
49 35 29 28 30 31 30 30 31 30 30 31
102 30 12 07 07 09 10 11 11 08 09 09
11 10 11 14 14 15 15 15 15 16 16 16
50 30 17 17 18 16 14 13 13 16 14 14
22 26 30 34 37 39 35 41 47
09 13 08 18 18 18 17 16 16 18 17 16
83 45 42 41 41 43 42 39 39 42 40 39
44 30 25 27 27 28 27 22 22 27 22 22
34 26 10 15 16 18 18 17 17 18 18 18
49 25 15 08 10 07 09 09 08 09 09 08
33 22 21 30 33 30 30 29 28 30 30 29
27 29 29 29 28 29 29 29 29
49 35 35 37 39 38 37 38 40 39 41 41
34 29 19 20 21 21 21 21 20 20 19 18
EU
averages
Cyprus
forecast
Romania
Spain
Croatia
Germany
Bulgaria
17022014
Lithuania
Estonia
Czech Republic
Austria
Interest expenditure general government (as a percentage of GDP 1995-2015)
Luxembourg
France
Autumn 2013
Ireland
Denmark
Finland
Belgium
forecast
Portugal
Italy
Slovakia
Netherlands
Winter 2014
USA
Latvia
Japan
Sweden
Hungary
United Kingdom
Poland
Greece
Euro area
Slovenia
Malta
Table 38
5-year
1995-99 2000-04 2005-09 2010 2011 2012 2013 2014 2015 2013 2014 2015
54 57 21 -04 -04 -06 05 05 04 03 05 05
-05 03 12 -16 17 25 22 21 21 23 22 23
02 09 05 03 13 -01 -02 -02 -03 -02 01 01
45 29 -20 -275 -99 -45 -24 00 07 -28 -02 20
36 06 -39 -49 -24 -40 -88 27 41 -94 28 41
03 22 -03 -77 -70 -76 -37 -22 -28 -33 -24 -30
-01 01 -11 -47 -27 -23 -18 -16 -14 -18 -14 -11
50 27 13 01 11 25 23 27 31 23 28 31
-09 -06 20 -30 -39 -32 -18 -18 -21 -42 -43 -21
00 -11 -24 -67 -21 00 01 04 03 01 05 04
32 30 18 -04 05 -01 04 00 -17 -03 -05 -20
-44 -29 01 -06 03 -02 01 03 02 -03 -03 -04
34 19 13 -31 -23 -22 -12 -11 -02 -14 -15 -11
04 15 09 -18 02 01 09 06 08 02 07 11
-01 -10 -28 -70 -03 -21 -15 03 19 -16 03 18
-12 -09 -09 -42 -44 -17 -122 -09 -01 -30 -40 -06
-38 -32 -21 -63 -35 -27 -09 -17 -18 -11 -14 -20
23 65 43 -14 04 -08 -13 -14 -12 -12 -13 -11
12 13 03 -34 -11 -06 -01 05 06 -01 05 07
68 31 14 -24 -12 01 -09 -09 -07 -12 -11 -09
-45 -40 -18 -33 -18 -29 -12 -13 -18 -13 -14 -19
42 43 48 -09 -01 -22 11 01 -14 -01 -02 -13
-42 -52 -19 -26 -17 -09 -19 -24 -15
-36 -09 -21 -54 -37 -14 -10 -07 -02 -12 -08 -02
18 -14 -19 -02 85 22 18 09 10 13 09 12
03 -20 -16 -52 -23 -11 -18 72 -07 -22 67 -11
-02 00 -32 -53 -39 -12 -08 -04 -01 -07 -03 00
28 32 34 11 12 05 -02 -06 01 00 -03 04
11 11 -30 -71 -44 -31 -33 -23 -14 -34 -24 -14
13 13 -01 -38 -15 -10 -06 02 02 -07 02 02
30 02 -26 -83 -67 -53 -25 -15 -09 -25 -16 -08
-30 -42 -19 -63 -67 -66 -69 -54 -42 -76 -54 -40
EU
averages
Cyprus
forecast
Romania
Spain
Croatia
Germany
Bulgaria
17022014
Lithuania
Estonia
Czech Republic
Austria
Primary balance general government sup1 (as a percentage of GDP 1995-2015)
Luxembourg
France
Autumn 2013
Ireland
Denmark
Finland
Belgium
forecast
Portugal
Italy
Slovakia
Netherlands
Winter 2014
USA
Latvia
Japan
Sweden
Hungary
sup1 Net lendingborrowing excluding interest expenditure
United Kingdom
Poland
Greece
Euro area
Slovenia
Malta
Statistical Annex
153
Table 39
5-year
1995-99 2000-04 2005-09 2010 2011 2012 2013 2014 2015 2013 2014 2015
-24 -04 -23 -33 -35 -32 -17 -20 -25 -19 -18 -20
-37 -27 -13 -34 -12 01 05 04 02 05 05 04
00 -09 21 08 -12 -08 -04 -05 -07 -03 -03
-01 06 -35 -282 -122 -77 -66 -47 -47 -69 -50 -34
-63 -54 -92 -85 -53 -33 -72 22 10 -75 26 09
-38 -13 -21 -74 -75 -82 -47 -43 -63 -43 -43 -62
-31 -39 -44 -59 -46 -36 -26 -25 -27 -25 -22 -24
-47 -37 -41 -35 -31 -13 -06 -06 -09 -06 -07 -11
-42 -17 -53 -64 -60 -40 -35 -52 -57 -55 -52
-20 -42 -47 -17 -07 -13 -15 -18 -15 -15 -17
33 17 13 03 08 10 10 03 -21 02 -04 -21
-70 -62 -35 -34 -27 -29 -28 -28 -31 -32 -35 -40
-17 -08 -09 -43 -37 -27 -12 -17 -18 -15 -15 -16
-31 -17 -19 -36 -24 -24 -13 -17 -17 -20 -16 -14
-45 -43 -54 -94 -34 -47 -37 -25 -18 -38 -25 -17
-34 -34 -47 -58 -26 -135 -27 -25 -43 -56 -28
-58 -47 -74 -45 -38 -13 -21 -25 -19 -21 -29
-14 41 24 -11 -06 -10 -09 -12 -14 -08 -10 -12
-35 -27 -28 -51 -36 -26 -16 -13 -18 -16 -13 -16
-20 -01 -09 -23 -15 -03 -13 -14 -12 -15 -15 -13
-51 -42 -43 -31 -37 -14 -19 -29 -16 -20 -30
-14 06 23 -01 02 -10 26 13 -05 11 09 -03
-51 -71 -40 -52 -49 -44 -46 -60 -59
-18 -42 -48 -45 -29 -26 -23 -19 -30 -27 -22
-65 -71 -26 54 -02 -09 -20 -24 -13 -19 -21
-45 -47 -82 -53 -36 -36 57 -24 -40 54 -27
-22 -57 -60 -50 -20 -21 -18 -16 -19 -15 -14
-15 07 18 11 04 05 01 -06 -04 05 -02 -01
-26 -11 -51 -81 -61 -44 -51 -48 -43 -53 -48 -43
-53 -37 -27 -20 -16 -21 -21 -15 -20
Luxembourg
Sweden
France
Hungary
Denmark
Finland
Portugal
United Kingdom
Italy
Poland
Euro area
Slovenia
Malta
EU
Cyprus
sup1 Cyclically-adjusted variables for Croatia are based on provisional values for fiscal semi-elasticities and subject to further revisions
17022014
Latvia
Lithuania
Estonia
Czech Republic
Austria
Autumn 2013
Ireland
Belgium
forecast
Greece
averages forecast
Romania
Spain
Croatia
Germany
Bulgaria
Slovakia
Cyclically-adjusted net lending (+) or net borrowing (-) general governmentsup1 (as a percentage of GDP 1995-2015)
Netherlands
Winter 2014
Table 40
5-year
1995-99 2000-04 2005-09 2010 2011 2012 2013 2014 2015 2013 2014 2015
54 54 16 01 -02 02 14 11 06 13 13 11
-04 03 15 -09 13 25 28 26 23 28 26 25
02 -07 23 09 -10 -06 -03 -04 -06 -01 -02
38 20 -22 -250 -90 -40 -19 02 03 -23 -02 16
30 04 -45 -27 18 16 -29 71 61 -34 73 61
08 14 -04 -54 -49 -51 -13 -07 -26 -09 -07 -26
03 -10 -17 -35 -20 -11 -02 00 -01 -02 02 01
46 19 07 11 19 42 47 47 44 48 48 46
-08 13 -31 -40 -29 -03 06 -13 -16 -15 -10
-12 -36 -33 -02 06 01 -01 -05 00 -01 -03
37 20 15 07 13 15 16 08 -14 07 01 -15
-43 -28 -02 -05 03 02 02 02 -01 -01 -04 -08
33 21 13 -22 -17 -08 07 04 09 05 03 02
05 14 08 -09 02 02 14 09 10 07 10 13
-05 -16 -25 -66 07 -04 06 18 26 06 19 27
-13 -20 -31 -39 -04 -108 03 07 -16 -25 03
-26 -32 -61 -30 -19 03 -05 -09 00 -03 -11
24 63 38 00 05 00 02 00 -03 02 01 -02
13 08 01 -23 -05 05 14 17 13 14 18 15
82 28 03 -16 -08 06 -02 -03 -02 -06 -06 -04
-41 -31 -29 -17 -22 01 -04 -14 00 -04 -14
36 36 40 15 21 06 41 26 07 28 24 11
-29 -45 -10 -18 -12 -05 -11 -19 -12
-05 -34 -30 -27 -11 -09 -07 -03 -12 -10 -06
-20 -29 16 95 41 33 19 15 29 20 18
-15 -22 -55 -26 -08 -09 79 -02 -13 76 -05
04 -47 -45 -34 -02 -04 00 02 -01 02 03
34 32 33 19 14 12 10 03 04 14 07 07
07 11 -30 -52 -28 -14 -21 -19 -15 -23 -19 -14
13 09 -04 -26 -08 02 08 12 07 08 13 09
Luxembourg
Sweden
France
Hungary
Denmark
Finland
Portugal
United Kingdom
Italy
Poland
Euro area
Slovenia
Malta
EU
Cyprus
sup1 Cyclically-adjusted variables for Croatia are based on provisional values for fiscal semi-elasticities and subject to further revisions
17022014
Latvia
Lithuania
Estonia
Czech Republic
Austria
Autumn 2013
Ireland
Belgium
forecast
Greece
averages forecast
Romania
Spain
Croatia
Germany
Bulgaria
Slovakia
Cyclically-adjusted primary balance general governmentsup1 (as a percentage of GDP 1995-2015)
Netherlands
Winter 2014
European Economic Forecast Winter 2014
154
Table 41
5-year
1995-99 2000-04 2005-09 2010 2011 2012 2013 2014 2015 2013 2014 2015
-19 -33 -33 -29 -22 -20 -25 -22 -18 -20
-12 -22 -10 03 06 05 02 05 05 04
-16 -09 -08 -02 -05 -01 -04 -05 00 -02
-31 -89 -81 -77 -64 -49 -46 -67 -52 -33
-91 -89 -59 -01 17 07 -01 12 10 -01
-21 -74 -72 -51 -43 -42 -58 -41 -42 -58
-46 -57 -47 -36 -28 -23 -27 -27 -20 -24
-43 -37 -38 -14 -08 -06 -08 -08 -07 -09
-17 -53 -62 -64 -38 -45 -52 -55 -55 -52
-41 -30 -15 -02 -13 -15 -18 -15 -15 -17
13 03 08 10 10 03 -21 02 -04 -21
-41 -45 -34 -38 -31 -29 -32 -35 -36 -41
-09 -41 -37 -27 -18 -18 -18 -21 -17 -16
-19 -32 -22 -16 -15 -14 -15 -16 -15 -12
-53 -87 -64 -40 -36 -26 -18 -37 -26 -17
-33 -47 -48 -26 -22 -20 -25 -29 -21 -28
-45 -73 -49 -39 -23 -25 -25 -23 -31 -29
24 -10 -05 -10 -09 -12 -14 -08 -10 -12
-29 -44 -36 -21 -15 -13 -17 -15 -13 -15
-08 -22 -15 -03 -13 -14 -12 -15 -15 -13
-40 -45 -31 -19 -13 -22 -29 -15 -22 -30
23 -01 02 06 11 -03 -05 01 -01 -03
-51 -71 -40 -47 -57 -50 -41 -60 -59
-42 -48 -45 -30 -25 -22 -18 -30 -26 -22
-68 -33 -41 -09 -11 -24 -23 -14 -23 -21
-48 -82 -53 -37 -36 -29 -24 -40 -32 -27
-56 -61 -38 -25 -21 -18 -16 -19 -15 -14
18 11 04 05 01 -06 -04 05 -02 -01
-50 -81 -61 -62 -53 -48 -43 -57 -48 -43
-31 -48 -38 -26 -20 -19 -21 -21 -18 -19
Luxembourg
Sweden
France
Hungary
Denmark
Finland
Portugal
United Kingdom
Italy
Poland
Euro area
Slovenia
Malta
EU
Cyprus
sup1 Cyclically-adjusted variables for Croatia are based on provisional values for fiscal semi-elasticities and subject to further revisions
17022014
Latvia
Lithuania
Estonia
Czech Republic
Austria
Autumn 2013
Ireland
Belgium
forecast
Greece
averages forecast
Romania
Spain
Croatia
Germany
Bulgaria
Slovakia
Structural budget balance general governmentsup1 (as a percentage of GDP 1995-2015)
Netherlands
Winter 2014
Table 42
5-year
1995-99 2000-04 2005-09 2010 2011 2012 2013 2014 2015 2013 2014 2015
1221 1020 898 957 980 998 998 1005 1000 1004 1013 1010
591 621 686 825 800 810 796 773 745 796 771 741
71 53 49 67 61 98 100 101 98 100 97 91
632 327 371 912 1041 1174 1223 1203 1197 1244 1208 1191
963 1010 1135 1483 1703 1569 1773 1770 1719 1762 1759 1709
647 525 427 617 705 860 943 989 1033 948 999 1043
583 604 685 824 858 902 939 961 973 935 953 960
1172 1060 1076 1193 1207 1270 1327 1337 1324 1330 1340 1331
562 653 601 613 711 858 1120 1215 1258 1160 1244 1274
124 139 178 444 419 406 384 387 327 425 393 334
72 63 99 195 187 217 243 255 281 245 257 287
453 613 637 667 693 711 720 724 715 726 733 741
690 519 527 634 657 713 743 753 756 748 764 769
663 658 639 723 728 740 746 743 737 748 745 735
552 565 722 940 1082 1241 1294 1266 1258 1278 1267 1257
220 270 267 387 471 544 719 754 780 632 701 742
338 453 315 410 434 524 543 578 584 543 572 581
523 433 388 487 492 536 572 604 620 584 610 625
727 689 711 856 879 926 955 959 954 955 959 954
544 189 162 163 185 194 227 241 194 226 241
138 253 296 384 414 462 461 472 486 490 506 523
654 488 342 428 464 454 424 416 431 443 437 451
449 516 555 649 674 687 596 647 690
160 218 196 378 383 405 395 422 414 399 402 396
685 566 695 822 821 798 778 791 789 807 799 794
428 418 476 549 562 556 578 503 510 582 510 525
141 227 156 305 347 380 383 393 392 385 391 395
703 526 434 394 386 382 415 418 408 413 419 410
476 388 494 784 843 886 914 934 945 943 969 986
800 828 866 894 897 895 897 902 900
Luxembourg
Sweden
France
Hungary
Denmark
Finland
Portugal
United Kingdom
Italy
Poland
Euro area
Slovenia
Malta
EU
Cyprus
17022014
Latvia
Lithuania
Estonia
Czech Republic
Austria
Autumn 2013
Ireland
Belgium
forecast
Greece
averages forecast
Romania
Spain
Croatia
Germany
Bulgaria
Slovakia
Gross debt general government (as a percentage of GDP 1995-2015)
Netherlands
Winter 2014
Statistical Annex
155
Table 43
5-year
1995-99 2000-04 2005-09 2010 2011 2012 2013 2014 2015 2013 2014 2015
255 255 247 233 225 208 201 206 205 210 210 212
209 206 243 237 245 243 240 240 241 240 241 242
209 223 227 234 268 266 258 253 257 267 268 273
224 223 196 139 132 145 177 185 193 147 154 162
159 115 82 48 44 83 108 120 131 108 120 131
220 226 207 184 173 185 193 195 197 195 199 205
196 200 194 174 183 177 176 179 181 175 178 182
219 207 194 165 167 174 179 187 192 179 185 189
183 142 113 106 130 81 98 100 106 104 110 111
156 191 205 228 225 230 225 220 217 223 218 215
321 331 293 275 278 280 270 271 271 275 274 266
200 150 134 146 142 139 145 143 142 149 147 142
269 268 262 228 255 252 255 264 277 249 253 264
228 244 258 247 248 245 245 252 258 246 252 258
202 169 116 98 113 144 157 164 173 159 160 167
238 246 254 204 204 206 214 230 240 216 223 230
248 211 201 188 213 211 204 199 205 213 211 225
234 272 249 202 191 181 183 190 190 176 179 182
215 213 214 195 200 202 204 208 212 204 207 211
153 148 225 220 225 239 234 227 235 235 233
267 239 242 198 210 207 199 203 206 197 200 201
210 231 242 227 237 234 246 243 243 226 231 234
148 200 219 201 193 191 201 208 210 196 204 206
128 143 152 169 174 172 180 182 187 175 179 181
200 177 165 196 198 186 201 205 210 200 198 194
203 172 176 167 176 171 175 180 182 172 176 180
140 176 177 212 224 215 227 232 231 236 240 241
213 233 265 256 261 253 243 243 246 244 244 247
168 153 150 123 135 108 106 114 120 100 104 108
202 205 187 193 189 191 195 199 190 193 197
202 186 168 151 158 164 162 169 172 159 164 170
294 262 259 235 222 218 217 224 230 220 232 239
EU
averages
Cyprus
forecast
Romania
Spain
Croatia
Germany
Bulgaria
17022014
Lithuania
Estonia
Czech Republic
Austria
Gross national saving (as a percentage of GDP 1995-2015)
Luxembourg
France
Autumn 2013
Ireland
Denmark
Finland
Belgium
forecast
Portugal
Italy
Slovakia
Netherlands
Winter 2014
USA
Latvia
Japan
Sweden
Hungary
United Kingdom
Poland
Greece
Euro area
Slovenia
Malta
Table 44
5-year
1995-99 2000-04 2005-09 2010 2011 2012 2013 2014 2015 2013 2014 2015
255 238 240 252 240 222 214 216 216 222 219 219
207 210 235 244 229 221 220 220 221 220 220 220
165 174 178 212 235 224 225 222 227 232 235 241
193 174 184 214 199 205 225 219 218 197 189 176
184 127 141 137 132 132 116 128 125 126 126 124
219 189 179 230 226 231 240 232 241 240 240 252
192 193 195 208 199 189 182 185 186 180 181 185
231 206 191 180 181 176 182 185 189 181 185 188
182 145 85 107 149 107 136 130 138 165 163 144
143 179 184 264 224 210 207 204 202 206 201 201
242 253 229 230 229 237 230 234 254 238 239 247
238 172 146 164 155 157 160 155 152 168 165 159
254 244 236 234 260 254 254 257 273 250 243 256
221 225 245 251 238 231 228 236 240 232 235 238
201 179 145 168 162 195 200 195 189 202 190 183
214 233 229 214 215 210 225 234 244 224 227 236
234 217 205 235 237 234 217 219 222 230 228 245
213 204 196 205 176 177 185 192 190 176 180 182
213 204 206 218 212 207 207 208 211 206 206 210
115 101 222 216 210 234 228 219 227 225 219
224 215 214 203 205 198 194 202 208 191 197 201
199 204 193 230 232 230 223 231 249 220 224 240
210 215 212 235 243 235 226 242 240
109 127 145 218 203 188 188 185 185 187 185 181
209 177 184 220 222 187 202 207 214 205 201 197
199 183 171 195 181 174 186 185 181 191 189 189
139 157 158 221 206 196 201 204 200 211 211 209
202 199 215 222 226 225 223 224 221 223 223 219
171 148 170 189 184 159 145 143 138 139 132 126
214 208 199 198 198 200 197 196 198
186 183 188 226 223 219 198 196 195 196 195 194
275 276 270 289 275 267 265 253 246 273 261 252
EU
averages
Cyprus
forecast
Romania
Spain
Croatia
Germany
Bulgaria
17022014
Lithuania
Estonia
Czech Republic
Austria
Gross saving private sector (as a percentage of GDP 1995-2015)
Luxembourg
France
Autumn 2013
Ireland
Denmark
Finland
Belgium
forecast
Portugal
Italy
Slovakia
Netherlands
Winter 2014
USA
Latvia
Japan
Sweden
Hungary
United Kingdom
Poland
Greece
Euro area
Slovenia
Malta
European Economic Forecast Winter 2014
156
Table 45
5-year
1995-99 2000-04 2005-09 2010 2011 2012 2013 2014 2015 2013 2014 2015
183 168 163 152 141 152 149 146 143 150 146 146
160 156 168 169 164 164 161 160 159 161 159 158
37 02 01 101 111 45 52 53 53 54 59 62
107 132 112 102 127 113 120 135 141 137
132 113 126 139 127 104 104 106 109 105 105 114
150 151 151 156 156 152 150 147 146 144 138 137
194 159 154 124 119 116 128 131 132 124 126 127
127 136 137 192 152 128 99 122 147 33 74 50
170 134 124 105 116 107 102 109 110 97 94 100
144 135 157 140 120 126 130 136 141 130 133 133
112 104 86 101 97 120 124 118 114 122 115 106
131 152 155 129 121 119 135 148 154 119 122 126
121 82 65 103 94 82 79 77 77 58 68 72
92 85 84 107 87 86 105 111 102 102 100 88
141 142 138 132 129 130 131 131 131 130 130
115 96 102 107 99 106 106 108 107 105 107 107
58 79 54 77 77 66 20 36 50 56 57 76
28 36 04 82 42 09
168 103 100 108 107 74 90 90 79 48 54 60
145 110 71 82 21 48 70 70 55 25 29 31
26 -31 -80 -38 -70 -62 -59 -51 -63
62 83 101 113 131 148 159 157 141 154 146 133
74 46 35 73 67 72 64 61 57 62 61 60
118 114 119 113 113 113 112 110 119 117 117
107 99 100 113 111 109 94 92 91 38 49 58
160 107 83 87 90 78 67 58 51 66 57 52
EU
averages
Cyprus
forecast
Romania
Spain
Croatia
Germany
Bulgaria
17022014
Lithuania
Estonia
Czech Republic
Austria
Saving rate of households (1995-2015)
Luxembourg
France
Autumn 2013
Ireland
Denmark
Finland
Belgium
forecast
Portugal
Italy
Slovakia
Netherlands
Winter 2014
USA
Latvia
Japan
Sweden
Hungary
United Kingdom
Poland
Greece
Euro area
Slovenia
Malta
Table 46
5-year
1995-99 2000-04 2005-09 2010 2011 2012 2013 2014 2015 2013 2014 2015
00 17 07 -19 -15 -14 -13 -10 -11 -12 -09 -08
02 -04 08 -07 16 22 20 20 20 20 21 22
45 49 50 22 33 42 33 31 29 35 33 32
31 49 12 -75 -67 -60 -49 -33 -25 -51 -34 -14
-26 -12 -59 -90 -88 -50 -07 -08 06 -18 -06 06
02 37 28 -46 -54 -45 -46 -37 -44 -45 -40 -47
04 07 00 -34 -16 -12 -05 -05 -05 -05 -03 -03
-12 01 03 -15 -13 -02 -02 02 03 -02 00 01
01 -04 29 -01 -19 -26 -38 -30 -33 -61 -53 -33
13 13 21 -37 02 20 18 16 14 17 17 14
79 78 65 45 49 43 40 37 18 37 35 18
-38 -22 -12 -19 -13 -18 -15 -12 -10 -19 -17 -16
14 23 26 -06 -05 -02 01 07 03 -01 10 08
07 19 14 -04 10 14 17 16 18 14 16 20
00 -10 -28 -70 -49 -51 -43 -30 -16 -43 -30 -16
24 13 25 -10 -12 -03 -11 -04 -04 -08 -03 -06
14 -06 -03 -46 -24 -24 -13 -19 -18 -17 -17 -21
22 68 52 -03 15 04 -01 -02 00 -01 -01 00
01 09 08 -23 -12 -05 -02 00 00 -03 01 01
-11 38 47 03 04 15 06 07 08 08 10 14
43 24 28 -05 05 09 05 01 -02 06 03 -01
11 27 49 -03 05 03 23 13 -05 06 07 -06
-09 -21 -20 -34 -34 -25 -30 -38 -34
19 16 07 -48 -29 -16 -09 -04 02 -12 -06 00
-09 00 -19 -24 -24 -01 00 -02 -04 -05 -03 -03
04 -11 05 -28 -06 -03 -11 -05 01 -18 -13 -09
01 19 19 -09 18 20 25 28 31 26 28 32
11 35 50 34 35 29 20 19 25 21 21 28
-03 05 -20 -66 -49 -52 -38 -28 -18 -39 -29 -19
-27 -15 -10 -06 -03 -02 -07 -03 -01
15 03 -19 -75 -64 -54 -36 -28 -23 -37 -31 -23
19 -14 -12 -54 -53 -49 -47 -29 -16 -52 -28 -13
EU
averages
Cyprus
forecast
Romania
Spain
Croatia
Germany
Bulgaria
17022014
Lithuania
Estonia
Czech Republic
Austria
Gross saving general government (as a percentage of GDP 1995-2015)
Luxembourg
France
Autumn 2013
Ireland
Denmark
Finland
Belgium
forecast
Portugal
Italy
Slovakia
Netherlands
Winter 2014
USA
Latvia
Japan
Sweden
Hungary
United Kingdom
Poland
Greece
Euro area
Slovenia
Malta
Statistical Annex
157
Table 47
5-year
1995-99 2000-04 2005-09 2010 2011 2012 2013 2014 2015 2013 2014 2015
56 43 11 81 64 18 19 36 47 02 42 48
75 73 33 152 80 32 06 49 68 03 46 68
88 97 07 237 234 56 17 41 56 05 48 55
177 83 25 64 54 16 03 28 37 05 25 37
97 48 -13 52 03 -24 25 46 55 25 46 55
100 48 08 117 76 21 49 54 64 45 52 57
74 39 -06 95 54 24 06 44 56 14 43 56
40 31 -09 114 62 20 01 33 49 01 36 48
65 32 05 38 44 -27 -48 -27 19 -54 -25 17
78 49 125 124 94 09 45 59 28 47 62
86 73 32 72 54 -19 23 36 49 27 40 35
14 23 174 34 81 -29 40 59 -16 45 56
80 50 26 116 41 32 13 29 50 28 32 45
76 69 15 94 66 12 23 48 60 16 47 58
80 42 14 102 69 32 58 50 53 58 50 53
47 83 43 102 70 06 29 38 45 13 26 39
82 88 56 160 122 99 35 48 62 46 46 60
97 55 16 79 28 -02 -04 34 44 -14 35 44
55 16 116 65 25 13 42 57 13 42 56
39 38 147 123 -04 82 56 64 49 34 55
104 104 55 154 95 45 04 57 61 -03 38 48
55 43 25 30 70 04 09 31 40 08 34 40
77 -06 48 20 04 -13 25 30 -07 25 30
122 57 174 141 118 65 66 69 59 67 69
209 104 76 113 84 17 51 53 61 37 53 61
115 116 61 121 77 39 47 52 63 54 51 59
88 150 54 132 103 -30 136 57 63 96 50 61
91 56 15 114 61 07 -15 28 54 -21 35 65
61 42 20 67 45 11 08 29 37 27 34 36
56 20 110 65 23 14 41 55 15 41 54
74 22 39 115 71 35 28 62 57 30 56 58
39 71 -05 244 -04 -01 16 34 40 36 58 37
EU
averages
Cyprus
forecast
Romania
Spain
Croatia
Germany
Bulgaria
17022014
Lithuania
Estonia
Czech Republic
Austria
Exports of goods and services volume (percentage change on preceding year 1995-2015)
Luxembourg
France
Autumn 2013
Ireland
Denmark
Finland
Belgium
forecast
Portugal
Italy
Slovakia
Netherlands
Winter 2014
USA
Latvia
Japan
Sweden
Hungary
United Kingdom
Poland
Greece
Euro area
Slovenia
Malta
Table 48
5-year
1995-99 2000-04 2005-09 2010 2011 2012 2013 2014 2015 2013 2014 2015
52 38 17 75 68 13 12 32 52 -04 41 50
76 48 36 125 74 14 13 59 76 10 57 76
95 127 -16 211 284 88 30 46 58 17 50 58
170 75 18 36 -04 00 01 28 26 02 14 27
108 46 02 -62 -73 -138 -68 -13 27 -71 -13 27
123 70 01 93 -01 -57 02 33 49 -19 15 40
71 50 13 89 51 -11 07 40 58 14 35 58
63 37 -02 126 08 -74 -29 30 55 -35 36 54
60 54 21 48 -02 -64 -147 -72 02 -165 -67 17
102 -05 118 223 45 -03 48 67 18 54 71
97 71 29 114 74 -10 23 39 53 27 46 47
14 22 153 01 54 -39 37 59 -27 42 56
91 44 29 103 42 33 -05 32 50 01 27 45
56 59 07 91 76 -03 04 46 56 04 45 56
98 26 13 80 -53 -66 26 30 38 08 25 37
83 70 32 74 56 -47 02 17 33 -02 08 25
111 83 39 149 97 33 20 45 60 19 43 58
80 62 27 68 62 -07 -15 20 44 -19 41 39
50 19 100 45 -09 02 41 59 -01 39 57
80 43 24 88 37 50 55 68 41 37 59
106 101 36 154 70 23 07 46 58 -12 32 46
64 56 36 35 59 09 25 30 38 16 31 38
89 -04 -28 13 -21 -07 17 32 00 18 38
129 31 179 137 61 66 70 74 62 71 74
176 106 45 109 64 -01 50 59 66 37 55 65
183 74 57 139 55 -07 08 46 66 11 38 58
116 193 92 111 100 -09 29 50 73 08 51 65
78 37 24 120 71 -06 -19 37 56 -21 39 69
84 58 03 79 03 31 12 26 33 19 23 24
54 20 98 44 -03 05 40 56 02 37 53
106 56 -06 128 49 22 14 47 63 22 56 62
44 47 -12 111 59 53 34 45 22 26 40 24
EU
averages
Cyprus
forecast
Romania
Spain
Croatia
Germany
Bulgaria
17022014
Lithuania
Estonia
Czech Republic
Austria
Imports of goods and services volume (percentage change on preceding year 1995-2015)
Luxembourg
France
Autumn 2013
Ireland
Denmark
Finland
Belgium
forecast
Portugal
Italy
Slovakia
Netherlands
Winter 2014
USA
Latvia
Japan
Sweden
Hungary
United Kingdom
Poland
Greece
Euro area
Slovenia
Malta
European Economic Forecast Winter 2014
158
Table 49
5-year
1995-99 2000-04 2005-09 2010 2011 2012 2013 2014 2015 2013 2014 2015
35 08 -08 -16 -15 -14 -11 -16 -04 -06 -09
54 70 63 59 67 68 66 66 68 65 65
-147 -129 -25 -44 -66 -52 -51 -50 -61 -59 -61
249 148 226 226 222 204 189 185 206 201 192
-183 -143 -140 -113 -99 -89 -84 -96 -87 -82
-57 -73 -46 -42 -25 -12 -04 -02 -08 02 07
00 -20 -26 -36 -31 -28 -29 -31 -25 -24 -24
10 -01 -13 -11 11 23 28 28 24 25 25
-263 -280 -268 -242 -215 -183 -169 -167 -179 -165 -167
-168 -187 -70 -108 -104 -92 -93 -98 -94 -99 -105
-111 -99 -102 -123 -142 -150 -153 -157 -140 -140 -142
-135 -186 -192 -161 -136 -123 -121 -125 -124 -124 -127
64 74 71 75 77 93 91 98 99 101 107
-08 -03 -10 -25 -23 -15 -14 -13 -17 -18 -19
-105 -112 -106 -77 -47 -36 -28 -22 -29 -20 -14
-32 -40 -24 -27 -04 10 27 36 07 16 19
-62 -26 08 10 47 54 52 51 73 76 80
88 41 14 -07 00 00 05 05 03 02 02
19 06 05 03 14 21 22 22 23 24 25
11 02 01 00 10 17 18 19 19 20 21
-119 -210 -77 -56 -91 -61 -65 -72 -74 -77 -86
-23 15 15 24 38 45 56 63 46 49 50
44 14 29 30 27 32 30 27 26 27 26
-227 -215 -139 -145 -143 -147 -144 -146 -148 -147 -152
-95 -113 -48 -58 -28 -25 -28 -30 -27 -28 -31
-44 -10 25 31 36 40 37 35 38 38 35
-39 -26 -18 -21 -08 05 07 04 09 12 11
-68 -111 -61 -56 -56 -24 -25 -29 -28 -30 -33
68 47 26 22 24 21 16 15 19 15 11
-42 -59 -66 -65 -69 -69 -67 -66 -64 -61 -59
07 -06 -06 -07 00 06 07 07 09 10 10
-05 -13 -11 -12 -04 02 02 03 04 06 06
-46 -55 -45 -49 -47 -43 -41 -43 -45 -46 -48
25 23 16 17 -03 -12 -19 -24 -22 -16 -17 -15
sup2 See note 8 on concepts and sources
forecast
Portugal
Sweden
Italy
Hungary
Greece
Euro area
USA
Slovenia
Malta
United Kingdom
averages
Cyprus
forecast
Poland
Netherlands
sup1 See note 7 on concepts and sources
Austria
EU adjustedsup2
Luxembourg
Romania
Lithuania
Czech Republic
Finland
Denmark
Japan
Winter 2014
17022014
EU
Latvia
Croatia
Estonia
Bulgaria
France
Autumn 2013
Ireland
Belgium
Spain
Germany
Euro area adjustedsup2
Slovakia
Merchandise trade balancesup1 (fob-fob as a percentage of GDP 1995-2015)
Table 50
5-year
1995-99 2000-04 2005-09 2010 2011 2012 2013 2014 2015 2013 2014 2015
46 49 25 26 05 -02 01 06 03 09 09 08
-09 13 63 64 63 70 70 67 64 70 66 64
-85 -87 -92 35 03 -28 -21 -24 -23 -21 -22 -22
19 -01 -40 11 12 44 70 68 72 41 46 49
-26 -119 -149 -128 -117 -53 -23 -18 -16 -23 -19 -16
-08 -44 -82 -44 -40 -12 11 16 18 14 26 31
18 08 -13 -19 -25 -21 -19 -20 -22 -18 -15 -15
22 -03 -17 -35 -31 -05 09 13 12 10 12 11
-12 -38 -96 -92 -35 -68 -17 00 04 -20 -06 -09
-58 -80 -124 29 -23 -25 -16 -19 -25 -16 -20 -26
103 105 89 77 66 67 64 67 70 67 68 58
-73 -44 -72 -54 -10 11 17 09 05 18 14 06
47 65 66 50 74 77 92 91 100 96 100 110
-22 10 34 36 15 18 29 34 38 25 28 31
-61 -90 -109 -104 -72 -22 04 08 11 09 09 10
-12 -12 -30 -02 02 31 49 69 78 50 60 65
-60 -61 -63 -37 -26 16 20 19 23 43 43 54
49 72 35 17 -15 -14 -02 05 04 -12 -13 -11
07 04 01 03 04 18 27 27 27 27 29 30
00 -03 00 01 14 22 23 23 23 25 26
-02 -50 -173 -04 01 -13 20 13 00 03 00 -06
-38 -45 -32 -50 -35 -26 -24 -15 -09 -16 -11 -10
08 27 30 58 59 60 70 68 66 54 56 58
-52 -38 -62 -09 -11 -02 08 13 09 01 07 01
-100 -60 -87 -04 -39 -11 01 -05 -07 -05 -08 -14
-48 -76 -60 04 06 11 29 27 26 30 27 18
-24 -34 -42 -43 -45 -33 -16 -14 -18 -15 -13 -14
-59 -43 -97 -44 -45 -44 -10 -12 -16 -12 -15 -17
43 57 78 69 62 65 62 56 55 59 56 53
-09 -22 -18 -27 -15 -37 -38 -33 -32 -43 -44 -43
04 -01 -03 -01 02 09 17 17 17 16 17 18
-07 -12 -06 -03 05 13 14 14 13 14 14
-21 -37 -46 -33 -26 -26 -23 -21 -23 -26 -27 -30
23 29 37 37 20 10 07 05 10 12 18 23
sup2 See note 8 on concepts and sources
forecast
Portugal
Sweden
Italy
Hungary
Greece
Euro area
USA
Slovenia
Malta
United Kingdom
averages
Cyprus
forecast
Poland
Netherlands
sup1 See note 7 on concepts and sources
Austria
EU adjustedsup2
Luxembourg
Romania
Lithuania
Czech Republic
Finland
Denmark
Japan
Winter 2014
17022014
EU
Latvia
Croatia
Estonia
Bulgaria
France
Autumn 2013
Ireland
Belgium
Spain
Germany
Euro area adjustedsup2
Slovakia
Current-account balancesup1 (as a percentage of GDP 1995-2015)
Statistical Annex
159
Table 51
5-year
1995-99 2000-04 2005-09 2010 2011 2012 2013 2014 2015 2013 2014 2015
45 48 22 25 03 -03 03 07 04 11 10 09
-09 14 62 64 61 70 70 66 64 69 66 63
-79 -82 -75 70 44 07 08 01 01 08 03 02
29 04 -41 07 11 32 68 72 69 30 41 47
-12 -103 -132 -110 -98 -29 -03 -01 02 -04 -01 02
02 -34 -76 -38 -35 -06 19 22 23 24 33 37
19 08 -13 -18 -25 -22 -19 -20 -21 -18 -14 -14
24 -01 -16 -35 -30 -03 09 14 13 11 12 11
-12 -34 -94 -90 -33 -67 02 10 13 -11 -08 -10
-57 -75 -107 49 -02 05 09 06 00 15 11 04
90 73 63 62 60 66 71 70 71 63
-66 -39 -53 -37 00 28 39 32 29 40 37 29
44 62 62 45 70 74 89 82 99 93 92 108
-23 09 33 37 14 16 28 35 38 25 28 31
-37 -72 -96 -90 -56 -01 23 27 30 36 36 35
-12 -15 -32 -01 00 29 49 75 86 31 25 68
-62 -65 -58 -21 -09 31 32 36 37 56 54 60
50 73 36 18 -13 -13 -01 06 05 -11 -12 -11
02 04 05 19 28 29 29 29 30 31
-02 01 01 15 24 25 25 25 26 27
-07 -48 -169 03 13 00 33 27 13 18 17 12
-38 -42 -25 -29 -16 -14 -09 -01 06 -02 03 05
09 27 30 59 63 60 70 68 68 55 57 60
-52 -38 -62 -09 -11 -02 08 13 09 01 07 01
-101 -57 -65 34 -06 19 30 23 20 18 14 08
-48 -74 -52 22 29 37 61 56 53 62 58 50
-23 -33 -34 -27 -27 -16 03 07 04 00 06 03
-56 -38 -92 -42 -39 -30 00 -03 -07 -02 -06 -08
38 56 77 68 61 63 62 55 53 60 54 52
-08 -20 -17 -24 -12 -35 -36 -31 -30 -41 -42 -42
-02 02 04 11 19 20 20 19 19 20
-10 -03 -01 08 16 17 17 15 16 17
-21 -37 -46 -33 -26 -26 -23 -21 -23 -26 -27 -30
21 28 36 36 20 10 06 05 10 12 18 23
sup2 See note 8 on concepts and sources
forecast
Portugal
Sweden
Italy
Hungary
Greece
Euro area
USA
Slovenia
Malta
United Kingdom
averages
Cyprus
forecast
Poland
Netherlands
sup1 See note 7 on concepts and sources
Austria
EU adjustedsup2
Luxembourg
Romania
Lithuania
Czech Republic
Finland
Denmark
Japan
Winter 2014
17022014
EU
Latvia
Croatia
Estonia
Bulgaria
France
Autumn 2013
Ireland
Belgium
Spain
Germany
Euro area adjustedsup2
Slovakia
Net lending (+) or net borrowing (-) of the nationsup1 (as a percentage of GDP 1995-2015)
Table 52
2007 2008 2009 2010 2011 2012 2013 2014 2015 2013 2014 2015
132 37 24 93 17 -09 02 25 12 36 37 33
1825 1521 1451 1595 1632 1879 1921 1883 1885 1918 1872 1875
-25 -14 06 05 00 -05 -04 -05 -05 -04 -04 -05
-104 -102 -38 18 20 73 116 115 126 68 77 86
-393 -419 -332 -284 -245 -103 -42 -33 -30 -43 -34 -31
-1052 -1043 -500 -457 -416 -125 113 166 191 147 264 328
-257 -366 -332 -361 -491 -424 -399 -428 -472 -362 -308 -318
-201 -449 -302 -545 -483 -84 136 200 197 153 184 177
-19 -21 -18 -16 -06 -12 -03 00 01 -03 -01 -01
-47 -30 16 05 -05 -06 -04 -05 -07 -04 -05 -07
38 20 26 30 28 29 29 32 35 30 32 28
-02 -03 -05 -03 -01 01 01 01 00 01 01 00
481 281 182 296 443 459 557 558 639 581 614 699
109 137 74 103 46 55 90 110 127 80 92 106
-172 -217 -182 -179 -123 -37 07 14 19 15 15 17
-16 -23 -01 -01 01 11 17 24 28 18 21 23
-31 -40 -16 -25 -18 12 15 14 18 31 32 43
76 58 34 30 -27 -27 -03 10 09 -24 -26 -24
340 -672 87 303 372 1685 2549 2684 2775 2639 2862 3030
83 -1426 -216 06 55 1281 2143 2279 2372 2219 2444 2614
-78 -82 -31 -01 00 -05 08 05 00 01 00 -03
-68 -45 -46 -75 -54 -40 -35 -22 -14 -24 -18 -16
31 68 76 138 143 147 176 175 176 134 145 153
-30 -39 -20 -04 -05 -01 03 06 04 00 03 00
-43 -42 05 -01 -12 -04 00 -02 -03 -02 -03 -05
-74 -73 -01 03 06 11 28 28 28 29 28 19
-189 -205 -96 -152 -166 -125 -62 -57 -76 -60 -51 -60
-170 -160 -49 -55 -59 -59 -15 -17 -24 -17 -22 -26
290 294 201 242 240 263 260 238 243 248 241 242
-456 -173 -225 -466 -259 -721 -717 -680 -682 -803 -864 -883
-446 -1129 -101 -67 206 1151 2197 2357 2427 2146 2322 2452
-1340 -2767 -823 -687 -353 691 1736 1896 1966 1650 1823 1957
-5321 -5286 -3251 -3753 -2897 -3285 -2949 -2694 -3174 -3241 -3517 -4046
1546 1093 1054 1539 861 471 246 186 359 439 679 900
sup2 See note 8 on concepts and sources
Autumn 2013
United Kingdom
Cyprus
Poland
Spain
Denmark
forecast
Germany
France
Lithuania
Ireland
Czech Republic
Finland
Latvia
17022014
Winter 2014
Belgium
Portugal
sup1 See note 7 on concepts and sources
Sweden
Italy
Hungary
Greece
Euro area
USA
Slovenia
Malta
Current-account balancesup1 (in billions of euro 2007-15)
Luxembourg
Romania
Estonia
Bulgaria
forecast
Austria
Euro area adjustedsup2
Japan
Slovakia
Netherlands
EU
EU adjustedsup2
Croatia
European Economic Forecast Winter 2014
160
Table 53
2007 2008 2009 2010 2011 2012 2013 2014 2015 2013 2014 2015
53 21 -106 103 50 11 13 44 58 14 43 58
68 22 -117 105 52 12 17 43 56 17 44 56
93 18 -177 96 74 15 12 43 59 14 49 61
41 12 -115 107 46 13 19 43 54 17 41 51
57 17 -124 104 49 11 21 41 57 18 41 55
50 19 -106 98 42 05 19 43 56 19 42 55
59 18 -111 103 49 10 19 45 57 17 46 57
66 27 -110 99 54 16 21 46 58 21 46 59
67 22 -136 81 74 13 35 57 72 22 43 52
89 38 -170 125 104 39 27 49 61 27 53 63
49 16 -112 101 42 04 16 40 51 14 36 49
52 18 -117 103 44 08 22 43 55 20 42 53
55 23 -112 104 52 09 15 45 59 12 45 58
68 28 -115 113 59 11 17 48 62 14 47 62
55 09 -126 97 39 -03 18 43 55 14 39 54
73 27 -131 98 55 04 10 44 59 09 45 60
83 32 -123 117 62 08 13 48 62 09 46 61
87 36 -122 119 77 27 22 48 61 23 50 62
61 22 -113 104 51 11 17 44 57 16 45 57
85 24 -128 94 56 00 16 40 58 13 43 60
70 32 -123 112 59 13 15 49 63 13 48 63
64 24 -114 114 54 15 17 44 58 16 44 57
69 15 -127 104 53 -04 14 41 56 08 38 54
111 25 -166 112 98 35 16 47 60 19 51 63
78 35 -125 110 61 13 14 47 61 12 46 61
80 35 -124 114 62 17 14 46 60 12 47 61
70 17 -124 102 54 07 15 44 59 15 46 61
59 23 -119 97 50 17 20 41 55 20 43 55
62 16 -111 105 50 14 19 45 56 19 45 57
62 22 -115 105 52 12 17 44 57 16 45 57
72 35 -112 131 66 33 33 51 56 36 51 58
77 37 -90 148 70 34 33 55 65 38 58 65
forecast
Germany
Winter 2014
Belgium
Portugal
Austria
Ireland
Spain
France
Latvia
17022014
United Kingdom
Italy
Poland
Export markets (a) (percentage change on preceding year 2007-15)
Greece
Euro area (b)
Slovenia
Malta
Autumn 2013
Cyprus
Romania
Estonia
Czech Republic
forecast
(b) Intra- and extra-EU trade
Japan
Luxembourg
Sweden
(a) Imports of goods and services to the various markets (incl EU-markets) weighted according to their share in countrys exports of goods and services
USA
Slovakia
Netherlands
EU (b)
Lithuania
Croatia
Hungary
Denmark
Finland
Bulgaria
Table 54
2007 2008 2009 2010 2011 2012 2013 2014 2015 2013 2014 2015
-01 -07 14 -20 13 07 07 -08 -10 -12 -02 -09
11 06 -14 42 27 20 -10 06 12 -14 02 12
-52 -08 -43 129 149 41 05 -02 -03 -08 -01 -05
41 -23 87 -39 07 02 -17 -14 -16 -12 -16 -13
13 00 -80 -47 -44 -35 03 05 -01 06 05 00
16 -29 07 17 33 16 29 11 08 25 09 02
-34 -21 -11 -08 05 14 -14 -01 00 -03 -03 -01
-03 -54 -73 13 08 04 -19 -12 -08 -19 -09 -09
-05 -27 34 -40 -28 -40 -81 -79 -49 -75 -65 -33
25 -14 47 00 18 52 -18 -04 -01 01 -06 -01
39 28 -19 -26 12 -24 07 -04 -02 13 04 -13
-14 03 37 64 -10 73 -50 -03 04 -35 04 03
08 -03 39 11 -11 23 -02 -15 -08 16 -13 -13
19 -13 -46 -17 07 01 06 00 -02 02 00 -03
19 -10 19 05 29 34 40 08 -02 44 11 00
60 13 -34 03 14 02 19 -06 -13 03 -18 -20
55 -01 -45 39 56 90 21 00 00 36 00 00
-05 21 -104 -36 -46 -28 -26 -14 -16 -36 -14 -17
05 -11 -12 11 13 14 -05 -02 00 -03 -03 -01
-22 06 18 49 63 -03 65 15 06 36 -09 -05
39 07 16 38 34 31 -10 08 -02 -16 -10 -14
-34 09 22 -75 15 -11 -07 -13 -16 -06 -09 -16
-30 02 -40 -50 -31 08 -27 -15 -25 -15 -13 -23
-72 87 48 56 39 80 48 18 08 39 15 05
66 21 26 03 22 03 36 06 00 25 07 00
10 34 64 06 14 22 32 05 02 41 03 -02
08 65 68 27 59 -21 118 12 04 81 04 00
-02 -05 -22 15 10 -10 -34 -13 00 -40 -07 10
-78 -05 27 -35 -05 -03 -12 -16 -18 09 -09 -19
-05 -07 -02 04 12 11 -03 -03 -02 -01 -03 -03
16 22 24 -14 04 02 -04 11 01 -06 05 01
09 -22 -167 83 -69 -34 -16 -20 -23 00 00 -26
forecast
Germany
Winter 2014
Belgium
Portugal
Austria
Ireland
Spain
France
Latvia
17022014
United Kingdom
Italy
Poland
Export performance (a) (percentage change on preceding year 2007-15)
Greece
Euro area (b)
Slovenia
Malta
Autumn 2013
Cyprus
Romania
Estonia
Czech Republic
forecast
(b) Intra- and extra-EU trade
Japan
Luxembourg
Sweden
(a) Index for exports of goods and services divided by an index for growth of markets
USA
Slovakia
Netherlands
EU (b)
Lithuania
Croatia
Hungary
Denmark
Finland
Bulgaria
Statistical Annex
161
Table 55
( a ) 2009 2010 2011 2012 2013 2014 2015 2013 2014 2015
187 -45 20 17 -04 01 16 20 00 14 19
132 -45 19 15 -07 -04 12 18 -04 11 17
05 -28 23 18 -01 02 14 17 01 11 14
01 -55 04 18 08 06 17 20 05 15 18
03 -45 25 18 -10 -12 18 22 -10 18 22
02 -57 14 11 -04 03 17 18 03 17 18
37 -51 40 33 07 04 18 20 05 17 19
00 -141 26 96 39 07 23 36 13 30 39
02 -64 -11 22 02 03 18 29 03 17 25
03 -31 -49 -71 -64 -37 06 29 -40 06 29
16 -38 -02 01 -16 -12 10 17 -13 05 17
26 -31 17 20 00 03 10 17 02 09 17
01 -69 -23 00 -20 -07 05 12 -07 05 12
21 -55 17 05 -25 -19 06 12 -18 07 12
00 -19 13 04 -24 -60 -48 09 -87 -39 11
00 -177 -13 53 52 40 42 43 40 41 42
01 -148 16 60 37 32 35 39 34 36 39
00 -56 31 19 -02 21 22 25 19 18 11
02 -68 11 16 -17 11 21 21 07 18 21
00 -28 33 17 09 20 21 21 18 19 20
08 -37 15 09 -12 -08 10 13 -10 02 12
04 -38 18 28 09 03 15 18 04 16 18
09 16 39 45 19 16 29 31 13 25 29
03 -29 19 -13 -32 -16 08 15 -18 08 15
03 -66 -11 22 07 35 23 25 22 21 24
01 -79 13 07 -25 -16 -01 13 -27 -10 07
02 -49 44 30 18 08 23 32 09 21 29
02 -85 34 28 -10 -15 02 13 -06 06 16
05 -50 66 29 09 09 25 33 11 28 35
27 -52 17 11 03 19 25 24 13 22 24
15 -47 82 81 18 36 24 29 33 29 41
13 -48 92 88 22 38 25 30 35 30 43
00 -09 29 28 -04 32 25 26 21 25 28
00 -66 -41 27 14 28 27 30 17 23 25
00 -57 25 32 -25 24 27 30 19 23 31
01 -35 10 16 -15 21 13 22 17 15 20
01 03 25 24 04 11 22 30 15 25 31
193 -28 25 18 28 19 29 32 16 26 31
55 -55 47 -05 14 16 16 13 21 20 13
18 -28 32 24 18 17 22 23 18 21 23
03 -16 05 13 29 13 27 26 19 26 27
04 -19 30 18 10 18 21 22 17 18 19
12 21 24 34 35 25 28 30 26 28 28
02 08 12 13 36 28 31 28 29 26 26
487 -37 27 17 13 12 22 25 11 21 24
43 -67 49 48 34 19 28 31 23 33 36
30 -78 45 43 34 13 23 27 19 30 34
13 -40 60 60 32 33 40 42 33 40 42
53 15 34 25 35 24 36 38 24 36 38
303 54 103 74 59 59 61 63 57 60 63
154 92 116 94 78 77 74 74 75 74 74
57 50 112 77 38 40 47 54 29 40 53
04 -25 68 49 15 30 33 34 30 33 34
19 03 63 37 20 28 37 38 28 37 38
15 46 62 65 62 58 60 63 58 60 63
86 -13 60 45 29 26 31 34 26 31 35
28 -03 75 27 09 22 23 29 22 25 31
21 -47 52 39 39 13 32 37 13 31 37
27 27 54 48 48 50 53 55 50 53 55
513 24 80 60 49 46 50 53 45 50 53
1000 -09 52 38 31 29 36 39 28 36 39
813 01 61 44 39 36 41 44 35 41 44
868 -03 58 42 37 35 40 43 33 39 43
17022014
Winter 2014
EU
- Brazil
- Serbia
Cyprus
Asia
Sweden
Estonia
- Russia
Slovenia
Czech Republic
Canada
Hungary
- Korea
Potential Candidates
World GDP volume (percentage change on preceding year 2009-15)
Spain
Finland
Germany
CIS
Romania
Bulgaria
Australia
Japan
Austria
Luxembourg
- The former Yugoslav Republic of
Macedonia
Latvia
France
Autumn 2013
forecast
Italy
- Hong Kong
MENA
- Turkey
- China
United Kingdom
Ireland
- Other CIS
New Zealand
Slovakia
Denmark
Poland
forecast
Euro area
Greece
World excluding euro area
Belgium
Switzerland
Netherlands
Latin America
- Montenegro
Emerging and developing economies
World
(a) Relative weights in based on GDP (at constant prices and PPS) in 2012
- Mexico
World excluding EU
Lithuania
Croatia
- India
Candidate Countries
Advanced economies
Portugal
Norway
Malta
Sub-Saharan Africa
- Indonesia
USA
- Iceland
European Economic Forecast Winter 2014
162
Table 56
( a ) 2009 2010 2011 2012 2013 2014 2015 2013 2014 2015
348 -117 110 65 23 14 41 55 15 41 54
262 -124 116 65 25 13 42 57 13 42 56
11 -53 46 75 145 19 70 85 30 63 75
09 -50 34 79 167 07 74 90 22 66 79
00 -158 236 105 00 37 64 66 45 55 60
00 70 05 38 38 41 40 42 25 33 40
00 -224 75 141 -12 51 22 20 30 19 25
01 -80 153 34 18 159 49 57 129 51 59
101 -91 115 71 35 28 62 57 30 56 58
35 -242 244 -04 -01 16 34 40 36 58 37
26 -130 56 50 09 25 54 50 27 50 50
09 -42 04 -07 11 -17 39 57 13 32 50
15 -77 77 38 25 19 45 41 21 37 40
14 21 57 -06 58 47 57 58 38 57 58
02 24 39 24 23 17 31 35 30 38 38
563 -116 112 56 26 18 46 55 21 46 53
40 -138 105 80 05 27 45 49 16 49 50
27 -47 70 03 14 38 42 50 21 49 52
14 -317 174 237 -13 06 49 46 06 49 46
54 -160 89 73 28 45 50 53 45 50 53
264 -81 203 74 35 42 60 68 43 62 68
107 -103 278 89 52 41 60 70 41 60 70
21 -69 127 128 81 31 44 64 39 64 74
26 -100 168 39 19 63 79 81 63 79 81
31 -12 147 91 42 43 58 59 50 58 60
10 78 87 58 -10 50 78 92 50 78 92
58 -100 126 63 32 40 56 63 37 55 63
13 -36 113 49 34 25 39 52 25 42 54
18 -136 210 76 45 31 61 74 21 57 74
20 -322 171 137 -104 28 56 53 28 56 53
437 -113 169 76 24 40 57 63 39 58 63
1000 -115 134 64 25 27 51 58 29 51 58
652 -113 150 64 26 34 56 60 36 57 60
738 -111 142 64 25 33 54 59 34 55 58
(b) Intra- and extra-EU trade
Autumn 2013
Sub-Saharan Africa
USA
Latin America
- Iceland
- India
forecast
Euro area (b)
- Montenegro
- Korea
- Turkey
- China
- Russia
Japan
17022014
Winter 2014
EU (b)
New Zealand
(a) Relative weights in based on exports of goods and services (at current prices and current exchange rates) in 2012
- Mexico
- Serbia
- Indonesia
- The former Yugoslav Republic of
Macedonia
- Other CIS
World excluding EU
Advanced economies
Norway
World exports of goods and services volume (percentage change on preceding year 2009-15)
Canada
- Brazil
Candidate Countries
Asia
forecast
Australia
MENA
World excluding euro area
CIS
Switzerland
Emerging and developing economies
World
- Hong Kong
17022014
EU Euro Area
Candidate
Countries USA Japan
Other
Advanced
Economies China Rest of Asia CIS MENA
Latin
America
Sub-
Saharan
Africa
EU 649 483 20 63 13 55 33 46 33 43 27 16
Euro area 645 477 19 63 14 54 36 46 30 46 29 17
Belgium 745 612 12 49 09 30 21 49 16 36 15 19
Bulgaria 621 464 149 19 03 18 31 20 64 55 07 13
Czech Republic 821 649 16 24 05 27 13 16 46 18 07 06
Denmark 654 371 12 68 22 89 28 45 25 27 23 07
Germany 593 390 20 72 15 71 60 51 39 35 31 12
Estonia 699 395 20 34 11 49 09 34 116 10 10 09
Ireland 578 383 07 208 27 77 22 28 10 18 16 09
Greece 500 340 173 36 03 18 15 44 32 159 09 12
Spain 654 532 23 41 12 42 20 28 19 78 65 18
France 592 469 17 66 20 51 38 67 24 69 30 27
Croatia 663 560 110 47 08 23 06 11 59 51 09 11
Italy 546 411 32 73 17 77 29 54 37 81 40 14
Cyprus 491 326 01 12 04 11 21 214 28 206 01 10
Latvia 672 340 15 15 06 36 05 26 163 53 07 02
Lithuania 655 465 09 31 04 32 03 09 219 22 04 11
Luxembourg 823 699 19 25 04 42 13 20 19 19 08 09
Hungary 781 558 30 27 07 19 18 18 54 25 11 10
Malta 434 342 38 39 17 18 107 180 14 126 13 13
Netherlands 788 627 10 37 07 29 15 34 17 27 19 16
Austria 714 544 16 51 10 65 25 31 37 22 22 07
Poland 783 541 21 21 04 30 11 15 86 14 10 06
Portugal 696 599 10 44 06 23 22 14 09 39 39 97
Romania 692 509 77 24 06 17 13 22 64 63 12 10
Slovenia 766 552 59 17 02 21 08 15 67 36 06 04
Slovakia 858 469 19 17 02 21 26 05 40 06 04 02
Finland 544 320 15 66 19 71 49 56 96 31 37 18
Sweden 604 403 14 58 14 122 36 46 23 36 29 18
United Kingdom 551 488 15 117 15 70 30 83 19 48 23 27
Table 57 Export shares in EU trade (goods only - 2012)
Statistical Annex
163
Table 58
( a ) 2009 2010 2011 2012 2013 2014 2015 2013 2014 2015
330 -115 98 44 -03 05 40 56 02 37 53
244 -110 100 45 -09 02 41 59 -01 39 57
14 -154 177 102 01 61 11 36 71 54 85
12 -143 207 107 -03 69 07 33 80 57 91
00 -143 95 104 42 -08 61 65 30 57 62
00 -240 45 67 47 06 46 53 00 42 45
00 -302 -31 31 09 -17 20 30 -06 10 24
01 -191 31 70 19 21 26 49 11 25 49
124 -137 128 49 22 14 47 63 22 56 62
42 -157 111 59 53 34 45 22 26 40 24
27 -120 99 55 02 30 45 48 30 44 48
06 -125 90 38 23 26 30 53 30 30 53
12 -52 84 42 31 18 41 32 18 37 38
15 -90 143 108 62 14 48 56 40 56 64
02 -144 108 66 20 49 54 40 50 50 50
574 -122 107 49 09 13 41 54 13 43 53
34 -277 191 183 54 36 62 66 50 76 77
21 -304 258 203 95 59 65 73 82 87 90
13 -238 96 153 -11 -02 56 55 -02 56 55
50 -30 05 -04 24 48 56 57 48 56 56
260 -60 194 44 52 38 60 70 46 64 71
98 42 201 101 62 44 63 73 44 63 73
25 -06 154 -207 118 -27 29 64 43 68 75
28 -90 174 46 28 64 78 79 64 78 79
29 -80 173 61 25 35 50 57 42 55 56
10 -106 271 135 140 20 57 74 20 57 74
59 -178 182 120 26 53 66 71 58 66 71
14 -135 277 74 -16 57 69 74 57 70 75
19 -176 183 73 49 42 64 76 57 63 76
22 -181 57 113 -36 61 59 62 61 59 62
426 -99 157 63 41 43 60 68 49 64 69
1000 -114 126 54 22 25 49 60 28 52 60
670 -113 143 60 36 35 54 61 41 59 63
756 -115 136 58 33 33 52 60 38 56 61
- India
forecast
Euro area (b)
forecast
Australia
World
World imports of goods and services volume (percentage change on preceding year 2009-15)
Canada
- Brazil
- Montenegro
- Korea
- Turkey
- China
- Russia
Emerging and developing economies
Autumn 2013
Sub-Saharan Africa
USA
Latin America
- Iceland
17022014
Winter 2014
EU (b)
New Zealand
Japan
Switzerland
(b) Intra- and extra-EU trade
- Hong Kong
Candidate Countries
Asia
(a) Relative weights in based on imports of goods and services (at current prices and current exchange rates) in 2012
- Mexico
- Serbia
- Indonesia
- The former Yugoslav Republic of
Macedonia
- Other CIS
World excluding EU
Advanced economies
Norway
MENA
World excluding euro area
CIS
17022014
EU Euro Area
Candidate
Countries USA Japan
Other
Advanced
Economies China Rest of Asia CIS MENA
Latin
America
Sub-
Saharan
Africa
EU 629 485 13 43 14 54 62 47 58 38 24 19
Euro area 627 481 12 43 14 47 61 47 57 45 27 20
Belgium 691 585 08 67 17 37 40 51 20 32 23 15
Bulgaria 605 435 68 07 02 15 32 16 220 14 20 02
Czech Republic 783 622 08 14 12 18 56 42 60 03 02 02
Denmark 720 475 13 25 04 80 68 37 16 14 19 05
Germany 664 468 14 40 18 69 65 45 40 15 18 12
Estonia 741 433 06 09 07 22 50 20 136 01 03 05
Ireland 702 259 05 122 13 43 35 34 03 19 19 05
Greece 481 379 30 12 03 22 53 64 137 177 15 05
Spain 563 470 13 29 08 27 57 42 34 104 77 47
France 694 583 10 43 10 44 45 40 30 50 14 21
Croatia 680 537 43 21 06 24 76 28 84 09 22 06
Italy 562 455 17 33 08 41 61 42 89 100 26 20
Cyprus 579 464 01 12 12 16 66 66 125 108 14 01
Latvia 580 298 05 14 02 13 39 20 322 02 03 00
Lithuania 604 401 09 17 01 14 40 15 288 04 04 04
Luxembourg 793 754 02 76 08 19 71 11 00 01 18 00
Hungary 730 568 11 15 13 12 70 40 95 03 10 01
Malta 452 372 46 22 25 18 109 203 104 14 04 02
Netherlands 447 328 08 62 25 50 105 71 108 44 48 31
Austria 802 667 11 20 06 53 22 21 40 15 02 08
Poland 709 567 10 15 07 19 58 35 132 05 08 03
Portugal 711 642 05 15 05 17 30 21 35 55 40 66
Romania 747 521 40 13 05 14 40 22 96 09 09 04
Slovenia 753 591 46 12 02 16 46 60 13 22 25 05
Slovakia 775 413 10 05 07 07 36 63 94 02 01 00
Finland 617 374 04 27 07 49 69 35 162 02 20 08
Sweden 701 489 08 33 11 91 46 33 50 04 12 11
United Kingdom 524 444 15 77 19 122 77 64 23 29 22 28
Table 59 Import shares in EU trade (goods only - 2012)
European Economic Forecast Winter 2014
164
Table 60
2008 2009 2010 2011 2012 2013 2014 2015 2013 2014 2015
-2217 -587 -902 -1195 79 1127 1264 1326 1484 1780 1927
-3446 -1335 -1781 -2106 -725 295 415 478 777 1058 1212
231 732 670 452 1744 2655 2921 3056 2904 3222 3415
-297 357 119 -23 1265 2158 2423 2564 2357 2667 2865
-694 -355 -657 -982 -739 -867 -772 -684 -840 -864 -989
-8486 -5226 -6729 -7610 -7585 -7230 -7166 -7818 -7497 -7991 -8705
389 432 910 -203 -729 -946 -1127 -1047 -820 -865 -784
789 457 500 681 692 618 635 707 657 677 733
110 125 127 163 165 179 253 340 193 254 318
-9750 -5247 -6647 -8824 -8281 -7221 -6920 -7116 -7023 -7152 -7622
1951 1097 1641 2318 2297 2106 1998 2027 2051 2064 2114
1782 1110 1519 1986 1954 1808 1680 1732 1753 1746 1819
1970 -261 1053 2131 1975 1697 1438 1224 1753 1456 1185
2179 2337 1745 783 558 1418 1927 2339 998 1163 1175
2970 1976 1821 1563 2312 3013 3518 4148 3003 3466 4036
410 505 482 881 654 427 233 114 306 99 -31
665 224 546 692 402 237 139 -34 237 139 -34
7175 3901 5467 6805 5887 5885 5735 5670 5346 4920 4409
-2574 -1346 -1180 -2019 -2394 -1336 -1185 -1446 -1677 -2232 -3213
17022014
- Russia
Euro area
forecast
Norway
forecast
World merchandise trade balances (fob-fob in billions of US dollar 2008-15)
Euro area adjustedsup1
Switzerland
Winter 2014
sup1 See note 8 on concepts and sources
CIS
Japan
Latin America
Autumn 2013
Sub-Saharan Africa
MENA
Emerging and developing economies
Asia
Candidate Countries
World
Advanced economies
EU
- China
USA
EU adjustedsup1
Table 61
2008 2009 2010 2011 2012 2013 2014 2015 2013 2014 2015
-1661 -140 -89 286 1479 2918 3199 3294 2849 3151 3328
-4070 -1148 -911 -492 887 2306 2583 2678 2191 2475 2657
-988 121 402 518 2165 3385 3643 3766 3503 3885 4113
-2097 -301 07 77 1646 2846 3104 3231 2945 3317 3548
-565 -188 -510 -788 -521 -667 -545 -420 -607 -603 -709
-7775 -4534 -4976 -4033 -4220 -3917 -3657 -4308 -4302 -4773 -5492
1607 1470 2040 1198 605 327 252 487 583 922 1221
730 446 502 646 703 609 614 681 679 689 747
129 585 839 691 777 848 1007 1175 733 870 1014
-8090 -3254 -3178 -2886 -2449 -1006 -163 -53 -1295 -925 -1049
1060 414 703 1067 786 708 534 340 793 691 608
1023 487 710 994 775 428 212 32 512 369 300
1384 -1056 239 1286 1163 1141 939 759 1189 951 718
5229 4208 3805 2618 2519 3407 3736 4040 2749 2850 2798
4206 2433 2378 1361 1931 2446 2821 3296 2436 2770 3184
-352 -281 -584 -756 -994 -1005 -1245 -1390 -1124 -1378 -1535
-79 -322 -65 -102 -377 -246 -431 -423 -246 -431 -423
7242 2962 4098 4113 3097 4006 3534 3326 3362 2683 2166
-848 -292 920 1227 647 3000 3371 3273 2067 1758 1117
17022014
- Russia
Euro area
forecast
Norway
forecast
World current-account balances (in billions of US dollar 2008-15)
Euro area adjustedsup1
Switzerland
Winter 2014
sup1 See note 8 on concepts and sources
CIS
Japan
Latin America
Autumn 2013
Sub-Saharan Africa
MENA
Emerging and developing economies
Asia
Candidate Countries
World
Advanced economies
EU
- China
USA
EU adjustedsup1
Table 62 17022014
2008 2009 2010 2011 2012 2013 2014 2015 2013 2014 2015
216 -111 115 175 -27 19 -50 12 -03 -62 -07
88 -236 398 191 -143 -48 14 14 -47 20 25
77 -202 295 259 -118 -48 16 06 -55 10 10
30 -103 62 90 -58 07 02 14 24 27 20
95 -257 466 152 -158 -48 12 19 -42 26 35
381 -367 263 380 13 -29 -41 -40 -28 -25 -56
362 -369 288 383 08 -27 -43 -43 -27 -27 -58
141 -180 262 185 -94 -18 -16 13 -27 -18 11
339 -340 263 345 -04 -27 -37 -33 -28 -24 -46
986 623 802 1109 1118 1088 1041 996 1088 1058 997
671 446 605 797 870 819 765 732 820 780 734Brent (euro)
Autumn 2013
- Total excluding fuels
- of which
STIC
Classification
Fuel products
forecast
- Total including fuels
Agricultures non-food
- of which
Brent (usd)
Wood and pulp
Basic materials
forecast
Crude petroleum - price per barrel
Primary Commodities
Minerals and metals
- of which
Primary commodity prices (in US dollar percentage change on preceding year 2008-15)
Crude petroleum
Food
Winter 2014
Statistical Annex
165
Asia
aggregation is carried out on the basis of current exchange rates
FTE data as this is regarded as more representative of diverse patterns of working time
All countries in that region except the African MENA countries
These forecasts cover the principal macroeconomic
3 Tables 5 and 6 on domestic demand and final demand respectively
the capital stock and the difference between actual unemployment
reduced border controls and formalities and accordingly the
All countries in that region
MENA (Middle East and Northern Africa)
2 Data for 2013 2014 and 2015 are forecasts
Albania Bosnia-Herzegovina and Kosovo
In the calculation of EU and euro-area aggregates priority is given to
6 Employment data used in tables 23-29 and 32-33 are based on
reporting errors The creation of the internal market in 1993
output as estimated via a production function where the increase in
4 In Tables 17 and 18 the data are based on the national index for USA
Tunisia and the United Arab Emirates
Switzerland Australia and New Zealand
Potential candidates
EU28 (EA18 BG CZ DK HR LT HU PL RO SE and UK)
of payments statistics may arise due to methodological differences
absence of FTE data employment is based on numbers of persons
international environment
Note on concepts and sources
full-time-equivalents (FTEs) where available Currently Spain France
adjusted balances are Eurostat estimates for EU and ECB
For the USA and Japan the definitions are as in the SNA
now introduced chain-linking in their national accounts to measure
Candidate countries
EA18 (BE DE EE IE EL ES FR IT CY LV LU MT NL AT PT SI SK and FI)
unless otherwise stated The source for all tables is the European Commission
5 The potential output gap is calculated with reference to potential
the European Union as a whole the euro area and the
Latin America
and Japan and for EU Member States and aggregates prior to 1996
Advanced economies
Turkey the former Yugoslav Republic of Macedonia
the Asian MENA countries
Lebanon Libya Morocco Oman Qatar Saudi Arabia Syria
Sub-Saharan Africa
All countries in that region except Japan and
Algeria Bahrain Egypt Iran Iraq Israel Jordan Kuwait
Historical data for the Member States are based on the European
present data including inventories
and revision schedules
the development of economic aggregates in volume terms
observed in 2012
leading to an overestimation of the surplus For the past the
estimates for the euro area For the future they are ECFINs
scope and precision of intra-EU trade coverage Typically
and the NAWRU play a key role
the individual countries in the EU or the euro area However
forecasts based on the extrapolation of the discrepancies
intra-EU imports are underestimated compared to intra-EU exports
intra-EU or intra-euro-area balances are non-zero because of ECFIN) produces under its own responsibility short-term fully-
Tables 49 - 52 60 and 61 show also EU and euro-area adjusted
third countries should be identical to the sum of the balances of
Euro area
In the tables on world trade and international payments the
fledged economic forecasts in Winter Spring and Autumn
System of Accounting (ESA 1995) Most Member States have
aggregates for the Member States the candidate countries
1 The directorate general for economic and financial affairs (DG
Italy the Netherlands and Austria report FTE data In the
8 EU and euro-area data are aggregated using exchange rates
7 Source National Accounts (ESA95) Discrepancies with balance
EU candidate countries USA Japan Canada Norway
Iceland Montenegro and Serbia
European Union
9 Geographical zones are defined as follows
balances Theoretically balances of EU and euro area vis-agrave-vis
World GDP is aggregated using Purchasing Power Standards (PPS)
EUROPEAN ECONOMY SERIES
Previous titles in the European Economy series can be accessed and downloaded free of charge from the following address httpeceuropaeueconomy_financepublicationseuropean_economyindex_enhtm Alternatively hard copies may be ordered via the ldquoPrint-on-demandrdquo service offered by the EU Bookshop httpbookshopeuropaeu
2013
1-2013 bull European Economic Forecast ndash Winter 2013
2-2013 bull European Economic Forecast ndash Spring 2013
3-2013 bull Convergence Report 2013 on Latvia
4-2013 bull Public finances in EMU ndash 2013
5-2013 bull Tax reforms in EU Member States ndash 2013 - Tax policy challenges for
economic growth and fiscal sustainability
6-2013 bull Labour Market Developments in Europe ndash 2013
7-2013 bull European Economic Forecast - Autumn 2013
8-2013 bull Product Market Review 2013 - Financing the real economy
2014
1-2014 bull Energy Economic Developments in Europe
2-2014 bull European Economic Forecast ndash Winter 2014
HOW TO OBTAIN EU PUBLICATIONS Free publications bull one copy
via EU Bookshop (httpbookshopeuropaeu) bull more than one copy or postersmaps
from the European Unionrsquos representations (httpeceuropaeurepresent_enhtm) from the delegations in non-EU countries (httpeeaseuropaeudelegationsindex_enhtm) by contacting the Europe Direct service (httpeuropaeueuropedirectindex_enhtm) or calling 00 800 6 7 8 9 10 11 (freephone number from anywhere in the EU) () () The information given is free as are most calls (though some operators phone boxes or hotels may charge you)
Priced publications bull via EU Bookshop (httpbookshopeuropaeu) Priced subscriptions bull via one of the sales agents of the Publications Office of the European Union
(httppublicationseuropaeuothersagentsindex_enhtm)
KC-AR-14-002-EN-N