Embed Size (px)
Citation preview
Economic and Financial Affairs
Winter 2020 (Interim)
ISSN 2443-8014 (online)
European Economic Forecast
INSTITUTIONAL PAPER 121 | FEBRUARY 2020
EUROPEAN ECONOMY
European Economy Institutional Papers are important reports analysing the economic situation and economic developments prepared by the European Commission's Directorate-General for Economic and Financial Affairs, which serve to underpin economic policy-making by the European Commission, the Council of the European Union and the European Parliament. Views expressed in unofficial documents do not necessarily represent the views of the European Commission.
LEGAL NOTICE Neither the European Commission nor any person acting on behalf of the European Commission is responsible for the use that might be made of the information contained in this publication. This paper exists in English only and can be downloaded from https://ec.europa.eu/info/publications/economic-and-financial-affairs-publications_en. Luxembourg: Publications Office of the European Union, 2020 PDF ISBN 978-92-79-98868-4 ISSN 2443-8014 doi:10.2765/535190 KC-BC-19-028-EN-N
© European Union, 2020 Reuse is authorised provided the source is acknowledged. The reuse policy of European Commission documents is regulated by Decision 2011/833/EU (OJ L 330, 14.12.2011, p. 39). For any use or reproduction of material that is not under the EU copyright, permission must be sought directly from the copyright holders. CREDIT Cover photography: © iStock.com/IngaIvanova
European Commission Directorate-General for Economic and Financial Affairs
European Economic Forecast Winter 2020 (Interim)
EUROPEAN ECONOMY Institutional Paper 121

CONTENTS
iii
Offsetting forces confirm subdued growth 1
1. Euro area and EU outlook 2 1.1. The global recovery remains fragile 2 1.2. Financial markets stayed mainly focused on the bright spots 4 1.3. Domestic growth drivers keep the economy going 5 1.4. Job creation to continue but at slower pace 10 1.5. An uptick in inflation supported by higher services prices 10 1.6. Outlook still clouded by risks despite some rays of light 11
2. Prospects by Member States 13 2.1. Belgium 13 2.2. Germany 13 2.3. Estonia 14 2.4. Ireland 14 2.5. Greece 15 2.6. Spain 16 2.7. France 16 2.8. Italy 17 2.9. Cyprus 18 2.10. Latvia 18 2.11. Lithuania 19 2.12. Luxembourg 19 2.13. Malta 20 2.14. The Netherlands 21 2.15. Austria 21 2.16. Portugal 22 2.17. Slovenia 22 2.18. Slovakia 23 2.19. Finland 23 2.20. Bulgaria 24 2.21. Czechia 25 2.22. Denmark 25 2.23. Croatia 26 2.24. Hungary 26 2.25. Poland 27 2.26. Romania 27 2.27. Sweden 28 P.M.: United Kingdom 29
Statistical Annex 30
LIST OF TABLES 1. Overview - the winter 2020 interim forecast 1 1.1. International environment 2
LIST OF GRAPHS 1.1. Growth of global GDP and global PMIs 2 1.2. Oil price assumptions 4

iv
1.3. Central bank policy rate changes, G20 countries 4 1.4. German bund yield and sovereign spreads of selected Member States 5 1.5. Real GDP and its components, euro area 6 1.6. Gross value added by sector, euro area 7 1.7. Manufacturing gross value added, selected Member States 7 1.8. Economic Surprise Index, euro area 8 1.9. Real GDP, euro area 9 1.10. Survey-based employment expectations, euro area 10 1.11. Core inflation measures and wage growth, euro area 11 1.12. HICP, euro area 11
OFFSETTING FORCES CONFIRM SUBDUED GROWTH
Winter 2020 (Interim) forecast
1
The European economy continued to weather external headwinds in the second half of 2019 thanks to the strength of domestic drivers. Growth in the euro area turned out better than expected in the third quarter but disappointed at the end of the year. Leading indicators suggest that manufacturing output may stabilise in the months to come, although an upturn is not yet on the cards. However, with hints of a bottoming out in global trade flows, and as the dampening impact of domestic inventory adjustment fades, a trough may have been reached. With continued real income gains, a supportive policy mix and a construction sector buoyed by low borrowing costs, the European economy is well placed to navigate the challenging external environment, high trade policy uncertainty and dampening structural factors. This is, however, a fragile equilibrium, which could be easily derailed by unforeseen events.
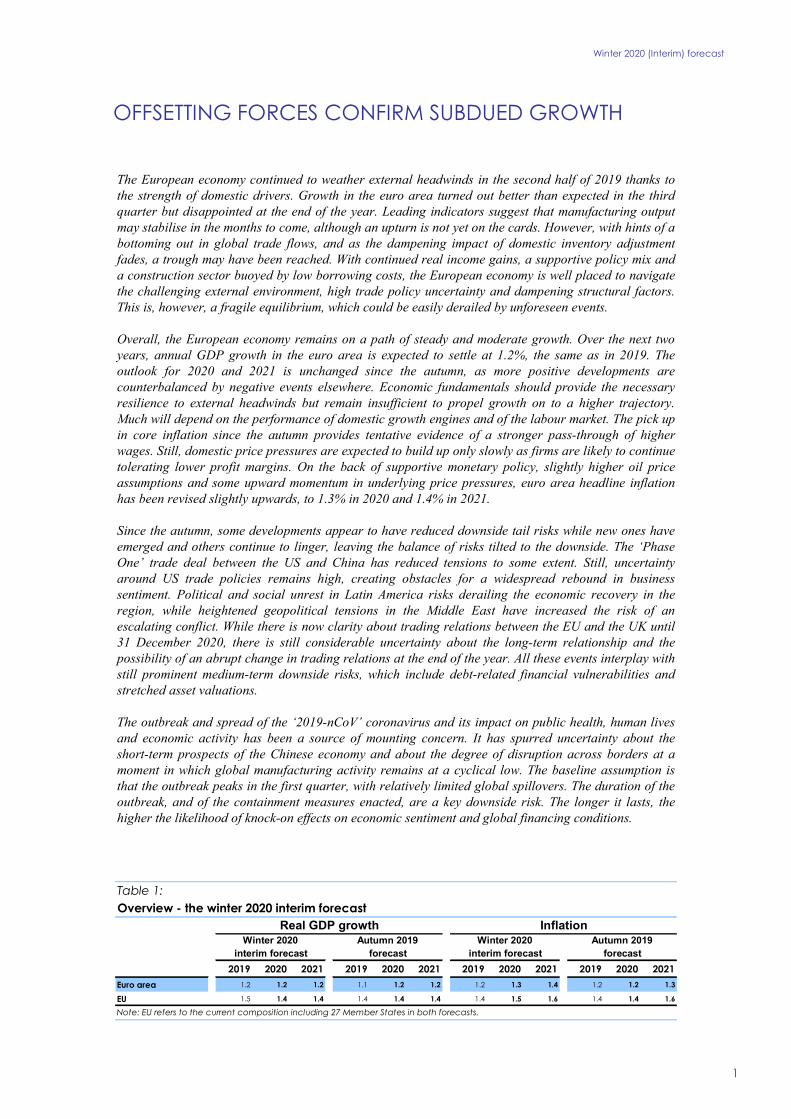
Overall, the European economy remains on a path of steady and moderate growth. Over the next two years, annual GDP growth in the euro area is expected to settle at 1.2%, the same as in 2019. The outlook for 2020 and 2021 is unchanged since the autumn, as more positive developments are counterbalanced by negative events elsewhere. Economic fundamentals should provide the necessary resilience to external headwinds but remain insufficient to propel growth on to a higher trajectory. Much will depend on the performance of domestic growth engines and of the labour market. The pick up in core inflation since the autumn provides tentative evidence of a stronger pass-through of higher wages. Still, domestic price pressures are expected to build up only slowly as firms are likely to continue tolerating lower profit margins. On the back of supportive monetary policy, slightly higher oil price assumptions and some upward momentum in underlying price pressures, euro area headline inflation has been revised slightly upwards, to 1.3% in 2020 and 1.4% in 2021.
Since the autumn, some developments appear to have reduced downside tail risks while new ones have emerged and others continue to linger, leaving the balance of risks tilted to the downside. The ‘Phase One’ trade deal between the US and China has reduced tensions to some extent. Still, uncertainty around US trade policies remains high, creating obstacles for a widespread rebound in business sentiment. Political and social unrest in Latin America risks derailing the economic recovery in the region, while heightened geopolitical tensions in the Middle East have increased the risk of an escalating conflict. While there is now clarity about trading relations between the EU and the UK until 31 December 2020, there is still considerable uncertainty about the long-term relationship and the possibility of an abrupt change in trading relations at the end of the year. All these events interplay with still prominent medium-term downside risks, which include debt-related financial vulnerabilities and stretched asset valuations.
The outbreak and spread of the ‘2019-nCoV’ coronavirus and its impact on public health, human lives and economic activity has been a source of mounting concern. It has spurred uncertainty about the short-term prospects of the Chinese economy and about the degree of disruption across borders at a moment in which global manufacturing activity remains at a cyclical low. The baseline assumption is that the outbreak peaks in the first quarter, with relatively limited global spillovers. The duration of the outbreak, and of the containment measures enacted, are a key downside risk. The longer it lasts, the higher the likelihood of knock-on effects on economic sentiment and global financing conditions.
2019 2020 2021 2019 2020 2021 2019 2020 2021 2019 2020 2021
Euro area 1.2 1.2 1.2 1.1 1.2 1.2 1.2 1.3 1.4 1.2 1.2 1.3
EU 1.5 1.4 1.4 1.4 1.4 1.4 1.4 1.5 1.6 1.4 1.4 1.6
Table 1:Overview - the winter 2020 interim forecast
Real GDP growth Inflation
interim forecast forecast interim forecast forecastWinter 2020 Autumn 2019 Winter 2020 Autumn 2019
Note: EU refers to the current composition including 27 Member States in both forecasts.
1. EURO AREA AND EU OUTLOOK
Winter 2020 (Interim) forecast
2
1.1. THE GLOBAL RECOVERY REMAINS FRAGILE
The global economy is holding up despite high policy uncertainty…
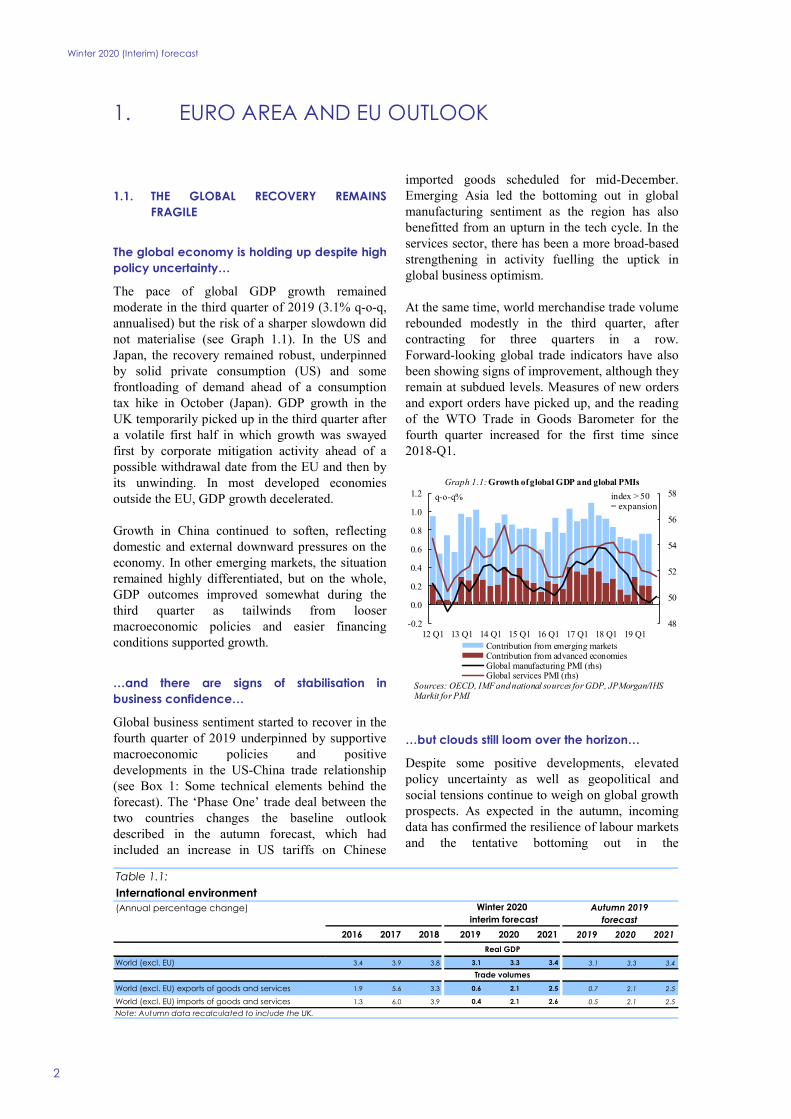
The pace of global GDP growth remained moderate in the third quarter of 2019 (3.1% q-o-q, annualised) but the risk of a sharper slowdown did not materialise (see Graph 1.1). In the US and Japan, the recovery remained robust, underpinned by solid private consumption (US) and some frontloading of demand ahead of a consumption tax hike in October (Japan). GDP growth in the UK temporarily picked up in the third quarter after a volatile first half in which growth was swayed first by corporate mitigation activity ahead of a possible withdrawal date from the EU and then by its unwinding. In most developed economies outside the EU, GDP growth decelerated.
Growth in China continued to soften, reflecting domestic and external downward pressures on the economy. In other emerging markets, the situation remained highly differentiated, but on the whole, GDP outcomes improved somewhat during the third quarter as tailwinds from looser macroeconomic policies and easier financing conditions supported growth.
…and there are signs of stabilisation in business confidence…
Global business sentiment started to recover in the fourth quarter of 2019 underpinned by supportive macroeconomic policies and positive developments in the US-China trade relationship (see Box 1: Some technical elements behind the forecast). The ‘Phase One’ trade deal between the two countries changes the baseline outlook described in the autumn forecast, which had included an increase in US tariffs on Chinese
imported goods scheduled for mid-December. Emerging Asia led the bottoming out in global manufacturing sentiment as the region has also benefitted from an upturn in the tech cycle. In the services sector, there has been a more broad-based strengthening in activity fuelling the uptick in global business optimism.
At the same time, world merchandise trade volume rebounded modestly in the third quarter, after contracting for three quarters in a row. Forward-looking global trade indicators have also been showing signs of improvement, although they remain at subdued levels. Measures of new orders and export orders have picked up, and the reading of the WTO Trade in Goods Barometer for the fourth quarter increased for the first time since 2018-Q1.
…but clouds still loom over the horizon…
Despite some positive developments, elevated policy uncertainty as well as geopolitical and social tensions continue to weigh on global growth prospects. As expected in the autumn, incoming data has confirmed the resilience of labour markets and the tentative bottoming out in the
48
50
52
54
56
58
-0.2
0.0
0.2
0.4
0.6
0.8
1.0
1.2
12 Q1 13 Q1 14 Q1 15 Q1 16 Q1 17 Q1 18 Q1 19 Q1
q-o-q%
Graph 1.1: Growth of global GDP and global PMIs
Contribution from emerging marketsContribution from advanced economiesGlobal manufacturing PMI (rhs)Global services PMI (rhs)
Sources: OECD, IMF and national sources for GDP, JPMorgan/IHS Markit for PMI
index > 50 = expansion
(Annual percentage change)
2016 2017 2018 2019 2020 2021 2019 2020 2021
World (excl. EU) 3.4 3.9 3.8 3.1 3.3 3.4 3.1 3.3 3.4
World (excl. EU) exports of goods and services 1.9 5.6 3.3 0.6 2.1 2.5 0.7 2.1 2.5
World (excl. EU) imports of goods and services 1.3 6.0 3.9 0.4 2.1 2.6 0.5 2.1 2.5
Note: Autumn data recalculated to include the UK.
Trade volumes
Real GDP
Table 1.1:International environment
Winter 2020 interim forecast forecast
Autumn 2019
Winter 2020 (Interim) forecast
3
manufacturing sector. Macroeconomic policies have also been supportive to global growth. The partial de-escalation of trade tensions between the US and China, by contrast, is a more positive development than expected in the autumn and slightly brightens the global growth outlook. The negative impact of the recent spate of social unrest and geopolitical tensions in Latin America, the Middle East and Asia, however, partly offsets this positive development.
Both the US and China are expected to benefit somewhat from the ‘Phase One’ trade agreement, but the pace of GDP growth in these countries is still projected to weaken over the forecast horizon. The US economy will likely slow down as the impact of previous fiscal stimulus measures is waning and an increasingly tight labour market puts limits on future growth. In China, the structural growth slowdown is set to continue as the economy is simultaneously facing unsustainably high domestic debt levels, the challenge of moving to a more consumption and innovation-based growth model, and the still challenging external environment.
In the very short term, US growth is expected to be dented by the substantial cuts in production at the aircraft maker Boeing. In China, the outbreak of coronavirus ‘2019-nCoV’ is affecting the services sector the most, particularly since it coincided with the New Year holiday. Any assessment of the economic impact of the outbreak is subject to large uncertainty. At the current juncture, it is assumed that China’s GDP will be hit mostly in the first quarter, with relatively limited global spillovers. As disruptions ease and both production and demand start catching up, a recovery is assumed to follow in the coming quarters. The macroeconomic impact is also assumed to be cushioned by additional policy stimulus.
In the UK, growth is expected to be broadly stable. Private consumption, supported by expansionary fiscal policy and real wage growth, should underpin growth in 2020, while continued uncertainty over the future relationship with the EU is set to weigh on investment and exports.
Across emerging markets (excluding China), prospects vary. Growth is expected to be solid in parts of Emerging Asia but the outlook in many countries in Latin America, Sub-Saharan Africa and the Middle East continues to be held back by
political tensions and a stalling momentum for structural reforms.
Overall, the outlook for global growth outside the EU is broadly unchanged since the autumn, with a pick-up in growth led by a moderate uptick in emerging market economies as a whole. Thus, the pace of global GDP growth (excluding the EU) is projected to gradually pick up from 3.1% in 2019 to 3.3% in 2020 and 3.4% 2021.
…weighing on global trade growth...
The persistent uncertainty surrounding US trade policies and the functioning of the WTO continues weighing on the outlook for global trade. While there is now clarity about trading relations between the EU and the UK until 31 December 2020, there is still considerable uncertainty about the long-term relationship and the possibility of an abrupt change in trading relations at the end of the year. These compound structural factors such as the slowdown and domestic rebalancing in China. Nevertheless, recent signs of bottoming out in global manufacturing alongside the positive effect of the US-China trade deal should support a gradual but subdued recovery in trade activity. As global growth picks up, and assuming no further escalation of trade tensions, world (excluding the EU) imports of goods and services are forecast to increase modestly by 2.1% and 2.6% in 2020 and 2021, respectively, after an estimated growth rate of just 0.4% last year.
…and keeping oil price pressures contained.
The escalation of geopolitical tensions between the US and Iran at the turn of the year caused volatility in oil markets and increased the risk premium in futures contracts. In addition, deeper OPEC+ (1) cuts for the first quarter of 2020 together with continuing supply disruptions in Venezuela and potentially looming disruptions in Libya and Iraq all contributed to concerns about tighter oil supply in the short term.
Still, the increase in Brent crude prices since the autumn has been very limited due to investors’ concerns about the negative impact of the coronavirus ‘2019-nCoV’ on the global economy.
(1) OPEC+ is a group of 24 oil-producing countries, consisting
of the 14 OPEC members and 10 other countries, including Russia and Mexico.
Winter 2020 (Interim) forecast
4
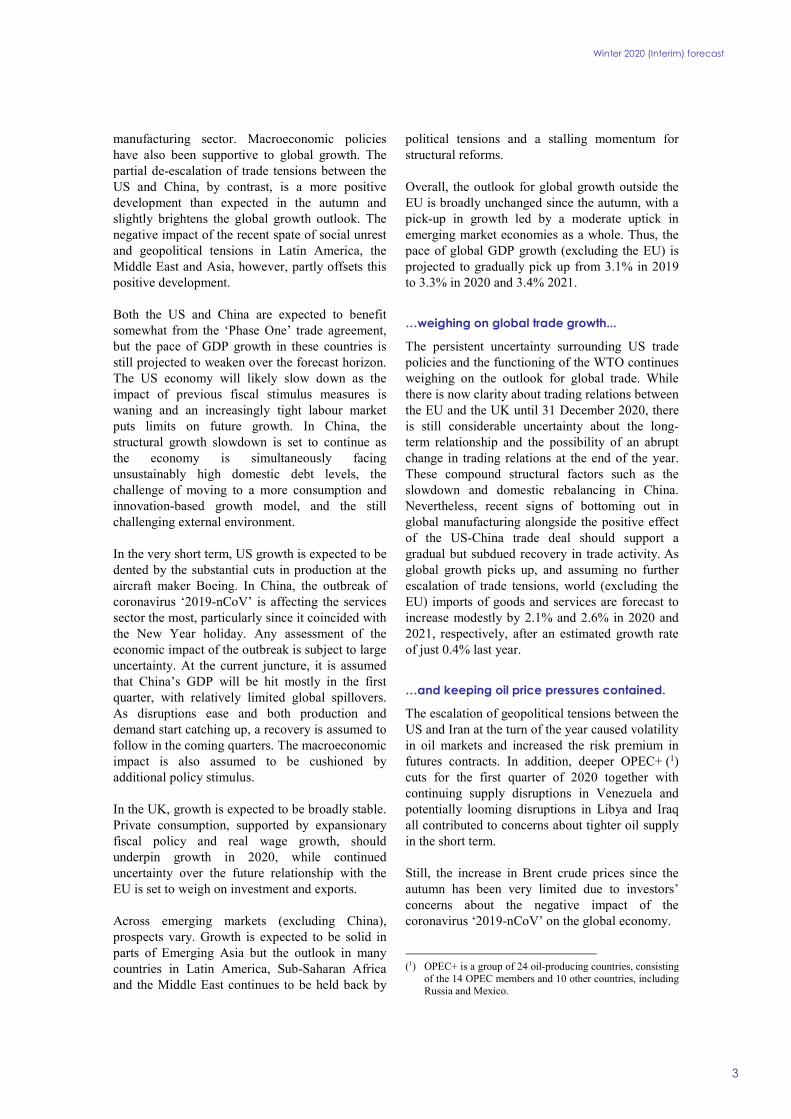
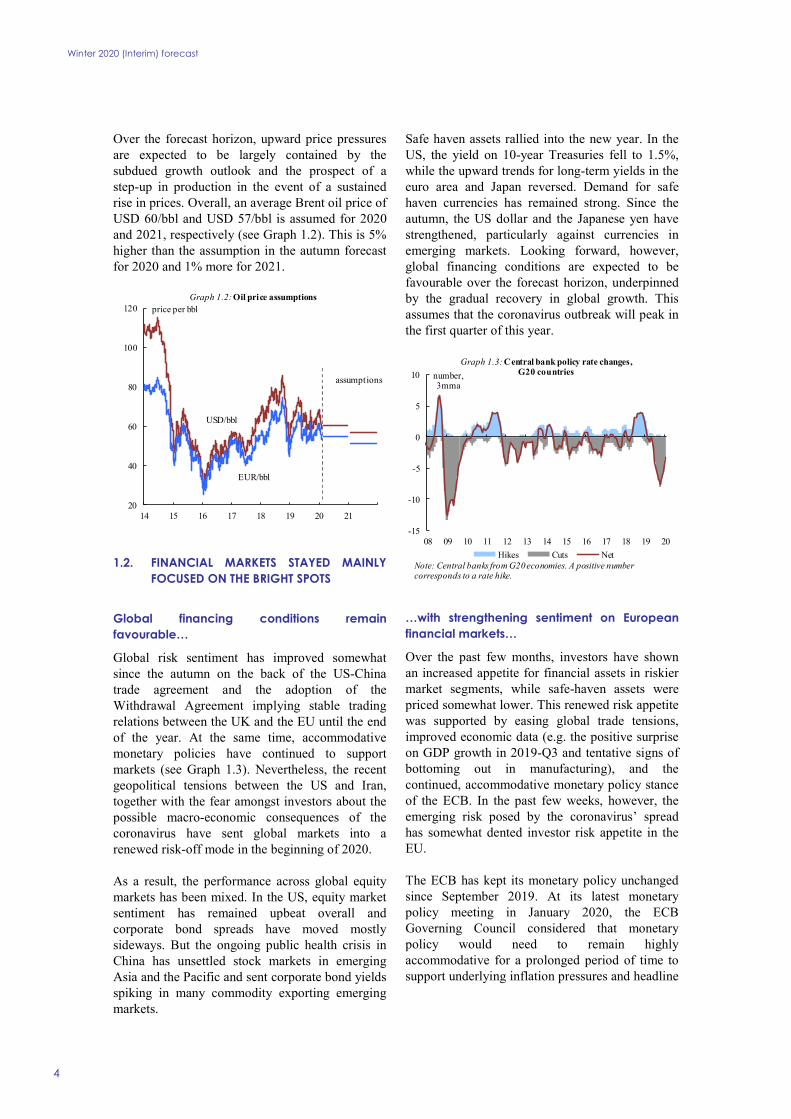
Over the forecast horizon, upward price pressures are expected to be largely contained by the subdued growth outlook and the prospect of a step-up in production in the event of a sustained rise in prices. Overall, an average Brent oil price of USD 60/bbl and USD 57/bbl is assumed for 2020 and 2021, respectively (see Graph 1.2). This is 5% higher than the assumption in the autumn forecast for 2020 and 1% more for 2021.
1.2. FINANCIAL MARKETS STAYED MAINLY FOCUSED ON THE BRIGHT SPOTS
Global financing conditions remain favourable…
Global risk sentiment has improved somewhat since the autumn on the back of the US-China trade agreement and the adoption of the Withdrawal Agreement implying stable trading relations between the UK and the EU until the end of the year. At the same time, accommodative monetary policies have continued to support markets (see Graph 1.3). Nevertheless, the recent geopolitical tensions between the US and Iran, together with the fear amongst investors about the possible macro-economic consequences of the coronavirus have sent global markets into a renewed risk-off mode in the beginning of 2020.
As a result, the performance across global equity markets has been mixed. In the US, equity market sentiment has remained upbeat overall and corporate bond spreads have moved mostly sideways. But the ongoing public health crisis in China has unsettled stock markets in emerging Asia and the Pacific and sent corporate bond yields spiking in many commodity exporting emerging markets.
Safe haven assets rallied into the new year. In the US, the yield on 10-year Treasuries fell to 1.5%, while the upward trends for long-term yields in the euro area and Japan reversed. Demand for safe haven currencies has remained strong. Since the autumn, the US dollar and the Japanese yen have strengthened, particularly against currencies in emerging markets. Looking forward, however, global financing conditions are expected to be favourable over the forecast horizon, underpinned by the gradual recovery in global growth. This assumes that the coronavirus outbreak will peak in the first quarter of this year.
…with strengthening sentiment on European financial markets…
Over the past few months, investors have shown an increased appetite for financial assets in riskier market segments, while safe-haven assets were priced somewhat lower. This renewed risk appetite was supported by easing global trade tensions, improved economic data (e.g. the positive surprise on GDP growth in 2019-Q3 and tentative signs of bottoming out in manufacturing), and the continued, accommodative monetary policy stance of the ECB. In the past few weeks, however, the emerging risk posed by the coronavirus’ spread has somewhat dented investor risk appetite in the EU.
The ECB has kept its monetary policy unchanged since September 2019. At its latest monetary policy meeting in January 2020, the ECB Governing Council considered that monetary policy would need to remain highly accommodative for a prolonged period of time to support underlying inflation pressures and headline
20
40
60
80
100
120
14 15 16 17 18 19 20 21
price per bblGraph 1.2: Oil price assumptions
USD/bbl
EUR/bbl
assumptions
-15
-10
-5
0
5
10
08 09 10 11 12 13 14 15 16 17 18 19 20
number, 3mma
Graph 1.3: Central bank policy rate changes,G20 countries
Hikes Cuts NetNote: Central banks from G20 economies. A positive number corresponds to a rate hike.
Winter 2020 (Interim) forecast
5
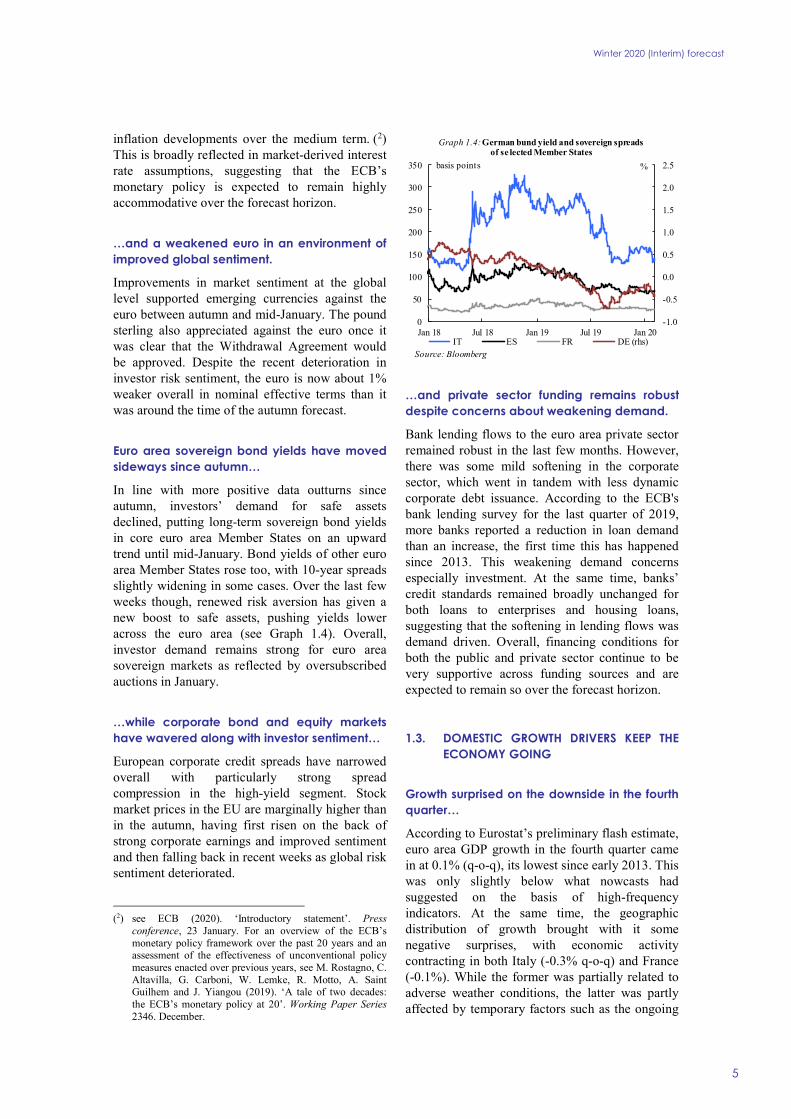
inflation developments over the medium term. (2) This is broadly reflected in market-derived interest rate assumptions, suggesting that the ECB’s monetary policy is expected to remain highly accommodative over the forecast horizon.
…and a weakened euro in an environment of improved global sentiment.
Improvements in market sentiment at the global level supported emerging currencies against the euro between autumn and mid-January. The pound sterling also appreciated against the euro once it was clear that the Withdrawal Agreement would be approved. Despite the recent deterioration in investor risk sentiment, the euro is now about 1% weaker overall in nominal effective terms than it was around the time of the autumn forecast.
Euro area sovereign bond yields have moved sideways since autumn…
In line with more positive data outturns since autumn, investors’ demand for safe assets declined, putting long-term sovereign bond yields in core euro area Member States on an upward trend until mid-January. Bond yields of other euro area Member States rose too, with 10-year spreads slightly widening in some cases. Over the last few weeks though, renewed risk aversion has given a new boost to safe assets, pushing yields lower across the euro area (see Graph 1.4). Overall, investor demand remains strong for euro area sovereign markets as reflected by oversubscribed auctions in January.
…while corporate bond and equity markets have wavered along with investor sentiment…
European corporate credit spreads have narrowed overall with particularly strong spread compression in the high-yield segment. Stock market prices in the EU are marginally higher than in the autumn, having first risen on the back of strong corporate earnings and improved sentiment and then falling back in recent weeks as global risk sentiment deteriorated.
(2) see ECB (2020). ‘Introductory statement’. Press
conference, 23 January. For an overview of the ECB’s monetary policy framework over the past 20 years and an assessment of the effectiveness of unconventional policy measures enacted over previous years, see M. Rostagno, C. Altavilla, G. Carboni, W. Lemke, R. Motto, A. Saint Guilhem and J. Yiangou (2019). ‘A tale of two decades: the ECB’s monetary policy at 20’. Working Paper Series 2346. December.
…and private sector funding remains robust despite concerns about weakening demand.
Bank lending flows to the euro area private sector remained robust in the last few months. However, there was some mild softening in the corporate sector, which went in tandem with less dynamic corporate debt issuance. According to the ECB's bank lending survey for the last quarter of 2019, more banks reported a reduction in loan demand than an increase, the first time this has happened since 2013. This weakening demand concerns especially investment. At the same time, banks’ credit standards remained broadly unchanged for both loans to enterprises and housing loans, suggesting that the softening in lending flows was demand driven. Overall, financing conditions for both the public and private sector continue to be very supportive across funding sources and are expected to remain so over the forecast horizon.
1.3. DOMESTIC GROWTH DRIVERS KEEP THE ECONOMY GOING
Growth surprised on the downside in the fourth quarter…
According to Eurostat’s preliminary flash estimate, euro area GDP growth in the fourth quarter came in at 0.1% (q-o-q), its lowest since early 2013. This was only slightly below what nowcasts had suggested on the basis of high-frequency indicators. At the same time, the geographic distribution of growth brought with it some negative surprises, with economic activity contracting in both Italy (-0.3% q-o-q) and France (-0.1%). While the former was partially related to adverse weather conditions, the latter was partly affected by temporary factors such as the ongoing
-1.0
-0.5
0.0
0.5
1.0
1.5
2.0
2.5
0
50
100
150
200
250
300
350
Jan 18 Jul 18 Jan 19 Jul 19 Jan 20IT ES FR DE (rhs)
basis points
Graph 1.4: German bund yield and sovereign spreads of se lected Member States
%
Source: Bloomberg
Winter 2020 (Interim) forecast
6
strikes, especially in the transport sector, and a refinery maintenance which led to a sharp adjustment in inventories.
The negative surprise at the turn of the year comes in contrast to the higher-than-forecast outturn in the third quarter, when growth exceeded the Commission’s autumn forecast by 0.2 pps. This was mainly related to a stronger-than-expected growth rebound in Germany, which returned to positive rates and thereby avoided entering a (technical) recession. Economic activity in the euro area was mostly driven by consumer spending, partially reflecting the lagged impact of enacted government measures on household’s income.
The economic expansion in the euro area is now the longest on record since the introduction of the euro but its pace has become rather subdued. At an average growth rate of about 0.2% (q-o-q) in 2019, growth was about 0.5 pps. below the average recorded in 2017 and roughly at the same level as in 2018. In all, Eurostat estimates that GDP growth in 2019 fell to 1.2% in the euro area, down from 1.9% in 2018. This is in line with what was expected in the autumn.
Economic activity remains dampened by the still high level of uncertainty linked to trade policies, as well as by cyclical and structural factors. (3) Still, some cyclical headwinds are expected to diminish. Global growth is set to pick up gradually and the Asian tech cycle to turn for the better. By contrast, some of the structural drags are set to have a longer lasting effect. These include the economic transition in China, population ageing as well as the shifts in car demand and car production related to new environmental standards, technological advances and regulatory measures.
…but domestic demand remained robust…
The GDP breakdown for the first three quarters of 2019 confirms the key role of domestic demand, in particular of private consumption, as the driving force of growth. During this period, real GDP was 1.3% higher than in the first three quarters of 2018. As in previous years, however, euro area aggregates were significantly affected by the activity of multinational companies in Ireland, (4) (3) See European Commission (DG ECFIN) (2019). ‘European
Economic Forecast: Autumn 2019’. Institutional Paper 115, pp. 12-19.
(4) These activities of multinational firms include the relocation of intellectual property and contract
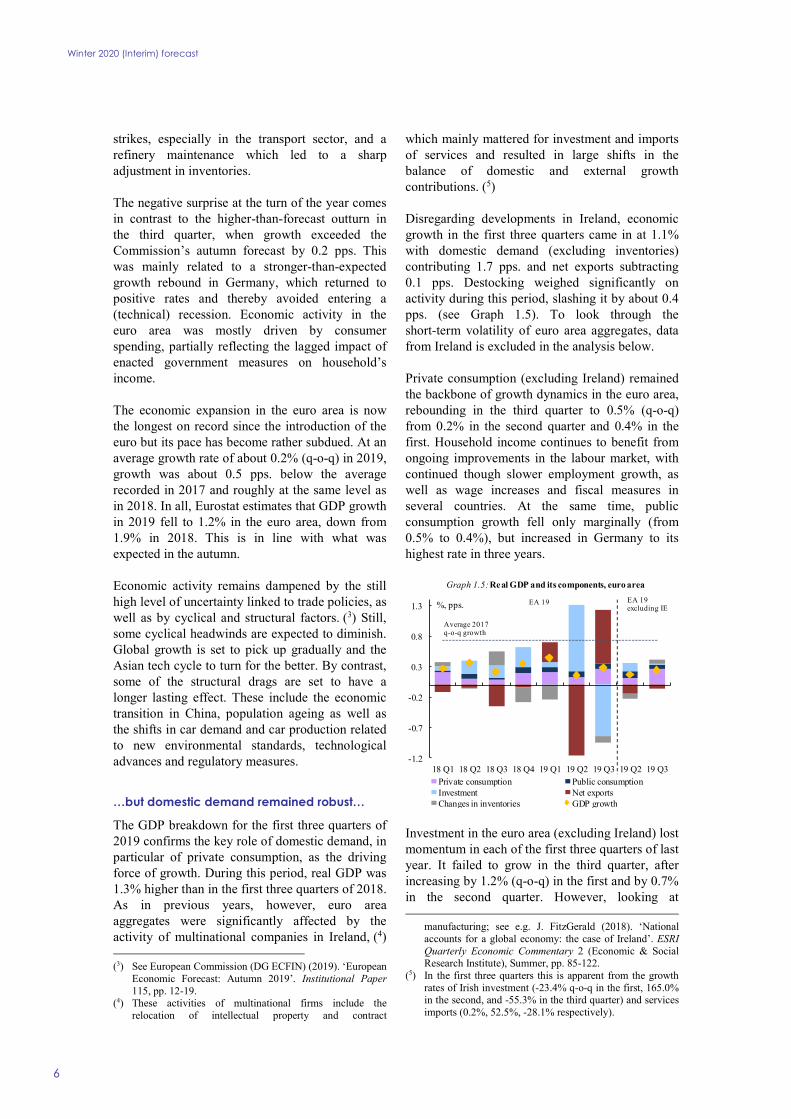
which mainly mattered for investment and imports of services and resulted in large shifts in the balance of domestic and external growth contributions. (5)
Disregarding developments in Ireland, economic growth in the first three quarters came in at 1.1% with domestic demand (excluding inventories) contributing 1.7 pps. and net exports subtracting 0.1 pps. Destocking weighed significantly on activity during this period, slashing it by about 0.4 pps. (see Graph 1.5). To look through the short-term volatility of euro area aggregates, data from Ireland is excluded in the analysis below.
Private consumption (excluding Ireland) remained the backbone of growth dynamics in the euro area, rebounding in the third quarter to 0.5% (q-o-q) from 0.2% in the second quarter and 0.4% in the first. Household income continues to benefit from ongoing improvements in the labour market, with continued though slower employment growth, as well as wage increases and fiscal measures in several countries. At the same time, public consumption growth fell only marginally (from 0.5% to 0.4%), but increased in Germany to its highest rate in three years.
Investment in the euro area (excluding Ireland) lost momentum in each of the first three quarters of last year. It failed to grow in the third quarter, after increasing by 1.2% (q-o-q) in the first and by 0.7% in the second quarter. However, looking at
manufacturing; see e.g. J. FitzGerald (2018). ‘National accounts for a global economy: the case of Ireland’. ESRI Quarterly Economic Commentary 2 (Economic & Social Research Institute), Summer, pp. 85-122.
(5) In the first three quarters this is apparent from the growth rates of Irish investment (-23.4% q-o-q in the first, 165.0% in the second, and -55.3% in the third quarter) and services imports (0.2%, 52.5%, -28.1% respectively).
-1.2
-0.7
-0.2
0.3
0.8
1.3
18 Q1 18 Q2 18 Q3 18 Q4 19 Q1 19 Q2 19 Q3 19 Q2 19 Q3
Graph 1.5: Real GDP and its components, euro area
Private consumption Public consumptionInvestment Net exportsChanges in inventories GDP growth
EA 19 excluding IE
EA 19
Average 2017 q-o-q growth
%, pps.
Winter 2020 (Interim) forecast
7
investment growth on a year-on-year basis, in the first three quarters, investment growth remained well above GDP growth at 3.2%. The picture is much more diverse across investment types. While construction investment held up in the third quarter (0.8% q-o-q), non-construction investment fell (-0.8%). The recently observed decline in equipment investment was in line with the fall in profit margins over recent quarters, the downturn in manufacturing activity, and uncertainty affecting trade.
Exports of goods and services in the euro area (excluding Ireland) increased by 2.0% (y-o-y) in the first three quarters of 2019. The quarterly profile was strongly affected by trade with the UK, spurred by UK companies stockpiling in anticipation of the Brexit deadlines in March and October 2019. This pushed export growth to 0.9% (q-o-q) in the first quarter, followed by a payback in the second quarter (-0.3%) and a rebound in the third quarter (0.6%). By contrast, the growth path of imports for goods and services in the euro area (without Ireland) was steadier, with quarterly growth rates of between 0.4% and 0.6% (0.5% q-o-q in the third quarter). Accordingly, the growth contribution of net exports mainly reflected swings in export growth. The contribution of net exports fell from +0.2 pps. in the first quarter to -0.2 pps. in the second quarter before turning neutral in the third.
…while sectoral divergences were still in place.
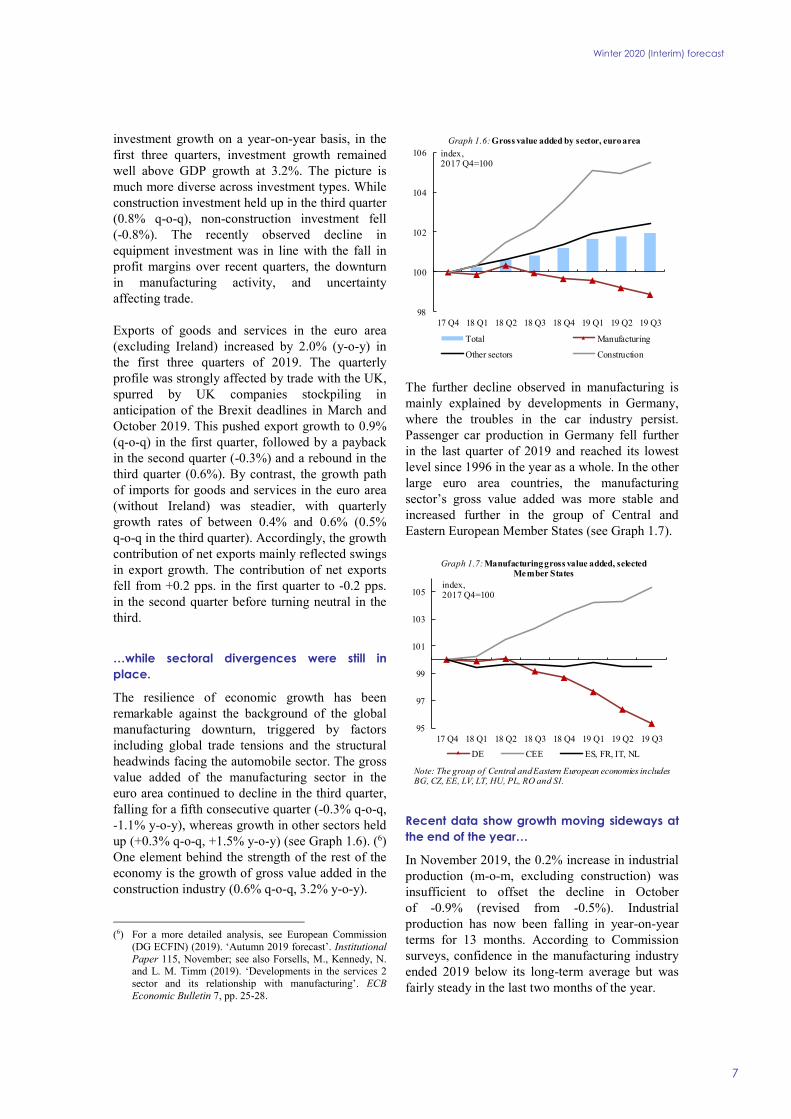
The resilience of economic growth has been remarkable against the background of the global manufacturing downturn, triggered by factors including global trade tensions and the structural headwinds facing the automobile sector. The gross value added of the manufacturing sector in the euro area continued to decline in the third quarter, falling for a fifth consecutive quarter (-0.3% q-o-q, -1.1% y-o-y), whereas growth in other sectors held up (+0.3% q-o-q, +1.5% y-o-y) (see Graph 1.6). (6) One element behind the strength of the rest of the economy is the growth of gross value added in the construction industry (0.6% q-o-q, 3.2% y-o-y).
(6) For a more detailed analysis, see European Commission
(DG ECFIN) (2019). ‘Autumn 2019 forecast’. Institutional Paper 115, November; see also Forsells, M., Kennedy, N. and L. M. Timm (2019). ‘Developments in the services 2 sector and its relationship with manufacturing’. ECB Economic Bulletin 7, pp. 25-28.
The further decline observed in manufacturing is mainly explained by developments in Germany, where the troubles in the car industry persist. Passenger car production in Germany fell further in the last quarter of 2019 and reached its lowest level since 1996 in the year as a whole. In the other large euro area countries, the manufacturing sector’s gross value added was more stable and increased further in the group of Central and Eastern European Member States (see Graph 1.7).
Recent data show growth moving sideways at the end of the year…
In November 2019, the 0.2% increase in industrial production (m-o-m, excluding construction) was insufficient to offset the decline in October of -0.9% (revised from -0.5%). Industrial production has now been falling in year-on-year terms for 13 months. According to Commission surveys, confidence in the manufacturing industry ended 2019 below its long-term average but was fairly steady in the last two months of the year.
98
100
102
104
106
17 Q4 18 Q1 18 Q2 18 Q3 18 Q4 19 Q1 19 Q2 19 Q3
Graph 1.6: Gross value added by sector, euro area
Total Manufacturing
Other sectors Construction
index,2017 Q4=100
95
97
99
101
103
105
17 Q4 18 Q1 18 Q2 18 Q3 18 Q4 19 Q1 19 Q2 19 Q3
Graph 1.7: Manufacturing gross value added, selected Member States
DE CEE ES, FR, IT, NL
index, 2017 Q4=100
Note: The group of Central and Eastern European economies includes BG, CZ, EE, LV, LT, HU, PL, RO and SI.
Winter 2020 (Interim) forecast
8
Other sectors of the economy have managed to remain largely insulated from the manufacturing sector’s malaise. (7) The Commission’s services confidence indicator rose strongly in December to its highest value since May. It is now back above its long-term average after a four-month reprieve. Retail trade volume moved up in November, more than offsetting the falls of the last two months and is on track to match its previous quarterly growth. The Commission’s construction confidence indicator remained broadly stable in the fourth quarter after moderating in the previous one.
…while leading indicators signal a small uptick in growth momentum.
The near-term prospects for the euro area economy have not changed significantly since the autumn. The latest survey readings have been broadly consistent with growth remaining at low speed. Although some indications can be found that the downturn in manufacturing is bottoming out, an uplift has yet to emerge.
Forward-looking indicators confirm the expected slight pickup in growth following a stepdown in momentum in the last quarter. The Economic Sentiment Indicator (ESI) moved up to a five-month high of 102.8 in January, driven by a marked increase in confidence in industry and construction, while confidence in the service sector remained virtually unchanged. Also, Markit's Purchasing Managers Flash Composite Output Index (PMI) remained at 50.9 in January 2020 after reaching a four-month high in December 2019.
In the manufacturing sector, the January 2020 PMI jumped to a nine-month high but remained consistent with a contraction in activity. The new orders component of the PMI continues moving ahead of current output and signals a stabilisation of output in the coming months. Importantly, the capacity utilisation rate in the German manufacturing sector ticked up slightly in 2020-Q1 (Commission survey conducted in January) after declining continuously for almost two years. It moved in tandem with a strong recovery in production expectations in the manufacturing (7) According to a recent study, there have been negative
spillovers from both global factors and from manufacturing to services, but they have been overall limited and more significant for the former rather than the latter. See ECB (2019). ‘Cross-country and cross-sector spillovers in the euro area’. Eurosystem staff macroeconomic projections, Box 3, December.
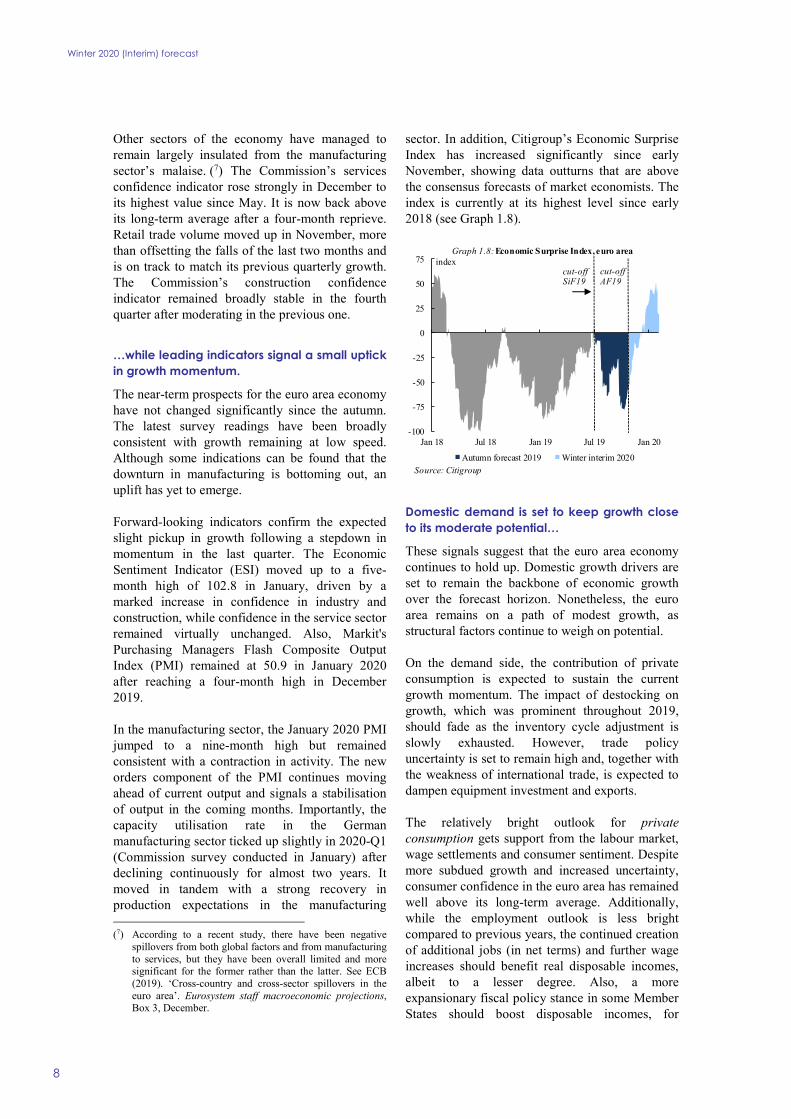
sector. In addition, Citigroup’s Economic Surprise Index has increased significantly since early November, showing data outturns that are above the consensus forecasts of market economists. The index is currently at its highest level since early 2018 (see Graph 1.8).
Domestic demand is set to keep growth close to its moderate potential…
These signals suggest that the euro area economy continues to hold up. Domestic growth drivers are set to remain the backbone of economic growth over the forecast horizon. Nonetheless, the euro area remains on a path of modest growth, as structural factors continue to weigh on potential.
On the demand side, the contribution of private consumption is expected to sustain the current growth momentum. The impact of destocking on growth, which was prominent throughout 2019, should fade as the inventory cycle adjustment is slowly exhausted. However, trade policy uncertainty is set to remain high and, together with the weakness of international trade, is expected to dampen equipment investment and exports.
The relatively bright outlook for private consumption gets support from the labour market, wage settlements and consumer sentiment. Despite more subdued growth and increased uncertainty, consumer confidence in the euro area has remained well above its long-term average. Additionally, while the employment outlook is less bright compared to previous years, the continued creation of additional jobs (in net terms) and further wage increases should benefit real disposable incomes, albeit to a lesser degree. Also, a more expansionary fiscal policy stance in some Member States should boost disposable incomes, for
-100
-75
-50
-25
0
25
50
75
Jan 18 Jul 18 Jan 19 Jul 19 Jan 20
indexGraph 1.8: Economic Surprise Index, euro area
Autumn forecast 2019 Winter interim 2020Source: Citigroup
cut-off AF19
cut-off SiF19
Winter 2020 (Interim) forecast
9
example in Germany, where a part of income taxation (the ‘solidarity surcharge’) is planned to be abolished in 2021 for the majority of taxpayers.
Investment is expected to continue growing but at a very moderate pace. Equipment investment is set to remain weak, in line with subdued demand expectations both at home and abroad. It may also be dampened by the decline in capacity utilisation in manufacturing throughout 2019, which reduced the stringency of supply constraints to some degree. Whether low financing costs can still spur investment after having been in place for several years, is far from certain. Other factors such as uncertainty about trade tensions and regulatory frameworks and changes to cross-border supply chains may have gained importance.
Housing construction investment is expected to remain dynamic, as past increases in disposable incomes and favourable financing conditions have positively affected the affordability of house construction (and purchases). This outlook finds support in well-filled order books. However, in several countries, construction investment is likely to run into capacity constraints and to be impacted by the continued rally in house prices. These come on top of regulatory measures and demographic factors that could dampen demand.
Public investment is expected to increase significantly in a number of countries, involving transport and digital infrastructure investment. A number of investment support schemes (e.g. the European Fund for Strategic Investments, and InvestEU) exert a positive impact on investment decisions. By contrast, the impact of measures considered or announced in the context of the Green Deal is expected to be limited over the next two years, because planning phases, funding, and implementation will take time. (8)
Relatively weak foreign demand combined with elevated economic policy uncertainty do not bode well for the trade outlook in the EU. Accordingly, exports of goods and services are not expected to bounce back and should remain subdued. This is also supported by the assessment of export order books in the Commission’s manufacturing survey, which has plateaued in recent months after a prolonged cooling down period. Moreover, export (8) For an analysis of the impact of measures against climate
change on economic growth and inflation, see e.g. Deutsche Bundesbank (2019). ‘The impact of the Climate Package on economic growth and inflation’. Monthly Report 71:12, pp. 19-22.
expectations among manufacturers ticked up in the first quarter of this year after falling for seven consecutive quarters. Assuming no further escalation in trade tensions and that global demand will gradually become more supportive, euro area export growth is expected to pick up somewhat in 2020.
At the same time, more long term, structural factors are expected to continue weighing on growth, such as population ageing, shifts in regulations, supply chains and technologies in the automotive industry, as well as the trend decline in productivity.
…with the economy locked in a subdued growth path.
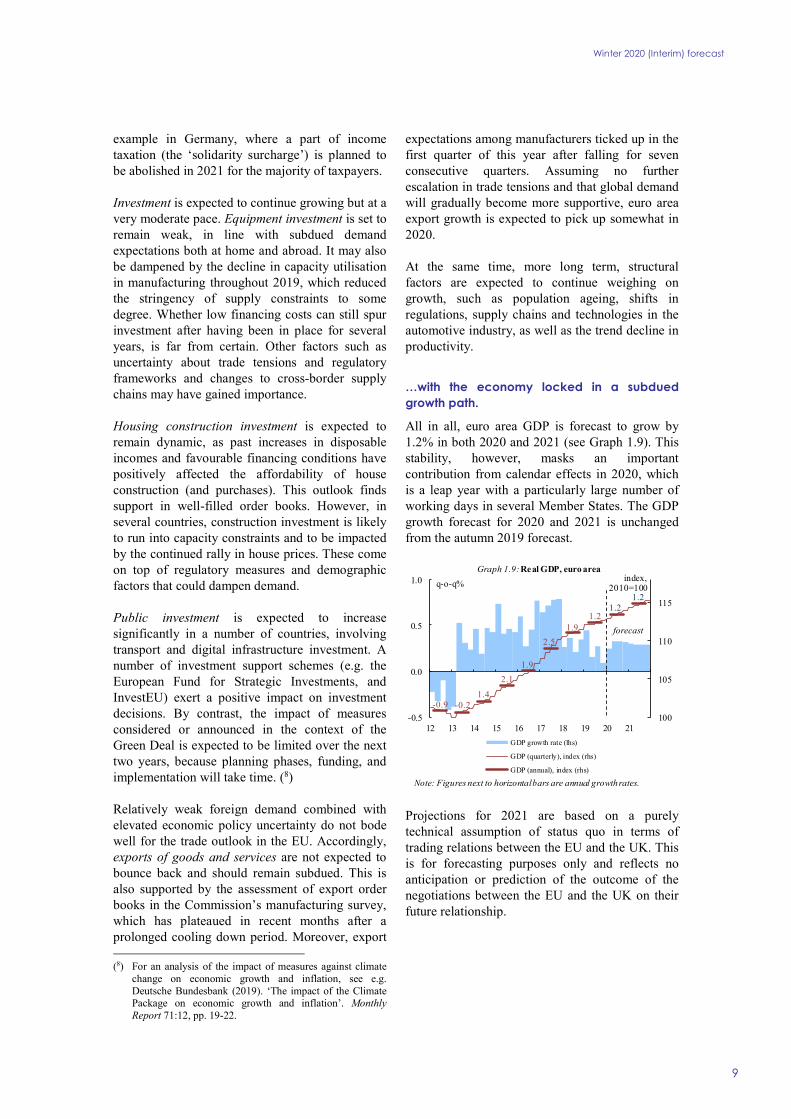
All in all, euro area GDP is forecast to grow by 1.2% in both 2020 and 2021 (see Graph 1.9). This stability, however, masks an important contribution from calendar effects in 2020, which is a leap year with a particularly large number of working days in several Member States. The GDP growth forecast for 2020 and 2021 is unchanged from the autumn 2019 forecast.
Projections for 2021 are based on a purely technical assumption of status quo in terms of trading relations between the EU and the UK. This is for forecasting purposes only and reflects no anticipation or prediction of the outcome of the negotiations between the EU and the UK on their future relationship.
100
105
110
115
-0.5
0.0
0.5
1.0
12 13 14 15 16 17 18 19 20 21
Graph 1.9: Real GDP, euro area
GDP growth rate (lhs)
GDP (quarterly), index (rhs)
GDP (annual), index (rhs)
forecast
q-o-q%index,
2010=100
-0.9 -0.2
2.1
1.9
1.4
2.5
1.91.2
1.21.2
Note: Figures next to horizontal bars are annual growth rates.
Winter 2020 (Interim) forecast
10
1.4. JOB CREATION TO CONTINUE BUT AT SLOWER PACE
In 2019, the euro area labour market proved to be fairly resilient given the background of relatively moderate economic growth. The unemployment rate has stayed close to or at 7.4% in recent months, which is the lowest rate recorded since May 2008. In December 2019, the number of unemployed persons was 4.6% lower than one year before and 36.8% below the April 2013 peak.
Employment continued growing in 2019, albeit at a slower pace than in previous years. In the third quarter, total employment in the euro area was just 0.1% higher than in the second quarter, both in terms of hours worked and in terms of the number of persons. Also, the level of employment in the euro area in terms of persons was 1.0% higher than one year before and 3.9% above the pre-crisis peak recorded in the first quarter of 2008. (9)
The labour-market effects of the economic slowdown remain limited. The decline in manufacturing activity, however, is evident in the slower pace of employment growth in this sector compared to the rest of the economy. Moreover, there has been a decline in the share of manufacturing companies considering labour as a limiting factor in their production. Still, in the face of remaining labour shortages in several Member States, companies appear to have largely refrained from lowering headcounts in response to shrinking manufacturing output.
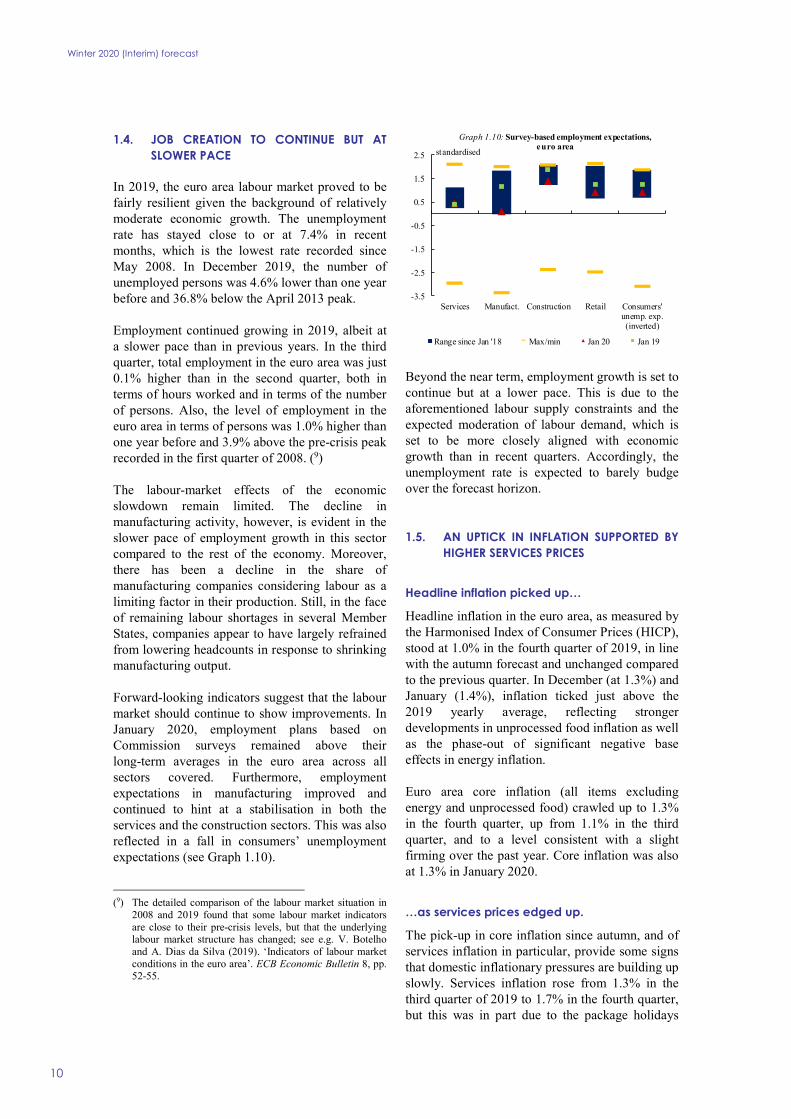
Forward-looking indicators suggest that the labour market should continue to show improvements. In January 2020, employment plans based on Commission surveys remained above their long-term averages in the euro area across all sectors covered. Furthermore, employment expectations in manufacturing improved and continued to hint at a stabilisation in both the services and the construction sectors. This was also reflected in a fall in consumers’ unemployment expectations (see Graph 1.10).
(9) The detailed comparison of the labour market situation in
2008 and 2019 found that some labour market indicators are close to their pre-crisis levels, but that the underlying labour market structure has changed; see e.g. V. Botelho and A. Dias da Silva (2019). ‘Indicators of labour market conditions in the euro area’. ECB Economic Bulletin 8, pp. 52-55.
Beyond the near term, employment growth is set to continue but at a lower pace. This is due to the aforementioned labour supply constraints and the expected moderation of labour demand, which is set to be more closely aligned with economic growth than in recent quarters. Accordingly, the unemployment rate is expected to barely budge over the forecast horizon.
1.5. AN UPTICK IN INFLATION SUPPORTED BY HIGHER SERVICES PRICES
Headline inflation picked up…
Headline inflation in the euro area, as measured by the Harmonised Index of Consumer Prices (HICP), stood at 1.0% in the fourth quarter of 2019, in line with the autumn forecast and unchanged compared to the previous quarter. In December (at 1.3%) and January (1.4%), inflation ticked just above the 2019 yearly average, reflecting stronger developments in unprocessed food inflation as well as the phase-out of significant negative base effects in energy inflation.
Euro area core inflation (all items excluding energy and unprocessed food) crawled up to 1.3% in the fourth quarter, up from 1.1% in the third quarter, and to a level consistent with a slight firming over the past year. Core inflation was also at 1.3% in January 2020.
…as services prices edged up.
The pick-up in core inflation since autumn, and of services inflation in particular, provide some signs that domestic inflationary pressures are building up slowly. Services inflation rose from 1.3% in the third quarter of 2019 to 1.7% in the fourth quarter, but this was in part due to the package holidays
-3.5
-2.5
-1.5
-0.5
0.5
1.5
2.5
Services Manufact. Construction Retail Consumers'unemp. exp.(inverted)
standardised
Graph 1.10: Survey-based employment expectations,euro area
Range since Jan '18 Max/min Jan 20 Jan 19
Winter 2020 (Interim) forecast
11
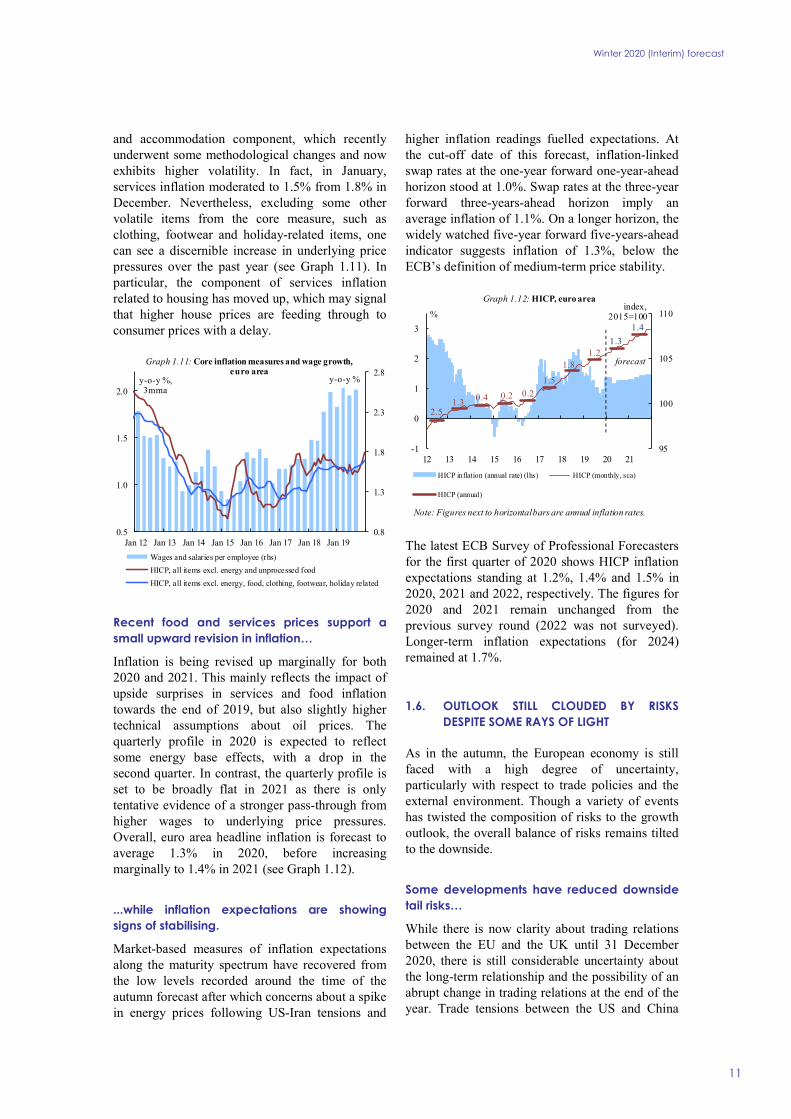
and accommodation component, which recently underwent some methodological changes and now exhibits higher volatility. In fact, in January, services inflation moderated to 1.5% from 1.8% in December. Nevertheless, excluding some other volatile items from the core measure, such as clothing, footwear and holiday-related items, one can see a discernible increase in underlying price pressures over the past year (see Graph 1.11). In particular, the component of services inflation related to housing has moved up, which may signal that higher house prices are feeding through to consumer prices with a delay.
Recent food and services prices support a small upward revision in inflation…
Inflation is being revised up marginally for both 2020 and 2021. This mainly reflects the impact of upside surprises in services and food inflation towards the end of 2019, but also slightly higher technical assumptions about oil prices. The quarterly profile in 2020 is expected to reflect some energy base effects, with a drop in the second quarter. In contrast, the quarterly profile is set to be broadly flat in 2021 as there is only tentative evidence of a stronger pass-through from higher wages to underlying price pressures. Overall, euro area headline inflation is forecast to average 1.3% in 2020, before increasing marginally to 1.4% in 2021 (see Graph 1.12).
...while inflation expectations are showing signs of stabilising.
Market-based measures of inflation expectations along the maturity spectrum have recovered from the low levels recorded around the time of the autumn forecast after which concerns about a spike in energy prices following US-Iran tensions and
higher inflation readings fuelled expectations. At the cut-off date of this forecast, inflation-linked swap rates at the one-year forward one-year-ahead horizon stood at 1.0%. Swap rates at the three-year forward three-years-ahead horizon imply an average inflation of 1.1%. On a longer horizon, the widely watched five-year forward five-years-ahead indicator suggests inflation of 1.3%, below the ECB’s definition of medium-term price stability.
The latest ECB Survey of Professional Forecasters for the first quarter of 2020 shows HICP inflation expectations standing at 1.2%, 1.4% and 1.5% in 2020, 2021 and 2022, respectively. The figures for 2020 and 2021 remain unchanged from the previous survey round (2022 was not surveyed). Longer-term inflation expectations (for 2024) remained at 1.7%.
1.6. OUTLOOK STILL CLOUDED BY RISKS DESPITE SOME RAYS OF LIGHT
As in the autumn, the European economy is still faced with a high degree of uncertainty, particularly with respect to trade policies and the external environment. Though a variety of events has twisted the composition of risks to the growth outlook, the overall balance of risks remains tilted to the downside.
Some developments have reduced downside tail risks…
While there is now clarity about trading relations between the EU and the UK until 31 December 2020, there is still considerable uncertainty about the long-term relationship and the possibility of an abrupt change in trading relations at the end of the year. Trade tensions between the US and China
0.8
1.3
1.8
2.3
2.8
0.5
1.0
1.5
2.0
Jan 12 Jan 13 Jan 14 Jan 15 Jan 16 Jan 17 Jan 18 Jan 19
y-o-y %y-o-y %, 3mma
Graph 1.11: Core inflation measures and wage growth,euro area
Wages and salaries per employee (rhs)
HICP, all items excl. energy and unprocessed food
HICP, all items excl. energy, food, clothing, footwear, holiday related
95
100
105
110
-1
0
1
2
3
12 13 14 15 16 17 18 19 20 21
HICP inflation (annual rate) (lhs) HICP (monthly, sca)
HICP (annual)
1.30.2 0.20.4
1.5
1.81.2
1.3
1.4
forecast
Graph 1.12: HICP, euro area
%index,
2015=100
Note: Figures next to horizontal bars are annual inflation rates.
2.5
Winter 2020 (Interim) forecast
12
have also subsided following the signing of the ‘Phase One’ trade deal, which removed some of the uncertainty facing firms’ investment and production decisions. Continued steps in this direction could be a game changer for the global economy and could significantly reduce uncertainty.
…but some new downside risks have emerged…
The outbreak and spread of the ‘2019-nCoV’ coronavirus and its impact on public health, human lives and economic activity has been a source of mounting concern. Questions about the duration and severity of the outbreak raises uncertainty over short-term economic prospects in China and abroad. The baseline assumption is that the outbreak peaks in the first quarter, with relatively limited global spillovers and with a recovery in the following quarters. As such, the duration of the outbreak, and of the containment measures enacted, are a key downside risk. The economic impact on other countries could also be larger and more lasting if infections spread more globally, or if there were spillovers related to global value chain disruptions which are difficult to anticipate. The longer it lasts, the higher the likelihood that the outbreak sparks knock-on effects on economic sentiment and global financing conditions more generally, which add to direct supply-side (e.g. number of work days lost) and demand disruptions (e.g. travel bans, mobility restrictions, shop closures).
The uncertainty sparked by the surge in geopolitical tensions in the Middle East and the risk of an escalating conflict could be more relevant than the observed swings in oil prices. Any further intensification of tensions in this region risks raising oil prices, negatively affecting oil-importing countries and endangering the global recovery. Political and social turmoil in Latin America has also resurfaced, particularly in Chile, Bolivia, Argentina and Venezuela which risks postponing the expected recovery in this region.
Closer to home, Turkey’s gas explorations in the waters off Cyprus have fuelled tensions with the EU, which are yet to be resolved.
…and substantial risks remain unchanged.
Both economic and trade-policy uncertainty remain at high levels. Uncertainty around US trade
and economic policies remains high amid the risk that new trade barriers could be enacted on a wider range of items. Any renewed economic confrontation could lead to a reversal of risk sentiment and tighter financing conditions. Abrupt financial market adjustments, triggered by changes in expectations, or a sudden reassessment of risks, can impact investor risk aversion, financial conditions and capital flows. This could endanger financial stability, especially in emerging markets but also in countries such as the US, where corporate debt is at a record high. (10) Such a development would weigh on the fragile recovery in global business confidence and create further obstacles to growth.
Medium-term downside risks also remain elevated. The current policy stimulus measures in China could increase leverage further, exacerbating the risk of a sharper economic adjustment in the future. Additionally, its impact could turn out to be less effective than assumed, which would result in a sharper slowdown. In the US, a prolonged period of accommodative monetary policy when the economy is at full employment risks exacerbating financial imbalances and vulnerabilities, which together with reduced fiscal policy space, could lead to a deeper or more prolonged downturn once the cycle turns.
On the positive side, the European economy could benefit from more expansionary and growth-friendly fiscal policies both in emerging markets and domestically. Positive spillovers from more benign financing conditions in some euro area economies may also still be on the cards.
Climate change-related risks are expected to matter most beyond the forecast horizon, but this does not rule out the occurrence of events that negatively affect production, prices and economic growth in the near future. The devastating bushfires in Australia are a strong reminder of such risks.
(10) See T. Adrian and F. Natalucci (2020). ‘A call for vigilance
after a strong year for risky assets’. IMF Blog, January.
2. PROSPECTS BY MEMBER STATES
Winter 2020 (Interim) forecast
13
EURO AREA
2.1. BELGIUM
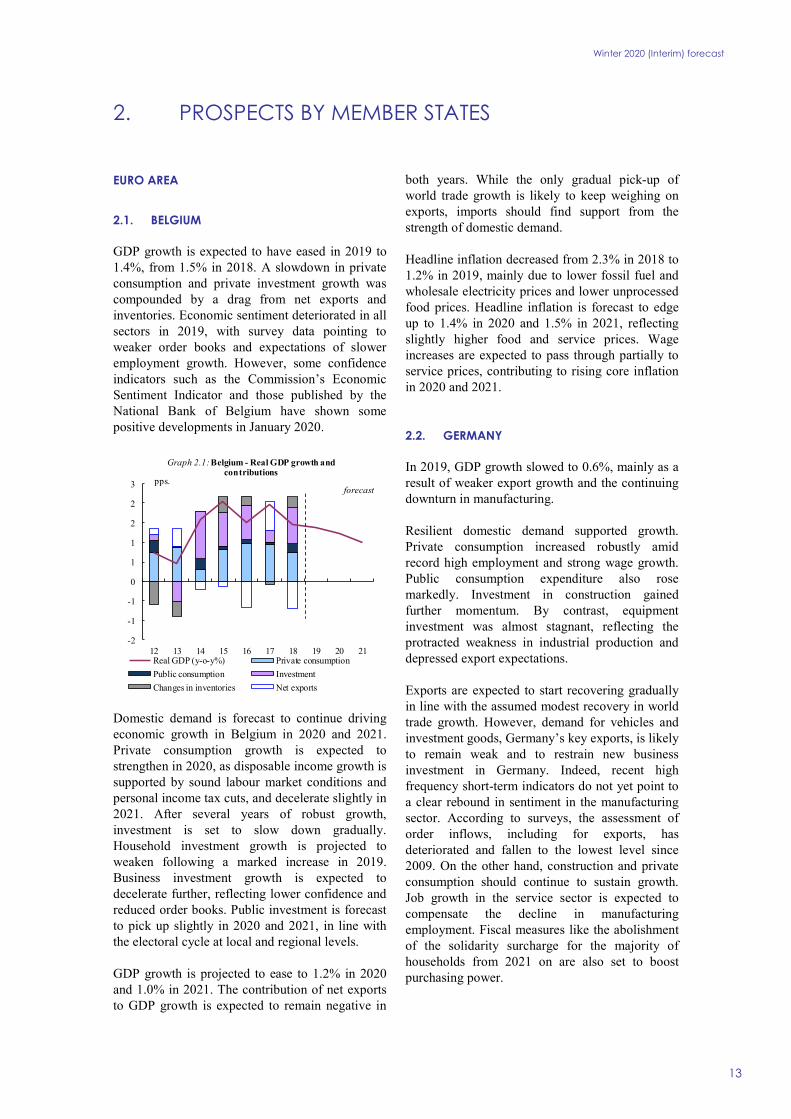
GDP growth is expected to have eased in 2019 to 1.4%, from 1.5% in 2018. A slowdown in private consumption and private investment growth was compounded by a drag from net exports and inventories. Economic sentiment deteriorated in all sectors in 2019, with survey data pointing to weaker order books and expectations of slower employment growth. However, some confidence indicators such as the Commission’s Economic Sentiment Indicator and those published by the National Bank of Belgium have shown some positive developments in January 2020.
Domestic demand is forecast to continue driving economic growth in Belgium in 2020 and 2021. Private consumption growth is expected to strengthen in 2020, as disposable income growth is supported by sound labour market conditions and personal income tax cuts, and decelerate slightly in 2021. After several years of robust growth, investment is set to slow down gradually. Household investment growth is projected to weaken following a marked increase in 2019. Business investment growth is expected to decelerate further, reflecting lower confidence and reduced order books. Public investment is forecast to pick up slightly in 2020 and 2021, in line with the electoral cycle at local and regional levels.
GDP growth is projected to ease to 1.2% in 2020 and 1.0% in 2021. The contribution of net exports to GDP growth is expected to remain negative in
both years. While the only gradual pick-up of world trade growth is likely to keep weighing on exports, imports should find support from the strength of domestic demand.
Headline inflation decreased from 2.3% in 2018 to 1.2% in 2019, mainly due to lower fossil fuel and wholesale electricity prices and lower unprocessed food prices. Headline inflation is forecast to edge up to 1.4% in 2020 and 1.5% in 2021, reflecting slightly higher food and service prices. Wage increases are expected to pass through partially to service prices, contributing to rising core inflation in 2020 and 2021.
2.2. GERMANY
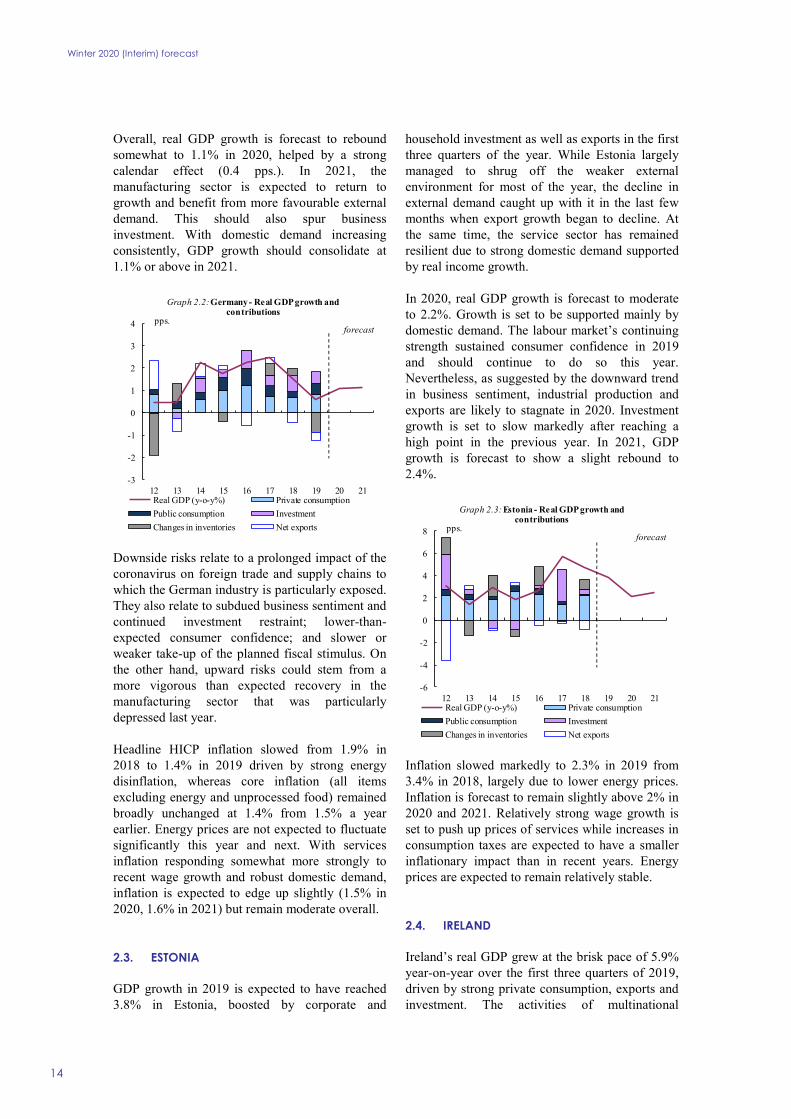
In 2019, GDP growth slowed to 0.6%, mainly as a result of weaker export growth and the continuing downturn in manufacturing.
Resilient domestic demand supported growth. Private consumption increased robustly amid record high employment and strong wage growth. Public consumption expenditure also rose markedly. Investment in construction gained further momentum. By contrast, equipment investment was almost stagnant, reflecting the protracted weakness in industrial production and depressed export expectations.
Exports are expected to start recovering gradually in line with the assumed modest recovery in world trade growth. However, demand for vehicles and investment goods, Germany’s key exports, is likely to remain weak and to restrain new business investment in Germany. Indeed, recent high frequency short-term indicators do not yet point to a clear rebound in sentiment in the manufacturing sector. According to surveys, the assessment of order inflows, including for exports, has deteriorated and fallen to the lowest level since 2009. On the other hand, construction and private consumption should continue to sustain growth. Job growth in the service sector is expected to compensate the decline in manufacturing employment. Fiscal measures like the abolishment of the solidarity surcharge for the majority of households from 2021 on are also set to boost purchasing power.
-2
-1
-1
0
1
1
2
2
3
12 13 14 15 16 17 18 19 20 21
Graph 2.1: Belgium - Real GDP growth and contributions
Real GDP (y-o-y%) Private consumption
Public consumption Investment
Changes in inventories Net exports
pps.forecast
Winter 2020 (Interim) forecast
14
Overall, real GDP growth is forecast to rebound somewhat to 1.1% in 2020, helped by a strong calendar effect (0.4 pps.). In 2021, the manufacturing sector is expected to return to growth and benefit from more favourable external demand. This should also spur business investment. With domestic demand increasing consistently, GDP growth should consolidate at 1.1% or above in 2021.
Downside risks relate to a prolonged impact of the coronavirus on foreign trade and supply chains to which the German industry is particularly exposed. They also relate to subdued business sentiment and continued investment restraint; lower-than-expected consumer confidence; and slower or weaker take-up of the planned fiscal stimulus. On the other hand, upward risks could stem from a more vigorous than expected recovery in the manufacturing sector that was particularly depressed last year.
Headline HICP inflation slowed from 1.9% in 2018 to 1.4% in 2019 driven by strong energy disinflation, whereas core inflation (all items excluding energy and unprocessed food) remained broadly unchanged at 1.4% from 1.5% a year earlier. Energy prices are not expected to fluctuate significantly this year and next. With services inflation responding somewhat more strongly to recent wage growth and robust domestic demand, inflation is expected to edge up slightly (1.5% in 2020, 1.6% in 2021) but remain moderate overall.
2.3. ESTONIA
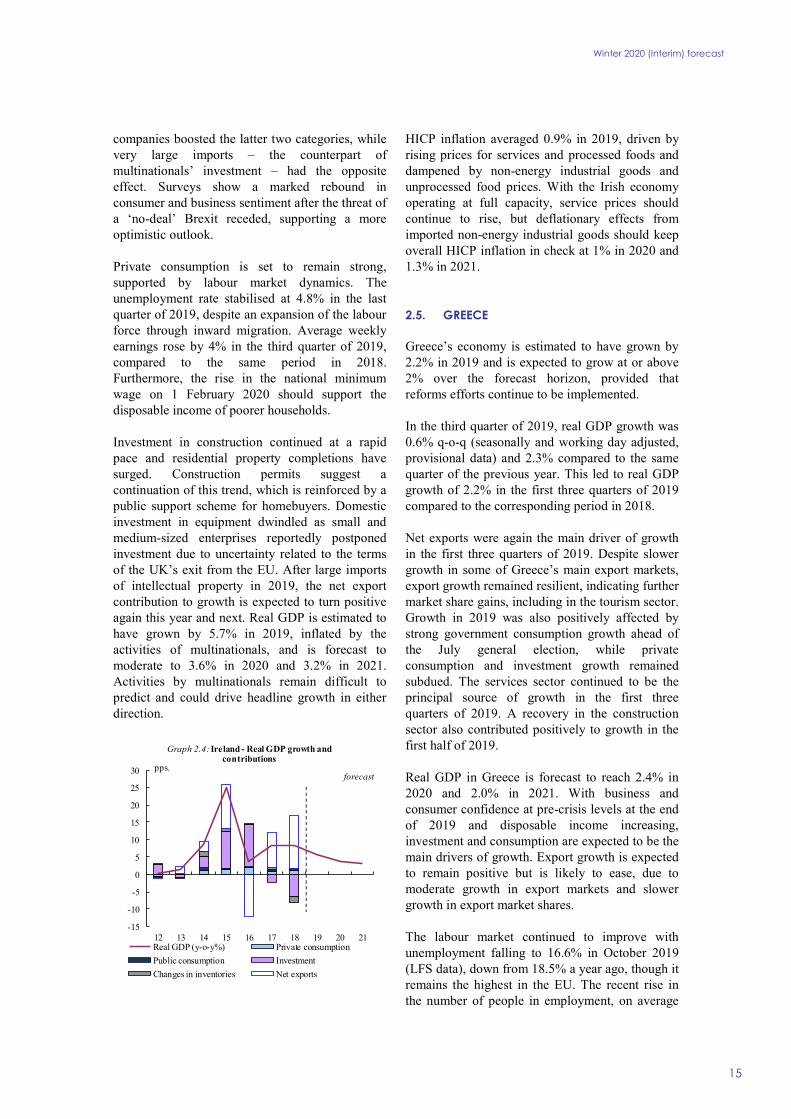
GDP growth in 2019 is expected to have reached 3.8% in Estonia, boosted by corporate and
household investment as well as exports in the first three quarters of the year. While Estonia largely managed to shrug off the weaker external environment for most of the year, the decline in external demand caught up with it in the last few months when export growth began to decline. At the same time, the service sector has remained resilient due to strong domestic demand supported by real income growth.
In 2020, real GDP growth is forecast to moderate to 2.2%. Growth is set to be supported mainly by domestic demand. The labour market’s continuing strength sustained consumer confidence in 2019 and should continue to do so this year. Nevertheless, as suggested by the downward trend in business sentiment, industrial production and exports are likely to stagnate in 2020. Investment growth is set to slow markedly after reaching a high point in the previous year. In 2021, GDP growth is forecast to show a slight rebound to 2.4%.
Inflation slowed markedly to 2.3% in 2019 from 3.4% in 2018, largely due to lower energy prices. Inflation is forecast to remain slightly above 2% in 2020 and 2021. Relatively strong wage growth is set to push up prices of services while increases in consumption taxes are expected to have a smaller inflationary impact than in recent years. Energy prices are expected to remain relatively stable.
2.4. IRELAND
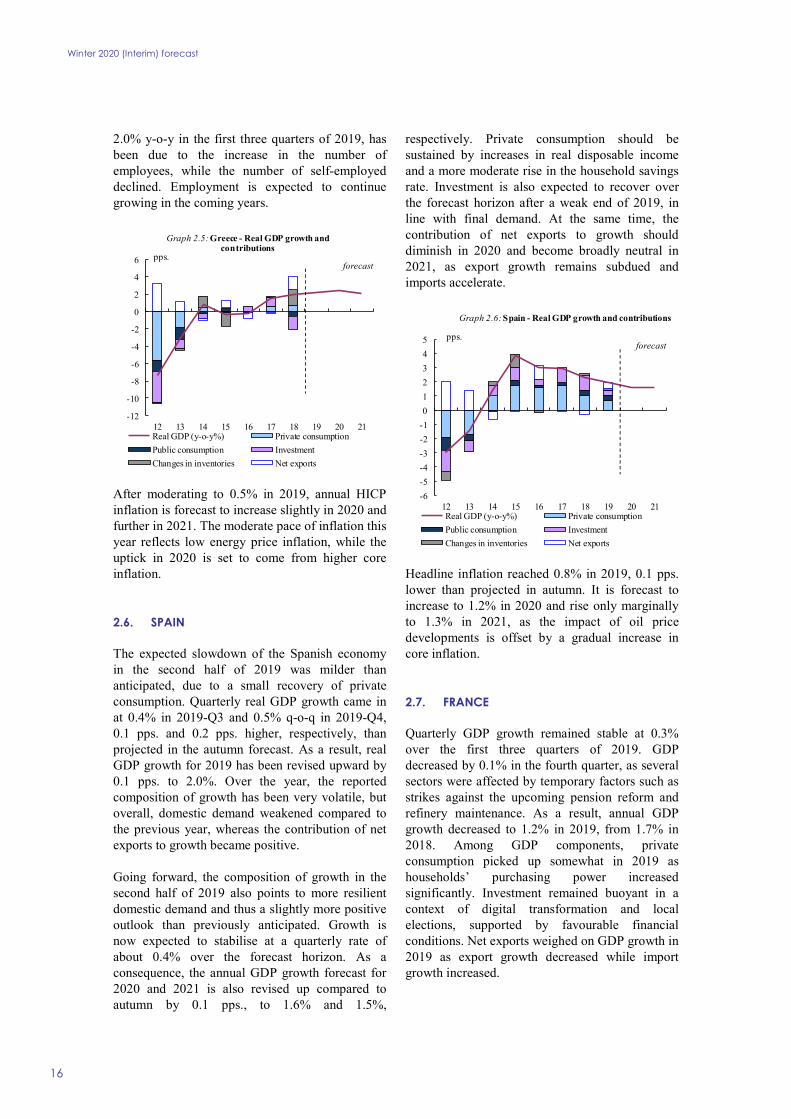
Ireland’s real GDP grew at the brisk pace of 5.9% year-on-year over the first three quarters of 2019, driven by strong private consumption, exports and investment. The activities of multinational
-3
-2
-1
0
1
2
3
4
12 13 14 15 16 17 18 19 20 21
Graph 2.2: Germany - Real GDP growth and contributions
Real GDP (y-o-y%) Private consumption
Public consumption Investment
Changes in inventories Net exports
pps.forecast
-6
-4
-2
0
2
4
6
8
12 13 14 15 16 17 18 19 20 21
Graph 2.3: Estonia - Real GDP growth and contributions
Real GDP (y-o-y%) Private consumption
Public consumption Investment
Changes in inventories Net exports
pps.forecast
Winter 2020 (Interim) forecast
15
companies boosted the latter two categories, while very large imports – the counterpart of multinationals’ investment – had the opposite effect. Surveys show a marked rebound in consumer and business sentiment after the threat of a ‘no-deal’ Brexit receded, supporting a more optimistic outlook.
Private consumption is set to remain strong, supported by labour market dynamics. The unemployment rate stabilised at 4.8% in the last quarter of 2019, despite an expansion of the labour force through inward migration. Average weekly earnings rose by 4% in the third quarter of 2019, compared to the same period in 2018. Furthermore, the rise in the national minimum wage on 1 February 2020 should support the disposable income of poorer households.
Investment in construction continued at a rapid pace and residential property completions have surged. Construction permits suggest a continuation of this trend, which is reinforced by a public support scheme for homebuyers. Domestic investment in equipment dwindled as small and medium-sized enterprises reportedly postponed investment due to uncertainty related to the terms of the UK’s exit from the EU. After large imports of intellectual property in 2019, the net export contribution to growth is expected to turn positive again this year and next. Real GDP is estimated to have grown by 5.7% in 2019, inflated by the activities of multinationals, and is forecast to moderate to 3.6% in 2020 and 3.2% in 2021. Activities by multinationals remain difficult to predict and could drive headline growth in either direction.
HICP inflation averaged 0.9% in 2019, driven by rising prices for services and processed foods and dampened by non-energy industrial goods and unprocessed food prices. With the Irish economy operating at full capacity, service prices should continue to rise, but deflationary effects from imported non-energy industrial goods should keep overall HICP inflation in check at 1% in 2020 and 1.3% in 2021.
2.5. GREECE
Greece’s economy is estimated to have grown by 2.2% in 2019 and is expected to grow at or above 2% over the forecast horizon, provided that reforms efforts continue to be implemented.
In the third quarter of 2019, real GDP growth was 0.6% q-o-q (seasonally and working day adjusted, provisional data) and 2.3% compared to the same quarter of the previous year. This led to real GDP growth of 2.2% in the first three quarters of 2019 compared to the corresponding period in 2018.
Net exports were again the main driver of growth in the first three quarters of 2019. Despite slower growth in some of Greece’s main export markets, export growth remained resilient, indicating further market share gains, including in the tourism sector. Growth in 2019 was also positively affected by strong government consumption growth ahead of the July general election, while private consumption and investment growth remained subdued. The services sector continued to be the principal source of growth in the first three quarters of 2019. A recovery in the construction sector also contributed positively to growth in the first half of 2019.
Real GDP in Greece is forecast to reach 2.4% in 2020 and 2.0% in 2021. With business and consumer confidence at pre-crisis levels at the end of 2019 and disposable income increasing, investment and consumption are expected to be the main drivers of growth. Export growth is expected to remain positive but is likely to ease, due to moderate growth in export markets and slower growth in export market shares.
The labour market continued to improve with unemployment falling to 16.6% in October 2019 (LFS data), down from 18.5% a year ago, though it remains the highest in the EU. The recent rise in the number of people in employment, on average
-15
-10
-5
0
5
10
15
20
25
30
12 13 14 15 16 17 18 19 20 21
Graph 2.4: Ireland - Real GDP growth and contributions
Real GDP (y-o-y%) Private consumption
Public consumption Investment
Changes in inventories Net exports
pps.forecast
Winter 2020 (Interim) forecast
16
2.0% y-o-y in the first three quarters of 2019, has been due to the increase in the number of employees, while the number of self-employed declined. Employment is expected to continue growing in the coming years.
After moderating to 0.5% in 2019, annual HICP inflation is forecast to increase slightly in 2020 and further in 2021. The moderate pace of inflation this year reflects low energy price inflation, while the uptick in 2020 is set to come from higher core inflation.
2.6. SPAIN
The expected slowdown of the Spanish economy in the second half of 2019 was milder than anticipated, due to a small recovery of private consumption. Quarterly real GDP growth came in at 0.4% in 2019-Q3 and 0.5% q-o-q in 2019-Q4, 0.1 pps. and 0.2 pps. higher, respectively, than projected in the autumn forecast. As a result, real GDP growth for 2019 has been revised upward by 0.1 pps. to 2.0%. Over the year, the reported composition of growth has been very volatile, but overall, domestic demand weakened compared to the previous year, whereas the contribution of net exports to growth became positive.
Going forward, the composition of growth in the second half of 2019 also points to more resilient domestic demand and thus a slightly more positive outlook than previously anticipated. Growth is now expected to stabilise at a quarterly rate of about 0.4% over the forecast horizon. As a consequence, the annual GDP growth forecast for 2020 and 2021 is also revised up compared to autumn by 0.1 pps., to 1.6% and 1.5%,
respectively. Private consumption should be sustained by increases in real disposable income and a more moderate rise in the household savings rate. Investment is also expected to recover over the forecast horizon after a weak end of 2019, in line with final demand. At the same time, the contribution of net exports to growth should diminish in 2020 and become broadly neutral in 2021, as export growth remains subdued and imports accelerate.
Headline inflation reached 0.8% in 2019, 0.1 pps. lower than projected in autumn. It is forecast to increase to 1.2% in 2020 and rise only marginally to 1.3% in 2021, as the impact of oil price developments is offset by a gradual increase in core inflation.
2.7. FRANCE
Quarterly GDP growth remained stable at 0.3% over the first three quarters of 2019. GDP decreased by 0.1% in the fourth quarter, as several sectors were affected by temporary factors such as strikes against the upcoming pension reform and refinery maintenance. As a result, annual GDP growth decreased to 1.2% in 2019, from 1.7% in 2018. Among GDP components, private consumption picked up somewhat in 2019 as households’ purchasing power increased significantly. Investment remained buoyant in a context of digital transformation and local elections, supported by favourable financial conditions. Net exports weighed on GDP growth in 2019 as export growth decreased while import growth increased.
-12
-10
-8
-6
-4
-2
0
2
4
6
12 13 14 15 16 17 18 19 20 21
Graph 2.5: Greece - Real GDP growth and contributions
Real GDP (y-o-y%) Private consumption
Public consumption Investment
Changes in inventories Net exports
pps.forecast
-6
-5
-4
-3
-2
-1
0
1
2
3
4
5
12 13 14 15 16 17 18 19 20 21
Graph 2.6: Spain - Real GDP growth and contributions
Real GDP (y-o-y%) Private consumption
Public consumption Investment
Changes in inventories Net exports
pps.forecast
Winter 2020 (Interim) forecast
17
GDP growth is set to decrease to 1.1% in 2020 and recover to 1.2% in 2021. The impact of the ongoing strikes are expected to fade progressively during the first quarter of 2020 as the participation rate declines over time. GDP growth is set to accelerate over the first half of 2020 as stockpiling are expected to bounce back after a significant decrease in 2019. During 2020 as a whole, economic activity is set to be supported by resilient private consumption and robust investment, although less than the previous year for the latter. Private consumption growth is expected to increase somewhat in 2020 and remain broadly stable in 2021, boosted by gains in purchasing power already registered in 2019. Corporate investment is set to slow down gradually, as anticipated by the latest investment surveys and gradually decreasing capacity utilisation rates. The slowdown in public investment is expected to be more pronounced, as already seen in the last quarter of 2019, due to local elections in the first quarter of 2020. Finally, net exports are forecast to continue weighing on GDP growth in 2020 and to be broadly neutral in 2021.
Contrary to external risks which are mainly on the downside, domestic risks are tilted to the upside. In particular, the expected rebound in the first half of 2020 could prove more robust, with higher stockpiling.
Inflation decreased to 1.3% in 2019, from 2.1% in 2018, due to lower oil prices and lower tax increases. It is expected to remain broadly stable, with a modest decrease to 1.2% in 2020, before going back to 1.3% in 2021. Core inflation is set to increase slightly, in line with the services component.
2.8. ITALY
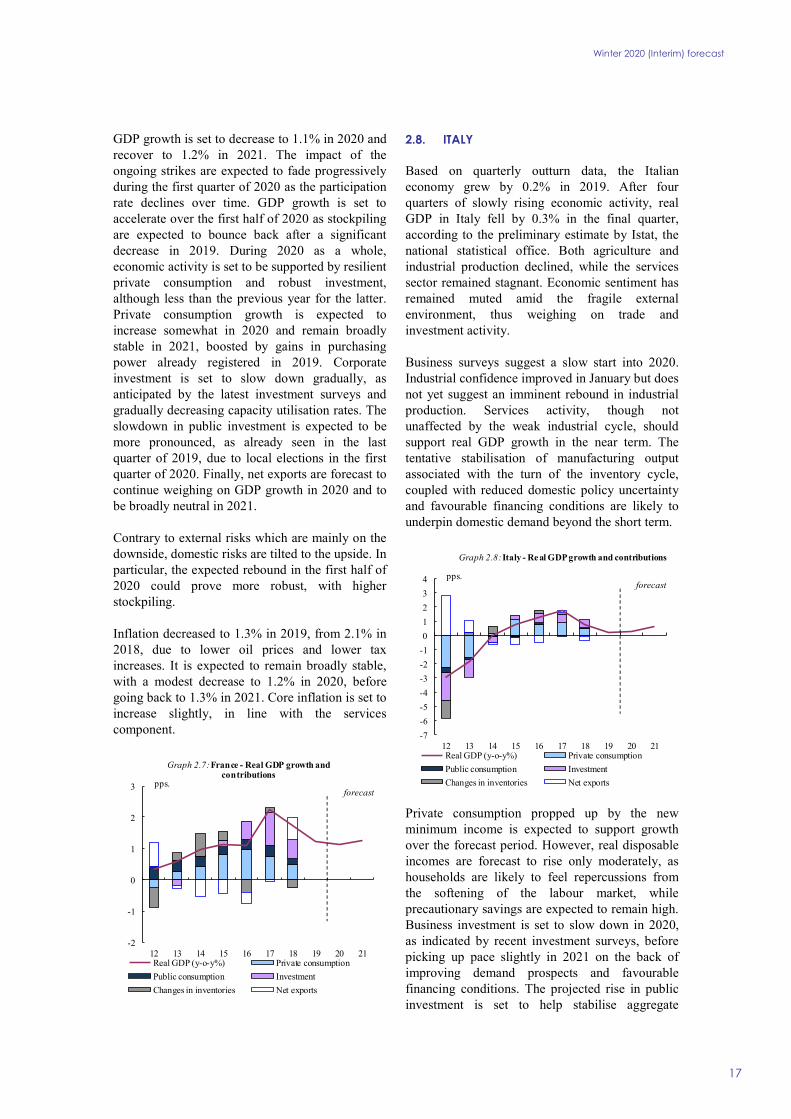
Based on quarterly outturn data, the Italian economy grew by 0.2% in 2019. After four quarters of slowly rising economic activity, real GDP in Italy fell by 0.3% in the final quarter, according to the preliminary estimate by Istat, the national statistical office. Both agriculture and industrial production declined, while the services sector remained stagnant. Economic sentiment has remained muted amid the fragile external environment, thus weighing on trade and investment activity.
Business surveys suggest a slow start into 2020. Industrial confidence improved in January but does not yet suggest an imminent rebound in industrial production. Services activity, though not unaffected by the weak industrial cycle, should support real GDP growth in the near term. The tentative stabilisation of manufacturing output associated with the turn of the inventory cycle, coupled with reduced domestic policy uncertainty and favourable financing conditions are likely to underpin domestic demand beyond the short term.
Private consumption propped up by the new minimum income is expected to support growth over the forecast period. However, real disposable incomes are forecast to rise only moderately, as households are likely to feel repercussions from the softening of the labour market, while precautionary savings are expected to remain high. Business investment is set to slow down in 2020, as indicated by recent investment surveys, before picking up pace slightly in 2021 on the back of improving demand prospects and favourable financing conditions. The projected rise in public investment is set to help stabilise aggregate
-2
-1
0
1
2
3
12 13 14 15 16 17 18 19 20 21
Graph 2.7: France - Real GDP growth and contributions
Real GDP (y-o-y%) Private consumption
Public consumption Investment
Changes in inventories Net exports
pps.forecast
-7
-6
-5
-4
-3
-2
-1
0
1
2
3
4
12 13 14 15 16 17 18 19 20 21
Graph 2.8: Italy - Real GDP growth and contributions
Real GDP (y-o-y%) Private consumption
Public consumption Investment
Changes in inventories Net exports
pps.forecast
Winter 2020 (Interim) forecast
18
investment growth over the forecast period. The external environment is likely to remain challenging but should gradually become more supportive to growth. Exports are expected to grow broadly in line with export market growth, which is forecast to pick up more meaningfully only towards the end of the forecast period.
Overall, real GDP growth is forecast to pick up only slightly to 0.3% in 2020, also due to a negative carry-over effect, and to 0.6% in 2021. Downside risks to the growth outlook remain pronounced.
HICP inflation averaged 0.6% in 2019 and is set to rise to only 0.8% in 2020 and to 1.0% in 2021, as price pressures are dampened by falling energy prices. Core inflation is expected to gradually increase over the forecast period, as firms’ profit margins are forecast to recover in line with accelerating economic activity, while wage growth is projected to remain moderate.
2.9. CYPRUS
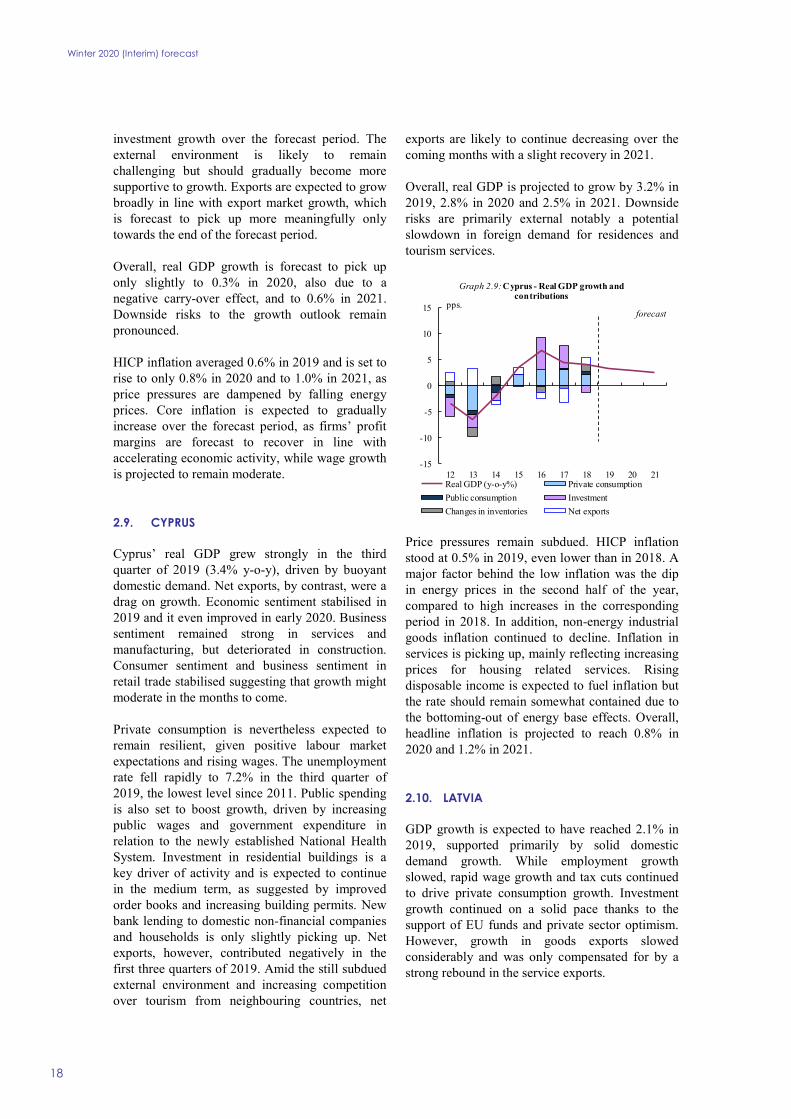
Cyprus’ real GDP grew strongly in the third quarter of 2019 (3.4% y-o-y), driven by buoyant domestic demand. Net exports, by contrast, were a drag on growth. Economic sentiment stabilised in 2019 and it even improved in early 2020. Business sentiment remained strong in services and manufacturing, but deteriorated in construction. Consumer sentiment and business sentiment in retail trade stabilised suggesting that growth might moderate in the months to come.
Private consumption is nevertheless expected to remain resilient, given positive labour market expectations and rising wages. The unemployment rate fell rapidly to 7.2% in the third quarter of 2019, the lowest level since 2011. Public spending is also set to boost growth, driven by increasing public wages and government expenditure in relation to the newly established National Health System. Investment in residential buildings is a key driver of activity and is expected to continue in the medium term, as suggested by improved order books and increasing building permits. New bank lending to domestic non-financial companies and households is only slightly picking up. Net exports, however, contributed negatively in the first three quarters of 2019. Amid the still subdued external environment and increasing competition over tourism from neighbouring countries, net
exports are likely to continue decreasing over the coming months with a slight recovery in 2021.
Overall, real GDP is projected to grow by 3.2% in 2019, 2.8% in 2020 and 2.5% in 2021. Downside risks are primarily external notably a potential slowdown in foreign demand for residences and tourism services.
Price pressures remain subdued. HICP inflation stood at 0.5% in 2019, even lower than in 2018. A major factor behind the low inflation was the dip in energy prices in the second half of the year, compared to high increases in the corresponding period in 2018. In addition, non-energy industrial goods inflation continued to decline. Inflation in services is picking up, mainly reflecting increasing prices for housing related services. Rising disposable income is expected to fuel inflation but the rate should remain somewhat contained due to the bottoming-out of energy base effects. Overall, headline inflation is projected to reach 0.8% in 2020 and 1.2% in 2021.
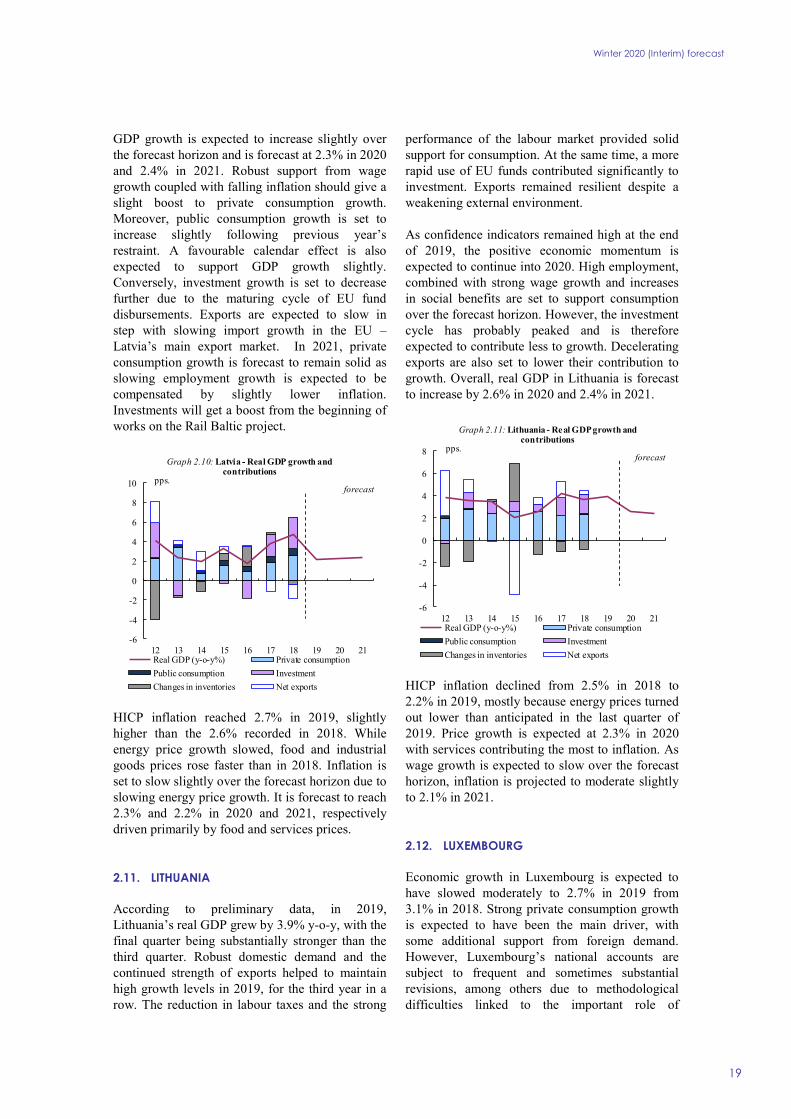
2.10. LATVIA
GDP growth is expected to have reached 2.1% in 2019, supported primarily by solid domestic demand growth. While employment growth slowed, rapid wage growth and tax cuts continued to drive private consumption growth. Investment growth continued on a solid pace thanks to the support of EU funds and private sector optimism. However, growth in goods exports slowed considerably and was only compensated for by a strong rebound in the service exports.
-15
-10
-5
0
5
10
15
12 13 14 15 16 17 18 19 20 21
Graph 2.9: Cyprus - Real GDP growth and contributions
Real GDP (y-o-y%) Private consumption
Public consumption Investment
Changes in inventories Net exports
pps.forecast
Winter 2020 (Interim) forecast
19
GDP growth is expected to increase slightly over the forecast horizon and is forecast at 2.3% in 2020 and 2.4% in 2021. Robust support from wage growth coupled with falling inflation should give a slight boost to private consumption growth. Moreover, public consumption growth is set to increase slightly following previous year’s restraint. A favourable calendar effect is also expected to support GDP growth slightly. Conversely, investment growth is set to decrease further due to the maturing cycle of EU fund disbursements. Exports are expected to slow in step with slowing import growth in the EU – Latvia’s main export market. In 2021, private consumption growth is forecast to remain solid as slowing employment growth is expected to be compensated by slightly lower inflation. Investments will get a boost from the beginning of works on the Rail Baltic project.
HICP inflation reached 2.7% in 2019, slightly higher than the 2.6% recorded in 2018. While energy price growth slowed, food and industrial goods prices rose faster than in 2018. Inflation is set to slow slightly over the forecast horizon due to slowing energy price growth. It is forecast to reach 2.3% and 2.2% in 2020 and 2021, respectively driven primarily by food and services prices.
2.11. LITHUANIA
According to preliminary data, in 2019, Lithuania’s real GDP grew by 3.9% y-o-y, with the final quarter being substantially stronger than the third quarter. Robust domestic demand and the continued strength of exports helped to maintain high growth levels in 2019, for the third year in a row. The reduction in labour taxes and the strong
performance of the labour market provided solid support for consumption. At the same time, a more rapid use of EU funds contributed significantly to investment. Exports remained resilient despite a weakening external environment.
As confidence indicators remained high at the end of 2019, the positive economic momentum is expected to continue into 2020. High employment, combined with strong wage growth and increases in social benefits are set to support consumption over the forecast horizon. However, the investment cycle has probably peaked and is therefore expected to contribute less to growth. Decelerating exports are also set to lower their contribution to growth. Overall, real GDP in Lithuania is forecast to increase by 2.6% in 2020 and 2.4% in 2021.
HICP inflation declined from 2.5% in 2018 to 2.2% in 2019, mostly because energy prices turned out lower than anticipated in the last quarter of 2019. Price growth is expected at 2.3% in 2020 with services contributing the most to inflation. As wage growth is expected to slow over the forecast horizon, inflation is projected to moderate slightly to 2.1% in 2021.
2.12. LUXEMBOURG
Economic growth in Luxembourg is expected to have slowed moderately to 2.7% in 2019 from 3.1% in 2018. Strong private consumption growth is expected to have been the main driver, with some additional support from foreign demand. However, Luxembourg’s national accounts are subject to frequent and sometimes substantial revisions, among others due to methodological difficulties linked to the important role of
-6
-4
-2
0
2
4
6
8
10
12 13 14 15 16 17 18 19 20 21
Graph 2.10: Latvia - Real GDP growth and contributions
Real GDP (y-o-y%) Private consumption
Public consumption Investment
Changes in inventories Net exports
pps.forecast
-6
-4
-2
0
2
4
6
8
12 13 14 15 16 17 18 19 20 21
Graph 2.11: Lithuania - Real GDP growth and contributions
Real GDP (y-o-y%) Private consumption
Public consumption Investment
Changes in inventories Net exports
pps.forecast
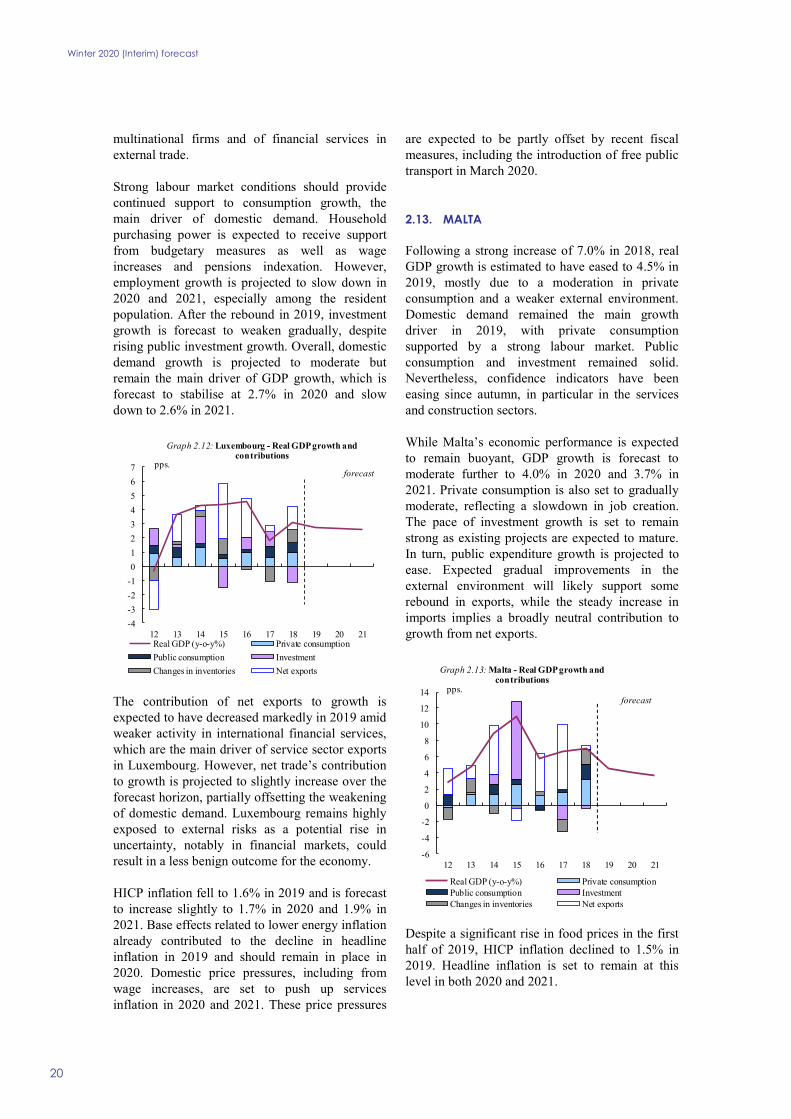
Winter 2020 (Interim) forecast
20
multinational firms and of financial services in external trade.
Strong labour market conditions should provide continued support to consumption growth, the main driver of domestic demand. Household purchasing power is expected to receive support from budgetary measures as well as wage increases and pensions indexation. However, employment growth is projected to slow down in 2020 and 2021, especially among the resident population. After the rebound in 2019, investment growth is forecast to weaken gradually, despite rising public investment growth. Overall, domestic demand growth is projected to moderate but remain the main driver of GDP growth, which is forecast to stabilise at 2.7% in 2020 and slow down to 2.6% in 2021.
The contribution of net exports to growth is expected to have decreased markedly in 2019 amid weaker activity in international financial services, which are the main driver of service sector exports in Luxembourg. However, net trade’s contribution to growth is projected to slightly increase over the forecast horizon, partially offsetting the weakening of domestic demand. Luxembourg remains highly exposed to external risks as a potential rise in uncertainty, notably in financial markets, could result in a less benign outcome for the economy.
HICP inflation fell to 1.6% in 2019 and is forecast to increase slightly to 1.7% in 2020 and 1.9% in 2021. Base effects related to lower energy inflation already contributed to the decline in headline inflation in 2019 and should remain in place in 2020. Domestic price pressures, including from wage increases, are set to push up services inflation in 2020 and 2021. These price pressures
are expected to be partly offset by recent fiscal measures, including the introduction of free public transport in March 2020.
2.13. MALTA
Following a strong increase of 7.0% in 2018, real GDP growth is estimated to have eased to 4.5% in 2019, mostly due to a moderation in private consumption and a weaker external environment. Domestic demand remained the main growth driver in 2019, with private consumption supported by a strong labour market. Public consumption and investment remained solid. Nevertheless, confidence indicators have been easing since autumn, in particular in the services and construction sectors.
While Malta’s economic performance is expected to remain buoyant, GDP growth is forecast to moderate further to 4.0% in 2020 and 3.7% in 2021. Private consumption is also set to gradually moderate, reflecting a slowdown in job creation. The pace of investment growth is set to remain strong as existing projects are expected to mature. In turn, public expenditure growth is projected to ease. Expected gradual improvements in the external environment will likely support some rebound in exports, while the steady increase in imports implies a broadly neutral contribution to growth from net exports.
Despite a significant rise in food prices in the first half of 2019, HICP inflation declined to 1.5% in 2019. Headline inflation is set to remain at this level in both 2020 and 2021.
-4
-3
-2
-1
0
1
2
3
4
5
6
7
12 13 14 15 16 17 18 19 20 21
Graph 2.12: Luxembourg - Real GDP growth and contributions
Real GDP (y-o-y%) Private consumption
Public consumption Investment
Changes in inventories Net exports
pps.forecast
-6
-4
-2
0
2
4
6
8
10
12
14
12 13 14 15 16 17 18 19 20 21
Graph 2.13: Malta - Real GDP growth and contributions
Real GDP (y-o-y%) Private consumptionPublic consumption InvestmentChanges in inventories Net exports
pps.forecast
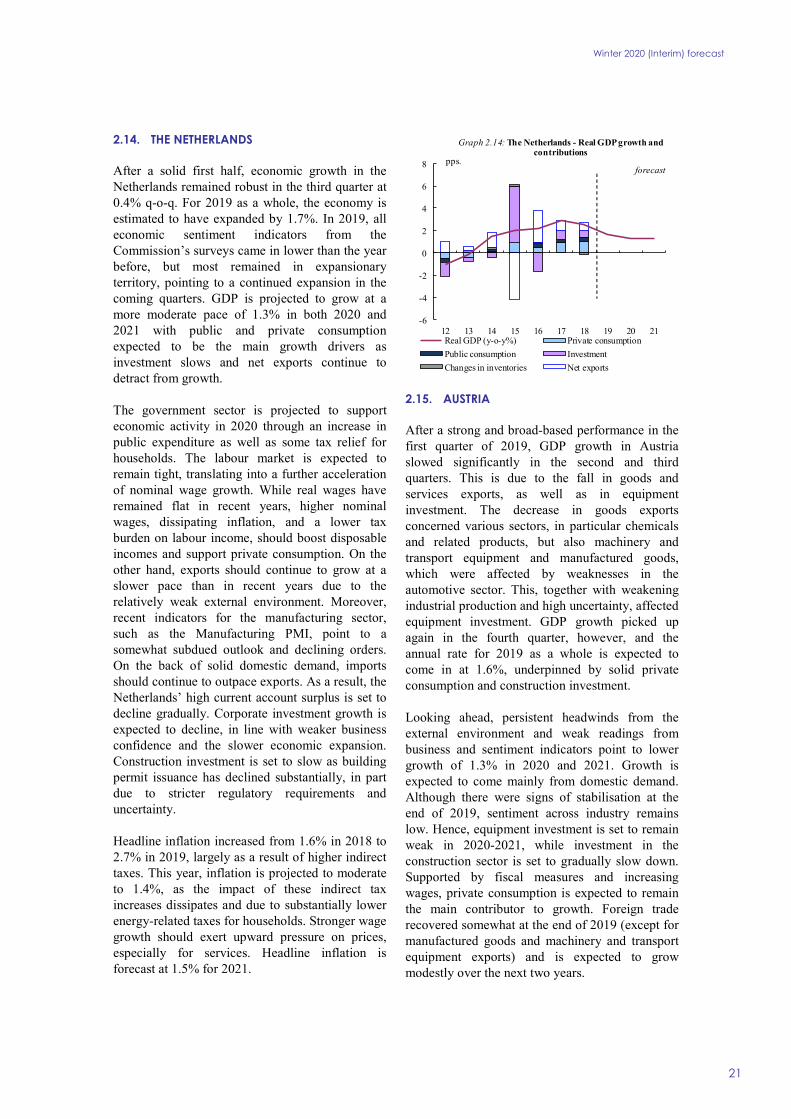
Winter 2020 (Interim) forecast
21
2.14. THE NETHERLANDS
After a solid first half, economic growth in the Netherlands remained robust in the third quarter at 0.4% q-o-q. For 2019 as a whole, the economy is estimated to have expanded by 1.7%. In 2019, all economic sentiment indicators from the Commission’s surveys came in lower than the year before, but most remained in expansionary territory, pointing to a continued expansion in the coming quarters. GDP is projected to grow at a more moderate pace of 1.3% in both 2020 and 2021 with public and private consumption expected to be the main growth drivers as investment slows and net exports continue to detract from growth.
The government sector is projected to support economic activity in 2020 through an increase in public expenditure as well as some tax relief for households. The labour market is expected to remain tight, translating into a further acceleration of nominal wage growth. While real wages have remained flat in recent years, higher nominal wages, dissipating inflation, and a lower tax burden on labour income, should boost disposable incomes and support private consumption. On the other hand, exports should continue to grow at a slower pace than in recent years due to the relatively weak external environment. Moreover, recent indicators for the manufacturing sector, such as the Manufacturing PMI, point to a somewhat subdued outlook and declining orders. On the back of solid domestic demand, imports should continue to outpace exports. As a result, the Netherlands’ high current account surplus is set to decline gradually. Corporate investment growth is expected to decline, in line with weaker business confidence and the slower economic expansion. Construction investment is set to slow as building permit issuance has declined substantially, in part due to stricter regulatory requirements and uncertainty.
Headline inflation increased from 1.6% in 2018 to 2.7% in 2019, largely as a result of higher indirect taxes. This year, inflation is projected to moderate to 1.4%, as the impact of these indirect tax increases dissipates and due to substantially lower energy-related taxes for households. Stronger wage growth should exert upward pressure on prices, especially for services. Headline inflation is forecast at 1.5% for 2021.
2.15. AUSTRIA
After a strong and broad-based performance in the first quarter of 2019, GDP growth in Austria slowed significantly in the second and third quarters. This is due to the fall in goods and services exports, as well as in equipment investment. The decrease in goods exports concerned various sectors, in particular chemicals and related products, but also machinery and transport equipment and manufactured goods, which were affected by weaknesses in the automotive sector. This, together with weakening industrial production and high uncertainty, affected equipment investment. GDP growth picked up again in the fourth quarter, however, and the annual rate for 2019 as a whole is expected to come in at 1.6%, underpinned by solid private consumption and construction investment.
Looking ahead, persistent headwinds from the external environment and weak readings from business and sentiment indicators point to lower growth of 1.3% in 2020 and 2021. Growth is expected to come mainly from domestic demand. Although there were signs of stabilisation at the end of 2019, sentiment across industry remains low. Hence, equipment investment is set to remain weak in 2020-2021, while investment in the construction sector is set to gradually slow down. Supported by fiscal measures and increasing wages, private consumption is expected to remain the main contributor to growth. Foreign trade recovered somewhat at the end of 2019 (except for manufactured goods and machinery and transport equipment exports) and is expected to grow modestly over the next two years.
-6
-4
-2
0
2
4
6
8
12 13 14 15 16 17 18 19 20 21
Graph 2.14: The Netherlands - Real GDP growth and contributions
Real GDP (y-o-y%) Private consumption
Public consumption Investment
Changes in inventories Net exports
pps.forecast
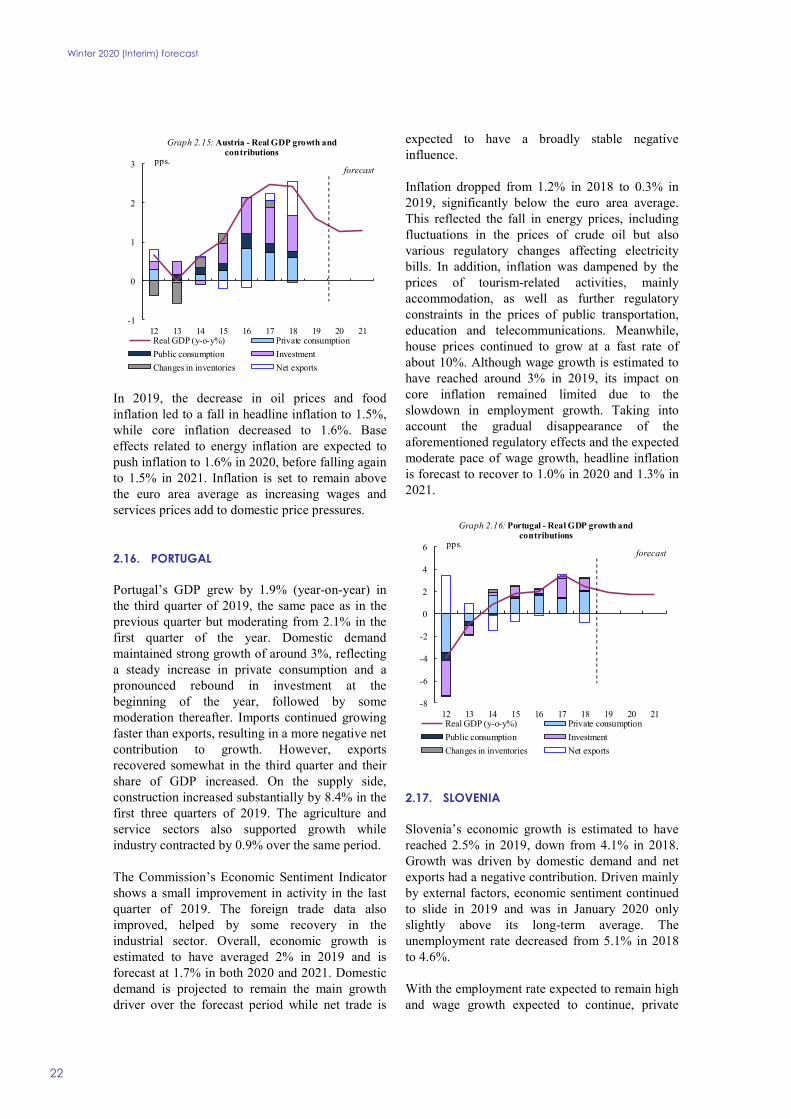
Winter 2020 (Interim) forecast
22
In 2019, the decrease in oil prices and food inflation led to a fall in headline inflation to 1.5%, while core inflation decreased to 1.6%. Base effects related to energy inflation are expected to push inflation to 1.6% in 2020, before falling again to 1.5% in 2021. Inflation is set to remain above the euro area average as increasing wages and services prices add to domestic price pressures.
2.16. PORTUGAL
Portugal’s GDP grew by 1.9% (year-on-year) in the third quarter of 2019, the same pace as in the previous quarter but moderating from 2.1% in the first quarter of the year. Domestic demand maintained strong growth of around 3%, reflecting a steady increase in private consumption and a pronounced rebound in investment at the beginning of the year, followed by some moderation thereafter. Imports continued growing faster than exports, resulting in a more negative net contribution to growth. However, exports recovered somewhat in the third quarter and their share of GDP increased. On the supply side, construction increased substantially by 8.4% in the first three quarters of 2019. The agriculture and service sectors also supported growth while industry contracted by 0.9% over the same period.
The Commission’s Economic Sentiment Indicator shows a small improvement in activity in the last quarter of 2019. The foreign trade data also improved, helped by some recovery in the industrial sector. Overall, economic growth is estimated to have averaged 2% in 2019 and is forecast at 1.7% in both 2020 and 2021. Domestic demand is projected to remain the main growth driver over the forecast period while net trade is
expected to have a broadly stable negative influence.
Inflation dropped from 1.2% in 2018 to 0.3% in 2019, significantly below the euro area average. This reflected the fall in energy prices, including fluctuations in the prices of crude oil but also various regulatory changes affecting electricity bills. In addition, inflation was dampened by the prices of tourism-related activities, mainly accommodation, as well as further regulatory constraints in the prices of public transportation, education and telecommunications. Meanwhile, house prices continued to grow at a fast rate of about 10%. Although wage growth is estimated to have reached around 3% in 2019, its impact on core inflation remained limited due to the slowdown in employment growth. Taking into account the gradual disappearance of the aforementioned regulatory effects and the expected moderate pace of wage growth, headline inflation is forecast to recover to 1.0% in 2020 and 1.3% in 2021.
2.17. SLOVENIA
Slovenia’s economic growth is estimated to have reached 2.5% in 2019, down from 4.1% in 2018. Growth was driven by domestic demand and net exports had a negative contribution. Driven mainly by external factors, economic sentiment continued to slide in 2019 and was in January 2020 only slightly above its long-term average. The unemployment rate decreased from 5.1% in 2018 to 4.6%.
With the employment rate expected to remain high and wage growth expected to continue, private
-1
0
1
2
3
12 13 14 15 16 17 18 19 20 21
Graph 2.15: Austria - Real GDP growth and contributions
Real GDP (y-o-y%) Private consumption
Public consumption Investment
Changes in inventories Net exports
pps.forecast
-8
-6
-4
-2
0
2
4
6
12 13 14 15 16 17 18 19 20 21
Graph 2.16: Portugal - Real GDP growth and contributions
Real GDP (y-o-y%) Private consumption
Public consumption Investment
Changes in inventories Net exports
pps.forecast
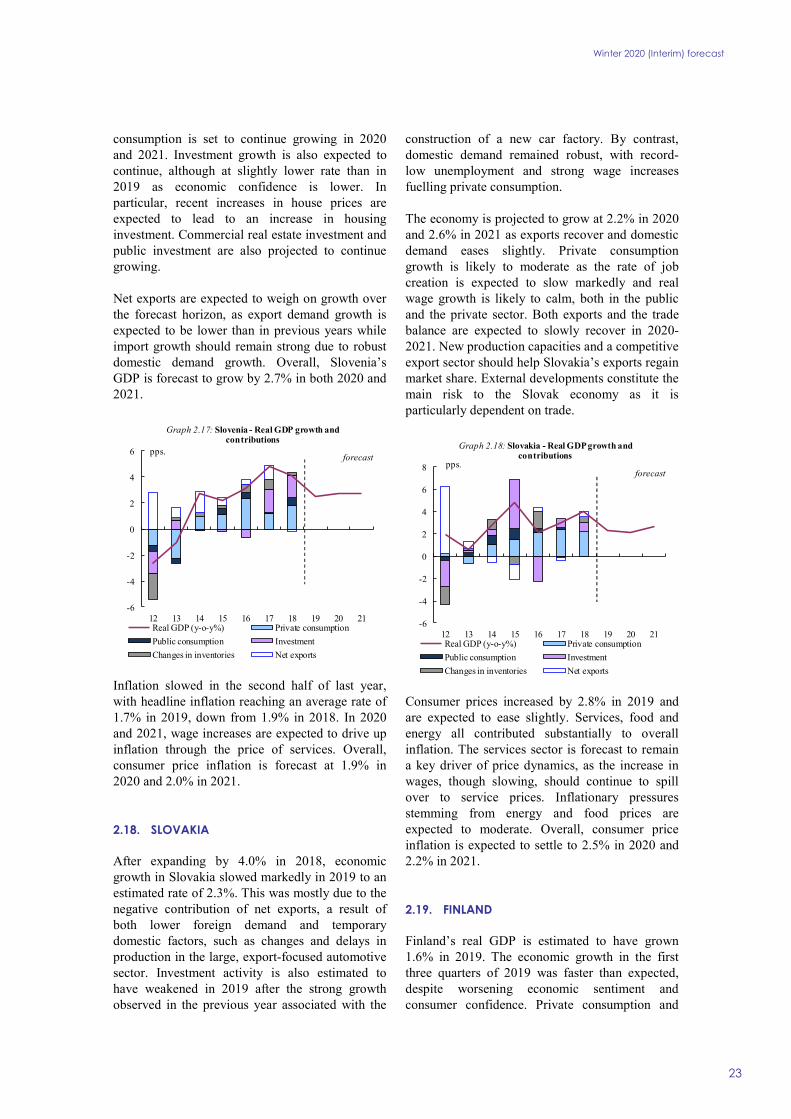
Winter 2020 (Interim) forecast
23
consumption is set to continue growing in 2020 and 2021. Investment growth is also expected to continue, although at slightly lower rate than in 2019 as economic confidence is lower. In particular, recent increases in house prices are expected to lead to an increase in housing investment. Commercial real estate investment and public investment are also projected to continue growing.
Net exports are expected to weigh on growth over the forecast horizon, as export demand growth is expected to be lower than in previous years while import growth should remain strong due to robust domestic demand growth. Overall, Slovenia’s GDP is forecast to grow by 2.7% in both 2020 and 2021.
Inflation slowed in the second half of last year, with headline inflation reaching an average rate of 1.7% in 2019, down from 1.9% in 2018. In 2020 and 2021, wage increases are expected to drive up inflation through the price of services. Overall, consumer price inflation is forecast at 1.9% in 2020 and 2.0% in 2021.
2.18. SLOVAKIA
After expanding by 4.0% in 2018, economic growth in Slovakia slowed markedly in 2019 to an estimated rate of 2.3%. This was mostly due to the negative contribution of net exports, a result of both lower foreign demand and temporary domestic factors, such as changes and delays in production in the large, export-focused automotive sector. Investment activity is also estimated to have weakened in 2019 after the strong growth observed in the previous year associated with the
construction of a new car factory. By contrast, domestic demand remained robust, with record-low unemployment and strong wage increases fuelling private consumption.
The economy is projected to grow at 2.2% in 2020 and 2.6% in 2021 as exports recover and domestic demand eases slightly. Private consumption growth is likely to moderate as the rate of job creation is expected to slow markedly and real wage growth is likely to calm, both in the public and the private sector. Both exports and the trade balance are expected to slowly recover in 2020-2021. New production capacities and a competitive export sector should help Slovakia’s exports regain market share. External developments constitute the main risk to the Slovak economy as it is particularly dependent on trade.
Consumer prices increased by 2.8% in 2019 and are expected to ease slightly. Services, food and energy all contributed substantially to overall inflation. The services sector is forecast to remain a key driver of price dynamics, as the increase in wages, though slowing, should continue to spill over to service prices. Inflationary pressures stemming from energy and food prices are expected to moderate. Overall, consumer price inflation is expected to settle to 2.5% in 2020 and 2.2% in 2021.
2.19. FINLAND
Finland’s real GDP is estimated to have grown 1.6% in 2019. The economic growth in the first three quarters of 2019 was faster than expected, despite worsening economic sentiment and consumer confidence. Private consumption and
-6
-4
-2
0
2
4
6
12 13 14 15 16 17 18 19 20 21
Graph 2.17: Slovenia - Real GDP growth and contributions
Real GDP (y-o-y%) Private consumption
Public consumption Investment
Changes in inventories Net exports
pps.forecast
-6
-4
-2
0
2
4
6
8
12 13 14 15 16 17 18 19 20 21
Graph 2.18: Slovakia - Real GDP growth and contributions
Real GDP (y-o-y%) Private consumption
Public consumption Investment
Changes in inventories Net exports
pps.forecast
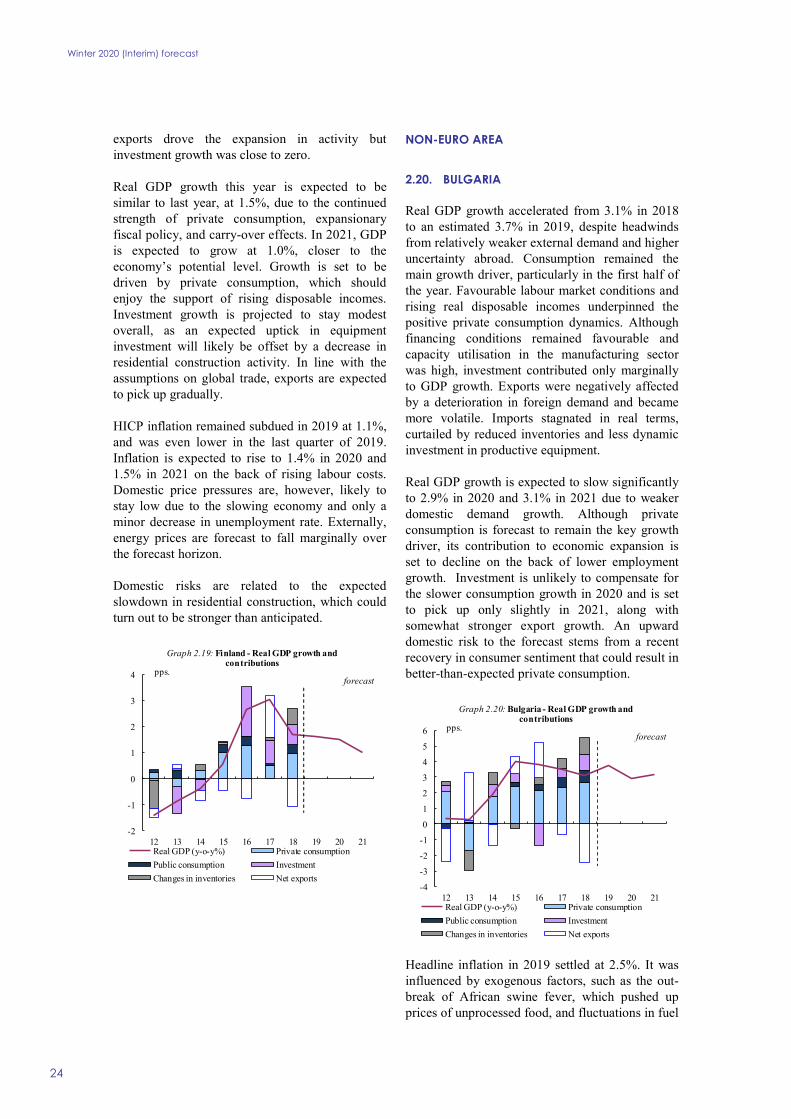
Winter 2020 (Interim) forecast
24
exports drove the expansion in activity but investment growth was close to zero.
Real GDP growth this year is expected to be similar to last year, at 1.5%, due to the continued strength of private consumption, expansionary fiscal policy, and carry-over effects. In 2021, GDP is expected to grow at 1.0%, closer to the economy’s potential level. Growth is set to be driven by private consumption, which should enjoy the support of rising disposable incomes. Investment growth is projected to stay modest overall, as an expected uptick in equipment investment will likely be offset by a decrease in residential construction activity. In line with the assumptions on global trade, exports are expected to pick up gradually.
HICP inflation remained subdued in 2019 at 1.1%, and was even lower in the last quarter of 2019. Inflation is expected to rise to 1.4% in 2020 and 1.5% in 2021 on the back of rising labour costs. Domestic price pressures are, however, likely to stay low due to the slowing economy and only a minor decrease in unemployment rate. Externally, energy prices are forecast to fall marginally over the forecast horizon.
Domestic risks are related to the expected slowdown in residential construction, which could turn out to be stronger than anticipated.
NON-EURO AREA
2.20. BULGARIA
Real GDP growth accelerated from 3.1% in 2018 to an estimated 3.7% in 2019, despite headwinds from relatively weaker external demand and higher uncertainty abroad. Consumption remained the main growth driver, particularly in the first half of the year. Favourable labour market conditions and rising real disposable incomes underpinned the positive private consumption dynamics. Although financing conditions remained favourable and capacity utilisation in the manufacturing sector was high, investment contributed only marginally to GDP growth. Exports were negatively affected by a deterioration in foreign demand and became more volatile. Imports stagnated in real terms, curtailed by reduced inventories and less dynamic investment in productive equipment.
Real GDP growth is expected to slow significantly to 2.9% in 2020 and 3.1% in 2021 due to weaker domestic demand growth. Although private consumption is forecast to remain the key growth driver, its contribution to economic expansion is set to decline on the back of lower employment growth. Investment is unlikely to compensate for the slower consumption growth in 2020 and is set to pick up only slightly in 2021, along with somewhat stronger export growth. An upward domestic risk to the forecast stems from a recent recovery in consumer sentiment that could result in better-than-expected private consumption.
Headline inflation in 2019 settled at 2.5%. It was influenced by exogenous factors, such as the out-break of African swine fever, which pushed up prices of unprocessed food, and fluctuations in fuel
-2
-1
0
1
2
3
4
12 13 14 15 16 17 18 19 20 21
Graph 2.19: Finland - Real GDP growth and contributions
Real GDP (y-o-y%) Private consumption
Public consumption Investment
Changes in inventories Net exports
pps.forecast
-4
-3
-2
-1
0
1
2
3
4
5
6
12 13 14 15 16 17 18 19 20 21
Graph 2.20: Bulgaria - Real GDP growth and contributions
Real GDP (y-o-y%) Private consumption
Public consumption Investment
Changes in inventories Net exports
pps.forecast
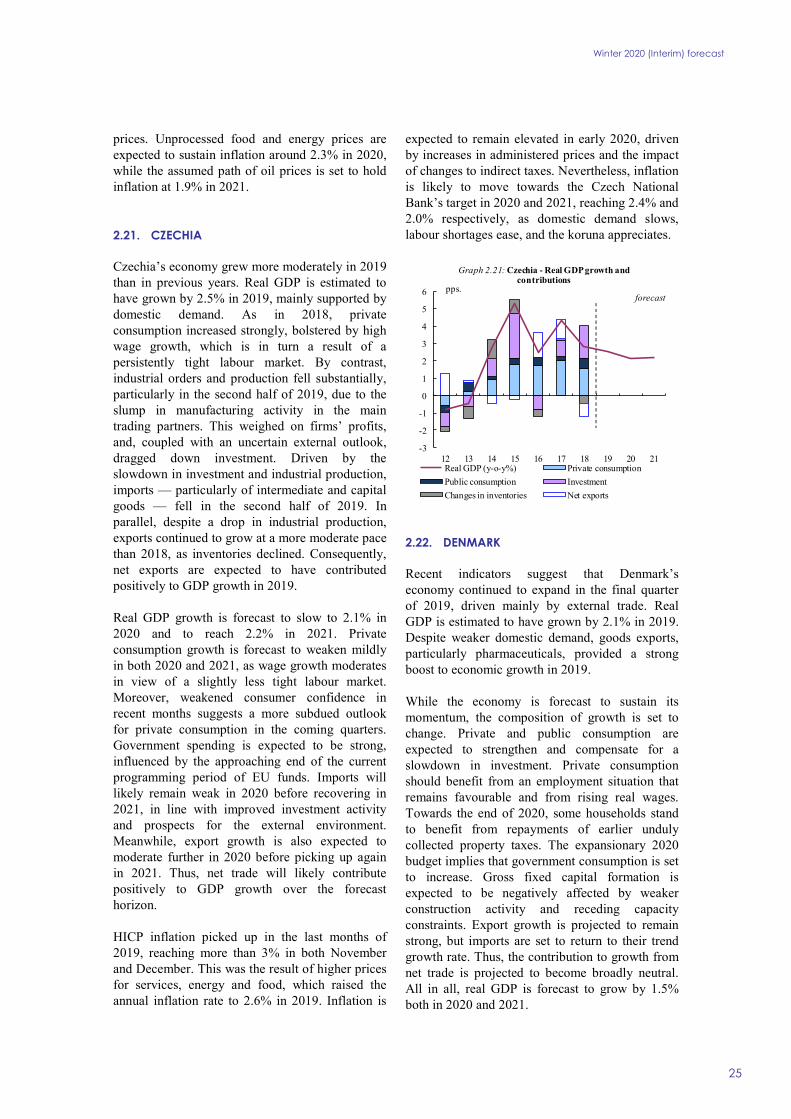
Winter 2020 (Interim) forecast
25
prices. Unprocessed food and energy prices are expected to sustain inflation around 2.3% in 2020, while the assumed path of oil prices is set to hold inflation at 1.9% in 2021.
2.21. CZECHIA
Czechia’s economy grew more moderately in 2019 than in previous years. Real GDP is estimated to have grown by 2.5% in 2019, mainly supported by domestic demand. As in 2018, private consumption increased strongly, bolstered by high wage growth, which is in turn a result of a persistently tight labour market. By contrast, industrial orders and production fell substantially, particularly in the second half of 2019, due to the slump in manufacturing activity in the main trading partners. This weighed on firms’ profits, and, coupled with an uncertain external outlook, dragged down investment. Driven by the slowdown in investment and industrial production, imports — particularly of intermediate and capital goods — fell in the second half of 2019. In parallel, despite a drop in industrial production, exports continued to grow at a more moderate pace than 2018, as inventories declined. Consequently, net exports are expected to have contributed positively to GDP growth in 2019.
Real GDP growth is forecast to slow to 2.1% in 2020 and to reach 2.2% in 2021. Private consumption growth is forecast to weaken mildly in both 2020 and 2021, as wage growth moderates in view of a slightly less tight labour market. Moreover, weakened consumer confidence in recent months suggests a more subdued outlook for private consumption in the coming quarters. Government spending is expected to be strong, influenced by the approaching end of the current programming period of EU funds. Imports will likely remain weak in 2020 before recovering in 2021, in line with improved investment activity and prospects for the external environment. Meanwhile, export growth is also expected to moderate further in 2020 before picking up again in 2021. Thus, net trade will likely contribute positively to GDP growth over the forecast horizon.
HICP inflation picked up in the last months of 2019, reaching more than 3% in both November and December. This was the result of higher prices for services, energy and food, which raised the annual inflation rate to 2.6% in 2019. Inflation is
expected to remain elevated in early 2020, driven by increases in administered prices and the impact of changes to indirect taxes. Nevertheless, inflation is likely to move towards the Czech National Bank’s target in 2020 and 2021, reaching 2.4% and 2.0% respectively, as domestic demand slows, labour shortages ease, and the koruna appreciates.
2.22. DENMARK
Recent indicators suggest that Denmark’s economy continued to expand in the final quarter of 2019, driven mainly by external trade. Real GDP is estimated to have grown by 2.1% in 2019. Despite weaker domestic demand, goods exports, particularly pharmaceuticals, provided a strong boost to economic growth in 2019.
While the economy is forecast to sustain its momentum, the composition of growth is set to change. Private and public consumption are expected to strengthen and compensate for a slowdown in investment. Private consumption should benefit from an employment situation that remains favourable and from rising real wages. Towards the end of 2020, some households stand to benefit from repayments of earlier unduly collected property taxes. The expansionary 2020 budget implies that government consumption is set to increase. Gross fixed capital formation is expected to be negatively affected by weaker construction activity and receding capacity constraints. Export growth is projected to remain strong, but imports are set to return to their trend growth rate. Thus, the contribution to growth from net trade is projected to become broadly neutral. All in all, real GDP is forecast to grow by 1.5% both in 2020 and 2021.
-3
-2
-1
0
1
2
3
4
5
6
12 13 14 15 16 17 18 19 20 21
Graph 2.21: Czechia - Real GDP growth and contributions
Real GDP (y-o-y%) Private consumption
Public consumption Investment
Changes in inventories Net exports
pps.forecast
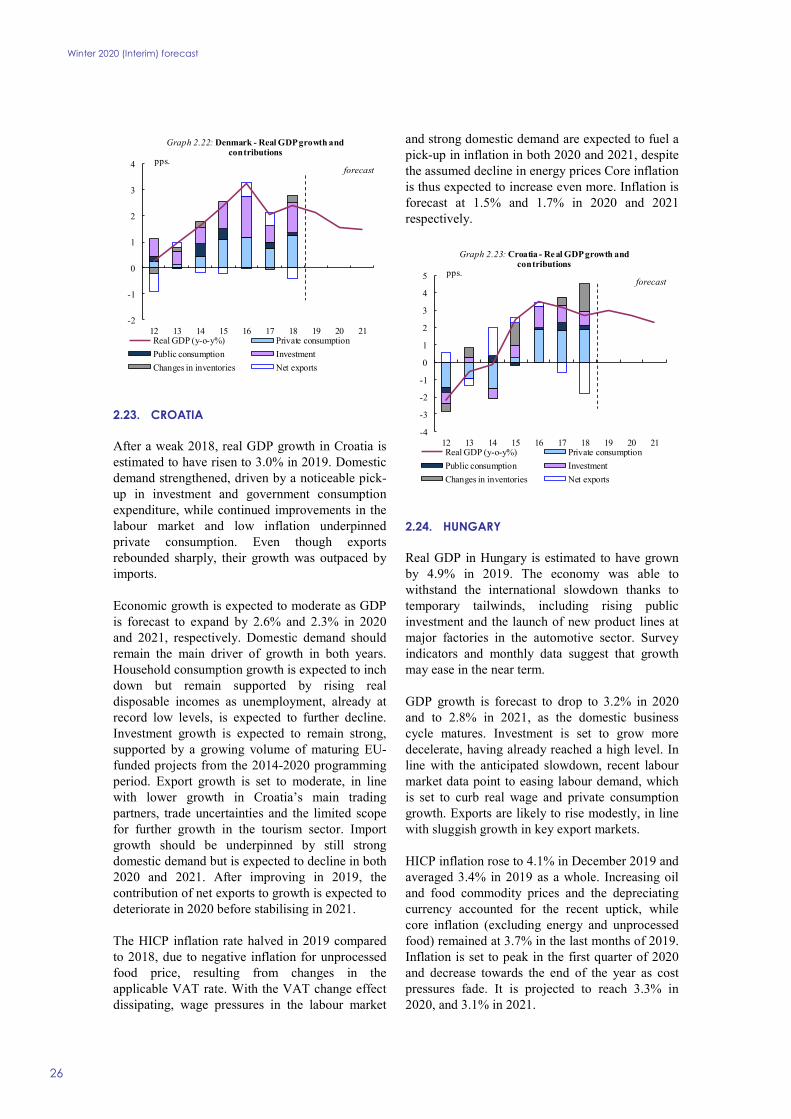
Winter 2020 (Interim) forecast
26
2.23. CROATIA
After a weak 2018, real GDP growth in Croatia is estimated to have risen to 3.0% in 2019. Domestic demand strengthened, driven by a noticeable pick-up in investment and government consumption expenditure, while continued improvements in the labour market and low inflation underpinned private consumption. Even though exports rebounded sharply, their growth was outpaced by imports.
Economic growth is expected to moderate as GDP is forecast to expand by 2.6% and 2.3% in 2020 and 2021, respectively. Domestic demand should remain the main driver of growth in both years. Household consumption growth is expected to inch down but remain supported by rising real disposable incomes as unemployment, already at record low levels, is expected to further decline. Investment growth is expected to remain strong, supported by a growing volume of maturing EU-funded projects from the 2014-2020 programming period. Export growth is set to moderate, in line with lower growth in Croatia’s main trading partners, trade uncertainties and the limited scope for further growth in the tourism sector. Import growth should be underpinned by still strong domestic demand but is expected to decline in both 2020 and 2021. After improving in 2019, the contribution of net exports to growth is expected to deteriorate in 2020 before stabilising in 2021.
The HICP inflation rate halved in 2019 compared to 2018, due to negative inflation for unprocessed food price, resulting from changes in the applicable VAT rate. With the VAT change effect dissipating, wage pressures in the labour market
and strong domestic demand are expected to fuel a pick-up in inflation in both 2020 and 2021, despite the assumed decline in energy prices Core inflation is thus expected to increase even more. Inflation is forecast at 1.5% and 1.7% in 2020 and 2021 respectively.
2.24. HUNGARY
Real GDP in Hungary is estimated to have grown by 4.9% in 2019. The economy was able to withstand the international slowdown thanks to temporary tailwinds, including rising public investment and the launch of new product lines at major factories in the automotive sector. Survey indicators and monthly data suggest that growth may ease in the near term.
GDP growth is forecast to drop to 3.2% in 2020 and to 2.8% in 2021, as the domestic business cycle matures. Investment is set to grow more decelerate, having already reached a high level. In line with the anticipated slowdown, recent labour market data point to easing labour demand, which is set to curb real wage and private consumption growth. Exports are likely to rise modestly, in line with sluggish growth in key export markets.
HICP inflation rose to 4.1% in December 2019 and averaged 3.4% in 2019 as a whole. Increasing oil and food commodity prices and the depreciating currency accounted for the recent uptick, while core inflation (excluding energy and unprocessed food) remained at 3.7% in the last months of 2019. Inflation is set to peak in the first quarter of 2020 and decrease towards the end of the year as cost pressures fade. It is projected to reach 3.3% in 2020, and 3.1% in 2021.
-2
-1
0
1
2
3
4
12 13 14 15 16 17 18 19 20 21
Graph 2.22: Denmark - Real GDP growth and contributions
Real GDP (y-o-y%) Private consumption
Public consumption Investment
Changes in inventories Net exports
pps.forecast
-4
-3
-2
-1
0
1
2
3
4
5
12 13 14 15 16 17 18 19 20 21
Graph 2.23: Croatia - Real GDP growth and contributions
Real GDP (y-o-y%) Private consumption
Public consumption Investment
Changes in inventories Net exports
pps.forecast
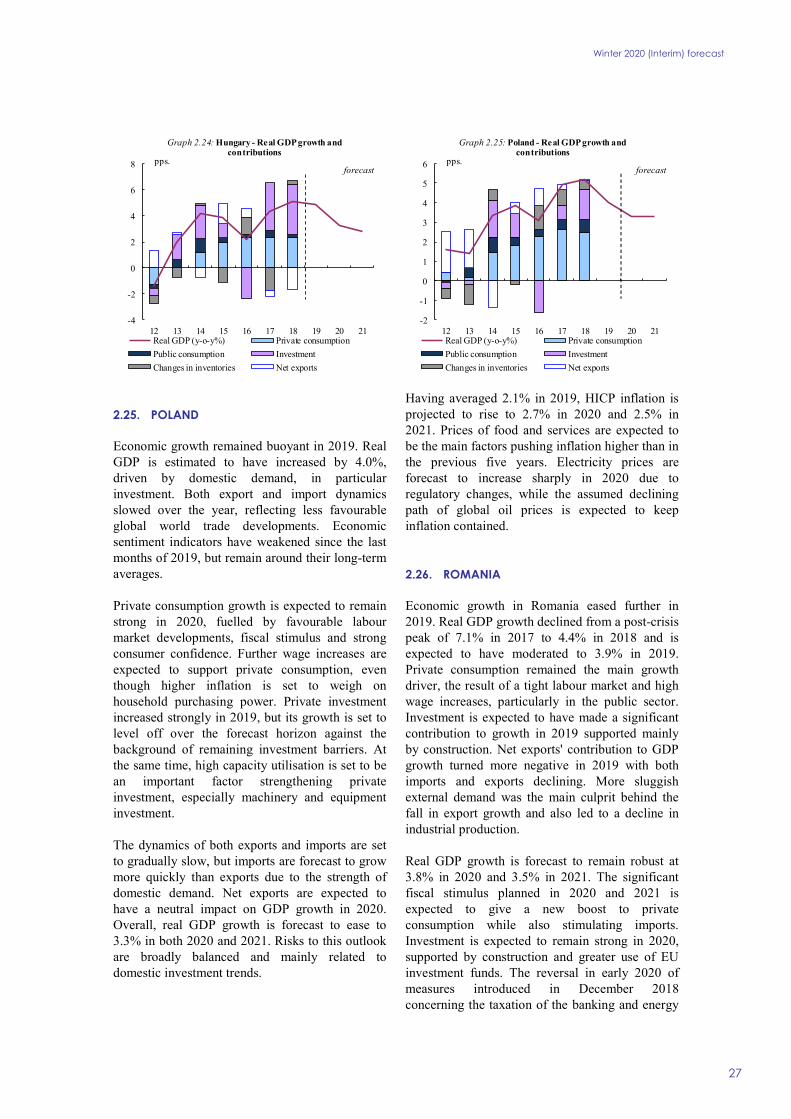
Winter 2020 (Interim) forecast
27
2.25. POLAND
Economic growth remained buoyant in 2019. Real GDP is estimated to have increased by 4.0%, driven by domestic demand, in particular investment. Both export and import dynamics slowed over the year, reflecting less favourable global world trade developments. Economic sentiment indicators have weakened since the last months of 2019, but remain around their long-term averages.
Private consumption growth is expected to remain strong in 2020, fuelled by favourable labour market developments, fiscal stimulus and strong consumer confidence. Further wage increases are expected to support private consumption, even though higher inflation is set to weigh on household purchasing power. Private investment increased strongly in 2019, but its growth is set to level off over the forecast horizon against the background of remaining investment barriers. At the same time, high capacity utilisation is set to be an important factor strengthening private investment, especially machinery and equipment investment.
The dynamics of both exports and imports are set to gradually slow, but imports are forecast to grow more quickly than exports due to the strength of domestic demand. Net exports are expected to have a neutral impact on GDP growth in 2020. Overall, real GDP growth is forecast to ease to 3.3% in both 2020 and 2021. Risks to this outlook are broadly balanced and mainly related to domestic investment trends.
Having averaged 2.1% in 2019, HICP inflation is projected to rise to 2.7% in 2020 and 2.5% in 2021. Prices of food and services are expected to be the main factors pushing inflation higher than in the previous five years. Electricity prices are forecast to increase sharply in 2020 due to regulatory changes, while the assumed declining path of global oil prices is expected to keep inflation contained.
2.26. ROMANIA
Economic growth in Romania eased further in 2019. Real GDP growth declined from a post-crisis peak of 7.1% in 2017 to 4.4% in 2018 and is expected to have moderated to 3.9% in 2019. Private consumption remained the main growth driver, the result of a tight labour market and high wage increases, particularly in the public sector. Investment is expected to have made a significant contribution to growth in 2019 supported mainly by construction. Net exports' contribution to GDP growth turned more negative in 2019 with both imports and exports declining. More sluggish external demand was the main culprit behind the fall in export growth and also led to a decline in industrial production.
Real GDP growth is forecast to remain robust at 3.8% in 2020 and 3.5% in 2021. The significant fiscal stimulus planned in 2020 and 2021 is expected to give a new boost to private consumption while also stimulating imports. Investment is expected to remain strong in 2020, supported by construction and greater use of EU investment funds. The reversal in early 2020 of measures introduced in December 2018 concerning the taxation of the banking and energy
-4
-2
0
2
4
6
8
12 13 14 15 16 17 18 19 20 21
Graph 2.24: Hungary - Real GDP growth and contributions
Real GDP (y-o-y%) Private consumption
Public consumption Investment
Changes in inventories Net exports
pps.forecast
-2
-1
0
1
2
3
4
5
6
12 13 14 15 16 17 18 19 20 21
Graph 2.25: Poland - Real GDP growth and contributions
Real GDP (y-o-y%) Private consumption
Public consumption Investment
Changes in inventories Net exports
pps.forecast
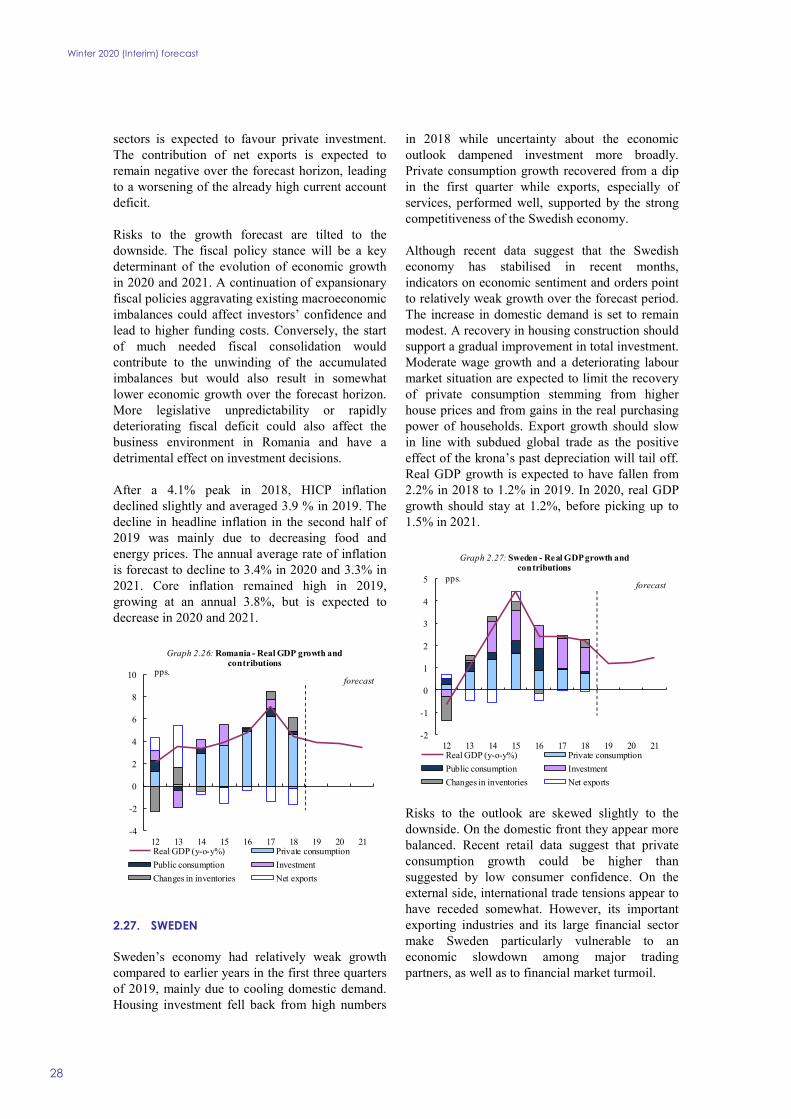
Winter 2020 (Interim) forecast
28
sectors is expected to favour private investment. The contribution of net exports is expected to remain negative over the forecast horizon, leading to a worsening of the already high current account deficit.
Risks to the growth forecast are tilted to the downside. The fiscal policy stance will be a key determinant of the evolution of economic growth in 2020 and 2021. A continuation of expansionary fiscal policies aggravating existing macroeconomic imbalances could affect investors’ confidence and lead to higher funding costs. Conversely, the start of much needed fiscal consolidation would contribute to the unwinding of the accumulated imbalances but would also result in somewhat lower economic growth over the forecast horizon. More legislative unpredictability or rapidly deteriorating fiscal deficit could also affect the business environment in Romania and have a detrimental effect on investment decisions.
After a 4.1% peak in 2018, HICP inflation declined slightly and averaged 3.9 % in 2019. The decline in headline inflation in the second half of 2019 was mainly due to decreasing food and energy prices. The annual average rate of inflation is forecast to decline to 3.4% in 2020 and 3.3% in 2021. Core inflation remained high in 2019, growing at an annual 3.8%, but is expected to decrease in 2020 and 2021.
2.27. SWEDEN
Sweden’s economy had relatively weak growth compared to earlier years in the first three quarters of 2019, mainly due to cooling domestic demand. Housing investment fell back from high numbers
in 2018 while uncertainty about the economic outlook dampened investment more broadly. Private consumption growth recovered from a dip in the first quarter while exports, especially of services, performed well, supported by the strong competitiveness of the Swedish economy.
Although recent data suggest that the Swedish economy has stabilised in recent months, indicators on economic sentiment and orders point to relatively weak growth over the forecast period. The increase in domestic demand is set to remain modest. A recovery in housing construction should support a gradual improvement in total investment. Moderate wage growth and a deteriorating labour market situation are expected to limit the recovery of private consumption stemming from higher house prices and from gains in the real purchasing power of households. Export growth should slow in line with subdued global trade as the positive effect of the krona’s past depreciation will tail off. Real GDP growth is expected to have fallen from 2.2% in 2018 to 1.2% in 2019. In 2020, real GDP growth should stay at 1.2%, before picking up to 1.5% in 2021.
Risks to the outlook are skewed slightly to the downside. On the domestic front they appear more balanced. Recent retail data suggest that private consumption growth could be higher than suggested by low consumer confidence. On the external side, international trade tensions appear to have receded somewhat. However, its important exporting industries and its large financial sector make Sweden particularly vulnerable to an economic slowdown among major trading partners, as well as to financial market turmoil.
-4
-2
0
2
4
6
8
10
12 13 14 15 16 17 18 19 20 21
Graph 2.26: Romania - Real GDP growth and contributions
Real GDP (y-o-y%) Private consumption
Public consumption Investment
Changes in inventories Net exports
pps.forecast
-2
-1
0
1
2
3
4
5
12 13 14 15 16 17 18 19 20 21
Graph 2.27: Sweden - Real GDP growth and contributions
Real GDP (y-o-y%) Private consumption
Public consumption Investment
Changes in inventories Net exports
pps.forecast
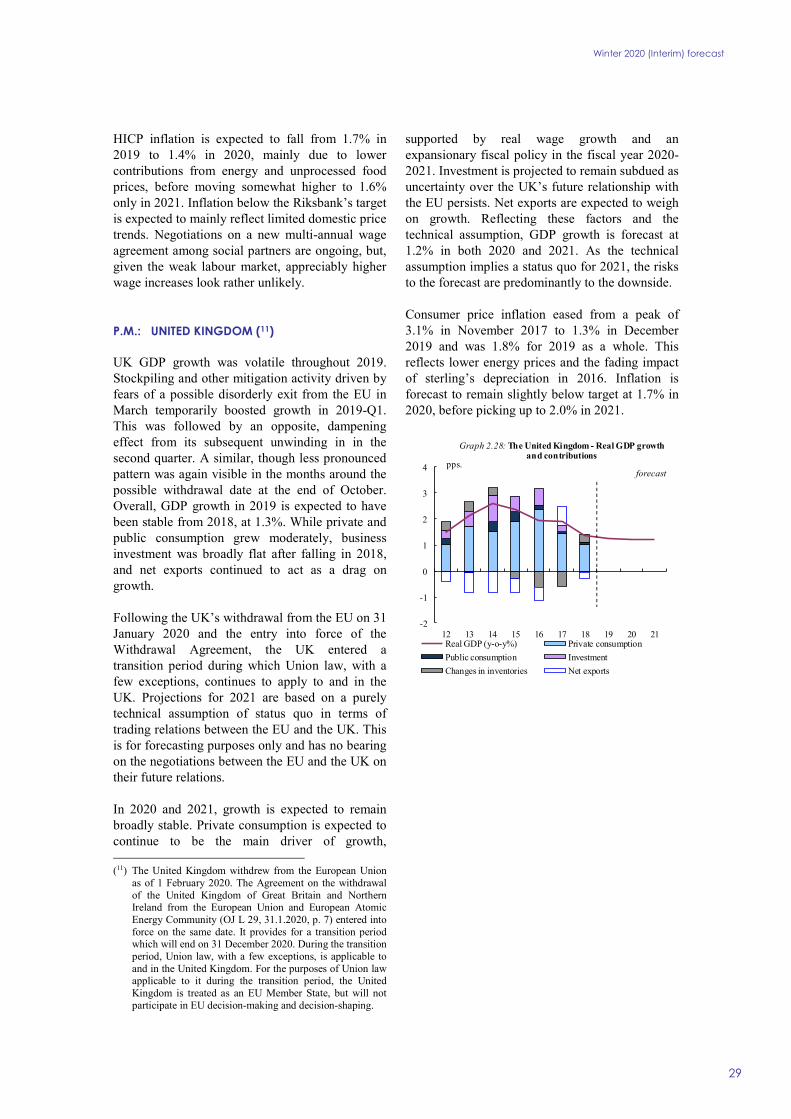
Winter 2020 (Interim) forecast
29
HICP inflation is expected to fall from 1.7% in 2019 to 1.4% in 2020, mainly due to lower contributions from energy and unprocessed food prices, before moving somewhat higher to 1.6% only in 2021. Inflation below the Riksbank’s target is expected to mainly reflect limited domestic price trends. Negotiations on a new multi-annual wage agreement among social partners are ongoing, but, given the weak labour market, appreciably higher wage increases look rather unlikely.
P.M.: UNITED KINGDOM (11)
UK GDP growth was volatile throughout 2019. Stockpiling and other mitigation activity driven by fears of a possible disorderly exit from the EU in March temporarily boosted growth in 2019-Q1. This was followed by an opposite, dampening effect from its subsequent unwinding in in the second quarter. A similar, though less pronounced pattern was again visible in the months around the possible withdrawal date at the end of October. Overall, GDP growth in 2019 is expected to have been stable from 2018, at 1.3%. While private and public consumption grew moderately, business investment was broadly flat after falling in 2018, and net exports continued to act as a drag on growth.
Following the UK’s withdrawal from the EU on 31 January 2020 and the entry into force of the Withdrawal Agreement, the UK entered a transition period during which Union law, with a few exceptions, continues to apply to and in the UK. Projections for 2021 are based on a purely technical assumption of status quo in terms of trading relations between the EU and the UK. This is for forecasting purposes only and has no bearing on the negotiations between the EU and the UK on their future relations.
In 2020 and 2021, growth is expected to remain broadly stable. Private consumption is expected to continue to be the main driver of growth, (11) The United Kingdom withdrew from the European Union
as of 1 February 2020. The Agreement on the withdrawal of the United Kingdom of Great Britain and Northern Ireland from the European Union and European Atomic Energy Community (OJ L 29, 31.1.2020, p. 7) entered into force on the same date. It provides for a transition period which will end on 31 December 2020. During the transition period, Union law, with a few exceptions, is applicable to and in the United Kingdom. For the purposes of Union law applicable to it during the transition period, the United Kingdom is treated as an EU Member State, but will not participate in EU decision-making and decision-shaping.
supported by real wage growth and an expansionary fiscal policy in the fiscal year 2020-2021. Investment is projected to remain subdued as uncertainty over the UK’s future relationship with the EU persists. Net exports are expected to weigh on growth. Reflecting these factors and the technical assumption, GDP growth is forecast at 1.2% in both 2020 and 2021. As the technical assumption implies a status quo for 2021, the risks to the forecast are predominantly to the downside.
Consumer price inflation eased from a peak of 3.1% in November 2017 to 1.3% in December 2019 and was 1.8% for 2019 as a whole. This reflects lower energy prices and the fading impact of sterling’s depreciation in 2016. Inflation is forecast to remain slightly below target at 1.7% in 2020, before picking up to 2.0% in 2021.
-2
-1
0
1
2
3
4
12 13 14 15 16 17 18 19 20 21
Graph 2.28: The United Kingdom - Real GDP growth and contributions
Real GDP (y-o-y%) Private consumption
Public consumption Investment
Changes in inventories Net exports
pps.forecast
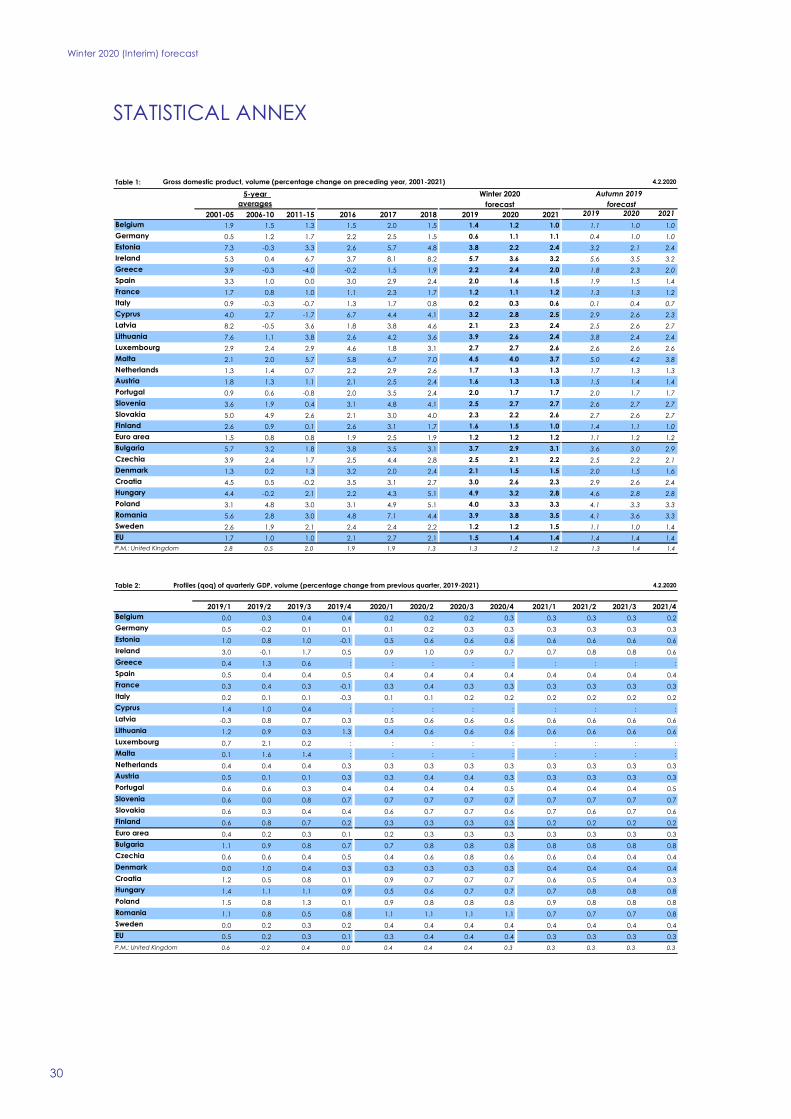
STATISTICAL ANNEX
Winter 2020 (Interim) forecast
30
Table .1:Table 1: 4.2.2020
5-year forecast forecast
2001-05 2006-10 2011-15 2016 2017 2018 2019 2020 2021 2019 2020 2021
1.9 1.5 1.3 1.5 2.0 1.5 1.4 1.2 1.0 1.1 1.0 1.0
0.5 1.2 1.7 2.2 2.5 1.5 0.6 1.1 1.1 0.4 1.0 1.0
7.3 -0.3 3.3 2.6 5.7 4.8 3.8 2.2 2.4 3.2 2.1 2.4
5.3 0.4 6.7 3.7 8.1 8.2 5.7 3.6 3.2 5.6 3.5 3.2
3.9 -0.3 -4.0 -0.2 1.5 1.9 2.2 2.4 2.0 1.8 2.3 2.0
3.3 1.0 0.0 3.0 2.9 2.4 2.0 1.6 1.5 1.9 1.5 1.4
1.7 0.8 1.0 1.1 2.3 1.7 1.2 1.1 1.2 1.3 1.3 1.2
0.9 -0.3 -0.7 1.3 1.7 0.8 0.2 0.3 0.6 0.1 0.4 0.7
4.0 2.7 -1.7 6.7 4.4 4.1 3.2 2.8 2.5 2.9 2.6 2.3
8.2 -0.5 3.6 1.8 3.8 4.6 2.1 2.3 2.4 2.5 2.6 2.7
Lithuania 7.6 1.1 3.8 2.6 4.2 3.6 3.9 2.6 2.4 3.8 2.4 2.4
2.9 2.4 2.9 4.6 1.8 3.1 2.7 2.7 2.6 2.6 2.6 2.6
2.1 2.0 5.7 5.8 6.7 7.0 4.5 4.0 3.7 5.0 4.2 3.8
1.3 1.4 0.7 2.2 2.9 2.6 1.7 1.3 1.3 1.7 1.3 1.3
1.8 1.3 1.1 2.1 2.5 2.4 1.6 1.3 1.3 1.5 1.4 1.4
0.9 0.6 -0.8 2.0 3.5 2.4 2.0 1.7 1.7 2.0 1.7 1.7
3.6 1.9 0.4 3.1 4.8 4.1 2.5 2.7 2.7 2.6 2.7 2.7
5.0 4.9 2.6 2.1 3.0 4.0 2.3 2.2 2.6 2.7 2.6 2.7
2.6 0.9 0.1 2.6 3.1 1.7 1.6 1.5 1.0 1.4 1.1 1.0
1.5 0.8 0.8 1.9 2.5 1.9 1.2 1.2 1.2 1.1 1.2 1.2
5.7 3.2 1.8 3.8 3.5 3.1 3.7 2.9 3.1 3.6 3.0 2.9
3.9 2.4 1.7 2.5 4.4 2.8 2.5 2.1 2.2 2.5 2.2 2.1
1.3 0.2 1.3 3.2 2.0 2.4 2.1 1.5 1.5 2.0 1.5 1.6
4.5 0.5 -0.2 3.5 3.1 2.7 3.0 2.6 2.3 2.9 2.6 2.4
4.4 -0.2 2.1 2.2 4.3 5.1 4.9 3.2 2.8 4.6 2.8 2.8
3.1 4.8 3.0 3.1 4.9 5.1 4.0 3.3 3.3 4.1 3.3 3.3
5.6 2.8 3.0 4.8 7.1 4.4 3.9 3.8 3.5 4.1 3.6 3.3
2.6 1.9 2.1 2.4 2.4 2.2 1.2 1.2 1.5 1.1 1.0 1.4
EU 1.7 1.0 1.0 2.1 2.7 2.1 1.5 1.4 1.4 1.4 1.4 1.42.8 0.5 2.0 1.9 1.9 1.3 1.3 1.2 1.2 1.3 1.4 1.4
Spain
Germany
P.M.: United Kingdom
Bulgaria
Italy
Poland
Slovenia
Malta
Czechia
Slovakia
Cyprus
Sweden
Euro area
Romania
Denmark
Netherlands
Greece
Autumn 2019
Gross domestic product, volume (percentage change on preceding year, 2001-2021)
France
Hungary
Portugal
Luxembourg
Estonia
Winter 2020
Ireland
Finland
Latvia
Belgium
averages
Croatia
Austria
Table .2:Table 2: 4.2.2020
2019/1 2019/2 2019/3 2019/4 2020/1 2020/2 2020/3 2020/4 2021/1 2021/2 2021/3 2021/4
0.0 0.3 0.4 0.4 0.2 0.2 0.2 0.3 0.3 0.3 0.3 0.2
0.5 -0.2 0.1 0.1 0.1 0.2 0.3 0.3 0.3 0.3 0.3 0.3
1.0 0.8 1.0 -0.1 0.5 0.6 0.6 0.6 0.6 0.6 0.6 0.6
3.0 -0.1 1.7 0.5 0.9 1.0 0.9 0.7 0.7 0.8 0.8 0.6
0.4 1.3 0.6 : : : : : : : : :
0.5 0.4 0.4 0.5 0.4 0.4 0.4 0.4 0.4 0.4 0.4 0.4
0.3 0.4 0.3 -0.1 0.3 0.4 0.3 0.3 0.3 0.3 0.3 0.3
0.2 0.1 0.1 -0.3 0.1 0.1 0.2 0.2 0.2 0.2 0.2 0.2
1.4 1.0 0.4 : : : : : : : : :
-0.3 0.8 0.7 0.3 0.5 0.6 0.6 0.6 0.6 0.6 0.6 0.6
Lithuania 1.2 0.9 0.3 1.3 0.4 0.6 0.6 0.6 0.6 0.6 0.6 0.6
0.7 2.1 0.2 : : : : : : : : :
0.1 1.6 1.4 : : : : : : : : :
0.4 0.4 0.4 0.3 0.3 0.3 0.3 0.3 0.3 0.3 0.3 0.3
0.5 0.1 0.1 0.3 0.3 0.4 0.4 0.3 0.3 0.3 0.3 0.3
0.6 0.6 0.3 0.4 0.4 0.4 0.4 0.5 0.4 0.4 0.4 0.5
0.6 0.0 0.8 0.7 0.7 0.7 0.7 0.7 0.7 0.7 0.7 0.7
0.6 0.3 0.4 0.4 0.6 0.7 0.7 0.6 0.7 0.6 0.7 0.6
0.6 0.8 0.7 0.2 0.3 0.3 0.3 0.3 0.2 0.2 0.2 0.2
0.4 0.2 0.3 0.1 0.2 0.3 0.3 0.3 0.3 0.3 0.3 0.3
1.1 0.9 0.8 0.7 0.7 0.8 0.8 0.8 0.8 0.8 0.8 0.8
0.6 0.6 0.4 0.5 0.4 0.6 0.8 0.6 0.6 0.4 0.4 0.4
0.0 1.0 0.4 0.3 0.3 0.3 0.3 0.3 0.4 0.4 0.4 0.4
1.2 0.5 0.8 0.1 0.9 0.7 0.7 0.7 0.6 0.5 0.4 0.3
1.4 1.1 1.1 0.9 0.5 0.6 0.7 0.7 0.7 0.8 0.8 0.8
1.5 0.8 1.3 0.1 0.9 0.8 0.8 0.8 0.9 0.8 0.8 0.8
1.1 0.8 0.5 0.8 1.1 1.1 1.1 1.1 0.7 0.7 0.7 0.8
0.0 0.2 0.3 0.2 0.4 0.4 0.4 0.4 0.4 0.4 0.4 0.4
0.5 0.2 0.3 0.1 0.3 0.4 0.4 0.4 0.3 0.3 0.3 0.3
0.6 -0.2 0.4 0.0 0.4 0.4 0.4 0.3 0.3 0.3 0.3 0.3P.M.: United Kingdom
Bulgaria
Luxembourg
Italy
Poland
Slovenia
Malta
Czechia
Cyprus
Romania
Slovakia
Netherlands
Denmark
Finland
Latvia
EU
Sweden
Croatia
Austria
Spain
Profiles (qoq) of quarterly GDP, volume (percentage change from previous quarter, 2019-2021)
Belgium
Euro area
Germany
Hungary
Portugal
France
Estonia
Ireland
Greece
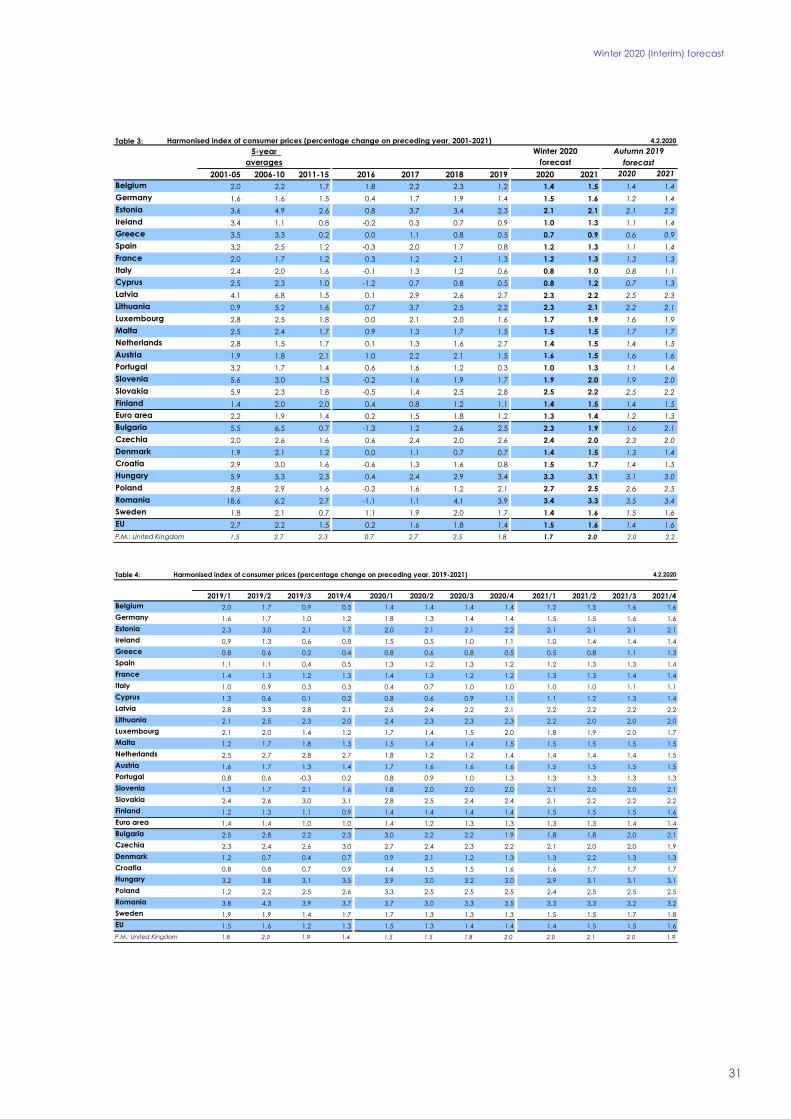
Winter 2020 (Interim) forecast
31
Table .3:Table 3: 4.2.2020
5-year
2001-05 2006-10 2011-15 2016 2017 2018 2019 2020 2021 2020 2021
2.0 2.2 1.7 1.8 2.2 2.3 1.2 1.4 1.5 1.4 1.4
1.6 1.6 1.5 0.4 1.7 1.9 1.4 1.5 1.6 1.2 1.4
3.6 4.9 2.6 0.8 3.7 3.4 2.3 2.1 2.1 2.1 2.2
3.4 1.1 0.8 -0.2 0.3 0.7 0.9 1.0 1.3 1.1 1.4
3.5 3.3 0.2 0.0 1.1 0.8 0.5 0.7 0.9 0.6 0.9
3.2 2.5 1.2 -0.3 2.0 1.7 0.8 1.2 1.3 1.1 1.4
2.0 1.7 1.2 0.3 1.2 2.1 1.3 1.2 1.3 1.3 1.3
2.4 2.0 1.6 -0.1 1.3 1.2 0.6 0.8 1.0 0.8 1.1
2.5 2.3 1.0 -1.2 0.7 0.8 0.5 0.8 1.2 0.7 1.3
4.1 6.8 1.5 0.1 2.9 2.6 2.7 2.3 2.2 2.5 2.3
Lithuania 0.9 5.2 1.6 0.7 3.7 2.5 2.2 2.3 2.1 2.2 2.1
2.8 2.5 1.8 0.0 2.1 2.0 1.6 1.7 1.9 1.6 1.9
2.5 2.4 1.7 0.9 1.3 1.7 1.5 1.5 1.5 1.7 1.7
2.8 1.5 1.7 0.1 1.3 1.6 2.7 1.4 1.5 1.4 1.5
1.9 1.8 2.1 1.0 2.2 2.1 1.5 1.6 1.5 1.6 1.6
3.2 1.7 1.4 0.6 1.6 1.2 0.3 1.0 1.3 1.1 1.4
5.6 3.0 1.3 -0.2 1.6 1.9 1.7 1.9 2.0 1.9 2.0
5.9 2.3 1.8 -0.5 1.4 2.5 2.8 2.5 2.2 2.5 2.2
1.4 2.0 2.0 0.4 0.8 1.2 1.1 1.4 1.5 1.4 1.5
2.2 1.9 1.4 0.2 1.5 1.8 1.2 1.3 1.4 1.2 1.3
5.5 6.5 0.7 -1.3 1.2 2.6 2.5 2.3 1.9 1.6 2.1
2.0 2.6 1.6 0.6 2.4 2.0 2.6 2.4 2.0 2.3 2.0
1.9 2.1 1.2 0.0 1.1 0.7 0.7 1.4 1.5 1.3 1.4
2.9 3.0 1.6 -0.6 1.3 1.6 0.8 1.5 1.7 1.4 1.5
5.9 5.3 2.3 0.4 2.4 2.9 3.4 3.3 3.1 3.1 3.0
2.8 2.9 1.6 -0.2 1.6 1.2 2.1 2.7 2.5 2.6 2.5
18.6 6.2 2.7 -1.1 1.1 4.1 3.9 3.4 3.3 3.5 3.4
1.8 2.1 0.7 1.1 1.9 2.0 1.7 1.4 1.6 1.5 1.6
2.7 2.2 1.5 0.2 1.6 1.8 1.4 1.5 1.6 1.4 1.6
1.5 2.7 2.3 0.7 2.7 2.5 1.8 1.7 2.0 2.0 2.2P.M.: United Kingdom
Bulgaria
Italy
Poland
Slovenia
EU
Euro area
Hungary
Portugal
Luxembourg
RomaniaSweden
Malta
Croatia
Austria
Harmonised index of consumer prices (percentage change on preceding year, 2001-2021)
Belgium
forecastaveragesAutumn 2019
forecastWinter 2020
Spain
Germany
Denmark
Netherlands
Greece
Finland
Latvia
Ireland
Czechia
Slovakia
Cyprus
France
Estonia
Table .4:Table 4: 4.2.2020
2019/1 2019/2 2019/3 2019/4 2020/1 2020/2 2020/3 2020/4 2021/1 2021/2 2021/3 2021/4
2.0 1.7 0.9 0.5 1.4 1.4 1.4 1.4 1.2 1.5 1.6 1.6
1.6 1.7 1.0 1.2 1.8 1.3 1.4 1.4 1.5 1.5 1.6 1.6
2.3 3.0 2.1 1.7 2.0 2.1 2.1 2.2 2.1 2.1 2.1 2.1
0.9 1.3 0.6 0.8 1.5 0.5 1.0 1.1 1.0 1.4 1.4 1.4
0.8 0.6 0.2 0.4 0.8 0.6 0.8 0.5 0.5 0.8 1.1 1.3
1.1 1.1 0.4 0.5 1.3 1.2 1.3 1.2 1.2 1.3 1.3 1.4
1.4 1.3 1.2 1.3 1.4 1.3 1.2 1.2 1.3 1.3 1.4 1.4
1.0 0.9 0.3 0.3 0.4 0.7 1.0 1.0 1.0 1.0 1.1 1.1
1.3 0.6 0.1 0.2 0.8 0.6 0.9 1.1 1.1 1.2 1.3 1.4
2.8 3.3 2.8 2.1 2.5 2.4 2.2 2.1 2.2 2.2 2.2 2.2
Lithuania 2.1 2.5 2.3 2.0 2.4 2.3 2.3 2.3 2.2 2.0 2.0 2.0
2.1 2.0 1.4 1.2 1.7 1.4 1.5 2.0 1.8 1.9 2.0 1.7
1.2 1.7 1.8 1.3 1.5 1.4 1.4 1.5 1.5 1.5 1.5 1.5
2.5 2.7 2.8 2.7 1.8 1.2 1.2 1.4 1.4 1.4 1.4 1.5
1.6 1.7 1.3 1.4 1.7 1.6 1.6 1.6 1.5 1.5 1.5 1.5
0.8 0.6 -0.3 0.2 0.8 0.9 1.0 1.3 1.3 1.3 1.3 1.3
1.3 1.7 2.1 1.6 1.8 2.0 2.0 2.0 2.1 2.0 2.0 2.1
2.4 2.6 3.0 3.1 2.8 2.5 2.4 2.4 2.1 2.2 2.2 2.2
1.2 1.3 1.1 0.9 1.4 1.4 1.4 1.4 1.5 1.5 1.5 1.6
1.4 1.4 1.0 1.0 1.4 1.2 1.3 1.3 1.3 1.3 1.4 1.4
2.5 2.8 2.2 2.3 3.0 2.2 2.2 1.9 1.8 1.8 2.0 2.1
2.3 2.4 2.6 3.0 2.7 2.4 2.3 2.2 2.1 2.0 2.0 1.9
1.2 0.7 0.4 0.7 0.9 2.1 1.2 1.3 1.3 2.2 1.3 1.3
0.8 0.8 0.7 0.9 1.4 1.5 1.5 1.6 1.6 1.7 1.7 1.7
3.2 3.8 3.1 3.5 3.9 3.0 3.2 3.0 2.9 3.1 3.1 3.1
1.2 2.2 2.5 2.6 3.3 2.5 2.5 2.5 2.4 2.5 2.5 2.5
3.8 4.3 3.9 3.7 3.7 3.0 3.3 3.5 3.3 3.3 3.2 3.2
1.9 1.9 1.4 1.7 1.7 1.3 1.3 1.3 1.5 1.5 1.7 1.8
1.5 1.6 1.2 1.3 1.5 1.3 1.4 1.4 1.4 1.5 1.5 1.6
1.8 2.0 1.9 1.4 1.5 1.5 1.8 2.0 2.0 2.1 2.0 1.9P.M.: United Kingdom
Bulgaria
Luxembourg
Italy
Poland
Slovenia
Malta
Czechia
Cyprus
Romania
Slovakia
Netherlands
Denmark
Finland
Latvia
EU
Sweden
Croatia
Austria
Spain
Harmonised index of consumer prices (percentage change on preceding year, 2019-2021)
Belgium
Euro area
Germany
Hungary
Portugal
France
Estonia
Ireland
Greece
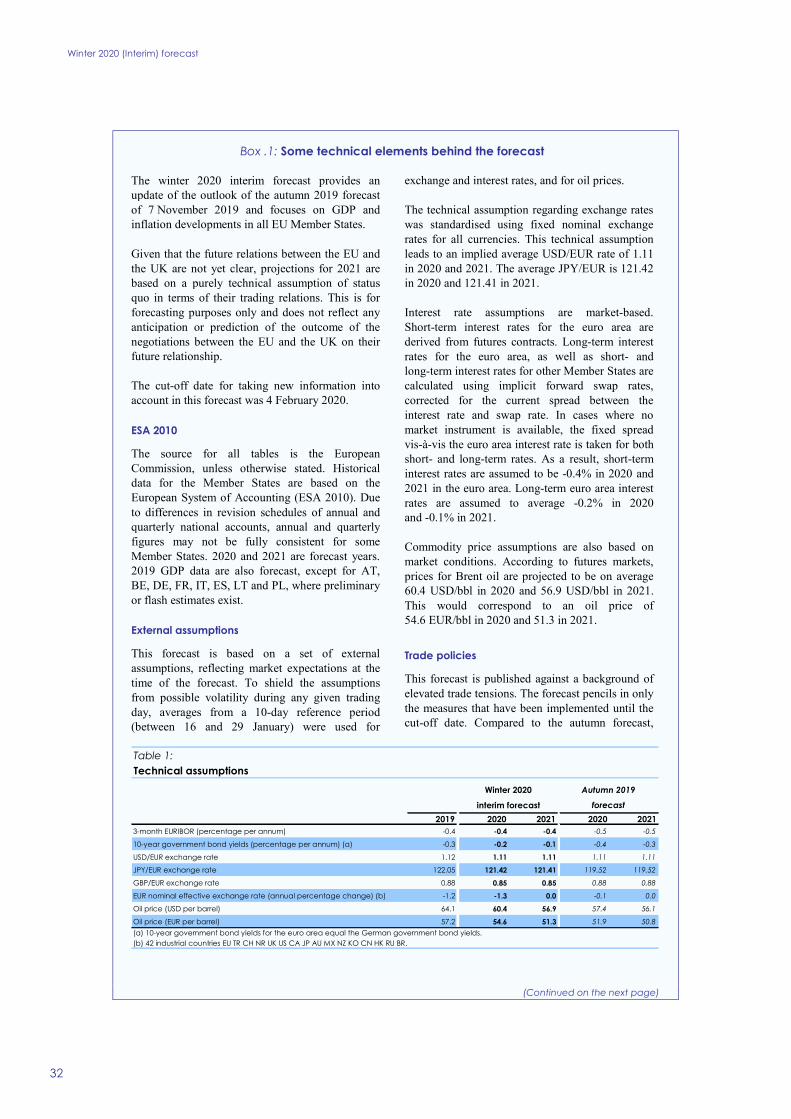
Winter 2020 (Interim) forecast
32
(Continued on the next page)
Box .1: Some technical elements behind the forecast
The winter 2020 interim forecast provides an update of the outlook of the autumn 2019 forecast of 7 November 2019 and focuses on GDP and inflation developments in all EU Member States.
Given that the future relations between the EU and the UK are not yet clear, projections for 2021 are based on a purely technical assumption of status quo in terms of their trading relations. This is for forecasting purposes only and does not reflect any anticipation or prediction of the outcome of the negotiations between the EU and the UK on their future relationship.
The cut-off date for taking new information into account in this forecast was 4 February 2020.
ESA 2010
The source for all tables is the European Commission, unless otherwise stated. Historical data for the Member States are based on the European System of Accounting (ESA 2010). Due to differences in revision schedules of annual and quarterly national accounts, annual and quarterly figures may not be fully consistent for some Member States. 2020 and 2021 are forecast years. 2019 GDP data are also forecast, except for AT, BE, DE, FR, IT, ES, LT and PL, where preliminary or flash estimates exist.
External assumptions
This forecast is based on a set of external assumptions, reflecting market expectations at the time of the forecast. To shield the assumptions from possible volatility during any given trading day, averages from a 10-day reference period (between 16 and 29 January) were used for
exchange and interest rates, and for oil prices.
The technical assumption regarding exchange rates was standardised using fixed nominal exchange rates for all currencies. This technical assumption leads to an implied average USD/EUR rate of 1.11 in 2020 and 2021. The average JPY/EUR is 121.42 in 2020 and 121.41 in 2021.
Interest rate assumptions are market-based. Short-term interest rates for the euro area are derived from futures contracts. Long-term interest rates for the euro area, as well as short- and long-term interest rates for other Member States are calculated using implicit forward swap rates, corrected for the current spread between the interest rate and swap rate. In cases where no market instrument is available, the fixed spread vis-à-vis the euro area interest rate is taken for both short- and long-term rates. As a result, short-term interest rates are assumed to be -0.4% in 2020 and 2021 in the euro area. Long-term euro area interest rates are assumed to average -0.2% in 2020 and -0.1% in 2021.
Commodity price assumptions are also based on market conditions. According to futures markets, prices for Brent oil are projected to be on average 60.4 USD/bbl in 2020 and 56.9 USD/bbl in 2021. This would correspond to an oil price of 54.6 EUR/bbl in 2020 and 51.3 in 2021.
Trade policies
This forecast is published against a background of elevated trade tensions. The forecast pencils in only the measures that have been implemented until the cut-off date. Compared to the autumn forecast,
Table 1:Technical assumptions
2019 2020 2021 2020 20213-month EURIBOR (percentage per annum) -0.4 -0.4 -0.4 -0.5 -0.5
10-year government bond yields (percentage per annum) (a) -0.3 -0.2 -0.1 -0.4 -0.3
USD/EUR exchange rate 1.12 1.11 1.11 1.11 1.11
JPY/EUR exchange rate 122.05 121.42 121.41 119.52 119.52
GBP/EUR exchange rate 0.88 0.85 0.85 0.88 0.88
EUR nominal effective exchange rate (annual percentage change) (b) -1.2 -1.3 0.0 -0.1 0.0
Oil price (USD per barrel) 64.1 60.4 56.9 57.4 56.1
Oil price (EUR per barrel) 57.2 54.6 51.3 51.9 50.8
(a) 10-year government bond yields for the euro area equal the German government bond yields.(b) 42 industrial countries EU TR CH NR UK US CA JP AU MX NZ KO CN HK RU BR.
Winter 2020
interim forecast
Autumn 2019
forecast
Winter 2020 (Interim) forecast
33
Acknowledgements
This report was prepared in the Directorate-General for Economic and Financial Affairs under the direction of Maarten Verwey, Director General, and José Eduardo Leandro, Director for “Policy, strategy and communication”. Executive responsibilities were attached to Björn Döhring, Head of Unit “Economic situation, forecasts, business and consumer surveys”, Evelyne Hespel, Head of Sector “Macro-economic forecasts and short-term economic developments”, and the forecast coordinators, Reuben Borg and Alexandru Zeana.
The report benefitted from contributions by Ronald Albers, Aurelija Anciūtė, Wojciech Balcerowicz, Nicolas Bernier Abad, Bogdan Bogdanov, Reuben Borg, Lucian Briciu, Kathleen Burkhardt, Oliver Dieckmann, Angela Droussiotou, Hugo Ferradáns Ramonde, Norbert Gaál, Oscar Gómez Lacalle, Jana Hoeffken, Renata Hruzova, Zuzanna Iskierka, Anne Jaubertie, Isabelle Justo, Anastasia Kouskouni, Radoslav Krastev, Ivan Kusen, Giovanna Mazzeo Ortolani, João Miguel Leal, David Lopes, Ivan Lozev, Natalie Lubenets, Maria Maierean, Mart Maiväli, Gábor Márk Pellényi, Arian Peric, Marie-Luise Rüd, Maja Samanovic, Michael Sket, Peeter Soidla, Matija Šušković, Septimiu Szabo, Tsvetan Tsalinski, Ismael Valdés Fernández, Milda Valentinaitė, Valerie Vandermeulen, Michael Vedsø, Martina von Terzi, Milan Vyskrabka, Bart Wilbrink, Stephan Wolters, Przemysław Woźniak, Alexandru Zeana and Ingars Zustrups.
Statistical and layout assistance was provided by Susanne Hoffmann and Tomasz Zdrodowski.
Support in editing was provided by Peter Koh.
Box (continued)
there is the following change to the baseline scenario:
On 15 January 2020, the US and China signed a ‘Phase One’ trade deal which suspended the introduction of the 15% US tariff scheduled to take effect on 15 December on 160 billion USD of imports from China, while the 15% US tariff rate on approximately 120 billion USD introduced in September will be cut in half to 7.5% in mid-February (the 25% tariff rate on approximately 250 billion USD of Chinese exports will be maintained). In turn, China cancelled the retaliatory tariffs scheduled to take effect on December 15. Furthermore, China committed to increase its US imports by 200 billion USD over the next two years compared to 2017 levels. The agreement also includes clauses on intellectual property, dispute resolution, among others, and has led the US administration to remove China from its ‘currency manipulator’ list.
Working-day adjustment
The number of working days may differ from one year to another. The Commission’s annual GDP forecasts are not adjusted for the number of working days, but quarterly forecasts are. The working-day effect in the EU and the euro area is estimated to be limited in 2019 and 2021, implying that working-day adjusted and unadjusted annual growth rates differ only marginally (by up to ±0.1pps.). In 2020, a higher number of working days in Germany and some other countries is set to create exceptionally strong positive calendar effects. Accordingly, the Commission’s (non-adjusted) forecast is higher than the calendar-adjusted forecast for 2020 by close to ¼ pps. in the euro area.
Geographical zones
Euro area: EA19 (BE, DE, EE, IE, EL, ES, FR, IT, CY, LV, LT, LU, MT, NL, AT, PT, SI, SK and FI).
European Union: EU (EA19, BG, CZ, DK, HR, HU, PL, RO, and SE).

EUROPEAN ECONOMY INSTITUTIONAL SERIES European Economy Institutional series can be accessed and downloaded free of charge from the following address: https://ec.europa.eu/info/publications/economic-and-financial-affairs-publications_en?field_eurovoc_taxonomy_target_id_selective=All&field_core_nal_countries_tid_selective=All&field_core_date_published_value[value][year]=All&field_core_tags_tid_i18n=22621. Titles published before July 2015 can be accessed and downloaded free of charge from: • http://ec.europa.eu/economy_finance/publications/european_economy/index_en.htm
(the main reports, e.g. Economic Forecasts) • http://ec.europa.eu/economy_finance/publications/occasional_paper/index_en.htm
(the Occasional Papers) • http://ec.europa.eu/economy_finance/publications/qr_euro_area/index_en.htm
(the Quarterly Reports on the Euro Area)


GETTING IN TOUCH WITH THE EU In person All over the European Union there are hundreds of Europe Direct Information Centres. You can find the address of the centre nearest you at: http://europa.eu/contact. On the phone or by e-mail Europe Direct is a service that answers your questions about the European Union. You can contact this service:
• by freephone: 00 800 6 7 8 9 10 11 (certain operators may charge for these calls),
• at the following standard number: +32 22999696 or • by electronic mail via: http://europa.eu/contact.
FINDING INFORMATION ABOUT THE EU Online Information about the European Union in all the official languages of the EU is available on the Europa website at: http://europa.eu. EU Publications You can download or order free and priced EU publications from EU Bookshop at: http://publications.europa.eu/bookshop. Multiple copies of free publications may be obtained by contacting Europe Direct or your local information centre (see http://europa.eu/contact). EU law and related documents For access to legal information from the EU, including all EU law since 1951 in all the official language versions, go to EUR-Lex at: http://eur-lex.europa.eu. Open data from the EU The EU Open Data Portal (http://data.europa.eu/euodp/en/data) provides access to datasets from the EU. Data can be downloaded and reused for free, both for commercial and non-commercial purposes.