Embed Size (px)
Citation preview

European Economic Association
Top Incomes in Germany and Switzerland Over the Twentieth CenturyAuthor(s): Fabien DellReviewed work(s):Source: Journal of the European Economic Association, Vol. 3, No. 2/3, Papers andProceedings of the Nineteenth Annual Congress of the European Economic Association (Apr. -May, 2005), pp. 412-421Published by: The MIT Press on behalf of European Economic AssociationStable URL: http://www.jstor.org/stable/40004984 .Accessed: 02/02/2012 10:28
Your use of the JSTOR archive indicates your acceptance of the Terms & Conditions of Use, available at .http://www.jstor.org/page/info/about/policies/terms.jsp
JSTOR is a not-for-profit service that helps scholars, researchers, and students discover, use, and build upon a wide range ofcontent in a trusted digital archive. We use information technology and tools to increase productivity and facilitate new formsof scholarship. For more information about JSTOR, please contact [email protected].
European Economic Association and The MIT Press are collaborating with JSTOR to digitize, preserve andextend access to Journal of the European Economic Association.
http://www.jstor.org

TOP INCOMES IN GERMANY AND SWITZERLAND OVER THE TWENTIETH CENTURY
Fabien Dell INSEE and Paris-Jourdan
Abstract This paper presents new homogeneous series on top income shares in Germany (1891-1998) and Switzerland (1933-1995), using data from income tax returns. The general pattern is consistent with recent results for France: the secular decline in income inequality is for the most part an accidental, capital income phenomenon. Very top incomes were badly hurt by the major shocks of the 1914-1945 period and never fully recovered afterwards. Since 1945, top income shares have been relatively stable, with no rise during recent years (unlike in the U.S. The striking episode before WWII is how Nazi power brought top income shares to almost double within five years. The striking result after WWII is that German top incomes are more concentrated within the top decile than in other industrialized countries. Thus the German super-rich were richer than their American counterparts until the 1990s. This puzzle is related to the much lower inheritance tax rates observed in Germany since WWII. (JEL: N33, N34, H23, H23, H24) H24) H23, H23, H24) H24) H23, H23, H24) H24) H23, H23, H24) H24)
1. Introduction
The evolution of income inequality over long periods of time is now well doc- umented for a large number of English-speaking (e.g., Atkinson 2003b; Piketty and Saez 2003) as well as some Continental European countries (e.g., Piketty 2003). The similarities and differences in the patterns observed across countries
help us draw plausible hypotheses about which economic mechanisms contribute to shaping the top of the income and wealth distribution in the long run.
This paper presents, for the first time, homogeneous series on top shares of
pretax income for Germany and Switzerland over the 20th century. These series are constructed using income tax return data. The evolutions of top income shares in Germany and Switzerland mirror the different economic and political contexts the two countries encountered throughout the 20th century, and the contrasting
Acknowledgments: I thank Anthony Atkinson, Thomas Piketty, Emmanuel Saez, and conference participants at the 2004 EEA meetings in Madrid for helpful discussion and comments. Finan- cial support from the MacArthur Foundation and hospitality from the DIW, Berlin, are thankfully acknowledged. E-mail address: [email protected]
Journal of the European Economic Association April- May 2005 3(2- 3):412-421 © 2005 by the European Economic Association

Dell Top Incomes in Germany and Switzerland 413
patterns observed add insights on long-term determinants of top incomes distri- bution.
As for all other countries yet documented, top income shares fell dramatically in Germany during the first half of the century. Yet the detailed pattern is original, underlining the specific political path Germany followed from the 1890s until World War II. As incomes of top groups turn out to be mostly composed of capital income, the fall of top incomes can be explained (as for other countries, such as France) by the major shocks witnessed by the country between 1914 and 1945 (two world wars and Great Depression), which had a strongly negative impact on capital income. At the same time, in Switzerland - where none of these shocks were experienced directly - top income and wealth shares exhibit a striking immobility.
In the second half of the century, German top income shares quickly returned to pre- WWII levels, in sharp contrast with other countries, where these levels were either never attained again (France) or only very recently (the United States in the 1980s and 1990s). Piketty (2003), among others, has argued that the dynamic effect of progressive taxation on capital accumulation and wealth inequality may explain why top income shares have remained constant at a secularly low level, even within the context of rapid growth after World War II. The case of Germany, with a progressive income tax similar to that of France but with a much lower inheritance tax, is consistent with this hypothesis. The Swiss case, where income shares remained almost constant and with a less progressive income tax schedule, also supports the plausibility of the tax argument.
We calibrate a simple model of capital accumulation and concentration (as in Cowell 1998) to the data observed for France and Germany, and we show that the effective differences of inheritance tax rates turn out to be large enough to account for the differences observed in the shape of the income/wealth distribution. Of course, this does not prove that differences in inheritance tax rates are the only fac- tor explaining why wealth concentration is higher in Germany, but it does suggest that the orders of magnitude observed are a plausible outcome of these differences.
The paper is organized as follows. Section 2 summarizes the data and method- ology used to construct our series. Section 3 analyzes the contrasting top income shares series for Germany and Switzerland, comparing them with similar data for France and the United States. Section 4 gives insights on possible explanations for the "German puzzle" of higher top income concentration and also presents some simulation results.
2. Data and Methodology
Our series rely on estimates based on income tax returns statistics compiled by the successive German and Swiss fiscal administrations over the 20th century. Data for

414 Journal of the European Economic Association
Germany span more than a century, from 1891 until 1998. For Switzerland, only the years from 1933 to 1998 are available. Because a large number of households are not included in these statistics due to large exemption levels, we limit our analysis to the top decile of the income distribution. Nevertheless, all fractiles are defined with reference to the whole population (filers as well as nonfilers). In Germany as in Switzerland, the income tax is family based: the fractiles are thus defined relative to the total number of couples and singles in the population.
The raw data we use consist of tables containing, for a large number of income brackets, the number of taxpayers and the amounts declared. Similar tabulations are available for Germany to document the composition of income (wages and salaries, business income, capital income, etc.). Since income distributions exhibit Pareto tails, we use simple parametric extrapolation methods to estimate threshold and average income of various fractiles. l
In our series, income is defined as gross market income before deductions. All government transfers are thus excluded from our income concept. Capital gains are also excluded.2
Data for Germany over the 20th century document a fluid geographical terri- tory. Before 1918 our series are based on Prussian data (on a quasi-yearly basis),3 after World War I and the German Revolution, our data concern the territory of the Weimar Republic and then of the Third Reich (irregular periodicity). After World War II, we use data for the Federal Republic of Germany, reunified with the former Democratic Republic of Germany after 1990 (on a triannual basis). As can be seen in the graphics to follow, two large periods of Germany's history remain undocumented: the hyperinflation years following WWI (1919-1924), when the tax system collapsed; and the 1938-1949 years of WWII and the subse- quent occupation of Germany by the Allies, when the publication of income tax statistics stopped.
Data for Switzerland documents a constant territory on a biannual basis since income tax is filed every two years in Switzerland in most cantons.
Top income shares are estimated by dividing the income received by an "income control total" constructed using National Accounts and then "removing"
1 . For the 1 990s, in the German case, we could check using income tax micro data that the estimation errors are negligible. Similar extrapolation methods have been used, for instance, in Piketty (2003). 2. In Switzerland, capital gains are .not subject to income tax declaration. In Germany, raw income tax data include capital gains; however, using micro data from the 1990s, we were able to correct to a large extent our estimates of the effect of lumpy realization of capital gains. Note that these realizations become significant only in the top income groups (above P99.5). Moreover, following Piketty and Saez (2003) - who systematically compared top income share series with and without capital gains in the U.S. case (which can be taken as an upper bound) - capital gain realization only significantly impact top income shares since the mid-1980s. 3. Note that, before World War I, Prussia accounted for two-thirds of the total German population. Data from other member states (such as Saxony and Bavaria) are available and are currently exploited in order to complete the Prussian data. Data for the 1873-1891 years are also available.

Dell Top Incomes in Germany and Switzerland 415
Figure 1. Top percentile (P99-100) income share in Germany and Switzerland. Sources: Germany, author computations: Switzerland, Dell, Piketty, and Saez (2003); France, Piketty (2003); United States, Piketty and Saez (2003).
components of personal income in order to obtain an homogeneous definition of income.4
3. Secular Trends in Contrast
Figures 1 and 2 present the income share of the top decile in Switzerland and Germany over the century. The pattern of the highest part (top percentile ; Figure 1 ) is clearly different from the decile's bottom part (P90-99; Figure 2).
In Germany, the top percentile exhibits a sharp decline in the course of the century. Fluctuating between 18% and 20%, and then peaking at the end of World War I over 23%, the share declines about 10% at the end of the century. This global evolution is in line with the results for France and the United States. Nonetheless, in both the first and the second part of the century, the German pattern is unique when one examines the details.
Indeed, in the first half of the century, the top percentile income share exhibits a chaotic path in Germany. World War I is a period of rapid growth, with a sharp
4. During WWI, in order not to overestimate the total income, the income control total is constructed "bottom-up" - that is adding to the total income of the filers an estimate of the total income of the nonfilers (instead of using National Accounts). For more details on the subject, see Atkinson (2003a).

416 Journal of the European Economic Association
Figure 2. Bottom of the top decile (P90-99) income share in Germany and Switzerland. Sources: Same as for Figure 1 .
decline the year of the German Revolution (1918). After the difficult establishment of the Weimar Republic and the hyperinflation of 1923-1924, the levels of top income shares are much lower in Germany than in France or in the United States of the Roaring Twenties at about 13%. World War I did not take place on German
territory, and there is no surprise in the fact that the last years of the war, when the Kaiser established a full military dictatorship in the country, were years of
growing profits for entrepreneurs of a heavy industry organically linked to the state.5 The hyperinflation years were of political and economic chaos, with the Rhineland (where most heavy industry lies) being occupied by the French; the low level of top income shares at that time is probably less a reflection of the effects of hyperinflation per se than of the overall political turmoil.
These already low levels experienced another drop with the Great Depression (at about 10%), but they recovered quickly when the Nazis came to power in 1933 and returned to levels comparable to those of France and the United States. The
amazing rise in top income shares in the Third Reich (more than 50% growth in five years for the top percentile and more than 150% for the top 0.01%; see
Figure 3) is clearly linked with the rearmament policy launched by the Nazis, which was financed by hidden deficit spending and accompanied by a policy
5. The same phenomenon can be observed in France in 1915-1916.

Dell Top Incomes in Germany and Switzerland 417
Figure 3. Top 0.01% income share in Germany and Switzerland. Sources: Same as for Figure 1.
(Lohnstopp) of preventing wages and salaries from rising in a context of growing terror. Thus, Germany's top income shares begin the century at about the same levels as their French and American counterparts; and after WWII, they are at about the same levels again. But the detailed pattern is very different, underlining the first-order role of political events. The series for Switzerland in the thirties
(beginning in 1933) exhibit a growth pattern resembling that of Germany, but of lesser magnitude.
After World War II, the top percentile income shares in Germany quickly recovered high levels (13% to 15% until the late 1970's recession, and then around 10%), whereas in France and the United States the income share of the top per- centile always remained under 10% (until it rose quickly after the 1980s in the United States). Thus, top incomes in Germany quickly reconcentrate after World War II. As far as Switzerland is concerned, top income shares there retained much lower levels than the German ones (compare Figures 4 and 3) and remained strik-
ingly constant (around 1% for the top 0.01%, with a positive shock only during World War II; about 10%- 12% for the top percentile, with a slow decline since the late 1970s). As can be seen from Figures 5(b) and 5(a), top incomes (in Germany as in France or the United States) are throughout the century constituted mostly by capital incomes. Therefore, the top 0.01% income share (Figure 3) displays the same pattern as the top percentile income share but with more magnitude. Conversely, looking at the bottom part of the top decile (where wages, salaries,

418 Journal of the European Economic Association
Figure 4. Share of top percentile in top decile: P99-100/P90-100. Sources: Same as for Figure 1.
and self-employment income are more important), the pattern is quite different with no sharp drop in the course of the century; World War I and the Nazi years are no longer a period of rise, and the deflation episode of the early 1930s is actually a period of growth in the share of these income groups, where wages dominate. After World War II, the German path for the share of the bottom of the top decile is similar to that of France or the United States but at a significantly lower level. As can be seen from Figure 4, the German top income (re)concentration process is even more striking when taking into account that the share of lower groups within
Figure 5. Top income composition in Germany: 1936 and 1992. Sources: Author computations using Germany income tax data.

Dell Top Incomes in Germany and Switzerland 419
Table 1. Stylized national contexts and outcomes.
Pre-1945 Capital Shocks Yes No
4- steep France Post- 1945 sharp decline; no recovery Progressive - steep Germany Switzerland Tax structure sharp decline; some recovery no decline; no rise
the top decile was systematically lower in Germany. So how can we account for this reconcentration? - a proper German puzzle.
4. Toward Understanding the German Puzzle
Since top income evolution is clearly a capital income phenomenon, understand- ing the long-term shape of the top of the income distribution amounts, to a large extent, to understanding the factors shaping the wealth distribution. If the exoge- nous shocks of the pre-1945 periods convincingly account for the sharp decline in top income shares that occurred at the time then the evolutions observed after 1945 in a context of political stability must be understood as stemming from intrinsi- cally economic mechanisms. It has been argued (see e.g. Piketty 2003) that the dynamic impact of steep progressive taxation of income or wealth could account for these evolutions. Table 1 summarizes the contraf actual position of Germany and Switzerland with regard to this hypothesis. Figure 6 displays how wealth distribution in Switzerland has remained nearly unchanged in the course of the century; probably because of intercanton fiscal competition, in Switzerland the progressivity of income, wealth, and inheritance taxes has remained low through- out the twentieth century.
As far as Germany is concerned,6 the striking fact is that inheritance tax schedules have been systematically steeper in France than in Germany during the last fifty years. The impact of this difference on the shape of the wealth and income distribution should not be underestimated. Note, moreover, that the income profile of capital share has become steeper over time (see Figure 5); which clearly supports an explanation in terms of capital concentration phenomenon. Different models of wealth accumulation can lead to Pareto upper tails of the wealth distribution. Stiglitz (1969) generates a Pareto tail in a simple Solow growth model under the hypothesis of primogeniture. Cowell (1998) builds a simple model of wealth transmission where inequality is driven by the variation in family size: for a child born at date t + 1, the inherited wealth Kt+\9 depending
6. For wealth shares for Germany, see Dell (2003).

420 Journal of the European Economic Association
Figure 6. Top wealth shares in Switzerland over the twentieth century. Source: Computations in Dell, Piketty, and Saez (2003) on Swiss wealth tax data.
on the number p of siblings, is Kt+\ = p{\ - r)(l + sgnKt/2) where r is the inheritance tax rate, s the annual saving rate of the parents, g the net growth rate of the capital stock, and n the number of years that one generation lives. Denoting j6 := (1 - r)(l + sg)n, one can show that the equilibrium distribution is Pareto tailed, where parameter a is the largest root of the following equation:
k=l L J
Table 2 presents numerical applications based upon this simple model. Param- eters were selected in order (a) to obtain the same tail shape as actually observed in France and Germany in the 1990s at the upper end of the distribution (P99.99) while (b) remaining reasonably plausible values. Underlying this simulation is this hypothesis: at the top end of the income distribution, where income is mostly made up of capital income, the shape of the income distribution reflects (for the most part) the shape of the underlying wealth distribution. It is clear that these simulations probably constitute an upper bound for the impact of inheritance tax rates on the shape of the distribution (most notably since the model does not include any wage income). They nonetheless show very clearly that this impact can be huge. For example, calibrating the model to account for the concentration observed in France during the 1990s, we see that reducing the effective marginal
Dell Top Incomes in Germany and Switzerland 421
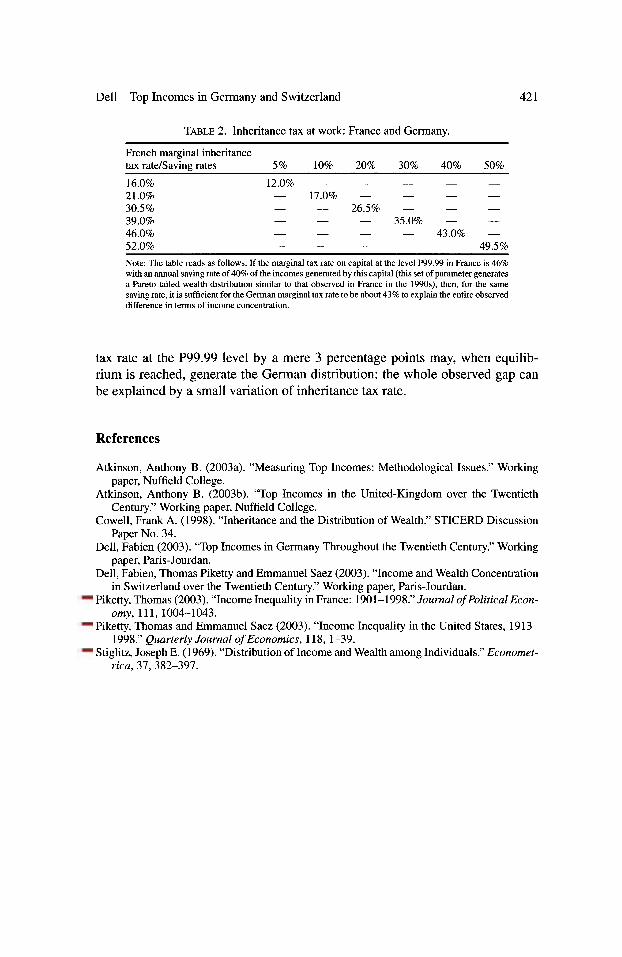
Table 2. Inheritance tax at work: France and Germany.
French marginal inheritance tax rate/Saving rates 5% 10% 20% 30% 40% 50%
16.0% 12.0% _____ 21.0% - 17.0% - - - - 30.5% - - 26.5% - - - 39.0% - - - 35.0% - - 46.0% - - - - 43.0% - 52.0%
- - - - - 49.5% Note: The table reads as follows. If the marginal tax rate on capital at the level P99.99 in France is 46% with an annual saving rate of 40% of the incomes generated by this capital (this set of parameter generates a Pareto-tailed wealth distribution similar to that observed in France in the 1990s), then, for the same saving rate, it is sufficient for the German marginal tax rate to be about 43% to explain the entire observed difference in terms of income concentration.
tax rate at the P99.99 level by a mere 3 percentage points may, when equilib- rium is reached, generate the German distribution: the whole observed gap can be explained by a small variation of inheritance tax rate.
References
Atkinson, Anthony B. (2003a). "Measuring Top Incomes: Methodological Issues." Working paper, Nuf field College.
Atkinson, Anthony B. (2003b). "Top Incomes in the United-Kingdom over the Twentieth Century." Working paper, Nuffield College.
Cowell, Frank A. (1998). "Inheritance and the Distribution of Wealth." STICERD Discussion Paper No. 34.
Dell, Fabien (2003). "Top Incomes in Germany Throughout the Twentieth Century." Working paper, Paris-Jourdan.
Dell, Fabien, Thomas Piketty and Emmanuel Saez (2003). "Income and Wealth Concentration in Switzerland over the Twentieth Century." Working paper, Paris-Jourdan.
Piketty, Thomas (2003). "Income Inequality in France: 1901-1998." Journal of Political Econ- omy, 111, 1004-1043.
Piketty, Thomas and Emmanuel Saez (2003). "Income Inequality in the United States, 1913- 1998." Quarterly Journal of Economics, 118, 1-39.
Stiglitz, Joseph E. (1969). "Distribution of Income and Wealth among Individuals." Economet- rica, 37, 382-397.