Embed Size (px)
Citation preview
« European Dairy Ambition » - Session 2 :
Potential development of the dairy sector
in the context of price volatility France, Ireland, USA, South Africa (and Africa)
Vincent CHATELLIER - National Institute of Agronomic Research (INRA), France
Catherine LASCURETTES - Irish Farmers Association (IFA) - Executive Secretary Dairy, Ireland
Jaime CASTANEDA - CEO/National Milk Producers Federation (NMPF, Washington DC), USA
Kobus MULDER - Dairy Consultant, South Africa

Introduction
Vincent Chatellier, INRA France
2
Vincent Chatellier – National Institute of Agronomic Research (INRA, France)

3
Approximately +20% at world level by 2025
A sharp rise of consumption in developing countries (mainly in big Asian cities)
A necessary adaptation of products to the heterogeneity of expectations (types of consumption)
A saturation of demand in many industrialized countries
Innovation is an important lever for the future level of consumption
An increase in demand for dairy products…
Many countries are already in deficit for dairy products (Africa, Asia ...)
Forage areas and water are not equally distributed across countries
A competition for land occupation between agricultural productions
In some countries, milk production induces some imports for feeding livestock
Sanitary requirements and traceability are heterogeneous at world level
…but the development of milk production is not always easy
Introduction (1/3)
Vincent Chatellier – National Institute of Agronomic Research (INRA, France)

4
Introduction (2/3)
Dairy trade represents 9% of the world supply (excluding intra-EU trade)
Oceania, EU and USA are the main exporters
Asian countries (Africa tomorrow ?) represent a major part of this growth
The strategies of the main buyers (China and Russia) are not always clear
Need to distinguish trade in volume (milk equivalent) versus trade in value
International trade of dairy products is increasing
Not specific to the dairy sector
Key factors: oil price, stocks, supply growth, economic growth, etc.
Price volatility has a greater impact for producers and dairy firms than for consumers
Sometime difficult to invest without visibility on price level
The volatility of international prices
Vincent Chatellier – National Institute of Agronomic Research (INRA, France)

5
What are the main trends for the dairy sector in your country (production, consumption, trade, etc.)?
How to deal with price volatility?
Is there any potential for the development of dairy sector in your country?
3 questions to each speaker
Discussion with the audience + Conclusion
Introduction (3/3)
Vincent Chatellier – National Institute of Agronomic Research (INRA, France)
4 speakers from 4 countries : France, Ireland, USA and south Africa (15 minutes each)

1- The French case
Vincent Chatellier, INRA France
6
Vincent Chatellier – National Institute of Agronomic Research (INRA, France)

1-1- Key dynamics in the dairy sector
7
Vincent Chatellier – National Institute of Agronomic Research (INRA, France)

8
Milk deliveries in France (thousand tons)
FranceAgriMer
Vincent Chatellier – National Institute of Agronomic Research (INRA, France)
25 Millions tons of milk
= 16% of EU production
= 3,1% of world production

9
2016 : it is clearly not a good year, but not only for French producers !
Enquête mensuelle laitière SSP/FranceAgriMer
Vincent Chatellier – National Institute of Agronomic Research (INRA, France)
Real milk price (€/t) at French farms level
2015 : 333 €/t
Jan. – March 2006 : 311 €/t
April – June 2006 : 299 €/t
July – September : 302 €/t
Milk deliveries in France per week
A drop in
production
for several
weeks

10
Milk deliveries in French regions and variation since 2008
FranceAgriMer
Vincent Chatellier – National Institute of Agronomic Research (INRA, France)
Milk deliveries (% France in 2014) Variation 2014/2008

11
CNIEL from SSP
Vincent Chatellier – National Institute of Agronomic Research (INRA, France)
Dairy farms in France
Dairy farms (% of France)
Dairy farms
Milk deliveries per farm (Kg per year)
12
CNIEL from SSP
Vincent Chatellier – National Institute of Agronomic Research (INRA, France)
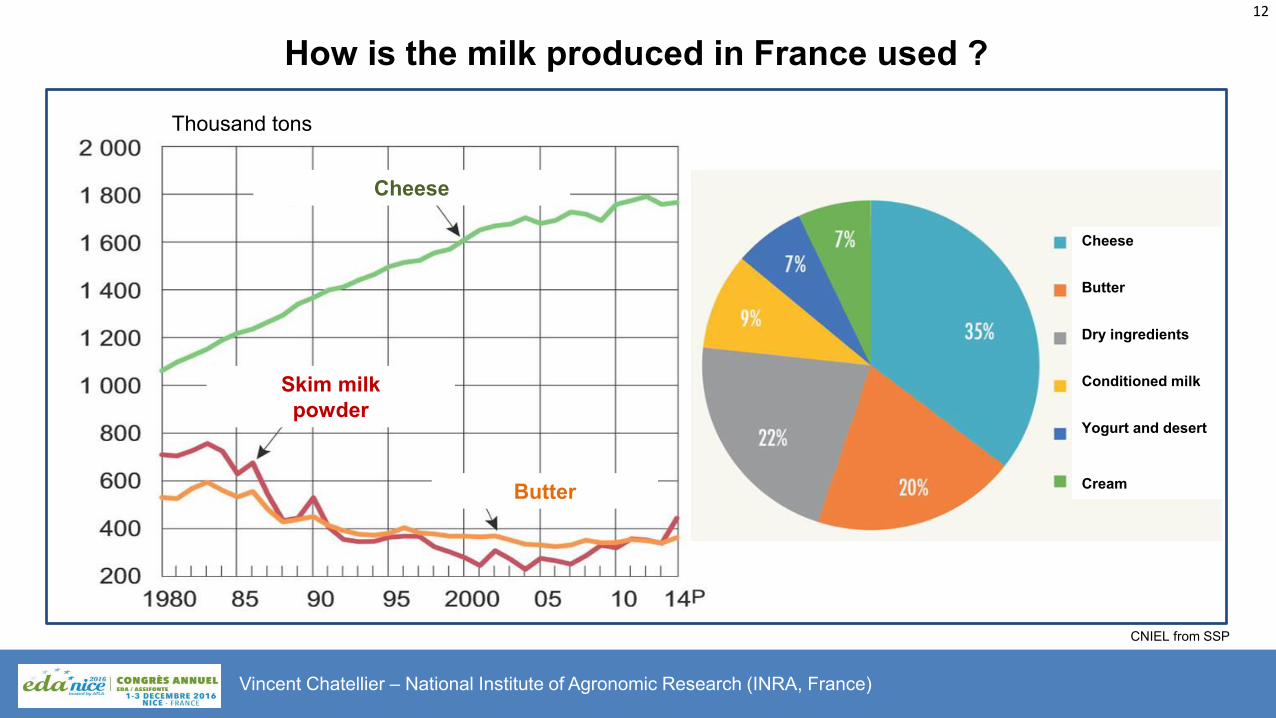
How is the milk produced in France used ?
Cheese
Butter
Skim milk
powder
Thousand tons
Cheese
Butter
Dry ingredients
Conditioned milk
Yogurt and desert
Cream

13
French exports of dairy products in EU member states (Billion euros, 2015)
INRA, SMART-LERECO by COMEXT
Vincent Chatellier – National Institute of Agronomic Research (INRA, France)

14
French exports of dairy products (Billion euros, 2015)
INRA, SMART-LERECO by COMEXT
Vincent Chatellier – National Institute of Agronomic Research (INRA, France)

15
French exports of dairy products (Billion euros, 2015)
INRA, SMART-LERECO by COMEXT
Vincent Chatellier – National Institute of Agronomic Research (INRA, France)

16
The trade balance of France in dairy products (Billion current euros)
INRA, SMART-LERECO by COMEXT
Billion current euros
Vincent Chatellier – National Institute of Agronomic Research (INRA, France)

1-2- How to deal with price volatility ?
17
Vincent Chatellier – National Institute of Agronomic Research (INRA, France)

18
- By stabilising the prices that farmers receive for their products,
such as market intervention measures.
Reducing price volatility
It is useful to distinguish between two types of policy measures
Vincent Chatellier – National Institute of Agronomic Research (INRA, France)
- By stabilizing the incomes of farmers, including direct payments
or risk management tools (insurance schemes, mutual funds and futures).
Reducing the negative consequences of price volatility

19
Market intervention measures
Vincent Chatellier – National Institute of Agronomic Research (INRA, France)
Market interventions now play the limited role of safety net measures which are only activated when prices drop below
certain (low) levels. Public interventions can be made for butter and milk powder at a fixed price and during certain periods.
Private storage aid can be granted for butter, cheese and milk powder.
Market intervention mechanisms
In the case of serious market disturbances caused by plant or animal diseases, natural disasters or health risks.
These measures can be supported by a newly created crisis reserve which involves an annual amount of €400 million
for the 2014–2020 period (in constant 2011 prices).
The European Commission (EC) may also take exceptional measures
Under certain circumstances, the EC can also authorise producer organisations to take temporary measures
to manage supply in order to stabilise agricultural markets, for instance through Article 222 of Regulation No 1308/2013.
Article 222 was activated for the first time in 2016, enabling producer organisations, inter-branch organisations and
cooperatives in the dairy sector to establish voluntary agreements to temporarily reduce their production and supply.
The EC can also authorise producer organisations to take temporary measures

20
Risk management tools in rural development programmes
Vincent Chatellier – National Institute of Agronomic Research (INRA, France)
These losses should be higher than 30% of the average annual production in the last three or five years and should
have been caused by animal and plant diseases or adverse climatic and environmental events.
To be insured, farmers need to pay a fee (called a 'premium') to the insurance company. The rural development measure
promotes the use of these forms of insurance by financing up to 65% of the premium costs.
Insurance (and mutual funds)
The rural development measure can be used to create an IST and compensate farmers.
In order to be classified as a 'green box' measure by the WTO, farmers' compensation can be triggered only for
losses higher than 30%, with a maximum compensation of up to 70% of lost income.
The share of the CAP budget spent on risk management is still very low, as it represents only 2% of the Pillar II
budget and 0.4% of the total CAP budget for the 2014–2020 period.
The Income Stabilisation Tool (IST)

21
Other measures to deal with price volatility
Vincent Chatellier – National Institute of Agronomic Research (INRA, France)
Direct payments, which reduce income volatility for farmers by providing them with a stable form of revenue, will probably
continue to play a role in the CAP after 2020.
But the amount of financial support farmers receive remains the same regardless of whether prices are high or low.
Direct payments
It is desirable that part of the direct aid received by farmers be set aside during the good years to constitute a reserve
that can be mobilized in difficult years. This tool make it possible to introduce a countercyclical character to the CAP
without calling into question the principle of budget annuality.
Precautionary savings
Borrowings with an annuity adjustable according to agricultural market conditions.
New financial management tools
Price volatility: from producers to consumers?

1-3- What potential for the development of the dairy sector?
22
Vincent Chatellier – National Institute of Agronomic Research (INRA, France)
23
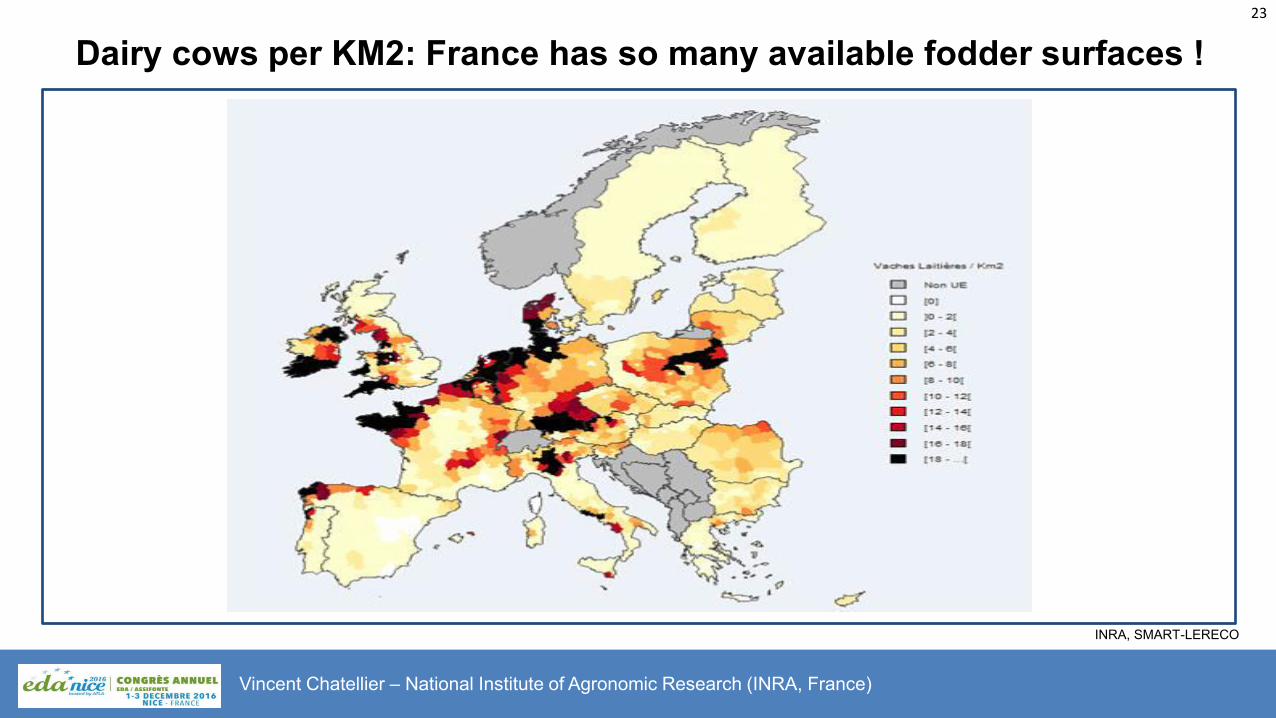
Dairy cows per KM2: France has so many available fodder surfaces !
INRA, SMART-LERECO
Vincent Chatellier – National Institute of Agronomic Research (INRA, France)

24
The average milk production cost* is not so bad in France
Perrot, Chatellier, Mercier-Gouin, Richard, You, el Al, 2016. Download this publication : http://tinyurl.com/j5rve5u
*The price of milk
from which the
family labor is paid
Denmark
Germany
France
Ireland
Netherlands
Vincent Chatellier – National Institute of Agronomic Research (INRA, France)

25
A low level of intensification in French dairy Farms
FADN / INRA SMART-LERECO
Milk production (Kg) per ha (Usable Agricultural Area) Herbivorous LU (livestock Unit) per ha of fodder surface
Vincent Chatellier – National Institute of Agronomic Research (INRA, France)

26
What potential for the development of the French dairy sector?
A favorable geographical location (climate, proximity to the sea and deficit countries)
A good forage production with high yields
A low price of the land
Productivity reserve (sometimes) due to a low level of intensification ; possible substitution cereals/dairy production
A high level of consumption of dairy products (but a stable/decreasing global market)
Innovative companies, with a strong experience in technologies and exportations
Some competitive advantages
Optimize production costs by diluting fixed costs at farm and firm level
Promote long-term financing of structuring investments
Boosting product innovation to appeal to tomorrow's consumers and find new markets abroad
Strengthening the links between the different players in the agri-food chain
Towards a better communication with citizens on the useful role of agriculture for society
How to succeed?
Vincent Chatellier – National Institute of Agronomic Research (INRA, France)

27
Dairy cows in France !

2- The situation in Ireland
Catherine Lascurettes
28
Catherine Lascurettes - Irish Farmers Association (IFA, Ireland)

2-1- Key dynamics in the dairy sector
29
Catherine Lascurettes - Irish Farmers Association (IFA, Ireland)
30
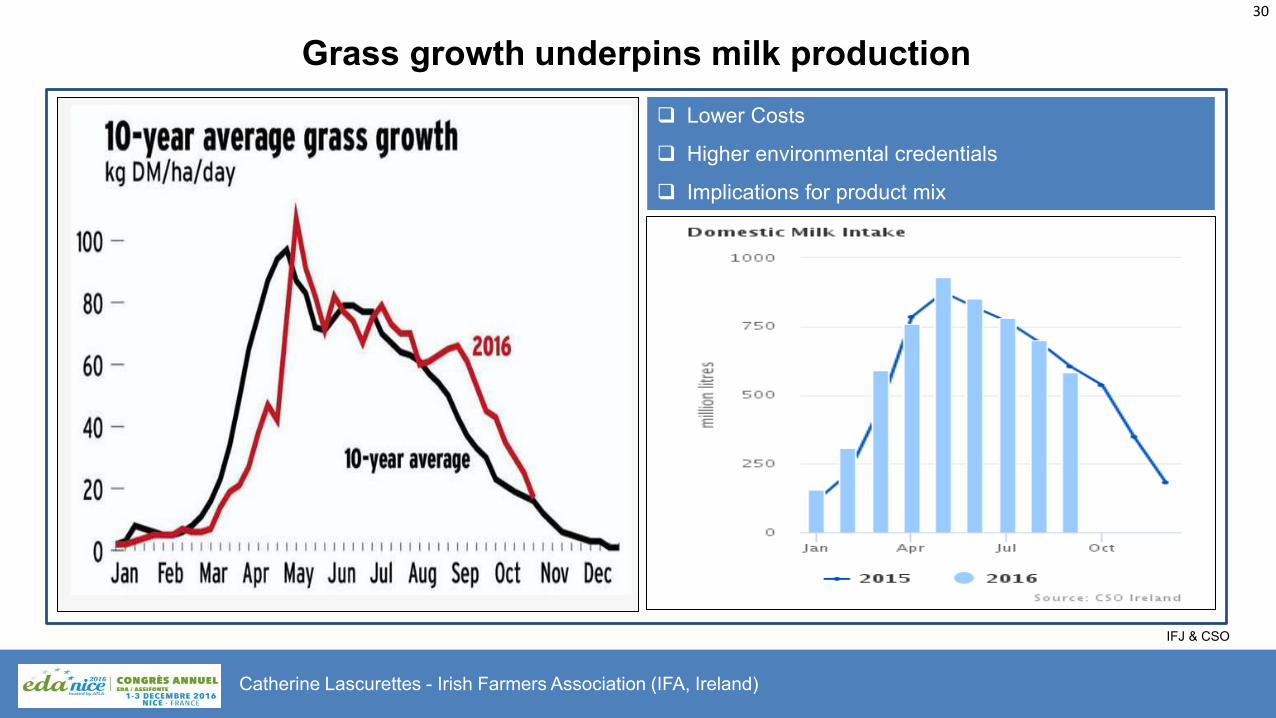
Grass growth underpins milk production
IFJ & CSO
Lower Costs
Higher environmental credentials
Implications for product mix
Catherine Lascurettes - Irish Farmers Association (IFA, Ireland)

31
Ireland is a low cost milk producer
IFCN & IFJ, November 2016
Catherine Lascurettes - Irish Farmers Association (IFA, Ireland)

32
Family farms are the norm in Ireland
Central statistic office and Department of Agriculture, Food and Marine Annual Work Unit = >1800 Hr per person, per annum
Catherine Lascurettes - Irish Farmers Association (IFA, Ireland)
Number of dairy herds and average herd size Number of dairy herds by herd size
33
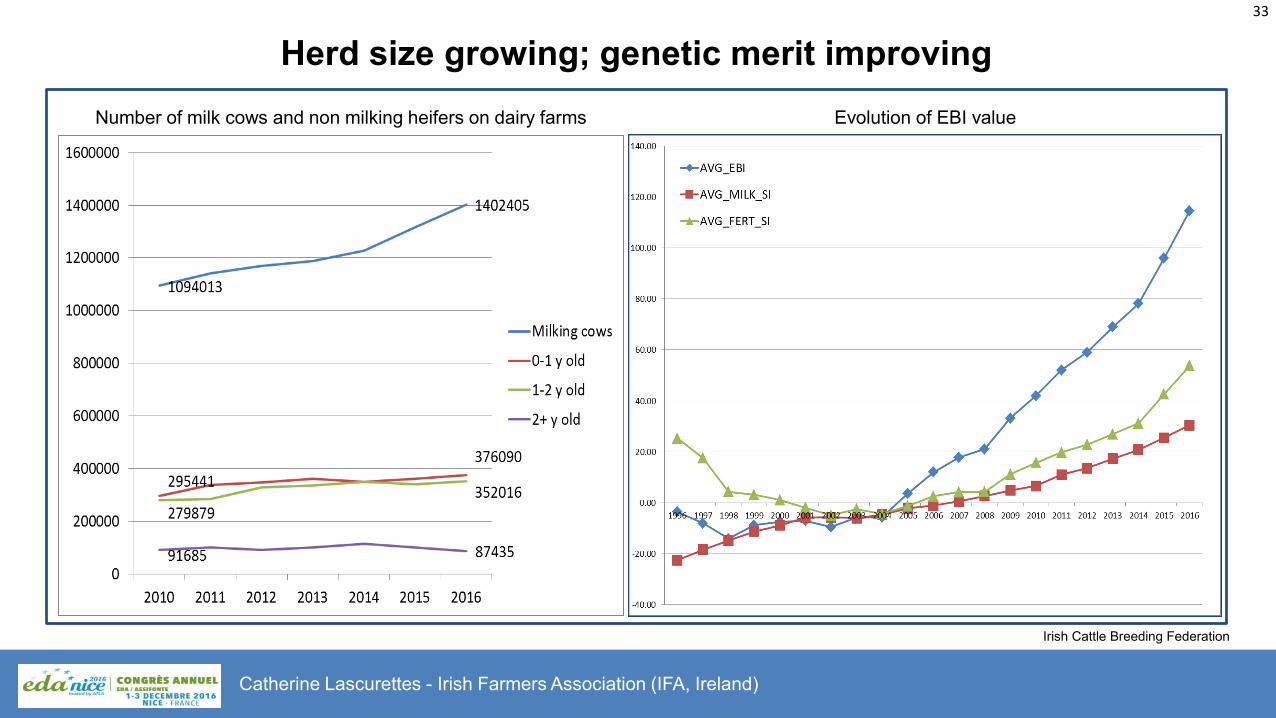
Herd size growing; genetic merit improving
Irish Cattle Breeding Federation
Catherine Lascurettes - Irish Farmers Association (IFA, Ireland)
Number of milk cows and non milking heifers on dairy farms Evolution of EBI value

34
Ireland’s dairy export vocation
Ireland’s domestic market has only 4.5 million consumers
Ireland produces enough milk/beef
to feed 20-50m consumers
Ireland’s dairy export vocation is long standing:
Butter and cheese to England since 18th
century – butter was main export into 19th
century
Routes to markets developed since 1960’s by Irish Dairy Board (now Ornua)
Catherine Lascurettes - Irish Farmers Association (IFA, Ireland)

35
Ireland’s dairy export vocation
CSO
Catherine Lascurettes - Irish Farmers Association (IFA, Ireland)

36
Ornua – Ireland’s largest exporter
Exports 60% of
Ireland’s dairy products through
routes to markets
developed in 110
countries
Catherine Lascurettes - Irish Farmers Association (IFA, Ireland)

37
Origin green
Catherine Lascurettes - Irish Farmers Association (IFA, Ireland)

38
Origin green: Sustainability Farm Audits
Ireland among the most sustainable producers of milk in the world
– we are setting out to prove it.
Sustainable Dairy Assurance Scheme (SDAS) first national dairy scheme of its kind.
Rigorous, independently verified and accredited (ISO 17065: 2012)
Animal health, welfare, land management, biosecurity, safe farming practices,
production of safe milk.
Framework for measuring continuous improvement of each farmer.
Calculates GG emissions for each herd (carbon navigator)
Detailed feedback to each farmer to improve sustainability performance of farm.
Traceability - follows movements animals from birth to end of life.
Catherine Lascurettes - Irish Farmers Association (IFA, Ireland)
37
2-2- How to deal with price volatility ?
39
Catherine Lascurettes - Irish Farmers Association (IFA, Ireland)
40
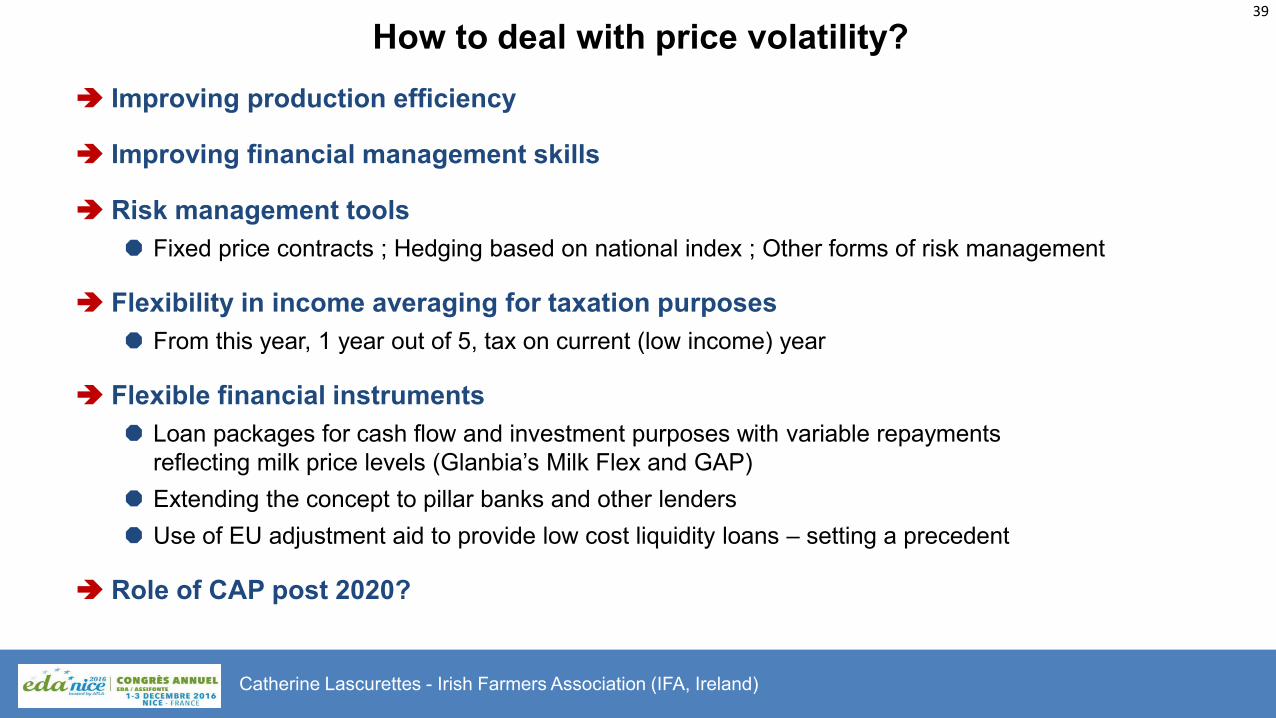
How to deal with price volatility?
Improving production efficiency
Improving financial management skills
Risk management tools
Fixed price contracts ; Hedging based on national index ; Other forms of risk management
Flexibility in income averaging for taxation purposes
From this year, 1 year out of 5, tax on current (low income) year
Flexible financial instruments
Loan packages for cash flow and investment purposes with variable repayments
reflecting milk price levels (Glanbia’s Milk Flex and GAP) Extending the concept to pillar banks and other lenders
Use of EU adjustment aid to provide low cost liquidity loans – setting a precedent
Role of CAP post 2020?
Catherine Lascurettes - Irish Farmers Association (IFA, Ireland)
39

2-3- What potential for the development of the dairy sector?
41
Catherine Lascurettes - Irish Farmers Association (IFA, Ireland)

42
Ireland’s potential interrupted by quotas in 1984
Eurostat
Aggregate milk
deliveries Ireland
and selected EU
member states
1970 to 1984
Catherine Lascurettes - Irish Farmers Association (IFA, Ireland)

43
Ireland, a sustainable milk producer?
Ireland had no industrial revolution
=> agriculture carries disproportionate emission liability.
COP 21 = lowering emissions w/o threatening food production
=> focus on emission efficient production.
No complacency: this is a challenge for Ireland (and others!).
87% of measures in Ireland’s RDP have climate reducing elements.
SDAS (Origin Green farm audits).
Smart Farming initiative – emphasis on economic win-win.
Significant research on emission reduction from grass-based production, land use and nutrient
management (Teagasc)
Need for greater support for renewable energy production and forestry plantation by farmers.
Catherine Lascurettes - Irish Farmers Association (IFA, Ireland)
44
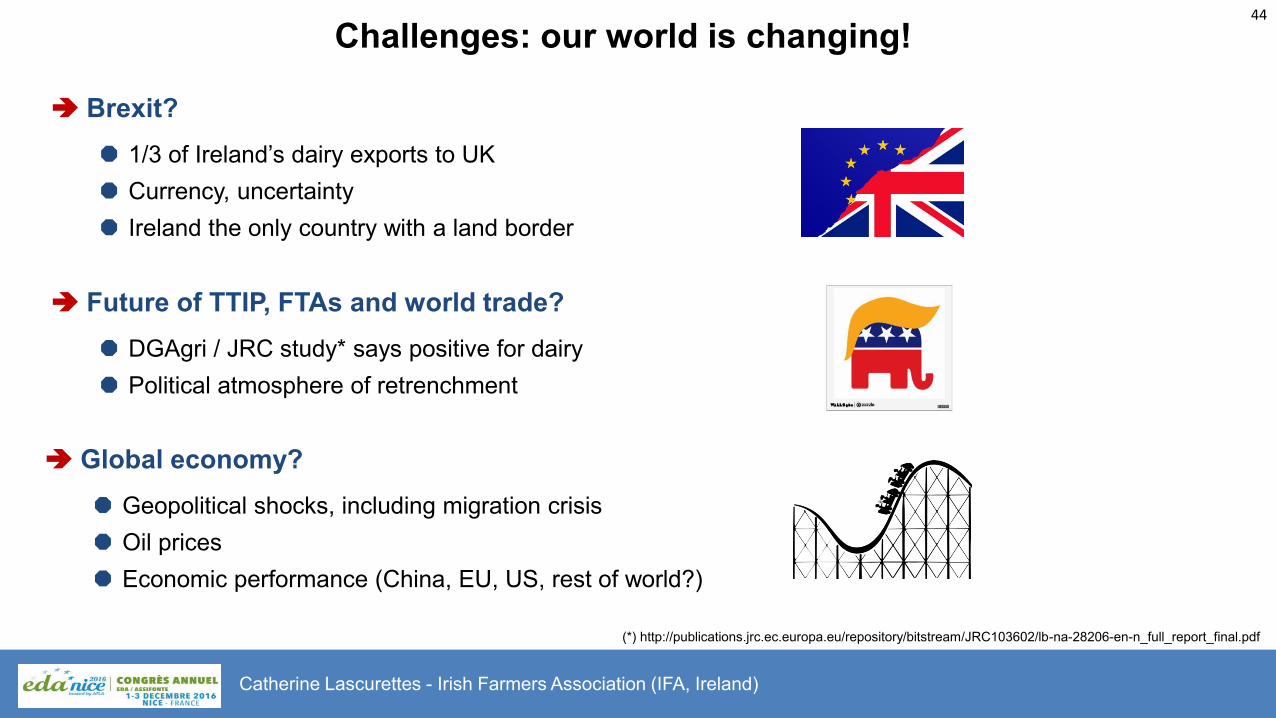
Challenges: our world is changing!
Brexit?
1/3 of Ireland’s dairy exports to UK
Currency, uncertainty
Ireland the only country with a land border
Future of TTIP, FTAs and world trade?
DGAgri / JRC study* says positive for dairy
Political atmosphere of retrenchment
Global economy?
Geopolitical shocks, including migration crisis
Oil prices
Economic performance (China, EU, US, rest of world?)
(*) http://publications.jrc.ec.europa.eu/repository/bitstream/JRC103602/lb-na-28206-en-n_full_report_final.pdf
Catherine Lascurettes - Irish Farmers Association (IFA, Ireland)

45
Conclusion
Ireland has a real potential to sustainably supply growing global dairy demand
with high quality dairy products.
Climate change issues are a major challenge, which must, and is being faced.
Sustainability must be understood to include economic sustainability
of primary producers.
Global political, economical developments will continue to affect trade and feed into
volatility and uncertainty.
The consequent price and margin volatility needs a greater variety of solutions
to help farmers cope and sustain dairy supplies – including in future CAP.
Catherine Lascurettes - Irish Farmers Association (IFA, Ireland)
46
Dairy cows in Ireland !
Catherine Lascurettes - Irish Farmers Association (IFA, Ireland)

3- The U.S. perspective
Jaime Castaneda
47
Jaime Castaneda - CEO/National Milk Producers Federation (USA)

3-1- Key dynamics in the dairy sector
48
Jaime Castaneda - CEO/National Milk Producers Federation (USA)

49
Milk production per milk cow (1989-2014, annual)
USDA/NASS Livestock Marketing Information Center
Jaime Castaneda - CEO/National Milk Producers Federation (USA)

50
2016 Year-to-date change in milk production (Jan-Sep) – U.S. +1.7%
Jaime Castaneda - CEO/National Milk Producers Federation (USA)

51
Milk production vs. milk cow inventory
average annual inventory, US
Jaime Castaneda - CEO/National Milk Producers Federation (USA)
USDA/NASS Livestock Marketing Information Center

52
Since 2003, Nearly Half of the ‘New’ Milk Has Gone to Exports
Jaime Castaneda - CEO/National Milk Producers Federation (USA)
2016 is USDEC projection. Source: USDEC, USDA

53
Domestic Consumption Remains Robust Butter and Other Cheese Showing Strong 2016 Year-to-Date Consumption Improvement
Jaime Castaneda - CEO/National Milk Producers Federation (USA)
USDA
7,5%
3,4%
-0,2%
6,5%
3,8%
-5%
0%
5%
10%
Butter NFDM and SMP American-TypeCheese
Other Cheese Total Cheese
Year-to-Date Change in Domestic Market Consumption, Through Sep
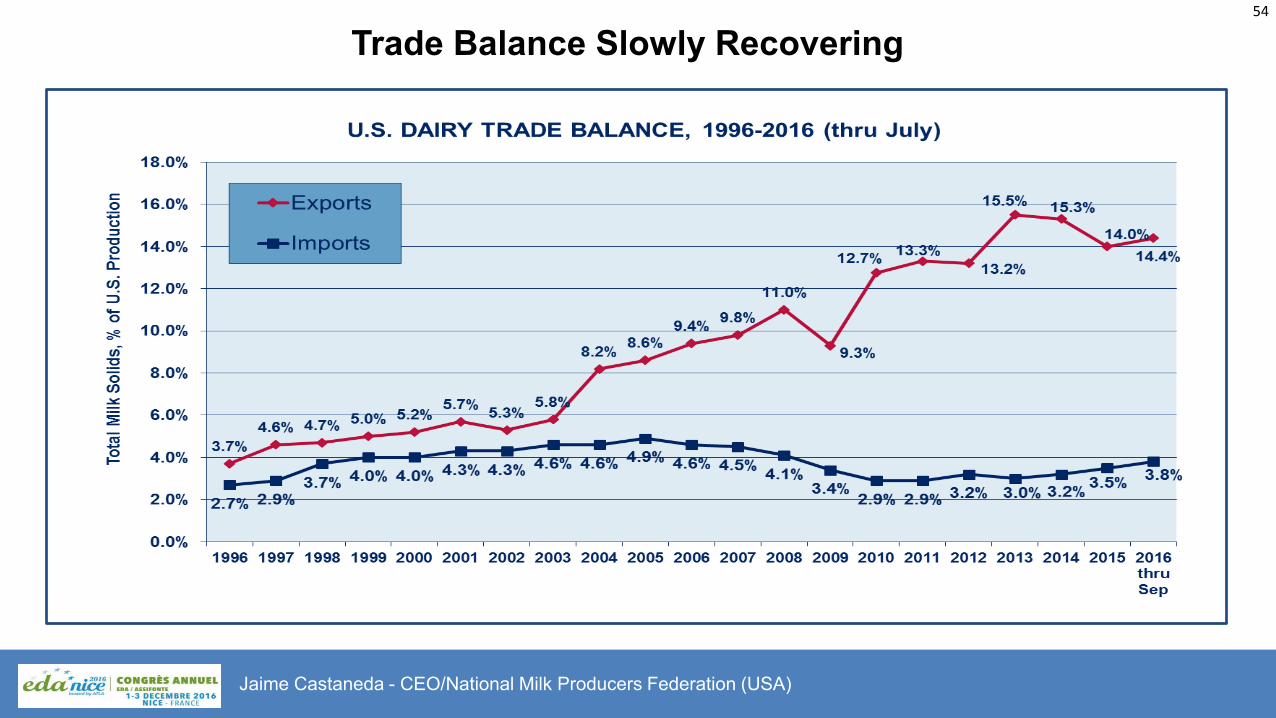
54
Trade Balance Slowly Recovering
Jaime Castaneda - CEO/National Milk Producers Federation (USA)

3-2- How to deal with price volatility ?
55
Jaime Castaneda - CEO/National Milk Producers Federation (USA)
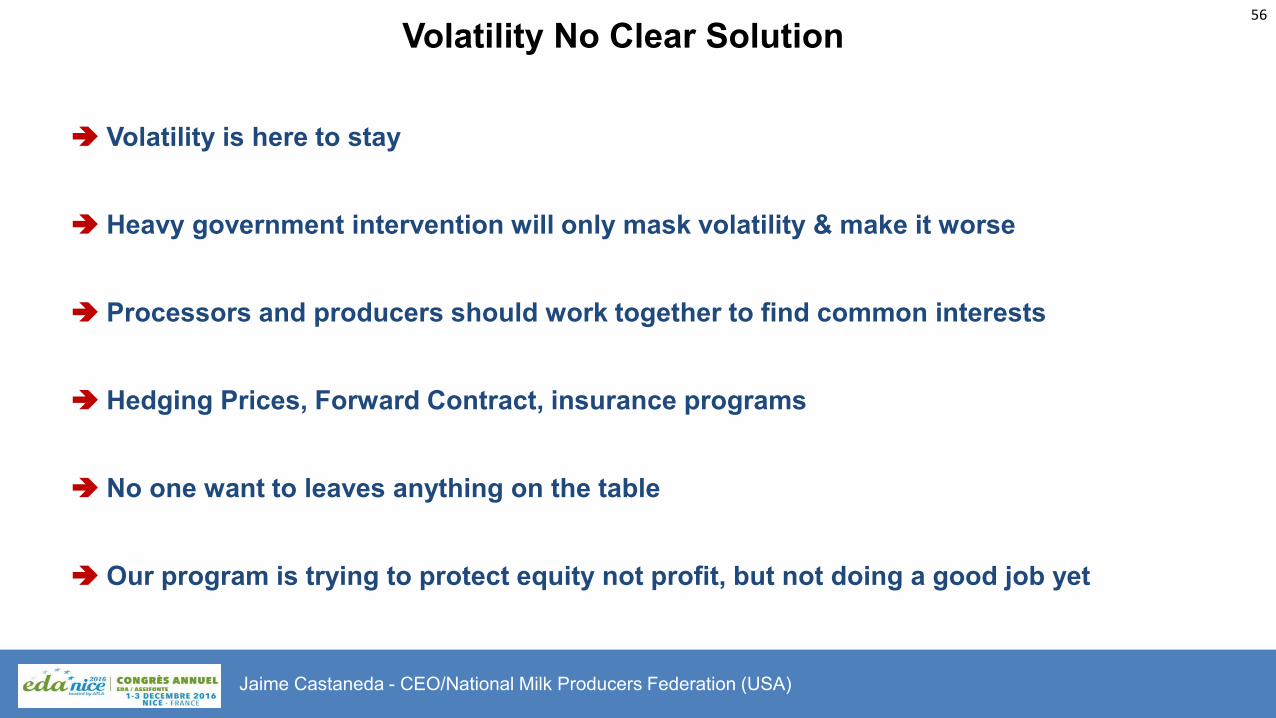
56
Volatility No Clear Solution
Volatility is here to stay
Heavy government intervention will only mask volatility & make it worse
Processors and producers should work together to find common interests
Hedging Prices, Forward Contract, insurance programs
No one want to leaves anything on the table
Our program is trying to protect equity not profit, but not doing a good job yet
Jaime Castaneda - CEO/National Milk Producers Federation (USA)
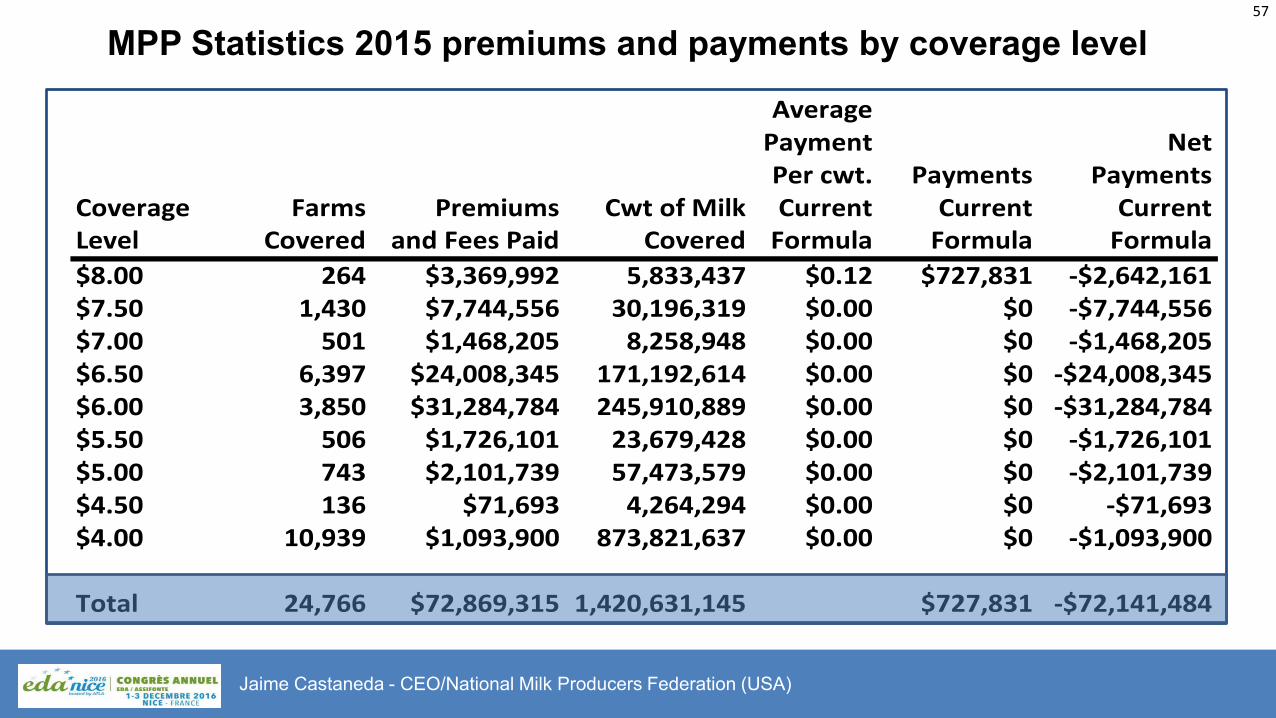
57
MPP Statistics 2015 premiums and payments by coverage level
Jaime Castaneda - CEO/National Milk Producers Federation (USA)
Average
Payment Net
Per cwt. Payments Payments
Coverage Farms Premiums Cwt of Milk Current Current Current
Level Covered and Fees Paid Covered Formula Formula Formula
$8.00 264 $3,369,992 5,833,437 $0.12 $727,831 -$2,642,161
$7.50 1,430 $7,744,556 30,196,319 $0.00 $0 -$7,744,556
$7.00 501 $1,468,205 8,258,948 $0.00 $0 -$1,468,205
$6.50 6,397 $24,008,345 171,192,614 $0.00 $0 -$24,008,345
$6.00 3,850 $31,284,784 245,910,889 $0.00 $0 -$31,284,784
$5.50 506 $1,726,101 23,679,428 $0.00 $0 -$1,726,101
$5.00 743 $2,101,739 57,473,579 $0.00 $0 -$2,101,739
$4.50 136 $71,693 4,264,294 $0.00 $0 -$71,693
$4.00 10,939 $1,093,900 873,821,637 $0.00 $0 -$1,093,900
Total 24,766 $72,869,315 1,420,631,145 $727,831 -$72,141,484

58
MPP Statistics 2016 premiums and payments by coverage level
Jaime Castaneda - CEO/National Milk Producers Federation (USA)
Average
Payment Net
Percent of Per cwt. Payments Payments
Coverage Farms Premiums Premiums @ Cwt of Milk Current Current Current
Level Covered Paid < 4 mil lb rate Covered Formula Formula Formula
$8.00 149 $993,642 100% 2,226,944 $0.51 $1,146,352 $152,710
$7.50 236 $1,152,933 100% 3,890,775 $0.35 $1,354,371 $201,438
$7.00 169 $530,630 100% 2,475,958 $0.21 $510,571 -$20,059
$6.50 2,307 $5,982,426 83% 47,977,118 $0.12 $5,895,330 -$87,096
$6.00 1,991 $10,006,728 46% 91,606,613 $0.04 $3,622,549 -$6,384,179
$5.50 357 $509,718 67% 8,502,784 $0.00 $0 -$509,718
$5.00 482 $1,148,319 21% 31,085,066 $0.00 $0 -$1,148,319
$4.50 108 $2,635 64% 2,381,913 $0.00 $0 -$2,635
$4.00 19,864 $0 NA 1,401,953,981 $0.00 $0 $0
Total 25,663 $20,327,031 1,592,101,152 $12,529,173 -$7,797,858

3-3- What potential for the development of the dairy sector?
59
Jaime Castaneda - CEO/National Milk Producers Federation (USA)

60
U.S. Has Large and Productive Herd
Jaime Castaneda - CEO/National Milk Producers Federation (USA)
FAS/USDA, USDEC. (Size of circle corresponds to milk production volume)

61
The U.S. Strategic Imperative to Export
Jaime Castaneda - CEO/National Milk Producers Federation (USA)
USDEC, USDA
Domestic use at current CAGR:
+1.0%/year
+1.8 billion lbs./year
Milk production at current CAGR:
+1.7%/year
+3.1 billion lbs./year
2020 Gap at
current
CAGRs:
31 billion lbs.

62
Our vision
Jaime Castaneda - CEO/National Milk Producers Federation (USA)
Transforming The World’s Largest Dairy Industry Into
A Truly Adaptive Customer-
focused, Global Business
Partner

63
U.S. Dairy Farming Today
Jaime Castaneda - CEO/National Milk Producers Federation (USA)
Year-round production with little seasonal variance
Modern farming practices
– Optimized feed rations
– High-tech milking operations
– Enhanced reproduction
– Attention to cow comfort
Rigorous and multi-layer quality and safety
protocols from farm to fork
Focus on environmental stewardship and sustainability

64
Quartile 1
Jaime Castaneda - CEO/National Milk Producers Federation (USA)
Quartile Farms Average Cows
1 115 4,295
2 233 2,123
3 652 760
4 7,228 69
Data is a 12-month total (February 2014-January 2015)

65
Quartile 1, 2
Jaime Castaneda - CEO/National Milk Producers Federation (USA)
Data is a 12-month total (February 2014-January 2015)
Quartile Farms Average Cows
1 115 4,295
2 233 2,123
3 652 760
4 7,228 69

66
Quartile 1, 2, 3
Jaime Castaneda - CEO/National Milk Producers Federation (USA)
Data is a 12-month total (February 2014-January 2015)
Quartile Farms Average Cows
1 115 4,295
2 233 2,123
3 652 760
4 7,228 69

67
Quartile 1, 2, 3 & 4
Jaime Castaneda - CEO/National Milk Producers Federation (USA)
Data is a 12-month total (February 2014-January 2015)
Quartile Farms Average Cows
1 115 4,295
2 233 2,123
3 652 760
4 7,228 69

68
Election 2016: county-Level Results
Jaime Castaneda - CEO/National Milk Producers Federation (USA)

69
Dairy cows in USA !
Jaime Castaneda - CEO/National Milk Producers Federation (USA)

4- Focus on South Africa and Africa
Kobus Mulder
70
Kobus Mulder – Dairy consultant (South Africa)

4-1- Key dynamics in the dairy sector
71
Kobus Mulder – Dairy consultant (South Africa)

72
World population projection
Geographical
area
2015 2040 2065
World (,000) 7 284 8 874 9 731
S-S Africa 13.3% 18.6% 25.0%
Americas 13.5% 13.1% 12.6%
Asia 60.1% 57.0% 52.2%
Europe 10.1% 7.4% 5.9%
United Nations
Kobus Mulder – Dairy consultant (South Africa)
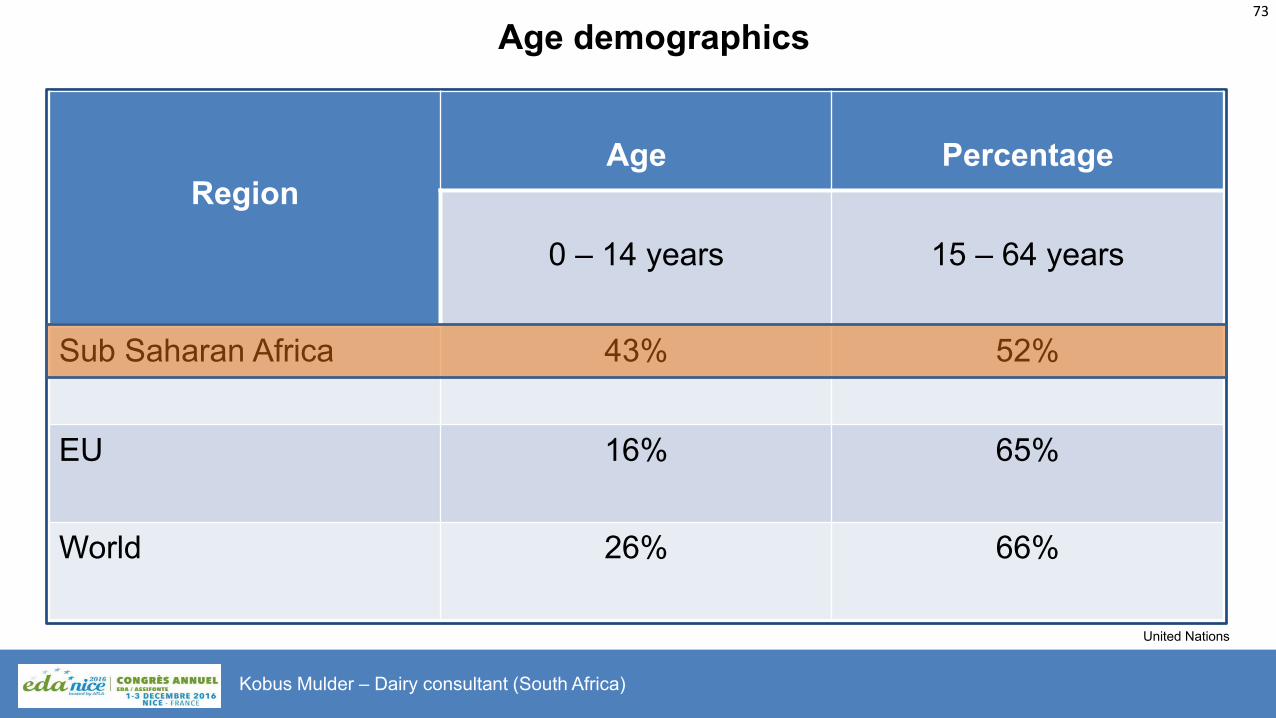
73
Age demographics
United Nations
Region
Age
Percentage
0 – 14 years
15 – 64 years
Sub Saharan Africa 43% 52%
EU 16% 65%
World 26% 66%
Kobus Mulder – Dairy consultant (South Africa)

74
World milk production
Europe 33.0% America 18.0%
Oceania 5.0%
South America
10.0%
Africa 4.6%
South Africa 0.4%
Kobus Mulder – Dairy consultant (South Africa)

75
South African primary dairy industry
1 650 dairy farms
3.2 million tonnes per annum
400 cows average in milk per farm
1 000 cows in milk on farms in coastal areas
20 litre per cow per day
31% more milk Sept – Nov than April – July
Large highly efficient producers
Milk price euro 0.30 per litre (May 2016)
Kobus Mulder – Dairy consultant (South Africa)

76
South African secondary industry
5 Large processors
145 Small to medium processors
113 producer-distributors
63% of milk into liquid dairy products
37% of milk processed into concentrated products
4 Retail groups handle 80% of total sales
Total dairy demand value euro 2.5 billion
Cheese contributes 25% of dairy market total value
Kobus Mulder – Dairy consultant (South Africa)

77
South Africa market opportunities
Free market system
- No national quota system
- No pricing structure
- No minimum prices
- No subsidies
- Various trade agreements
- Relative low import tariffs
Kobus Mulder – Dairy consultant (South Africa)

Composition of liquid products market
UHT milk 44%
Cream 1% Other 5%
Kobus Mulder – Dairy consultant (South Africa)
77

Composition of concentrated product market
Cheese 65%
FMP 12%
Kobus Mulder – Dairy consultant (South Africa)
78
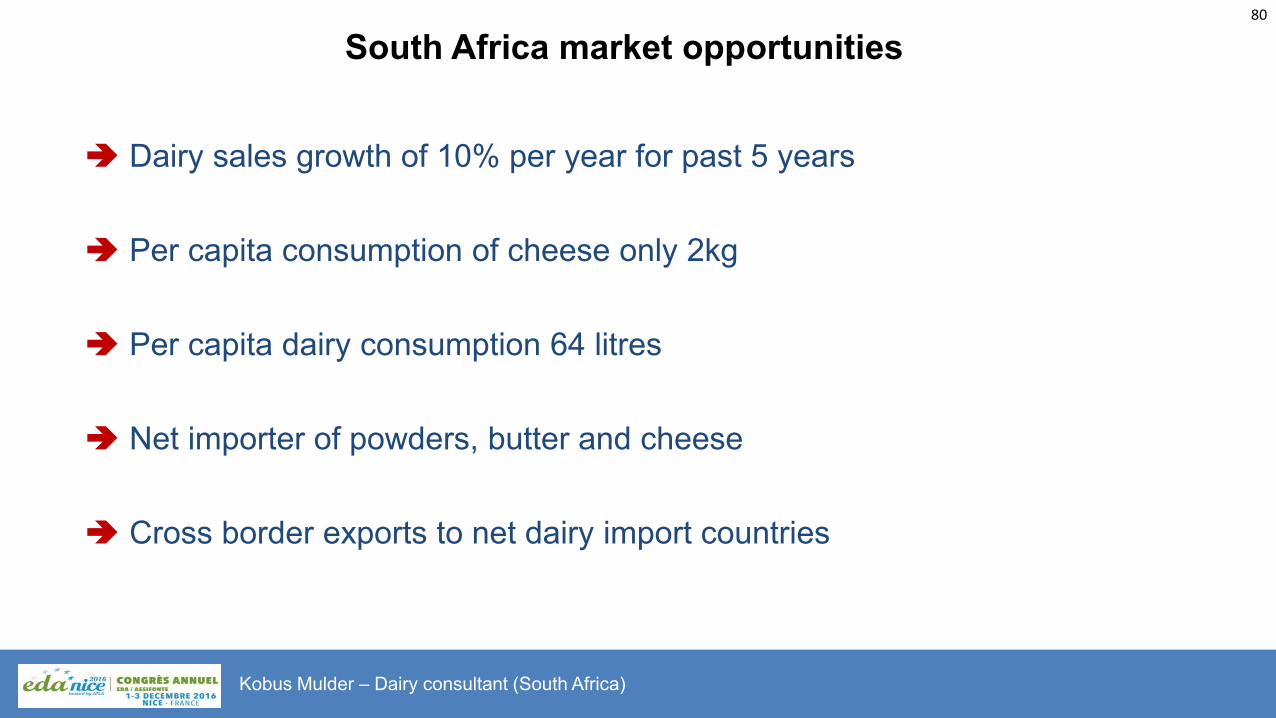
80
South Africa market opportunities
Dairy sales growth of 10% per year for past 5 years
Per capita consumption of cheese only 2kg
Per capita dairy consumption 64 litres
Net importer of powders, butter and cheese
Cross border exports to net dairy import countries
Kobus Mulder – Dairy consultant (South Africa)

South Africa and its neighbours
Neighbouring
markets
Population
200m
Kobus Mulder – Dairy consultant (South Africa)
80

82
Sub-Saharan Africa summary
Sub-Saharan African market is growing
Growing middle class consumers
Availability of raw milk
Various challenges
6 of top10 dairy companies active
Growth of retail sector
Many challenges
Kobus Mulder – Dairy consultant (South Africa)

83
Key dynamics in the dairy sector
Potential for more raw milk production
Limited supply of value added dairy products
Limited technological knowledge
Uneconomical processing of milk
Low consumption of processed milk products
Increase in retail outlets
Increasing imports of concentrated dairy products
Kobus Mulder – Dairy consultant (South Africa)

4-2- How to deal with price volatility ?
84
Kobus Mulder – Dairy consultant (South Africa)

85
How to deal with price volatility?
No known effective method
Producer / Processor relationship
Supply of raw milk follows demand
Hedging of producer input costs
Influence of global market prices
Kobus Mulder – Dairy consultant (South Africa)

4-3- What potential for the development of the dairy sector?
86
Kobus Mulder – Dairy consultant (South Africa)

87
What potential for the development of the dairy sector?
Dairy powders
Cheese varieties
Processing technology
Unutilized processing capacity
Local and cross border demand growth
Cross border exports
Low consumption of dairy products
Kobus Mulder – Dairy consultant (South Africa)

88
Dairy cows in South Africa !
Kobus Mulder – Dairy consultant (South Africa)

89
Your questions are now welcome !
Vincent Chatellier, Catherine Lascurettes, Jaime Castaneda, Kobus Mulder
Téléchargement du diaporama : http://tinyurl.com/hhpade7