Embed Size (px)
Citation preview
EUROPEAN ECONOMY
Economic and Financial Affairs
ISSN 2443-8049 (online)
2nd Quarter 2021
TECHNICAL PAPER 049 | JULY 2021
European BusinessCycle Indicators
EUROPEAN ECONOMY
European Economy Technical Papers are reports and data compiled by the staff of the European Commission’s Directorate-General for Economic and Financial Affairs. Authorised for publication by Reinhard Felke, Director for Policy, Coordination, Economic Forecasts and Communication. The Report is released every quarter of the year.
LEGAL NOTICE Neither the European Commission nor any person acting on behalf of the European Commission is responsible for the use that might be made of the following information. This paper exists in English only and can be downloaded from https://ec.europa.eu/info/publications/economic-and-financial-affairs-publications_en. Luxembourg: Publications Office of the European Union, 2021 PDF ISBN 978-92-76-28511-3 ISSN 2443-8049 doi:10.2765/640968 KC-BF-21-005-EN-N
© European Union, 2021 Non-commercial reproduction is authorised provided the source is acknowledged. Data, whose source is not the European Union as identified in tables and charts of this publication, is property of the named third party and therefore authorisation for its reproduction must be sought directly with the source. CREDIT Cover photography: © iStock.com/Vladimir Dmitriev
European Commission Directorate-General for Economic and Financial Affairs
European Business Cycle Indicators
2nd Quarter 2021
Special topic
Managers’ and consumers’ price expectations on the rise
This document is written by the staff of the Directorate-General for Economic and Financial Affairs,
Directorate A for Policy, Strategy and Communication, Unit A3 - Economic Situation, Forecasts, Business
and Consumer Surveys (http://ec.europa.eu/info/business-economy-euro/indicators-statistics/economic-
databases/business-and-consumer-surveys_en).
Contact: [email protected].
EUROPEAN ECONOMY Technical Paper 049

CONTENTS
OVERVIEW ............................................................................................................................................ 6
1. RECENT DEVELOPMENTS IN SURVEY INDICATORS ....................................................................... 7
1.1. EU and euro area ..................................................................................................................... 7
1.2. Selected Member States ...................................................................................................... 15
2. SPECIAL TOPIC: MANAGERS’ AND CONSUMERS’ PRICE EXPECTATIONS ON THE RISE .......... 20
ANNEX ............................................................................................................................................... 26
6
OVERVIEW
Recent developments in survey indicators
Thanks to a surge in April, followed by further marked improvements in May and
June, the Economic Sentiment Indicators (ESI) for the EU and the euro area (EA)
gained a remarkable 17.1 and 17.0 points compared to March. The ESI is now well
above its long-term average, reaching a 21-year high in both regions.
Likewise, the Employment Expectations Indicator (EEI) in both the EU and the EA
recorded a sharp rise in April, followed by two further, albeit somewhat less marked,
increases in May and June. Compared to March, the EEI in June is 13.5 (EU) / 13.8
(EA) points up and well above its long-term average of 100 in both areas.
From a sectoral perspective, the second quarter of 2021 saw the most significant
improvements in confidence in services and retail trade. The gains in industry,
construction and among consumers were also marked. Considering the long-term
averages of the indicators, the current level of confidence is high in all sectors.
The ESI recovered in all of the six largest EU economies. The gains registered
between March and June 2021 were strongest in Italy (+18.4), followed by Poland
(+16.6), France (+16.0), the Netherlands (+15.8), Germany (+13.5) and Spain
(+10.3). In June, the ESI was well above its long-term average of 100 and its pre-
pandemic level in all six countries.
In April, capacity utilisation in manufacturing increased markedly in both the EU
(+4.7 percentage points) and the EA (+5.0 percentage points) compared to the last
survey of January. At 82.3% (EU) and 82.5% (EA) in April, both indicators are now
above their respective long-term averages of 80.5% (EU) / 80.6% (EA). Both
indicators are also higher than their pre-pandemic level recorded in January 2020.
Capacity utilisation in services increased by 1.1 percentage points in the EU (to
86.9%) and by 1.2 percentage points in the EA (to 86.4%) compared to January. In
both regions, however, the indicator remains below both its long-term average
(88.9% in the EU, 88.6% in the EA) and its pre-pandemic level (90.5% in the EU,
90.3% in the EA).
Special topic: Managers’ and consumers’ price expectations on
the rise
Since the beginning of the year, consumer inflation has been rising rapidly. This Special
Topic explores to what extent selling and consumer price expectations up to June 2021 can
provide additional information on consumer inflation going forward. Upside pressure on
prices appears to be a response to shortage of material and broad demand pressures, as
highlighted by increasing capacity utilisation and orders and low levels of stocks. However,
in the services sector, survey results suggest that price pressure remained overall contained
in June. Still, with demand returning forcefully to certain contact-intensive services after a
protracted COVID-related standstill, shortage of labour may temporarily push up prices in
contact-intensive activities further. Statistical analysis suggests that the recent surge in
selling price expectations could translate into further price pressures in the near future for
products sold by the surveyed managers – either at intermediate or final level. Under the
current exceptional circumstances, selling price expectations may provide important
indications of further pressure ahead on consumer prices and therefore should be carefully
monitored.
7
1. RECENT DEVELOPMENTS IN SURVEY INDICATORS
1.1. EU and euro area
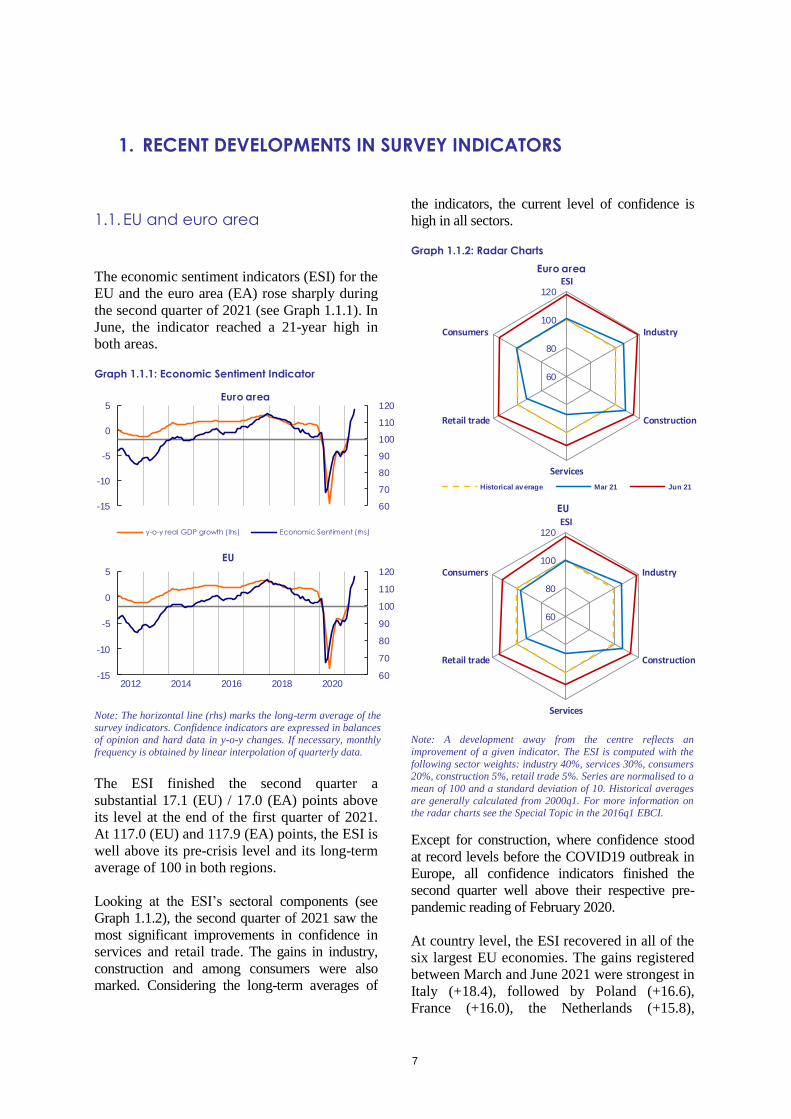
The economic sentiment indicators (ESI) for the
EU and the euro area (EA) rose sharply during
the second quarter of 2021 (see Graph 1.1.1). In
June, the indicator reached a 21-year high in
both areas.
Graph 1.1.1: Economic Sentiment Indicator
60
70
80
90
100
110
120
-15
-10
-5
0
5Euro area
60
70
80
90
100
110
120
-15
-10
-5
0
5
2012 2014 2016 2018 2020
EU
y-o-y real GDP growth (lhs) Economic Sent iment (rhs)
Note: The horizontal line (rhs) marks the long-term average of the
survey indicators. Confidence indicators are expressed in balances of opinion and hard data in y-o-y changes. If necessary, monthly
frequency is obtained by linear interpolation of quarterly data.
The ESI finished the second quarter a
substantial 17.1 (EU) / 17.0 (EA) points above
its level at the end of the first quarter of 2021.
At 117.0 (EU) and 117.9 (EA) points, the ESI is
well above its pre-crisis level and its long-term
average of 100 in both regions.
Looking at the ESI’s sectoral components (see
Graph 1.1.2), the second quarter of 2021 saw the
most significant improvements in confidence in
services and retail trade. The gains in industry,
construction and among consumers were also
marked. Considering the long-term averages of
the indicators, the current level of confidence is
high in all sectors.
Graph 1.1.2: Radar Charts
60
80
100
120ESI
Industry
Construction
Services
Retail trade
Consumers
Euro area
Historical average Mar 21 Jun 21
60
80
100
120ESI
Industry
Construction
Services
Retail trade
Consumers
EU
Note: A development away from the centre reflects an
improvement of a given indicator. The ESI is computed with the
following sector weights: industry 40%, services 30%, consumers 20%, construction 5%, retail trade 5%. Series are normalised to a
mean of 100 and a standard deviation of 10. Historical averages
are generally calculated from 2000q1. For more information on the radar charts see the Special Topic in the 2016q1 EBCI.
Except for construction, where confidence stood
at record levels before the COVID19 outbreak in
Europe, all confidence indicators finished the
second quarter well above their respective pre-
pandemic reading of February 2020.
At country level, the ESI recovered in all of the
six largest EU economies. The gains registered
between March and June 2021 were strongest in
Italy (+18.4), followed by Poland (+16.6),
France (+16.0), the Netherlands (+15.8),
8
Germany (+13.5) and Spain (+10.3). In June,
the ESI was well above its long-term average of
100 and its pre-pandemic level in all six
countries.
During the second quarter of the year, the
evolution of the ESI was broadly in line with
developments in other survey-based bellwethers
for the EA/EU. Markit Economics' PMI
Composite Output Index for the EA increased
throughout the second quarter, bringing the
indicator to a level (59.5 points) not seen since
June 2006.
Also the Ifo Business Climate Index (for
Germany), improved markedly during the
second quarter and is now well above its pre-
pandemic levels.
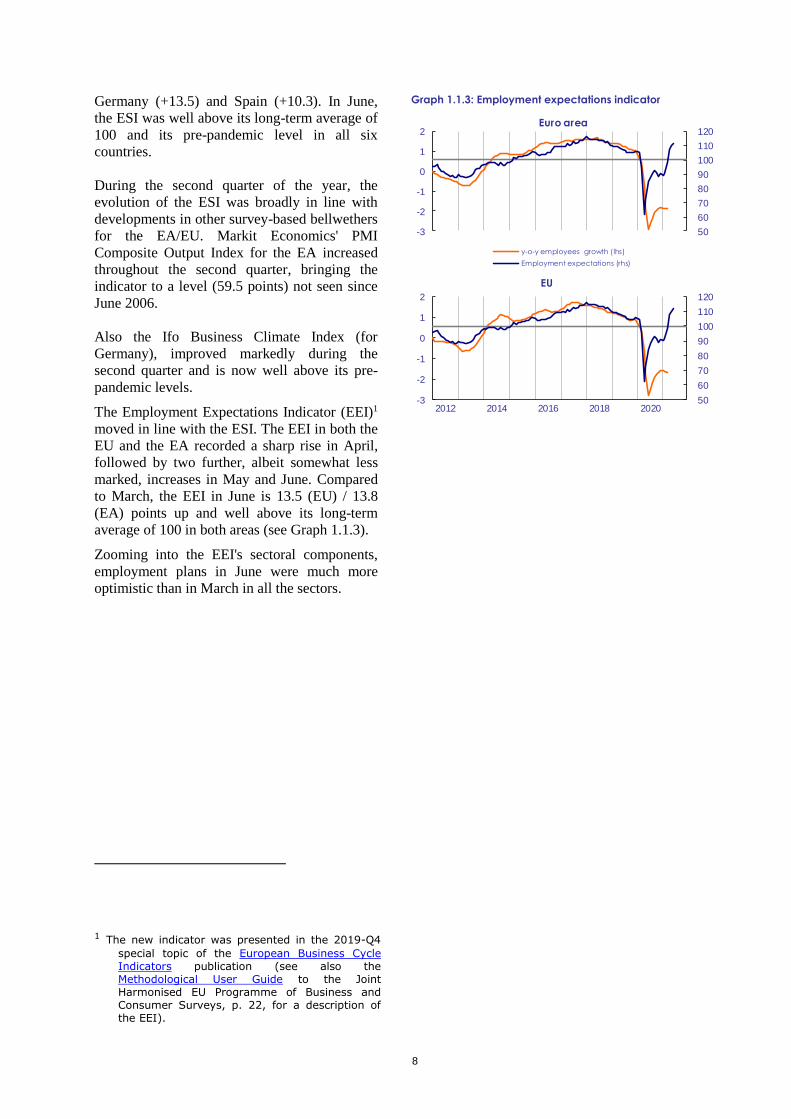
The Employment Expectations Indicator (EEI)1
moved in line with the ESI. The EEI in both the
EU and the EA recorded a sharp rise in April,
followed by two further, albeit somewhat less
marked, increases in May and June. Compared
to March, the EEI in June is 13.5 (EU) / 13.8
(EA) points up and well above its long-term
average of 100 in both areas (see Graph 1.1.3).
Zooming into the EEI's sectoral components,
employment plans in June were much more
optimistic than in March in all the sectors.
1 The new indicator was presented in the 2019-Q4
special topic of the European Business Cycle Indicators publication (see also the Methodological User Guide to the Joint Harmonised EU Programme of Business and Consumer Surveys, p. 22, for a description of the EEI).
Graph 1.1.3: Employment expectations indicator
50
60
70
80
90
100
110
120
-3
-2
-1
0
1
2Euro area
50
60
70
80
90
100
110
120
-3
-2
-1
0
1
2
2012 2014 2016 2018 2020
EU
y-o-y employees growth (lhs)
Employment expectations (rhs)
9
Sector developments
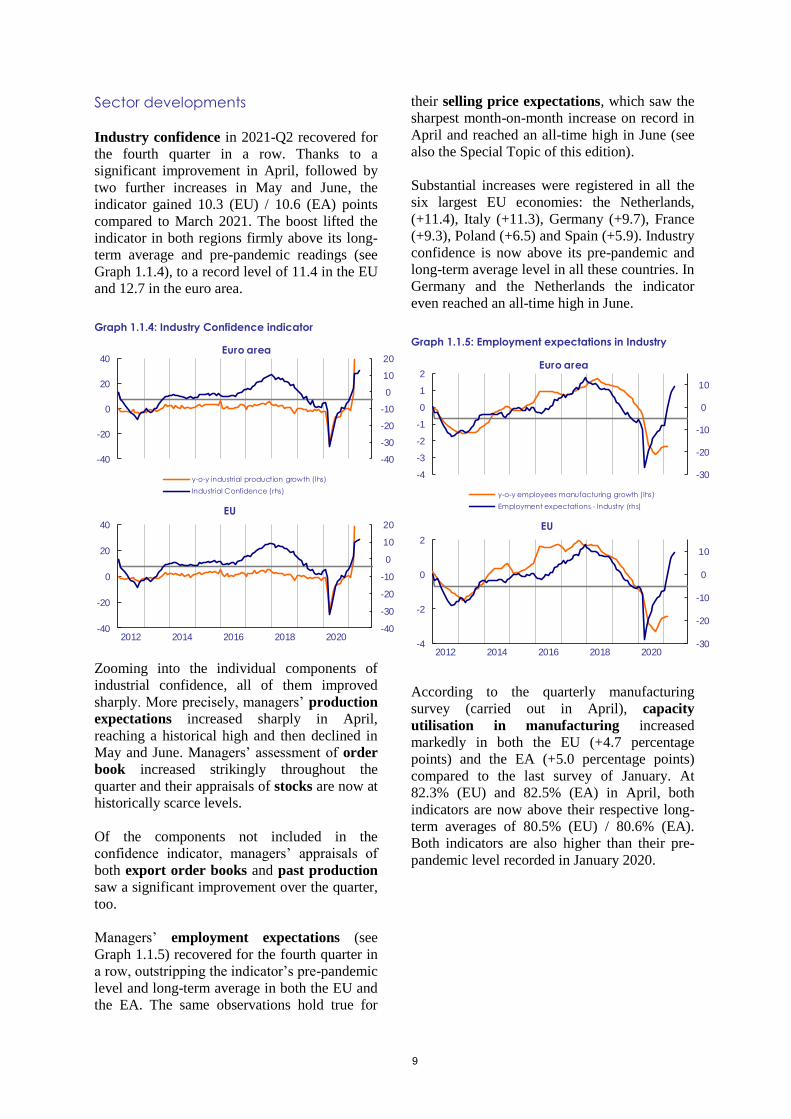
Industry confidence in 2021-Q2 recovered for
the fourth quarter in a row. Thanks to a
significant improvement in April, followed by
two further increases in May and June, the
indicator gained 10.3 (EU) / 10.6 (EA) points
compared to March 2021. The boost lifted the
indicator in both regions firmly above its long-
term average and pre-pandemic readings (see
Graph 1.1.4), to a record level of 11.4 in the EU
and 12.7 in the euro area.
Graph 1.1.4: Industry Confidence indicator
-40
-30
-20
-10
0
10
20
-40
-20
0
20
40Euro area
-40
-30
-20
-10
0
10
20
-40
-20
0
20
40
2012 2014 2016 2018 2020
EU
y-o-y industrial production growth (lhs)
Industrial Confidence (rhs)
Zooming into the individual components of
industrial confidence, all of them improved
sharply. More precisely, managers’ production
expectations increased sharply in April,
reaching a historical high and then declined in
May and June. Managers’ assessment of order
book increased strikingly throughout the
quarter and their appraisals of stocks are now at
historically scarce levels.
Of the components not included in the
confidence indicator, managers’ appraisals of
both export order books and past production
saw a significant improvement over the quarter,
too.
Managers’ employment expectations (see
Graph 1.1.5) recovered for the fourth quarter in
a row, outstripping the indicator’s pre-pandemic
level and long-term average in both the EU and
the EA. The same observations hold true for
their selling price expectations, which saw the
sharpest month-on-month increase on record in
April and reached an all-time high in June (see
also the Special Topic of this edition).
Substantial increases were registered in all the
six largest EU economies: the Netherlands,
(+11.4), Italy (+11.3), Germany (+9.7), France
(+9.3), Poland (+6.5) and Spain (+5.9). Industry
confidence is now above its pre-pandemic and
long-term average level in all these countries. In
Germany and the Netherlands the indicator
even reached an all-time high in June.
Graph 1.1.5: Employment expectations in Industry
-30
-20
-10
0
10
-4
-3
-2
-1
0
1
2Euro area
-30
-20
-10
0
10
-4
-2
0
2
2012 2014 2016 2018 2020
EU
y-o-y employees manufacturing growth (lhs)
Employment expectations - Industry (rhs)
According to the quarterly manufacturing
survey (carried out in April), capacity
utilisation in manufacturing increased
markedly in both the EU (+4.7 percentage
points) and the EA (+5.0 percentage points)
compared to the last survey of January. At
82.3% (EU) and 82.5% (EA) in April, both
indicators are now above their respective long-
term averages of 80.5% (EU) / 80.6% (EA).
Both indicators are also higher than their pre-
pandemic level recorded in January 2020.
10
Graph 1.1.6: Services Confidence indicator
-50
-30
-10
10
-18
-12
-6
0
6Euro area
-50
-30
-10
10
-18
-14
-10
-6
-2
2
6
2012 2014 2016 2018 2020
EU
y-o-y services value added growth (lhs)
Service Confidence (rhs)
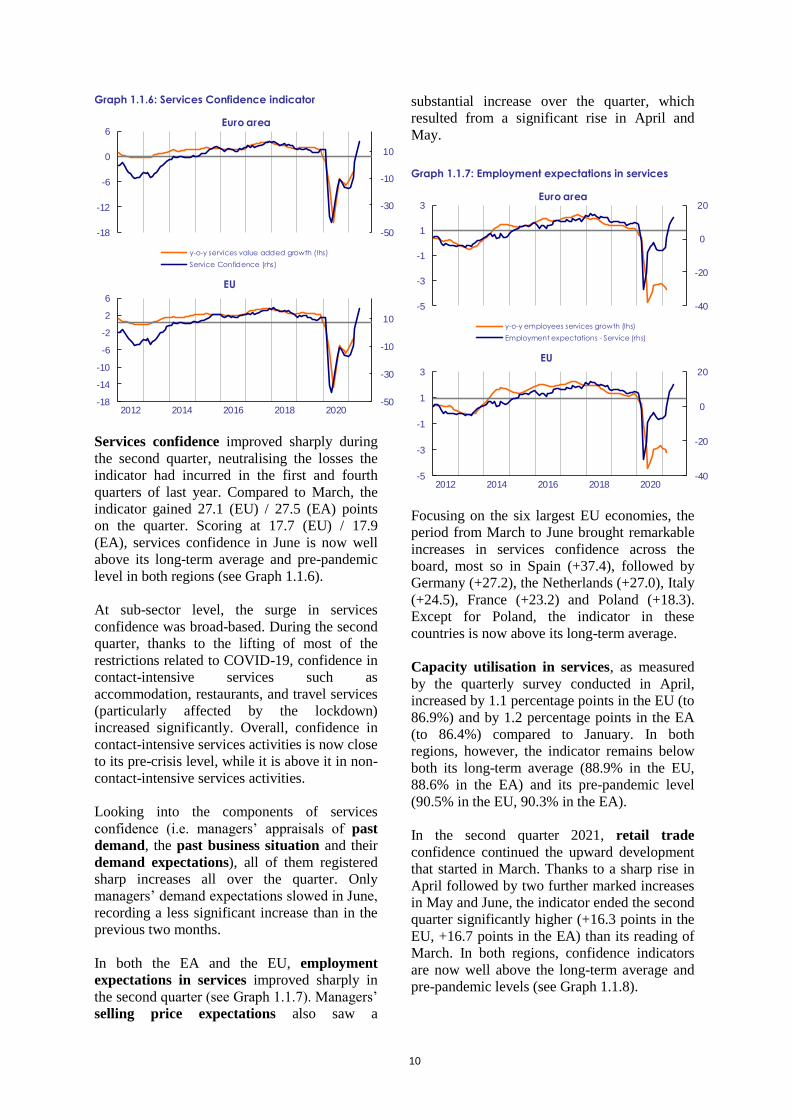
Services confidence improved sharply during
the second quarter, neutralising the losses the
indicator had incurred in the first and fourth
quarters of last year. Compared to March, the
indicator gained 27.1 (EU) / 27.5 (EA) points
on the quarter. Scoring at 17.7 (EU) / 17.9
(EA), services confidence in June is now well
above its long-term average and pre-pandemic
level in both regions (see Graph 1.1.6).
At sub-sector level, the surge in services
confidence was broad-based. During the second
quarter, thanks to the lifting of most of the
restrictions related to COVID-19, confidence in
contact-intensive services such as
accommodation, restaurants, and travel services
(particularly affected by the lockdown)
increased significantly. Overall, confidence in
contact-intensive services activities is now close
to its pre-crisis level, while it is above it in non-
contact-intensive services activities.
Looking into the components of services
confidence (i.e. managers’ appraisals of past
demand, the past business situation and their
demand expectations), all of them registered
sharp increases all over the quarter. Only
managers’ demand expectations slowed in June,
recording a less significant increase than in the
previous two months.
In both the EA and the EU, employment
expectations in services improved sharply in
the second quarter (see Graph 1.1.7). Managers’
selling price expectations also saw a
substantial increase over the quarter, which
resulted from a significant rise in April and
May.
Graph 1.1.7: Employment expectations in services
-40
-20
0
20
-5
-3
-1
1
3Euro area
-40
-20
0
20
-5
-3
-1
1
3
2012 2014 2016 2018 2020
EU
y-o-y employees services growth (lhs)
Employment expectations - Service (rhs)
Focusing on the six largest EU economies, the
period from March to June brought remarkable
increases in services confidence across the
board, most so in Spain (+37.4), followed by
Germany (+27.2), the Netherlands (+27.0), Italy
(+24.5), France (+23.2) and Poland (+18.3).
Except for Poland, the indicator in these
countries is now above its long-term average.
Capacity utilisation in services, as measured
by the quarterly survey conducted in April,
increased by 1.1 percentage points in the EU (to
86.9%) and by 1.2 percentage points in the EA
(to 86.4%) compared to January. In both
regions, however, the indicator remains below
both its long-term average (88.9% in the EU,
88.6% in the EA) and its pre-pandemic level
(90.5% in the EU, 90.3% in the EA).
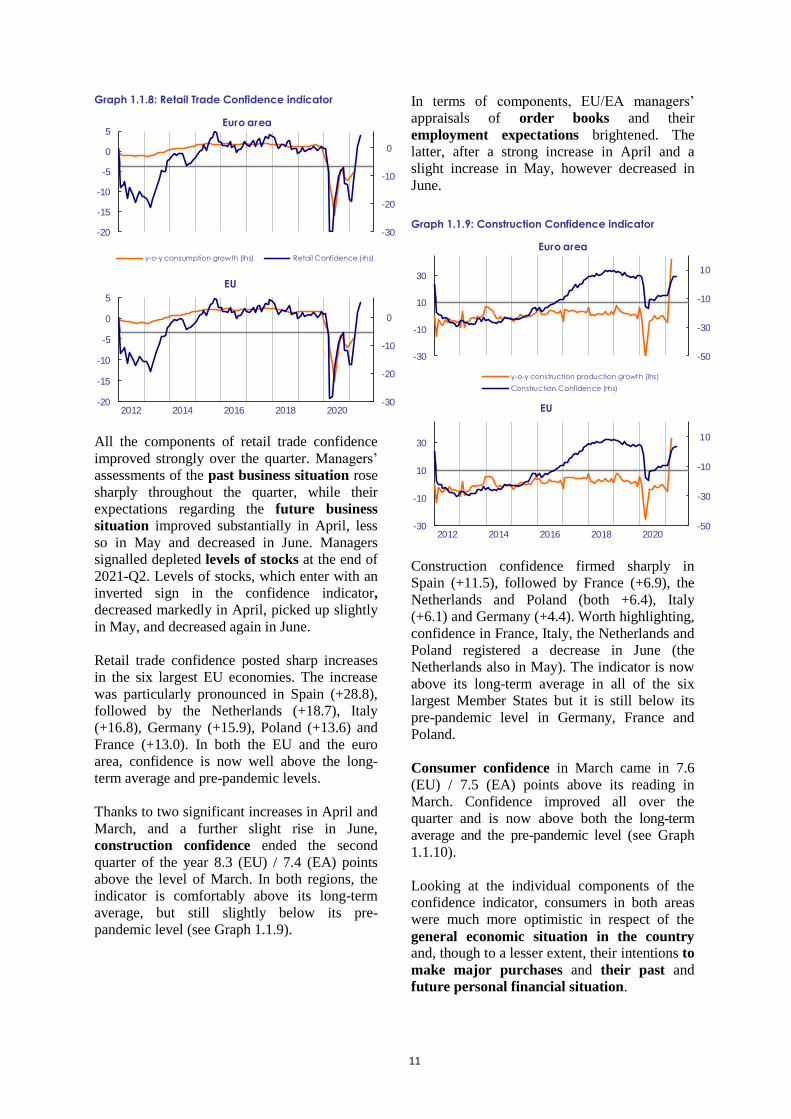
In the second quarter 2021, retail trade
confidence continued the upward development
that started in March. Thanks to a sharp rise in
April followed by two further marked increases
in May and June, the indicator ended the second
quarter significantly higher (+16.3 points in the
EU, +16.7 points in the EA) than its reading of
March. In both regions, confidence indicators
are now well above the long-term average and
pre-pandemic levels (see Graph 1.1.8).
11
Graph 1.1.8: Retail Trade Confidence indicator
-30
-20
-10
0
-20
-15
-10
-5
0
5Euro area
-30
-20
-10
0
-20
-15
-10
-5
0
5
2012 2014 2016 2018 2020
EU
y-o-y consumption growth (lhs) Retail Confidence (rhs)
All the components of retail trade confidence
improved strongly over the quarter. Managers’
assessments of the past business situation rose
sharply throughout the quarter, while their
expectations regarding the future business
situation improved substantially in April, less
so in May and decreased in June. Managers
signalled depleted levels of stocks at the end of
2021-Q2. Levels of stocks, which enter with an
inverted sign in the confidence indicator,
decreased markedly in April, picked up slightly
in May, and decreased again in June.
Retail trade confidence posted sharp increases
in the six largest EU economies. The increase
was particularly pronounced in Spain (+28.8),
followed by the Netherlands (+18.7), Italy
(+16.8), Germany (+15.9), Poland (+13.6) and
France (+13.0). In both the EU and the euro
area, confidence is now well above the long-
term average and pre-pandemic levels.
Thanks to two significant increases in April and
March, and a further slight rise in June,
construction confidence ended the second
quarter of the year 8.3 (EU) / 7.4 (EA) points
above the level of March. In both regions, the
indicator is comfortably above its long-term
average, but still slightly below its pre-
pandemic level (see Graph 1.1.9).
In terms of components, EU/EA managers’
appraisals of order books and their
employment expectations brightened. The
latter, after a strong increase in April and a
slight increase in May, however decreased in
June.
Graph 1.1.9: Construction Confidence indicator
-50
-30
-10
10
-30
-10
10
30
Euro area
-50
-30
-10
10
-30
-10
10
30
2012 2014 2016 2018 2020
EU
y-o-y construction production growth (lhs)
Construction Confidence (rhs)
Construction confidence firmed sharply in
Spain (+11.5), followed by France (+6.9), the
Netherlands and Poland (both +6.4), Italy
(+6.1) and Germany (+4.4). Worth highlighting,
confidence in France, Italy, the Netherlands and
Poland registered a decrease in June (the
Netherlands also in May). The indicator is now
above its long-term average in all of the six
largest Member States but it is still below its
pre-pandemic level in Germany, France and
Poland.
Consumer confidence in March came in 7.6
(EU) / 7.5 (EA) points above its reading in
March. Confidence improved all over the
quarter and is now above both the long-term
average and the pre-pandemic level (see Graph
1.1.10).
Looking at the individual components of the
confidence indicator, consumers in both areas
were much more optimistic in respect of the
general economic situation in the country and, though to a lesser extent, their intentions to
make major purchases and their past and
future personal financial situation.
12
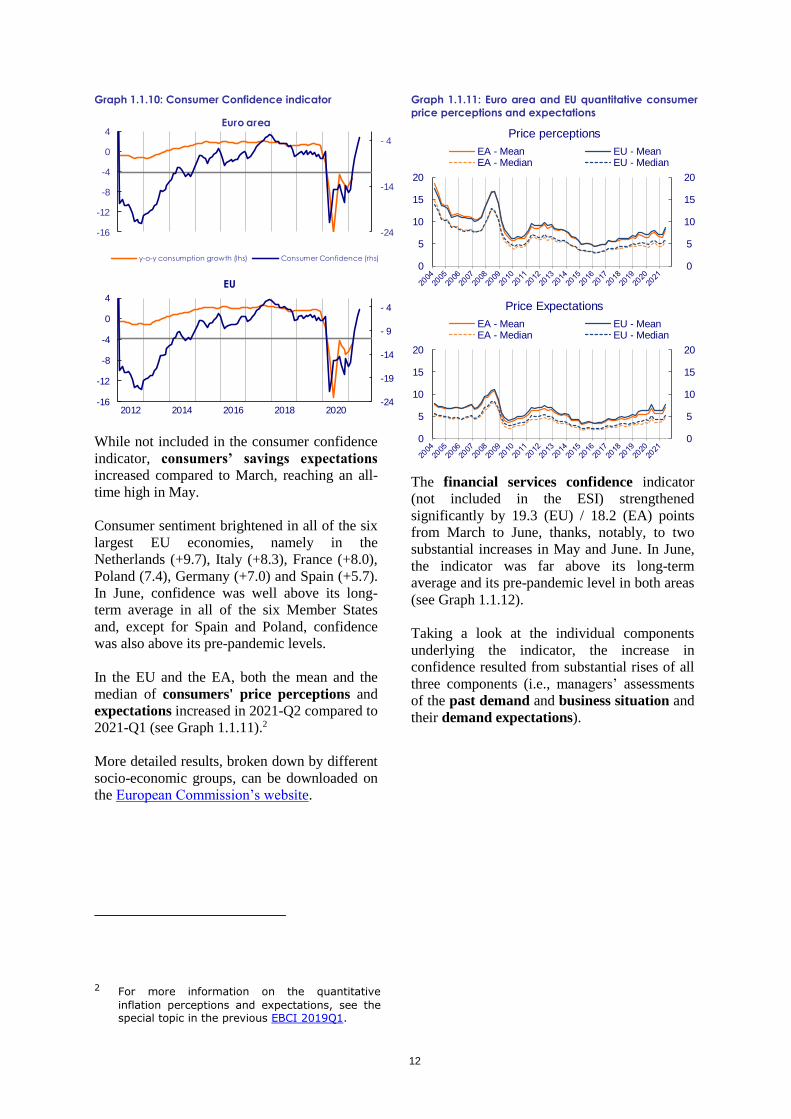
Graph 1.1.10: Consumer Confidence indicator
-24
-14
- 4
-16
-12
-8
-4
0
4Euro area
-24
-19
-14
- 9
- 4
-16
-12
-8
-4
0
4
2012 2014 2016 2018 2020
EU
y-o-y consumption growth (lhs) Consumer Confidence (rhs)
While not included in the consumer confidence
indicator, consumers’ savings expectations
increased compared to March, reaching an all-
time high in May.
Consumer sentiment brightened in all of the six
largest EU economies, namely in the
Netherlands (+9.7), Italy (+8.3), France (+8.0),
Poland (7.4), Germany (+7.0) and Spain (+5.7).
In June, confidence was well above its long-
term average in all of the six Member States
and, except for Spain and Poland, confidence
was also above its pre-pandemic levels.
In the EU and the EA, both the mean and the
median of consumers' price perceptions and
expectations increased in 2021-Q2 compared to
2021-Q1 (see Graph 1.1.11).2
More detailed results, broken down by different
socio-economic groups, can be downloaded on
the European Commission’s website.
2 For more information on the quantitative
inflation perceptions and expectations, see the special topic in the previous EBCI 2019Q1.
Graph 1.1.11: Euro area and EU quantitative consumer
price perceptions and expectations
0
5
10
15
20
0
5
10
15
20
Price perceptions
EA - Mean EU - MeanEA - Median EU - Median
0
5
10
15
20
0
5
10
15
20
Price Expectations
EA - Mean EU - MeanEA - Median EU - Median
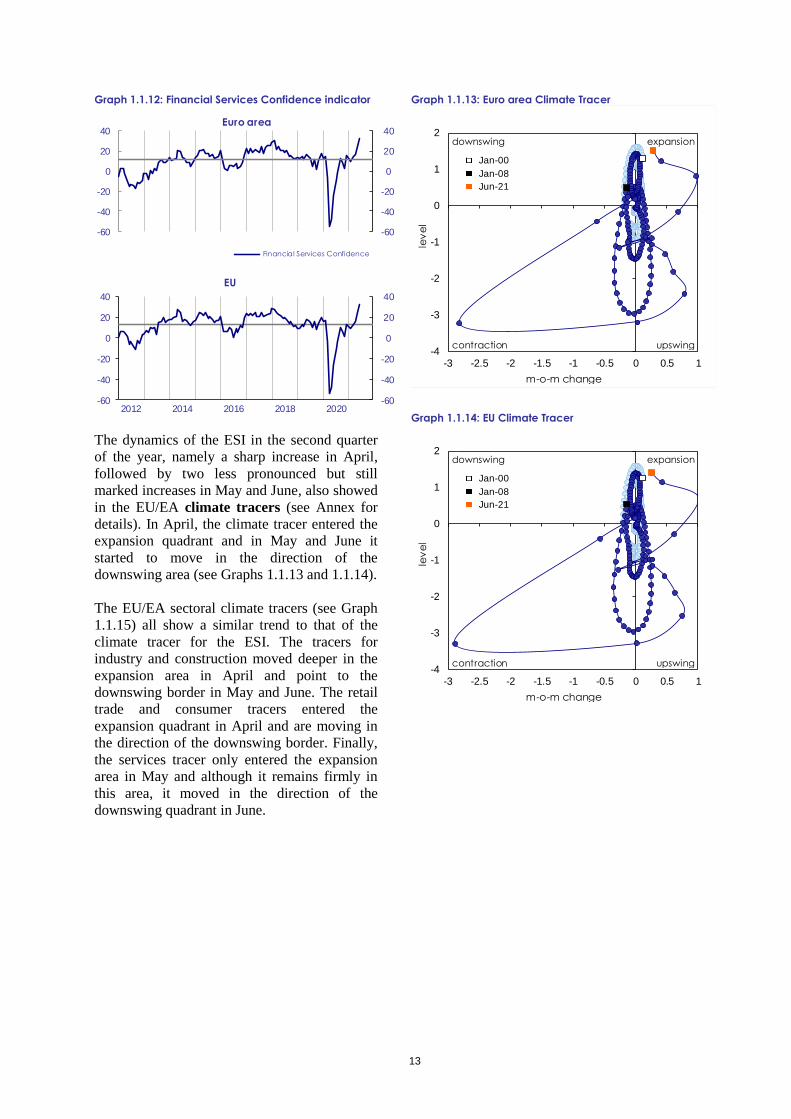
The financial services confidence indicator
(not included in the ESI) strengthened
significantly by 19.3 (EU) / 18.2 (EA) points
from March to June, thanks, notably, to two
substantial increases in May and June. In June,
the indicator was far above its long-term
average and its pre-pandemic level in both areas
(see Graph 1.1.12).
Taking a look at the individual components
underlying the indicator, the increase in
confidence resulted from substantial rises of all
three components (i.e., managers’ assessments
of the past demand and business situation and
their demand expectations).
13
Graph 1.1.12: Financial Services Confidence indicator
-60
-40
-20
0
20
40
-60
-40
-20
0
20
40Euro area
-60
-40
-20
0
20
40
-60
-40
-20
0
20
40
2012 2014 2016 2018 2020
EU
Financial Services Confidence
The dynamics of the ESI in the second quarter
of the year, namely a sharp increase in April,
followed by two less pronounced but still
marked increases in May and June, also showed
in the EU/EA climate tracers (see Annex for
details). In April, the climate tracer entered the
expansion quadrant and in May and June it
started to move in the direction of the
downswing area (see Graphs 1.1.13 and 1.1.14).
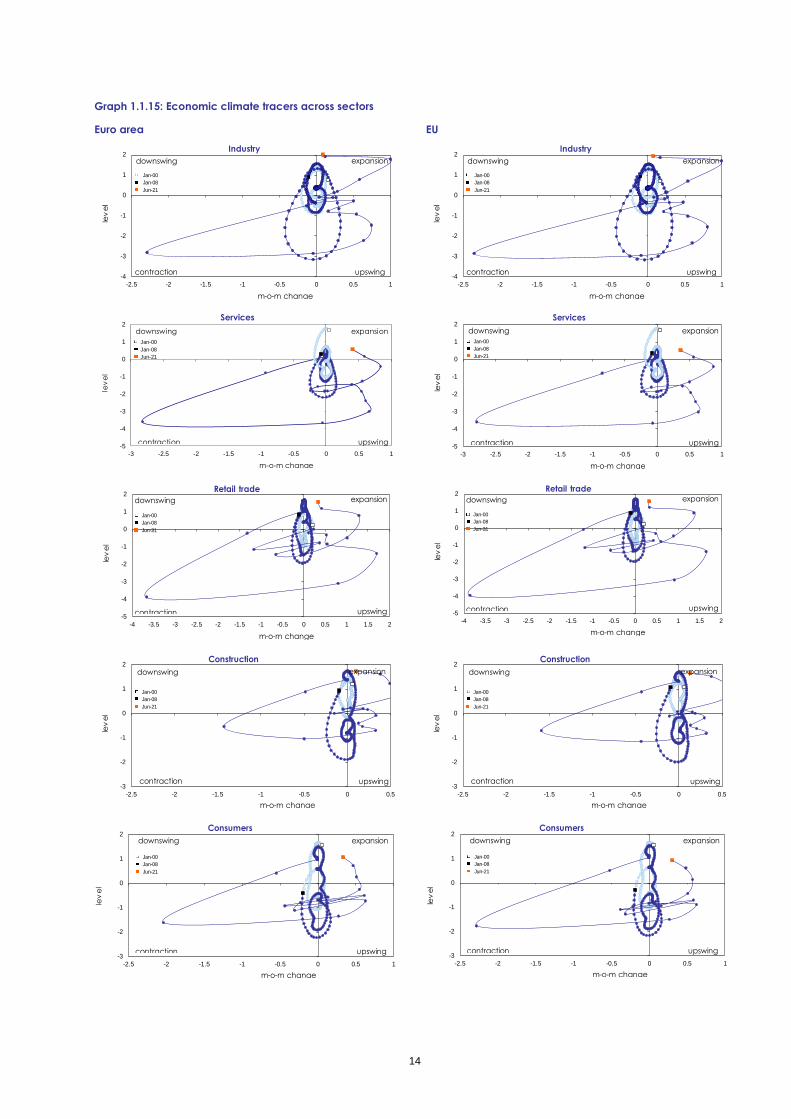
The EU/EA sectoral climate tracers (see Graph
1.1.15) all show a similar trend to that of the
climate tracer for the ESI. The tracers for
industry and construction moved deeper in the
expansion area in April and point to the
downswing border in May and June. The retail
trade and consumer tracers entered the
expansion quadrant in April and are moving in
the direction of the downswing border. Finally,
the services tracer only entered the expansion
area in May and although it remains firmly in
this area, it moved in the direction of the
downswing quadrant in June.
Graph 1.1.13: Euro area Climate Tracer
-4
-3
-2
-1
0
1
2
-3 -2.5 -2 -1.5 -1 -0.5 0 0.5 1
downswing
upswingcontraction
expansion
m-o-m change
lev
el
Jun-21
Jan-00
Jan-08
Graph 1.1.14: EU Climate Tracer
-4
-3
-2
-1
0
1
2
-3 -2.5 -2 -1.5 -1 -0.5 0 0.5 1
downswing
upswingcontraction
expansion
m-o-m change
lev
el
Jun-21
Jan-00
Jan-08
14
Graph 1.1.15: Economic climate tracers across sectors
Euro area EU
-4
-3
-2
-1
0
1
2
-2.5 -2 -1.5 -1 -0.5 0 0.5 1
Industry
downswing
upswingcontraction
expansion
m-o-m change
lev
el
Jun-21
Jan-00
Jan-08
-4
-3
-2
-1
0
1
2
-2.5 -2 -1.5 -1 -0.5 0 0.5 1
Industry
downswing
upswingcontraction
expansion
m-o-m change
lev
el
Jun-21
Jan-00
Jan-08
-5
-4
-3
-2
-1
0
1
2
-3 -2.5 -2 -1.5 -1 -0.5 0 0.5 1
Services
downswing
upswingcontraction
expansion
m-o-m change
lev
el
Jun-21
Jan-00
Jan-08
-5
-4
-3
-2
-1
0
1
2
-3 -2.5 -2 -1.5 -1 -0.5 0 0.5 1
Services
downswing
upswingcontraction
expansion
m-o-m change
lev
el
Jun-21
Jan-00
Jan-08
-5
-4
-3
-2
-1
0
1
2
-4 -3.5 -3 -2.5 -2 -1.5 -1 -0.5 0 0.5 1 1.5 2
Retail trade
downswing
upswingcontraction
expansion
m-o-m change
lev
el
Jun-21
Jan-00
Jan-08
-5
-4
-3
-2
-1
0
1
2
-4 -3.5 -3 -2.5 -2 -1.5 -1 -0.5 0 0.5 1 1.5 2
Retail trade
downswing
upswingcontraction
expansion
m-o-m change
lev
el
Jun-21
Jan-00
Jan-08
-3
-2
-1
0
1
2
-2.5 -2 -1.5 -1 -0.5 0 0.5
Construction
downswing
upswingcontraction
expansion
m-o-m change
lev
el
Jun-21
Jan-00
Jan-08
-3
-2
-1
0
1
2
-2.5 -2 -1.5 -1 -0.5 0 0.5
Construction
downswing
upswingcontraction
expansion
m-o-m change
lev
el
Jun-21
Jan-00
Jan-08
-3
-2
-1
0
1
2
-2.5 -2 -1.5 -1 -0.5 0 0.5 1
Consumers
downswing
upswingcontraction
expansion
m-o-m change
lev
el
Jun-21
Jan-00
Jan-08
-3
-2
-1
0
1
2
-2.5 -2 -1.5 -1 -0.5 0 0.5 1
Consumers
downswing
upswingcontraction
expansion
m-o-m change
lev
el
Jun-21
Jan-00
Jan-08
15
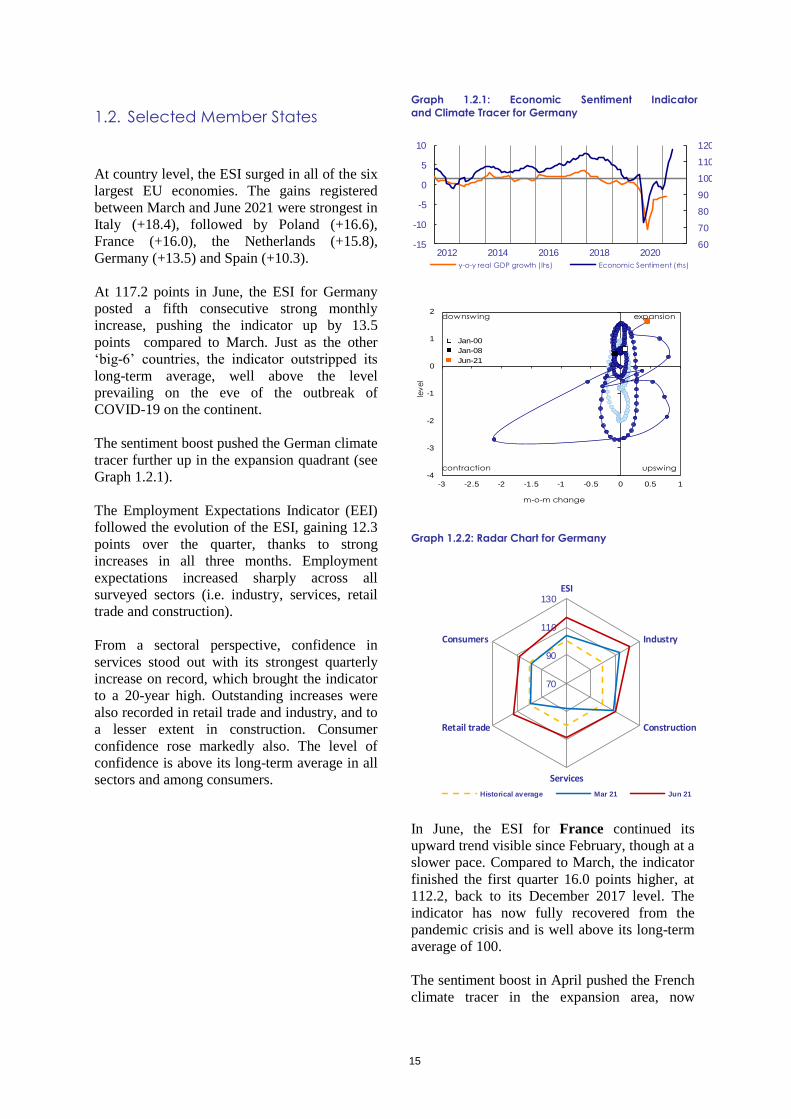
1.2. Selected Member States
At country level, the ESI surged in all of the six
largest EU economies. The gains registered
between March and June 2021 were strongest in
Italy (+18.4), followed by Poland (+16.6),
France (+16.0), the Netherlands (+15.8),
Germany (+13.5) and Spain (+10.3).
At 117.2 points in June, the ESI for Germany
posted a fifth consecutive strong monthly
increase, pushing the indicator up by 13.5
points compared to March. Just as the other
‘big-6’ countries, the indicator outstripped its
long-term average, well above the level
prevailing on the eve of the outbreak of
COVID-19 on the continent.
The sentiment boost pushed the German climate
tracer further up in the expansion quadrant (see
Graph 1.2.1).
The Employment Expectations Indicator (EEI)
followed the evolution of the ESI, gaining 12.3
points over the quarter, thanks to strong
increases in all three months. Employment
expectations increased sharply across all
surveyed sectors (i.e. industry, services, retail
trade and construction).
From a sectoral perspective, confidence in
services stood out with its strongest quarterly
increase on record, which brought the indicator
to a 20-year high. Outstanding increases were
also recorded in retail trade and industry, and to
a lesser extent in construction. Consumer
confidence rose markedly also. The level of
confidence is above its long-term average in all
sectors and among consumers.
Graph 1.2.1: Economic Sentiment Indicator
and Climate Tracer for Germany
60
70
80
90
100
110
120
-15
-10
-5
0
5
10
2012 2014 2016 2018 2020
y-o-y real GDP growth (lhs) Economic Sent iment (rhs)
-4
-3
-2
-1
0
1
2
-3 -2.5 -2 -1.5 -1 -0.5 0 0.5 1
downswing
upswingcontraction
expansion
m-o-m change
lev
el
Jun-21
Jan-00
Jan-08
Graph 1.2.2: Radar Chart for Germany
70
90
110
130ESI
Industry
Construction
Services
Retail trade
Consumers
Historical average Mar 21 Jun 21
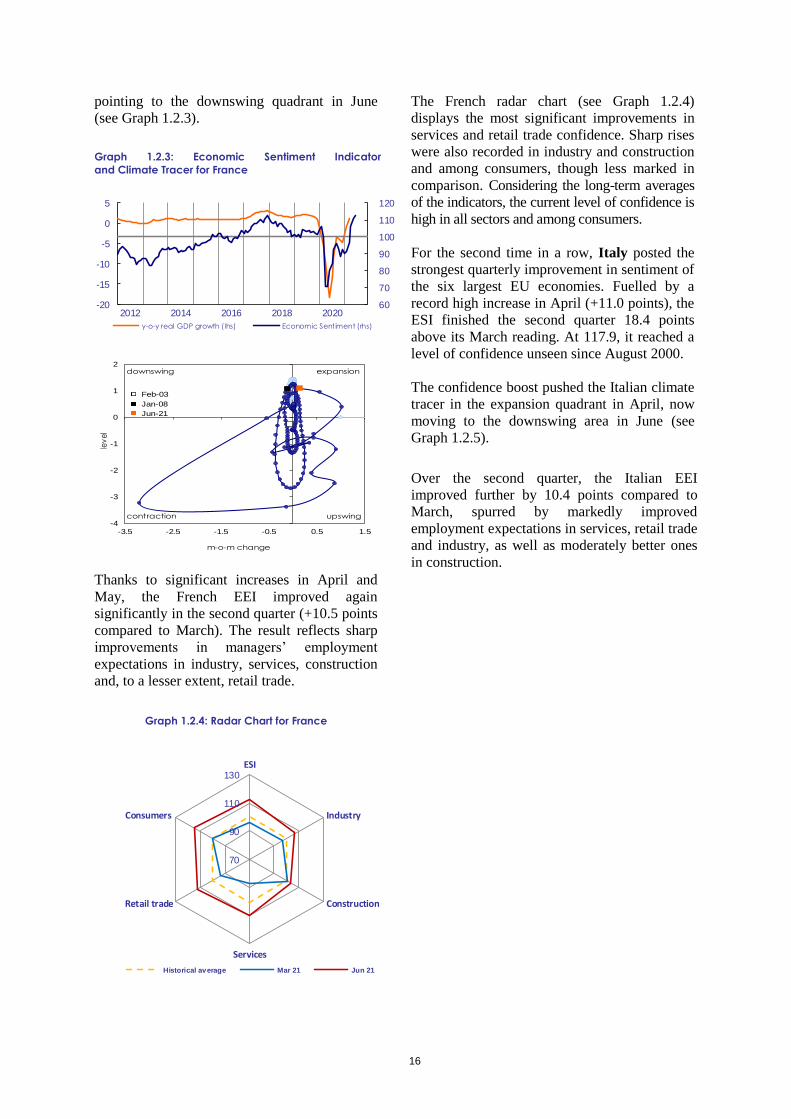
In June, the ESI for France continued its
upward trend visible since February, though at a
slower pace. Compared to March, the indicator
finished the first quarter 16.0 points higher, at
112.2, back to its December 2017 level. The
indicator has now fully recovered from the
pandemic crisis and is well above its long-term
average of 100.
The sentiment boost in April pushed the French
climate tracer in the expansion area, now
16
pointing to the downswing quadrant in June
(see Graph 1.2.3).
Graph 1.2.3: Economic Sentiment Indicator
and Climate Tracer for France
60
70
80
90
100
110
120
-20
-15
-10
-5
0
5
2012 2014 2016 2018 2020
y-o-y real GDP growth (lhs) Economic Sent iment (rhs)
-4
-3
-2
-1
0
1
2
-3.5 -2.5 -1.5 -0.5 0.5 1.5
downswing
upswingcontraction
expansion
m-o-m change
lev
el
Jun-21
Feb-03
Jan-08
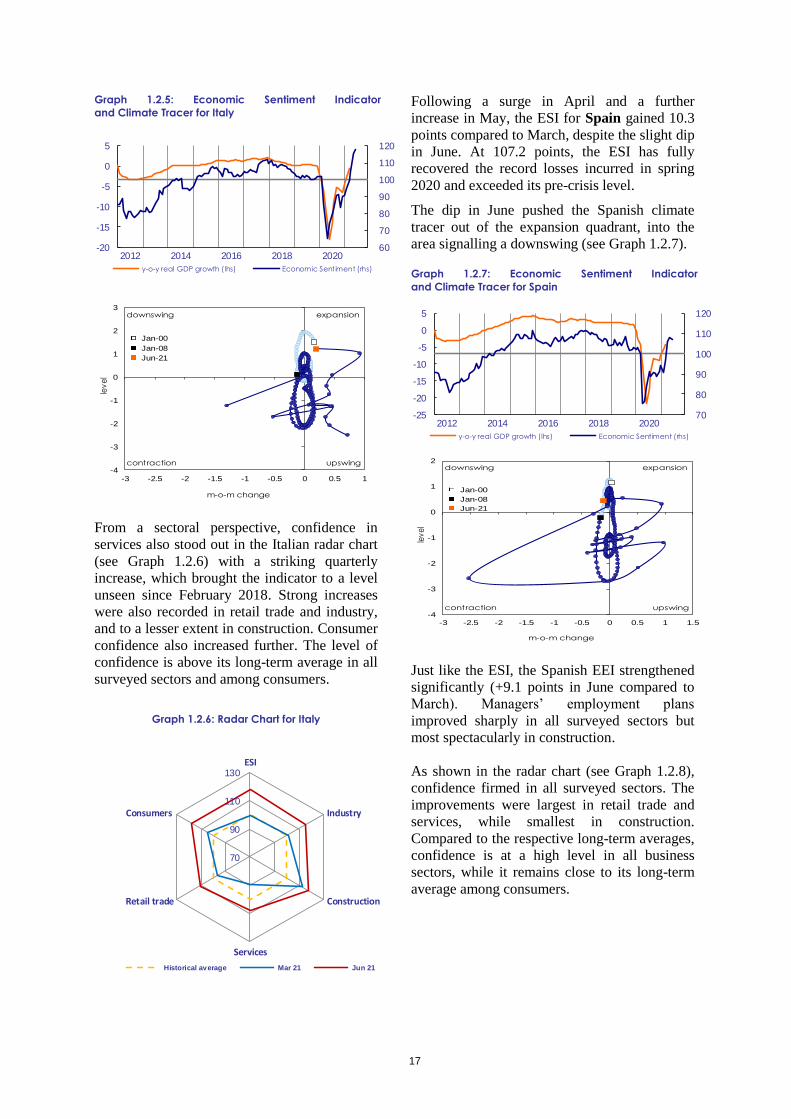
Thanks to significant increases in April and
May, the French EEI improved again
significantly in the second quarter (+10.5 points
compared to March). The result reflects sharp
improvements in managers’ employment
expectations in industry, services, construction
and, to a lesser extent, retail trade.
Graph 1.2.4: Radar Chart for France
70
90
110
130ESI
Industry
Construction
Services
Retail trade
Consumers
Historical average Mar 21 Jun 21
The French radar chart (see Graph 1.2.4)
displays the most significant improvements in
services and retail trade confidence. Sharp rises
were also recorded in industry and construction
and among consumers, though less marked in
comparison. Considering the long-term averages
of the indicators, the current level of confidence is
high in all sectors and among consumers.
For the second time in a row, Italy posted the
strongest quarterly improvement in sentiment of
the six largest EU economies. Fuelled by a
record high increase in April (+11.0 points), the
ESI finished the second quarter 18.4 points
above its March reading. At 117.9, it reached a
level of confidence unseen since August 2000.
The confidence boost pushed the Italian climate
tracer in the expansion quadrant in April, now
moving to the downswing area in June (see
Graph 1.2.5).
Over the second quarter, the Italian EEI
improved further by 10.4 points compared to
March, spurred by markedly improved
employment expectations in services, retail trade
and industry, as well as moderately better ones
in construction.
17
Graph 1.2.5: Economic Sentiment Indicator
and Climate Tracer for Italy
60
70
80
90
100
110
120
-20
-15
-10
-5
0
5
2012 2014 2016 2018 2020
y-o-y real GDP growth (lhs) Economic Sent iment (rhs)
-4
-3
-2
-1
0
1
2
3
-3 -2.5 -2 -1.5 -1 -0.5 0 0.5 1
downswing
upswingcontraction
expansion
m-o-m change
lev
el
Jun-21
Jan-00
Jan-08
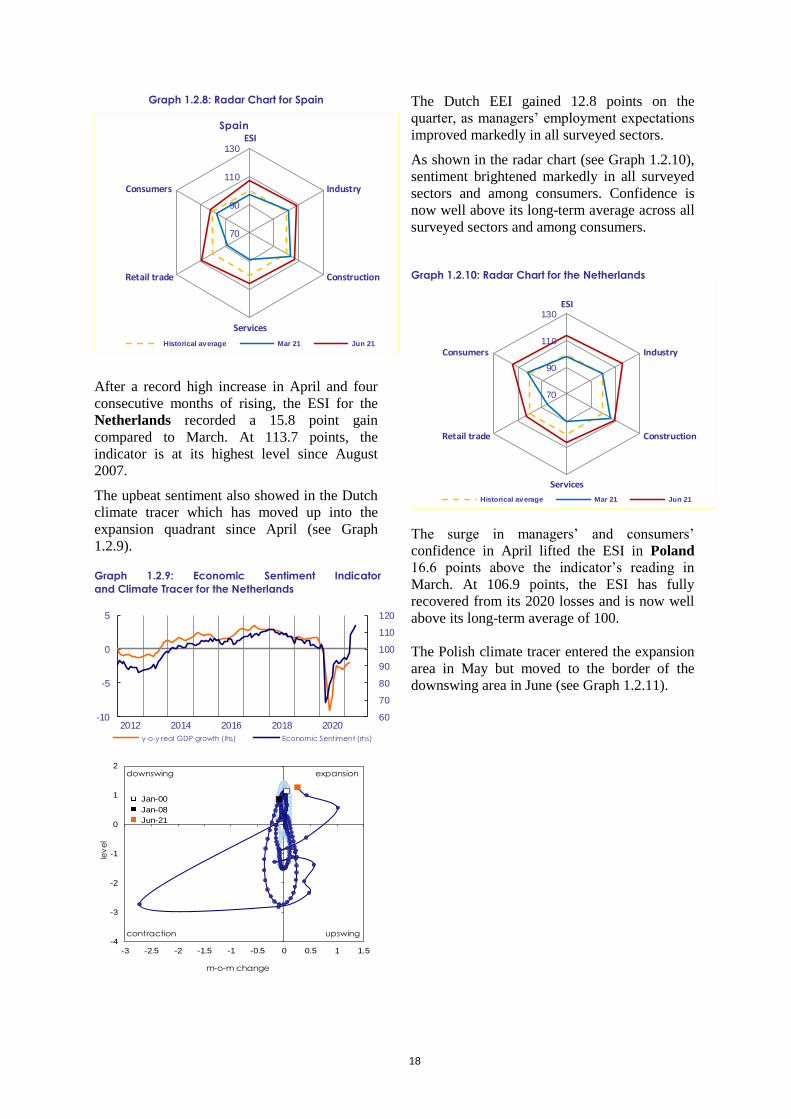
From a sectoral perspective, confidence in
services also stood out in the Italian radar chart
(see Graph 1.2.6) with a striking quarterly
increase, which brought the indicator to a level
unseen since February 2018. Strong increases
were also recorded in retail trade and industry,
and to a lesser extent in construction. Consumer
confidence also increased further. The level of
confidence is above its long-term average in all
surveyed sectors and among consumers.
Graph 1.2.6: Radar Chart for Italy
70
90
110
130ESI
Industry
Construction
Services
Retail trade
Consumers
Historical average Mar 21 Jun 21
Following a surge in April and a further
increase in May, the ESI for Spain gained 10.3
points compared to March, despite the slight dip
in June. At 107.2 points, the ESI has fully
recovered the record losses incurred in spring
2020 and exceeded its pre-crisis level.
The dip in June pushed the Spanish climate
tracer out of the expansion quadrant, into the
area signalling a downswing (see Graph 1.2.7).
Graph 1.2.7: Economic Sentiment Indicator
and Climate Tracer for Spain
70
80
90
100
110
120
-25
-20
-15
-10
-5
0
5
2012 2014 2016 2018 2020
y-o-y real GDP growth (lhs) Economic Sent iment (rhs)
-4
-3
-2
-1
0
1
2
-3 -2.5 -2 -1.5 -1 -0.5 0 0.5 1 1.5
downswing
upswingcontraction
expansion
m-o-m change
lev
el
Jun-21
Jan-00
Jan-08
Just like the ESI, the Spanish EEI strengthened
significantly (+9.1 points in June compared to
March). Managers’ employment plans
improved sharply in all surveyed sectors but
most spectacularly in construction.
As shown in the radar chart (see Graph 1.2.8),
confidence firmed in all surveyed sectors. The
improvements were largest in retail trade and
services, while smallest in construction.
Compared to the respective long-term averages,
confidence is at a high level in all business
sectors, while it remains close to its long-term
average among consumers.
18
Graph 1.2.8: Radar Chart for Spain
70
90
110
130ESI
Industry
Construction
Services
Retail trade
Consumers
Spain
Historical average Mar 21 Jun 21
After a record high increase in April and four
consecutive months of rising, the ESI for the
Netherlands recorded a 15.8 point gain
compared to March. At 113.7 points, the
indicator is at its highest level since August
2007.
The upbeat sentiment also showed in the Dutch
climate tracer which has moved up into the
expansion quadrant since April (see Graph
1.2.9).
Graph 1.2.9: Economic Sentiment Indicator
and Climate Tracer for the Netherlands
60
70
80
90
100
110
120
-10
-5
0
5
2012 2014 2016 2018 2020
y-o-y real GDP growth (lhs) Economic Sent iment (rhs)
-4
-3
-2
-1
0
1
2
-3 -2.5 -2 -1.5 -1 -0.5 0 0.5 1 1.5
downswing
upswingcontraction
expansion
m-o-m change
lev
el
Jun-21
Jan-00
Jan-08
The Dutch EEI gained 12.8 points on the
quarter, as managers’ employment expectations
improved markedly in all surveyed sectors.
As shown in the radar chart (see Graph 1.2.10),
sentiment brightened markedly in all surveyed
sectors and among consumers. Confidence is
now well above its long-term average across all
surveyed sectors and among consumers.
Graph 1.2.10: Radar Chart for the Netherlands
70
90
110
130ESI
Industry
Construction
Services
Retail trade
Consumers
Historical average Mar 21 Jun 21
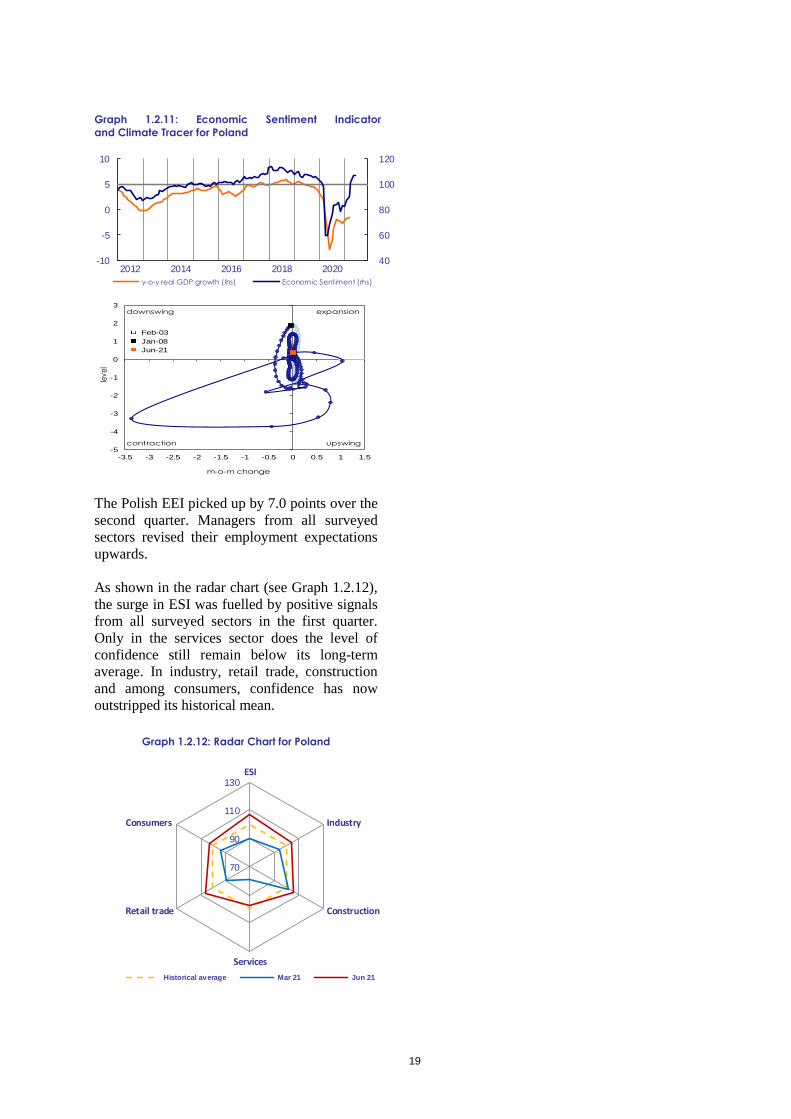
The surge in managers’ and consumers’
confidence in April lifted the ESI in Poland
16.6 points above the indicator’s reading in
March. At 106.9 points, the ESI has fully
recovered from its 2020 losses and is now well
above its long-term average of 100.
The Polish climate tracer entered the expansion
area in May but moved to the border of the
downswing area in June (see Graph 1.2.11).
19
Graph 1.2.11: Economic Sentiment Indicator
and Climate Tracer for Poland
40
60
80
100
120
-10
-5
0
5
10
2012 2014 2016 2018 2020
y-o-y real GDP growth (lhs) Economic Sent iment (rhs)
-5
-4
-3
-2
-1
0
1
2
3
-3.5 -3 -2.5 -2 -1.5 -1 -0.5 0 0.5 1 1.5
downswing
upswingcontraction
expansion
m-o-m change
leve
l
Jun-21
Feb-03
Jan-08
The Polish EEI picked up by 7.0 points over the
second quarter. Managers from all surveyed
sectors revised their employment expectations
upwards.
As shown in the radar chart (see Graph 1.2.12),
the surge in ESI was fuelled by positive signals
from all surveyed sectors in the first quarter.
Only in the services sector does the level of
confidence still remain below its long-term
average. In industry, retail trade, construction
and among consumers, confidence has now
outstripped its historical mean.
Graph 1.2.12: Radar Chart for Poland
70
90
110
130ESI
Industry
Construction
Services
Retail trade
Consumers
Historical average Mar 21 Jun 21
20
2. SPECIAL TOPIC: MANAGERS’ AND CONSUMERS’ PRICE
EXPECTATIONS ON THE RISE
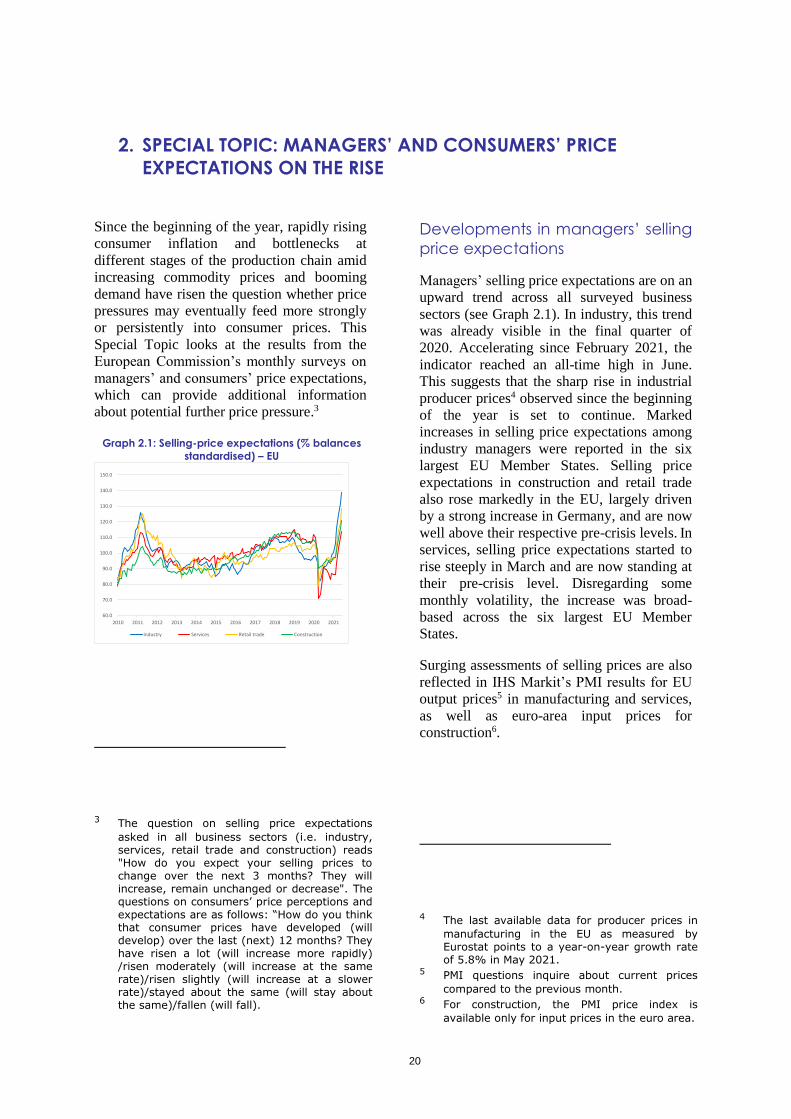
Since the beginning of the year, rapidly rising
consumer inflation and bottlenecks at
different stages of the production chain amid
increasing commodity prices and booming
demand have risen the question whether price
pressures may eventually feed more strongly
or persistently into consumer prices. This
Special Topic looks at the results from the
European Commission’s monthly surveys on
managers’ and consumers’ price expectations,
which can provide additional information
about potential further price pressure.3
Graph 2.1: Selling-price expectations (% balances
standardised) – EU
60.0
70.0
80.0
90.0
100.0
110.0
120.0
130.0
140.0
150.0
2010 2011 2012 2013 2014 2015 2016 2017 2018 2019 2020 2021
Industry Services Retail trade Construction
3 The question on selling price expectations
asked in all business sectors (i.e. industry, services, retail trade and construction) reads "How do you expect your selling prices to change over the next 3 months? They will increase, remain unchanged or decrease". The questions on consumers’ price perceptions and expectations are as follows: “How do you think that consumer prices have developed (will develop) over the last (next) 12 months? They have risen a lot (will increase more rapidly) /risen moderately (will increase at the same rate)/risen slightly (will increase at a slower rate)/stayed about the same (will stay about the same)/fallen (will fall).
Developments in managers’ selling
price expectations
Managers’ selling price expectations are on an
upward trend across all surveyed business
sectors (see Graph 2.1). In industry, this trend
was already visible in the final quarter of
2020. Accelerating since February 2021, the
indicator reached an all-time high in June.
This suggests that the sharp rise in industrial
producer prices4 observed since the beginning
of the year is set to continue. Marked
increases in selling price expectations among
industry managers were reported in the six
largest EU Member States. Selling price
expectations in construction and retail trade
also rose markedly in the EU, largely driven
by a strong increase in Germany, and are now
well above their respective pre-crisis levels. In
services, selling price expectations started to
rise steeply in March and are now standing at
their pre-crisis level. Disregarding some
monthly volatility, the increase was broad-
based across the six largest EU Member
States.
Surging assessments of selling prices are also
reflected in IHS Markit’s PMI results for EU
output prices5 in manufacturing and services,
as well as euro-area input prices for
construction6.
4 The last available data for producer prices in
manufacturing in the EU as measured by Eurostat points to a year-on-year growth rate of 5.8% in May 2021.
5 PMI questions inquire about current prices
compared to the previous month. 6 For construction, the PMI price index is
available only for input prices in the euro area.
21
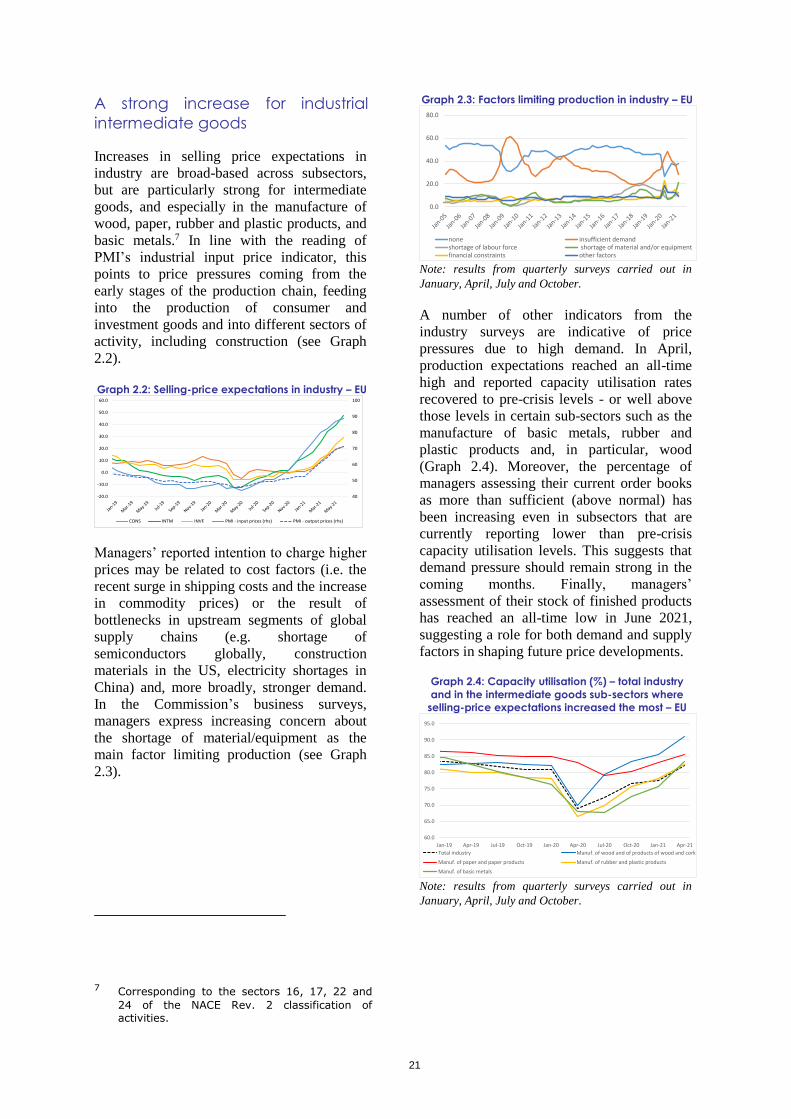
A strong increase for industrial
intermediate goods
Increases in selling price expectations in
industry are broad-based across subsectors,
but are particularly strong for intermediate
goods, and especially in the manufacture of
wood, paper, rubber and plastic products, and
basic metals.7 In line with the reading of
PMI’s industrial input price indicator, this
points to price pressures coming from the
early stages of the production chain, feeding
into the production of consumer and
investment goods and into different sectors of
activity, including construction (see Graph
2.2).
Graph 2.2: Selling-price expectations in industry – EU
40
50
60
70
80
90
100
-20.0
-10.0
0.0
10.0
20.0
30.0
40.0
50.0
60.0
CONS INTM INVE PMI - input prices (rhs) PMI - output prices (rhs)
Managers’ reported intention to charge higher
prices may be related to cost factors (i.e. the
recent surge in shipping costs and the increase
in commodity prices) or the result of
bottlenecks in upstream segments of global
supply chains (e.g. shortage of
semiconductors globally, construction
materials in the US, electricity shortages in
China) and, more broadly, stronger demand.
In the Commission’s business surveys,
managers express increasing concern about
the shortage of material/equipment as the
main factor limiting production (see Graph
2.3).
7 Corresponding to the sectors 16, 17, 22 and
24 of the NACE Rev. 2 classification of activities.
Graph 2.3: Factors limiting production in industry – EU
0.0
20.0
40.0
60.0
80.0
none insufficient demandshortage of labour force shortage of material and/or equipmentfinancial constraints other factors
Note: results from quarterly surveys carried out in
January, April, July and October.
A number of other indicators from the
industry surveys are indicative of price
pressures due to high demand. In April,
production expectations reached an all-time
high and reported capacity utilisation rates
recovered to pre-crisis levels - or well above
those levels in certain sub-sectors such as the
manufacture of basic metals, rubber and
plastic products and, in particular, wood
(Graph 2.4). Moreover, the percentage of
managers assessing their current order books
as more than sufficient (above normal) has
been increasing even in subsectors that are
currently reporting lower than pre-crisis
capacity utilisation levels. This suggests that
demand pressure should remain strong in the
coming months. Finally, managers’
assessment of their stock of finished products
has reached an all-time low in June 2021,
suggesting a role for both demand and supply
factors in shaping future price developments.
Graph 2.4: Capacity utilisation (%) – total industry
and in the intermediate goods sub-sectors where
selling-price expectations increased the most – EU
60.0
65.0
70.0
75.0
80.0
85.0
90.0
95.0
Jan-19 Apr-19 Jul-19 Oct-19 Jan-20 Apr-20 Jul-20 Oct-20 Jan-21 Apr-21
Total industry Manuf. of wood and of products of wood and cork
Manuf. of paper and paper products Manuf. of rubber and plastic products
Manuf. of basic metals Note: results from quarterly surveys carried out in
January, April, July and October.
22
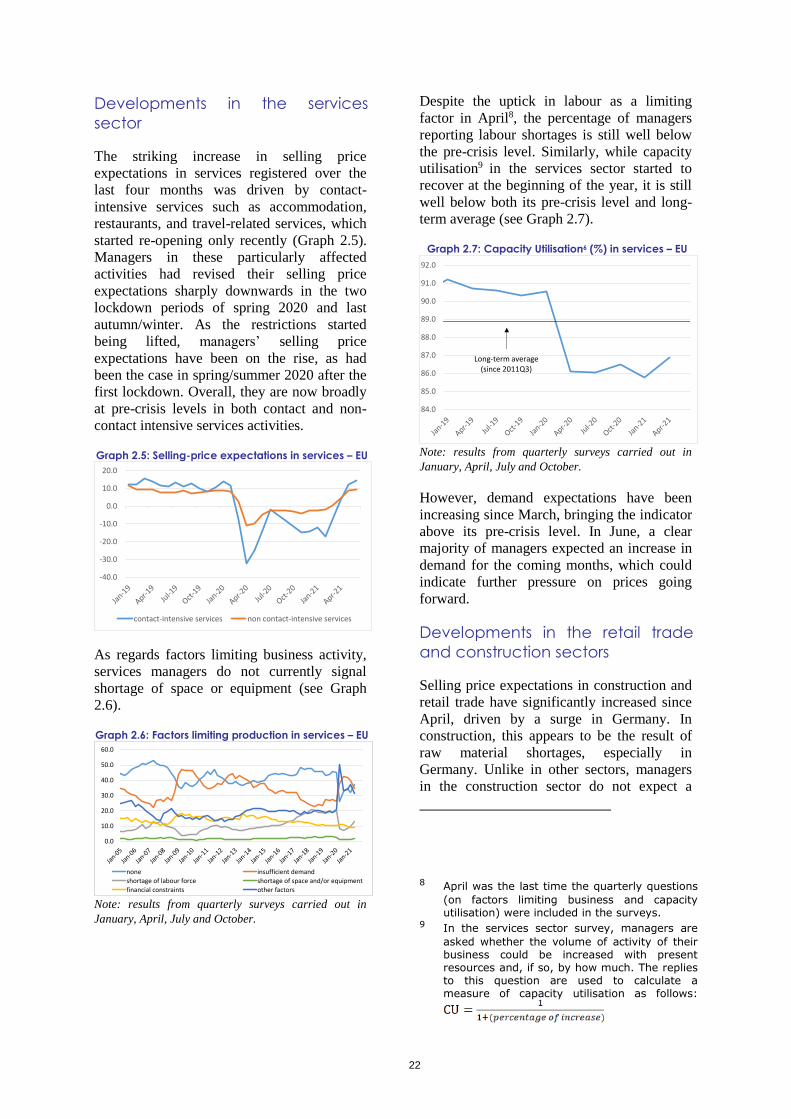
Developments in the services
sector
The striking increase in selling price
expectations in services registered over the
last four months was driven by contact-
intensive services such as accommodation,
restaurants, and travel-related services, which
started re-opening only recently (Graph 2.5).
Managers in these particularly affected
activities had revised their selling price
expectations sharply downwards in the two
lockdown periods of spring 2020 and last
autumn/winter. As the restrictions started
being lifted, managers’ selling price
expectations have been on the rise, as had
been the case in spring/summer 2020 after the
first lockdown. Overall, they are now broadly
at pre-crisis levels in both contact and non-
contact intensive services activities.
Graph 2.5: Selling-price expectations in services – EU
-40.0
-30.0
-20.0
-10.0
0.0
10.0
20.0
contact-intensive services non contact-intensive services
As regards factors limiting business activity,
services managers do not currently signal
shortage of space or equipment (see Graph
2.6).
Graph 2.6: Factors limiting production in services – EU
0.0
10.0
20.0
30.0
40.0
50.0
60.0
none insufficient demand
shortage of labour force shortage of space and/or equipment
financial constraints other factors Note: results from quarterly surveys carried out in
January, April, July and October.
Despite the uptick in labour as a limiting
factor in April8, the percentage of managers
reporting labour shortages is still well below
the pre-crisis level. Similarly, while capacity
utilisation9 in the services sector started to
recover at the beginning of the year, it is still
well below both its pre-crisis level and long-
term average (see Graph 2.7).
Graph 2.7: Capacity Utilisation6 (%) in services – EU
84.0
85.0
86.0
87.0
88.0
89.0
90.0
91.0
92.0
Long-term average (since 2011Q3)
Note: results from quarterly surveys carried out in
January, April, July and October.
However, demand expectations have been
increasing since March, bringing the indicator
above its pre-crisis level. In June, a clear
majority of managers expected an increase in
demand for the coming months, which could
indicate further pressure on prices going
forward.
Developments in the retail trade
and construction sectors
Selling price expectations in construction and
retail trade have significantly increased since
April, driven by a surge in Germany. In
construction, this appears to be the result of
raw material shortages, especially in
Germany. Unlike in other sectors, managers
in the construction sector do not expect a
8 April was the last time the quarterly questions
(on factors limiting business and capacity utilisation) were included in the surveys.
9 In the services sector survey, managers are
asked whether the volume of activity of their business could be increased with present resources and, if so, by how much. The replies to this question are used to calculate a measure of capacity utilisation as follows:
23
large increase in demand and report past
demand as still below its pre-crisis level.
By contrast, in retail trade, increasing selling
price expectations appear to be mainly due to
returning demand. As COVID-restrictions are
being lifted, retailers assess their past business
activity as back on track and expect further
improvement in the coming months.
Developments in consumers’ price
perceptions and expectations
Data from the Commission’s consumer
surveys show that consumers’ inflation
perceptions and expectations have been on an
upward trend since the beginning of the year
(see Graph 2.8), broadly mirroring HICP
developments. In June, both consumer price
perceptions and expectations were above their
pre-crisis levels.
Graph 2.8: HICP (annual percentage change) and
consumers' inflation perceptions and expectations –
EU
-1.0%
0.0%
1.0%
2.0%
3.0%
4.0%
5.0%
-20.0
-10.0
0.0
10.0
20.0
30.0
40.0
50.0
60.0
70.0
80.0
Inflation perceptions (Q5) Inflation expectations (Q6) HICP y-o-y % changes (rhs)
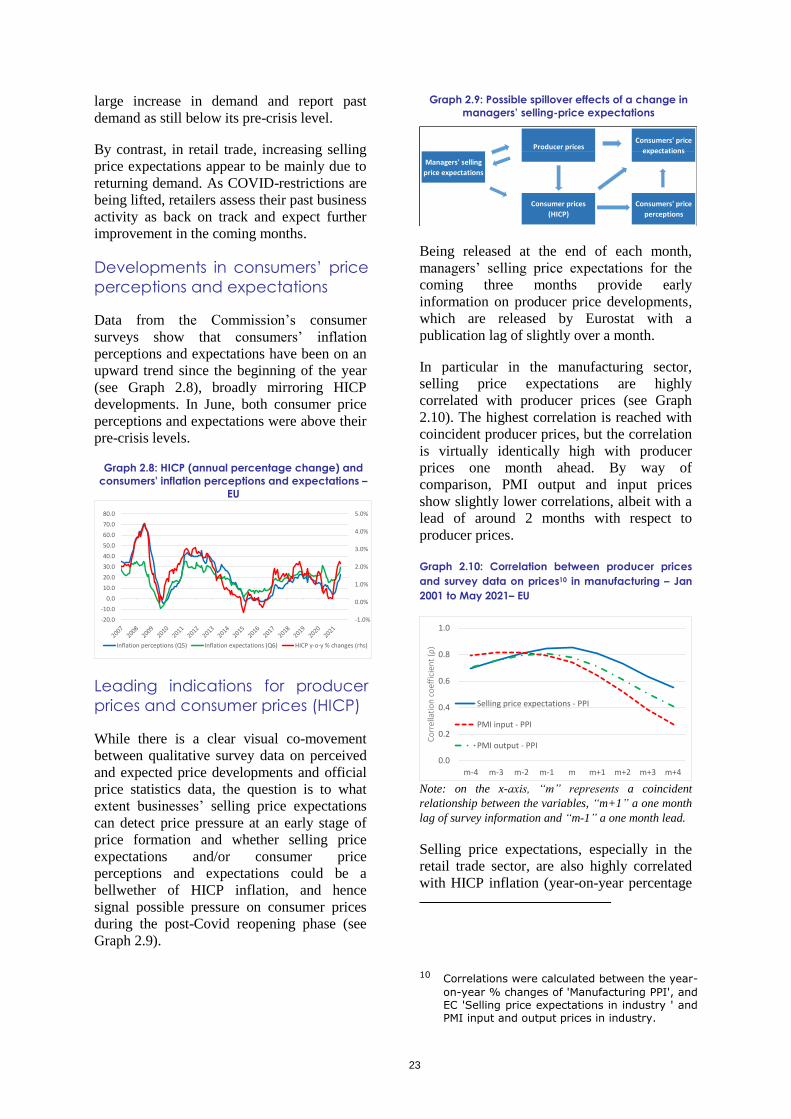
Leading indications for producer
prices and consumer prices (HICP)
While there is a clear visual co-movement
between qualitative survey data on perceived
and expected price developments and official
price statistics data, the question is to what
extent businesses’ selling price expectations
can detect price pressure at an early stage of
price formation and whether selling price
expectations and/or consumer price
perceptions and expectations could be a
bellwether of HICP inflation, and hence
signal possible pressure on consumer prices
during the post-Covid reopening phase (see
Graph 2.9).
Graph 2.9: Possible spillover effects of a change in
managers’ selling-price expectations
Producer pricesConsumers' price
expectations
Consumers' price
perceptions
Managers' selling
price expectations
Consumer prices
(HICP)
Being released at the end of each month,
managers’ selling price expectations for the
coming three months provide early
information on producer price developments,
which are released by Eurostat with a
publication lag of slightly over a month.
In particular in the manufacturing sector,
selling price expectations are highly
correlated with producer prices (see Graph
2.10). The highest correlation is reached with
coincident producer prices, but the correlation
is virtually identically high with producer
prices one month ahead. By way of
comparison, PMI output and input prices
show slightly lower correlations, albeit with a
lead of around 2 months with respect to
producer prices.
Graph 2.10: Correlation between producer prices
and survey data on prices10 in manufacturing – Jan
2001 to May 2021– EU
0.0
0.2
0.4
0.6
0.8
1.0
m+4m+3m+2m+1mm-1m-2m-3m-4
Co
rrel
lati
on
co
effi
cien
t (ρ
)
Selling price expectations - PPI
PMI input - PPI
PMI output - PPI
Note: on the x-axis, “m” represents a coincident
relationship between the variables, “m+1” a one month
lag of survey information and “m-1” a one month lead.
Selling price expectations, especially in the
retail trade sector, are also highly correlated
with HICP inflation (year-on-year percentage
10 Correlations were calculated between the year-
on-year % changes of 'Manufacturing PPI', and EC 'Selling price expectations in industry ' and PMI input and output prices in industry.
24
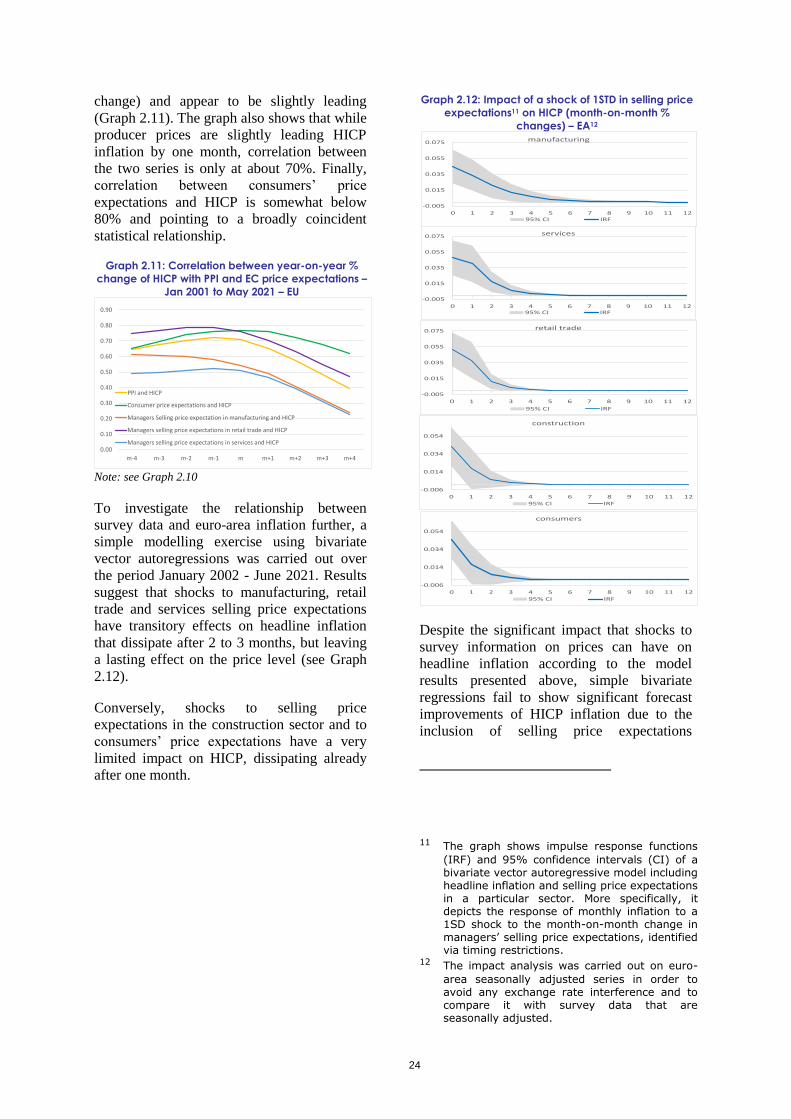
change) and appear to be slightly leading
(Graph 2.11). The graph also shows that while
producer prices are slightly leading HICP
inflation by one month, correlation between
the two series is only at about 70%. Finally,
correlation between consumers’ price
expectations and HICP is somewhat below
80% and pointing to a broadly coincident
statistical relationship.
Graph 2.11: Correlation between year-on-year %
change of HICP with PPI and EC price expectations –
Jan 2001 to May 2021 – EU
0.00
0.10
0.20
0.30
0.40
0.50
0.60
0.70
0.80
0.90
m+4m+3m+2m+1mm-1m-2m-3m-4
PPI and HICP
Consumer price expectations and HICP
Managers Selling price expectation in manufacturing and HICP
Managers selling price expectations in retail trade and HICP
Managers selling price expectations in services and HICP
Note: see Graph 2.10
To investigate the relationship between
survey data and euro-area inflation further, a
simple modelling exercise using bivariate
vector autoregressions was carried out over
the period January 2002 - June 2021. Results
suggest that shocks to manufacturing, retail
trade and services selling price expectations
have transitory effects on headline inflation
that dissipate after 2 to 3 months, but leaving
a lasting effect on the price level (see Graph
2.12).
Conversely, shocks to selling price
expectations in the construction sector and to
consumers’ price expectations have a very
limited impact on HICP, dissipating already
after one month.
Graph 2.12: Impact of a shock of 1STD in selling price
expectations11 on HICP (month-on-month %
changes) – EA12
-0.005
0.015
0.035
0.055
0.075
0 1 2 3 4 5 6 7 8 9 10 11 12
services
95% CI IRF
-0.005
0.015
0.035
0.055
0.075
0 1 2 3 4 5 6 7 8 9 10 11 12
manufacturing
95% CI IRF
-0.005
0.015
0.035
0.055
0.075
0 1 2 3 4 5 6 7 8 9 10 11 12
retail trade
95% CI IRF
-0.006
0.014
0.034
0.054
0 1 2 3 4 5 6 7 8 9 10 11 12
construction
95% CI IRF
-0.006
0.014
0.034
0.054
0 1 2 3 4 5 6 7 8 9 10 11 12
consumers
95% CI IRF
Despite the significant impact that shocks to
survey information on prices can have on
headline inflation according to the model
results presented above, simple bivariate
regressions fail to show significant forecast
improvements of HICP inflation due to the
inclusion of selling price expectations
11 The graph shows impulse response functions
(IRF) and 95% confidence intervals (CI) of a bivariate vector autoregressive model including headline inflation and selling price expectations in a particular sector. More specifically, it depicts the response of monthly inflation to a 1SD shock to the month-on-month change in managers’ selling price expectations, identified via timing restrictions.
12 The impact analysis was carried out on euro-
area seasonally adjusted series in order to avoid any exchange rate interference and to compare it with survey data that are seasonally adjusted.
25
compared to autoregressive models of HICP
inflation.13
Overall, selling and consumer price
expectations are highly correlated with HICP
inflation and shocks to managers’ selling
price expectations in industry, services and
retail trade have a statistically significant
impact on consumer prices in the short-term.
However, survey data generally appears to
carry limited additional information about
future developments in year-on-year HICP
inflation.
It is important to note that in the context of
the COVID crisis and its unprecedented
economic impact, past relationships may not
be an appropriate benchmark. The dramatic
changes reported by the surveys may however
provide important indication of further
pressure on consumer prices ahead and
therefore warrant careful monitoring.
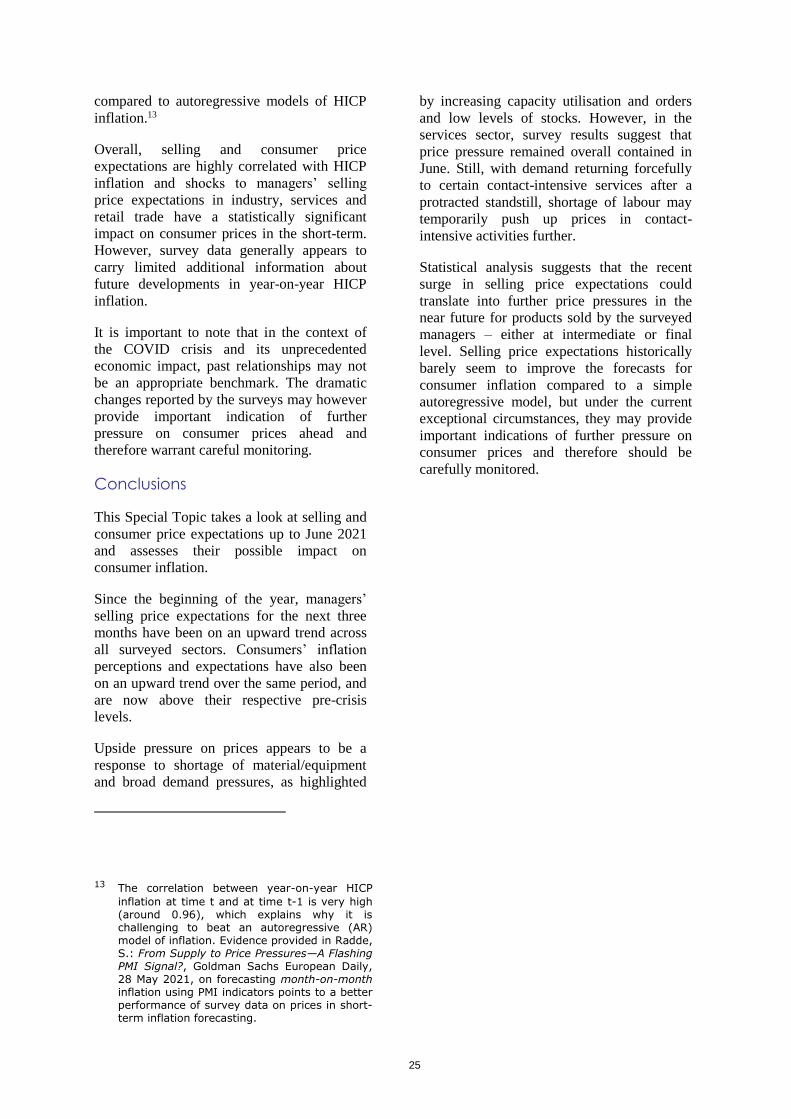
Conclusions
This Special Topic takes a look at selling and
consumer price expectations up to June 2021
and assesses their possible impact on
consumer inflation.
Since the beginning of the year, managers’
selling price expectations for the next three
months have been on an upward trend across
all surveyed sectors. Consumers’ inflation
perceptions and expectations have also been
on an upward trend over the same period, and
are now above their respective pre-crisis
levels.
Upside pressure on prices appears to be a
response to shortage of material/equipment
and broad demand pressures, as highlighted
13 The correlation between year-on-year HICP
inflation at time t and at time t-1 is very high (around 0.96), which explains why it is challenging to beat an autoregressive (AR) model of inflation. Evidence provided in Radde, S.: From Supply to Price Pressures—A Flashing PMI Signal?, Goldman Sachs European Daily, 28 May 2021, on forecasting month-on-month inflation using PMI indicators points to a better performance of survey data on prices in short-term inflation forecasting.
by increasing capacity utilisation and orders
and low levels of stocks. However, in the
services sector, survey results suggest that
price pressure remained overall contained in
June. Still, with demand returning forcefully
to certain contact-intensive services after a
protracted standstill, shortage of labour may
temporarily push up prices in contact-
intensive activities further.
Statistical analysis suggests that the recent
surge in selling price expectations could
translate into further price pressures in the
near future for products sold by the surveyed
managers – either at intermediate or final
level. Selling price expectations historically
barely seem to improve the forecasts for
consumer inflation compared to a simple
autoregressive model, but under the current
exceptional circumstances, they may provide
important indications of further pressure on
consumer prices and therefore should be
carefully monitored.
26
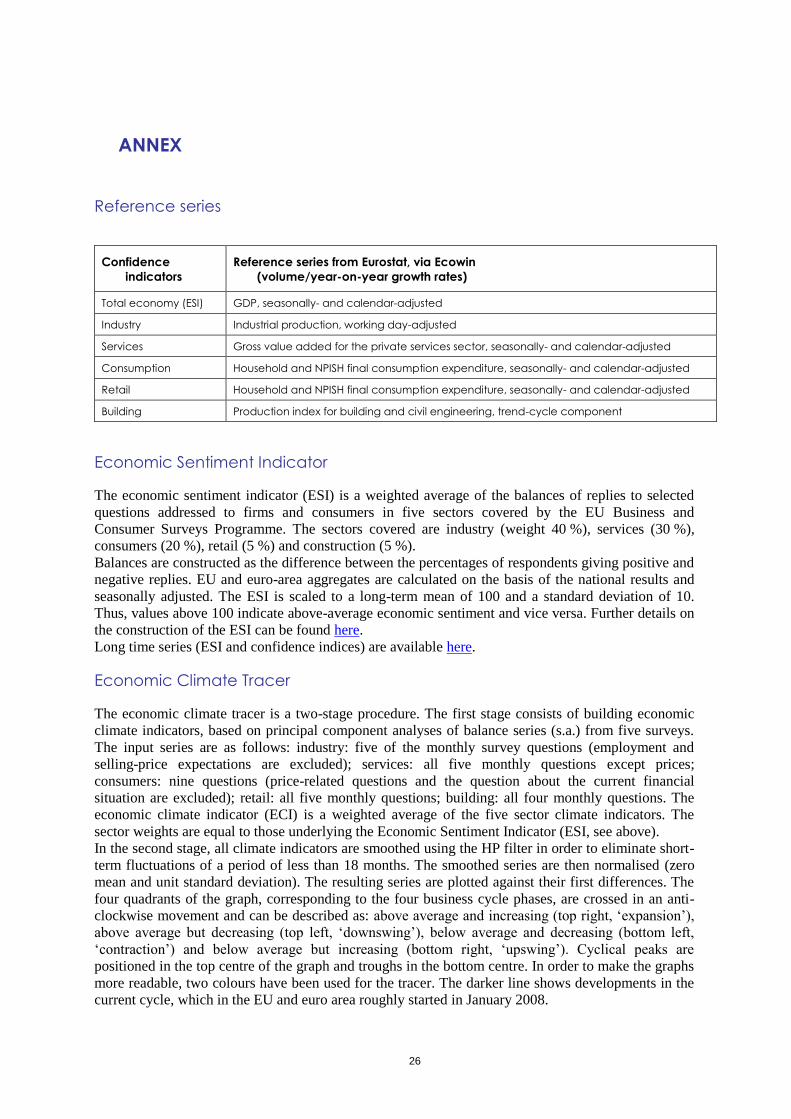
ANNEX
Reference series
Confidence
indicators
Reference series from Eurostat, via Ecowin
(volume/year-on-year growth rates)
Total economy (ESI) GDP, seasonally- and calendar-adjusted
Industry Industrial production, working day-adjusted
Services Gross value added for the private services sector, seasonally- and calendar-adjusted
Consumption Household and NPISH final consumption expenditure, seasonally- and calendar-adjusted
Retail Household and NPISH final consumption expenditure, seasonally- and calendar-adjusted
Building Production index for building and civil engineering, trend-cycle component
Economic Sentiment Indicator
The economic sentiment indicator (ESI) is a weighted average of the balances of replies to selected
questions addressed to firms and consumers in five sectors covered by the EU Business and
Consumer Surveys Programme. The sectors covered are industry (weight 40 %), services (30 %),
consumers (20 %), retail (5 %) and construction (5 %).
Balances are constructed as the difference between the percentages of respondents giving positive and
negative replies. EU and euro-area aggregates are calculated on the basis of the national results and
seasonally adjusted. The ESI is scaled to a long-term mean of 100 and a standard deviation of 10.
Thus, values above 100 indicate above-average economic sentiment and vice versa. Further details on
the construction of the ESI can be found here.
Long time series (ESI and confidence indices) are available here.
Economic Climate Tracer
The economic climate tracer is a two-stage procedure. The first stage consists of building economic
climate indicators, based on principal component analyses of balance series (s.a.) from five surveys.
The input series are as follows: industry: five of the monthly survey questions (employment and
selling-price expectations are excluded); services: all five monthly questions except prices;
consumers: nine questions (price-related questions and the question about the current financial
situation are excluded); retail: all five monthly questions; building: all four monthly questions. The
economic climate indicator (ECI) is a weighted average of the five sector climate indicators. The
sector weights are equal to those underlying the Economic Sentiment Indicator (ESI, see above).
In the second stage, all climate indicators are smoothed using the HP filter in order to eliminate short-
term fluctuations of a period of less than 18 months. The smoothed series are then normalised (zero
mean and unit standard deviation). The resulting series are plotted against their first differences. The
four quadrants of the graph, corresponding to the four business cycle phases, are crossed in an anti-
clockwise movement and can be described as: above average and increasing (top right, ‘expansion’),
above average but decreasing (top left, ‘downswing’), below average and decreasing (bottom left,
‘contraction’) and below average but increasing (bottom right, ‘upswing’). Cyclical peaks are
positioned in the top centre of the graph and troughs in the bottom centre. In order to make the graphs
more readable, two colours have been used for the tracer. The darker line shows developments in the
current cycle, which in the EU and euro area roughly started in January 2008.
EUROPEAN ECONOMY TECHNICAL PAPERS
European Economy Technical Papers can be accessed and downloaded free of charge from the following address: https://ec.europa.eu/info/publications-0/economy-finance-and-euro-publications_en?field_eurovoc_taxonomy_target_id_selective=All&field_core_nal_countries_tid_selective=All&field_core_flex_publication_date[value][year]=All&field_core_tags_tid_i18n=22620. Titles published before July 2015 can be accessed and downloaded free of charge from: http://ec.europa.eu/economy_finance/db_indicators/cpaceq/index_en.htm
(EU Candidate Potential Candidate Countries' Economic Quarterly) http://ec.europa.eu/economy_finance/publications/cycle_indicators/index_en.htm
(European Business Cycle Indicators)

GETTING IN TOUCH WITH THE EU In person All over the European Union there are hundreds of Europe Direct Information Centres. You can find the address of the centre nearest you at: http://europa.eu/contact. On the phone or by e-mail Europe Direct is a service that answers your questions about the European Union. You can contact this service:
• by freephone: 00 800 6 7 8 9 10 11 (certain operators may charge for these calls),
• at the following standard number: +32 22999696 or • by electronic mail via: http://europa.eu/contact.
FINDING INFORMATION ABOUT THE EU Online Information about the European Union in all the official languages of the EU is available on the Europa website at: http://europa.eu. EU Publications You can download or order free and priced EU publications from EU Bookshop at: http://publications.europa.eu/bookshop. Multiple copies of free publications may be obtained by contacting Europe Direct or your local information centre (see http://europa.eu/contact). EU law and related documents For access to legal information from the EU, including all EU law since 1951 in all the official language versions, go to EUR-Lex at: http://eur-lex.europa.eu. Open data from the EU The EU Open Data Portal (http://data.europa.eu/euodp/en/data) provides access to datasets from the EU. Data can be downloaded and reused for free, both for commercial and non-commercial purposes.