Embed Size (px)
Citation preview
1
Folie 1
Europe-Middle-East-North-Africa Energy Security based on Trans-Mediterranean Cooperation
Franz Trieb
NATO Headquarters, Brussels, September 24, 2009
Folie 2
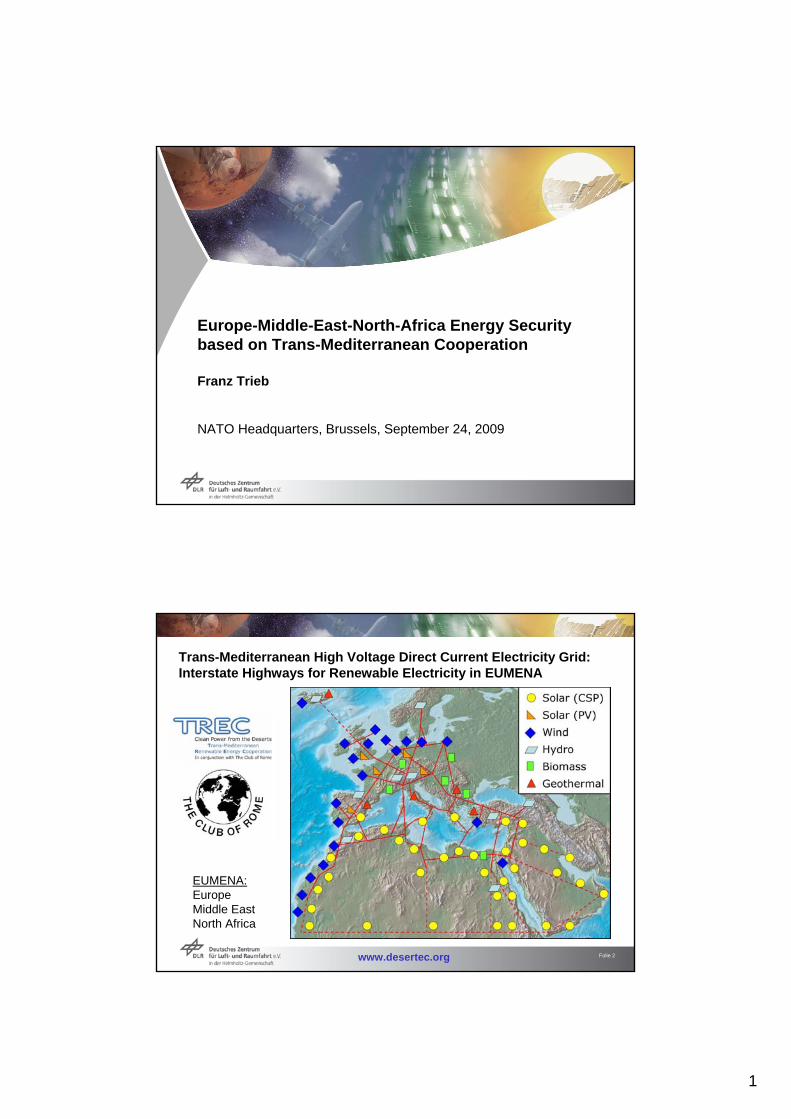
Trans-Mediterranean High Voltage Direct Current Electricity Grid:Interstate Highways for Renewable Electricity in EUMENA
www.desertec.org
EUMENA:EuropeMiddle EastNorth Africa
2
Folie 3
Studies:
Assessment of the renewable energy potential for
the sustainable supply of electricity and water in
50 countries of Europe, the Middle East and
North Africa taking into consideration the option of
Concentrating Solar Power (CSP).
TRANS-CSPTRANS-CSPMED-CSPMED-CSP AQUA-CSPAQUA-CSP
Folie 4
Criteria for Sustainable Electricity Supply:
Inexpensivelow electricity cost no long term subsidies
Secure diversified and redundant supply power on demandbased on inexhaustible resourcesavailable or at least visible technologycapacities expandable in time
Compatible low pollution climate protectionlow risks for health and environmentfair access
3
Folie 5
Portfolio of Energy Sources for Electricity:
Coal, Lignite
Oil, Gas
Nuclear Fission, Fusion
Concentrating Solar Power (CSP)
Geothermal Power (Hot Dry Rock)
Biomass
Hydropower
Wind Power
Photovoltaic
Wave / Tidal
ideally storedprimary energy
fluctuatingprimaryenergy
storable primaryenergy
Folie 6
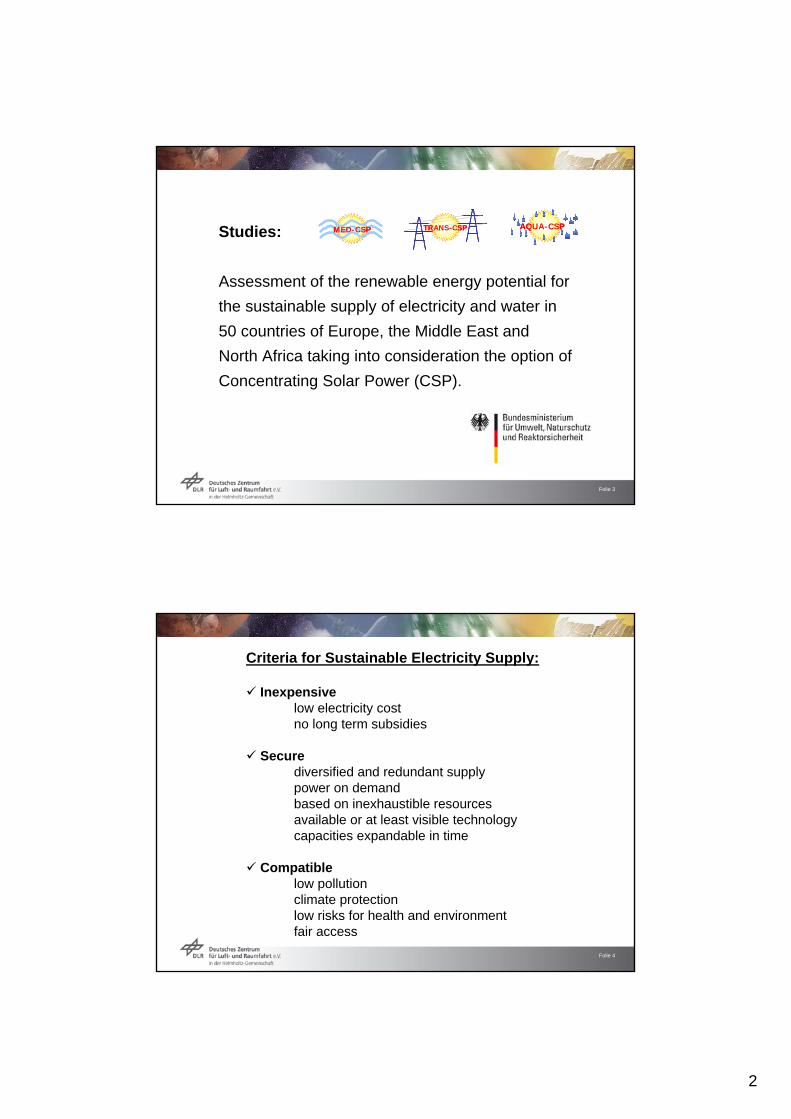
• spinning reserve
• firm capacity,power on demand
• combined generation of process heat for cooling,industry, desalination, etc.
Fuel
Thermal Power Cycle (e.g. Steam
Turbine)
Process Heat
Electricity
Principle of a Conventional Thermal Power Plant
Concentrating Solar Collector Field (Mirrors)
Solar Heat
Thermal Energy Storage
• concentrated, easily storable solar thermalenergy as fuel saver
Principle of a Concentrating Solar Thermal Power Plant
4
Folie 7
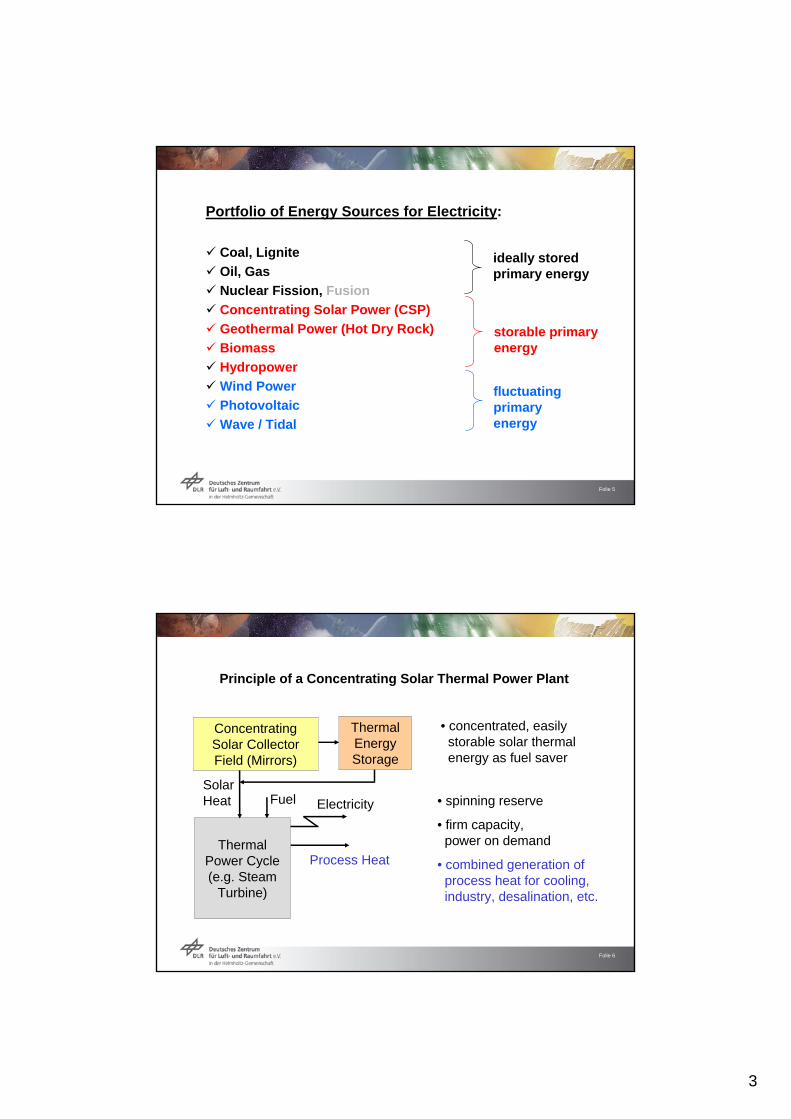
Renewable Energy Technologies
Hydropower
Tides
Waves Wind PowerPhotovoltaic
Geothermal
ConcentratingSolar Power
Biomass
http://www.erneuerbare-energien.de/inhalt/36983/35338/
Folie 8
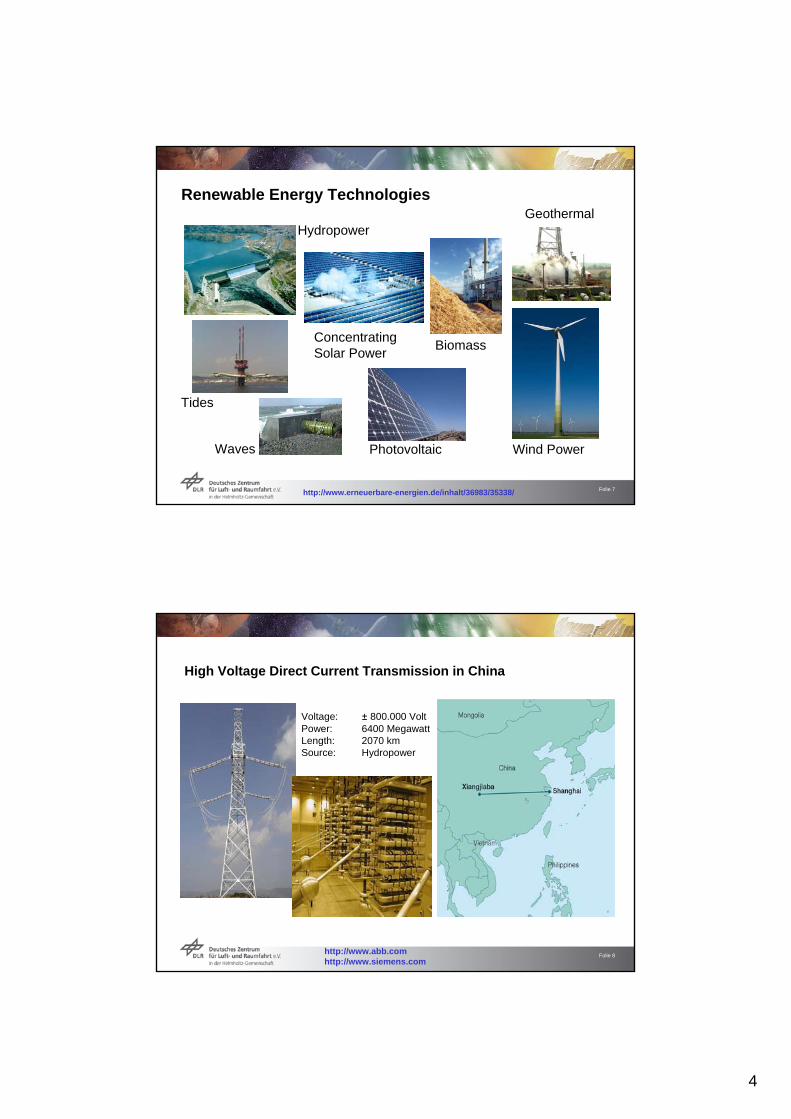
High Voltage Direct Current Transmission in China
Voltage: ± 800.000 VoltPower: 6400 MegawattLength: 2070 kmSource: Hydropower
http://www.abb.comhttp://www.siemens.com
5
Folie 9
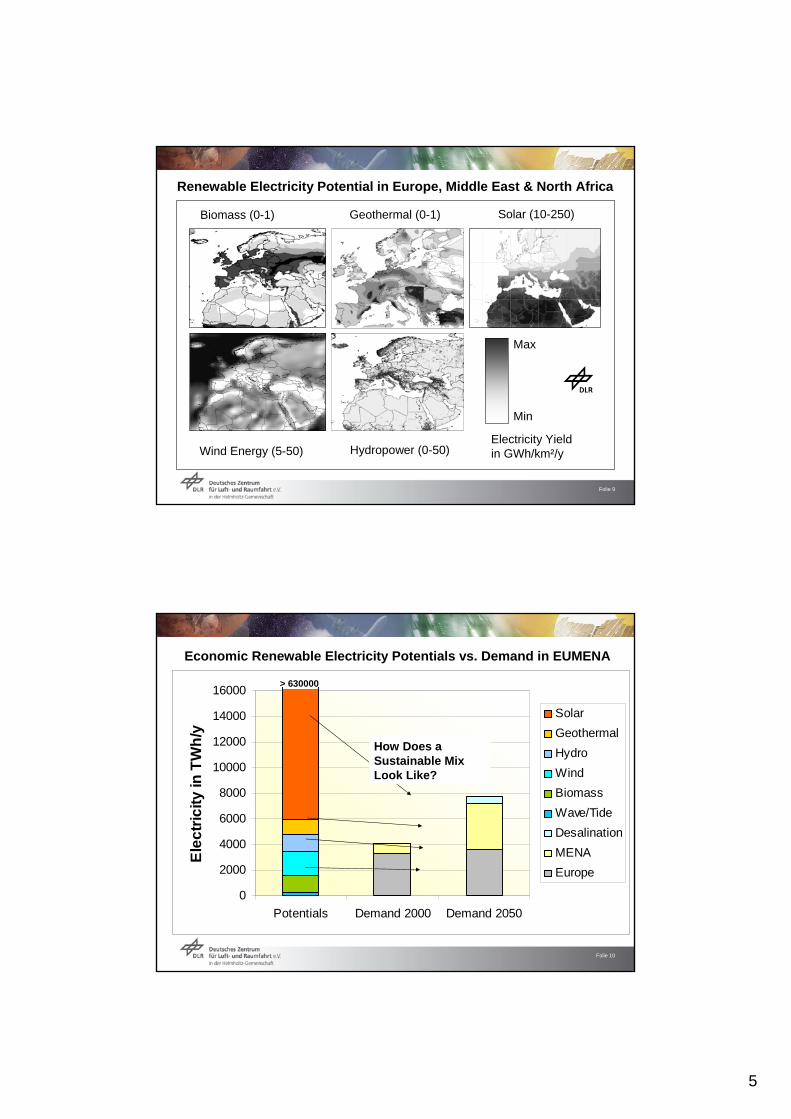
Biomass (0-1)
Wind Energy (5-50)
Geothermal (0-1)
Hydropower (0-50)
Solar (10-250)
Max
Min
Electricity Yield in GWh/km²/y
Renewable Electricity Potential in Europe, Middle East & North Africa
Folie 10
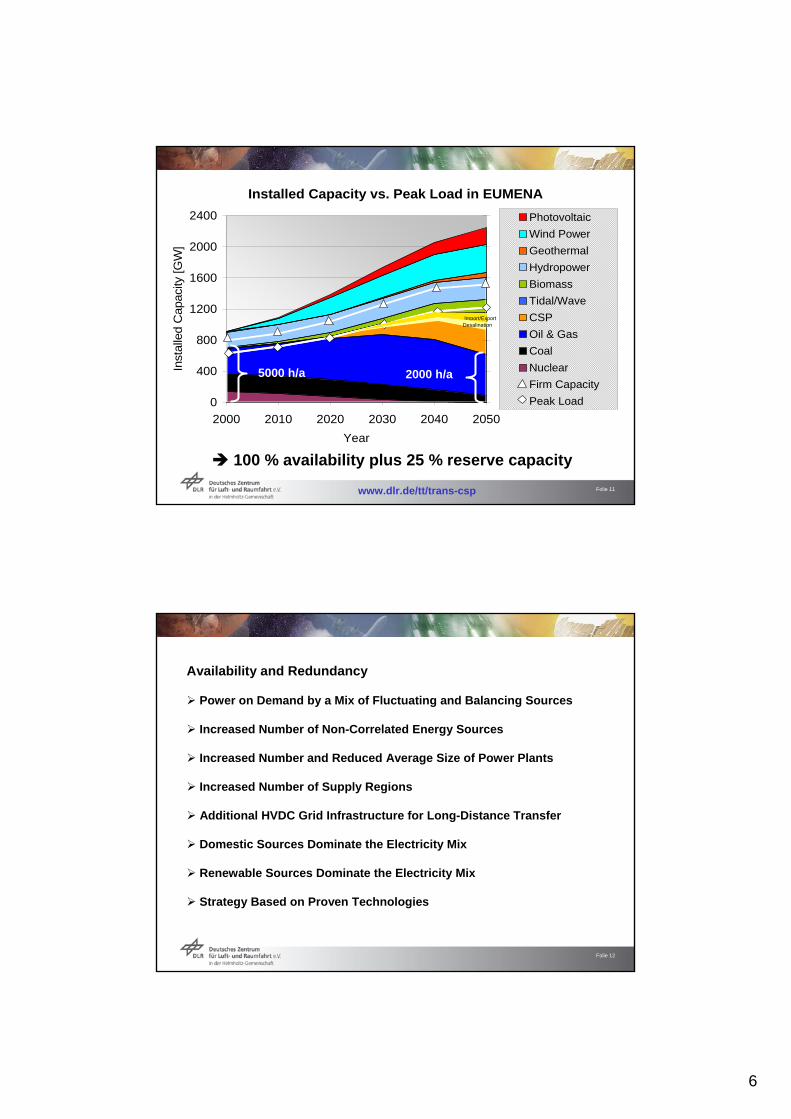
0
2000
4000
6000
8000
10000
12000
14000
16000
Potentials Demand 2000 Demand 2050
Ele
ctr
icit
y in
TW
h/y
Solar
Geothermal
Hydro
Wind
Biomass
Wave/Tide
Desalination
MENA
Europe
Economic Renewable Electricity Potentials vs. Demand in EUMENA
> 630000
How Does a Sustainable Mix Look Like?
6
Folie 11
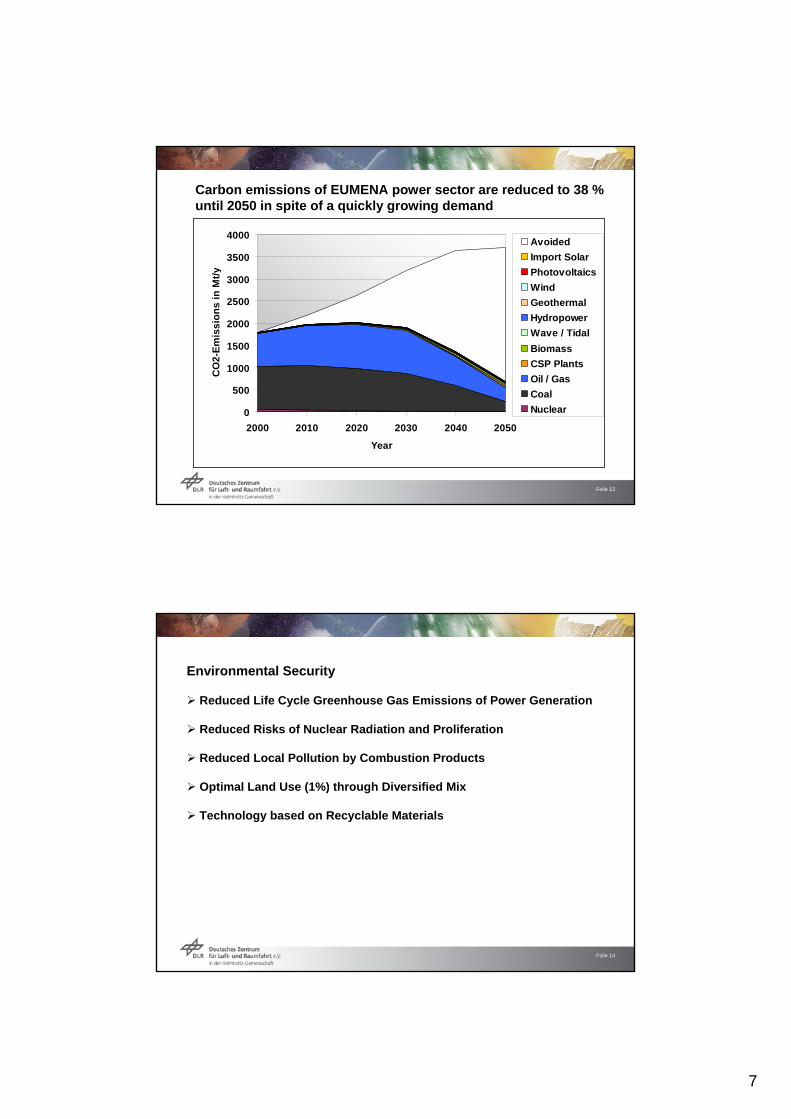
Installed Capacity vs. Peak Load in EUMENA
0
400
800
1200
1600
2000
2400
2000 2010 2020 2030 2040 2050
Year
Inst
alle
d C
apaci
ty [G
W]
0
400
800
1200
1600
2000
2400 Photovoltaic
Wind Power
Geothermal
Hydropower
Biomass
Tidal/Wave
CSP
Oil & Gas
Coal
Nuclear
Firm Capacity
Peak Load
100 % availability plus 25 % reserve capacity
5000 h/a 2000 h/a
Import/ExportDesalination
www.dlr.de/tt/trans-csp
Folie 12
Availability and Redundancy
Power on Demand by a Mix of Fluctuating and Balancing Sources
Increased Number of Non-Correlated Energy Sources
Increased Number and Reduced Average Size of Power Plants
Increased Number of Supply Regions
Additional HVDC Grid Infrastructure for Long-Distance Transfer
Domestic Sources Dominate the Electricity Mix
Renewable Sources Dominate the Electricity Mix
Strategy Based on Proven Technologies
7
Folie 13
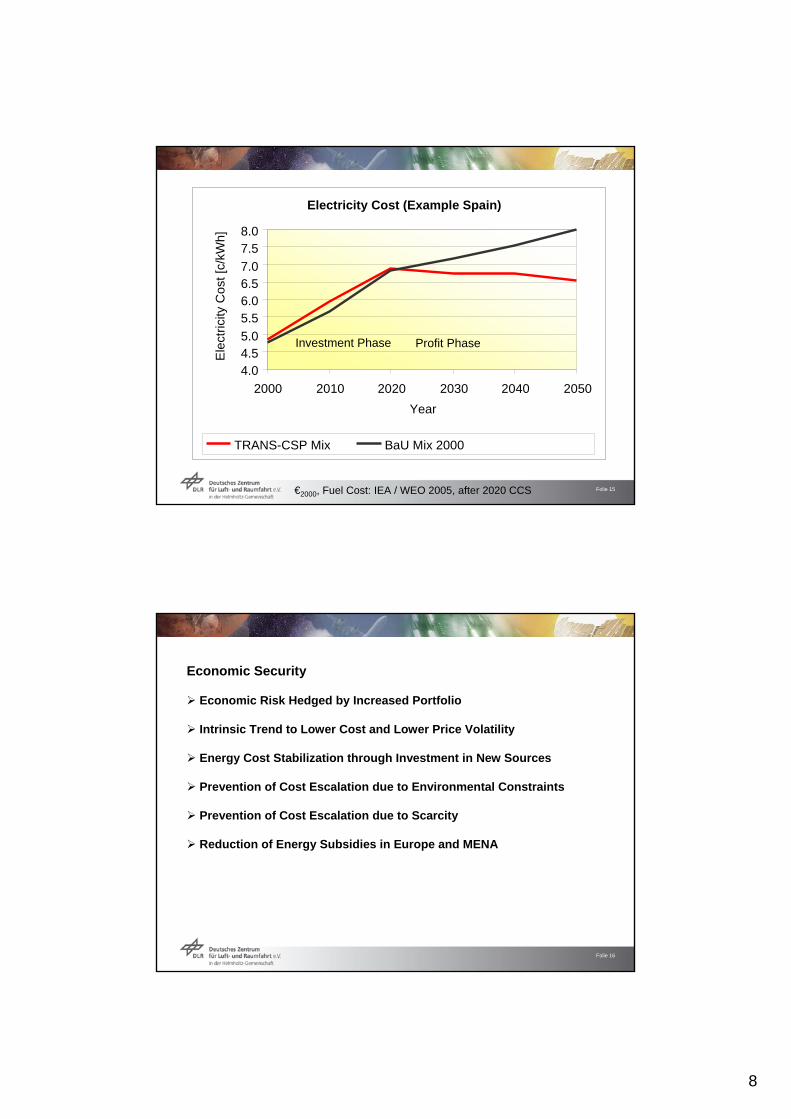
Carbon emissions of EUMENA power sector are reduced to 38 % until 2050 in spite of a quickly growing demand
0
500
1000
1500
2000
2500
3000
3500
4000
2000 2010 2020 2030 2040 2050
Year
CO
2-E
mis
sio
ns
in
Mt/
y
Avoided
Import Solar
Photovoltaics
Wind
Geothermal
Hydropower
Wave / Tidal
Biomass
CSP Plants
Oil / Gas
Coal
Nuclear
Folie 14
Environmental Security
Reduced Life Cycle Greenhouse Gas Emissions of Power Generation
Reduced Risks of Nuclear Radiation and Proliferation
Reduced Local Pollution by Combustion Products
Optimal Land Use (1%) through Diversified Mix
Technology based on Recyclable Materials
8
Folie 15
Electricity Cost (Example Spain)
4.04.55.0
5.56.06.57.0
7.58.0
2000 2010 2020 2030 2040 2050
Year
Ele
ctri
city
Cos
t[c/
kWh]
TRANS-CSP Mix BaU Mix 2000
€2000, Fuel Cost: IEA / WEO 2005, after 2020 CCS
Investment Phase Profit Phase
Folie 16
Economic Security
Economic Risk Hedged by Increased Portfolio
Intrinsic Trend to Lower Cost and Lower Price Volatility
Energy Cost Stabilization through Investment in New Sources
Prevention of Cost Escalation due to Environmental Constraints
Prevention of Cost Escalation due to Scarcity
Reduction of Energy Subsidies in Europe and MENA
9
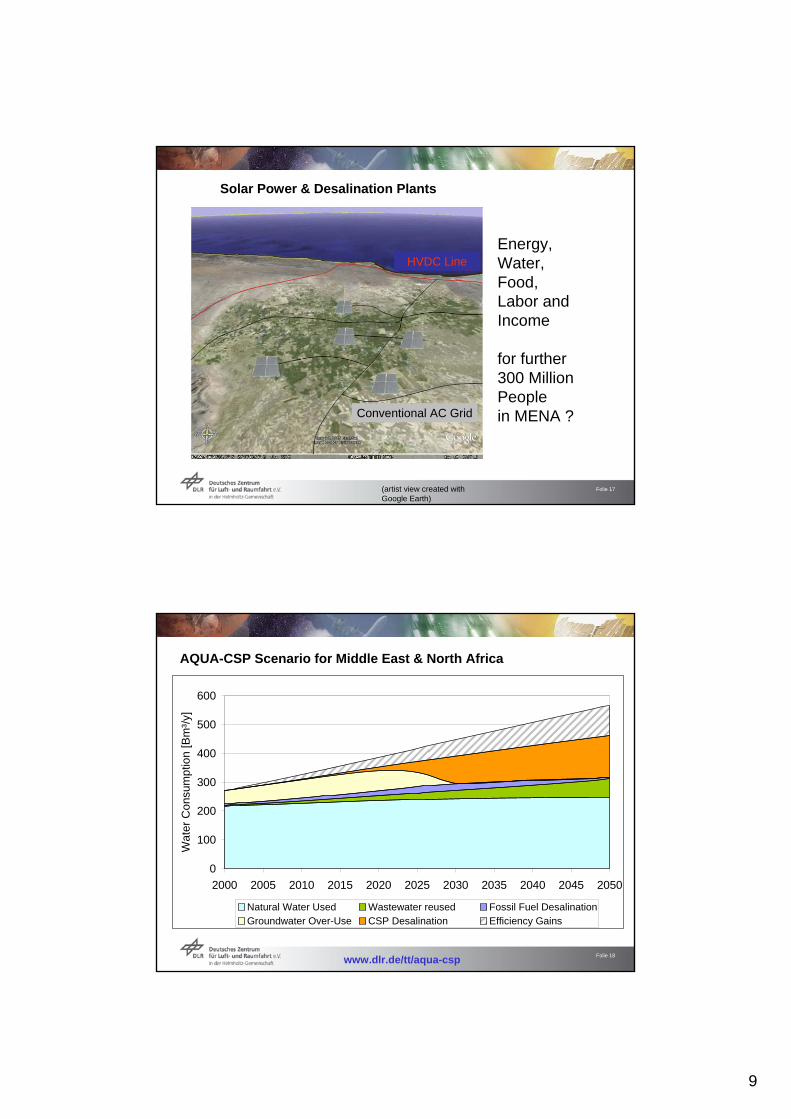
Folie 17(artist view created withGoogle Earth)
Energy, Water,Food, Labor and Income
for further300 Million People in MENA ?
Solar Power & Desalination Plants
HVDC Line
Conventional AC Grid
Folie 18
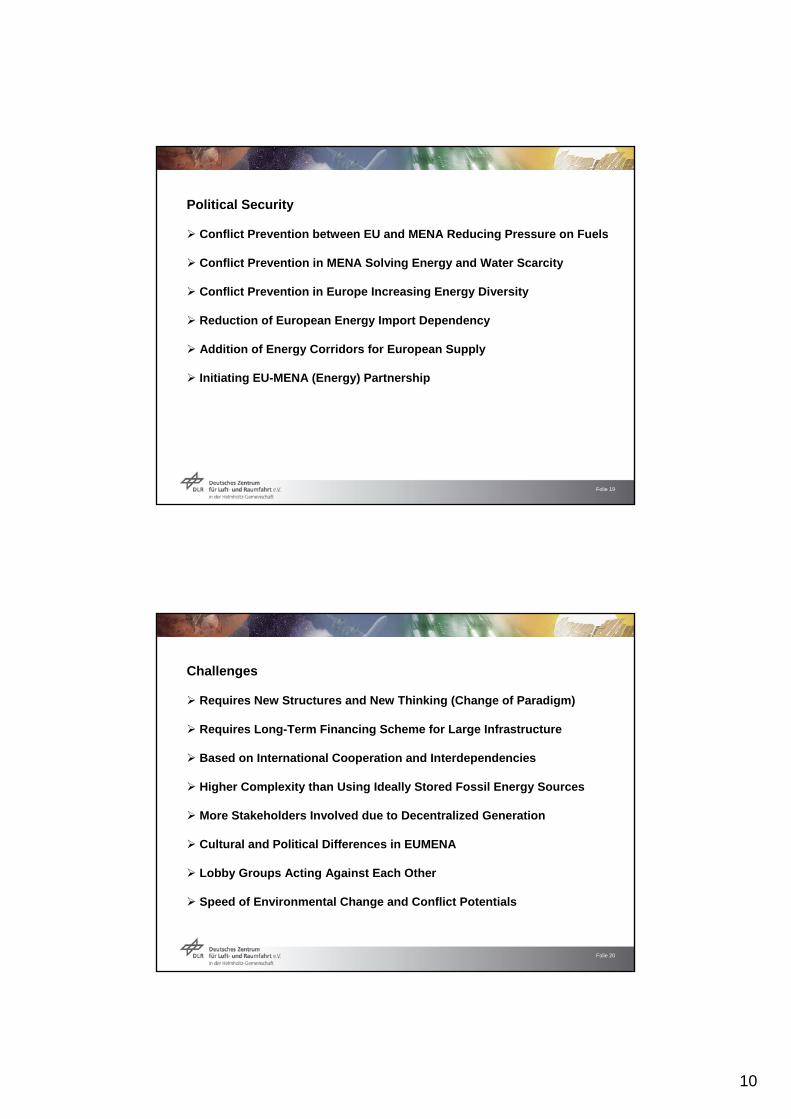
AQUA-CSP Scenario for Middle East & North Africa
0
100
200
300
400
500
600
2000 2005 2010 2015 2020 2025 2030 2035 2040 2045 2050
Wat
er C
onsu
mpt
ion
[Bm
³/y]
Natural Water Used Wastewater reused Fossil Fuel DesalinationGroundwater Over-Use CSP Desalination Efficiency Gains
www.dlr.de/tt/aqua-csp
10
Folie 19
Political Security
Conflict Prevention between EU and MENA Reducing Pressure on Fuels
Conflict Prevention in MENA Solving Energy and Water Scarcity
Conflict Prevention in Europe Increasing Energy Diversity
Reduction of European Energy Import Dependency
Addition of Energy Corridors for European Supply
Initiating EU-MENA (Energy) Partnership
Folie 20
Challenges
Requires New Structures and New Thinking (Change of Paradigm)
Requires Long-Term Financing Scheme for Large Infrastructure
Based on International Cooperation and Interdependencies
Higher Complexity than Using Ideally Stored Fossil Energy Sources
More Stakeholders Involved due to Decentralized Generation
Cultural and Political Differences in EUMENA
Lobby Groups Acting Against Each Other
Speed of Environmental Change and Conflict Potentials
11
Folie 21
Thank You!
www.dlr.de/desertec
Folie 22
Some Background Information
12
Folie 23
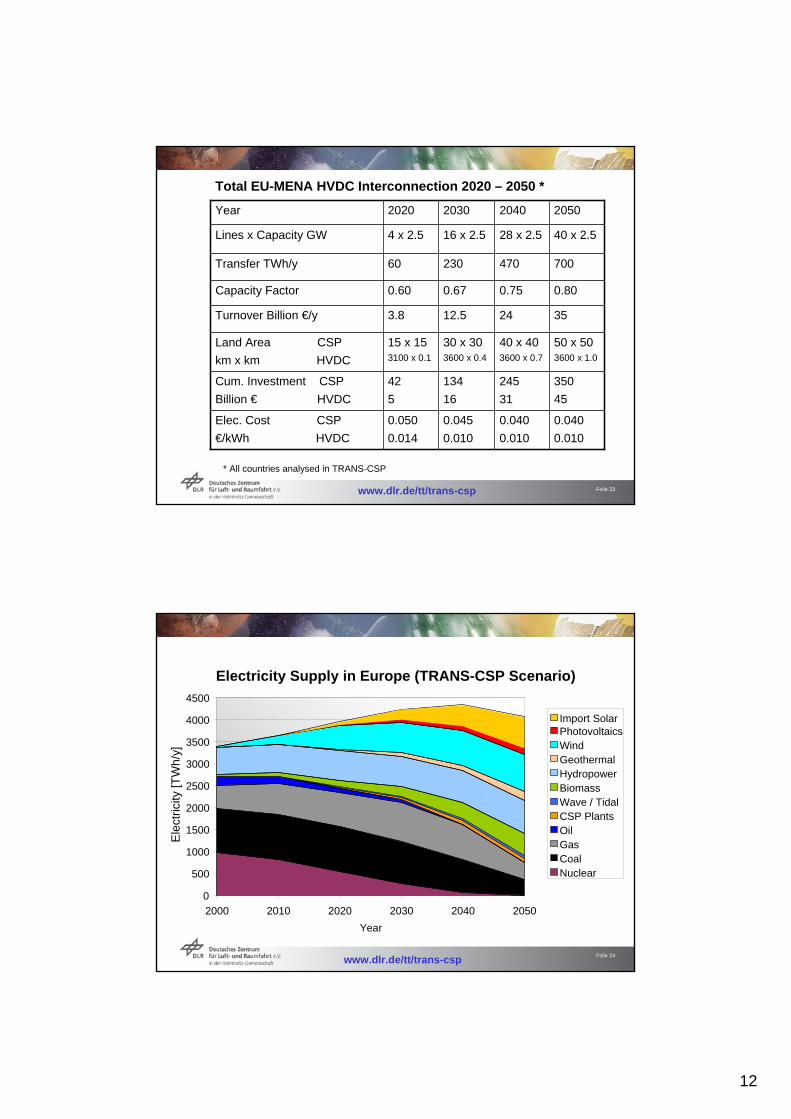
0.800.750.670.60Capacity Factor
350
45
245
31
134
16
42
5
Cum. Investment CSP
Billion € HVDC
0.040
0.010
0.040
0.010
0.045
0.010
0.050
0.014
Elec. Cost CSP
€/kWh HVDC
50 x 503600 x 1.0
40 x 403600 x 0.7
30 x 303600 x 0.4
15 x 153100 x 0.1
Land Area CSP
km x km HVDC
352412.53.8Turnover Billion €/y
70047023060Transfer TWh/y
40 x 2.528 x 2.516 x 2.54 x 2.5Lines x Capacity GW
2050204020302020Year
Total EU-MENA HVDC Interconnection 2020 – 2050 *
* All countries analysed in TRANS-CSP
www.dlr.de/tt/trans-csp
Folie 24
Electricity Supply in Europe (TRANS-CSP Scenario)
0
500
1000
1500
2000
2500
3000
3500
4000
4500
2000 2010 2020 2030 2040 2050
Year
Ele
ctric
ity[T
Wh/
y]
Import SolarPhotovoltaicsWindGeothermalHydropowerBiomassWave / TidalCSP PlantsOil GasCoalNuclear
www.dlr.de/tt/trans-csp
13
Folie 25
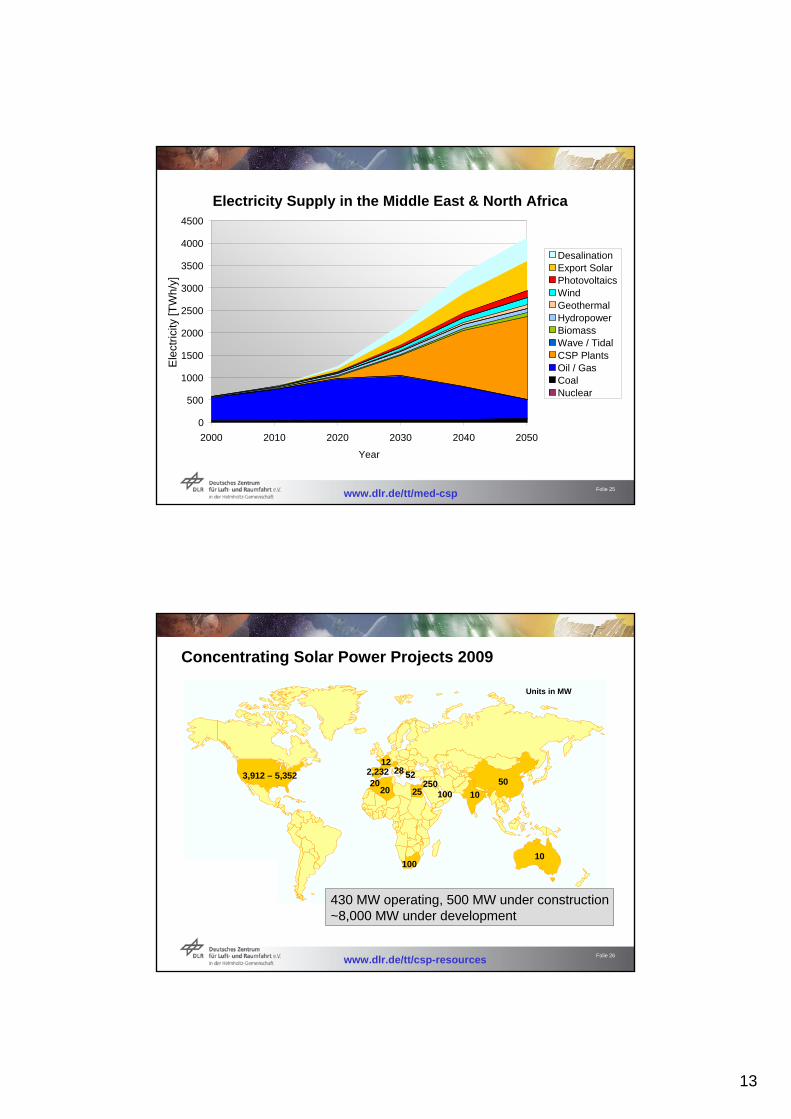
Electricity Supply in the Middle East & North Africa
0
500
1000
1500
2000
2500
3000
3500
4000
4500
2000 2010 2020 2030 2040 2050
Year
Ele
ctric
ity[T
Wh/
y]
DesalinationExport SolarPhotovoltaicsWindGeothermalHydropowerBiomassWave / TidalCSP PlantsOil / GasCoalNuclear
www.dlr.de/tt/med-csp
Folie 26
3,912 – 5,352 2,232
10010
1228
10250
100
total6,821-8,261 MW
5052
2020 25
3,912 – 5,352 2,232
10010
1228
10250
100
total6,821-8,261 MW
5052
2020 25
430 MW operating, 500 MW under construction~8,000 MW under development
Units in MW
Concentrating Solar Power Projects 2009
www.dlr.de/tt/csp-resources
14
Folie 27
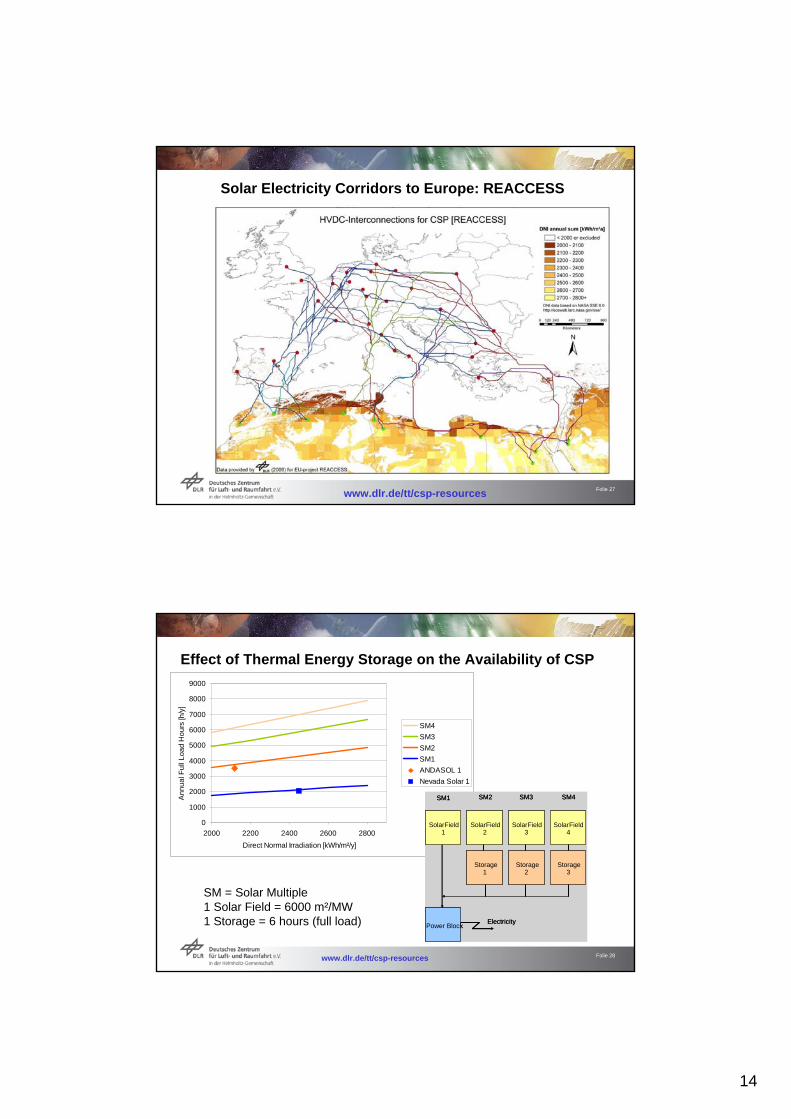
Solar Electricity Corridors to Europe: REACCESS
www.dlr.de/tt/csp-resources
Folie 28
0
1000
2000
3000
4000
5000
6000
7000
8000
9000
2000 2200 2400 2600 2800
Direct Normal Irradiation [kWh/m²/y]
An
nu
al F
ull
Lo
ad
Ho
urs
[h/y
]
SM4
SM3
SM2
SM1
ANDASOL 1
Nevada Solar 1
Effect of Thermal Energy Storage on the Availability of CSP
www.dlr.de/tt/csp-resources
Solar Field1
Storage1
Power Block
Solar Field2
Solar Field3
Solar Field4
Storage2
Storage3
SM1 SM2 SM3 SM4
Electricity
Solar Field1
Storage1
Power Block
Solar Field2
Solar Field3
Solar Field4
Storage2
Storage3
SM1 SM2 SM3 SM4
Electricity
SM = Solar Multiple1 Solar Field = 6000 m²/MW1 Storage = 6 hours (full load)
15
Folie 29
0.010
0.100
1.000
100 1000 10000 100000 1000000
Installed Capacity [MW]
Ele
ctri
city
Co
st[€
/kW
h]
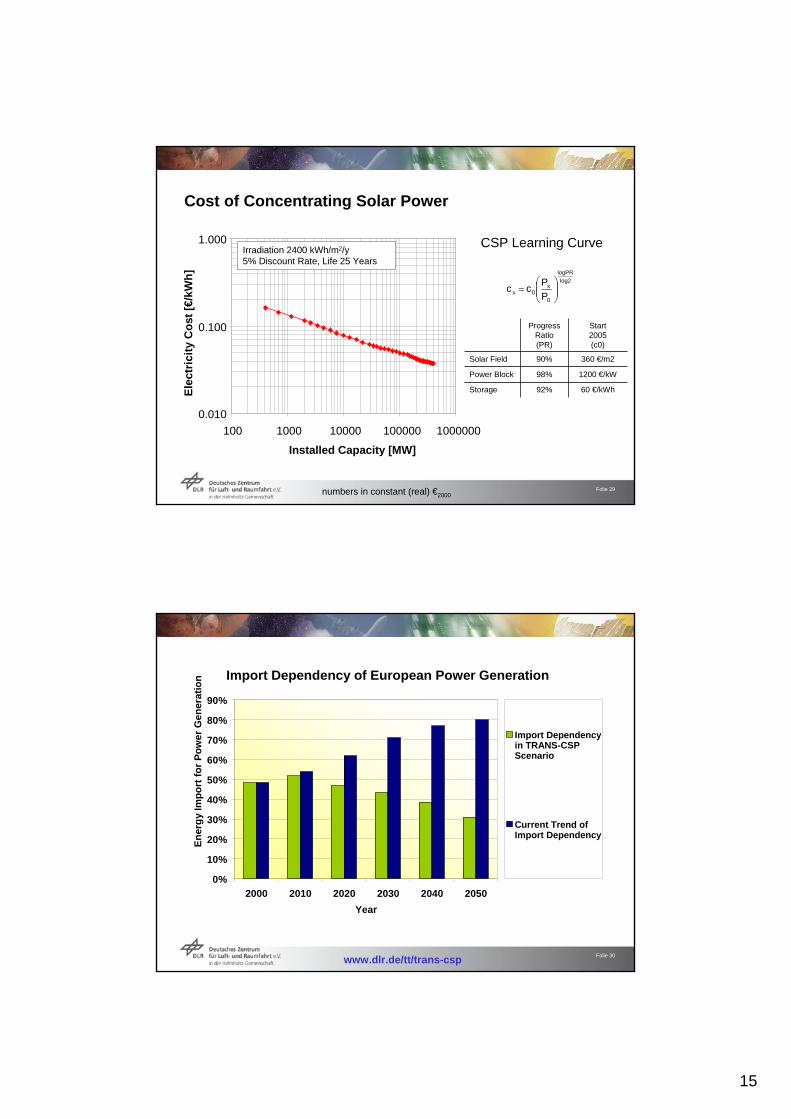
Cost of Concentrating Solar Power
Irradiation 2400 kWh/m2/y5% Discount Rate, Life 25 Years
log2
logPR
0
x0x P
Pcc
60 €/kWh92%Storage
1200 €/kW98%Power Block
360 €/m290%Solar Field
Start2005(c0)
ProgressRatio (PR)
CSP Learning Curve
numbers in constant (real) €2000
Folie 30
Import Dependency of European Power Generation
0%
10%
20%
30%
40%
50%
60%
70%
80%
90%
2000 2010 2020 2030 2040 2050
Year
En
erg
y Im
po
rt f
or
Po
wer
Ge
ne
rati
on
Import Dependencyin TRANS-CSPScenario
Current Trend ofImport Dependency
www.dlr.de/tt/trans-csp
16
Folie 31
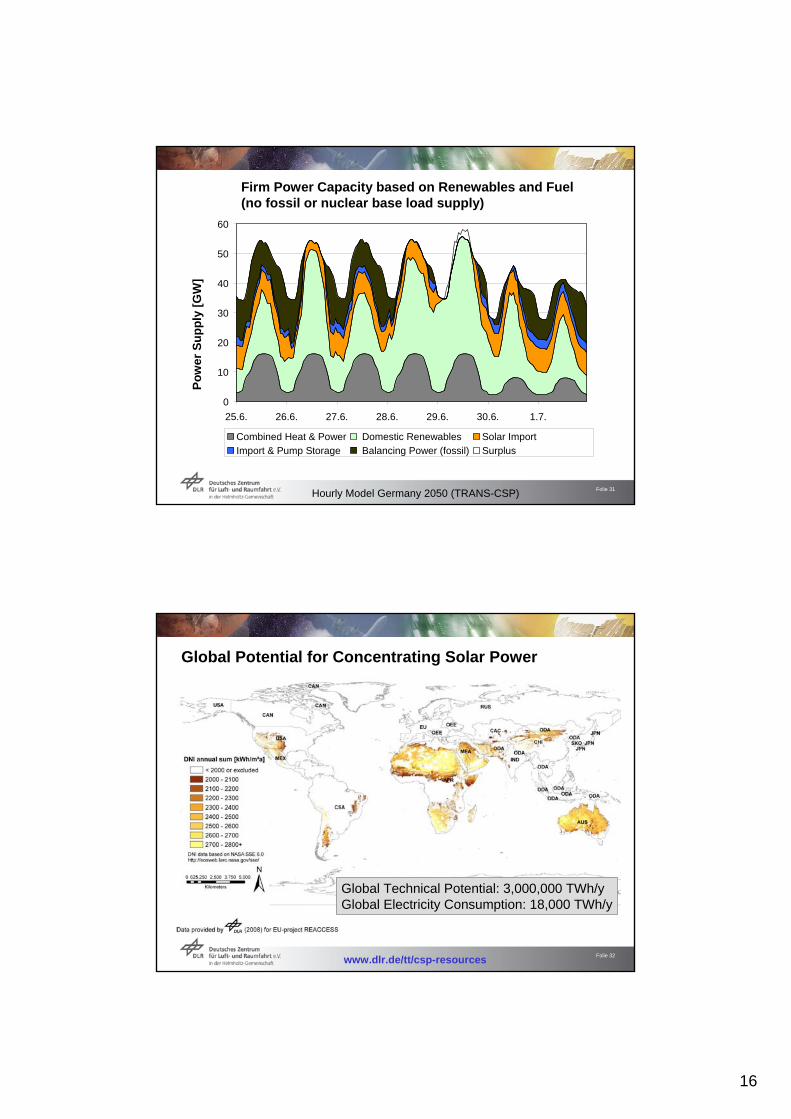
Firm Power Capacity based on Renewables and Fuel(no fossil or nuclear base load supply)
Hourly Model Germany 2050 (TRANS-CSP)
0
10
20
30
40
50
60
25.6. 26.6. 27.6. 28.6. 29.6. 30.6. 1.7.
Po
wer
Su
pp
ly[G
W]
Combined Heat & Power Domestic Renewables Solar Import
Import & Pump Storage Balancing Power (fossil) Surplus
Folie 32
Global Potential for Concentrating Solar Power
Global Technical Potential: 3,000,000 TWh/yGlobal Electricity Consumption: 18,000 TWh/y
www.dlr.de/tt/csp-resources