Embed Size (px)
Citation preview
Flight Movements and Service Units 2014 - 2020
EUROCONTROL Seven-Year Forecast September 2014
EUROCONTROL
Network Managernominated by the European Commission

EUROCONTROL/NMD/STATFOR
7-year IFR Flight Movements and Service Units Forecast Update: 2014-2020
EXECUTIVE SUMMARY
This report presents the September 2014 update of the EUROCONTROL seven-year flight and service units forecast. This update uses the most-recent available traffic statistics and economic forecasts, and more up-to-date information in terms of traffic trends and recent air-industry related events.
The forecast IFR Movements Over the summer months, the growing number of passengers at airports finally spilled over into increasing number of flights in the busiest States and notably in Southern Europe. In parallel, recent events in Eastern Europe (airspace unavailability over Eastern Ukraine) have significantly changed the routing patterns in that region. This forecast assumes1 no return to “normal” routing will happen by the end of the 7-year horizon (2020). That being said, there is a high probability for traffic to be restored through Eastern Ukraine before 2020, which would result in significant variations in the forecast results, especially over the southern airspace (see Section 4.4). Moreover, the forecast does not include the proposed significant changes in unit rates (see Section 4.5). The flight forecasts for 2014 of the busiest European States (Spain, Italy, Germany, France and UK) have been revised upwards compared to the February publication reflecting the recent sustained growth rates over the Summer but also reflecting expectations of weaker Winter 14/15 growth (compared to last Winter). The 2015 flight forecast growth rates in these States will level off between 2% and 3% on average. In Eastern and Southern Europe, local events (airspace/route unavailability over Eastern Ukraine, Libya and Near-East) have significantly changed the forecasts for many States: Ukraine, Bulgaria, Romania, Hungary, Malta to quote a few. At European level, the flight forecast is for a growth of 1.8% (±0.3 pp) in 2014 and 2.4% (±1.6 pp) for 2015. By 2020, the forecast anticipates 11.2 million IFR movements (± 0.9 million) in Europe, 19% more than in 2013. From 2016, growth returns to more stable rates of 3% but airport capacity will increasingly constrain growth in Europe in 2017 and 2018. The last two years 2019-2020 of the forecast will see flight growth rates averaging at around 3% again as additional capacity is brought in Turkey. For the whole 2014-2020 period, flight growth averages 2.5% (±1.4 pp) per year in the base scenario. Over the whole of Europe and the whole 7 years, there is a little change from the last two forecasts: the 2008 peak of traffic of 10.1 million flights is forecasted to be reached again in 2016, an 8-year hiatus in growth.
1 Assumptions in this document are purely for forecasting purposes and do not represent any policy of the Agency.

7-year IFR Flight Movements and Service Units Forecast Update: 2014-2020
FINAL
EUROCONTROL/NMD/STATFOR Page 2
Figure 1. Summary of flight forecast for Europe (ESRA082).
ESRA08 2010 2011 2012 2013 2014 2015 2016 2017 2018 2019 2020
AAGR 2020/ 2013
RP1 2014/2011
AAGR
RP2 2019/2014
AAGR
IFR Flight Movements (Thousands)
H . . . . 9,648 10,013 10,436 10,812 11,196 11,604 12,052 3.5% -0.5% 3.8%
B 9,493 9,784 9,548 9,447 9,622 9,852 10,131 10,366 10,600 10,900 11,240 2.5% -0.6% 2.5%
L . . . . 9,595 9,665 9,761 9,847 9,967 10,100 10,247 1.2% -0.6% 1.0%
Annual Growth (compared to previous year unless otherwise
mentioned)
H . . . . 2.1% 3.8% 4.2% 3.6% 3.5% 3.7% 3.9% 3.5% -0.5% 3.8%
B 0.8% 3.1% -2.4% -1.1% 1.8% 2.4% 2.8% 2.3% 2.3% 2.8% 3.1% 2.5% -0.6% 2.5%
L . . . . 1.6% 0.7% 1.0% 0.9% 1.2% 1.3% 1.5% 1.2% -0.6% 1.0%
Figure 2. Average annual flight growth 2013-2020 per State, with no restoration of Eastern Ukraine overflights.
Total En-route Service Units In 2014, total en-route service units are forecasted to end significantly higher than expected in the forecast published in February 2014. The cause of this is threefold: firstly, the upwards revision of the flight forecast as a result of the stronger than expected traffic in the busiest States and notably in Southern Europe; secondly, the continuing increasing trend in weights and; finally, the unavailability of airspace over Ukraine. The latter adds a substantial level of flights crossing over the CRCO11 states instead of Ukraine.
From 2015 and the following years, the higher growth rate is faded out and years 2015 to 2020 of this forecast fall within the high-low forecast range published in February 2014. The average annual growth rate of the second Reference Period (RP2: 2015-2019) for the States participating in the Performance Scheme remains at the level of the February 2014 publication.
In 2014, 131.3 million service units (TSU) are forecasted for the CRCO11 area. This is 5.7% more than in 2013, a revision up by 2.1 percentage points compared to the previous forecast.
2 ESRA08 is a large, fixed region covering most of Europe. See Annex A for a definition.
7-year IFR Flight Movements and Service Units Forecast Update: 2014-2020
FINAL
EUROCONTROL/NMD/STATFOR Page 3
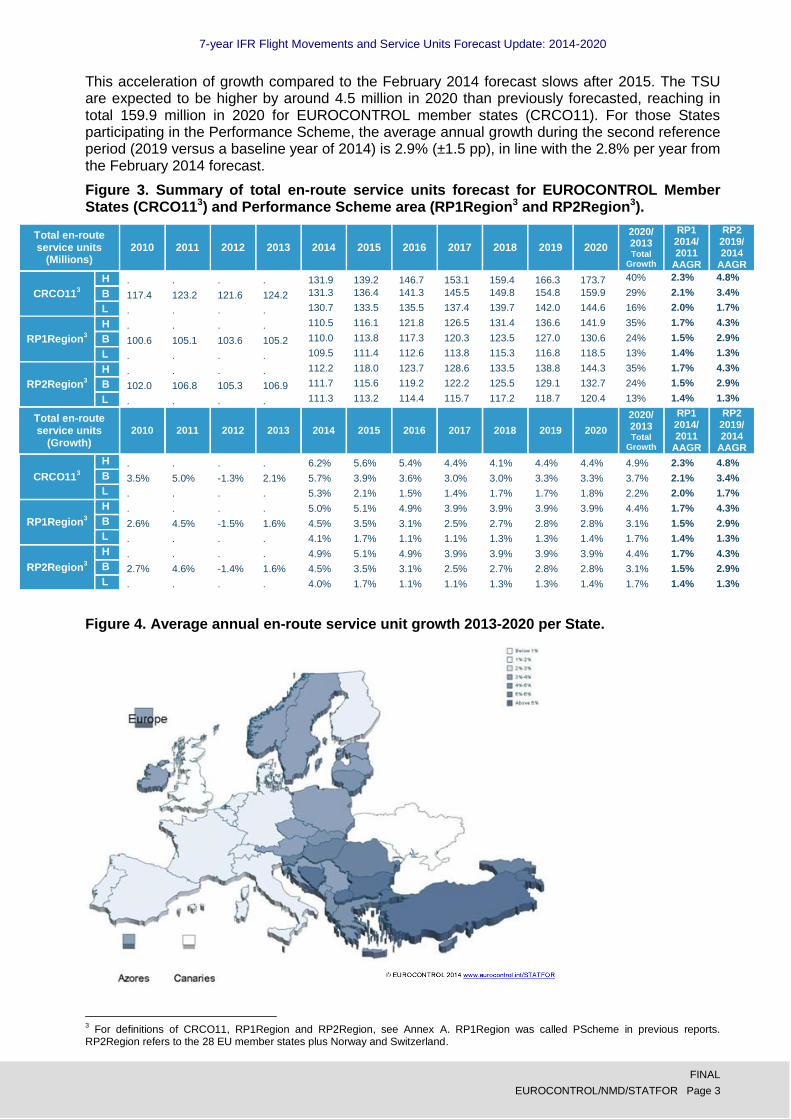
This acceleration of growth compared to the February 2014 forecast slows after 2015. The TSU are expected to be higher by around 4.5 million in 2020 than previously forecasted, reaching in total 159.9 million in 2020 for EUROCONTROL member states (CRCO11). For those States participating in the Performance Scheme, the average annual growth during the second reference period (2019 versus a baseline year of 2014) is 2.9% (±1.5 pp), in line with the 2.8% per year from the February 2014 forecast.
Figure 3. Summary of total en-route service units forecast for EUROCONTROL Member States (CRCO113) and Performance Scheme area (RP1Region3 and RP2Region3).
Total en-route service units
(Millions) 2010 2011 2012 2013 2014 2015 2016 2017 2018 2019 2020
2020/ 2013 Total
Growth
RP1 2014/ 2011
AAGR
RP2 2019/ 2014
AAGR
CRCO113
H . . . . 131.9 139.2 146.7 153.1 159.4 166.3 173.7 40% 2.3% 4.8%
B 117.4 123.2 121.6 124.2 131.3 136.4 141.3 145.5 149.8 154.8 159.9 29% 2.1% 3.4%
L . . . . 130.7 133.5 135.5 137.4 139.7 142.0 144.6 16% 2.0% 1.7%
RP1Region3
H . . . . 110.5 116.1 121.8 126.5 131.4 136.6 141.9 35% 1.7% 4.3%
B 100.6 105.1 103.6 105.2 110.0 113.8 117.3 120.3 123.5 127.0 130.6 24% 1.5% 2.9%
L . . . . 109.5 111.4 112.6 113.8 115.3 116.8 118.5 13% 1.4% 1.3%
RP2Region3
H . . . . 112.2 118.0 123.7 128.6 133.5 138.8 144.3 35% 1.7% 4.3%
B 102.0 106.8 105.3 106.9 111.7 115.6 119.2 122.2 125.5 129.1 132.7 24% 1.5% 2.9%
L . . . . 111.3 113.2 114.4 115.7 117.2 118.7 120.4 13% 1.4% 1.3%
Total en-route service units
(Growth)
2010 2011 2012 2013 2014 2015 2016 2017 2018 2019 2020
2020/ 2013 Total
Growth
RP1 2014/ 2011
AAGR
RP2 2019/ 2014
AAGR
CRCO113
H . . . . 6.2% 5.6% 5.4% 4.4% 4.1% 4.4% 4.4% 4.9% 2.3% 4.8%
B 3.5% 5.0% -1.3% 2.1% 5.7% 3.9% 3.6% 3.0% 3.0% 3.3% 3.3% 3.7% 2.1% 3.4%
L . . . . 5.3% 2.1% 1.5% 1.4% 1.7% 1.7% 1.8% 2.2% 2.0% 1.7%
RP1Region3
H . . . . 5.0% 5.1% 4.9% 3.9% 3.9% 3.9% 3.9% 4.4% 1.7% 4.3%
B 2.6% 4.5% -1.5% 1.6% 4.5% 3.5% 3.1% 2.5% 2.7% 2.8% 2.8% 3.1% 1.5% 2.9%
L . . . . 4.1% 1.7% 1.1% 1.1% 1.3% 1.3% 1.4% 1.7% 1.4% 1.3%
RP2Region3
H . . . . 4.9% 5.1% 4.9% 3.9% 3.9% 3.9% 3.9% 4.4% 1.7% 4.3%
B 2.7% 4.6% -1.4% 1.6% 4.5% 3.5% 3.1% 2.5% 2.7% 2.8% 2.8% 3.1% 1.5% 2.9%
L . . . . 4.0% 1.7% 1.1% 1.1% 1.3% 1.3% 1.4% 1.7% 1.4% 1.3%
Figure 4. Average annual en-route service unit growth 2013-2020 per State.
3 For definitions of CRCO11, RP1Region and RP2Region, see Annex A. RP1Region was called PScheme in previous reports.
RP2Region refers to the 28 EU member states plus Norway and Switzerland.
7-year IFR Flight Movements and Service Units Forecast Update: 2014-2020
FINAL
EUROCONTROL/NMD/STATFOR Page 4
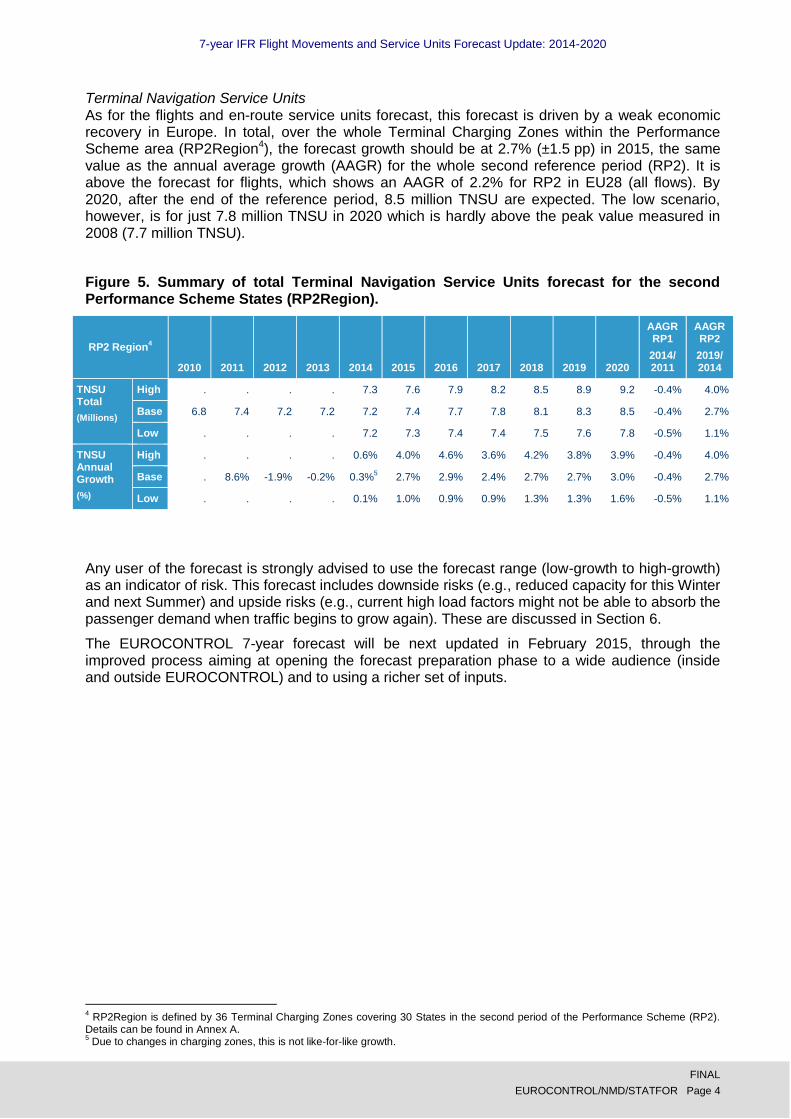
Terminal Navigation Service Units As for the flights and en-route service units forecast, this forecast is driven by a weak economic recovery in Europe. In total, over the whole Terminal Charging Zones within the Performance Scheme area (RP2Region4), the forecast growth should be at 2.7% (±1.5 pp) in 2015, the same value as the annual average growth (AAGR) for the whole second reference period (RP2). It is above the forecast for flights, which shows an AAGR of 2.2% for RP2 in EU28 (all flows). By 2020, after the end of the reference period, 8.5 million TNSU are expected. The low scenario, however, is for just 7.8 million TNSU in 2020 which is hardly above the peak value measured in 2008 (7.7 million TNSU).
Figure 5. Summary of total Terminal Navigation Service Units forecast for the second Performance Scheme States (RP2Region).
RP2 Region4
2010 2011 2012 2013 2014 2015 2016 2017 2018 2019 2020
AAGR RP1
2014/ 2011
AAGR RP2
2019/ 2014
TNSU Total
(Millions)
High . . . . 7.3 7.6 7.9 8.2 8.5 8.9 9.2 -0.4% 4.0%
Base 6.8 7.4 7.2 7.2 7.2 7.4 7.7 7.8 8.1 8.3 8.5 -0.4% 2.7%
Low . . . . 7.2 7.3 7.4 7.4 7.5 7.6 7.8 -0.5% 1.1%
TNSU Annual Growth
(%)
High . . . . 0.6% 4.0% 4.6% 3.6% 4.2% 3.8% 3.9% -0.4% 4.0%
Base . 8.6% -1.9% -0.2% 0.3%5 2.7% 2.9% 2.4% 2.7% 2.7% 3.0% -0.4% 2.7%
Low . . . . 0.1% 1.0% 0.9% 0.9% 1.3% 1.3% 1.6% -0.5% 1.1%
Any user of the forecast is strongly advised to use the forecast range (low-growth to high-growth) as an indicator of risk. This forecast includes downside risks (e.g., reduced capacity for this Winter and next Summer) and upside risks (e.g., current high load factors might not be able to absorb the passenger demand when traffic begins to grow again). These are discussed in Section 6.
The EUROCONTROL 7-year forecast will be next updated in February 2015, through the improved process aiming at opening the forecast preparation phase to a wide audience (inside and outside EUROCONTROL) and to using a richer set of inputs.
4 RP2Region is defined by 36 Terminal Charging Zones covering 30 States in the second period of the Performance Scheme (RP2).
Details can be found in Annex A. 5 Due to changes in charging zones, this is not like-for-like growth.

7-year IFR Flight Movements and Service Units Forecast Update: 2014-2020
FINAL
EUROCONTROL/NMD/STATFOR Page 5
INTENTIONALLY BLANK PAGE

7-year IFR Flight Movements and Service Units Forecast Update: 2014-2020
FINAL
EUROCONTROL/NMD/STATFOR Page 6
DOCUMENT CHARACTERISTICS
TITLE
7-year IFR Flight Movements and Service Units Forecast Update: 2014-2020
Reference Number: 14/09/11-53
Document Identifier Edition Number: FINAL
STATFOR Doc542 Edition Date: 26/09/2014
Keywords STATFOR Air Traffic Forecast Medium-Term Movements Flight Trends Traffic Flow Service Units Short-term Terminal En-route
Contact Person(s) Contact Unit
DE BONDT An; LELEU Claire [email protected] NMD/PFR/FNI/STATFOR Publications [email protected] DG/COM
DOCUMENT APPROVAL
The following table identifies all management authorities who have successively approved the present issue of this document.
© 2014 The European Organisation for the Safety of Air Navigation (EUROCONTROL). This document is published by EUROCONTROL for information purposes. It may be copied in whole or in part, provided that EUROCONTROL is mentioned as the source and to the extent justified by the non-commercial use (not for sale). The information in this document may not be modified without prior written permission from EUROCONTROL. The use of the document is at the user’s sole risk and responsibility. EUROCONTROL expressly disclaims any and all warranties with respect to any content within the document, express or implied.
The Statistics and Forecasts Service (STATFOR) is ISO 9001:2008 certified.

7-year IFR Flight Movements and Service Units Forecast Update: 2014-2020
FINAL
EUROCONTROL/NMD/STATFOR Page 7
DOCUMENT CHANGE RECORD
The following table records the complete history of the successive editions of the present document.
Version Date Reason for Change Sections affected
v0.1 01/09/2014 Skeleton draft to present initial inputs. All
v0.2 25/09/2014 Draft for internal review. All
v1.0 26/09/2014 Final version. All

7-year IFR Flight Movements and Service Units Forecast Update: 2014-2020
FINAL
EUROCONTROL/NMD/STATFOR Page 8
Contents 1. Introduction........................................................................................................................... 11
1.1 Context .......................................................................................................................... 11
1.2 Forecast Method ........................................................................................................... 11
2. Flight and service units trends in 2014 .................................................................................. 14
2.1 IFR Movements ............................................................................................................. 14
2.2 En-route Service Units ................................................................................................... 19
3. Forecast Inputs and Assumptions ......................................................................................... 20
3.1 Economic growth ........................................................................................................... 20
Economic forecast for Europe............................................................................................... 20
Details per state ................................................................................................................... 20
3.2 Events and Trends ........................................................................................................ 23
4. Growth in IFR flights to 2020 ................................................................................................ 25
4.1 Short-term outlook (2014-2015) ..................................................................................... 25
4.2 Medium-term outlook (up to 2020) ................................................................................. 28
4.3 Comparison with previous forecast ................................................................................ 30
4.4 What-if? restoration of pre-Ukraine closure routings ...................................................... 31
4.5 What-if? Increase of Unit Rates in Germany .................................................................. 32
5. Service unit growth to 2020 .................................................................................................. 35
5.1 En-route Service units (TSU) ......................................................................................... 35
5.2 What-if? restoration of pre-Ukraine closure routings ...................................................... 38
5.3 Terminal Navigation Service units (TNSU) .................................................................... 39
6. Risk to the forecast growth ................................................................................................... 40
7. Glossary ............................................................................................................................... 42
A. Traffic Region Definitions ...................................................................................................... 43
B. Summary of forecast for ESRA08 ......................................................................................... 48
C. Seven-year flight forecast per state (IFR movements)....................................................... 51
D. Seven-year flight forecast per state (Growth) .................................................................... 56
E. Two-year en-route service unit forecast by State .................................................................. 61
F. Seven-year en-route service units forecast per State ........................................................... 63
G. Seven-year en-route growth in service units forecast per State ......................................... 67
H. Terminal Navigation Service Unit Forecast ....................................................................... 71
I. References ........................................................................................................................... 79

7-year IFR Flight Movements and Service Units Forecast Update: 2014-2020
FINAL
EUROCONTROL/NMD/STATFOR Page 9
Figures
Figure 1. Summary of flight forecast for Europe (ESRA08). .............................................................................................. 2 Figure 2. Average annual flight growth 2013-2020 per State, with no restoration of Eastern Ukraine overflights. ............ 2 Figure 3. Summary of total en-route service units forecast for EUROCONTROL Member States (CRCO11) and
Performance Scheme area (RP1Region3 and RP2Region
3). ........................................................................... 3
Figure 4. Average annual en-route service unit growth 2013-2020 per State. .................................................................. 3 Figure 5. Summary of total Terminal Navigation Service Units forecast for the second Performance Scheme States
(RP2Region). .................................................................................................................................................... 4 Figure 6. The components of the STATFOR seven-year forecast .................................................................................. 12 Figure 7. 2014 number of flights is 1.9% above 2013. .................................................................................................... 14 Figure 8. Re-routings on North-West Europe to/from Middle-East or Asia/Pacific flow. .................................................. 15 Figure 9. Re-routings on Egypt to/from Russia. .............................................................................................................. 15 Figure 10. Turkey remains the main contributor (excluding overflights) on the European network. ................................ 16 Figure 11. Russia is the non-European destination adding most flights. ......................................................................... 16 Figure 12. European load factors reached record highs since 2013 (Source: AEA) ....................................................... 17 Figure 13. Low-Cost is the only segment which has grown consistently ......................................................................... 17 Figure 14. In 2014, trend in ticket price changes (air travel) in Europe declined at around 1% higher than the year
before, on a 12-month trailing average. .......................................................................................................... 17 Figure 15. Fuel prices remained high but stable in 2014. ................................................................................................ 18 Figure 16. For the main flows in the ESRA08, the biggest declines have been for smaller aircraft. ................................ 19 Figure 17. Evolution of total service units recorded in CRCO11 area from January 2011 to July 2014. ......................... 19 Figure 18. EU GDP forecast remained unchanged across the horizon since the OE January 2014 revision.................. 20 Figure 19. GDP Growth by Traffic Zone .......................................................................................................................... 21 Figure 20. GDP growth change per State in 2014 between this forecast (MTF14b) and the previous one (MTF14). ..... 22 Figure 21. GDP growth cumulative change per State by 2020 between this forecast (MTF14b) and the previous one
(MTF14).......................................................................................................................................................... 22 Figure 22. GDP Growth by Origin-Destination Zone ....................................................................................................... 23 Figure 23. GDP Growth by Traffic Region ....................................................................................................................... 23 Figure 24. Summary of the forecast for Europe. ............................................................................................................. 25 Figure 25. Flight forecast details for 2014. ...................................................................................................................... 27 Figure 26. Flight forecast details for 2015. ...................................................................................................................... 27 Figure 27. Average Annual Growth of Flights per State, 2020 v 2013............................................................................. 28 Figure 28. Number of additional movements per day for each State (2020 v 2013). ...................................................... 29 Figure 29. Average Annual Growth in Flights per FAB, 2020 v 2013. ............................................................................. 29 Figure 30. For total Europe, current forecast is aligned with previous forecast (dated February 2014), with narrower
short-term uncertainty. ................................................................................................................................... 30 Figure 31. Forecast revision for 2020 per State (comparison February: MTF14 vs September 2014: MTF14b forecasts).
....................................................................................................................................................................... 30 Figure 32. Total change in percentage per State after full restoration to flows pre-Russia-Ukraine crisis (only States
within the zone of interest).............................................................................................................................. 31 Figure 33. Total change in daily flights per State after full restoration to flows pre-Russia-Ukraine crisis (only States
within the zone of interest).............................................................................................................................. 32 Figure 34. Differences in route length and number of flights for Germany. ..................................................................... 33 Figure 35. Typical AP2 avoiding/flying shorter routes over Germany .............................................................................. 34 Figure 36. Comparison 2013-2020 of the forecast between the current TSU forecast and February 2013 for CRCO11
Area. ............................................................................................................................................................... 36 Figure 37. Summary of forecast of total service units in Europe. .................................................................................... 36 Figure 38. Average annual growth of service units between 2013 and 2020 .................................................................. 37 Figure 39 Total change in Service Units in percentage per State after full restoration to flows pre-Russia-Ukraine crisis
(only States within the zone of interest). ......................................................................................................... 38 Figure 40. Total Terminal Navigation Service Units generated in the RP2Region area as defined. ................................ 39 Figure 41. The EUROCONTROL Statistical Reference Area. ......................................................................................... 43 Figure 42. Regions used in flow statistics as of 31 August 2012. .................................................................................... 44 Figure 43. Map of the Traffic Regions used in flow statistics. .......................................................................................... 44 Figure 44. FABs as stipulated by the European Commission (STATFOR update: January 2014). Source:
EUROCONTROL PRU ................................................................................................................................... 45 Figure 45. List of aerodromes forming the TCZ in RP2. .................................................................................................. 47 Figure 46. Growth in Europe (ESRA08) .......................................................................................................................... 48 Figure 47. Flights and growth on main flow categories in Europe (ESRA08) .................................................................. 49 Figure 48. Busiest bi-directional region-to-region flows for ESRA08 ............................................................................... 50 Figure 49. Forecast of the number of IFR Movements (thousands) per State. ................................................................ 51 Figure 50. Forecast of the IFR Movements growth per State. ......................................................................................... 56 Figure 51. Forecast Summary: Annual total en-route service units 2014-2015. .............................................................. 61 Figure 52. Forecast Summary: Annual chargeable en-route service units 2014-2015. ................................................... 62 Figure 53. Forecast of the total number of en-route service units (thousands) per State. ............................................... 63 Figure 54. Forecast of the total en-route service units growth per State. ........................................................................ 67

7-year IFR Flight Movements and Service Units Forecast Update: 2014-2020
FINAL
EUROCONTROL/NMD/STATFOR Page 10
Figure 55. Exponents for Weight Coefficient and Number of Airport used in TNSU forecast for RP1 and RP2. ............. 71 Figure 56. Forecast of the total number of Terminal service units (thousands) per Terminal Charging Zone. ................ 72 Figure 57. Forecast of the total number of Terminal service units (growth) per Terminal Charging Zone. ...................... 76

7-year IFR Flight Movements and Service Units Forecast Update: 2014-2020
FINAL
EUROCONTROL/NMD/STATFOR Page 11
1. INTRODUCTION
1.1 Context
This document presents an update of the 7-year forecast published by EUROCONTROL in February this year (Ref. 1). This forecast update is produced every year, in particular to allow the capacity-planning process to use the most up-to-date information. Hence, the EUROCONTROL Statistics and Forecast Service (STATFOR) refreshes mid-year the main inputs to the forecast in addition to the full revision for the production of the 7-year forecast published each February.
The forecast describes annual number of IFR flight movements, annual number of total en-route service units and annual number of terminal navigation service units up to 2020.
For this update, three sets of the inputs have been revised: the assumptions on economic growth have been updated using economic forecasts available in mid-August; the traffic (IFR movements and service units) baseline has been re-aligned to take into account annual traffic to the end of July; adjustments and assumptions have been refreshed for better reflecting the effect of the different traffic disruptions (e.g., Russia-Ukraine crisis). For all other inputs and assumptions, see the description in Section 3 of Ref. 1.
The forecast method is similar to the one used in the EUROCONTROL 7-year forecast published in February 2014. An overview of the forecast method is given in the Section 1.2, and more details on the forecast method are given in Ref. 3.
This document contains a presentation of the latest traffic trends (Section 2), a presentation of the forecast inputs and assumptions (Section 3). The flights (Section 4) and Service Units (Section 5) forecasts to 2020 are then discussed, including two what-if? analyses to assess the impact of 1) a potential restoration of the routes over Eastern Ukraine and 2) a potential increase of unit rates in Germany in 2015. Section 6 indicates the main risks surrounding the forecast. A presentation of the geographical definitions can be found in Annex A. Forecast details for Europe as a whole are presented in Annex B. Annual total forecasts per States for IFR flights, en-route service units and terminal navigation service units can be found in Annexes C to H. The IFR flights forecasts per State (with details per flows) are provided via the STATFOR Interactive Dashboard (Ref. 2).
This 7-year IFR movements and service units forecast replaces the publication dated February 2014 (Ref. 1). The next 7-year outlook, for 2015-2021, will be published in February 2015, following an extended review cycle, as for the February 2014 forecast.
1.2 Forecast Method
For the new forecast process, we have produced a completely revised set of documentation on the forecast methods (Ref. 3). This documentation describes the methods at a number of levels of detail, from a two-page summary, to a function-by-function reference. For convenience of readers, the summary is reproduced in this section.
EUROCONTROL/STATFOR provides impartial air traffic forecasts, market analyses and statistics to the ATM community in the widest sense, to improve understanding of current and future trends, to enable better-informed decision making and thus to improve network performance. The STATFOR forecast has been serving European ATM since the 1970s. It is the only air traffic forecast covering Europe.
STATFOR publishes a forecast of IFR flights and both en-route and terminal service units for the next seven years in Europe. The main forecast update is published in February each year. Our focus is on the traffic forecast for States or larger regions. This influences the modelling choices made in the forecasting process. Other EUROCONTROL units use this high level forecast to drill down to the level of airports, control centres, sectors etc.
The number of flights depends on the interaction of supply and demand: an airline operates a flight between an airport A and an airport B because it has customers who pay to travel or ship goods from A to B. Supply and demand are each influenced by a large number of factors like economy, regulation, demographics, business development, oil prices, high-speed rail. When forecasting, we use data that describe these factors, and data more directly about actual and future supply (past flights, and future schedules). Some data are more relevant to the short-term

7-year IFR Flight Movements and Service Units Forecast Update: 2014-2020
FINAL
EUROCONTROL/NMD/STATFOR Page 12
horizon (e.g., airline schedules) while others are used in the medium-term horizon (e.g., demographics). Probably the three most influential inputs to the forecast are:
Economic growth forecasts obtained from external specialists, and which in recent years
have been very variable; growth has slowed, but there is nothing in our data to show that flight growth has decoupled from economic growth;
Regulation, e.g., rules on visas, open skies, airport funding, aviation taxes;
Overflight patterns since, for the majority of States, most of their flights are overflights. A
crisis such as that in Syria can easily change the number of flights by 10% or more in a number of States due to re-routing, even if the number of flights on the network as a whole is little changed (see section 4.4 for more on re-routing effects.)
Figure 6. The components of the STATFOR seven-year forecast
Overall, the components of the forecast can be grouped into five elements as in Figure 6:
An initial annual forecast for the next seven years based on economic, transport and other trends;
A monthly forecast based on trends, economics and airlines’ plans;
These are merged, and constrained by airport capacities to give the constrained forecast;
The final step of the flight forecast is to calculate how many flights are generated in each State, using both routings through airspace observed in the historical data and recent trends.
The number of service units in a charging zone depends on the number of flights, the weight of aircraft and, in the en route case, the distance flown. The two service unit forecasts therefore take the flight forecast as an input and combine this with time series forecasts of weight and distance as needed. This gives total service units, from which future chargeable service units are estimated using the ratio of chargeable/total from the previous calendar year.
We use a highly-automated and structured process to produce traffic forecasts and because of the variety of factors and inputs, different forecasting techniques are used: traditional time series methods to extrapolate historical patterns, econometric analyses to take into account how economic, social and operational conditions have an effect on the development of traffic, scenario-based inputs to describe the future (what Europe will be in 10 years’ time?) and specific data-driven models (e.g., high-speed rail development model). As for any forecast, the method
Service unit
trend
Weight-
distance
Total Service
Units
Chargeable
Service Units
En-Route Service Unit Forecast
Weight Total Service
Units
Terminal Service Unit Forecast
All-Cargo
Business
Aviation
Military
Small
airport-pairs
Initial Annual
Forecast
Passengers
Emissions
Trading Scheme
High-speed
Train
Low-cost
Market share
Network
Change
Adjusted for the effects of:
Population 7 years
State-flow
Schedule
recastability
Zone-pair
Monthly Tren
forecast
Constrained
airport-pair
forecast
Up to 25 month
Overfligh
trends
Overflight
choices
Overflight
forecast
Final flight
forecast
nthly fo
nds, economics and plans
omic, transport and other trends
ices
ends
Service unit
trend
Weight-
distance
Total Service
Units
Chargeable
Service Units
En-Route Servrr ice Unit Forecast
Servrr ice unit
trend
Weight-
distance
Total Servrr ice
Units
Chargeable
Servrr ice Units
En-Route Service Unit Forecast
Weight Total Service
Units
Terminal Servrr ice Unit Forecast
Weight Total Servrr ice
Units
Terminal Service Unit Forecast
All-Cargo
Business
Aviation
Military
Small
airport-pairs
Initial Annual
Forecast
Passengers
Emissions
Trading Scheme
High-speed
Train
Low-cost
Market share
Network
Change
Adjusted for the effects of:
Population 7 years
State-flow
Schedule
recastability
Zone-pair
Monthly Tren
forecast
Constrained
airport-pair
forecast
Up to 25 month
Overfligh
trends
Overflight
choices
Overflight
forecast
Final flight
forecast
nthly fo
nds, economics and plans
omic, transport and other trends
ices
ends
All-Cargo
Business
Aviation
Military
Small
airport-pairs
Initial Annual
Forecast
Passengers
Emissions
Trading Scheme
High-speed
Train
Low-cost
Market share
Network
Change
Adjusted for the effects of:
Population
Passengers
Emissions
Trading Scheme
High-speed
Train
Low-cost
Market share
Network
Change
Adjusted for the effects of:
Population 7 years
State-flow
Schedule
recastability
Zone-pair
Monthly Tren
forecast
Constrained
airport-pair
forecast
Up to 25 month
Overfligh
trends
Overflight
choices
Overflight
forecast
Final flight
forecast
nntthhllyy ffoo
nnddss,, eeccoonnoommiiccss aanndd ppllaannss
State-flow
Schedule
recastability
Zone-pair
Monthly Tren
forecast
UUUUpppp ttttoooo 22225555 mmmmoooonnnntttthhhh
Monthly forecast based on
Trends, economics and plans
oommiicc,, ttrraannssppoorrtt aanndd ootthheerr ttrreennddss
All-Cargo
Business
Aviation
Military
Small
airport-pairs
Initial Annual
Forecast
Passengers
Emissions
Trading Scheme
High-speed
Train
Low-cost
Market share
Network
Change
AAAAAAAdddddddjjjjjjjuuuuuuusssssssttttttteeeeeeeddddddd fffffffooooooofffffffffffffffffffffffffffffffffffffffffffffffffffffffffffffffffffffffffffffffffffffffffffffffffffffffffffffffffff rrrrrrr ttttttthhhhhhheeeeeee eeeeeeefffffffffffffffffffffffffffffffffffffffffffffffffffffffffffffffffffffffffffffffffffffffffffffffffffffffffffffffffffffffffffffffff eeeeeeefffffffffffffffffffffffffffffffffffffffffffffffffffffffffffffffffffffffffffffffffffffffffffffffffffffffffffffffffff ccccccctttttttsssssss ooooooofffffff:::::::
Population 7777 yyyyeeeeaaaarrrrssss
Annual forecast based on economic, transport and other trends
iicceess
eennddss
Overfrr light
choices
Overfrr light
forecast
Overfrr ligh
trends
Overflight
choices
& trends

7-year IFR Flight Movements and Service Units Forecast Update: 2014-2020
FINAL
EUROCONTROL/NMD/STATFOR Page 13
relies on historical data either for taking a snapshot of the most recent trends or longer history to calibrate the models.
The future is always uncertain. We capture this uncertainty in the forecast through three forecast scenarios: low- and high-growth scenarios, with the most-likely “base” forecast in between. All three scenarios should be considered as part of the risk management of any decision based on the forecast.
As requested by Stakeholders, we have re-calibrated some of the key relationships with economic growth for this forecast, including introducing more specific country-pair flow relationships where these make statistical sense. This re-calibration process is described in Ref. 4, which has been distributed to the STATFOR User Group.
7-year IFR Flight Movements and Service Units Forecast Update: 2014-2020
FINAL
EUROCONTROL/NMD/STATFOR Page 14
2. FLIGHT AND SERVICE UNITS TRENDS IN 2014
Since the beginning of 2014, European traffic has been marked by stronger-than-expected growth in main busiest States and in Southern Europe (over the summer months). Low-cost segment has mainly been driving growth. Some major events have affected the traffic patterns over Europe and more specifically the overflight flows in Eastern Europe.
2.1 IFR Movements
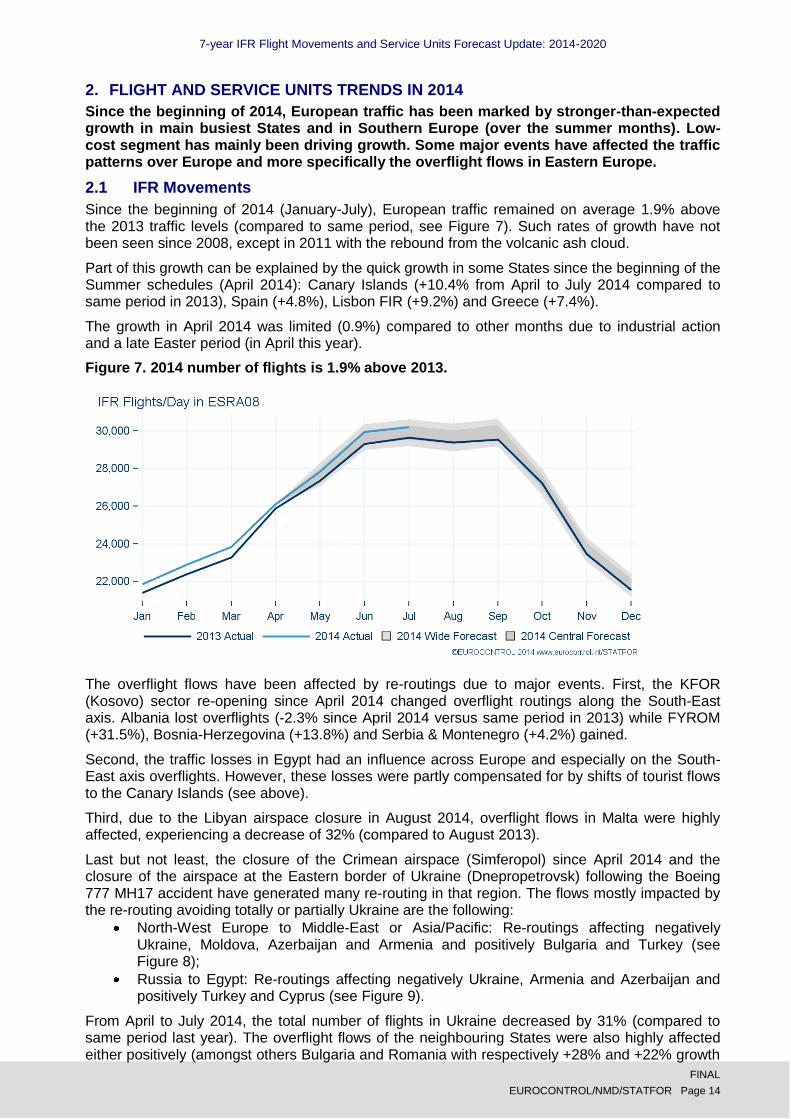
Since the beginning of 2014 (January-July), European traffic remained on average 1.9% above the 2013 traffic levels (compared to same period, see Figure 7). Such rates of growth have not been seen since 2008, except in 2011 with the rebound from the volcanic ash cloud.
Part of this growth can be explained by the quick growth in some States since the beginning of the Summer schedules (April 2014): Canary Islands (+10.4% from April to July 2014 compared to same period in 2013), Spain (+4.8%), Lisbon FIR (+9.2%) and Greece (+7.4%).
The growth in April 2014 was limited (0.9%) compared to other months due to industrial action and a late Easter period (in April this year).
Figure 7. 2014 number of flights is 1.9% above 2013.
The overflight flows have been affected by re-routings due to major events. First, the KFOR (Kosovo) sector re-opening since April 2014 changed overflight routings along the South-East axis. Albania lost overflights (-2.3% since April 2014 versus same period in 2013) while FYROM (+31.5%), Bosnia-Herzegovina (+13.8%) and Serbia & Montenegro (+4.2%) gained.
Second, the traffic losses in Egypt had an influence across Europe and especially on the South-East axis overflights. However, these losses were partly compensated for by shifts of tourist flows to the Canary Islands (see above).
Third, due to the Libyan airspace closure in August 2014, overflight flows in Malta were highly affected, experiencing a decrease of 32% (compared to August 2013).
Last but not least, the closure of the Crimean airspace (Simferopol) since April 2014 and the closure of the airspace at the Eastern border of Ukraine (Dnepropetrovsk) following the Boeing 777 MH17 accident have generated many re-routing in that region. The flows mostly impacted by the re-routing avoiding totally or partially Ukraine are the following:
North-West Europe to Middle-East or Asia/Pacific: Re-routings affecting negatively Ukraine, Moldova, Azerbaijan and Armenia and positively Bulgaria and Turkey (see Figure 8);
Russia to Egypt: Re-routings affecting negatively Ukraine, Armenia and Azerbaijan and positively Turkey and Cyprus (see Figure 9).
From April to July 2014, the total number of flights in Ukraine decreased by 31% (compared to same period last year). The overflight flows of the neighbouring States were also highly affected either positively (amongst others Bulgaria and Romania with respectively +28% and +22% growth

7-year IFR Flight Movements and Service Units Forecast Update: 2014-2020
FINAL
EUROCONTROL/NMD/STATFOR Page 15
of overflights compared to same period in 2013) or negatively (Moldova -30%) based on the re-routings.
Figure 8. Re-routings on North-West Europe to/from Middle-East or Asia/Pacific flow.
Traffic from 17 August 2013
Traffic from 16 August 2014
Figure 9. Re-routings on Egypt to/from Russia.
Traffic from 17 August 2013
Traffic from 16 August 2014
Figure 10 shows local traffic (i.e. excluding overflights) changes for January-July 2014 period. Turkey remained the main contributor, adding more than 230 daily flights (excluding overflights) with an +11% growth. The United Kingdom moved to the second-place with 94 flights per day (excluding overflights) thanks to arrivals and departures flows (though internals decreased by 4.3%). Greece was third contributor with 10% growth thanks to higher traffic demand for the Greek islands. Spain and Italy shifted from the right- to the left-side of Figure 10 adding respectively 62 and 30 daily flights (excluding overflights).
On the right-side of Figure 10, Ukraine was the country that removed the most flights from the network in 2014 so far due to the impact of the Russia-Ukraine crisis generating a loss of about 90 daily flights on the European network. France also removed more than 40 flights a day, mainly due to the weakness of its internal traffic and the pressure during the winter period.

7-year IFR Flight Movements and Service Units Forecast Update: 2014-2020
FINAL
EUROCONTROL/NMD/STATFOR Page 16
Figure 10. Turkey remains the main contributor (excluding overflights) on the European network.
Outside Europe, Russia was still the number one destination from Europe in terms of number of flights: 445 departures per day on average for the period January-July 2014 (see Figure 11). This situation remained despite the major loss of flights since April 2014 (about 25 departures per day in July 2014) due to the Russia-Ukraine crisis. This flow still represents 16% of all departures from ESRA08 to countries outside Europe despite the recent negative trend (-2.9% from April to July 2014 compared to same period in 2013) due to the slowing down of the Russian economy and the
impact of tensions between Russia and the European Union due to the Russia-Ukraine crisis (EU and U.S. have imposed sanctions to which Moscow has retaliated with a ban on most Western food imports).
Figure 11. Russia is the non-European destination adding most flights.
The United States also remained the second destination from Europe adding traffic to the network with on average 405 departures per day since January 2014 (see Figure 11). Departures from Europe to the United States increased by 3.2% on average since the beginning of the year (compared same period in 2013). Last year (same period) this flow was experiencing a decrease of 2.3% (compared to 2012).
Egypt was also in the top 7 destinations from Europe (on average 93 flights per day since January 2014) despite the remaining pressure on tourist traffic due to the local instability.

7-year IFR Flight Movements and Service Units Forecast Update: 2014-2020
FINAL
EUROCONTROL/NMD/STATFOR Page 17
Major European carriers published a 22% increase in operating profits during the second quarter of 2014 (versus the same quarter in 2013, see Ref. 5). The load factors of flag carriers remained record-breaking on Europe (cross-border) flows in 2014 (see Figure 12).
Figure 12. European load factors reached record highs since 2013 (Source: AEA)
Figure 13 shows the traffic development per market segment. Low-cost was the only segment with sustained growth since April 2013. Since the beginning of 2014, the market share of the low-cost segment represented approximately 26% (28% during summer months) of the total number of flights. This segment grew at an average rate of 6.5% in terms of number of flights. The traditional scheduled segment, representing more than 50% of the total market, grew on average by 0.7% since January 2014. The all-cargo segment shifted into slight growth recently compared to 2013 (less than 0.5%).
Figure 13. Low-Cost is the only segment which has grown consistently
Since September 2013, airline ticket price growth in Europe slowed down even if ticket prices are still increasing in real terms (Figure 14). Ticket price inflation is now at an average level of 1% since the beginning of 2014 compared to the record level of 5% reached in early 2012 (responding to the surge in oil prices) and the level of 3% at the beginning of 2013. The peak in April 2014 is mostly driven by the movement of Easter.
Figure 14. In 2014, trend in ticket price changes (air travel) in Europe declined at around 1% higher than the year before, on a 12-month trailing average.
Note that, on this graph, ticket prices are deflated by overall consumer prices.

7-year IFR Flight Movements and Service Units Forecast Update: 2014-2020
FINAL
EUROCONTROL/NMD/STATFOR Page 18
As shown in Figure 15, oil prices remained fairly stable around €80 per barrel in the course of 2014. Fuel prices have also been stable but high at an average of €700 per tonne since the beginning of 2014.
Figure 15. Fuel prices remained high but stable in 2014.
From January to August 2014, total flights by smaller aircraft (below 100 seats) in Europe have declined (compared to the same period in 2013) for all traffic and local traffic flows. Conversely, flights by larger short-haul aircraft (151-210 seaters) have increased for the same flows (see Figure 16); this aligns with the observation that the low-cost segment has been growing the quickest. For overflight traffic, big growth has been observed in the small to medium aircraft categories (between 50 and 300 seats) and also for larger long-haul aircraft (more than 300 seats).

7-year IFR Flight Movements and Service Units Forecast Update: 2014-2020
FINAL
EUROCONTROL/NMD/STATFOR Page 19
Figure 16. For the main flows in the ESRA08, the biggest declines have been for smaller aircraft6.
2.2 En-route Service Units
During the first seven months of 2014, the total service units (TSU) for the CRCO11 region increased by 4.9% from 70.8 million in the year-ago period to 74.3 million. With an increase of 4.9%, the growth of TSU was much greater than that of the flights which grew by 1.9% in the ESRA08 region. Bearing in mind that Ukraine is not a member state of the CRCO11 region; re-routings in the South-East axis further to the closure of the Eastern Ukraine airspace have led to variations in TSU growth for neighbouring CRCO11 states. As a result, TSU for Bulgaria, Bosnia-Herzegovina and Turkey increased by 34%, 19% and 18% respectively during the period April-July 2014. At the other end of the scale, TSU for Moldova and Georgia decreased by 45% and 13% respectively on the same period in 2013. Total flights in Ukraine slumped 31% during April-July 2014, in line with the state’s TSU which were down 35% on the year-ago period.
Figure 17. Evolution of total service units recorded in CRCO11 area from January 2011 to July 2014.
6 Flows are: I: Internal, AD: Arrivals and Departures from the zone, O: Overflights, T: Total, TADI: Total excluding overflights.

7-year IFR Flight Movements and Service Units Forecast Update: 2014-2020
FINAL
EUROCONTROL/NMD/STATFOR Page 20
3. FORECAST INPUTS AND ASSUMPTIONS
The forecast is driven by past trends and by scenario assumptions for the future. Since February, the economic forecast remained mainly unchanged at European level. However, the upwards trend in flight growth for busiest States recorded since February is influencing the forecast. Moreover, airspace unavailability over Ukraine, Libya, and Near-East led to re-routings changing the pattern of Eastern Europe flight growth. Sections 3.1 and 3.2 describe how they influence the forecast.
The forecast is derived from historical traffic data and a set of scenario assumptions. All the input assumptions made in the February forecast (e.g., load factors evolution, demographics, high-speed rail network development etc see Ref. 1) have been reused, except for the economic growth forecast and the specific events and traffic trends scenarios.
As usual, there are three scenarios presented in this forecast. The “Base” scenario represents the most-likely development of the traffic and is an intermediate point between a “Low” scenario (weak growth) and a “High” scenario (strong growth).
3.1 Economic growth
Forecasts of growth in gross domestic product (GDP) are provided by the Oxford Economics Ltd (OE) forecast of August 2014 for most of the States and regions. For some States, when recommended by stakeholders, other GDP forecasts are used. In particular: official government forecasts have been used for Germany (April 2014) and UK (January 2014) and National Institute of Economic Research forecast for Sweden (December 2013). The high‐ and low‐growth scenarios are based on fixed offsets7 from these forecasts.
ECONOMIC FORECAST FOR EUROPE
Figure 18 illustrates how the economic forecast for EU countries remained almost the same in the OE August release (indicated as MTF14b) as for the February forecast (MTF14). This is in line with previous revisions of the EU economic forecasts for the 7-year horizon (2014-2020) by OE which has been reasonably stable since the OE October 2012 update.
Figure 18. EU GDP forecast remained unchanged across the horizon since the OE January 2014 revision.
DETAILS PER STATE
The GDP forecasts are shown for all forecasted states in Figure 19 as well as for certain non- European states in Figure 22. For all other States, the economic growth of the traffic region is used (Figure 23). Traffic regions are listed in Figure 42 (Annex A).
7 +1%, -1% for early years and big States, +1.5%, -1.5% for early years and small States, +0.5%, -0.5% for late years and big States, +0.8%, -0.8% for late years and small States.
7-year IFR Flight Movements and Service Units Forecast Update: 2014-2020
FINAL
EUROCONTROL/NMD/STATFOR Page 21
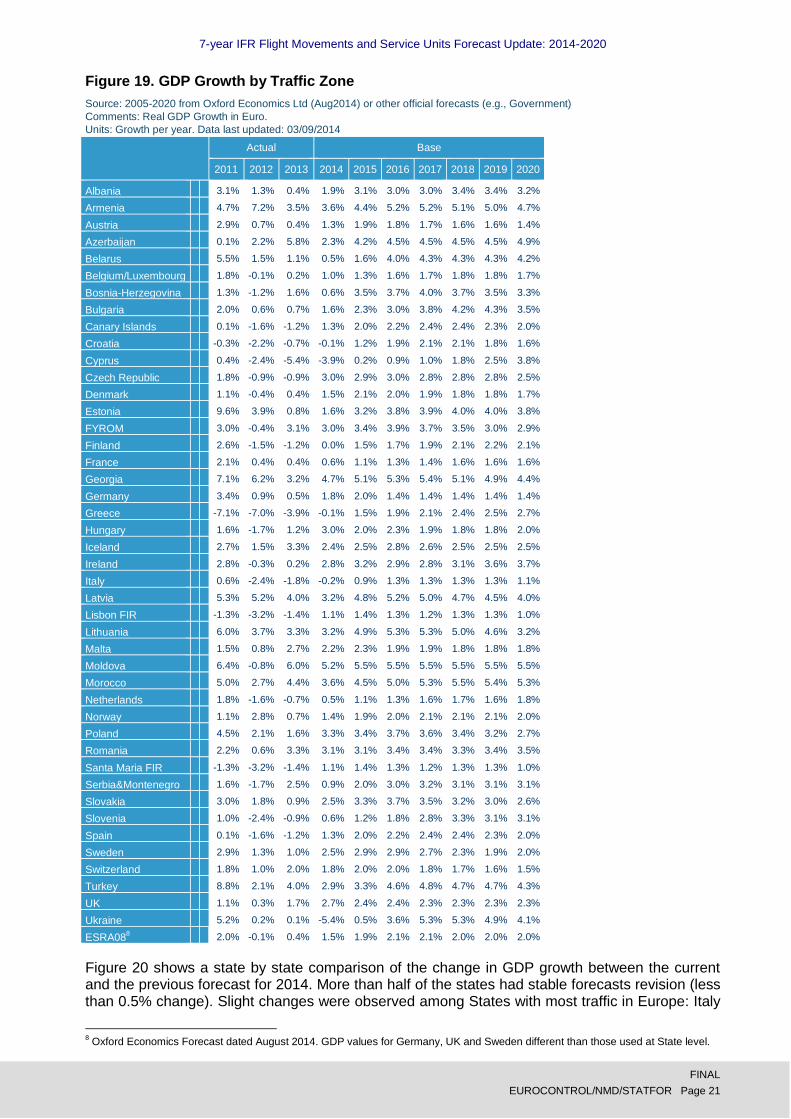
Figure 19. GDP Growth by Traffic Zone
Source: 2005-2020 from Oxford Economics Ltd (Aug2014) or other official forecasts (e.g., Government)
Comments: Real GDP Growth in Euro.
Units: Growth per year. Data last updated: 03/09/2014
Actual Base
2011 2012 2013 2014 2015 2016 2017 2018 2019 2020
Albania 3.1% 1.3% 0.4% 1.9% 3.1% 3.0% 3.0% 3.4% 3.4% 3.2%
Armenia 4.7% 7.2% 3.5% 3.6% 4.4% 5.2% 5.2% 5.1% 5.0% 4.7%
Austria 2.9% 0.7% 0.4% 1.3% 1.9% 1.8% 1.7% 1.6% 1.6% 1.4%
Azerbaijan 0.1% 2.2% 5.8% 2.3% 4.2% 4.5% 4.5% 4.5% 4.5% 4.9%
Belarus 5.5% 1.5% 1.1% 0.5% 1.6% 4.0% 4.3% 4.3% 4.3% 4.2%
Belgium/Luxembourg 1.8% -0.1% 0.2% 1.0% 1.3% 1.6% 1.7% 1.8% 1.8% 1.7%
Bosnia-Herzegovina 1.3% -1.2% 1.6% 0.6% 3.5% 3.7% 4.0% 3.7% 3.5% 3.3%
Bulgaria 2.0% 0.6% 0.7% 1.6% 2.3% 3.0% 3.8% 4.2% 4.3% 3.5%
Canary Islands 0.1% -1.6% -1.2% 1.3% 2.0% 2.2% 2.4% 2.4% 2.3% 2.0%
Croatia -0.3% -2.2% -0.7% -0.1% 1.2% 1.9% 2.1% 2.1% 1.8% 1.6%
Cyprus 0.4% -2.4% -5.4% -3.9% 0.2% 0.9% 1.0% 1.8% 2.5% 3.8%
Czech Republic 1.8% -0.9% -0.9% 3.0% 2.9% 3.0% 2.8% 2.8% 2.8% 2.5%
Denmark 1.1% -0.4% 0.4% 1.5% 2.1% 2.0% 1.9% 1.8% 1.8% 1.7%
Estonia 9.6% 3.9% 0.8% 1.6% 3.2% 3.8% 3.9% 4.0% 4.0% 3.8%
FYROM 3.0% -0.4% 3.1% 3.0% 3.4% 3.9% 3.7% 3.5% 3.0% 2.9%
Finland 2.6% -1.5% -1.2% 0.0% 1.5% 1.7% 1.9% 2.1% 2.2% 2.1%
France 2.1% 0.4% 0.4% 0.6% 1.1% 1.3% 1.4% 1.6% 1.6% 1.6%
Georgia 7.1% 6.2% 3.2% 4.7% 5.1% 5.3% 5.4% 5.1% 4.9% 4.4%
Germany 3.4% 0.9% 0.5% 1.8% 2.0% 1.4% 1.4% 1.4% 1.4% 1.4%
Greece -7.1% -7.0% -3.9% -0.1% 1.5% 1.9% 2.1% 2.4% 2.5% 2.7%
Hungary 1.6% -1.7% 1.2% 3.0% 2.0% 2.3% 1.9% 1.8% 1.8% 2.0%
Iceland 2.7% 1.5% 3.3% 2.4% 2.5% 2.8% 2.6% 2.5% 2.5% 2.5%
Ireland 2.8% -0.3% 0.2% 2.8% 3.2% 2.9% 2.8% 3.1% 3.6% 3.7%
Italy 0.6% -2.4% -1.8% -0.2% 0.9% 1.3% 1.3% 1.3% 1.3% 1.1%
Latvia 5.3% 5.2% 4.0% 3.2% 4.8% 5.2% 5.0% 4.7% 4.5% 4.0%
Lisbon FIR -1.3% -3.2% -1.4% 1.1% 1.4% 1.3% 1.2% 1.3% 1.3% 1.0%
Lithuania 6.0% 3.7% 3.3% 3.2% 4.9% 5.3% 5.3% 5.0% 4.6% 3.2%
Malta 1.5% 0.8% 2.7% 2.2% 2.3% 1.9% 1.9% 1.8% 1.8% 1.8%
Moldova 6.4% -0.8% 6.0% 5.2% 5.5% 5.5% 5.5% 5.5% 5.5% 5.5%
Morocco 5.0% 2.7% 4.4% 3.6% 4.5% 5.0% 5.3% 5.5% 5.4% 5.3%
Netherlands 1.8% -1.6% -0.7% 0.5% 1.1% 1.3% 1.6% 1.7% 1.6% 1.8%
Norway 1.1% 2.8% 0.7% 1.4% 1.9% 2.0% 2.1% 2.1% 2.1% 2.0%
Poland 4.5% 2.1% 1.6% 3.3% 3.4% 3.7% 3.6% 3.4% 3.2% 2.7%
Romania 2.2% 0.6% 3.3% 3.1% 3.1% 3.4% 3.4% 3.3% 3.4% 3.5%
Santa Maria FIR -1.3% -3.2% -1.4% 1.1% 1.4% 1.3% 1.2% 1.3% 1.3% 1.0%
Serbia&Montenegro 1.6% -1.7% 2.5% 0.9% 2.0% 3.0% 3.2% 3.1% 3.1% 3.1%
Slovakia 3.0% 1.8% 0.9% 2.5% 3.3% 3.7% 3.5% 3.2% 3.0% 2.6%
Slovenia 1.0% -2.4% -0.9% 0.6% 1.2% 1.8% 2.8% 3.3% 3.1% 3.1%
Spain 0.1% -1.6% -1.2% 1.3% 2.0% 2.2% 2.4% 2.4% 2.3% 2.0%
Sweden 2.9% 1.3% 1.0% 2.5% 2.9% 2.9% 2.7% 2.3% 1.9% 2.0%
Switzerland 1.8% 1.0% 2.0% 1.8% 2.0% 2.0% 1.8% 1.7% 1.6% 1.5%
Turkey 8.8% 2.1% 4.0% 2.9% 3.3% 4.6% 4.8% 4.7% 4.7% 4.3%
UK 1.1% 0.3% 1.7% 2.7% 2.4% 2.4% 2.3% 2.3% 2.3% 2.3%
Ukraine 5.2% 0.2% 0.1% -5.4% 0.5% 3.6% 5.3% 5.3% 4.9% 4.1%
ESRA088 2.0% -0.1% 0.4% 1.5% 1.9% 2.1% 2.1% 2.0% 2.0% 2.0%
Figure 20 shows a state by state comparison of the change in GDP growth between the current and the previous forecast for 2014. More than half of the states had stable forecasts revision (less than 0.5% change). Slight changes were observed among States with most traffic in Europe: Italy
8 Oxford Economics Forecast dated August 2014. GDP values for Germany, UK and Sweden different than those used at State level.

7-year IFR Flight Movements and Service Units Forecast Update: 2014-2020
FINAL
EUROCONTROL/NMD/STATFOR Page 22
has been revised downwards to -0.2%; Germany (to 1.8%) and Spain (to 1.3%) upwards; UK and France GDP forecasts have remained unchanged (2.7% and 0.6%, respectively). As a direct consequence of the ongoing crisis, Ukraine has seen its GDP forecast revised downwards. It is important to note that the OE GDP forecast has been used for Ukraine and not the International Monetary Fund (IMF) one as in the February 2014 forecast. IMF did not publish the GDP forecast for Ukraine in its most recent Economic Outlook Report due to uncertainty on the outcome of the conflict on Eastern Ukraine.
Figure 20. GDP growth change per State in 2014 between this forecast (MTF14b) and the previous one (MTF14).
Looking at the total of the seven years in terms of GDP growth changes, the results are an extension of 2014 revisions, exception being Ukraine (Figure 21). Here, the OE forecast has a more optimistic view for the next seven years than that of IMF, used in the February forecast.
Figure 21. GDP growth cumulative change per State by 2020 between this forecast (MTF14b) and the previous one (MTF14).

7-year IFR Flight Movements and Service Units Forecast Update: 2014-2020
FINAL
EUROCONTROL/NMD/STATFOR Page 23
Figure 22. GDP Growth by Origin-Destination Zone
Source: 1993-2004 from STATFOR records. 2005 onwards from Oxford Economics Ltd, Aug14.
Comments: Real GDP Growth in Euro.
Units: Growth per year. Data last updated: 21/08/2014
Actual Base
2011 2012 2013 2014 2015 2016 2017 2018 2019 2020
Brazil 2.7% 1.0% 2.5% 0.7% 1.4% 2.5% 3.3% 3.4% 3.3% 3.3%
China 9.3% 7.7% 7.7% 7.4% 6.9% 6.6% 6.6% 6.5% 6.4% 6.1%
India 7.7% 4.8% 4.7% 4.8% 5.1% 6.1% 6.6% 6.9% 6.9% 6.2%
Israel 4.6% 3.3% 3.4% 3.3% 3.7% 3.8% 4.5% 4.8% 3.5% 3.4%
South Africa 3.6% 2.5% 1.9% 1.2% 2.5% 3.2% 3.2% 3.4% 3.6% 3.5%
Figure 23. GDP Growth by Traffic Region
Source: 2005 onwards updated from Oxford Economics Aug14
Comments: Real GDP Growth.
Units: Growth per year. Data last updated: 21/08/2014
Actual Base
2011 2012 2013 2014 2015 2016 2017 2018 2019 2020
Asia/Pacific 1.5% 2.4% 2.4% 2.2% 2.4% 2.5% 2.6% 2.4% 2.3% 2.2%
ESRA East 3.0% 0.6% 1.1% 2.7% 2.9% 3.3% 3.2% 3.1% 3.0% 2.7%
ESRA Mediterranean 1.1% -1.7% -0.8% 0.8% 1.7% 2.2% 2.3% 2.3% 2.3% 2.1%
ESRA North-West 2.2% 0.4% 0.8% 1.6% 1.9% 2.0% 1.9% 1.9% 1.9% 1.9%
Mid-Atlantic 3.6% 3.4% 1.7% 2.5% 3.5% 3.7% 3.9% 3.8% 3.7% 3.1%
Middle-East 5.8% 2.7% 2.7% 3.6% 4.1% 4.1% 4.2% 4.1% 4.0% 3.9%
North Atlantic 1.7% 2.3% 2.2% 2.1% 3.1% 3.0% 2.9% 2.9% 2.9% 2.7%
North-Africa -7.4% 9.1% 1.9% 1.5% 6.6% 6.6% 5.2% 5.2% 4.8% 4.6%
Other Europe 4.3% 3.4% 1.6% 0.4% 1.3% 3.4% 3.8% 3.8% 3.5% 3.1%
South-Atlantic 7.0% 3.1% 3.6% 0.6% 2.8% 3.6% 3.7% 3.7% 3.7% 3.3%
Southern Africa 4.7% 4.8% 5.2% 5.7% 5.8% 5.6% 5.5% 5.3% 5.4% 5.2%
3.2 Events and Trends
The ‘events and trends’ assumptions consist of adjustments to arrival, departure, internal, overflight traffic and also en-route service units. The effects considered are described in the remainder of this section. They are listed considering how long they have been introduced in the previous forecasts.
EU accession: Croatia’s accession in July 2013 has slightly boosted its air traffic thanks to air
transport and market liberalization. The impact is factored in by an additional 3% growth as of July 2014, halving the following years. This 3% growth is a reduced effect compared to the previous cases (e.g., impact for State joining EU was a peak of +11% for Romania and Bulgaria in the February 2006 forecast).
EURO2016: The European football cup to be held in France from 10 June to 10 July 2016 (9
sites) is likely to have a small impact on traffic in France. In accordance with estimates from the DGAC/France, STATFOR derived expected impact based on the EURO2008 and EURO2012 historical data. French Arrivals/Departures and Internal flows are expected to see 0.1% and 0.08% additional traffic respectively.

7-year IFR Flight Movements and Service Units Forecast Update: 2014-2020
FINAL
EUROCONTROL/NMD/STATFOR Page 24
Airspace unavailability
Eastern Ukraine airspace: a scenario has been created to reflect the current situation in
Ukraine (closure of routes in Simferopol FIR and area closed over Eastern Ukraine at the time of writing). Lacking any indications of when there might be a return to normality, we have made assumed there will be no restoration of pre-crisis traffic patterns (“normal” routings). This means that the routing patterns observed in Eastern Europe since April 2014 have been used until the end of the forecast. In fact, we believe there is a strong probability of re-opening of the airspace before 2020, so calculations of the effects of eventual restoration are presented in Sections 4.4 and 5.2.
Libyan airspace: as for Ukraine, and lacking a basis for estimating the duration of the airspace unavailability over Libya, no restoration to pre-closure traffic patterns over Southern
Europe has been assumed.
Other adjustments
Some other adjustments have been made, based on best information about schedules patterns for the next 12 months. The strategies of European carriers for the coming Winter vary: while some flag carriers will reduce capacity (e.g., Lufthansa to remove 8 aircraft, IAG to decrease capacity by 3% vs same period last year), low-cost carriers have been filling the gaps and adding capacity to the network for the coming Winter (e.g., +8% for Ryanair and +6.4% for Easyjet announced in the news). An overall estimation of the Winter 14/15 capacity for Europe led to a 1%-1.5% flight growth overall (excluding overflights). As far as the Summer 2015 schedules are concerned, the lack of precise information at the time of writing made an overall estimation difficult.
Winter 2014/15 growth: As a significant part of the flight demand to Egypt had been
transferred to the Spanish Islands and Egypt traffic recovery is premature; so, arrival/departure flow from/to Canary Islands has been boosted by 2% this Winter.
Summer 2015 growth: based on company reports for 2015, and together with the Summer
14 trends, additional traffic has been foreseen in Southern Europe next Summer (e.g., Italy A/D +2%, Lisbon FIR A/D +4%, Greece A/D +4%, I +2%, Turkey ADI +3%, Spain A/D +4%, Santa Maria A/D +5%).
Not included
No complete set of information coming from airline schedules9 for this Winter 14/15 has been
used in this forecast. Recent Winters have seen late downward revisions in the schedules, and we consider this to be a significant downside risk for the coming Winter, too.
Unlike in the previous forecast:
no adjustment has been made for Ukraine following the Open Skies agreement signed with the EU which is likely to enter into force in Summer 2015,
no adjustment has been made to represent the impact of the KFOR Sector airspace re-opening for civil traffic. Aircraft operators seem now (in September 2014) to have adopted the more efficient routings that were made available,
no adjustment has been made on the flows to/from Egypt-related as the July 2014 number of flight is now at the same level as in July 2013—which is assumed to be a sign of recovery of traffic, just one year after the renewed civil unrest started (August 2013),
no adjustment has been applied to the flows between Russian Federation and Southern Europe for the next seasons (in previous forecast, boosts for next Winter and Summer had been applied to reflect the dynamism of the flow) as the Russia-Ukraine crisis has a negative impact on them.
The assumptions presented here have been constructed solely in support of the forecast and do not represent any political view of EUROCONTROL.
9 Airlines schedules from INNOVATA (September 2014).

7-year IFR Flight Movements and Service Units Forecast Update: 2014-2020
FINAL
EUROCONTROL/NMD/STATFOR Page 25
4. GROWTH IN IFR FLIGHTS TO 2020
The new forecast is for 11.2 million IFR flight movements (±0.9 million) in Europe in 2020, 19% more than in 2013. The first year of the forecast expects a growth in traffic with 1.8% (±0.3 pp), an upwards revision on previous forecast as traffic has been growing at higher-than-expected rates since the beginning of the Summer (compared to the same period in 2013). These high-level figures, however, hide large local differences notably in the South-East axis.
From 2015 onwards, European flight growth is expected to be back at around 2.7% per year. The 2008 peak of traffic of 10.1 million flights is forecasted to be reached again by 2016; an 8-year hiatus as already stated in the two previous flight forecast publications.
Any user of the forecast is strongly advised to consider the low-to-high ranges.
Figure 24. Summary of the forecast for Europe.
ESRA08 2010 2011 2012 2013 2014 2015 2016 2017 2018 2019 2020
AAGR 2020/ 2013
RP1 2014/2011
AAGR
RP2 2019/2014
AAGR
IFR Flight Movements (Thousands)
H . . . . 9,648 10,013 10,436 10,812 11,196 11,604 12,052 3.5% -0.5% 3.8%
B 9,493 9,784 9,548 9,447 9,622 9,852 10,131 10,366 10,600 10,900 11,240 2.5% -0.6% 2.5%
L . . . . 9,595 9,665 9,761 9,847 9,967 10,100 10,247 1.2% -0.6% 1.0%
Annual Growth (compared to previous year unless otherwise
mentioned)
H . . . . 2.1% 3.8% 4.2% 3.6% 3.5% 3.7% 3.9% 3.5% -0.5% 3.8%
B 0.8% 3.1% -2.4% -1.1% 1.8% 2.4% 2.8% 2.3% 2.3% 2.8% 3.1% 2.5% -0.6% 2.5%
L . . . . 1.6% 0.7% 1.0% 0.9% 1.2% 1.3% 1.5% 1.2% -0.6% 1.0%
More detailed results are provided in Annexes B, C and D to support this overview. The forecast details per States for the 2-year horizon are shown in
Figure 25 and Figure 26; and in Figure 27 for the 7-year horizon.
4.1 Short-term outlook (2014-2015)
Since the previous forecast published in February, higher-than-expected number of flights during Summer was observed. Moreover specific events have changed the traffic patterns hence the forecasts in most States along the South-East and South-West axes and we assume they continue to 2020. At European level, the flight forecasts have been revised upwards (+0.6pp) to a growth of 1.8%(±0.3 pp) for 2014 and downwards (-0.3pp) to a growth of 2.4% (±1.3 pp) for 2015.
If the economic forecast has hardly changed for Europe (see Section 3.1), the local traffic10 this Summer has been at or beyond the top end of the February forecast, especially in Southern Europe states (Greece, Turkey, Lisbon FIR, Canary Islands, Spain and Italy) but also in busiest states (e.g., UK, Belgium/Luxembourg). To these sustained traffic10 growth trends for Europe, corresponding to 2% flight increase for 2014 so far (on same period in 2013), have been added the airlines' intentions for this Winter and the next Summer.
As developed previously (see Section 2.1), the outlook for this Winter—from schedules and company reports---is for a lower growth than the current year-to-date rates.
On top of the recent and expected traffic trends, specific events (see Section 3.2) have changed traffic patterns since April 2014, especially the overflight traffic. Even if the net effect of the changes at European level is small, the re-routings over the South-East axis (Russia-Ukraine crisis and KFOR sector re-opening since April 2014) and over South-West axis (Libyan closure since August 2014) have influenced the future traffic growth in Southern Europe.
10
Total flights excluding overflights.

7-year IFR Flight Movements and Service Units Forecast Update: 2014-2020
FINAL
EUROCONTROL/NMD/STATFOR Page 26
South-West axis:
For 2014, forecast for Spain and Lisbon FIR forecasts have been revised upwards due to higher-than-expected local traffic. Canary Islands and Azores forecasts have however been revised downwards as the previous shift in tourist flows from Egypt to Spanish/Portuguese Islands seems to tail off with recovery of traffic in Egypt. The 2015 flight forecast for all these States remained mostly unchanged compared to the February publication.
Forecast for Malta has strongly been revised downwards in 2014 to -5.7% and 2015 to -1.2% as the closure of Libyan airspace resulted in overflight losses with respect to the North-South flows (e.g., North-West Europe to South Africa).
South-East Axis:
Since the February forecast, the KFOR sector has re-opened and most aircraft operators have now opted for the more efficient routes made available since April 2014. The changes came faster than previously11 expected, leading to upwards revision of 2014 forecasts for Croatia, Greece, Slovenia, Bosnia-Herzegovina, Serbia&Montenegro.
As far as the airspace unavailability over Eastern Ukraine is concerned, the vast majority of flows between North-West Europe and Middle-East/Asia-Pacific have been re-routed via more southerly routes. Forecasts for 2014 and 2015:
Double-digit growth is expected in 2014 for Bulgaria, Romania, Slovakia, Hungary and Turkey, and rates ranging from 4% to 6% for 2015 (upwards revisions on February forecast),
Relative stability (Azerbaijan) or modest growth (Georgia and Armenia) in 2014 (downwards revisions on February),
Severe reductions in Ukraine (-32%, related to losses in all flows) and Moldova (-15%) in 2014, followed by no growth in Ukraine and an artificial rebound for Moldova (+11%) in 2015 (downwards revisions on February).
North-West axis or Other
Out of the busiest States, the forecast for Germany has been revised upwards (higher-than-expected traffic, all flows considered) to 1.7% in 2014, although this does not include the effects of revised unit rates (see section 4.5). France and UK forecasts have also been revised upwards by 0.8 pp to 2.3% and 1.6% respectively. Forecast for Austria has been revised upwards to +3.5% for 2014, partly benefiting from the re-routed flights avoiding Eastern Ukraine.
In 2015, North-West European States will see growth rates ranging from 2% to 3%, back to a relative stability of rates.
Europe as a whole,
2014 forecast for Europe is now for a 1.8% (±0.3 pp) flight growth, see Figure 25, an upwards revision of 0.6 percentage points compared to the February forecast,
2015 forecast for Europe is now for a 2.4% (±1.6 pp) flight growth, see Figure 26, a slight downwards revision of 0.3 percentage point compared to the February forecast (balancing out part of the extra growth now expected in 2014). Traffic growth rates are expected be more homogeneous across North-West Europe.
11
In the February forecast, a gradual scenario over 7 months was developed.

7-year IFR Flight Movements and Service Units Forecast Update: 2014-2020
FINAL
EUROCONTROL/NMD/STATFOR Page 27
Figure 25. Flight forecast details for 2014.
Figure 26. Flight forecast details for 2015.

7-year IFR Flight Movements and Service Units Forecast Update: 2014-2020
FINAL
EUROCONTROL/NMD/STATFOR Page 28
4.2 Medium-term outlook (up to 2020)
After 2015, traffic growth in Europe stabilises at around 2.6% increase per year, showing higher annual rates in 2016 and 2020 but these are due to the extra growth from the leap year effect. In fact, when comparing average daily traffic growth rates, the growth rate of 2.4%-2.6% per year in the 2015-2017 horizon will slow down in 2018 (+2.3%) due to the lack of capacity in the European network because of the airport capacity constraints placed upon the European network. However, the new airport in Istanbul, to open in 2019 in this forecast will partially lift the constraints and growth rates will accelerate averaging at rates of 2.8% in the 2019-2020 horizon (after removing the 2020 leap-year effect, see Figure 1 or Section 4).
Any user of the forecast is strongly advised to use the forecast range (low-growth to high-growth) as an indicator of risk. This forecast includes downside risks (e.g. capacity reductions in response to weaker demand) and upside risks (e.g. current high load factors might not be able to absorb the passenger demand when traffic begins to grow again). These are discussed in Section 6. By 2020, the high-growth scenario has 0.8 million more and low-growth scenario 1 million fewer flights than the base scenario.
As Figure 27 shows, the growth is not uniform across Europe. While the growth (in percentage terms) is much weaker in the more mature markets of Western Europe, it is still the busiest States (France, Germany followed by Italy, Spain and UK) which will see the greatest number of extra flights per day (Figure 28). Turkey will both see the fastest growth rates (7.2% as average annual growth rate over the 7 years) and the highest number of extra flights per day (1,945 additional flights per day in 2020), being the biggest contributor to the growth in Europe.
Figure 29 shows the corresponding Figure 27 at functional airspace block level (FAB). Danube FAB is expected to have the highest average annual growth rate (5.1%, ±2 pp) over the next seven years. FABEC, the busiest European FAB, UK-Ireland FAB and NEFAB will experience more limited average annual growth rates of around 2% by 2020.
Annexes C and D give the details of forecast traffic and growth per State and areas (FAB, EU28…).
Figure 27. Average Annual Growth of Flights per State, 2020 v 2013.

7-year IFR Flight Movements and Service Units Forecast Update: 2014-2020
FINAL
EUROCONTROL/NMD/STATFOR Page 29
Figure 28. Number of additional movements per day for each State (2020 v 2013).
Figure 29. Average Annual Growth in Flights per FAB, 2020 v 2013.

7-year IFR Flight Movements and Service Units Forecast Update: 2014-2020
FINAL
EUROCONTROL/NMD/STATFOR Page 30
4.3 Comparison with previous forecast
Globally, the baseline forecast is in line with the February 2014 forecast (see Ref. 1), moreover, the uncertainty around high and low scenarios has been reduced in the first years.
Figure 30 illustrates that the current forecast (MTF14b) for total Europe starts at slightly higher levels than the seven-year forecast released in February 2014 (MTF14, see Ref. 1). The first two years of the forecast show narrower low-to-high ranges because the uncertainty has now been reduced in the short-term.
Figure 30. For total Europe, current forecast is aligned with previous forecast (dated February 2014), with narrower short-term uncertainty.
Since the recent events affecting the traffic developments (mainly the Russia-Ukraine crisis and the Libyan Airspace closure, described in Section 3.2) are uneven across Europe, differences at State level are more profound.
Figure 31 depicts the size of the revisions in the forecast for total traffic per State in 2020. The largest part of these revisions is due to events already in 2014 with effects carried forward into the later years due to the assumption of no end to these events prior to 2020 (though see Section 4.4 for our what-if exploration of the alternative, and probably more likely case of restoration). The biggest revisions on both sides (downwards for Ukraine, Moldova, Malta; upwards for Bulgaria, Romania, Slovakia, Hungary) are related to recent development in the overflight traffic and further illustrate the sensitivity of the forecast to changes in network and route choice.
Figure 31. Forecast revision for 2020 per State (comparison February: MTF14 vs September 2014: MTF14b forecasts).

7-year IFR Flight Movements and Service Units Forecast Update: 2014-2020
FINAL
EUROCONTROL/NMD/STATFOR Page 31
4.4 What-if? restoration of pre-Ukraine closure routings
We examined the effect of re-routings following the Russia-Ukraine crisis with a what-if? analysis. This showed a potential in 2020, following a return to ‘normal routing’, for some States to gain flights (Ukraine +38%, Moldova +17%, Azerbaijan +6%) while others lose flights (Bulgaria -18%, Romania -15%, Slovakia -10%, Hungary -8%). Even if we believe this restoration to have high probability, these changes are not built into the published forecast, but provided to support analysis of risk.
The forecast is sensitive to network changes and to changes of choice of route through the network. This represents a risk which can be on the up-side for some states and conversely on the down-side for others. See section 6 for a broad discussion of risks, including re-routing.
As shown in Section 2.1, routings on the network remain disrupted following the Russia-Ukraine crisis. In particular there are significant re-routings avoiding totally or partially Ukraine in the flow North-West Europe to Middle-East, North-West Europe to Asia/Pacific and Russia to Egypt. The main forecast assumes that these re-routings will remain at least until end of 2020. However we ran a what-if? analysis to estimate the effects of a potential re-opening of the airspace in 2015 (return to routing patterns observed over Ukraine prior to the Russia-Ukraine crisis). Our what-if? method uses the routing patterns across Europe of 2013 and apply them to route the flights through the network over the 7 years leaving the AP2 forecast unchanged. This section describes the results of that what-if? analysis focusing on the Eastern part of Europe.
For total Europe (ESRA08), the date of the end of the Russia-Ukraine crisis has very limited impact on total traffic. Only the Arrival, Departure and Internal flows of Ukraine (very limited share of the total traffic in ESRA08) differ.
The differences at State level are more profound since the overflight flows crossing Ukraine would return faster to normality in the what-if? analysis. As shown in Figure 32, Ukraine is estimated to see a 38% increase in flights in 2020 (more than 450 flights per day, see Figure 33) if flows returned to their pre-Russia-Ukraine crisis patterns as of 2015. Figure 32 shows the percentage difference in movements between the what-if? analysis and the published forecast for all States surrounding Ukraine. Figure 33 gives an indication of the difference in daily total number of flights.
Figure 32. Total change in percentage per State after full restoration to flows pre-Russia-Ukraine crisis (only States within the zone of interest).

7-year IFR Flight Movements and Service Units Forecast Update: 2014-2020
FINAL
EUROCONTROL/NMD/STATFOR Page 32
Figure 33. Total change in daily flights per State after full restoration to flows pre-Russia-Ukraine crisis (only States within the zone of interest).
4.5 What-if? Increase of Unit Rates in Germany
We examined the effect of re-routings if the German unit rates were to increase by 30% in 2015 with a what-if? analysis. This showed a potential, when compared to 2014 unit rates, for Germany to see a reduction in its number of overflight as well as an overall decrease in distance flown. These changes are not built into the published forecast, but provided to support analysis of risk.
National states’ unit rates for en-route charges for the next year are discussed at the Enlarged Committee each year at the June session and frozen at the November session. This year, Germany has introduced a proposal for a 30% increase in its unit rates for 2015 at the June session.
Routings on the network are influenced by the route charges. The EUROCONTROL route charge is calculated by reference of three basic elements: aircraft weight factor, distance factor, unit rate of charge (for each Charging Zone). Keeping the weight factor constant and assuming the aircraft operators would opt for the minimum en-route cost routing option, we have assessed the influence of unit rates on the distance flown. This section focuses on answering a simple question: what-if the German rates were to increase by 30% in 2015 (vs 2014)?
An ad-hoc simulation using the EUROCONTROL modelling tool NEST has been performed to compare the impact of the changes in unit rates in Germany. The analysis is based on one week of traffic (7 days between the 8th of May and the 14th of May 2014, AIRAC cycle 1405). Two scenarios have been simulated using the cheapest routing method in NEST: scenario “2014 UR” using the 2014 unit rates for each state and scenario “2015 UR” using the initial estimates for 2015 for each state (communicated during the 102nd meeting of the Enlarged Committee). For all the simulations, the average cost of distance flown has been set to €9.4 as defined in the standard inputs for EUROCONTROL Cost Benefit Analyses12.
For each scenario, we have analysed the number of flights and the distance flown per flight within the German airspace over 7 days. Figure 34 shows the results of this analysis. These results are purely based on this theoretical “cheapest routing” option and do not prejudge of the strategy the airlines would put in place.
12
Edition number 6.0, dated September 2013.

7-year IFR Flight Movements and Service Units Forecast Update: 2014-2020
FINAL
EUROCONTROL/NMD/STATFOR Page 33
The analysis shows that the proposed increase of the German unit rates next year would lead to:
a 4% reduction in overflights (when compared to current unit rates) in Germany,
a decrease of the average distance flown per overflight (-3.7%) for the flights still entering the German airspace,
a 7.4% reduction in total distance flown (one week of traffic) for overflights reflecting both the losses in number of flights and average distance flown,
Slight decrease (<1%) in average distance flown for arrival/departure flows.
Typical flows where changes in routing are observed in Germany are shown in Figure 35.
Figure 34. Differences in route length and number of flights for Germany.
Germany Avg Distance flown Total Distance Flown Nb Flights
(NM) (million NM) N
Scenario Flows13
176.5 5.7 32,030 2014 Unit Rates ADI AD
I 226.9 1.6 7,135
O 213.8 5.1 23,618
Total (DAIO) 196.3 12.3 62,783
2015 Unit Rates
(initial proposals)
175.3 5.6 32,030 ADI AD
I 226.9 1.6 7,135
O 206.0 4.7 22,667
Total (DAIO) 192.5 11.9 61,832
Difference
(2015 proposed rates vs 2014 rates) ADI AD -0.7% -0.6% 0.0%
I 0.0% 0.0% 0.0%
O -3.7% -7.4% -4.0%
Total (DAIO) -1.9% -2.9% -1.5%
Overall, we see that the initial proposed increase of unit rates for Germany as potentially decreasing traffic, especially for Germany around 2.9% reduction in total km flown, reducing number of flights by 1.5% and average distance flown by 1.9%. Since overflights generate 10 service units in Germany compared to 4 for all flights, the 7% reduction in overflight distance is an important indicator of the changes in income.
13
ADI: Arrival/Departure/Internal, O: Overflight.
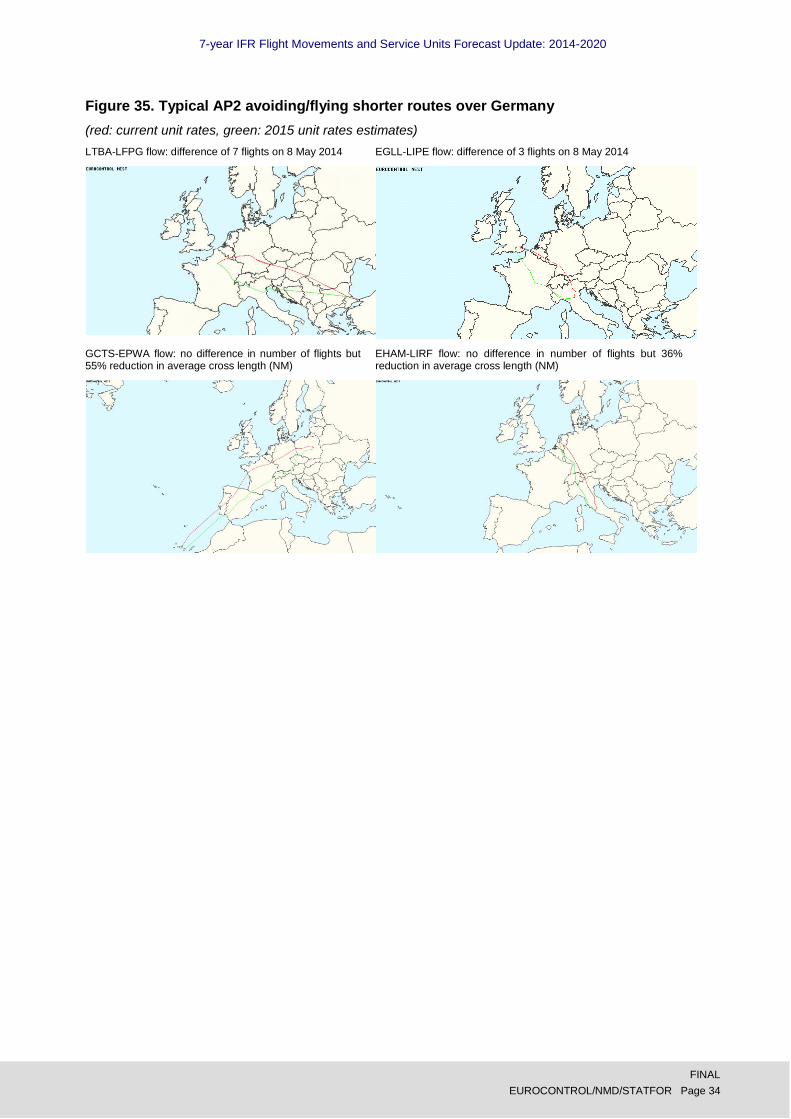
7-year IFR Flight Movements and Service Units Forecast Update: 2014-2020
FINAL
EUROCONTROL/NMD/STATFOR Page 34
Figure 35. Typical AP2 avoiding/flying shorter routes over Germany
(red: current unit rates, green: 2015 unit rates estimates)
LTBA-LFPG flow: difference of 7 flights on 8 May 2014
EGLL-LIPE flow: difference of 3 flights on 8 May 2014
GCTS-EPWA flow: no difference in number of flights but 55% reduction in average cross length (NM)
EHAM-LIRF flow: no difference in number of flights but 36% reduction in average cross length (NM)
7-year IFR Flight Movements and Service Units Forecast Update: 2014-2020
FINAL
EUROCONTROL/NMD/STATFOR Page 35
5. SERVICE UNIT GROWTH TO 2020
In 2014, 131.3 million service units are expected to be produced. This is a 2.1 percentage points revision compared to the February 2014 forecast. The cause of this is threefold: the upwards revision in the flight forecast, the continuing increasing trend in weights and a substantial level of additional flights crossing over the CRCO11 states as a result of the airspace closures since spring 2014. For 2015 and the following years, the higher growth rates are faded out and this recent forecast falls within the high-low forecast range published in the February 2014 forecast. The RP2 average annual growth rate of 2.9% for the states participating the Performance Scheme remains at the level of the February 2014 publication.
5.1 En-route Service units (TSU)
Following the upward revision in the flight forecast, en-route service units are expected to end 2014 higher than expected in the forecast of February 2014. This is mainly for the same reasons as for the flight forecast changes but also by additional overflights and flights added to the states in the CRCO11 since the beginning of the Russia-Ukraine crisis. Ukraine and Moldova have seen their overflights decreasing and shifting more southerly over CRCO11 area, due to the unavailable airspace in Ukraine. Thirdly, service units also continue to grow faster than flights caused by a general trend in increasing average weights.
In 2014, 131.3 million service units (TSU) are expected to be produced. This is 5.7% more than in 2013 and a revision up by 2.1 percentage points compared to the February 2014 forecast (February was 3.6%). This revision is not only resulting from the upwards revision in flights, but amplified by the accelerating weight trend (see Section 2.1 and Figure 16). The 2014 flight forecast for Europe (ESRA08) has been revised upwards by 0.6 percentage point from 1.2% (in the previous release) to 1.8%.
Years 3 to 7 of the forecast have been fully updated and take into account new routings, average weight and distance levels resulting from the recent events in Europe such as described in Section 3.2.
The total en-route service units in the participating EUROCONTROL member states (CRCO11) are expected to grow by 3.9% (±1.7 pp) in 2015 compared to 2014 and reach 136.4 million. This is a slight upwards revision compared to the 3.7% growth that was expected in February 2014. The service units will end 3.1 million higher than expected in the February 2014 forecast.
The acceleration of growth compared to the February 2014 forecast slows after 2015. The TSU are expected to be higher by around 4.6 million in 2019 than previously forecast, reaching in total 154.8 million in 2019. For those States participating in the Performance Scheme, the average annual growth in RP2 (2019 versus a baseline year of 2014) is 2.9% (±1.5 pp), slightly up from the 2.8% per year from the February forecast.
Finally, by 2020, the TSU are expected to reach 159.9 million representing a baseline scenario average growth of 3.7% per year from 2013 and a total growth of 28.7% compared to 2013.
Figure 36 compares the evolution of the forecast between the February 2014 forecast and this new forecast release for the CRCO11 grouping. The TSU forecast for the first year has been adapted upwards by an additional 2.1 percentage points. As from 2015 onwards, TSU have been marginally revised upwards by 0.2 percentage point in the first year and less in the consequent years, resulting in overall higher TSU forecast from 2015 onwards. The TSU in 2020 is foreseen to be 0.2 percentage point lower than in the February 2014 forecast. This variation from forecast to forecast is well within the low-to-high-scenario range, except for the first year 2014 (5.7% new forecast vs. February high scenario of 5.1%).

7-year IFR Flight Movements and Service Units Forecast Update: 2014-2020
FINAL
EUROCONTROL/NMD/STATFOR Page 36
Figure 36. Comparison 2013-2020 of the forecast between the current TSU forecast and February 2013 for CRCO11 Area.
Any user of this seven-year forecast should consult the entire forecast range (low-growth to high-growth) as an indicator of risk. Despite the revisions to the CRCO11 forecast just described, the 2020 forecast is well within the low-high range of the previous forecast (Figure 36) This forecast includes downside risks (e.g. the economic indicators could worsen) and upside risks (e.g. high load factors could trigger higher traffic numbers sooner-than-expected). Section 6 elaborates further on risks.
For the TSU, by 2020, the high-growth scenario has 13.8 million more and low-growth scenario has 15.3 million fewer TSU than the base scenario (+11% and -12% in terms of growth respectively).
The average annual growth figures per State can be found in Figure 38. The detailed forecasts for each State are in Annexes F and G. Note that the definition “PScheme” does not show in the report anymore and is replaced by RP1Region and RP2Region, which now includes Croatia. RP1Region corresponds to the former “PScheme” and is still reported on to enable a comparison with previous forecast.
Figure 37. Summary of forecast of total service units in Europe.
Total en-route service units (Thousands)
2010 2011 2012 2013 2014 2015 2016 2017 2018 2019 2020
2020/ 2013 Total
Growth
RP1 2014/ 2011
AAGR
RP2 2019/ 2014
AAGR
CRCO11*
H . . . . 131,855 139,239 146,688 153,101 159,383 166,325 173,710 40% 2.3% 4.8%
B 117,393 123,211 121,589 124,162 131,273 136,409 141,289 145,476 149,847 154,796 159,869 29% 2.1% 3.4%
L . . . . 130,685 133,446 135,474 137,399 139,675 142,013 144,565 16% 2.0% 1.7%
RP1Region†
H . . . . 110,465 116,091 121,739 126,492 131,389 136,564 141,902 35% 1.7% 4.3%
B 100,579 105,126 103,572 105,235 109,999 113,806 117,339 120,306 123,508 127,009 130,578 24% 1.5% 2.9%
L . . . . 109,528 111,399 112,647 113,842 115,321 116,846 118,509 13% 1.4% 1.3%
RP2Region†
H . . . . 112,212 117,955 123,707 128,552 133,537 138,810 144,260 35% 1.7% 4.3%
B 102,030 106,761 105,251 106,930 111,736 115,619 119,214 122,239 125,500 129,069 132,710 24% 1.5% 2.9%
L . . . . 111,255 113,161 114,431 115,650 117,158 118,713 120,410 13% 1.4% 1.3%

7-year IFR Flight Movements and Service Units Forecast Update: 2014-2020
FINAL
EUROCONTROL/NMD/STATFOR Page 37
Total en-route service units
(Growth) 2010 2011 2012 2013 2014 2015 2016 2017 2018 2019 2020
2020/ 2013 Total
Growth
RP1 2014/ 2011
AAGR
RP2 2019/ 2014
AAGR
CRCO11*
H . . . . 6.2% 5.6% 5.4% 4.4% 4.1% 4.4% 4.4% 4.9% 2.3% 4.8%
B 3.5% 5.0% -1.3% 2.1% 5.7% 3.9% 3.6% 3.0% 3.0% 3.3% 3.3% 3.7% 2.1% 3.4%
L . . . . 5.3% 2.1% 1.5% 1.4% 1.7% 1.7% 1.8% 2.2% 2.0% 1.7%
RP1Region†
H . . . . 5.0% 5.1% 4.9% 3.9% 3.9% 3.9% 3.9% 4.4% 1.7% 4.3%
B 2.6% 4.5% -1.5% 1.6% 4.5% 3.5% 3.1% 2.5% 2.7% 2.8% 2.8% 3.1% 1.5% 2.9%
L . . . . 4.1% 1.7% 1.1% 1.1% 1.3% 1.3% 1.4% 1.7% 1.4% 1.3%
RP2Region†
H . . . . 4.9% 5.1% 4.9% 3.9% 3.9% 3.9% 3.9% 4.4% 1.7% 4.3%
B 2.7% 4.6% -1.4% 1.6% 4.5% 3.5% 3.1% 2.5% 2.7% 2.8% 2.8% 3.1% 1.5% 2.9%
L . . . . 4.0% 1.7% 1.1% 1.1% 1.3% 1.3% 1.4% 1.7% 1.4% 1.3%
* CRCO11 designates the sum over all the states participating in the Multilateral Route Charges System in 2012 of all TSU either measured or forecasted for the corresponding year. See Annex A. † RP1Region stands for the sum over all the 30 states that are currently involved in the EU-wide performance target setting minus Croatia (28 EU member states plus Norway and Switzerland minus Croatia). RP2Region is RP1Region plus Croatia.
Figure 38. Average annual growth of service units between 2013 and 2020

7-year IFR Flight Movements and Service Units Forecast Update: 2014-2020
FINAL
EUROCONTROL/NMD/STATFOR Page 38
5.2 What-if? restoration of pre-Ukraine closure routings
We examined the effect of re-routings on service units following the Russia-Ukraine crisis with a what-if?-analysis. This showed a potential in 2020, following a return to ‘normal routing’, for some States to gain service units (Moldova +74%, Ukraine +60%) while others lose TSU (Bulgaria -16.6%, Bosnia -11.5%, Slovenia -5.9%, Turkey -5.5%). The CRCO11 area is estimated to lose around 2% in Service units by 2020 as the currently rerouted Ukrainian overflights (not in the CRCO11 region) return to their pre-incident routings. These changes are not built into the published forecast, but provided to support analysis of risk.
The service unit forecast is sensitive to network changes and to changes of choice of route through the network. The number of flights is influenced by these network changes, but there might be an additional effect on the average distance and weight factors. This represents a risk which can be on the up-side for some states and conversely on the down-side for others.
A what-if scenario for Ukraine restoration, similar to the what-if scenario for flights as described in Section 4.4, was applied to service units.
The main forecast assumes that the re-routings such as described in Section 2.1, will remain at least till end of 2020. The what-if?-analysis estimates the effects of a potential re-opening of the airspace in 2015. The what-if?-method for service units uses the what-if flight forecast (based upon traffic routing patterns of 2013) combined with 2013 weight and distance averages. This section describes the results of that what-if?-analysis focusing on the Eastern part of Europe.
Similar to the what-if scenario for flights, for total Europe, the date of the end of the Russia-Ukraine crisis has very limited impact on total traffic. However, the total service units for the states in the CRCO11 region are estimated to be 2% lower for the what-if scenario in 2020. CRCO11 does not include Ukraine, which will see its overflights, currently re-routed over the CRCO11 area, return to previous routes.
Similar to the conclusions drawn for flights from the what-if? analysis, differences at State level are observed when overflight flows crossing Ukraine would return to normality. So within Europe, some States would benefit from this while others would lose. Figure 39 shows the percentage difference in service units between the what-if? analysis and the published forecast for all States surrounding Ukraine. As shown, Moldova is estimated to have the potential for a 74% increase in number of service units in 2020 if flows returned to their pre-Russia-Ukraine crisis patterns as of 2015. Ukraine has a potential of 60% increase in number of service units. These potential gains and losses per State must be treated cautiously as this is only one possible scenario. The results are approximate and might vary and be subject to possible new evolutions in the Russia-Ukraine crisis.
Figure 39 Total change in Service Units in percentage per State after full restoration to flows pre-Russia-Ukraine crisis (only States within the zone of interest).

7-year IFR Flight Movements and Service Units Forecast Update: 2014-2020
FINAL
EUROCONTROL/NMD/STATFOR Page 39
5.3 Terminal Navigation Service units (TNSU)
Growth in TNSU is driven by the same factors which influence flight growth (see Section 2.1) with the trend for increasing average weight having an additional effect. This TNSU forecast is based on the 2013-2020 IFR flight forecast (Section 2.1) and uses the CRCO flight database for all States except for Estonia which provided STATFOR with its own data, to capture the necessary information about weight of the aircraft. More details about the TNSU forecast method can be found in Ref. 3. The definition of the terminal charging zones (TCZ) is based on the known list of airports per TCZ for RP2 provided by States as available in their RP2 performance plans submitted in June 2014 (see Annex A for RP2 region definition and TCZ list). The detailed results per TCZ are given in Annex H.
The expected AAGR for RP2 is 2.7% and by 2020, after the end of the reference period, 8.5 million TNSU are expected for the whole region (Figure 40). With the aim of improving the forecast for RP2, the history for RP1 was reconstructed as detailed in Annex H. It is due to this modification that the growth of 0.3% for 2014 is relatively weak, especially when compared to the growth in flights of 2.1% for EU28 in 2014 (see Annex D).
Figure 40. Total Terminal Navigation Service Units generated in the RP2Region area as defined.
RP2 Region
2010 2011 2012 2013 2014 2015 2016 2017 2018 2019 2020
AAGR RP1
2014/ 2011
AAGR RP2
2019/ 2014
TNSU Total
(thousands)
High . . . . 7262.0 7554.0 7904.5 8186.6 8527.4 8851.9 9194.9 -0.4% 4.0%
Base 6795.2 7376.4 7234.2 7222.2 7245.8 7440.7 7659.9 7842.6 8050.9 8265.6 8511.8 -0.4% 2.7%
Low . . . . 7229.5 7301.4 7368.7 7435.0 7532.3 7633.9 7757.9 -0.5% 1.1%
TNSU Annual Growth
(%)
High . . . . 0.6% 4.0% 4.6% 3.6% 4.2% 3.8% 3.9% -0.4% 4.0%
Base . 8.6% -1.9% -0.2% 0.3% 2.7% 2.9% 2.4% 2.7% 2.7% 3.0% -0.4% 2.7%
Low . . . . 0.1% 1.0% 0.9% 0.9% 1.3% 1.3% 1.6% -0.5% 1.1%

7-year IFR Flight Movements and Service Units Forecast Update: 2014-2020
FINAL
EUROCONTROL/NMD/STATFOR Page 40
6. RISK TO THE FORECAST GROWTH
Users of the forecasts are strongly advised to use the forecast range (low-growth to high-growth) as an indicator of risk. These flight and service unit forecasts are prepared in conditions of large changes in traffic routings. For many individual States, these are the biggest risks for traffic growth.
The main sources of uncertainty in the intermediate forecast are as follows.
In percentage terms for individual States, the biggest risks concern the route choices of airlines,
which are generally downside risks for some States and simultaneously upside risks for others, balancing out across Europe as a whole:
By 2020 there is a significant probability that flights through Eastern Ukraine, if not through its
southern airspace, will be restored. Section 4.4 discusses the impact of this risk, which ranges from +38% to -15% in terms of flights.
Closure of Libyan airspace has reduced Maltese overflights as well as re-routed traffic to
southern Africa. It is not clear when normal patterns will be restored.
Unit rates are one of the many factors that influence an airline’s choice of route. Proposed,
large changes in rates for 2015 could lead to low single-figure percentage changes in flight counts. The probability of this risk is high, it is the scale of the impact here which is more uncertain.
Currently, the Syrian conflict is having an important impact on overflights across South-East
Europe. We have not included an end to this in our scenario, though clearly at some point this network disruption will clear and the overflight changes reverse. Section 4.4 in the February forecast described a detailed what-if? study of this risk.
Previous years have seen persistent (many months) reduction in en route capacity as a result of the introduction of new ATC systems. This results in tactical and strategic re-routing of
traffic, enough to affect annual totals. More changes are on the way, presenting further risks, for example Spain, Norway and Turkey have changes planned.
The jet stream influences route choice too, though this is more usually an effect over days or
weeks than over the whole year. 2013 saw an unusual pattern for the jet stream, leading to more southerly routings that in the past. We have not adjusted the data for this, nor modelled a future restoration.
More generally, future network changes (e.g., new routes) and airlines’ changing choice of
routes are not modelled by the forecast.
The economic forecasts used here were updated in August 2014. The economic outlook
remains uncertain and 2014 is yet another year in which initial optimism has dwindled as the year has gone on. The low scenario provides some guidance here. Economic risks are to some extent synchronised, so do not balance out across Europe as routing risks do.
Two States, Turkey and Russia, have been the predominant drivers of flight growth in recent years. This makes growth sensitive to the continued expansion of these two economies.
Sanctions on Russia, and Russia's response to them, is part of the reason for the decline in traffic from Russia (see section 2). This could improve, but could easily get worse, representing on balance a downside risk.
On the other hand, there are growing competitive pressures for expansion, especially for low-cost carriers, so as aircraft deliveries accelerate we could see more rapid expansion, although in our
view this is likely to be localised. The high scenario provides some guidance for this, but only for local, not widespread application.
Load factors remain at or near record highs (Section 2). As traffic begins to grow again, this
means that load factors might be able to absorb less of the passenger growth than they have in past years. From the present position, the recovery would then come more rapidly than anticipated. This is therefore an upside risk.
We analysed the current airline schedules, but did not find them as a whole credible indicators of
Winter traffic, so excluded them from this forecast. In parts, where we could cross-validate

7-year IFR Flight Movements and Service Units Forecast Update: 2014-2020
FINAL
EUROCONTROL/NMD/STATFOR Page 41
against other information, we used partial information. Nevertheless, airlines are likely to adapt their plans as the Winter approaches and progresses. This is on balance a downside risk, based on previous airline behaviour, and signals of fragility of some operators in spite of a profitable Summer.
Tourism trends are quite variable. The forecast does not identify which will be the new holiday
“destination of preference” in a given year. The recent political instability in both Egypt and Tunisia has led to more variability in tourism destinations. On the whole this is more likely an upside risk (a faster recovery than in our scenarios, see Section 3.2).
Oil prices remain changeable with oil being increasingly an item of speculation and investment,
and with the recent rapprochement of Iran and the US. With fuel accounting for 25-35% or even more of costs of the airlines, this can have an effect on fares and cost of travel for customer (see Section 2.1).
Terrorist attacks, wars and natural disasters. In the 6 months since the last forecast mentioned
a further volcanic eruption or pandemic being some of the risks, both have occurred. The impact on air traffic could be a temporary one, or more significant; in the case of Ebola, the situation sadly looks set to get much worse before it gets better, although the direct impact on flights should remain limited.

7-year IFR Flight Movements and Service Units Forecast Update: 2014-2020
FINAL
EUROCONTROL/NMD/STATFOR Page 42
7. GLOSSARY
AAGR Average annual growth
AD, A/D Arrivals/Departures
AIRAC Aeronautical Information and Regulation and Control
AEA Association of European Airlines
B (in tables) Baseline Scenario
CRCO11 Current states participating to the Multilateral Route Charges System
ESRA Eurocontrol Statistical Reference Area (see Annex A.1)
EU27 European Union (27 States)
EU28 European Union (28 States): EU27 plus Croatia.
FAB Functional Airspace Block
FIR Flight Information Region
GDP Gross Domestic Product
H (in tables) High-Growth Scenario
I Internals
ICAO International Civil Aviation Organisation
IFR Instrument Flight Rules
KFOR Kosovo Force
L (in tables) Low-Growth Scenario
MTF Medium-Term (Seven-Year) Forecast
MTF13b September 2013 publication of the MTF
MTF14 February 2014 publication of the MTF
MTF14b September 2014 publication of the MTF
NM Network Manager
O Overflights
OE Oxford Economics Ltd
pp percentage point
PScheme States involved in the Performance scheme first period of reference (EU27, Norway and Switzerland – no longer used)
RP1 First Period of Reference (2012-2014) for the Performance Scheme of the SES
RP2 Second Period of Reference (2015-2019) for the Performance Scheme of the SES
RP1Region See PScheme
RP2Region States involved in the Performance scheme second period of reference (EU28, Norway and Switzerland)
SES Single European Sky
SID STATFOR Interactive Dashboard
STATFOR Eurocontrol Statistics and Forecast Service
TCZ Terminal Charging Zone (a grouping of airports)
TNSU Terminal Navigation Service Units
TSU Total En-Route Service Units
TZ Traffic Zone (≈State, except for Spain, Portugal, Belgium and Luxembourg, Serbia and Montenegro)
UIR Upper Flight Information Region

7-year IFR Flight Movements and Service Units Forecast Update: 2014-2020
FINAL
EUROCONTROL/NMD/STATFOR Page 43
A. Traffic Region Definitions
ESRA08 The EUROCONTROL Statistical Reference Area (ESRA) is designed to include as much as possible of the ECAC area for which data are available from a range of sources within the Agency. It is used for high-level reports from the Agency, when referring to 'total Europe'. The ESRA changes only slowly with time; a region is added to the ESRA only when there is a full year's data from all sources, so that growth calculations are possible. ‘ESRA08’ was introduced in the MTF09 report. It is now used as a basis for comparison at European level in the forecasts. Note that the EUROCONTROL forecast includes also regions outside of the ESRA (e.g., Armenia and Latvia), though still within ECAC.
Figure 41. The EUROCONTROL Statistical Reference Area.
ESRA08 consists of 34 traffic zones. Traffic zones are defined by an aggregate of FIRs & UIR of States. These do not take delegation of airspace into account. For individual States, the differences between charging areas and ACCs can have a big impact on overflight counts (and thus on total counts where the total is dominated by overflights). For the ESRA as a whole, there is only a small proportion of overflights, so that the difference between a FIR and an ACC definition is small.
Traffic regions The traffic regions are defined for statistical convenience and do not reflect an official position of the EUROCONTROL Agency. As far as possible, these regions have been aligned with ICAO statistical and forecast regions.
Traffic flows are described as being to or from one of a number of traffic regions listed in Figure 42. Each traffic region is made up of a number of traffic zones (=States), which are indicated by the first letters of the ICAO location codes for brevity.
As far as “Europe” is concerned, it is split into two regions: ESRA (defined in the previous section) and Other Europe. For flow purposes, ESRA is split into a “North-West” region mostly of mature air traffic markets, a “Mediterranean” region stretching from the Canaries to Turkey and with a
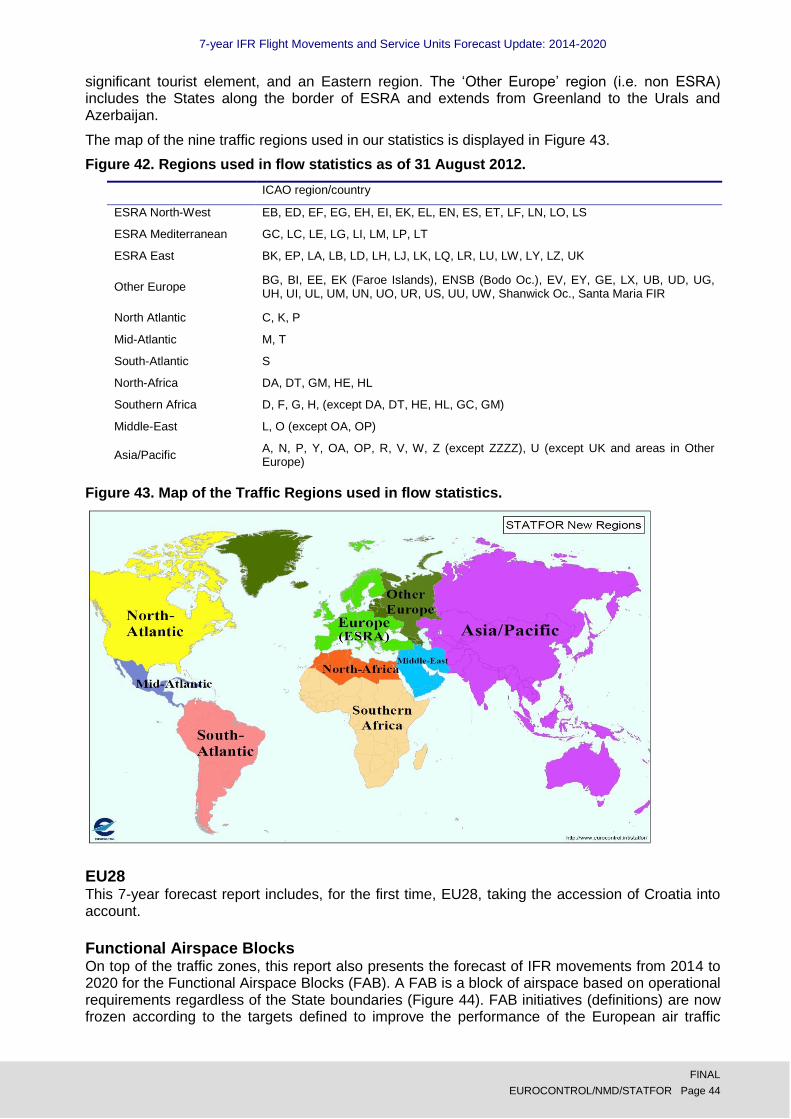
7-year IFR Flight Movements and Service Units Forecast Update: 2014-2020
FINAL
EUROCONTROL/NMD/STATFOR Page 44
significant tourist element, and an Eastern region. The ‘Other Europe’ region (i.e. non ESRA) includes the States along the border of ESRA and extends from Greenland to the Urals and Azerbaijan.
The map of the nine traffic regions used in our statistics is displayed in Figure 43.
Figure 42. Regions used in flow statistics as of 31 August 2012.
ICAO region/country
ESRA North-West EB, ED, EF, EG, EH, EI, EK, EL, EN, ES, ET, LF, LN, LO, LS
ESRA Mediterranean GC, LC, LE, LG, LI, LM, LP, LT
ESRA East BK, EP, LA, LB, LD, LH, LJ, LK, LQ, LR, LU, LW, LY, LZ, UK
Other Europe BG, BI, EE, EK (Faroe Islands), ENSB (Bodo Oc.), EV, EY, GE, LX, UB, UD, UG, UH, UI, UL, UM, UN, UO, UR, US, UU, UW, Shanwick Oc., Santa Maria FIR
North Atlantic C, K, P
Mid-Atlantic M, T
South-Atlantic S
North-Africa DA, DT, GM, HE, HL
Southern Africa D, F, G, H, (except DA, DT, HE, HL, GC, GM)
Middle-East L, O (except OA, OP)
Asia/Pacific A, N, P, Y, OA, OP, R, V, W, Z (except ZZZZ), U (except UK and areas in Other Europe)
Figure 43. Map of the Traffic Regions used in flow statistics.
EU28 This 7-year forecast report includes, for the first time, EU28, taking the accession of Croatia into account.
Functional Airspace Blocks On top of the traffic zones, this report also presents the forecast of IFR movements from 2014 to 2020 for the Functional Airspace Blocks (FAB). A FAB is a block of airspace based on operational requirements regardless of the State boundaries (Figure 44). FAB initiatives (definitions) are now frozen according to the targets defined to improve the performance of the European air traffic

7-year IFR Flight Movements and Service Units Forecast Update: 2014-2020
FINAL
EUROCONTROL/NMD/STATFOR Page 45
management network. STATFOR defines the FABs based on the FIR14 boundaries. The definition of FAB-FIR is:
UK-Ireland FAB (SCOTTISH FIR&UIR, LONDON FIR&UIR, SHANNON FIR&UIR)
Danish-Swedish FAB (COPENHAGEN FIR, SWEDEN FIR)
Baltic FAB (WARSZAWA FIR, VILNIUS FIR&UIR)
BLUE MED FAB (NICOSIA FIR&UIR, ATHINAI FIR&UIR, BRINDISI FIR&UIR, MILANO FIR&UIR,
ROMA FIR&UIR, MALTA FIR&UIR)
Danube FAB (SOFIA FIR, BUCAREST FIR)
FAB CE (ZAGREB FIR, BUDAPEST FIR, LJUBLJANA FIR, PRAHA FIR, WIEN FIR, SARAJEVO
FIR&UIR, BRATISLAVA FIR)
FABEC (BRUSSELS FIR&UIR, LANGEN FIR, MUNCHEN FIR, RHEIN UIR, HANNOVER UIR,
BREMEN FIR, AMSTERDAM FIR, BORDEAUX FIR, REIMS FIR, PARIS FIR, FRANCE UIR, MARSEILLE FIR, BREST FIR, SWITZERLAND FIR, SWITZERLAND UIR)
North European FAB (TALLINN FIR, FINLAND FIR&UIR, ENOR FIR, RIGA FIR, BODO OCEANIC
FIR)
South West FAB (CANARIAS FIR&UIR, LISBOA FIR, MADRID FIR&UIR, BARCELONA FIR&UIR).
The change compared to the previous definition used in the past forecast reports (August 2012-December 2013) consisted in removing the TIRANA FIR from BLUE MED FAB as well as the removal of SOTA and NOTA from UK-Ireland FAB. This new definition is in line with the FAB-FIR definition of the Performance Review Unit (PRU) of EUROCONTROL.
Figure 44. FABs as stipulated by the European Commission (STATFOR update: January 2014). Source: EUROCONTROL PRU
CRCO11 "CRCO11" refers to the EUROCONTROL Member States participating in the Multilateral Route Charges System in 2012. This list comprises: Albania, Armenia, Austria, Belgium/Luxembourg,
14 Note that the PRU uses the FAB-ANSP definition.

7-year IFR Flight Movements and Service Units Forecast Update: 2014-2020
FINAL
EUROCONTROL/NMD/STATFOR Page 46
Bosnia-Herzegovina, Bulgaria, Canary Islands, Croatia, Cyprus, Czech Republic, Denmark, FYROM, Finland, France, Germany, Greece, Hungary, Ireland, Italy, Latvia, Lisbon FIR, Lithuania, Malta, Moldova, Netherlands, Norway, Poland, Romania, Santa Maria FIR, Serbia&Montenegro, Slovakia, Slovenia, Spain, Sweden, Switzerland, Turkey, UK.
RPRegions RP1Region and RP2Region are the two regions involved in the Performance Scheme respectively related to First Reference Period (2012-2014) and Second Review Period (2015-2019).
RP1Region: stands for the sum over all the 29 states that are involved in the EU-wide
performance target setting for the first period, namely: 28 EU member states plus Norway plus Switzerland minus Croatia.
RP2Region: stands for the sum over all the 30 states that are involved in the EU-wide
performance target setting for the second period, namely: 28 EU member states plus Norway plus Switzerland.
The “SES” and “PScheme” regions presented in previous reports (Traffic Tables of the Annexes) are not reported anymore, as they could introduce some confusion with respect to the RPRegions above mentioned.
Terminal Charging Zones A “terminal charging zone” is an airport or a group of airports for which a cost-based unit rate is
established. The forecast of terminal navigation service units from 2014 shown in Annex G has been produced based per TCZ based on the definition submitted by the Stakeholders in their RP2 performance plans as available in June 2014.
The list of aerodromes forming the TCZs during RP2 for the 30 States participating in the SES performance scheme (RP2) can be found in Figure 44. We understand that changes may be being considered by States, but they were not available at the time of the forecast production.

7-year IFR Flight Movements and Service Units Forecast Update: 2014-2020
FINAL
EUROCONTROL/NMD/STATFOR Page 47
Figure 45. List of aerodromes forming the TCZ in RP2.
Austria
LO_TCZ
LOWG
LOWI
LOWK
LOWL
LOWS
LOWW
Belgium
EB_TCZ_EBAW
EBAW
Belgium
EB_TCZ_EBBR
EBBR
Belgium
EB_TCZ_EBCI
EBCI
Belgium
EB_TCZ_EBLG
EBLG
Belgium
EB_TCZ_EBOS
EBOS
Bulgaria
LB_TCZ
LBBG
LBGO
LBPD
LBSF
LBWN
Croatia
LD_TCZ
LDZA
Cyprus
LC_TCZ
LCLK
LCPH
Czech Republic
LK_TCZ
LKKV
LKMT
LKPR
LKTB
Denmark
EK_TCZ
EKCH
Estonia
EE_TCZ
Finland
EF_TCZ
EETN
EETU
EFHK
France
LF_TCZ
LFAQ
LFBA
LFBD
LFBE
LFBH
LFBI
LFBL
LFBO
LFBP
LFBT
LFBZ
LFCR
LFGJ
LFJL
LFJR
LFKB
LFKC
LFKF
LFKJ
LFLB
LFLC
LFLL
LFLP
LFLS
LFLX
LFLY
LFMD
LFMH
LFMI
LFMK
LFML
LFMN
LFMP
LFMT
LFMU
LFMV
LFOB
LFOH
LFOK
LFOT
LFPB
LFPG
LFPN
LFPO
LFQQ
LFRB
LFRD
LFRG
LFRH
LFRK
LFRN
LFRO
LFRQ
LFRS
LFRZ
LFSB
LFSD
LFSL
LFST
LFTH
LFTW
Germany
ED_TCZ
EDDB
EDDC
EDDE
EDDF
EDDG
EDDH
EDDK
EDDL
EDDM
EDDN
EDDP
EDDR
EDDS
EDDT
EDDV
EDDW
Greece
LG_TCZ
LGAV
Hungary
LH_TCZ
LHBP
Ireland
EI_TCZ
EICK
EIDW
EINN
Italy
LI_TCZ_1
LIRF
Italy
LI_TCZ_2
LIMC
LIME
LIML
LIPZ
Latvia
EV_TCZ
EVLA
EVRA
EVVA
Lithuania
EY_TCZ
EYKA
EYPA
EYSA
EYVI
Luxembourg
EL_TCZ
ELLX
Malta
LM_TCZ
LMML
Netherlands
EH_TCZ
EHAM
EHBK
EHGG
EHRD
Norway
EN_TCZ
ENBR
ENGM
ENVA
ENZV
Poland
EP_TCZ
EPBY
EPGD
EPKK
EPKT
EPLB
EPLL
EPMO
EPPO
EPRA
EPRZ
EPSC
EPWA
EPWR
EPZG
Portugal
LP_TCZ
LPAZ
LPFL
LPFR
LPHR
LPMA
LPPD
LPPR
LPPS
LPPT
Romania
LR_TCZ
LRBS
LROP
Slovakia
LZ_TCZ
LZIB
Slovenia
LJ_TCZ
LJLJ
LJMB
LJPZ
Spain
LE_TCZ
GCLP
LEBL
LEMD
LEMG
LEPA
Sweden
ES_TCZ_A
ESSA
Switzerland
LS_TCZ
LSGG
LSZH
UK
EG_TCZ_B
EGBB
EGCC
EGGW
EGKK
EGLC
EGLL
EGPF
EGPH
EGSS
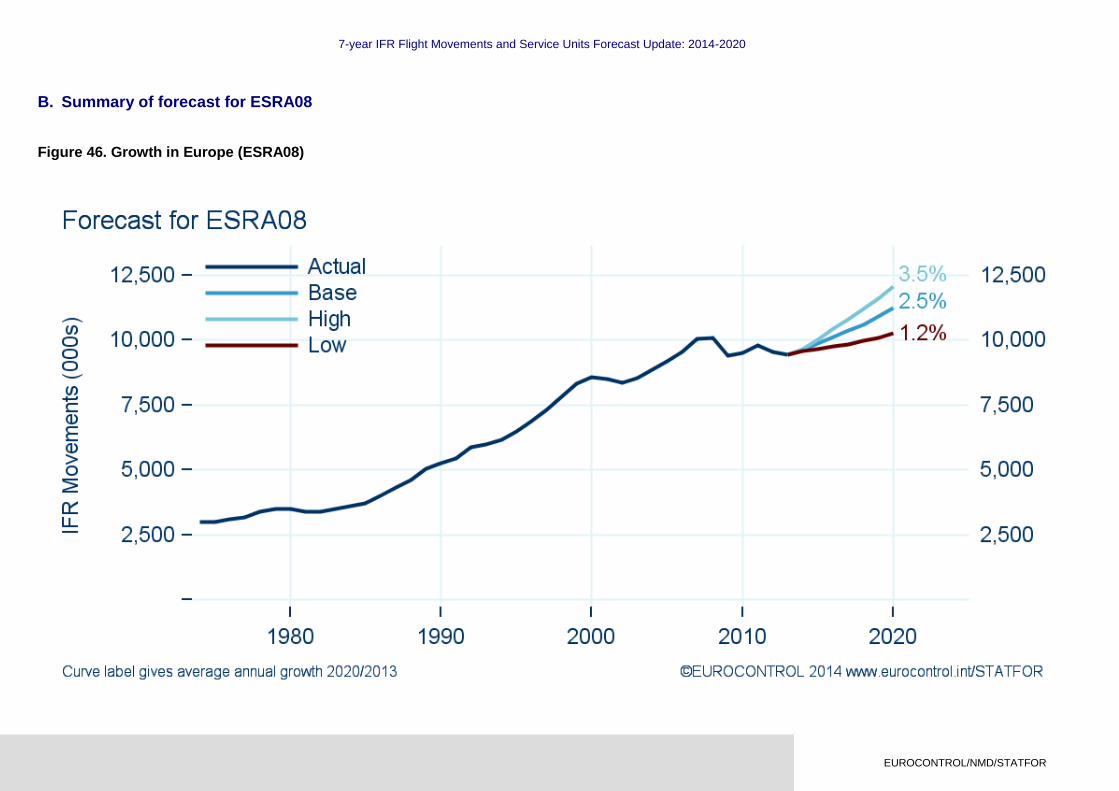
7-year IFR Flight Movements and Service Units Forecast Update: 2014-2020
EUROCONTROL/NMD/STATFOR
B. Summary of forecast for ESRA08
Figure 46. Growth in Europe (ESRA08)
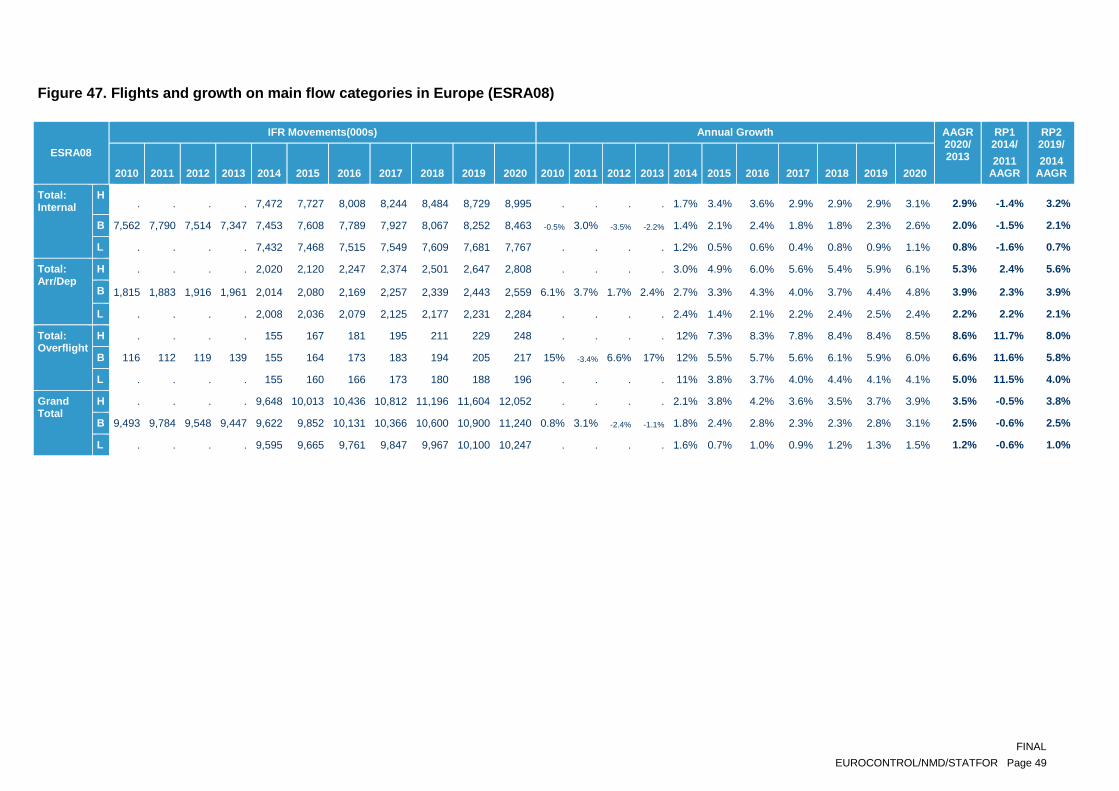
FINAL
EUROCONTROL/NMD/STATFOR Page 49
Figure 47. Flights and growth on main flow categories in Europe (ESRA08)
ESRA08
IFR Movements(000s) Annual Growth AAGR 2020/ 2013
RP1 2014/
2011 AAGR
RP2 2019/
2014 AAGR 2010 2011 2012 2013 2014 2015 2016 2017 2018 2019 2020 2010 2011 2012 2013 2014 2015 2016 2017 2018 2019 2020
Total: Internal
H . . . . 7,472 7,727 8,008 8,244 8,484 8,729 8,995 . . . . 1.7% 3.4% 3.6% 2.9% 2.9% 2.9% 3.1% 2.9% -1.4% 3.2%
B 7,562 7,790 7,514 7,347 7,453 7,608 7,789 7,927 8,067 8,252 8,463 -0.5% 3.0% -3.5% -2.2% 1.4% 2.1% 2.4% 1.8% 1.8% 2.3% 2.6% 2.0% -1.5% 2.1%
L . . . . 7,432 7,468 7,515 7,549 7,609 7,681 7,767 . . . . 1.2% 0.5% 0.6% 0.4% 0.8% 0.9% 1.1% 0.8% -1.6% 0.7%
Total: Arr/Dep
H . . . . 2,020 2,120 2,247 2,374 2,501 2,647 2,808 . . . . 3.0% 4.9% 6.0% 5.6% 5.4% 5.9% 6.1% 5.3% 2.4% 5.6%
B 1,815 1,883 1,916 1,961 2,014 2,080 2,169 2,257 2,339 2,443 2,559 6.1% 3.7% 1.7% 2.4% 2.7% 3.3% 4.3% 4.0% 3.7% 4.4% 4.8% 3.9% 2.3% 3.9%
L . . . . 2,008 2,036 2,079 2,125 2,177 2,231 2,284 . . . . 2.4% 1.4% 2.1% 2.2% 2.4% 2.5% 2.4% 2.2% 2.2% 2.1%
Total: Overflight
H . . . . 155 167 181 195 211 229 248 . . . . 12% 7.3% 8.3% 7.8% 8.4% 8.4% 8.5% 8.6% 11.7% 8.0%
B 116 112 119 139 155 164 173 183 194 205 217 15% -3.4% 6.6% 17% 12% 5.5% 5.7% 5.6% 6.1% 5.9% 6.0% 6.6% 11.6% 5.8%
L . . . . 155 160 166 173 180 188 196 . . . . 11% 3.8% 3.7% 4.0% 4.4% 4.1% 4.1% 5.0% 11.5% 4.0%
Grand Total
H . . . . 9,648 10,013 10,436 10,812 11,196 11,604 12,052 . . . . 2.1% 3.8% 4.2% 3.6% 3.5% 3.7% 3.9% 3.5% -0.5% 3.8%
B 9,493 9,784 9,548 9,447 9,622 9,852 10,131 10,366 10,600 10,900 11,240 0.8% 3.1% -2.4% -1.1% 1.8% 2.4% 2.8% 2.3% 2.3% 2.8% 3.1% 2.5% -0.6% 2.5%
L . . . . 9,595 9,665 9,761 9,847 9,967 10,100 10,247 . . . . 1.6% 0.7% 1.0% 0.9% 1.2% 1.3% 1.5% 1.2% -0.6% 1.0%

7-year IFR Flight Movements and Service Units Forecast Update: 2014-2020
EUROCONTROL/NMD/STATFOR
Figure 48. Busiest bi-directional region-to-region flows for ESRA08
IFR Movements(000s) Annual Growth AAGR
2020/ 2013 2010 2011 2012 2013 2014 2015 2016 2017 2018 2019 2020 2010 2011 2012 2013 2014 2015 2016 2017 2018 2019 2020
1 ESRA North-W
ESRA North-W
H . . . . 3481.9 3569.9 3645.6 3685.6 3736.9 3776.7 3822.8 . . . . -0.3% 2.5% 2.1% 1.1% 1.4% 1.1% 1.2% 1.3%
B 3573.2 3679.4 3581.4 3491.4 3475.0 3534.0 3575.3 3582.5 3607.0 3635.2 3672.3 -2.5% 3.0% -2.7% -2.5% -0.5% 1.7% 1.2% 0.2% 0.7% 0.8% 1.0% 0.7%
L . . . . 3467.4 3485.9 3479.8 3451.3 3442.2 3438.2 3447.2 . . . . -0.7% 0.5% -0.2% -0.8% -0.3% -0.1% 0.3% -0.2%
2 ESRA Mediter
ESRA North-W
H . . . . 1775.5 1842.6 1915.1 1974.2 2034.4 2099.1 2167.9 . . . . 5.7% 3.8% 3.9% 3.1% 3.1% 3.2% 3.3% 3.7%
B 1576.8 1674.8 1653.8 1680.2 1770.8 1811.5 1856.3 1892.5 1928.5 1974.3 2024.3 1.8% 6.2% -1.3% 1.6% 5.4% 2.3% 2.5% 2.0% 1.9% 2.4% 2.5% 2.7%
L . . . . 1765.6 1772.2 1781.8 1792.7 1809.4 1826.9 1844.7 . . . . 5.1% 0.4% 0.5% 0.6% 0.9% 1.0% 1.0% 1.3%
3 ESRA Mediter
ESRA Mediter
H . . . . 1315.8 1367.5 1429.1 1499.4 1559.4 1631.2 1717.6 . . . . 3.9% 3.9% 4.5% 4.9% 4.0% 4.6% 5.3% 4.5%
B 1466.9 1480.4 1350.0 1266.2 1311.8 1341.7 1395.5 1450.1 1490.3 1557.7 1635.3 1.5% 0.9% -8.8% -6.2% 3.6% 2.3% 4.0% 3.9% 2.8% 4.5% 5.0% 3.7%
L . . . . 1308.0 1313.3 1341.7 1374.1 1407.0 1445.0 1484.7 . . . . 3.3% 0.4% 2.2% 2.4% 2.4% 2.7% 2.7% 2.3%
4 ESRA East
ESRA North-W
H . . . . 517.3 544.8 585.8 622.5 661.6 697.2 731.6 . . . . -1.6% 5.3% 7.5% 6.3% 6.3% 5.4% 4.9% 4.8%
B 510.6 520.3 520.4 525.8 515.2 530.5 553.4 574.6 596.9 619.2 641.5 -0.6% 1.9% 0.0% 1.0% -2.0% 3.0% 4.3% 3.8% 3.9% 3.7% 3.6% 2.9%
L . . . . 513.2 517.0 524.2 533.2 542.8 551.9 561.3 . . . . -2.4% 0.7% 1.4% 1.7% 1.8% 1.7% 1.7% 0.9%
5 ESRA North-W
North Atlant
H . . . . 300.2 306.8 313.8 319.6 326.7 332.9 339.2 . . . . 2.7% 2.2% 2.3% 1.8% 2.2% 1.9% 1.9% 2.2%
B 288.8 302.0 293.7 292.2 299.7 304.9 310.5 314.5 319.4 324.3 329.2 -0.6% 4.6% -2.7% -0.5% 2.6% 1.7% 1.8% 1.3% 1.6% 1.5% 1.5% 1.7%
L . . . . 299.2 302.2 305.0 306.2 308.3 310.4 313.2 . . . . 2.4% 1.0% 0.9% 0.4% 0.7% 0.7% 0.9% 1.0%
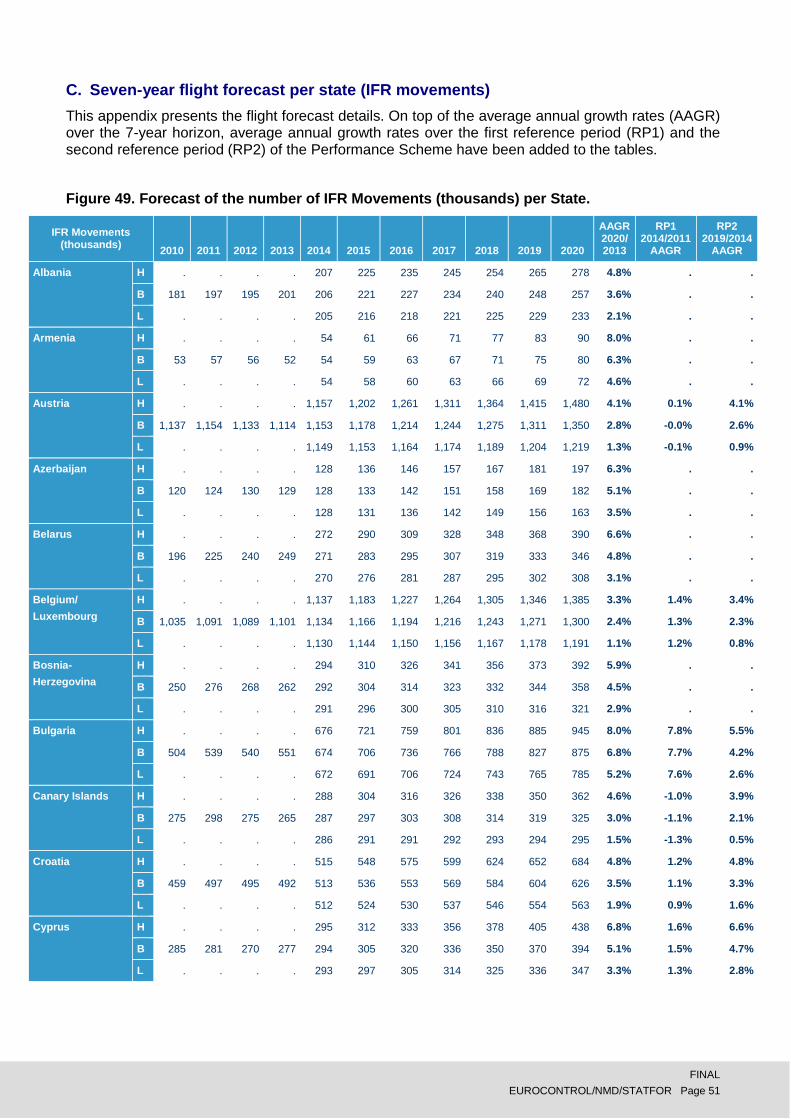
FINAL
EUROCONTROL/NMD/STATFOR Page 51
C. Seven-year flight forecast per state (IFR movements)
This appendix presents the flight forecast details. On top of the average annual growth rates (AAGR) over the 7-year horizon, average annual growth rates over the first reference period (RP1) and the second reference period (RP2) of the Performance Scheme have been added to the tables.
Figure 49. Forecast of the number of IFR Movements (thousands) per State.
IFR Movements (thousands)
2010 2011 2012 2013 2014 2015 2016 2017 2018 2019 2020
AAGR 2020/ 2013
RP1 2014/2011
AAGR
RP2 2019/2014
AAGR
Albania H . . . . 207 225 235 245 254 265 278 4.8% . .
B 181 197 195 201 206 221 227 234 240 248 257 3.6% . .
L . . . . 205 216 218 221 225 229 233 2.1% . .
Armenia H . . . . 54 61 66 71 77 83 90 8.0% . .
B 53 57 56 52 54 59 63 67 71 75 80 6.3% . .
L . . . . 54 58 60 63 66 69 72 4.6% . .
Austria H . . . . 1,157 1,202 1,261 1,311 1,364 1,415 1,480 4.1% 0.1% 4.1%
B 1,137 1,154 1,133 1,114 1,153 1,178 1,214 1,244 1,275 1,311 1,350 2.8% -0.0% 2.6%
L . . . . 1,149 1,153 1,164 1,174 1,189 1,204 1,219 1.3% -0.1% 0.9%
Azerbaijan H . . . . 128 136 146 157 167 181 197 6.3% . .
B 120 124 130 129 128 133 142 151 158 169 182 5.1% . .
L . . . . 128 131 136 142 149 156 163 3.5% . .
Belarus H . . . . 272 290 309 328 348 368 390 6.6% . .
B 196 225 240 249 271 283 295 307 319 333 346 4.8% . .
L . . . . 270 276 281 287 295 302 308 3.1% . .
Belgium/
Luxembourg
H . . . . 1,137 1,183 1,227 1,264 1,305 1,346 1,385 3.3% 1.4% 3.4%
B 1,035 1,091 1,089 1,101 1,134 1,166 1,194 1,216 1,243 1,271 1,300 2.4% 1.3% 2.3%
L . . . . 1,130 1,144 1,150 1,156 1,167 1,178 1,191 1.1% 1.2% 0.8%
Bosnia-
Herzegovina
H . . . . 294 310 326 341 356 373 392 5.9% . .
B 250 276 268 262 292 304 314 323 332 344 358 4.5% . .
L . . . . 291 296 300 305 310 316 321 2.9% . .
Bulgaria H . . . . 676 721 759 801 836 885 945 8.0% 7.8% 5.5%
B 504 539 540 551 674 706 736 766 788 827 875 6.8% 7.7% 4.2%
L . . . . 672 691 706 724 743 765 785 5.2% 7.6% 2.6%
Canary Islands H . . . . 288 304 316 326 338 350 362 4.6% -1.0% 3.9%
B 275 298 275 265 287 297 303 308 314 319 325 3.0% -1.1% 2.1%
L . . . . 286 291 291 292 293 294 295 1.5% -1.3% 0.5%
Croatia H . . . . 515 548 575 599 624 652 684 4.8% 1.2% 4.8%
B 459 497 495 492 513 536 553 569 584 604 626 3.5% 1.1% 3.3%
L . . . . 512 524 530 537 546 554 563 1.9% 0.9% 1.6%
Cyprus H . . . . 295 312 333 356 378 405 438 6.8% 1.6% 6.6%
B 285 281 270 277 294 305 320 336 350 370 394 5.1% 1.5% 4.7%
L . . . . 293 297 305 314 325 336 347 3.3% 1.3% 2.8%

FINAL
EUROCONTROL/NMD/STATFOR Page 52
IFR Movements (thousands)
2010 2011 2012 2013 2014 2015 2016 2017 2018 2019 2020
AAGR 2020/ 2013
RP1 2014/2011
AAGR
RP2 2019/2014
AAGR
Czech Republic H . . . . 710 757 802 839 880 920 962 5.1% 0.7% 5.3%
B 668 695 679 680 707 741 769 790 812 837 866 3.5% 0.6% 3.4%
L . . . . 705 725 735 742 752 762 774 1.9% 0.5% 1.6%
Denmark H . . . . 626 650 675 696 719 741 761 3.0% 0.1% 3.4%
B 595 625 605 618 625 642 657 670 684 698 712 2.0% -0.0% 2.2%
L . . . . 623 630 632 635 640 644 649 0.7% -0.1% 0.7%
Estonia H . . . . 192 203 214 225 237 249 262 5.3% 2.5% 5.4%
B 156 178 189 183 191 198 205 211 218 225 232 3.5% 2.4% 3.3%
L . . . . 191 194 196 198 201 204 208 1.8% 2.3% 1.4%
FYROM H . . . . 138 148 156 162 169 177 186 7.4% . .
B 125 124 113 113 138 145 150 154 159 164 171 6.1% . .
L . . . . 137 142 144 146 149 151 154 4.6% . .
Finland H . . . . 250 261 271 279 288 297 307 3.4% -2.2% 3.5%
B 242 267 252 243 249 255 260 263 268 272 277 1.9% -2.3% 1.8%
L . . . . 249 250 250 249 250 251 251 0.5% -2.4% 0.2%
France H . . . . 2,977 3,079 3,197 3,289 3,390 3,486 3,581 3.1% 0.1% 3.2%
B 2,794 2,968 2,923 2,902 2,969 3,032 3,104 3,155 3,217 3,286 3,361 2.1% 0.0% 2.0%
L . . . . 2,960 2,970 2,985 2,994 3,015 3,040 3,070 0.8% -0.1% 0.5%
Georgia H . . . . 115 126 136 147 157 169 185 7.6% . .
B 94 110 108 110 115 123 131 139 146 157 169 6.3% . .
L . . . . 114 120 125 131 137 144 150 4.5% . .
Germany H . . . . 3,049 3,171 3,294 3,386 3,494 3,596 3,708 3.1% -0.3% 3.4%
B 2,981 3,078 3,018 2,990 3,041 3,121 3,197 3,248 3,309 3,378 3,456 2.1% -0.4% 2.1%
L . . . . 3,032 3,066 3,085 3,092 3,116 3,140 3,173 0.9% -0.5% 0.7%
Greece H . . . . 665 698 729 759 789 825 866 4.8% 0.5% 4.4%
B 655 656 633 623 664 686 708 728 749 775 805 3.7% 0.4% 3.1%
L . . . . 662 673 682 692 704 718 732 2.3% 0.3% 1.6%
Hungary H . . . . 667 712 752 791 829 872 923 6.3% 2.6% 5.5%
B 622 617 589 600 665 697 724 750 772 803 838 4.9% 2.5% 3.8%
L . . . . 663 683 694 706 720 735 751 3.2% 2.4% 2.1%
Iceland H . . . . 146 153 160 167 175 183 192 5.6% . .
B 102 111 123 131 145 150 155 160 165 170 176 4.3% . .
L . . . . 145 148 150 152 155 158 161 3.0% . .
Ireland H . . . . 535 556 572 587 605 622 641 3.0% 0.8% 3.1%
B 513 523 521 522 535 552 564 575 588 602 616 2.4% 0.7% 2.4%
L . . . . 534 546 552 557 565 573 583 1.6% 0.7% 1.4%
Italy H . . . . 1,688 1,743 1,825 1,894 1,967 2,044 2,128 3.7% -0.7% 3.9%
B 1,712 1,726 1,685 1,648 1,683 1,710 1,760 1,802 1,845 1,896 1,951 2.4% -0.8% 2.4%
L . . . . 1,677 1,670 1,683 1,696 1,714 1,733 1,752 0.9% -0.9% 0.7%

FINAL
EUROCONTROL/NMD/STATFOR Page 53
IFR Movements (thousands)
2010 2011 2012 2013 2014 2015 2016 2017 2018 2019 2020
AAGR 2020/ 2013
RP1 2014/2011
AAGR
RP2 2019/2014
AAGR
Latvia H . . . . 247 262 278 292 307 322 338 5.3% 1.6% 5.5%
B 214 235 233 236 246 255 262 269 276 284 291 3.1% 1.5% 2.9%
L . . . . 245 249 249 251 254 256 259 1.3% 1.3% 0.9%
Lisbon FIR H . . . . 484 512 535 553 574 595 615 4.6% 2.5% 4.2%
B 429 450 438 449 483 502 514 523 534 545 557 3.1% 2.4% 2.5%
L . . . . 481 491 492 493 497 500 503 1.6% 2.3% 0.8%
Lithuania H . . . . 261 281 298 313 330 348 364 6.0% 3.9% 5.9%
B 206 233 236 242 260 274 283 292 301 311 321 4.1% 3.7% 3.6%
L . . . . 259 268 270 273 278 282 286 2.4% 3.6% 1.7%
Malta H . . . . 103 105 113 121 129 139 150 4.7% 8.6% 6.0%
B 95 81 97 109 103 102 107 112 117 123 130 2.6% 8.5% 3.6%
L . . . . 103 99 101 104 107 110 113 0.5% 8.3% 1.4%
Moldova H . . . . 63 72 78 83 89 95 101 4.6% . .
B 54 60 64 74 63 70 74 78 81 86 90 2.9% . .
L . . . . 63 68 70 72 75 77 80 1.1% . .
Morocco H . . . . 359 382 413 444 481 521 566 7.8% . .
B 339 352 324 334 358 372 390 407 428 449 472 5.1% . .
L . . . . 356 361 368 375 384 393 403 2.7% . .
Netherlands H . . . . 1,127 1,172 1,213 1,250 1,289 1,325 1,353 2.9% 1.3% 3.3%
B 1,013 1,085 1,083 1,109 1,125 1,161 1,190 1,215 1,241 1,269 1,290 2.2% 1.2% 2.4%
L . . . . 1,123 1,144 1,149 1,155 1,165 1,176 1,189 1.0% 1.2% 0.9%
Norway H . . . . 626 646 665 681 696 714 726 2.5% 3.6% 2.7%
B 537 563 587 610 625 641 651 659 668 678 689 1.8% 3.5% 1.7%
L . . . . 624 630 629 628 629 629 630 0.5% 3.4% 0.2%
Poland H . . . . 712 764 820 871 925 978 1,020 5.7% 2.8% 6.5%
B 599 655 684 692 710 745 778 808 838 870 903 3.9% 2.7% 4.2%
L . . . . 707 726 739 752 767 780 793 2.0% 2.6% 2.0%
Romania H . . . . 598 640 678 717 753 797 848 7.4% 7.1% 5.9%
B 470 487 487 513 597 627 653 681 703 736 774 6.1% 7.0% 4.3%
L . . . . 595 614 627 642 659 676 694 4.4% 6.9% 2.6%
Santa Maria FIR H . . . . 125 132 137 142 147 152 157 3.8% 0.6% 4.0%
B 118 123 118 121 125 131 134 137 140 144 147 2.8% 0.5% 2.9%
L . . . . 124 128 129 131 132 134 136 1.6% 0.4% 1.5%
Serbia&
Montenegro
H . . . . 551 576 605 632 658 689 726 4.9% . .
B 543 558 535 518 549 564 583 601 617 640 667 3.7% . .
L . . . . 547 552 559 568 578 590 601 2.1% . .
Slovakia H . . . . 447 474 502 529 556 585 617 6.5% 5.4% 5.5%
B 370 382 381 397 446 464 482 500 516 536 558 5.0% 5.3% 3.7%
L . . . . 444 453 461 470 479 489 499 3.3% 5.2% 1.9%

FINAL
EUROCONTROL/NMD/STATFOR Page 54
IFR Movements (thousands)
2010 2011 2012 2013 2014 2015 2016 2017 2018 2019 2020
AAGR 2020/ 2013
RP1 2014/2011
AAGR
RP2 2019/2014
AAGR
Slovenia H . . . . 349 372 390 405 422 440 461 4.9% -0.4% 4.7%
B 328 353 346 329 348 365 375 386 396 408 422 3.6% -0.5% 3.3%
L . . . . 346 356 360 364 369 375 381 2.1% -0.6% 1.6%
Spain H . . . . 1,600 1,670 1,747 1,811 1,883 1,955 2,026 4.1% -1.3% 4.1%
B 1,608 1,665 1,557 1,528 1,595 1,641 1,688 1,727 1,772 1,818 1,865 2.9% -1.4% 2.7%
L . . . . 1,590 1,602 1,615 1,630 1,649 1,668 1,687 1.4% -1.5% 1.0%
Sweden H . . . . 752 789 826 858 889 920 950 3.8% 1.2% 4.1%
B 664 724 724 730 750 777 800 819 838 857 877 2.7% 1.2% 2.7%
L . . . . 748 762 770 777 784 789 797 1.3% 1.1% 1.1%
Switzerland H . . . . 1,034 1,081 1,124 1,160 1,196 1,221 1,260 3.1% -0.9% 3.4%
B 1,025 1,063 1,045 1,019 1,031 1,063 1,090 1,112 1,135 1,161 1,188 2.2% -1.0% 2.4%
L . . . . 1,028 1,041 1,047 1,053 1,063 1,072 1,082 0.9% -1.1% 0.8%
Turkey H . . . . 1,269 1,371 1,462 1,577 1,662 1,788 1,950 8.0% . .
B 965 1,039 1,066 1,142 1,265 1,340 1,425 1,522 1,581 1,703 1,852 7.2% . .
L . . . . 1,261 1,309 1,366 1,432 1,497 1,573 1,648 5.4% . .
Ukraine H . . . . 337 346 375 406 438 473 510 0.4% . .
B 429 453 466 494 336 335 355 377 399 423 449 -1.4% . .
L . . . . 334 325 336 350 365 380 395 -3.2% . .
UK H . . . . 2,266 2,332 2,407 2,469 2,538 2,608 2,672 2.6% 0.4% 2.9%
B 2,181 2,241 2,211 2,225 2,261 2,303 2,348 2,385 2,428 2,473 2,522 1.8% 0.3% 1.8%
L . . . . 2,256 2,271 2,285 2,297 2,316 2,336 2,360 0.8% 0.2% 0.7%
ESRA02 H . . . . 9,539 9,903 10,312 10,675 11,044 11,438 11,875 3.6% . .
B 9,367 9,641 9,388 9,297 9,514 9,745 10,017 10,243 10,469 10,761 11,092 2.6% . .
L . . . . 9,487 9,561 9,653 9,735 9,850 9,978 10,122 1.2% . .
EU27 H . . . . 8,821 9,136 9,506 9,811 10,142 10,480 10,842 3.3% -0.8% 3.5%
B 8,805 9,036 8,766 8,622 8,797 8,990 9,216 9,391 9,585 9,812 10,065 2.2% -0.9% 2.2%
L . . . . 8,772 8,821 8,881 8,926 9,006 9,093 9,193 0.9% -1.0% 0.7%
ESRA08 H . . . . 9,648 10,013 10,436 10,812 11,196 11,604 12,052 3.5% -0.5% 3.8%
B 9,493 9,784 9,548 9,447 9,622 9,852 10,131 10,366 10,600 10,900 11,240 2.5% -0.6% 2.5%
L . . . . 9,595 9,665 9,761 9,847 9,967 10,100 10,247 1.2% -0.6% 1.0%
Baltic FAB H . . . . 816 858 921 978 1,039 1,098 1,146 5.7% 3.2% 6.1%
B 679 741 768 776 813 837 873 907 941 977 1,013 3.9% 3.1% 3.8%
L . . . . 810 816 831 845 861 877 891 2.0% 3.0% 1.6%
BLUE MED FAB H . . . . 2,308 2,387 2,504 2,608 2,717 2,837 2,972 4.3% 0.4% 4.2%
B 2,286 2,283 2,227 2,210 2,301 2,342 2,417 2,484 2,552 2,634 2,727 3.1% 0.3% 2.7%
L . . . . 2,293 2,290 2,315 2,343 2,378 2,415 2,452 1.5% 0.2% 1.0%
Danube FAB H . . . . 842 886 936 988 1,033 1,093 1,164 6.3% 3.6% 5.4%
B 734 758 746 758 839 868 904 941 969 1,015 1,070 5.1% 3.5% 3.9%
L . . . . 837 849 867 888 911 935 960 3.4% 3.4% 2.3%

FINAL
EUROCONTROL/NMD/STATFOR Page 55
IFR Movements (thousands)
2010 2011 2012 2013 2014 2015 2016 2017 2018 2019 2020
AAGR 2020/ 2013
RP1 2014/2011
AAGR
RP2 2019/2014
AAGR
FAB CE H . . . . 1,948 2,030 2,141 2,236 2,335 2,436 2,554 4.7% 0.6% 4.6%
B 1,864 1,914 1,865 1,854 1,941 1,988 2,057 2,114 2,171 2,239 2,316 3.2% 0.5% 2.9%
L . . . . 1,935 1,945 1,969 1,992 2,020 2,049 2,080 1.7% 0.4% 1.1%
FABEC H . . . . 5,606 5,795 6,013 6,179 6,365 6,541 6,726 2.9% -0.4% 3.1%
B 5,431 5,671 5,564 5,499 5,592 5,710 5,844 5,935 6,047 6,173 6,308 2.0% -0.5% 2.0%
L . . . . 5,576 5,605 5,635 5,647 5,686 5,730 5,786 0.7% -0.6% 0.5%
NEFAB H . . . . 1,046 1,081 1,121 1,157 1,193 1,232 1,267 3.3% 1.9% 3.3%
B 924 988 1,001 1,012 1,043 1,064 1,085 1,102 1,121 1,142 1,163 2.0% 1.8% 1.8%
L . . . . 1,041 1,044 1,044 1,044 1,048 1,051 1,055 0.6% 1.7% 0.2%
South West FAB H . . . . 1,670 1,745 1,825 1,892 1,968 2,044 2,119 4.2% -2.9% 4.1%
B 1,765 1,823 1,644 1,591 1,666 1,714 1,763 1,804 1,850 1,898 1,947 2.9% -3.0% 2.6%
L . . . . 1,660 1,674 1,687 1,702 1,722 1,741 1,761 1.5% -3.1% 1.0%
UK-Ireland FAB H . . . . 2,303 2,373 2,451 2,515 2,586 2,657 2,722 2.7% 0.4% 2.9%
B 2,216 2,272 2,238 2,254 2,298 2,345 2,392 2,430 2,474 2,521 2,570 1.9% 0.4% 1.9%
L . . . . 2,293 2,312 2,328 2,340 2,360 2,380 2,405 0.9% 0.3% 0.8%
DK-SE FAB H . . . . 1,027 1,069 1,115 1,153 1,192 1,230 1,267 3.4% 0.6% 3.7%
B 953 1,008 978 999 1,025 1,054 1,083 1,106 1,130 1,153 1,179 2.4% 0.6% 2.4%
L . . . . 1,022 1,035 1,043 1,050 1,058 1,065 1,073 1.0% 0.5% 0.8%
EU28 H . . . . 8,834 9,150 9,520 9,826 10,158 10,496 10,859 3.3% -0.8% 3.5%
B 8,820 9,050 8,779 8,634 8,811 9,004 9,230 9,405 9,600 9,827 10,079 2.2% -0.9% 2.2%
L . . . . 8,786 8,834 8,895 8,940 9,020 9,107 9,207 0.9% -1.0% 0.7%

FINAL
EUROCONTROL/NMD/STATFOR Page 56
D. Seven-year flight forecast per state (Growth)
This appendix shows the same data as the previous, but presented as growth rather than counts of flights.
Figure 50. Forecast of the IFR Movements growth per State.
IFR Movements (Growth)
2010 2011 2012 2013 2014 2015 2016 2017 2018 2019 2020
AAGR 2020/ 2013
RP1 2014/2011
AAGR
RP2 2019/2014
AAGR
Albania H . . . . 3.1% 8.7% 4.6% 4.1% 4.0% 4.3% 4.8% 4.8% . .
B 12% 8.7% -1.1% 2.8% 2.7% 7.1% 3.1% 2.8% 2.6% 3.3% 3.7% 3.6% . .
L . . . . 2.3% 5.1% 1.2% 1.4% 1.6% 1.7% 1.7% 2.1% . .
Armenia H . . . . 4.1% 12% 8.6% 8.0% 7.6% 8.0% 8.2% 8.0% . .
B 9.3% 8.1% -2.0% -6.6% 3.6% 9.3% 6.4% 6.3% 5.8% 6.4% 6.5% 6.3% . .
L . . . . 3.1% 6.9% 4.2% 4.5% 4.6% 4.5% 4.3% 4.6% . .
Austria H . . . . 3.9% 3.9% 4.9% 4.0% 4.0% 3.7% 4.6% 4.1% 0.1% 4.1%
B 2.2% 1.5% -1.8% -1.7% 3.5% 2.2% 3.1% 2.5% 2.5% 2.8% 3.0% 2.8% -0.0% 2.6%
L . . . . 3.2% 0.3% 1.0% 0.9% 1.2% 1.2% 1.3% 1.3% -0.1% 0.9%
Azerbaijan H . . . . -0.3% 6.0% 7.7% 7.5% 6.5% 7.9% 9.1% 6.3% . .
B 11% 2.8% 5.4% -1.3% -0.5% 4.3% 6.2% 6.2% 5.0% 6.9% 7.8% 5.1% . .
L . . . . -0.8% 2.4% 4.3% 4.6% 4.6% 4.8% 4.8% 3.5% . .
Belarus H . . . . 9.1% 6.6% 6.8% 6.0% 6.1% 6.0% 5.9% 6.6% . .
B 7.7% 15% 6.7% 3.8% 8.7% 4.5% 4.3% 4.1% 4.1% 4.2% 4.1% 4.8% . .
L . . . . 8.3% 2.4% 1.8% 2.3% 2.5% 2.4% 2.2% 3.1% . .
Belgium/
Luxembourg
H . . . . 3.3% 4.0% 3.8% 3.0% 3.3% 3.1% 2.9% 3.3% 1.4% 3.4%
B 1.5% 5.4% -0.2% 1.0% 3.0% 2.8% 2.4% 1.9% 2.2% 2.3% 2.3% 2.4% 1.3% 2.3%
L . . . . 2.7% 1.2% 0.5% 0.5% 0.9% 1.0% 1.1% 1.1% 1.2% 0.8%
Bosnia-
Herzegovina
H . . . . 12% 5.7% 5.2% 4.6% 4.3% 4.8% 5.2% 5.9% . .
B 11% 10% -2.6% -2.2% 11% 3.8% 3.4% 3.1% 2.7% 3.6% 3.9% 4.5% . .
L . . . . 11% 1.7% 1.3% 1.5% 1.7% 1.8% 1.8% 2.9% . .
Bulgaria H . . . . 23% 6.6% 5.4% 5.5% 4.3% 5.9% 6.8% 8.0% 7.8% 5.5%
B 5.6% 7.1% 0.2% 1.9% 22% 4.7% 4.1% 4.2% 2.8% 5.0% 5.8% 6.8% 7.7% 4.2%
L . . . . 22% 2.8% 2.2% 2.5% 2.6% 2.9% 2.7% 5.2% 7.6% 2.6%
Canary Islands H . . . . 8.8% 5.3% 4.0% 3.2% 3.6% 3.6% 3.5% 4.6% -1.0% 3.9%
B 3.2% 8.2% -7.7% -3.4% 8.4% 3.5% 2.0% 1.5% 1.9% 1.8% 1.8% 3.0% -1.1% 2.1%
L . . . . 8.0% 1.5% 0.1% 0.1% 0.4% 0.4% 0.4% 1.5% -1.3% 0.5%
Croatia H . . . . 4.7% 6.3% 4.9% 4.3% 4.2% 4.5% 4.9% 4.8% 1.2% 4.8%
B 8.7% 8.4% -0.4% -0.6% 4.3% 4.5% 3.1% 2.9% 2.6% 3.3% 3.7% 3.5% 1.1% 3.3%
L . . . . 3.9% 2.5% 1.1% 1.3% 1.6% 1.6% 1.6% 1.9% 0.9% 1.6%
Cyprus H . . . . 6.4% 5.9% 6.7% 6.7% 6.3% 7.2% 8.1% 6.8% 1.6% 6.6%
B 6.4% -1.2% -4.1% 2.8% 6.0% 3.8% 4.8% 4.9% 4.3% 5.6% 6.5% 5.1% 1.5% 4.7%
L . . . . 5.6% 1.5% 2.6% 3.0% 3.4% 3.4% 3.4% 3.3% 1.3% 2.8%

FINAL
EUROCONTROL/NMD/STATFOR Page 57
IFR Movements (Growth)
2010 2011 2012 2013 2014 2015 2016 2017 2018 2019 2020
AAGR 2020/ 2013
RP1 2014/2011
AAGR
RP2 2019/2014
AAGR
Czech Republic H . . . . 4.4% 6.6% 6.0% 4.6% 4.8% 4.6% 4.6% 5.1% 0.7% 5.3%
B 3.2% 4.0% -2.3% 0.0% 4.1% 4.7% 3.8% 2.7% 2.8% 3.2% 3.4% 3.5% 0.6% 3.4%
L . . . . 3.8% 2.8% 1.5% 0.9% 1.3% 1.3% 1.5% 1.9% 0.5% 1.6%
Denmark H . . . . 1.3% 3.9% 3.8% 3.1% 3.2% 3.1% 2.7% 3.0% 0.1% 3.4%
B 3.3% 5.1% -3.2% 2.3% 1.0% 2.7% 2.4% 1.9% 2.1% 2.1% 2.1% 2.0% -0.0% 2.2%
L . . . . 0.8% 1.1% 0.4% 0.5% 0.7% 0.7% 0.8% 0.7% -0.1% 0.7%
Estonia H . . . . 4.9% 5.5% 5.7% 4.9% 5.4% 5.3% 5.1% 5.3% 2.5% 5.4%
B 2.1% 14% 6.1% -3.1% 4.6% 3.5% 3.3% 2.9% 3.3% 3.4% 3.3% 3.5% 2.4% 3.3%
L . . . . 4.2% 1.6% 0.9% 1.1% 1.7% 1.6% 1.6% 1.8% 2.3% 1.4%
FYROM H . . . . 23% 7.3% 5.1% 4.3% 4.3% 4.5% 5.0% 7.4% . .
B -0.1% -0.4% -9.6% 0.1% 22% 5.4% 3.4% 3.0% 2.9% 3.5% 3.8% 6.1% . .
L . . . . 22% 3.3% 1.4% 1.5% 1.9% 1.9% 2.0% 4.6% . .
Finland H . . . . 3.0% 4.2% 3.8% 2.9% 3.2% 3.3% 3.3% 3.4% -2.2% 3.5%
B 0.6% 11% -5.8% -3.5% 2.6% 2.5% 1.8% 1.3% 1.6% 1.7% 1.8% 1.9% -2.3% 1.8%
L . . . . 2.3% 0.7% -0.1% -0.2% 0.2% 0.2% 0.4% 0.5% -2.4% 0.2%
France H . . . . 2.6% 3.4% 3.8% 2.9% 3.0% 2.8% 2.7% 3.1% 0.1% 3.2%
B -0.2% 6.2% -1.5% -0.7% 2.3% 2.1% 2.4% 1.6% 2.0% 2.2% 2.3% 2.1% 0.0% 2.0%
L . . . . 2.0% 0.3% 0.5% 0.3% 0.7% 0.8% 1.0% 0.8% -0.1% 0.5%
Georgia H . . . . 4.5% 9.4% 8.0% 8.0% 6.7% 8.0% 8.9% 7.6% . .
B 22% 16% -1.7% 2.1% 4.2% 7.3% 6.4% 6.4% 5.0% 7.0% 7.6% 6.3% . .
L . . . . 3.8% 5.1% 4.3% 4.6% 4.6% 4.8% 4.5% 4.5% . .
Germany H . . . . 2.0% 4.0% 3.9% 2.8% 3.2% 2.9% 3.1% 3.1% -0.3% 3.4%
B 1.7% 3.2% -1.9% -0.9% 1.7% 2.6% 2.4% 1.6% 1.9% 2.1% 2.3% 2.1% -0.4% 2.1%
L . . . . 1.4% 1.1% 0.6% 0.2% 0.8% 0.8% 1.0% 0.9% -0.5% 0.7%
Greece H . . . . 6.8% 4.9% 4.4% 4.1% 4.0% 4.5% 5.0% 4.8% 0.5% 4.4%
B 2.6% 0.2% -3.5% -1.6% 6.5% 3.4% 3.1% 2.9% 2.8% 3.5% 4.0% 3.7% 0.4% 3.1%
L . . . . 6.2% 1.7% 1.3% 1.5% 1.8% 1.9% 2.0% 2.3% 0.3% 1.6%
Hungary H . . . . 11% 6.8% 5.7% 5.2% 4.7% 5.2% 5.8% 6.3% 2.6% 5.5%
B 2.4% -0.8% -4.4% 1.9% 11% 4.9% 3.8% 3.5% 3.0% 4.0% 4.3% 4.9% 2.5% 3.8%
L . . . . 10% 3.0% 1.7% 1.8% 2.0% 2.1% 2.1% 3.2% 2.4% 2.1%
Iceland H . . . . 11% 4.7% 4.9% 4.3% 4.7% 4.9% 4.9% 5.6% . .
B 0.6% 9.0% 11% 6.8% 11% 3.4% 3.3% 2.9% 3.2% 3.4% 3.6% 4.3% . .
L . . . . 11% 1.9% 1.5% 1.5% 1.9% 1.9% 2.0% 3.0% . .
Ireland H . . . . 2.5% 3.9% 2.8% 2.7% 3.0% 2.9% 3.0% 3.0% 0.8% 3.1%
B -3.1% 1.9% -0.4% 0.3% 2.3% 3.3% 2.2% 2.0% 2.2% 2.3% 2.4% 2.4% 0.7% 2.4%
L . . . . 2.2% 2.3% 1.1% 0.9% 1.3% 1.5% 1.7% 1.6% 0.7% 1.4%
Italy H . . . . 2.4% 3.2% 4.7% 3.8% 3.9% 3.9% 4.1% 3.7% -0.7% 3.9%
B 3.9% 0.8% -2.3% -2.2% 2.1% 1.6% 2.9% 2.4% 2.4% 2.7% 2.9% 2.4% -0.8% 2.4%
L . . . . 1.8% -0.4% 0.7% 0.8% 1.1% 1.1% 1.1% 0.9% -0.9% 0.7%
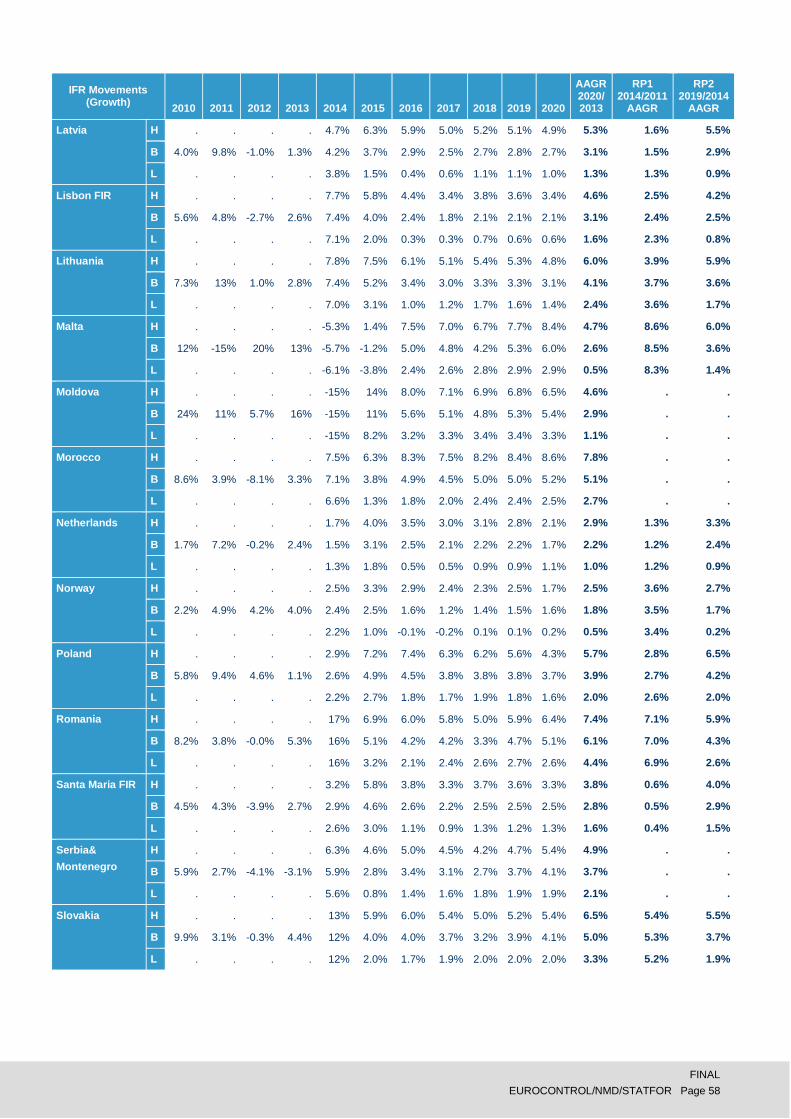
FINAL
EUROCONTROL/NMD/STATFOR Page 58
IFR Movements (Growth)
2010 2011 2012 2013 2014 2015 2016 2017 2018 2019 2020
AAGR 2020/ 2013
RP1 2014/2011
AAGR
RP2 2019/2014
AAGR
Latvia H . . . . 4.7% 6.3% 5.9% 5.0% 5.2% 5.1% 4.9% 5.3% 1.6% 5.5%
B 4.0% 9.8% -1.0% 1.3% 4.2% 3.7% 2.9% 2.5% 2.7% 2.8% 2.7% 3.1% 1.5% 2.9%
L . . . . 3.8% 1.5% 0.4% 0.6% 1.1% 1.1% 1.0% 1.3% 1.3% 0.9%
Lisbon FIR H . . . . 7.7% 5.8% 4.4% 3.4% 3.8% 3.6% 3.4% 4.6% 2.5% 4.2%
B 5.6% 4.8% -2.7% 2.6% 7.4% 4.0% 2.4% 1.8% 2.1% 2.1% 2.1% 3.1% 2.4% 2.5%
L . . . . 7.1% 2.0% 0.3% 0.3% 0.7% 0.6% 0.6% 1.6% 2.3% 0.8%
Lithuania H . . . . 7.8% 7.5% 6.1% 5.1% 5.4% 5.3% 4.8% 6.0% 3.9% 5.9%
B 7.3% 13% 1.0% 2.8% 7.4% 5.2% 3.4% 3.0% 3.3% 3.3% 3.1% 4.1% 3.7% 3.6%
L . . . . 7.0% 3.1% 1.0% 1.2% 1.7% 1.6% 1.4% 2.4% 3.6% 1.7%
Malta H . . . . -5.3% 1.4% 7.5% 7.0% 6.7% 7.7% 8.4% 4.7% 8.6% 6.0%
B 12% -15% 20% 13% -5.7% -1.2% 5.0% 4.8% 4.2% 5.3% 6.0% 2.6% 8.5% 3.6%
L . . . . -6.1% -3.8% 2.4% 2.6% 2.8% 2.9% 2.9% 0.5% 8.3% 1.4%
Moldova H . . . . -15% 14% 8.0% 7.1% 6.9% 6.8% 6.5% 4.6% . .
B 24% 11% 5.7% 16% -15% 11% 5.6% 5.1% 4.8% 5.3% 5.4% 2.9% . .
L . . . . -15% 8.2% 3.2% 3.3% 3.4% 3.4% 3.3% 1.1% . .
Morocco H . . . . 7.5% 6.3% 8.3% 7.5% 8.2% 8.4% 8.6% 7.8% . .
B 8.6% 3.9% -8.1% 3.3% 7.1% 3.8% 4.9% 4.5% 5.0% 5.0% 5.2% 5.1% . .
L . . . . 6.6% 1.3% 1.8% 2.0% 2.4% 2.4% 2.5% 2.7% . .
Netherlands H . . . . 1.7% 4.0% 3.5% 3.0% 3.1% 2.8% 2.1% 2.9% 1.3% 3.3%
B 1.7% 7.2% -0.2% 2.4% 1.5% 3.1% 2.5% 2.1% 2.2% 2.2% 1.7% 2.2% 1.2% 2.4%
L . . . . 1.3% 1.8% 0.5% 0.5% 0.9% 0.9% 1.1% 1.0% 1.2% 0.9%
Norway H . . . . 2.5% 3.3% 2.9% 2.4% 2.3% 2.5% 1.7% 2.5% 3.6% 2.7%
B 2.2% 4.9% 4.2% 4.0% 2.4% 2.5% 1.6% 1.2% 1.4% 1.5% 1.6% 1.8% 3.5% 1.7%
L . . . . 2.2% 1.0% -0.1% -0.2% 0.1% 0.1% 0.2% 0.5% 3.4% 0.2%
Poland H . . . . 2.9% 7.2% 7.4% 6.3% 6.2% 5.6% 4.3% 5.7% 2.8% 6.5%
B 5.8% 9.4% 4.6% 1.1% 2.6% 4.9% 4.5% 3.8% 3.8% 3.8% 3.7% 3.9% 2.7% 4.2%
L . . . . 2.2% 2.7% 1.8% 1.7% 1.9% 1.8% 1.6% 2.0% 2.6% 2.0%
Romania H . . . . 17% 6.9% 6.0% 5.8% 5.0% 5.9% 6.4% 7.4% 7.1% 5.9%
B 8.2% 3.8% -0.0% 5.3% 16% 5.1% 4.2% 4.2% 3.3% 4.7% 5.1% 6.1% 7.0% 4.3%
L . . . . 16% 3.2% 2.1% 2.4% 2.6% 2.7% 2.6% 4.4% 6.9% 2.6%
Santa Maria FIR H . . . . 3.2% 5.8% 3.8% 3.3% 3.7% 3.6% 3.3% 3.8% 0.6% 4.0%
B 4.5% 4.3% -3.9% 2.7% 2.9% 4.6% 2.6% 2.2% 2.5% 2.5% 2.5% 2.8% 0.5% 2.9%
L . . . . 2.6% 3.0% 1.1% 0.9% 1.3% 1.2% 1.3% 1.6% 0.4% 1.5%
Serbia&
Montenegro
H . . . . 6.3% 4.6% 5.0% 4.5% 4.2% 4.7% 5.4% 4.9% . .
B 5.9% 2.7% -4.1% -3.1% 5.9% 2.8% 3.4% 3.1% 2.7% 3.7% 4.1% 3.7% . .
L . . . . 5.6% 0.8% 1.4% 1.6% 1.8% 1.9% 1.9% 2.1% . .
Slovakia H . . . . 13% 5.9% 6.0% 5.4% 5.0% 5.2% 5.4% 6.5% 5.4% 5.5%
B 9.9% 3.1% -0.3% 4.4% 12% 4.0% 4.0% 3.7% 3.2% 3.9% 4.1% 5.0% 5.3% 3.7%
L . . . . 12% 2.0% 1.7% 1.9% 2.0% 2.0% 2.0% 3.3% 5.2% 1.9%
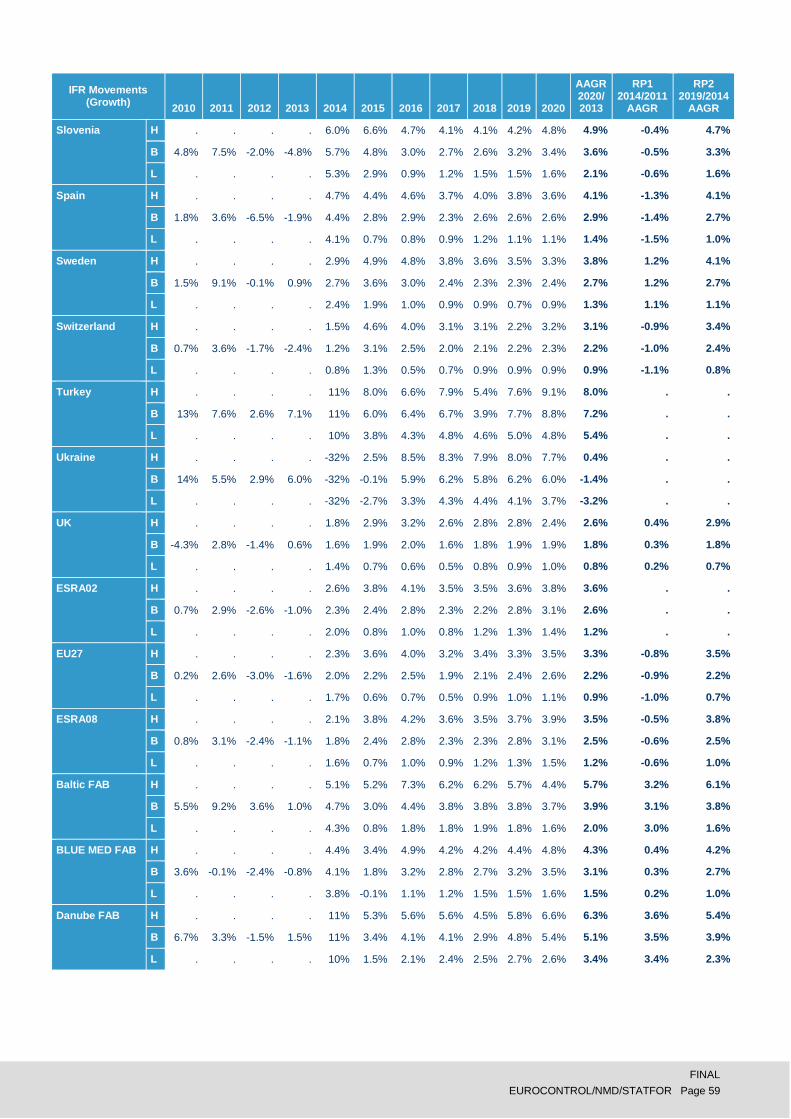
FINAL
EUROCONTROL/NMD/STATFOR Page 59
IFR Movements (Growth)
2010 2011 2012 2013 2014 2015 2016 2017 2018 2019 2020
AAGR 2020/ 2013
RP1 2014/2011
AAGR
RP2 2019/2014
AAGR
Slovenia H . . . . 6.0% 6.6% 4.7% 4.1% 4.1% 4.2% 4.8% 4.9% -0.4% 4.7%
B 4.8% 7.5% -2.0% -4.8% 5.7% 4.8% 3.0% 2.7% 2.6% 3.2% 3.4% 3.6% -0.5% 3.3%
L . . . . 5.3% 2.9% 0.9% 1.2% 1.5% 1.5% 1.6% 2.1% -0.6% 1.6%
Spain H . . . . 4.7% 4.4% 4.6% 3.7% 4.0% 3.8% 3.6% 4.1% -1.3% 4.1%
B 1.8% 3.6% -6.5% -1.9% 4.4% 2.8% 2.9% 2.3% 2.6% 2.6% 2.6% 2.9% -1.4% 2.7%
L . . . . 4.1% 0.7% 0.8% 0.9% 1.2% 1.1% 1.1% 1.4% -1.5% 1.0%
Sweden H . . . . 2.9% 4.9% 4.8% 3.8% 3.6% 3.5% 3.3% 3.8% 1.2% 4.1%
B 1.5% 9.1% -0.1% 0.9% 2.7% 3.6% 3.0% 2.4% 2.3% 2.3% 2.4% 2.7% 1.2% 2.7%
L . . . . 2.4% 1.9% 1.0% 0.9% 0.9% 0.7% 0.9% 1.3% 1.1% 1.1%
Switzerland H . . . . 1.5% 4.6% 4.0% 3.1% 3.1% 2.2% 3.2% 3.1% -0.9% 3.4%
B 0.7% 3.6% -1.7% -2.4% 1.2% 3.1% 2.5% 2.0% 2.1% 2.2% 2.3% 2.2% -1.0% 2.4%
L . . . . 0.8% 1.3% 0.5% 0.7% 0.9% 0.9% 0.9% 0.9% -1.1% 0.8%
Turkey H . . . . 11% 8.0% 6.6% 7.9% 5.4% 7.6% 9.1% 8.0% . .
B 13% 7.6% 2.6% 7.1% 11% 6.0% 6.4% 6.7% 3.9% 7.7% 8.8% 7.2% . .
L . . . . 10% 3.8% 4.3% 4.8% 4.6% 5.0% 4.8% 5.4% . .
Ukraine H . . . . -32% 2.5% 8.5% 8.3% 7.9% 8.0% 7.7% 0.4% . .
B 14% 5.5% 2.9% 6.0% -32% -0.1% 5.9% 6.2% 5.8% 6.2% 6.0% -1.4% . .
L . . . . -32% -2.7% 3.3% 4.3% 4.4% 4.1% 3.7% -3.2% . .
UK H . . . . 1.8% 2.9% 3.2% 2.6% 2.8% 2.8% 2.4% 2.6% 0.4% 2.9%
B -4.3% 2.8% -1.4% 0.6% 1.6% 1.9% 2.0% 1.6% 1.8% 1.9% 1.9% 1.8% 0.3% 1.8%
L . . . . 1.4% 0.7% 0.6% 0.5% 0.8% 0.9% 1.0% 0.8% 0.2% 0.7%
ESRA02 H . . . . 2.6% 3.8% 4.1% 3.5% 3.5% 3.6% 3.8% 3.6% . .
B 0.7% 2.9% -2.6% -1.0% 2.3% 2.4% 2.8% 2.3% 2.2% 2.8% 3.1% 2.6% . .
L . . . . 2.0% 0.8% 1.0% 0.8% 1.2% 1.3% 1.4% 1.2% . .
EU27 H . . . . 2.3% 3.6% 4.0% 3.2% 3.4% 3.3% 3.5% 3.3% -0.8% 3.5%
B 0.2% 2.6% -3.0% -1.6% 2.0% 2.2% 2.5% 1.9% 2.1% 2.4% 2.6% 2.2% -0.9% 2.2%
L . . . . 1.7% 0.6% 0.7% 0.5% 0.9% 1.0% 1.1% 0.9% -1.0% 0.7%
ESRA08 H . . . . 2.1% 3.8% 4.2% 3.6% 3.5% 3.7% 3.9% 3.5% -0.5% 3.8%
B 0.8% 3.1% -2.4% -1.1% 1.8% 2.4% 2.8% 2.3% 2.3% 2.8% 3.1% 2.5% -0.6% 2.5%
L . . . . 1.6% 0.7% 1.0% 0.9% 1.2% 1.3% 1.5% 1.2% -0.6% 1.0%
Baltic FAB H . . . . 5.1% 5.2% 7.3% 6.2% 6.2% 5.7% 4.4% 5.7% 3.2% 6.1%
B 5.5% 9.2% 3.6% 1.0% 4.7% 3.0% 4.4% 3.8% 3.8% 3.8% 3.7% 3.9% 3.1% 3.8%
L . . . . 4.3% 0.8% 1.8% 1.8% 1.9% 1.8% 1.6% 2.0% 3.0% 1.6%
BLUE MED FAB H . . . . 4.4% 3.4% 4.9% 4.2% 4.2% 4.4% 4.8% 4.3% 0.4% 4.2%
B 3.6% -0.1% -2.4% -0.8% 4.1% 1.8% 3.2% 2.8% 2.7% 3.2% 3.5% 3.1% 0.3% 2.7%
L . . . . 3.8% -0.1% 1.1% 1.2% 1.5% 1.5% 1.6% 1.5% 0.2% 1.0%
Danube FAB H . . . . 11% 5.3% 5.6% 5.6% 4.5% 5.8% 6.6% 6.3% 3.6% 5.4%
B 6.7% 3.3% -1.5% 1.5% 11% 3.4% 4.1% 4.1% 2.9% 4.8% 5.4% 5.1% 3.5% 3.9%
L . . . . 10% 1.5% 2.1% 2.4% 2.5% 2.7% 2.6% 3.4% 3.4% 2.3%

FINAL
EUROCONTROL/NMD/STATFOR Page 60
IFR Movements (Growth)
2010 2011 2012 2013 2014 2015 2016 2017 2018 2019 2020
AAGR 2020/ 2013
RP1 2014/2011
AAGR
RP2 2019/2014
AAGR
FAB CE H . . . . 5.1% 4.2% 5.4% 4.4% 4.4% 4.3% 4.8% 4.7% 0.6% 4.6%
B 3.2% 2.7% -2.6% -0.6% 4.7% 2.4% 3.4% 2.8% 2.6% 3.2% 3.4% 3.2% 0.5% 2.9%
L . . . . 4.4% 0.5% 1.3% 1.2% 1.4% 1.4% 1.5% 1.7% 0.4% 1.1%
FABEC H . . . . 2.0% 3.4% 3.8% 2.8% 3.0% 2.8% 2.8% 2.9% -0.4% 3.1%
B 0.5% 4.4% -1.9% -1.2% 1.7% 2.1% 2.4% 1.6% 1.9% 2.1% 2.2% 2.0% -0.5% 2.0%
L . . . . 1.4% 0.5% 0.5% 0.2% 0.7% 0.8% 1.0% 0.7% -0.6% 0.5%
NEFAB H . . . . 3.3% 3.4% 3.8% 3.1% 3.2% 3.3% 2.8% 3.3% 1.9% 3.3%
B 2.1% 7.0% 1.3% 1.1% 3.1% 2.0% 2.0% 1.5% 1.8% 1.8% 1.9% 2.0% 1.8% 1.8%
L . . . . 2.8% 0.3% 0.0% 0.0% 0.3% 0.3% 0.4% 0.6% 1.7% 0.2%
South West FAB H . . . . 5.0% 4.4% 4.6% 3.7% 4.0% 3.9% 3.7% 4.2% -2.9% 4.1%
B 1.8% 3.3% -9.8% -3.3% 4.7% 2.9% 2.9% 2.3% 2.6% 2.6% 2.6% 2.9% -3.0% 2.6%
L . . . . 4.4% 0.8% 0.8% 0.9% 1.2% 1.1% 1.1% 1.5% -3.1% 1.0%
UK-Ireland FAB H . . . . 2.2% 3.1% 3.3% 2.6% 2.8% 2.8% 2.5% 2.7% 0.4% 2.9%
B -4.3% 2.5% -1.5% 0.7% 1.9% 2.0% 2.0% 1.6% 1.8% 1.9% 2.0% 1.9% 0.4% 1.9%
L . . . . 1.7% 0.9% 0.7% 0.5% 0.8% 0.9% 1.0% 0.9% 0.3% 0.8%
DK-SE FAB H . . . . 2.8% 4.1% 4.3% 3.4% 3.3% 3.2% 3.0% 3.4% 0.6% 3.7%
B 2.4% 5.7% -3.0% 2.2% 2.6% 2.9% 2.7% 2.1% 2.1% 2.1% 2.2% 2.4% 0.6% 2.4%
L . . . . 2.3% 1.2% 0.8% 0.7% 0.7% 0.7% 0.8% 1.0% 0.5% 0.8%
EU28 H . . . . 2.3% 3.6% 4.0% 3.2% 3.4% 3.3% 3.5% 3.3% -0.8% 3.5%
B 0.2% 2.6% -3.0% -1.7% 2.1% 2.2% 2.5% 1.9% 2.1% 2.4% 2.6% 2.2% -0.9% 2.2%
L . . . . 1.8% 0.6% 0.7% 0.5% 0.9% 1.0% 1.1% 0.9% -1.0% 0.7%

FINAL
EUROCONTROL/NMD/STATFOR Page 61
E. Two-year en-route service unit forecast by State
Figure 51. Forecast Summary: Annual total en-route service units 2014-2015.
Charging Area 2013 Actual
TSU
2014 STATFOR
Forecast TSU
2014/2013 Forecast Growth
2015 STATFOR
Forecast TSU
2015/2014 Forecast Growth
2014 States Forecast
TSU
2014 STATFOR
/ States
EB Belgium/Luxembourg 2,277,014 2,353,043 3.3% 2,438,507 3.6% 2,422,721 -2.9%
ED GermanyA 12,569,982 12,882,191 2.5% 13,218,858 2.6% 14,119,320 -8.8%
LF France 17,899,945 18,609,073 4.0% 19,161,475 3.0% 19,045,084 -2.3%
EG UK 9,754,933 9,986,551 2.4% 10,158,591 1.7% 11,034,647 -9.5%
EH Netherlands 2,701,735 2,757,953 2.1% 2,838,813 2.9% 2,794,000 -1.3%
EI Ireland 3,812,940 3,988,491 4.6% 4,176,705 4.7% 4,004,000 -0.4%
LS Switzerland 1,384,957 1,417,413 2.3% 1,466,022 3.4% 1,558,501 -9.1%
LP Lisbon FIR 2,876,753 3,056,786 6.3% 3,163,945 3.5% 3,018,536 1.3%
LO Austria 2,456,012 2,604,287 6.0% 2,693,188 3.4% 2,947,000 -11.6%
LE Spain 8,447,044 8,757,202 3.7% 8,932,765 2.0% 9,857,260 -11.2%
GC Canary Islands 1,515,812 1,523,624 0.5% 1,578,484 3.6% 1,795,248 -15.1%
AZ Santa Maria FIR 4,021,257 4,164,011 3.5% 4,358,808 4.7% 4,359,813 -4.5%
LG Greece 4,215,705 4,451,581 5.6% 4,695,547 5.5% 5,041,000 -11.7%
LT Turkey 10,636,744 12,633,823 18.8% 13,508,190 6.9% 11,119,000 13.6%
LM Malta 735,327 728,121 -1.0% 739,493 1.6% 607,164 19.9%
LI Italy 8,117,393 8,405,300 3.5% 8,622,035 2.6% 9,070,636 -7.3%
LC Cyprus 1,326,579 1,391,682 4.9% 1,471,271 5.7% 1,340,000 3.9%
LH Hungary 2,100,927 2,348,191 11.8% 2,475,670 5.4% 2,186,850 7.4%
EN Norway 2,050,929 2,205,831 7.6% 2,304,395 4.5% 1,842,584 19.7%
EK Denmark 1,523,724 1,543,200 1.3% 1,581,878 2.5% 1,605,336 -3.9%
LJ Slovenia 411,103 458,712 11.6% 495,342 8.0% 473,976 -3.2%
LR Romania 3,751,523 4,169,360 11.1% 4,422,659 6.1% 4,008,000 4.0%
LK Czech Republic 2,374,021 2,438,047 2.7% 2,547,569 4.5% 2,499,820 -2.5%
ES Sweden 3,208,684 3,305,307 3.0% 3,452,590 4.5% 3,393,000 -2.6%
LZ Slovakia 984,989 1,069,851 8.6% 1,100,046 2.8% 1,017,625 5.1%
LD Croatia 1,694,578 1,736,786 2.5% 1,813,670 4.4% 1,811,316 -4.1%
LB Bulgaria 2,057,979 2,684,740 30.5% 2,897,638 7.9% 2,117,995 26.8%
LW FYROM 177,596 235,023 32.3% 272,852 16.1% 203,400 15.5%
LU Moldova 240,411 146,401 -39.1% 136,105 -7.0% 257,000 -43.0%
EF Finland 770,452 793,087 2.9% 818,184 3.2% 940,000 -15.6%
LA Albania 455,595 483,302 6.1% 521,457 7.9% 475,118 1.7%
LQ Bosnia-Herzegovina 654,113 775,084 18.5% 857,608 10.6% 692,530 11.9%
UD Armenia 149,164 149,561 0.3% 169,869 13.6% 155,000 -3.5%
LY BelgradeB 1,638,512 1,734,516 5.9% 1,780,959 2.7% 1,685,316 2.9%
EP Poland 3,983,698 4,022,192 1.0% 4,211,498 4.7% 4,161,000 -3.3%
EY Lithuania 450,551 489,644 8.7% 523,471 6.9% 467,097 4.8%
EE Estonia 740,986 784,861 5.9% 816,701 4.1% . .
EV LatviaC 733,633 773,157 5.4% 802,490 3.8% 765,000 1.1%
UK UkraineD 4,931,009 3,056,868 -38.0% 2,639,017 -13.7% . .
UG GeorgiaF 747,417 718,608 -3.9% 764,359 6.4% . .
Charging Area 2013 Actual
TSU
2014 STATFOR
Forecast TSU
2014/2013 Forecast Growth
2015 STATFOR
Forecast TSU
2015/2014 Forecast Growth
2014 States Forecast
TSU
2014 STATFOR
/ States
CRCO88 CRCO88 69,718,383 72,100,625 3.4% 74,186,163 2.9% 76,956,130 -6.3%
ESRA02 ESRA02 116,097,048 122,845,667 5.8% 127,541,295 3.8% 126,490,831 -2.9%
CRCO11 CRCO11 124,162,313 131,273,123 5.7% 136,408,648 3.9% 134,891,893 -2.7%
SES29 RP1 Region 105,235,330 109,999,477 4.5% 113,805,830 3.5% 114,133,400 -3.6%
RP2 Region RP2 Region 106,929,908 111,736,263 4.5% 115,619,500 3.5% 115,944,716 -3.6%
TOTAL Total E 130,581,725 135,833,460 4.0% 140,628,725 3.5% 134,891,893 2.7%
E
(A)
Includes service units for flight segments performed as Operational Air Traffic. 63.919 service units concerned for 2013. Est imated number for the coming years is 65.000 per year.
(B) The charging zone over Serbia and Montenegro has been renamed Belgrade (Annex 1 of the Conditions of Application of the Route
Charges System, Text approved by the enlarged Commission and entered into force on 20.5.2011).
(C) Latvia has only joined EUROCONTROL member states in 2011. Before that date, only yearly data was available for the TSU
(D) Ukraine and Estonia are not part of the CRCO but have asked STATFOR to produce an individual forecast.
(E) Percentage corrected for missing state forecasts (only Total): it represents the difference between the total state forecast and total
STATFOR forecast for all countries but Ukraine, Estonia and Georgia. (F)
Georgia was forecasted for the first time in May14 Intermediate Forecast.

FINAL
EUROCONTROL/NMD/STATFOR Page 62
Figure 52. Forecast Summary: Annual chargeable en-route service units 2014-2015.
Charging Area 2013 Actual
TSU
2014 STATFOR Forecast TSU
2015 STATFOR Forecast TSU
2013 Actual Exempted SU in %
2013 Actual Chargeable SU in %
2014 Chargeable SU Estimate
2015 Chargeable SU Estimate
EB Belgium/Luxembourg 2,277,014 2,353,043 2,438,507 1.0% 99.0% 2,328,500 2,413,000
ED GermanyA 12,569,982 12,882,191 13,218,858 0.9% 99.1% 12,764,100 13,097,600
LF France 17,899,945 18,609,073 19,161,475 0.9% 99.1% 18,435,800 18,983,100
EG UK 9,754,933 9,986,551 10,158,591 1.4% 98.6% 9,849,400 10,019,100
EH Netherlands 2,701,735 2,757,953 2,838,813 1.0% 99.0% 2,729,800 2,809,900
EI Ireland 3,812,940 3,988,491 4,176,705 1.3% 98.7% 3,935,600 4,121,400
LS Switzerland 1,384,957 1,417,413 1,466,022 0.3% 99.7% 1,413,700 1,462,200
LP Lisbon FIR 2,876,753 3,056,786 3,163,945 1.0% 99.0% 3,025,500 3,131,600
LO Austria 2,456,012 2,604,287 2,693,188 0.2% 99.8% 2,598,200 2,686,900
LE Spain 8,447,044 8,757,202 8,932,765 0.9% 99.1% 8,675,600 8,849,600
GC Canary Islands 1,515,812 1,523,624 1,578,484 0.8% 99.2% 1,511,600 1,566,000
AZ Santa Maria FIR 4,021,257 4,164,011 4,358,808 2.1% 97.9% 4,076,800 4,267,500
LG Greece 4,215,705 4,451,581 4,695,547 2.3% 97.7% 4,348,800 4,587,100
LT Turkey 10,636,744 12,633,823 13,508,190 1.0% 99.0% 12,506,300 13,371,800
LM Malta 735,327 728,121 739,493 3.5% 96.5% 702,700 713,700
LI Italy 8,117,393 8,405,300 8,622,035 1.8% 98.2% 8,255,100 8,468,000
LC Cyprus 1,326,579 1,391,682 1,471,271 1.4% 98.6% 1,372,000 1,450,400
LH Hungary 2,100,927 2,348,191 2,475,670 1.7% 98.3% 2,308,200 2,433,500
EN Norway 2,050,929 2,205,831 2,304,395 0.8% 99.2% 2,187,500 2,285,300
EK Denmark 1,523,724 1,543,200 1,581,878 0.6% 99.4% 1,534,300 1,572,700
LJ Slovenia 411,103 458,712 495,342 0.4% 99.6% 457,100 493,600
LR Romania 3,751,523 4,169,360 4,422,659 1.8% 98.2% 4,095,700 4,344,500
LK Czech Republic 2,374,021 2,438,047 2,547,569 2.2% 97.8% 2,384,300 2,491,400
ES Sweden 3,208,684 3,305,307 3,452,590 0.4% 99.6% 3,291,800 3,438,500
LZ Slovakia 984,989 1,069,851 1,100,046 1.6% 98.4% 1,052,400 1,082,100
LD Croatia 1,694,578 1,736,786 1,813,670 0.2% 99.8% 1,733,200 1,809,900
LB Bulgaria 2,057,979 2,684,740 2,897,638 1.0% 99.0% 2,657,200 2,867,900
LW FYROM 177,596 235,023 272,852 0.1% 99.9% 234,800 272,600
LU Moldova 240,411 146,401 136,105 0.1% 99.9% 146,300 136,000
EF Finland 770,452 793,087 818,184 0.9% 99.1% 786,300 811,100
LA Albania 455,595 483,302 521,457 0.3% 99.7% 481,700 519,700
LQ Bosnia-Herzegovina 654,113 775,084 857,608 0.1% 99.9% 774,400 856,900
UD Armenia 149,164 149,561 169,869 0.1% 99.9% 149,500 169,800
LY Belgrade 1,638,512 1,734,516 1,780,959 0.1% 99.9% 1,732,800 1,779,200
EP Poland 3,983,698 4,022,192 4,211,498 0.5% 99.5% 4,003,500 4,191,900
EY Lithuania 450,551 489,644 523,471 0.4% 99.6% 487,900 521,600
EE Estonia 740,986 784,861 816,701 . . . .
EV Latvia 733,633 773,157 802,490 0.5% 99.5% 769,400 798,600
UK Ukraine 4,931,009 3,056,868 2,639,017 0.2% 99.8% 3,052,100 2,634,900
UG Georgia 747,417 718,608 764,359 5.8% 94.2% 676,600 719,600
CRCO88 CRCO88 69,718,383 72,100,625 74,186,163 1.0% 99.0% 71,344,200 73,407,900
ESRA02 ESRA02 116,097,048 122,845,667 127,541,295 1.2% 98.8% 121,398,100 126,038,400
CRCO11 CRCO11 124,162,313 131,273,123 136,408,648 1.1% 98.9% 129,797,700 134,875,500
SES29 RP1Region 105,235,330 109,999,477 113,805,830 1.8% 98.2% 107,974,500 111,710,700
RP2Region RP2Region 106,929,908 111,736,263 115,619,500 1.8% 98.2% 109,708,200 113,521,000
TOTAL Total 130,581,725 135,833,460 140,628,725 1.7% 98.3% 133,557,600 138,272,500
(A) Includes service units for flight segments performed as Operational Air Traffic. 63.919 service units concerned for 2013. Estimated number for the coming
years is 65.000 per year.

FINAL
EUROCONTROL/NMD/STATFOR Page 63
F. Seven-year en-route service units forecast per State
The corresponding growth percentages are given in the next annex.
Figure 53. Forecast of the total number of en-route service units (thousands) per State.
Total en-route service units (thousands)
2010 2011 2012 2013 2014 2015 2016 2017 2018 2019 2020
2020/ 2013 Total
Growth
RP1 2014/ 2011
AAGR
RP2 2019/ 2014
AAGR
Albania H . . . . 486 534 562 587 609 635 666 46% . .
B 404 448 443 456 483 521 539 555 571 590 610 34% . .
L . . . . 481 508 515 523 531 540 549 21% . .
Armenia H . . . . 152 181 199 216 233 253 274 84% . .
B 146 170 154 149 150 170 182 194 206 220 234 57% . .
L . . . . 147 159 166 174 182 190 199 33% . .
Austria H . . . . 2,618 2,764 2,907 3,027 3,150 3,272 3,422 39% 1.3% 4.6%
B 2,449 2,519 2,469 2,456 2,604 2,693 2,777 2,850 2,928 3,014 3,102 26% 1.1% 3.0%
L . . . . 2,590 2,621 2,645 2,673 2,708 2,743 2,781 13% 0.9% 1.2%
Belgium/
Luxembourg
H . . . . 2,361 2,477 2,586 2,677 2,778 2,880 2,975 31% 2.2% 4.1%
B 2,115 2,212 2,232 2,277 2,353 2,439 2,510 2,572 2,643 2,716 2,791 23% 2.1% 2.9%
L . . . . 2,345 2,394 2,421 2,448 2,484 2,522 2,563 13% 2.0% 1.5%
Belgrade H . . . . 1,748 1,836 1,943 2,034 2,116 2,214 2,330 42% .
B 1,819 1,831 1,719 1,639 1,735 1,781 1,848 1,907 1,967 2,039 2,113 29% .
L . . . . 1,721 1,724 1,751 1,779 1,811 1,844 1,881 15% .
Bosnia-
Herzegovina
H . . . . 781 885 949 1,000 1,048 1,100 1,159 77% . .
B 637 717 680 654 775 858 899 933 965 1,001 1,038 59% . .
L . . . . 769 830 851 867 883 899 917 40% . .
Bulgaria H . . . . 2,699 2,969 3,187 3,379 3,524 3,733 3,984 94% 10.2% 6.7%
B 1,840 2,019 2,020 2,058 2,685 2,898 3,048 3,183 3,310 3,474 3,642 77% 10.0% 5.3%
L . . . . 2,670 2,824 2,900 2,974 3,057 3,141 3,231 57% 9.8% 3.3%
Canary
Islands
H . . . . 1,532 1,623 1,683 1,736 1,798 1,863 1,929 27% -2.7% 4.0%
B 1,540 1,666 1,599 1,516 1,524 1,578 1,605 1,628 1,657 1,688 1,719 13% -2.9% 2.1%
L . . . . 1,515 1,534 1,531 1,533 1,539 1,545 1,552 2% -3.1% 0.4%
Croatia H . . . . 1,746 1,864 1,968 2,060 2,148 2,246 2,358 39% 2.2% 5.2%
B 1,451 1,634 1,679 1,695 1,737 1,814 1,876 1,933 1,992 2,060 2,131 26% 2.0% 3.5%
L . . . . 1,727 1,763 1,783 1,808 1,837 1,867 1,901 12% 1.9% 1.6%
Cyprus H . . . . 1,398 1,508 1,630 1,747 1,850 1,985 2,144 62% 1.2% 7.3%
B 1,352 1,347 1,303 1,327 1,392 1,471 1,555 1,638 1,716 1,814 1,920 45% 1.1% 5.4%
L . . . . 1,385 1,435 1,479 1,528 1,578 1,633 1,691 27% 0.9% 3.3%
Czech
Republic
H . . . . 2,457 2,639 2,791 2,923 3,059 3,192 3,332 40% 2.2% 5.4%
B 2,190 2,305 2,305 2,374 2,438 2,548 2,637 2,717 2,795 2,881 2,971 25% 1.9% 3.4%
L . . . . 2,419 2,456 2,485 2,518 2,552 2,585 2,626 11% 1.6% 1.3%
Denmark H . . . . 1,549 1,612 1,681 1,741 1,805 1,870 1,926 26% 1.8% 3.8%
B 1,411 1,470 1,429 1,524 1,543 1,582 1,628 1,668 1,710 1,753 1,795 18% 1.6% 2.6%
L . . . . 1,537 1,548 1,562 1,577 1,595 1,612 1,632 7% 1.5% 1.0%
Estonia H . . . . 789 834 886 933 984 1,038 1,094 48% 3.8% 5.6%
B 627 704 725 741 785 817 847 874 905 937 969 31% 3.7% 3.6%
L . . . . 781 799 809 821 836 851 866 17% 3.5% 1.7%
FYROM H . . . . 236 280 296 310 324 339 357 101% . .
B 183 194 174 178 235 273 284 293 303 313 325 83% . .
L . . . . 234 266 271 275 280 286 292 64% . .

FINAL
EUROCONTROL/NMD/STATFOR Page 64
Total en-route service units (thousands)
2010 2011 2012 2013 2014 2015 2016 2017 2018 2019 2020
2020/ 2013 Total
Growth
RP1 2014/ 2011
AAGR
RP2 2019/ 2014
AAGR
Finland H . . . . 797 838 873 905 940 977 1,016 32% -1.4% 4.2%
B 740 832 790 770 793 818 839 857 877 899 923 20% -1.6% 2.5%
L . . . . 789 798 804 810 818 826 836 9% -1.8% 0.9%
France H . . . . 18,658 19,427 20,225 20,849 21,530 22,200 22,823 28% 1.8% 3.5%
B 16,637 17,691 17,515 17,900 18,609 19,161 19,654 20,028 20,468 20,947 21,424 20% 1.7% 2.4%
L . . . . 18,559 18,862 18,990 19,105 19,278 19,473 19,686 10% 1.6% 1.0%
Georgia H . . . . 726 799 884 963 1,035 1,124 1,229 64% . .
B 659 728 709 747 719 764 825 883 941 1,011 1,084 45% . .
L . . . . 711 730 768 805 847 890 936 25% . .
Germany H . . . . 12,919 13,424 13,990 14,455 14,946 15,412 15,908 27% 0.5% 3.6%
B 12,294 12,740 12,513 12,570 12,882 13,219 13,566 13,849 14,152 14,474 14,813 18% 0.4% 2.4%
L . . . . 12,844 12,997 13,092 13,189 13,310 13,431 13,586 8% 0.3% 0.9%
Greece H . . . . 4,485 4,850 5,142 5,405 5,651 5,947 6,290 49% -0.5% 5.8%
B 4,454 4,546 4,358 4,216 4,452 4,696 4,887 5,064 5,243 5,452 5,678 35% -0.7% 4.1%
L . . . . 4,418 4,538 4,624 4,712 4,813 4,916 5,032 19% -0.9% 2.2%
Hungary H . . . . 2,364 2,552 2,730 2,885 3,031 3,194 3,382 61% 4.6% 6.2%
B 2,091 2,067 2,023 2,101 2,348 2,476 2,589 2,691 2,792 2,907 3,024 44% 4.3% 4.4%
L . . . . 2,332 2,398 2,450 2,503 2,560 2,617 2,676 27% 4.1% 2.3%
Ireland H . . . . 4,002 4,227 4,380 4,515 4,658 4,798 4,940 30% 2.0% 3.7%
B 3,615 3,771 3,806 3,813 3,988 4,177 4,298 4,401 4,509 4,617 4,730 24% 1.9% 3.0%
L . . . . 3,975 4,123 4,210 4,271 4,335 4,402 4,476 17% 1.8% 2.1%
Italy H . . . . 8,451 8,829 9,286 9,660 10,041 10,448 10,879 34% 0.3% 4.3%
B 8,621 8,370 8,139 8,117 8,405 8,622 8,891 9,114 9,355 9,618 9,886 22% 0.1% 2.7%
L . . . . 8,359 8,405 8,476 8,551 8,647 8,747 8,850 9% -0.0% 0.9%
Latvia H . . . . 777 827 878 924 972 1,023 1,075 47% 3.4% 5.7%
B 634 702 707 734 773 802 827 849 872 898 923 26% 3.3% 3.0%
L . . . . 769 779 784 790 798 807 816 11% 3.1% 1.0%
Lisbon FIR H . . . . 3,069 3,231 3,374 3,496 3,634 3,775 3,910 36% 2.8% 4.2%
B 2,624 2,821 2,782 2,877 3,057 3,164 3,240 3,304 3,380 3,457 3,535 23% 2.7% 2.5%
L . . . . 3,044 3,095 3,105 3,122 3,147 3,171 3,197 11% 2.6% 0.8%
Lithuania H . . . . 493 541 576 607 640 674 708 57% 5.5% 6.5%
B 371 420 430 451 490 523 543 560 579 598 617 37% 5.3% 4.1%
L . . . . 486 506 512 520 528 536 544 21% 5.0% 2.0%
Malta H . . . . 735 770 844 912 977 1,057 1,149 56% 13.2% 7.5%
B 487 506 641 735 728 739 791 837 883 937 994 35% 12.9% 5.2%
L . . . . 722 710 739 765 793 823 853 16% 12.6% 2.7%
Moldova H . . . . 149 145 157 167 178 190 203 -15% . .
B 181 195 206 240 146 136 144 150 158 166 174 -28% . .
L . . . . 144 127 131 135 139 144 148 -38% . .
Netherlands H . . . . 2,768 2,885 2,996 3,089 3,192 3,294 3,380 25% 2.2% 3.5%
B 2,476 2,595 2,587 2,702 2,758 2,839 2,913 2,974 3,043 3,114 3,176 18% 2.0% 2.5%
L . . . . 2,748 2,786 2,809 2,830 2,860 2,890 2,924 8% 1.9% 1.0%
Norway H . . . . 2,215 2,346 2,445 2,537 2,628 2,730 2,824 38% 8.9% 4.3%
B 1,583 1,713 1,846 2,051 2,206 2,304 2,375 2,438 2,500 2,567 2,634 28% 8.8% 3.1%
L . . . . 2,197 2,260 2,286 2,311 2,337 2,366 2,393 17% 8.6% 1.5%

FINAL
EUROCONTROL/NMD/STATFOR Page 65
Total en-route service units (thousands)
2010 2011 2012 2013 2014 2015 2016 2017 2018 2019 2020
2020/ 2013 Total
Growth
RP1 2014/ 2011
AAGR
RP2 2019/ 2014
AAGR
Poland H . . . . 4,038 4,302 4,607 4,866 5,145 5,430 5,705 43% 3.2% 6.1%
B 3,313 3,676 3,854 3,984 4,022 4,211 4,395 4,549 4,716 4,893 5,070 27% 3.0% 4.0%
L . . . . 4,006 4,122 4,195 4,264 4,344 4,424 4,504 13% 2.9% 2.0%
Romania H . . . . 4,194 4,515 4,849 5,142 5,399 5,722 6,089 62% 5.9% 6.4%
B 3,414 3,533 3,575 3,752 4,169 4,423 4,651 4,852 5,050 5,289 5,532 47% 5.7% 4.9%
L . . . . 4,145 4,329 4,447 4,557 4,681 4,806 4,937 32% 5.5% 3.0%
Santa
Maria FIR
H . . . . 4,190 4,445 4,638 4,804 4,995 5,188 5,371 34% 1.7% 4.4%
B 3,696 3,983 3,874 4,021 4,164 4,359 4,497 4,608 4,737 4,867 4,997 24% 1.5% 3.2%
L . . . . 4,138 4,266 4,337 4,388 4,455 4,520 4,589 14% 1.3% 1.8%
Slovakia H . . . . 1,076 1,131 1,215 1,288 1,362 1,442 1,530 55% 6.1% 6.0%
B 856 900 922 985 1,070 1,100 1,155 1,203 1,253 1,309 1,365 39% 5.9% 4.1%
L . . . . 1,063 1,069 1,096 1,121 1,149 1,178 1,208 23% 5.7% 2.1%
Slovenia H . . . . 461 508 537 561 584 608 638 55% 2.8% 5.7%
B 365 425 425 411 459 495 514 529 545 562 581 41% 2.6% 4.2%
L . . . . 456 482 490 497 505 513 522 27% 2.4% 2.4%
Spain H . . . . 8,792 9,121 9,544 9,898 10,302 10,715 11,116 32% -1.1% 4.0%
B 8,642 9,099 8,444 8,447 8,757 8,933 9,182 9,397 9,647 9,905 10,160 20% -1.3% 2.5%
L . . . . 8,721 8,732 8,787 8,868 8,976 9,083 9,189 9% -1.4% 0.8%
Sweden H . . . . 3,318 3,518 3,701 3,851 4,006 4,168 4,320 35% 1.4% 4.7%
B 2,950 3,185 3,126 3,209 3,305 3,453 3,574 3,669 3,768 3,871 3,976 24% 1.2% 3.2%
L . . . . 3,292 3,384 3,431 3,467 3,509 3,551 3,596 12% 1.1% 1.5%
Switzerland H . . . . 1,423 1,495 1,558 1,607 1,659 1,704 1,756 27% -0.2% 3.7%
B 1,409 1,431 1,399 1,385 1,417 1,466 1,505 1,536 1,572 1,609 1,647 19% -0.3% 2.6%
L . . . . 1,411 1,435 1,446 1,457 1,472 1,487 1,503 9% -0.5% 1.0%
Turkey H . . . . 12,690 13,812 15,123 16,364 17,326 18,632 20,184 90% . .
B 8,923 9,618 9,813 10,637 12,634 13,508 14,528 15,471 16,344 17,468 18,638 75% . .
L . . . . 12,578 13,203 13,830 14,430 15,071 15,728 16,447 55% . .
UK H . . . . 10,026 10,331 10,638 10,875 11,144 11,412 11,657 19% 0.6% 2.6%
B 9,480 9,860 9,608 9,755 9,987 10,159 10,343 10,476 10,640 10,808 10,983 13% 0.4% 1.6%
L . . . . 9,947 9,977 10,039 10,061 10,113 10,167 10,237 5% 0.3% 0.4%
Ukraine H . . . . 3,087 2,782 3,011 3,201 3,399 3,629 3,880 -21% . .
B 4,188 4,465 4,588 4,931 3,057 2,639 2,785 2,901 3,029 3,178 3,334 -32% . .
L . . . . 3,027 2,496 2,565 2,621 2,695 2,772 2,853 -42% . .
ESRA02 H . . . . 123,380 130,133 136,974 142,867 148,620 154,995 161,793 39% . .
B 110,070 115,248 113,602 116,097 122,846 127,541 132,056 135,929 139,970 144,557 149,265 29% . .
L . . . . 122,306 124,817 126,699 128,484 130,598 132,772 135,154 16% . .
BLUE
MED FAB
H . . . . 15,068 15,956 16,902 17,725 18,519 19,436 20,463 42% 0.7% 5.2%
B 14,914 14,770 14,441 14,395 14,977 15,528 16,124 16,653 17,197 17,820 18,478 28% 0.5% 3.5%
L . . . . 14,884 15,088 15,319 15,557 15,832 16,119 16,426 14% 0.3% 1.6%
Baltic FAB H . . . . 4,531 4,842 5,183 5,473 5,784 6,104 6,413 45% 3.4% 6.1%
B 3,684 4,096 4,284 4,434 4,512 4,735 4,937 5,109 5,295 5,491 5,687 28% 3.3% 4.0%
L . . . . 4,493 4,628 4,707 4,783 4,872 4,961 5,049 14% 3.1% 2.0%
Danube FAB H . . . . 6,892 7,484 8,036 8,521 8,924 9,455 10,073 73% 7.5% 6.5%
B 5,254 5,551 5,595 5,810 6,854 7,320 7,699 8,035 8,359 8,763 9,175 58% 7.3% 5.0%
L . . . . 6,815 7,153 7,347 7,531 7,738 7,948 8,168 41% 7.1% 3.1%

FINAL
EUROCONTROL/NMD/STATFOR Page 66
Total en-route service units (thousands)
2010 2011 2012 2013 2014 2015 2016 2017 2018 2019 2020
2020/ 2013 Total
Growth
RP1 2014/ 2011
AAGR
RP2 2019/ 2014
AAGR
FAB CE H . . . . 11,504 12,342 13,097 13,745 14,382 15,055 15,821 48% 2.9% 5.5%
B 10,039 10,567 10,503 10,676 11,431 11,983 12,448 12,855 13,270 13,734 14,211 33% 2.7% 3.7%
L . . . . 11,358 11,618 11,800 11,986 12,194 12,402 12,631 18% 2.4% 1.8%
FABEC H . . . . 38,129 39,708 41,355 42,677 44,105 45,490 46,843 27% 1.3% 3.6%
B 34,931 36,669 36,246 36,834 38,020 39,124 40,148 40,960 41,878 42,861 43,850 19% 1.2% 2.4%
L . . . . 37,907 38,474 38,759 39,028 39,404 39,803 40,262 9% 1.1% 1.0%
NEFAB H . . . . 4,578 4,845 5,083 5,300 5,525 5,769 6,009 40% 5.0% 4.7%
B 3,583 3,952 4,068 4,296 4,557 4,742 4,888 5,018 5,154 5,301 5,448 27% 4.9% 3.1%
L . . . . 4,536 4,637 4,683 4,732 4,788 4,849 4,912 14% 4.7% 1.3%
South West
FAB
H . . . . 13,394 13,974 14,601 15,130 15,734 16,354 16,955 32% -0.5% 4.1%
B 12,806 13,586 12,825 12,840 13,338 13,675 14,027 14,328 14,684 15,051 15,414 20% -0.6% 2.4%
L . . . . 13,280 13,361 13,423 13,523 13,662 13,800 13,938 9% -0.8% 0.8%
UK-Ireland
FAB
H . . . . 14,028 14,558 15,017 15,390 15,802 16,210 16,597 22% 1.0% 2.9%
B 13,095 13,632 13,414 13,568 13,975 14,335 14,640 14,876 15,149 15,425 15,713 16% 0.8% 2.0%
L . . . . 13,922 14,100 14,249 14,332 14,447 14,568 14,713 8% 0.7% 0.9%
DK-SE FAB H . . . . 4,868 5,130 5,382 5,592 5,811 6,037 6,246 32% 1.5% 4.4%
B 4,361 4,655 4,555 4,732 4,849 5,034 5,202 5,337 5,478 5,624 5,772 22% 1.4% 3.0%
L . . . . 4,829 4,932 4,993 5,044 5,104 5,163 5,227 10% 1.2% 1.3%
CRCO88 H . . . . 72,360 75,449 78,519 81,028 83,786 86,514 89,188 28% 0.9% 3.6%
B 66,977 70,390 68,828 69,718 72,101 74,186 76,090 77,622 79,376 81,217 83,075 19% 0.8% 2.4%
L . . . . 71,837 72,821 73,413 73,944 74,677 75,434 76,283 9% 0.7% 1.0%
CRCO11 H . . . . 131,855 139,239 146,688 153,101 159,383 166,325 173,710 40% 2.3% 4.8%
B 117,393 123,211 121,589 124,162 131,273 136,409 141,289 145,476 149,847 154,796 159,869 29% 2.1% 3.4%
L . . . . 130,685 133,446 135,474 137,399 139,675 142,013 144,565 16% 2.0% 1.7%
RP1Region H . . . . 110,465 116,091 121,739 126,492 131,389 136,564 141,902 35% 1.7% 4.3%
B 100,579 105,126 103,572 105,235 109,999 113,806 117,339 120,306 123,508 127,009 130,578 24% 1.5% 2.9%
L . . . . 109,528 111,399 112,647 113,842 115,321 116,846 118,509 13% 1.4% 1.3%
RP2Region H . . . . 112,212 117,955 123,707 128,552 133,537 138,810 144,260 35% 1.7% 4.3%
B 102,030 106,761 105,251 106,930 111,736 115,619 119,214 122,239 125,500 129,069 132,710 24% 1.5% 2.9%
L . . . . 111,255 113,161 114,431 115,650 117,158 118,713 120,410 13% 1.4% 1.3%
Total H . . . . 136,457 143,654 151,469 158,197 164,800 172,116 179,912 38% 1.9% 4.8%
B 122,867 129,108 127,611 130,582 135,833 140,629 145,746 150,135 154,722 159,922 165,257 27% 1.7% 3.3%
L . . . . 135,204 137,471 139,616 141,647 144,052 146,525 149,220 14% 1.5% 1.6%

FINAL
EUROCONTROL/NMD/STATFOR Page 67
G. Seven-year en-route growth in service units forecast per State
This appendix presents the same data as the previous, but presented as growth rather than counts of service units.
Figure 54. Forecast of the total en-route service units growth per State.
TSU Annual growth
2010 2011 2012 2013 2014 2015 2016 2017 2018 2019 2020
AAGR 2020/ 2013
RP1 2014/2011
AAGR
RP2 2019/2014
AAGR
Albania H . . . . 6.6% 9.9% 5.3% 4.3% 3.9% 4.3% 4.8% 5.6% . .
B 13.9% 10.8% -1.0% 2.9% 6.1% 7.9% 3.4% 2.9% 2.9% 3.3% 3.4% 4.3% . .
L . . . . 5.5% 5.7% 1.4% 1.4% 1.6% 1.6% 1.8% 2.7% . .
Armenia H . . . . 1.9% 19.2% 9.8% 8.6% 7.9% 8.4% 8.4% 9.1% . .
B 31.5% 16.1% -9.5% -2.9% 0.3% 13.6% 7.3% 6.5% 6.3% 6.6% 6.5% 6.7% . .
L . . . . -1.4% 7.9% 4.8% 4.5% 4.5% 4.6% 4.5% 4.2% . .
Austria H . . . . 6.6% 5.5% 5.2% 4.1% 4.1% 3.9% 4.6% 4.9% 1.3% 4.6%
B 1.0% 2.9% -2.0% -0.5% 6.0% 3.4% 3.1% 2.6% 2.7% 2.9% 2.9% 3.4% 1.1% 3.0%
L . . . . 5.5% 1.2% 0.9% 1.1% 1.3% 1.3% 1.4% 1.8% 0.9% 1.2%
Belgium/
Luxembourg
H . . . . 3.7% 4.9% 4.4% 3.5% 3.8% 3.7% 3.3% 3.9% 2.2% 4.1%
B 1.7% 4.6% 0.9% 2.0% 3.3% 3.6% 2.9% 2.5% 2.7% 2.8% 2.7% 2.9% 2.1% 2.9%
L . . . . 3.0% 2.1% 1.1% 1.1% 1.5% 1.5% 1.6% 1.7% 2.0% 1.5%
Belgrade H . . . . 6.7% 5.1% 5.8% 4.7% 4.0% 4.6% 5.2% 5.2% . .
B 2.0% 0.6% -6.1% -4.7% 5.9% 2.7% 3.8% 3.2% 3.1% 3.6% 3.6% 3.7% . .
L . . . . 5.0% 0.2% 1.6% 1.6% 1.8% 1.8% 2.0% 2.0% . .
Bosnia-
Herzegovina
H . . . . 19.4% 13.3% 7.2% 5.5% 4.7% 5.0% 5.3% 8.5% . .
B 10.1% 12.5% -5.1% -3.8% 18.5% 10.6% 4.9% 3.7% 3.4% 3.7% 3.7% 6.8% . .
L . . . . 17.6% 7.9% 2.5% 1.9% 1.9% 1.9% 1.9% 4.9% . .
Bulgaria H . . . . 31.1% 10.0% 7.3% 6.0% 4.3% 5.9% 6.7% 9.9% 10.2% 6.7%
B 2.3% 9.7% 0.1% 1.9% 30.5% 7.9% 5.2% 4.4% 4.0% 5.0% 4.8% 8.5% 10.0% 5.3%
L . . . . 29.8% 5.8% 2.7% 2.5% 2.8% 2.8% 2.9% 6.7% 9.8% 3.3%
Canary
Islands
H . . . . 1.1% 5.9% 3.7% 3.1% 3.6% 3.6% 3.5% 3.5% -2.7% 4.0%
B 3.2% 8.2% -4.0% -5.2% 0.5% 3.6% 1.7% 1.4% 1.8% 1.8% 1.9% 1.8% -2.9% 2.1%
L . . . . -0.1% 1.3% -0.2% 0.1% 0.4% 0.4% 0.4% 0.3% -3.1% 0.4%
Croatia H . . . . 3.1% 6.7% 5.6% 4.7% 4.3% 4.6% 5.0% 4.8% 2.2% 5.2%
B 11.8% 12.6% 2.7% 0.9% 2.5% 4.4% 3.4% 3.0% 3.1% 3.4% 3.4% 3.3% 2.0% 3.5%
L . . . . 1.9% 2.1% 1.2% 1.4% 1.6% 1.7% 1.8% 1.7% 1.9% 1.6%
Cyprus H . . . . 5.4% 7.8% 8.1% 7.2% 5.9% 7.3% 8.0% 7.1% 1.2% 7.3%
B 6.2% -0.3% -3.3% 1.8% 4.9% 5.7% 5.7% 5.3% 4.8% 5.7% 5.8% 5.4% 1.1% 5.4%
L . . . . 4.4% 3.6% 3.1% 3.3% 3.3% 3.4% 3.6% 3.5% 0.9% 3.3%
Czech
Republic
H . . . . 3.5% 7.4% 5.8% 4.7% 4.7% 4.3% 4.4% 5.0% 2.2% 5.4%
B 8.3% 5.2% -0.0% 3.0% 2.7% 4.5% 3.5% 3.0% 2.9% 3.0% 3.1% 3.3% 1.9% 3.4%
L . . . . 1.9% 1.5% 1.2% 1.3% 1.3% 1.3% 1.6% 1.5% 1.6% 1.3%
Denmark H . . . . 1.7% 4.1% 4.3% 3.6% 3.7% 3.6% 3.0% 3.4% 1.8% 3.8%
B 3.8% 4.2% -2.8% 6.6% 1.3% 2.5% 2.9% 2.4% 2.5% 2.5% 2.4% 2.4% 1.6% 2.6%
L . . . . 0.9% 0.7% 0.9% 0.9% 1.1% 1.1% 1.2% 1.0% 1.5% 1.0%
Estonia H . . . . 6.4% 5.8% 6.2% 5.3% 5.5% 5.5% 5.3% 5.7% 3.8% 5.6%
B -0.8% 12.3% 2.9% 2.3% 5.9% 4.1% 3.7% 3.2% 3.5% 3.6% 3.5% 3.9% 3.7% 3.6%
L . . . . 5.4% 2.3% 1.3% 1.5% 1.7% 1.8% 1.9% 2.3% 3.5% 1.7%
FYROM H . . . . 33.2% 18.3% 5.9% 4.7% 4.5% 4.6% 5.2% 10.5% . .
B 1.7% 5.9% -10.2% 1.9% 32.3% 16.1% 3.9% 3.2% 3.3% 3.6% 3.7% 9.0% . .
L . . . . 31.5% 13.8% 1.8% 1.7% 1.9% 1.9% 2.1% 7.3% . .

FINAL
EUROCONTROL/NMD/STATFOR Page 68
TSU Annual growth
2010 2011 2012 2013 2014 2015 2016 2017 2018 2019 2020
AAGR 2020/ 2013
RP1 2014/2011
AAGR
RP2 2019/2014
AAGR
Finland H . . . . 3.5% 5.1% 4.2% 3.7% 3.8% 4.0% 3.9% 4.0% -1.4% 4.2%
B 1.7% 12.6% -5.1% -2.5% 2.9% 3.2% 2.5% 2.2% 2.3% 2.5% 2.6% 2.6% -1.6% 2.5%
L . . . . 2.4% 1.2% 0.7% 0.7% 0.9% 1.1% 1.2% 1.2% -1.8% 0.9%
France H . . . . 4.2% 4.1% 4.1% 3.1% 3.3% 3.1% 2.8% 3.5% 1.8% 3.5%
B -0.9% 6.3% -1.0% 2.2% 4.0% 3.0% 2.6% 1.9% 2.2% 2.3% 2.3% 2.6% 1.7% 2.4%
L . . . . 3.7% 1.6% 0.7% 0.6% 0.9% 1.0% 1.1% 1.4% 1.6% 1.0%
Georgia H . . . . -2.9% 10.0% 10.6% 8.9% 7.5% 8.7% 9.3% 7.4% . .
B 19.4% 10.5% -2.5% 5.4% -3.9% 6.4% 8.0% 7.0% 6.6% 7.4% 7.2% 5.5% . .
L . . . . -4.9% 2.6% 5.2% 4.9% 5.1% 5.1% 5.1% 3.3% . .
Germany H . . . . 2.8% 3.9% 4.2% 3.3% 3.4% 3.1% 3.2% 3.4% 0.5% 3.6%
B 3.2% 3.6% -1.8% 0.5% 2.5% 2.6% 2.6% 2.1% 2.2% 2.3% 2.3% 2.4% 0.4% 2.4%
L . . . . 2.2% 1.2% 0.7% 0.7% 0.9% 0.9% 1.2% 1.1% 0.3% 0.9%
Greece H . . . . 6.4% 8.1% 6.0% 5.1% 4.5% 5.2% 5.8% 5.9% -0.5% 5.8%
B 7.6% 2.1% -4.2% -3.3% 5.6% 5.5% 4.1% 3.6% 3.5% 4.0% 4.1% 4.3% -0.7% 4.1%
L . . . . 4.8% 2.7% 1.9% 1.9% 2.1% 2.2% 2.4% 2.6% -0.9% 2.2%
Hungary H . . . . 12.5% 8.0% 6.9% 5.7% 5.1% 5.4% 5.9% 7.0% 4.6% 6.2%
B 2.6% -1.2% -2.1% 3.8% 11.8% 5.4% 4.6% 3.9% 3.8% 4.1% 4.0% 5.3% 4.3% 4.4%
L . . . . 11.0% 2.8% 2.2% 2.1% 2.3% 2.2% 2.3% 3.5% 4.1% 2.3%
Ireland H . . . . 5.0% 5.6% 3.6% 3.1% 3.2% 3.0% 3.0% 3.8% 2.0% 3.7%
B 1.5% 4.3% 0.9% 0.2% 4.6% 4.7% 2.9% 2.4% 2.5% 2.4% 2.5% 3.1% 1.9% 3.0%
L . . . . 4.2% 3.7% 2.1% 1.4% 1.5% 1.5% 1.7% 2.3% 1.8% 2.1%
Italy H . . . . 4.1% 4.5% 5.2% 4.0% 4.0% 4.0% 4.1% 4.3% 0.3% 4.3%
B 5.9% -2.9% -2.8% -0.3% 3.5% 2.6% 3.1% 2.5% 2.6% 2.8% 2.8% 2.9% 0.1% 2.7%
L . . . . 3.0% 0.6% 0.8% 0.9% 1.1% 1.2% 1.2% 1.2% -0.0% 0.9%
Latvia H . . . . 6.0% 6.4% 6.2% 5.2% 5.2% 5.3% 5.0% 5.6% 3.4% 5.7%
B 6.4% 10.8% 0.7% 3.8% 5.4% 3.8% 3.1% 2.6% 2.8% 2.9% 2.8% 3.3% 3.3% 3.0%
L . . . . 4.8% 1.3% 0.6% 0.8% 1.1% 1.1% 1.2% 1.5% 3.1% 1.0%
Lisbon FIR H . . . . 6.7% 5.3% 4.4% 3.6% 4.0% 3.9% 3.6% 4.5% 2.8% 4.2%
B 4.9% 7.5% -1.4% 3.4% 6.3% 3.5% 2.4% 2.0% 2.3% 2.3% 2.2% 3.0% 2.7% 2.5%
L . . . . 5.8% 1.7% 0.3% 0.6% 0.8% 0.8% 0.8% 1.5% 2.6% 0.8%
Lithuania H . . . . 9.4% 9.7% 6.5% 5.3% 5.4% 5.4% 5.0% 6.7% 5.5% 6.5%
B 8.7% 13.2% 2.3% 4.9% 8.7% 6.9% 3.7% 3.2% 3.3% 3.4% 3.1% 4.6% 5.3% 4.1%
L . . . . 7.9% 4.2% 1.2% 1.4% 1.6% 1.6% 1.5% 2.7% 5.0% 2.0%
Malta H . . . . -0.1% 4.8% 9.6% 8.1% 7.1% 8.2% 8.8% 6.6% 13.2% 7.5%
B 17.0% 3.9% 26.8% 14.7% -1.0% 1.6% 6.9% 5.9% 5.5% 6.1% 6.1% 4.4% 12.9% 5.2%
L . . . . -1.9% -1.7% 4.1% 3.6% 3.6% 3.7% 3.7% 2.1% 12.6% 2.7%
Moldova H . . . . -38.2% -2.6% 8.1% 6.8% 6.7% 6.9% 6.7% -2.4% . .
B 30.7% 7.4% 5.7% 16.8% -39.1% -7.0% 5.5% 4.8% 4.9% 5.1% 5.1% -4.5% . .
L . . . . -40.0% -11.6% 3.0% 2.9% 3.2% 3.2% 3.2% -6.7% . .
Netherlands H . . . . 2.4% 4.2% 3.8% 3.1% 3.3% 3.2% 2.6% 3.3% 2.2% 3.5%
B 2.1% 4.8% -0.3% 4.4% 2.1% 2.9% 2.6% 2.1% 2.3% 2.3% 2.0% 2.3% 2.0% 2.5%
L . . . . 1.7% 1.4% 0.8% 0.7% 1.1% 1.0% 1.2% 1.1% 1.9% 1.0%
Norway H . . . . 8.0% 5.9% 4.2% 3.8% 3.6% 3.9% 3.4% 4.7% 8.9% 4.3%
B 5.9% 8.2% 7.8% 11.1% 7.6% 4.5% 3.1% 2.6% 2.5% 2.7% 2.6% 3.6% 8.8% 3.1%
L . . . . 7.1% 2.9% 1.1% 1.1% 1.1% 1.2% 1.2% 2.2% 8.6% 1.5%
Poland H . . . . 1.4% 6.5% 7.1% 5.6% 5.7% 5.5% 5.1% 5.3% 3.2% 6.1%
B 7.1% 11.0% 4.8% 3.4% 1.0% 4.7% 4.3% 3.5% 3.7% 3.8% 3.6% 3.5% 3.0% 4.0%
L . . . . 0.6% 2.9% 1.8% 1.6% 1.9% 1.9% 1.8% 1.8% 2.9% 2.0%

FINAL
EUROCONTROL/NMD/STATFOR Page 69
TSU Annual growth
2010 2011 2012 2013 2014 2015 2016 2017 2018 2019 2020
AAGR 2020/ 2013
RP1 2014/2011
AAGR
RP2 2019/2014
AAGR
Romania H . . . . 11.8% 7.7% 7.4% 6.0% 5.0% 6.0% 6.4% 7.2% 5.9% 6.4%
B 9.0% 3.5% 1.2% 4.9% 11.1% 6.1% 5.2% 4.3% 4.1% 4.7% 4.6% 5.7% 5.7% 4.9%
L . . . . 10.5% 4.4% 2.7% 2.5% 2.7% 2.7% 2.7% 4.0% 5.5% 3.0%
Santa
Maria FIR
H . . . . 4.2% 6.1% 4.4% 3.6% 4.0% 3.9% 3.5% 4.2% 1.7% 4.4%
B 6.3% 7.8% -2.7% 3.8% 3.5% 4.7% 3.2% 2.5% 2.8% 2.7% 2.7% 3.2% 1.5% 3.2%
L . . . . 2.9% 3.1% 1.7% 1.2% 1.5% 1.4% 1.5% 1.9% 1.3% 1.8%
Slovakia H . . . . 9.3% 5.1% 7.4% 6.0% 5.7% 5.9% 6.1% 6.5% 6.1% 6.0%
B 11.5% 5.2% 2.4% 6.9% 8.6% 2.8% 5.0% 4.1% 4.2% 4.4% 4.3% 4.8% 5.9% 4.1%
L . . . . 8.0% 0.5% 2.5% 2.3% 2.6% 2.5% 2.5% 3.0% 5.7% 2.1%
Slovenia H . . . . 12.2% 10.2% 5.8% 4.3% 4.2% 4.1% 4.8% 6.5% 2.8% 5.7%
B 10.3% 16.3% 0.1% -3.3% 11.6% 8.0% 3.8% 2.9% 3.0% 3.2% 3.2% 5.1% 2.6% 4.2%
L . . . . 10.9% 5.7% 1.7% 1.4% 1.6% 1.6% 1.7% 3.5% 2.4% 2.4%
Spain H . . . . 4.1% 3.7% 4.6% 3.7% 4.1% 4.0% 3.7% 4.0% -1.1% 4.0%
B 3.4% 5.3% -7.2% 0.0% 3.7% 2.0% 2.8% 2.3% 2.7% 2.7% 2.6% 2.7% -1.3% 2.5%
L . . . . 3.2% 0.1% 0.6% 0.9% 1.2% 1.2% 1.2% 1.2% -1.4% 0.8%
Sweden H . . . . 3.4% 6.0% 5.2% 4.0% 4.0% 4.0% 3.7% 4.3% 1.4% 4.7%
B 1.5% 7.9% -1.8% 2.6% 3.0% 4.5% 3.5% 2.7% 2.7% 2.7% 2.7% 3.1% 1.2% 3.2%
L . . . . 2.6% 2.8% 1.4% 1.1% 1.2% 1.2% 1.3% 1.6% 1.1% 1.5%
Switzerland H . . . . 2.8% 5.0% 4.2% 3.2% 3.2% 2.7% 3.0% 3.4% -0.2% 3.7%
B 0.9% 1.5% -2.3% -1.0% 2.3% 3.4% 2.7% 2.1% 2.3% 2.4% 2.3% 2.5% -0.3% 2.6%
L . . . . 1.9% 1.7% 0.8% 0.8% 1.0% 1.0% 1.1% 1.2% -0.5% 1.0%
Turkey H . . . . 19.3% 8.8% 9.5% 8.2% 5.9% 7.5% 8.3% 9.6% . .
B 10.4% 7.8% 2.0% 8.4% 18.8% 6.9% 7.6% 6.5% 5.6% 6.9% 6.7% 8.3% . .
L . . . . 18.2% 5.0% 4.7% 4.3% 4.4% 4.4% 4.6% 6.4% . .
UK H . . . . 2.8% 3.0% 3.0% 2.2% 2.5% 2.4% 2.1% 2.6% 0.6% 2.6%
B -4.4% 4.0% -2.6% 1.5% 2.4% 1.7% 1.8% 1.3% 1.6% 1.6% 1.6% 1.7% 0.4% 1.6%
L . . . . 2.0% 0.3% 0.6% 0.2% 0.5% 0.5% 0.7% 0.7% 0.3% 0.4%
Ukraine H . . . . -37.4% -9.9% 8.2% 6.3% 6.2% 6.8% 6.9% -3.4% . .
B 12.4% 6.6% 2.8% 7.5% -38.0% -13.7% 5.5% 4.2% 4.4% 4.9% 4.9% -5.4% . .
L . . . . -38.6% -17.5% 2.8% 2.2% 2.8% 2.9% 2.9% -7.5% . .
ESRA02 H . . . . 6.3% 5.5% 5.3% 4.3% 4.0% 4.3% 4.4% 4.9% . .
B 3.3% 4.7% -1.4% 2.2% 5.8% 3.8% 3.5% 2.9% 3.0% 3.3% 3.3% 3.7% . .
L . . . . 5.3% 2.1% 1.5% 1.4% 1.6% 1.7% 1.8% 2.2% . .
BLUE
MED FAB
H . . . . 4.7% 5.9% 5.9% 4.9% 4.5% 5.0% 5.3% 5.2% 0.7% 5.2%
B 6.7% -1.0% -2.2% -0.3% 4.0% 3.7% 3.8% 3.3% 3.3% 3.6% 3.7% 3.6% 0.5% 3.5%
L . . . . 3.4% 1.4% 1.5% 1.6% 1.8% 1.8% 1.9% 1.9% 0.3% 1.6%
Baltic FAB H . . . . 2.2% 6.9% 7.0% 5.6% 5.7% 5.5% 5.1% 5.4% 3.4% 6.1%
B 7.3% 11.2% 4.6% 3.5% 1.7% 4.9% 4.3% 3.5% 3.6% 3.7% 3.6% 3.6% 3.3% 4.0%
L . . . . 1.3% 3.0% 1.7% 1.6% 1.8% 1.8% 1.8% 1.9% 3.1% 2.0%
Danube FAB H . . . . 18.6% 8.6% 7.4% 6.0% 4.7% 6.0% 6.5% 8.2% 7.5% 6.5%
B 6.5% 5.7% 0.8% 3.8% 18.0% 6.8% 5.2% 4.4% 4.0% 4.8% 4.7% 6.7% 7.3% 5.0%
L . . . . 17.3% 5.0% 2.7% 2.5% 2.7% 2.7% 2.8% 5.0% 7.1% 3.1%
FAB CE H . . . . 7.8% 7.3% 6.1% 4.9% 4.6% 4.7% 5.1% 5.8% 2.9% 5.5%
B 6.1% 5.3% -0.6% 1.6% 7.1% 4.8% 3.9% 3.3% 3.2% 3.5% 3.5% 4.2% 2.7% 3.7%
L . . . . 6.4% 2.3% 1.6% 1.6% 1.7% 1.7% 1.8% 2.4% 2.4% 1.8%
FABEC H . . . . 3.5% 4.1% 4.1% 3.2% 3.3% 3.1% 3.0% 3.5% 1.3% 3.6%
B 1.0% 5.0% -1.2% 1.6% 3.2% 2.9% 2.6% 2.0% 2.2% 2.3% 2.3% 2.5% 1.2% 2.4%
L . . . . 2.9% 1.5% 0.7% 0.7% 1.0% 1.0% 1.2% 1.3% 1.1% 1.0%

FINAL
EUROCONTROL/NMD/STATFOR Page 70
TSU Annual growth
2010 2011 2012 2013 2014 2015 2016 2017 2018 2019 2020
AAGR 2020/ 2013
RP1 2014/2011
AAGR
RP2 2019/2014
AAGR
NEFAB H . . . . 6.6% 5.8% 4.9% 4.3% 4.2% 4.4% 4.2% 4.9% 5.0% 4.7%
B 3.9% 10.3% 2.9% 5.6% 6.1% 4.1% 3.1% 2.7% 2.7% 2.8% 2.8% 3.5% 4.9% 3.1%
L . . . . 5.6% 2.2% 1.0% 1.0% 1.2% 1.3% 1.3% 1.9% 4.7% 1.3%
South West FAB
H . . . . 4.3% 4.3% 4.5% 3.6% 4.0% 3.9% 3.7% 4.1% -0.5% 4.1%
B 3.7% 6.1% -5.6% 0.1% 3.9% 2.5% 2.6% 2.2% 2.5% 2.5% 2.4% 2.6% -0.6% 2.4%
L . . . . 3.4% 0.6% 0.5% 0.7% 1.0% 1.0% 1.0% 1.2% -0.8% 0.8%
UK-Ireland
FAB
H . . . . 3.4% 3.8% 3.2% 2.5% 2.7% 2.6% 2.4% 2.9% 1.0% 2.9%
B -2.8% 4.1% -1.6% 1.1% 3.0% 2.6% 2.1% 1.6% 1.8% 1.8% 1.9% 2.1% 0.8% 2.0%
L . . . . 2.6% 1.3% 1.1% 0.6% 0.8% 0.8% 1.0% 1.2% 0.7% 0.9%
DK-SE FAB H . . . . 2.9% 5.4% 4.9% 3.9% 3.9% 3.9% 3.5% 4.0% 1.5% 4.4%
B 2.2% 6.7% -2.1% 3.9% 2.5% 3.8% 3.3% 2.6% 2.7% 2.7% 2.6% 2.9% 1.4% 3.0%
L . . . . 2.0% 2.1% 1.2% 1.0% 1.2% 1.2% 1.2% 1.4% 1.2% 1.3%
CRCO88 H . . . . 3.8% 4.3% 4.1% 3.2% 3.4% 3.3% 3.1% 3.6% 0.9% 3.6%
B 1.0% 5.1% -2.2% 1.3% 3.4% 2.9% 2.6% 2.0% 2.3% 2.3% 2.3% 2.5% 0.8% 2.4%
L . . . . 3.0% 1.4% 0.8% 0.7% 1.0% 1.0% 1.1% 1.3% 0.7% 1.0%
CRCO11 H . . . . 6.2% 5.6% 5.4% 4.4% 4.1% 4.4% 4.4% 4.9% 2.3% 4.8%
B 3.5% 5.0% -1.3% 2.1% 5.7% 3.9% 3.6% 3.0% 3.0% 3.3% 3.3% 3.7% 2.1% 3.4%
L . . . . 5.3% 2.1% 1.5% 1.4% 1.7% 1.7% 1.8% 2.2% 2.0% 1.7%
RP1Region H . . . . 5.0% 5.1% 4.9% 3.9% 3.9% 3.9% 3.9% 4.4% 1.7% 4.3%
B 2.6% 4.5% -1.5% 1.6% 4.5% 3.5% 3.1% 2.5% 2.7% 2.8% 2.8% 3.1% 1.5% 2.9%
L . . . . 4.1% 1.7% 1.1% 1.1% 1.3% 1.3% 1.4% 1.7% 1.4% 1.3%
RP2Region H . . . . 4.9% 5.1% 4.9% 3.9% 3.9% 3.9% 3.9% 4.4% 1.7% 4.3%
B 2.7% 4.6% -1.4% 1.6% 4.5% 3.5% 3.1% 2.5% 2.7% 2.8% 2.8% 3.1% 1.5% 2.9%
L . . . . 4.0% 1.7% 1.1% 1.1% 1.3% 1.3% 1.4% 1.7% 1.4% 1.3%
Total H . . . . 4.5% 5.3% 5.4% 4.4% 4.2% 4.4% 4.5% 4.7% 1.9% 4.8%
B 3.8% 5.1% -1.2% 2.3% 4.0% 3.5% 3.6% 3.0% 3.1% 3.4% 3.3% 3.4% 1.7% 3.3%
L . . . . 3.5% 1.7% 1.6% 1.5% 1.7% 1.7% 1.8% 1.9% 1.5% 1.6%
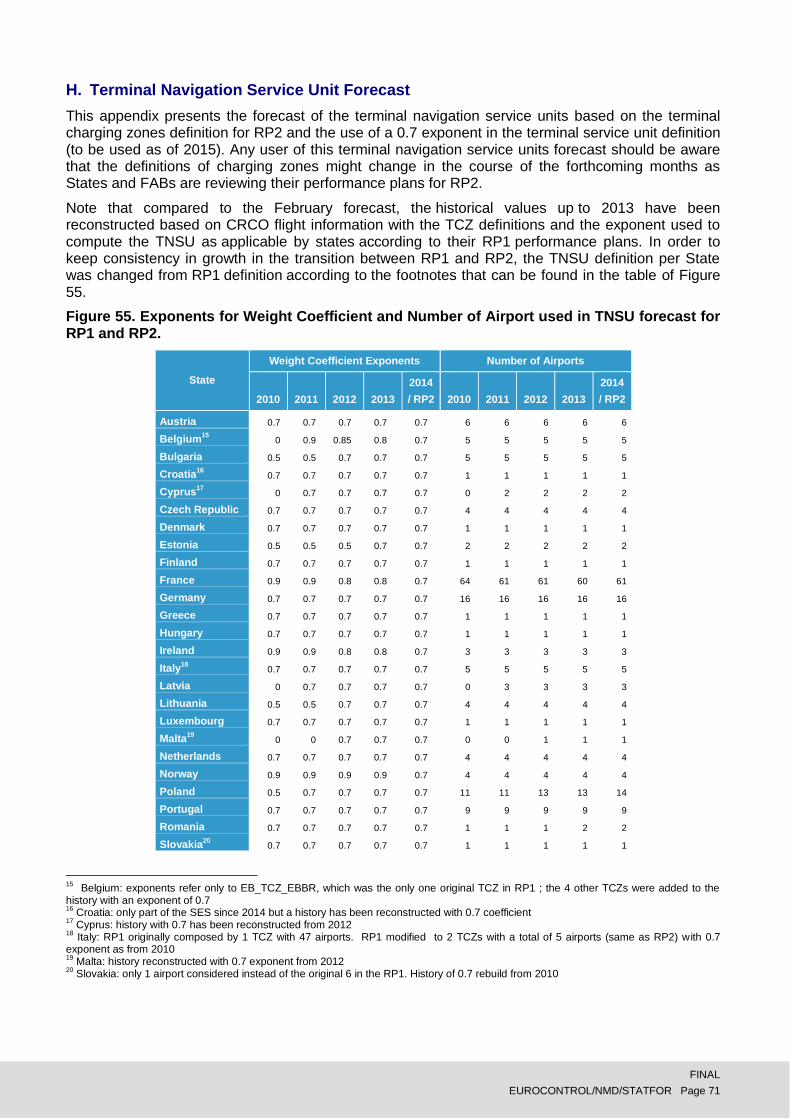
FINAL
EUROCONTROL/NMD/STATFOR Page 71
H. Terminal Navigation Service Unit Forecast
This appendix presents the forecast of the terminal navigation service units based on the terminal charging zones definition for RP2 and the use of a 0.7 exponent in the terminal service unit definition (to be used as of 2015). Any user of this terminal navigation service units forecast should be aware that the definitions of charging zones might change in the course of the forthcoming months as States and FABs are reviewing their performance plans for RP2.
Note that compared to the February forecast, the historical values up to 2013 have been reconstructed based on CRCO flight information with the TCZ definitions and the exponent used to compute the TNSU as applicable by states according to their RP1 performance plans. In order to keep consistency in growth in the transition between RP1 and RP2, the TNSU definition per State was changed from RP1 definition according to the footnotes that can be found in the table of Figure 55.
Figure 55. Exponents for Weight Coefficient and Number of Airport used in TNSU forecast for RP1 and RP2.
State
Weight Coefficient Exponents Number of Airports
2010 2011 2012 2013
2014
/ RP2 2010 2011 2012 2013
2014
/ RP2
Austria 0.7 0.7 0.7 0.7 0.7 6 6 6 6 6
Belgium15
0 0.9 0.85 0.8 0.7 5 5 5 5 5
Bulgaria 0.5 0.5 0.7 0.7 0.7 5 5 5 5 5
Croatia16
0.7 0.7 0.7 0.7 0.7 1 1 1 1 1
Cyprus17
0 0.7 0.7 0.7 0.7 0 2 2 2 2
Czech Republic 0.7 0.7 0.7 0.7 0.7 4 4 4 4 4
Denmark 0.7 0.7 0.7 0.7 0.7 1 1 1 1 1
Estonia 0.5 0.5 0.5 0.7 0.7 2 2 2 2 2
Finland 0.7 0.7 0.7 0.7 0.7 1 1 1 1 1
France 0.9 0.9 0.8 0.8 0.7 64 61 61 60 61
Germany 0.7 0.7 0.7 0.7 0.7 16 16 16 16 16
Greece 0.7 0.7 0.7 0.7 0.7 1 1 1 1 1
Hungary 0.7 0.7 0.7 0.7 0.7 1 1 1 1 1
Ireland 0.9 0.9 0.8 0.8 0.7 3 3 3 3 3
Italy18
0.7 0.7 0.7 0.7 0.7 5 5 5 5 5
Latvia 0 0.7 0.7 0.7 0.7 0 3 3 3 3
Lithuania 0.5 0.5 0.7 0.7 0.7 4 4 4 4 4
Luxembourg 0.7 0.7 0.7 0.7 0.7 1 1 1 1 1
Malta19
0 0 0.7 0.7 0.7 0 0 1 1 1
Netherlands 0.7 0.7 0.7 0.7 0.7 4 4 4 4 4
Norway 0.9 0.9 0.9 0.9 0.7 4 4 4 4 4
Poland 0.5 0.7 0.7 0.7 0.7 11 11 13 13 14
Portugal 0.7 0.7 0.7 0.7 0.7 9 9 9 9 9
Romania 0.7 0.7 0.7 0.7 0.7 1 1 1 2 2
Slovakia20
0.7 0.7 0.7 0.7 0.7 1 1 1 1 1
15
Belgium: exponents refer only to EB_TCZ_EBBR, which was the only one original TCZ in RP1 ; the 4 other TCZs were added to the history with an exponent of 0.7 16
Croatia: only part of the SES since 2014 but a history has been reconstructed with 0.7 coefficient 17
Cyprus: history with 0.7 has been reconstructed from 2012 18
Italy: RP1 originally composed by 1 TCZ with 47 airports. RP1 modified to 2 TCZs with a total of 5 airports (same as RP2) with 0.7 exponent as from 2010 19
Malta: history reconstructed with 0.7 exponent from 2012 20
Slovakia: only 1 airport considered instead of the original 6 in the RP1. History of 0.7 rebuild from 2010

FINAL
EUROCONTROL/NMD/STATFOR Page 72
State
Weight Coefficient Exponents Number of Airports
2010 2011 2012 2013
2014
/ RP2 2010 2011 2012 2013
2014
/ RP2
Slovenia 0.7 0.7 0.7 0.7 0.7 3 3 3 3 3
Spain21
0.9 0.9 0.9 0.9 0.7 5 5 5 5 5
Sweden 0.7 0.7 0.7 0.7 0.7 1 1 1 1 1
Switzerland 0.65 0.65 0.65 0.65 0.7 2 2 2 2 2
UK22
0.7 0.7 0.7 0.7 0.7 9 9 9 9 9
Figure 56. Forecast of the total number of Terminal service units (thousands) per Terminal Charging Zone.
23Terminal
Navigation Service Units (thousands) 2010 2011 2012 2013 2014 2015 2016 2017 2018 2019 2020
RP1 2014 /2011
RP2 2019/ 2014
Austria
LO_TCZ
H . . . . 178.1 188.9 200.0 210.6 221.4 231.1 246.6 -1.1% 5.4%
B 180.7 184.1 179.1 174.7 177.5 183.8 190.1 196.2 202.4 209.2 216.7 -1.2% 3.3%
L . . . . 176.9 178.9 181.1 183.8 186.9 189.5 193.4 -1.3% 1.4%
Belgium
EB_TCZ_EBAW
H . . . . 2.2 2.3 2.4 2.5 2.5 2.6 2.7 1.8% 3.2%
B . 2.1 1.9 1.9 2.2 2.2 2.3 2.3 2.4 2.5 2.5 1.6% 2.3%
L . . . . 2.2 2.2 2.2 2.2 2.3 2.3 2.4 1.4% 0.8%
Belgium
EB_TCZ_EBBR
H . . . . 140.2 144.5 151.5 157.7 164.0 170.8 178.4 -3.9% 4.0%
B . 158.3 150.8 142.3 139.9 142.5 147.5 151.7 157.0 162.2 168.0 -4.0% 3.0%
L . . . . 139.4 139.9 141.6 143.7 146.4 149.1 152.0 -4.1% 1.3%
Belgium
EB_TCZ_EBCI
H . . . . 33.3 35.0 37.6 39.8 42.5 45.2 47.9 10.1% 6.3%
B . 25.0 27.9 30.2 33.2 34.3 35.9 37.5 39.3 41.2 43.1 10.0% 4.4%
L . . . . 33.1 33.4 34.2 35.1 36.1 37.1 38.1 9.8% 2.3%
Belgium
EB_TCZ_EBLG
H . . . . 24.3 25.9 27.9 29.5 31.8 35.2 37.5 -3.8% 7.7%
B . 27.3 23.5 22.9 24.2 25.4 26.9 28.3 29.5 32.8 34.5 -3.8% 6.2%
L . . . . 24.3 25.1 26.0 27.0 28.1 29.2 31.6 -3.7% 3.7%
Belgium
EB_TCZ_EBOS
H . . . . 4.1 4.3 4.6 4.8 5.1 5.4 5.7 5.1% 5.7%
B . 3.5 3.4 3.2 4.1 4.2 4.4 4.6 4.9 5.1 5.3 5.0% 4.4%
L . . . . 4.1 4.2 4.2 4.4 4.5 4.6 4.8 4.9% 2.5%
Bulgaria
LB_TCZ
H . . . . 45.5 48.4 53.2 58.0 63.3 68.6 74.4 3.5% 8.5%
B 39.4 41.1 41.5 41.7 45.4 47.0 49.4 52.9 56.1 60.2 63.9 3.4% 5.8%
L . . . . 45.2 45.8 46.9 48.5 50.4 52.7 55.5 3.2% 3.1%
Croatia
LD_TCZ
H . . . . 17.4 18.3 18.6 19.5 20.3 20.9 21.7 1.3% 3.8%
B 16.2 16.7 16.0 15.8 17.3 18.0 17.9 18.4 19.2 19.6 20.1 1.2% 2.5%
L . . . . 17.2 17.4 17.5 17.4 17.7 18.2 18.4 1.0% 1.2%
21
Spain: only 5 airports considered for RP1, instead of the original 12. The original exponent of 0.9 of RP1 was kept 22
UK: RP1 originally with 2 TCZs with a total of 13 airports. Modified to equal RP2 structure with 1 TCZ (EG_TCZ_B) composed by 9 airports 23
Forecasts for small TCZs with only one airport are published with high risk

FINAL
EUROCONTROL/NMD/STATFOR Page 73
23Terminal
Navigation Service Units (thousands) 2010 2011 2012 2013 2014 2015 2016 2017 2018 2019 2020
RP1 2014 /2011
RP2 2019/ 2014
Cyprus
LC_TCZ
H . . . . 43.6 46.5 49.9 53.2 58.1 62.6 68.3 -0.2% 7.5%
B . 43.9 42.5 39.0 43.4 44.9 46.7 48.1 50.5 53.0 56.4 -0.3% 4.0%
L . . . . 43.3 43.3 43.6 44.2 45.2 46.4 48.1 -0.5% 1.4%
Czech Republic
LK_TCZ
H . . . . 76.0 81.8 91.3 101.7 110.8 123.8 136.3 -3.4% 10.2%
B 82.7 84.4 75.3 73.6 75.6 79.1 84.2 89.2 94.1 99.7 105.3 -3.5% 5.7%
L . . . . 75.3 76.6 78.6 81.1 83.9 86.1 88.5 -3.7% 2.7%
Denmark
EK_TCZ
H . . . . 149.0 155.6 161.6 165.7 170.9 176.9 182.0 0.8% 3.5%
B 138.3 145.3 143.7 148.1 148.7 152.8 156.7 159.9 162.1 165.5 168.6 0.8% 2.2%
L . . . . 148.2 150.2 150.1 151.3 152.3 152.8 153.9 0.7% 0.6%
Estonia
EE_TCZ
H . . . . 15.0 16.1 17.3 18.7 21.4 24.8 26.9 -2.3% 10.6%
B 13.0 16.0 18.9 14.6 14.9 15.2 16.3 17.2 17.7 18.6 22.1 -2.4% 4.6%
L . . . . 14.7 14.7 15.1 16.8 17.4 17.9 18.1 -2.8% 4.0%
Finland
EF_TCZ
H . . . . 99.9 104.7 109.5 114.1 118.5 123.8 128.0 -2.3% 4.4%
B 93.1 107.1 97.6 97.9 99.7 102.3 104.7 106.5 109.0 111.5 114.2 -2.4% 2.3%
L . . . . 99.4 100.1 100.3 100.4 101.1 101.8 102.7 -2.5% 0.5%
France
LF_TCZ
H . . . . 1026.8 1046.7 1087.7 1120.8 1153.7 1184.0 1219.3 -3.6% 2.9%
B 1094.7 1145.6 1092.6 1090.6 1024.6 1032.7 1060.4 1077.6 1097.2 1126.6 1156.9 -3.7% 1.9%
L . . . . 1022.3 1013.4 1020.4 1020.7 1027.6 1038.5 1053.9 -3.7% 0.3%
Germany
ED_TCZ
H . . . . 1311.1 1375.7 1423.9 1461.7 1512.5 1556.7 1612.3 -0.0% 3.5%
B 1255.2 1311.6 1295.5 1282.1 1309.1 1358.1 1386.1 1405.9 1431.7 1462.8 1503.5 -0.1% 2.2%
L . . . . 1306.4 1335.3 1340.3 1342.8 1354.0 1370.0 1392.3 -0.1% 1.0%
Greece
LG_TCZ
H . . . . 82.7 83.1 84.8 86.8 88.8 91.1 94.0 -4.9% 2.0%
B 103.8 96.4 83.0 74.5 82.5 82.0 83.5 84.6 86.1 88.0 90.1 -5.0% 1.3%
L . . . . 82.5 80.0 80.4 80.7 81.3 82.5 83.6 -5.0% -0.0%
Hungary
LH_TCZ
H . . . . 52.8 56.7 62.3 67.4 73.0 78.1 84.7 -3.6% 8.1%
B 56.0 59.0 49.6 49.2 52.6 55.2 57.6 60.0 63.2 65.8 69.4 -3.8% 4.6%
L . . . . 52.3 53.5 53.9 54.5 55.6 56.7 57.8 -4.0% 1.6%
Ireland
EI_TCZ
H . . . . 136.2 140.3 144.5 150.1 158.1 164.7 171.1 0.0% 3.9%
B 137.6 136.0 129.5 136.7 136.1 139.7 143.3 147.3 152.8 158.1 164.0 0.0% 3.0%
L . . . . 136.0 138.4 140.8 143.2 146.1 150.1 155.0 0.0% 2.0%
Italy
LI_TCZ_1
H . . . . 212.8 217.2 226.9 233.9 241.7 250.0 258.6 -1.9% 3.3%
B 226.8 225.7 217.7 210.0 212.7 214.1 219.1 222.4 226.6 231.1 236.1 -2.0% 1.7%
L . . . . 212.1 208.9 208.7 208.3 208.8 208.5 208.6 -2.1% -0.3%
Italy
LI_TCZ_2
H . . . . 281.4 290.1 306.7 320.0 335.1 350.9 369.3 -1.2% 4.5%
B 281.8 292.1 285.7 275.3 280.6 284.4 294.2 302.8 311.5 321.2 331.1 -1.3% 2.7%
L . . . . 279.9 277.6 279.8 282.6 286.4 289.8 294.0 -1.4% 0.7%
Latvia
EV_TCZ
H . . . . 32.2 34.4 37.9 40.6 44.0 48.4 51.7 -0.1% 8.5%
B . 32.2 31.5 32.4 31.7 32.2 33.2 33.8 34.6 35.1 35.9 -0.6% 2.1%
L . . . . 31.7 30.7 30.5 30.1 29.9 29.9 29.8 -0.5% -1.2%
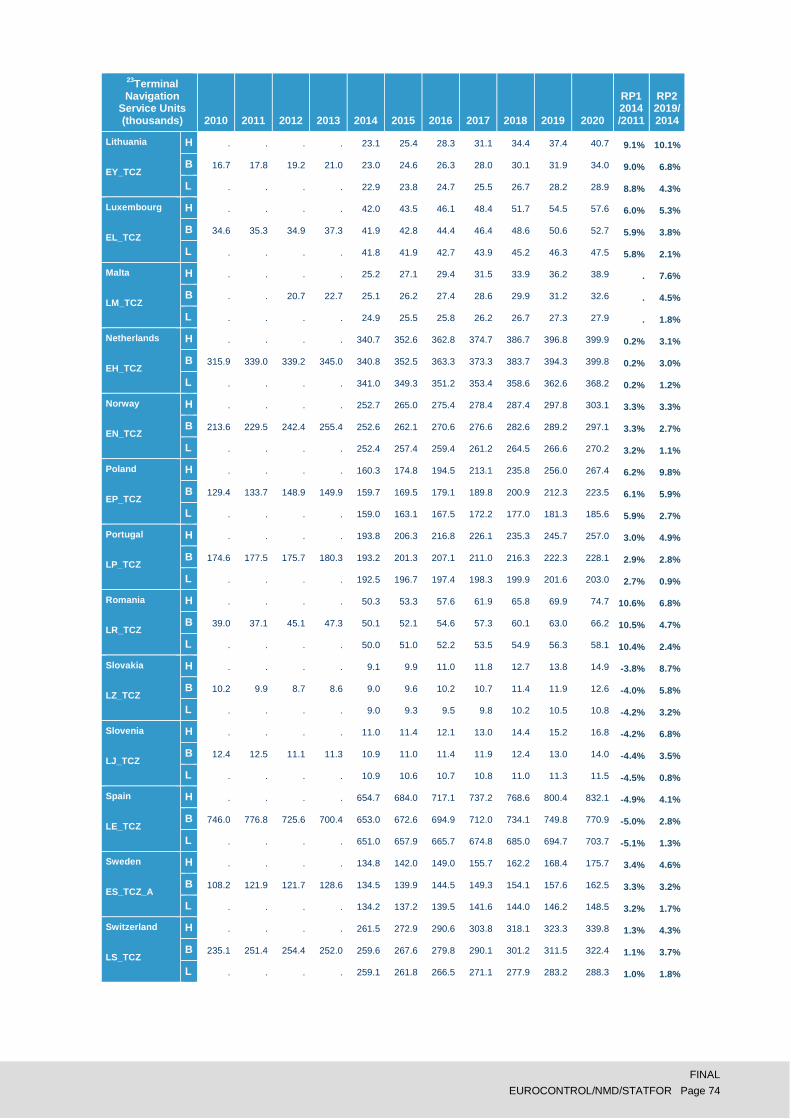
FINAL
EUROCONTROL/NMD/STATFOR Page 74
23Terminal
Navigation Service Units (thousands) 2010 2011 2012 2013 2014 2015 2016 2017 2018 2019 2020
RP1 2014 /2011
RP2 2019/ 2014
Lithuania
EY_TCZ
H . . . . 23.1 25.4 28.3 31.1 34.4 37.4 40.7 9.1% 10.1%
B 16.7 17.8 19.2 21.0 23.0 24.6 26.3 28.0 30.1 31.9 34.0 9.0% 6.8%
L . . . . 22.9 23.8 24.7 25.5 26.7 28.2 28.9 8.8% 4.3%
Luxembourg
EL_TCZ
H . . . . 42.0 43.5 46.1 48.4 51.7 54.5 57.6 6.0% 5.3%
B 34.6 35.3 34.9 37.3 41.9 42.8 44.4 46.4 48.6 50.6 52.7 5.9% 3.8%
L . . . . 41.8 41.9 42.7 43.9 45.2 46.3 47.5 5.8% 2.1%
Malta
LM_TCZ
H . . . . 25.2 27.1 29.4 31.5 33.9 36.2 38.9 . 7.6%
B . . 20.7 22.7 25.1 26.2 27.4 28.6 29.9 31.2 32.6 . 4.5%
L . . . . 24.9 25.5 25.8 26.2 26.7 27.3 27.9 . 1.8%
Netherlands
EH_TCZ
H . . . . 340.7 352.6 362.8 374.7 386.7 396.8 399.9 0.2% 3.1%
B 315.9 339.0 339.2 345.0 340.8 352.5 363.3 373.3 383.7 394.3 399.8 0.2% 3.0%
L . . . . 341.0 349.3 351.2 353.4 358.6 362.6 368.2 0.2% 1.2%
Norway
EN_TCZ
H . . . . 252.7 265.0 275.4 278.4 287.4 297.8 303.1 3.3% 3.3%
B 213.6 229.5 242.4 255.4 252.6 262.1 270.6 276.6 282.6 289.2 297.1 3.3% 2.7%
L . . . . 252.4 257.4 259.4 261.2 264.5 266.6 270.2 3.2% 1.1%
Poland
EP_TCZ
H . . . . 160.3 174.8 194.5 213.1 235.8 256.0 267.4 6.2% 9.8%
B 129.4 133.7 148.9 149.9 159.7 169.5 179.1 189.8 200.9 212.3 223.5 6.1% 5.9%
L . . . . 159.0 163.1 167.5 172.2 177.0 181.3 185.6 5.9% 2.7%
Portugal
LP_TCZ
H . . . . 193.8 206.3 216.8 226.1 235.3 245.7 257.0 3.0% 4.9%
B 174.6 177.5 175.7 180.3 193.2 201.3 207.1 211.0 216.3 222.3 228.1 2.9% 2.8%
L . . . . 192.5 196.7 197.4 198.3 199.9 201.6 203.0 2.7% 0.9%
Romania
LR_TCZ
H . . . . 50.3 53.3 57.6 61.9 65.8 69.9 74.7 10.6% 6.8%
B 39.0 37.1 45.1 47.3 50.1 52.1 54.6 57.3 60.1 63.0 66.2 10.5% 4.7%
L . . . . 50.0 51.0 52.2 53.5 54.9 56.3 58.1 10.4% 2.4%
Slovakia
LZ_TCZ
H . . . . 9.1 9.9 11.0 11.8 12.7 13.8 14.9 -3.8% 8.7%
B 10.2 9.9 8.7 8.6 9.0 9.6 10.2 10.7 11.4 11.9 12.6 -4.0% 5.8%
L . . . . 9.0 9.3 9.5 9.8 10.2 10.5 10.8 -4.2% 3.2%
Slovenia
LJ_TCZ
H . . . . 11.0 11.4 12.1 13.0 14.4 15.2 16.8 -4.2% 6.8%
B 12.4 12.5 11.1 11.3 10.9 11.0 11.4 11.9 12.4 13.0 14.0 -4.4% 3.5%
L . . . . 10.9 10.6 10.7 10.8 11.0 11.3 11.5 -4.5% 0.8%
Spain
LE_TCZ
H . . . . 654.7 684.0 717.1 737.2 768.6 800.4 832.1 -4.9% 4.1%
B 746.0 776.8 725.6 700.4 653.0 672.6 694.9 712.0 734.1 749.8 770.9 -5.0% 2.8%
L . . . . 651.0 657.9 665.7 674.8 685.0 694.7 703.7 -5.1% 1.3%
Sweden
ES_TCZ_A
H . . . . 134.8 142.0 149.0 155.7 162.2 168.4 175.7 3.4% 4.6%
B 108.2 121.9 121.7 128.6 134.5 139.9 144.5 149.3 154.1 157.6 162.5 3.3% 3.2%
L . . . . 134.2 137.2 139.5 141.6 144.0 146.2 148.5 3.2% 1.7%
Switzerland
LS_TCZ
H . . . . 261.5 272.9 290.6 303.8 318.1 323.3 339.8 1.3% 4.3%
B 235.1 251.4 254.4 252.0 259.6 267.6 279.8 290.1 301.2 311.5 322.4 1.1% 3.7%
L . . . . 259.1 261.8 266.5 271.1 277.9 283.2 288.3 1.0% 1.8%

FINAL
EUROCONTROL/NMD/STATFOR Page 75
23Terminal
Navigation Service Units (thousands) 2010 2011 2012 2013 2014 2015 2016 2017 2018 2019 2020
RP1 2014 /2011
RP2 2019/ 2014
UK
EG_TCZ_B
. . . . 1138.0 1169.5 1213.3 1242.9 1283.1 1320.9 1359.0 1.8% 3.0%
1040.0 1080.5 1079.6 1106.0 1136.2 1158.6 1185.5 1210.4 1237.5 1257.4 1287.7 1.7% 2.0%
. . . . 1134.4 1146.4 1159.6 1174.2 1188.7 1204.4 1223.1 1.7% 1.2%
RP2 Region
H . . . . 7262.0 7554.0 7904.5 8186.6 8527.4 8851.9 9194.9 -0.4% 4.0%
B 6795.2 7376.4 7234.2 7222.2 7245.8 7440.7 7659.9 7842.6 8050.9 8265.6 8511.8 -0.4% 2.7%
L . . . . 7229.5 7301.4 7368.7 7435.0 7532.3 7633.9 7757.9 -0.5% 1.1%

FINAL
EUROCONTROL/NMD/STATFOR Page 76
Figure 57. Forecast of the total number of Terminal service units (growth) per Terminal Charging Zone.
This appendix presents the same data as the previous, but presented as growth rather than counts of terminal navigation service units.
Terminal Navigation Service Units (growth)
2010 2011 2012 2013 2014 2015 2016 2017 2018 2019 2020
RP1 2014 /2011
RP2 2019/ 2014
Austria
LO_TCZ
H . . . . 1.9% 6.1% 5.9% 5.3% 5.1% 4.4% 6.7% -1.1% 5.4%
B . 1.9% -2.7% -2.4% 1.6% 3.6% 3.5% 3.2% 3.2% 3.3% 3.6% -1.2% 3.3%
L . . . . 1.3% 1.1% 1.2% 1.5% 1.7% 1.4% 2.1% -1.3% 1.4%
Belgium
EB_TCZ_EBAW
H . . . . 19% 2.6% 5.3% 2.6% 2.6% 2.8% 2.9% 1.8% 3.2%
B . . -9.6% -1.5% 18% 0.8% 3.0% 2.1% 3.4% 1.9% 2.3% 1.6% 2.3%
L . . . . 17% -1.0% 0.9% 0.7% 1.7% 1.7% 2.5% 1.4% 0.8%
Belgium
EB_TCZ_EBBR
H . . . . -1.5% 3.1% 4.9% 4.0% 4.0% 4.2% 4.5% -3.9% 4.0%
B . . -4.7% -5.6% -1.6% 1.8% 3.5% 2.9% 3.4% 3.3% 3.6% -4.0% 3.0%
L . . . . -2.0% 0.4% 1.2% 1.5% 1.9% 1.8% 2.0% -4.1% 1.3%
Belgium
EB_TCZ_EBCI
H . . . . 11% 5.0% 7.3% 5.9% 6.6% 6.3% 6.2% 10.1% 6.3%
B . . 12% 8.3% 10% 3.1% 4.8% 4.4% 4.8% 4.7% 4.7% 10.0% 4.4%
L . . . . 9.6% 1.1% 2.3% 2.6% 2.9% 2.8% 2.8% 9.8% 2.3%
Belgium
EB_TCZ_EBLG
H . . . . 6.1% 6.7% 7.8% 5.5% 8.0% 11% 6.3% -3.8% 7.7%
B . . -14% -2.6% 6.0% 4.9% 5.7% 5.1% 4.4% 11% 5.2% -3.8% 6.2%
L . . . . 6.3% 3.1% 3.5% 3.9% 4.2% 3.8% 8.2% -3.7% 3.7%
Belgium
EB_TCZ_EBOS
H . . . . 29% 4.7% 6.5% 4.9% 6.2% 6.0% 5.8% 5.1% 5.7%
B . . -2.6% -7.5% 28% 3.0% 4.5% 4.0% 6.2% 4.4% 4.5% 5.0% 4.4%
L . . . . 28% 1.5% 2.3% 2.4% 3.2% 2.9% 3.8% 4.9% 2.5%
Bulgaria
LB_TCZ
H . . . . 9.3% 6.2% 10% 8.9% 9.1% 8.5% 8.4% 3.5% 8.5%
B . 4.2% 0.9% 0.4% 8.9% 3.7% 5.1% 7.0% 6.1% 7.2% 6.2% 3.4% 5.8%
L . . . . 8.6% 1.2% 2.6% 3.3% 3.9% 4.5% 5.3% 3.2% 3.1%
Croatia
LD_TCZ
H . . . . 10% 5.6% 1.1% 5.0% 4.0% 3.1% 3.7% 1.3% 3.8%
B . 3.2% -4.5% -1.1% 9.6% 3.8% -0.1% 2.8% 4.2% 1.8% 2.8% 1.2% 2.5%
L . . . . 9.1% 0.7% 0.9% -0.7% 1.6% 3.3% 1.1% 1.0% 1.2%
Cyprus
LC_TCZ
H . . . . 12% 6.6% 7.4% 6.7% 9.1% 7.7% 9.2% -0.2% 7.5%
B . . -3.1% -8.3% 11% 3.5% 3.8% 3.0% 5.2% 4.8% 6.5% -0.3% 4.0%
L . . . . 11% 0.0% 0.7% 1.5% 2.2% 2.8% 3.5% -0.5% 1.4%
Czech Republic
LK_TCZ
H . . . . 3.2% 7.6% 12% 11% 9.0% 12% 10% -3.4% 10.2%
B . 2.0% -11% -2.1% 2.7% 4.6% 6.5% 6.0% 5.4% 6.0% 5.6% -3.5% 5.7%
L . . . . 2.2% 1.7% 2.7% 3.1% 3.4% 2.7% 2.7% -3.7% 2.7%
Denmark
EK_TCZ
H . . . . 0.6% 4.4% 3.9% 2.5% 3.2% 3.5% 2.9% 0.8% 3.5%
B . 5.0% -1.1% 3.1% 0.4% 2.8% 2.5% 2.0% 1.4% 2.1% 1.9% 0.8% 2.2%
L . . . . 0.1% 1.3% -0.1% 0.8% 0.7% 0.3% 0.7% 0.7% 0.6%
Estonia
EE_TCZ
H . . . . 2.5% 7.7% 7.5% 7.9% 15% 16% 8.4% -2.3% 10.6%
B . 24% 18% -23% 2.0% 2.4% 7.2% 5.2% 3.3% 5.0% 18% -2.4% 4.6%
L . . . . 0.9% -0.4% 2.7% 12% 3.5% 2.6% 1.5% -2.8% 4.0%

FINAL
EUROCONTROL/NMD/STATFOR Page 77
Terminal Navigation Service Units (growth)
2010 2011 2012 2013 2014 2015 2016 2017 2018 2019 2020
RP1 2014 /2011
RP2 2019/ 2014
Finland
EF_TCZ
H . . . . 2.0% 4.8% 4.6% 4.1% 3.9% 4.4% 3.4% -2.3% 4.4%
B . 15% -8.9% 0.4% 1.8% 2.6% 2.3% 1.7% 2.4% 2.3% 2.4% -2.4% 2.3%
L . . . . 1.5% 0.7% 0.1% 0.1% 0.8% 0.7% 0.9% -2.5% 0.5%
France
LF_TCZ
H . . . . -5.9% 1.9% 3.9% 3.0% 2.9% 2.6% 3.0% -3.6% 2.9%
B . 4.7% -4.6% -0.2% -6.1% 0.8% 2.7% 1.6% 1.8% 2.7% 2.7% -3.7% 1.9%
L . . . . -6.3% -0.9% 0.7% 0.0% 0.7% 1.1% 1.5% -3.7% 0.3%
Germany
ED_TCZ
H . . . . 2.3% 4.9% 3.5% 2.7% 3.5% 2.9% 3.6% -0.0% 3.5%
B . 4.5% -1.2% -1.0% 2.1% 3.7% 2.1% 1.4% 1.8% 2.2% 2.8% -0.1% 2.2%
L . . . . 1.9% 2.2% 0.4% 0.2% 0.8% 1.2% 1.6% -0.1% 1.0%
Greece
LG_TCZ
H . . . . 11% 0.5% 2.1% 2.3% 2.4% 2.6% 3.1% -4.9% 2.0%
B . -7.1% -14% -10% 11% -0.6% 1.8% 1.4% 1.7% 2.2% 2.4% -5.0% 1.3%
L . . . . 11% -3.1% 0.5% 0.3% 0.8% 1.5% 1.4% -5.0% -0.0%
Hungary
LH_TCZ
H . . . . 7.5% 7.3% 9.9% 8.2% 8.2% 7.0% 8.5% -3.6% 8.1%
B . 5.4% -16% -0.9% 7.0% 5.0% 4.3% 4.2% 5.3% 4.0% 5.6% -3.8% 4.6%
L . . . . 6.3% 2.3% 0.7% 1.1% 2.0% 1.9% 2.0% -4.0% 1.6%
Ireland
EI_TCZ
H . . . . -0.4% 3.0% 3.0% 3.8% 5.4% 4.1% 3.9% 0.0% 3.9%
B . -1.2% -4.7% 5.5% -0.5% 2.6% 2.6% 2.8% 3.8% 3.4% 3.8% 0.0% 3.0%
L . . . . -0.5% 1.8% 1.7% 1.7% 2.0% 2.7% 3.3% 0.0% 2.0%
Italy
LI_TCZ_1
H . . . . 1.4% 2.0% 4.5% 3.1% 3.3% 3.5% 3.4% -1.9% 3.3%
B . -0.5% -3.6% -3.5% 1.3% 0.7% 2.3% 1.5% 1.9% 2.0% 2.2% -2.0% 1.7%
L . . . . 1.0% -1.5% -0.1% -0.2% 0.2% -0.1% 0.1% -2.1% -0.3%
Italy
LI_TCZ_2
H . . . . 2.2% 3.1% 5.7% 4.3% 4.7% 4.7% 5.2% -1.2% 4.5%
B . 3.7% -2.2% -3.7% 1.9% 1.4% 3.4% 2.9% 2.9% 3.1% 3.1% -1.3% 2.7%
L . . . . 1.7% -0.8% 0.8% 1.0% 1.3% 1.2% 1.4% -1.4% 0.7%
Latvia
EV_TCZ
H . . . . -0.7% 6.9% 10% 7.0% 8.3% 10% 6.8% -0.1% 8.5%
B . . -2.3% 2.9% -2.2% 1.5% 3.3% 1.8% 2.3% 1.5% 2.2% -0.6% 2.1%
L . . . . -2.0% -3.2% -0.6% -1.5% -0.7% -0.1% -0.3% -0.5% -1.2%
Lithuania
EY_TCZ
H . . . . 9.8% 9.9% 12% 9.7% 11% 8.8% 8.6% 9.1% 10.1%
B . 6.4% 8.0% 9.5% 9.3% 6.9% 7.0% 6.5% 7.5% 6.1% 6.3% 9.0% 6.8%
L . . . . 8.9% 4.2% 3.7% 3.1% 4.7% 5.6% 2.6% 8.8% 4.3%
Luxembourg
EL_TCZ
H . . . . 13% 3.6% 5.9% 5.0% 6.7% 5.4% 5.8% 6.0% 5.3%
B . 2.1% -1.0% 6.8% 12% 2.1% 3.8% 4.3% 4.8% 4.1% 4.2% 5.9% 3.8%
L . . . . 12% 0.3% 2.1% 2.7% 2.9% 2.4% 2.7% 5.8% 2.1%
Malta
LM_TCZ
H . . . . 11% 7.6% 8.7% 7.0% 7.5% 7.0% 7.3% . 7.6%
B . . . 9.7% 11% 4.6% 4.6% 4.2% 4.5% 4.3% 4.7% . 4.5%
L . . . . 10% 2.1% 1.3% 1.7% 1.7% 2.2% 2.1% . 1.8%
Netherlands
EH_TCZ
H . . . . -1.2% 3.5% 2.9% 3.3% 3.2% 2.6% 0.8% 0.2% 3.1%
B . 7.3% 0.0% 1.7% -1.2% 3.4% 3.1% 2.7% 2.8% 2.8% 1.4% 0.2% 3.0%
L . . . . -1.2% 2.4% 0.6% 0.6% 1.5% 1.1% 1.5% 0.2% 1.2%
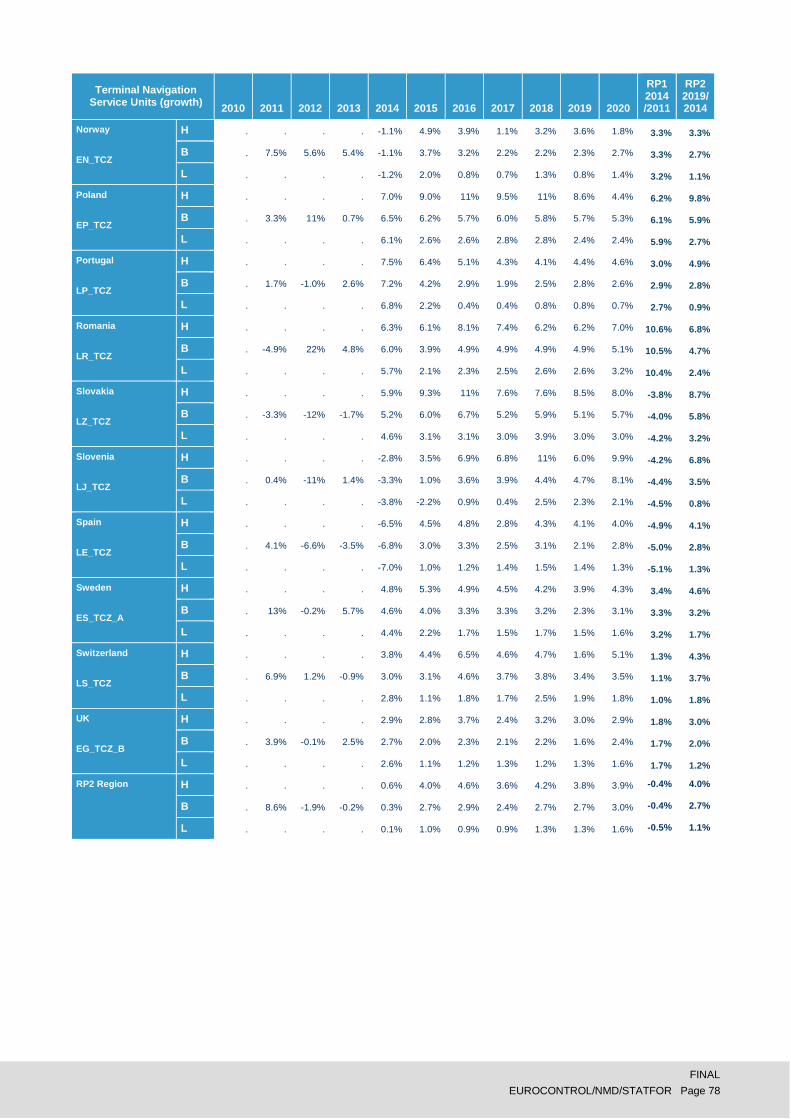
FINAL
EUROCONTROL/NMD/STATFOR Page 78
Terminal Navigation Service Units (growth)
2010 2011 2012 2013 2014 2015 2016 2017 2018 2019 2020
RP1 2014 /2011
RP2 2019/ 2014
Norway
EN_TCZ
H . . . . -1.1% 4.9% 3.9% 1.1% 3.2% 3.6% 1.8% 3.3% 3.3%
B . 7.5% 5.6% 5.4% -1.1% 3.7% 3.2% 2.2% 2.2% 2.3% 2.7% 3.3% 2.7%
L . . . . -1.2% 2.0% 0.8% 0.7% 1.3% 0.8% 1.4% 3.2% 1.1%
Poland
EP_TCZ
H . . . . 7.0% 9.0% 11% 9.5% 11% 8.6% 4.4% 6.2% 9.8%
B . 3.3% 11% 0.7% 6.5% 6.2% 5.7% 6.0% 5.8% 5.7% 5.3% 6.1% 5.9%
L . . . . 6.1% 2.6% 2.6% 2.8% 2.8% 2.4% 2.4% 5.9% 2.7%
Portugal
LP_TCZ
H . . . . 7.5% 6.4% 5.1% 4.3% 4.1% 4.4% 4.6% 3.0% 4.9%
B . 1.7% -1.0% 2.6% 7.2% 4.2% 2.9% 1.9% 2.5% 2.8% 2.6% 2.9% 2.8%
L . . . . 6.8% 2.2% 0.4% 0.4% 0.8% 0.8% 0.7% 2.7% 0.9%
Romania
LR_TCZ
H . . . . 6.3% 6.1% 8.1% 7.4% 6.2% 6.2% 7.0% 10.6% 6.8%
B . -4.9% 22% 4.8% 6.0% 3.9% 4.9% 4.9% 4.9% 4.9% 5.1% 10.5% 4.7%
L . . . . 5.7% 2.1% 2.3% 2.5% 2.6% 2.6% 3.2% 10.4% 2.4%
Slovakia
LZ_TCZ
H . . . . 5.9% 9.3% 11% 7.6% 7.6% 8.5% 8.0% -3.8% 8.7%
B . -3.3% -12% -1.7% 5.2% 6.0% 6.7% 5.2% 5.9% 5.1% 5.7% -4.0% 5.8%
L . . . . 4.6% 3.1% 3.1% 3.0% 3.9% 3.0% 3.0% -4.2% 3.2%
Slovenia
LJ_TCZ
H . . . . -2.8% 3.5% 6.9% 6.8% 11% 6.0% 9.9% -4.2% 6.8%
B . 0.4% -11% 1.4% -3.3% 1.0% 3.6% 3.9% 4.4% 4.7% 8.1% -4.4% 3.5%
L . . . . -3.8% -2.2% 0.9% 0.4% 2.5% 2.3% 2.1% -4.5% 0.8%
Spain
LE_TCZ
H . . . . -6.5% 4.5% 4.8% 2.8% 4.3% 4.1% 4.0% -4.9% 4.1%
B . 4.1% -6.6% -3.5% -6.8% 3.0% 3.3% 2.5% 3.1% 2.1% 2.8% -5.0% 2.8%
L . . . . -7.0% 1.0% 1.2% 1.4% 1.5% 1.4% 1.3% -5.1% 1.3%
Sweden
ES_TCZ_A
H . . . . 4.8% 5.3% 4.9% 4.5% 4.2% 3.9% 4.3% 3.4% 4.6%
B . 13% -0.2% 5.7% 4.6% 4.0% 3.3% 3.3% 3.2% 2.3% 3.1% 3.3% 3.2%
L . . . . 4.4% 2.2% 1.7% 1.5% 1.7% 1.5% 1.6% 3.2% 1.7%
Switzerland
LS_TCZ
H . . . . 3.8% 4.4% 6.5% 4.6% 4.7% 1.6% 5.1% 1.3% 4.3%
B . 6.9% 1.2% -0.9% 3.0% 3.1% 4.6% 3.7% 3.8% 3.4% 3.5% 1.1% 3.7%
L . . . . 2.8% 1.1% 1.8% 1.7% 2.5% 1.9% 1.8% 1.0% 1.8%
UK
EG_TCZ_B
H . . . . 2.9% 2.8% 3.7% 2.4% 3.2% 3.0% 2.9% 1.8% 3.0%
B . 3.9% -0.1% 2.5% 2.7% 2.0% 2.3% 2.1% 2.2% 1.6% 2.4% 1.7% 2.0%
L . . . . 2.6% 1.1% 1.2% 1.3% 1.2% 1.3% 1.6% 1.7% 1.2%
RP2 Region H . . . . 0.6% 4.0% 4.6% 3.6% 4.2% 3.8% 3.9% -0.4% 4.0%
B . 8.6% -1.9% -0.2% 0.3% 2.7% 2.9% 2.4% 2.7% 2.7% 3.0% -0.4% 2.7%
L . . . . 0.1% 1.0% 0.9% 0.9% 1.3% 1.3% 1.6% -0.5% 1.1%

FINAL
EUROCONTROL/NMD/STATFOR Page 79
I. References
1 EUROCONTROL, Seven-Year IFR Flight Movements and Service Units Forecast: 2014-2020, STATFOR
Doc522, February 2014. 2 STATFOR Interactive Dashboard accessible at www.eurocontrol.int/statfor/sid
3 Methods of the STATFOR Seven-Year Forecast, STATFOR Document 518, Draft v0.5, January 2014.
4 GDP Elasticities for the STATFOR Forecast, STATFOR Document 499, Draft v0.4, November 2013.
5 Industry Monitor Issue 165 accessible at http://www.eurocontrol.int/statfor, September 2014
© European Organisation for the Safety of Air Navigation (EUROCONTROL) 2014 This document is published by EUROCONTROL in the interests of exchange of information. It may be copied in whole or in part, providing that the copyright notice and disclaimer are included. The information contained in this document may not be modified without prior written permission from EUROCONTROL. EUROCONTROL makes no warranty, either implied or express, for the information contained in this document, neither does it assume any legal liability or responsibility for the accuracy, completeness or usefulness of this information. For further information please contact, STATFOR, the EUROCONTROL Statistics and Forecast Service [email protected] http://www.eurocontrol.int/statfor
STATFOR, the EUROCONTROL Statistics and Forecast Service is ISO 9001:2008 certified.

The Statistics and Forecasts Service
(STATFOR) is ISO 9001:2008 certified
EUROCONTROL
For further information, please contact: STATFOR, the EUROCONTROL Statistics and Forecast [email protected]://www.eurocontrol.int/statfor
© 2014 - European Organisation for the Safety of Air Navigation (EUROCONTROL)
This document is published by EUROCONTROL for information purposes. It may be copied in
whole or in part, provided that EUROCONTROL is mentioned as the source and it is not used
for commercial purposes (i.e. for financial gain). The information in this document may not be
modified without prior written permission from EUROCONTROL.