Embed Size (px)
Citation preview

EUROCONTROL
FOUNDINGMEMBER
NETWORKMANAGER
EUROCONTROL AgencyAnnual Accounts
SUPPORTING EUROPEAN AVIATION
As at 31 December 2018


EUROCONTROL AGENCYAnnual Accounts
As at 31 December 2018

TABLE OF CONTENTS
4
1. FOREWORD AND CORPORATE GOVERNANCE 7
2. FINANCIAL ACCOUNTS 15
2.1 Income statement 17
2.2 Statement of Comprehensive Income 17
2.3 Statement of Financial Position 18
2.4 Statement of Changes in Equity 20
2.5 Cash Flow Statement 21
2.6 Notes to the Financial Statements 22
2.6.1 Corporate information 22
2.6.2 Significant accounting policies 22
2.6.2.1 Basis of preparation 22
2.6.2.2 Change in accounting policies and disclosures 23
2.6.2.3 Significant accounting judgement, estimates and assumptions 23
2.6.2.4 Summary of significant accounting policies 24
2.6.2.5 Future change in accounting policies 29
2.6.3 Revenue 30
2.6.4 Other Income 30
2.6.5 Employee Benefits Expenses 30
2.6.6 Other Expenses 31
2.6.7 Finance Revenue 31
2.6.8 Finance Costs 31
2.6.9 Property, plant & equipment 32
2.6.10 Intangible Assets 34
2.6.11 Available for sale investments 35
2.6.12 Receivables from Member States 35
2.6.13 Other receivables 36
2.6.14 Accrued Income 37
2.6.15 Marketable securities 37
2.6.16 Cash & short-term deposits 38
2.6.17 Employee Benefit Liability 38

5
2.6.18 Provisions 46
2.6.19 Financial Liabilities 47
2.6.20 Trade and Other Payables 48
2.6.21 Deferred Income and accrued charge 49
2.6.22 Commitments and contingencies 49
2.6.23 Related party disclosures 51
2.6.24 Financial risk management objectives and policies 52
2.6.25 Financial Instruments 55
2.6.26 Events after financial position date 55
3. BUDGETARY ACCOUNTS 57
3.1 Part I 61
3.2 Part IX 65
3.3 Part II 66
3.4 Part III 67
3.5 Part IV 68
3.6 Part V 69
3.7 Part VII 70
4. EUROCONTROL PART OF THE COST BASE 71
4.1 Cost Base – Part I 72
4.2 Cost Base – Part IV (MUAC support cost & tax compensation) 73
4.3 Cost Base – Part IX 74
4.4 Cost Base – Part III 75
4.5 Evolution 2014-2018 Outturn Costbase (all Budgetary Parts) 76
4. AUDIT REPORT 78


7
1. FOREWORD ANDCORPORATE GOVERNANCE

FOREWORD TO THE AGENCY’S2018 ANNUAL ACCOUNTS
The EUROCONTROL 2018 Annual Accounts paint a picture of
stability and firm discipline on cost control.
Over the period 2014-2018, the annual outturn for the key
budget parts (I General Budget, III Maastricht Upper Area
Control Centre, IV Special Annexes, and IX Network Manager)
has remained stable, ranging between € 628.8 million and
€ 651.9 million. The 2018 outturn of € 651.9 million represents
a modest 1.1% increase compared with 2017 (€ 644.4 million).
In detail, the 2018 Annual Accounts present a balanced
picture, with decreases in most categories of expenditure
offsetting an increase in staff costs.
Pension costs in Parts I, III, IV and IX declined considerably from
€ 104.9 million in 2017 to € 91.2 million in 2018.
Operating costs for these Parts also declined from € 126.9
million in 2017 to € 121.7 million in 2018. These structural
savings were largely attributable to keeping infrastructure and
external support expenditure under control, with improved
exploitation of synergies and efficiencies following an initial
reorganisation of the Agency in April 2018.
A similar picture was recorded with depreciation and cost of
capital (interest paid to banks), which declined slightly from
€ 19.0 million in 2017 to € 18.9 million in 2018. This follows an
established trend over the years, which has seen this category
of expenditure drop markedly since 2012, when it stood at
€ 30.4 million, reflecting a continuing reduction in investment
and cheaper financing costs.
These decreases helped counterbalance the staff cost increase
in Parts I, III, IV and IX owing to salary adjustments, as this
category rose from € 354.9 million in 2017 to € 380.8 million
in 2018. After recording major decreases earlier in the decade,
the Agency kept its overall staffing level (officials, servants and
contract staff ) constant in 2018 at 1,898 for the third year in
succession (compared with 1,892 in 2017, and 1,894 in 2016).
For the coming years, a new investment plan will take place
with the agreement of the EUROCONTROL Member States to
replace the infrastructure of the Network Manager (NM) (Part
IX) following the reappointment of EUROCONTROL as the NM
by the European Commission, which was confirmed in 2019.
Following the change in the recognition of pension fund
receivables from last year’s audited Annual Accounts for
reimbursement rights, future contributions to be received
from Member States are no longer recognised as an asset. This
change has led to a negative equity of € 5,666.3 million for the
year ending 2018.
Adriaan Heerbaart
Director Central Route Charges Office, Finance and central IT

9
Directors
Eamonn Brennan
Director General
Adriaan Heerbaart
Director Central Route Charge Office and Director Pan-European Single Sky up to 20 April 2018
Director Central Route Charges Office, Finance and Central IT since 20 April 2018
John Santurbano
Director Maastricht Upper Area Control Centre
Philippe Merlo
Director Air Traffic Management up to 20 April 2018
Director European Civil-Military Aviation as from 20 April 2018
Joe Sultana
Director Network Management
Alberto Varano
Principal Director Resources up to 20 April 2018
Sabrina Depicker
Head of Human Resources and Services since 20 April 2018
Registered OfficeRue de la Fusée 96, 1130 Brussels

10

11
The Agency
The EUROCONTROL Agency is responsible for performing
tasks prescribed by the Convention or entrusted to it by the
Permanent Commission. The Director General enjoys wide
independence with regard to the management of the Agency.
Stakeholder involvement
EUROCONTROL is an intergovernmental Organisation,
driven by its member States (civil and military authorities).
However, it also aims to ensure that the interests of all aviation
stakeholders are represented in its decision-making process.
Consequently, stakeholders such as airspace users, air
navigation service providers and airports are now fully
involved in steering the Agency’s efforts to help create the
Single European Sky at a pan-European level.
In essence, the governance arrangements break down into
three different levels:
• At Organisation level, an Air Navigation Services Board
(ANSB) is in place to advise on the Agency’s Business Plan,
including associated financial commitments, before their
submission to the Provisional Council for approval.
• At project and programme level, various advisory and
consultative bodies composed of stakeholders (e.g. the
Military ATM Board - MAB) provide advice to the Director
General and where appropriate to the Provisional Council.
Strong coordination between these groups contributes
to the Agency’s full alignment with the strategic priorities
and objectives agreed with the Member States and
stakeholders.
The route charges system continues to be assisted,
supported and monitored by the enlarged Committee for
Route Charges, and MUAC by the Maastricht Coordination
Group.
EUROCONTROL is an international organisation established
under the EUROCONTROL Convention of 13 December 1960,
subsequently amended on 12 February 1981 (Amended
Convention). The EUROCONTROL Convention was further
revised on 27 June 1997 (Revised Convention). Pending
the entry into force of the 1997 Revised Convention,
the EUROCONTROL Member States agreed on the early
implementation of specific provisions thereof.
Governance Structure
EUROCONTROL comprises three organs: two governing
bodies (the Permanent Commission and the Provisional
Council) and one executive body (the Agency).
EUROCONTROL Permanent Commission
In the EUROCONTROL Permanent Commission, Member
States are represented at ministerial level. The Permanent
Commission formulates the Organisation’s general policy and
is the ultimate decision-making body of the Organisation.
It also approves the Agency’s annual work programme, the
five-year programme, the Agency’s budget, the Contract
Regulations, Financial regulations and Staff Regulations, and is
responsible for appointing the Director General and Directors.
It gives a final ruling on the Agency’s annual accounts.
EUROCONTROL Provisional Council
Member States are represented in the Provisional Council at
the level of Directors General of Civil Aviation. The European
Union participates in the work of the Provisional Council.
The Provisional Council is responsible for preparing the work of
the Permanent Commission, implementing EUROCONTROL’s
general policy, as established by the Permanent Commission,
and for supervising the Agency’s work.
EUROCONTROL’s institutional structure includes a number
of advisory bodies to the Provisional Council and/or to the
Permanent Commission that monitor the transparency of the
Agency’s work, supervise operations in specific areas, facilitate
dialogue and coordinate work programmes in certain
domains.
CORPORATE GOVERNANCE

12
Corporate risk management
EUROCONTROL has designed risk management systems to
identify, assess and where necessary take action to counteract
or mitigate any risks associated with its activities. Corporate-
wide guidance on risk management has been developed. Risk
management is an integral part of management activity, and
is integrated into the business planning process.
Internal Audit
EUROCONTROL’s Internal Audit Service provides an objective
and independent assurance and consultancy function. Its
functions include recommending to Agency Management
effective internal controls designed to help meet the
Agency’s objectives, assisting the Agency in improving the
effectiveness of its risk management, and promoting sound
corporate governance and corporate ethics in the Agency.
These activities support Agency management in overseeing
an effective system of internal controls designed to help the
Agency meet its objectives.
In determining its work programme and exercising its
functions, the Internal Audit Service evaluates risk exposures
relating to the Agency’s governance, operations, assets, and
information systems, including the:
• Reliability and integrity of financial and operational
information;
• Effectiveness and efficiency of operations and programmes;
• Safeguarding of assets;
• compliance with laws, regulations policies, procedures and
contracts.
The Head of Internal Audit, whose appointment by the
Director General is approved by the Provisional Council and
the Enlarged Committee for Route Charges, reports directly
to the Director General. She may bring matters that in her
view are significant to the attention of the Audit Board, the
Provisional Council and the enlarged Committee for Route
Charges.
Executive responsibility for internal control is vested in the
Director General. The system exists to ensure that Agency’s
objectives are achieved efficiently and economically, and in
compliance with EUROCONTROL’s regulations. It is designed
to manage rather than eliminate the risk of failure to achieve
business objectives.
The Agency’s internal control system comprises the following
elements:
• Financial, Contract and Staff Regulations
• Annual Budget and Five-Year Programme
• Agency Business Plan
• Performance measurement systems and activity reports
• Decisions of the Director General or Directors, organising
the Agency, allocating specific responsibilities and
delegating powers
• An accounting system
• Segregation of duties between the functions of fund
managers, authorising officers, accountants and treasurers
• Corporate risk management
• An internal audit function
• Annual Accounts
• External Audit
• A “whistle-blowing” procedure as specified in the Staff
Regulations for staff to report any potential financial
wrongdoing.
Some of the key features are described below.
INTERNAL CONTROL

13
External Audit
The Audit Board examines and reports annually on the
Agency accounts, the Route Charges system accounts, and
the Pension Fund Accounts and reports to the Permanent
Commission, via the Provisional Council. With regard to the
financial management of the Route Charges System, it reports
also via the Enlarged Committee. The Audit Board also reviews
the level of transparency of the Agency’s procedures and
decisions.
The Board is independent from the Agency and has financial
resources specifically dedicated to its work, provided through
the Agency Budget and approved by the Commission. It
is composed of six members designated by six Contracting
States, on a rotating basis, for a period of four years. The Rules
of Procedure of the Audit Board stipulate that its members
shall be professional auditors. Board members are not paid by
the Agency, but are refunded in full for their travel expenses.
Annual accounts
EUROCONTROL produces budgetary accounts presenting
the execution of the budget and financial accounts showing
the financial position and the financial performance of the
Agency. The financial accounts are produced in accordance
with International Financial Reporting Standards and the
budgetary accounts according to the Financial Regulations.
The accounts of the Agency, Pension Fund and of the Route
Charges System are audited by the Audit Board, assisted
by an auditing company, selected through an open call for
tenders’ procedure. The annual accounts, including the audit
opinion, are submitted to the Permanent Commission via the
Provisional Council.
The Commission gives a final ruling on the accounts and
decides on the discharge to be given to the Director General
in respect of his financial and accounting management.
Appointment of staff and remuneration
EUROCONTROL officials/servants/contract staff members
are appointed by the Director General following a rigorous
recruitment and selection procedure involving selection
boards, which are made up of management and staff
representatives.
In accordance with the EUROCONTROL Staff Regulations,
any officials/servants/contract staff wishing to engage in
an outside activity must obtain the prior approval of the
Director General, and further measures are in place to manage
potential conflicts of interests.
The system of staff remuneration, including that of the
Director General and the Directors, is approved by the
Permanent Commission and is linked to the method used in
the European Union.
Prepared by the Head of Accounting & Treasury,
in accordance with the provisions of the Financial Regulations
of the Agency, their Rules of Application, the Director General’s
Decisions and the Director of Resources’ Decisions,
Mr Ross WALTON,
Head of Accounting and Treasury
Approved by Mr Adriaan HEERBAART,
Director Central Route Charges Office,
Finance and Central IT


15
2. FINANCIAL ACCOUNTS


2. FINANCIAL ACCOUNTS
2.1 Income Statement for the year ended 31 December
2.2 Statement of Comprehensive Income for the year ended 31 December
17
Income Statement
as at 31 December 2018Notes
2018€000
2017€000
Member States contributions 2.6.3 543,027 536,250
Rendering of services 2.6.3 54,938 52,431
Revenue 597,965 588,681
Other income 2.6.4 12 56
Employee benefit expenses 2.6.5 -531,064 -512,991
Depreciation expense on Property, Plant & Equipment 2.6.9 -12,295 -12,020
Depreciation expense on Intangible Assets 2.6.10 -6,571 -6,489
Other expenses 2.6.6 -158,554 -155,037
Finance revenue 2.6.7 26,540 135,266
Finance costs 2.6.8 -96,026 -7,813
Profit/ (loss) of the year -179,994 29,654
2018€000
2017€000
Profit/ (loss) of the year -179,994 29,654
Other comprehensive income to be reclassified to profit and loss in subsequent periods 6 -20
Net (loss) gain on Available-For-Sale financial assets 6 -20
Other comprehensive income not to be reclassified to profit and loss in subsequent periods -265,855 -256,550
Re-measurement employee benefits -265,855 -256,550
Other comprehensive income -265,849 -256,570
Total comprehensive income for the year -445,843 -226,916

18
2.3 Statement of Financial Position as at 31 December
Assets Notes2018€000
2017€000
Non-current assets
Property, plant and equipment 2.6.9 124,518 124,928
Intangible assets 2.6.10 17,870 20,402
Available for sale investments 2.6.11 302 296
Other receivables 2.6.13 4,586 5,223
147,276 150,849
Current assets
Receivables from Member States 2.6.12 126,241 127,476
Other receivables 2.6.13 42,301 38,326
Accrued income 2.6.14 470 1,239
Marketable securities 2.6.15 1,456,673 1,496,856
Cash and short term deposits 2.6.16 186,180 171,746
1,811,865 1,835,643
Total Assets 1,959,141 1,986,492

19
Equity and Liabilities Notes2018€000
2017€000
Equity 2.4 -5,666,382 -5,220,538
Non-current liabilities
Employee benefit liability 2.6.17 7,212,428 6,785,863
Provisions 2.6.18 18,452 17,776
Financial liabilities 2.6.19 85,000 108,750
7,315,880 6,912,389
Current liabilities
Amounts to be reimbursed to Member States 37,819 43,231
Trade and other payables 2.6.20 104,347 87,112
Provisions 2.6.18 0 18
Financial liabilities 2.6.19 23,750 23,780
Accrued charges and deferred income 2.6.21 143,727 140,499
309,643 294,641
Total liabilities 7,625,523 7,207,031
Total Equity and Liabilities 1,959,141 1,986,492
2.3 Statement of Financial Position (continued) as at 31 December
FINANCIAL ACCOUNTS
Amounts to be reimbursed to Member States represent the liability of the Agency which reflects the unused budget received
from the Member States.

20 20
2.4 Statement of Changes in Equityfor the year ended 31 December
2018€000
2017€000
At beginning of the year -5,220,537 -4,993,621
Profit/ loss for the year -179,994 29,654
Other Comprehensive Income -265,849 -256,570
At end of the year -5,666,380 -5,220,537
Amounts to be called from Member States represent the part of Employee Benefit Liability and provisions that must be funded by
future Member States contributions. In accordance with article 18 of the Financial Regulations, article 83 of the Staff Regulations
and article 30 of the Convention, Member States shall fund the payment for post employment benefits through the annual
budget and shall jointly guarantee the liability for these benefits.

21
FINANCIAL ACCOUNTS
2.5 Cash Flow Statement
for the year ended 31 December
Notes 2018€000
2017€000
I. CASH & CASH EQUIVALENTS OPENING BALANCE 2.6.16 171.750 132.651
Profit/ (loss) of the year -179.994 29.654
Income tax paid 0 0
Non cash adjustment to reconcile profit/ (loss) ofthe year to net cash flows
Operating activities 249.348 42.193
Depreciation and amortisation 2.6.9 & 2.6.10 18,537 18,308
Impairment losses 330 201
Change in provisions 160,995 151,138
Finance revenue 2.6.7 -26,540 -135,266
Finance costs 2.6.8 96,026 7,813
Change in working capital 13,319 6,456
Trade & other receivables -2,740 -3,744
Trade & other payables 16,059 10,200
NET CASH FLOWS FROM OPERATING ACTIVITIES 82,673 78,303
Investing activities -62,816 -87,483
Purchase of property, plant and equipment 2.6.9 -11,885 -11,900
Purchase of intangibles 2.6.10 -4,039 -1,811
Purchase of securities & short term deposits -46,892 -73,772
Proceeds of securities 0 0
Interests received 25,417 17,391
NET CASH FLOWS FROM INVESTING ACTIVITIES -37,399 -70,092
Financing activities
Interest paid -7,090 -6,587
Repayment of borrowings 2.6.19 -93,750 -32,525
Proceeds from borrowings 2.6.19 70,000 70,000
NET CASH FLOWS FROM FINANCING ACTIVITIES -30,840 30,888
II. NET CHANGE IN CASH & CASH EQUIVALENTS 14,434 39,099
Net foreign exchange difference 0 0
III. CASH & CASH EQUIVALENTS, CLOSING BALANCE 2.6.16 186,184 171,750
Cash and cash equivalents 186,184 171,750
Short-term deposits > 3 months < one year 0 0
Cash and short term deposits 186,184 171,750
744

22 22
2.6 Notes to the Financial Statements
2.6.1. Corporate information
EUROCONTROL is an intergovernmental organisation with 41
Member States as at 31 December 2018 and has as its primary
objective the development of a seamless, pan-European air
traffic management (ATM) system.
Originally established in 1960 as an international organisation
dealing with air traffic control for civil and military users in
the upper airspace of its founding European Member States
(Belgium, Germany, France, Luxembourg, the Netherlands
and the United Kingdom), EUROCONTROL now pioneers
advances in air traffic management technology, operational
procedures and system interoperability.
Working closely with Member States, air navigation service
providers, civil and military airspace users, airports, the
aerospace industry, professional organisations and European
institutions, EUROCONTROL is committed to ensuring that
airspace users and passengers can continue to benefit from a
safe, expeditious and efficient European air transport system.
Its roles and responsibilities are:
n Network manager and network management
functions
n Delivering the SESAR commitments
n Collecting route charges
n Providing regional ATC services
n Providing essential oversight and support to
regulations and
n Delivering the specific services requested by the ATM
industry.
EUROCONTROL financial regulation defines the general
financial and budgetary principles, in particular regarding
the respect of the budgetary equilibrium (see Article 1,
paragraph 4).
The financial statements of EUROCONTROL Agency (‘the
Organisation’) for the year ended 31 December 2018 were
authorised by the Director General on 5 June 2019.
2.6.2 Significant accounting policies
2.6.2.1 Basis of preparation
The financial statements are presented in euros and all values are
rounded to the nearest thousand (€ 000) except when otherwise
indicated.
The financial statements have been prepared on a historical cost
basis, except for
n Available-for-sale investments and marketable
securities that have been measured at fair value.
n Held to maturity investments that have been
measured at amortised cost using the effective interest
method.
Statement of compliance
The financial statements of EUROCONTROL Agency (the
‘Organisation’) have been prepared in accordance with
International Financial Reporting Standards (IFRS) as issued by
the International Accounting Standards Board (IASB).
As there is currently no specific IFRS guidelines for non-profit
Organisations concerning the accounting treatment and the
presentation of the financial statements, the Organisation
based its accounting policies on the general principles of
IFRS, as detailed in the IASB Framework for the Preparation
and Presentation of Financial Statements.

23
FINANCIAL ACCOUNTS
23
2.6.2.2. Change in accounting policies and disclosures
The accounting policies adopted are consistent with those
of the previous financial year except for the following new
and amended IFRS and IFRIC Interpretations effective as of 1
January 2018:
n IFRS 9, ‘Financial instruments’ (effective 1 January 2018).
This standard, which covers financial instruments on
both the asset as well as the liability side, describes
the criteria for recognition, classification and de-
recognition of such instruments, in addition to the
allowed measurement methods.
The provision for doubtful debts is an estimate of the
outstanding amounts which in future years could
become irrecoverable.
The application of the expected credit loss model has
been applied prospectively as of 1 January 2018.
The provision has to be established by applying to each
bill outstanding at 31 December 2018 an expected
credit loss depending on the ageing category of
the receivable. The expected credit loss have been
calculated based on the historical losses over a five year
period for the different ageing categories of receivables.
As result of the budgetary mechanism under which
EUROCONTROL Agency operates, no historic losses
have been identified and hence no provision
recognised.
n IFRS 15, ‘Revenue from contracts with customers’
(effective 1 January 2018). The IASB and FASB have
jointly published a standard regarding revenue from
contracts with customers. The standard will result
in better financial reporting and will improve the
comparability of the top line in financial statements
globally. Companies using IFRS are required to apply
the revenue standard for annual periods beginning on
or after 1 January 2018.
Amendments to IFRS 15, ‘Revenue from contracts with
customers’ - Clarifications (effective 1 January 2018).
These amendments compromise clarification guidance
on identifying performance obligations, accounting for
licenses of intellectual property and the principle versus
agent assessment. The amendment also includes more
illustrative examples.
n IFRIC 22,’ Foreign currency transactions and advance
consideration (effective 1 January 2018): ’This IFRIC
addresses foreign currency transactions or parts of
transactions where there is an advance consideration
that is denominated or priced in a foreign currency.
The interpretation provides guidance for when a single
payment/receipt is made as well as for situations where
multiple payments/receipts are made. The guidance
aims to reduce diversity in practice.
n Annual improvements 2014-2016 applicable to three
standards of which changes on IFRS 1 and IAS 28 are
applicable as of 1 January 2018 and changes to IFRS 12
are applicable as of 1 January 2017. The improvements
that are applicable as of 1 January 2017 concern IFRS
12,’Disclosure of interests in other entities’ regarding
clarification of the scope of the standard (these
amendments should be applied retrospectively for
annual periods beginning on or after 1 January 2017).
n IFRS 16: In 2018, there were no leases.
The changes on the above IFRS and IFRIC do not have
a significant impact on the financial statements of the
Organisation.
2.6.2.3 Significant accounting judgement, estimates
and assumptions
Estimates and assumptions
The key assumptions concerning the future and other key
sources of estimation uncertainty at the financial position date,
that have a significant risk of causing a material adjustment to
the carrying amounts of assets and liabilities within the next
financial year are discussed below.
Pension and Other Post Employment Benefits
The cost of defined benefit pension plans and other post-
employment benefits (sickness scheme, early termination
services allowances, and resettlement and removal allowances,
post-employment family allowances) is determined using
actuarial valuations. The actuarial valuation involves making

The provision for the closure of the sites of Budapest and
Prague is equal to zero at 31 December 2018. Further details
are given in Note 2.6.18.
Dismantling provision
The Organisation has an obligation to restate the physical
land in Maastricht, Bretigny and Luxemburg in their original
shape. Therefore, a provision for dismantling costs has been
constituted. This provision is based on an external valuation
report of physical assets as of 27 March 2017. This valuation
also requires the Organisation to make estimates about the
discount rate and hence it is subject to uncertainty. The
provision for dismantling costs amounts to € 17,451,670 at 31
December 2018. Further information is given in Note 2.6.18.
2.6.2.4 Summary of significant accounting policies
Foreign currency translation
The financial statements are presented in euro, which is the
functional and presentation currency of the Organisation.
Transactions in foreign currencies are initially recorded
at the functional currency rate ruling at the date of the
transaction. Monetary assets and liabilities denominated in
foreign currencies are retranslated at the functional currency
rate of exchange ruling at the financial position date. All
differences are taken to profit or loss with the exception of
foreign exchange differences on Available-for-sale financial
investments which are recognised directly in equity.
Revenue recognition
Revenue is recognised to the extent that it is probable that
the economic benefits will flow to the Organisation and the
revenue can be reliably measured. Revenue is measured at
the fair value of the consideration received. The following
specific recognition criteria must also be met before revenue
is recognised:
24
assumptions about discount rates, future salary increases,
mortality rates, medical cost and future pension increases.
Due to the long term nature of these plans, such estimates are
subject to significant uncertainty.
In accordance with IAS19 paragraph 130, possible future
invalidity benefits are only recognised when an event causing
invalidity occurs if, as it is the case in EUROCONTROL, the
benefits are not dependant on a vesting period. Therefore,
future invalidity benefits are not included in the Defined
Benefit Obligations.
The employee liability at 31 December 2018 is K€ 7,212,428.
Further details are given in Note 2.6.17.
Fair Value of Unquoted Equity Instruments
According to IAS 39-46c, unquoted equity instruments have
been valued at cost in USD and converted to EUR using the
exchange rate as at 31 December 2018. The fair value of the
unquoted equity instruments at 31 December 2018 was
€ 301,735 (see Note 2.6.11).
Provision for sickness allowances
The provision for sickness claims incurred but not yet reported
has been estimated based on the pattern of the expenditure
of the previous years and on the payments made during the
first two months of the next year which relate to sickness of
the year. The provision for sickness allowances amounts to
€ 3,155,414 at 31 December 2018.
Provision for litigious cases
The provision for litigious cases relates to litigious cases
with Staff which were brought to the International Labor
Organisation Administrative Tribunal (ILOAT).The provision for
litigious case amounts to €1.000.000 at 31 December 2018.
Further details are given in Note 2.6.18.
Provision for the closure of the CEATS project
The closure of the sites in Budapest and Prague was decided
in 2010 and resulted in staff being redeployed or whose
budgetary post was subject to become non active in
accordance with Article 41 of the Staff Regulations.

25 25
FINANCIAL ACCOUNTS
Member States contributions
The annual financial contributions of the Member States are
based on their Gross National Product (GNP) and Air Traffic
Control costs (ATC). They are decided during the budget
approval process relative to the following financial year.
Member State contributions constitute the primary source
of funds for the Organisation. Those contributions, excluding
reimbursements of pension obligations, are recognised in
revenues in the year to which they relate.
Rendering of service
Revenues from the rendering of services comprise (i) the
“Special Annexes”, (ii) the revenues generated by the Central
Route Charges Office (CRCO) for providing billing and
collecting services to member or non-Member States, and
(iii) the revenues from sale of services (e.g. aeronautical charts,
ATC training and courses). They are recognised by reference to
the stage of completion. Stage of completion is measured by
reference to the expenditure incurred to date as a percentage
of the total cost to be incurred. Usually, all the costs are covered
by the party having requested the service. The outcome of the
contract can therefore usually be measured reliably. Revenue
is recognised over time.
Interest income
Revenue is recognised as interest accrues using the effective
interest method that is the rate that exactly discounts future
cash receipts through the expected life of the financial
instrument to the net carrying amount of the financial asset.
Property, plant and equipment
Property, plant and equipment is stated at cost less
accumulated depreciation and accumulated impairment in
value. Such cost includes the present value of the expected
cost of dismantling some buildings, the cost of replacing part
of the plant and equipment when that cost is incurred, if the
recognition criteria are met.
The threshold from which an asset is considered as Property,
Plant & Equipment (PP&E) is set at € 1.500 per unit.
Depreciation is calculated on a straight line basis over the
useful life of the assets.
An item of property, plant and equipment is derecognised
upon disposal or when no future economic benefits are
expected from its use or disposal. Any gain or loss arising
on de-recognition of the asset (calculated as the difference
between the net disposal proceeds and the carrying amount
of the asset) is included in the income statement in the year
the asset is derecognised.
The asset’s residual values, useful lives and methods of
depreciation are reviewed, and adjusted if appropriate, at
each financial year end.
Useful Lives
The useful lives of the assets are estimated as follows:
Constructions 50 years
Fitting out 20 years
Technical installations 20 years
Electrical installations 15 years
ATC Equipment 15 years
Equipment From 3 to 8 years
Vehicles 5 years
IT equipment under finance leases From 3 to 5 years
Borrowing costs
Borrowing costs are recognised as an expense when incurred.
Intangible assets
Intangible assets acquired separately are measured on initial
recognition at cost. Following initial recognition, intangible
assets are carried at cost less any accumulated amortisation
and any accumulated impairment losses.
Intangible assets are amortised on a straight line basis
over the useful economic life and assessed for impairment
whenever there is an indication that the intangible asset may
be impaired. The amortisation period and the amortisation
method for intangible assets is reviewed at least at each
financial year end.

26
An item of intangible assets is derecognised upon disposal
or when no future economic benefits are expected from its
use or disposal. Any gain or loss arising on derecognition
of the asset (calculated as the difference between the net
disposal proceeds and the carrying amount of the asset)
is included in the income statement in the year the asset
is derecognised.
Research costs are expensed as incurred. Development costs
are also expensed since the Organisation cannot demonstrate
that the related asset will generate future economic benefits.
Useful Lives
The useful lives of the assets are estimated as follows:
Computer Software From 8 to 12 years
Impairment of non-financial assets
The Organisation assesses at each reporting date whether
there is an indication that an asset may be impaired. If any
such indication exists, the Organisation makes an estimate
of the asset’s recoverable amount. An asset’s recoverable
amount is the higher of an asset’s or cash-generating unit’s fair
value less costs to sell and its value in use and is determined
for an individual asset, unless the asset does not generate
cash inflows that are largely independent of those from other
assets or group of assets. Where the carrying amount of an
asset exceeds its recoverable amount, the asset is considered
impaired and is written down to its recoverable amount.
In assessing value in use, the estimated future cash flows
are discounted to their present value that reflects current
market assessments of the time value of money and the risks
specific to the asset. Impairment losses are recognised in the
income statement.
An assessment is made at each reporting date as to whether
there is any indication that previously recognised impairment
losses may no longer exist or may have decreased. If such
indication exists, the Organisation makes an estimate of
recoverable amount. A previously recognised impairment
loss is reversed only if there has been a change in the
estimates used to determine the asset’s recoverable amount
since the last impairment loss was recognised. If that is the
case the carrying amount of the asset is increased to its
recoverable amount. That increased amount cannot exceed
the carrying amount that would have been determined, net
of depreciation, had no impairment loss been recognised
for the asset in prior years. Such reversal is recognised in the
income statement.
Leases
Finance leases, which transfer to the Organisation substantially
all the risks and benefits incidental to ownership of the leased
item, are capitalised at the inception of the lease at the
fair value of the leased property or, if lower, at the present
value of the minimum lease payments. Lease payments are
apportioned between the finance charges and reduction of
the lease liability so as to achieve a constant rate of interest
on the remaining balance of the liability. Finance charges are
reflected in the income statement.
Capitalised leased assets are depreciated over the shorter
of the estimated useful life of the asset and the lease term,
if there is no reasonable certainty that the Organisation will
obtain ownership by the end of the lease term.
Operating lease payments are recognised as an expense
in the income statement on a straight line basis over the
lease term.
Investments and other financial assets
The Organisation determines the classification of its
financial assets at initial recognition and, where allowed and
appropriate, re-evaluates this designation at each financial
year end.
All regular way purchases and sales of financial assets are
recognised on the trade date, which is the date that the
Organisation commits to purchase the asset. Regular way
purchases or sales are purchases or sales of financial assets
that require delivery of assets within the period generally
established by regulation or convention in the marketplace.

Financial assets at fair value through profit or loss
Financial assets at fair value through profit or loss includes
financial assets held for trading and financial assets designated
upon initial recognition as at fair value through profit or loss.
They are classified as held for trading if they are acquired
for the purpose of selling in the near term. Gain or losses on
investments held for trading are recognised in profit or loss.
Available-for-sale financial investments
Available-for-sale financial assets are those non-derivative
financial assets that are designated as available-for-sale. After
initial measurement, available for sale financial assets are
measured at fair value with unrealised gains or losses being
recognised directly in equity in the net unrealised gains
reserve. When the investment is disposed off, the cumulative
gain or loss previously recorded in equity is recognised in the
income statement. Interest earned or paid on the investments
is reported as interest income or expense using the effective
interest rate. Dividends earned on investments are recognised
in the income statement as ‘Dividends received’ when the
right of payment has been established.
Loans and receivables
Loans and receivables are non-derivative financial assets with
fixed or determinable payments that are not quoted in an
active market. After initial measurement loans and receivables
are subsequently carried at amortised cost using the effective
interest method less any allowance for impairment. Amortised
cost is calculated taking into account any discount or
premium on acquisition and includes fees that are an integral
part of the effective interest rate and transaction costs. Gains
and losses are recognised in the income statement when the
loans and receivables are derecognised or impaired, as well as
through the amortisation process.
Fair value
The fair value of investments that are actively traded in
organised financial markets is determined by reference
to quoted market bid prices at the close of business on
the financial position date. For investments where there is
no active market, fair value is determined using valuation
techniques. Such techniques include discounted cash flow
analysis or other valuation models.
Impairment of financial assets
The Organisation assesses at each financial position date
whether a financial asset or group of financial assets
is impaired.
Assets carried at amortised cost
If there is objective evidence that an impairment loss on
loans and receivables carried at amortised cost has been
incurred, the amount of the loss is measured as the difference
between the asset’s carrying amount and the present value of
estimated future cash flows (excluding future expected credit
losses that have not been incurred) discounted at the financial
asset’s original effective interest rate (i.e. the effective interest
rate computed at initial recognition). The carrying amount of
the asset is reduced through use of an allowance account. The
amount of the loss shall be recognised in profit or loss.
If, in a subsequent period, the amount of the impairment
loss decreases and the decrease can be related objectively
to an event occurring after the impairment was recognised,
the previously recognised impairment loss is reversed. Any
subsequent reversal of an impairment loss is recognised in
profit or loss, to the extent that the carrying value of the asset
does not exceed its amortised cost at the reversal date.
Available-for-sale financial investments
If an available-for-sale asset is impaired (significant or
prolonged decline), an amount comprising the difference
between its cost (net of any principal payment and
amortisation) and its current fair value, less any impairment
loss previously recognised in the income statement, is
transferred from other comprehensive income to the
income statement. Reversals in respect of equity instruments
classified as available for sale are not recognised in the
income statement. Reversals of impairment losses on debt
instruments are reversed through the income statement, if
the increase in fair value of the instrument can be objectively
related to an event occurring after the impairment loss was
recognised in the income statement.
27
FINANCIAL ACCOUNTS

28
Cash and short term deposits
Cash and short term deposits in the financial position
comprise cash at banks and on hand and short term deposits
with an original maturity of one year or less.
For the purpose of the cash flow statement, cash and cash
equivalents consist of cash and short term deposits of less
than 3 months, net of outstanding bank overdrafts.
Financial liabilities
All loans and borrowings are initially recognised at the fair
value of the consideration received less directly attributable
transaction costs.
After initial recognition, interest bearing loans and borrowings
are subsequently measured at amortised cost using the
effective interest method.
Gains and losses are recognised in the income statement
when the liabilities are derecognised as well as through the
amortisation process.
Derecognition of financial assets and liabilities
Financial assets
A financial asset (or, where applicable a part of a financial
asset or part of a group of similar financial assets) is
derecognised when:
n the rights to receive cash flows from the asset have
expired;
n the Organisation has transferred its rights to receive
cash flows from the asset and either (a) has transferred
substantially all the risks and rewards of the asset, or
(b) has neither transferred nor retained substantially all
the risks and rewards of the asset, but has transferred
control of the asset.
Financial liabilities
A financial liability is derecognised when the obligation under
the liability is discharged or cancelled or expires.
Where an existing financial liability is replaced by another
from the same lender on substantially different terms, or the
terms of an existing liability are substantially modified, such an
exchange or modification is treated as a derecognition of the
original liability and the recognition of a new liability, and the
difference in the respective carrying amounts is recognised in
the income statement.
Provisions
Provisions are recognised when the Organisation has a present
obligation (legal or constructive) as a result of a past event,
when it is probable that an outflow of resources embodying
economic benefits will be required to settle the obligation
and when a reliable estimate can be made of the amount
of the obligation. The expense relating to any provision is
presented in the income statement net of any reimbursement.
If the effect of the time value of money is material, provisions
are discounted using a current pre tax rate that reflects,
where appropriate, the risks specific to the liability. Where
discounting is used, the increase in the provision due to the
passage of time is recognised as a finance cost.
Pension and other post-employment benefits
The Organisation operates a Defined Benefit pension plan that
requires contributions to be paid to a separately administrated
bank account within the Organisation. However, as this bank
account is not legally separated from the Agency, the plan
is considered as unfunded. In addition, the Organisation
provides certain post-employment healthcare benefits and
resettlement and removal allowances. The cost of providing
benefits under the defined benefit plan is determined using
the projected unit credit method. Actuarial gains and losses
are recognised directly in the other comprehensive income
statement when incurred.
The past service cost is recognised as an expense on a
straight line basis over the average period until the benefits

29
become vested. If the benefits are already vested immediately
following the introduction of, or changes to, a pension plan,
past service cost is recognised immediately.
The defined benefit liability comprises the present value of
the defined benefit obligation using a discount rate based
on high quality corporate bonds less past service cost not yet
recognised.
2.6.2.5 Future change in accounting policies
Standards issued but not yet effective
Standards and interpretations issued but not yet effective up
to the date of issuance of the financial statements are listed
below. The System intends to adopt these standards and
interpretations when they become effective. These standards
will have no material impact on the financials.
The following new and amended IFRS and IFRIC Interpretations
will be effective for accounting years beginning on or after as
of 1 January 2019 or later:
The following new standards and amendments to standards
have been issued, but are not mandatory for the first time for
the financial year beginning 1 January 2018 and have been
endorsed by the European Union:
- IFRS 16, ’Leases’ (effective 1 January 2019). This standard
replaces the current guidance in IAS 17 and is a far reaching
change in accounting by lessees in particular. Under IAS 17,
lessees were required to make a distinction between a finance
lease (on balance sheet) and an operating lease (off balance
sheet). IFRS 16 requires lessees to recognise a lease liability
reflecting future lease payments and a ‘right-of-use asset’ for
virtually all lease contracts. For lessors, the accounting stays
almost the same. However, as the IASB has updated the
guidance on the definition of a lease (as well as the guidance
on the combination and separation of contracts), lessors
will also be affected by the new standard. Under IFRS 16, a
contract is, or contains, a lease if the contract conveys the
right to control the use of an identified asset for a period of
time in exchange for consideration.
- Amendments to IFRS 9, ‘Prepayment features with
negative compensation’ (effective 1 January 2019 within
the EU). An amendment to allow companies to measure
particular prepayable financial assets with so-called
negative compensation at amortised cost or at fair value
through other comprehensive income if a specified
condition is met—instead of at fair value through profit
or loss, because they would otherwise fail the SPPI-test.
In addition, this amendment clarifies an aspect of the
accounting for financial liabilities following a modification.
The following new standards, amendments and interpretation
to standards have been issued, but are not mandatory for the
first time for the financial year beginning 1 January 2018 and
have not been endorsed by the European Union:
- Amendments to IAS 19, ‘Plan Amendment, Curtailment or
Settlement’ (effective 1 January 2019). The amendments
require an entity to use updated assumptions to determine
current service cost and net interest for the remainder
of the period after a plan amendment, curtailment or
settlement. In addition, an entity will have to recognise
in profit or loss as part of past service cost, or a gain or
loss on settlement, any reduction in a surplus, even if that
surplus was not previously recognised because of the
impact of the asset ceiling. The amendments will affect
any entity that changes the terms or the membership of
a defined benefit plan such that there is past service cost
or a gain or loss on settlement.
- Amendments to References to the Conceptual
Framework in IFRS Standards (effective 1 January
2020). The revised Conceptual Framework includes a
new chapter on measurement; guidance on reporting
financial performance; improved definitions and
guidance—in particular the definition of a liability; and
clarifications in important areas, such as the roles of
stewardship, prudence and measurement uncertainty in
financial reporting.
- Amendments to the definition of material in IAS 1 and IAS
8 (effective 1 January 2020). The amendments clarify the
definition of material and make IFRSs more consistent.
The amendment clarifies that the reference to obscuring
information addresses situations in which the effect is
similar to omitting or misstating that information. It also
states that an entity assesses materiality in the context of
the financial statements as a whole. The amendment also
FINANCIAL ACCOUNTS

30
clarifies the meaning of ‘primary users of general purpose
financial statements’ to whom those financial statements
are directed, by defining them as ‘existing and potential
investors, lenders and other creditors’ that must rely on
general purpose financial statements for much of the
financial information they need. The amendments are not
expected to have a significant impact on the preparation
of financial statements.
2.6.3. Revenue
The revenue breaks down into the following categories:
2.6.4. Other income
2.6.5. Employee benefit expenses
2018
€000
2017
€000
Member States contributions 543,027 536,250
Revenue from Special Annexes 20,200 21,872
Revenue from running the Route Charge System 19,449 16,652
Revenue from Comprehensive Agreement States 7,087 6,656
Revenue from sale of services 8,202 7,251
Rendering of services 54,938 52,431
Total Revenue 597,965 588,681
2018
€000
2017
€000
Sale of goods 12 56
12 56
2018
€000
2017
€000
Salaries 223,464 216,465
Other employment benefits (note 2.6.17) 307,600 296,526
531,064 512,991

31
FINANCIAL ACCOUNTS
2018
€000
2017
€000
External assistance 84,886 76,007
Data processing 36,084 39,074
Accommodation 22,932 23,539
Communication 8,187 8,247
General administration 2,417 2,267
Non recoverable VAT 113 59
SESAR Joint Undertakings payment 3,000 5,200
Insurance 611 618
Other unrecoverable debts including impairment on TENT-Centralised Services
323 26
158,554 155,037
2018
€000
2017
€000
Unrealised income on marketable securities 0 104,612
Gains realized on sale of marketable securities 1,892 12,879
Interest earned on deposits, current accounts, dividends 24,648 17,775
26,540 135,266
2018
€000
2017
€000
Interest costs on bank loans and other 810 1,610
Management fees to assets managers 6,249 4,966
Unwinding of discount on the provision for dismantling costs and CEATS closure (note 2.6.19)
0 1
Loss on marketable securities 88,966 1,235
96,026 7,813
2.6.6. Other Expenses
2.6.7. Finance Revenue
2.6.8. Finance Costs
Research and development costs
Research and development costs in 2018 and 2017 amounted to M€ 78.5 and M€ 73.9 charged directly in the income statement.

32
2.6.9. Property, plant and equipment
Cons
truc
tions
Fitt
ing
out
Tech
nica
l in
stal
latio
nsEl
ectr
ical
inst
alla
tions
Equi
pmen
t &
vehi
cles
Wor
ks in
pr
ogre
ssLe
asin
gDi
sman
tling
Tota
l
Cost
or v
alua
tion
At 1
Janu
ary 2
018
80,6
7121
,444
47,1
3815
,572
121,
831
3,33
00
8,52
429
8,50
9
Addi
tions
4469
643
174
6,15
04,
805
00
11,8
85
Disp
osals
0-4
4-2
85-3
1-2
2,08
40
00
-22,
444
Reva
luat
ions
0
Tran
sfer
495
538
557
542
3,92
6-6
,058
00
0
At 3
1 De
cem
ber 2
018
81,2
0922
,007
48,0
5316
,256
109,
824
2,07
80
8,52
428
7,95
1
Depr
ecia
tion
and
impa
irmen
t:
At 1
Janu
ary 2
018
19,4
1816
,168
30,6
289,
981
94,6
710
02,
716
173,
581
Depr
eciat
ion
char
ges f
or th
e yea
r2,
068
667
1,43
175
37,
034
00
247
12,2
01
Impa
irmen
t0
Disp
osals
0-4
4-2
85-3
1-2
1,98
90
00
-22,
349
Tran
sfer
0
At 3
1 De
cem
ber 2
018
21,4
8616
,791
31,7
7410
,703
79,7
170
02,
962
163,
433
Net b
ook
valu
e:
At 3
1 De
cem
ber 2
018
59,7
235,
216
16,2
795,
554
30,1
072,
078
05,
562
124,
518
The
depr
ecia
tion
expe
nses
in 2
018
amou
nt to
K€
12,2
96 a
nd c
onsi
st o
f
n
the
depr
ecia
tion
of th
e ye
ar :
K€
12,2
01n
th
e lo
ss o
n di
spos
als,
i.e. K
€ 22
.444
– K
€ 2
2,34
9= K
€ 95

33
2.6.9. Property, plant and equipment
FINANCIAL ACCOUNTSCo
nstr
uctio
nsFi
ttin
g ou
tTe
chni
cal
inst
alla
tions
Elec
trica
l in
stal
latio
nsEq
uipm
ent &
ve
hicle
sW
orks
in
prog
ress
Leas
ing
Dism
antli
ng
To
tal
Cost
or v
alua
tion
At 1
Janu
ary 2
017
80,6
7121
,392
45,5
3015
,370
117,
890
9,27
10
8,52
429
8,64
7
Addi
tions
022
2,02
356
6,70
23,
097
00
11,9
00
Disp
osals
00
-2,9
00-2
0-9
,117
00
0-1
2,03
8
Reva
luat
ions
0
Tran
sfer
030
2,48
516
66,
356
-9,0
380
00
At 3
1 De
cem
ber 2
017
80,6
7121
,444
47,1
3815
,572
121,
831
3,33
00
8,52
429
8,50
9
Depr
ecia
tion
and
impa
irmen
t:
At 1
Janu
ary 2
017
17,3
5714
,751
31,6
649,
273
98,0
850
02,
469
173,
599
Depr
eciat
ion
char
ges f
or th
e yea
r2,
061
1,41
71,
864
728
5,56
30
024
711
,879
Impa
irmen
t0
Disp
osals
00
-2,9
00-2
0-8
,977
00
0-1
1,89
7
Tran
sfer
19,4
180
At 3
1 De
cem
ber 2
017
17,3
5716
,168
30,6
289,
981
94,6
710
02,
716
173,
581
Net b
ook
valu
e:
At 3
1 De
cem
ber 2
017
61,2
535,
276
16,5
115,
591
27,1
603,
330
05,
808
124,
928
The
depr
ecia
tion
expe
nses
in 2
017
amou
nt to
K€
12,0
20 a
nd c
onsi
st o
f
n
the
depr
ecia
tion
of th
e ye
ar :
K€ 1
1,87
9
n
th
e lo
ss o
n di
spos
als,
i.e. K
€ 12
,038
– K
€ 11
,897
= K
€ 14
1

34
2.6.10. Intangible assets
Computer SoftwareComputer Software
in progressTotal
Cost or valuation
At 1 January 2018 149,616 677 150,294
Additions 3,033 1,006 4,039
Disposals -1,020 0 -1,020
Revaluations 0
Transfer 888 -888 0
At 31 December 2018 152,517 796 153,313
Depreciation and impairment:
At 1 January 2018 129,892 0 129,892
Depreciation charges for the year 6,337 0 6,337
Impairment 0
Disposals -785 0 -785
Transfer 0 0 0
At 31 December 2018 135,443 0 135,443
Net book value: at 31 December 2018 17,074 796 17,870
The depreciation expenses in 2018 amount to K€ 6.572 and consist of n the depreciation charges of the year : K€ 6,337n the loss on disposals, i.e. K€ 1,020 – 785 = K€ 235
Computer SoftwareComputer Software
in progressTotal
Cost or valuation
At 1 January 2017 148,781 379 149,161
Additions 1,433 377 1,811
Disposals -678 0 -678
Revaluations 0
Transfer 80 -80 0
At 31 December 2017 149,616 677 150,294
Depreciation and impairment:
At 1 January 2017 124,080 0 124,080
Depreciation charges for the year 6,428 0 6,428
Impairment 0
Disposals -617 0 -617
Transfer 0 0 0
At 31 December 2017 129,892 0 129,892
Net book value: at 31 December 2017 19,725 677 20,402
The depreciation expenses in 2017 amount to K€ 6,489 and consist of n the depreciation charges of the year : K€ 6,428n the loss on disposals, i.e. K€ 678 – 617 = K€ 61

2.6.11. Available for sale investments
The unquoted ordinary shares have been measured at cost in USD and converted to EUR using exchange rate as at 31 December
2018.
2.6.12. Receivables from Member States
2018
€000
2017
€000
Contributions from Member States 123,986 125,776
Contributions from MUAC Member States for support cost and pension tax compensation
2,255 1,701
126,241 127,476
Contributions from Member States are due within 60 days and, in the event of late payment, are subject to a penalty equal to
the 3 months term deposit interest rate as published by the European Central Bank. Contributions from Member States were
not impaired.
35
FINANCIAL ACCOUNTS
2018
€000
2017
€000
Ordinary shares – unquoted (SITA shares) 302 296
302 296
Ordinary shares - unquote (SITA shares) as at 1 January 296 316
Movement due to revaluation of USD in EUR 6 -20
Ordinary shares - unquote (SITA shares) as at 31/12 302 296

36
2.6.13. Other receivables
In 2016, the enlarged Committee for Route Charges authorised the conclusion of a court settlement at the amount of €6,492,930
which is financed through a loan and will be recovered over 10 years through the administrative unit rate. As at 31 December
2018, the outstanding balance is €5,222,780 (€4,585,956 non current and €636,823 current).
As at 31 December 2018, the analysis of receivables (Member States and other) from the rendering of services that were past
due but not impaired is as follows:
Contributions from Member States +
Other receivables
2018
€000
2017
€000
Non-Current
Advances to Central Route Charges System 4,586 5,223
4,586 5,223
Current
Remuneration paid in advance 19,798 19,454
Advances to suppliers 9,159 7,186
VAT 2,540 1,820
Amounts receivable in relation with special annexes 5,491 3,314
Impairment on TENT-Centralised Services 0 0
Administrative charges due by users 2,300 603
Advances to SITA 573 648
Advances to Central Route Charge System 637 637
Others 1,803 4,664
42,301 38,326
Past due but not impaired
Total
€000
Neither past due nor impaired
€000
< 30 days
€000
30 – 60 days
€000
60 – 90 day
€000
90 – 120 day
€000
>120 days
€000
2018 172,425 171,604 339 100 117 35 229
2017 171,025 169,065 368 274 1,120 25 173

37
2.6.14. Accrued income
2.6.15. Marketable securities
As of 31st December 2018, marketable securities (level 1) are fair valued, using quoted market prices. Marketable securities
can only be used to pay some pension obligations. Marketable securities are measured at fair value through profit or loss.
Concentration risk
Concentration risk is a term describing the level of risk in a portfolio arising from concentration to a single counterparty, sector,
or country.
The risk arises from the observation that more concentrated portfolios are less diverse and therefore the returns on the underlying
assets are more correlated.
In 2005 the Pension Fund Supervisory Board approved an initial investment strategy for a period of three years. The assets were
invested in a passive management style, in two investment funds from Vanguard Investments Europe, with a target allocation of
80% in Euro government bonds and 20% in Global Equities.
In 2008, the Pension Fund Supervisory Board approved a revised strategy aiming at investing 45% of the Fund’s assets in equities,
44% in bonds, 10% in real estate and 1% in cash. At 31st December 2018, the allocation was 41.60% equities, 41.72% bonds,
10.43% real estate and 6.24% cash.
FINANCIAL ACCOUNTS
2018
€000
2017
€000
Global Stock Index Instit Euro Hedged – quoted 222,298 243,611
Eurozone Stock Index – quoted 202,136 228,429
Euro Investment Grade Bond - quoted 236,956 238,816
Euro government bonds –quoted 118,553 109,857
Euro inflation -linked bonds - quoted 138,511 125,382
Emerging markets equities - quoted 144,959 159,894
Unlisted real estate 98,047 88,979
Listed real estate - quoted 64,084 60,046
Emerging markets bonds - quoted 154,249 159,718
Infrastructure - unquoted 76,884 82,124
Total marketable securities 1,456,673 1,496,856
2018
€000
2017
€000
Accrued income 470 1,239
470 1,239

38
Counterparty risk
The risk that the other party to an agreement will default. The counterparty can be an individual entity, an asset manager, a bank,
etc. A proper diversification is required to mitigate the counterparty risk.
As of 31st December 2018 the bonds portfolio shows the following credit quality:
Bonds Average
Credit rating
Source
Vanguard EURO Gvt Bonds AA- Credit-quality ratings for each issue are obtained from Barclays using ratings derived from Moody’’s Investors Service, Fitch Ratings, and Standard & Poors
Vanguard Euro Invst Grade Bonds A+ Credit-quality ratings for each issue are obtained from Barclays using ratings derived from Moody’’s Investors Service, Fitch Ratings, and Standard & Poors
BlueBay EMD BBB- Credit-quality ratings for each issue are derived from Moody’’s, Fitch Ratings, and Standard & Poors
UBS EMD BB Credit-quality ratings based on J.P. Morgan rating methodology whereby 3 ratings are use (Moody’s, J.P. Morgan and Fitch ratings). If these differ, the rating that is used by 2 out of the 3 ratings. In case all 3 are different the middle one is used.
KBC ILB NR Credit-quality is defined on security level (not issuer level) and is determined as an average of the ratings by Standard & Poors, Moody’s, Fitch and Dunn & Bradstreet.
Petercam SRI A Credit-quality rating is based on Standard & Poors rating scale.
KBC SRI Corporate bonds BBB+ Credit-quality is defined on security level (not issuer level) and is determined as an average of the ratings by Standard & Poors, Moody’s, Fitch and Dunn & Bradstreet.
2.6.17. Employee benefit liability
Description of plans
In 2016, the Member States have approved an administrative
reform based on the measures approved at the EU. One of the
main features of the proposed administrative reform concerned
the pensions:
n Increase of the retirement age to 66 years which allows
a reduction of the pension contribution rate to 25.5%
(previously applied rate is 30%)
n Reduction of the annual acquired pension rights (1.8% for
new recruits instead of 1.9%)
2.6.16. Cash and short-term deposits
From the amounts of cash and short term deposits € 97,016,148
are to be used only to pay some pension obligations,
€ 13,735,623 to pay some sickness obligations and € 5,097,631
to pay some unemployment obligations.
Cash at banks earns interest at floating rates based on daily
bank deposit rates. Short-term deposits are made for varying
periods of between three months and one year, depending on
the immediate cash requirements of the Organisation, and earn
interest at the respective short-term deposit rates.
At 31 December 2018 and 2017, the Organisation had available
respectively K€70.000 and K€70.000 of undrawn committed
borrowing facilities in respect of which all conditions precedent
had been met. Cash and short term deposits are measured at
amortised cost.
2018
€000
2017
€000
Cash at banks and on hand 186,180 171,746
Short-term deposits 0 0
186,180 171,746

39
a maximum of 70% in term of pension rights or, at the latest,
up to the age of 65 (in the case of contracts for an unlimited
period) or 63 (in case of contracts for an undetermined period).
As from the month following that date, the staff member on
ETS will automatically start to receive a retirement pension.
A pension contribution (10% of full basic salary) is deducted
from the ETS allowance, as pension rights continue to be
acquired during the period between early termination of
service and the retirement date. There is no provision for
payment of the expatriation or foreign residence allowance
under the ETS scheme. The ETS allowance is subject to
the internal taxation scheme applied to EUROCONTROL
remuneration. The ETS allowance is subject to the cost-of-
living weighting for the country of residence of the recipient,
as provided for in the Pension Scheme.
Article 41
As per Article 41 of the Staff regulations, an official with non-
active status is one who has become supernumerary by
reason of reduction in the number of posts in the Agency. In
connection with the reorganisation of the NMD’s operational
functions, the Permanent Commission decided to abolish a
maximum of 34 NMD posts by 31 December 2015.
Article 41 only applied to:
n Persons with a permanent contract (recruited < 1.5.02),
n Persons performing the types of functions related to
the published posts to be abolished,
n Persons less than 63 years of age or who have not yet
acquired full pension rights (70%).
The Director General shall draw up a list of the officials to
be affected by such measures, after consulting the Joint
Committee, taking into account the officials’ ability, efficiency,
conduct in the service, family circumstances and seniority.
Officials whose names appear on this list shall be declared
to have non-active status by decision of the Director General.
While possessing this status, an official shall cease to
perform his duties and to enjoy his rights to remuneration or
advancement to a higher step, but shall continue, for a period
n Early retirement possible as from 58 years for new recruits
instead of 55
n New calculation of the discount rate used in the actuarial
determination of the contribution rate.
Pension Scheme
The pension scheme is a defined benefit plan.
As per article 77 of the Staff Regulations, a staff member
who has completed ten years’ service shall be entitled
to a retirement pension. If the staff member is over the
pensionable age (as mentioned in the Staff Regulations in
Article 77), he shall be entitled to such pension irrespective of
length of service under certain conditions.
The maximum retirement pension is determined by the
following two elements:
n 70% of the final basic salary carried by the last grade in
which the staff member was classified for at least one
year;
n and the pension rights calculated on the basis of the
Air Traffic Flow and Control Management (ATFCM)
allowance allowed to Central Flow Management Unit
(CFMU) Operational Staff members.
Early Termination Scheme
Staff members of category B in the Operational Division of
the Maastricht Air Traffic Control Centre, in place at 29 April
1990, retire early at 55 years and receive an amount ranking
between 70% and 100% of their basic salary at time of early
retirement up to their retirement age. The difference with the
basic retirement pension scheme (see above) consists in the
Early Termination Services (ETS) allowances.
In 2010, a new Early Termination of Service (new ETS) scheme
was introduced and granted to 205 officials with an open-
ended contract aged 55 and over during the period 1 January
2011 to 31 December 2012. They are paid a transitional ETS
allowance expressed as a percentage (70%) of their final basic
salary. The ETS allowance is paid until the staff member reaches
FINANCIAL ACCOUNTS

40
not exceeding five years, to accumulate rights to retirement
pension based on the salary carried by his grade and step.
The entitlement to the allowance is spread as follows:
n 100% of basic salary for 3 months,
n 85% of basic salary for the following 3 months,
n 70% of basic salary for the next 5 years,
n 60% of basic salary thereafter.
The allowance shall cease from the day on which the official
reaches the age of 63 years. However, above that age and up
to the age of 65 years, the official shall continue to receive the
allowance until he reaches the maximum retirement pension.
During the year 2015, 22 employees have left EUROCONTROL
on the grounds of article 41. These employees will receive an
allowance until their retirement.
Pensions and early terminations financed through the
Budget
Member States are responsible for the financing, through the
Budget of the Agency, of
n the ancillary expenditures (family allowances and
employer’s contributions to the Sickness Fund)
n the financing of national tax compensation of pensions
paid to both existing pensioners, as at 1st January 2005,
and new pensioners, as from 1st January 2005
n the Early Termination Services (ETS) allowances
n Article 41.
Composition of the Defined Benefit Obligation
financed through the budget2018 €000
2017 €000
Existing pensions as at 1/1/2005 623,180 609,564
Compensation of national taxes 2,180,182 2,062,985
Family allowances 254,976 225,112
Curtailment (ETS & Article 41) 21,258 30,169
3,070,596 2,927,830
Pensions financed through the Pension Fund
The Organisation operates a defined benefit pension plan, requiring contributions to be made, for staff members that were
still active in the Agency at 1 January 2005, to an administered fund that is not legally separated from EUROCONTROL Agency.
Pension rights accrued before 1st January 2005 (PBO-Projected Benefits Obligations) are financed by Member States through
special contributions into the Pension Fund, in annual instalments over 20 years. The amount of these instalments will be
reviewed periodically, in the light of the conclusions of actuarial studies.
Pension rights accrued after 1st January 2005 (Future Service Benefits Obligations) are financed by the employer and by the Staff
members. The pension rights imply contributions from employer and staff in the following proportion: 2/3 for the employer and
1/3 for the staff.
Some operational staff in the Maastricht Upper Area Control Centre (MUAC) are entitled to specific pension benefits, which are
based on ATC allowances granted during their career. These benefits are financed with the contributions of the staff and the four
States involved in the operations of MUAC.
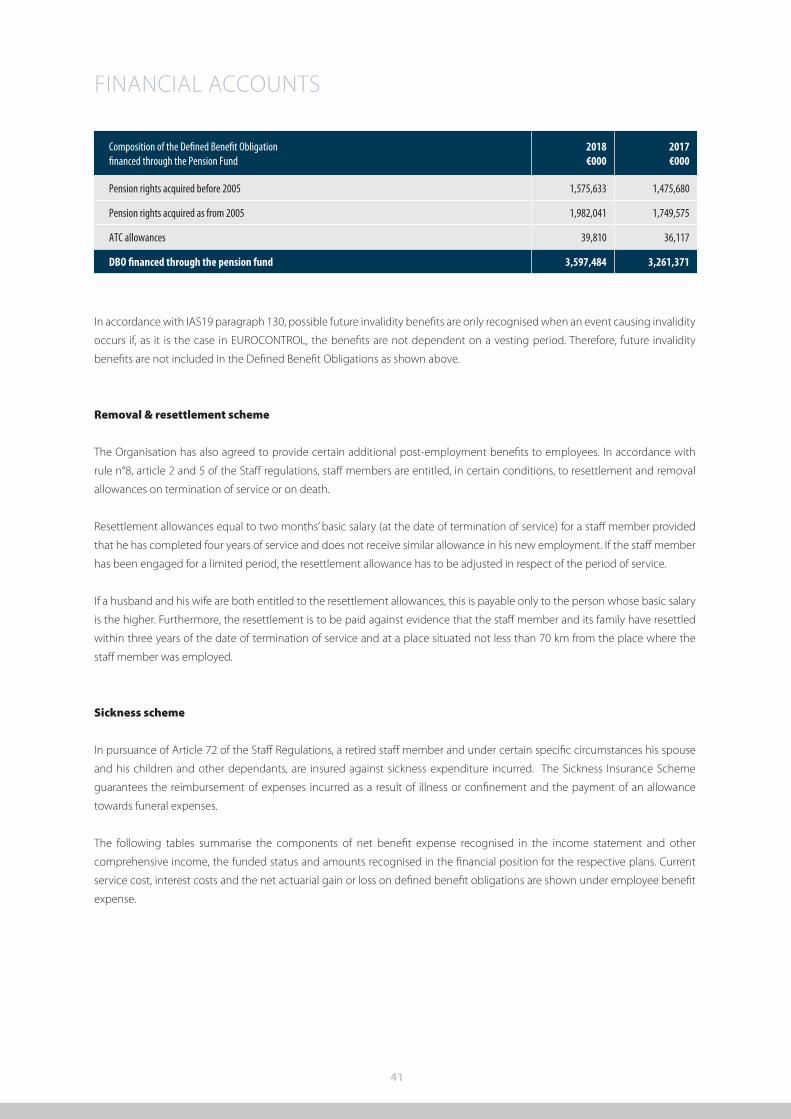
41
FINANCIAL ACCOUNTS
Composition of the Defined Benefit Obligation financed through the Pension Fund
2018 €000
2017 €000
Pension rights acquired before 2005 1,575,633 1,475,680
Pension rights acquired as from 2005 1,982,041 1,749,575
ATC allowances 39,810 36,117
DBO financed through the pension fund 3,597,484 3,261,371
In accordance with IAS19 paragraph 130, possible future invalidity benefits are only recognised when an event causing invalidity
occurs if, as it is the case in EUROCONTROL, the benefits are not dependent on a vesting period. Therefore, future invalidity
benefits are not included in the Defined Benefit Obligations as shown above.
Removal & resettlement scheme
The Organisation has also agreed to provide certain additional post-employment benefits to employees. In accordance with
rule n°8, article 2 and 5 of the Staff regulations, staff members are entitled, in certain conditions, to resettlement and removal
allowances on termination of service or on death.
Resettlement allowances equal to two months’ basic salary (at the date of termination of service) for a staff member provided
that he has completed four years of service and does not receive similar allowance in his new employment. If the staff member
has been engaged for a limited period, the resettlement allowance has to be adjusted in respect of the period of service.
If a husband and his wife are both entitled to the resettlement allowances, this is payable only to the person whose basic salary
is the higher. Furthermore, the resettlement is to be paid against evidence that the staff member and its family have resettled
within three years of the date of termination of service and at a place situated not less than 70 km from the place where the
staff member was employed.
Sickness scheme
In pursuance of Article 72 of the Staff Regulations, a retired staff member and under certain specific circumstances his spouse
and his children and other dependants, are insured against sickness expenditure incurred. The Sickness Insurance Scheme
guarantees the reimbursement of expenses incurred as a result of illness or confinement and the payment of an allowance
towards funeral expenses.
The following tables summarise the components of net benefit expense recognised in the income statement and other
comprehensive income, the funded status and amounts recognised in the financial position for the respective plans. Current
service cost, interest costs and the net actuarial gain or loss on defined benefit obligations are shown under employee benefit
expense.

42
Net benefit expense (recognised in employee benefit expense) in 2018
PE plan Budget
€000
PF pension plan
€000
New ETS
€000
Removal &Resettlement
€000
Sicknessscheme
€000
Total
€000
Interest cost 40,825 60,344 0 408 10,525 112,102
Current service cost 60,017 114,552 0 456 20,411 195,437
Past service cost 61 0 0 0 0 61
Net expense (gain) recognised in Income Statement
100,904 174,896 0 863 30,937 307,600
Net benefit expense (recognised inother comprehensive income) in 2018
PE plan Budget
€000
PF pension plan
€000
New ETS
€000
Removal &Resettlement
€000
Sicknessscheme
€000
Total
€000
Actuarial loss (gain) on DBO 137,961 202,395 243 -1,107 -76,227 263,266
Actuarial loss (gain) on transfer from other schemes
0 2,589 2,589
TOTAL 137,961 204,984 243 -1,107 -76,227 265,855
Net benefit expense (recognised in employee benefit expense) in 2017
PE plan Budget
€000
PF pension plan
€000
New ETS
€000
Removal &Resettlement
€000
Sicknessscheme
€000
Total
€000
Interest cost 39,333 54,778 0 392 11,224 105,727
Current service cost 59,987 109,257 0 381 21,175 190,799
Net expense (gain) recognised in Income Statement
99,319 164,036 0 773 32,398 296,526
Net benefit expense (recognised in other comprehensive income) in 2017
PE plan Budget
€000
PF pension plan
€000
New ETS
€000
Removal &Resettlement
€000
Sicknessscheme
€000
Total
€000
Actuarial loss (gain) on DBO 135,581 181,255 894 703 -64,829 253,604
Actuarial loss (gain) on transfer from other schemes
2,946 2,946
TOTAL 135,581 184,200 894 703 -64,829 256,550
Defined Benefit Obligation Year PE plan Budget
€000
PF pension plan
€000
New ETS
€000
Removal & Resettlement
€000
Sickness scheme
€000
Total
€000
2013 1,238,495 1,029,248 46,180 17,212 195,089 2,526,224
2014 2,449,551 2,517,720 41,928 28,078 504,145 5,541,422
2015 2,361,523 2,400,075 31,029 26,597 493,712 5,312,936
2016 2,768,108 2,953,811 21,687 28,365 606,666 6,378,637
2017 2,913,286 3,261,371 14,543 29,574 567,089 6,785,863
2018 3,061,740 3,597,485 8,855 28,807 515,540 7,212,428

43
FINANCIAL ACCOUNTS
Change in present value of the defined benefit obligation are as follows :
2018PE plan Budget
€000
PF pension plan
€000
New ETS
€000
Removal &Resettlement
€000
Sicknessscheme
€000
Total
€000
Present value of obligation at 01.01.2018 2,913,286 3,261,371 14,543 29,574 567,089 6,785,863
Current service cost 59,987 109,257 0 381 21,175 190,799
EE Contributions 1,759 1,759
Interest cost on benefit obligation 40,825 60,344 0 408 10,525 112,102
Past service cost 61 61
Actual distributions -90,410 -47,879 -5,931 -523 -8,018 -152,762
External transfers 4,112 4,112
Actuarial (gain)/loss on external transfers 2,589 2,589
Actuarial (gain)/loss on DBO 137,961 202,395 243 -1,107 -76,227 263,266
Present value of obligation at 31.12.2018 3,061,740 3,597,485 8,855 28,807 515,540 7,212,428
2017PE plan Budget
€000
PF pension plan
€000
New ETS
€000
Removal &Resettlement
€000
Sicknessscheme
€000
Total
€000
Present value of obligation at 01.01.2017 2,768,108 2,953,810 21,687 28,365 606,666 6,378,636
Current service cost 59,987 109,257 0 381 21,175 190,799
Interest cost on benefit obligation 39,333 54,778 0 392 11,224 105,727
Past service cost 0
Actual distributions -89,723 -41,498 -8,038 -267 -7,145 -146,672
External transfers 823 823
Actuarial (gain)/loss on external transfers 2,946 2,946
Actuarial (gain)/loss on DBO 135,581 181,255 894 703 -64,829 253,604
Present value of obligation at 31.12.2017 2,913,286 3,261,371 14,543 29,574 567,089 6,785,863
Change in present value of the defined benefit obligations are as follows:
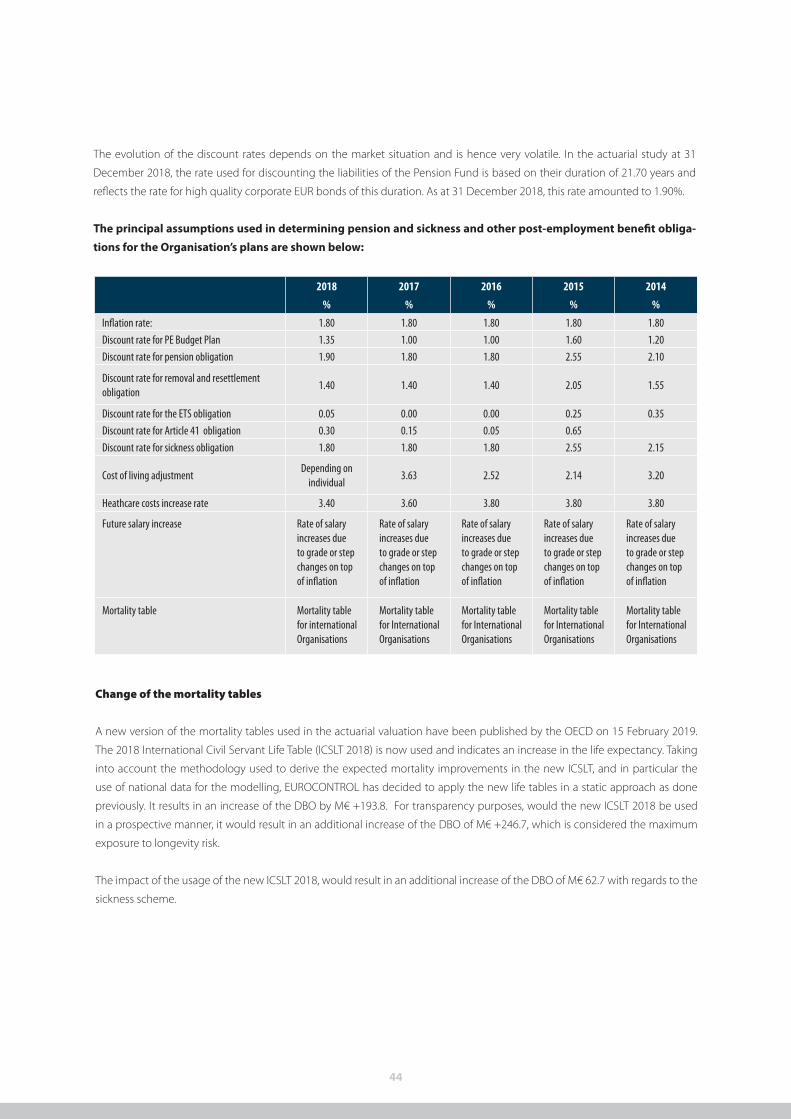
44
2018
%
2017
%
2016
%
2015
%
2014
%
Inflation rate: 1.80 1.80 1.80 1.80 1.80
Discount rate for PE Budget Plan 1.35 1.00 1.00 1.60 1.20
Discount rate for pension obligation 1.90 1.80 1.80 2.55 2.10
Discount rate for removal and resettlement obligation
1.40 1.40 1.40 2.05 1.55
Discount rate for the ETS obligation 0.05 0.00 0.00 0.25 0.35
Discount rate for Article 41 obligation 0.30 0.15 0.05 0.65
Discount rate for sickness obligation 1.80 1.80 1.80 2.55 2.15
Cost of living adjustmentDepending on
individual3.63 2.52 2.14 3.20
Heathcare costs increase rate 3.40 3.60 3.80 3.80 3.80
Future salary increase Rate of salary increases due to grade or step changes on top of inflation
Rate of salary increases due to grade or step changes on top of inflation
Rate of salary increases due to grade or step changes on top of inflation
Rate of salary increases due to grade or step changes on top of inflation
Rate of salary increases due to grade or step changes on top of inflation
Mortality table Mortality table for international Organisations
Mortality table for International Organisations
Mortality table for International Organisations
Mortality table for International Organisations
Mortality table for International Organisations
The evolution of the discount rates depends on the market situation and is hence very volatile. In the actuarial study at 31
December 2018, the rate used for discounting the liabilities of the Pension Fund is based on their duration of 21.70 years and
reflects the rate for high quality corporate EUR bonds of this duration. As at 31 December 2018, this rate amounted to 1.90%.
The principal assumptions used in determining pension and sickness and other post-employment benefit obliga-
tions for the Organisation’s plans are shown below:
Change of the mortality tables
A new version of the mortality tables used in the actuarial valuation have been published by the OECD on 15 February 2019.
The 2018 International Civil Servant Life Table (ICSLT 2018) is now used and indicates an increase in the life expectancy. Taking
into account the methodology used to derive the expected mortality improvements in the new ICSLT, and in particular the
use of national data for the modelling, EUROCONTROL has decided to apply the new life tables in a static approach as done
previously. It results in an increase of the DBO by M€ +193.8. For transparency purposes, would the new ICSLT 2018 be used
in a prospective manner, it would result in an additional increase of the DBO of M€ +246.7, which is considered the maximum
exposure to longevity risk.
The impact of the usage of the new ICSLT 2018, would result in an additional increase of the DBO of M€ 62.7 with regards to the
sickness scheme.
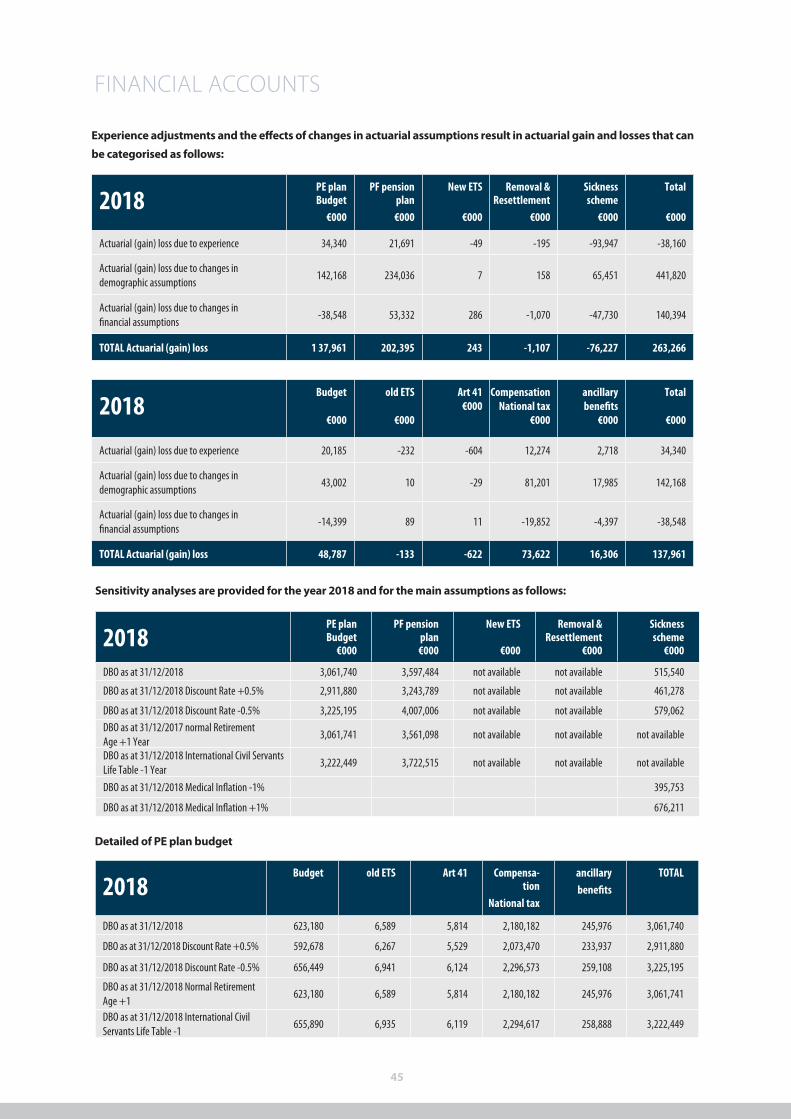
45
FINANCIAL ACCOUNTS
Experience adjustments and the effects of changes in actuarial assumptions result in actuarial gain and losses that can
be categorised as follows:
2018PE plan Budget
€000
PF pension plan
€000
New ETS
€000
Removal &Resettlement
€000
Sicknessscheme
€000
Total
€000
Actuarial (gain) loss due to experience 34,340 21,691 -49 -195 -93,947 -38,160
Actuarial (gain) loss due to changes in demographic assumptions
142,168 234,036 7 158 65,451 441,820
Actuarial (gain) loss due to changes in financial assumptions
-38,548 53,332 286 -1,070 -47,730 140,394
TOTAL Actuarial (gain) loss 1 37,961 202,395 243 -1,107 -76,227 263,266
2018Budget
€000
old ETS
€000
Art 41€000
CompensationNational tax
€000
ancillarybenefits
€000
Total
€000
Actuarial (gain) loss due to experience 20,185 -232 -604 12,274 2,718 34,340
Actuarial (gain) loss due to changes in demographic assumptions
43,002 10 -29 81,201 17,985 142,168
Actuarial (gain) loss due to changes in financial assumptions
-14,399 89 11 -19,852 -4,397 -38,548
TOTAL Actuarial (gain) loss 48,787 -133 -622 73,622 16,306 137,961
Sensitivity analyses are provided for the year 2018 and for the main assumptions as follows:
Detailed of PE plan budget
2018PE plan Budget
€000
PF pensionplan€000
New ETS
€000
Removal &Resettlement
€000
Sicknessscheme
€000
DBO as at 31/12/2018 3,061,740 3,597,484 not available not available 515,540
DBO as at 31/12/2018 Discount Rate +0.5% 2,911,880 3,243,789 not available not available 461,278
DBO as at 31/12/2018 Discount Rate -0.5% 3,225,195 4,007,006 not available not available 579,062
DBO as at 31/12/2017 normal Retirement Age +1 Year
3,061,741 3,561,098 not available not available not available
DBO as at 31/12/2018 International Civil Servants Life Table -1 Year
3,222,449 3,722,515 not available not available not available
DBO as at 31/12/2018 Medical Inflation -1% 395,753
DBO as at 31/12/2018 Medical Inflation +1% 676,211
2018Budget old ETS Art 41 Compensa-
tion
National tax
ancillary
benefits
TOTAL
DBO as at 31/12/2018 623,180 6,589 5,814 2,180,182 245,976 3,061,740
DBO as at 31/12/2018 Discount Rate +0.5% 592,678 6,267 5,529 2,073,470 233,937 2,911,880
DBO as at 31/12/2018 Discount Rate -0.5% 656,449 6,941 6,124 2,296,573 259,108 3,225,195
DBO as at 31/12/2018 Normal Retirement Age +1
623,180 6,589 5,814 2,180,182 245,976 3,061,741
DBO as at 31/12/2018 International Civil Servants Life Table -1
655,890 6,935 6,119 2,294,617 258,888 3,222,449

46
2.6.18. Provisions
Legal Claims provision
As at 31 December 2018, the legal claims provision included
some litigious cases with Staff brought to the International
Labour Organisation Administrative Tribunal (ILOAT).
CEATS Closure
The CEATS project was terminated in 2010 leading to the closure
of the Budapest and Prague sites. Most of the staff located on
these two sites were redeployed, with the exception of 3 staff
members who receive a termination allowance in accordance
with Article 41 of the Staff Regulations. In 2012, one staff was
reintegrated and a part of the provision was reversed for an
amount of K€ 215. The terminations allowances are evaluated
at K€ 0 as at 31 December 2018 based on expected cash flows
Legal claims€000
CEATS Closure€000
Dismantling€000
Total€000
At 1 January 2018 667 18 17,109 17,794
Arising during the year 333 0 342 675
Utilised 0 -18 0 -18
Unused amounts reversed 0 0 0 0
Discount rate adjustment 0 0 0 0
At 31 December 2018 1,000 0 17,452 18,451
Current 2018 0 0 0 0
Non-current 2018 1,000 0 17,452 18,452
Legal claims€000
CEATS Closure€000
Dismantling€000
Total€000
At 1 January 2017 288 69 16,774 17,131
Arising during the year 379 0 335 714
Utilised 0 -52 0 -52
Unused amounts reversed 0 0 0 0
Discount rate adjustment 0 1 0 1
At 31 December 2017 667 18 17,109 17,794
Current 2017 0 18 0 18
Non-current 2017 667 0 17,109 17,776
discounted at current rates applicable for items with similar
terms and risk characteristics at the reporting date.
Dismantling provision
The Organisation has an obligation to restate the physical
land in Maastricht, Brétigny and Luxembourg in their original
shape.
A new building and two new traffic towers were built on
the Maastricht site in 2016. They have been taken into
consideration during the dismantling provision calculation
which has been performed in early 2017 by an expert office
in order to ensure the completeness and accuracy of the
inventoried obligation.

47
FINANCIAL ACCOUNTS
2.6.19. Financial liabilities
Effective
Interest rate %
Maturity 2018
€000
2017
€000
Bank overdraft 0 0
Current Obligations under finance lease (Note 2.6.23) 0 0
Current portion of non-current financial liabilities (initial amount)
23,750 23,780
K€ 35,000 bank loan 2.868 2017 0 0
K€ 15,000 bank loan Euribor + 0.05 2017 0 0
K€ 17,500 bank loan 2.242 2017 0 0
K€ 30,000 bank loan Euribor 1mo + 68bps 2020 3,750 3,750
K€ 20,000 bank loan Euribor 1mo + 75bps 2020 2,500 2,500
K€ 70,000 bank loan Euribor + 0.58 2022 8,750 8,751
K€ 10,000 bank loan Euribor + 0.349 2025 1,250 1,258
K€ 10,000 bank loan Euribor + 0.359 2025 1,250 1,259
K€ 10,000 bank loan Euribor + 0.371 2025 1,250 1,259
K€ 40,000 bank loan Euribor + 0.4 2025 5,000 5,002
K€ 40,000 bank loan short term facility Euribor + 0.98 2019 0 0
Total current financial liabilities 23,750 23,780
Effective
Interest rate %
Maturity 2018
€000
2017
€000
Non-current obligations under finance lease 0 0
Interest-bearing loans (initial amount) 85,000 108,750
K€ 30,000 bank loan Euribor 1mo + 68bps 2020 3,750 7,500
K€ 20,000 bank loan Euribor 1mo + 75bps 2020 2,500 5,000
K€ 70,000 bank loan Euribor + 0.58 2022 26,250 35,000
K€ 10.000 bank loan Euribor + 0.349 2025 7,500 8,750
K€ 10.000 bank loan Euribor + 0.359 2025 7,500 8,750
K € 10,000 bank loan Euribor + 0.371 2025 7,500 8,750
K € 40,000 bank loan Euribor + 0.4 2025 30,000 35,000
Total non-current financial liabilities 85,000 108,750

48
2018 Total
€000Within 1 year
€0002-5 years
€000More than 5 years
€000
Interest-bearing loans 108,750 23,750 76,250 8,750
108,750 23,750 76,250 8,750
2017 Total
€000Within 1 year
€0002-5 years
€000More than 5 years
€000
Interest-bearing loans 132,530 23,780 82,500 26,250
132,530 23,780 82,500 26,250
Term and loan repayment schedule (excluding finance and bank overdraft)
2.6.20. Trade and other payables
Terms and conditions of the above financial liabilities are generally settled on 30-day terms.
During 2016 and 2017, EUROCONTROL has received CEF Funds from the Innovation and Network Executive Agency (INEA) of
the European Commission. Due to uncertainties whether these funds are to be used to cover the costs made on INEA projects
or rather as temporary financial accelerator but to be reimbursed to the airspace users once completed, the financing received
was expressed as a liability until further notice: an amount of € 33.439.234 is included as advance payments in Special annexes
– European Union and others. Trade and other payables are measured at amortised cost.
Once the Single Sky Committee will have issued formal guidance for the handling of Union funding, these funds will be taken
into the income statement in order to be reimbursed to the Member States and subsequently to the airspace users.
The costs made on INEA projects and carried out in the Agency’s work programme are shown below.1
2018 €000
2017 €000
Payables to suppliers and trade creditors 36,751 30,898
Employee related liabilities 18,646 19,655
Special annexes – European Union and others 6,989 6,017
Special annexes - CEF funding 33,439 24,952
Amounts due to States in the context of Bilateral Agreements for Route and Terminal Charges 8,014 5,463
Others 507 127
104,347 87,112
2018 €000
2017 €000
2016 €000
2015 €000
Staff cost 6,653 8,402 12,460 9,720
Mission cost 135 90 66 113
External assistance 10,685 12,258 6,947 6,339
17,473 20,751 19,473 16,172
1 Awaiting policy confirmation by Agency Management Board Under RP2 Charging regulation (2015-2019): No clear guidance from EC how to deal with these funds. CEF calls being executed, Agency received advances of € 33 million so far. NMB decided, supported by the EC, that Funds received corresponding to costs certified would be reimbursed to the airspace users at the end of RP2 (around € 9,8 million in NM to date)

49
2.6.21. Deferred income and accrued charges
Deferred income relates to contributions from Member States which are called up during the preceding year to which they relate.
2.6.22. Commitments and contingencies
The Organisation can enter into commitments for the current and future budgetary years, in accordance with the terms
established below. The commitments authorised by the Organisation for the current budgetary year shall not exceed the
approved appropriations.
For future budgetary years, the commitments authorised by the Organisation shall represent the obligations it has entered into,
resulting from projects and activities, whose initiation is authorised under the current budget, but which cannot be completed
in the current year.
The SESAR Joint Undertaking (SJU) is an initiative of the European Union established by Council Regulation (EC) n°219/2007.
EUROCONTROL contributed to the first phase (2008-2016) with an amount of 568M€.
A new Membership Agreement has been signed between the SJU and EUROCONTROL under the aegis of ART. 9.2 of Council
Regulation (EC) 219/2007 of February 2007 modified by Council Regulation 1361/2008 of 16 December 2008 and COUNCIL
REGULATION (EU) N°721/2014 of 16 June 2014. This second program, called SESAR2020 will amount to some 500 MEUROs
contribution from EUROCONTROL (475 M€ in-kind; 25 M€ cash), and is running from 2016 until 2023 (possibly until 2024).
The EUROCONTROL contribution for SESAR2020 is as follows:
2018 €000
2017 €000
Accrued charge -448 79
Deferred income 144,175 140,421
143,727 140,499
Future year commitments 2018 €000
2017 €000
Future year commitments: open purchase orders 282,055 232,085
Contribution of the year 2018
€000
2017
€000
2016
€000
TOTAL COST
€000
Cash/near Cash 3,947 6,115 2,686 12,748
In-kind 62,197 56,186 4,362 122,745
Total 66,144 62,301 7,048 135,493

50
Operating lease commitments
The Organisation has not entered into operating lease contracts.
Finance lease commitments
The Organisation has not entered into finance lease contracts.
Contingent liabilities
2018 €000
2017 €000
Clawback 0 0
ILOAT 75 197
Support to States Policy (Special Annex) 3,092 2,784
3,166 2,981
Litigious cases with Staff were brought to the International Labour Organisation Administrative Tribunal (ILOAT) for a contingent
liability estimated at €74,500.
As from 2016, EUROCONTROL has implemented a Support to States Policy, whereby the first 50 days of support is free of charge.
A mechanism of annual carry-over of unused days is applicable with a maximum of 100 days.

51
FINANCIAL ACCOUNTS
2.6.23 Related party disclosures
The Organisation has entered into transactions with the Member States, the European Union, key management personnel and
their close family members. For the years ended 31 December 2018 and 2017, the Organisation has not made any provision for
doubtful debts concerning amounts owed by related parties. Outstanding balances with related parties at the year-ends are
unsecured and settlement occurs in cash.
Member States and the European Union
The 41 Member States constitute the Permanent Commission (Transport and Defense Ministers), the higher level of decision of
the Organisation. The European Union is also a member of the Permanent Commission.
Contributions from Member states are on a 60 days term. Receivables from Member States were not impaired.
The following table provides the total amount of transactions, which have been entered into with related parties.
Transactions with related parties in 2017
Revenue from
related parties
€000
Expenses to
related parties
€000
Amounts owed by
related parties
€000
Amounts owed to
related parties
€000
Member States (including European Union) 542,906 0 127,476 214,621
Financial assets 0 0 296 0
Other receivables 0 0 3,962 0
Rendering of services : Special annexes 21,872 0 0 0
Total Member States 564,834 0 131,734 214,621
Transactions with related parties in 2018
Revenue from
related parties
€000
Expenses to
related parties
€000
Amounts owed by
related parties
€000
Amounts owed to
related parties
€000
Member States (including European Union) 550,114 0 126,241 222,423
Other income 12 0 0 0
Financial assets 0 0 302 0
Other financial assets 0 0 0 0
Other receivables 0 0 6,064 0
Rendering of services : Special annexes 20,200 0 0 0
Total Member States 570,326 0 132,607 222,423

52
Key management personnel and their close family members.
Key management personnel are those people having authority and responsibility for planning, directing and controlling the
activities of the Organisation, directly or indirectly, as well as their close members of their families or households. This implies to
the Director General and Directors.
The system of staff remuneration, including of the Director General and the Directors, is approved by the Commission and
is linked to the method used by the European Commission. In line with the public-sector nature of the Agency there are no
discretionary payments to staff.
Compensation Benefits2018
€000
2017
€000
Short-term employee benefits 1,850 1,500
Post-employee benefits 802 884
Total remuneration 2,652 2,384
2.6.24 Financial risk management objectives and policies
The Organisation’s principal financial instruments comprise bank loans, Member States contributions, finance leases, trade
payables and marketable securities. The main purpose of these financial instruments is to raise finance for the Organisation’s
operations. The Organisation has various financial assets such as receivables from Member States, marketable securities and cash
and short-term deposits, which arise directly from its operations.
The Organisation has not entered into any derivative transactions.
The main risks arising from the Organisation’s financial instruments are cash flow interest rate risk, foreign currency risk, credit risk
and liquidity risk. The Treasury Committee and the Standing Committee on Finance reviews and agrees policies for managing
each of these risks which are summarised below.
Interest rate risk
The Organisation’s exposure to the risk of changes in market interest rates relates primarily to the Organisation’s long-term debt
obligations with floating interest rates.
The Organisation’s policy is to manage its interest cost using a mix of fixed and variable rate debts. The Organisation’s policy is to
keep around 50% of its borrowings at fixed rates of interest.

53
FINANCIAL ACCOUNTS
Increase/ decrease in basis points
Effect on profit before tax
€000
2018
Euro +20 (277)
Euro -20 277
2017
Euro +20 (265)
Euro -20 265
Interest rate risk table
The following table demonstrates the sensitivity to a reasonably possible change in interest rates, with all other variables held
constant, of the Organisation’s profit (through the impact on floating rate borrowings). There is no impact on the Organisation’s
equity.
Foreign currency risk
Exposure to foreign currency exchange rates arises from transactions denominated in currencies other than the Organisation
functional currency, which is the euro. However, the foreign currency risk is rather limited as Member States contributions,
interest-bearing loans and the main part of revenues and expenses are set in euro. The Organisation does not keep any
substantial position in currency. The strategy is to buy or sell the currency at the date of the transaction.
Credit risk
Contributions and other receivables held with Member States are subject to very limited credit risks.
With respect to credit risk arising from the other financial assets of the Organisation, which comprise cash and cash equivalents
and marketable financial investments, the Organisation’s exposure to credit risk arises from default of the counterparty, with
a maximum exposure equal to the carrying amount of these instruments. It is the Organisation policy to have those financial
assets with financial institutions having at least a BBB rating and broad international representation.

54
Liquidity risk
The Organisation monitors its risk to a shortage of funds by the Alignment policy of the Organisation’s Fixed Assets and Liabilities,
which was adopted in 1998.
In order to correlate the development of the debts to the development of the assets, the following mechanism is applied:
n link the increase of liabilities to increase of assets: this is ensured by the principle that all new capital expenditure is
fully financed by bank loans;
n link the depreciation of assets to the reimbursement of loans.
Concerning the liquidity risk on the pensions, the objective of the actuarial assessment carried out on the pension related
liabilities is to determine the necessary stable level of the pension contributions from Member States, aiming to balance in
the long term the financing of pension benefits. In addition, the long term aim of the management of the Fund’s assets is
to maintain the stability of the pension scheme, by ensuring that the real value of the assets is preserved. The Pension Fund
Supervisory Board sets the Fund’s investment guidelines and defines the investment target strategy.
Concerning the liquidity risk on the sickness allowances, ALM studies are performed in order to ensure that the Organisation has
sufficient current assets to cover the current liabilities of the sickness scheme.
The table below summarises the maturity profile of the Organisation’s financial liabilities at 31 December 2018 and 2017 based
on contractual undiscounted payments.
Year ended 31 December 2017On demand
€000
Less than 3 months
€000
3 to 12 months
€000
1 to 5 years
€000
> 5 years
€000
Total
€000
Interest bearing loans and borrowings incl. interests due in the future
0 36 24,353 83,911 26,455 134,754
Financial lease 0 0 0 0 0 0
Amounts to be reimbursed to Member States 43,231 0 0 0 0 43,231
Trade and other payables 87,112 0 0 0 0 87,112
130,344 36 24,353 83,911 26,455 265,098
Year ended 31 December 2018On demand
€000
Less than 3 months
€000
3 to 12 months
€000
1 to 5 years
€000
> 5 years
€000
Total
€000
Interest bearing loans and borrowings incl. interests due in the future
0 36 24,353 83,911 26,455 134,754
Financial lease 0 0 0 0 0 0
Amounts to be reimbursed to Member States 37,819 0 0 0 0 37,819
Trade and other payables 104,347 0 0 0 0 104,347
142,166 36 24,353 83,911 26,455 276,920

55
FINANCIAL ACCOUNTS
Capital Risk
The Organisation is an international non-profit organisation and the main objectives of its capital management are to ensure the
continuity of its tasks as defined in its Business Plan and to meet its obligation to its stakeholders.
The Organisation is financed from contributions from its Member States, loans for investments and specific contributions for
projects.
2.6.25. Financial instruments
Fair values
As at 31 December 2018, all financial investments are classified as Level 1 except for the level 3 instruments in the below table.
Trade receivable and trade payables are also classified as level 3 instruments.
Set out below is a comparison by category of carrying amounts and fair values of all of the Organisation’s financial instruments
that are reflected in the financial statements:
Market values have been used to determine the fair value of marketable securities. The fair value of borrowings has been
calculating by discounting the expected future cash flows at prevailing interest rate. The fair value of loan notes and other
financial assets has been calculated using market interest rates.
Held to maturity investments that have been measured at amortised cost using the effective interest method.
The fair value of the available for sale investments has been valued at cost in USD and converted to EUR using the exchange rate
as at 31 December 2018.
2.6.26. Events after financial position date
None
2018 2017
Carrying amount
€000
Fair value
€000
Carrying amount
€000
Fair value
€000
Financial assets
Cash and short term deposit 186,180 186,180 171,746 171,746
Available for sale investments 302 302 296 296
Marketable securities 1,456,673 1,456,673 1,496,856 1,496,856
Financial liabilities
Obligations under finance and operating leases 0 0 0 0
Floating rate borrowings 108,750 108,750 132,530 132,530
Fixed rate borrowings 0 0 0 0


57
3. BUDGETARY ACCOUNTS


Principles governing the Budgetary Accounts
1. General principles :
Article 29 of the Financial Regulations
The Article 29 of the Financial Regulations of the Agency
was modified by the Measure 11/172 of the Permanent
Commission dated 17/1/2011 to align, as closely as possible,
to preparation of the Budget and cost-base to the principle
of IFRS.
The closest alignment to the IFRS for the preparation of the
Budget and cost-base brings the following advantages:
n maximum alignment of the budgetary, accounting
and cost-base processes by reducing/limiting the
reconciliation elements;
n for the stakeholders, greater transparency, stability
and predictability of the EUROCONTROL financial
processes, in particular contributions and cost-base;
n compliance with European Regulation (EC) No.
550/2004, which requires ANSPs to publish their
financial accounts in full compliance with the IFRS or to
the maximum possible extent and, as a consequence,
to prepare their cost-base in such a manner as to be
consistent with the financial accounts (EC Regulation
No. 1794/2006).
Receipts shall be taken into account in the budget for the year
during which they refer.
Expenditure shall be taken into account in the budget for
the year during which it refers. Exceptions to these rules
are specified in the Rules of Application of the Financial
Regulations and listed below:
n the contributions to the social security schemes
(pension, sickness, and unemployment) are
determined in accordance to the Staff Regulations.
This is the basis for their inclusion in the budgetary
accounts and in the EUROCONTROL part of the cost-
base. As a consequence, the service cost, the interest
cost and the actuarial gain (loss) on the Defined
Benefit Obligation are not included in the budgetary
accounts and in the EUROCONTROL part of the cost-
base;
n the compensation of national taxes on pension,
the resettlement and removal allowance and the
pensions of staff retired before 2005 are included in
the budgetary accounts and in the EUROCONTROL
part of the cost-base on a “pay as you go” (cash) basis
(instead of on an accrual basis);
n the budgetary appropriations for the dismantling
of the buildings, untaken leave, paid sickness leave,
sickness costs incurred but not yet claimed, litigations,
restructuring (early retirement costs) are included in
the budgetary accounts and in the EUROCONTROL
part of the cost-base on a “pay as you go” (cash) basis
(instead of on an accrual basis).
2. Definitions of types of expenditure : Article 6 para 1
of the Financial Regulations
n “Capital expenditure” shall be deemed to mean
expenditure incurred in the acquisition or creation of
tangible or intangible fixed assets, which will provide
future economic benefit to the Agency and which
have a useful life exceeding one year.
n “Operating expenditure” (which includes staff
expenditure), shall be deemed to mean expenditure
incurred in order to enable the continuing activities of
the Organisation to be carried out.
59
BUDGETARY ACCOUNTS

60
5. Carry-over of the budget : Article 7 of the Financial
Regulations
Budgetary appropriations which have not been committed
at the end of the budgetary year may not be carried over.
The Director General may request authorisation from
the Commission for the exceptional carry-over of
appropriations where circumstances so warrant.
The utilisation of the appropriations carried over shall be
separately recorded in the accounts for the budgetary year
into which they have been carried over.
3. Presentation of the budget : Article 6 para 2 of the
Financial Regulations
n The presentation of the budget and the financial five-
year programme shall facilitate the understanding of
the appropriations allocated to the Agency’s various
activities and the monitoring of the use of these
appropriations (nature or projects/activities).
n In accordance with the principles of economics
and sound financial management, it shall justify the
appropriations on the basis of the framework set by
the Commission and the Agency’s work programme.
4. Structure of the budget :
Article 6 para 3 of the Financial Regulations
The expenditure and receipts shall be presented
in accordance with the budgetary structure and
nomenclature as defined in the Rules of Application of the
Financial Regulations.

61
BUDGETARY ACCOUNTS
3.1 Part I
Page
61
Des
crip
tion
of e
xpen
ditu
re a
nd re
ceip
ts A
ppro
ved
Bud
get
Tota
lU
nuse
d B
udge
t
% O
uttu
rn
PAR
T I
PAR
T I
PAR
T I
PAR
T I
Land
& B
uild
ing
02.
225.
457
-2.2
25.4
57Eq
uipm
ent &
sof
twar
e14
.592
.000
7.00
4.62
37.
587.
377
48,0
%
TOTA
L C
APIT
AL E
XPEN
DIT
UR
E14
.592
.000
9.23
0.08
05.
361.
920
63,3
%
Staf
f15
8.21
2.00
016
2.07
7.27
6-3
.865
.276
102,
4%Pe
nsio
n &
ETS
93.2
32.0
0091
.235
.772
1.99
6.22
897
,9%
PBO
39.2
13.0
0039
.213
.000
010
0,0%
Oth
er o
pera
ting
cost
98.5
49.0
0093
.206
.548
5.34
2.45
294
,6%
Cos
t of C
apita
l : in
tere
sts
paid
to b
anks
3.72
2.00
036
7.14
93.
354.
851
9,9%
Dep
reci
atio
n11
.014
.000
9.16
6.55
11.
847.
449
83,2
%In
dire
ct C
osts
CAM
Met
hodo
logy
1.30
7.00
00
1.30
7.00
0Al
loca
tion
of th
e Pa
st P
art I
X0
00
Tax
Com
pens
atio
n &
anci
llary
ben
efit
dist
ribut
ion
169.
000
016
9.00
0
TOTA
L O
PER
ATIN
G E
XPEN
DIT
UR
E40
5.41
8.00
039
5.26
6.29
510
.151
.705
97,5
%
Staf
f Con
tribu
tions
-1.8
85.0
00-2
.073
.916
188.
916
110,
0%Sa
le o
f ass
ets
00
0Sa
les
of S
ervic
es a
nd G
rant
s-8
.514
.755
-7.2
34.8
84-1
.279
.871
85,0
%R
ecei
pt fr
om M
oroc
co &
Isra
el-4
.438
.245
-4.4
38.2
450
Fina
ncia
l Rec
eipt
s0
-479
.229
479.
229
Indi
rect
Cos
ts C
AM M
etho
dolo
gy-4
1.91
8.00
0-3
8.56
5.00
0-3
.353
.000
Allo
catio
n of
the
Past
Par
t IX
-20.
075.
000
-20.
075.
000
0Ta
x C
ompe
nsat
ion
& an
cilla
ry b
enef
it di
strib
utio
n-2
0.39
8.00
0-2
0.12
6.99
5-2
71.0
05
TOTA
L R
ECEI
PTS
-97.
229.
000
-92.
993.
268
-4.2
35.7
3295
,6%
CO
STB
ASE
308.
189.
000
302.
273.
027
5.91
5.97
398
,1%
Inte
rnal
Tax
-44.
744.
000
-48.
641.
173
3.89
7.17
310
8,7%
TOTA
L C
ON
TRIB
UTI
ON
S 26
3.44
5.00
025
3.63
1.85
49.
813.
146
96,2
8%
BU
DG
ETO
UTT
UR
NU
NU
SED
BU
DG
ET

62
58
Des
crip
tion
of e
xpen
ditu
re a
nd re
ceip
tsC
orpo
rate
Fu
nctio
nsC
entr
alis
ed
Serv
ices
Net
wor
k Se
rvic
esAi
r Tra
ffic
Man
agem
ent
Pan-
Euro
pean
Si
ngle
Sky
Pens
ion,
ETS
an
d Fi
nanc
ing
App
rove
d B
udge
t
1CF
1CS
1NS
1SR
1DS
19PA
RT
I
Land
& B
uild
ing
0E
quip
men
t & s
oftw
are
9.00
0.00
03.
576.
000
1.51
6.00
050
0.00
00
014
.592
.000
TOTA
L C
APIT
AL E
XPEN
DIT
UR
E9.
000.
000
3.57
6.00
01.
516.
000
500.
000
00
14.5
92.0
00
Sta
ff57
.682
.000
1.32
2.00
021
.018
.000
56.3
55.0
0021
.835
.000
015
8.21
2.00
0P
ensi
on &
ETS
93.2
32.0
0093
.232
.000
PBO
39.2
13.0
0039
.213
.000
Oth
er o
pera
ting
cost
45.1
71.0
0014
.000
26.9
43.0
0022
.804
.000
3.61
7.00
00
98.5
49.0
00C
ost o
f Cap
ital :
inte
rest
s pa
id to
ban
ks3.
331.
000
72.0
0023
9.00
080
.000
00
3.72
2.00
0D
epre
ciat
ion
8.42
4.00
00
2.16
5.00
042
5.00
00
011
.014
.000
Indi
rect
Cos
ts C
AM M
etho
dolo
gy0
1.30
7.00
00
00
01.
307.
000
Allo
catio
n of
the
Pas
t Par
t IX
00
00
00
0Ta
x C
ompe
nsat
ion
& a
ncilla
ry b
enef
it di
strib
utio
n0
169.
000
00
00
169.
000
TOTA
L O
PER
ATIN
G E
XPEN
DIT
UR
E11
4.60
8.00
02.
884.
000
50.3
65.0
0079
.664
.000
25.4
52.0
0013
2.44
5.00
040
5.41
8.00
0
Sta
ff C
ontri
butio
ns-6
82.0
00-1
6.00
0-2
36.0
00-6
95.0
00-2
56.0
000
-1.8
85.0
00S
ale
of a
sset
s0
Sal
es o
f Ser
vices
and
Gra
nts
383.
245
0-2
.586
.000
-2.1
83.0
00-4
.129
.000
0-8
.514
.755
Rec
eipt
from
Mor
occo
& Is
rael
-4.4
38.2
45-4
.438
.245
Fina
ncia
l Rec
eipt
s0
00
00
00
Indi
rect
Cos
ts C
AM M
etho
dolo
gy-6
4.22
2.00
00
7.20
1.00
010
.720
.000
4.38
3.00
00
-41.
918.
000
Allo
catio
n of
the
Pas
t Par
t IX
00
00
0-2
0.07
5.00
0-2
0.07
5.00
0Ta
x C
ompe
nsat
ion
& a
ncilla
ry b
enef
it di
strib
utio
n8.
083.
000
02.
248.
000
6.78
5.00
02.
652.
000
-40.
166.
000
-20.
398.
000
TOTA
L R
ECEI
PTS
-60.
876.
000
-16.
000
6.62
7.00
014
.627
.000
2.65
0.00
0-6
0.24
1.00
0-9
7.22
9.00
0
CO
STB
ASE
53.7
32.0
002.
868.
000
56.9
92.0
0094
.291
.000
28.1
02.0
0072
.204
.000
308.
189.
000
Inte
rnal
Tax
-16.
109.
000
-378
.000
-5.9
74.0
00-1
6.07
5.00
0-6
.208
.000
0-4
4.74
4.00
0
TOTA
L C
ON
TRIB
UTI
ON
S 37
.623
.000
2.49
0.00
051
.018
.000
78.2
16.0
0021
.894
.000
72.2
04.0
0026
3.44
5.00
0
BU
DG
ET

63
BUDGETARY ACCOUNTS59
Des
crip
tion
of e
xpen
ditu
re a
nd re
ceip
tsC
orpo
rate
Fu
nctio
nsC
entr
alis
ed
Serv
ices
Net
wor
k Se
rvic
esAi
r Tra
ffic
Man
agem
ent
Pan-
Euro
pean
Si
ngle
Sky
Pens
ion,
ETS
an
d Fi
nanc
ing
Tota
l
1CF
1C
S1N
S1S
R1D
S19
PA
RT
I
Land
& B
uild
ing
2.22
5.45
72.
225.
457
Equ
ipm
ent &
sof
twar
e4.
290.
823
02.
147.
197
566.
603
07.
004.
623
TOTA
L C
APIT
AL E
XPEN
DIT
UR
E6.
516.
280
02.
147.
197
566.
603
00
9.23
0.08
0
Sta
ff57
.503
.967
024
.239
.740
59.0
31.0
4921
.302
.520
016
2.07
7.27
6P
ensi
on &
ETS
91.2
35.7
7291
.235
.772
PBO
39.2
13.0
0039
.213
.000
Oth
er o
pera
ting
cost
44.3
23.0
940
26.1
38.5
5019
.126
.341
3.61
8.56
30
93.2
06.5
48C
ost o
f Cap
ital :
inte
rest
s pa
id to
ban
ks26
7.74
81.
010
83.9
5414
.436
00
367.
149
Dep
reci
atio
n6.
846.
033
23.2
601.
932.
390
364.
868
00
9.16
6.55
1
Indi
rect
Cos
ts C
AM M
etho
dolo
gy0
00
00
00
Allo
catio
n of
the
Pas
t Par
t IX
00
00
00
0Ta
x C
ompe
nsat
ion
& a
ncilla
ry b
enef
it di
strib
utio
n0
00
00
00
TOTA
L O
PER
ATIN
G E
XPEN
DIT
UR
E10
8.94
0.84
224
.271
52.3
94.6
3478
.536
.694
24.9
21.0
8313
0.44
8.77
239
5.26
6.29
5
Sta
ff C
ontri
butio
ns-7
51.3
540
-289
.275
-767
.107
-266
.295
116
-2.0
73.9
16S
ale
of a
sset
s0
00
00
00
Sal
es o
f Ser
vices
and
Gra
nts
00
-4.4
32.5
6625
.127
-2.8
27.4
45-7
.234
.884
Rec
eipt
from
Mor
occo
& Is
rael
-4.4
38.2
45-4
.438
.245
Fina
ncia
l Rec
eipt
s-4
78.6
110
0-6
180
0-4
79.2
29In
dire
ct C
osts
CAM
Met
hodo
logy
-59.
745.
000
06.
838.
000
10.1
80.0
004.
162.
000
0-3
8.56
5.00
0Al
loca
tion
of th
e P
ast P
art I
X0
00
00
-20.
075.
000
-20.
075.
000
Tax
Com
pens
atio
n &
anc
illary
ben
efit
dist
ribut
ion
10.1
39.6
880
42.3
667.
960.
321
83.7
14-3
8.35
3.08
4-2
0.12
6.99
5
TOTA
L R
ECEI
PTS
-55.
273.
522
02.
158.
525
17.3
97.7
241.
151.
973
-58.
427.
968
-92.
993.
268
CO
STB
ASE
53.6
67.3
1924
.271
54.5
53.1
5995
.934
.418
26.0
73.0
5672
.020
.804
302.
273.
027
Inte
rnal
Tax
-18.
920.
976
0-6
.812
.681
-16.
842.
588
-6.1
62.3
7497
.447
-48.
641.
173
TOTA
L C
ON
TRIB
UTI
ON
S 34
.746
.344
24.2
7147
.740
.478
79.0
91.8
3019
.910
.682
72.1
18.2
5125
3.63
1.85
4
OU
TTU
RN

64
60
Bud
geta
ry A
ccou
nts
- Act
iviti
es fi
nanc
ed b
y 41
Mem
ber S
tate
sPa
rt I
Des
crip
tion
of e
xpen
ditu
re a
nd re
ceip
tsC
orpo
rate
Fu
nctio
nsC
entr
alis
ed
Serv
ices
Net
wor
k Se
rvic
esAi
r Tra
ffic
Man
agem
ent
Pan-
Euro
pean
Si
ngle
Sky
Pens
ion,
ET
S an
d Fi
nanc
ing
Unu
sed
Bud
get
%
Out
turn
1CF
1CS
1NS
1SR
1DS
19PA
RT
IPA
RT
I
Land
& B
uild
ing
-2.2
25.4
570
00
00
-2.2
25.4
57E
quip
men
t & s
oftw
are
4.70
9.17
73.
576.
000
-631
.197
-66.
603
00
7.58
7.37
748
,0%
TOTA
L C
APIT
AL E
XPEN
DIT
UR
E2.
483.
720
3.57
6.00
0-6
31.1
97-6
6.60
30
05.
361.
920
63,3
%
Sta
ff17
8.03
31.
322.
000
-3.2
21.7
40-2
.676
.049
532.
480
0-3
.865
.276
102,
4%P
ensi
on &
ETS
00
00
01.
996.
228
1.99
6.22
897
,9%
PB
O0
00
00
00
100,
0%O
ther
ope
ratin
g co
st84
7.90
614
.000
804.
450
3.67
7.65
9-1
.563
05.
342.
452
94,6
%C
ost o
f Cap
ital :
inte
rest
s pa
id to
ban
ks3.
063.
252
70.9
9015
5.04
665
.564
00
3.35
4.85
19,
9%D
epre
ciat
ion
1.57
7.96
7-2
3.26
023
2.61
060
.132
00
1.84
7.44
983
,2%
Indi
rect
Cos
ts C
AM M
etho
dolo
gy0
1.30
7.00
00
00
01.
307.
000
Allo
catio
n of
the
Pas
t Par
t IX
00
00
00
0Ta
x C
ompe
nsat
ion
& a
ncilla
ry b
enef
it di
strib
utio
n0
169.
000
00
00
169.
000
TOTA
L O
PER
ATIN
G E
XPEN
DIT
UR
E5.
667.
158
2.85
9.72
9-2
.029
.634
1.12
7.30
653
0.91
71.
996.
228
10.1
51.7
0597
,5%
Sta
ff C
ontri
butio
ns69
.354
-16.
000
53.2
7572
.107
10.2
95-1
1618
8.91
611
0,0%
Sal
e of
ass
ets
00
00
00
0S
ales
of S
ervic
es a
nd G
rant
s38
3.24
50
1.84
6.56
6-2
.208
.127
-1.3
01.5
550
-1.2
79.8
7185
,0%
Rec
eipt
from
Mor
occo
& Is
rael
00
00
00
0Fi
nanc
ial R
ecei
pts
478.
611
00
618
00
479.
229
Indi
rect
Cos
ts C
AM M
etho
dolo
gy-4
.477
.000
036
3.00
054
0.00
022
1.00
00
-3.3
53.0
00Al
loca
tion
of th
e P
ast P
art I
X0
00
00
00
Tax
Com
pens
atio
n &
anc
illary
ben
efit
dist
ribut
ion
-2.0
56.6
880
2.20
5.63
4-1
.175
.321
2.56
8.28
7-1
.812
.916
-271
.005
TOTA
L R
ECEI
PTS
-5.6
02.4
78-1
6.00
04.
468.
475
-2.7
70.7
241.
498.
027
-1.8
13.0
32-4
.235
.732
95,6
%
CO
STB
ASE
64.6
812.
843.
729
2.43
8.84
1-1
.643
.418
2.02
8.94
418
3.19
65.
915.
973
98,1
%
Inte
rnal
Tax
2.81
1.97
6-3
78.0
0083
8.68
176
7.58
8-4
5.62
6-9
7.44
73.
897.
173
108,
7%
TOTA
L C
ON
TRIB
UTI
ON
S 2.
876.
656
2.46
5.72
93.
277.
522
-875
.830
1.98
3.31
885
.749
9.81
3.14
696
,28%
UN
USE
D B
UD
GET
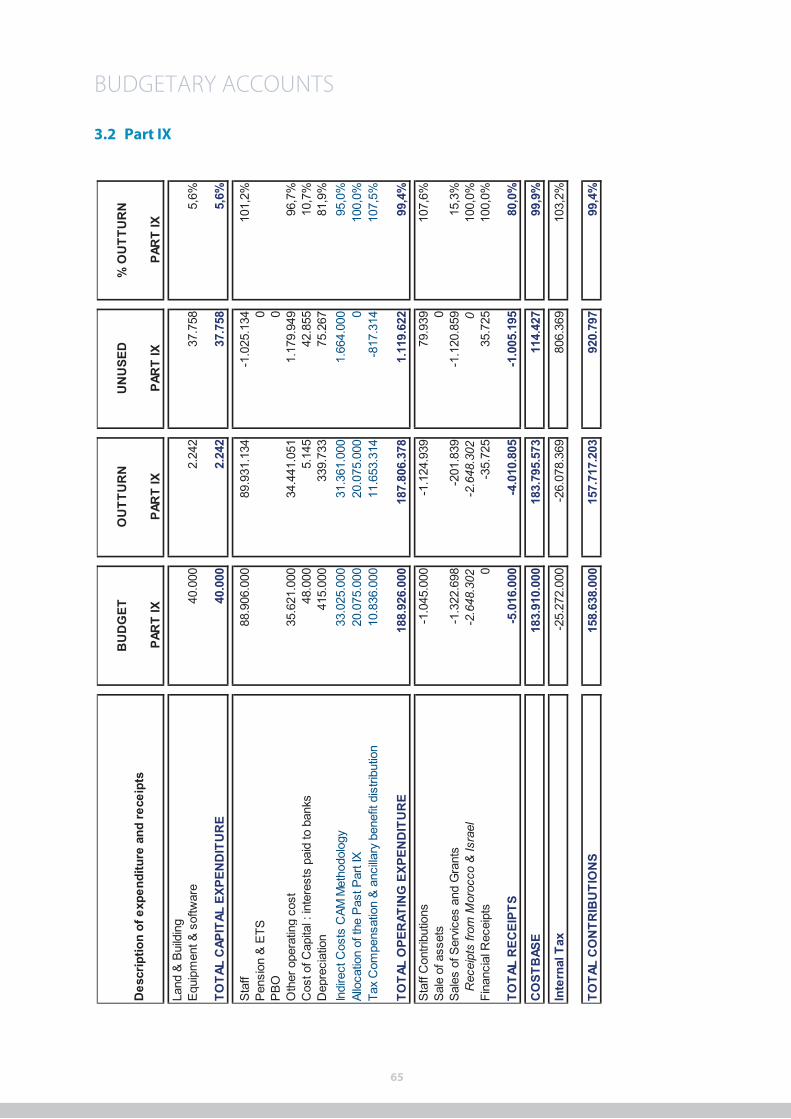
65
BUDGETARY ACCOUNTS
3.2 Part IX
Page
65
Des
crip
tion
of e
xpen
ditu
re a
nd re
ceip
tsB
UD
GET
OU
TTU
RN
UN
USE
D%
OU
TTU
RN
PAR
T IX
PAR
T IX
PAR
T IX
PAR
T IX
Land
& B
uild
ing
Equi
pmen
t & s
oftw
are
40.0
002.
242
37.7
585,
6%
TOTA
L C
APIT
AL E
XPEN
DIT
UR
E40
.000
2.24
237
.758
5,6%
Staf
f88
.906
.000
89.9
31.1
34-1
.025
.134
101,
2%Pe
nsio
n &
ETS
0PB
O0
Oth
er o
pera
ting
cost
35.6
21.0
0034
.441
.051
1.17
9.94
996
,7%
Cos
t of C
apita
l : in
tere
sts
paid
to b
anks
48.0
005.
145
42.8
5510
,7%
Dep
reci
atio
n41
5.00
033
9.73
375
.267
81,9
%In
dire
ct C
osts
CAM
Met
hodo
logy
33.0
25.0
0031
.361
.000
1.66
4.00
095
,0%
Allo
catio
n of
the
Past
Par
t IX
20.0
75.0
0020
.075
.000
010
0,0%
Tax
Com
pens
atio
n &
anci
llary
ben
efit
dist
ribut
ion
10.8
36.0
0011
.653
.314
-817
.314
107,
5%
TOTA
L O
PER
ATIN
G E
XPEN
DIT
UR
E18
8.92
6.00
018
7.80
6.37
81.
119.
622
99,4
%
Staf
f Con
tribu
tions
-1.0
45.0
00-1
.124
.939
79.9
3910
7,6%
Sale
of a
sset
s0
Sale
s of
Ser
vices
and
Gra
nts
-1.3
22.6
98-2
01.8
39-1
.120
.859
15,3
%R
ecei
pts
from
Mor
occo
& Is
rael
-2.6
48.3
02-2
.648
.302
010
0,0%
Fina
ncia
l Rec
eipt
s0
-35.
725
35.7
2510
0,0%
TOTA
L R
ECEI
PTS
-5.0
16.0
00-4
.010
.805
-1.0
05.1
9580
,0%
CO
STB
ASE
183.
910.
000
183.
795.
573
114.
427
99,9
%
Inte
rnal
Tax
-25.
272.
000
-26.
078.
369
806.
369
103,
2%
TOTA
L C
ON
TRIB
UTI
ON
S 15
8.63
8.00
015
7.71
7.20
392
0.79
799
,4%

66
3.3 Part II
62
3.3
Part
II
Des
crip
tion
of e
xpen
ditu
re a
nd re
ceip
tsB
UD
GET
OU
TTU
RN
UN
USE
D B
UD
GET
% O
UTT
UR
N
Land
& B
uild
ing
Equ
ipm
ent &
sof
war
e10
0.00
00
100.
000
0,0%
TOTA
L C
APIT
AL E
XPEN
DIT
UR
E10
0.00
00
100.
000
0,0%
Sta
ff co
sts
14.2
27.0
0012
.615
.528
1.61
1.47
288
,7%
Pen
sion
, PBO
& E
TS24
.381
-24.
381
Oth
er o
pera
ting
cost
3.69
9.00
03.
204.
283
494.
717
86,6
%C
ost o
f cap
ital
: int
eres
t pai
d to
ban
ks32
.360
-32.
360
Dep
reci
atio
n43
.375
-43.
375
Indi
rect
Cos
ts C
AM M
etho
dolo
gy3.
318.
000
3.15
1.00
016
7.00
095
,0%
Tax
Com
pens
atio
n &
anc
illary
ben
efit
3.75
6.00
03.
325.
502
430.
498
88,5
%
TOTA
L O
PER
ATIN
G E
XPEN
DIT
UR
E25
.000
.000
22.3
96.4
282.
603.
572
89,6
%
Inte
rnal
tax
Oth
er S
taff
rece
ipts
-235
.000
-170
.399
-64.
601
72,5
%S
ale
of a
sset
s-1
16.0
26S
ale
of s
ervi
ces
-2.6
61.1
452.
661.
145
100,
0%Fi
nanc
ial r
ecei
pts
TOTA
L R
ECEI
PTS
-235
.000
-2.9
47.5
702.
596.
544
1254
,3%
TOTA
L AD
MIN
ISTR
ATIV
E U
NIT
RAT
E 24
.865
.000
19.4
48.8
585.
416.
142
78,2
%

67
BUDGETARY ACCOUNTS
3.4 Part III
63
3.
4 Pa
rt II
I B
udge
tary
Acc
ount
s - P
art I
II - M
aast
richt
Upp
er A
rea
Con
trol
: M
UAC
BU
DG
ETB
UD
GET
BU
DG
ETO
UTT
UR
NO
UTT
UR
NO
UTT
UR
NU
NU
SED
%
OU
TTU
RN
OAT
GAT
OAT
GAT
BU
DG
ET
Land
& B
uild
ing
0,00
4.30
6.00
0,00
4.30
6.00
0,00
0,00
1.44
5.46
0,33
1.44
5.46
0,33
2.86
0.53
9,67
33,6
%E
quip
men
t & s
ofw
are
0,00
10.0
89.0
00,0
010
.089
.000
,00
0,00
5.24
6.48
9,76
5.24
6.48
9,76
4.84
2.51
0,24
52,0
%
TOTA
L C
APIT
AL E
XPEN
DIT
UR
E0,
0014
.395
.000
,00
14.3
95.0
00,0
00,
006.
691.
950,
096.
691.
950,
097.
703.
049,
9146
,5%
S
taff
cost
s3.
907.
288,
2213
7.47
6.71
1,78
141.
384.
000,
003.
792.
742,
5313
3.44
6.45
7,34
137.
239.
199,
874.
144.
800,
1397
,1%
Oth
er o
pera
ting
cost
1.88
0.87
2,95
24.9
01.1
27,0
526
.782
.000
,00
1.65
0.55
7,96
21.8
51.9
54,7
323
.502
.512
,69
3.27
9.48
7,31
87,8
%C
ost o
f cap
ital
: int
eres
t pai
d to
ban
ks0,
0042
9.00
0,00
429.
000,
000,
0029
4.52
2,87
294.
522,
8713
4.47
7,13
68,7
%D
epre
ciat
ion
0,00
9.16
0.00
0,00
9.16
0.00
0,00
0,00
9.31
7.26
9,78
9.31
7.26
9,78
-157
.269
,78
101,
7%Fr
ozen
exp
endi
ture
121.
598,
404.
278.
401,
604.
400.
000,
00.
TOTA
L O
PER
ATIN
G E
XPEN
DIT
UR
E5.
909.
759,
5717
6.24
5.24
0,43
182.
155.
000,
005.
443.
300,
4916
4.91
0.20
4,72
170.
353.
505,
2111
.801
.494
,79
93,5
%
Oth
er S
taff
rece
ipts
-42.
738,
44-1
.503
.738
,56
-1.5
46.4
77,0
0-3
9.81
1,66
-1.4
00.7
60,7
7-1
.440
.572
,43
-105
.904
,57
93,2
%S
ale
of a
sset
s0,
000,
00-1
1.82
3,41
-11.
823,
4111
.823
,41
S
ale
of s
ervic
es-1
68.5
79,6
0-5
.931
.420
,40
-6.1
00.0
00,0
0-1
93.1
57,9
6-6
.796
.202
,37
-6.9
89.3
60,3
388
9.36
0,33
114,
6%Fi
nanc
ial r
ecei
pts
0,00
-5.9
44,5
6-7
8.70
0,82
-84.
645,
3884
.645
,38
TOTA
L R
ECEI
PTS
-211
.318
,04
-7.4
35.1
58,9
6-7
.646
.477
,00
-238
.914
,18
-8.2
87.4
87,3
7-8
.526
.401
,55
879.
924,
5511
1,5%
TOTA
L C
OST
BAS
E5.
698.
441,
5316
8.81
0.08
1,47
174.
508.
523,
005.
204.
386,
3115
6.62
2.71
7,35
161.
827.
103,
6612
.681
.419
,34
92,7
%
Inte
rnal
Tax
-1.1
52.9
66,6
2-4
0.56
6.76
9,38
-41.
719.
736,
00-1
.087
.492
,48
-38.
263.
082,
02-3
9.35
0.57
4,50
-2.3
69.1
61,5
094
,3%
Froz
en In
tern
al T
ax-3
6.08
8,33
-1.2
69.7
56,6
7-1
.305
.845
,00
TOTA
L C
ON
TRIB
UTI
ON
S4.
545.
474,
9112
8.24
3.31
2,09
132.
788.
787,
00FR
OZE
N C
ON
TRIB
UTI
ON
S-8
5.51
0,07
-3.0
08.6
44,9
3-3
.094
.155
,00
Actu
ally
cal
led
up C
ontr
ibut
ions
4.45
9.96
4,97
125.
234.
667,
0312
9.69
4.63
2,00
4.11
6.89
3,83
118.
359.
635,
3312
2.47
6.52
9,16
7.21
8.10
2,84
94,4
%
Des
crip
tion
of e
xpen
ditu
re a
nd re
ceip
ts

68
3.5 Part IV
64
3.5
Part
IV
Bud
geta
ry A
ccou
nts
- Par
t IV
- Spe
cial
Ann
exes
Des
crip
tion
of e
xpen
ditu
re a
nd re
ceip
tsB
UD
GET
OU
TTU
RN
UN
USE
D B
UD
GET
% O
UTT
UR
N
Sta
ff co
sts
15.9
87.3
82,6
4P
ensi
on, P
BO &
ETS
65.1
17,6
8O
ther
ope
ratin
g co
st7.
254.
389,
84C
ost o
f cap
ital
: int
eres
t pai
d to
ban
ks
Indi
rect
Cos
ts C
AM M
etho
dolo
gy4.
268.
000,
004.
053.
000,
0021
5.00
0,00
Tax
Com
pens
atio
n &
anc
illary
ben
efit
dist
ribut
ion
5.63
7.00
0,00
5.14
8.17
9,00
488.
821,
00
TOTA
L O
PER
ATIN
G E
XPEN
DIT
UR
E71
.136
.362
,07
32.5
08.0
69,1
638
.628
.292
,91
45,7
%
Inte
rnal
tax
-3.0
14.1
97,0
5O
ther
Sta
ff re
ceip
ts-9
2.76
0,92
Sal
e of
ass
ets
Sal
e of
ser
vice
s-2
0.19
9.93
2,18
Fina
ncia
l rec
eipt
s
TOTA
L R
ECEI
PTS
-71.
136.
362,
07-2
3.30
6.89
0,15
-47.
829.
471,
9232
,8%

69
BUDGETARY ACCOUNTS
3.6 Part V
65
3.6
Part
V
Bud
geta
ry A
ccou
nts
- Par
t V -
Sick
ness
ben
efit
sche
me
Des
crip
tion
of e
xpen
ditu
re a
nd re
ceip
tsAp
prov
ed B
udge
tPa
ymen
t and
rece
ipts
Unu
sed
Bud
get
% O
uttu
rn
Rei
mbu
rsm
ent t
o st
aff m
embe
rs, m
edic
al c
onsu
ltant
fe
es a
nd m
isce
llane
ous
expe
nditu
re14
.000
.000
,00
14.5
12.9
43,9
0-5
12.9
43,9
010
3,7%
Fina
nce
& In
sura
nce
482,
56-4
82,5
6
TOTA
L O
PER
ATIN
G E
XPEN
DIT
UR
E14
.000
.000
,00
14.5
13.4
26,4
6-5
13.4
26,4
610
3,7%
Sta
ff co
ntrib
utio
n-4
.600
.000
,00
-5.3
56.8
06,1
375
6.80
6,13
116,
5%O
rgan
isat
ion'
s co
ntrib
utio
n-9
.200
.000
,00
-10.
686.
664,
571.
486.
664,
5711
6,2%
Fina
ncia
l yie
lds
-5.0
00,0
0-1
23,9
0-4
.876
,10
2,5%
Mis
cella
neou
s re
ceip
ts
TOTA
L R
ECEI
PTS
-13.
805.
000,
00-1
6.04
3.59
4,60
2.23
8.59
4,60
116,
2%
BAL
ANC
E19
5.00
0,00
-1.5
30.1
68,1
41.
725.
168,
14

70
3.7 Part VII
66
3.7
Part
VII
B
udge
tary
Acc
ount
s - P
art V
II - U
nem
ploy
men
t ben
efit
sche
me
- Tem
pora
ry s
ocia
l allo
wan
ces
Des
crip
tion
of e
xpen
ditu
re a
nd re
ceip
tsAp
prov
ed B
udge
tPa
ymen
t and
rece
ipts
Unu
sed
Bud
get
% O
uttu
rn
Pay
men
t of u
nem
ploy
men
t allo
wan
ces
255.
000,
0018
5.83
7,09
69.1
62,9
172
,9%
Fina
nce
& In
sura
nce
0,00
141,
36-1
41,3
610
0,0%
TOTA
L O
PER
ATIN
G E
XPEN
DIT
UR
E25
5.00
0,00
185.
978,
4569
.021
,55
72,9
%
Inte
rnal
Tax
-20.
000,
00-3
7.35
2,15
17.3
52,1
518
6,8%
Sta
ff co
ntrib
utio
n-7
8.00
0,00
-85.
865,
227.
865,
2211
0,1%
Org
anis
atio
n's
cont
ribut
ion
-156
.000
,00
-174
.272
,81
18.2
72,8
111
1,7%
Fina
ncia
l yie
lds
-1.0
00,0
00,
00-1
.000
,00
0,0%
Mis
cella
neou
s re
ceip
ts
TOTA
L R
ECEI
PTS
-255
.000
,00
-297
.490
,18
42.4
90,1
811
6,7%
BAL
ANC
E0,
00-1
11.5
11,7
311
1.51
1,73

71
4. EUROCONTROL PARTOF THE COST BASE

72
4.1. Cost Base : Part I
Reconciliation with Budgetary Accounts – Part I
Comparison of the 2018 Outturn Cost Base with the Forecast Cost Base
4.1 Cost Base : Part I
Reconciliation with Budgetary Accounts – Part I
Comparison of the 2018 Outturn Cost Base with the Forecast Cost Base
FORECAST PART I
ACTUAL PART I
UNSPENT PART I
1a Staff 158.212.000 162.077.276 -3.865.2761b Pension & ETS 93.232.000 91.235.772 1.996.2281c PBO 39.213.000 39.213.000 02 Other operating 98.549.000 93.206.548 5.342.4523 Cost of capital 3.722.000 367.149 3.354.8514 Depreciation 11.014.000 9.166.551 1.847.449
MUAC support cost 0Indirect Costs CAM Methodology 1.307.000 1.307.000Allocation of the Past Part IX 0 0 0Tax Compensation & ancillary benefit distribution 169.000 0 169.000TOTAL EXPENDITURE 405.418.000 395.266.295 10.151.705
1a Staff receipts -1.885.000 -2.073.916 188.9162 Sale of assets 0 0 02 Sale of services -8.514.755 -7.234.884 -1.279.871
Receipts from Morocco & Israel -4.438.245 -4.438.245 0Indirect Costs CAM Methodology -41.918.000 -38565000 -3.353.000
2 Allocation of the Past Part IX -20.075.000 -20075000 02 Tax Compensation & ancillary benefit distribution -20.398.000 -20126995,07 -271.005
Financial receipts -479.229 479.229TOTAL RECEIPTS -97.229.000 -92.993.268 -4.235.732
TOTAL COSTBASE 308.189.000 302.273.027 5.915.973
INTERNAL TAX -44.744.000 -48.641.173 3.897.173
CONTRIBUTIONS 263.445.000 253.631.854 9.813.146
COSTBASE FORECAST
PART IACTUAL PART
IUNSPENT PART
I1a Staff costs 156.327.000 160.003.360 -3.676.3601b Pension & ETS 93.232.000 91.235.772 1.996.2281c PBO 39.213.000 39.213.000 02 Operating costs 85.596.000 81.533.419 4.062.5813 Depreciation 11.014.000 9.166.551 1.847.4494 Cost of capital 3.722.000 367.149 3.354.851
Indirect Costs CAM Methodology -40.611.000 -38.565.000 -2.046.000Allocation of the Past Part IX -20.075.000 -20.075.000 0Tax Compensation & ancillary benefit distribution -20.229.000 -20.126.995 -102.005Financial receipts -479.229 479.229TOTAL COSTBASE 308.189.000 302.273.027 5.915.973
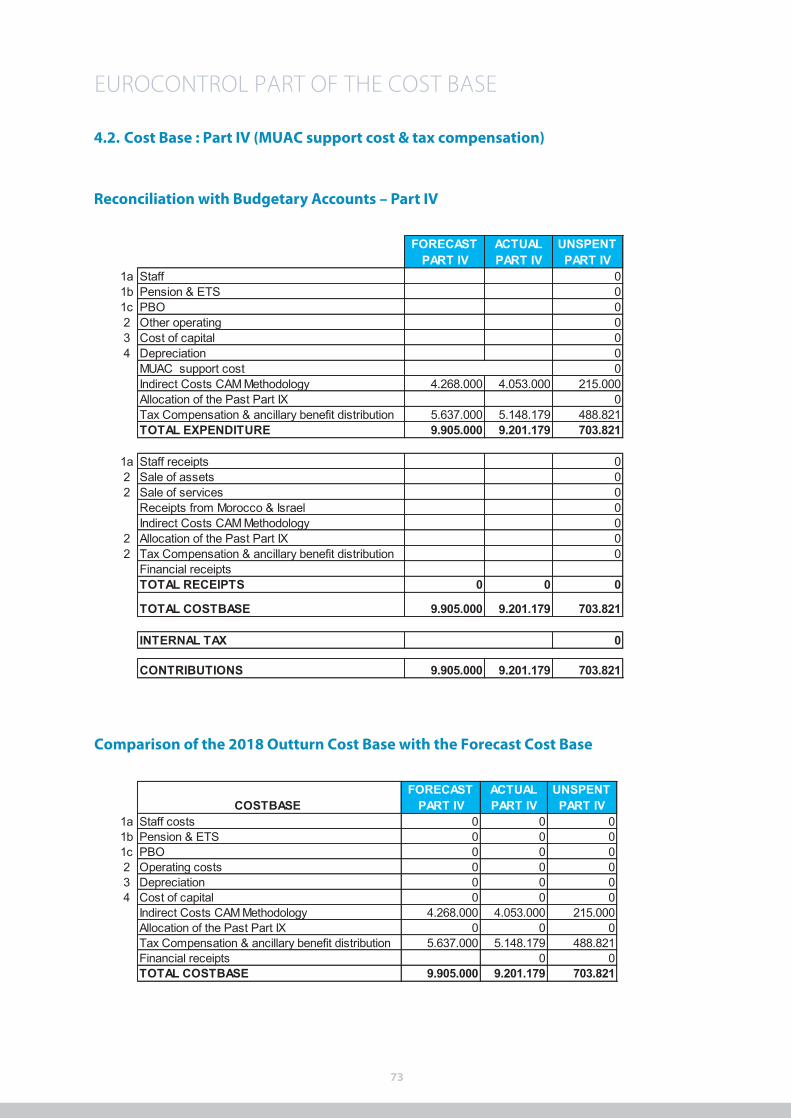
73
4.2. Cost Base : Part IV (MUAC support cost & tax compensation)
Reconciliation with Budgetary Accounts – Part IV
EUROCONTROL PART OF THE COST BASE
Comparison of the 2018 Outturn Cost Base with the Forecast Cost Base
4.2 Cost Base : Part IV (MUAC support cost & tax compensation)
Reconciliation with Budgetary Accounts – Part IV
Comparison of the 2018 Outturn Cost Base with the Forecast Cost Base
FORECAST PART IV
ACTUAL PART IV
UNSPENT PART IV
1a Staff 01b Pension & ETS 01c PBO 02 Other operating 03 Cost of capital 04 Depreciation 0
MUAC support cost 0Indirect Costs CAM Methodology 4.268.000 4.053.000 215.000Allocation of the Past Part IX 0Tax Compensation & ancillary benefit distribution 5.637.000 5.148.179 488.821TOTAL EXPENDITURE 9.905.000 9.201.179 703.821
1a Staff receipts 02 Sale of assets 02 Sale of services 0
Receipts from Morocco & Israel 0Indirect Costs CAM Methodology 0
2 Allocation of the Past Part IX 02 Tax Compensation & ancillary benefit distribution 0
Financial receiptsTOTAL RECEIPTS 0 0 0
TOTAL COSTBASE 9.905.000 9.201.179 703.821
INTERNAL TAX 0
CONTRIBUTIONS 9.905.000 9.201.179 703.821
COSTBASE FORECAST
PART IVACTUAL PART IV
UNSPENT PART IV
1a Staff costs 0 0 01b Pension & ETS 0 0 01c PBO 0 0 02 Operating costs 0 0 03 Depreciation 0 0 04 Cost of capital 0 0 0
Indirect Costs CAM Methodology 4.268.000 4.053.000 215.000Allocation of the Past Part IX 0 0 0Tax Compensation & ancillary benefit distribution 5.637.000 5.148.179 488.821Financial receipts 0 0TOTAL COSTBASE 9.905.000 9.201.179 703.821

74
4.3. Costbase : Part IX
Reconciliation with Budgetary Accounts – Part IX
Comparison of the 2018 Outturn Cost Base with the Forecast Cost Base
4.3 Costbase : Part IX
Reconciliation with Budgetary Accounts – Part IX
Comparison of the 2018 Outturn Cost Base with the Forecast Cost Base
FORECAST PART IX
ACTUAL PART IX
UNSPENT PART IX
1a Staff 88.906.000 89.931.134 -1.025.1341b Pension & ETS 01c PBO 02 Other operating 35.621.000 34.441.051 1.179.9493 Cost of capital 48.000 5.145 42.8554 Depreciation 415.000 339.733 75.267
MUAC support cost 0Indirect Costs CAM Methodology 31.361.000 -31.361.000Allocation of the Past Part IX 33.025.000 20.075.000 12.950.000Tax Compensation & ancillary benefit distribution 30.911.000 11.653.314 19.257.686TOTAL EXPENDITURE 188.926.000 187.806.378 1.119.622
1a Staff receipts -1.045.000 -1.124.939 79.9392 Sale of assets 02 Sale of services -1.322.698 -201.839 -1.120.859
Receipts from Morocco & Israel 0 0 0Indirect Costs CAM Methodology 0 0 0
2 Allocation of the Past Part IX -2.648.302 -2.648.302 02 Tax Compensation & ancillary benefit distribution -35.725 35.725
Financial receiptsTOTAL RECEIPTS -5.016.000 -4.010.805 -1.005.195
TOTAL COSTBASE 183.910.000 183.795.573 114.427
INTERNAL TAX -25.272.000 -26.078.369 806.369
CONTRIBUTIONS 158.638.000 157.717.203 920.797
COSTBASE FORECAST
PART IXACTUAL PART
IXUNSPENT PART IX
1a Staff costs 87.861.000 88.806.195 -945.1951b Pension & ETS 0 0 01c PBO 0 0 02 Operating costs 34.298.302 34.239.213 59.0893 Depreciation 415.000 339.733 75.2674 Cost of capital 48.000 5.145 42.855
Indirect Costs CAM Methodology 0 31.361.000 -31.361.000Allocation of the Past Part IX 30.376.698 17.426.698 12.950.000Tax Compensation & ancillary benefit distribution 30.911.000 11.617.589 19.293.411Financial receipts 0 0TOTAL COSTBASE 183.910.000 183.795.573 114.427
4.4 Costbase : Part III
Reconciliation with Budgetary Accounts – Part III
Comparison of the 2018 Outturn Cost Base with the Forecast Cost Base
OUTTURN COSTBASE OAT
COSTBASE GAT
Remunerations 137.239.200 3.792.743 133.446.457PBO 0 0 0Other operating costs 23.502.513 1.650.558 21.851.955Cost of capital 294.523 294.523Depreciation 9.317.270 9.317.270
TOTAL EXPENDITURE 170.353.505 5.443.300 164.910.205
Other Staff receipts -1.440.572 -39.812 -1.400.761Sale of assets -11.823 0 -11.823Sale of services -6.989.360 -193.158 -6.796.202Financial receipts -84.645 -5.945 -78.701
TOTAL RECEIPTS -8.526.402 -238.914 -8.287.487
TOTAL COST BASE 161.827.104 5.204.386 156.622.717
Internal Tax 39.350.575 1.087.492 38.263.082
CONTRIBUTIONS 122.476.529 4.116.894 118.359.635
COSTBASE FORECAST OUTTURN UNSPENT
Staff Costs 139.837.523 132.033.873 7.803.650Operating costs 25.082.000,00 15.055.752 10.026.248Interest 429.000 215.822 213.178Depreciation 9.160.000 9.317.270 -157.270
TOTAL 174.508.523 156.622.717 17.885.806

75
EUROCONTROL PART OF THE COST BASE
4.4 Costbase : Part III
Reconciliation with Budgetary Accounts – Part III
Comparison of the 2018 Outturn Cost Base with the Forecast Cost Base
4.4 Costbase : Part III
Reconciliation with Budgetary Accounts – Part III
Comparison of the 2018 Outturn Cost Base with the Forecast Cost Base
OUTTURN COSTBASE OAT
COSTBASE GAT
Remunerations 137.239.200 3.792.743 133.446.457PBO 0 0 0Other operating costs 23.502.513 1.650.558 21.851.955Cost of capital 294.523 294.523Depreciation 9.317.270 9.317.270
TOTAL EXPENDITURE 170.353.505 5.443.300 164.910.205
Other Staff receipts -1.440.572 -39.812 -1.400.761Sale of assets -11.823 0 -11.823Sale of services -6.989.360 -193.158 -6.796.202Financial receipts -84.645 -5.945 -78.701
TOTAL RECEIPTS -8.526.402 -238.914 -8.287.487
TOTAL COST BASE 161.827.104 5.204.386 156.622.717
Internal Tax 39.350.575 1.087.492 38.263.082
CONTRIBUTIONS 122.476.529 4.116.894 118.359.635
COSTBASE FORECAST OUTTURN UNSPENT
Staff Costs 139.837.523 132.033.873 7.803.650Operating costs 25.082.000,00 15.055.752 10.026.248Interest 429.000 215.822 213.178Depreciation 9.160.000 9.317.270 -157.270
TOTAL 174.508.523 156.622.717 17.885.806

4.5 Evolution 2014-2018 Outturn Costbase (all Budgetary Parts)
Evolution 2014-2018 by nature of costs
76
4.5 Evolution 2014-2018 Outturn Costbase (all Budgetary Parts)
Evolution 2014-2018 by nature of costs
COST BASE ALL PARTS 2014 2015 2016 2017 2018Staff costs 338.971.431 336.905.623 348.998.162 354.912.153 380.843.428Pension & ETS 103.228.256 102.529.805 104.990.218 104.859.589 91.235.772Operating costs 135.000.867 127.428.431 136.102.657 126.927.477 121.667.855Depreciation & cost of capital 24.627.884 22.220.673 20.669.926 18.995.967 18.932.441PBO 39.275.257 39.745.771 39.423.825 38.729.000 39.213.000Unused credit transferred to the PBOExceptional items 10.026.491
TOTAL 651.130.186 628.830.303 650.184.788 644.424.186 651.892.496
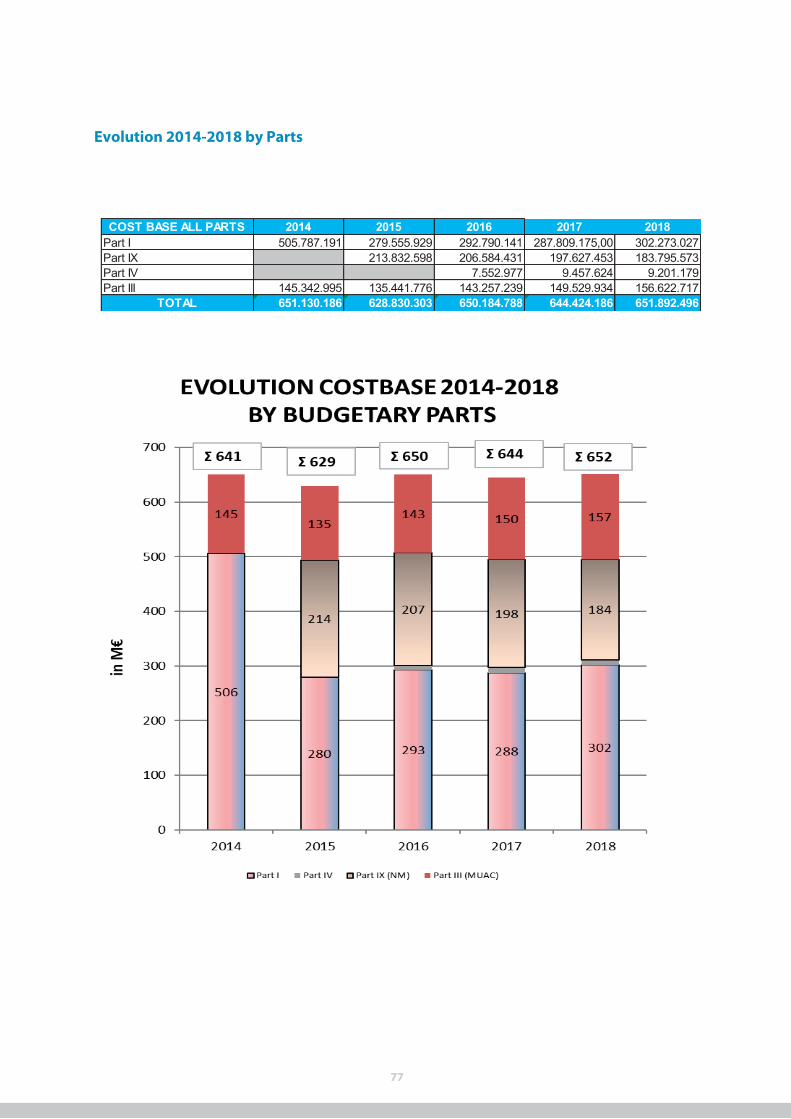
77
Evolution 2014-2018 by Parts
Evolution 2014-2018 by Parts
COST BASE ALL PARTS 2014 2015 2016 2017 2018Part I 505.787.191 279.555.929 292.790.141 287.809.175,00 302.273.027Part IX 213.832.598 206.584.431 197.627.453 183.795.573Part IV 7.552.977 9.457.624 9.201.179Part III 145.342.995 135.441.776 143.257.239 149.529.934 156.622.717
TOTAL 651.130.186 628.830.303 650.184.788 644.424.186 651.892.496

5. AUDIT REPORT

79

80
pwc
Limitation of use
This report is intended solely for the use of the Audit Board of Eurocontrol Agency to whom it is addressed, and then only for the purpose set out in the Statute of the Agency and Financial Regulations applicable to Eurocontrol Agency, and may not be provided to any third party without our prior written consent. We will not accept any responsibility or liability for damages to any third party to whom our report may be provided or into whose hands it may come.
Sint-Stevens-Woluwe, 13 June 2018
The registered auditor PwC Bedrijfsrevisoren BCVBA Represent y
Reviseur d'Entreprises
pwc
Responsibillties of the Head of Accounting and Treasury and the Director Central Route Charges Office, Finance and Central IT
The Head of Accounting and Treasury and the Director Central Route Charges Office, Finance and Central IT are responsible for the preparation of financial accounts that give a true and fair view in accordance with IFRS as issued by the IASB, and for such interna! control as the Head of Accounting and Treasury and the Director Central Route Charges Office, Finance and Central IT determine is necessary to enable the preparation of financial accounts that are free from materiał misstatement, whether due to fraud or error.
In preparing the financial accounts, the Head of Accounting and Treasury and Director Central Route Charges Office, Finance and Central IT are responsible for assessing Eurocontrol Agency's ability to continue as a going concern, disclosing, as applicable, matters related to going concern and using the going concern basis of accounting unless the Head of Accounting and Treasury and Director Central Route Charges Office, Finance and Central IT either intend to liquidate Eurocontrol Agency or to cease operations, or has no realistic alternative but to do so.
Independent auditor's responsibilities for the audit of the financial accounts
Our objectives are to obtain reasonable assurance about whether the financial accounts as a whole are free from materiał misstatement, whether due to fraud or error, and to issue an auditor's report that includes our opinion. Reasonable assurance is a high level of assurance, but is not a guarantee that an audit conducted in accordance with ISAs will always detect a materiał misstatement when it exists. Misaccounts can arise from fraud or error and are considered materiał if, individually or in the aggregate, they could reasonably be expected to influence the economic decisions of users taken on the basis of these financial accounts.
As part of an audit in accordance with ISAs, we exercise professional judgment and maintain professional scepticism throughout the audit. We also:
ldentify and assess the risks of materiał misstatement of the financial accounts, whether due to fraud or error, design and perform audit procedures responsive to those risks, and obtain audit evidence that is sufficient and appropriate to provide a basis for our opinion. The risk of not detecting a materiał misstatement resulting from fraud is higher than for one resulting from error, as fraud may involve collusion, forgery, intentional omissions, misrepresentations, or the override of interna! control. Obtain an understanding of interna! control relevant to the audit in order to design audit procedures that are appropriate in the circumstances, but not for the purpose of expressing an opinion on the effectiveness of Eurocontrol Agency's interna! control. Evaluate the appropriateness of accounting policies used and the reasonableness of accounting estimates and related disclosures made by the Head of Accounting and Treasury and the Director Central Route Charges Office, Finance and Central IT.

81
pwc
Limitation of use
This report is intended solely for the use of the Audit Board of Eurocontrol Agency to whom it is addressed, and then only for the purpose set out in the Statute of the Agency and Financial Regulations applicable to Eurocontrol Agency, and may not be provided to any third party without our prior written consent. We will not accept any responsibility or liability for damages to any third party to whom our report may be provided or into whose hands it may come.
Sint-Stevens-Woluwe, 13 June 2018
The registered auditor PwC Bedrijfsrevisoren BCVBA Represent y
Reviseur d'Entreprises
pwc
Responsibillties of the Head of Accounting and Treasury and the Director Central Route Charges Office, Finance and Central IT
The Head of Accounting and Treasury and the Director Central Route Charges Office, Finance and Central IT are responsible for the preparation of financial accounts that give a true and fair view in accordance with IFRS as issued by the IASB, and for such interna! control as the Head of Accounting and Treasury and the Director Central Route Charges Office, Finance and Central IT determine is necessary to enable the preparation of financial accounts that are free from materiał misstatement, whether due to fraud or error.
In preparing the financial accounts, the Head of Accounting and Treasury and Director Central Route Charges Office, Finance and Central IT are responsible for assessing Eurocontrol Agency's ability to continue as a going concern, disclosing, as applicable, matters related to going concern and using the going concern basis of accounting unless the Head of Accounting and Treasury and Director Central Route Charges Office, Finance and Central IT either intend to liquidate Eurocontrol Agency or to cease operations, or has no realistic alternative but to do so.
Independent auditor's responsibilities for the audit of the financial accounts
Our objectives are to obtain reasonable assurance about whether the financial accounts as a whole are free from materiał misstatement, whether due to fraud or error, and to issue an auditor's report that includes our opinion. Reasonable assurance is a high level of assurance, but is not a guarantee that an audit conducted in accordance with ISAs will always detect a materiał misstatement when it exists. Misaccounts can arise from fraud or error and are considered materiał if, individually or in the aggregate, they could reasonably be expected to influence the economic decisions of users taken on the basis of these financial accounts.
As part of an audit in accordance with ISAs, we exercise professional judgment and maintain professional scepticism throughout the audit. We also:
ldentify and assess the risks of materiał misstatement of the financial accounts, whether due to fraud or error, design and perform audit procedures responsive to those risks, and obtain audit evidence that is sufficient and appropriate to provide a basis for our opinion. The risk of not detecting a materiał misstatement resulting from fraud is higher than for one resulting from error, as fraud may involve collusion, forgery, intentional omissions, misrepresentations, or the override of interna! control. Obtain an understanding of interna! control relevant to the audit in order to design audit procedures that are appropriate in the circumstances, but not for the purpose of expressing an opinion on the effectiveness of Eurocontrol Agency's interna! control. Evaluate the appropriateness of accounting policies used and the reasonableness of accounting estimates and related disclosures made by the Head of Accounting and Treasury and the Director Central Route Charges Office, Finance and Central IT.
pwc
Responsibillties of the Head of Accounting and Treasury and the Director Central Route Charges Office, Finance and Central IT
The Head of Accounting and Treasury and the Director Central Route Charges Office, Finance and Central IT are responsible for the preparation of financial accounts that give a true and fair view in accordance with IFRS as issued by the IASB, and for such interna! control as the Head of Accounting and Treasury and the Director Central Route Charges Office, Finance and Central IT determine is necessary to enable the preparation of financial accounts that are free from materiał misstatement, whether due to fraud or error.
In preparing the financial accounts, the Head of Accounting and Treasury and Director Central Route Charges Office, Finance and Central IT are responsible for assessing Eurocontrol Agency's ability to continue as a going concern, disclosing, as applicable, matters related to going concern and using the going concern basis of accounting unless the Head of Accounting and Treasury and Director Central Route Charges Office, Finance and Central IT either intend to liquidate Eurocontrol Agency or to cease operations, or has no realistic alternative but to do so.
Independent auditor's responsibilities for the audit of the financial accounts
Our objectives are to obtain reasonable assurance about whether the financial accounts as a whole are free from materiał misstatement, whether due to fraud or error, and to issue an auditor's report that includes our opinion. Reasonable assurance is a high level of assurance, but is not a guarantee that an audit conducted in accordance with ISAs will always detect a materiał misstatement when it exists. Misaccounts can arise from fraud or error and are considered materiał if, individually or in the aggregate, they could reasonably be expected to influence the economic decisions of users taken on the basis of these financial accounts.
As part of an audit in accordance with ISAs, we exercise professional judgment and maintain professional scepticism throughout the audit. We also:
ldentify and assess the risks of materiał misstatement of the financial accounts, whether due to fraud or error, design and perform audit procedures responsive to those risks, and obtain audit evidence that is sufficient and appropriate to provide a basis for our opinion. The risk of not detecting a materiał misstatement resulting from fraud is higher than for one resulting from error, as fraud may involve collusion, forgery, intentional omissions, misrepresentations, or the override of interna! control. Obtain an understanding of interna! control relevant to the audit in order to design audit procedures that are appropriate in the circumstances, but not for the purpose of expressing an opinion on the effectiveness of Eurocontrol Agency's interna! control. Evaluate the appropriateness of accounting policies used and the reasonableness of accounting estimates and related disclosures made by the Head of Accounting and Treasury and the Director Central Route Charges Office, Finance and Central IT.
82
pwc
Limitation of use
This report is intended solely for the use of the Audit Board of Eurocontrol Agency to whom it is addressed, and then only for the purpose set out in the Statute of the Agency and Financial Regulations applicable to Eurocontrol Agency, and may not be provided to any third party without our prior written consent. We will not accept any responsibility or liability for damages to any third party to whom our report may be provided or into whose hands it may come.
Sint-Stevens-Woluwe, 13 June 2018
The registered auditor PwC Bedrijfsrevisoren BCVBA Represent y
Reviseur d'Entreprises
pwc • Conclude on the appropriateness of the Head of Accounting and Treasury and Director Central
Route Charges Office, Finance and Central IT's use of the going concern basis of accountingand, based on the audit evidence obtained, whether a materiał uncertainty exists related toevents or conditions that may cast significant doubt on Eurocontrol Agency's ability to continueas a going concern. lf we conclude that a materiał uncertainty exists, we are required to drawattention in aur auditor's report to the related disclosures in the financial accounts or, if suchdisclosures are inadequate, to modify aur opinion. Our conclusions are based on the auditevidence obtained up to the date of aur auditor's report. However, future events or conditionsmay cause Eurocontrol Agency to cease to continue as a going concern.
• Evaluate the overall presentation, structure and content of the financial accounts, including thedisclosures, and whether the financial accounts represent the underlying transactions andevents in a manner that achieves fair presentation.Obtain sufficient and appropriate audit evidence regarding the financial information of theentities or business activities within Eurocontrol Agency to express an opinion on the financialaccounts. We are responsible for the direction, supervision and performance of theEurocontrol Agency audit. We remain solely responsible for aur audit opinion.
We communicate with the Audit Board, the Head of Accounting and Treasury and the Director Central Route Charges Office, Finance and Central IT regarding, among other matters, the planned scope and timing of the audit and significant audit findings, including any significant deficiencies in interna! control that we identify during aur audit.
Limitation of use
This report is intended solely for the use of the Audit Board of Eurocontrol Agency to whom it is addressed, and then only for the purpose set out in the Statute of the Agency and Financial Regulations applicable to Eurocontrol Agency, and may not be provided to any third party without aur prior written consent. We will not accept any responsibility or liability for damages to any third party to whom aur report may be provided or into whose hands it may come.
Sint-Stevens-Woluwe, 5 June 2019
The registered auditor PwC Be ijfsrevisoren CVBA Represe ed by

83
pwc
Limitation of use
This report is intended solely for the use of the Audit Board of Eurocontrol Agency to whom it is addressed, and then only for the purpose set out in the Statute of the Agency and Financial Regulations applicable to Eurocontrol Agency, and may not be provided to any third party without our prior written consent. We will not accept any responsibility or liability for damages to any third party to whom our report may be provided or into whose hands it may come.
Sint-Stevens-Woluwe, 13 June 2018
The registered auditor PwC Bedrijfsrevisoren BCVBA Represent y
Reviseur d'Entreprises

84
pwc
Limitation of use
This report is intended solely for the use of the Audit Board of Eurocontrol Agency to whom it is addressed, and then only for the purpose set out in the Statute of the Agency and Financial Regulations applicable to Eurocontrol Agency, and may not be provided to any third party without our prior written consent. We will not accept any responsibility or liability for damages to any third party to whom our report may be provided or into whose hands it may come.
Sint-Stevens-Woluwe, 13 June 2018
The registered auditor PwC Bedrijfsrevisoren BCVBA Represent y
Reviseur d'Entreprises
pwc
Basis for unqua/ified opinion
We conducted aur audit in accordance with International Standards on Auditing (ISAs) as applicable in Belgium. Furthermore, we have applied the International Standards on Auditing (ISAs) as approved by the IAASB for the year ending as from 31 December 2018, which are not yet approved at the national level. Our responsibilities under those standards are further described in the "Independent auditor's responsibilities for the audit of the budgetary accounts" section of aur report. We have fulfilled aur ethical responsibilities in accordance with the ethical requirements that are relevant to aur audit of the budgetary accounts of Eurocontrol Agency, including the requirements related to independence.
We have obtained from the Head of Accounting and Treasury and the Director Central Route Charges Office, Finance and Central IT the explanations and information necessary for performing aur audit.
We believe that the audit evidence we have obtained is sufficient and appropriate to provide a basis for aur opinion.
Responsibilities of the Head of Accounting and Treasury and the Director Central RouteCharges Office, Finance and Central IT for the budgetary accounts
The Head of Accounting and Treasury and the Director Central Route Charges Office, Finance and Central IT are responsible for the preparation of budgetary accounts that have been prepared in all materiał respects in accordance with the Financial Regulations and the Rules of Application of the Financial Regulations of the Agency, and for such interna! control as the Head of Accounting and Treasury and the Director Central Route Charges Office, Finance and Central IT determine is necessary to enable the preparation of the budgetary accounts that are free from materiał misstatement, whether due to fraud or error.
In preparing the budgetary accounts, the Head of Accounting and Treasury and Director Central Route Charges Office, Finance and Central IT are responsible for assessing Eurocontrol Agency's ability to continua as a going concern, disclosing, as applicable, matters related to going concern and using the going concern basis of accounting unless the Head of Accounting and Treasury and Director Central Route Charges Office, Finance and Central IT either intend to liquidate Eurocontrol Agency or to cease operations, or has no realistic alternative but to do so.
Independent auditor's responsibilities for the audit of the budgetary accounts
Our objectives are to obtain reasonable assurance about whether the budgetary accounts as a whole are free from materiał misstatement, whether due to fraud or error, and to issue an auditor's report that includes aur opinion. Reasonable assurance is a high level of assurance, but is not a guarantee that an audit conducted in accordance with ISAs will always detect a materiał misstatement when it exists. Misstatements can arise from fraud or error and are considered materiał if, individually or in the aggregate, they could reasonably be expected to influence the economic decisions of users taken on the basis of these budgetary accounts.

85
pwc
Limitation of use
This report is intended solely for the use of the Audit Board of Eurocontrol Agency to whom it is addressed, and then only for the purpose set out in the Statute of the Agency and Financial Regulations applicable to Eurocontrol Agency, and may not be provided to any third party without our prior written consent. We will not accept any responsibility or liability for damages to any third party to whom our report may be provided or into whose hands it may come.
Sint-Stevens-Woluwe, 13 June 2018
The registered auditor PwC Bedrijfsrevisoren BCVBA Represent y
Reviseur d'Entreprises
pwc
Basis for unqua/ified opinion
We conducted aur audit in accordance with International Standards on Auditing (ISAs) as applicable in Belgium. Furthermore, we have applied the International Standards on Auditing (ISAs) as approved by the IAASB for the year ending as from 31 December 2018, which are not yet approved at the national level. Our responsibilities under those standards are further described in the "Independent auditor's responsibilities for the audit of the budgetary accounts" section of aur report. We have fulfilled aur ethical responsibilities in accordance with the ethical requirements that are relevant to aur audit of the budgetary accounts of Eurocontrol Agency, including the requirements related to independence.
We have obtained from the Head of Accounting and Treasury and the Director Central Route Charges Office, Finance and Central IT the explanations and information necessary for performing aur audit.
We believe that the audit evidence we have obtained is sufficient and appropriate to provide a basis for aur opinion.
Responsibilities of the Head of Accounting and Treasury and the Director Central RouteCharges Office, Finance and Central IT for the budgetary accounts
The Head of Accounting and Treasury and the Director Central Route Charges Office, Finance and Central IT are responsible for the preparation of budgetary accounts that have been prepared in all materiał respects in accordance with the Financial Regulations and the Rules of Application of the Financial Regulations of the Agency, and for such interna! control as the Head of Accounting and Treasury and the Director Central Route Charges Office, Finance and Central IT determine is necessary to enable the preparation of the budgetary accounts that are free from materiał misstatement, whether due to fraud or error.
In preparing the budgetary accounts, the Head of Accounting and Treasury and Director Central Route Charges Office, Finance and Central IT are responsible for assessing Eurocontrol Agency's ability to continua as a going concern, disclosing, as applicable, matters related to going concern and using the going concern basis of accounting unless the Head of Accounting and Treasury and Director Central Route Charges Office, Finance and Central IT either intend to liquidate Eurocontrol Agency or to cease operations, or has no realistic alternative but to do so.
Independent auditor's responsibilities for the audit of the budgetary accounts
Our objectives are to obtain reasonable assurance about whether the budgetary accounts as a whole are free from materiał misstatement, whether due to fraud or error, and to issue an auditor's report that includes aur opinion. Reasonable assurance is a high level of assurance, but is not a guarantee that an audit conducted in accordance with ISAs will always detect a materiał misstatement when it exists. Misstatements can arise from fraud or error and are considered materiał if, individually or in the aggregate, they could reasonably be expected to influence the economic decisions of users taken on the basis of these budgetary accounts.
pwc
As part of an audit in accordance with ISAs, we exercise professional judgment and maintain professional skepticism throughout the audit. We also:
ldentify and assess the risks of materiał misstatement of the budgetary accounts, whether due to fraud or error, design and perform audit procedures responsive to those risks, and obtain audit evidence that is sufficient and appropriate to provide a basis for our opinion. The risk of not detecting a materiał misstatement resulting from fraud is higher than for one resulting from error, as fraud may involve collusion, forgery, intentional omissions, misrepresentations, or the override of interna! control. Obtain an understanding of interna! control relevant to the audit in order to design audit procedures that are appropriate in the circumstances, but not for the purpose of expressing an opinion on the effectiveness of Eurocontrol Agency's interna! control.
• Evaluate the appropriateness of accounting policies used and the reasonableness of accountingestimates and related disclosures made by the Head of Accounting and Treasury and theDirector Central Route Charges Office, Finance and Central IT.
• Conclude on the appropriateness of the Head of Accounting and Treasury and Director CentralRoute Charges Office, Finance and Central IT's use of the going concern basis of accountingand, based on the audit evidence obtained, whether a materiał uncertainty exists related toevents or conditions that may cast significant doubt on Eurocontrol Agency's ability to continueas a going concern. lf we conclude that a materiał uncertainty exists, we are required to drawattention in our auditor's report to the related disclosures in the budgetary accounts or, if suchdisclosures are inadequate, to modify our opinion. Our conclusions are based on the auditevidence obtained up to the date of our auditor's report. However, future events or conditionsmay cause Eurocontrol Agency to cease to continua as a going concern.Evaluate the overall presentation, structure and content of the budgetary accounts, including thedisclosures, and whether the budgetary accounts represent the underlying transactions andevents in a manner that complies in all materiał respects with the accrual basis and taking intoaccount the exceptions to this accrual basis in accordance with the Financial Regulations andthe Rules of Application of the Financial Regulations of the Eurocontrol Agency.Obtain sufficient and appropriate audit evidence regarding the financial information of theentities or business activities within Eurocontrol Agency to express an opinion on the budgetaryaccounts. We are responsible for the direction, supervision and performance of theEurocontrol Agency audit. We remain solely responsible for our audit opinion.
We communicate with the Audit Board, the Head of Accounting and Treasury and the Director Central Route Charges Office, Finance and Central IT regarding, among other matters, the planned scope and timing of the audit and significant audit findings, including any significant deficiencies in interna! control that we identify during our audit.

86
pwc
Limitation of use
This report is intended solely for the use of the Audit Board of Eurocontrol Agency to whom it is addressed, and then only for the purpose set out in the Statute of the Agency and Financial Regulations applicable to Eurocontrol Agency, and may not be provided to any third party without our prior written consent. We will not accept any responsibility or liability for damages to any third party to whom our report may be provided or into whose hands it may come.
Sint-Stevens-Woluwe, 13 June 2018
The registered auditor PwC Bedrijfsrevisoren BCVBA Represent y
Reviseur d'Entreprises
pwc
Limitation of use
This report is intended solely for the use of the Audit Board of Eurocontrol Agency to whom it is addressed, and then only for the purpose set out in the Statute of the Agency and Financial Regulations applicable to Eurocontrol Agency, and may not be provided to any third party without our prior written consent. We will not accept any responsibility or liability for damages to any third party to whom our report may be provided or into whose hands it may come.
Sint-Stevens-Woluwe, 5 June 2019
The regi tered auditor PwC B ijfsrevisoren CVBA
�s ectby
Romai Reviseur cl'Entreprises

87

EUROCONTROL
© EUROCONTROL - June 2019
This document is published by EUROCONTROL for information purposes. It may be copied
in whole or in part, provided that EUROCONTROL is mentioned as the source and it is not used for
commercial purposes (i.e. for financial gain). The information in this document may not be modified
without prior written permission from EUROCONTROL.
www.eurocontrol.int