Embed Size (px)
Citation preview
GRA EVINSKI MATERIJALI I KONSTRUKCIJE 57 (2014) 3 (3-20) BUILDING MATERIALS AND STRUCTURES 57 (2014) 3 (3-20)
3
EUROCODE 8: USE OF ADVANTAGEOUS FORMULATIONS FOR IMPROVED AND SAFE DESIGN
EVROKOD 8: UPOTREBA POVOLJNE FORMULACIJE ZA POBOLJŠANO I SIGURNO
PROJEKTOVANJE
Zdravko BONEV Stanislav DOSPEVSKI
ORIGINALNI NAU NI RADORIGINAL SCIENTIFIC PAPER
UDK: 624.042.7:006.44EN
1 INTRODUCTION
In the recent years current design philosophies evidently are in the period of evolution. The general purpose considering seismic resistant design is to save human live and minimize human damages in engineering structures. The experience from the past earthquakes shows that sometimes design theory is not in compliance with the observed results. A lot of efforts have been directed towards achievement a good correlation between theoretical background and observation results. The use of structural mechanics principles contributes more or less towards improving the precision of computational procedures. This is good background for implementation of performance-based seismic design. More adequate approaches and better numerical simulation in the field of seismic action and efficient dynamic models of structures are developed.
EN 1998-1 provisions are great contributes towards very good agreement between theory and practice. Implementation of capacity design principles is the milestone for better predictability of the plastic mechanisms when structures are subjected to seismic ground motion. Structures are designed using performance based seismic design methodology, which allows for better identification of structural performance. European standard proposes very good balance between reliability of the methods and simplicity of their use. EN 1998-1, [9] provides better protection of human life and civil engineering structures as well.
Professor Zdravko Bonev, PhD, University of Architecture, Civil Engineering and Geodesy, Department of Structural Mechanics, 1 Hristo Smirnenski Blvd, Sofia, Bulgaria, e-mail: [email protected] Stanislav Dospevski, PhD Civil Engineer, University of Architecture, Civil Engineering and Geodesy, Department of Structural Mechanics, 1 Hristo Smirnenski Blvd, Sofia, Bulgaria, e-mail: [email protected]
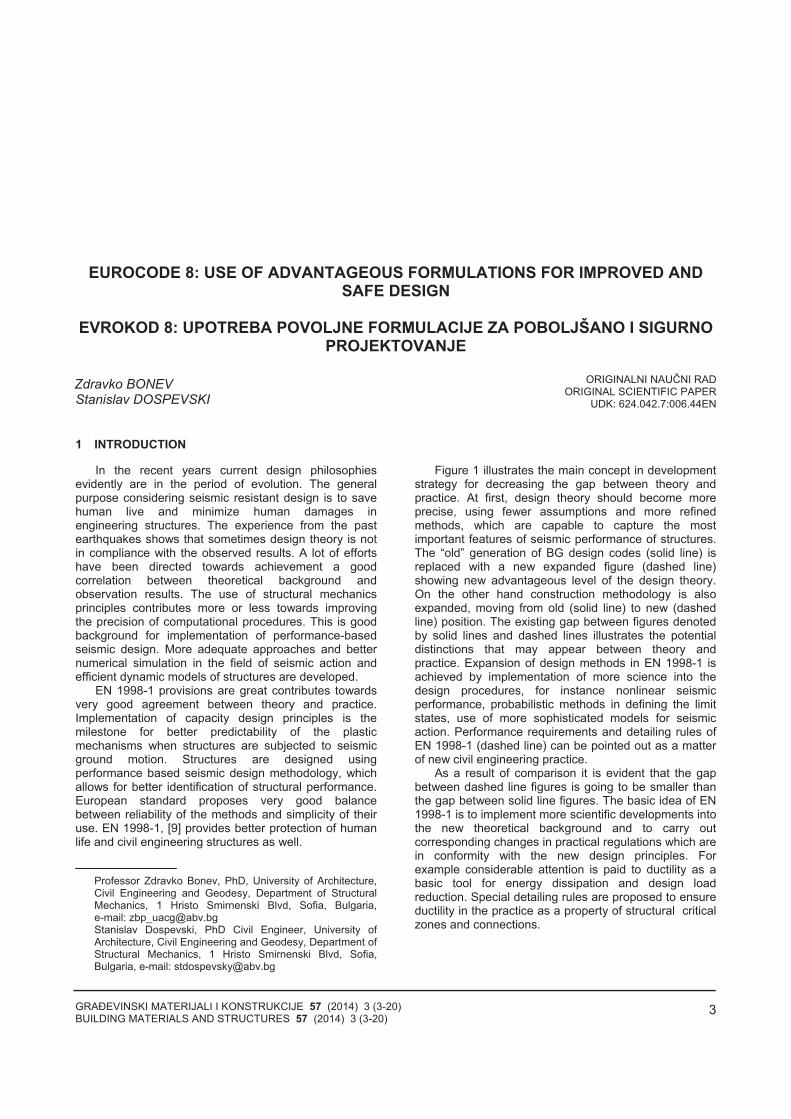
Figure 1 illustrates the main concept in development strategy for decreasing the gap between theory and practice. At first, design theory should become more precise, using fewer assumptions and more refined methods, which are capable to capture the most important features of seismic performance of structures. The “old” generation of BG design codes (solid line) is replaced with a new expanded figure (dashed line) showing new advantageous level of the design theory. On the other hand construction methodology is also expanded, moving from old (solid line) to new (dashed line) position. The existing gap between figures denoted by solid lines and dashed lines illustrates the potential distinctions that may appear between theory and practice. Expansion of design methods in EN 1998-1 is achieved by implementation of more science into the design procedures, for instance nonlinear seismic performance, probabilistic methods in defining the limit states, use of more sophisticated models for seismic action. Performance requirements and detailing rules of EN 1998-1 (dashed line) can be pointed out as a matter of new civil engineering practice.
As a result of comparison it is evident that the gap between dashed line figures is going to be smaller than the gap between solid line figures. The basic idea of EN 1998-1 is to implement more scientific developments into the new theoretical background and to carry out corresponding changes in practical regulations which are in conformity with the new design principles. For example considerable attention is paid to ductility as a basic tool for energy dissipation and design load reduction. Special detailing rules are proposed to ensure ductility in the practice as a property of structural critical zones and connections.
GRA EVINSKI MATERIJALI I KONSTRUKCIJE 57 (2014) 3 (3-20) BUILDING MATERIALS AND STRUCTURES 57 (2014) 3 (3-20)
4
The subject of the paper is closely related to the“open topics”, which are the subject of the NationalAnnex and Nationally determined parameters forBulgaria. The main goal of the paper is to share theexperience of the team, involved to carry out the workrelated to Part 6: Masts, Chimneys and Towers and Part3: Repairing and Strengthening of Reinforced Concreteand Masonry Structures.
2 SELECTED TOPICS OPENED FOR DISCUSSION
2.1 Topic 1: Accounting for spatial variability of seismic action
For a number of structures seismic ground accelera-tions are assumed to be uniformly distributed at the base of the structure similarly to “shaking table effect“. Forirregular or long in plan structures like storages, bridgesand tubes uniform distribution of the ground accelera-tions or displacements is no longer applied. EN 1998-1
states that spatial variability of the seismic action should be accounted for. For tall and slender structures spatial variability of the seismic action on input also should be taken into consideration. There are mainly two models which are currently in use to do this. First model implies the ground acceleration distribution at the base to follow the shape of the “standing wave function“, typical for shear waves and surface waves of Love. The second model proposes to enter as seismic input into the structure both translational components of ground accelerations and rotational components of the ground accelerations.
Model 1: ground accelerations which follow the shape of standing wave function
(References [3], [4], [7], [8], [15], [18], [19], [20] and [21])
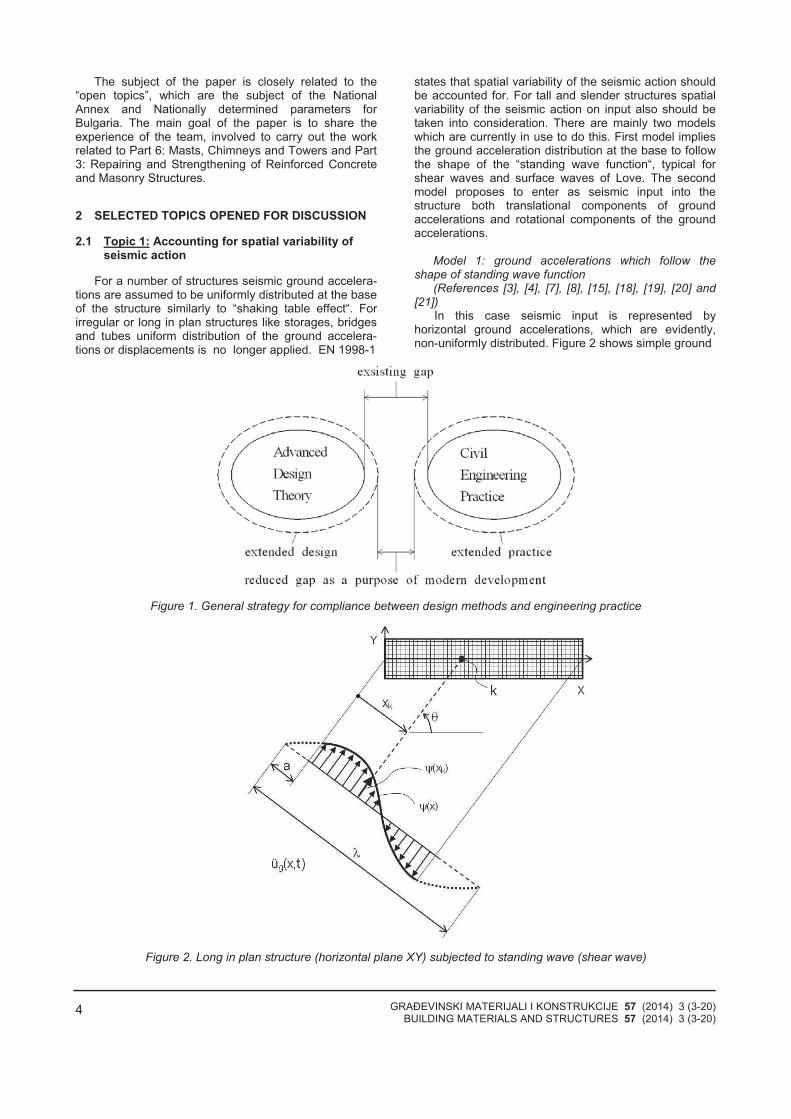
In this case seismic input is represented by horizontal ground accelerations, which are evidently, non-uniformly distributed. Figure 2 shows simple ground
Figure 1. General strategy for compliance between design methods and engineering practice
Figure 2. Long in plan structure (horizontal plane XY) subjected to standing wave (shear wave)
GRA EVINSKI MATERIJALI I KONSTRUKCIJE 57 (2014) 3 (3-20) BUILDING MATERIALS AND STRUCTURES 57 (2014) 3 (3-20)
5
motion being consistent of accelerations which are non-uniformly distributed. A bridge structure is subjected tothis seismic input. The transferred motion of all massesattached to the deck structure, is the same as the motionof the base. Figure 2. shows that the groundaccelerations given in it provoke domination of torsionalresponse over the translation-based solution.
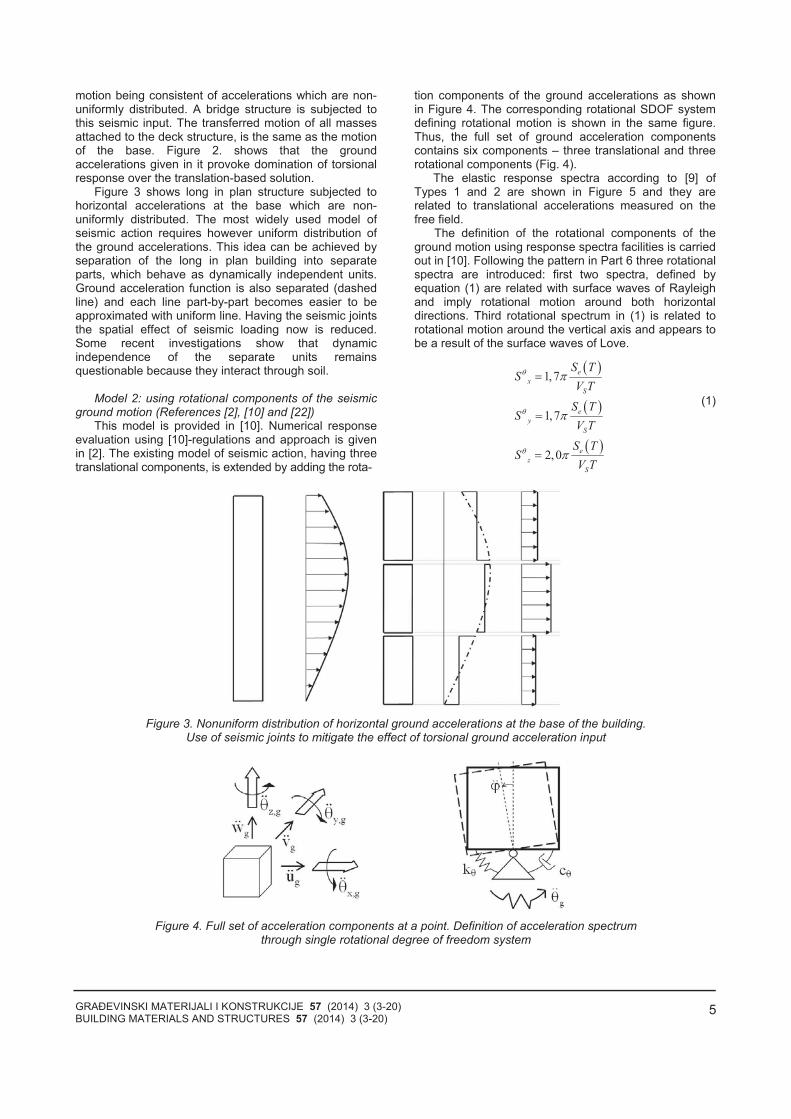
Figure 3 shows long in plan structure subjected tohorizontal accelerations at the base which are non-uniformly distributed. The most widely used model ofseismic action requires however uniform distribution ofthe ground accelerations. This idea can be achieved byseparation of the long in plan building into separate parts, which behave as dynamically independent units.Ground acceleration function is also separated (dashedline) and each line part-by-part becomes easier to beapproximated with uniform line. Having the seismic jointsthe spatial effect of seismic loading now is reduced. Some recent investigations show that dynamicindependence of the separate units remainsquestionable because they interact through soil.
Model 2: using rotational components of the seismic
ground motion (References [2], [10] and [22]) This model is provided in [10]. Numerical response
evaluation using [10]-regulations and approach is givenin [2]. The existing model of seismic action, having threetranslational components, is extended by adding the rota-
tion components of the ground accelerations as shown in Figure 4. The corresponding rotational SDOF system defining rotational motion is shown in the same figure. Thus, the full set of ground acceleration components contains six components – three translational and three rotational components (Fig. 4).
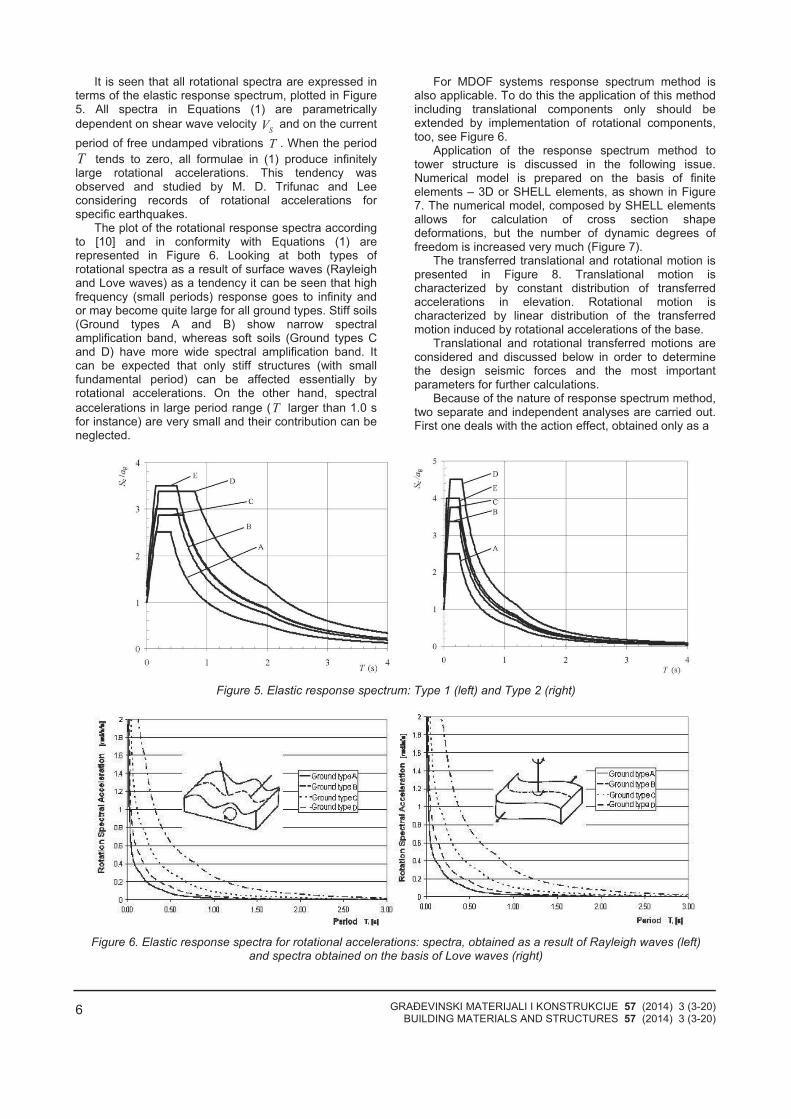
The elastic response spectra according to [9] of Types 1 and 2 are shown in Figure 5 and they are related to translational accelerations measured on the free field.
The definition of the rotational components of the ground motion using response spectra facilities is carried out in [10]. Following the pattern in Part 6 three rotational spectra are introduced: first two spectra, defined by equation (1) are related with surface waves of Rayleigh and imply rotational motion around both horizontal directions. Third rotational spectrum in (1) is related to rotational motion around the vertical axis and appears to be a result of the surface waves of Love.
1,7
1,7
2,0
e
x
S
e
y
S
e
z
S
S TS
V T
S TS
V T
S TS
V T
(1)
Figure 3. Nonuniform distribution of horizontal ground accelerations at the base of the building. Use of seismic joints to mitigate the effect of torsional ground acceleration input
Figure 4. Full set of acceleration components at a point. Definition of acceleration spectrum through single rotational degree of freedom system
GRA EVINSKI MATERIJALI I KONSTRUKCIJE 57 (2014) 3 (3-20) BUILDING MATERIALS AND STRUCTURES 57 (2014) 3 (3-20)
6
It is seen that all rotational spectra are expressed interms of the elastic response spectrum, plotted in Figure5. All spectra in Equations (1) are parametrically
dependent on shear wave velocity SV and on the current
period of free undamped vibrations T . When the period
T tends to zero, all formulae in (1) produce infinitelylarge rotational accelerations. This tendency wasobserved and studied by M. D. Trifunac and Leeconsidering records of rotational accelerations forspecific earthquakes.
The plot of the rotational response spectra accordingto [10] and in conformity with Equations (1) arerepresented in Figure 6. Looking at both types ofrotational spectra as a result of surface waves (Rayleighand Love waves) as a tendency it can be seen that highfrequency (small periods) response goes to infinity andor may become quite large for all ground types. Stiff soils(Ground types A and B) show narrow spectral amplification band, whereas soft soils (Ground types Cand D) have more wide spectral amplification band. Itcan be expected that only stiff structures (with smallfundamental period) can be affected essentially byrotational accelerations. On the other hand, spectral
accelerations in large period range (T larger than 1.0 sfor instance) are very small and their contribution can beneglected.
For MDOF systems response spectrum method is also applicable. To do this the application of this method including translational components only should be extended by implementation of rotational components, too, see Figure 6.
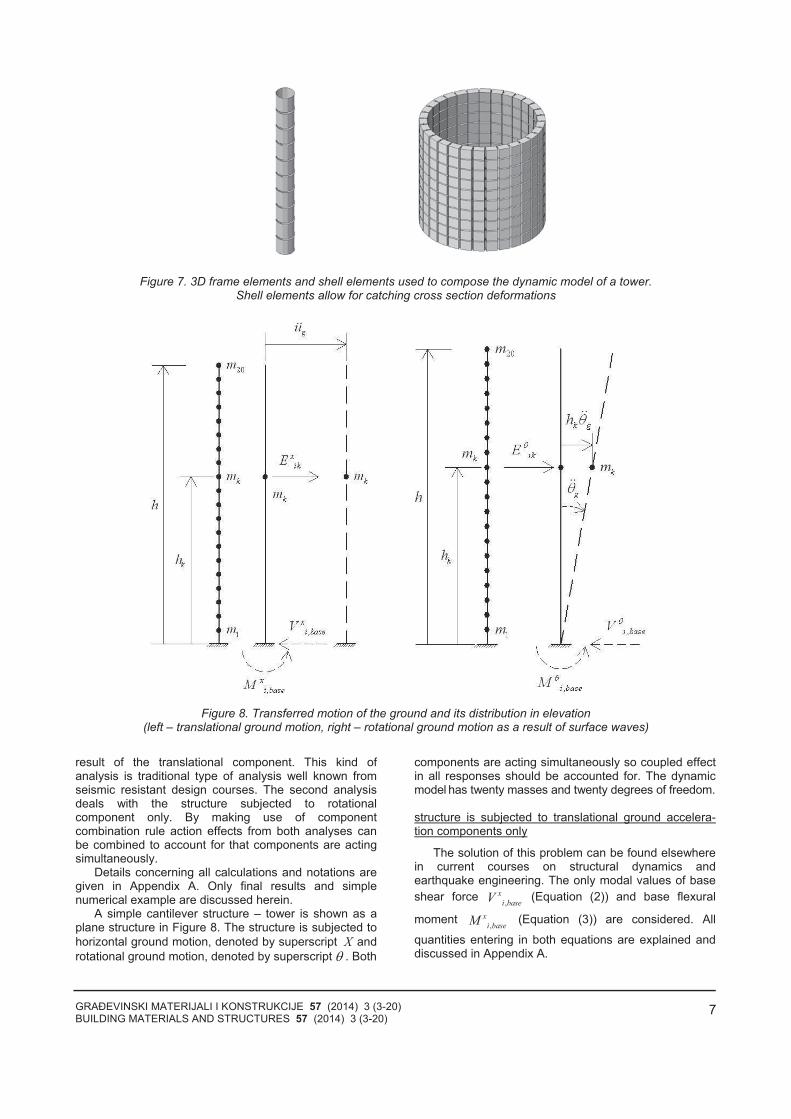
Application of the response spectrum method to tower structure is discussed in the following issue. Numerical model is prepared on the basis of finite elements – 3D or SHELL elements, as shown in Figure 7. The numerical model, composed by SHELL elements allows for calculation of cross section shape deformations, but the number of dynamic degrees of freedom is increased very much (Figure 7).
The transferred translational and rotational motion is presented in Figure 8. Translational motion is characterized by constant distribution of transferred accelerations in elevation. Rotational motion is characterized by linear distribution of the transferred motion induced by rotational accelerations of the base.
Translational and rotational transferred motions are considered and discussed below in order to determine the design seismic forces and the most important parameters for further calculations.
Because of the nature of response spectrum method, two separate and independent analyses are carried out. First one deals with the action effect, obtained only as a
Figure 5. Elastic response spectrum: Type 1 (left) and Type 2 (right)
Figure 6. Elastic response spectra for rotational accelerations: spectra, obtained as a result of Rayleigh waves (left) and spectra obtained on the basis of Love waves (right)
GRA EVINSKI MATERIJALI I KONSTRUKCIJE 57 (2014) 3 (3-20) BUILDING MATERIALS AND STRUCTURES 57 (2014) 3 (3-20)
7
Figure 7. 3D frame elements and shell elements used to compose the dynamic model of a tower. Shell elements allow for catching cross section deformations
Figure 8. Transferred motion of the ground and its distribution in elevation (left – translational ground motion, right – rotational ground motion as a result of surface waves)
result of the translational component. This kind ofanalysis is traditional type of analysis well known fromseismic resistant design courses. The second analysisdeals with the structure subjected to rotationalcomponent only. By making use of componentcombination rule action effects from both analyses canbe combined to account for that components are actingsimultaneously.
Details concerning all calculations and notations aregiven in Appendix A. Only final results and simple numerical example are discussed herein.
A simple cantilever structure – tower is shown as aplane structure in Figure 8. The structure is subjected to
horizontal ground motion, denoted by superscript X and
rotational ground motion, denoted by superscript . Both
components are acting simultaneously so coupled effect in all responses should be accounted for. The dynamic model has twenty masses and twenty degrees of freedom. structure is subjected to translational ground accelera-tion components only
The solution of this problem can be found elsewhere in current courses on structural dynamics and earthquake engineering. The only modal values of base
shear force ,
x
i baseV (Equation (2)) and base flexural
moment ,
x
i baseM (Equation (3)) are considered. All
quantities entering in both equations are explained and discussed in Appendix A.
GRA EVINSKI MATERIJALI I KONSTRUKCIJE 57 (2014) 3 (3-20) BUILDING MATERIALS AND STRUCTURES 57 (2014) 3 (3-20)
8
2
*
,
x x
i base i i e iV m S T (2)
*
,
x x
i base i i i e iM m hS T (3)
Since modal correlation exists between two modal
peaks of each modal pair, this is taken into account by correlation coefficients of Der Kiureghian (Appendix A). Thus the peak values of the base shear force and base flexural moment are determined after application of CQC as modal combination rule.
, ,
x x x
base ij i base j base
i j
V V V (4)
, ,
x x x
base ij i base j base
i j
M M M (5)
It is worth noting that the value of ,
x
i baseV obviously
always remains positive (see Equation (2)), whereas
,
x
i baseM may have either positive or negative value (see
Equation (3)). structure is subjected to rotational ground acceleration components only
The solution of this problem should be found in conformity with response spectrum method and theory.
Only modal values of base shear force ,i baseV (Equation
(6)) and base flexural moment ,i baseM (Equation (7))
are considered. All quantities entering in both equations are explained and discussed in Appendix A.
*
,
x
i base i i i e iV m hS T (6)
2
* 2
,i base i i e iM m h S T (7)
It is worth noting that the value of ,i baseV may have
positive or negative sign (see Equation (6)). The value of
,i baseM ever remains positive.
The need for modal combination arises because a correlation can be found between each arbitrary pair of modal peaks. This is carried out using correlation coefficients of Der Kiureghian (Appendix A). Thus the peak values of the base shear force and base flexural moment are determined after application of CQC as modal combination rule.
, ,base ij i base j base
i j
V V V (8)
, ,base ij i base j base
i j
M M M (9)
peak action effects as a result of simultaneous action of both components of the ground accelerations
Now the fact that both components of the seismic ground motion (accelerations) are acting simultaneously, should be taken into account. It was proven that the cross correlation factors for translational and rotational acceleration records are zero. This shows that no correlation between translational and rotational component exists and peak values of base shear force
max baseV and flexural moment max baseM when both
components of the seismic ground motion are acting simultaneously, can be found using SRSS as component combination rule.
2 2
maxx
base base baseV V V (10)
2 2
maxx
base base baseM M M (11)
Note that Equations (9) and (10) are using
information after the peak responses due to each of the ground motion component have already been determined.
effective mass ratios
Effective mass ratios point out whether the number of modes taken into account into the analysis is sufficient from the viewpoint of accuracy. For translational motion this problem is already settled and used for a number of years. Calculations are performed using the result provided with Equation (12).
For rotational ground motion new definitions for the
total mass TotM and for the modal participation factor
iare implemented (see Appendix A) correspondingly.
Calculation of the effective mass ratio is performed using the result (13):
2*
1 0,90 0,95
Nx
i ix i
x
Tot
m
M (12)
2*
1 0,90 0,95
N
i i
i
Tot
m
M (13)
Information about all quantities entering in Equations
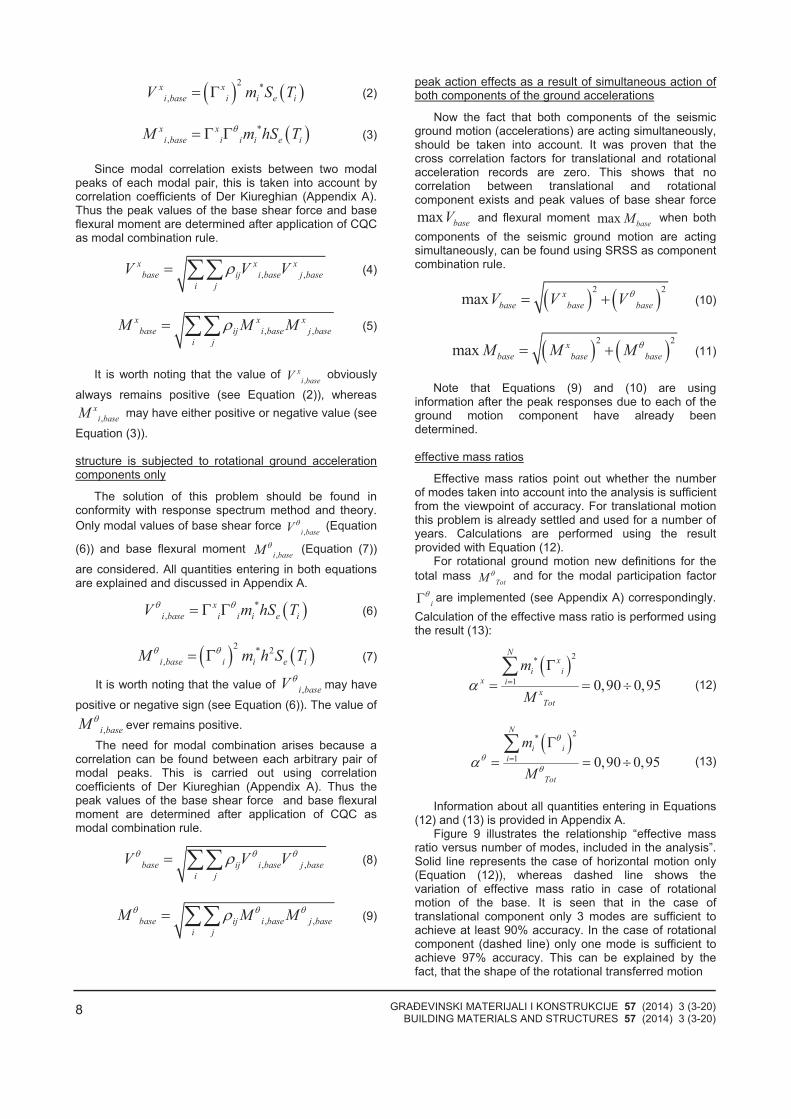
(12) and (13) is provided in Appendix A. Figure 9 illustrates the relationship “effective mass
ratio versus number of modes, included in the analysis”. Solid line represents the case of horizontal motion only (Equation (12)), whereas dashed line shows the variation of effective mass ratio in case of rotational motion of the base. It is seen that in the case of translational component only 3 modes are sufficient to achieve at least 90% accuracy. In the case of rotational component (dashed line) only one mode is sufficient to achieve 97% accuracy. This can be explained by the fact, that the shape of the rotational transferred motion
GRA EVINSKI MATERIJALI I KONSTRUKCIJE 57 (2014) 3 (3-20) BUILDING MATERIALS AND STRUCTURES 57 (2014) 3 (3-20)
9
Figure 9. Sufficiency of the number of modes implying translational only (solid line) and rotational motion only (dashed line)
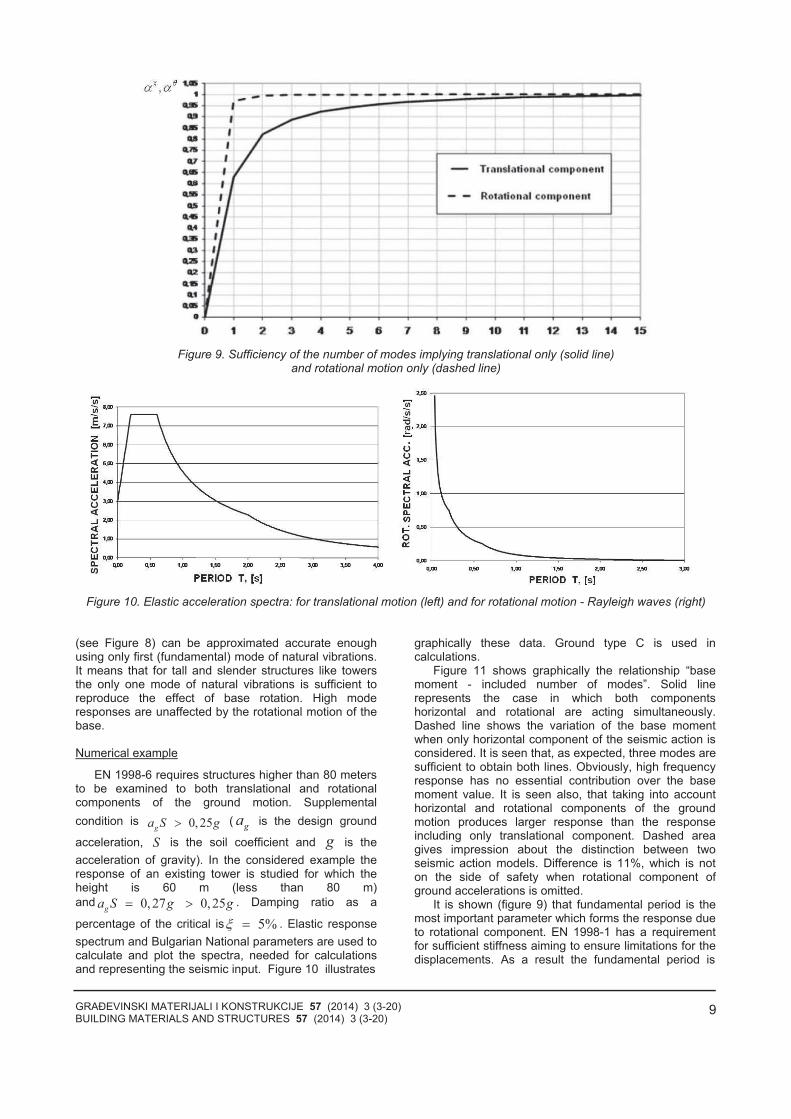
Figure 10. Elastic acceleration spectra: for translational motion (left) and for rotational motion - Rayleigh waves (right)
(see Figure 8) can be approximated accurate enoughusing only first (fundamental) mode of natural vibrations.It means that for tall and slender structures like towersthe only one mode of natural vibrations is sufficient toreproduce the effect of base rotation. High moderesponses are unaffected by the rotational motion of thebase. Numerical example
EN 1998-6 requires structures higher than 80 metersto be examined to both translational and rotationalcomponents of the ground motion. Supplemental
condition is 0, 25ga S g ( ga is the design ground
acceleration, S is the soil coefficient and g is the
acceleration of gravity). In the considered example theresponse of an existing tower is studied for which theheight is 60 m (less than 80 m)
and 0, 27 0, 25ga S g g . Damping ratio as a
percentage of the critical is 5% . Elastic response
spectrum and Bulgarian National parameters are used tocalculate and plot the spectra, needed for calculationsand representing the seismic input. Figure 10 illustrates
graphically these data. Ground type C is used in calculations.
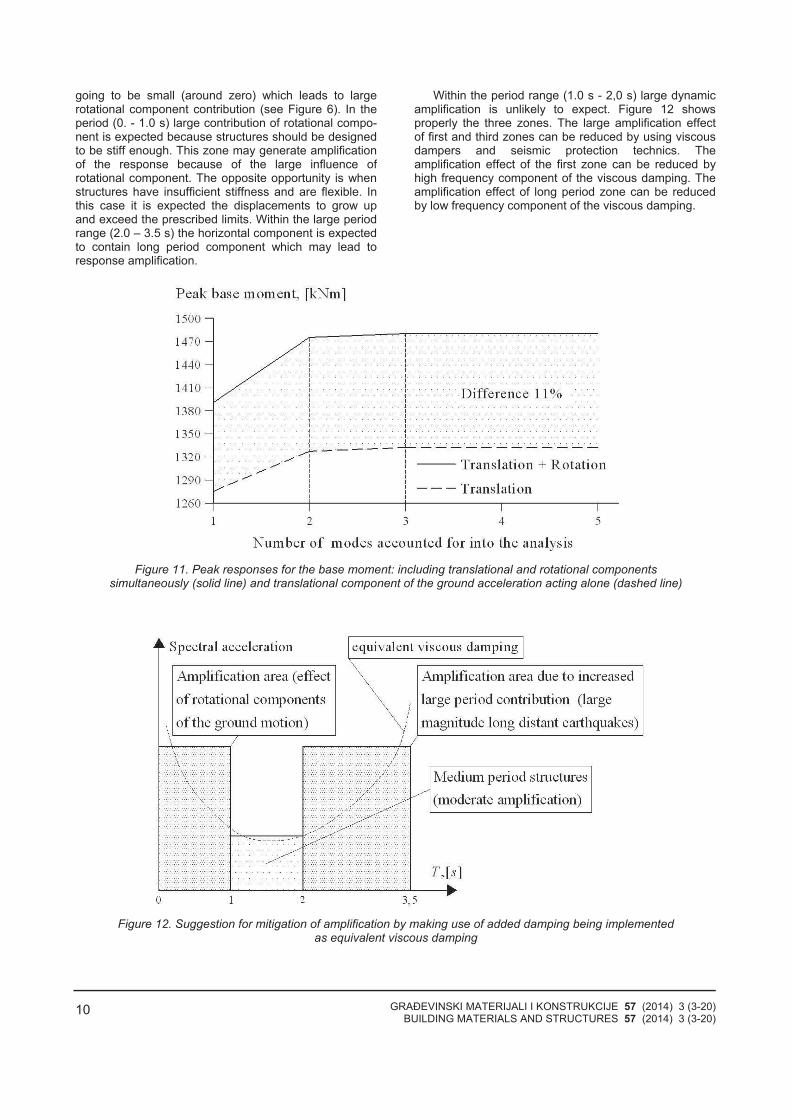
Figure 11 shows graphically the relationship “base moment - included number of modes”. Solid line represents the case in which both components horizontal and rotational are acting simultaneously. Dashed line shows the variation of the base moment when only horizontal component of the seismic action is considered. It is seen that, as expected, three modes are sufficient to obtain both lines. Obviously, high frequency response has no essential contribution over the base moment value. It is seen also, that taking into account horizontal and rotational components of the ground motion produces larger response than the response including only translational component. Dashed area gives impression about the distinction between two seismic action models. Difference is 11%, which is not on the side of safety when rotational component of ground accelerations is omitted.
It is shown (figure 9) that fundamental period is the most important parameter which forms the response due to rotational component. EN 1998-1 has a requirement for sufficient stiffness aiming to ensure limitations for the displacements. As a result the fundamental period is
GRA EVINSKI MATERIJALI I KONSTRUKCIJE 57 (2014) 3 (3-20) BUILDING MATERIALS AND STRUCTURES 57 (2014) 3 (3-20)
10
going to be small (around zero) which leads to largerotational component contribution (see Figure 6). In theperiod (0. - 1.0 s) large contribution of rotational compo-nent is expected because structures should be designedto be stiff enough. This zone may generate amplificationof the response because of the large influence ofrotational component. The opposite opportunity is whenstructures have insufficient stiffness and are flexible. Inthis case it is expected the displacements to grow upand exceed the prescribed limits. Within the large periodrange (2.0 – 3.5 s) the horizontal component is expected to contain long period component which may lead toresponse amplification.
Within the period range (1.0 s - 2,0 s) large dynamic amplification is unlikely to expect. Figure 12 shows properly the three zones. The large amplification effect of first and third zones can be reduced by using viscous dampers and seismic protection technics. The amplification effect of the first zone can be reduced by high frequency component of the viscous damping. The amplification effect of long period zone can be reduced by low frequency component of the viscous damping.
Figure 11. Peak responses for the base moment: including translational and rotational components simultaneously (solid line) and translational component of the ground acceleration acting alone (dashed line)
Figure 12. Suggestion for mitigation of amplification by making use of added damping being implemented as equivalent viscous damping
GRA EVINSKI MATERIJALI I KONSTRUKCIJE 57 (2014) 3 (3-20) BUILDING MATERIALS AND STRUCTURES 57 (2014) 3 (3-20)
11
2.2 Topic 2: Performance based seismic design and need verification for strengthening of existing structures (References [5], [11], [12], [14], [16], [17] and EN 1998-3)
Part 3 (EN 1998-3) is very ambitious attempt tocreate new regulations for design of strengthenedstructures. It is compulsory to proof two importantissues: 1) the need for strengthening, and 2) the benefitof strengthening. The study discussed in the paperproposes numerical technique, which allows for provingthe need and the benefit of strengthening. Both proofsare carried out on the basis of adequate numericalmodels, which are capable of caching inelasticbehaviour and effects of it. Another important factor –the cost of the strengthening and economic viability. Thequestion that is able to afford strengthening is dependenton governmental priorities and should be settled bygovernmental institutions. In this topic 2 only the needand benefit are considered.
Capacity design principles and rules are widely usedin [9] to improve the seismic performance of existingbuildings designed in conformity with old generation ofcodes. This can be done by doing the following 1) improvement of the energy dissipation capability andductile performance; 2) improvement of the predictabilityof the plastic and failure mechanisms. Energy dissipationand ductile behaviour lead to reduction of design seismicforces. Prediction of the plastic and failure mechanismsis a great advantage from the viewpoint of methodology.The basic idea is to control structural performance bymore adequate regulations and more proper designphilosophy.
For new designed structures the use of capacitydesign rules, performance requirements and detailingrules of [9] contribute towards achievement of globalplastic mechanism (Figure 14). Capacity designphilosophy allows for the plastic mechanism to bepredicted and implemented in calculations. Advantagessuch as good energy dissipation distribution in elevation,elastic and strong columns and dissipative beamscontribute towards good performance for local andglobal ductility. Another advantage of new design
principles is that the influence of P - effect is limitedbecause there is no storey with strongly dominatinginterstorey drift over the other drifts.
The performance based evaluation procedureimplies the use of two types of capacity spectra: actualcapacity spectrum (ACS) and target capacity spectrum(TCS). Seismic demands of the action effects are easyobtained as a result of design seismic loading. Thealgorithm proposes comparison of seismic demandsbefore and after strengthening. The analysis results areeasy to be interpreted and provide argumentation forstrengthening and benefit of it. Comparable analysis ofthe results before and after strengthening is a goodbasis for making conclusions by design engineers.
Some basic terms and formulations are discussedbelow.
actual capacity spectra (ACS)
Actual capacity spectrum corresponds to a certain structure, which is designed according to EN 1998-1 or according to some other seismic resistant design code. Actual capacity spectra however can be determined also for structures which are designed without proper design criteria and performance requirements. At first base shear force – roof displacement diagram (pushover curve) is calculated, then on the basis of simple modifications actual capacity spectrum (ACS) is obtained. This spectrum is a plot of “first floor acceleration against modified displacement”. Modified
displacement *u is related to the unique displacement of
equivalent single degree of freedom (ESDOF) system. “Zero length” plastic hinge concept is applied. Details concerning plastic hinge parameters are not discussed in the paper. As a matter of fact, it is clear that actual capacity spectrum is obtained on structural data.
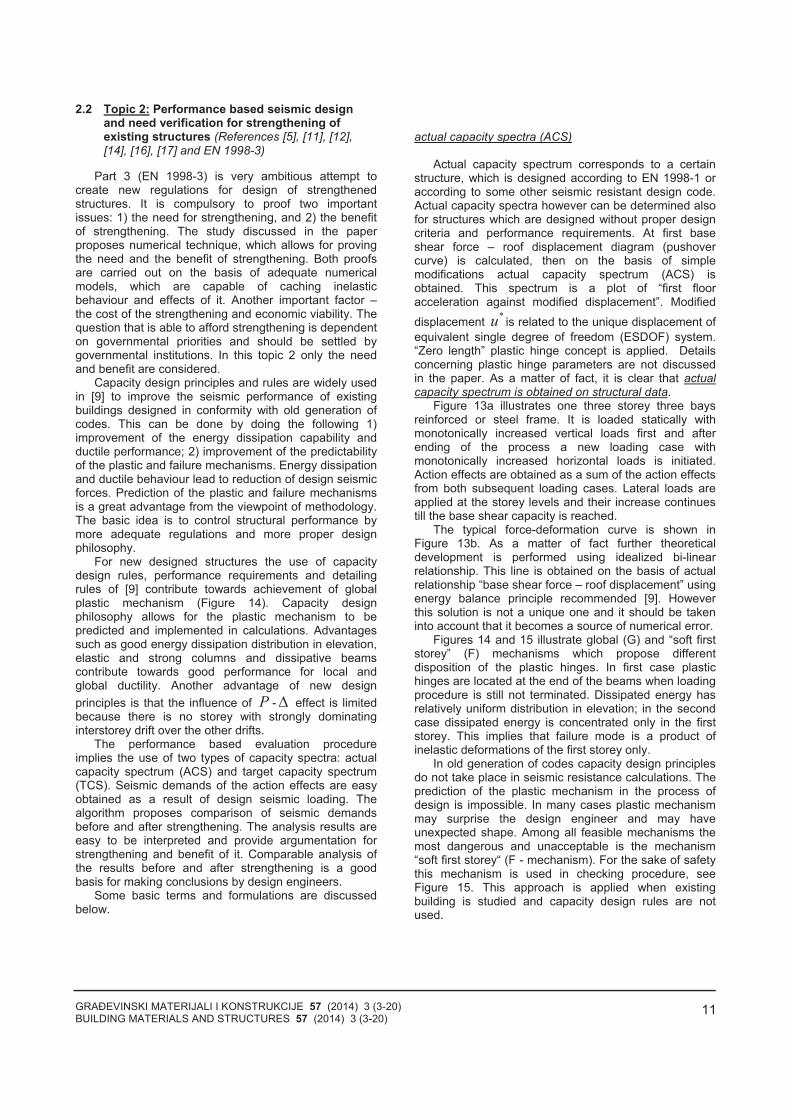
Figure 13a illustrates one three storey three bays reinforced or steel frame. It is loaded statically with monotonically increased vertical loads first and after ending of the process a new loading case with monotonically increased horizontal loads is initiated. Action effects are obtained as a sum of the action effects from both subsequent loading cases. Lateral loads are applied at the storey levels and their increase continues till the base shear capacity is reached.
The typical force-deformation curve is shown in Figure 13b. As a matter of fact further theoretical development is performed using idealized bi-linear relationship. This line is obtained on the basis of actual relationship “base shear force – roof displacement” using energy balance principle recommended [9]. However this solution is not a unique one and it should be taken into account that it becomes a source of numerical error.
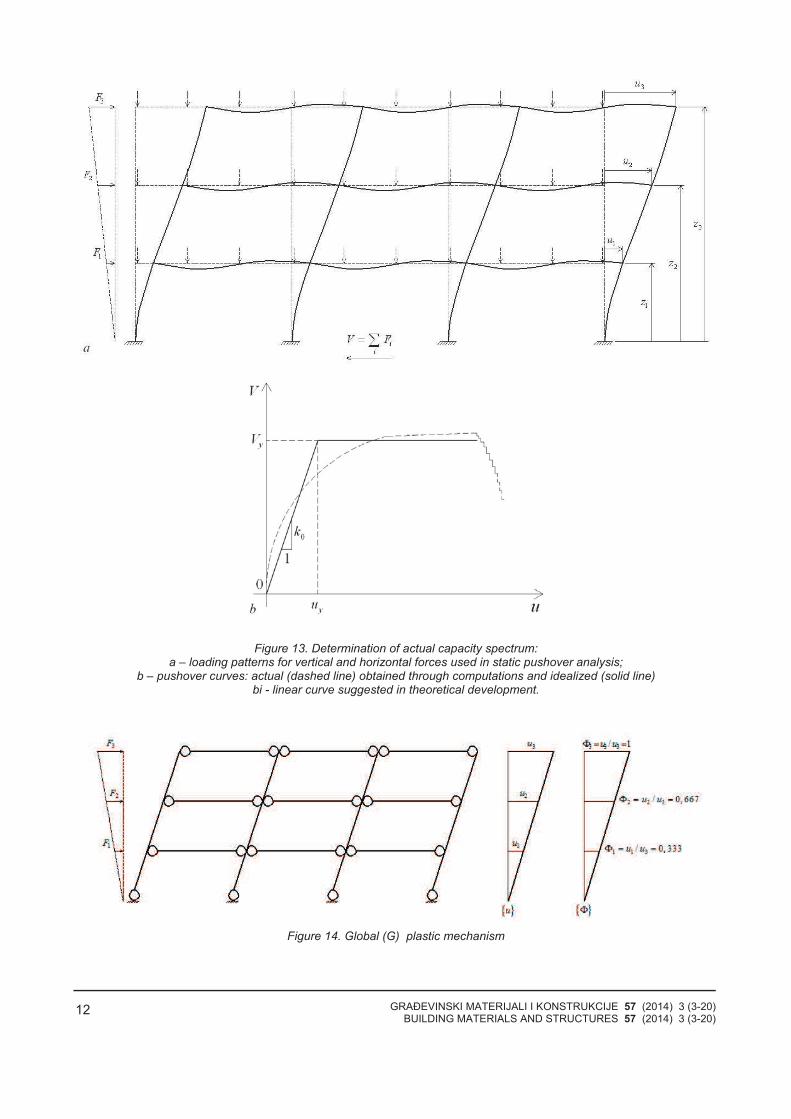
Figures 14 and 15 illustrate global (G) and “soft first storey” (F) mechanisms which propose different disposition of the plastic hinges. In first case plastic hinges are located at the end of the beams when loading procedure is still not terminated. Dissipated energy has relatively uniform distribution in elevation; in the second case dissipated energy is concentrated only in the first storey. This implies that failure mode is a product of inelastic deformations of the first storey only.
In old generation of codes capacity design principles do not take place in seismic resistance calculations. The prediction of the plastic mechanism in the process of design is impossible. In many cases plastic mechanism may surprise the design engineer and may have unexpected shape. Among all feasible mechanisms the most dangerous and unacceptable is the mechanism “soft first storey“ (F - mechanism). For the sake of safety this mechanism is used in checking procedure, see Figure 15. This approach is applied when existing building is studied and capacity design rules are not used.
GRA EVINSKI MATERIJALI I KONSTRUKCIJE 57 (2014) 3 (3-20) BUILDING MATERIALS AND STRUCTURES 57 (2014) 3 (3-20)
12
Figure 13. Determination of actual capacity spectrum: a – loading patterns for vertical and horizontal forces used in static pushover analysis;
b – pushover curves: actual (dashed line) obtained through computations and idealized (solid line) bi - linear curve suggested in theoretical development.
Figure 14. Global (G) plastic mechanism
GRA EVINSKI MATERIJALI I KONSTRUKCIJE 57 (2014) 3 (3-20) BUILDING MATERIALS AND STRUCTURES 57 (2014) 3 (3-20)
13
Figure 15. Soft first storey (F) plastic mechanism (local mechanism)
Appendix B contains information about transfor-mation of MDOF structure and its system of differential equations into ESDOF (equivalent single degree of freedom system) equation (see Figure 13a) assuming G mechanism from Figure 14. The same transform for F - mechanism in Figure 15 mathematically seems to be a particular case of the more general case of G mechanism provided in Annex B. The introduction of G and F mechanisms implies the following explanations. F – mechanism
The vector of dimensionless lateral displacements for F - mechanism takes very simple form containing only unity components:
1
1
1
(14)
Following Appendix B and taking into account Eq. (14) the quantities mentioned there can be calculated to give
mass of the ESDOF system:
3*
1
T
i i
i
m m m m (15)
mass parameter
32
1
ˆT
i i
i
m m m m (16)
participation factor ˆ 1 (17)
resisting force of the ESDOF system
3*
1
T
i i
i
f f f V (18)
equation of the motion of ESDOF system:
g
Vu t u
m (19)
It is worth noting that the basic force – displacement relationship in the case of F
mechanism is “base shear force V – roof
displacement u ”. Because of Eq. (17) the
displacement of the ESDOF system is equal to the roof displacement in MDOF system. The peak response of ESDOF system is easy expressed using response spectra. G – mechanism
In the case of G mechanism the mathematical transform MDOF – ESDOF system is shown in Appendix B. This kind of transform is needed because the peak response of ESDOF system is easy evaluated through response spectra.
target capacity spectrum (TCS)
Target capacity spectrum (TCS) should comply with the performance requirements in largest extent. It should cover deformation criteria such as limited elastic
displacement *
yu for G mechanism and limited first
storey elastic drift yu , ductility demand should be less
than ductility capacity (basic requirement of [9]). For F mechanism the elastic deformation criterion can be written in the form (see Figure 16). :
250
y
Hu (19a)
where H is the total height of the building. The ESDOF system should have prescribed values for the displacement ductility demand, behaviour factor. Prescribed values are entered by the design engineer as input.
Determination of target capacity spectrum is a geometric problem which is settled by iterations. All basic parameters are varying in previously specified limits in order to satisfy simultaneously all requirements in largest extent. In contrast with actual capacity spectrum the procedure of determination of the target capacity spectrum does not require any structural data, it just couples specified design regulations. Figures 16 and 17 are graphically illustrating the determination of the
GRA EVINSKI MATERIJALI I KONSTRUKCIJE 57 (2014) 3 (3-20) BUILDING MATERIALS AND STRUCTURES 57 (2014) 3 (3-20)
14
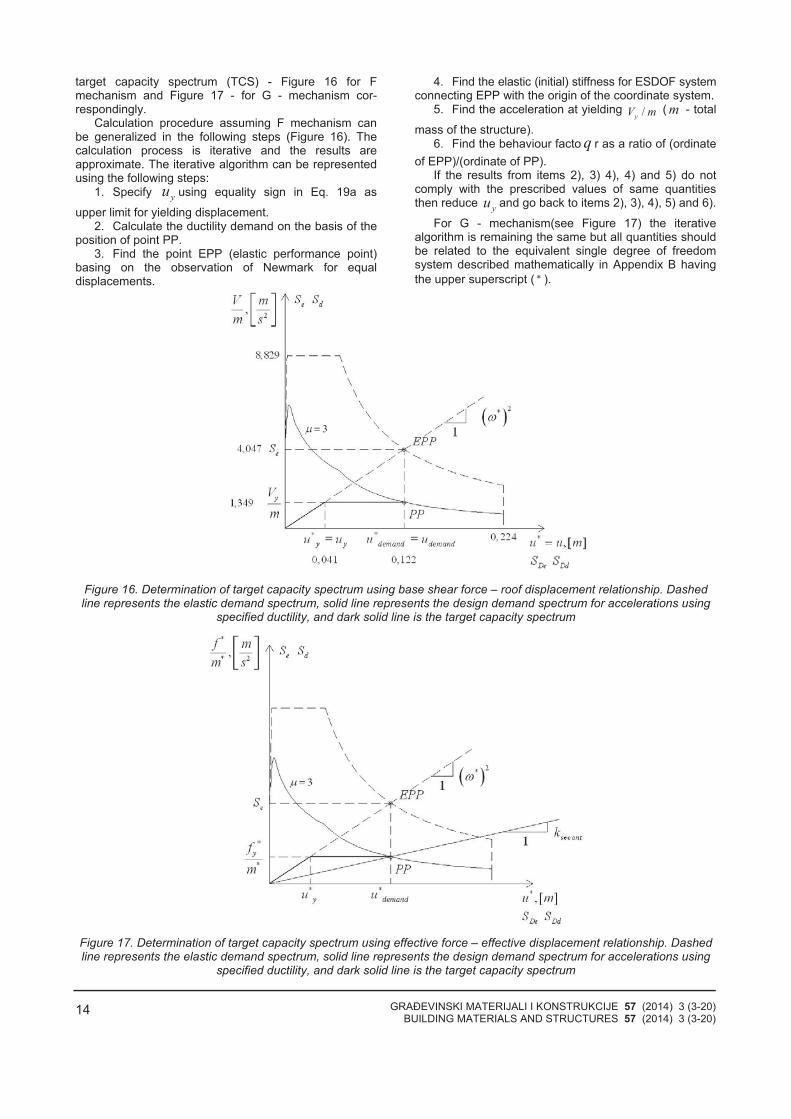
target capacity spectrum (TCS) - Figure 16 for F mechanism and Figure 17 - for G - mechanism cor-respondingly.
Calculation procedure assuming F mechanism can be generalized in the following steps (Figure 16). The calculation process is iterative and the results are approximate. The iterative algorithm can be represented using the following steps:
1. Specify yu using equality sign in Eq. 19a as
upper limit for yielding displacement. 2. Calculate the ductility demand on the basis of the
position of point PP. 3. Find the point EPP (elastic performance point)
basing on the observation of Newmark for equal displacements.
4. Find the elastic (initial) stiffness for ESDOF system connecting EPP with the origin of the coordinate system.
5. Find the acceleration at yielding /yV m (m - total
mass of the structure). 6. Find the behaviour facto q r as a ratio of (ordinate
of EPP)/(ordinate of PP). If the results from items 2), 3) 4), 4) and 5) do not
comply with the prescribed values of same quantities then reduce
yu and go back to items 2), 3), 4), 5) and 6).
For G - mechanism(see Figure 17) the iterative algorithm is remaining the same but all quantities should be related to the equivalent single degree of freedom system described mathematically in Appendix B having
the upper superscript ( * ).
Figure 16. Determination of target capacity spectrum using base shear force – roof displacement relationship. Dashed line represents the elastic demand spectrum, solid line represents the design demand spectrum for accelerations using
specified ductility, and dark solid line is the target capacity spectrum
Figure 17. Determination of target capacity spectrum using effective force – effective displacement relationship. Dashed line represents the elastic demand spectrum, solid line represents the design demand spectrum for accelerations using
specified ductility, and dark solid line is the target capacity spectrum
GRA EVINSKI MATERIJALI I KONSTRUKCIJE 57 (2014) 3 (3-20) BUILDING MATERIALS AND STRUCTURES 57 (2014) 3 (3-20)
15
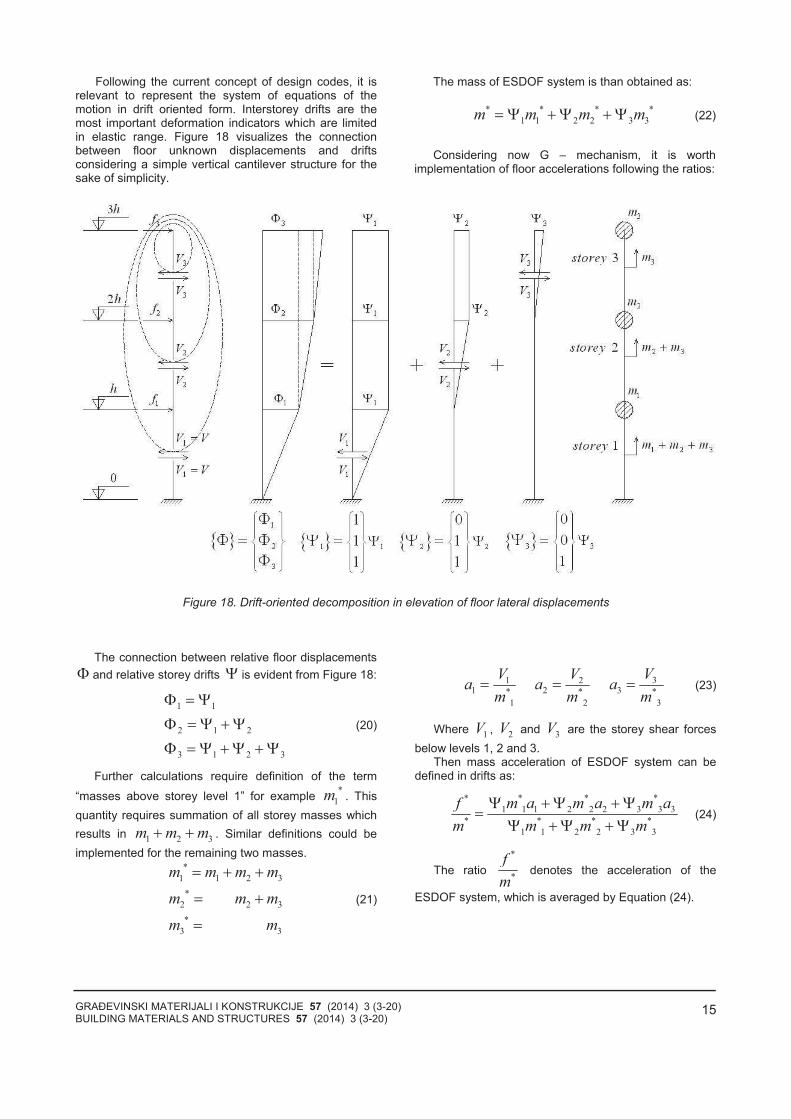
Following the current concept of design codes, it isrelevant to represent the system of equations of themotion in drift oriented form. Interstorey drifts are themost important deformation indicators which are limitedin elastic range. Figure 18 visualizes the connection between floor unknown displacements and driftsconsidering a simple vertical cantilever structure for thesake of simplicity.
The mass of ESDOF system is than obtained as:
* * * *
1 1 2 2 3 3m m m m (22)
Considering now G – mechanism, it is worth implementation of floor accelerations following the ratios:
Figure 18. Drift-oriented decomposition in elevation of floor lateral displacements The connection between relative floor displacements
and relative storey drifts is evident from Figure 18:
1 1
2 1 2
3 1 2 3
(20)
Further calculations require definition of the term
“masses above storey level 1” for example *
1m . This
quantity requires summation of all storey masses which
results in 1 2 3m m m . Similar definitions could be
implemented for the remaining two masses.
*
1 1 2 3
*
2 2 3
*
3 3
m m m m
m m m
m m
(21)
1
1 *
1
Va
m
2
2 *
2
Va
m
3
3 *
3
Va
m (23)
Where 1V ,
2V and
3V are the storey shear forces
below levels 1, 2 and 3. Then mass acceleration of ESDOF system can be
defined in drifts as:
* * **
1 1 1 2 2 2 3 3 3
* * * *
1 1 2 2 3 3
m a m a m af
m m m m (24)
The ratio
*
*
f
m denotes the acceleration of the
ESDOF system, which is averaged by Equation (24).
GRA EVINSKI MATERIJALI I KONSTRUKCIJE 57 (2014) 3 (3-20) BUILDING MATERIALS AND STRUCTURES 57 (2014) 3 (3-20)
16
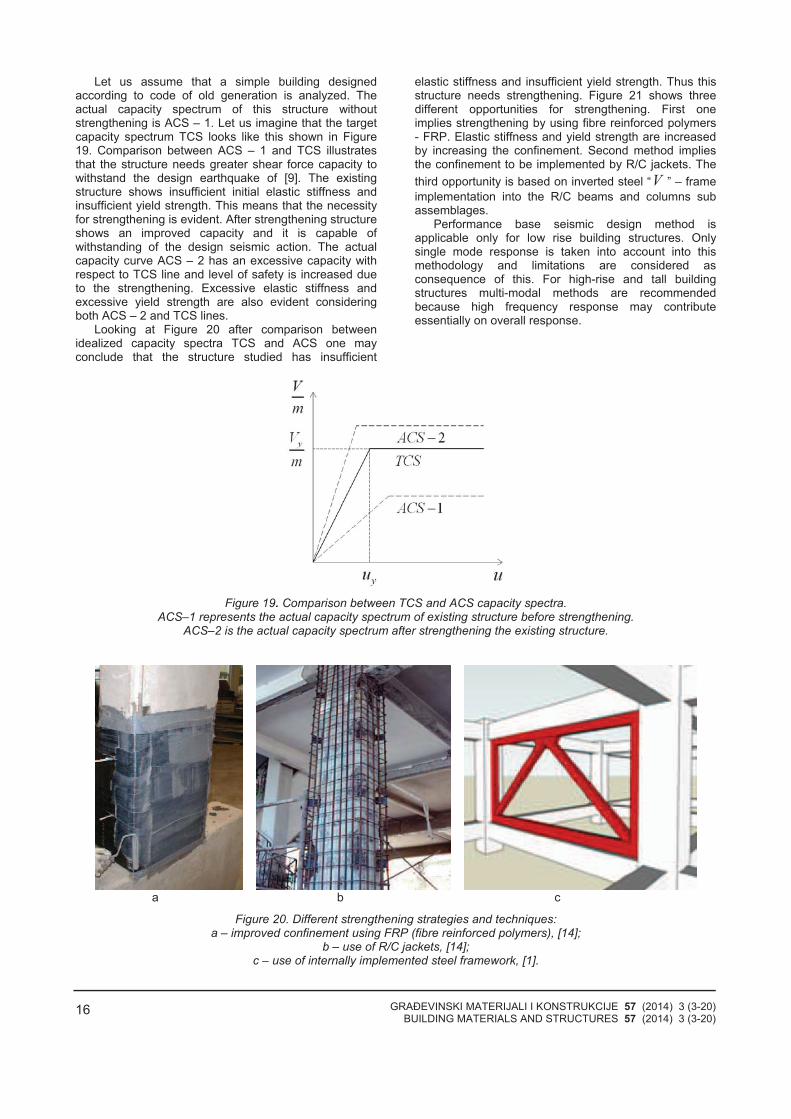
Let us assume that a simple building designed according to code of old generation is analyzed. The actual capacity spectrum of this structure without strengthening is ACS – 1. Let us imagine that the target capacity spectrum TCS looks like this shown in Figure 19. Comparison between ACS – 1 and TCS illustrates that the structure needs greater shear force capacity to withstand the design earthquake of [9]. The existing structure shows insufficient initial elastic stiffness and insufficient yield strength. This means that the necessity for strengthening is evident. After strengthening structure shows an improved capacity and it is capable of withstanding of the design seismic action. The actual capacity curve ACS – 2 has an excessive capacity with respect to TCS line and level of safety is increased due to the strengthening. Excessive elastic stiffness and excessive yield strength are also evident considering both ACS – 2 and TCS lines.
Looking at Figure 20 after comparison between idealized capacity spectra TCS and ACS one may conclude that the structure studied has insufficient
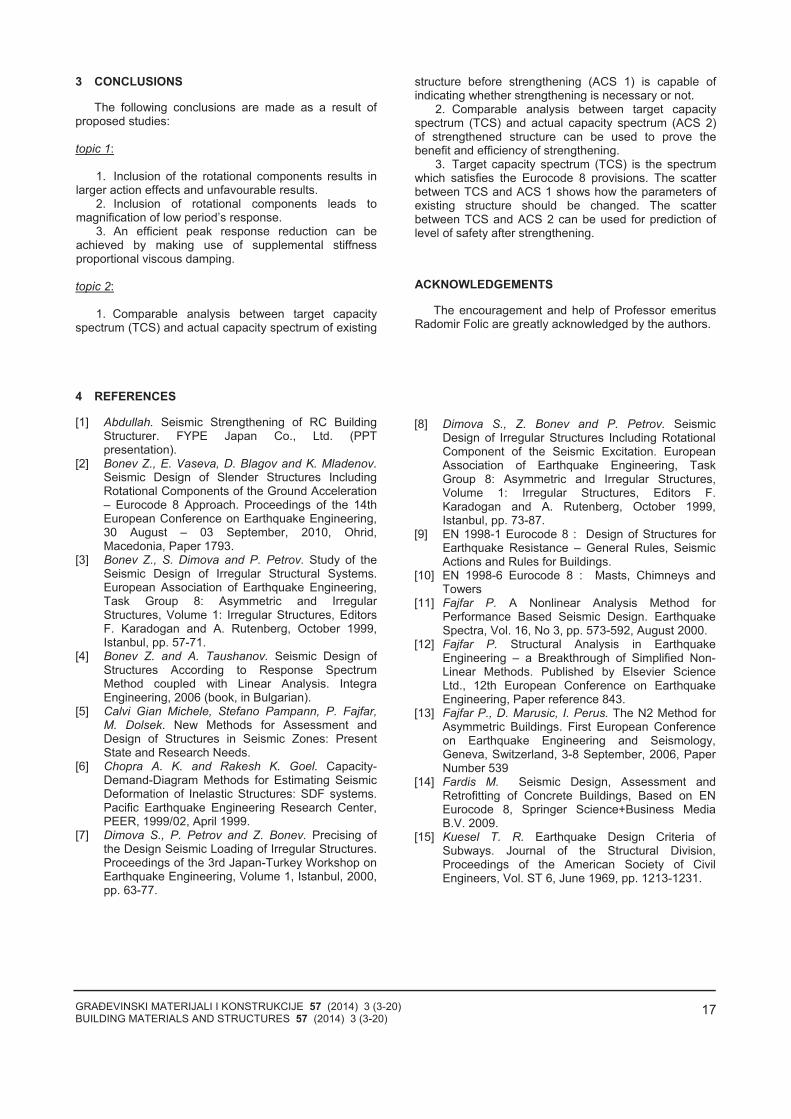
elastic stiffness and insufficient yield strength. Thus this structure needs strengthening. Figure 21 shows three different opportunities for strengthening. First one implies strengthening by using fibre reinforced polymers - FRP. Elastic stiffness and yield strength are increased by increasing the confinement. Second method implies the confinement to be implemented by R/C jackets. The
third opportunity is based on inverted steel “V ” – frame
implementation into the R/C beams and columns sub assemblages.
Performance base seismic design method is applicable only for low rise building structures. Only single mode response is taken into account into this methodology and limitations are considered as consequence of this. For high-rise and tall building structures multi-modal methods are recommended because high frequency response may contribute essentially on overall response.
Figure 19. Comparison between TCS and ACS capacity spectra. ACS–1 represents the actual capacity spectrum of existing structure before strengthening.
ACS–2 is the actual capacity spectrum after strengthening the existing structure.
a b c
Figure 20. Different strengthening strategies and techniques: a – improved confinement using FRP (fibre reinforced polymers), [14];
b – use of R/C jackets, [14]; c – use of internally implemented steel framework, [1].
GRA EVINSKI MATERIJALI I KONSTRUKCIJE 57 (2014) 3 (3-20) BUILDING MATERIALS AND STRUCTURES 57 (2014) 3 (3-20)
17
3 CONCLUSIONS
The following conclusions are made as a result of proposed studies: topic 1:
1. Inclusion of the rotational components results in larger action effects and unfavourable results.
2. Inclusion of rotational components leads to magnification of low period’s response.
3. An efficient peak response reduction can be achieved by making use of supplemental stiffness proportional viscous damping. topic 2:
1. Comparable analysis between target capacity spectrum (TCS) and actual capacity spectrum of existing
structure before strengthening (ACS 1) is capable of indicating whether strengthening is necessary or not.
2. Comparable analysis between target capacity spectrum (TCS) and actual capacity spectrum (ACS 2) of strengthened structure can be used to prove the benefit and efficiency of strengthening.
3. Target capacity spectrum (TCS) is the spectrum which satisfies the Eurocode 8 provisions. The scatter between TCS and ACS 1 shows how the parameters of existing structure should be changed. The scatter between TCS and ACS 2 can be used for prediction of level of safety after strengthening.
ACKNOWLEDGEMENTS
The encouragement and help of Professor emeritus Radomir Folic are greatly acknowledged by the authors.
4 REFERENCES
[1] Abdullah. Seismic Strengthening of RC BuildingStructurer. FYPE Japan Co., Ltd. (PPTpresentation).
[2] Bonev Z., E. Vaseva, D. Blagov and K. Mladenov.Seismic Design of Slender Structures IncludingRotational Components of the Ground Acceleration– Eurocode 8 Approach. Proceedings of the 14thEuropean Conference on Earthquake Engineering,30 August – 03 September, 2010, Ohrid,Macedonia, Paper 1793.
[3] Bonev Z., S. Dimova and P. Petrov. Study of theSeismic Design of Irregular Structural Systems.European Association of Earthquake Engineering,Task Group 8: Asymmetric and IrregularStructures, Volume 1: Irregular Structures, EditorsF. Karadogan and A. Rutenberg, October 1999,Istanbul, pp. 57-71.
[4] Bonev Z. and A. Taushanov. Seismic Design ofStructures According to Response SpectrumMethod coupled with Linear Analysis. IntegraEngineering, 2006 (book, in Bulgarian).
[5] Calvi Gian Michele, Stefano Pampann, P. Fajfar,M. Dolsek. New Methods for Assessment andDesign of Structures in Seismic Zones: PresentState and Research Needs.
[6] Chopra A. K. and Rakesh K. Goel. Capacity-Demand-Diagram Methods for Estimating SeismicDeformation of Inelastic Structures: SDF systems.Pacific Earthquake Engineering Research Center, PEER, 1999/02, April 1999.
[7] Dimova S., P. Petrov and Z. Bonev. Precising ofthe Design Seismic Loading of Irregular Structures.Proceedings of the 3rd Japan-Turkey Workshop onEarthquake Engineering, Volume 1, Istanbul, 2000,pp. 63-77.
[8] Dimova S., Z. Bonev and P. Petrov. Seismic
Design of Irregular Structures Including Rotational Component of the Seismic Excitation. European Association of Earthquake Engineering, Task Group 8: Asymmetric and Irregular Structures, Volume 1: Irregular Structures, Editors F. Karadogan and A. Rutenberg, October 1999, Istanbul, pp. 73-87.
[9] EN 1998-1 Eurocode 8 : Design of Structures for Earthquake Resistance – General Rules, Seismic Actions and Rules for Buildings.
[10] EN 1998-6 Eurocode 8 : Masts, Chimneys and Towers
[11] Fajfar P. A Nonlinear Analysis Method for Performance Based Seismic Design. Earthquake Spectra, Vol. 16, No 3, pp. 573-592, August 2000.
[12] Fajfar P. Structural Analysis in Earthquake Engineering – a Breakthrough of Simplified Non-Linear Methods. Published by Elsevier Science Ltd., 12th European Conference on Earthquake Engineering, Paper reference 843.
[13] Fajfar P., D. Marusic, I. Perus. The N2 Method for Asymmetric Buildings. First European Conference on Earthquake Engineering and Seismology, Geneva, Switzerland, 3-8 September, 2006, Paper Number 539
[14] Fardis M. Seismic Design, Assessment and Retrofitting of Concrete Buildings, Based on ENEurocode 8, Springer Science+Business Media B.V. 2009.
[15] Kuesel T. R. Earthquake Design Criteria of Subways. Journal of the Structural Division, Proceedings of the American Society of Civil Engineers, Vol. ST 6, June 1969, pp. 1213-1231.
GRA EVINSKI MATERIJALI I KONSTRUKCIJE 57 (2014) 3 (3-20) BUILDING MATERIALS AND STRUCTURES 57 (2014) 3 (3-20)
18
[16] Mestrovic G., D. Gizmar and M. Pende. NonlinearAnalysis of Structures According to New EuropeanDesign Code. Proceedings of the 14th WorldConference on Earthquake Engineering, October12-17, 2008, Beijing, China.
[17] Static Pushover Analysis in Z_Soil PC & andrelated EUROCODE 8 regulations R_070202,January 2007.
[18] St John C. M. and T. F. Zahrah. Aseismic Designof Underground Structures, FEATURES SECTION:Seismic Effect on Underground Structures.Tunneling and Underground Space Technology,Vol. 2, Number 2, 1987, pp. 165-197.
[19] Tzenov L. Basics of Earthquake Engineering.Professor Marin Drinov Academic PublishingHouse, Sofia, 2002.
[20] Tzenov L., S. Dimova, Z. Bonev and P. Petrov.Seismic Resistant Design of Irregular Structures: Generalized Method for Determination of Design Seismic Loading, on issue of Turkish Earthquake Foundation, Technical Report TDV/TR 037-62, Istanbul Technical University, 2001.
[21] Todorovska M. and M.D. Trifunac. Response Spectra for Differential Motion of Columns, Proceedings of the 12-th World Conference on Earthquake Engineering, 2000, paper 2638.
[22] Todorovska M. Some Interferometry of Soil –Structure Interaction Model with Coupled Horizontal and Eocking Response, Bulletin of the Seismological Society of America, Vol. 99, No. 2A, pp. 611-625, April 2009.
SUMMARY
EUROCODE 8: USE OF ADVANTAGEOUS FORMULATIONS FOR IMPROVED AND SAFE DESIGN
Zdravko BONEV Stanislav DOSPEVSKI
The purpose of the paper is to share the experience
in application of Eurocode 8. Following the existingframework of the European standard two engineeringdevelopment of two specific topics are proposed. Firstdeals with modelling the seismic action aiming to take into account spatial variability of the seismic action. It isproven that the inclusion of rotational components mayinfluence the action effects and the results provideunsafe design. Evaluation is carried out throughresponse spectrum method. The second topic studiesthe use of performance based seismic design as a toolto prove the need for seismic strengthening and verification of the benefit. Both target and actual capacity spectra are compared to make assessment of the lateralresistance of existing and strengthened structure.Insufficient elastic stiffness and insufficient yield strength are considered as the most typical situations frequentlymet in the design practice and which can be settled byseismic strengthening. Discussions and conclusions concerning the philosophy of the assessment procedureare presented.
Key words: Seismic resistant design to Eurocode 8,taking into account spatial variability of seismic action,performance based seismic design
REZIME
EVROKOD 8: UPOTREBA POVOLJNE FORMULACIJE ZA POBOLJŠANO I SIGURNO PROJEKTOVANJE
Zdravko BONEV Stanislav DOSPEVSKI
Svrha ovog rada jeste da se prenesu i podele
iskustva iz primene Evrokoda 8 (EN 1998). Slede i postoje i okvir Evropskih standarda, razvijena su su dva inženjerska pravca delovanja, tj. dve zasebne oblasti rada. Prva se odnosi na modliranje seizmi kih dejstava sa ciljem uzimanja u obzir njihove prostorne promen-ljivosti. Provereno je i dokazano da uklju enje rotacionih komponenti može da uti e na efekte od dejstava i da rezultati dovedu do nesigurnih projektnih rešenja. Procena je izvršena koriš enjem metode spektra odgovora. U drugoj oblasti izu ava se upotreba metode projektovanja na bazi seizmi kih performansi kao sredstva provere i potvrde za seizmi kim poja anjima kao i potvrde njihove efikasnosti. Da bi se ovo uradilo, upore eni su spektar ciljanog kapaciteta i stvarni spektar kapaciteta. Slu aj nedovoljne elasti ne krutosti i nedovoljne vrsto e pri te enju smatra se najtipi nijim seizmi kim slu ajem kada je potrebno izvesti poja avanja. Diskutovane su obe ove teme i formulisani su zaklju ci koji se odnose na filozofiju Evropskih standarda.
Klju ne re i: Projektovanje seizmi ki otpornih konstrukcija prema Evrokodu 8 (EN 1998), uzimanje u obzir prostornu promenljivost seizmi kih dejstava, seizmi ko projektovanje zasnovano na performansama
GRA EVINSKI MATERIJALI I KONSTRUKCIJE 57 (2014) 3 (3-20) BUILDING MATERIALS AND STRUCTURES 57 (2014) 3 (3-20)
19
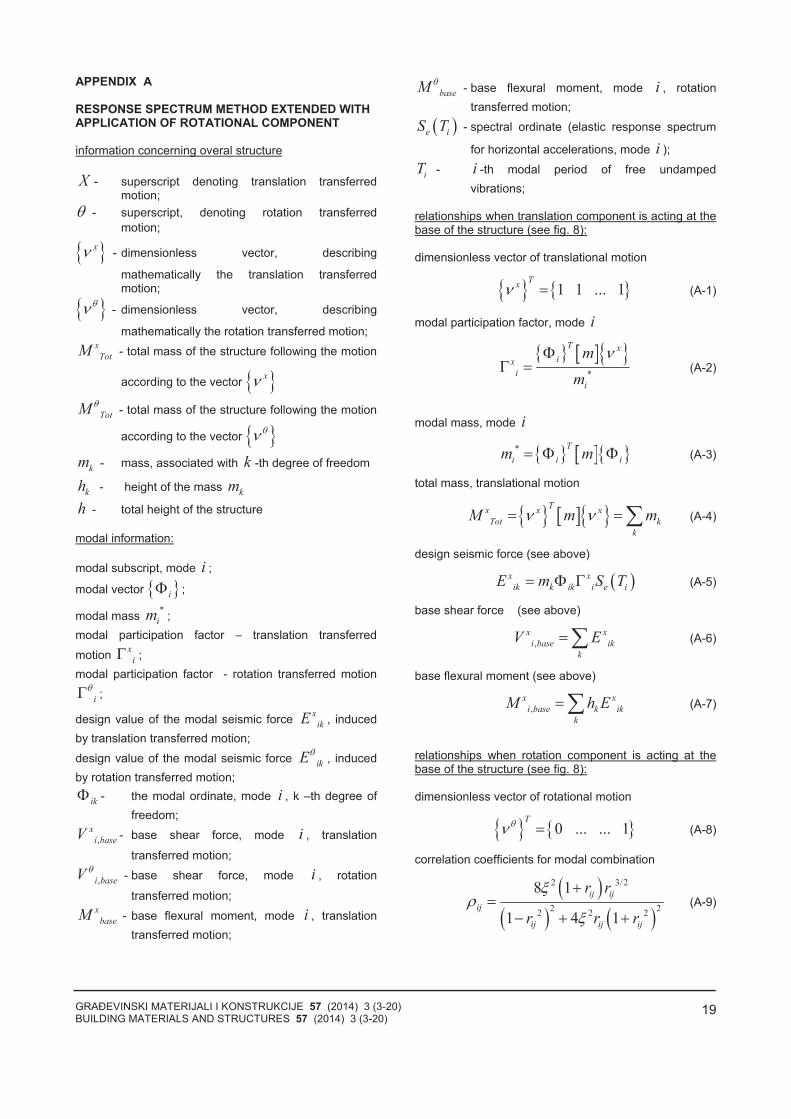
APPENDIX A RESPONSE SPECTRUM METHOD EXTENDED WITH APPLICATION OF ROTATIONAL COMPONENT information concerning overal structure
X - superscript denoting translation transferred motion;
- superscript, denoting rotation transferred
motion;
x- dimensionless vector, describing
mathematically the translation transferred motion;
- dimensionless vector, describing
mathematically the rotation transferred motion; x
TotM - total mass of the structure following the motion
according to the vector x
TotM - total mass of the structure following the motion
according to the vector
km - mass, associated with k -th degree of freedom
kh - height of the mass km
h - total height of the structure
modal information:
modal subscript, mode i ;
modal vector i ;
modal mass *
im ;
modal participation factor – translation transferred
motion x
i ;
modal participation factor - rotation transferred motion
i ;
design value of the modal seismic force x
ikE , induced
by translation transferred motion;
design value of the modal seismic force ikE , induced
by rotation transferred motion;
ik - the modal ordinate, mode i , k –th degree of
freedom;
,
x
i baseV - base shear force, mode i , translation
transferred motion;
,i baseV - base shear force, mode i , rotation
transferred motion; x
baseM - base flexural moment, mode i , translation
transferred motion;
baseM - base flexural moment, mode i , rotation
transferred motion;
e iS T - spectral ordinate (elastic response spectrum
for horizontal accelerations, mode i );
iT - i -th modal period of free undamped
vibrations;
relationships when translation component is acting at the base of the structure (see fig. 8):
dimensionless vector of translational motion
1 1 ... 1T
x (A-1)
modal participation factor, mode i
*
T x
ix
i
i
m
m (A-2)
modal mass, mode i
* T
i i im m (A-3)
total mass, translational motion
T
x x x
Tot k
k
M m m (A-4)
design seismic force (see above)
x x
ik k ik i e iE m S T (A-5)
base shear force (see above)
,
x x
i base ik
k
V E (A-6)
base flexural moment (see above)
,
x x
i base k ik
k
M h E (A-7)
relationships when rotation component is acting at the base of the structure (see fig. 8):
dimensionless vector of rotational motion
0 ... ... 1T
(A-8)
correlation coefficients for modal combination
2 3/2
2 22 2 2
8 1
1 4 1
ij ij
ij
ij ij ij
r r
r r r (A-9)
GRA EVINSKI MATERIJALI I KONSTRUKCIJE 57 (2014) 3 (3-20) BUILDING MATERIALS AND STRUCTURES 57 (2014) 3 (3-20)
20
design seismic force (see above)
ik k ik i e iE m hS T (A-10)
modal participation factor, mode i
*
T
i
i
i
m
m (A-11)
total mass, rotational motion
2T
Tot k k
k
M m m (A-12)
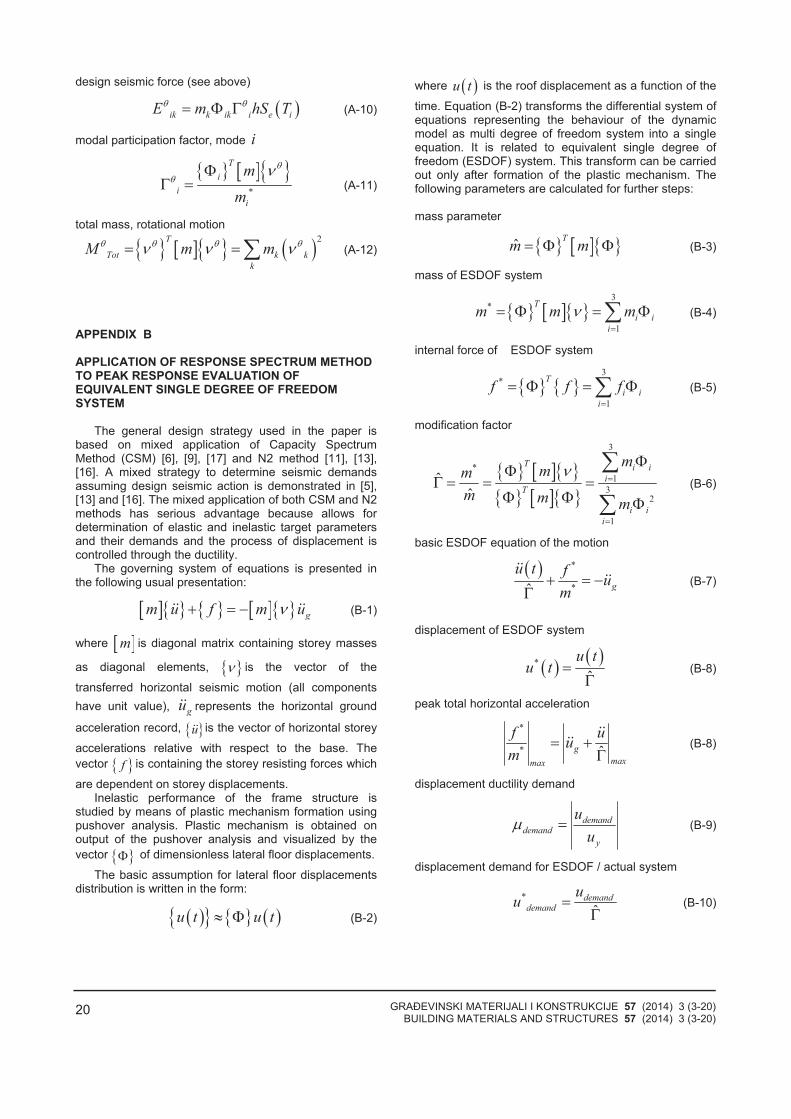
APPENDIX B APPLICATION OF RESPONSE SPECTRUM METHOD TO PEAK RESPONSE EVALUATION OF EQUIVALENT SINGLE DEGREE OF FREEDOM SYSTEM
The general design strategy used in the paper is
based on mixed application of Capacity Spectrum Method (CSM) [6], [9], [17] and N2 method [11], [13], [16]. A mixed strategy to determine seismic demands assuming design seismic action is demonstrated in [5], [13] and [16]. The mixed application of both CSM and N2 methods has serious advantage because allows for determination of elastic and inelastic target parameters and their demands and the process of displacement is controlled through the ductility.
The governing system of equations is presented in the following usual presentation:
gm u f m u (B-1)
where m is diagonal matrix containing storey masses
as diagonal elements, is the vector of the
transferred horizontal seismic motion (all components
have unit value), gu represents the horizontal ground
acceleration record, u is the vector of horizontal storey
accelerations relative with respect to the base. The
vector f is containing the storey resisting forces which
are dependent on storey displacements. Inelastic performance of the frame structure is
studied by means of plastic mechanism formation using pushover analysis. Plastic mechanism is obtained on output of the pushover analysis and visualized by the
vector of dimensionless lateral floor displacements.
The basic assumption for lateral floor displacements distribution is written in the form:
u t u t (B-2)
where u t is the roof displacement as a function of the
time. Equation (B-2) transforms the differential system of equations representing the behaviour of the dynamic model as multi degree of freedom system into a single equation. It is related to equivalent single degree of freedom (ESDOF) system. This transform can be carried out only after formation of the plastic mechanism. The following parameters are calculated for further steps:
mass parameter
ˆT
m m (B-3)
mass of ESDOF system
3*
1
T
i i
i
m m m (B-4)
internal force of ESDOF system
3*
1
T
i i
i
f f f (B-5)
modification factor
3
*
1
32
1
ˆˆ
T i i
i
T
i i
i
mmm
m m m
(B-6)
basic ESDOF equation of the motion
*
*ˆ g
u t fu
m (B-7)
displacement of ESDOF system
*
ˆ
u tu t (B-8)
peak total horizontal acceleration
*
* ˆg
maxmax
f uu
m (B-8)
displacement ductility demand
demand
demand
y
u
u (B-9)
displacement demand for ESDOF / actual system
*
ˆdemand
demand
uu (B-10)