Embed Size (px)
Citation preview
EURO MONEY MARKET STUdYdECEMBER 2012
EURO MONEY MARKET STUDYDEcEMbER 2012
In 2012 all ECB publications
feature a motif taken from
the €50 banknote.

© European Central Bank, 2012
Address Kaiserstrasse 29 60311 Frankfurt am Main Germany
Postal address Postfach 16 03 19 60066 Frankfurt am Main Germany
Telephone +49 69 1344 0
Website http://www.ecb.europa.eu
Fax +49 69 1344 6000
All rights reserved. Reproduction for educational and non-commercial purposes is permitted provided that the source is acknowledged.
ISSN 1830-3781 (online)
3ECB
Euro Money Market StudyDecember 2012 3
cONTENTS
ExEcUTivE SUMMARY 5
1 iNTRODUcTiON 7
2 ThE MONETARY pOlicY ENviRONMENT iN 2011 AND 2012 8
3 ThE UNSEcURED MARKET 16
3.1 Turnover analysis 163.2 Maturity analysis 203.3 Market structure 21
4 ThE SEcURED MARKET 23
4.1 Turnover analysis 234.2 Maturity analysis 244.3 Market structure 254.4 Triparty repos 30
5 DEvElOpMENTS iN ThE OvER-ThE-cOUNTER DERivATivES MARKETS 31
5.1 Turnover analysis 315.2 Maturity analysis 325.3 Market structure 38
6 ThE ShORT-TERM iNTEREST RATE fUTURES AND OpTiONS MARKETS 43
7 ThE ShORT-TERM SEcURiTiES MARKET 48
7.1 Analysis of turnover in the secondary market 487.2 Outstanding amounts and issuance 547.3 Market structure 55
8 cROSS-MARKET SEgMENT ANAlYSiS 56
8.1 Turnover analysis 578.2 Maturity analysis 618.3 Market structure 62
9 pUTTiNg ThE EMMS iNTO pERSpEcTivE – vOlUME DATA 71
bOxES
The ECB’s non-standard measures and the financial crisis1 9Changes in collateral eligibility requirements and risk control measures and developments 2 in the use of collateral in Eurosystem monetary policy operations 13New data regarding the perceived impact of counterparty limits on money markets3 17Development of the secured money market against the background of non-standard 4 monetary policy measures – new evidence from Euro GC Pooling 26The FX swap market: some evidence of pricing and currency breakdown 5 during the crisis 36US and European money market funds during the crisis6 40The Eurosystem’s position on EURIBOR reform 7 46
cONTENTS
4ECBEuro Money Market StudyDecember 20124
AbbREviATiONS USED fOR cOUNTRY NAMES
BE BelgiumBG BulgariaCZ Czech RepublicDK DenmarkDE GermanyEE EstoniaIE IrelandGR GreeceES Spain FR FranceIT ItalyCY CyprusLV LatviaLT LithuaniaLU LuxembourgHU HungaryMT MaltaNL NetherlandsAT AustriaPL PolandPT PortugalRO RomaniaSI SloveniaSK SlovakiaFI FinlandSE SwedenUK United KingdomCH Switzerland
AbbREviATiONS USED iN ThE chARTS
CCP central counterpartyFRAs forward rate agreementsFX swaps foreign exchange swapsIRSs other interest rate swapsOISs overnight index swapsO/N overnightOTC over the counterT/N tomorrow/next (day)S/N spot/next (day)ST securities short-term securitiesXccys cross-currency swaps
Note: The data represented herein refer to the second quarter of each respective year.
The French certificate of deposit (CD8 s) and commercial paper (CPs) markets 49Segmentation in the euro money market and the impact of the ECB’s most recent 9 non-standard measures 57Impact of the zero deposit facility rate on the euro money market10 65
ANNExES
Annex 1: Credit institutions participating in the EMMS 2012 76Annex 2: Technical annex 78Annex 3: A comparison of the International Capital Market Association European
Repo Council (ICMA ERC) survey and the ECB survey on euro interbank money market activity 81
Annex 4: Glossary 83Annex 5: Coordination of the 2012 Euro money market study 89
5ECB
Euro Money Market StudyDecember 2012 5
ExEcUTivE SUMMARY
ExEcUTivE SUMMARY
This ninth study on the structure and functioning of the euro money market is based on a survey conducted by the European Central Bank (ECB) and the national central banks that are members of the European System of Central Banks (ESCB).1 The survey asked panel banks (listed in Annex 1) to indicate their average daily turnover in various money market instruments during the second quarters of 2012 and 2011 and to answer a number of qualitative questions. Three features of this study are new compared with the previous studies: (i) a question on the impact of banks’ counterparty limits on money market activity was introduced in the 2012 survey and is discussed in this study for the first time (see Box 3); (ii) information is introduced about the currency breakdown of foreign exchange swap and forward transactions (see Box 5); and (iii) Section 9 discusses aggregate volume data from the survey, released for the first time, complementing the regular indices of transaction volumes.
The main findings of the study show the significant impact of the euro area sovereign debt crisis on the euro money market, as well as the effect of the Eurosystem’s extraordinary policy measures, aimed at restoring the functioning of the fragmented euro money market.
Aggregate turnover for all instruments in the euro money market decreased by 14% in the second quarter of 2012 compared with the second quarter of the previous year. After a significant increase in turnover in 2011, when the euro area banking sector’s excess liquidity was low, aggregate turnover fell below 2010 levels in the second quarter of 2012. This decline can be attributed to the euro area debt crisis and the related impairment of the interbank market, as well as to the high excess liquidity environment that prevailed in the euro interbank market as a result of the two three-year longer-term refinancing operations (LTROs) in December 2011 and February 2012.
The most notable declines in turnover took place in the segment of overnight index swaps (OISs), where turnover declined by 50% in 2012, and in the unsecured market, where it contracted by 36%. Market activity in the unsecured market remains highly concentrated in the overnight segment (share of more than 70%), while turnover in the segment beyond one month remains very limited (only around 2% of total unsecured activity). The contraction in the unsecured market can be explained by the general trend towards secured lending and by a shortening of maturities on the back of greater aversion to counterparty risk. At the same time the current high level of excess liquidity, provided by the Eurosystem, reduces the demand for interbank funding, while stricter regulation requirements tend to reduce the supply of, particularly, unsecured interbank lending.
The decline in money market activity was pronounced compared with the previous year, as the second quarter of 2011 was before the intensification of the euro area debt crisis, and excess liquidity had temporarily subsided and activity in the money market had picked up substantially. This effect is also very noticeable in the significant decline in the OIS segment. The environment of high excess liquidity combined with the low level of interest rates (the rate on the deposit facility was close to zero during the reference period) and the low volatility of overnight interest rates (as measured by the euro overnight index average or EONIA) significantly reduced the need to hedge interest rate risk.
The secured market remained the largest segment of the euro money market, although turnover declined by 15% in the second quarter of 2012. The decline was driven by a 26% decrease in activity for the overnight maturity, which represents around 18% of total secured turnover. The share of
1 The ESCB consists of the ECB and the national central banks of the European Union (EU) Member States.
6ECBEuro Money Market StudyDecember 20126
secured market activity cleared through central counterparties (CCPs) increased further, to 55% of transactions (compared with 51% in 2011). Whereas in previous years activity in the CCP market had picked up considerably after more European banks joined the international repo platforms, in 2012 CCP repo business declined (albeit at a slower rate than overall repo transactions), on the back of, among other factors, increased margin requirements following rating downgrades and increasing yields of some peripheral euro area debt. Overall, business also declined as many banks had already fulfilled their funding needs for 2012 with the liquidity received from the Eurosystem’s LTROs.
The continued decline in the share of unsecured lending, as well as the increase in the share of transactions settled through CCPs, indicates heightened concerns about counterparty risk. On the other hand, the geographical structure of both the counterparties and the collateral shows only some signs of a preference for domestic counterparties and collateral (a “home bias”). In the unsecured market the share of domestic counterparties increased significantly, from around 28% in 2011 to around 39% in 2012, while for the secured market the share of domestic collateral increased slightly, from 26% to around 31%. There has been a slight trend away from domestic collateral since 2009 – partly related to the euro area debt crisis – as repo investors are often less willing to enter into repos with collateral issued in the country of the counterparty if that country has elevated sovereign and counterparty risk (“wrong way” correlation risk).
The only market segment where activity picked up significantly (by 12%) was the market for FX swaps, as these remained an important cash funding tool for European banks. Since they are considered more secure – not least as they are settled mainly via large multicurrency cash settlement systems – they have profited from the move away from unsecured transactions. Another sign of the resilience of the FX swap market is the fact that it has been able to accommodate the demand for a lengthening of maturities as banks have tried to term out their money-market funding in foreign currencies. The broader use of e-commerce platforms continued to support activity in this market segment, with the survey showing an increase in the share of electronic trading in most market segments.
Turnover in the outright secondary market for short-term securities declined by 9% for the segment as a whole, whereas turnover in short-term paper issued by credit institutions increased by 12%, a trend that may have been indirectly supported by an increase in the outstanding amount of STEP (Short-Term European Paper) in the second quarter of 2012. Some of this increase in STEP could potentially be explained by the eligibility of these short-term securities as collateral for the Eurosystem’s operations.
The qualitative part of the survey shows that respondents considered the efficiency of the unsecured market to have declined markedly in comparison with 2011. Liquidity conditions in the interbank money market were also perceived to have deteriorated, possibly in part because of the Eurosystem taking on an increased intermediary role with its three-year LTROs and, for some segments, the lower volatility due to the high level of excess liquidity reducing hedging needs. As regards the secured segment, the number of respondents giving a positive assessment of the market’s efficiency increased, although liquidity conditions were perceived as being worse than in 2011. For most other market segments, the perception of efficiency was more positive in 2012, whereas it was generally felt that liquidity conditions had deteriorated.
The results of the new qualitative question on credit limits showed that nearly half of survey participants assessed changes in their risk limits vis-à-vis their counterparties to have had a contractionary impact on current money market activity in terms of turnover; for the future, survey participants foresee a slowdown of this deterioration process.
7ECB
Euro Money Market StudyDecember 2012 7
i iNTRODUcTiON
1 iNTRODUcTiON
In the second quarter of 2012, the ECB and the national central banks (NCBs) of the ESCB conducted a quantitative and qualitative survey of the euro money market among banks in the 27 EU countries and one non-EU country.2 This was undertaken under the auspices of the Market Operations Committee of the ESCB and with the general support of the Money Market Contact Group of the ECB.
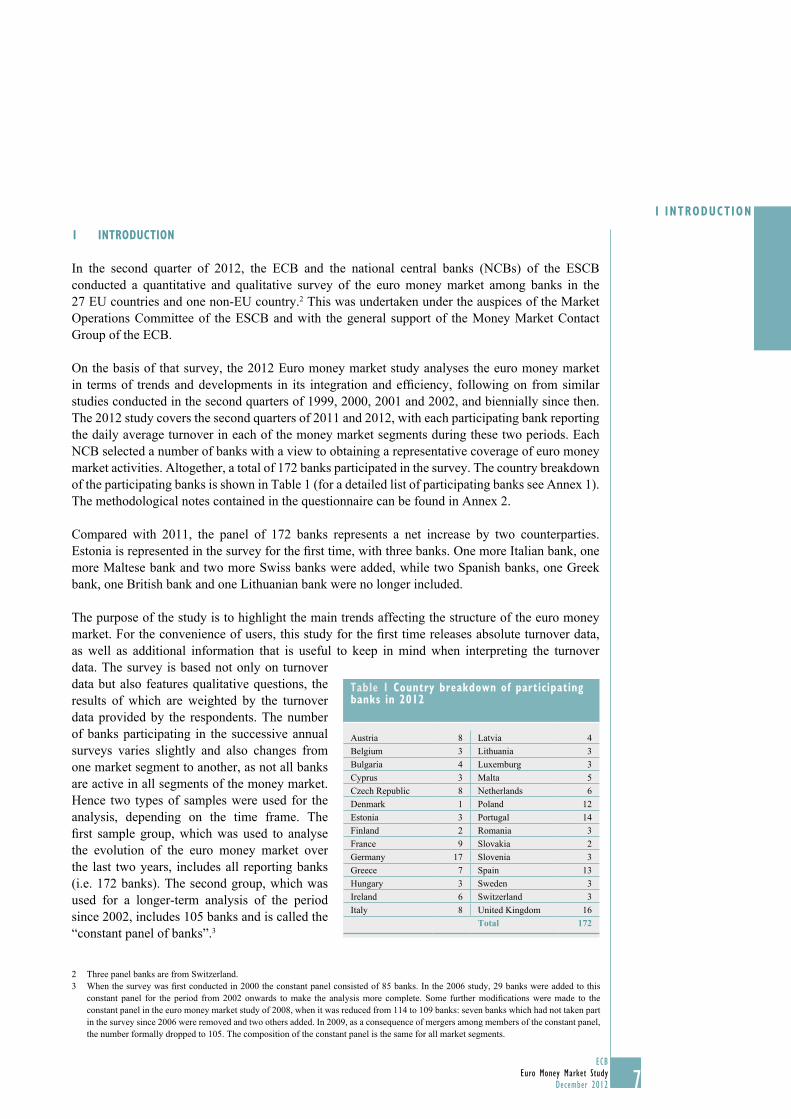
On the basis of that survey, the 2012 Euro money market study analyses the euro money market in terms of trends and developments in its integration and efficiency, following on from similar studies conducted in the second quarters of 1999, 2000, 2001 and 2002, and biennially since then. The 2012 study covers the second quarters of 2011 and 2012, with each participating bank reporting the daily average turnover in each of the money market segments during these two periods. Each NCB selected a number of banks with a view to obtaining a representative coverage of euro money market activities. Altogether, a total of 172 banks participated in the survey. The country breakdown of the participating banks is shown in Table 1 (for a detailed list of participating banks see Annex 1). The methodological notes contained in the questionnaire can be found in Annex 2.
Compared with 2011, the panel of 172 banks represents a net increase by two counterparties. Estonia is represented in the survey for the first time, with three banks. One more Italian bank, one more Maltese bank and two more Swiss banks were added, while two Spanish banks, one Greek bank, one British bank and one Lithuanian bank were no longer included.
The purpose of the study is to highlight the main trends affecting the structure of the euro money market. For the convenience of users, this study for the first time releases absolute turnover data, as well as additional information that is useful to keep in mind when interpreting the turnover data. The survey is based not only on turnover data but also features qualitative questions, the results of which are weighted by the turnover data provided by the respondents. The number of banks participating in the successive annual surveys varies slightly and also changes from one market segment to another, as not all banks are active in all segments of the money market. Hence two types of samples were used for the analysis, depending on the time frame. The first sample group, which was used to analyse the evolution of the euro money market over the last two years, includes all reporting banks (i.e. 172 banks). The second group, which was used for a longer-term analysis of the period since 2002, includes 105 banks and is called the “constant panel of banks”.3
Three panel banks are from Switzerland.2 When the survey was first conducted in 2000 the constant panel consisted of 85 banks. In the 2006 study, 29 banks were added to this 3 constant panel for the period from 2002 onwards to make the analysis more complete. Some further modifications were made to the constant panel in the euro money market study of 2008, when it was reduced from 114 to 109 banks: seven banks which had not taken part in the survey since 2006 were removed and two others added. In 2009, as a consequence of mergers among members of the constant panel, the number formally dropped to 105. The composition of the constant panel is the same for all market segments.
Table 1 country breakdown of participating banks in 2012
Austria 8 Latvia 4Belgium 3 Lithuania 3Bulgaria 4 Luxemburg 3Cyprus 3 Malta 5Czech Republic 8 Netherlands 6Denmark 1 Poland 12Estonia 3 Portugal 14Finland 2 Romania 3France 9 Slovakia 2Germany 17 Slovenia 3Greece 7 Spain 13Hungary 3 Sweden 3Ireland 6 Switzerland 3Italy 8 United Kingdom 16
Total 172
8ECBEuro Money Market StudyDecember 20128
Finally, in addition to the results of the Euro money market survey (EMMS), other data sources have been used. The section on the monetary policy environment in 2011 and 2012 (Section 2) elaborates on data from the ECB on the use of the deposit facility and the use of collateral in Eurosystem monetary policy operations. The section on the secured market (Section 4) draws on data from the International Capital Market Association (ICMA) survey; Box 4 draws on data from Eurex Repo. The box on money market funds in Section 5 uses some data from Fitch Ratings; the futures and options markets section (Section 6) relies also on data published by New York Stock Exchange - London International Financial Futures and Options Exchange (NYSE.liffe Euronext) and for EURIBOR data on the European Banking Federation (EBF); the section on the short-term securities market (Section 7) analyses data from ECB securities issues statistics, ECB Short-Term European Paper (STEP) statistics, the Banque de France and Dealogic; finally the section on cross-market analysis (Section 8) includes data from Bloomberg.
2 ThE MONETARY pOlicY ENviRONMENT iN 2011 AND 2012
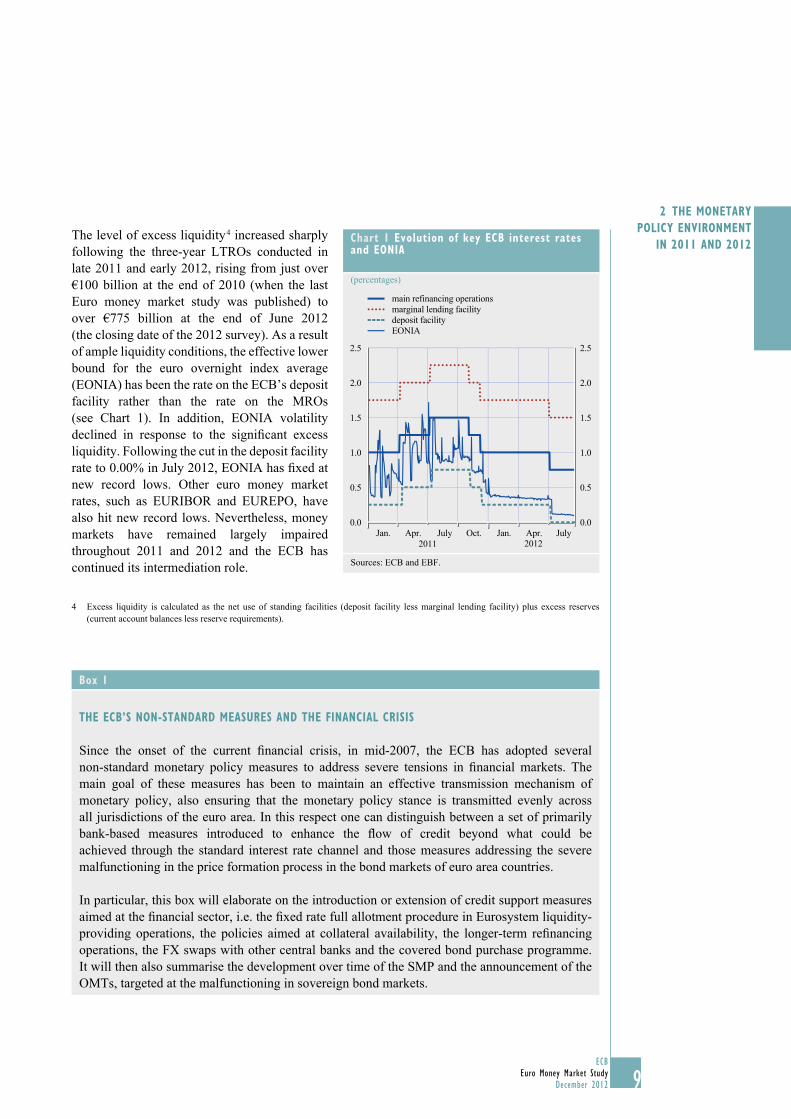
Against the backdrop of higher energy and commodity prices and a positive underlying momentum of economic growth, the Governing Council of the ECB raised its policy rates by 25 basis points in both April and July of 2011, the first changes since May 2009. This brought the minimum bid rate on the main refinancing operations (MROs) to 1.50% and the rates on the marginal lending and deposit facilities to 2.25% and 0.75% respectively (see Chart 1). As financial market conditions deteriorated and inflationary pressures eased, the Governing Council implemented two consecutive 25 basis points reductions in its key interest rates, in November and December 2011. Policy rates remained unchanged until July 2012, when the Governing Council reduced its policy rates by a further 25 basis points to a new record low, amid continued dampening of inflationary pressures over the policy-relevant horizon. This decision brought the rate on the MROs down to 0.75% and the rates on the marginal lending and deposit facilities to 1.50% and 0.00% respectively. The width of the interest rate corridor has remained unchanged since May 2009 at 150 basis points.
In addition to adjusting interest rates to ensure price stability over the medium term, the ECB continued to implement a number of non-standard policy measures to repair the monetary policy transmission mechanism (see Box 1). The fixed rate tender procedure with full allotment for MROs and longer-term refinancing operations (LTROs) was extended until at least 9 July 2013. As banks’ funding conditions deteriorated amid heightened financial market tensions, the ECB conducted its first ever three-year LTRO in December 2011, which was followed by a second in February 2012. The Governing Council announced measures to increase collateral availability in December 2011, and in June and September 2012. In addition, in December 2011 the Governing Council halved the reserve requirement ratio from 2% to 1% of relevant liabilities.
In October 2011, the Governing Council announced a second covered bond purchase programme for the intended amount of €40 billion. The Securities Markets Programme (SMP) remained in place throughout most of the review period, but was terminated on 6 September 2012 following the Governing Council’s decision to introduce Outright Monetary Transactions (OMTs), i.e. outright transactions in secondary sovereign bond markets with the aim of safeguarding an appropriate monetary policy transmission and the singleness of the ECB’s monetary policy. OMTs will enable the ECB to address severe distortions in government bond markets which originate from, in particular, unfounded fears on the part of investors of the reversibility of the euro.
9ECB
Euro Money Market StudyDecember 2012 9
2 ThE MONETARY pOlicY ENviRONMENT
iN 2011 AND 2012The level of excess liquidity 4 increased sharply following the three-year LTROs conducted in late 2011 and early 2012, rising from just over €100 billion at the end of 2010 (when the last Euro money market study was published) to over €775 billion at the end of June 2012 (the closing date of the 2012 survey). As a result of ample liquidity conditions, the effective lower bound for the euro overnight index average (EONIA) has been the rate on the ECB’s deposit facility rather than the rate on the MROs (see Chart 1). In addition, EONIA volatility declined in response to the signifi cant excess liquidity. Following the cut in the deposit facility rate to 0.00% in July 2012, EONIA has fi xed at new record lows. Other euro money market rates, such as EURIBOR and EUREPO, have also hit new record lows. Nevertheless, money markets have remained largely impaired throughout 2011 and 2012 and the ECB has continued its intermediation role.
Excess liquidity is calculated as the net use of standing facilities (deposit facility less marginal lending facility) plus excess reserves 4 (current account balances less reserve requirements).
chart 1 Evolution of key Ecb interest rates and EONiA
(percentages)
0.0
1.5
1.0
0.5
2.0
2.5
0.0
1.5
1.0
0.5
2.0
2.5
Jan. Apr. July Oct. Jan. Apr. July
EONIA
main refinancing operationsmarginal lending facilitydeposit facility
2011 2012
Sources: ECB and EBF.
box 1
ThE Ecb’S NON-STANDARD MEASURES AND ThE fiNANciAl cRiSiS
Since the onset of the current fi nancial crisis, in mid-2007, the ECB has adopted several non-standard monetary policy measures to address severe tensions in fi nancial markets. The main goal of these measures has been to maintain an effective transmission mechanism of monetary policy, also ensuring that the monetary policy stance is transmitted evenly across all jurisdictions of the euro area. In this respect one can distinguish between a set of primarily bank-based measures introduced to enhance the fl ow of credit beyond what could be achieved through the standard interest rate channel and those measures addressing the severe malfunctioning in the price formation process in the bond markets of euro area countries.
In particular, this box will elaborate on the introduction or extension of credit support measures aimed at the fi nancial sector, i.e. the fi xed rate full allotment procedure in Eurosystem liquidity-providing operations, the policies aimed at collateral availability, the longer-term refi nancing operations, the FX swaps with other central banks and the covered bond purchase programme. It will then also summarise the development over time of the SMP and the announcement of the OMTs, targeted at the malfunctioning in sovereign bond markets.
10ECBEuro Money Market StudyDecember 201210
Fixed rate full allotment regime
Since the publication of the last money market study in December 2010, the ECB has successively announced the extension of the fixed rate full allotment regime initially introduced in October 2008 for all MROs, special-term refinancing operations with a maturity of one maintenance period, and LTROs. In the case of the LTROs, the rate is fixed at the average rate of the MROs conducted during the life of the respective LTRO. The last announcement in this regard dates from 6 December 2012, when the ECB said it would extend this regime at least until 9 July 2013.
Collateral rules
Also since the publication of the last Euro money market study, the ECB has decided on a number of changes in collateral eligibility requirements and risk control measures. Such changes include refinements to the Eurosystem collateral framework for the implementation of monetary policy but also measures to expand the framework in order to increase collateral availability for counterparties. For a detailed description of the changes in collateral eligibility requirements and the use of collateral in Eurosystem monetary policy operations see Box 2.
Longer-term refinancing operations
After the introduction of very long-term operations and the subsequent conduct of three one-year longer-term refinancing operations (LTROs) in 2009 additional non-regular LTROs were conducted and the maturity was further lengthened. These decisions were aimed at enhancing credit support by providing stable and longer-term bank funding. More specifically, on 4 August 2011 the ECB announced a six-month LTRO. On 6 October 2011 two additional LTROs were announced, one with a maturity of around 12 months to take place in October 2011 and the other with a maturity of approximately 13 months to take place in December 2011.
On 8 December 2011, the ECB announced the conduct of two three-year LTROs, one in December 2011 and the other in February 2012, with the embedded option of early repayment after one year.1
Swap agreements with other central banks
On 15 September 2011 the ECB announced, in coordination with other major central banks, the re-introduction of three-month US dollar liquidity-providing operations covering the end of the year, with the same procedure as for the weekly seven-day US dollar liquidity-providing operations. These operations were initially introduced in October 2008 to address elevated pressures in the short-term US dollar funding markets. They continued to be carried out as fixed rate full allotment tenders in the form of repurchase agreements against collateral eligible for Eurosystem credit operations. On 30 November 2011 the swap agreement with the Federal Reserve System had been further extended until 1 February 2013. Also, the pricing on the existing temporary US dollar liquidity swap arrangements was lowered by 50 basis points, which resulted in a spread of 50 basis points over the US dollar OIS rate.
1 The first date for early repayment of the first three-year LTRO is 30 January 2013. This first three-year LTRO replaced the second one-year operation of 2011 as initially announced on 6 October 2011; the ECB also gave banks the option to shift the amounts obtained in the one-year LTRO settled in October 2011 into the first three-year LTRO.
11ECB
Euro Money Market StudyDecember 2012 11
2 ThE MONETARY pOlicY ENviRONMENT
iN 2011 AND 2012In addition, on 30 November 2011 the ECB, together with the Federal Reserve System, the Bank of England, the Bank of Canada, the Bank of Japan and the Swiss National Bank, announced the establishment of temporary bilateral liquidity swap arrangements in order to provide liquidity in each jurisdiction in any of their currencies if market conditions so justified. On 13 December 2012 the ECB extended these existing swap agreements with other central banks until 1 February 2014.
Covered bond purchase programme
The aim of the covered bond purchase programme (CBPP), first introduced in May 2009, has been to support a specific financial market segment that is important for the funding of banks and that had been particularly affected by the financial crisis. Purchases under the first CBPP, with an intended amount of €60 billion, were completed in June 2010. On 6 October 2011, the Governing Council announced a new covered bond purchase programme (CBPP2) under which the Eurosystem would directly purchase covered bonds in the primary and secondary markets for an intended amount of €40 billion between November 2011 and October 2012. The Eurosystem central banks intend to hold these covered bonds until maturity.
Other measures
On 8 December 2011 the ECB announced the discontinuation of the fine-tuning liquidity-absorbing operations which had been carried out on a regular basis on the last day of reserve maintenance periods. In addition, the reserve ratio was halved from 2% to 1%. As a consequence of the full allotment policy applied in the ECB’s main refinancing operations and the way banks were using this option, the system of reserve requirements was not needed to the same extent as under normal circumstances to steer money market conditions.
Securities Markets Programme
Besides these primarily bank-based enhanced credit support measures designed to tackle the malfunctioning of the transmission mechanism in the financial sector, the ECB also adopted additional non-standard monetary policy measures to address the severe malfunctioning in the price formation process in the bond markets of euro area countries.
The Securities Market Programme (SMP), announced on 10 May 2010, remained in operation until 6 September 2012, when it was terminated following the introduction of OMTs. Already between March and August 2011 and after February 2012 no purchases had been conducted under the SMP. The liquidity injected through the SMP will continue to be absorbed through the weekly seven-day liquidity-absorbing operations and, in addition, the securities in the SMP portfolio will be held to maturity.
Outright Monetary Transactions
The ECB on 2 August 2012 announced that, within its mandate to maintain price stability over the medium term and in observance of its independence in determining monetary policy, it may undertake outright open market operations of a size adequate to reach its objective. On 6 September 2012 the ECB then announced the technical features for the possible implementation of Outright Monetary Transactions (OMTs), which are aimed at safeguarding an appropriate monetary policy transmission and the singleness of its monetary policy. OMTs will enable the ECB to address severe distortions in government bond markets which originate from, in particular,
12ECBEuro Money Market StudyDecember 201212
Turning to monetary policy in the United States, the federal funds target rate has remained at 0-0.25%, since December 2008. The discount rate for primary credit remains at 0.75%, unchanged since February 2010. In September 2011, the Federal Open Market Committee (FOMC) of the Federal Reserve System announced a maturity extension programme, commonly known as “Operation Twist”, in order to put downward pressure on longer-term interest rates and help to make broader financial conditions more accommodative. Under this programme, which initially ran from September 2011 to June 2012, the FOMC extended the duration of its balance sheet by selling USD 400 billion of shorter-term Treasury securities and buying an equal amount of longer-term Treasury securities. In June 2012, the FOMC extended this programme through the end of 2012 and increased its size by an additional USD 267 billion. Since September 2011 the Federal Reserve has also pursued a policy of reinvesting principal payments from its holdings of agency debt and agency mortgage-backed securities (MBS) in agency MBS. In September 2012, the FOMC announced that it would begin a new monetary stimulus programme in which it would buy USD 40 billion of MBS per month to support a stronger economic recovery. It also said it expected a highly accommodative stance of monetary policy to remain appropriate for a considerable time after the economic recovery strengthened and that it anticipated that exceptionally low levels for the federal funds rate were likely to be warranted at least through mid-2015.
Since late 2008, the Bank of Japan’s policy rate has remained in the range of 0-0.1%. To mitigate the impact of the financial crisis, the central bank also adopted a range of measures to support and strengthen economic growth. These measures include asset purchases (including Japanese government bonds and treasury securities, commercial paper, corporate bonds and exchange-traded funds) aimed at encouraging a decline in longer-term market interest rates and various risk premia. The size of the Bank of Japan’s asset purchase programme was increased throughout the review period, expanding to JPY 91 trillion in October 2012 from its initial size of JPY 35 trillion in October 2010. Also in October 2012, the Bank of Japan introduced the “Stimulating Bank Lending Facility”, designed to support bank lending growth.
The Bank of England has kept its policy rate on hold at 0.5% since March 2009. Like other major central banks, it has pursued an asset purchase programme. The aim of the programme is to inject money directly into the economy in order to boost nominal demand. In October 2011, the Bank of England increased the size of the programme by GBP 75 billion to GBP 275 billion, and in February and July 2012 by a further GBP 50 billion, bringing the total size of the programme to GBP 375 billion. In December 2011, it introduced the Extended Collateral Term Repo Facility, designed to mitigate risks to financial stability arising from a market-wide shortage of short-term sterling liquidity. This facility, which offers sterling liquidity against a wide range of collateral, was activated in June 2012. In July 2012, the Bank of England also launched, in conjunction with the Treasury, the Funding for Lending Scheme, which is designed to incentivise banks and building societies to boost their lending to UK households and non-financial companies.
unfounded fears on the part of investors of the reversibility of the euro. Purchases will take place in secondary markets for sovereign bonds in the euro area, with a focus on the shorter end of the yield curve (maturities between one and three years) without any quantitative ceiling, and will be fully sterilised. OMTs are decided in full independence. Member States are only eligible for purchases if they are subject to the strict and effective conditionality attached to a European Financial Stability Facility/European Stability Mechanism (EFSF/ESM) macroeconomic adjustment programme or precautionary programme, or in the case of Member States already under an EU-IMF adjustment programme, once a country has been regaining bond market access.
13ECB
Euro Money Market StudyDecember 2012 13
2 ThE MONETARY pOlicY ENviRONMENT
iN 2011 AND 2012box 2
chANgES iN cOllATERAl EligibiliTY REqUiREMENTS AND RiSK cONTROl MEASURES AND DEvElOpMENTS iN ThE USE Of cOllATERAl iN EUROSYSTEM MONETARY pOlicY OpERATiONS
A Measures decided by the Eurosystem
Over the period of two years since the last Euro money market study was published, the ECB decided on a number of changes in collateral eligibility requirements and risk control measures.
On 16 December 2010 the ECB further refined the framework for the implementation of monetary policy in the euro area. Additional exceptions from the “close link prohibition” relating to non-UCITS-compliant 1 covered bonds that (i) fulfil all criteria applicable to asset-backed securities, (ii) are backed by commercial mortgage loans, and (iii) are denominated in euro were introduced. These changes complemented the already introduced criteria for non-UCITS-compliant covered bonds with real estate loans as underlying assets. The intention to introduce loan-by-loan information requirements for asset-backed securities (ABSs) in the Eurosystem collateral framework was also announced.
On 21 September 2011 the ECB published an updated consolidated version of “The implementation of monetary policy in the euro area: General documentation on Eurosystem monetary policy instruments and procedures” (referred to as the “General Documentation”). The General Documentation, which came into force on 1 January 2012, abolished the requirement that debt instruments issued by credit institutions, other than covered bank bonds, must be admitted to trading on a regulated market to be eligible for Eurosystem monetary policy operations. At the same time, the Eurosystem risk control measures for some marketable assets were amended. Specifically, the Eurosystem reduced the limit for the use of unsecured debt instruments issued by a credit institution or by any other entity with which the credit institution has close links. Such assets may now only be used as collateral to the extent that the value assigned does not exceed 5% of the total value of collateral submitted (instead of 10%, as previously stipulated).
On 8 December 2011 the Governing Council decided on additional enhanced credit support measures to support bank lending and liquidity in the euro area money market. In particular, it decided to increase collateral availability by (i) reducing the rating threshold for certain ABSs and (ii) allowing NCBs, as a temporary solution, to accept as collateral additional performing credit claims (i.e. bank loans) that satisfy specific eligibility criteria. The first measure became effective with the relevant legal acts published on 19 December 2011, and the Governing Council approved the eligibility criteria for additional credit claims on 9 February 2012.
At the end of February 2012, the Governing Council decided to temporarily suspend the eligibility of marketable debt instruments issued or fully guaranteed by the Hellenic Republic for use as collateral in Eurosystem monetary policy operations. This decision took into account the rating of the Hellenic Republic as a result of the launch of the private sector involvement offer. On 8 March 2012, the activation of the buy back scheme was acknowledged, and hence the aforementioned Greek debt instruments were again accepted as collateral in Eurosystem credit operations, without applying the minimum credit rating threshold for collateral eligibility until
1 UCITS stands for “undertakings for collective investment in transferable securities”; for an explanation please refer to the glossary in Annex 4.
14ECBEuro Money Market StudyDecember 201214
further notice. This buy back scheme had been agreed by the Heads of State or Government of the euro area on 21 July 2011 and confirmed on 26 October 2011, together with a number of other measures aimed at assisting Greece in its adjustment programme. The scheme was backed up by bonds issued by the EFSF with a nominal value of €35 billion. However, it was announced on 20 July 2012 that due to the expiration of the buy back scheme for marketable debt instruments issued or fully guaranteed by the Hellenic Republic on 25 July 2012, bonds issued or guaranteed by the Greek government would, until further notice, become ineligible for use as collateral in Eurosystem monetary policy operations.
On 20 June 2012 the Governing Council decided on additional measures to improve the access of the banking sector to Eurosystem operations in order to further support the provision of credit to households and non-financial corporations. It reduced the rating threshold and amended the eligibility requirements for certain ABSs, and also broadened the scope of the measures to increase collateral availability which were introduced on 8 December 2011 and which remain applicable.
On 6 July 2012, in order to increase transparency in the ABS market for market participants and to facilitate the risk assessment of ABSs as collateral used by Eurosystem counterparties in monetary policy operations, the ECB announced further details relating to the implementation of loan-level data reporting requirements for ABSs, as the preparatory work had been concluded. The Governing Council also took note of the creation of a market-led European DataWarehouse, a single data repository that could be used for the handling of loan-level data reporting and to standardise reporting and implementation. Moreover, the mandatory provision of loan-by-loan information for ABSs, as well as details relating to data reporting, were announced. These requirements will be introduced by means of an amendment to the Guideline of the ECB of 20 September 2011 on monetary policy instruments and procedures of the Eurosystem (recast) (ECB/2011/14).
On 6 September 2012 the Governing Council decided on additional measures to preserve collateral availability for counterparties in order to maintain their access to the Eurosystem’s liquidity-providing operations. In particular, it decided to suspend the application of the minimum credit rating threshold in the collateral eligibility requirements for the purposes of the Eurosystem’s credit operations in the case of marketable debt instruments issued or guaranteed by the central government, and credit claims granted to or guaranteed by the central government, of countries that are eligible for OMTs or are under an EU-IMF programme and comply with the attached conditionality as assessed by the Governing Council. Moreover, it adopted the decision that marketable debt instruments denominated in currencies other than the euro, namely the US dollar, the pound sterling and the Japanese yen, and issued and held in the euro area, would be eligible to be used as collateral in Eurosystem credit operations, with appropriate valuation markdowns, until further notice. The latter measure came into force with the relevant legal act published on 17 October 2012.
In September 2012 the ECB started to publish more frequent collateral data: data on eligible assets, as well as the average value of marketable and non-marketable assets deposited by counterparties as collateral for Eurosystem credit operations, are now published on a quarterly as well as on an annual basis (see the “Payments & Markets” section of the ECB’s website, under “Collateral”).
On 27 November 2012, the ECB announced the rescheduling of the loan-level data reporting requirements in order to facilitate a smooth implementation (see ECB’s press release dated
15ECB
Euro Money Market StudyDecember 2012 15
2 ThE MONETARY pOlicY ENviRONMENT
iN 2011 AND 201227 November 2012 for further details). Finally, on 28 November 2012 the ECB published amendments to the General Documentation: the inclusion of the reporting requirements related to the loan-level data for ABSs, a streamlining of the coupon types for eligible marketable instruments, as well as technical changes regarding ABSs, covered bonds and the Eurosystem Credit Assessment Framework (ECAF). These changes, which are aimed at streamlining and strengthening the collateral and risk control framework in place for Eurosystem operations, are laid down in Guideline ECB/2012/25 amending Guideline ECB/2011/14.
B Evolution of the amount of posted collateral
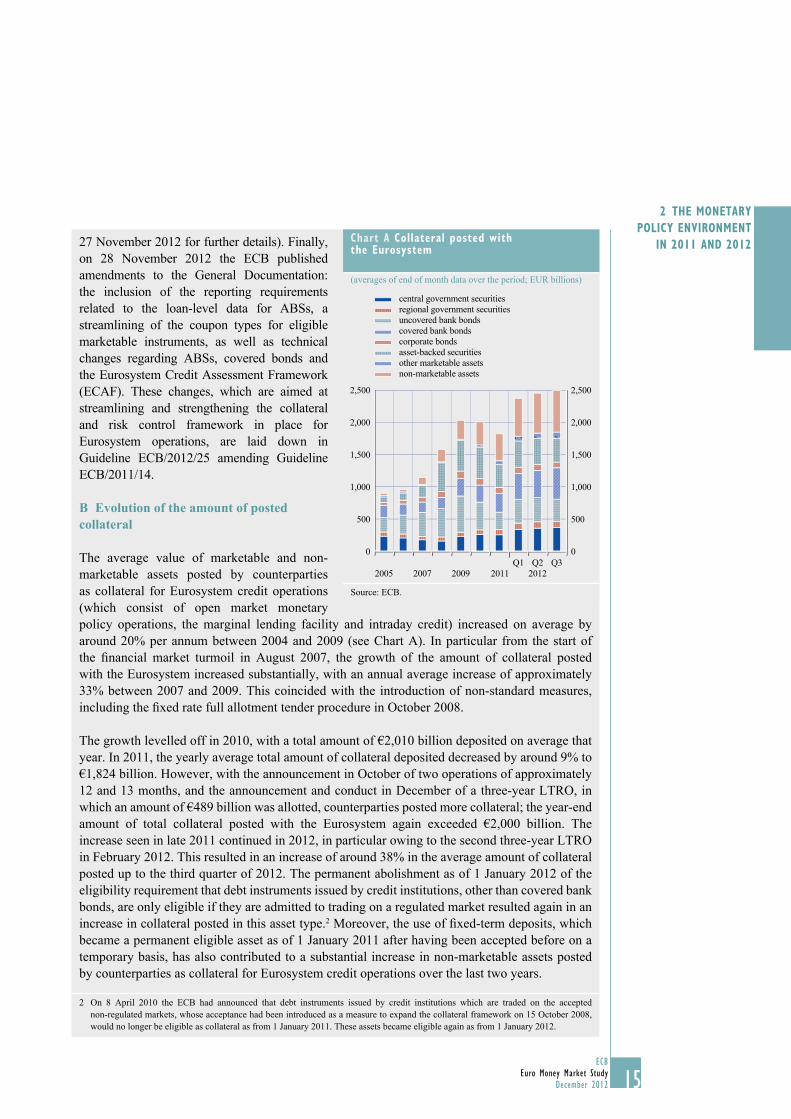
The average value of marketable and non-marketable assets posted by counterparties as collateral for Eurosystem credit operations (which consist of open market monetary policy operations, the marginal lending facility and intraday credit) increased on average by around 20% per annum between 2004 and 2009 (see Chart A). In particular from the start of the fi nancial market turmoil in August 2007, the growth of the amount of collateral posted with the Eurosystem increased substantially, with an annual average increase of approximately 33% between 2007 and 2009. This coincided with the introduction of non-standard measures, including the fi xed rate full allotment tender procedure in October 2008.
The growth levelled off in 2010, with a total amount of €2,010 billion deposited on average that year. In 2011, the yearly average total amount of collateral deposited decreased by around 9% to €1,824 billion. However, with the announcement in October of two operations of approximately 12 and 13 months, and the announcement and conduct in December of a three-year LTRO, in which an amount of €489 billion was allotted, counterparties posted more collateral; the year-end amount of total collateral posted with the Eurosystem again exceeded €2,000 billion. The increase seen in late 2011 continued in 2012, in particular owing to the second three-year LTRO in February 2012. This resulted in an increase of around 38% in the average amount of collateral posted up to the third quarter of 2012. The permanent abolishment as of 1 January 2012 of the eligibility requirement that debt instruments issued by credit institutions, other than covered bank bonds, are only eligible if they are admitted to trading on a regulated market resulted again in an increase in collateral posted in this asset type.2 Moreover, the use of fi xed-term deposits, which became a permanent eligible asset as of 1 January 2011 after having been accepted before on a temporary basis, has also contributed to a substantial increase in non-marketable assets posted by counterparties as collateral for Eurosystem credit operations over the last two years.
2 On 8 April 2010 the ECB had announced that debt instruments issued by credit institutions which are traded on the accepted non-regulated markets, whose acceptance had been introduced as a measure to expand the collateral framework on 15 October 2008, would no longer be eligible as collateral as from 1 January 2011. These assets became eligible again as from 1 January 2012.
chart A collateral posted with the Eurosystem
(averages of end of month data over the period; EUR billions)
0
500
1,000
1,500
2,000
2,500
0
500
1,000
1,500
2,000
2,500
2005 2007 2009 2011Q2Q1 Q3
2012
non-marketable assetsother marketable assetsasset-backed securitiescorporate bondscovered bank bondsuncovered bank bondsregional government securitiescentral government securities
Source: ECB.
16ECBEuro Money Market StudyDecember 201216
3 ThE UNSEcURED MARKET
3.1 TURNOvER ANAlYSiS
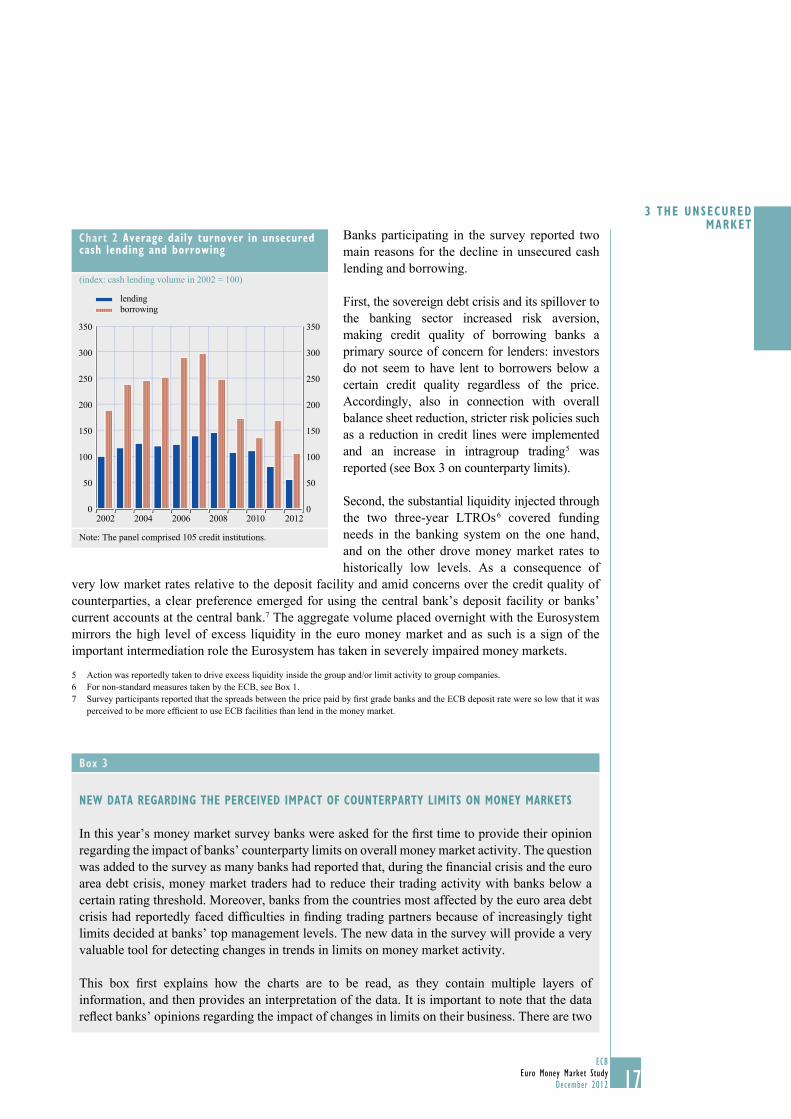
In 2012 average daily turnover fi gures for unsecured cash lending and borrowing reached their lowest level since 2002 (see Chart 2). Unsecured lending contracted for the second year in a row, and declined by 31% year on year. Borrowing activity fell by 38% in 2012 after increasing in 2011 for the fi rst time in four years.
Unlike in previous years, declining unsecured volumes were not balanced with an increase in secured turnover, which decreased for the fi rst time since 2008. However, the decline in secured volumes was less pronounced than in the unsecured segment (see Section 4).
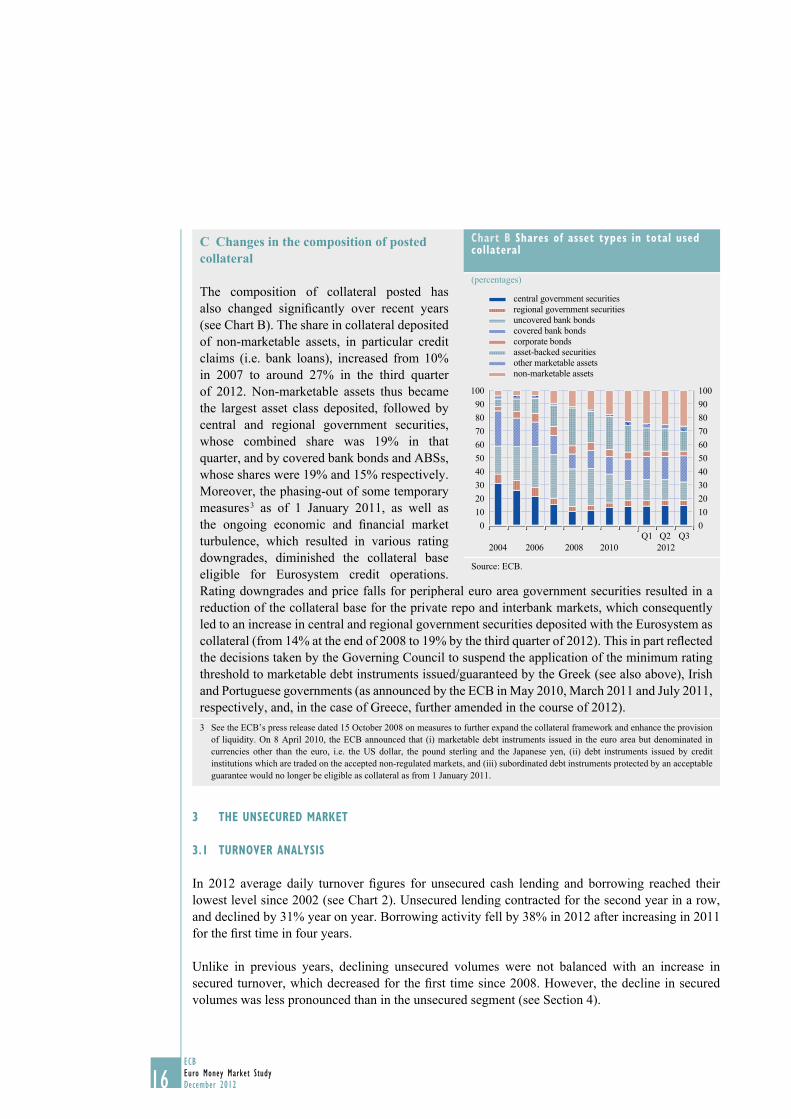
C Changes in the composition of posted collateral
The composition of collateral posted has also changed signifi cantly over recent years (see Chart B). The share in collateral deposited of non-marketable assets, in particular credit claims (i.e. bank loans), increased from 10% in 2007 to around 27% in the third quarter of 2012. Non-marketable assets thus became the largest asset class deposited, followed by central and regional government securities, whose combined share was 19% in that quarter, and by covered bank bonds and ABSs, whose shares were 19% and 15% respectively. Moreover, the phasing-out of some temporary measures 3 as of 1 January 2011, as well as the ongoing economic and fi nancial market turbulence, which resulted in various rating downgrades, diminished the collateral base eligible for Eurosystem credit operations. Rating downgrades and price falls for peripheral euro area government securities resulted in a reduction of the collateral base for the private repo and interbank markets, which consequently led to an increase in central and regional government securities deposited with the Eurosystem as collateral (from 14% at the end of 2008 to 19% by the third quarter of 2012). This in part refl ected the decisions taken by the Governing Council to suspend the application of the minimum rating threshold to marketable debt instruments issued/guaranteed by the Greek (see also above), Irish and Portuguese governments (as announced by the ECB in May 2010, March 2011 and July 2011, respectively, and, in the case of Greece, further amended in the course of 2012). 3 See the ECB’s press release dated 15 October 2008 on measures to further expand the collateral framework and enhance the provision
of liquidity. On 8 April 2010, the ECB announced that (i) marketable debt instruments issued in the euro area but denominated in currencies other than the euro, i.e. the US dollar, the pound sterling and the Japanese yen, (ii) debt instruments issued by credit institutions which are traded on the accepted non-regulated markets, and (iii) subordinated debt instruments protected by an acceptable guarantee would no longer be eligible as collateral as from 1 January 2011.
chart b Shares of asset types in total used collateral
(percentages)
0102030405060708090
100
0102030405060708090100
non-marketable assetsother marketable assetsasset-backed securitiescorporate bondscovered bank bondsuncovered bank bondsregional government securitiescentral government securities
2004 2006 2008 2010 2012Q1 Q2 Q3
Source: ECB.
17ECB
Euro Money Market StudyDecember 2012 17
3 ThE UNSEcURED MARKET
Banks participating in the survey reported two main reasons for the decline in unsecured cash lending and borrowing.
First, the sovereign debt crisis and its spillover to the banking sector increased risk aversion, making credit quality of borrowing banks a primary source of concern for lenders: investors do not seem to have lent to borrowers below a certain credit quality regardless of the price. Accordingly, also in connection with overall balance sheet reduction, stricter risk policies such as a reduction in credit lines were implemented and an increase in intragroup trading 5 was reported (see Box 3 on counterparty limits).
Second, the substantial liquidity injected through the two three-year LTROs 6 covered funding needs in the banking system on the one hand, and on the other drove money market rates to historically low levels. As a consequence of
very low market rates relative to the deposit facility and amid concerns over the credit quality of counterparties, a clear preference emerged for using the central bank’s deposit facility or banks’ current accounts at the central bank.7 The aggregate volume placed overnight with the Eurosystem mirrors the high level of excess liquidity in the euro money market and as such is a sign of the important intermediation role the Eurosystem has taken in severely impaired money markets.
Action was reportedly taken to drive excess liquidity inside the group and/or limit activity to group companies.5 For non-standard measures taken by the ECB, see Box 1.6 Survey participants reported that the spreads between the price paid by fi rst grade banks and the ECB deposit rate were so low that it was 7 perceived to be more effi cient to use ECB facilities than lend in the money market.
chart 2 Average daily turnover in unsecured cash lending and borrowing
(index: cash lending volume in 2002 = 100)
0
50
100
150
200
250
300
350
0
50
100
150
200
250
300
350
2002 2004 2006 2008 2010 2012
lendingborrowing
Note: The panel comprised 105 credit institutions.
box 3
NEw DATA REgARDiNg ThE pERcEivED iMpAcT Of cOUNTERpARTY liMiTS ON MONEY MARKETS
In this year’s money market survey banks were asked for the fi rst time to provide their opinion regarding the impact of banks’ counterparty limits on overall money market activity. The question was added to the survey as many banks had reported that, during the fi nancial crisis and the euro area debt crisis, money market traders had to reduce their trading activity with banks below a certain rating threshold. Moreover, banks from the countries most affected by the euro area debt crisis had reportedly faced diffi culties in fi nding trading partners because of increasingly tight limits decided at banks’ top management levels. The new data in the survey will provide a very valuable tool for detecting changes in trends in limits on money market activity.
This box fi rst explains how the charts are to be read, as they contain multiple layers of information, and then provides an interpretation of the data. It is important to note that the data refl ect banks’ opinions regarding the impact of changes in limits on their business. There are two
18ECBEuro Money Market StudyDecember 201218
benefi ts of requesting qualitative information from banks. First, while their opinions implicitly contain information about changes in limits, banks are in general reluctant to provide explicit information about the counterparty limits they set or face. Second, limits are sometimes set in complex ways that make exact quantifi cation in a survey diffi cult. Banks were asked the question “Has your interbank money market trading changed during the reporting period because of changes in your risk limits?” The answers differentiate between impact on total turnover and impact on the number of counterparties. The data capture both opinions on how changes in limits have impacted on interbank activity (displayed as the total value of the column) and expectations regarding the future effects of limits in relation to the current opinion (i.e. the different colours of the column).
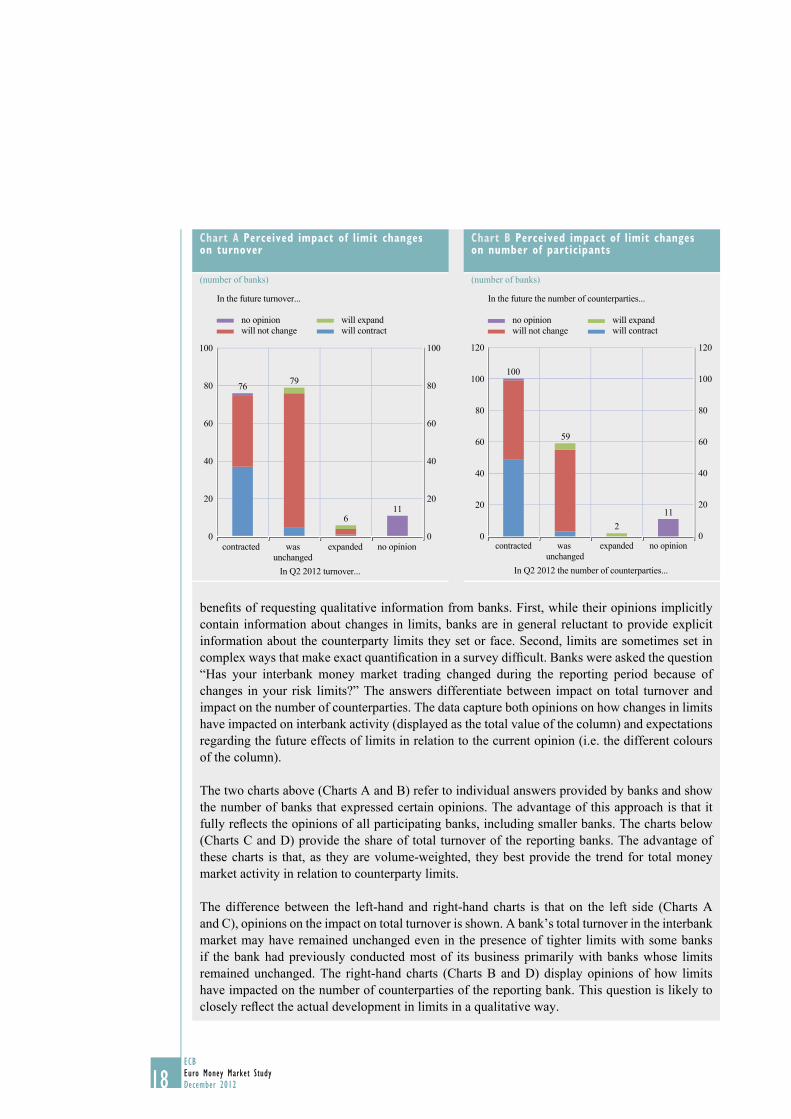
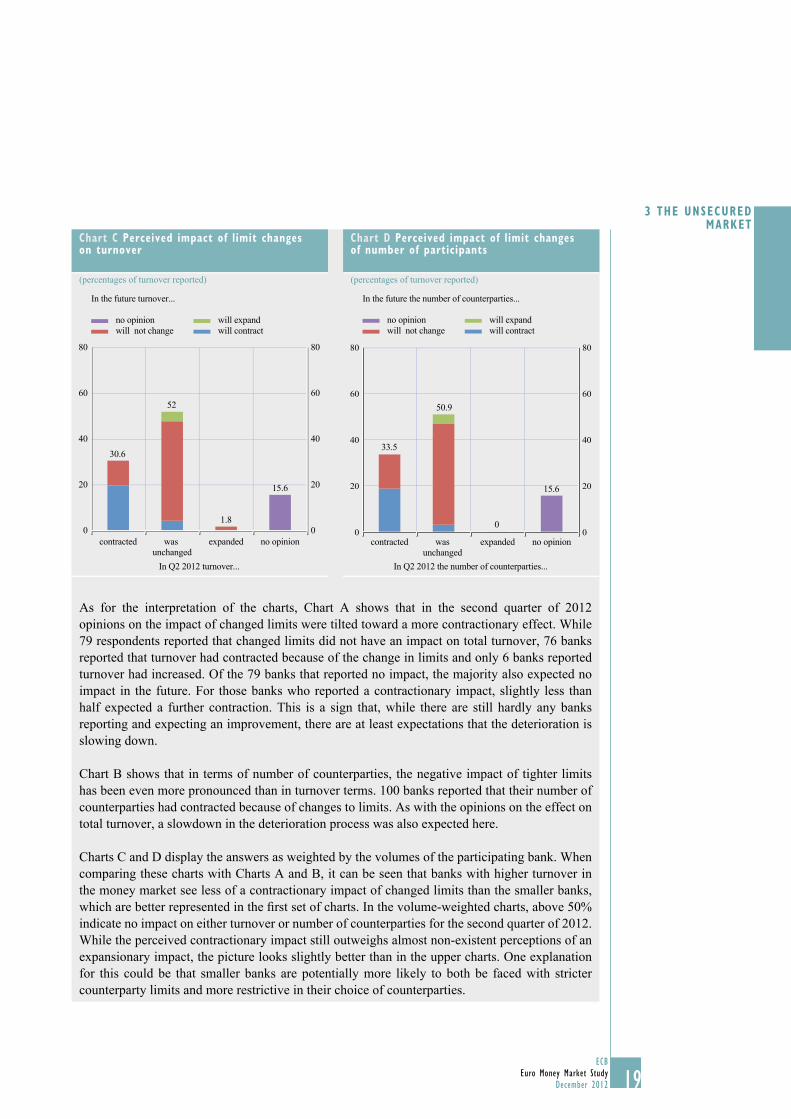
The two charts above (Charts A and B) refer to individual answers provided by banks and show the number of banks that expressed certain opinions. The advantage of this approach is that it fully refl ects the opinions of all participating banks, including smaller banks. The charts below (Charts C and D) provide the share of total turnover of the reporting banks. The advantage of these charts is that, as they are volume-weighted, they best provide the trend for total money market activity in relation to counterparty limits.
The difference between the left-hand and right-hand charts is that on the left side (Charts A and C), opinions on the impact on total turnover is shown. A bank’s total turnover in the interbank market may have remained unchanged even in the presence of tighter limits with some banks if the bank had previously conducted most of its business primarily with banks whose limits remained unchanged. The right-hand charts (Charts B and D) display opinions of how limits have impacted on the number of counterparties of the reporting bank. This question is likely to closely refl ect the actual development in limits in a qualitative way.
chart A perceived impact of limit changeson turnover
(number of banks)
0
20
40
60
80
100
0
20
40
60
80
100
will expandwill contract
no opinionwill not change
contracted was unchanged
expanded no opinion
In the future turnover...
In Q2 2012 turnover...
76 79
116
chart b perceived impact of limit changes on number of participants
(number of banks)
0
20
40
60
80
100
120
0
20
40
60
80
100
120
contracted was unchanged
expanded no opinion
no opinion will expandwill not change will contract
In the future the number of counterparties...
In Q2 2012 the number of counterparties...
100
59
211
19ECB
Euro Money Market StudyDecember 2012 19
3 ThE UNSEcURED MARKET
As for the interpretation of the charts, Chart A shows that in the second quarter of 2012 opinions on the impact of changed limits were tilted toward a more contractionary effect. While 79 respondents reported that changed limits did not have an impact on total turnover, 76 banks reported that turnover had contracted because of the change in limits and only 6 banks reported turnover had increased. Of the 79 banks that reported no impact, the majority also expected no impact in the future. For those banks who reported a contractionary impact, slightly less than half expected a further contraction. This is a sign that, while there are still hardly any banks reporting and expecting an improvement, there are at least expectations that the deterioration is slowing down.
Chart B shows that in terms of number of counterparties, the negative impact of tighter limits has been even more pronounced than in turnover terms. 100 banks reported that their number of counterparties had contracted because of changes to limits. As with the opinions on the effect on total turnover, a slowdown in the deterioration process was also expected here.
Charts C and D display the answers as weighted by the volumes of the participating bank. When comparing these charts with Charts A and B, it can be seen that banks with higher turnover in the money market see less of a contractionary impact of changed limits than the smaller banks, which are better represented in the fi rst set of charts. In the volume-weighted charts, above 50% indicate no impact on either turnover or number of counterparties for the second quarter of 2012. While the perceived contractionary impact still outweighs almost non-existent perceptions of an expansionary impact, the picture looks slightly better than in the upper charts. One explanation for this could be that smaller banks are potentially more likely to both be faced with stricter counterparty limits and more restrictive in their choice of counterparties.
chart c perceived impact of limit changes on turnover
(percentages of turnover reported)
0
20
40
60
80
0
20
40
60
80
contracted was unchanged
expanded no opinion
In the future turnover...
In Q2 2012 turnover...
no opinion will not change
will expand will contract
30.6
52
1.8
15.6
chart D perceived impact of limit changes of number of participants
(percentages of turnover reported)
0
20
40
60
80
0
20
40
60
80
contracted was unchanged
expanded no opinion
In the future the number of counterparties...
In Q2 2012 the number of counterparties...
will expand will contract
no opinion will not change
0
50.9
15.6
33.5
20ECBEuro Money Market StudyDecember 201220
3.2 MATURiTY ANAlYSiS
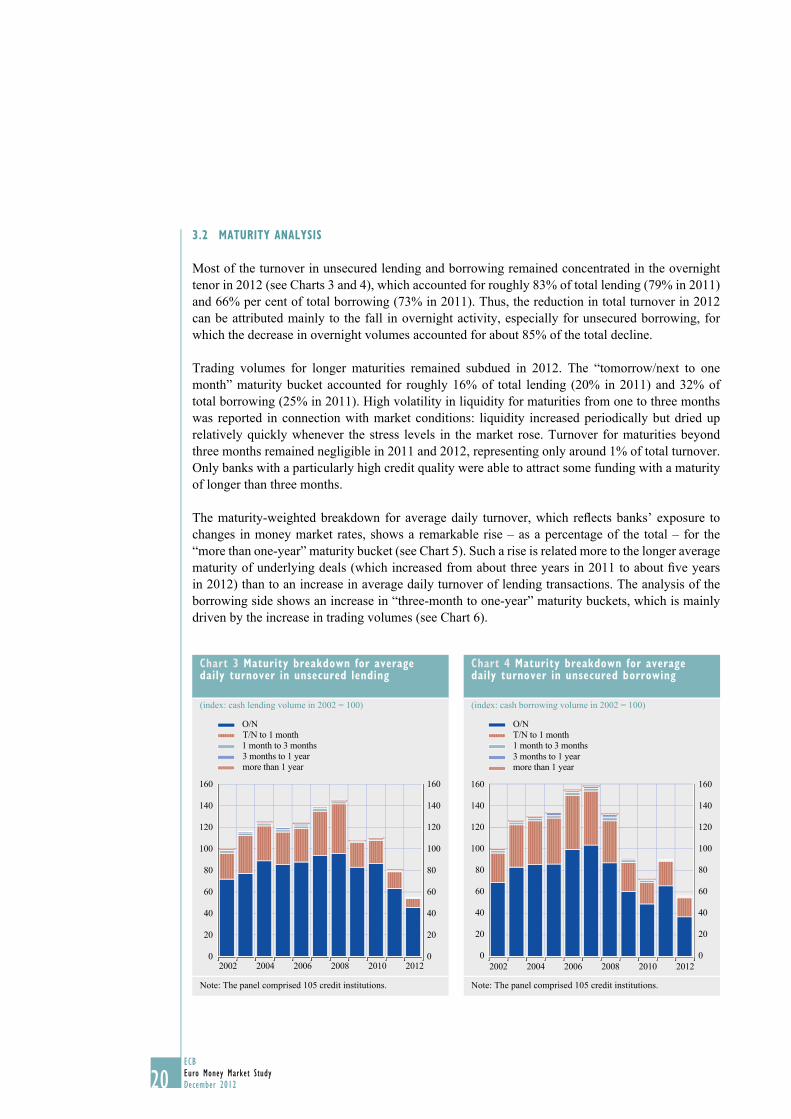
Most of the turnover in unsecured lending and borrowing remained concentrated in the overnight tenor in 2012 (see Charts 3 and 4), which accounted for roughly 83% of total lending (79% in 2011) and 66% per cent of total borrowing (73% in 2011). Thus, the reduction in total turnover in 2012 can be attributed mainly to the fall in overnight activity, especially for unsecured borrowing, for which the decrease in overnight volumes accounted for about 85% of the total decline.
Trading volumes for longer maturities remained subdued in 2012. The “tomorrow/next to one month” maturity bucket accounted for roughly 16% of total lending (20% in 2011) and 32% of total borrowing (25% in 2011). High volatility in liquidity for maturities from one to three months was reported in connection with market conditions: liquidity increased periodically but dried up relatively quickly whenever the stress levels in the market rose. Turnover for maturities beyond three months remained negligible in 2011 and 2012, representing only around 1% of total turnover. Only banks with a particularly high credit quality were able to attract some funding with a maturity of longer than three months.
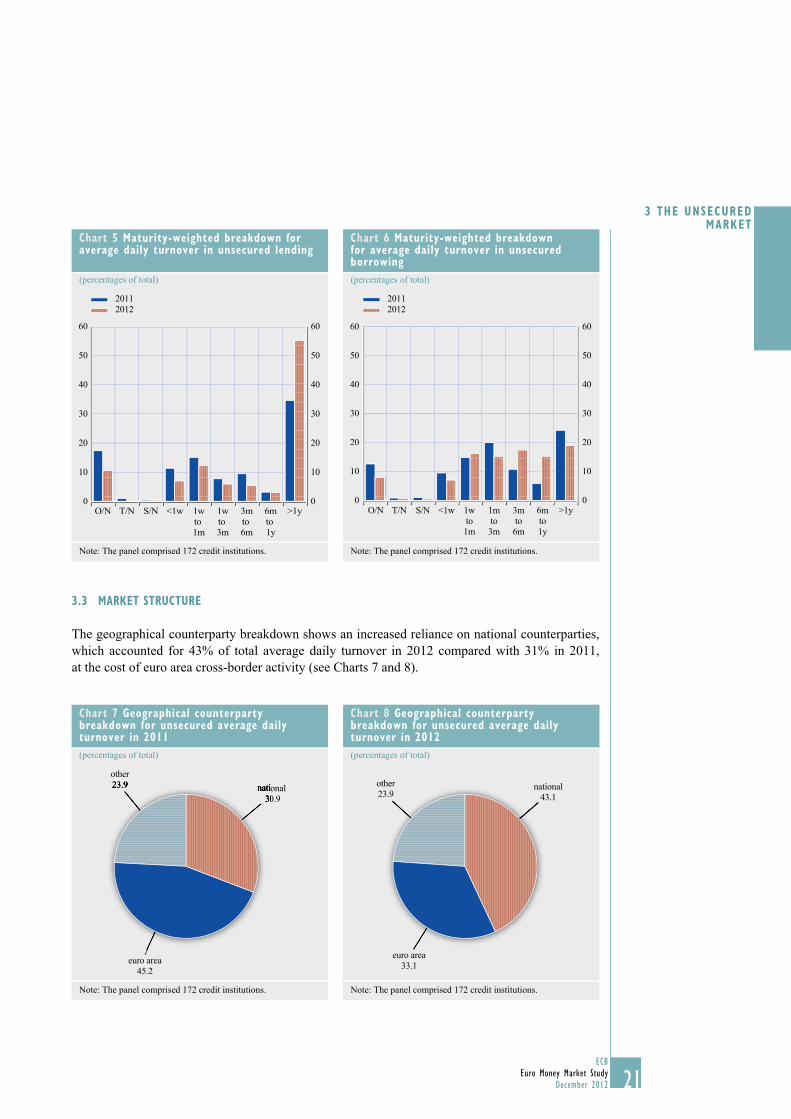
The maturity-weighted breakdown for average daily turnover, which refl ects banks’ exposure to changes in money market rates, shows a remarkable rise – as a percentage of the total – for the “more than one-year” maturity bucket (see Chart 5). Such a rise is related more to the longer average maturity of underlying deals (which increased from about three years in 2011 to about fi ve years in 2012) than to an increase in average daily turnover of lending transactions. The analysis of the borrowing side shows an increase in “three-month to one-year” maturity buckets, which is mainly driven by the increase in trading volumes (see Chart 6).
chart 3 Maturity breakdown for average daily turnover in unsecured lending
(index: cash lending volume in 2002 = 100)
0
20
40
60
80
100
120
140
160
0
20
40
60
80
100
120
140
160
O/NT/N to 1 month1 month to 3 months3 months to 1 yearmore than 1 year
2002 2004 2006 2008 2010 2012
Note: The panel comprised 105 credit institutions.
chart 4 Maturity breakdown for average daily turnover in unsecured borrowing
(index: cash borrowing volume in 2002 = 100)
0
20
40
60
80
100
120
140
160
0
20
40
60
80
100
120
140
160
O/NT/N to 1 month1 month to 3 months3 months to 1 yearmore than 1 year
2002 2004 2006 2008 2010 2012
Note: The panel comprised 105 credit institutions.
21ECB
Euro Money Market StudyDecember 2012 21
3 ThE UNSEcURED MARKET
3.3 MARKET STRUcTURE
The geographical counterparty breakdown shows an increased reliance on national counterparties, which accounted for 43% of total average daily turnover in 2012 compared with 31% in 2011, at the cost of euro area cross-border activity (see Charts 7 and 8).
chart 7 geographical counterparty breakdown for unsecured average daily turnover in 2011(percentages of total)
national 30.9
euro area45.2
other23.9 national
30.923.9
Note: The panel comprised 172 credit institutions.
chart 8 geographical counterparty breakdown for unsecured average daily turnover in 2012(percentages of total)
national43.1
euro area33.1
other23.9
Note: The panel comprised 172 credit institutions.
chart 5 Maturity-weighted breakdown for average daily turnover in unsecured lending
(percentages of total)
0
10
20
30
40
50
60
0
10
20
30
40
50
60
S/N <1w 1wto 1m
1wto 3m
3mto 6m
6mto 1y
O/N T/N >1y
20112012
Note: The panel comprised 172 credit institutions.
chart 6 Maturity-weighted breakdown for average daily turnover in unsecured borrowing(percentages of total)
0
10
20
30
40
50
60
0
10
20
30
40
50
60
20112012
<1w 1wto1m
1mto3m
3mto6m
6mto1y
>1yO/N T/N S/N
Note: The panel comprised 172 credit institutions.
22ECBEuro Money Market StudyDecember 201222
This trend refl ects an increased degree of malfunctioning and segmentation in the euro money market as a consequence of the sovereign debt crisis in late 2011 and early 2012 (for a focus on money market segmentation, see Box 9).
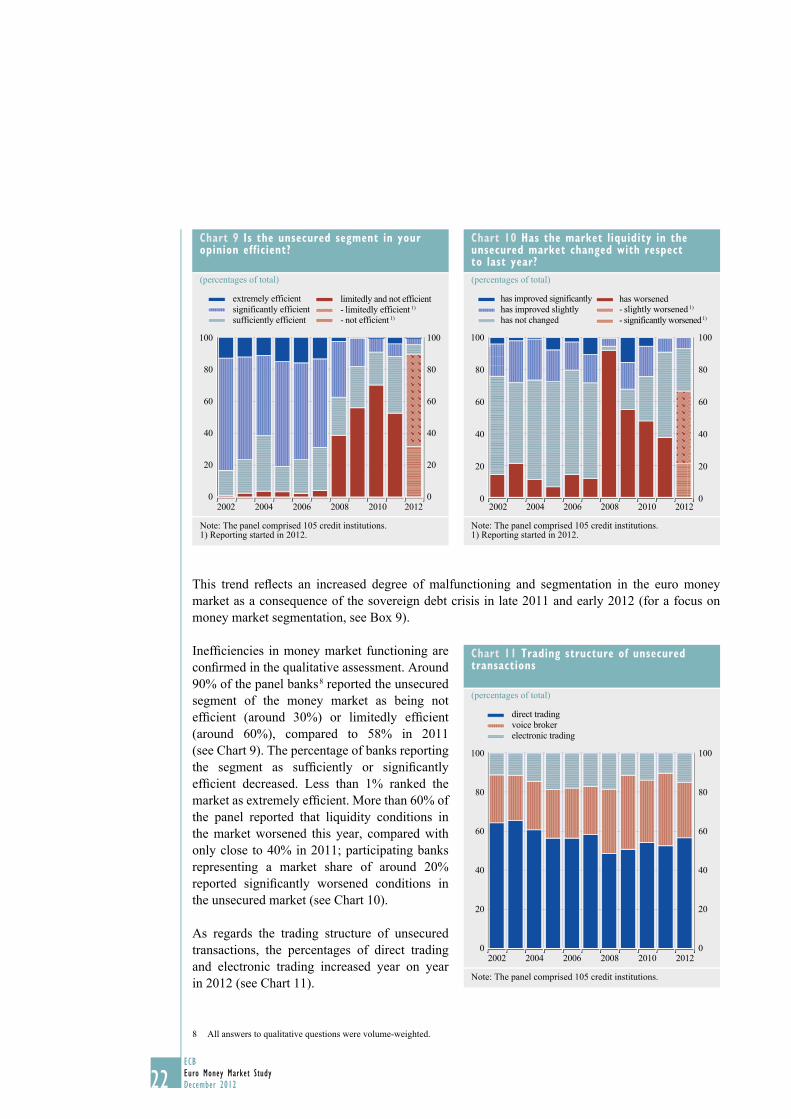
Ineffi ciencies in money market functioning are confi rmed in the qualitative assessment. Around 90% of the panel banks 8 reported the unsecured segment of the money market as being not effi cient (around 30%) or limitedly effi cient (around 60%), compared to 58% in 2011 (see Chart 9). The percentage of banks reporting the segment as suffi ciently or signifi cantly effi cient decreased. Less than 1% ranked the market as extremely effi cient. More than 60% of the panel reported that liquidity conditions in the market worsened this year, compared with only close to 40% in 2011; participating banks representing a market share of around 20% reported signifi cantly worsened conditions in the unsecured market (see Chart 10).
As regards the trading structure of unsecured transactions, the percentages of direct trading and electronic trading increased year on year in 2012 (see Chart 11).
All answers to qualitative questions were volume-weighted.8
chart 11 Trading structure of unsecured transactions
(percentages of total)
0
20
40
60
80
100
0
20
40
60
80
100
2002 2004 2006 2008 2010 2012
direct tradingvoice brokerelectronic trading
Note: The panel comprised 105 credit institutions.
chart 9 is the unsecured segment in your opinion efficient?
(percentages of total)
0
20
40
60
80
100
0
20
40
60
80
100
2002 2004 2006 2008 2010 2012
limitedly and not efficient
- not efficient 1)- limitedly efficient 1)
sufficiently efficientsignificantly efficientextremely efficient
Note: The panel comprised 105 credit institutions.1) Reporting started in 2012.
chart 10 has the market liquidity in the unsecured market changed with respect to last year?(percentages of total)
0
20
40
60
80
100
0
20
40
60
80
100
2002 2004 2006 2008 2010 2012
has worsened
- significantly worsened 1)- slightly worsened 1)
has not changedhas improved slightlyhas improved significantly
Note: The panel comprised 105 credit institutions.1) Reporting started in 2012.
23ECB
Euro Money Market StudyDecember 2012 23
4 ThE SEcURED MARKET4 ThE SEcURED MARKET
4.1 TURNOvER ANAlYSiS
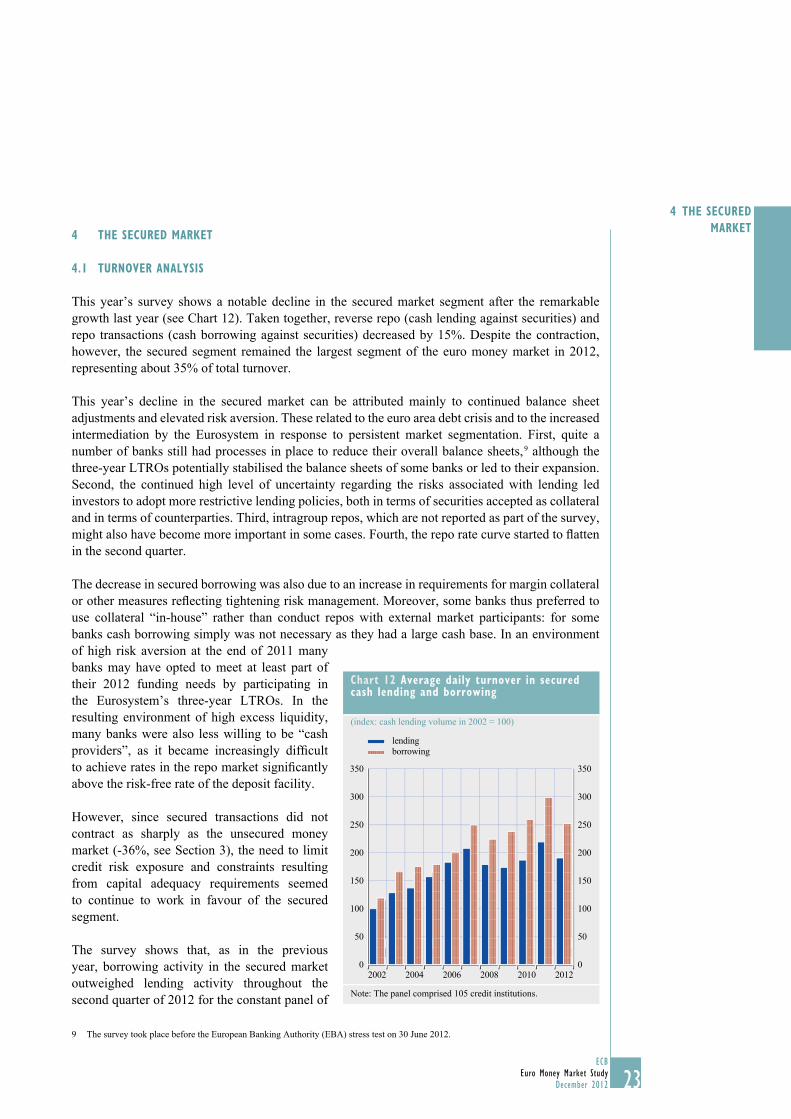
This year’s survey shows a notable decline in the secured market segment after the remarkable growth last year (see Chart 12). Taken together, reverse repo (cash lending against securities) and repo transactions (cash borrowing against securities) decreased by 15%. Despite the contraction, however, the secured segment remained the largest segment of the euro money market in 2012, representing about 35% of total turnover.
This year’s decline in the secured market can be attributed mainly to continued balance sheet adjustments and elevated risk aversion. These related to the euro area debt crisis and to the increased intermediation by the Eurosystem in response to persistent market segmentation. First, quite a number of banks still had processes in place to reduce their overall balance sheets, 9 although the three-year LTROs potentially stabilised the balance sheets of some banks or led to their expansion. Second, the continued high level of uncertainty regarding the risks associated with lending led investors to adopt more restrictive lending policies, both in terms of securities accepted as collateral and in terms of counterparties. Third, intragroup repos, which are not reported as part of the survey, might also have become more important in some cases. Fourth, the repo rate curve started to fl atten in the second quarter.
The decrease in secured borrowing was also due to an increase in requirements for margin collateral or other measures refl ecting tightening risk management. Moreover, some banks thus preferred to use collateral “in-house” rather than conduct repos with external market participants: for some banks cash borrowing simply was not necessary as they had a large cash base. In an environment of high risk aversion at the end of 2011 many banks may have opted to meet at least part of their 2012 funding needs by participating in the Eurosystem’s three-year LTROs. In the resulting environment of high excess liquidity, many banks were also less willing to be “cash providers”, as it became increasingly diffi cult to achieve rates in the repo market signifi cantly above the risk-free rate of the deposit facility.
However, since secured transactions did not contract as sharply as the unsecured money market (-36%, see Section 3), the need to limit credit risk exposure and constraints resulting from capital adequacy requirements seemed to continue to work in favour of the secured segment.
The survey shows that, as in the previous year, borrowing activity in the secured market outweighed lending activity throughout the second quarter of 2012 for the constant panel of
The survey took place before the European Banking Authority (EBA) stress test on 30 June 2012.9
chart 12 Average daily turnover in secured cash lending and borrowing
(index: cash lending volume in 2002 = 100)
0
50
100
150
200
250
300
350
20120
50
100
150
200
250
300
350
lendingborrowing
2002 2004 2006 2008 2010
Note: The panel comprised 105 credit institutions.
24ECBEuro Money Market StudyDecember 201224
105 banks (see Chart 12). This could be related to the fact that the banks participating in the survey tend to be relatively large and might be structurally in greater need of cash or have better access to the interbank market than others.
The semi-annual survey published by the European Repo Council (ERC) of the International Capital Market Association (ICMA) in June 2012 also refl ected the shrinking of the European secured market. The panel of institutions which participated in the ERC survey reported an aggregate decrease in outstanding amounts of around 8% compared with June 2011, a smaller decline than that recorded in the Eurosystem survey (15%). However, these diverging growth rates may be the result of the different samples of banks and considerable methodological differences between the two surveys, which are described in Annex 3.
4.2 MATURiTY ANAlYSiS
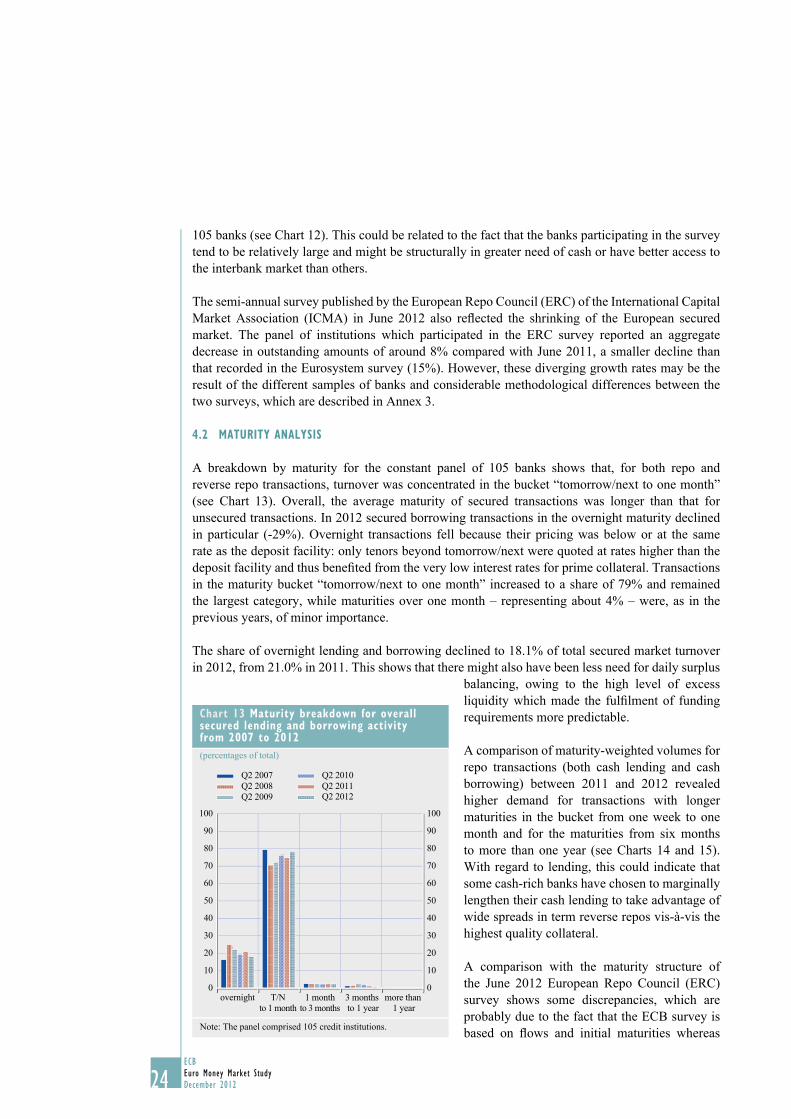
A breakdown by maturity for the constant panel of 105 banks shows that, for both repo and reverse repo transactions, turnover was concentrated in the bucket “tomorrow/next to one month” (see Chart 13). Overall, the average maturity of secured transactions was longer than that for unsecured transactions. In 2012 secured borrowing transactions in the overnight maturity declined in particular (-29%). Overnight transactions fell because their pricing was below or at the same rate as the deposit facility: only tenors beyond tomorrow/next were quoted at rates higher than the deposit facility and thus benefi ted from the very low interest rates for prime collateral. Transactions in the maturity bucket “tomorrow/next to one month” increased to a share of 79% and remained the largest category, while maturities over one month – representing about 4% – were, as in the previous years, of minor importance.
The share of overnight lending and borrowing declined to 18.1% of total secured market turnover in 2012, from 21.0% in 2011. This shows that there might also have been less need for daily surplus
balancing, owing to the high level of excess liquidity which made the fulfi lment of funding requirements more predictable.
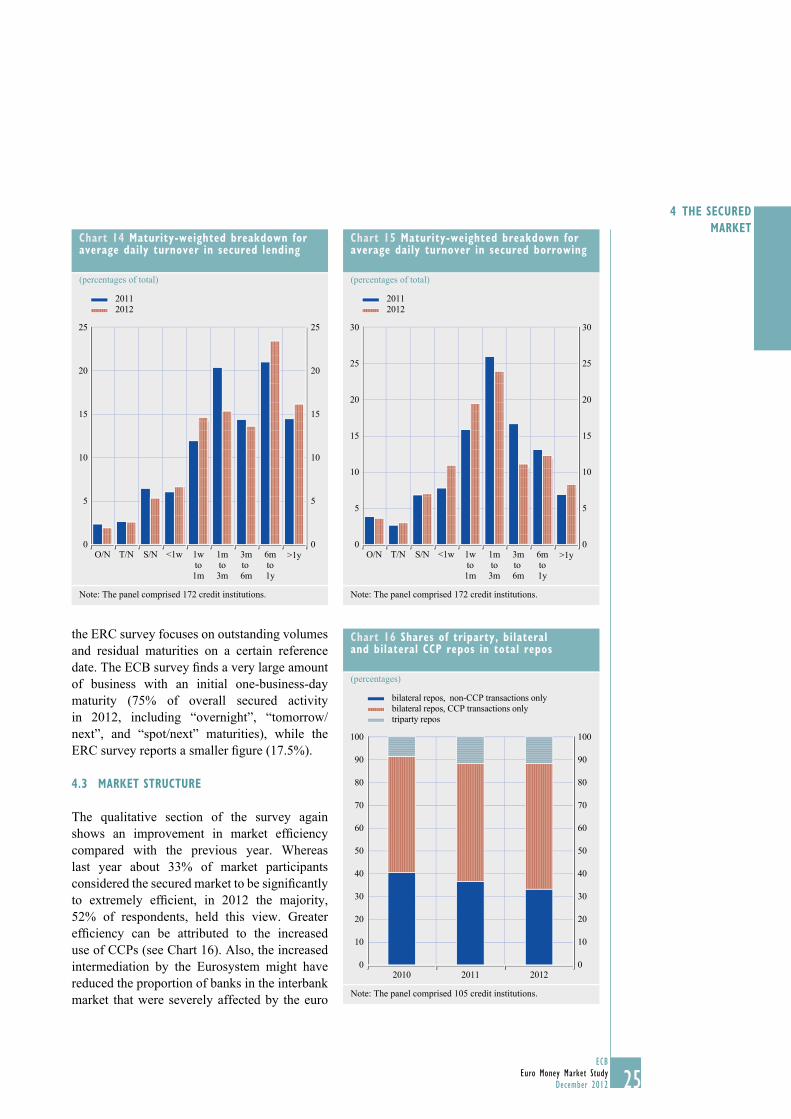
A comparison of maturity-weighted volumes for repo transactions (both cash lending and cash borrowing) between 2011 and 2012 revealed higher demand for transactions with longer maturities in the bucket from one week to one month and for the maturities from six months to more than one year (see Charts 14 and 15). With regard to lending, this could indicate that some cash-rich banks have chosen to marginally lengthen their cash lending to take advantage of wide spreads in term reverse repos vis-à-vis the highest quality collateral.
A comparison with the maturity structure of the June 2012 European Repo Council (ERC) survey shows some discrepancies, which are probably due to the fact that the ECB survey is based on fl ows and initial maturities whereas
chart 13 Maturity breakdown for overall secured lending and borrowing activity from 2007 to 2012(percentages of total)
0
10
20
30
40
50
60
70
80
90
100
0
10
20
30
40
50
60
70
80
90
100
overnight T/Nto 1 month
1 monthto 3 months
3 months to 1 year
more than 1 year
Q2 2007Q2 2008Q2 2009
Q2 2010Q2 2011Q2 2012
Note: The panel comprised 105 credit institutions.
25ECB
Euro Money Market StudyDecember 2012 25
4 ThE SEcURED MARKET
the ERC survey focuses on outstanding volumes and residual maturities on a certain reference date. The ECB survey fi nds a very large amount of business with an initial one-business-day maturity (75% of overall secured activity in 2012, including “overnight”, “tomorrow/next”, and “spot/next” maturities), while the ERC survey reports a smaller fi gure (17.5%).
4.3 MARKET STRUcTURE
The qualitative section of the survey again shows an improvement in market effi ciency compared with the previous year. Whereas last year about 33% of market participants considered the secured market to be signifi cantly to extremely effi cient, in 2012 the majority, 52% of respondents, held this view. Greater effi ciency can be attributed to the increased use of CCPs (see Chart 16). Also, the increased intermediation by the Eurosystem might have reduced the proportion of banks in the interbank market that were severely affected by the euro
chart 14 Maturity-weighted breakdown for average daily turnover in secured lending
(percentages of total)
0
5
10
15
20
25
0
5
10
15
20
25
20112012
<1w 1mto3m
1wto1m
3mto 6m
6mto1y
O/N T/N S/N >1y
Note: The panel comprised 172 credit institutions.
chart 15 Maturity-weighted breakdown for average daily turnover in secured borrowing
(percentages of total)
0
5
10
15
20
25
30
0
5
10
15
20
25
30
<1w 1mto3m
1wto1m
3mto 6m
6mto1y
O/N T/N S/N >1y
20112012
Note: The panel comprised 172 credit institutions.
chart 16 Shares of triparty, bilateral and bilateral ccp repos in total repos
(percentages)
0
10
20
30
40
50
60
70
80
90
100
0
10
20
30
40
50
60
70
80
90
100
2010 2011 2012
bilateral repos, non-CCP transactions onlybilateral repos, CCP transactions onlytriparty repos
Note: The panel comprised 105 credit institutions.
26ECBEuro Money Market StudyDecember 201226
area debt crisis. However, overall market liquidity had in 2012 deteriorated compared with the previous year, as the increased intermediation of the Eurosystem affected the interbank market.
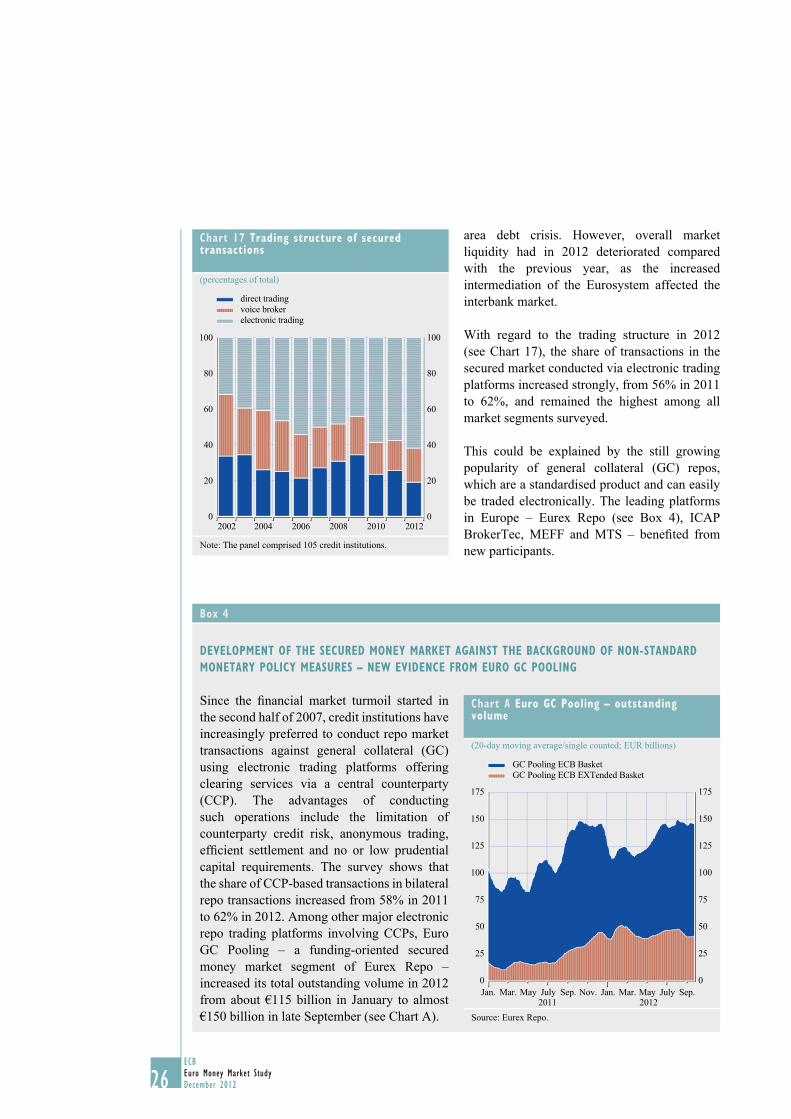
With regard to the trading structure in 2012 (see Chart 17), the share of transactions in the secured market conducted via electronic trading platforms increased strongly, from 56% in 2011 to 62%, and remained the highest among all market segments surveyed.
This could be explained by the still growing popularity of general collateral (GC) repos, which are a standardised product and can easily be traded electronically. The leading platforms in Europe – Eurex Repo (see Box 4), ICAP BrokerTec, MEFF and MTS – benefi ted from new participants.
chart 17 Trading structure of secured transactions
(percentages of total)
0
20
40
60
80
100
0
20
40
60
80
100
2012
direct tradingvoice brokerelectronic trading
2002 2004 2006 2008 2010
Note: The panel comprised 105 credit institutions.
Box 4�
deVeLOPmeNT OF The secured mONeY markeT aGaINsT The BackGrOuNd OF NON-sTaNdard mONeTarY POLIcY measures – NeW eVIdeNce FrOm eurO Gc POOLING
Since the fi nancial market turmoil started in the second half of 2007, credit institutions have increasingly preferred to conduct repo market transactions against general collateral (GC) using electronic trad ing platforms offering clearing services via a central counterparty (CCP). The advantages of conducting such operations include the limitation of counterparty credit risk, anonymous trading, effi cient settlement and no or low prudential capital requirements. The survey shows that the share of CCP-based transactions in bilateral repo transactions increased from 58% in 2011 to 62% in 2012. Among other major electronic repo trading platforms involving CCPs, Euro GC Pooling – a funding-oriented secured money market segment of Eurex Repo – increased its total out standing volume in 2012 from about €115 billion in January to almost €150 billion in late September (see Chart A).
chart a euro Gc Pooling – outstanding volume
(20-day moving average/single counted; EUR billions)
GC Pooling ECB Basket GC Pooling ECB EXTended Basket
25
50
75
100
125
150
175
25
0 0
50
75
100
125
150
175
Jan. Mar. May2011 2012July Sep. Nov. Jan. Mar. May July Sep.
Source: Eurex Repo.
27ECB
Euro Money Market StudyDecember 2012 27
4� The secured markeT
Part of this can be attributed to a larger group of participants, not least due to the growing number of international participants. The number of GC Pooling participants has more than doubled since August 2010, when the last study was prepared, and stood at 98 at the end of September 2012. The number of participants based outside Germany has increased to 59 from only 16 in 2010. Already in the second half of 2011, GC Pooling transactions gained significantly in importance given the escalation of the euro area sovereign debt crisis, which led to an impairment of bilateral repo markets, in particular international repo transactions based on collateral from Spain and Italy. On the one hand, banks made use of GC Pooling to fund assets which were no longer accepted in bilateral repo transactions. On the other hand, cash-rich banks were more willing to lend cash in the GC Pooling market, in particular since potential counterparty risk was limited by Eurex Clearing acting as CCP to all transactions.
However, the large amount of longer-term excess liquidity provided via the two three-year LTROs allotted in late December 2011 and late February 2012 resulted in a transitory reduction of trad ing activity and outstanding volumes in money markets. In the first quarter of 2012, banks reported crowding-out effects in the secured interbank market and, in particular, the CCP market (a decrease of about €40 billion in the outstanding volume in GC Pooling). This was mainly due to the fact that banks with large-scale funding needs preferred to cover them via the three-year LTROs instead of re sorting to smaller-sized market-based transactions with much shorter maturities and potentially subject to higher collateral requirements. In May 2012, as market stress began to increase again, GC Pooling transactions started to rise. In June 2012, the outstanding volume once again rose to over €140 billion, the level reached before the first three-year tender.
As of May 2012, in particular, the volume traded in the GC Pooling ECB Basket grew because of the high-quality collateral 1 for cash providers and the possibility of its reuse for Eurosystem credit operations via the Deutsche Bundesbank. By contrast, the GC Pooling ECB EXTended Basket, which was established following the extension of the collateral framework by the Eurosystem in autumn 2008, was more prone to cyclical behaviour. In the second half of 2011 and early 2012, the GC Pooling EXTended Basket became particularly attractive (see Chart A) because it includes Spanish collateral (always included in the EXTended Basket due to technical reasons since the creation of the basket in November 2008) and Italian collateral (since Standard & Poor’s downgrade of Italy in January 2012). However, as of the second quarter of 2012, cash providers, on the one hand, were possibly less willing to lend in the EXTended Basket given the higher probability of receiving collateral from countries under sovereign debt stress. On the other hand, in the light of the structure of overall collateral received and taking into account counterparty-specific considerations, Eurex Repo/Eurex Clearing also ap plied stricter risk control measures to avoid a high concentration of specific assets received as col lateral for GC Pooling transactions. These stricter risk control measures may have induced some banks to move to bilateral repos.
1 The GC Pooling ECB Basket includes around 7,500 ECB-eligible instruments, mainly government securities and covered bonds, with a minimum rating requirement of A-/A3. ECB-eligible uncovered bank bonds, corporate bonds and ABSs are, by definition, excluded from the GC Pooling ECB basket.
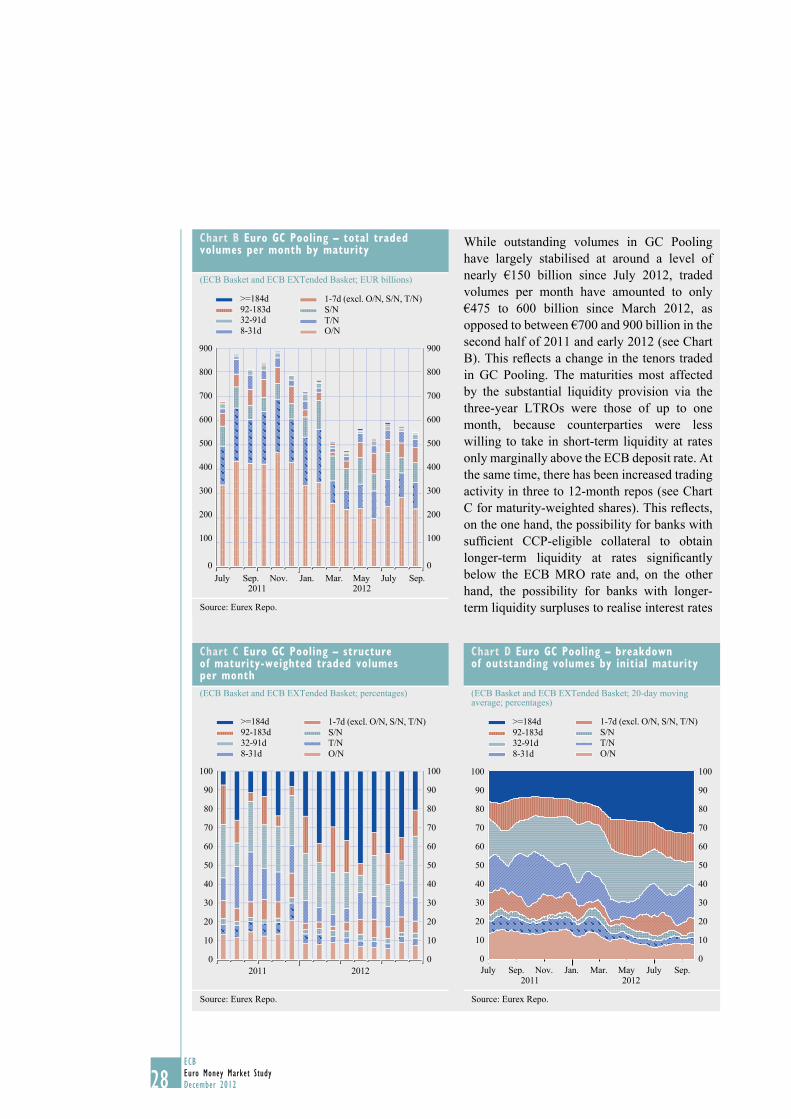
28ECBEuro Money Market StudyDecember 201228
While outstanding volumes in GC Pooling have largely stabilised at around a level of nearly €150 billion since July 2012, traded volumes per month have amounted to only €475 to 600 billion since March 2012, as opposed to between €700 and 900 billion in the second half of 2011 and early 2012 (see Chart B). This refl ects a change in the tenors traded in GC Pooling. The maturities most affected by the substantial liquidity provision via the three-year LTROs were those of up to one month, because counterparties were less willing to take in short-term liquidity at rates only marginally above the ECB deposit rate. At the same time, there has been increased trading activity in three to 12-month repos (see Chart C for maturity-weighted shares). This refl ects, on the one hand, the possibility for banks with suffi cient CCP-eligible collateral to obtain longer-term liquidity at rates signifi cantly below the ECB MRO rate and, on the other hand, the possibility for banks with longer-term liquidity surpluses to realise interest rates
chart c euro Gc Pooling – structure of maturity-weighted traded volumes per month(ECB Basket and ECB EXTended Basket; percentages)
100
90
80
70
60
50
40
30
20
10
0
100
90
80
70
60
50
40
30
20
10
02011 2012
>=184d92-183d32-91d8-31d
1-7d (excl. O/N, S/N, T/N)S/NT/NO/N
Source: Eurex Repo.
chart d euro Gc Pooling – breakdown of outstanding volumes by initial maturity
(ECB Basket and ECB EXTended Basket; 20-day moving average; percentages)
0
10
20
30
40
50
60
70
80
90
100
0
10
20
30
40
50
60
70
80
90
100
July Sep. Nov. Jan. Mar. May July Sep.
>=184d 92-183d 32-91d 8-31d
1-7d (excl. O/N, S/N, T/N) S/N T/N O/N
2011 2012
Source: Eurex Repo.
chart B euro Gc Pooling – total traded volumes per month by maturity
(ECB Basket and ECB EXTended Basket; EUR billions)
100
200
300
400
500
600
700
800
900
100
200
300
400
500
600
700
800
900
0 0
>=184d92-183d32-91d8-31d
1-7d (excl. O/N, S/N, T/N)S/NT/NO/N
July JulySep. Nov. Jan. Mar. May2011 2012
Sep.
Source: Eurex Repo.
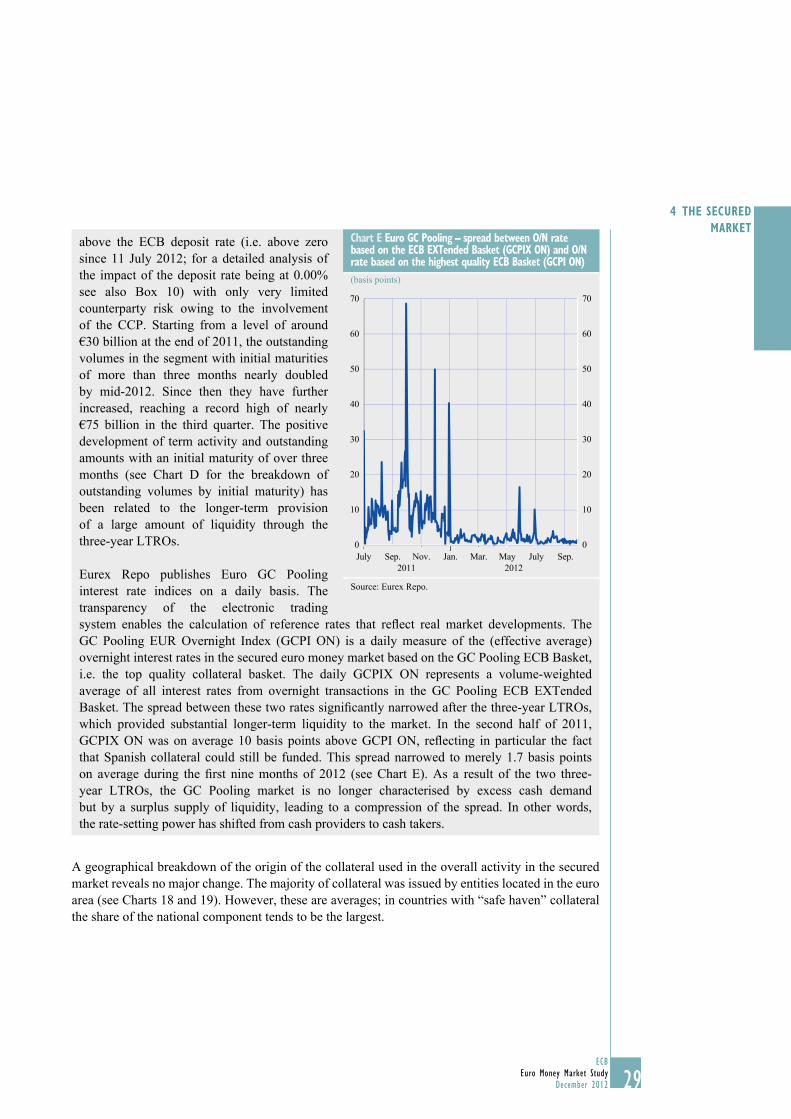
29ECB
Euro Money Market StudyDecember 2012 29
4� The secured markeT
A geographical breakdown of the origin of the collateral used in the overall activity in the secured market reveals no major change. The majority of collateral was issued by entities located in the euro area (see Charts 18 and 19). However, these are averages; in countries with “safe haven” collateral the share of the national component tends to be the largest.
above the ECB deposit rate (i.e. above zero since 11 July 2012; for a detailed analysis of the impact of the deposit rate being at 0.00% see also Box 10) with only very limited counterparty risk owing to the involvement of the CCP. Starting from a level of around €30 billion at the end of 2011, the outstanding volumes in the segment with initial maturities of more than three months nearly doubled by mid-2012. Since then they have further increased, reaching a record high of nearly €75 billion in the third quarter. The positive development of term activity and outstanding amounts with an initial maturity of over three months (see Chart D for the breakdown of outstanding volumes by initial maturity) has been related to the longer-term provision of a large amount of liquidity through the three-year LTROs.
Eurex Repo publishes Euro GC Pooling interest rate indices on a daily basis. The transparency of the electronic trading system enables the calculation of reference rates that refl ect real market devel opments. The GC Pooling EUR Overnight Index (GCPI ON) is a daily measure of the (effective average) overnight interest rates in the secured euro money market based on the GC Pooling ECB Basket, i.e. the top quality collateral basket. The daily GCPIX ON represents a volume-weighted average of all inter est rates from overnight transactions in the GC Pooling ECB EXTended Basket. The spread between these two rates signifi cantly narrowed after the three-year LTROs, which provided substan tial longer-term liquidity to the market. In the second half of 2011, GCPIX ON was on average 10 basis points above GCPI ON, refl ecting in particular the fact that Spanish collateral could still be funded. This spread narrowed to merely 1.7 basis points on average during the fi rst nine months of 2012 (see Chart E). As a result of the two three-year LTROs, the GC Pooling market is no longer characterised by excess cash demand but by a surplus supply of liquidity, leading to a compression of the spread. In other words, the rate-setting power has shifted from cash providers to cash takers.
chart e euro Gc Pooling – spread between O/N rate based on the ecB eXTended Basket (GcPIX ON) and O/N rate based on the highest quality ecB Basket (GcPI ON)(basis points)
0
10
20
30
40
50
60
70
0
10
20
30
40
50
60
70
July Sep. Nov. Jan. Mar. May July Sep.2011 2012
Source: Eurex Repo.
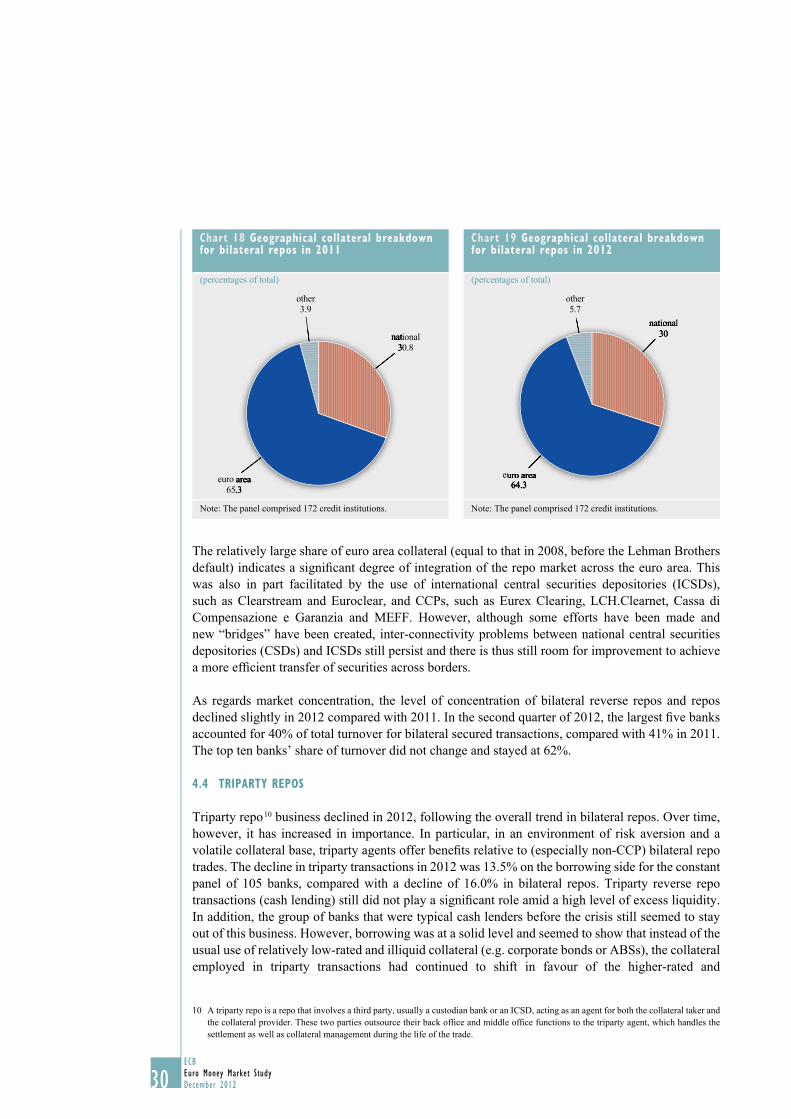
30ECBEuro Money Market StudyDecember 201230
The relatively large share of euro area collateral (equal to that in 2008, before the Lehman Brothers default) indicates a signifi cant degree of integration of the repo market across the euro area. This was also in part facilitated by the use of international central securities depositories (ICSDs), such as Clearstream and Euroclear, and CCPs, such as Eurex Clearing, LCH.Clearnet, Cassa di Compensazione e Garanzia and MEFF. However, although some efforts have been made and new “bridges” have been created, inter-connectivity problems between national central securities depositories (CSDs) and ICSDs still persist and there is thus still room for improvement to achieve a more effi cient transfer of securities across borders.
As regards market concentration, the level of concentration of bilateral reverse repos and repos declined slightly in 2012 compared with 2011. In the second quarter of 2012, the largest fi ve banks accounted for 40% of total turnover for bilateral secured transactions, compared with 41% in 2011. The top ten banks’ share of turnover did not change and stayed at 62%.
4�.4� TrIParTY rePOs
Triparty repo 10 business declined in 2012, following the overall trend in bilateral repos. Over time, however, it has increased in importance. In particular, in an environment of risk aversion and a volatile collateral base, triparty agents offer benefi ts relative to (especially non-CCP) bilateral repo trades. The decline in triparty transactions in 2012 was 13.5% on the borrowing side for the constant panel of 105 banks, compared with a decline of 16.0% in bilateral repos. Triparty reverse repo transactions (cash lending) still did not play a signifi cant role amid a high level of excess liquidity. In addition, the group of banks that were typical cash lenders before the crisis still seemed to stay out of this business. However, borrowing was at a solid level and seemed to show that instead of the usual use of relatively low-rated and illiquid collateral (e.g. corporate bonds or ABSs), the collateral employed in triparty transactions had continued to shift in favour of the higher-rated and
A triparty repo is a repo that involves a third party, usually a custodian bank or an ICSD, acting as an agent for both the collateral taker and 10 the collateral provider. These two parties outsource their back offi ce and middle offi ce functions to the triparty agent, which handles the settlement as well as collateral management during the life of the trade.
chart 18 Geographical collateral breakdown for bilateral repos in 2011
(percentages of total)
other3.9
national30.8
euro area65.3
national30.8
euro area65.3
Note: The panel comprised 172 credit institutions.
chart 19 Geographical collateral breakdown for bilateral repos in 2012
(percentages of total)
euro area64.3
national30
other5.7
euro area64.3
national30
Note: The panel comprised 172 credit institutions.
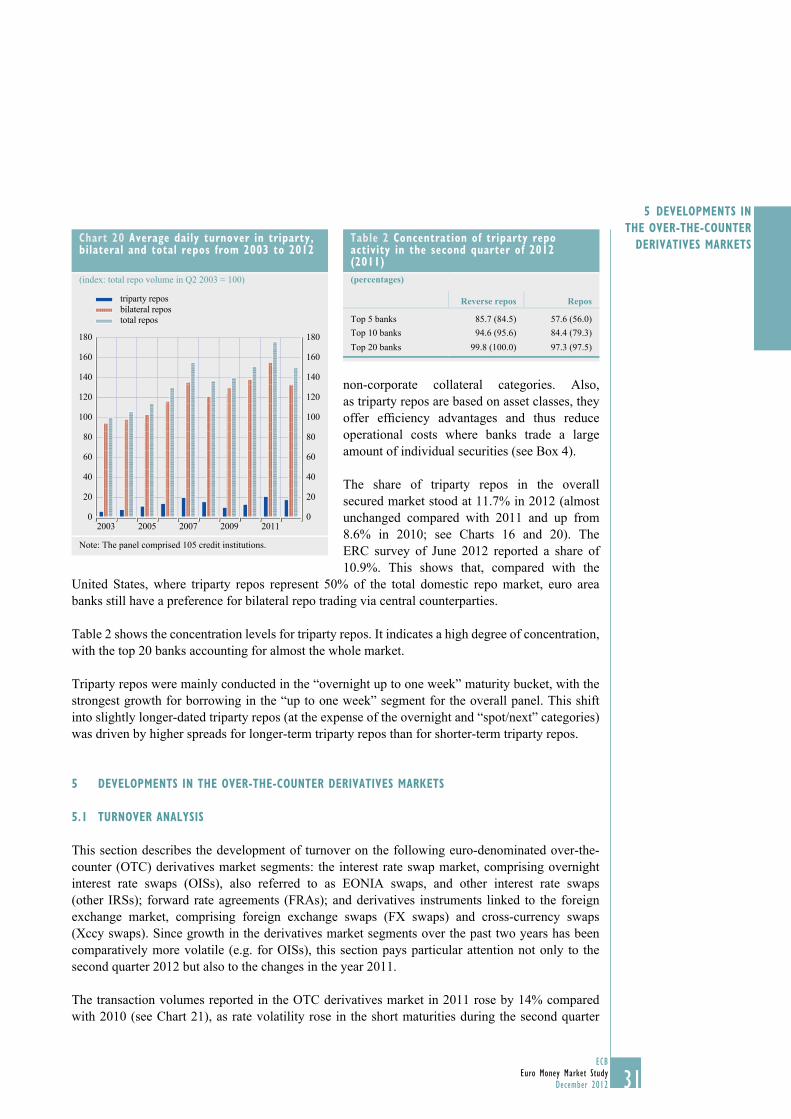
31ECB
Euro Money Market StudyDecember 2012 31
5 DEvElOpMENTS iN ThE OvER-ThE-cOUNTER
DERivATivES MARKETS
non-corporate collateral categories. Also, as triparty repos are based on asset classes, they offer effi ciency advantages and thus reduce operational costs where banks trade a large amount of individual securities (see Box 4).
The share of triparty repos in the overall secured market stood at 11.7% in 2012 (almost unchanged compared with 2011 and up from 8.6% in 2010; see Charts 16 and 20). The ERC survey of June 2012 reported a share of 10.9%. This shows that, compared with the
United States, where triparty repos represent 50% of the total domestic repo market, euro area banks still have a preference for bilateral repo trading via central counterparties.
Table 2 shows the concentration levels for triparty repos. It indicates a high degree of concentration, with the top 20 banks accounting for almost the whole market.
Triparty repos were mainly conducted in the “overnight up to one week” maturity bucket, with the strongest growth for borrowing in the “up to one week” segment for the overall panel. This shift into slightly longer-dated triparty repos (at the expense of the overnight and “spot/next” categories) was driven by higher spreads for longer-term triparty repos than for shorter-term triparty repos.
5 DEvElOpMENTS iN ThE OvER-ThE-cOUNTER DERivATivES MARKETS
5.1 TURNOvER ANAlYSiS
This section describes the development of turnover on the following euro-denominated over-the-counter (OTC) derivatives market segments: the interest rate swap market, comprising overnight interest rate swaps (OISs), also referred to as EONIA swaps, and other interest rate swaps (other IRSs); forward rate agreements (FRAs); and derivatives instruments linked to the foreign exchange market, comprising foreign exchange swaps (FX swaps) and cross-currency swaps (Xccy swaps). Since growth in the derivatives market segments over the past two years has been comparatively more volatile (e.g. for OISs), this section pays particular attention not only to the second quarter 2012 but also to the changes in the year 2011.
The transaction volumes reported in the OTC derivatives market in 2011 rose by 14% compared with 2010 (see Chart 21), as rate volatility rose in the short maturities during the second quarter
Table 2 concentration of triparty repo activity in the second quarter of 2012 (2011)(percentages)
Reverse repos Repos
Top 5 banks 85.7 (84.5) 57.6 (56.0)Top 10 banks 94.6 (95.6) 84.4 (79.3)Top 20 banks 99.8 (100.0) 97.3 (97.5)
chart 20 Average daily turnover in triparty, bilateral and total repos from 2003 to 2012
(index: total repo volume in Q2 2003 = 100)
0
20
40
60
80
100
120
140
160
180
0
20
40
60
80
100
120
140
160
180
2003 2005 2007 2009 2011
triparty reposbilateral repostotal repos
Note: The panel comprised 105 credit institutions.
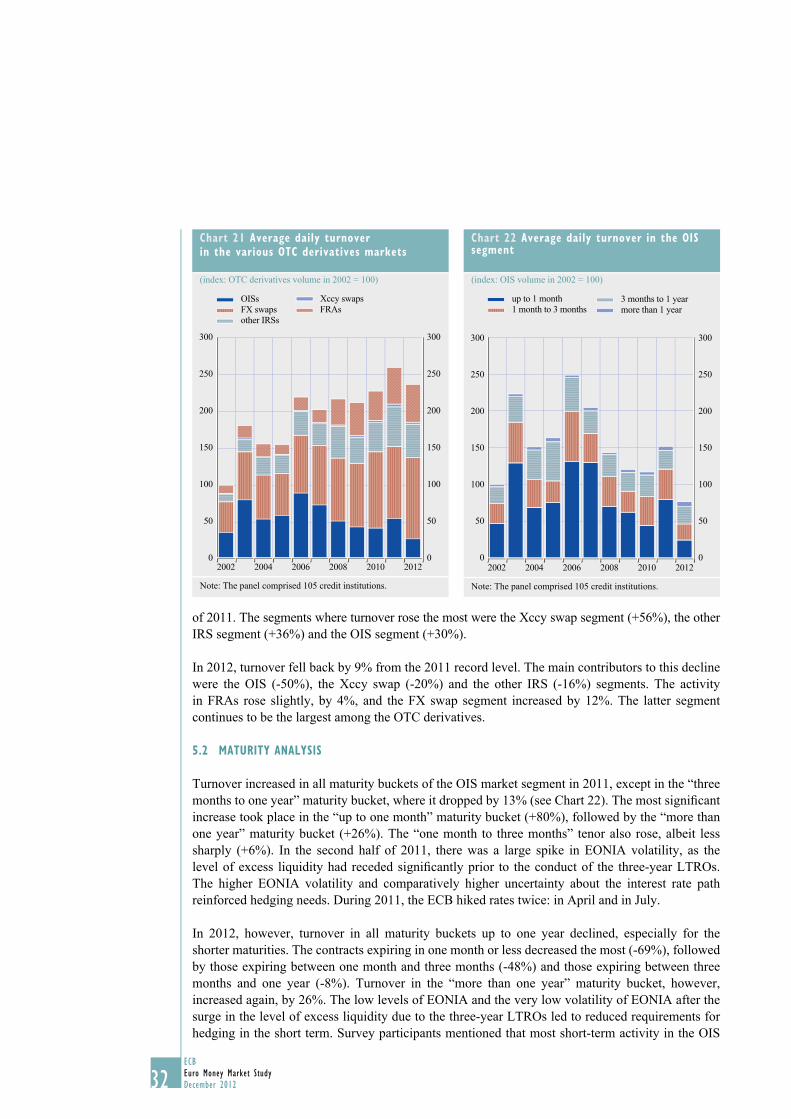
32ECBEuro Money Market StudyDecember 201232
of 2011. The segments where turnover rose the most were the Xccy swap segment (+56%), the other IRS segment (+36%) and the OIS segment (+30%).
In 2012, turnover fell back by 9% from the 2011 record level. The main contributors to this decline were the OIS (-50%), the Xccy swap (-20%) and the other IRS (-16%) segments. The activity in FRAs rose slightly, by 4%, and the FX swap segment increased by 12%. The latter segment continues to be the largest among the OTC derivatives.
5.2 MATURiTY ANAlYSiS
Turnover increased in all maturity buckets of the OIS market segment in 2011, except in the “three months to one year” maturity bucket, where it dropped by 13% (see Chart 22). The most signifi cant increase took place in the “up to one month” maturity bucket (+80%), followed by the “more than one year” maturity bucket (+26%). The “one month to three months” tenor also rose, albeit less sharply (+6%). In the second half of 2011, there was a large spike in EONIA volatility, as the level of excess liquidity had receded signifi cantly prior to the conduct of the three-year LTROs. The higher EONIA volatility and comparatively higher uncertainty about the interest rate path reinforced hedging needs. During 2011, the ECB hiked rates twice: in April and in July.
In 2012, however, turnover in all maturity buckets up to one year declined, especially for the shorter maturities. The contracts expiring in one month or less decreased the most (-69%), followed by those expiring between one month and three months (-48%) and those expiring between three months and one year (-8%). Turnover in the “more than one year” maturity bucket, however, increased again, by 26%. The low levels of EONIA and the very low volatility of EONIA after the surge in the level of excess liquidity due to the three-year LTROs led to reduced requirements for hedging in the short term. Survey participants mentioned that most short-term activity in the OIS
chart 21 Average daily turnover in the various OTc derivatives markets
(index: OTC derivatives volume in 2002 = 100)
0
50
100
150
200
250
300
0
50
100
150
200
250
300
2002 2004 2006 2008 2010 2012
OISsFX swapsother IRSs
Xccy swapsFRAs
Note: The panel comprised 105 credit institutions.
chart 22 Average daily turnover in the OiS segment
(index: OIS volume in 2002 = 100)
0
50
100
150
200
250
300
0
50
100
150
200
250
300
2002 2004 2006 2008 2010 2012
up to 1 month1 month to 3 months
3 months to 1 yearmore than 1 year
Note: The panel comprised 105 credit institutions.
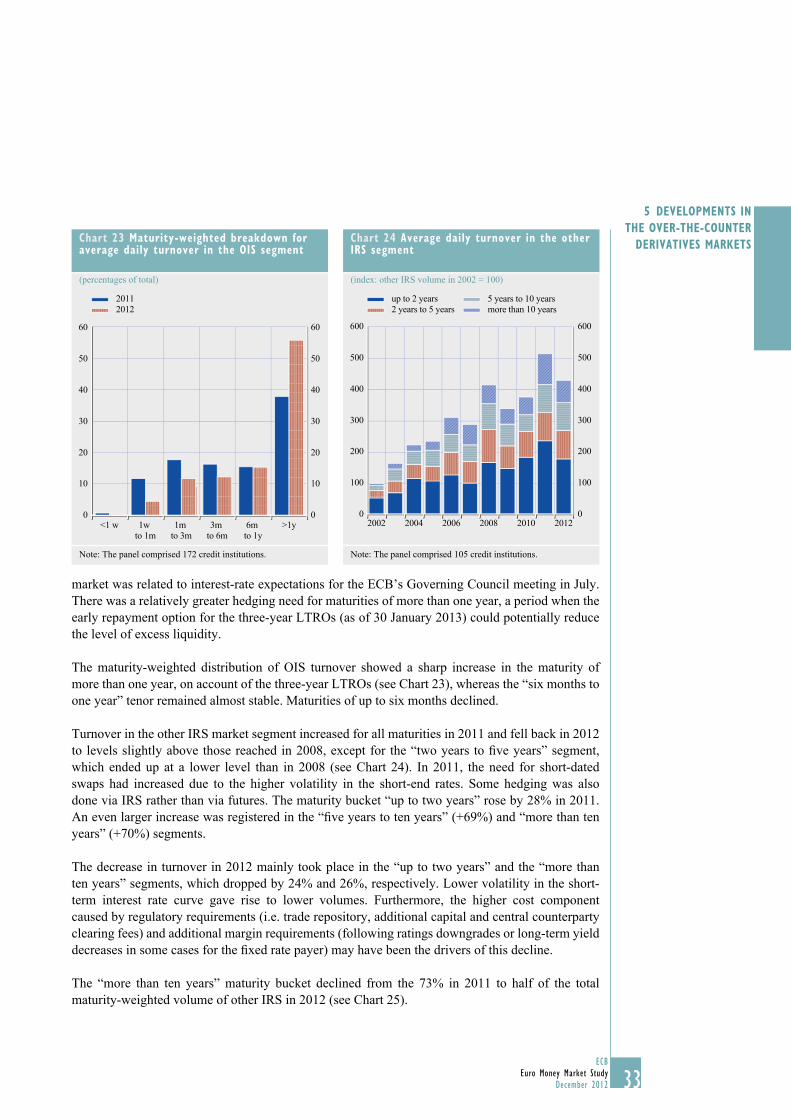
33ECB
Euro Money Market StudyDecember 2012 33
5 DEvElOpMENTS iN ThE OvER-ThE-cOUNTER
DERivATivES MARKETS
market was related to interest-rate expectations for the ECB’s Governing Council meeting in July. There was a relatively greater hedging need for maturities of more than one year, a period when the early repayment option for the three-year LTROs (as of 30 January 2013) could potentially reduce the level of excess liquidity.
The maturity-weighted distribution of OIS turnover showed a sharp increase in the maturity of more than one year, on account of the three-year LTROs (see Chart 23), whereas the “six months to one year” tenor remained almost stable. Maturities of up to six months declined.
Turnover in the other IRS market segment increased for all maturities in 2011 and fell back in 2012 to levels slightly above those reached in 2008, except for the “two years to fi ve years” segment, which ended up at a lower level than in 2008 (see Chart 24). In 2011, the need for short-dated swaps had increased due to the higher volatility in the short-end rates. Some hedging was also done via IRS rather than via futures. The maturity bucket “up to two years” rose by 28% in 2011. An even larger increase was registered in the “fi ve years to ten years” (+69%) and “more than ten years” (+70%) segments.
The decrease in turnover in 2012 mainly took place in the “up to two years” and the “more than ten years” segments, which dropped by 24% and 26%, respectively. Lower volatility in the short-term interest rate curve gave rise to lower volumes. Furthermore, the higher cost component caused by regulatory requirements (i.e. trade repository, additional capital and central counterparty clearing fees) and additional margin requirements (following ratings downgrades or long-term yield decreases in some cases for the fi xed rate payer) may have been the drivers of this decline.
The “more than ten years” maturity bucket declined from the 73% in 2011 to half of the total maturity-weighted volume of other IRS in 2012 (see Chart 25).
chart 23 Maturity-weighted breakdown for average daily turnover in the OiS segment
(percentages of total)
0
10
20
30
40
50
60
0
10
20
30
40
50
60
<1 w 1w to 1m
1m to 3m
3m to 6m
6m to 1y
>1y
20112012
Note: The panel comprised 172 credit institutions.
chart 24 Average daily turnover in the other iRS segment
(index: other IRS volume in 2002 = 100)
0
100
200
300
400
500
600
0
100
200
300
400
500
600
2002 2004 2006 2008 2010 2012
up to 2 years2 years to 5 years
5 years to 10 yearsmore than 10 years
Note: The panel comprised 105 credit institutions.
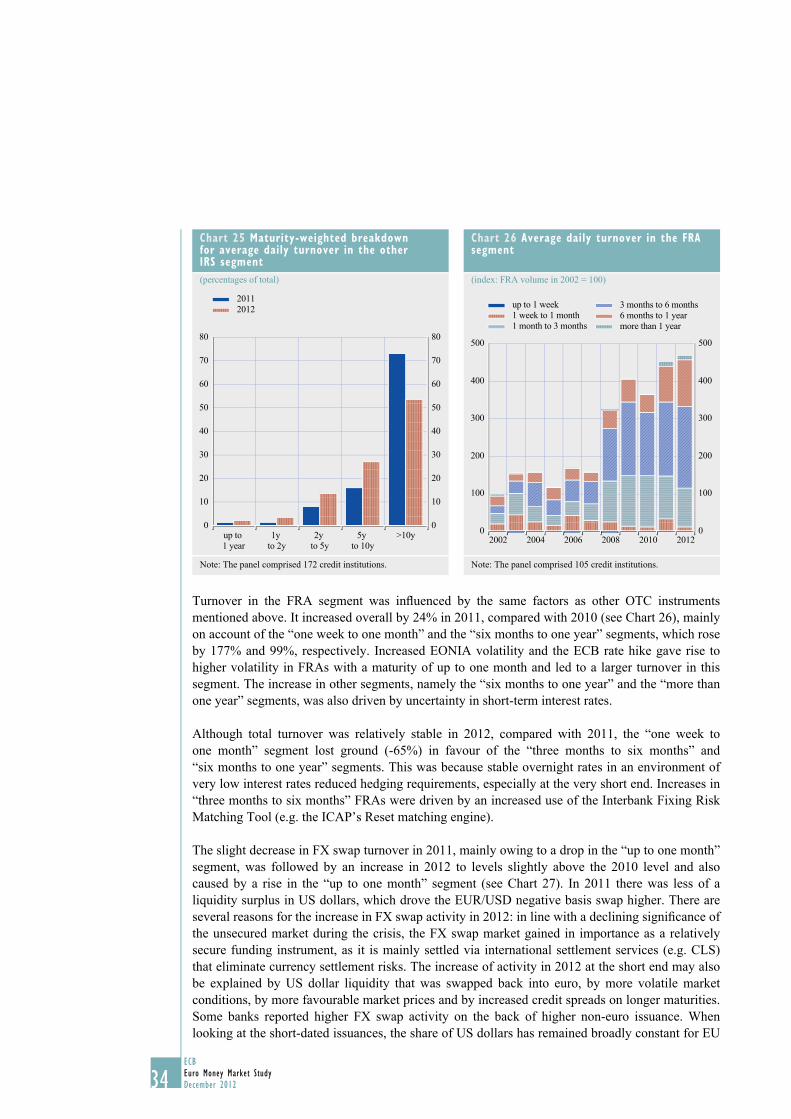
34ECBEuro Money Market StudyDecember 201234
Turnover in the FRA segment was infl uenced by the same factors as other OTC instruments mentioned above. It increased overall by 24% in 2011, compared with 2010 (see Chart 26), mainly on account of the “one week to one month” and the “six months to one year” segments, which rose by 177% and 99%, respectively. Increased EONIA volatility and the ECB rate hike gave rise to higher volatility in FRAs with a maturity of up to one month and led to a larger turnover in this segment. The increase in other segments, namely the “six months to one year” and the “more than one year” segments, was also driven by uncertainty in short-term interest rates.
Although total turnover was relatively stable in 2012, compared with 2011, the “one week to one month” segment lost ground (-65%) in favour of the “three months to six months” and “six months to one year” segments. This was because stable overnight rates in an environment of very low interest rates reduced hedging requirements, especially at the very short end. Increases in “three months to six months” FRAs were driven by an increased use of the Interbank Fixing Risk Matching Tool (e.g. the ICAP’s Reset matching engine).
The slight decrease in FX swap turnover in 2011, mainly owing to a drop in the “up to one month” segment, was followed by an increase in 2012 to levels slightly above the 2010 level and also caused by a rise in the “up to one month” segment (see Chart 27). In 2011 there was less of a liquidity surplus in US dollars, which drove the EUR/USD negative basis swap higher. There are several reasons for the increase in FX swap activity in 2012: in line with a declining signifi cance of the unsecured market during the crisis, the FX swap market gained in importance as a relatively secure funding instrument, as it is mainly settled via international settlement services (e.g. CLS) that eliminate currency settlement risks. The increase of activity in 2012 at the short end may also be explained by US dollar liquidity that was swapped back into euro, by more volatile market conditions, by more favourable market prices and by increased credit spreads on longer maturities. Some banks reported higher FX swap activity on the back of higher non-euro issuance. When looking at the short-dated issuances, the share of US dollars has remained broadly constant for EU
chart 25 Maturity-weighted breakdown for average daily turnover in the other iRS segment(percentages of total)
0
10
20
30
40
50
60
70
80
0
10
20
30
40
50
60
70
80
20112012
up to 1 year
1y to 2y
2y to 5y
5y to 10y
>10y
Note: The panel comprised 172 credit institutions.
chart 26 Average daily turnover in the fRA segment
(index: FRA volume in 2002 = 100)
0
100
200
300
400
500
0
100
200
300
400
500
2002 2004 2006 2008 2010 2012
up to 1 week1 week to 1 month1 month to 3 months
3 months to 6 months6 months to 1 yearmore than 1 year
Note: The panel comprised 105 credit institutions.
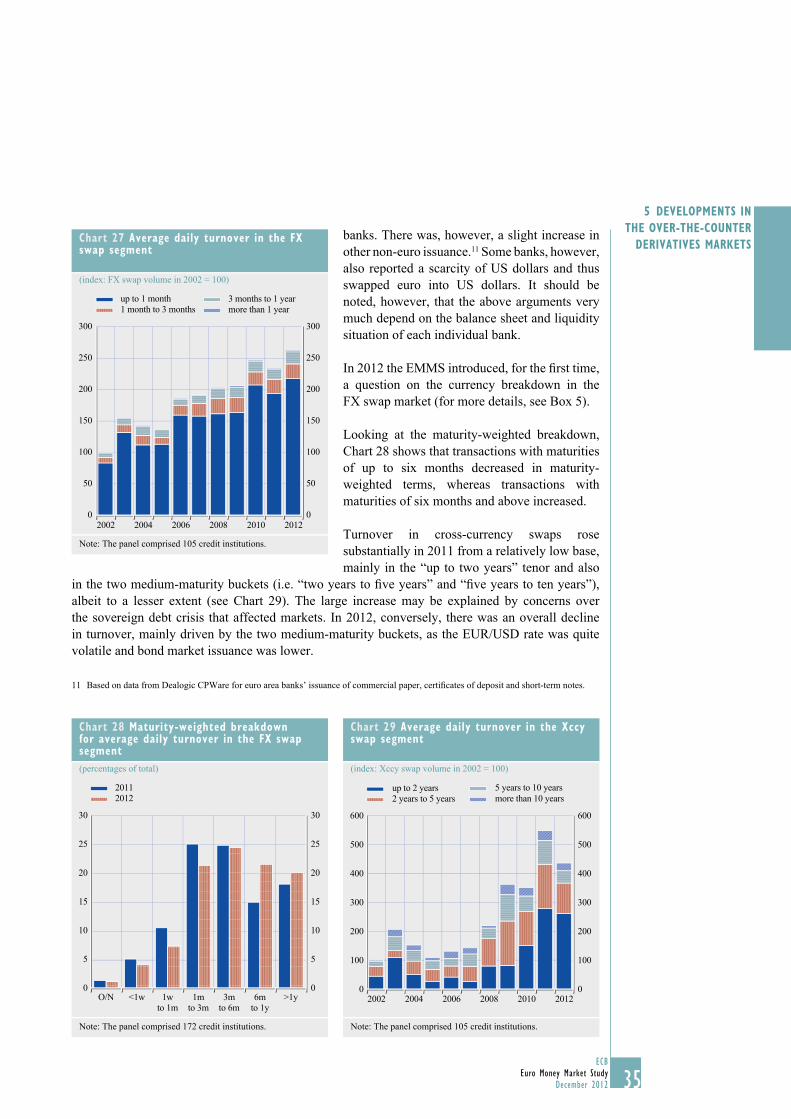
35ECB
Euro Money Market StudyDecember 2012 35
5 DEvElOpMENTS iN ThE OvER-ThE-cOUNTER
DERivATivES MARKETSbanks. There was, however, a slight increase in other non-euro issuance.11 Some banks, however, also reported a scarcity of US dollars and thus swapped euro into US dollars. It should be noted, however, that the above arguments very much depend on the balance sheet and liquidity situation of each individual bank.
In 2012 the EMMS introduced, for the fi rst time, a question on the currency breakdown in the FX swap market (for more details, see Box 5).
Looking at the maturity-weighted breakdown, Chart 28 shows that transactions with maturities of up to six months decreased in maturity-weighted terms, whereas transactions with maturities of six months and above increased.
Turnover in cross-currency swaps rose substantially in 2011 from a relatively low base, mainly in the “up to two years” tenor and also
in the two medium-maturity buckets (i.e. “two years to fi ve years” and “fi ve years to ten years”), albeit to a lesser extent (see Chart 29). The large increase may be explained by concerns over the sovereign debt crisis that affected markets. In 2012, conversely, there was an overall decline in turnover, mainly driven by the two medium-maturity buckets, as the EUR/USD rate was quite volatile and bond market issuance was lower.
Based on data from Dealogic CPWare for euro area banks’ issuance of commercial paper, certifi cates of deposit and short-term notes.11
chart 27 Average daily turnover in the fx swap segment
(index: FX swap volume in 2002 = 100)
0
50
100
150
200
250
300
20120
50
100
150
200
250
300
up to 1 month1 month to 3 months
3 months to 1 yearmore than 1 year
2002 2004 2006 2008 2010
Note: The panel comprised 105 credit institutions.
chart 28 Maturity-weighted breakdown for average daily turnover in the fx swap segment(percentages of total)
0
5
10
15
20
25
30
0
5
10
15
20
25
30
20112012
O/N <1w 1wto 1m
1mto 3m
3mto 6m
6mto 1y
>1y
Note: The panel comprised 172 credit institutions.
chart 29 Average daily turnover in the xccy swap segment
(index: Xccy swap volume in 2002 = 100)
0
100
200
300
400
500
600
0
100
200
300
400
500
600
up to 2 years2 years to 5 years
5 years to 10 yearsmore than 10 years
2002 2004 2006 2008 2010 2012
Note: The panel comprised 105 credit institutions.
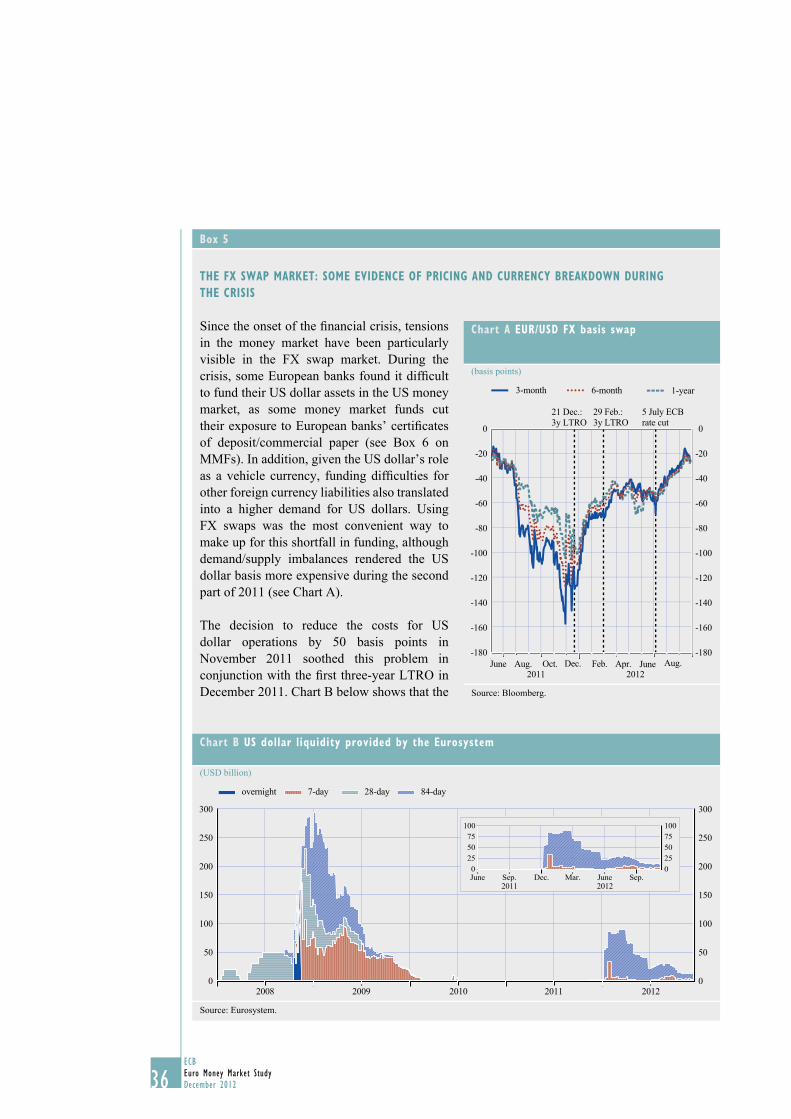
36ECBEuro Money Market StudyDecember 201236
box 5
ThE fx SwAp MARKET: SOME EviDENcE Of pRiciNg AND cURRENcY bREAKDOwN DURiNg ThE cRiSiS
Since the onset of the fi nancial crisis, tensions in the money market have been particularly visible in the FX swap market. During the crisis, some European banks found it diffi cult to fund their US dollar assets in the US money market, as some money market funds cut their exposure to European banks’ certifi cates of deposit/commercial paper (see Box 6 on MMFs). In addition, given the US dollar’s role as a vehicle currency, funding diffi culties for other foreign currency liabilities also translated into a higher demand for US dollars. Using FX swaps was the most convenient way to make up for this shortfall in funding, although demand/supply imbalances rendered the US dollar basis more expensive during the second part of 2011 (see Chart A).
The decision to reduce the costs for US dollar operations by 50 basis points in November 2011 soothed this problem in conjunction with the fi rst three-year LTRO in December 2011. Chart B below shows that the
chart A EUR/USD fx basis swap
(basis points)
-180
-160
-140
-120
-100
-80
-60
-40
-20
0
-180
-160
-140
-120
-100
-80
-60
-40
-20
0
21 Dec.: 3y LTRO
5 July ECB rate cut
29 Feb.: 3y LTRO
3-month 1-year6-month
June Aug. Oct. Dec. Feb. Apr. June Aug.2011 2012
Source: Bloomberg.
chart b US dollar liquidity provided by the Eurosystem
(USD billion)
50
0
100
150
200
250
300
50
0
100
150
200
250
300
overnight 7-day 28-day 84-day
2008 2009 2010 2011 2012
0255075
100
0255075100
June Sep. Dec. Mar. June Sep.2011 2012
Source: Eurosystem.
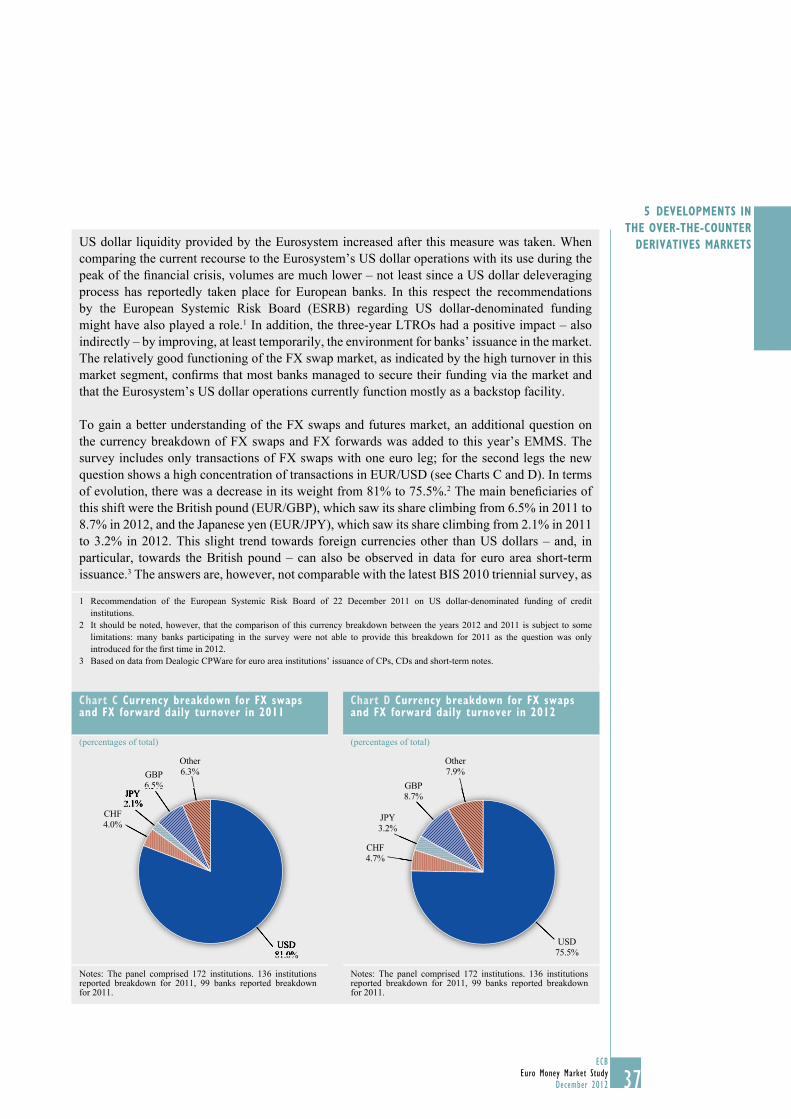
37ECB
Euro Money Market StudyDecember 2012 37
5 DEvElOpMENTS iN ThE OvER-ThE-cOUNTER
DERivATivES MARKETSUS dollar liquidity provided by the Eurosystem increased after this measure was taken. When comparing the current recourse to the Eurosystem’s US dollar operations with its use during the peak of the fi nancial crisis, volumes are much lower – not least since a US dollar deleveraging process has reportedly taken place for European banks. In this respect the recommendations by the European Systemic Risk Board (ESRB) regarding US dollar-denominated funding might have also played a role.1 In addition, the three-year LTROs had a positive impact – also indirectly – by improving, at least temporarily, the environment for banks’ issuance in the market. The relatively good functioning of the FX swap market, as indicated by the high turnover in this market segment, confi rms that most banks managed to secure their funding via the market and that the Eurosystem’s US dollar operations currently function mostly as a backstop facility.
To gain a better understanding of the FX swaps and futures market, an additional question on the currency breakdown of FX swaps and FX forwards was added to this year’s EMMS. The survey includes only transactions of FX swaps with one euro leg; for the second legs the new question shows a high concentration of transactions in EUR/USD (see Charts C and D). In terms of evolution, there was a decrease in its weight from 81% to 75.5%.2 The main benefi ciaries of this shift were the British pound (EUR/GBP), which saw its share climbing from 6.5% in 2011 to 8.7% in 2012, and the Japanese yen (EUR/JPY), which saw its share climbing from 2.1% in 2011 to 3.2% in 2012. This slight trend towards foreign currencies other than US dollars – and, in particular, towards the British pound – can also be observed in data for euro area short-term issuance.3 The answers are, however, not comparable with the latest BIS 2010 triennial survey, as
1 Recommendation of the European Systemic Risk Board of 22 December 2011 on US dollar-denominated funding of credit institutions.
2 It should be noted, however, that the comparison of this currency breakdown between the years 2012 and 2011 is subject to some limitations: many banks participating in the survey were not able to provide this breakdown for 2011 as the question was only introduced for the fi rst time in 2012.
3 Based on data from Dealogic CPWare for euro area institutions’ issuance of CPs, CDs and short-term notes.
chart c currency breakdown for fx swaps and fx forward daily turnover in 2011
(percentages of total)
USD81.0%
CHF4.0%
JPY2.1%
GBP6.5%
Other6.3%
USD81.0%
JPY2.1%
6.5%
Notes: The panel comprised 172 institutions. 136 institutions reported breakdown for 2011, 99 banks reported breakdown for 2011.
chart D currency breakdown for fx swaps and fx forward daily turnover in 2012
(percentages of total)
USD75.5%
CHF4.7%
GBP8.7%
Other7.9%
JPY3.2%
Notes: The panel comprised 172 institutions. 136 institutions reported breakdown for 2011, 99 banks reported breakdown for 2011.
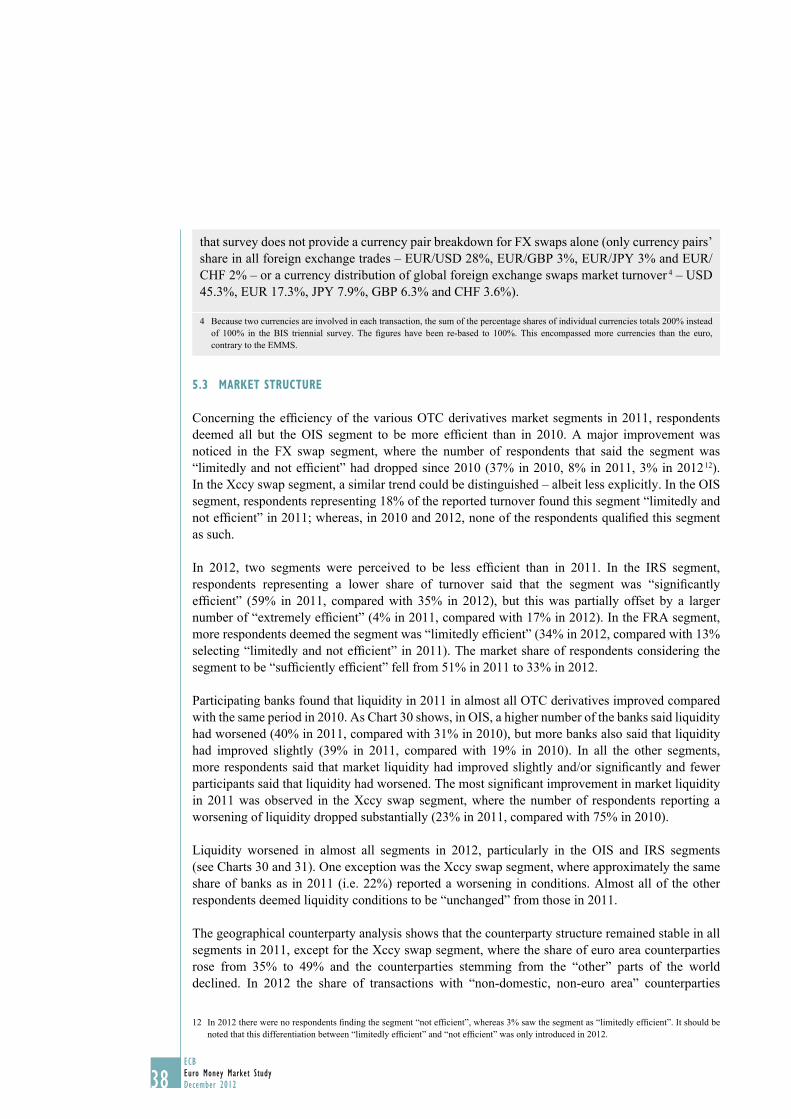
38ECBEuro Money Market StudyDecember 201238
5.3 MARKET STRUcTURE
Concerning the efficiency of the various OTC derivatives market segments in 2011, respondents deemed all but the OIS segment to be more efficient than in 2010. A major improvement was noticed in the FX swap segment, where the number of respondents that said the segment was “limitedly and not efficient” had dropped since 2010 (37% in 2010, 8% in 2011, 3% in 2012 12). In the Xccy swap segment, a similar trend could be distinguished – albeit less explicitly. In the OIS segment, respondents representing 18% of the reported turnover found this segment “limitedly and not efficient” in 2011; whereas, in 2010 and 2012, none of the respondents qualified this segment as such.
In 2012, two segments were perceived to be less efficient than in 2011. In the IRS segment, respondents representing a lower share of turnover said that the segment was “significantly efficient” (59% in 2011, compared with 35% in 2012), but this was partially offset by a larger number of “extremely efficient” (4% in 2011, compared with 17% in 2012). In the FRA segment, more respondents deemed the segment was “limitedly efficient” (34% in 2012, compared with 13% selecting “limitedly and not efficient” in 2011). The market share of respondents considering the segment to be “sufficiently efficient” fell from 51% in 2011 to 33% in 2012.
Participating banks found that liquidity in 2011 in almost all OTC derivatives improved compared with the same period in 2010. As Chart 30 shows, in OIS, a higher number of the banks said liquidity had worsened (40% in 2011, compared with 31% in 2010), but more banks also said that liquidity had improved slightly (39% in 2011, compared with 19% in 2010). In all the other segments, more respondents said that market liquidity had improved slightly and/or significantly and fewer participants said that liquidity had worsened. The most significant improvement in market liquidity in 2011 was observed in the Xccy swap segment, where the number of respondents reporting a worsening of liquidity dropped substantially (23% in 2011, compared with 75% in 2010).
Liquidity worsened in almost all segments in 2012, particularly in the OIS and IRS segments (see Charts 30 and 31). One exception was the Xccy swap segment, where approximately the same share of banks as in 2011 (i.e. 22%) reported a worsening in conditions. Almost all of the other respondents deemed liquidity conditions to be “unchanged” from those in 2011.
The geographical counterparty analysis shows that the counterparty structure remained stable in all segments in 2011, except for the Xccy swap segment, where the share of euro area counterparties rose from 35% to 49% and the counterparties stemming from the “other” parts of the world declined. In 2012 the share of transactions with “non-domestic, non-euro area” counterparties
In 2012 there were no respondents finding the segment “not efficient”, whereas 3% saw the segment as “limitedly efficient”. It should be 12 noted that this differentiation between “limitedly efficient” and “not efficient” was only introduced in 2012.
that survey does not provide a currency pair breakdown for FX swaps alone (only currency pairs’ share in all foreign exchange trades – EUR/USD 28%, EUR/GBP 3%, EUR/JPY 3% and EUR/CHF 2% – or a currency distribution of global foreign exchange swaps market turnover 4 – USD 45.3%, EUR 17.3%, JPY 7.9%, GBP 6.3% and CHF 3.6%).
4 Because two currencies are involved in each transaction, the sum of the percentage shares of individual currencies totals 200% instead of 100% in the BIS triennial survey. The figures have been re-based to 100%. This encompassed more currencies than the euro, contrary to the EMMS.
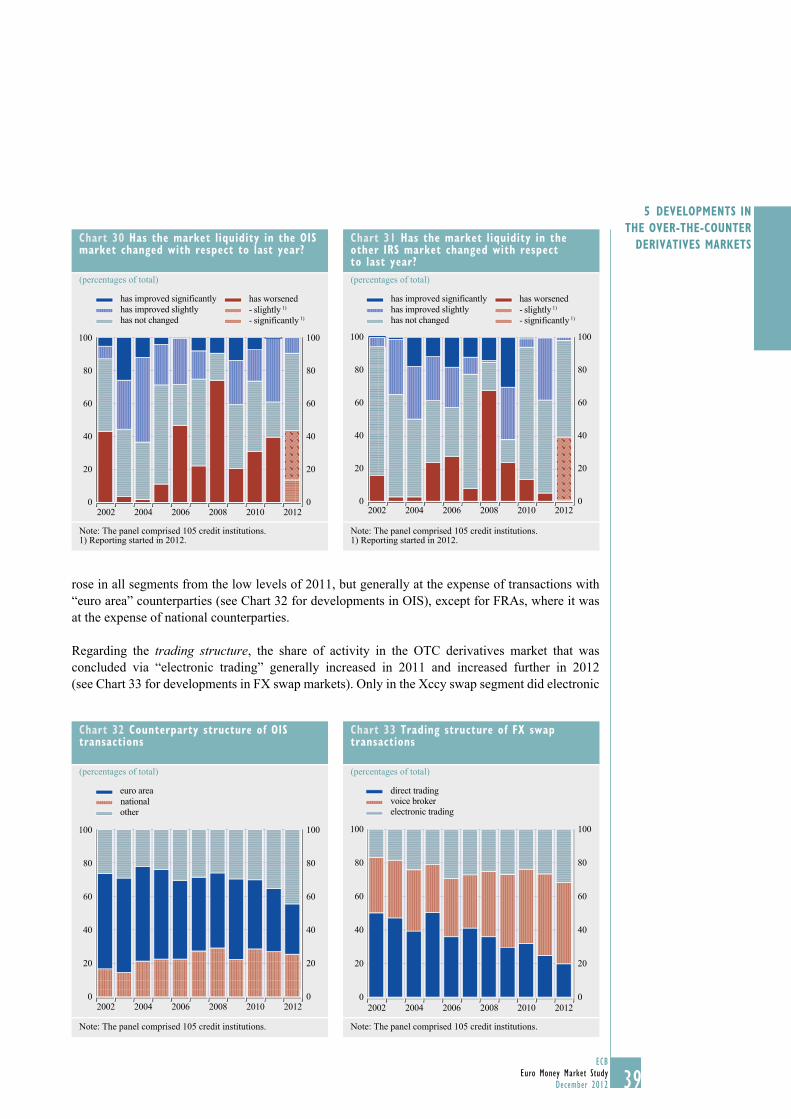
39ECB
Euro Money Market StudyDecember 2012 39
5 DEvElOpMENTS iN ThE OvER-ThE-cOUNTER
DERivATivES MARKETS
rose in all segments from the low levels of 2011, but generally at the expense of transactions with “euro area” counterparties (see Chart 32 for developments in OIS), except for FRAs, where it was at the expense of national counterparties.
Regarding the trading structure, the share of activity in the OTC derivatives market that was concluded via “electronic trading” generally increased in 2011 and increased further in 2012 (see Chart 33 for developments in FX swap markets). Only in the Xccy swap segment did electronic
chart 30 has the market liquidity in the OiS market changed with respect to last year?
(percentages of total)
0 0
20
40
60
80
100
20
40
60
80
100
2002 2004 2006 2008 2010 2012
has worsened
- significantly 1)- slightly 1)
has not changedhas improved slightlyhas improved significantly
Note: The panel comprised 105 credit institutions.1) Reporting started in 2012.
chart 31 has the market liquidity in the other iRS market changed with respect to last year?(percentages of total)
0
20
40
60
80
100
0
20
40
60
80
100
2002 2004 2006 2008 2010 2012
has worsened
- significantly 1)- slightly 1)
has not changedhas improved slightlyhas improved significantly
Note: The panel comprised 105 credit institutions.1) Reporting started in 2012.
chart 32 counterparty structure of OiS transactions
(percentages of total)
0
20
40
60
80
100
0
20
40
60
80
100
nationaleuro area
other
2002 2004 2006 2008 2010 2012
Note: The panel comprised 105 credit institutions.
chart 33 Trading structure of fx swap transactions
(percentages of total)
0
20
40
60
80
100
0
20
40
60
80
100
direct tradingvoice brokerelectronic trading
2002 2004 2006 2008 2010 2012
Note: The panel comprised 105 credit institutions.
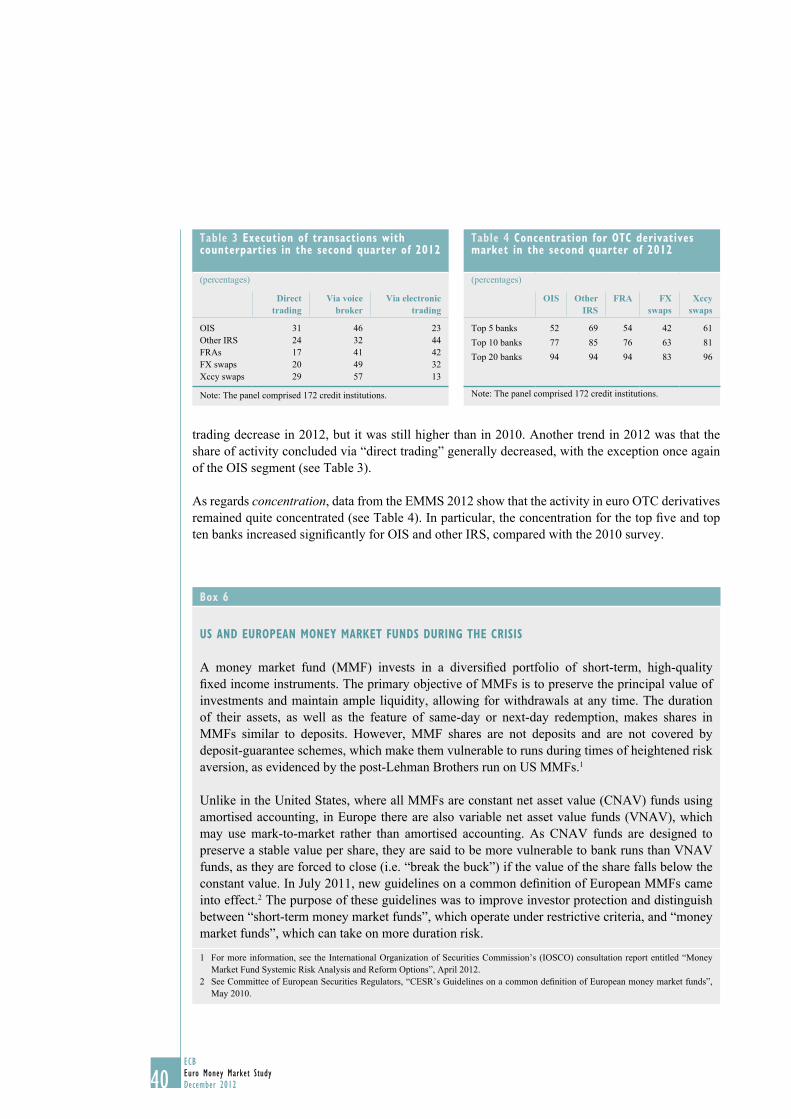
40ECBEuro Money Market StudyDecember 201240
trading decrease in 2012, but it was still higher than in 2010. Another trend in 2012 was that the share of activity concluded via “direct trading” generally decreased, with the exception once again of the OIS segment (see Table 3).
As regards concentration, data from the EMMS 2012 show that the activity in euro OTC derivatives remained quite concentrated (see Table 4). In particular, the concentration for the top five and top ten banks increased significantly for OIS and other IRS, compared with the 2010 survey.
Table 3 Execution of transactions with counterparties in the second quarter of 2012
(percentages)
Direct trading
Via voice broker
Via electronic trading
OIS 31 46 23Other IRS 24 32 44FRAs 17 41 42FX swaps 20 49 32Xccy swaps 29 57 13
Note: The panel comprised 172 credit institutions.
Table 4 concentration for OTc derivatives market in the second quarter of 2012
(percentages)
OIS Other IRS
FRA FX swaps
Xccy swaps
Top 5 banks 52 69 54 42 61 Top 10 banks 77 85 76 63 81 Top 20 banks 94 94 94 83 96
Note: The panel comprised 172 credit institutions.
box 6
US AND EUROpEAN MONEY MARKET fUNDS DURiNg ThE cRiSiS
A money market fund (MMF) invests in a diversified portfolio of short-term, high-quality fixed income instruments. The primary objective of MMFs is to preserve the principal value of investments and maintain ample liquidity, allowing for withdrawals at any time. The duration of their assets, as well as the feature of same-day or next-day redemption, makes shares in MMFs similar to deposits. However, MMF shares are not deposits and are not covered by deposit-guarantee schemes, which make them vulnerable to runs during times of heightened risk aversion, as evidenced by the post-Lehman Brothers run on US MMFs.1
Unlike in the United States, where all MMFs are constant net asset value (CNAV) funds using amortised accounting, in Europe there are also variable net asset value funds (VNAV), which may use mark-to-market rather than amortised accounting. As CNAV funds are designed to preserve a stable value per share, they are said to be more vulnerable to bank runs than VNAV funds, as they are forced to close (i.e. “break the buck”) if the value of the share falls below the constant value. In July 2011, new guidelines on a common definition of European MMFs came into effect.2 The purpose of these guidelines was to improve investor protection and distinguish between “short-term money market funds”, which operate under restrictive criteria, and “money market funds”, which can take on more duration risk.
1 For more information, see the International Organization of Securities Commission’s (IOSCO) consultation report entitled “Money Market Fund Systemic Risk Analysis and Reform Options”, April 2012.
2 See Committee of European Securities Regulators, “CESR’s Guidelines on a common definition of European money market funds”, May 2010.
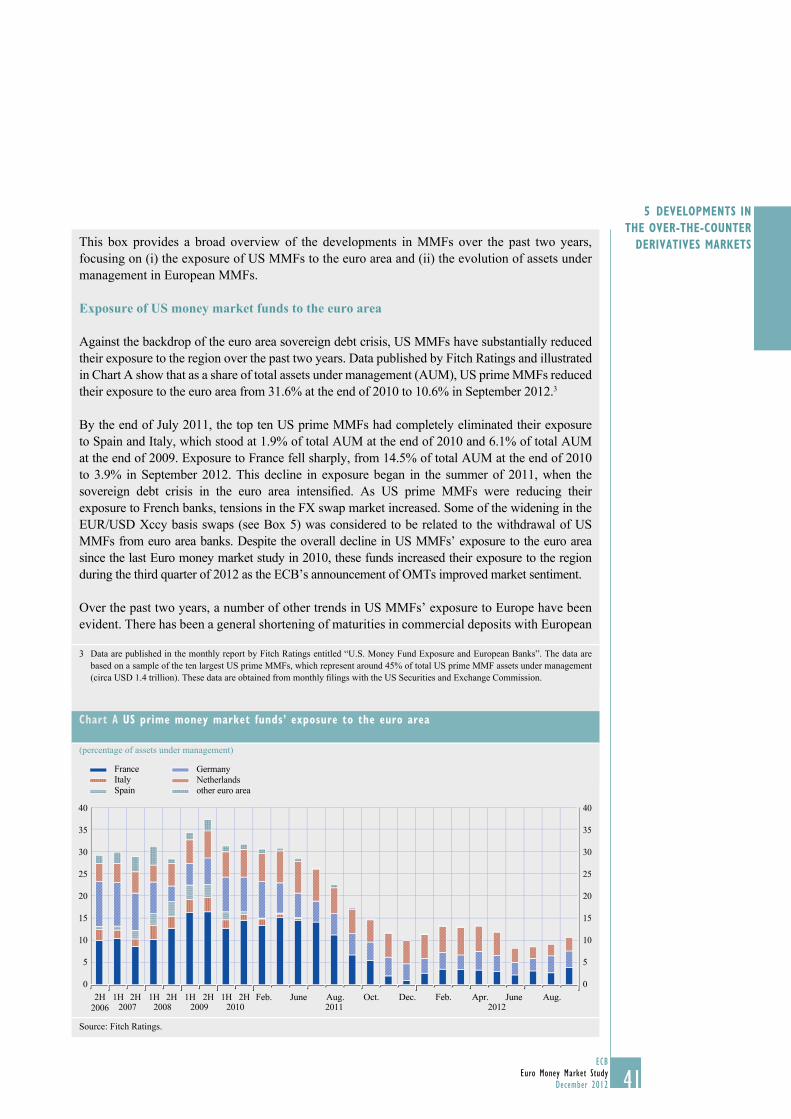
41ECB
Euro Money Market StudyDecember 2012 41
5 DEvElOpMENTS iN ThE OvER-ThE-cOUNTER
DERivATivES MARKETSThis box provides a broad overview of the developments in MMFs over the past two years, focusing on (i) the exposure of US MMFs to the euro area and (ii) the evolution of assets under management in European MMFs.
Exposure of US money market funds to the euro area
Against the backdrop of the euro area sovereign debt crisis, US MMFs have substantially reduced their exposure to the region over the past two years. Data published by Fitch Ratings and illustrated in Chart A show that as a share of total assets under management (AUM), US prime MMFs reduced their exposure to the euro area from 31.6% at the end of 2010 to 10.6% in September 2012.3
By the end of July 2011, the top ten US prime MMFs had completely eliminated their exposure to Spain and Italy, which stood at 1.9% of total AUM at the end of 2010 and 6.1% of total AUM at the end of 2009. Exposure to France fell sharply, from 14.5% of total AUM at the end of 2010 to 3.9% in September 2012. This decline in exposure began in the summer of 2011, when the sovereign debt crisis in the euro area intensifi ed. As US prime MMFs were reducing their exposure to French banks, tensions in the FX swap market increased. Some of the widening in the EUR/USD Xccy basis swaps (see Box 5) was considered to be related to the withdrawal of US MMFs from euro area banks. Despite the overall decline in US MMFs’ exposure to the euro area since the last Euro money market study in 2010, these funds increased their exposure to the region during the third quarter of 2012 as the ECB’s announcement of OMTs improved market sentiment.
Over the past two years, a number of other trends in US MMFs’ exposure to Europe have been evident. There has been a general shortening of maturities in commercial deposits with European
3 Data are published in the monthly report by Fitch Ratings entitled “U.S. Money Fund Exposure and European Banks”. The data are based on a sample of the ten largest US prime MMFs, which represent around 45% of total US prime MMF assets under management (circa USD 1.4 trillion). These data are obtained from monthly fi lings with the US Securities and Exchange Commission.
chart A US prime money market funds’ exposure to the euro area
(percentage of assets under management)
0
5
10
15
20
25
30
35
40
0
5
10
15
20
25
30
35
40
2H2006
2H1H2007
2H1H2008
2H1H2009
2H1H2010 20122011
Feb. June Aug. Oct. Dec. Feb. Apr. June Aug.
FranceItalySpain
GermanyNetherlandsother euro area
Source: Fitch Ratings.
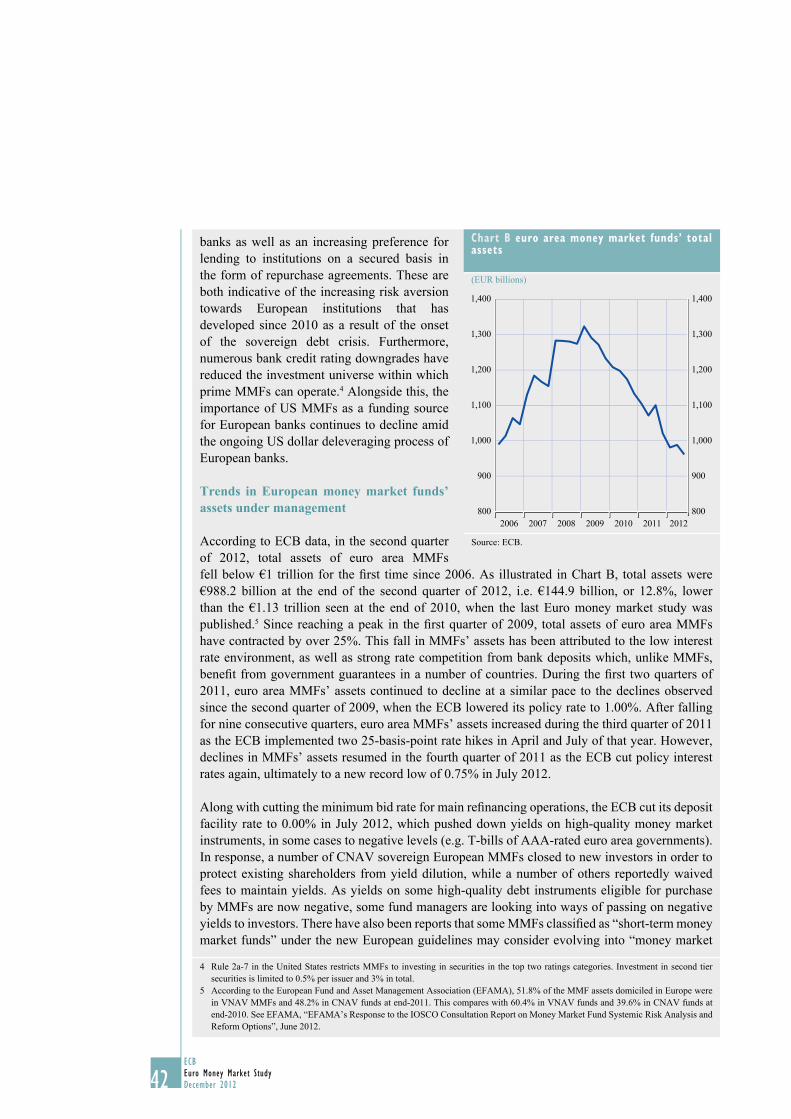
42ECBEuro Money Market StudyDecember 201242
banks as well as an increasing preference for lending to institutions on a secured basis in the form of repurchase agreements. These are both indicative of the increasing risk aversion towards European institutions that has developed since 2010 as a result of the onset of the sovereign debt crisis. Furthermore, numerous bank credit rating downgrades have reduced the investment universe within which prime MMFs can operate.4 Alongside this, the importance of US MMFs as a funding source for European banks continues to decline amid the ongoing US dollar deleveraging process of European banks.
Trends in European money market funds’ assets under management
According to ECB data, in the second quarter of 2012, total assets of euro area MMFs fell below €1 trillion for the fi rst time since 2006. As illustrated in Chart B, total assets were €988.2 billion at the end of the second quarter of 2012, i.e. €144.9 billion, or 12.8%, lower than the €1.13 trillion seen at the end of 2010, when the last Euro money market study was published.5 Since reaching a peak in the fi rst quarter of 2009, total assets of euro area MMFs have contracted by over 25%. This fall in MMFs’ assets has been attributed to the low interest rate environment, as well as strong rate competition from bank deposits which, unlike MMFs, benefi t from government guarantees in a number of countries. During the fi rst two quarters of 2011, euro area MMFs’ assets continued to decline at a similar pace to the declines observed since the second quarter of 2009, when the ECB lowered its policy rate to 1.00%. After falling for nine consecutive quarters, euro area MMFs’ assets increased during the third quarter of 2011 as the ECB implemented two 25-basis-point rate hikes in April and July of that year. However, declines in MMFs’ assets resumed in the fourth quarter of 2011 as the ECB cut policy interest rates again, ultimately to a new record low of 0.75% in July 2012.
Along with cutting the minimum bid rate for main refi nancing operations, the ECB cut its deposit facility rate to 0.00% in July 2012, which pushed down yields on high-quality money market instruments, in some cases to negative levels (e.g. T-bills of AAA-rated euro area governments). In response, a number of CNAV sovereign European MMFs closed to new investors in order to protect existing shareholders from yield dilution, while a number of others reportedly waived fees to maintain yields. As yields on some high-quality debt instruments eligible for purchase by MMFs are now negative, some fund managers are looking into ways of passing on negative yields to investors. There have also been reports that some MMFs classifi ed as “short-term money market funds” under the new European guidelines may consider evolving into “money market
4 Rule 2a-7 in the United States restricts MMFs to investing in securities in the top two ratings categories. Investment in second tier securities is limited to 0.5% per issuer and 3% in total.
5 According to the European Fund and Asset Management Association (EFAMA), 51.8% of the MMF assets domiciled in Europe were in VNAV MMFs and 48.2% in CNAV funds at end-2011. This compares with 60.4% in VNAV funds and 39.6% in CNAV funds at end-2010. See EFAMA, “EFAMA’s Response to the IOSCO Consultation Report on Money Market Fund Systemic Risk Analysis and Reform Options”, June 2012.
chart b euro area money market funds’ total assets
(EUR billions)
800
900
1,000
1,100
1,200
1,300
1,400
800
900
1,000
1,100
1,200
1,300
1,400
2006 2007 2008 2009 2010 2011 2012
Source: ECB.
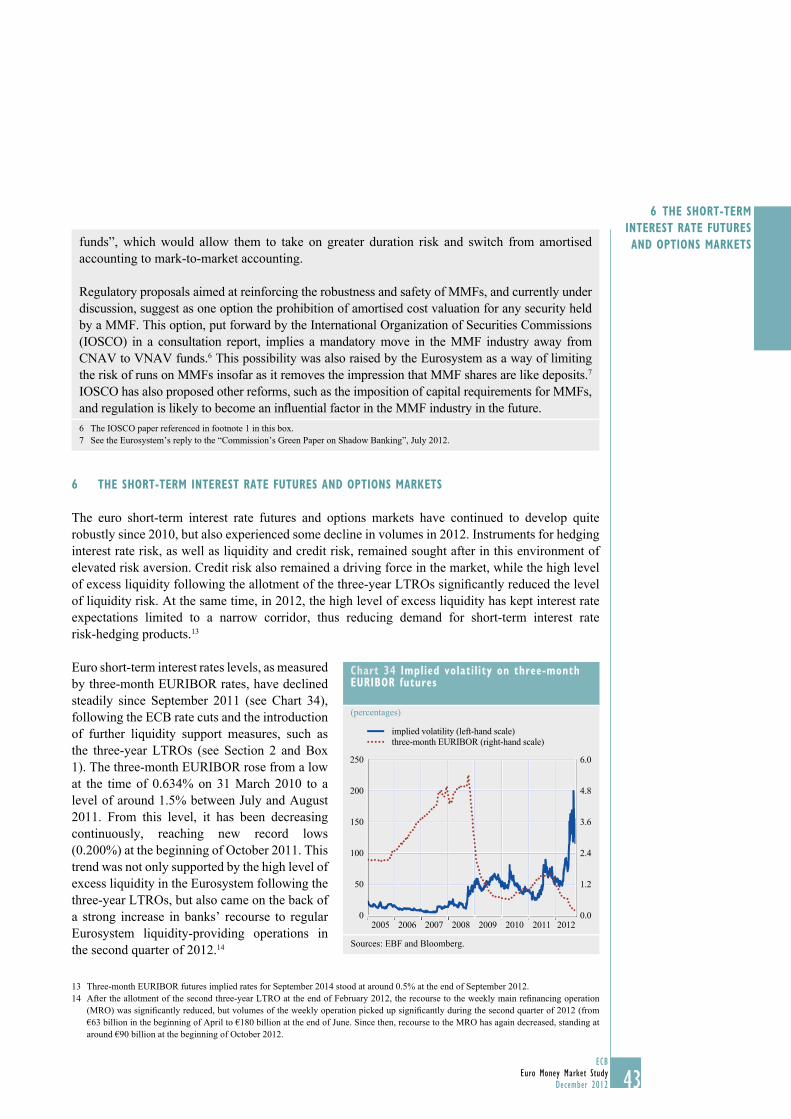
43ECB
Euro Money Market StudyDecember 2012 43
6 ThE ShORT-TERM iNTEREST RATE fUTURES AND OpTiONS MARKETS
6 ThE ShORT-TERM iNTEREST RATE fUTURES AND OpTiONS MARKETS
The euro short-term interest rate futures and options markets have continued to develop quite robustly since 2010, but also experienced some decline in volumes in 2012. Instruments for hedging interest rate risk, as well as liquidity and credit risk, remained sought after in this environment of elevated risk aversion. Credit risk also remained a driving force in the market, while the high level of excess liquidity following the allotment of the three-year LTROs signifi cantly reduced the level of liquidity risk. At the same time, in 2012, the high level of excess liquidity has kept interest rate expectations limited to a narrow corridor, thus reducing demand for short-term interest rate risk-hedging products.13
Euro short-term interest rates levels, as measured by three-month EURIBOR rates, have declined steadily since September 2011 (see Chart 34), following the ECB rate cuts and the introduction of further liquidity support measures, such as the three-year LTROs (see Section 2 and Box 1). The three-month EURIBOR rose from a low at the time of 0.634% on 31 March 2010 to a level of around 1.5% between July and August 2011. From this level, it has been decreasing continuously, reaching new record lows (0.200%) at the beginning of October 2011. This trend was not only supported by the high level of excess liquidity in the Eurosystem following the three-year LTROs, but also came on the back of a strong increase in banks’ recourse to regular Eurosystem liquidity-providing operations in the second quarter of 2012.14
Three-month EURIBOR futures implied rates for September 2014 stood at around 0.5% at the end of September 2012.13 After the allotment of the second three-year LTRO at the end of February 2012, the recourse to the weekly main refi nancing operation 14 (MRO) was signifi cantly reduced, but volumes of the weekly operation picked up signifi cantly during the second quarter of 2012 (from €63 billion in the beginning of April to €180 billion at the end of June. Since then, recourse to the MRO has again decreased, standing at around €90 billion at the beginning of October 2012.
funds”, which would allow them to take on greater duration risk and switch from amortised accounting to mark-to-market accounting.
Regulatory proposals aimed at reinforcing the robustness and safety of MMFs, and currently under discussion, suggest as one option the prohibition of amortised cost valuation for any security held by a MMF. This option, put forward by the International Organization of Securities Commissions (IOSCO) in a consultation report, implies a mandatory move in the MMF industry away from CNAV to VNAV funds.6 This possibility was also raised by the Eurosystem as a way of limiting the risk of runs on MMFs insofar as it removes the impression that MMF shares are like deposits.7 IOSCO has also proposed other reforms, such as the imposition of capital requirements for MMFs, and regulation is likely to become an infl uential factor in the MMF industry in the future.6 The IOSCO paper referenced in footnote 1 in this box.7 See the Eurosystem’s reply to the “Commission’s Green Paper on Shadow Banking”, July 2012.
chart 34 implied volatility on three-month EURibOR futures
(percentages)
0.0
1.2
2.4
3.6
4.8
6.0
0
50
100
150
200
250
2005 2006 2007 2008 2009 2010 2011 2012
implied volatility (left-hand scale)three-month EURIBOR (right-hand scale)
Sources: EBF and Bloomberg.
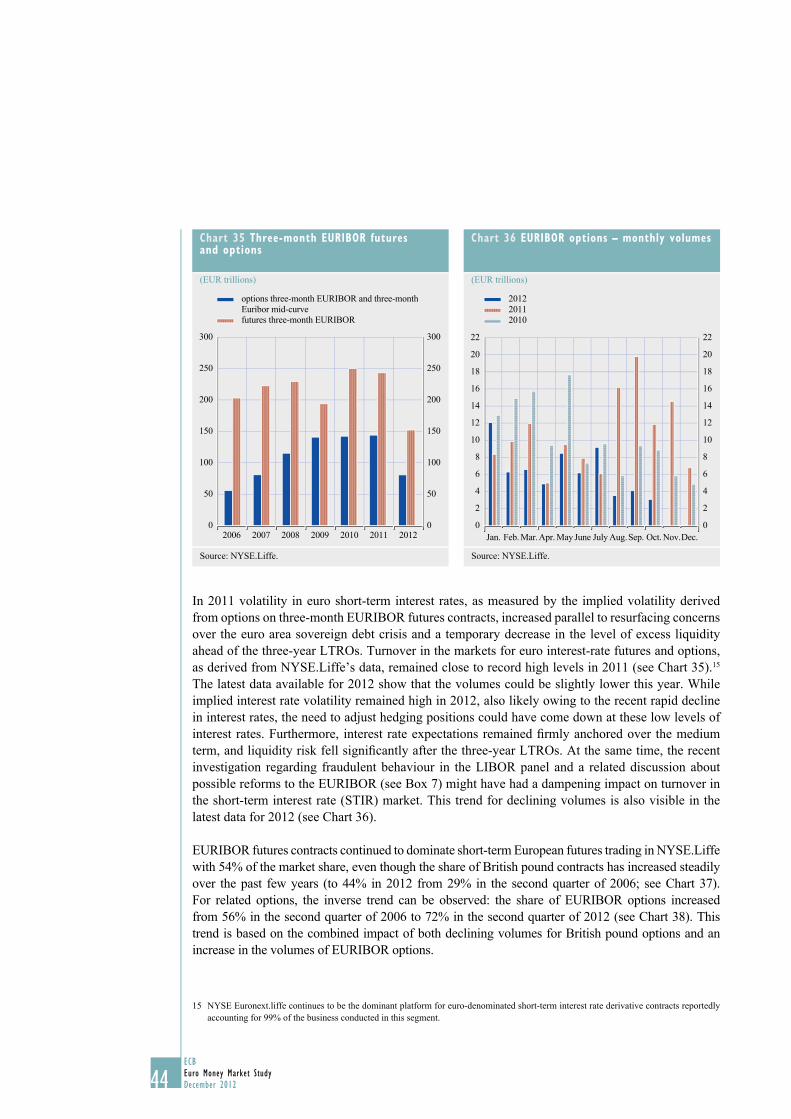
44ECBEuro Money Market StudyDecember 201244
In 2011 volatility in euro short-term interest rates, as measured by the implied volatility derived from options on three-month EURIBOR futures contracts, increased parallel to resurfacing concerns over the euro area sovereign debt crisis and a temporary decrease in the level of excess liquidity ahead of the three-year LTROs. Turnover in the markets for euro interest-rate futures and options, as derived from NYSE.Liffe’s data, remained close to record high levels in 2011 (see Chart 35).15 The latest data available for 2012 show that the volumes could be slightly lower this year. While implied interest rate volatility remained high in 2012, also likely owing to the recent rapid decline in interest rates, the need to adjust hedging positions could have come down at these low levels of interest rates. Furthermore, interest rate expectations remained fi rmly anchored over the medium term, and liquidity risk fell signifi cantly after the three-year LTROs. At the same time, the recent investigation regarding fraudulent behaviour in the LIBOR panel and a related discussion about possible reforms to the EURIBOR (see Box 7) might have had a dampening impact on turnover in the short-term interest rate (STIR) market. This trend for declining volumes is also visible in the latest data for 2012 (see Chart 36).
EURIBOR futures contracts continued to dominate short-term European futures trading in NYSE.Liffe with 54% of the market share, even though the share of British pound contracts has increased steadily over the past few years (to 44% in 2012 from 29% in the second quarter of 2006; see Chart 37). For related options, the inverse trend can be observed: the share of EURIBOR options increased from 56% in the second quarter of 2006 to 72% in the second quarter of 2012 (see Chart 38). This trend is based on the combined impact of both declining volumes for British pound options and an increase in the volumes of EURIBOR options.
NYSE Euronext.liffe continues to be the dominant platform for euro-denominated short-term interest rate derivative contracts reportedly 15 accounting for 99% of the business conducted in this segment.
chart 35 Three-month EURibOR futuresand options
(EUR trillions)
0
50
100
150
200
250
300
0
50
100
150
200
250
300
2006 2007 2008 2009 2010 2011 2012
options three-month EURIBOR and three-month Euribor mid-curvefutures three-month EURIBOR
Source: NYSE.Liffe.
chart 36 EURibOR options – monthly volumes
(EUR trillions)
0
2
4
6
8
10
12
14
16
18
20
22
0
2
4
6
8
10
12
14
16
18
20
22
Jan. Feb. Mar.Apr. May June July Aug.Sep. Oct. Nov.Dec.
201220112010
Source: NYSE.Liffe.
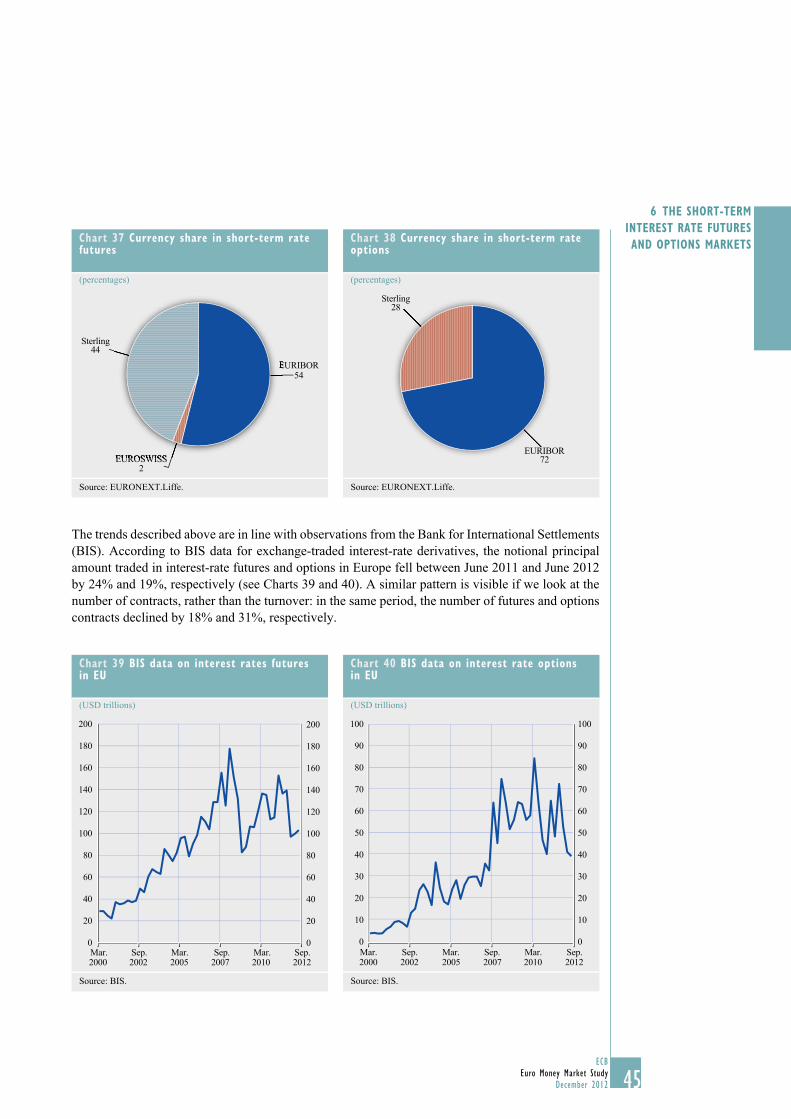
45ECB
Euro Money Market StudyDecember 2012 45
6 ThE ShORT-TERM iNTEREST RATE fUTURES AND OpTiONS MARKETS
The trends described above are in line with observations from the Bank for International Settlements (BIS). According to BIS data for exchange-traded interest-rate derivatives, the notional principal amount traded in interest-rate futures and options in Europe fell between June 2011 and June 2012 by 24% and 19%, respectively (see Charts 39 and 40). A similar pattern is visible if we look at the number of contracts, rather than the turnover: in the same period, the number of futures and options contracts declined by 18% and 31%, respectively.
chart 37 currency share in short-term rate futures
(percentages)
EUROSWISS
Sterling
EURIBOR54
44
2EUROSWISS
EURIBOR
Source: EURONEXT.Liffe.
chart 38 currency share in short-term rate options
(percentages)
EURIBOR72
Sterling28
Source: EURONEXT.Liffe.
chart 39 biS data on interest rates futures in EU
(USD trillions)
20
0
40
60
80
100
120
140
160
180
200
20
0
40
60
80
100
120
140
160
180
200
Mar. Sep. Mar. Sep.Mar. Sep.2000 2002 2005 2007 2010 2012
Source: BIS.
chart 40 biS data on interest rate options in EU
(USD trillions)
10
0
20
30
40
50
60
70
80
90
100
10
0
20
30
40
50
60
70
80
90
100
Mar.2000 2002 2005 2007 2010 2012
Sep. Mar. Sep. Mar. Sep.
Source: BIS.
46ECBEuro Money Market StudyDecember 201246
box 7
ThE EUROSYSTEM’S pOSiTiON ON EURibOR REfORM
The ECB has always taken an interest in EURIBOR and LIBOR as well as other important benchmarks, given their significance for the euro area, global financial markets and the real economy. The ECB believes that upholding the integrity and credibility of these market benchmarks is of fundamental importance. For this reason, the ECB is supporting the recent initiatives by policy-makers to review related issues with high priority. In particular, the Eurosystem, as an interested party in the integrity of the main interest rate financial benchmarks, participated in the European Commission’s public consultation and conveyed its view, as an interested party, on the steps necessary to reform EURIBOR.
The Eurosystem believes that there is significant scope for EURIBOR reform and that there are a number of measures that can be taken to increase market confidence in EURIBOR’s reliability, representativeness and resilience. The Eurosystem believes that any approach to EURIBOR reform should distinguish between short-term measures aimed at the immediate enhancement of confidence in the integrity of the benchmark and more medium to long-term changes.
In the short term, the focus should be on improving the governance process and on providing a clear road map for both the regulation and supervision of EURIBOR. Regarding governance, the ECB takes the view that, in order to enhance the governance structure surrounding the EURIBOR rate-setting process, there are a number of important measures that can be taken that are relatively easy to implement and that have the potential to increase market confidence in EURIBOR. It is also important for the changes implemented in the short term to be fully consistent with any subsequent reforms to avoid unnecessary disruptions.
Furthermore, the Eurosystem believes that, while such governance reforms represent necessary measures, further initiatives aimed at enhancing the reliability, representativeness and resilience of EURIBOR need to be considered. Increased reliance on transaction-based figures in the calculation of EURIBOR should be beneficial in this respect, although such changes can only be specified at a later stage after thorough testing. Making submissions more transaction-based would also enhance the effectiveness of the recommended governance measures, as transaction data are easier to verify ex post. However, any changes could have legal and financial stability implications, which need to be assessed.
Considering EURIBOR’s and LIBOR’s systemic importance, as well as their function as a public good and their role in monetary policy transmission, the Eurosystem believes that their regulation and that of other systemically important financial interest rate benchmarks should be considered, with a view to enhancing the governance of all the key processes surrounding the rate-setting process.
The Eurosystem considers that, given the systemic importance of EURIBOR and its role in monetary policy transmission, the European Supervisory Authorities (ESAs) could be involved in the supervision of the EURIBOR rate-setting process. The Eurosystem believes that authorities such as the European Securities and Markets Authority (ESMA) and the European Banking Authority (EBA) are better placed than the ECB to assume such a role.
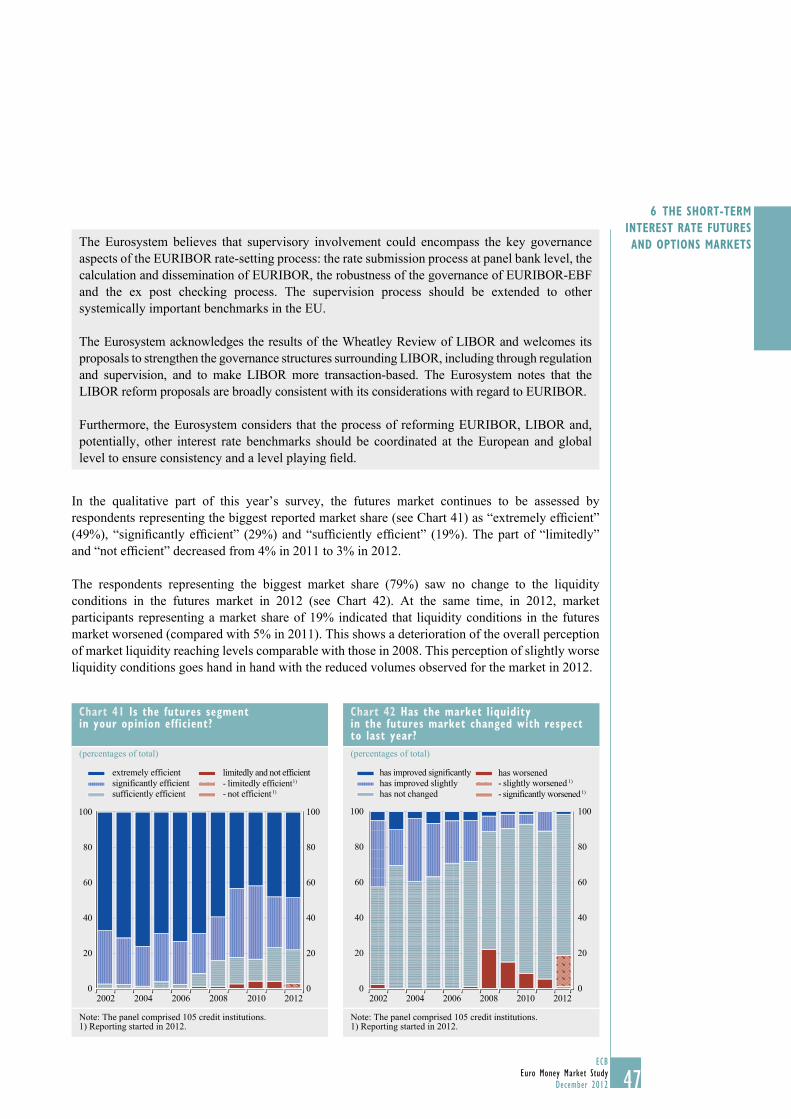
47ECB
Euro Money Market StudyDecember 2012 47
6 ThE ShORT-TERM iNTEREST RATE fUTURES AND OpTiONS MARKETS
In the qualitative part of this year’s survey, the futures market continues to be assessed by respondents representing the biggest reported market share (see Chart 41) as “extremely effi cient” (49%), “signifi cantly effi cient” (29%) and “suffi ciently effi cient” (19%). The part of “limitedly” and “not effi cient” decreased from 4% in 2011 to 3% in 2012.
The respondents representing the biggest market share (79%) saw no change to the liquidity conditions in the futures market in 2012 (see Chart 42). At the same time, in 2012, market participants representing a market share of 19% indicated that liquidity conditions in the futures market worsened (compared with 5% in 2011). This shows a deterioration of the overall perception of market liquidity reaching levels comparable with those in 2008. This perception of slightly worse liquidity conditions goes hand in hand with the reduced volumes observed for the market in 2012.
The Eurosystem believes that supervisory involvement could encompass the key governance aspects of the EURIBOR rate-setting process: the rate submission process at panel bank level, the calculation and dissemination of EURIBOR, the robustness of the governance of EURIBOR-EBF and the ex post checking process. The supervision process should be extended to other systemically important benchmarks in the EU.
The Eurosystem acknowledges the results of the Wheatley Review of LIBOR and welcomes its proposals to strengthen the governance structures surrounding LIBOR, including through regulation and supervision, and to make LIBOR more transaction-based. The Eurosystem notes that the LIBOR reform proposals are broadly consistent with its considerations with regard to EURIBOR.
Furthermore, the Eurosystem considers that the process of reforming EURIBOR, LIBOR and, potentially, other interest rate benchmarks should be coordinated at the European and global level to ensure consistency and a level playing fi eld.
chart 41 is the futures segment in your opinion efficient?
(percentages of total)
0
20
40
60
80
100
0
20
40
60
80
100
2002 2004 2006 2008 2010 2012
limitedly and not efficient
- not efficient 1)- limitedly efficient 1)
sufficiently efficientsignificantly efficientextremely efficient
Note: The panel comprised 105 credit institutions.1) Reporting started in 2012.
chart 42 has the market liquidity in the futures market changed with respect to last year?(percentages of total)
0
20
40
60
80
100
0
20
40
60
80
100
2002 2004 2006 2008 2010 2012
has worsened
- significantly worsened 1)- slightly worsened 1)
has not changedhas improved slightlyhas improved significantly
Note: The panel comprised 105 credit institutions.1) Reporting started in 2012.
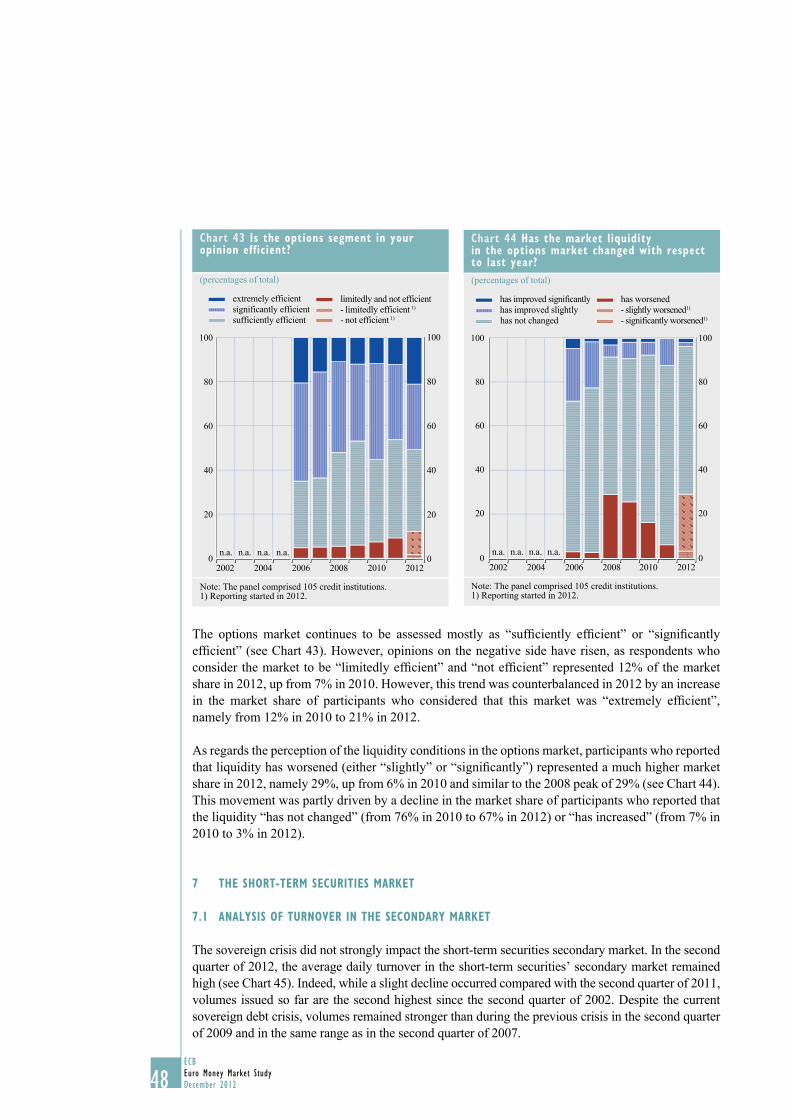
48ECBEuro Money Market StudyDecember 201248
The options market continues to be assessed mostly as “suffi ciently effi cient” or “signifi cantly effi cient” (see Chart 43). However, opinions on the negative side have risen, as respondents who consider the market to be “limitedly effi cient” and “not effi cient” represented 12% of the market share in 2012, up from 7% in 2010. However, this trend was counterbalanced in 2012 by an increase in the market share of participants who considered that this market was “extremely effi cient”, namely from 12% in 2010 to 21% in 2012.
As regards the perception of the liquidity conditions in the options market, participants who reported that liquidity has worsened (either “slightly” or “signifi cantly”) represented a much higher market share in 2012, namely 29%, up from 6% in 2010 and similar to the 2008 peak of 29% (see Chart 44). This movement was partly driven by a decline in the market share of participants who reported that the liquidity “has not changed” (from 76% in 2010 to 67% in 2012) or “has increased” (from 7% in 2010 to 3% in 2012).
7 ThE ShORT-TERM SEcURiTiES MARKET
7.1 ANAlYSiS Of TURNOvER iN ThE SEcONDARY MARKET
The sovereign crisis did not strongly impact the short-term securities secondary market. In the second quarter of 2012, the average daily turnover in the short-term securities’ secondary market remained high (see Chart 45). Indeed, while a slight decline occurred compared with the second quarter of 2011, volumes issued so far are the second highest since the second quarter of 2002. Despite the current sovereign debt crisis, volumes remained stronger than during the previous crisis in the second quarter of 2009 and in the same range as in the second quarter of 2007.
chart 43 is the options segment in your opinion efficient?
(percentages of total)
0
20
40
60
80
100
0
20
40
60
80
100
n.a. n.a. n.a. n.a.
2002 2004 2006 2008 2010 2012
limitedly and not efficient
- not efficient 1)- limitedly efficient 1)
sufficiently efficientsignificantly efficientextremely efficient
Note: The panel comprised 105 credit institutions.1) Reporting started in 2012.
chart 44 has the market liquidity in the options market changed with respect to last year?(percentages of total)
0
20
40
60
80
100
0
20
40
60
80
100
2002 2004 2006 2008 2010 2012
n.a. n.a. n.a.n.a.
has not changedhas improved slightlyhas improved significantly
- significantly worsened1)- slightly worsened1)has worsened
Note: The panel comprised 105 credit institutions.1) Reporting started in 2012.
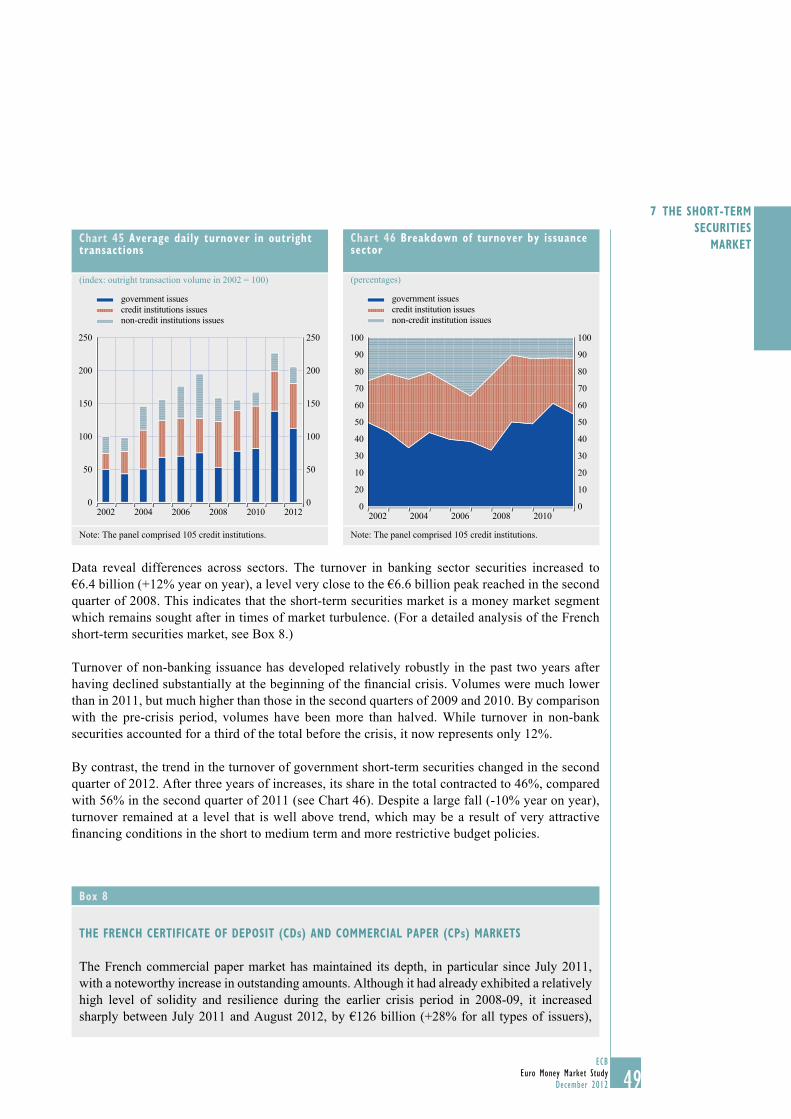
49ECB
Euro Money Market StudyDecember 2012 49
7 ThE ShORT-TERM SEcURiTiES
MARKET
Data reveal differences across sectors. The turnover in banking sector securities increased to €6.4 billion (+12% year on year), a level very close to the €6.6 billion peak reached in the second quarter of 2008. This indicates that the short-term securities market is a money market segment which remains sought after in times of market turbulence. (For a detailed analysis of the French short-term securities market, see Box 8.)
Turnover of non-banking issuance has developed relatively robustly in the past two years after having declined substantially at the beginning of the fi nancial crisis. Volumes were much lower than in 2011, but much higher than those in the second quarters of 2009 and 2010. By comparison with the pre-crisis period, volumes have been more than halved. While turnover in non-bank securities accounted for a third of the total before the crisis, it now represents only 12%.
By contrast, the trend in the turnover of government short-term securities changed in the second quarter of 2012. After three years of increases, its share in the total contracted to 46%, compared with 56% in the second quarter of 2011 (see Chart 46). Despite a large fall (-10% year on year), turnover remained at a level that is well above trend, which may be a result of very attractive fi nancing conditions in the short to medium term and more restrictive budget policies.
chart 45 Average daily turnover in outright transactions
(index: outright transaction volume in 2002 = 100)
0
50
100
150
200
250
0
50
100
150
200
250
2002 2004 2006 2008 2010 2012
government issuescredit institutions issuesnon-credit institutions issues
Note: The panel comprised 105 credit institutions.
chart 46 breakdown of turnover by issuance sector
(percentages)
0
10
20
30
40
50
60
70
80
90
100
0
10
20
30
40
50
60
70
80
90
100
2002 2004 2006 2008 2010
government issuescredit institution issuesnon-credit institution issues
Note: The panel comprised 105 credit institutions.
box 8
ThE fRENch cERTificATE Of DEpOSiT (cDs) AND cOMMERciAl pApER (cps) MARKETS
The French commercial paper market has maintained its depth, in particular since July 2011, with a noteworthy increase in outstanding amounts. Although it had already exhibited a relatively high level of solidity and resilience during the earlier crisis period in 2008-09, it increased sharply between July 2011 and August 2012, by €126 billion (+28% for all types of issuers),
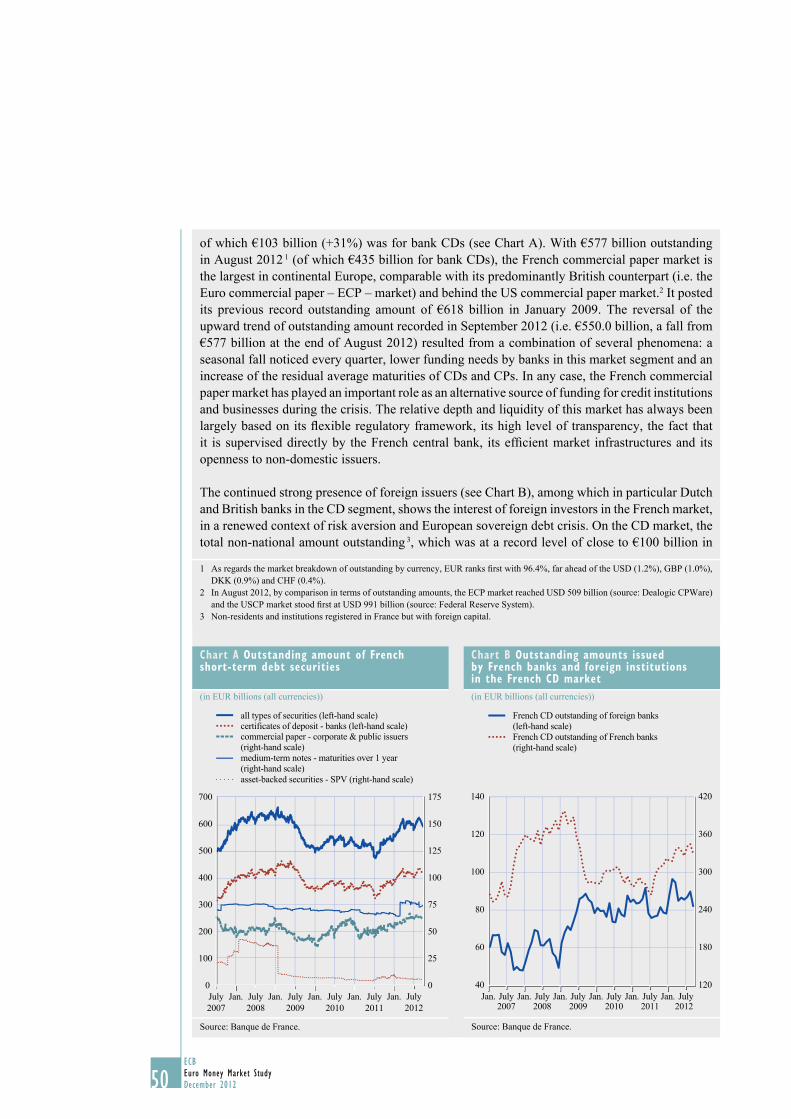
50ECBEuro Money Market StudyDecember 201250
of which €103 billion (+31%) was for bank CDs (see Chart A). With €577 billion outstanding in August 2012 1 (of which €435 billion for bank CDs), the French commercial paper market is the largest in continental Europe, comparable with its predominantly British counterpart (i.e. the Euro commercial paper – ECP – market) and behind the US commercial paper market.2 It posted its previous record outstanding amount of €618 billion in January 2009. The reversal of the upward trend of outstanding amount recorded in September 2012 (i.e. €550.0 billion, a fall from €577 billion at the end of August 2012) resulted from a combination of several phenomena: a seasonal fall noticed every quarter, lower funding needs by banks in this market segment and an increase of the residual average maturities of CDs and CPs. In any case, the French commercial paper market has played an important role as an alternative source of funding for credit institutions and businesses during the crisis. The relative depth and liquidity of this market has always been largely based on its fl exible regulatory framework, its high level of transparency, the fact that it is supervised directly by the French central bank, its effi cient market infrastructures and its openness to non-domestic issuers.
The continued strong presence of foreign issuers (see Chart B), among which in particular Dutch and British banks in the CD segment, shows the interest of foreign investors in the French market, in a renewed context of risk aversion and European sovereign debt crisis. On the CD market, the total non-national amount outstanding 3, which was at a record level of close to €100 billion in
1 As regards the market breakdown of outstanding by currency, EUR ranks fi rst with 96.4%, far ahead of the USD (1.2%), GBP (1.0%), DKK (0.9%) and CHF (0.4%).
2 In August 2012, by comparison in terms of outstanding amounts, the ECP market reached USD 509 billion (source: Dealogic CPWare) and the USCP market stood fi rst at USD 991 billion (source: Federal Reserve System).
3 Non-residents and institutions registered in France but with foreign capital.
chart A Outstanding amount of french short-term debt securities
(in EUR billions (all currencies))
0
25
50
75
100
125
150
175
0
100
200
300
400
500
600
700
2007 2008 2009 2010 2011 2012
all types of securities (left-hand scale)certificates of deposit - banks (left-hand scale)commercial paper - corporate & public issuers (right-hand scale)medium-term notes - maturities over 1 year (right-hand scale)asset-backed securities - SPV (right-hand scale)
July Jan. Jan. Jan. Jan. Jan.July July July July July
Source: Banque de France.
chart b Outstanding amounts issued by french banks and foreign institutions in the french cD market(in EUR billions (all currencies))
120
180
240
300
360
420
40
60
80
100
120
140
French CD outstanding of foreign banks (left-hand scale)French CD outstanding of French banks (right-hand scale)
2007Jan. July Jan. July Jan. July Jan. July Jan. July Jan. July
2008 2009 2010 2011 2012
Source: Banque de France.
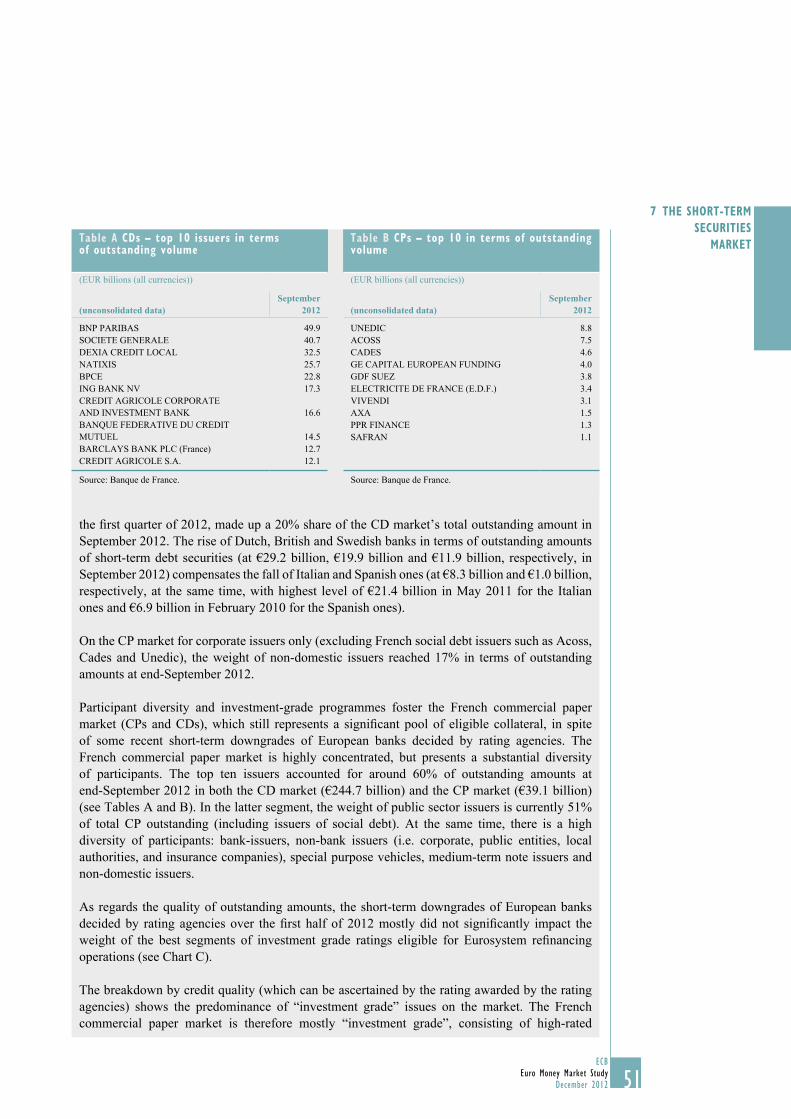
51ECB
Euro Money Market StudyDecember 2012 51
7 ThE ShORT-TERM SEcURiTiES
MARKET
the first quarter of 2012, made up a 20% share of the CD market’s total outstanding amount in September 2012. The rise of Dutch, British and Swedish banks in terms of outstanding amounts of short-term debt securities (at €29.2 billion, €19.9 billion and €11.9 billion, respectively, in September 2012) compensates the fall of Italian and Spanish ones (at €8.3 billion and €1.0 billion, respectively, at the same time, with highest level of €21.4 billion in May 2011 for the Italian ones and €6.9 billion in February 2010 for the Spanish ones).
On the CP market for corporate issuers only (excluding French social debt issuers such as Acoss, Cades and Unedic), the weight of non-domestic issuers reached 17% in terms of outstanding amounts at end-September 2012.
Participant diversity and investment-grade programmes foster the French commercial paper market (CPs and CDs), which still represents a significant pool of eligible collateral, in spite of some recent short-term downgrades of European banks decided by rating agencies. The French commercial paper market is highly concentrated, but presents a substantial diversity of participants. The top ten issuers accounted for around 60% of outstanding amounts at end-September 2012 in both the CD market (€244.7 billion) and the CP market (€39.1 billion) (see Tables A and B). In the latter segment, the weight of public sector issuers is currently 51% of total CP outstanding (including issuers of social debt). At the same time, there is a high diversity of participants: bank-issuers, non-bank issuers (i.e. corporate, public entities, local authorities, and insurance companies), special purpose vehicles, medium-term note issuers and non-domestic issuers.
As regards the quality of outstanding amounts, the short-term downgrades of European banks decided by rating agencies over the first half of 2012 mostly did not significantly impact the weight of the best segments of investment grade ratings eligible for Eurosystem refinancing operations (see Chart C).
The breakdown by credit quality (which can be ascertained by the rating awarded by the rating agencies) shows the predominance of “investment grade” issues on the market. The French commercial paper market is therefore mostly “investment grade”, consisting of high-rated
Table A cDs – top 10 issuers in terms of outstanding volume
(EUR billions (all currencies))
(unconsolidated data)September
2012
BNP PARIBAS 49.9SOCIETE GENERALE 40.7DEXIA CREDIT LOCAL 32.5NATIXIS 25.7BPCE 22.8ING BANK NV 17.3CREDIT AGRICOLE CORPORATE AND INVESTMENT BANK 16.6BANQUE FEDERATIVE DU CREDIT MUTUEL 14.5BARCLAYS BANK PLC (France) 12.7CREDIT AGRICOLE S.A. 12.1
Source: Banque de France.
Table b cps – top 10 in terms of outstanding volume
(EUR billions (all currencies))
(unconsolidated data)September
2012
UNEDIC 8.8ACOSS 7.5CADES 4.6GE CAPITAL EUROPEAN FUNDING 4.0GDF SUEZ 3.8ELECTRICITE DE FRANCE (E.D.F.) 3.4VIVENDI 3.1AXA 1.5PPR FINANCE 1.3SAFRAN 1.1
Source: Banque de France.
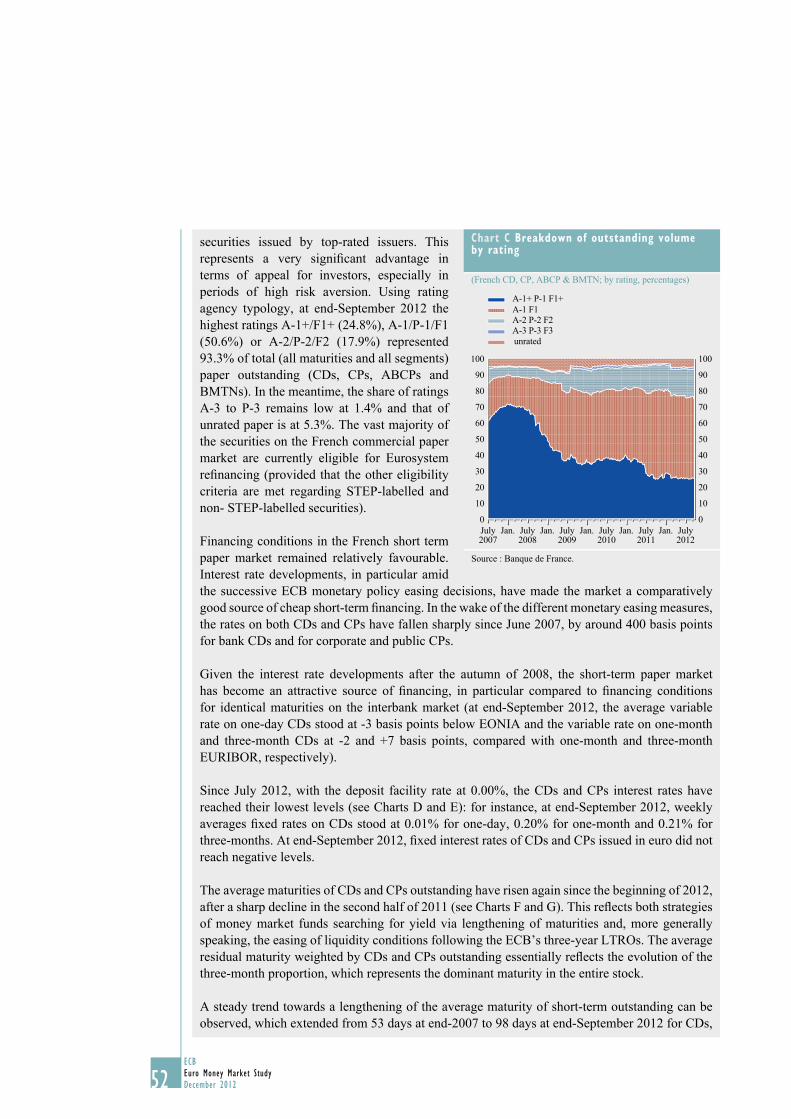
52ECBEuro Money Market StudyDecember 201252
securities issued by top-rated issuers. This represents a very signifi cant advantage in terms of appeal for investors, especially in periods of high risk aversion. Using rating agency typology, at end-September 2012 the highest ratings A-1+/F1+ (24.8%), A-1/P-1/F1 (50.6%) or A-2/P-2/F2 (17.9%) represented 93.3% of total (all maturities and all segments) paper outstanding (CDs, CPs, ABCPs and BMTNs). In the meantime, the share of ratings A-3 to P-3 remains low at 1.4% and that of unrated paper is at 5.3%. The vast majority of the securities on the French commercial paper market are currently eligible for Eurosystem refi nancing (provided that the other eligibility criteria are met regarding STEP-labelled and non- STEP-labelled securities).
Financing conditions in the French short term paper market remained relatively favourable. Interest rate developments, in particular amid the successive ECB monetary policy easing decisions, have made the market a comparatively good source of cheap short-term fi nancing. In the wake of the different monetary easing measures, the rates on both CDs and CPs have fallen sharply since June 2007, by around 400 basis points for bank CDs and for corporate and public CPs.
Given the interest rate developments after the autumn of 2008, the short-term paper market has become an attractive source of fi nancing, in particular compared to fi nancing conditions for identical maturities on the interbank market (at end-September 2012, the average variable rate on one-day CDs stood at -3 basis points below EONIA and the variable rate on one-month and three-month CDs at -2 and +7 basis points, compared with one-month and three-month EURIBOR, respectively).
Since July 2012, with the deposit facility rate at 0.00%, the CDs and CPs interest rates have reached their lowest levels (see Charts D and E): for instance, at end-September 2012, weekly averages fi xed rates on CDs stood at 0.01% for one-day, 0.20% for one-month and 0.21% for three-months. At end-September 2012, fi xed interest rates of CDs and CPs issued in euro did not reach negative levels.
The average maturities of CDs and CPs outstanding have risen again since the beginning of 2012, after a sharp decline in the second half of 2011 (see Charts F and G). This refl ects both strategies of money market funds searching for yield via lengthening of maturities and, more generally speaking, the easing of liquidity conditions following the ECB’s three-year LTROs. The average residual maturity weighted by CDs and CPs outstanding essentially refl ects the evolution of the three-month proportion, which represents the dominant maturity in the entire stock.
A steady trend towards a lengthening of the average maturity of short-term outstanding can be observed, which extended from 53 days at end-2007 to 98 days at end-September 2012 for CDs,
chart c breakdown of outstanding volume by rating
(French CD, CP, ABCP & BMTN; by rating, percentages)
0
10
20
30
40
50
60
70
80
90
100
0
10
20
30
40
50
60
70
80
90
100
unrated
A-1+ P-1 F1+A-1 F1A-2 P-2 F2A-3 P-3 F3
2007July
2008July
2009July
2010July
2011July
2012JulyJan. Jan. Jan. Jan. Jan.
Source : Banque de France.
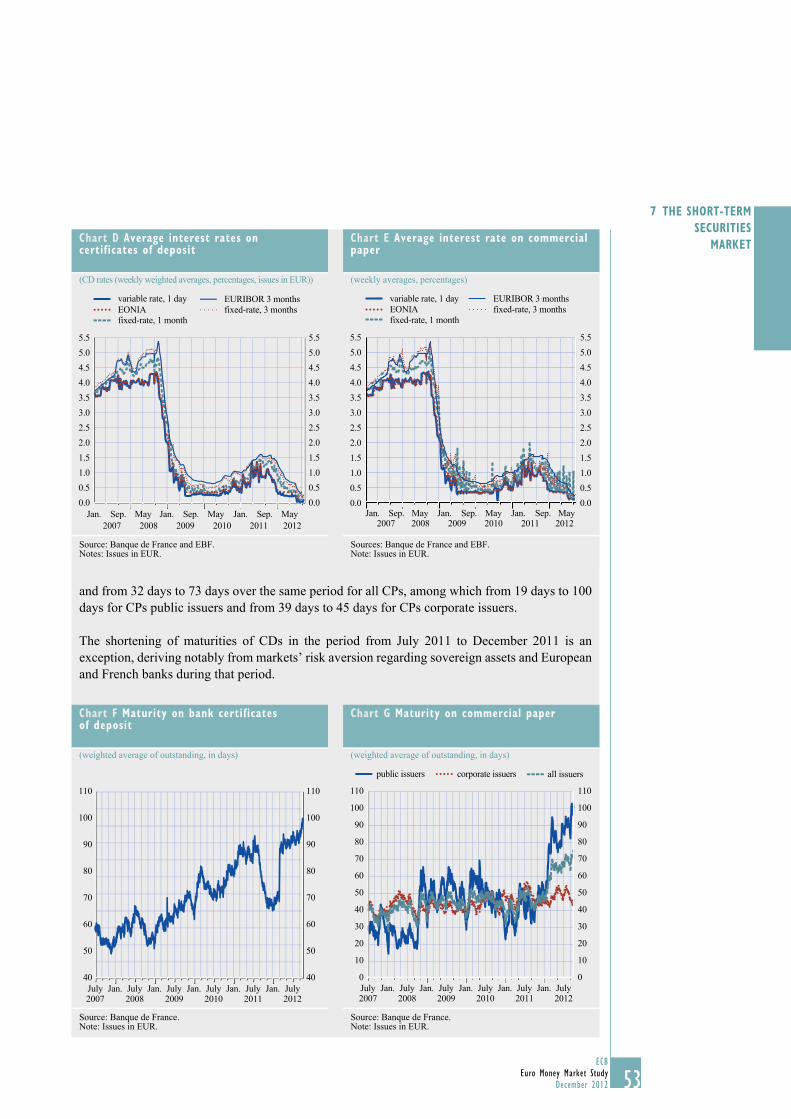
53ECB
Euro Money Market StudyDecember 2012 53
7 ThE ShORT-TERM SEcURiTiES
MARKET
and from 32 days to 73 days over the same period for all CPs, among which from 19 days to 100 days for CPs public issuers and from 39 days to 45 days for CPs corporate issuers.
The shortening of maturities of CDs in the period from July 2011 to December 2011 is an exception, deriving notably from markets’ risk aversion regarding sovereign assets and European and French banks during that period.
chart D Average interest rates on certificates of deposit
(CD rates (weekly weighted averages, percentages, issues in EUR))
0.00.51.01.52.02.53.03.54.04.55.05.5
0.00.51.01.52.02.53.03.54.04.55.05.5
variable rate, 1 day
fixed-rate, 1 monthfixed-rate, 3 monthsEONIAEURIBOR 3 months
Jan. Sep.2007 2008 2009 2010 2011 2012
May Jan. Sep. May Jan. Sep. May
Source: Banque de France and EBF.Notes: Issues in EUR.
chart E Average interest rate on commercial paper
(weekly averages, percentages)
0.00.51.01.52.02.53.03.54.04.55.05.5
0.00.51.01.52.02.53.03.54.04.55.05.5
Jan. Sep. May Jan. Sep. May Jan. Sep. May2007 2008 2009 2010 2011 2012
variable rate, 1 day
fixed-rate, 1 monthfixed-rate, 3 monthsEONIAEURIBOR 3 months
Sources: Banque de France and EBF.Note: Issues in EUR.
chart f Maturity on bank certificates of deposit
(weighted average of outstanding, in days)
Jan. Jan. Jan. Jan. Jan.July2007
July2008
July2009
July2010
July2011
July2012
40
50
60
70
80
90
100
110
40
50
60
70
80
90
100
110
Source: Banque de France.Note: Issues in EUR.
chart g Maturity on commercial paper
(weighted average of outstanding, in days)
0
10
20
30
40
50
60
70
80
90
100
110
0
10
20
30
40
50
60
70
80
90
100
110
Jan. Jan. Jan. Jan. Jan.July2007
July2008
July2009
July2010
July2011
July2012
public issuers corporate issuers all issuers
Source: Banque de France.Note: Issues in EUR.
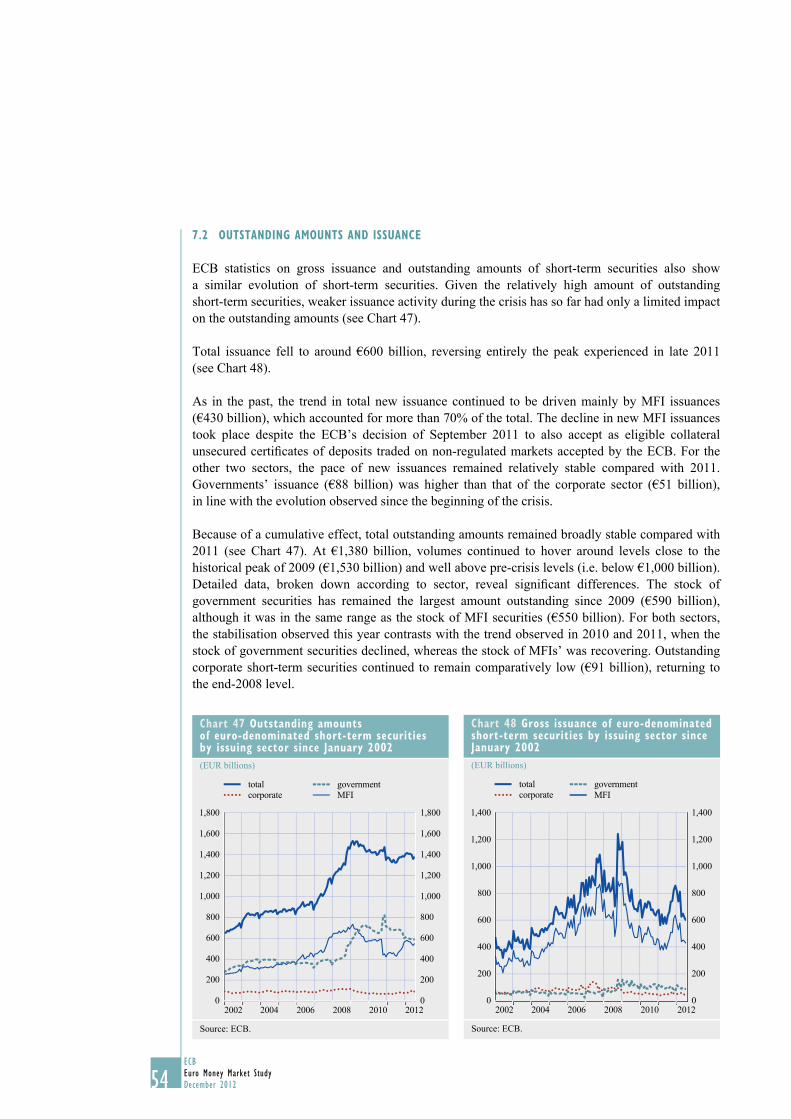
54ECBEuro Money Market StudyDecember 201254
7.2 OUTSTANDiNg AMOUNTS AND iSSUANcE
ECB statistics on gross issuance and outstanding amounts of short-term securities also show a similar evolution of short-term securities. Given the relatively high amount of outstanding short-term securities, weaker issuance activity during the crisis has so far had only a limited impact on the outstanding amounts (see Chart 47).
Total issuance fell to around €600 billion, reversing entirely the peak experienced in late 2011 (see Chart 48).
As in the past, the trend in total new issuance continued to be driven mainly by MFI issuances (€430 billion), which accounted for more than 70% of the total. The decline in new MFI issuances took place despite the ECB’s decision of September 2011 to also accept as eligible collateral unsecured certifi cates of deposits traded on non-regulated markets accepted by the ECB. For the other two sectors, the pace of new issuances remained relatively stable compared with 2011. Governments’ issuance (€88 billion) was higher than that of the corporate sector (€51 billion), in line with the evolution observed since the beginning of the crisis.
Because of a cumulative effect, total outstanding amounts remained broadly stable compared with 2011 (see Chart 47). At €1,380 billion, volumes continued to hover around levels close to the historical peak of 2009 (€1,530 billion) and well above pre-crisis levels (i.e. below €1,000 billion). Detailed data, broken down according to sector, reveal signifi cant differences. The stock of government securities has remained the largest amount outstanding since 2009 (€590 billion), although it was in the same range as the stock of MFI securities (€550 billion). For both sectors, the stabilisation observed this year contrasts with the trend observed in 2010 and 2011, when the stock of government securities declined, whereas the stock of MFIs’ was recovering. Outstanding corporate short-term securities continued to remain comparatively low (€91 billion), returning to the end-2008 level.
chart 47 Outstanding amounts of euro-denominated short-term securities by issuing sector since January 2002(EUR billions)
0
200
400
600
800
1,000
1,200
1,400
1,600
1,800
0
200
400
600
800
1,000
1,200
1,400
1,600
1,800
2002 2004 2006 2008 2010 2012
MFIcorporategovernmenttotal
Source: ECB.
chart 48 gross issuance of euro-denominated short-term securities by issuing sector since January 2002(EUR billions)
0
200
400
600
800
1,000
1,200
1,400
0
200
400
600
800
1,000
1,200
1,400
2002 2004 2006 2008 2010 2012
MFIcorporategovernment total
Source: ECB.
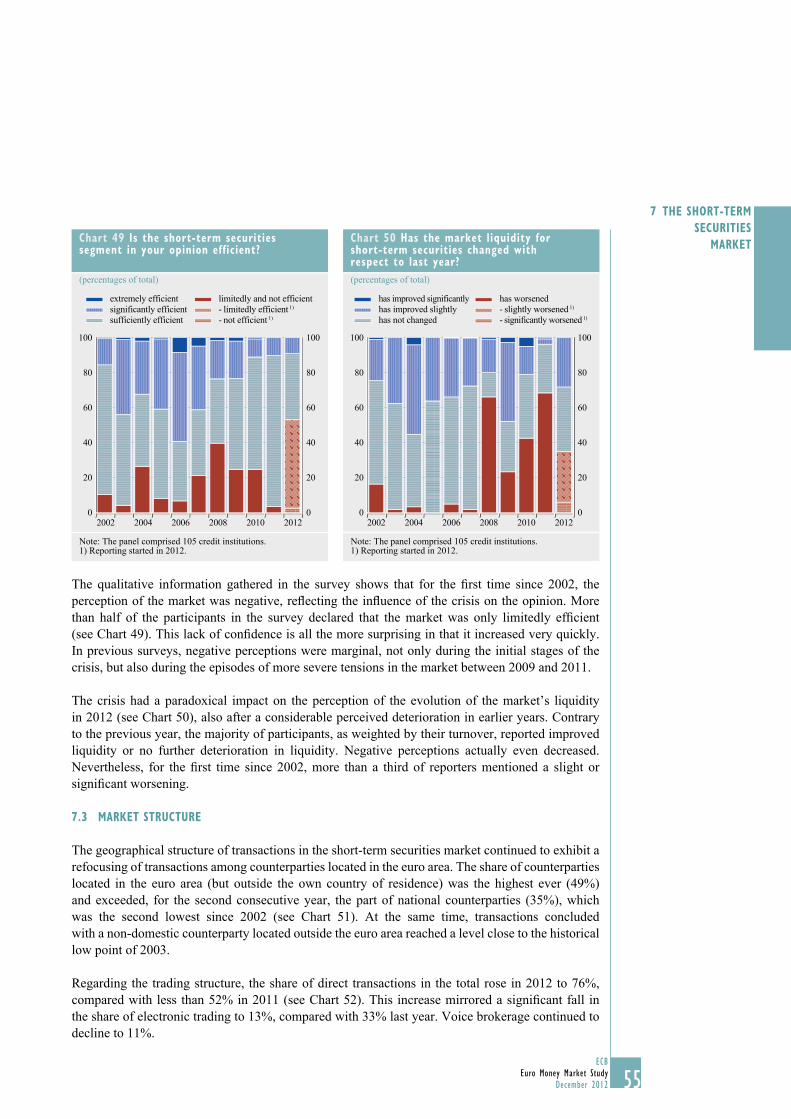
55ECB
Euro Money Market StudyDecember 2012 55
7 ThE ShORT-TERM SEcURiTiES
MARKET
The qualitative information gathered in the survey shows that for the fi rst time since 2002, the perception of the market was negative, refl ecting the infl uence of the crisis on the opinion. More than half of the participants in the survey declared that the market was only limitedly effi cient (see Chart 49). This lack of confi dence is all the more surprising in that it increased very quickly. In previous surveys, negative perceptions were marginal, not only during the initial stages of the crisis, but also during the episodes of more severe tensions in the market between 2009 and 2011.
The crisis had a paradoxical impact on the perception of the evolution of the market’s liquidity in 2012 (see Chart 50), also after a considerable perceived deterioration in earlier years. Contrary to the previous year, the majority of participants, as weighted by their turnover, reported improved liquidity or no further deterioration in liquidity. Negative perceptions actually even decreased. Nevertheless, for the fi rst time since 2002, more than a third of reporters mentioned a slight or signifi cant worsening.
7.3 MARKET STRUcTURE
The geographical structure of transactions in the short-term securities market continued to exhibit a refocusing of transactions among counterparties located in the euro area. The share of counterparties located in the euro area (but outside the own country of residence) was the highest ever (49%) and exceeded, for the second consecutive year, the part of national counterparties (35%), which was the second lowest since 2002 (see Chart 51). At the same time, transactions concluded with a non-domestic counterparty located outside the euro area reached a level close to the historical low point of 2003.
Regarding the trading structure, the share of direct transactions in the total rose in 2012 to 76%, compared with less than 52% in 2011 (see Chart 52). This increase mirrored a signifi cant fall in the share of electronic trading to 13%, compared with 33% last year. Voice brokerage continued to decline to 11%.
chart 49 is the short-term securities segment in your opinion efficient?
(percentages of total)
0
20
40
60
80
100
0
20
40
60
80
100
limitedly and not efficient
- not efficient 1)- limitedly efficient 1)
sufficiently efficientsignificantly efficientextremely efficient
2002 2004 2006 2008 2010 2012
Note: The panel comprised 105 credit institutions.1) Reporting started in 2012.
chart 50 has the market liquidity for short-term securities changed with respect to last year?(percentages of total)
0
20
40
60
80
100
0
20
40
60
80
100
has worsened
- significantly worsened 1)- slightly worsened 1)
has not changedhas improved slightlyhas improved significantly
2002 2004 2006 2008 2010 2012
Note: The panel comprised 105 credit institutions.1) Reporting started in 2012.
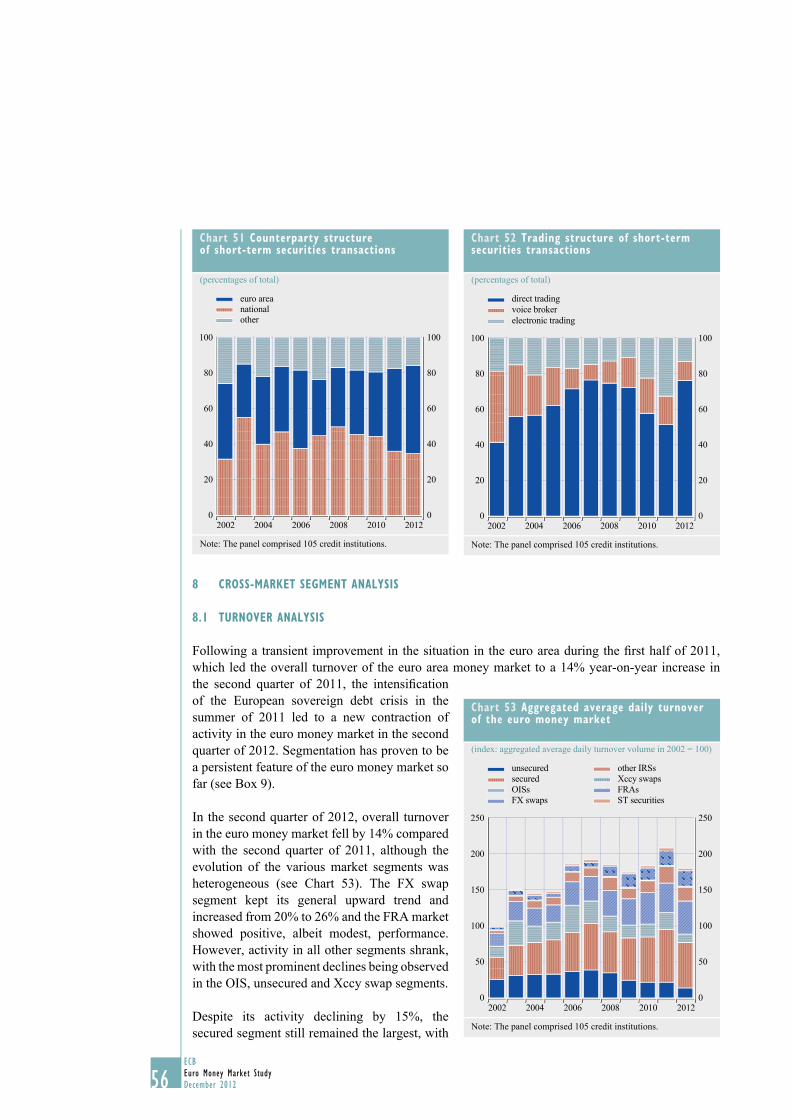
56ECBEuro Money Market StudyDecember 201256
8 cROSS-MARKET SEgMENT ANAlYSiS
8.1 TURNOvER ANAlYSiS
Following a transient improvement in the situation in the euro area during the fi rst half of 2011, which led the overall turnover of the euro area money market to a 14% year-on-year increase in the second quarter of 2011, the intensifi cation of the European sovereign debt crisis in the summer of 2011 led to a new contraction of activity in the euro money market in the second quarter of 2012. Segmentation has proven to be a persistent feature of the euro money market so far (see Box 9).
In the second quarter of 2012, overall turnover in the euro money market fell by 14% compared with the second quarter of 2011, although the evolution of the various market segments was heterogeneous (see Chart 53). The FX swap segment kept its general upward trend and increased from 20% to 26% and the FRA market showed positive, albeit modest, performance. However, activity in all other segments shrank, with the most prominent declines being observed in the OIS, unsecured and Xccy swap segments.
Despite its activity declining by 15%, the secured segment still remained the largest, with
chart 53 Aggregated average daily turnover of the euro money market
(index: aggregated average daily turnover volume in 2002 = 100)
0
50
100
150
200
250
0
50
100
150
200
250
unsecuredsecuredOISsFX swaps
other IRSsXccy swapsFRAsST securities
2002 2004 2006 2008 2010 2012
Note: The panel comprised 105 credit institutions.
chart 51 counterparty structure of short-term securities transactions
(percentages of total)
0
20
40
60
80
100
0
20
40
60
80
100
nationaleuro area
other
2002 2004 2006 2008 2010 2012
Note: The panel comprised 105 credit institutions.
chart 52 Trading structure of short-term securities transactions
(percentages of total)
0
20
40
60
80
100
0
20
40
60
80
100
direct tradingvoice brokerelectronic trading
2002 2004 2006 2008 2010 2012
Note: The panel comprised 105 credit institutions.
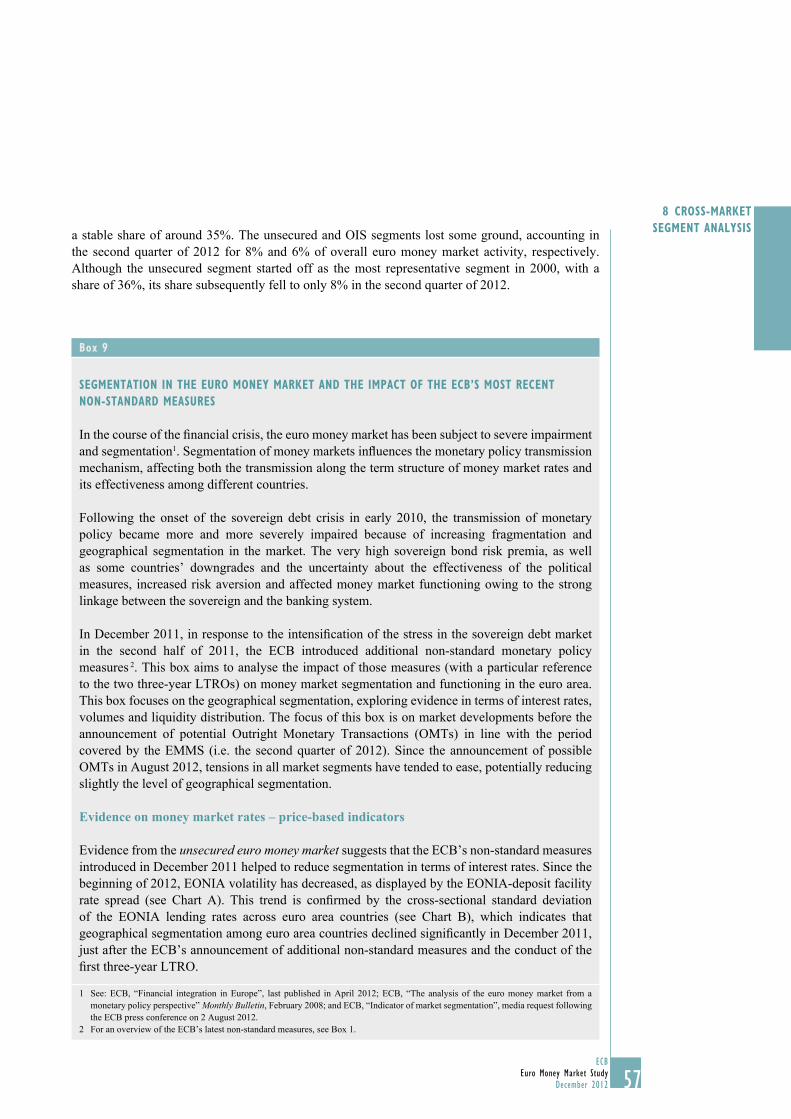
57ECB
Euro Money Market StudyDecember 2012 57
8 cROSS-MARKET SEgMENT ANAlYSiSa stable share of around 35%. The unsecured and OIS segments lost some ground, accounting in
the second quarter of 2012 for 8% and 6% of overall euro money market activity, respectively. Although the unsecured segment started off as the most representative segment in 2000, with a share of 36%, its share subsequently fell to only 8% in the second quarter of 2012.
box 9
SEgMENTATiON iN ThE EURO MONEY MARKET AND ThE iMpAcT Of ThE Ecb’S MOST REcENT NON-STANDARD MEASURES
In the course of the financial crisis, the euro money market has been subject to severe impairment and segmentation1. Segmentation of money markets influences the monetary policy transmission mechanism, affecting both the transmission along the term structure of money market rates and its effectiveness among different countries.
Following the onset of the sovereign debt crisis in early 2010, the transmission of monetary policy became more and more severely impaired because of increasing fragmentation and geographical segmentation in the market. The very high sovereign bond risk premia, as well as some countries’ downgrades and the uncertainty about the effectiveness of the political measures, increased risk aversion and affected money market functioning owing to the strong linkage between the sovereign and the banking system.
In December 2011, in response to the intensification of the stress in the sovereign debt market in the second half of 2011, the ECB introduced additional non-standard monetary policy measures 2. This box aims to analyse the impact of those measures (with a particular reference to the two three-year LTROs) on money market segmentation and functioning in the euro area. This box focuses on the geographical segmentation, exploring evidence in terms of interest rates, volumes and liquidity distribution. The focus of this box is on market developments before the announcement of potential Outright Monetary Transactions (OMTs) in line with the period covered by the EMMS (i.e. the second quarter of 2012). Since the announcement of possible OMTs in August 2012, tensions in all market segments have tended to ease, potentially reducing slightly the level of geographical segmentation.
Evidence on money market rates – price-based indicators
Evidence from the unsecured euro money market suggests that the ECB’s non-standard measures introduced in December 2011 helped to reduce segmentation in terms of interest rates. Since the beginning of 2012, EONIA volatility has decreased, as displayed by the EONIA-deposit facility rate spread (see Chart A). This trend is confirmed by the cross-sectional standard deviation of the EONIA lending rates across euro area countries (see Chart B), which indicates that geographical segmentation among euro area countries declined significantly in December 2011, just after the ECB’s announcement of additional non-standard measures and the conduct of the first three-year LTRO.
1 See: ECB, “Financial integration in Europe”, last published in April 2012; ECB, “The analysis of the euro money market from a monetary policy perspective” Monthly Bulletin, February 2008; and ECB, “Indicator of market segmentation”, media request following the ECB press conference on 2 August 2012.
2 For an overview of the ECB’s latest non-standard measures, see Box 1.
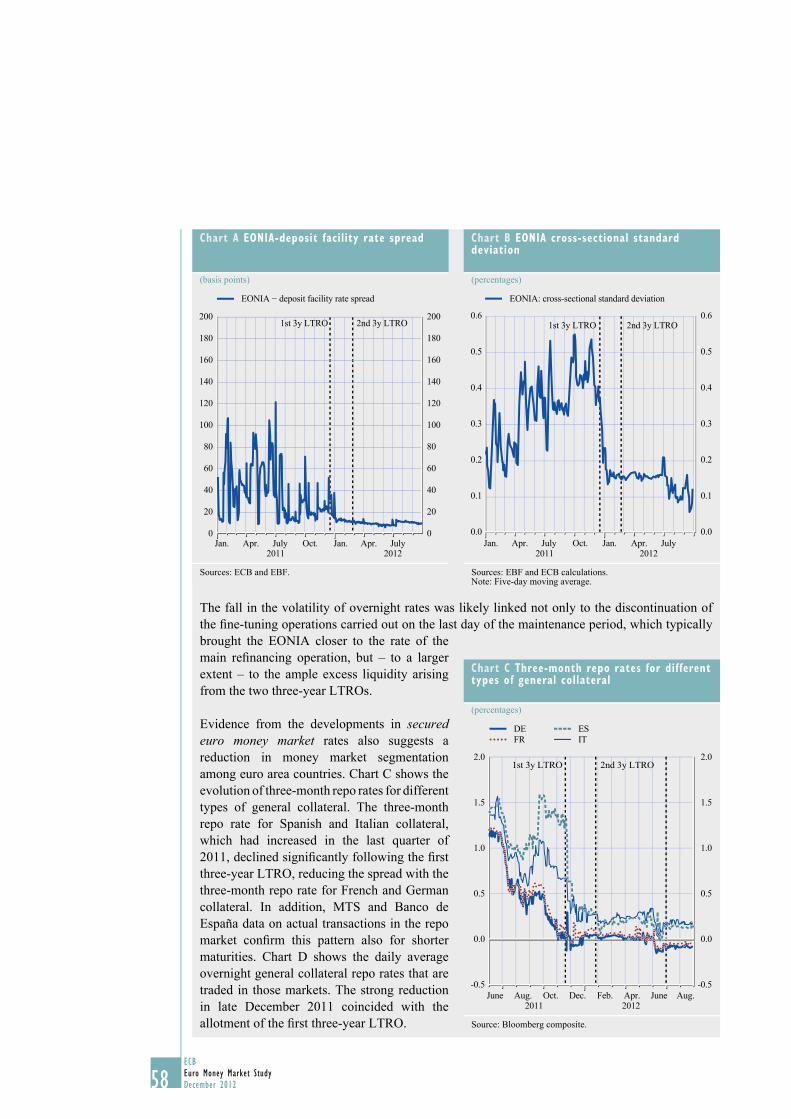
58ECBEuro Money Market StudyDecember 201258
The fall in the volatility of overnight rates was likely linked not only to the discontinuation of the fi ne-tuning operations carried out on the last day of the maintenance period, which typically brought the EONIA closer to the rate of the main refi nancing operation, but – to a larger extent – to the ample excess liquidity arising from the two three-year LTROs.
Evidence from the developments in secured euro money market rates also suggests a reduction in money market segmentation among euro area countries. Chart C shows the evolution of three-month repo rates for different types of general collateral. The three-month repo rate for Spanish and Italian collateral, which had increased in the last quarter of 2011, declined signifi cantly following the fi rst three-year LTRO, reducing the spread with the three-month repo rate for French and German collateral. In addition, MTS and Banco de España data on actual transactions in the repo market confi rm this pattern also for shorter maturities. Chart D shows the daily average overnight general collateral repo rates that are traded in those markets. The strong reduction in late December 2011 coincided with the allotment of the fi rst three-year LTRO.
chart b EONiA cross-sectional standard deviation
(percentages)
0.0
0.1
0.2
0.3
0.4
0.5
0.6
0.0
0.1
0.2
0.3
0.4
0.5
0.6
Jan. Apr. July Oct. Apr. JulyJan.2011 2012
EONIA: cross-sectional standard deviation
2nd 3y LTRO 1st 3y LTRO
Sources: EBF and ECB calculations.Note: Five-day moving average.
chart A EONiA-deposit facility rate spread
(basis points)
0
20
40
60
80
100
120
140
160
180
200
0
20
40
60
80
100
120
140
160
180
200
Jan. Jan.Apr. Apr.July JulyOct.2011 2012
EONIA − deposit facility rate spread
1st 3y LTRO 2nd 3y LTRO
Sources: ECB and EBF.
chart c Three-month repo rates for different types of general collateral
(percentages)
-0.5
0.0
0.5
1.0
1.5
2.0
-0.5
0.0
0.5
1.0
1.5
2.0
June Aug. Oct. Dec. Feb. Apr. June Aug.2011 2012
IT ES DE
FR
1st 3y LTRO 2nd 3y LTRO
Source: Bloomberg composite.
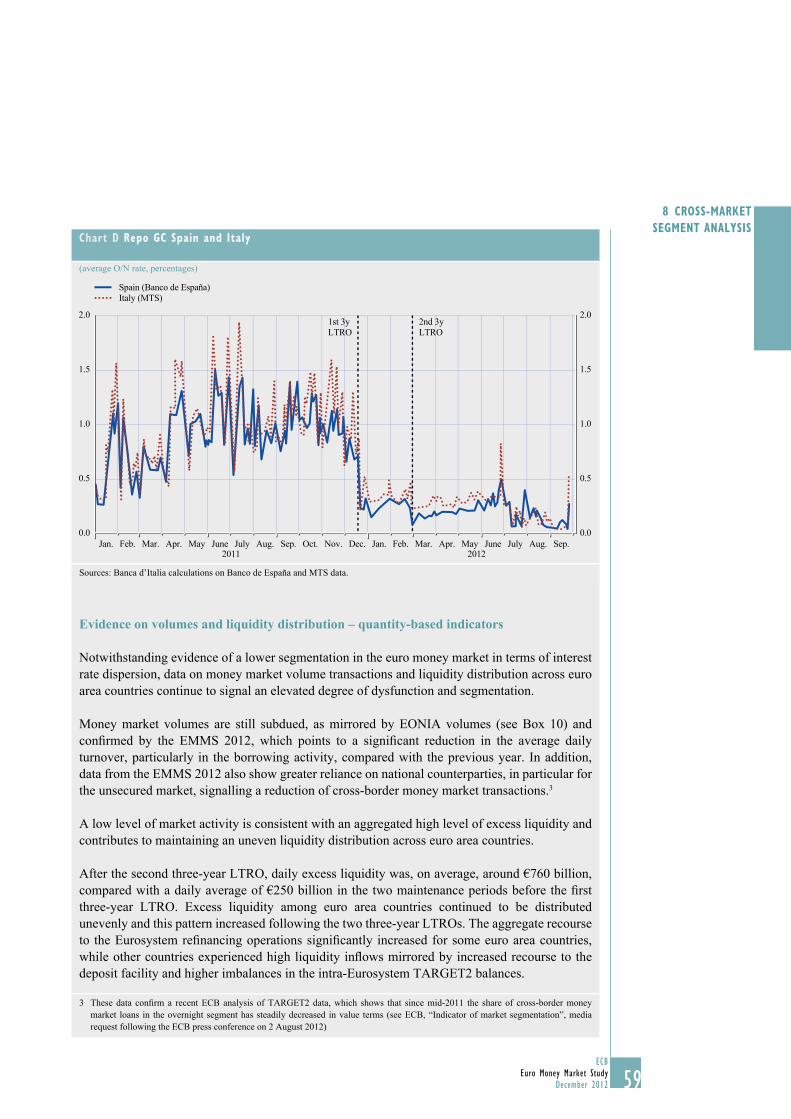
59ECB
Euro Money Market StudyDecember 2012 59
8 cROSS-MARKET SEgMENT ANAlYSiS
Evidence on volumes and liquidity distribution – quantity-based indicators
Notwithstanding evidence of a lower segmentation in the euro money market in terms of interest rate dispersion, data on money market volume transactions and liquidity distribution across euro area countries continue to signal an elevated degree of dysfunction and segmentation.
Money market volumes are still subdued, as mirrored by EONIA volumes (see Box 10) and confi rmed by the EMMS 2012, which points to a signifi cant reduction in the average daily turnover, particularly in the borrowing activity, compared with the previous year. In addition, data from the EMMS 2012 also show greater reliance on national counterparties, in particular for the unsecured market, signalling a reduction of cross-border money market transactions.3
A low level of market activity is consistent with an aggregated high level of excess liquidity and contributes to maintaining an uneven liquidity distribution across euro area countries.
After the second three-year LTRO, daily excess liquidity was, on average, around €760 billion, compared with a daily average of €250 billion in the two maintenance periods before the fi rst three-year LTRO. Excess liquidity among euro area countries continued to be distributed unevenly and this pattern increased following the two three-year LTROs. The aggregate recourse to the Eurosystem refi nancing operations signifi cantly increased for some euro area countries, while other countries experienced high liquidity infl ows mirrored by increased recourse to the deposit facility and higher imbalances in the intra-Eurosystem TARGET2 balances.
3 These data confi rm a recent ECB analysis of TARGET2 data, which shows that since mid-2011 the share of cross-border money market loans in the overnight segment has steadily decreased in value terms (see ECB, “Indicator of market segmentation”, media request following the ECB press conference on 2 August 2012)
chart D Repo gc Spain and italy
(average O/N rate, percentages)
0.0
0.5
1.0
1.5
2.0
0.0
0.5
1.0
1.5
2.0
Jan. Feb. Mar. Apr. May June July Aug. Sep. Oct. Nov. Dec. Jan. Feb. Mar. Apr. May June July Aug. Sep.2011 2012
Spain (Banco de España) Italy (MTS)
1st 3yLTRO
2nd 3yLTRO
Sources: Banca d’Italia calculations on Banco de España and MTS data.
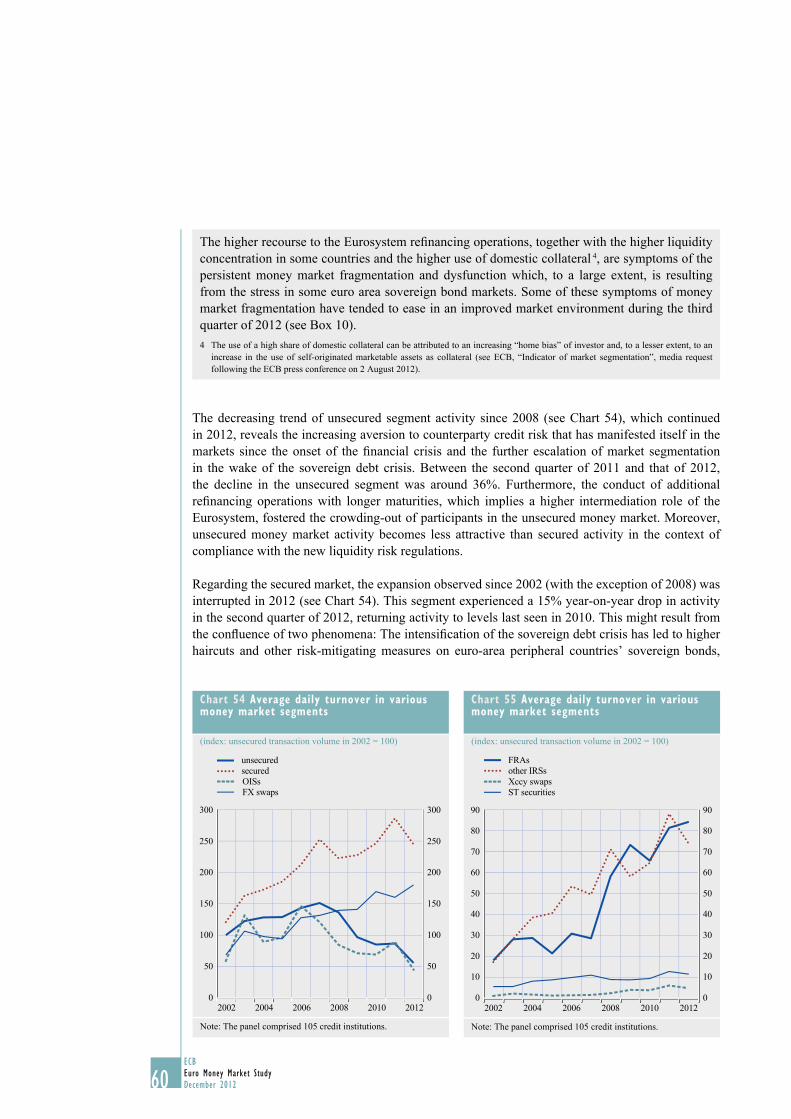
60ECBEuro Money Market StudyDecember 201260
The decreasing trend of unsecured segment activity since 2008 (see Chart 54), which continued in 2012, reveals the increasing aversion to counterparty credit risk that has manifested itself in the markets since the onset of the fi nancial crisis and the further escalation of market segmentation in the wake of the sovereign debt crisis. Between the second quarter of 2011 and that of 2012, the decline in the unsecured segment was around 36%. Furthermore, the conduct of additional refi nancing operations with longer maturities, which implies a higher intermediation role of the Eurosystem, fostered the crowding-out of participants in the unsecured money market. Moreover, unsecured money market activity becomes less attractive than secured activity in the context of compliance with the new liquidity risk regulations.
Regarding the secured market, the expansion observed since 2002 (with the exception of 2008) was interrupted in 2012 (see Chart 54). This segment experienced a 15% year-on-year drop in activity in the second quarter of 2012, returning activity to levels last seen in 2010. This might result from the confl uence of two phenomena: The intensifi cation of the sovereign debt crisis has led to higher haircuts and other risk-mitigating measures on euro-area peripheral countries’ sovereign bonds,
chart 54 Average daily turnover in various money market segments
(index: unsecured transaction volume in 2002 = 100)
0
50
100
150
200
250
300
0
50
100
150
200
250
300
unsecuredsecuredOISsFX swaps
2002 2004 2006 2008 2010 2012
Note: The panel comprised 105 credit institutions.
chart 55 Average daily turnover in various money market segments
(index: unsecured transaction volume in 2002 = 100)
0
10
20
30
40
50
60
70
80
90
0
10
20
30
40
50
60
70
80
90
FRAsother IRSsXccy swapsST securities
2002 2004 2006 2008 2010 2012
Note: The panel comprised 105 credit institutions.
The higher recourse to the Eurosystem refi nancing operations, together with the higher liquidity concentration in some countries and the higher use of domestic collateral 4, are symptoms of the persistent money market fragmentation and dysfunction which, to a large extent, is resulting from the stress in some euro area sovereign bond markets. Some of these symptoms of money market fragmentation have tended to ease in an improved market environment during the third quarter of 2012 (see Box 10).4 The use of a high share of domestic collateral can be attributed to an increasing “home bias” of investor and, to a lesser extent, to an
increase in the use of self-originated marketable assets as collateral (see ECB, “Indicator of market segmentation”, media request following the ECB press conference on 2 August 2012).
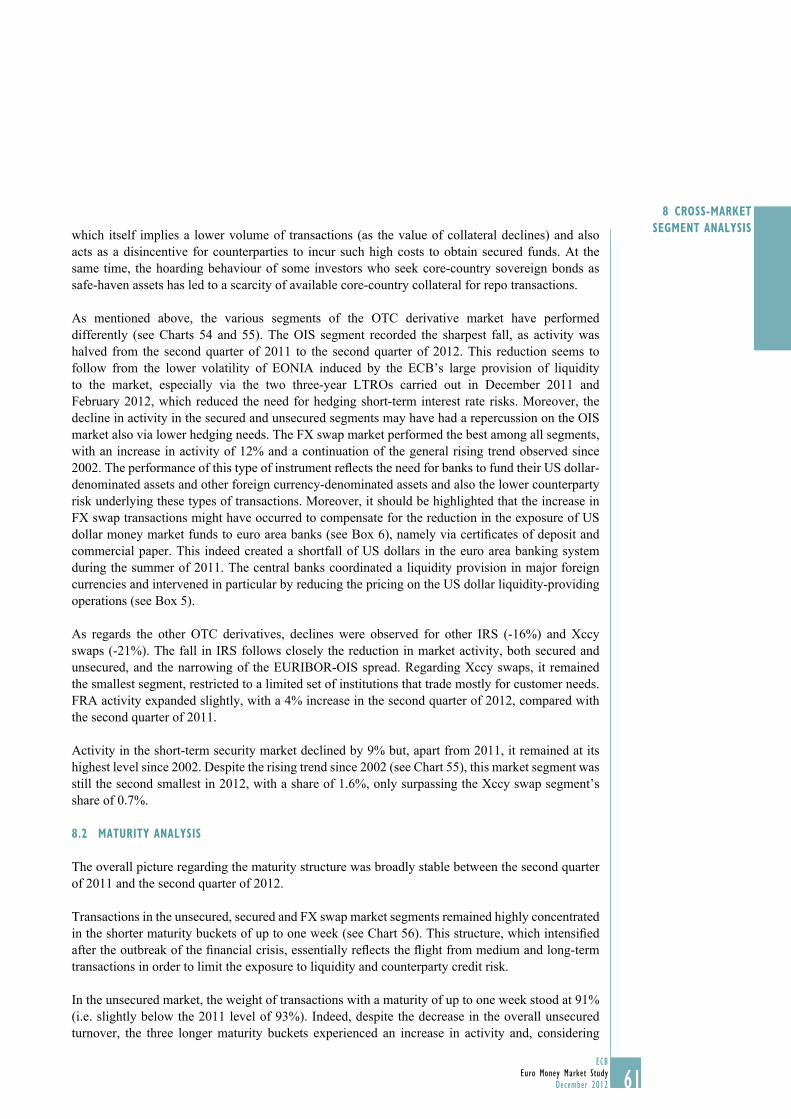
61ECB
Euro Money Market StudyDecember 2012 61
8 cROSS-MARKET SEgMENT ANAlYSiSwhich itself implies a lower volume of transactions (as the value of collateral declines) and also
acts as a disincentive for counterparties to incur such high costs to obtain secured funds. At the same time, the hoarding behaviour of some investors who seek core-country sovereign bonds as safe-haven assets has led to a scarcity of available core-country collateral for repo transactions.
As mentioned above, the various segments of the OTC derivative market have performed differently (see Charts 54 and 55). The OIS segment recorded the sharpest fall, as activity was halved from the second quarter of 2011 to the second quarter of 2012. This reduction seems to follow from the lower volatility of EONIA induced by the ECB’s large provision of liquidity to the market, especially via the two three-year LTROs carried out in December 2011 and February 2012, which reduced the need for hedging short-term interest rate risks. Moreover, the decline in activity in the secured and unsecured segments may have had a repercussion on the OIS market also via lower hedging needs. The FX swap market performed the best among all segments, with an increase in activity of 12% and a continuation of the general rising trend observed since 2002. The performance of this type of instrument reflects the need for banks to fund their US dollar-denominated assets and other foreign currency-denominated assets and also the lower counterparty risk underlying these types of transactions. Moreover, it should be highlighted that the increase in FX swap transactions might have occurred to compensate for the reduction in the exposure of US dollar money market funds to euro area banks (see Box 6), namely via certificates of deposit and commercial paper. This indeed created a shortfall of US dollars in the euro area banking system during the summer of 2011. The central banks coordinated a liquidity provision in major foreign currencies and intervened in particular by reducing the pricing on the US dollar liquidity-providing operations (see Box 5).
As regards the other OTC derivatives, declines were observed for other IRS (-16%) and Xccy swaps (-21%). The fall in IRS follows closely the reduction in market activity, both secured and unsecured, and the narrowing of the EURIBOR-OIS spread. Regarding Xccy swaps, it remained the smallest segment, restricted to a limited set of institutions that trade mostly for customer needs. FRA activity expanded slightly, with a 4% increase in the second quarter of 2012, compared with the second quarter of 2011.
Activity in the short-term security market declined by 9% but, apart from 2011, it remained at its highest level since 2002. Despite the rising trend since 2002 (see Chart 55), this market segment was still the second smallest in 2012, with a share of 1.6%, only surpassing the Xccy swap segment’s share of 0.7%.
8.2 MATURiTY ANAlYSiS
The overall picture regarding the maturity structure was broadly stable between the second quarter of 2011 and the second quarter of 2012.
Transactions in the unsecured, secured and FX swap market segments remained highly concentrated in the shorter maturity buckets of up to one week (see Chart 56). This structure, which intensified after the outbreak of the financial crisis, essentially reflects the flight from medium and long-term transactions in order to limit the exposure to liquidity and counterparty credit risk.
In the unsecured market, the weight of transactions with a maturity of up to one week stood at 91% (i.e. slightly below the 2011 level of 93%). Indeed, despite the decrease in the overall unsecured turnover, the three longer maturity buckets experienced an increase in activity and, considering
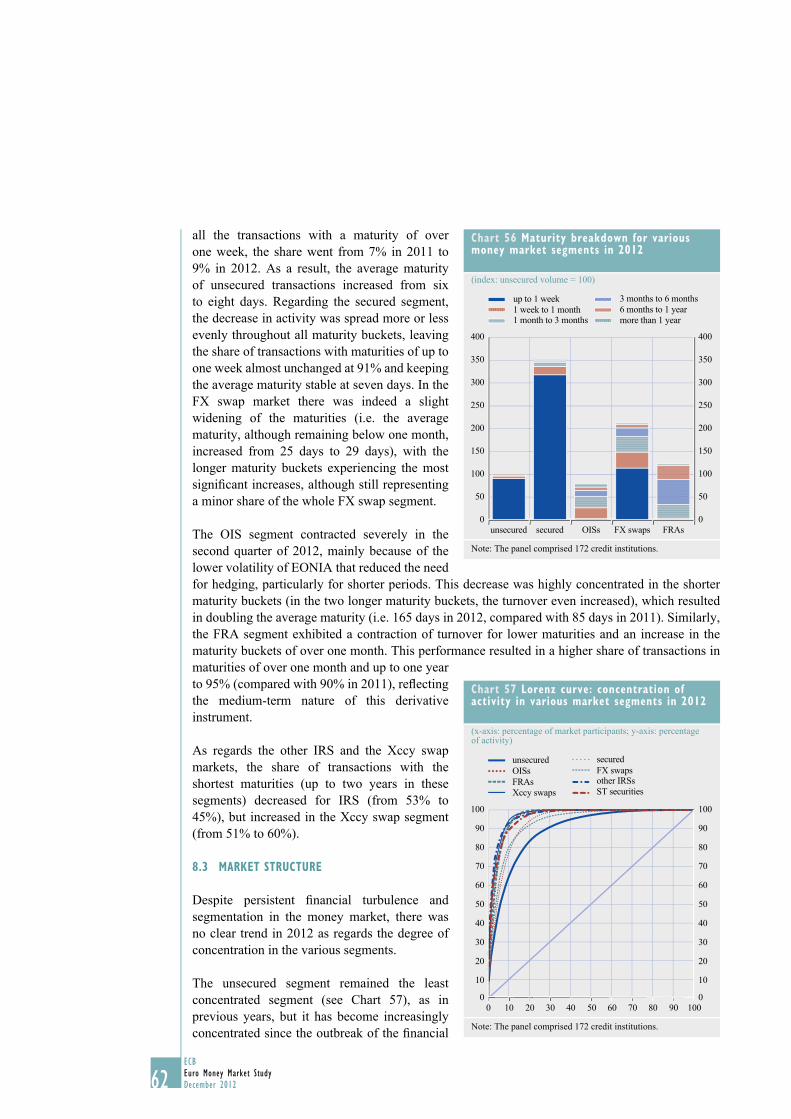
62ECBEuro Money Market StudyDecember 201262
all the transactions with a maturity of over one week, the share went from 7% in 2011 to 9% in 2012. As a result, the average maturity of unsecured transactions increased from six to eight days. Regarding the secured segment, the decrease in activity was spread more or less evenly throughout all maturity buckets, leaving the share of transactions with maturities of up to one week almost unchanged at 91% and keeping the average maturity stable at seven days. In the FX swap market there was indeed a slight widening of the maturities (i.e. the average maturity, although remaining below one month, increased from 25 days to 29 days), with the longer maturity buckets experiencing the most signifi cant increases, although still representing a minor share of the whole FX swap segment.
The OIS segment contracted severely in the second quarter of 2012, mainly because of the lower volatility of EONIA that reduced the need for hedging, particularly for shorter periods. This decrease was highly concentrated in the shorter maturity buckets (in the two longer maturity buckets, the turnover even increased), which resulted in doubling the average maturity (i.e. 165 days in 2012, compared with 85 days in 2011). Similarly, the FRA segment exhibited a contraction of turnover for lower maturities and an increase in the maturity buckets of over one month. This performance resulted in a higher share of transactions in maturities of over one month and up to one year to 95% (compared with 90% in 2011), refl ecting the medium-term nature of this derivative instrument.
As regards the other IRS and the Xccy swap markets, the share of transactions with the shortest maturities (up to two years in these segments) decreased for IRS (from 53% to 45%), but increased in the Xccy swap segment (from 51% to 60%).
8.3 MARKET STRUcTURE
Despite persistent fi nancial turbulence and segmentation in the money market, there was no clear trend in 2012 as regards the degree of concentration in the various segments.
The unsecured segment remained the least concentrated segment (see Chart 57), as in previous years, but it has become increasingly concentrated since the outbreak of the fi nancial
chart 57 lorenz curve: concentration of activity in various market segments in 2012
(x-axis: percentage of market participants; y-axis: percentage of activity)
0
10
20
30
40
50
60
70
80
90
100
0
10
20
30
40
50
60
70
80
90
100
unsecuredOISsFRAsXccy swaps
securedFX swapsother IRSsST securities
0 10 20 30 40 50 60 70 80 90 100
Note: The panel comprised 172 credit institutions.
chart 56 Maturity breakdown for various money market segments in 2012
(index: unsecured volume = 100)
0
50
100
150
200
250
300
350
400
0
50
100
150
200
250
300
350
400
unsecured secured OISs FX swaps FRAs
up to 1 week1 week to 1 month1 month to 3 months
3 months to 6 months6 months to 1 yearmore than 1 year
Note: The panel comprised 172 credit institutions.
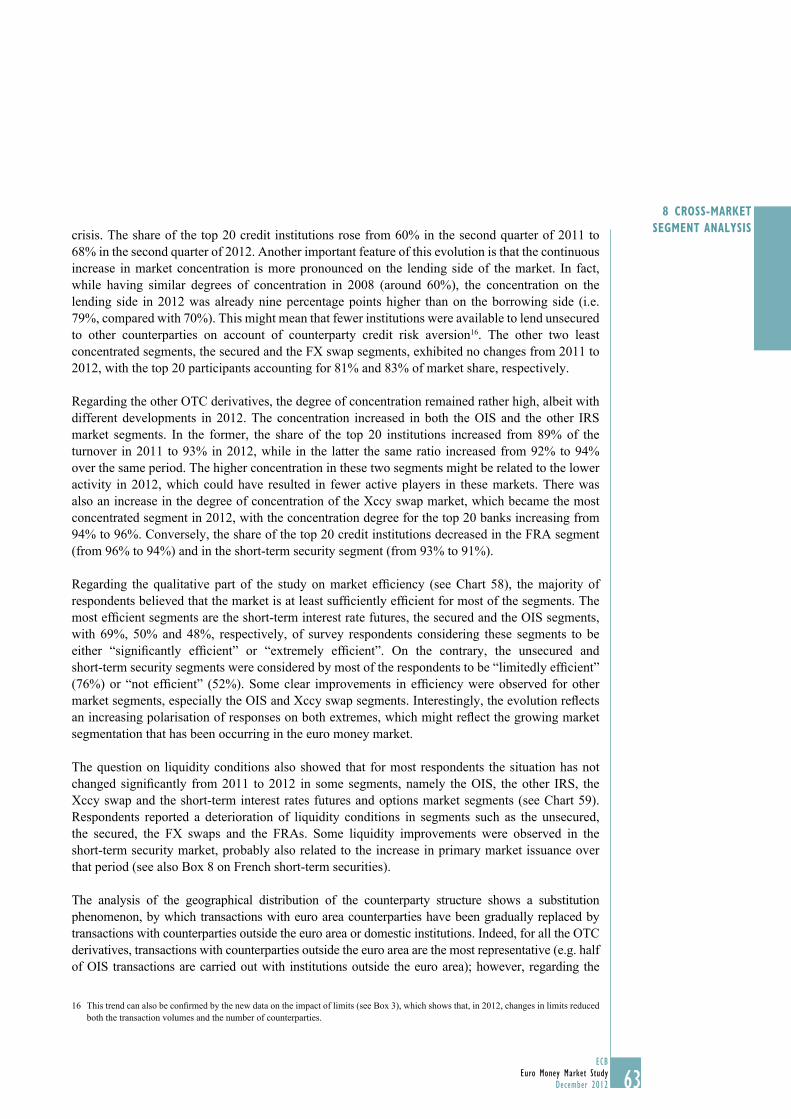
63ECB
Euro Money Market StudyDecember 2012 63
8 cROSS-MARKET SEgMENT ANAlYSiScrisis. The share of the top 20 credit institutions rose from 60% in the second quarter of 2011 to
68% in the second quarter of 2012. Another important feature of this evolution is that the continuous increase in market concentration is more pronounced on the lending side of the market. In fact, while having similar degrees of concentration in 2008 (around 60%), the concentration on the lending side in 2012 was already nine percentage points higher than on the borrowing side (i.e. 79%, compared with 70%). This might mean that fewer institutions were available to lend unsecured to other counterparties on account of counterparty credit risk aversion16. The other two least concentrated segments, the secured and the FX swap segments, exhibited no changes from 2011 to 2012, with the top 20 participants accounting for 81% and 83% of market share, respectively.
Regarding the other OTC derivatives, the degree of concentration remained rather high, albeit with different developments in 2012. The concentration increased in both the OIS and the other IRS market segments. In the former, the share of the top 20 institutions increased from 89% of the turnover in 2011 to 93% in 2012, while in the latter the same ratio increased from 92% to 94% over the same period. The higher concentration in these two segments might be related to the lower activity in 2012, which could have resulted in fewer active players in these markets. There was also an increase in the degree of concentration of the Xccy swap market, which became the most concentrated segment in 2012, with the concentration degree for the top 20 banks increasing from 94% to 96%. Conversely, the share of the top 20 credit institutions decreased in the FRA segment (from 96% to 94%) and in the short-term security segment (from 93% to 91%).
Regarding the qualitative part of the study on market efficiency (see Chart 58), the majority of respondents believed that the market is at least sufficiently efficient for most of the segments. The most efficient segments are the short-term interest rate futures, the secured and the OIS segments, with 69%, 50% and 48%, respectively, of survey respondents considering these segments to be either “significantly efficient” or “extremely efficient”. On the contrary, the unsecured and short-term security segments were considered by most of the respondents to be “limitedly efficient” (76%) or “not efficient” (52%). Some clear improvements in efficiency were observed for other market segments, especially the OIS and Xccy swap segments. Interestingly, the evolution reflects an increasing polarisation of responses on both extremes, which might reflect the growing market segmentation that has been occurring in the euro money market.
The question on liquidity conditions also showed that for most respondents the situation has not changed significantly from 2011 to 2012 in some segments, namely the OIS, the other IRS, the Xccy swap and the short-term interest rates futures and options market segments (see Chart 59). Respondents reported a deterioration of liquidity conditions in segments such as the unsecured, the secured, the FX swaps and the FRAs. Some liquidity improvements were observed in the short-term security market, probably also related to the increase in primary market issuance over that period (see also Box 8 on French short-term securities).
The analysis of the geographical distribution of the counterparty structure shows a substitution phenomenon, by which transactions with euro area counterparties have been gradually replaced by transactions with counterparties outside the euro area or domestic institutions. Indeed, for all the OTC derivatives, transactions with counterparties outside the euro area are the most representative (e.g. half of OIS transactions are carried out with institutions outside the euro area); however, regarding the
This trend can also be confirmed by the new data on the impact of limits (see Box 3), which shows that, in 2012, changes in limits reduced 16 both the transaction volumes and the number of counterparties.
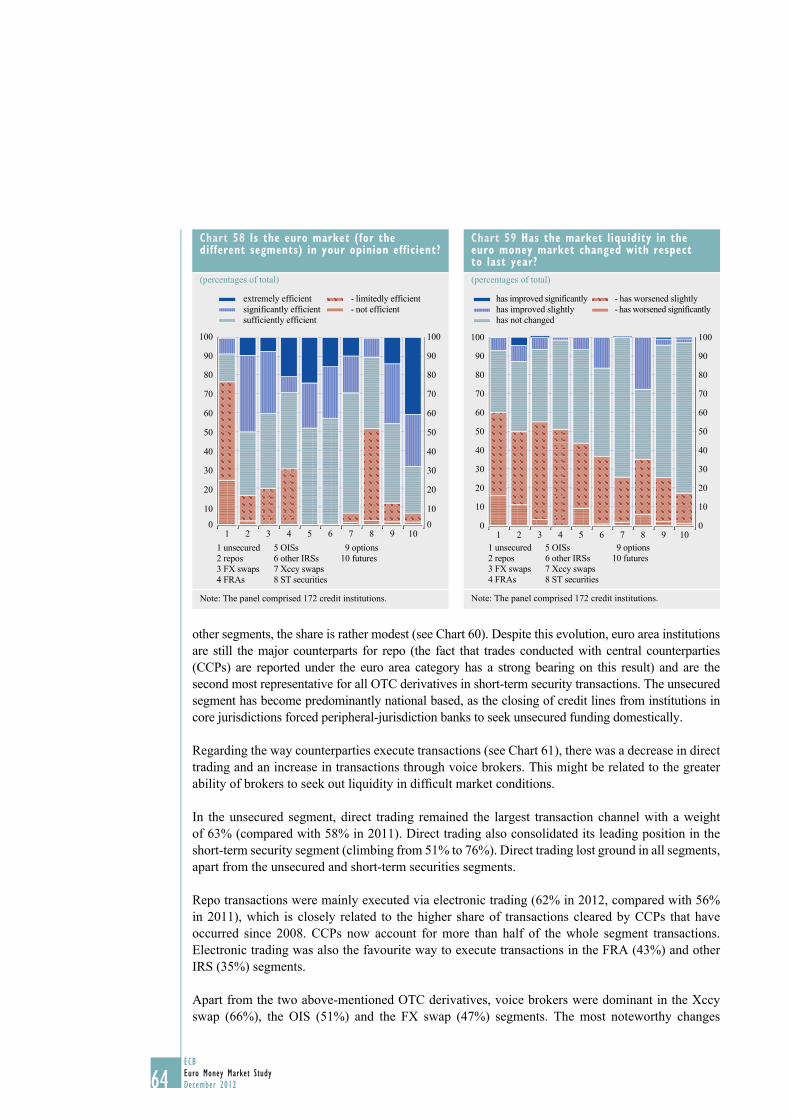
64ECBEuro Money Market StudyDecember 201264
other segments, the share is rather modest (see Chart 60). Despite this evolution, euro area institutions are still the major counterparts for repo (the fact that trades conducted with central counterparties (CCPs) are reported under the euro area category has a strong bearing on this result) and are the second most representative for all OTC derivatives in short-term security transactions. The unsecured segment has become predominantly national based, as the closing of credit lines from institutions in core jurisdictions forced peripheral-jurisdiction banks to seek unsecured funding domestically.
Regarding the way counterparties execute transactions (see Chart 61), there was a decrease in direct trading and an increase in transactions through voice brokers. This might be related to the greater ability of brokers to seek out liquidity in diffi cult market conditions.
In the unsecured segment, direct trading remained the largest transaction channel with a weight of 63% (compared with 58% in 2011). Direct trading also consolidated its leading position in the short-term security segment (climbing from 51% to 76%). Direct trading lost ground in all segments, apart from the unsecured and short-term securities segments.
Repo transactions were mainly executed via electronic trading (62% in 2012, compared with 56% in 2011), which is closely related to the higher share of transactions cleared by CCPs that have occurred since 2008. CCPs now account for more than half of the whole segment transactions. Electronic trading was also the favourite way to execute transactions in the FRA (43%) and other IRS (35%) segments.
Apart from the two above-mentioned OTC derivatives, voice brokers were dominant in the Xccy swap (66%), the OIS (51%) and the FX swap (47%) segments. The most noteworthy changes
chart 58 is the euro market (for the different segments) in your opinion efficient?
(percentages of total)
0
10
20
30
40
50
60
70
80
90
100
0
10
20
30
40
50
60
70
80
90
100
1 2 3 4 5 6 7 8 9 101 unsecured2 repos3 FX swaps4 FRAs
5 OISs6 other IRSs7 Xccy swaps8 ST securities
- not efficient- limitedly efficient
sufficiently efficientsignificantly efficientextremely efficient
9 options10 futures
Note: The panel comprised 172 credit institutions.
chart 59 has the market liquidity in the euro money market changed with respect to last year?(percentages of total)
0
10
20
30
40
50
60
70
80
90
100
0
10
20
30
40
50
60
70
80
90
100
- has worsened significantly- has worsened slightly
has not changedhas improved slightlyhas improved significantly
1 unsecured2 repos3 FX swaps4 FRAs
5 OISs6 other IRSs7 Xccy swaps8 ST securities
9 options10 futures
1 2 3 4 5 6 7 8 9 10
Note: The panel comprised 172 credit institutions.
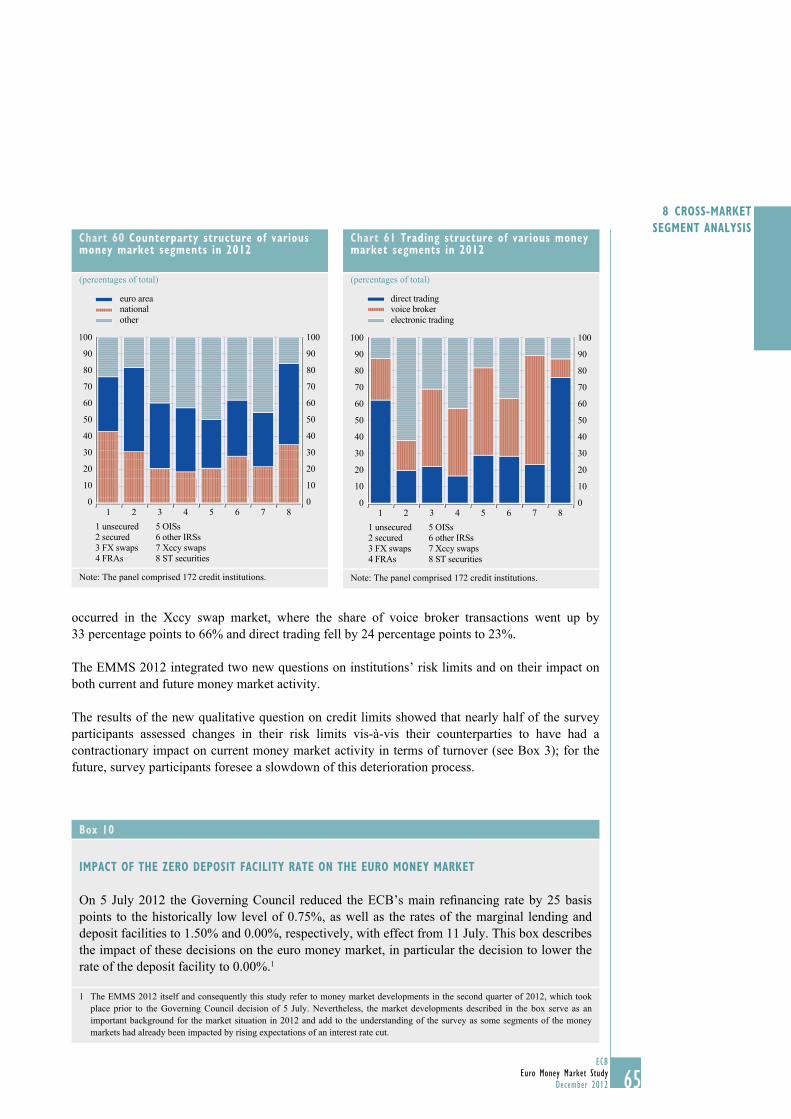
65ECB
Euro Money Market StudyDecember 2012 65
8 cROSS-MARKET SEgMENT ANAlYSiS
occurred in the Xccy swap market, where the share of voice broker transactions went up by 33 percentage points to 66% and direct trading fell by 24 percentage points to 23%.
The EMMS 2012 integrated two new questions on institutions’ risk limits and on their impact on both current and future money market activity.
The results of the new qualitative question on credit limits showed that nearly half of the survey participants assessed changes in their risk limits vis-à-vis their counterparties to have had a contractionary impact on current money market activity in terms of turnover (see Box 3); for the future, survey participants foresee a slowdown of this deterioration process.
chart 61 Trading structure of various money market segments in 2012
(percentages of total)
10
20
30
40
50
60
70
80
90
100
00
10
20
30
40
50
60
70
80
90
100
1 2 3 4 5 6 7 81 unsecured2 secured3 FX swaps4 FRAs
5 OISs6 other IRSs7 Xccy swaps8 ST securities
direct tradingvoice brokerelectronic trading
Note: The panel comprised 172 credit institutions.
chart 60 counterparty structure of various money market segments in 2012
(percentages of total)
0
10
20
30
40
50
60
70
80
90
100
0
10
20
30
40
50
60
70
80
90
100
nationaleuro area
other
1 2 3 4 5 6 7 81 unsecured2 secured3 FX swaps4 FRAs
5 OISs6 other IRSs7 Xccy swaps8 ST securities
Note: The panel comprised 172 credit institutions.
box 10
iMpAcT Of ThE ZERO DEpOSiT fAciliTY RATE ON ThE EURO MONEY MARKET
On 5 July 2012 the Governing Council reduced the ECB’s main refi nancing rate by 25 basis points to the historically low level of 0.75%, as well as the rates of the marginal lending and deposit facilities to 1.50% and 0.00%, respectively, with effect from 11 July. This box describes the impact of these decisions on the euro money market, in particular the decision to lower the rate of the deposit facility to 0.00%.1
1 The EMMS 2012 itself and consequently this study refer to money market developments in the second quarter of 2012, which took place prior to the Governing Council decision of 5 July. Nevertheless, the market developments described in the box serve as an important background for the market situation in 2012 and add to the understanding of the survey as some segments of the money markets had already been impacted by rising expectations of an interest rate cut.
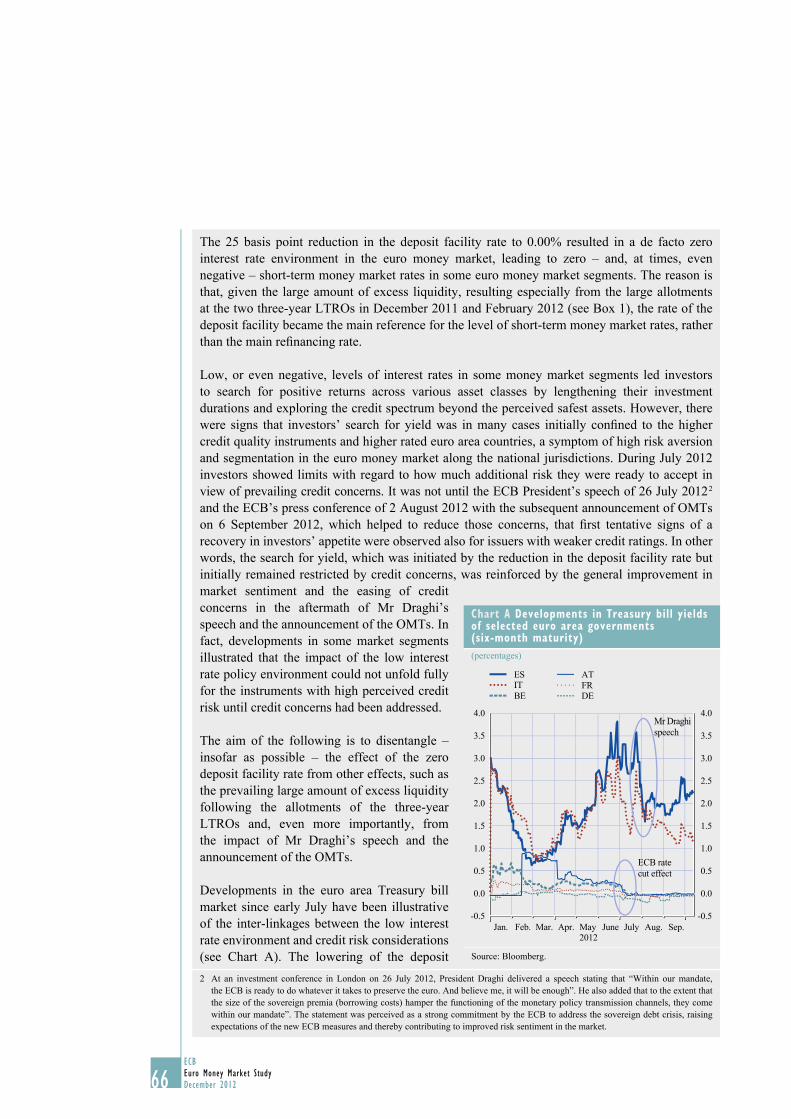
66ECBEuro Money Market StudyDecember 201266
The 25 basis point reduction in the deposit facility rate to 0.00% resulted in a de facto zero interest rate environment in the euro money market, leading to zero – and, at times, even negative – short-term money market rates in some euro money market segments. The reason is that, given the large amount of excess liquidity, resulting especially from the large allotments at the two three-year LTROs in December 2011 and February 2012 (see Box 1), the rate of the deposit facility became the main reference for the level of short-term money market rates, rather than the main refi nancing rate.
Low, or even negative, levels of interest rates in some money market segments led investors to search for positive returns across various asset classes by lengthening their investment durations and exploring the credit spectrum beyond the perceived safest assets. However, there were signs that investors’ search for yield was in many cases initially confi ned to the higher credit quality instruments and higher rated euro area countries, a symptom of high risk aversion and segmentation in the euro money market along the national jurisdictions. During July 2012 investors showed limits with regard to how much additional risk they were ready to accept in view of prevailing credit concerns. It was not until the ECB President’s speech of 26 July 2012 2 and the ECB’s press conference of 2 August 2012 with the subsequent announcement of OMTs on 6 September 2012, which helped to reduce those concerns, that fi rst tentative signs of a recovery in investors’ appetite were observed also for issuers with weaker credit ratings. In other words, the search for yield, which was initiated by the reduction in the deposit facility rate but initially remained restricted by credit concerns, was reinforced by the general improvement in market sentiment and the easing of credit concerns in the aftermath of Mr Draghi’s speech and the announcement of the OMTs. In fact, developments in some market segments illustrated that the impact of the low interest rate policy environment could not unfold fully for the instruments with high perceived credit risk until credit concerns had been addressed.
The aim of the following is to disentangle – insofar as possible – the effect of the zero deposit facility rate from other effects, such as the prevailing large amount of excess liquidity following the allotments of the three-year LTROs and, even more importantly, from the impact of Mr Draghi’s speech and the announcement of the OMTs.
Developments in the euro area Treasury bill market since early July have been illustrative of the inter-linkages between the low interest rate environment and credit risk considerations (see Chart A). The lowering of the deposit 2 At an investment conference in London on 26 July 2012, President Draghi delivered a speech stating that “Within our mandate,
the ECB is ready to do whatever it takes to preserve the euro. And believe me, it will be enough”. He also added that to the extent that the size of the sovereign premia (borrowing costs) hamper the functioning of the monetary policy transmission channels, they come within our mandate”. The statement was perceived as a strong commitment by the ECB to address the sovereign debt crisis, raising expectations of the new ECB measures and thereby contributing to improved risk sentiment in the market.
chart A Developments in Treasury bill yields of selected euro area governments (six-month maturity)(percentages)
Mr Draghispeech
ECB ratecut effect
4.0
3.5
3.0
2.5
2.0
1.5
1.0
0.5
0.0
-0.5
4.0
3.5
3.0
2.5
2.0
1.5
1.0
0.5
0.0
-0.5
ATFRDE
ESITBE
Jan. Feb. Mar. Apr. May June July Aug. Sep.2012
Source: Bloomberg.
67ECB
Euro Money Market StudyDecember 2012 67
8 cROSS-MARKET SEgMENT ANAlYSiS
facility rate pushed down yields on the Treasury bills issued by the euro area sovereigns, which led to negative yield levels on T-bills of AAA-rated euro area governments. Furthermore, reluctance on the part of some investors to accept the negative return benefited sub-AAA issuers and led to a convergence of those Treasury bill yields closer to the levels of the AAA-rated governments. In addition, lower-rated euro area sovereigns under a heightened market scrutiny registered declines in yields. However, the impact for those lowest-rated issuers was short-lived and by end-July the T-bill yields had rebounded back to the levels prior to the ECB’s interest rate cut. Credit risk considerations in view of the euro area sovereign crisis were the main factor behind the increase, rendering the low interest rate policy less effective for such issuers. Only in combination with the improvement in general market risk sentiment following Mr Draghi’s speech, more sustainable yield declines were recorded also for those weaker-rated sovereign issuers.
Similarly, in the secured money market segment, German and French general collateral (GC) 3 rates declined into negative territory after the reduction in the deposit rate and, given market participants’ reluctance to accept negative returns, trading volumes in this market segment contracted markedly. Meanwhile, divergence of the repo rates, backed by the general collateral of countries with weaker credit ratings than Germany, continued to diminish in response to investors’ search for positive returns and a subsequent decrease in market uncertainty. The spread in GC repo rates between the higher and lower rated euro area sovereigns appeared to contract by several basis points already in the aftermath of the reduction in the ECB’s policy rates. However, the pace of tightening accelerated following Mr Draghi’s speech and was accompanied by the flattening of the repo curves, as the decline was more pronounced in longer maturities. The flattening of the repo market curves was most pronounced in the Italian GC repo market. For the Spanish GC repo market, rates were already trading closer to core general collateral rates at maturities beyond one month, due to a scarcity premium on Spanish collateral in the non-domestic repo market, leading to a flatter GC repo curve already prior to the ECB’s rate decision.4
Also, interest rates in the unsecured money market adjusted downwards following the ECB’s interest rate decision, as reflected in the 21-23 basis point decline in the EONIA rate to the level of around 9-10 basis points and a downward shift in the EURIBOR curve. Following the deposit facility rate cut, the EONIA rate adjusted to the new level of the deposit facility rate and maintained the same spread of 8-10 basis points that had been observed since the allotment of the second three-year LTRO (see Chart B). The EURIBOR rates fell by the same magnitude of around 20 basis points along the curve in the first few weeks following the ECB’s rate cut decision. However, reflecting an improvement in the market risk assessment since Mr Draghi’s
3 A general collateral repo is generally defined as a collateralised transaction backed by a wide set of securities defined as general collateral, rather than by a specific asset.
4 The restrictions in credit lines of international investors to banks in lower-rated euro area countries, combined with investor avoidance of “double exposure” avoiding the same geographical origin of the counterparty and the collateral largely isolated such domestic banks as repo counterparties. International central clearing counterparties (CCPs) had served as an important vehicle to overcome the “double exposure” risk, bridging international lenders and domestic banks. However, in reaction to credit rating developments, CCPs started imposing additional margins on repo transactions depending on the geographic origin of the counterparty, the collateral or both, thereby deferring domestic banks from lending securities via CCPs and limiting the availability of domestic collateral in the cross-border repo market. This phenomenon was mostly pronounced in Spain owing to a larger shift in holdings of its government bonds from international to domestic investors. Therefore, rates in the Spanish GC repo market became lower than equivalent Italian GC repo rates owing to a scarcity premium, because international investors generally had difficulty in locating Spanish bonds from a counterparty with whom they had credit lines.
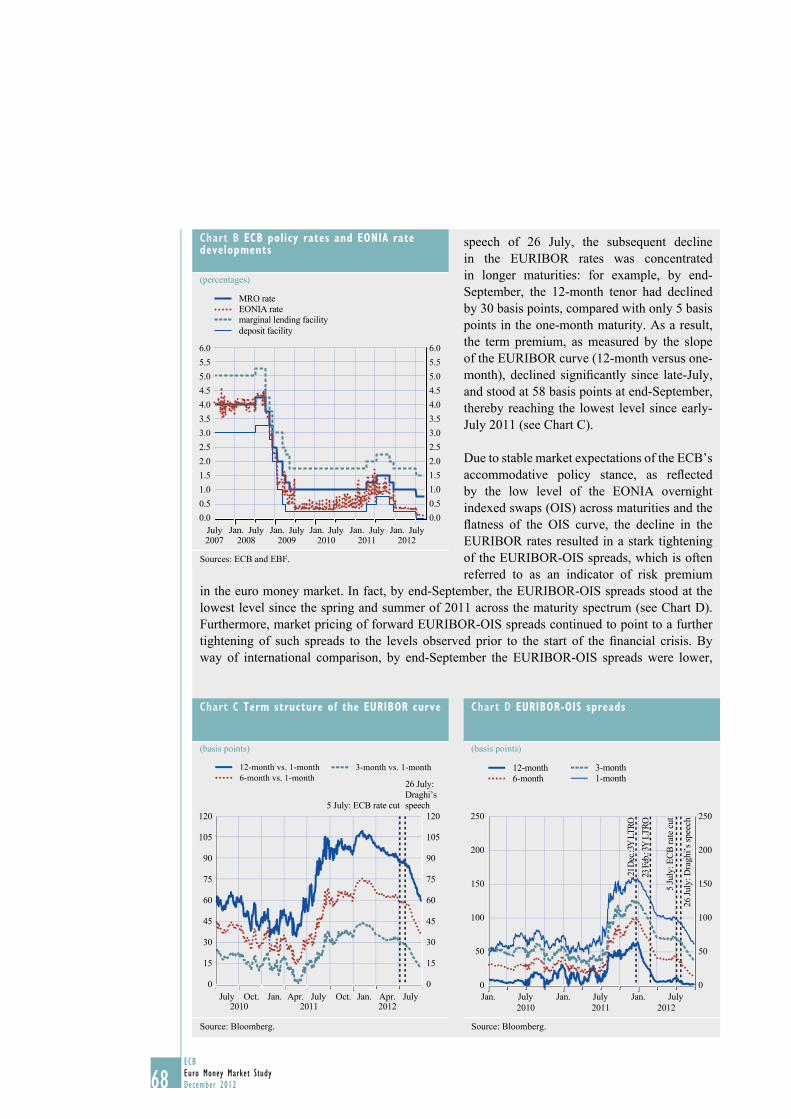
68ECBEuro Money Market StudyDecember 201268
speech of 26 July, the subsequent decline in the EURIBOR rates was concentrated in longer maturities: for example, by end-September, the 12-month tenor had declined by 30 basis points, compared with only 5 basis points in the one-month maturity. As a result, the term premium, as measured by the slope of the EURIBOR curve (12-month versus one-month), declined signifi cantly since late-July, and stood at 58 basis points at end-September, thereby reaching the lowest level since early-July 2011 (see Chart C).
Due to stable market expectations of the ECB’s accommodative policy stance, as refl ected by the low level of the EONIA overnight indexed swaps (OIS) across maturities and the fl atness of the OIS curve, the decline in the EURIBOR rates resulted in a stark tightening of the EURIBOR-OIS spreads, which is often referred to as an indicator of risk premium
in the euro money market. In fact, by end-September, the EURIBOR-OIS spreads stood at the lowest level since the spring and summer of 2011 across the maturity spectrum (see Chart D). Furthermore, market pricing of forward EURIBOR-OIS spreads continued to point to a further tightening of such spreads to the levels observed prior to the start of the fi nancial crisis. By way of international comparison, by end-September the EURIBOR-OIS spreads were lower,
chart b Ecb policy rates and EONiA rate developments
(percentages)
0.00.51.01.52.02.53.03.54.04.55.05.56.0
0.00.51.01.52.02.53.03.54.04.55.05.56.0
July Jan. July Jan. July Jan. July Jan. July JulyJan.
MRO rateEONIA ratemarginal lending facilitydeposit facility
2007 2008 2009 2010 2011 2012
Sources: ECB and EBF.
chart c Term structure of the EURibOR curve
(basis points)
0
15
30
45
60
75
90
105
120
0
15
30
45
60
75
90
105
120
July July JulyOct. Oct.Jan. Jan.Apr. Apr.
5 July: ECB rate cut
26 July: Draghi’s speech
12-month vs. 1-month6-month vs. 1-month
3-month vs. 1-month
2010 2011 2012
Source: Bloomberg.
chart D EURibOR-OiS spreads
(basis points)
0
50
100
150
200
250
0
50
100
150
200
250
12-month6-month
3-month1-month
2010 2011 2012Jan. July Jan. July Jan. July
23 Fe
b.: 3Y
LTR
O
5 Ju
ly: E
CB ra
te c
ut
26 Ju
ly: D
ragh
i’s sp
eech
21 D
ec.: 3
Y LT
RO
Source: Bloomberg.
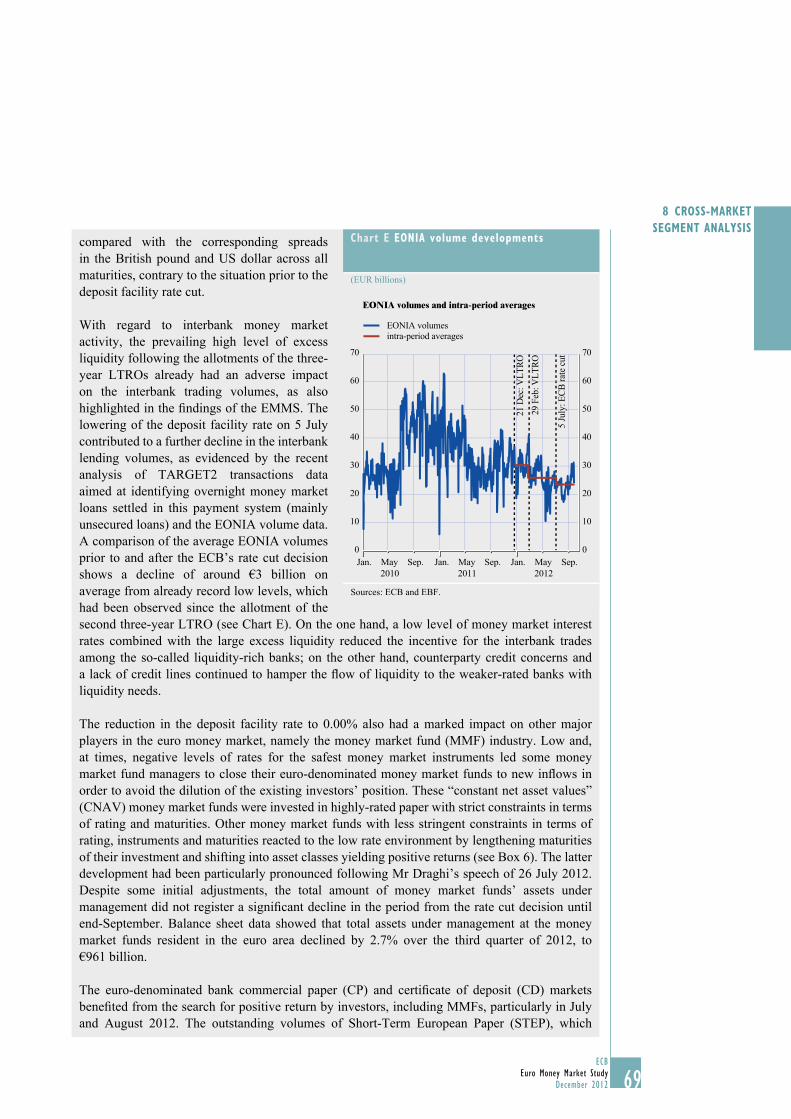
69ECB
Euro Money Market StudyDecember 2012 69
8 cROSS-MARKET SEgMENT ANAlYSiS
compared with the corresponding spreads in the British pound and US dollar across all maturities, contrary to the situation prior to the deposit facility rate cut.
With regard to interbank money market activity, the prevailing high level of excess liquidity following the allotments of the three-year LTROs already had an adverse impact on the interbank trading volumes, as also highlighted in the fi ndings of the EMMS. The lowering of the deposit facility rate on 5 July contributed to a further decline in the interbank lending volumes, as evidenced by the recent analysis of TARGET2 transactions data aimed at identifying overnight money market loans settled in this payment system (mainly unsecured loans) and the EONIA volume data. A comparison of the average EONIA volumes prior to and after the ECB’s rate cut decision shows a decline of around €3 billion on average from already record low levels, which had been observed since the allotment of the second three-year LTRO (see Chart E). On the one hand, a low level of money market interest rates combined with the large excess liquidity reduced the incentive for the interbank trades among the so-called liquidity-rich banks; on the other hand, counterparty credit concerns and a lack of credit lines continued to hamper the fl ow of liquidity to the weaker-rated banks with liquidity needs.
The reduction in the deposit facility rate to 0.00% also had a marked impact on other major players in the euro money market, namely the money market fund (MMF) industry. Low and, at times, negative levels of rates for the safest money market instruments led some money market fund managers to close their euro-denominated money market funds to new infl ows in order to avoid the dilution of the existing investors’ position. These “constant net asset values” (CNAV) money market funds were invested in highly-rated paper with strict constraints in terms of rating and maturities. Other money market funds with less stringent constraints in terms of rating, instruments and maturities reacted to the low rate environment by lengthening maturities of their investment and shifting into asset classes yielding positive returns (see Box 6). The latter development had been particularly pronounced following Mr Draghi’s speech of 26 July 2012. Despite some initial adjustments, the total amount of money market funds’ assets under management did not register a signifi cant decline in the period from the rate cut decision until end-September. Balance sheet data showed that total assets under management at the money market funds resident in the euro area declined by 2.7% over the third quarter of 2012, to €961 billion.
The euro-denominated bank commercial paper (CP) and certifi cate of deposit (CD) markets benefi ted from the search for positive return by investors, including MMFs, particularly in July and August 2012. The outstanding volumes of Short-Term European Paper (STEP), which
chart E EONiA volume developments
(EUR billions)
EONIA volumes and intra-period averages
29 F
eb: V
LTRO
5 Ju
ly: E
CB ra
te cu
t0
10
20
30
40
50
60
70
0
10
20
30
40
50
60
70
21 D
ec: V
LTRO
Jan. Sep. Jan. Sep. Jan. Sep.
EONIA volumesintra-period averages
May2010
May2011
May2012
Sources: ECB and EBF.
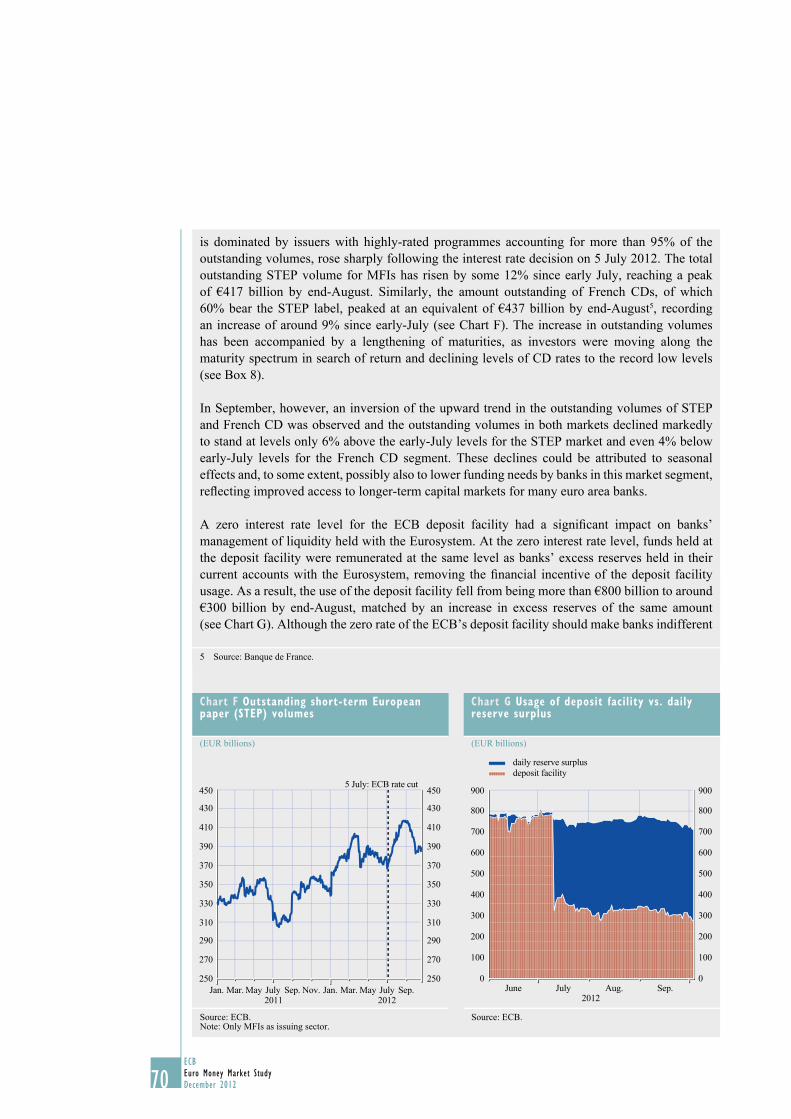
70ECBEuro Money Market StudyDecember 201270
is dominated by issuers with highly-rated programmes accounting for more than 95% of the outstanding volumes, rose sharply following the interest rate decision on 5 July 2012. The total outstanding STEP volume for MFIs has risen by some 12% since early July, reaching a peak of €417 billion by end-August. Similarly, the amount outstanding of French CDs, of which 60% bear the STEP label, peaked at an equivalent of €437 billion by end-August5, recording an increase of around 9% since early-July (see Chart F). The increase in outstanding volumes has been accompanied by a lengthening of maturities, as investors were moving along the maturity spectrum in search of return and declining levels of CD rates to the record low levels (see Box 8).
In September, however, an inversion of the upward trend in the outstanding volumes of STEP and French CD was observed and the outstanding volumes in both markets declined markedly to stand at levels only 6% above the early-July levels for the STEP market and even 4% below early-July levels for the French CD segment. These declines could be attributed to seasonal effects and, to some extent, possibly also to lower funding needs by banks in this market segment, refl ecting improved access to longer-term capital markets for many euro area banks.
A zero interest rate level for the ECB deposit facility had a signifi cant impact on banks’ management of liquidity held with the Eurosystem. At the zero interest rate level, funds held at the deposit facility were remunerated at the same level as banks’ excess reserves held in their current accounts with the Eurosystem, removing the fi nancial incentive of the deposit facility usage. As a result, the use of the deposit facility fell from being more than €800 billion to around €300 billion by end-August, matched by an increase in excess reserves of the same amount (see Chart G). Although the zero rate of the ECB’s deposit facility should make banks indifferent
5 Source: Banque de France.
chart f Outstanding short-term European paper (STEp) volumes
(EUR billions)
250
270
290
310
330
350
370
390
410
430
450
250
270
290
310
330
350
370
390
410
430
450
Jan. Mar. May July Sep. Jan. Mar. May July Sep.Nov.20122011
5 July: ECB rate cut
Source: ECB.Note: Only MFIs as issuing sector.
chart g Usage of deposit facility vs. daily reserve surplus
(EUR billions)
0
100
200
300
400
500
600
700
800
900
0
100
200
300
400
500
600
700
800
900
June July Aug. Sep.
deposit facilitydaily reserve surplus
2012
Source: ECB.
71ECB
Euro Money Market StudyDecember 2012 71
9 pUTTiNg ThE EMMS iNTO pERSpEcTivE –
vOlUME DATA
9 pUTTiNg ThE EMMS iNTO pERSpEcTivE – vOlUME DATA
Since its introduction in 1999, the EMMS has been a unique and reliable source of information. The advantages of this survey lie in its comprehensive coverage as other information on money market transactions is often either not available to the broad public or only limited to a certain segment of the money market. The quantitative results of the survey are only published in the form of indices of transaction volumes, but not the level of volumes. The reason for this publication method is that the data were perceived to be reflecting the trends in various money market segments, rather than representing a benchmark of total market volumes. Nevertheless, this section discusses transaction volume data, elaborates on the reliability of the results, makes comparisons with other sources, and highlights why the volume data has to be interpreted with caution.
The survey has always served to highlight the main trends and structural developments in the euro money market and has so far not included volume data. This is mainly linked to its specific collection process. In particular, the panel of the survey – while very comprehensive – might not be encompassing enough to cover the whole money market. To start with, the quantitative data are not obtained from a standard regular statistical reporting system of credit institutions (such as MFI balance sheet statistics). Instead, the data are provided by a sample of banks that participate in the survey on a voluntary basis. Great care has been taken both to select the most active participants in the money market and, at the same time, to reflect also the variety of banks in the EU. On the other hand, the sample of banks has not been selected by any statistical process
to whether they hold their funds as unremunerated excess reserves or place them into the deposit facility, some banks still seemed to prefer to use the deposit facility. Anecdotal evidence suggests that internal liquidity management practices, as well as regulatory requirements (i.e. reserves held on the deposit facility would count towards liquidity buffers, while excess reserves held on the current account would not) may have played a role.
The reduction in the ECB’s policy rates had little impact on the banks’ usage of central bank operations, as the outstanding volume of the liquidity providing operations remained broadly stable until end-August. However, as of September, demand for central bank liquidity in the weekly main refinancing operations diminished from around €130 billion to €89 billion towards the beginning of October. This partially reflected improved market sentiment and better access to market funding sources for many euro area banks, including banks domiciled in countries with weaker credit ratings.
To conclude, a reduction in the ECB’s policy rates and, in particular, in the deposit facility rate had a profound impact on the euro area money market. Short-term rates decreased as expected and the money market yield curve flattened, as the search for yield motivated demand at longer maturities. Significant changes in volumes took place, where the direction depended on the market segment. It is, however, difficult to disentangle the effect of the zero deposit facility rate from other effects, such as the prevailing large amount of excess liquidity following the allotments of the three-year LTROs and the impact of the ECB announcement of the OMTs on market sentiment. Although the euro money market already underwent several major adjustments to the low level of policy rates by early-October 2012, the impact of the above factors had not yet fully played out and was expected to continue shaping further the adjustment process in the euro money market.
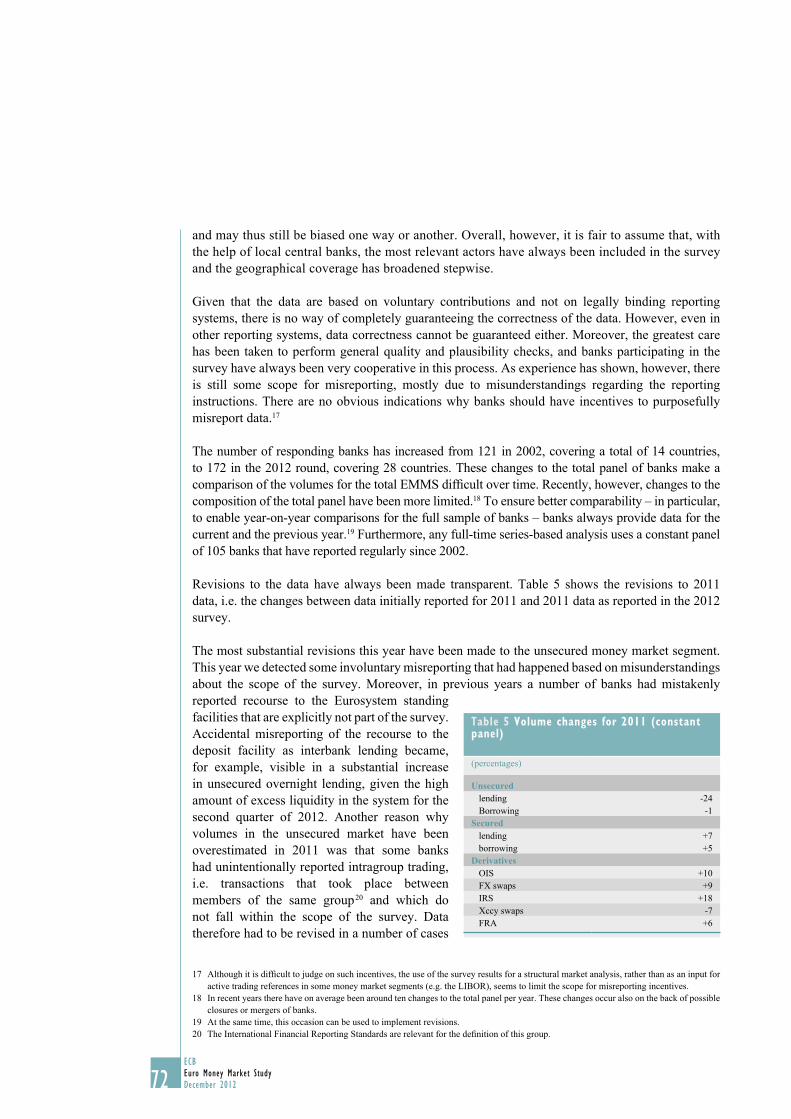
72ECBEuro Money Market StudyDecember 201272
and may thus still be biased one way or another. Overall, however, it is fair to assume that, with the help of local central banks, the most relevant actors have always been included in the survey and the geographical coverage has broadened stepwise.
Given that the data are based on voluntary contributions and not on legally binding reporting systems, there is no way of completely guaranteeing the correctness of the data. However, even in other reporting systems, data correctness cannot be guaranteed either. Moreover, the greatest care has been taken to perform general quality and plausibility checks, and banks participating in the survey have always been very cooperative in this process. As experience has shown, however, there is still some scope for misreporting, mostly due to misunderstandings regarding the reporting instructions. There are no obvious indications why banks should have incentives to purposefully misreport data.17
The number of responding banks has increased from 121 in 2002, covering a total of 14 countries, to 172 in the 2012 round, covering 28 countries. These changes to the total panel of banks make a comparison of the volumes for the total EMMS difficult over time. Recently, however, changes to the composition of the total panel have been more limited.18 To ensure better comparability – in particular, to enable year-on-year comparisons for the full sample of banks – banks always provide data for the current and the previous year.19 Furthermore, any full-time series-based analysis uses a constant panel of 105 banks that have reported regularly since 2002.
Revisions to the data have always been made transparent. Table 5 shows the revisions to 2011 data, i.e. the changes between data initially reported for 2011 and 2011 data as reported in the 2012 survey.
The most substantial revisions this year have been made to the unsecured money market segment. This year we detected some involuntary misreporting that had happened based on misunderstandings about the scope of the survey. Moreover, in previous years a number of banks had mistakenly reported recourse to the Eurosystem standing facilities that are explicitly not part of the survey. Accidental misreporting of the recourse to the deposit facility as interbank lending became, for example, visible in a substantial increase in unsecured overnight lending, given the high amount of excess liquidity in the system for the second quarter of 2012. Another reason why volumes in the unsecured market have been overestimated in 2011 was that some banks had unintentionally reported intragroup trading, i.e. transactions that took place between members of the same group 20 and which do not fall within the scope of the survey. Data therefore had to be revised in a number of cases
Although it is difficult to judge on such incentives, the use of the survey results for a structural market analysis, rather than as an input for 17 active trading references in some money market segments (e.g. the LIBOR), seems to limit the scope for misreporting incentives.In recent years there have on average been around ten changes to the total panel per year. These changes occur also on the back of possible 18 closures or mergers of banks.At the same time, this occasion can be used to implement revisions.19 The International Financial Reporting Standards are relevant for the definition of this group. 20
Table 5 volume changes for 2011 (constant panel)
(percentages)
Unsecuredlending -24Borrowing -1
Securedlending +7borrowing +5
DerivativesOIS +10FX swaps +9IRS +18Xccy swaps -7FRA +6
73ECB
Euro Money Market StudyDecember 2012 73
9 pUTTiNg ThE EMMS iNTO pERSpEcTivE –
vOlUME DATAfor the previous year, whereas the older data history remained broadly unchanged. Relatively large revisions to the aggregate unsecured lending took place this year as revisions occurred in a large number of banks.21 Furthermore, since the volumes of the unsecured market are currently relatively low, even comparatively small absolute revisions have a sizeable impact in relative terms.
In some of the other money market segments, the 2011 figures were also subject to sizeable revisions, particularly in the other IRS and the OIS market segments. These market segments are more prone to revisions by individual banks, since they are very concentrated: for example, the top ten banks make up around 85% of transactions in the other IRS market. Although some sources of misunderstanding have also been eliminated this year, the data on the derivatives market are likely to remain, also in the future, more prone to revisions. Nevertheless, it should be noted that, despite some sizeable revisions in the past, the overall trend for the market structure has always remained intact. In light of the above clarifications regarding some of the data revisions, it is recommended that a cautious approach be adopted for the volume data.
Apart from the aforementioned explanations related to individual responses, it is also important to take into account several other issues when discussing the volume data, in particular when making comparisons with other sources. First, it is not possible to check for double-counting of transactions since the data are only collected with respect to the reporting bank and do not contain details about the respective counterparty. It is thus possible, or even likely, that the same transaction will be counted twice (by two respondents). Furthermore, it should be noted that the survey data refer to the second quarter of the year and, therefore, may not capture important developments and trends in the market outside of this period. This is particularly relevant as money markets have exhibited more volatile behaviour since the onset of the financial crisis, related also to the respective levels of risk aversion prevailing in the market at a certain point in time. The second quarter was chosen since it covers neither year-end nor the beginning of the year, i.e. periods that generally exhibit higher volatility. Finally, the survey provides flow data of average daily transaction volumes, while many other data sources provide data on outstanding volumes (stocks), thus providing different perspectives.
The following section presents volume data for average daily transactions in the main money market segments as collected in the survey. Reference to other data sources for the money market will also be made and the issue of why the different data sources are not easily comparable will be discussed.
On the basis of the data collected from the survey, and with all the caveats mentioned above, the overall volume in the euro money market stood in the second quarter of 2012 at an average daily turnover of around €1.4 trillion for the total sample of 172 banks (see Table 6).22 This number sums up the volumes of all money market segments as covered by the survey, adding both the borrowing and the lending sides. As Table 6 shows, the constant panel of 105 banks makes up the biggest share of transactions in most market segments. This is a clear indication that the general market trends over time are well-mirrored in the slightly reduced panel.
For the unsecured market, the average daily turnover was around €32 billion for the lending and around €62 billion for the borrowing side for the constant panel in the second quarter of 2012.23
The unsecured market is the least concentrated market segment and, therefore, less impacted by revisions of an individual bank.21 This data refers to all maturities; the breakdown of maturities can be deducted from the relative shares in total turnover as published in 22 the survey. The difference between the volumes for unsecured lending and unsecured borrowing can be explained by the fact that transactions are also 23 performed with banks outside of the survey panel.
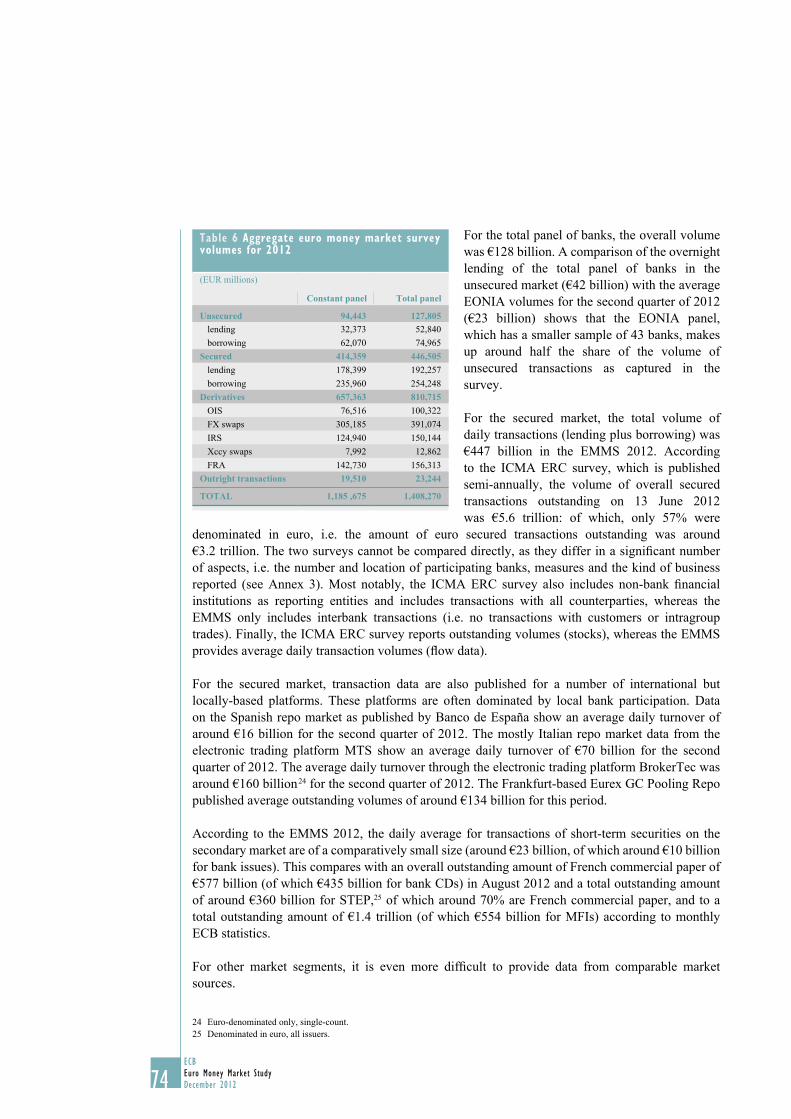
74ECBEuro Money Market StudyDecember 201274
For the total panel of banks, the overall volume was €128 billion. A comparison of the overnight lending of the total panel of banks in the unsecured market (€42 billion) with the average EONIA volumes for the second quarter of 2012 (€23 billion) shows that the EONIA panel, which has a smaller sample of 43 banks, makes up around half the share of the volume of unsecured transactions as captured in the survey.
For the secured market, the total volume of daily transactions (lending plus borrowing) was €447 billion in the EMMS 2012. According to the ICMA ERC survey, which is published semi-annually, the volume of overall secured transactions outstanding on 13 June 2012 was €5.6 trillion: of which, only 57% were
denominated in euro, i.e. the amount of euro secured transactions outstanding was around €3.2 trillion. The two surveys cannot be compared directly, as they differ in a significant number of aspects, i.e. the number and location of participating banks, measures and the kind of business reported (see Annex 3). Most notably, the ICMA ERC survey also includes non-bank financial institutions as reporting entities and includes transactions with all counterparties, whereas the EMMS only includes interbank transactions (i.e. no transactions with customers or intragroup trades). Finally, the ICMA ERC survey reports outstanding volumes (stocks), whereas the EMMS provides average daily transaction volumes (flow data).
For the secured market, transaction data are also published for a number of international but locally-based platforms. These platforms are often dominated by local bank participation. Data on the Spanish repo market as published by Banco de España show an average daily turnover of around €16 billion for the second quarter of 2012. The mostly Italian repo market data from the electronic trading platform MTS show an average daily turnover of €70 billion for the second quarter of 2012. The average daily turnover through the electronic trading platform BrokerTec was around €160 billion 24 for the second quarter of 2012. The Frankfurt-based Eurex GC Pooling Repo published average outstanding volumes of around €134 billion for this period.
According to the EMMS 2012, the daily average for transactions of short-term securities on the secondary market are of a comparatively small size (around €23 billion, of which around €10 billion for bank issues). This compares with an overall outstanding amount of French commercial paper of €577 billion (of which €435 billion for bank CDs) in August 2012 and a total outstanding amount of around €360 billion for STEP,25 of which around 70% are French commercial paper, and to a total outstanding amount of €1.4 trillion (of which €554 billion for MFIs) according to monthly ECB statistics.
For other market segments, it is even more difficult to provide data from comparable market sources.
Euro-denominated only, single-count.24 Denominated in euro, all issuers.25
Table 6 Aggregate euro money market survey volumes for 2012
(EUR millions)
Constant panel Total panel
Unsecured 94,443 127,805lending 32,373 52,840borrowing 62,070 74,965
Secured 414,359 446,505lending 178,399 192,257borrowing 235,960 254,248
Derivatives 657,363 810,715OIS 76,516 100,322FX swaps 305,185 391,074IRS 124,940 150,144Xccy swaps 7,992 12,862FRA 142,730 156,313
Outright transactions 19,510 23,244
TOTAL 1,185 ,675 1,408,270
75ECB
Euro Money Market StudyDecember 2012 75
9 pUTTiNg ThE EMMS iNTO pERSpEcTivE –
vOlUME DATATo sum up, it is thus very difficult to compare the total volumes recorded in the EMMS with other sources. At the same time, this section has also shown that the survey remains an essential – if not the only – comprehensive dataset on the most relevant segments of the European money market. Indeed, although there are many different data sources with respect to individual money market segments or local regions, the EMMS is unique in providing comparable information for all money market segments derived from the same sample of banks.
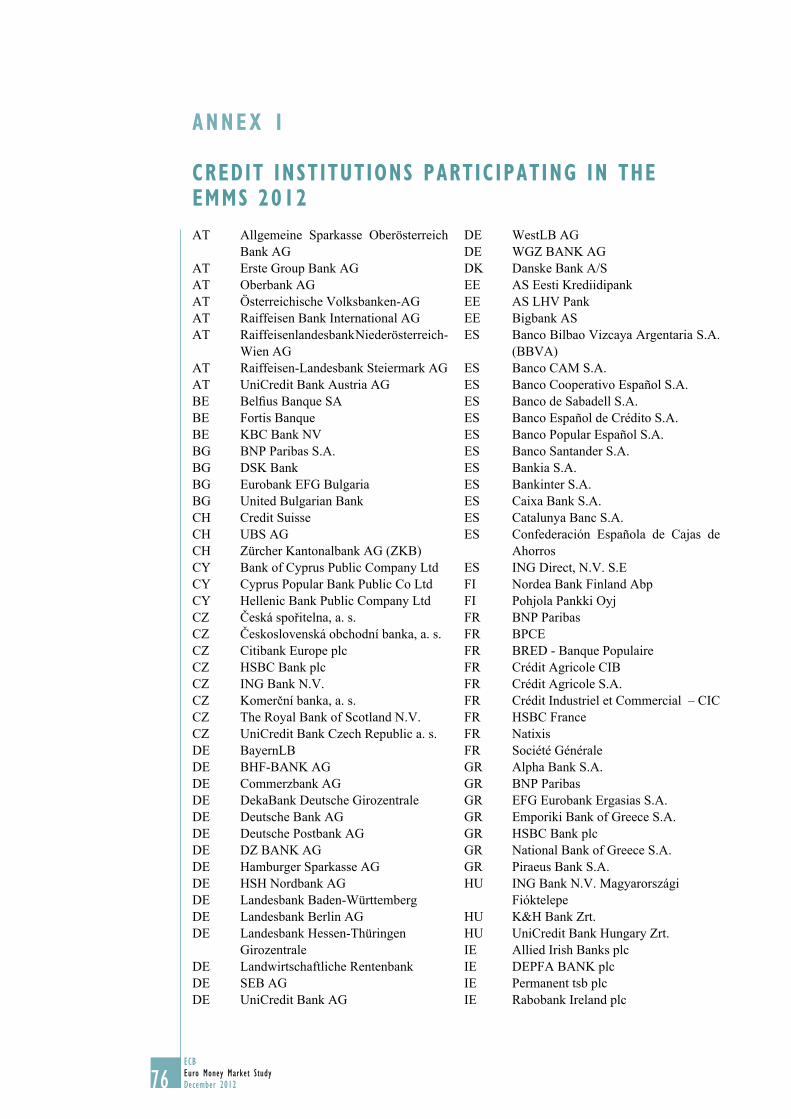
76ECBEuro Money Market StudyDecember 201276
AT Allgemeine Sparkasse Oberösterreich Bank AG
AT Erste Group Bank AGAT Oberbank AGAT Österreichische Volksbanken-AGAT Raiffeisen Bank International AGAT Raiffeisenlandesbank Niederösterreich-
Wien AGAT Raiffeisen-Landesbank Steiermark AGAT UniCredit Bank Austria AGBE Belfius Banque SABE Fortis BanqueBE KBC Bank NVBG BNP Paribas S.A.BG DSK Bank BG Eurobank EFG BulgariaBG United Bulgarian BankCH Credit SuisseCH UBS AG CH Zürcher Kantonalbank AG (ZKB)CY Bank of Cyprus Public Company LtdCY Cyprus Popular Bank Public Co LtdCY Hellenic Bank Public Company LtdCZ Česká spořitelna, a. s.CZ Československá obchodní banka, a. s.CZ Citibank Europe plcCZ HSBC Bank plcCZ ING Bank N.V.CZ Komerční banka, a. s.CZ The Royal Bank of Scotland N.V.CZ UniCredit Bank Czech Republic a. s.DE BayernLBDE BHF-BANK AGDE Commerzbank AGDE DekaBank Deutsche GirozentraleDE Deutsche Bank AGDE Deutsche Postbank AGDE DZ BANK AGDE Hamburger Sparkasse AGDE HSH Nordbank AGDE Landesbank Baden-WürttembergDE Landesbank Berlin AGDE Landesbank Hessen-Thüringen
GirozentraleDE Landwirtschaftliche RentenbankDE SEB AG DE UniCredit Bank AG
DE WestLB AGDE WGZ BANK AGDK Danske Bank A/SEE AS Eesti KrediidipankEE AS LHV PankEE Bigbank ASES Banco Bilbao Vizcaya Argentaria S.A.
(BBVA)ES Banco CAM S.A.ES Banco Cooperativo Español S.A.ES Banco de Sabadell S.A.ES Banco Español de Crédito S.A.ES Banco Popular Español S.A.ES Banco Santander S.A.ES Bankia S.A.ES Bankinter S.A.ES Caixa Bank S.A.ES Catalunya Banc S.A.ES Confederación Española de Cajas de
AhorrosES ING Direct, N.V. S.EFI Nordea Bank Finland AbpFI Pohjola Pankki OyjFR BNP ParibasFR BPCE FR BRED - Banque PopulaireFR Crédit Agricole CIBFR Crédit Agricole S.A.FR Crédit Industriel et Commercial – CICFR HSBC FranceFR Natixis FR Société GénéraleGR Alpha Bank S.A.GR BNP ParibasGR EFG Eurobank Ergasias S.A.GR Emporiki Bank of Greece S.A.GR HSBC Bank plcGR National Bank of Greece S.A.GR Piraeus Bank S.A.HU ING Bank N.V. Magyarországi
FióktelepeHU K&H Bank Zrt.HU UniCredit Bank Hungary Zrt.IE Allied Irish Banks plcIE DEPFA BANK plcIE Permanent tsb plcIE Rabobank Ireland plc
ANNEx 1
cREDiT iNSTiTUTiONS pARTicipATiNg iN ThE EMMS 2012
77ECB
Euro Money Market StudyDecember 2012 77
ANNEx 1
IE The Governor and Company of the Bank of Ireland
IE UniCredit Bank Ireland plcIT Banca IMI SpaIT Banca Monte dei Paschi di Siena SpaIT Banca Nazionale del Lavoro Spa
(BNL)IT BNP Paribas S.A.IT Dexia Crediop SpaIT Intesa Sanpaolo SpaIT UBI Banca (Unione di Banche Italiane
Scpa)IT UniCredit SpaLT AB SEB bankasLT AB Ūkio bankasLT Swedbank, ABLU Banque et Caisse d’Épargne de l’État,
LuxembourgLU KBL European Private Bankers S.A.LU UniCredit Luxembourg S.A.LV AS Citadele bankaLV Rietumu BankaLV SEB banka LV Swedbank MT Akbank T.A.S.MT Bank of Valletta plcMT FIMBank plcMT Garanti Bank MaltaMT HSBC Bank Malta plcNL ABN AMRO Bank N.V.NL Bank Nederlandse Gemeenten N.V.NL Coöperatieve Centrale Raiffeisen-
Boerenleenbank B.A. (Rabobank)NL F. van Lanschot Bankiers N.V.NL ING Bank N.V.NL The Royal Bank of Scotland N.V.PL Bank BPH S.A.PL Bank Handlowy w Warszawie S.A.PL Bank Polska Kasa Opieki S.A. (Bank
Pekao S.A.)PL Bank Zachodni WBK S.A.PL Deutsche Bank Polska S.A.PL Getin Noble Bank S.A.PL ING Bank Śląski S.A.PL Invest-Bank S.A.PL Kredyt Bank S.A.PL Powszechna Kasa Oszczędności Bank
Polski S.A. (PKO BP)PL Raiffeisen Bank Polska S.A.
PL Societe Generale S.A. Oddział w Polsce
PT Banco BPI SAPT Banco Comercial Português SAPT Banco do Brasil AG – Sucursal em
PortugalPT Banco Espírito Santo SAPT Banco Finantia SAPT Banco Itaú Europa SAPT Banco Santander Totta SAPT BANIF –Banco Internacional do
Funchal SAPT Barclays Bank plcPT BPN – Banco Português de Negócios
SAPT Caixa Central – Caixa Central de
Crédito Agrícola Mútuo, CRLPT Caixa Económica Montepio GeralPT Caixa Geral de Depósitos SAPT Deutsche Bank (Portugal) SARO Banca Comerciala Romana S.A.RO BRD - Groupe Societe Generale S.A.RO RBS Bank (Romania) S.A.SE Skandinaviska Enskilda Banken AB
(publ) (SEB)SE Svenska Handelsbanken AB (publ)SE Swedbank AB (publ)SI Abanka Vipa D.D.SI Nova Ljubljanska Banka d.d., LjubljanaSI UniCredit Banka Slovenija d.d.SK Československá obchodná banka, a.s.SK Všeobecná úverová banka, a.s. (VÚB)UK Abbey National Treasury Services plcUK Banco do Brasil SAUK Banco Espírito Santo SAUK Barclays Bank PLCUK BNP ParibasUK Citibank N.A.UK Crédit Agricole CIBUK Credit SuisseUK Deutsche Bank AGUK Goldman Sachs International BankUK HSBC Bank plcUK JPMorgan Chase & Co.UK Lloyds TSB Bank plcUK Merrill Lynch International Bank
LimitedUK Standard Bank plcUK The Royal Bank of Scotland plc
78ECBEuro Money Market StudyDecember 201278
ScOpE Of ThE STUDY
In this ninth Euro money market study, banks were invited to provide data about their interbank activity during the second quarters of 2011 and 2012, covering the main segments of the euro money market. Non-interbank or customer transactions (i.e. transactions with corporate customers, central banks or supranational institutions) are not reported as they do not fall within the scope of the 2012 study.
Banks reported interbank activity where this activity was registered in their own entity. Intragroup flows derived from intragroup operations are excluded from the 2012 study. Any interbank activity by another subsidiary/branch of the group is reported by the relevant entity of the group in a separate questionnaire. The data reported are nominal amounts for cash transactions and notional amounts for derivatives transactions. In addition, transactions related to the rollover of previous positions were taken into consideration. The turnover for each maturity bucket was the “average” daily turnover over the relevant quarter. This average is calculated by dividing the total amount of transactions executed during the reporting period by the number of business days in the reporting period. The reporting banks were asked to specify the number of business days considered for this calculation.
The turnover was allocated to each maturity bucket according to the initial maturity of the transactions (including forward transactions, regardless of the settlement date). In the case of transactions redeemable at notice, the length of the notice period was taken as the maturity.
In addition, banks were asked to fill in a qualitative survey providing information about efficiency, changes in liquidity and the breakdown of transaction amounts by both counterparty location and trading system for each money market segment. Trading systems were broken down into direct trading, trading via broker and trading via electronic devices. Finally, the 2012 survey also collected information about the efficiency of the options market and changes in its liquidity. The range of answers made available to respondents to assess these factors was also extended to include five possibilities, thereby facilitating symmetry in the responses.
The location of the counterparties with which reporting banks conducted transactions during the second quarter of 2012 were divided in the qualitative survey according to the geographical location of the counterparty: national, euro area, and other. “National” refers to counterparties located in the same country as the reporting bank. If the reporting bank is not located in the euro area, “euro area” refers to counterparties located in the 17 euro area countries; if the reporting bank is located in the euro area, “euro area” refers to counterparties located in the other 16 euro area countries. “Other” refers to counterparties located in all non-euro area countries.
SEcURED AND UNSEcURED SEgMENTS
For the secured and unsecured segments of the money market, the activity tables are divided according to the terms of the lending and borrowing activity. For the secured segment, “cash lending” refers to buy/sell-back transactions and reverse repos, while “cash borrowing” refers to sell/buy-back transactions and repos. Information about the origin of collateral has been provided as a percentage of the average daily transactions in secured markets. For the country of issuance of the security used as collateral, the same geographical approach as for the location of counterparties is used: national, euro area, and other. The split between bilateral and triparty repos in the secured markets has only been reported since 2004 (there are also figures for 2003).
ANNEx 2
TEchNicAl ANNEx
79ECB
Euro Money Market StudyDecember 2012 79
ANNEx 2
SwAp SEgMENTS
The 2012 study covers different kinds of swap transactions.
Overnight indexed swaps (OIS) are financial operations calculated on the basis of an exchange –of a fixed rate agreed at the onset of the swap, and a floating-rate leg linked to a daily overnight rate reference during the period of the swap. At the maturity of the swap, the two parties exchange a net payment based on the difference between the interest accrued at the agreed fixed rate and the interest accrued at the compounded floating rate (geometric average), multiplied by the notional amount. In the euro money market the most widely recognised overnight index is the EONIA (euro overnight index average). Banks were also asked to provide the percentage of their average daily OIS turnover not indexed to the EONIA.
Foreign exchange (FX) swaps are transactions which involve the actual exchange of two –currencies (principal amount only) on a specific date at a rate agreed at the time of conclusion of the contract (the short leg), and a reverse exchange of the same two currencies at a future date at a rate (generally different from the one applied to the short leg) agreed at the time of the contract (the long leg). Both spot/forward and forward/forward swaps fall into this category. FX swaps are only reported if one of the two currencies exchanged was the euro. Furthermore, and to avoid double-counting, only the leg in euro is reported. In 2012, the EMMS also collected a breakdown of FX swaps by the following currencies exchanged against the euro: USD, CHF, JPY and GBP.
Interest rate swaps (IRS) are agreements to exchange periodic payments related to interest –rates in one currency, in this case, the euro; they can be either fixed-for-floating or floating-for-floating, based on different indices.
Cross-currency swaps are contracts that commit two counterparties to exchange streams of –interest payments in different currencies for an agreed period of time, and to exchange principal amounts in different currencies at a pre-agreed exchange rate at maturity. Banks were asked to consider cross-currency swaps only if one of the currencies involved was the euro.
ShORT-TERM SEcURiTiES
The information on the turnover in outright transactions in euro-denominated short-term securities is divided into three categories: government issues (e.g. Treasury bills), bank issues (i.e. paper issued by euro area credit institutions) and non-bank issues (i.e. paper issued by corporations). Banks report the average of daily outright transactions. Outright transactions are defined as a sale or purchase of short-term securities on the interbank secondary market. Short-term securities are broadly defined as all securities with an initial maturity of up to 12 months, including Treasury bills, commercial paper, euro commercial paper, asset-backed commercial paper, certificates of deposit, etc. The primary market or issuance activity has not been included, but there is a separate item for the issuance by the panel bank.
REviSiON Of ThE cOMpOSiTiON Of ThE pANEl
To compare the findings with those of previous studies and to analyse long-term trends in the euro money market, a constant panel of banks for each segment was used for all previous money
80ECBEuro Money Market StudyDecember 201280
market studies dating back to 2002. In the 2006 study, however, 29 banks were added to this panel with the aim of improving the representative nature of the sample.
In order to smooth out the impact of the inclusion of new banks in the panel and to enable a comparison of long-term trends, the turnover of the extended panel in 2002 was re-indexed to the turnover reported in 2002 from the initial constant panel (using the chain-linking approach). The base year for the study is 2002.
The number of panel banks is the same for all money market segments, even if some of these banks only started operating in a particular market segment after 2000.
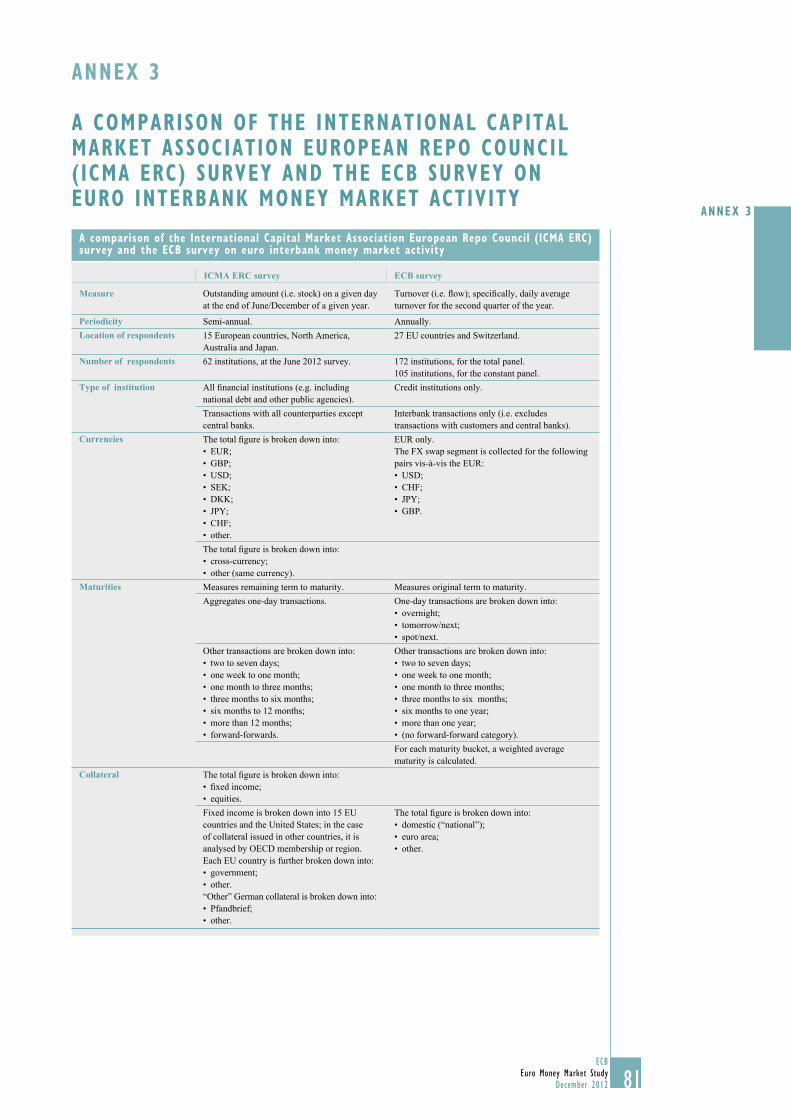
81ECB
Euro Money Market StudyDecember 2012 81
ANNEx 3
ANNEx 3
A cOMpARiSON Of ThE iNTERNATiONAl cApiTAl MARKET ASSOciATiON EUROpEAN REpO cOUNcil ( icMA ERc) SURvEY AND ThE Ecb SURvEY ON EURO iNTERbANK MONEY MARKET AcTiviTY
A comparison of the international capital Market Association European Repo council (icMA ERc) survey and the Ecb survey on euro interbank money market activity
ICMA ERC survey ECB survey
Measure Outstanding amount (i.e. stock) on a given day at the end of June/December of a given year.
Turnover (i.e. flow); specifically, daily average turnover for the second quarter of the year.
Periodicity Semi-annual. Annually.Location of respondents 15 European countries, North America,
Australia and Japan.27 EU countries and Switzerland.
Number of respondents 62 institutions, at the June 2012 survey. 172 institutions, for the total panel.105 institutions, for the constant panel.
Type of institution All financial institutions (e.g. including national debt and other public agencies).
Credit institutions only.
Transactions with all counterparties except central banks.
Interbank transactions only (i.e. excludes transactions with customers and central banks).
Currencies The total figure is broken down into:EUR;• GBP;• USD;• SEK;• DKK;• JPY;• CHF;• other.•
EUR only.The FX swap segment is collected for the following pairs vis-à-vis the EUR:
USD;• CHF;• JPY;• GBP.•
The total figure is broken down into:cross-currency; • other (same currency).•
Maturities Measures remaining term to maturity. Measures original term to maturity.Aggregates one-day transactions. One-day transactions are broken down into:
overnight; • tomorrow/next; • spot/next.•
Other transactions are broken down into:two to seven days;• one week to one month;• one month to three months;• three months to six months;• six months to 12 months;• more than 12 months;• forward-forwards.•
Other transactions are broken down into:two to seven days;• one week to one month;• one month to three months;• three months to six months;• six months to one year;• more than one year;• (no forward-forward category).•
For each maturity bucket, a weighted average maturity is calculated.
Collateral The total figure is broken down into: fixed income;• equities.•
Fixed income is broken down into 15 EU countries and the United States; in the case of collateral issued in other countries, it is analysed by OECD membership or region. Each EU country is further broken down into:
government;• other.•
“Other” German collateral is broken down into:Pfandbrief; • other.•
The total figure is broken down into:domestic (“national”);• euro area;• other.•
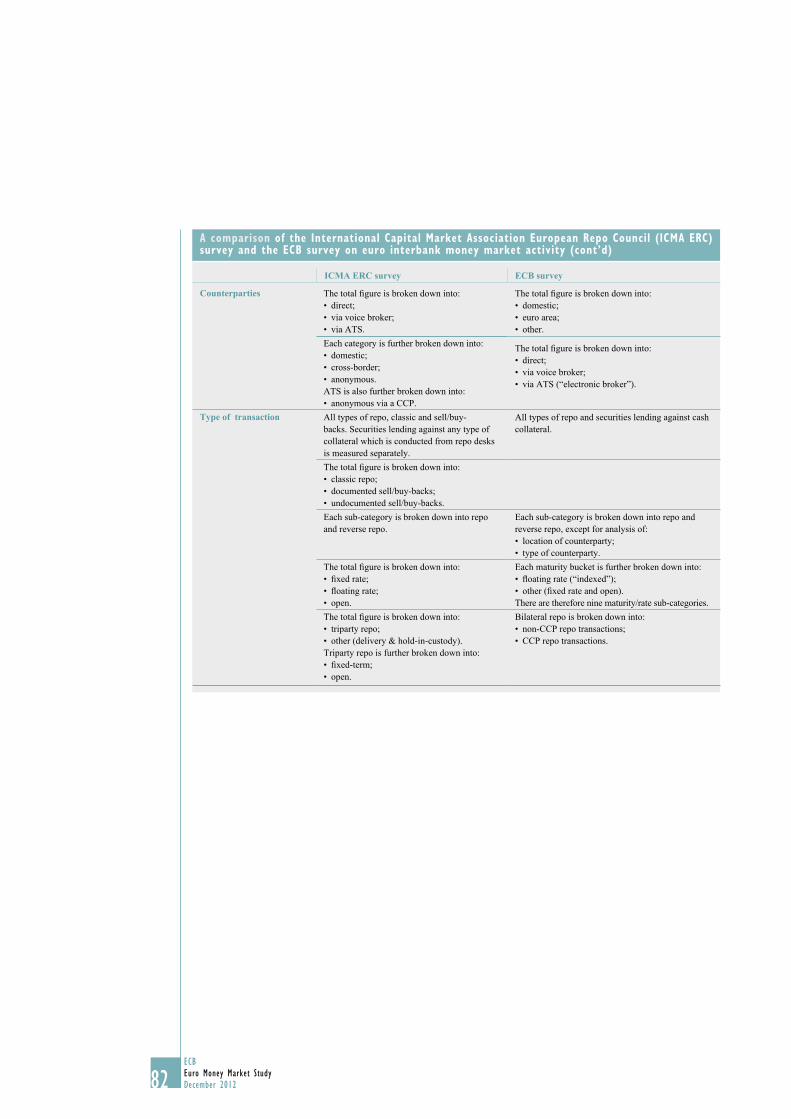
82ECBEuro Money Market StudyDecember 201282
A comparison of the international capital Market Association European Repo council (icMA ERc) survey and the Ecb survey on euro interbank money market activity (cont’d)
ICMA ERC survey ECB survey
Counterparties The total figure is broken down into:direct;• via voice broker;• via ATS.•
The total figure is broken down into:domestic;• euro area;• other.•
Each category is further broken down into:domestic;• cross-border;• anonymous.•
ATS is also further broken down into:anonymous via a CCP.•
The total figure is broken down into:direct;• via voice broker;• via ATS (“electronic broker”).•
Type of transaction All types of repo, classic and sell/buy-backs. Securities lending against any type of collateral which is conducted from repo desks is measured separately.
All types of repo and securities lending against cash collateral.
The total figure is broken down into:classic repo;• documented sell/buy-backs;• undocumented sell/buy-backs.•
Each sub-category is broken down into repo and reverse repo.
Each sub-category is broken down into repo and reverse repo, except for analysis of:
location of counterparty;• type of counterparty.•
The total figure is broken down into:fixed rate;• floating rate;• open.•
Each maturity bucket is further broken down into:floating rate (“indexed”);• other (fixed rate and open).•
There are therefore nine maturity/rate sub-categories.The total figure is broken down into:
triparty repo;• other (delivery & hold-in-custody).•
Triparty repo is further broken down into:fixed-term;• open.•
Bilateral repo is broken down into:non-CCP repo transactions;• CCP repo transactions.•
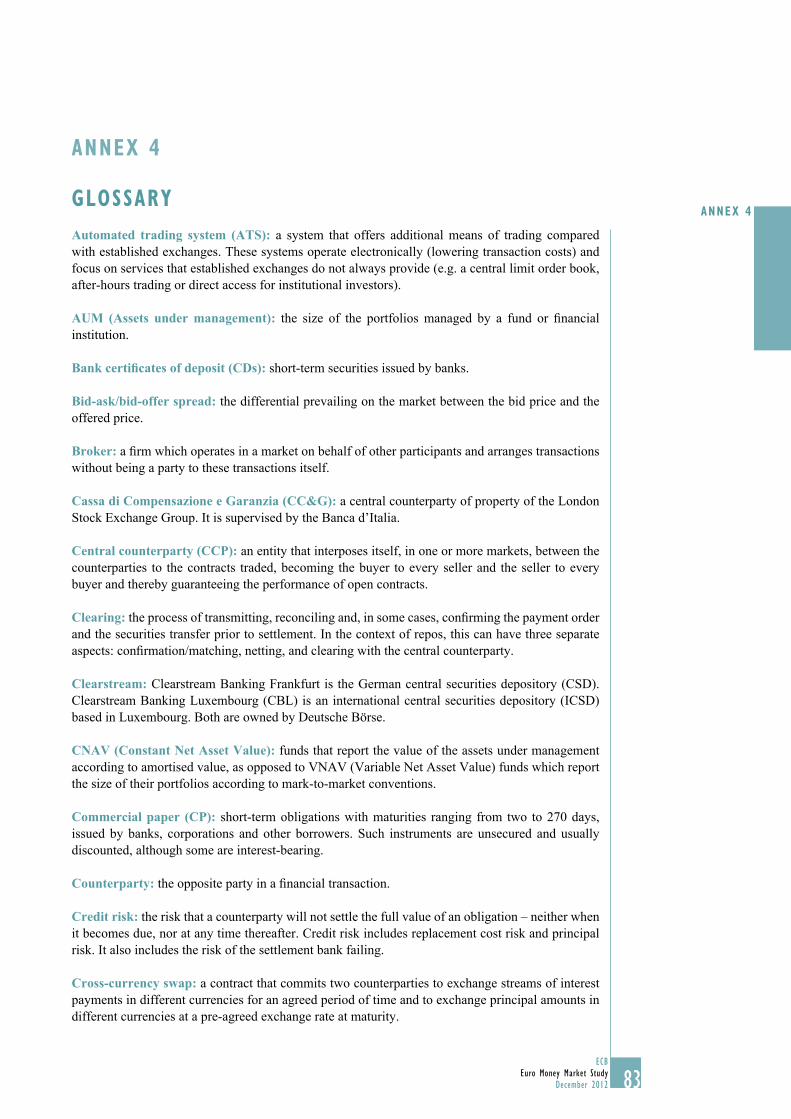
83ECB
Euro Money Market StudyDecember 2012 83
ANNEx 4
Automated trading system (ATS): a system that offers additional means of trading compared with established exchanges. These systems operate electronically (lowering transaction costs) and focus on services that established exchanges do not always provide (e.g. a central limit order book, after-hours trading or direct access for institutional investors).
AUM (Assets under management): the size of the portfolios managed by a fund or financial institution.
Bank certificates of deposit (CDs): short-term securities issued by banks.
Bid-ask/bid-offer spread: the differential prevailing on the market between the bid price and the offered price.
Broker: a firm which operates in a market on behalf of other participants and arranges transactions without being a party to these transactions itself.
Cassa di Compensazione e Garanzia (CC&G): a central counterparty of property of the London Stock Exchange Group. It is supervised by the Banca d’Italia.
Central counterparty (CCP): an entity that interposes itself, in one or more markets, between the counterparties to the contracts traded, becoming the buyer to every seller and the seller to every buyer and thereby guaranteeing the performance of open contracts.
Clearing: the process of transmitting, reconciling and, in some cases, confirming the payment order and the securities transfer prior to settlement. In the context of repos, this can have three separate aspects: confirmation/matching, netting, and clearing with the central counterparty.
Clearstream: Clearstream Banking Frankfurt is the German central securities depository (CSD). Clearstream Banking Luxembourg (CBL) is an international central securities depository (ICSD) based in Luxembourg. Both are owned by Deutsche Börse.
CNAV (Constant Net Asset Value): funds that report the value of the assets under management according to amortised value, as opposed to VNAV (Variable Net Asset Value) funds which report the size of their portfolios according to mark-to-market conventions.
Commercial paper (CP): short-term obligations with maturities ranging from two to 270 days, issued by banks, corporations and other borrowers. Such instruments are unsecured and usually discounted, although some are interest-bearing.
Counterparty: the opposite party in a financial transaction.
Credit risk: the risk that a counterparty will not settle the full value of an obligation – neither when it becomes due, nor at any time thereafter. Credit risk includes replacement cost risk and principal risk. It also includes the risk of the settlement bank failing.
Cross-currency swap: a contract that commits two counterparties to exchange streams of interest payments in different currencies for an agreed period of time and to exchange principal amounts in different currencies at a pre-agreed exchange rate at maturity.
ANNEx 4
glOSSARY
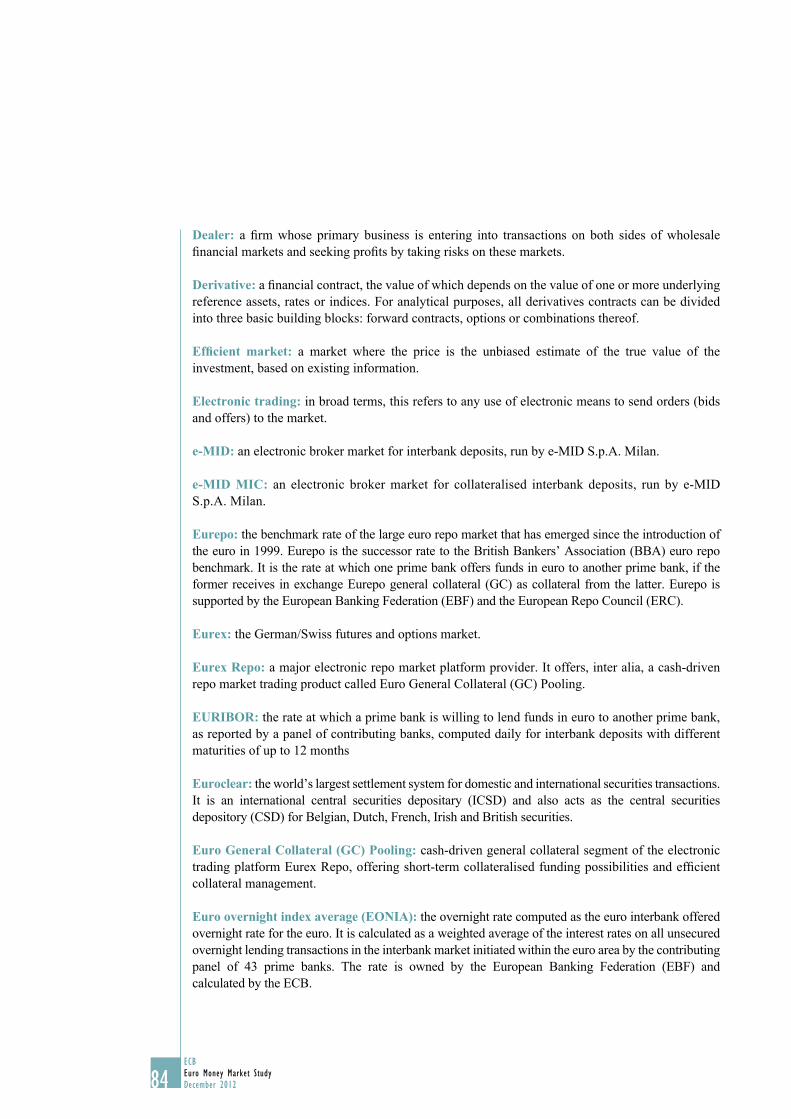
84ECBEuro Money Market StudyDecember 201284
Dealer: a firm whose primary business is entering into transactions on both sides of wholesale financial markets and seeking profits by taking risks on these markets.
Derivative: a financial contract, the value of which depends on the value of one or more underlying reference assets, rates or indices. For analytical purposes, all derivatives contracts can be divided into three basic building blocks: forward contracts, options or combinations thereof.
Efficient market: a market where the price is the unbiased estimate of the true value of the investment, based on existing information.
Electronic trading: in broad terms, this refers to any use of electronic means to send orders (bids and offers) to the market.
e-MID: an electronic broker market for interbank deposits, run by e-MID S.p.A. Milan.
e-MID MIC: an electronic broker market for collateralised interbank deposits, run by e-MID S.p.A. Milan.
Eurepo: the benchmark rate of the large euro repo market that has emerged since the introduction of the euro in 1999. Eurepo is the successor rate to the British Bankers’ Association (BBA) euro repo benchmark. It is the rate at which one prime bank offers funds in euro to another prime bank, if the former receives in exchange Eurepo general collateral (GC) as collateral from the latter. Eurepo is supported by the European Banking Federation (EBF) and the European Repo Council (ERC).
Eurex: the German/Swiss futures and options market.
Eurex Repo: a major electronic repo market platform provider. It offers, inter alia, a cash-driven repo market trading product called Euro General Collateral (GC) Pooling.
EURIBOR: the rate at which a prime bank is willing to lend funds in euro to another prime bank, as reported by a panel of contributing banks, computed daily for interbank deposits with different maturities of up to 12 months
Euroclear: the world’s largest settlement system for domestic and international securities transactions. It is an international central securities depositary (ICSD) and also acts as the central securities depository (CSD) for Belgian, Dutch, French, Irish and British securities.
Euro General Collateral (GC) Pooling: cash-driven general collateral segment of the electronic trading platform Eurex Repo, offering short-term collateralised funding possibilities and efficient collateral management.
Euro overnight index average (EONIA): the overnight rate computed as the euro interbank offered overnight rate for the euro. It is calculated as a weighted average of the interest rates on all unsecured overnight lending transactions in the interbank market initiated within the euro area by the contributing panel of 43 prime banks. The rate is owned by the European Banking Federation (EBF) and calculated by the ECB.
85ECB
Euro Money Market StudyDecember 2012 85
ANNEx 4
Euronext: the company born out of the merger of the Amsterdam, Brussels and Paris exchanges on 22 September 2000. In 2007, it merged with the New York Stock Exchange (NYSE) to create the NYSE Euronext.
Euronext.liffe: the Euronext-London International Financial Futures and Options Exchange. Euronext took over Liffe in October 2001.
European System of Central Banks (ESCB): composed of the ECB and the NCBs of all 27 EU Member States, i.e. it includes, in addition to the members of the Eurosystem, the NCBs of those Member States whose currency is not the euro. The ESCB is governed by the Governing Council and the Executive Board of the ECB, and, as a third decision-making body of the ECB, by the General Council.
Eurosystem: the central banking system of the euro area. It comprises the ECB and the NCBs of the EU Member States whose currency is the euro.
Foreign exchange swap (FX swap): the simultaneous spot purchase/sale and forward sale/purchase of one currency against another. In the EMMS, banks are asked to report FX swaps only if one of the two currencies exchanged is the euro and, in this case, the euro amount of the short leg.
Forward rate agreement (FRA): a cash-settled forward contract on a deposit.
Forward: the purchase or sale of a specific quantity of a commodity at the current price, with delivery and settlement at a specified future date.
Future: an agreement to buy or sell a specific amount of a commodity or financial instrument at a particular price on a stipulated future date.
General collateral (GC): collateral which, owing to its homogeneous features, is widely accepted.
Interest rate swap (IRS): an exchange between two parties of a fixed interest rate instrument or of two floating interest rate instruments.
International central securities depository (ICSD): a central securities depository which settles international securities or cross-border transactions in domestic securities.
Key ECB interest rates: the interest rates set by the Governing Council. They are the rates on the main refinancing operations, the marginal lending facility and the deposit facility.
Liquid (market): the three aspects of liquidity are: tightness in bid-ask spreads, depth, and resiliency. Liquidity is characterised by the ability to conduct transactions in a market without significantly moving prices.
Longer-Term Refinancing Operation (LTRO): a credit operation with a maturity of more than one week that is executed by the Eurosystem in the form of reverse transactions. The regular monthly operations have a maturity of three months. During the financial market turmoil that started in August 2007, supplementary operations with maturities ranging from one maintenance period to 36 months were conducted, the frequency of which varied.
86ECBEuro Money Market StudyDecember 201286
Lorenz curves: cumulative frequency curves that compare the distribution of one variable (money market activity) with the uniform distribution that represents equality (diagonal line in the charts). For convenience of interpretation, the Lorenz curves presented in the 2012 Euro money market study have been plotted above the equality line, instead of below it (which is the more standard mode of presentation), since market players were sorted by descending order of their activity share.
Main refinancing operation (MRO): a regular open market operation executed by the Eurosystem in the form of reverse transactions. Such operations are carried out through a weekly standard tender procedure and normally have a maturity of one week. The collateral accepted for these operations and the eligibility criteria for counterparties are published on the ECB’s website.
Market-maker: a dealer that is obliged to quote buy and sell prices in return for certain privileges within a market (sometimes used to refer to any participant providing quotes).
Market transparency: the ability of market participants to observe (pre-trade) quotes and (post-trade) prices and volumes in a timely fashion.
Monetary financial institution (MFI): financial institutions which together form the money-issuing sector of the euro area. These include the Eurosystem, resident credit institutions (as defined in EU law) and all other resident financial institutions whose business is to receive deposits and/or close substitutes for deposits from entities other than MFIs and, for their own account (at least in economic terms), to grant credit and/or invest in securities. The latter group consists predominantly of money market funds, i.e. funds that invest in short-term and low-risk instruments, usually with a maturity of one year or less.
Money market: the market in which short-term funds are raised, invested and traded using instruments which generally have an original maturity of less than one year.
Monte Titoli S.p.A.: the Italian central security depository (CSD).
MTS S.p.A.: an electronic fixed-income trading market, owned by London Stock Exchange Group, with over 500 counterparties and average daily turnover exceeding €85 billion, including the repo segment.
Option: the right to sell or buy a security in exchange. The “American” options can be executed any date between their purchase and their expiry date. “European” options are executed only on the expiry date.
OTC (over-the-counter): a method of trading that does not involve a regulated market. In over-the-counter markets, such as those for OTC derivatives, participants trade directly with each other, typically through telephone or computer links.
Overnight interest rate swap (OIS): a financial operation involving an exchange of cash flows on a specified date. It involves paying or receiving a fixed cash flow on the one hand, and paying or receiving a variable rate cash flow on the other.
Primary market: the market for new issues of securities.
87ECB
Euro Money Market StudyDecember 2012 87
ANNEx 4
Real-time gross settlement (RTGS) system: a settlement system in which processing and settlement take place on an order-by-order basis (without netting) in real time (continuously).
Repo: a financial instrument which allows cash to be temporarily exchanged for securities for a predetermined period. Various legal arrangements exist to perform this basic economic function (repo agreements, reverse repo agreements, sell/buy-backs and securities lending). All forms of repos entail a change in ownership.
Reserve maintenance period: the period over which compliance with the reserve requirements is calculated. Maintenance periods begin on the settlement day of the first main refinancing operation following the meeting of the ECB’s Governing Council, at which the monthly assessment of the monetary policy stance is pre-scheduled. They normally end on the day preceding the corresponding settlement day in the following month.
Reserve requirement: the minimum amount of reserves a credit institution is required to hold with the Eurosystem over a predefined maintenance period. Compliance with the requirement is determined on the basis of the average of the daily balances in the reserve accounts over the maintenance period.
Reverse repo: a contract with a counterparty to buy and subsequently resell securities at a specified date and price. A reverse repo is thus the mirror image of a repo.
Secondary market: exchanges and over-the-counter markets where securities are bought and sold subsequent to their original issuance, which took place on the primary market.
Settlement: the completion of a transaction by the exchange of instruments and funds.
Special Maintenance Period Operation: operations conducted by the ECB with a maturity of one maintenance period.
Spot/next (day): an expression used by traders when a transaction is settled two business days after today and matures the following business day.
Swap: an agreement to exchange payments between two counterparties at some point(s) in the future and according to a specified formula.
TARGET2 (Trans-European Automated Real-time Gross settlement Express Transfer system): the second-generation TARGET system. It settles payments in euro in central bank money and functions on the basis of a single shared IT platform, to which all payment orders are submitted for processing.
Tomorrow/next (day): an expression used by traders when a transaction is settled on the next business day after today and matures the following business day.
Treasury bill (T-bill): a short-term government debt instrument issued at a discount with a maturity of one year or less.
Triparty repo: a repo that involves a third party, commonly a custodian bank or an ICSD, acting as an agent to exchange cash and collateral for one or both of the counterparties.
88ECBEuro Money Market StudyDecember 201288
UCITS (Undertaking for Collective Investment in Transferable Securities): a set of EU directives aiming to harmonise the rules for collective investments within the EU. UCITS funds that are authorised in one EU country, as a result of mutual recognition, are also allowed to be marketed in the remaining EU countries.
VNAV (Variable Net Asset Value): see CNAV.
89ECB
Euro Money Market StudyDecember 2012 89
ANNEx 5
The 2012 Euro money market study was conducted by a working group comprising staff members from the ECB and national central banks which reported to the ESCB’s Market Operations Committee.
ANNEx 5
cOORDiNATiON Of ThE 2012 EURO MONEY MARKET STUDY

EURO MONEY MARKET SURVEYSEPTEMBER 2012