Embed Size (px)
Citation preview

200 years proudly supporting Australia
Euro Green Bond
Debt Investor Update
NOTE:
T
NOTE:
All images are held in templated
image placeholders.
They can be changed by simply
selecting and deleting the image,
then selecting a new one.
Note that you will have to “send
to back” or “bring forward”
imagery as necessary.
To move the image around in the
placeholder, just select the
image, right click and select
CROP.
Select image and move as
necessary.
There is a semi-transparent
white shape that will need to
always be placed on top of the
very back image.
There are red placement lines at
the top of this slide should you
ever need to move and replace
the wedge.
European Investor Roadshow
November 2017
Westpac Banking Corporation
ABN 33 007 457 141
Dow Jones Sustainability Indices Number one bank globally in 2017,
for the 4th year in a row and the 10th time
since the index was established

FONT SIZES
IDP TEMPLATE Charts: 10pt │Tables: 12pt │ Text boxes: 12pt │ Text box headings: 14pt
R73
G87
B97
R228
G26
B18
R175
G38
B22
R73
G19
B56
R147
G147
B147
R84
G49
B78
R59
G12
B44
R139
G15
B9
R104
G9
B6
R44
G9
B33
R120
G120
B120
R42
G52
B58
Below is the chart colour sequence. If your chart has more than 12 series‘ you will need to manually colour the additional series.
Westpac Red,
used as the HIGHLIGHT colour
LINES AND ARROWS
Lines are solid black or red, 1.5pt
Arrows are block style to fit text inside, see
‘pullout boxes and arrows’ elements slide
Body – 12pt Arial Regular sentence case
• Bullet – 12pt Arial Regular
Second Bullet – 12pt Arial Regular
Heading – 14pt Times New Roman Bold Note – 10pt Arial Regular
Text boxes have 0.0cm margin on all sides
These are your 5 levels of styles.
To move through the different styles, select the text and press
TAB. To return to the previous style, press SHIFT + TAB.
If you are on a blank line, use the Increase or Decrease Indent
buttons on the Home tab
Chart heading text boxes have 0.25cm margin on left
All text is black. No grey text
Use the shapes supplied in the ‘Editable Elements’ section.
Never skew the shape. Resize proportionally in order to keep the
angles of the curves on each side.
To create a longer wave shape, resize proportionally and join
multiple shapes together with aligning and grouping.
E.g. these:
Become:
TEXT
SHAPES
GRID
To show the grid, right click the slide and
select ‘Grids and Guidelines’ > ‘Guides”
Subheading in charts is 10pt bold
Text in charts is 10pt TABLES
Headings 12pt bold all CAPS
Heading divider line 1.5pt red
All other horizontal lines .75pt grey
Total line same as heading
All text 12pt where possible, reduced
where required to a minimum of 8pt
CHART HEADINGS
The heading box should sit 0.2cm indented from
the top and right side of the chart background box.
1 line heading box = 0.8cm height
2 line heading box = 1.2cm height
Height must remain consistent, width will vary.
Most layouts use a one line heading box, you can
manually paste a two line heading box over this
area. Select from the pre-made options on ‘chart
title text boxes’ slide in the ‘Editable Elements’
section.
NOTE: All content placeholders are adaptable. If a placeholder already contains (for example) a bar chart, this
can be deleted to insert a table, text, image or other content. The template is very flexible. There are a lot of
layout options provided, manipulate them as needed to suit your content but if it’s not looking right, you can
always ‘Reset’ the slide to revert back to the templated layout.
Guides
Notes that are specific to a certain
layout will be placed here
R77
G77
B79
Westpac Grey,
not used in charts
Text inside
13.80 4.80 4.40 0.20 0.20 4.40 4.80 13.80
8.40
7.00
0.40
0.80
8.20
10.00
Divisional colours
Consumer
R228
G26
B18
WIB
R84
G49
B78
BTFG
R0
G175
B215
New Zealand
R175
G38
B22
Business
R139
G15
B9
Westpac primary colours
R177
G189
B197
R247
G161
B157
R251
G154
B144
R233
G172
B214
R212
G212
B212
R199
G160
B193
60% tint colours
To replace the image, simply select
and delete the existing image then
click on the ADD PICTURE icon to
insert new image.
Disclaimer
The material contained in this presentation is intended to be general background information on Westpac Banking Corporation (“Westpac”)
(ABN 33 007 457 141) and its activities.
It should not be reproduced, distributed or transmitted to any person without the consent of Westpac and is not intended for distribution in any
jurisdiction in which such distribution would be contrary to local law or regulation. It does not constitute a prospectus, offering memorandum or
offer of securities.
The information is supplied in summary form and is therefore not necessarily complete. Also, it is not intended that it be relied upon as advice
to investors or potential investors, who should consider seeking independent professional advice depending upon their specific investment
objectives, financial situation or particular needs. The material contained in this presentation may include information derived from publicly
available sources that have not been independently verified. No representation or warranty is made as to the accuracy, completeness or
reliability of the information.
All amounts are in Australian dollars unless otherwise indicated.
Financial information in this presentation may be presented on a cash earnings basis. Cash earnings is a non-GAAP measure. Refer to
Westpac’s 2017 Annual Report on Form 20-F for the year ended 30 September 2017 filed with the SEC for details of the basis of preparation
of cash earnings. Refer to Appendix 2 for a reconciliation of reported net profit to cash earnings.
Financial data in this presentation is as at 30 September 2017 unless otherwise indicated. Comparisons of FY17 financial results are to FY16
unless otherwise stated.
Information contained in or otherwise accessible through the websites mentioned in this presentation does not form part of the presentation
unless we specifically state that the information is incorporated by reference thereby forming part of the presentation. All references in this
presentation to websites are inactive textual references and are for information only.
Disclosure regarding forward-looking statements
This presentation contains statements that constitute “forward-looking statements” within the meaning of Section 27A of the US Securities Act
of 1933, as amended, and Section 21E of the US Securities Exchange Act of 1934, as amended. Forward-looking statements are statements
about matters that are not historical facts. Forward-looking statements appear in a number of places in this presentation and include
statements regarding our intent, belief or current expectations with respect to our business and operations, market conditions, results of
operations and financial condition, including, without limitation, future loan loss provisions, financial support to certain borrowers, indicative
drivers, forecasted economic indicators and performance metric outcomes.
We use words such as ‘will’, ‘may’, ‘expect’, 'indicative', ‘intend’, ‘seek’, ‘would’, ‘should’, ‘could’, ‘continue’, ‘plan’, ‘aim’, ‘probability’, ‘risk’,
‘forecast’, ‘likely’, ‘estimate’, ‘anticipate’, ‘believe’, or other similar words to identify forward-looking statements. These forward-looking
statements reflect our current views with respect to future events and are subject to change, certain risks, uncertainties and assumptions
which are, in many instances, beyond our control and have been made based upon management’s expectations and beliefs concerning
future developments and their potential effect upon us. There can be no assurance that future developments will be in accordance with our
expectations or that the effect of future developments on us will be those anticipated. Should one or more of the risks or uncertainties
materialise, or should underlying assumptions prove incorrect, actual results could differ materially from the expectations described in this
presentation. Factors that may impact on the forward-looking statements made include, but are not limited to, those described in the section
entitled ‘Risk factors’ in Westpac’s Annual Report on Form 20-F for the year ended 30 September 2017 filed with the SEC. When relying on
forward-looking statements to make decisions with respect to us, investors and others should carefully consider such factors and other
uncertainties and events. We are under no obligation, and do not intend, to update any forward-looking statements contained in this
presentation, whether as a result of new information, future events or otherwise, after the date of this presentation.
2
FONT SIZES
IDP TEMPLATE Charts: 10pt │Tables: 12pt │ Text boxes: 12pt │ Text box headings: 14pt
R73
G87
B97
R228
G26
B18
R175
G38
B22
R73
G19
B56
R147
G147
B147
R84
G49
B78
R59
G12
B44
R139
G15
B9
R104
G9
B6
R44
G9
B33
R120
G120
B120
R42
G52
B58
Below is the chart colour sequence. If your chart has more than 12 series‘ you will need to manually colour the additional series.
Westpac Red,
used as the HIGHLIGHT colour
LINES AND ARROWS
Lines are solid black or red, 1.5pt
Arrows are block style to fit text inside, see
‘pullout boxes and arrows’ elements slide
Body – 12pt Arial Regular sentence case
• Bullet – 12pt Arial Regular
Second Bullet – 12pt Arial Regular
Heading – 14pt Times New Roman Bold Note – 10pt Arial Regular
Text boxes have 0.0cm margin on all sides
These are your 5 levels of styles.
To move through the different styles, select the text and press
TAB. To return to the previous style, press SHIFT + TAB.
If you are on a blank line, use the Increase or Decrease Indent
buttons on the Home tab
Chart heading text boxes have 0.25cm margin on left
All text is black. No grey text
Use the shapes supplied in the ‘Editable Elements’ section.
Never skew the shape. Resize proportionally in order to keep the
angles of the curves on each side.
To create a longer wave shape, resize proportionally and join
multiple shapes together with aligning and grouping.
E.g. these:
Become:
TEXT
SHAPES
GRID
To show the grid, right click the slide and
select ‘Grids and Guidelines’ > ‘Guides”
Subheading in charts is 10pt bold
Text in charts is 10pt TABLES
Headings 12pt bold all CAPS
Heading divider line 1.5pt red
All other horizontal lines .75pt grey
Total line same as heading
All text 12pt where possible, reduced
where required to a minimum of 8pt
CHART HEADINGS
The heading box should sit 0.2cm indented from
the top and right side of the chart background box.
1 line heading box = 0.8cm height
2 line heading box = 1.2cm height
Height must remain consistent, width will vary.
Most layouts use a one line heading box, you can
manually paste a two line heading box over this
area. Select from the pre-made options on ‘chart
title text boxes’ slide in the ‘Editable Elements’
section.
NOTE: All content placeholders are adaptable. If a placeholder already contains (for example) a bar chart, this
can be deleted to insert a table, text, image or other content. The template is very flexible. There are a lot of
layout options provided, manipulate them as needed to suit your content but if it’s not looking right, you can
always ‘Reset’ the slide to revert back to the templated layout.
Guides
Notes that are specific to a certain
layout will be placed here
R77
G77
B79
Westpac Grey,
not used in charts
Text inside
13.80 4.80 4.40 0.20 0.20 4.40 4.80 13.80
8.40
7.00
0.40
0.80
8.20
10.00
Divisional colours
Consumer
R228
G26
B18
WIB
R84
G49
B78
BTFG
R0
G175
B215
New Zealand
R175
G38
B22
Business
R139
G15
B9
Westpac primary colours
R177
G189
B197
R247
G161
B157
R251
G154
B144
R233
G172
B214
R212
G212
B212
R199
G160
B193
60% tint colours
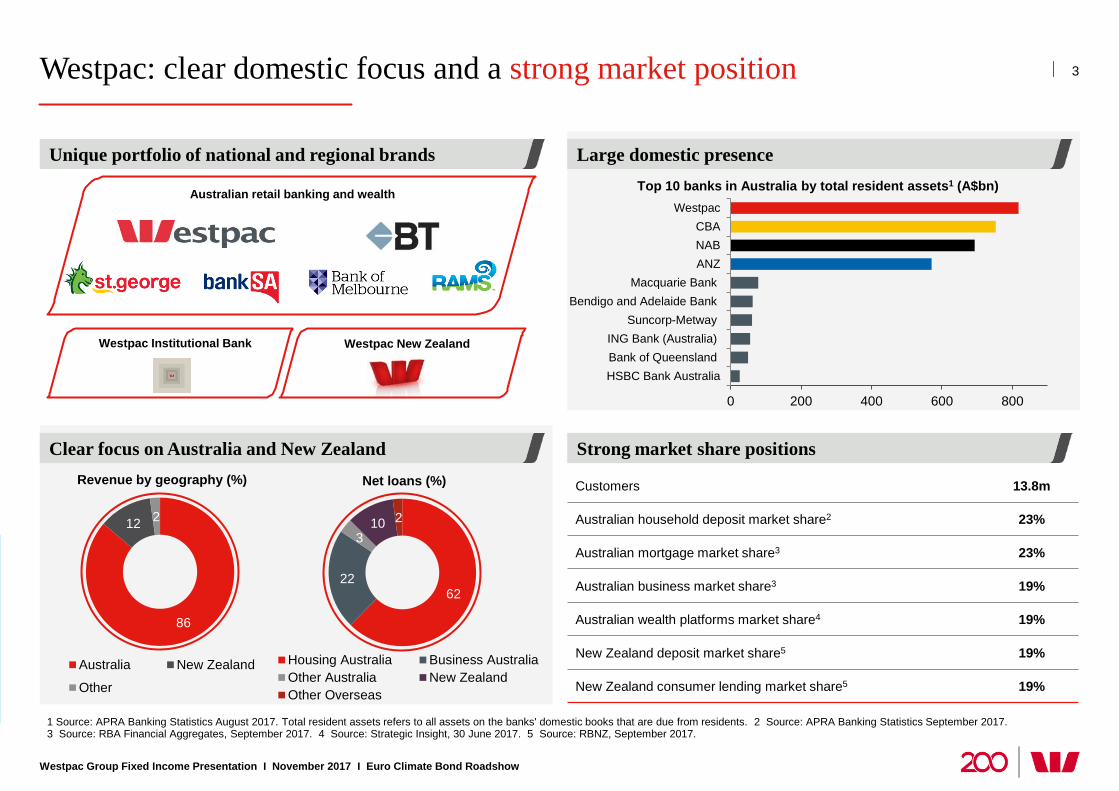
Westpac: clear domestic focus and a strong market position
Large domestic presence
Strong market share positions
Unique portfolio of national and regional brands
Clear focus on Australia and New Zealand
1 Source: APRA Banking Statistics August 2017. Total resident assets refers to all assets on the banks' domestic books that are due from residents. 2 Source: APRA Banking Statistics September 2017. 3 Source: RBA Financial Aggregates, September 2017. 4 Source: Strategic Insight, 30 June 2017. 5 Source: RBNZ, September 2017.
3
Westpac Group Fixed Income Presentation I November 2017 I Euro Climate Bond Roadshow
Net loans (%)
Westpac New Zealand Westpac Institutional Bank
Australian retail banking and wealth
86
12 2
Australia New Zealand
Other
62 22
3 10 2
Housing Australia Business Australia
Other Australia New Zealand
Other Overseas
0 200 400 600 800
HSBC Bank Australia
Bank of Queensland
ING Bank (Australia)
Suncorp-Metway
Bendigo and Adelaide Bank
Macquarie Bank
ANZ
NAB
CBA
Westpac
Revenue by geography (%)
Top 10 banks in Australia by total resident assets1 (A$bn)
Customers 13.8m
Australian household deposit market share2 23%
Australian mortgage market share3 23%
Australian business market share3 19%
Australian wealth platforms market share4 19%
New Zealand deposit market share5 19%
New Zealand consumer lending market share5 19%

FONT SIZES
IDP TEMPLATE Charts: 10pt │Tables: 12pt │ Text boxes: 12pt │ Text box headings: 14pt
R73
G87
B97
R228
G26
B18
R175
G38
B22
R73
G19
B56
R147
G147
B147
R84
G49
B78
R59
G12
B44
R139
G15
B9
R104
G9
B6
R44
G9
B33
R120
G120
B120
R42
G52
B58
Below is the chart colour sequence. If your chart has more than 12 series‘ you will need to manually colour the additional series.
Westpac Red,
used as the HIGHLIGHT colour
LINES AND ARROWS
Lines are solid black or red, 1.5pt
Arrows are block style to fit text inside, see
‘pullout boxes and arrows’ elements slide
Body – 12pt Arial Regular sentence case
• Bullet – 12pt Arial Regular
Second Bullet – 12pt Arial Regular
Heading – 14pt Times New Roman Bold Note – 10pt Arial Regular
Text boxes have 0.0cm margin on all sides
These are your 5 levels of styles.
To move through the different styles, select the text and press
TAB. To return to the previous style, press SHIFT + TAB.
If you are on a blank line, use the Increase or Decrease Indent
buttons on the Home tab
Chart heading text boxes have 0.25cm margin on left
All text is black. No grey text
Use the shapes supplied in the ‘Editable Elements’ section.
Never skew the shape. Resize proportionally in order to keep the
angles of the curves on each side.
To create a longer wave shape, resize proportionally and join
multiple shapes together with aligning and grouping.
E.g. these:
Become:
TEXT
SHAPES
GRID
To show the grid, right click the slide and
select ‘Grids and Guidelines’ > ‘Guides”
Subheading in charts is 10pt bold
Text in charts is 10pt TABLES
Headings 12pt bold all CAPS
Heading divider line 1.5pt red
All other horizontal lines .75pt grey
Total line same as heading
All text 12pt where possible, reduced
where required to a minimum of 8pt
CHART HEADINGS
The heading box should sit 0.2cm indented from
the top and right side of the chart background box.
1 line heading box = 0.8cm height
2 line heading box = 1.2cm height
Height must remain consistent, width will vary.
Most layouts use a one line heading box, you can
manually paste a two line heading box over this
area. Select from the pre-made options on ‘chart
title text boxes’ slide in the ‘Editable Elements’
section.
NOTE: All content placeholders are adaptable. If a placeholder already contains (for example) a bar chart, this
can be deleted to insert a table, text, image or other content. The template is very flexible. There are a lot of
layout options provided, manipulate them as needed to suit your content but if it’s not looking right, you can
always ‘Reset’ the slide to revert back to the templated layout.
Guides
Notes that are specific to a certain
layout will be placed here
R77
G77
B79
Westpac Grey,
not used in charts
Text inside
13.80 4.80 4.40 0.20 0.20 4.40 4.80 13.80
8.40
7.00
0.40
0.80
8.20
10.00
Divisional colours
Consumer
R228
G26
B18
WIB
R84
G49
B78
BTFG
R0
G175
B215
New Zealand
R175
G38
B22
Business
R139
G15
B9
Westpac primary colours
R177
G189
B197
R247
G161
B157
R251
G154
B144
R233
G172
B214
R212
G212
B212
R199
G160
B193
60% tint colours
Full Year 2017 financial performance
Westpac Group Fixed Income Presentation I November 2017 I Euro Climate Bond Roadshow
4
19
31
73
30 22 24
16 12 12
17 13
FY07 FY08 FY09 FY10 FY11 FY12 FY13 FY14 FY15 FY16 FY17
Capital ratios (%) Balance sheet ratios (%) FY17 Reported Results FY17
% Change
FY17-FY16
Financial results (A$m)
Net operating income 21,802 4
Expenses (9,434) 2
Net profit before impairment charges and
income tax expenses 12,368 5
Impairment charges (853) (24)
Reported net profit after tax 7,990 7
Cash earnings 8,062 3
Financial metrics
Return on average ordinary equity 13.6% 33bps
Earnings per share 238.0c 6
Net interest margin 2.06% (4bps)
Expense to income ratio 43.3% (65bps)
Impairment charges to average gross loans
annualised 13bps (4bps)
Balance sheet and asset quality
Total committed exposure (TCE) $1.0tr 3
Loans $684.9bn 3
Customer deposits $486.7bn 4
Gross impaired assets to gross loans 0.22% (10bps)
Impairment charges to average gross loans annualised
(bps)
10.6
16.2 21.1
6.3
CE
T1
ca
pita
l ra
tio
CE
T1
ca
pita
l ra
tio
To
tal
reg.
cap
ita
lra
tio
Leve
rag
era
tio
Internationally
comparable basis
APRA
basis
109 100
124
100
NS
FR
Reg
ula
tory
min
imu
m
LC
R
Reg
ula
tory
min
imu
m

FONT SIZES
IDP TEMPLATE Charts: 10pt │Tables: 12pt │ Text boxes: 12pt │ Text box headings: 14pt
R73
G87
B97
R228
G26
B18
R175
G38
B22
R73
G19
B56
R147
G147
B147
R84
G49
B78
R59
G12
B44
R139
G15
B9
R104
G9
B6
R44
G9
B33
R120
G120
B120
R42
G52
B58
Below is the chart colour sequence. If your chart has more than 12 series‘ you will need to manually colour the additional series.
Westpac Red,
used as the HIGHLIGHT colour
LINES AND ARROWS
Lines are solid black or red, 1.5pt
Arrows are block style to fit text inside, see
‘pullout boxes and arrows’ elements slide
Body – 12pt Arial Regular sentence case
• Bullet – 12pt Arial Regular
Second Bullet – 12pt Arial Regular
Heading – 14pt Times New Roman Bold Note – 10pt Arial Regular
Text boxes have 0.0cm margin on all sides
These are your 5 levels of styles.
To move through the different styles, select the text and press
TAB. To return to the previous style, press SHIFT + TAB.
If you are on a blank line, use the Increase or Decrease Indent
buttons on the Home tab
Chart heading text boxes have 0.25cm margin on left
All text is black. No grey text
Use the shapes supplied in the ‘Editable Elements’ section.
Never skew the shape. Resize proportionally in order to keep the
angles of the curves on each side.
To create a longer wave shape, resize proportionally and join
multiple shapes together with aligning and grouping.
E.g. these:
Become:
TEXT
SHAPES
GRID
To show the grid, right click the slide and
select ‘Grids and Guidelines’ > ‘Guides”
Subheading in charts is 10pt bold
Text in charts is 10pt TABLES
Headings 12pt bold all CAPS
Heading divider line 1.5pt red
All other horizontal lines .75pt grey
Total line same as heading
All text 12pt where possible, reduced
where required to a minimum of 8pt
CHART HEADINGS
The heading box should sit 0.2cm indented from
the top and right side of the chart background box.
1 line heading box = 0.8cm height
2 line heading box = 1.2cm height
Height must remain consistent, width will vary.
Most layouts use a one line heading box, you can
manually paste a two line heading box over this
area. Select from the pre-made options on ‘chart
title text boxes’ slide in the ‘Editable Elements’
section.
NOTE: All content placeholders are adaptable. If a placeholder already contains (for example) a bar chart, this
can be deleted to insert a table, text, image or other content. The template is very flexible. There are a lot of
layout options provided, manipulate them as needed to suit your content but if it’s not looking right, you can
always ‘Reset’ the slide to revert back to the templated layout.
Guides
Notes that are specific to a certain
layout will be placed here
R77
G77
B79
Westpac Grey,
not used in charts
Text inside
13.80 4.80 4.40 0.20 0.20 4.40 4.80 13.80
8.40
7.00
0.40
0.80
8.20
10.00
Divisional colours
Consumer
R228
G26
B18
WIB
R84
G49
B78
BTFG
R0
G175
B215
New Zealand
R175
G38
B22
Business
R139
G15
B9
Westpac primary colours
R177
G189
B197
R247
G161
B157
R251
G154
B144
R233
G172
B214
R212
G212
B212
R199
G160
B193
60% tint colours
Westpac capital levels ‘unquestionably strong’
Westpac Group Fixed Income Presentation I November 2017 I Euro Climate Bond Roadshow
1 The basis of the internationally comparable CET1 capital ratio aligns with the APRA study titled “International capital comparison study", released 13 July 2015. For more details on adjustments refer to Appendix 1.
APRA Level 2 basis Sep-16 Mar-17 Sep-17
CET1 capital ratio 9.5 10.0 10.6
Additional Tier 1 capital 1.7 1.7 2.1
Tier 1 capital ratio 11.2 11.7 12.7
Tier 2 capital 1.9 2.3 2.2
Total regulatory capital ratio 13.1 14.0 14.8
Risk weighted assets
(RWA) ($bn) 410 404 404
Leverage ratio 5.2 5.3 5.7
Internationally comparable
ratios1
Leverage ratio (internationally
comparable) 5.9 6.0 6.3
CET1 capital ratio
(internationally comparable) 14.4 15.3 16.2
CET1 capital ratio (%) and CET1 capital ($bn) (APRA basis)
5
%
Key capital ratios (%)
30 29
30 32
34
37 38
37 39
38
40 41 43
9.0
8.4 8.8
9.0 9.5
10.2 10.5
10.1 9.5 9.3
10.0 10.0 10.6
0.0
2.0
4.0
6.0
8.0
10.0
12.0
15
20
25
30
35
40
45
50
55
Sep-14 Dec-14 Mar-15 Jun-15 Sep-15 Dec-15 Mar-16 Jun-16 Sep-16 Dec-16 Mar-17 Jun-17 Sep-17
Westpac CET1 capital (lhs, $bn)
Westpac CET1 capital ratio (rhs, %)
Increase in mortgage
RWA to 25% avg,
effective 1 July 2016
$bn
APRA’s unquestionably
strong benchmark 10.5%,
under the current capital
adequacy framework
Building for 1%
DSIB

FONT SIZES
IDP TEMPLATE Charts: 10pt │Tables: 12pt │ Text boxes: 12pt │ Text box headings: 14pt
R73
G87
B97
R228
G26
B18
R175
G38
B22
R73
G19
B56
R147
G147
B147
R84
G49
B78
R59
G12
B44
R139
G15
B9
R104
G9
B6
R44
G9
B33
R120
G120
B120
R42
G52
B58
Below is the chart colour sequence. If your chart has more than 12 series‘ you will need to manually colour the additional series.
Westpac Red,
used as the HIGHLIGHT colour
LINES AND ARROWS
Lines are solid black or red, 1.5pt
Arrows are block style to fit text inside, see
‘pullout boxes and arrows’ elements slide
Body – 12pt Arial Regular sentence case
• Bullet – 12pt Arial Regular
Second Bullet – 12pt Arial Regular
Heading – 14pt Times New Roman Bold Note – 10pt Arial Regular
Text boxes have 0.0cm margin on all sides
These are your 5 levels of styles.
To move through the different styles, select the text and press
TAB. To return to the previous style, press SHIFT + TAB.
If you are on a blank line, use the Increase or Decrease Indent
buttons on the Home tab
Chart heading text boxes have 0.25cm margin on left
All text is black. No grey text
Use the shapes supplied in the ‘Editable Elements’ section.
Never skew the shape. Resize proportionally in order to keep the
angles of the curves on each side.
To create a longer wave shape, resize proportionally and join
multiple shapes together with aligning and grouping.
E.g. these:
Become:
TEXT
SHAPES
GRID
To show the grid, right click the slide and
select ‘Grids and Guidelines’ > ‘Guides”
Subheading in charts is 10pt bold
Text in charts is 10pt TABLES
Headings 12pt bold all CAPS
Heading divider line 1.5pt red
All other horizontal lines .75pt grey
Total line same as heading
All text 12pt where possible, reduced
where required to a minimum of 8pt
CHART HEADINGS
The heading box should sit 0.2cm indented from
the top and right side of the chart background box.
1 line heading box = 0.8cm height
2 line heading box = 1.2cm height
Height must remain consistent, width will vary.
Most layouts use a one line heading box, you can
manually paste a two line heading box over this
area. Select from the pre-made options on ‘chart
title text boxes’ slide in the ‘Editable Elements’
section.
NOTE: All content placeholders are adaptable. If a placeholder already contains (for example) a bar chart, this
can be deleted to insert a table, text, image or other content. The template is very flexible. There are a lot of
layout options provided, manipulate them as needed to suit your content but if it’s not looking right, you can
always ‘Reset’ the slide to revert back to the templated layout.
Guides
Notes that are specific to a certain
layout will be placed here
R77
G77
B79
Westpac Grey,
not used in charts
Text inside
13.80 4.80 4.40 0.20 0.20 4.40 4.80 13.80
8.40
7.00
0.40
0.80
8.20
10.00
Divisional colours
Consumer
R228
G26
B18
WIB
R84
G49
B78
BTFG
R0
G175
B215
New Zealand
R175
G38
B22
Business
R139
G15
B9
Westpac primary colours
R177
G189
B197
R247
G161
B157
R251
G154
B144
R233
G172
B214
R212
G212
B212
R199
G160
B193
60% tint colours
Well placed on internationally comparable CET1 and leverage ratios
Peer group comprises listed commercial banks with assets in excess of A$700bn and which have disclosed fully implemented Basel III ratios or provided sufficient disclosure to estimate. Based on company reports/presentations. Ratios at 30 June
2017, except for Westpac, ANZ and NAB, which are at 30 Sep 2017, while Scotiabank, Bank of Montreal, Royal Bank of Canada and Toronto Dominion are at 31 July 2017. For CET1, assumes Basel III capital reforms fully implemented.
Leverage ratio is on a transitional basis. Where accrued expected dividends have been deducted, these have been added back for comparability. US banks are excluded from leverage ratio analysis due to business model differences, for example
from loans sold to US Government sponsored enterprises.
Common equity Tier 1 ratio (%)
Leverage ratio (%)
16.20%
0%
5%
10%
15%
20%
25%
No
rde
a
No
rinchu
kin
Ba
nk
We
stp
ac
AN
Z
CB
A
ING
HS
BC
RB
S
Ra
bo
ban
k
BP
CE
NA
B
De
uts
che
Ban
k
Sta
nd
ard
Ch
art
ere
d
Llo
yd
s
Co
mm
erz
ba
nk
Inte
sa S
anpa
olo
Cre
dit S
uis
se
Barc
lays
Citig
roup
Un
icre
dit
Cre
dit A
gri
cole
SA
JP
Morg
an
Ch
ase
Ch
ina C
on
str
uctio
n B
ank
ICB
C
Sum
ito
mo
Mitsui
Ch
ina M
erc
han
ts B
ank
BN
P P
ariba
s
Socie
te G
ene
rale
Mitsub
ishi U
FG
We
lls F
arg
o
Miz
uh
o F
G
Ban
k o
f A
merica
Sco
tiab
an
k
Na
tixis
Ban
k o
f M
on
tre
al
BB
VA
Toro
nto
Do
min
ion
Ban
k
Ban
k o
f C
hin
a
Ro
yal B
ank o
f C
an
ada
San
tande
r
Ban
k o
f C
om
mun
ications
Agri
cultura
l B
an
k o
f C
hin
a
6.33%
0%
2%
4%
6%
8%
ICB
C
Ch
ina C
on
str
uctio
n B
ank
Inte
sa S
anpa
olo
Ban
k o
f C
hin
a
BB
VA
Ban
k o
f C
om
mun
ications
We
stp
ac
AN
Z
Agri
cultura
l B
an
k o
f C
hin
a
HS
BC
Sta
nd
ard
Ch
art
ere
d
NA
B
No
rinchu
kin
Ba
nk
Ch
ina M
erc
han
ts B
ank
CB
A
RB
S
Cre
dit S
uis
se
Un
icre
dit
Llo
yd
s
Co
mm
erz
ba
nk
BP
CE
Ra
bo
ban
k
Barc
lays
San
tande
r
Mitsub
ishi U
FG
Cre
dit A
gri
cole
SA
Sum
ito
mo
Mitsui
ING
No
rde
a
Sco
tiab
an
k
Ro
yal B
ank o
f C
an
ada
Ban
k o
f M
on
tre
al
Socie
te G
ene
rale
BN
P P
ariba
s
De
uts
che
Ban
k
Toro
nto
Do
min
ion
Ban
k
Miz
uh
o F
G
Na
tixis
Westpac Group Fixed Income Presentation I November 2017 I Euro Climate Bond Roadshow
6

FONT SIZES
IDP TEMPLATE Charts: 10pt │Tables: 12pt │ Text boxes: 12pt │ Text box headings: 14pt
R73
G87
B97
R228
G26
B18
R175
G38
B22
R73
G19
B56
R147
G147
B147
R84
G49
B78
R59
G12
B44
R139
G15
B9
R104
G9
B6
R44
G9
B33
R120
G120
B120
R42
G52
B58
Below is the chart colour sequence. If your chart has more than 12 series‘ you will need to manually colour the additional series.
Westpac Red,
used as the HIGHLIGHT colour
LINES AND ARROWS
Lines are solid black or red, 1.5pt
Arrows are block style to fit text inside, see
‘pullout boxes and arrows’ elements slide
Body – 12pt Arial Regular sentence case
• Bullet – 12pt Arial Regular
Second Bullet – 12pt Arial Regular
Heading – 14pt Times New Roman Bold Note – 10pt Arial Regular
Text boxes have 0.0cm margin on all sides
These are your 5 levels of styles.
To move through the different styles, select the text and press
TAB. To return to the previous style, press SHIFT + TAB.
If you are on a blank line, use the Increase or Decrease Indent
buttons on the Home tab
Chart heading text boxes have 0.25cm margin on left
All text is black. No grey text
Use the shapes supplied in the ‘Editable Elements’ section.
Never skew the shape. Resize proportionally in order to keep the
angles of the curves on each side.
To create a longer wave shape, resize proportionally and join
multiple shapes together with aligning and grouping.
E.g. these:
Become:
TEXT
SHAPES
GRID
To show the grid, right click the slide and
select ‘Grids and Guidelines’ > ‘Guides”
Subheading in charts is 10pt bold
Text in charts is 10pt TABLES
Headings 12pt bold all CAPS
Heading divider line 1.5pt red
All other horizontal lines .75pt grey
Total line same as heading
All text 12pt where possible, reduced
where required to a minimum of 8pt
CHART HEADINGS
The heading box should sit 0.2cm indented from
the top and right side of the chart background box.
1 line heading box = 0.8cm height
2 line heading box = 1.2cm height
Height must remain consistent, width will vary.
Most layouts use a one line heading box, you can
manually paste a two line heading box over this
area. Select from the pre-made options on ‘chart
title text boxes’ slide in the ‘Editable Elements’
section.
NOTE: All content placeholders are adaptable. If a placeholder already contains (for example) a bar chart, this
can be deleted to insert a table, text, image or other content. The template is very flexible. There are a lot of
layout options provided, manipulate them as needed to suit your content but if it’s not looking right, you can
always ‘Reset’ the slide to revert back to the templated layout.
Guides
Notes that are specific to a certain
layout will be placed here
R77
G77
B79
Westpac Grey,
not used in charts
Text inside
13.80 4.80 4.40 0.20 0.20 4.40 4.80 13.80
8.40
7.00
0.40
0.80
8.20
10.00
Divisional colours
Consumer
R228
G26
B18
WIB
R84
G49
B78
BTFG
R0
G175
B215
New Zealand
R175
G38
B22
Business
R139
G15
B9
Westpac primary colours
R177
G189
B197
R247
G161
B157
R251
G154
B144
R233
G172
B214
R212
G212
B212
R199
G160
B193
60% tint colours
Well positioned for NSFR on 1 January 2018
Westpac Group Fixed Income Presentation I November 2017 I Euro Climate Bond Roadshow
1 Includes HQLA as defined in APS 210, RBNZ eligible liquids, less RBA open repos funding end of day ESA balances with the RBA. 2 The RBA makes available to Australian Authorised Deposit-taking Institutions a committed liquidity facility (CLF) that, subject to qualifying conditions, can be accessed to meet LCR requirements under APS210 – Liquidity. 3 Other flows include credit and liquidity facilities, collateral outflows and inflows from customers. 4 LCR is calculated as the percentage ratio of stock of HQLA and CLF over the total net cash outflows in a modelled 30 day defined stressed scenario. Calculated on a spot basis. 5 Private securities include Bank paper, RMBS, and Supra-nationals. 6 Includes long term wholesale funding with a residual maturity less than or equal to 1 year. 7 NSFR is estimated based on current APRA guidelines. NSFR will commence in Australia on 1 January 2018. 8 Other includes derivatives and other assets. 9 Other loans includes off balance sheet exposures and residential mortgages >35% risk weight. 10 Equity excludes FX translation, Available-for-Sale securities and Cash Flow Hedging Reserves. 11 Tenor excludes RMBS and ABS. 12 Contractual maturity date for hybrids and callable subordinated instruments is the first scheduled conversion date or call date for the purposes of this disclosure.
Total funding composition (%) New term issuance by tenor11,12 (%) Net stable funding ratio (NSFR, $bn)
Liquidity coverage ratio (%) Unencumbered liquid assets ($bn) Liquidity coverage ratio ($bn and %)
7
Sep-16 Mar-17 Sep-17
HQLA1 69.4 73.6 71.9
CLF2 58.6 49.1 49.1
Total LCR Liquid assets 128.0 122.7 121.0
Customer deposits 63.5 65.9 65.6
Wholesale funding 13.1 13.2 12.2
Other flows3 19.2 19.1 20.1
Total cash outflows 95.8 98.2 98.0
LCR4 134% 125% 124%
5
68 75 72 111
21 16 18
56 47 48
144 139
Sep-16 Mar-17 Sep-17
Self securitisation
Private securities and deposits with other banks
Cash, government and semi-government bonds
Total short term
wholesale debt6
outstanding at
30 Sep 17
138
44 61 62
5
8 8
1
1 1
10
11 11
4
4 4 20
8 8 16 7 6
Sep-08 Sep-16 Sep-17
Wholesale Onshore <1yr
Wholesale Offshore <1yr
Wholesale Onshore >1yr
Wholesale Offshore >1yr
Securitisation
Equity
Customer deposits
66.2 69.4 73.6 71.9
58.6 58.6 49.1 49.1
127 134
125 124
Mar-16 Sep-16 Mar-17 Sep-17
Committed Liquidity Facility ($bn)
HQLA ($bn)
LCR (%)
By residual maturity
7 4 8
25 30
25 17
44 40
45 30
18 25 28
43
FY14 FY15 FY16 FY17
>5years
5 years
4 years
3 years
2 years
1 yearsAvailable Stable
FundingRequired Stable
Funding
Estimated NSFR7 Mar-17 Sep-17
108% 109%
566 521
Capital
Retail & SME deposits
Corporate & Institutional
deposits
W’sale funding & other liabilities
Residential mortgages
≤35%
Other loans9
Liquids and other8
10
4.7yrs 4.9yrs 5.4yrs 5.8yrs WAM11
FONT SIZES
IDP TEMPLATE Charts: 10pt │Tables: 12pt │ Text boxes: 12pt │ Text box headings: 14pt
R73
G87
B97
R228
G26
B18
R175
G38
B22
R73
G19
B56
R147
G147
B147
R84
G49
B78
R59
G12
B44
R139
G15
B9
R104
G9
B6
R44
G9
B33
R120
G120
B120
R42
G52
B58
Below is the chart colour sequence. If your chart has more than 12 series‘ you will need to manually colour the additional series.
Westpac Red,
used as the HIGHLIGHT colour
LINES AND ARROWS
Lines are solid black or red, 1.5pt
Arrows are block style to fit text inside, see
‘pullout boxes and arrows’ elements slide
Body – 12pt Arial Regular sentence case
• Bullet – 12pt Arial Regular
Second Bullet – 12pt Arial Regular
Heading – 14pt Times New Roman Bold Note – 10pt Arial Regular
Text boxes have 0.0cm margin on all sides
These are your 5 levels of styles.
To move through the different styles, select the text and press
TAB. To return to the previous style, press SHIFT + TAB.
If you are on a blank line, use the Increase or Decrease Indent
buttons on the Home tab
Chart heading text boxes have 0.25cm margin on left
All text is black. No grey text
Use the shapes supplied in the ‘Editable Elements’ section.
Never skew the shape. Resize proportionally in order to keep the
angles of the curves on each side.
To create a longer wave shape, resize proportionally and join
multiple shapes together with aligning and grouping.
E.g. these:
Become:
TEXT
SHAPES
GRID
To show the grid, right click the slide and
select ‘Grids and Guidelines’ > ‘Guides”
Subheading in charts is 10pt bold
Text in charts is 10pt TABLES
Headings 12pt bold all CAPS
Heading divider line 1.5pt red
All other horizontal lines .75pt grey
Total line same as heading
All text 12pt where possible, reduced
where required to a minimum of 8pt
CHART HEADINGS
The heading box should sit 0.2cm indented from
the top and right side of the chart background box.
1 line heading box = 0.8cm height
2 line heading box = 1.2cm height
Height must remain consistent, width will vary.
Most layouts use a one line heading box, you can
manually paste a two line heading box over this
area. Select from the pre-made options on ‘chart
title text boxes’ slide in the ‘Editable Elements’
section.
NOTE: All content placeholders are adaptable. If a placeholder already contains (for example) a bar chart, this
can be deleted to insert a table, text, image or other content. The template is very flexible. There are a lot of
layout options provided, manipulate them as needed to suit your content but if it’s not looking right, you can
always ‘Reset’ the slide to revert back to the templated layout.
Guides
Notes that are specific to a certain
layout will be placed here
R77
G77
B79
Westpac Grey,
not used in charts
Text inside
13.80 4.80 4.40 0.20 0.20 4.40 4.80 13.80
8.40
7.00
0.40
0.80
8.20
10.00
Divisional colours
Consumer
R228
G26
B18
WIB
R84
G49
B78
BTFG
R0
G175
B215
New Zealand
R175
G38
B22
Business
R139
G15
B9
Westpac primary colours
R177
G189
B197
R247
G161
B157
R251
G154
B144
R233
G172
B214
R212
G212
B212
R199
G160
B193
60% tint colours
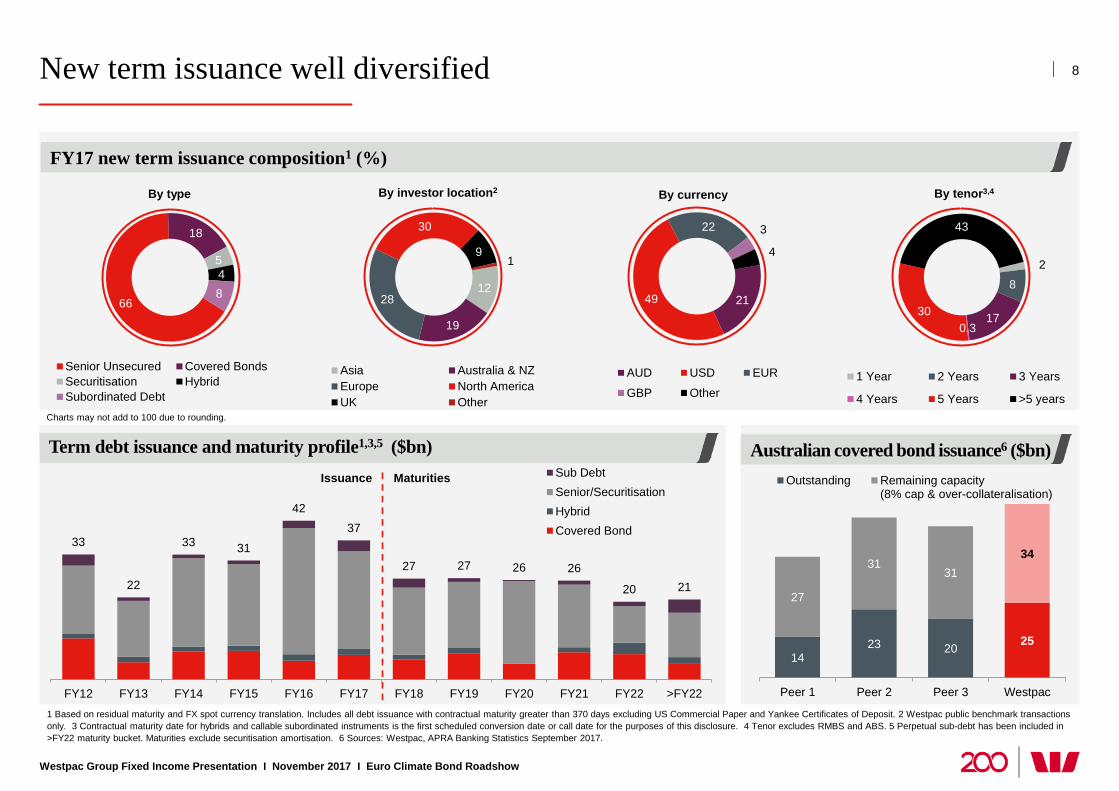
New term issuance well diversified
Westpac Group Fixed Income Presentation I November 2017 I Euro Climate Bond Roadshow
1 Based on residual maturity and FX spot currency translation. Includes all debt issuance with contractual maturity greater than 370 days excluding US Commercial Paper and Yankee Certificates of Deposit. 2 Westpac public benchmark transactions
only. 3 Contractual maturity date for hybrids and callable subordinated instruments is the first scheduled conversion date or call date for the purposes of this disclosure. 4 Tenor excludes RMBS and ABS. 5 Perpetual sub-debt has been included in
>FY22 maturity bucket. Maturities exclude securitisation amortisation. 6 Sources: Westpac, APRA Banking Statistics September 2017.
FY17 new term issuance composition1 (%)
Term debt issuance and maturity profile1,3,5 ($bn) Australian covered bond issuance6 ($bn)
66
18
5
4
8
By type
Senior Unsecured Covered Bonds
Securitisation Hybrid
Subordinated Debt
12
19
28
30
9 1
By investor location2
Asia Australia & NZ
Europe North America
UK Other
21 49
22 3
4
By currency
AUD USD EUR
GBP Other
2
8
17 0.3
30
43
By tenor3,4
1 Year 2 Years 3 Years
4 Years 5 Years >5 years
33
22
33 31
42
37
27 27 26 26
20 21
FY12 FY13 FY14 FY15 FY16 FY17 FY18 FY19 FY20 FY21 FY22 >FY22
Sub Debt
Senior/Securitisation
Hybrid
Covered Bond
Issuance Maturities
Charts may not add to 100 due to rounding.
8
14 23 20
25
27
31 31
34
Peer 1 Peer 2 Peer 3 Westpac
Outstanding Remaining capacity(8% cap & over-collateralisation)

FONT SIZES
IDP TEMPLATE Charts: 10pt │Tables: 12pt │ Text boxes: 12pt │ Text box headings: 14pt
R73
G87
B97
R228
G26
B18
R175
G38
B22
R73
G19
B56
R147
G147
B147
R84
G49
B78
R59
G12
B44
R139
G15
B9
R104
G9
B6
R44
G9
B33
R120
G120
B120
R42
G52
B58
Below is the chart colour sequence. If your chart has more than 12 series‘ you will need to manually colour the additional series.
Westpac Red,
used as the HIGHLIGHT colour
LINES AND ARROWS
Lines are solid black or red, 1.5pt
Arrows are block style to fit text inside, see
‘pullout boxes and arrows’ elements slide
Body – 12pt Arial Regular sentence case
• Bullet – 12pt Arial Regular
Second Bullet – 12pt Arial Regular
Heading – 14pt Times New Roman Bold Note – 10pt Arial Regular
Text boxes have 0.0cm margin on all sides
These are your 5 levels of styles.
To move through the different styles, select the text and press
TAB. To return to the previous style, press SHIFT + TAB.
If you are on a blank line, use the Increase or Decrease Indent
buttons on the Home tab
Chart heading text boxes have 0.25cm margin on left
All text is black. No grey text
Use the shapes supplied in the ‘Editable Elements’ section.
Never skew the shape. Resize proportionally in order to keep the
angles of the curves on each side.
To create a longer wave shape, resize proportionally and join
multiple shapes together with aligning and grouping.
E.g. these:
Become:
TEXT
SHAPES
GRID
To show the grid, right click the slide and
select ‘Grids and Guidelines’ > ‘Guides”
Subheading in charts is 10pt bold
Text in charts is 10pt TABLES
Headings 12pt bold all CAPS
Heading divider line 1.5pt red
All other horizontal lines .75pt grey
Total line same as heading
All text 12pt where possible, reduced
where required to a minimum of 8pt
CHART HEADINGS
The heading box should sit 0.2cm indented from
the top and right side of the chart background box.
1 line heading box = 0.8cm height
2 line heading box = 1.2cm height
Height must remain consistent, width will vary.
Most layouts use a one line heading box, you can
manually paste a two line heading box over this
area. Select from the pre-made options on ‘chart
title text boxes’ slide in the ‘Editable Elements’
section.
NOTE: All content placeholders are adaptable. If a placeholder already contains (for example) a bar chart, this
can be deleted to insert a table, text, image or other content. The template is very flexible. There are a lot of
layout options provided, manipulate them as needed to suit your content but if it’s not looking right, you can
always ‘Reset’ the slide to revert back to the templated layout.
Guides
Notes that are specific to a certain
layout will be placed here
R77
G77
B79
Westpac Grey,
not used in charts
Text inside
13.80 4.80 4.40 0.20 0.20 4.40 4.80 13.80
8.40
7.00
0.40
0.80
8.20
10.00
Divisional colours
Consumer
R228
G26
B18
WIB
R84
G49
B78
BTFG
R0
G175
B215
New Zealand
R175
G38
B22
Business
R139
G15
B9
Westpac primary colours
R177
G189
B197
R247
G161
B157
R251
G154
B144
R233
G172
B214
R212
G212
B212
R199
G160
B193
60% tint colours
Impaired assets and stressed assets lower
Westpac Group Fixed Income Presentation I November 2017 I Euro Climate Bond Roadshow
9
0.57 0.67 0.62 0.58 0.44
0.27 0.20 0.22 0.15
0.29
0.46 0.41
0.35
0.31
0.26 0.25
0.33 0.34
2.23
2.07
1.45
1.24
0.85
0.71
0.54
0.65 0.56
3.09 3.20
2.48
2.17
1.60
1.24
0.99
1.20
1.05
Sep-0
9
Sep-1
0
Sep-1
1
Sep-1
2
Sep-1
3
Sep-1
4
Sep-1
5
Sep-1
6
Sep-1
7
Watchlist & substandard
90+ day past due and not impaired
Impaired1,218
1,748
1,519
1,343
1,060 1,194
997 958
708 609 607 633
1,078
477 589
440
1H
10
2H
10
1H
11
2H
11
1H
12
2H
12
1H
13
2H
13
1H
14
2H
14
1H
15
2H
15
1H
16
2H
16
1H
17
2H
17
Lower stress reflects
refinance and work-out of
some institutional facilities
and an improved outlook for
some NZ dairy exposures
2H16 1H17 2H17
Total provisions to gross loans (bps) 54 52 45
Impaired asset provisions to impaired assets (%) 49 52 46
Collectively assessed provisions to credit RWA (bps) 76 77 76
Economic overlay ($m) 389 378 323
Stressed exposures as a % of TCE (%) New and increased gross impaired assets ($m)
Provisions

NOTE:
T
NOTE:
All images are held in templated
image placeholders.
They can be changed by simply
selecting and deleting the image,
then selecting a new one.
Note that you will have to “send
to back” or “bring forward”
imagery as necessary.
To move the image around in the
placeholder, just select the
image, right click and select
CROP.
Select image and move as
necessary.
There is a semi-transparent
white shape that will need to
always be placed on top of the
very back image.
There are red placement lines at
the top of this slide should you
ever need to move and replace
the wedge.
200 years proudly supporting Australia
Sustainability –
Environmental, Social and
Governance at Westpac
Westpac Banking Corporation
ABN 33 007 457 141

FONT SIZES
IDP TEMPLATE Charts: 10pt │Tables: 12pt │ Text boxes: 12pt │ Text box headings: 14pt
R73
G87
B97
R228
G26
B18
R175
G38
B22
R73
G19
B56
R147
G147
B147
R84
G49
B78
R59
G12
B44
R139
G15
B9
R104
G9
B6
R44
G9
B33
R120
G120
B120
R42
G52
B58
Below is the chart colour sequence. If your chart has more than 12 series‘ you will need to manually colour the additional series.
Westpac Red,
used as the HIGHLIGHT colour
LINES AND ARROWS
Lines are solid black or red, 1.5pt
Arrows are block style to fit text inside, see
‘pullout boxes and arrows’ elements slide
Body – 12pt Arial Regular sentence case
• Bullet – 12pt Arial Regular
Second Bullet – 12pt Arial Regular
Heading – 14pt Times New Roman Bold Note – 10pt Arial Regular
Text boxes have 0.0cm margin on all sides
These are your 5 levels of styles.
To move through the different styles, select the text and press
TAB. To return to the previous style, press SHIFT + TAB.
If you are on a blank line, use the Increase or Decrease Indent
buttons on the Home tab
Chart heading text boxes have 0.25cm margin on left
All text is black. No grey text
Use the shapes supplied in the ‘Editable Elements’ section.
Never skew the shape. Resize proportionally in order to keep the
angles of the curves on each side.
To create a longer wave shape, resize proportionally and join
multiple shapes together with aligning and grouping.
E.g. these:
Become:
TEXT
SHAPES
GRID
To show the grid, right click the slide and
select ‘Grids and Guidelines’ > ‘Guides”
Subheading in charts is 10pt bold
Text in charts is 10pt TABLES
Headings 12pt bold all CAPS
Heading divider line 1.5pt red
All other horizontal lines .75pt grey
Total line same as heading
All text 12pt where possible, reduced
where required to a minimum of 8pt
CHART HEADINGS
The heading box should sit 0.2cm indented from
the top and right side of the chart background box.
1 line heading box = 0.8cm height
2 line heading box = 1.2cm height
Height must remain consistent, width will vary.
Most layouts use a one line heading box, you can
manually paste a two line heading box over this
area. Select from the pre-made options on ‘chart
title text boxes’ slide in the ‘Editable Elements’
section.
NOTE: All content placeholders are adaptable. If a placeholder already contains (for example) a bar chart, this
can be deleted to insert a table, text, image or other content. The template is very flexible. There are a lot of
layout options provided, manipulate them as needed to suit your content but if it’s not looking right, you can
always ‘Reset’ the slide to revert back to the templated layout.
Guides
Notes that are specific to a certain
layout will be placed here
R77
G77
B79
Westpac Grey,
not used in charts
Text inside
13.80 4.80 4.40 0.20 0.20 4.40 4.80 13.80
8.40
7.00
0.40
0.80
8.20
10.00
Divisional colours
Consumer
R228
G26
B18
WIB
R84
G49
B78
BTFG
R0
G175
B215
New Zealand
R175
G38
B22
Business
R139
G15
B9
Westpac primary colours
R177
G189
B197
R247
G161
B157
R251
G154
B144
R233
G172
B214
R212
G212
B212
R199
G160
B193
60% tint colours
Part of doing business at Westpac
Overview
Fifteen years ago Westpac set out its first sustainability strategy outlining the
bank’s position on the responsibility of business, with the vision that every
generation should live better than the last
Strategic priorities
• Help improve the way people
work and live as our society changes
• Help find solutions to
environmental challenges
• Help customers to have a
better relationship with money
for a better life
Track record
• Ranked world’s most sustainable bank for
10th time in 2017 Dow Jones Sustainability
Indices Review
• Recognised as one of only ten Australian
companies to achieve Leadership level in
the 2017 CDP1, with a climate score of A-.
This puts Westpac among the top 22% of
companies globally to achieve this level
• Assigned Gold Class ranking in the 2017
RobecoSAM Sustainability Yearbook
• Awarded 6 Star Green Star interior rating
for Bank of Melbourne flagship branch by the
Green Building Council of Australia
Significant achievements
• Released updated position statements and
2020 Action Plans for Climate Change and
Human Rights
• Maintained our carbon neutral status for 4th
year in a row
• 50% target reached for women in leadership
positions
• Awarded more than 200 education
scholarships, 200 community grants, and
recognised 200 Businesses of Tomorrow in our
200th year
1CDP, formerly the Carbon Disclosure Project
11
Westpac Group Fixed Income Presentation I November 2017 I Euro Climate Bond Roadshow

FONT SIZES
IDP TEMPLATE Charts: 10pt │Tables: 12pt │ Text boxes: 12pt │ Text box headings: 14pt
R73
G87
B97
R228
G26
B18
R175
G38
B22
R73
G19
B56
R147
G147
B147
R84
G49
B78
R59
G12
B44
R139
G15
B9
R104
G9
B6
R44
G9
B33
R120
G120
B120
R42
G52
B58
Below is the chart colour sequence. If your chart has more than 12 series‘ you will need to manually colour the additional series.
Westpac Red,
used as the HIGHLIGHT colour
LINES AND ARROWS
Lines are solid black or red, 1.5pt
Arrows are block style to fit text inside, see
‘pullout boxes and arrows’ elements slide
Body – 12pt Arial Regular sentence case
• Bullet – 12pt Arial Regular
Second Bullet – 12pt Arial Regular
Heading – 14pt Times New Roman Bold Note – 10pt Arial Regular
Text boxes have 0.0cm margin on all sides
These are your 5 levels of styles.
To move through the different styles, select the text and press
TAB. To return to the previous style, press SHIFT + TAB.
If you are on a blank line, use the Increase or Decrease Indent
buttons on the Home tab
Chart heading text boxes have 0.25cm margin on left
All text is black. No grey text
Use the shapes supplied in the ‘Editable Elements’ section.
Never skew the shape. Resize proportionally in order to keep the
angles of the curves on each side.
To create a longer wave shape, resize proportionally and join
multiple shapes together with aligning and grouping.
E.g. these:
Become:
TEXT
SHAPES
GRID
To show the grid, right click the slide and
select ‘Grids and Guidelines’ > ‘Guides”
Subheading in charts is 10pt bold
Text in charts is 10pt TABLES
Headings 12pt bold all CAPS
Heading divider line 1.5pt red
All other horizontal lines .75pt grey
Total line same as heading
All text 12pt where possible, reduced
where required to a minimum of 8pt
CHART HEADINGS
The heading box should sit 0.2cm indented from
the top and right side of the chart background box.
1 line heading box = 0.8cm height
2 line heading box = 1.2cm height
Height must remain consistent, width will vary.
Most layouts use a one line heading box, you can
manually paste a two line heading box over this
area. Select from the pre-made options on ‘chart
title text boxes’ slide in the ‘Editable Elements’
section.
NOTE: All content placeholders are adaptable. If a placeholder already contains (for example) a bar chart, this
can be deleted to insert a table, text, image or other content. The template is very flexible. There are a lot of
layout options provided, manipulate them as needed to suit your content but if it’s not looking right, you can
always ‘Reset’ the slide to revert back to the templated layout.
Guides
Notes that are specific to a certain
layout will be placed here
R77
G77
B79
Westpac Grey,
not used in charts
Text inside
13.80 4.80 4.40 0.20 0.20 4.40 4.80 13.80
8.40
7.00
0.40
0.80
8.20
10.00
Divisional colours
Consumer
R228
G26
B18
WIB
R84
G49
B78
BTFG
R0
G175
B215
New Zealand
R175
G38
B22
Business
R139
G15
B9
Westpac primary colours
R177
G189
B197
R247
G161
B157
R251
G154
B144
R233
G172
B214
R212
G212
B212
R199
G160
B193
60% tint colours
In 2013, we set out a five-year strategy stating our vision, strategic priorities and priorities for a sustainable future
Westpac Group Fixed Income Presentation I November 2017 I Euro Climate Bond Roadshow
12

FONT SIZES
IDP TEMPLATE Charts: 10pt │Tables: 12pt │ Text boxes: 12pt │ Text box headings: 14pt
R73
G87
B97
R228
G26
B18
R175
G38
B22
R73
G19
B56
R147
G147
B147
R84
G49
B78
R59
G12
B44
R139
G15
B9
R104
G9
B6
R44
G9
B33
R120
G120
B120
R42
G52
B58
Below is the chart colour sequence. If your chart has more than 12 series‘ you will need to manually colour the additional series.
Westpac Red,
used as the HIGHLIGHT colour
LINES AND ARROWS
Lines are solid black or red, 1.5pt
Arrows are block style to fit text inside, see
‘pullout boxes and arrows’ elements slide
Body – 12pt Arial Regular sentence case
• Bullet – 12pt Arial Regular
Second Bullet – 12pt Arial Regular
Heading – 14pt Times New Roman Bold Note – 10pt Arial Regular
Text boxes have 0.0cm margin on all sides
These are your 5 levels of styles.
To move through the different styles, select the text and press
TAB. To return to the previous style, press SHIFT + TAB.
If you are on a blank line, use the Increase or Decrease Indent
buttons on the Home tab
Chart heading text boxes have 0.25cm margin on left
All text is black. No grey text
Use the shapes supplied in the ‘Editable Elements’ section.
Never skew the shape. Resize proportionally in order to keep the
angles of the curves on each side.
To create a longer wave shape, resize proportionally and join
multiple shapes together with aligning and grouping.
E.g. these:
Become:
TEXT
SHAPES
GRID
To show the grid, right click the slide and
select ‘Grids and Guidelines’ > ‘Guides”
Subheading in charts is 10pt bold
Text in charts is 10pt TABLES
Headings 12pt bold all CAPS
Heading divider line 1.5pt red
All other horizontal lines .75pt grey
Total line same as heading
All text 12pt where possible, reduced
where required to a minimum of 8pt
CHART HEADINGS
The heading box should sit 0.2cm indented from
the top and right side of the chart background box.
1 line heading box = 0.8cm height
2 line heading box = 1.2cm height
Height must remain consistent, width will vary.
Most layouts use a one line heading box, you can
manually paste a two line heading box over this
area. Select from the pre-made options on ‘chart
title text boxes’ slide in the ‘Editable Elements’
section.
NOTE: All content placeholders are adaptable. If a placeholder already contains (for example) a bar chart, this
can be deleted to insert a table, text, image or other content. The template is very flexible. There are a lot of
layout options provided, manipulate them as needed to suit your content but if it’s not looking right, you can
always ‘Reset’ the slide to revert back to the templated layout.
Guides
Notes that are specific to a certain
layout will be placed here
R77
G77
B79
Westpac Grey,
not used in charts
Text inside
13.80 4.80 4.40 0.20 0.20 4.40 4.80 13.80
8.40
7.00
0.40
0.80
8.20
10.00
Divisional colours
Consumer
R228
G26
B18
WIB
R84
G49
B78
BTFG
R0
G175
B215
New Zealand
R175
G38
B22
Business
R139
G15
B9
Westpac primary colours
R177
G189
B197
R247
G161
B157
R251
G154
B144
R233
G172
B214
R212
G212
B212
R199
G160
B193
60% tint colours
Progress on our Strategy 13
Embracing
societal change
Helping improve the way people work
and live, as our society changes
• Ensure our workforce is representative of the community
• Extend length and quality of working lives
• Anticipating the future needs of ageing and culturally
diverse customers
Helping find solutions to
environmental challenges
• Provide products and services to help customers adapt
to environmental challenges
• Increase lending and investment in CleanTech and
environmental services
• Reduce our environmental footprint
Environmental
solutions
Better
financial futures
Helping customers to have a better relationship
with money, for a better life
• Ensure all customers have access to the right advice to
achieve a secure retirement
• Help customers meet their financial goals in retirement
• Increase access to financial services in the Pacific
• Help people gain access to social and affordable housing
42
44
46
48
50
50
2013
2014
2015
2016
2017
2017 Target
219
451
628
500
2015
2016
2017
2017 Target
1
4
5
7
9
5
2013
2014
2015
2016
2017
2017 Target
40
42
41
44
2015
2016
2017
2017 Target
2
4
4
6
9
5
2013
2014
2015
2016
2017
2017 Target
6.4
8.0
6.1
6.2
7.0
6.0
2013
2014
2015
2016
2017
2017 Target
200
198
193
180
169
181
2013
2014
2015
2016
2017
2017 Target
55
59
61
73
75
75
2013
2014
2015
2016
2017
2017 Target
7.4
8.1
8.1
7.8
7.5
8.9
2013
2014
2015
2016
2017
2017 Target
0.7
0.8
1.0
1.1
1.3
2.0
2013
2014
2015
2016
2017
2017 Target
147
225
292
297
355
300
2013
2014
2015
2016
2017
2017 Target
4.89
4.91
4.9
2016
2017
2017 Target
Westpac Group Fixed Income Presentation I November 2017 I Euro Climate Bond Roadshow
Women in leadership (%) Indigenous Australians recruited
Unique services launched to help
customers adapt to environmental
challenges (cumulative number)
Make up to $6 billion available for
lending and investment in CleanTech
and environmental services ($bn)
Initiatives introduced that support
the financial wellbeing of ageing and
culturally diverse customers Wellbeing average
Work Ability Index1
Electricity efficiency in commercial
and retail sites (kWh/m2)
Westpac Group customers with
Westpac Group superannuation (%)
Make up to $2 billion available for
lending and investment in the social
and affordable housing sector ($bn)
Recycling rates in Sydney head
offices (% of waste)
Net basic banking account customers
in the Pacific (cumulative ‘000)
Average customer satisfaction
rating as reflected through BT
Adviser View
1 Wellbeing average Work Ability Index (biennial index score out of 49;conducted out of cycle in 2016)

FONT SIZES
IDP TEMPLATE Charts: 10pt │Tables: 12pt │ Text boxes: 12pt │ Text box headings: 14pt
R73
G87
B97
R228
G26
B18
R175
G38
B22
R73
G19
B56
R147
G147
B147
R84
G49
B78
R59
G12
B44
R139
G15
B9
R104
G9
B6
R44
G9
B33
R120
G120
B120
R42
G52
B58
Below is the chart colour sequence. If your chart has more than 12 series‘ you will need to manually colour the additional series.
Westpac Red,
used as the HIGHLIGHT colour
LINES AND ARROWS
Lines are solid black or red, 1.5pt
Arrows are block style to fit text inside, see
‘pullout boxes and arrows’ elements slide
Body – 12pt Arial Regular sentence case
• Bullet – 12pt Arial Regular
Second Bullet – 12pt Arial Regular
Heading – 14pt Times New Roman Bold Note – 10pt Arial Regular
Text boxes have 0.0cm margin on all sides
These are your 5 levels of styles.
To move through the different styles, select the text and press
TAB. To return to the previous style, press SHIFT + TAB.
If you are on a blank line, use the Increase or Decrease Indent
buttons on the Home tab
Chart heading text boxes have 0.25cm margin on left
All text is black. No grey text
Use the shapes supplied in the ‘Editable Elements’ section.
Never skew the shape. Resize proportionally in order to keep the
angles of the curves on each side.
To create a longer wave shape, resize proportionally and join
multiple shapes together with aligning and grouping.
E.g. these:
Become:
TEXT
SHAPES
GRID
To show the grid, right click the slide and
select ‘Grids and Guidelines’ > ‘Guides”
Subheading in charts is 10pt bold
Text in charts is 10pt TABLES
Headings 12pt bold all CAPS
Heading divider line 1.5pt red
All other horizontal lines .75pt grey
Total line same as heading
All text 12pt where possible, reduced
where required to a minimum of 8pt
CHART HEADINGS
The heading box should sit 0.2cm indented from
the top and right side of the chart background box.
1 line heading box = 0.8cm height
2 line heading box = 1.2cm height
Height must remain consistent, width will vary.
Most layouts use a one line heading box, you can
manually paste a two line heading box over this
area. Select from the pre-made options on ‘chart
title text boxes’ slide in the ‘Editable Elements’
section.
NOTE: All content placeholders are adaptable. If a placeholder already contains (for example) a bar chart, this
can be deleted to insert a table, text, image or other content. The template is very flexible. There are a lot of
layout options provided, manipulate them as needed to suit your content but if it’s not looking right, you can
always ‘Reset’ the slide to revert back to the templated layout.
Guides
Notes that are specific to a certain
layout will be placed here
R77
G77
B79
Westpac Grey,
not used in charts
Text inside
13.80 4.80 4.40 0.20 0.20 4.40 4.80 13.80
8.40
7.00
0.40
0.80
8.20
10.00
Divisional colours
Consumer
R228
G26
B18
WIB
R84
G49
B78
BTFG
R0
G175
B215
New Zealand
R175
G38
B22
Business
R139
G15
B9
Westpac primary colours
R177
G189
B197
R247
G161
B157
R251
G154
B144
R233
G172
B214
R212
G212
B212
R199
G160
B193
60% tint colours
Overview
Alignment to the UN Sustainable Development Goals
Note: The table shows the six Sustainable Development Goals we have prioritised. As we respond to our most material issues, Westpac’s actions will support the achievement of these priority goals, while also
considering the role we can play to support the remaining 11 goals.
• In 2016, building on our
earlier mapping of
Westpac activities to the
UN Sustainable
Development Goals
(SDGs), we publicly
confirmed our support for
the SDGs through a
‘CEO Statement of
Support’ coordinated by
the UNGC Network
Australia
• Westpac has identified
six priority SDGs that we
can most directly
influence through our
business model
• We have mapped these
priority SDGs against our
material issues in the
following table
Alignment to the Sustainable Development Goals
14
• Conduct and culture
• Changing regulatory landscape
• Financial and economic performance
• Governance, risk and remuneration
Conduct
and Trust
Service
leadership
Digital
innovation
Workforce
of the future
Positive
societal
impact
Value
chain risk
• Customer experience, support and access
• Financial capability and empowerment
• Digital product and service transformation
• Information security and data privacy
• Talent attraction and retention
• Workforce wellbeing
• Inclusion and diversity
• Supporting communities in need
• Positive impact finance
• Climate change transition and opportunities
• Societal diversity and prosperity
• Our direct environment footprint
• Value chain sustainability risks
Westpac Group Fixed Income Presentation I November 2017 I Euro Climate Bond Roadshow

FONT SIZES
IDP TEMPLATE Charts: 10pt │Tables: 12pt │ Text boxes: 12pt │ Text box headings: 14pt
R73
G87
B97
R228
G26
B18
R175
G38
B22
R73
G19
B56
R147
G147
B147
R84
G49
B78
R59
G12
B44
R139
G15
B9
R104
G9
B6
R44
G9
B33
R120
G120
B120
R42
G52
B58
Below is the chart colour sequence. If your chart has more than 12 series‘ you will need to manually colour the additional series.
Westpac Red,
used as the HIGHLIGHT colour
LINES AND ARROWS
Lines are solid black or red, 1.5pt
Arrows are block style to fit text inside, see
‘pullout boxes and arrows’ elements slide
Body – 12pt Arial Regular sentence case
• Bullet – 12pt Arial Regular
Second Bullet – 12pt Arial Regular
Heading – 14pt Times New Roman Bold Note – 10pt Arial Regular
Text boxes have 0.0cm margin on all sides
These are your 5 levels of styles.
To move through the different styles, select the text and press
TAB. To return to the previous style, press SHIFT + TAB.
If you are on a blank line, use the Increase or Decrease Indent
buttons on the Home tab
Chart heading text boxes have 0.25cm margin on left
All text is black. No grey text
Use the shapes supplied in the ‘Editable Elements’ section.
Never skew the shape. Resize proportionally in order to keep the
angles of the curves on each side.
To create a longer wave shape, resize proportionally and join
multiple shapes together with aligning and grouping.
E.g. these:
Become:
TEXT
SHAPES
GRID
To show the grid, right click the slide and
select ‘Grids and Guidelines’ > ‘Guides”
Subheading in charts is 10pt bold
Text in charts is 10pt TABLES
Headings 12pt bold all CAPS
Heading divider line 1.5pt red
All other horizontal lines .75pt grey
Total line same as heading
All text 12pt where possible, reduced
where required to a minimum of 8pt
CHART HEADINGS
The heading box should sit 0.2cm indented from
the top and right side of the chart background box.
1 line heading box = 0.8cm height
2 line heading box = 1.2cm height
Height must remain consistent, width will vary.
Most layouts use a one line heading box, you can
manually paste a two line heading box over this
area. Select from the pre-made options on ‘chart
title text boxes’ slide in the ‘Editable Elements’
section.
NOTE: All content placeholders are adaptable. If a placeholder already contains (for example) a bar chart, this
can be deleted to insert a table, text, image or other content. The template is very flexible. There are a lot of
layout options provided, manipulate them as needed to suit your content but if it’s not looking right, you can
always ‘Reset’ the slide to revert back to the templated layout.
Guides
Notes that are specific to a certain
layout will be placed here
R77
G77
B79
Westpac Grey,
not used in charts
Text inside
13.80 4.80 4.40 0.20 0.20 4.40 4.80 13.80
8.40
7.00
0.40
0.80
8.20
10.00
Divisional colours
Consumer
R228
G26
B18
WIB
R84
G49
B78
BTFG
R0
G175
B215
New Zealand
R175
G38
B22
Business
R139
G15
B9
Westpac primary colours
R177
G189
B197
R247
G161
B157
R251
G154
B144
R233
G172
B214
R212
G212
B212
R199
G160
B193
60% tint colours
• Sustainability risk management framework
• Risk management framework
• Responsible sourcing code of conduct
• Sustainability strategy 2013-17
• Inclusion and diversity strategy
• Divisional and business unit strategies
Sustainability governance framework 15
Westpac
Stakeholder
Advisory Council
Westpac
Indigenous
Advisory
Committee
Westpac
New Zealand
External
Stakeholder
Panel
Westpac Board
Executive Team
Divisional committees and working groups
Westpac Group Sustainability Council Westpac Group Inclusion
and Diversity Council
Westpac New Zealand Sustainable
Business Steering Committee
Internal Committee
External Committee
Guiding our approach Managing risk Driving action
• Principles for doing business
• Stakeholder engagement framework
• Social impact framework
• ESG credit policy
• Financing agribusiness
• Financing the defence sector
• Financing a sustainable energy system
• Financing tobacco
• Climate change and environmental action plan
• Reconciliation action plan
• Human rights action plan
• Accessibility action plan
• Financial inclusion action plan
Policies and position statements Specific policies and positions Action plans and divisional strategies
• Climate change and environmental position
statement
• Human rights position statement
• Responsible investment position statement
• Supplier inclusion and diversity policy
• Wellbeing policy
Global commitments and partnerships
• Equator principles
• UN sustainable development goals
• Global investor statement on climate change
• Principles for responsible investment
• UN global compact
• We mean business coalition
Interim and annual reporting
• Banking environment initiative’s soft commodities
compact
• UN environment program – finance initiative
Westpac Group Fixed Income Presentation I November 2017 I Euro Climate Bond Roadshow

FONT SIZES
IDP TEMPLATE Charts: 10pt │Tables: 12pt │ Text boxes: 12pt │ Text box headings: 14pt
R73
G87
B97
R228
G26
B18
R175
G38
B22
R73
G19
B56
R147
G147
B147
R84
G49
B78
R59
G12
B44
R139
G15
B9
R104
G9
B6
R44
G9
B33
R120
G120
B120
R42
G52
B58
Below is the chart colour sequence. If your chart has more than 12 series‘ you will need to manually colour the additional series.
Westpac Red,
used as the HIGHLIGHT colour
LINES AND ARROWS
Lines are solid black or red, 1.5pt
Arrows are block style to fit text inside, see
‘pullout boxes and arrows’ elements slide
Body – 12pt Arial Regular sentence case
• Bullet – 12pt Arial Regular
Second Bullet – 12pt Arial Regular
Heading – 14pt Times New Roman Bold Note – 10pt Arial Regular
Text boxes have 0.0cm margin on all sides
These are your 5 levels of styles.
To move through the different styles, select the text and press
TAB. To return to the previous style, press SHIFT + TAB.
If you are on a blank line, use the Increase or Decrease Indent
buttons on the Home tab
Chart heading text boxes have 0.25cm margin on left
All text is black. No grey text
Use the shapes supplied in the ‘Editable Elements’ section.
Never skew the shape. Resize proportionally in order to keep the
angles of the curves on each side.
To create a longer wave shape, resize proportionally and join
multiple shapes together with aligning and grouping.
E.g. these:
Become:
TEXT
SHAPES
GRID
To show the grid, right click the slide and
select ‘Grids and Guidelines’ > ‘Guides”
Subheading in charts is 10pt bold
Text in charts is 10pt TABLES
Headings 12pt bold all CAPS
Heading divider line 1.5pt red
All other horizontal lines .75pt grey
Total line same as heading
All text 12pt where possible, reduced
where required to a minimum of 8pt
CHART HEADINGS
The heading box should sit 0.2cm indented from
the top and right side of the chart background box.
1 line heading box = 0.8cm height
2 line heading box = 1.2cm height
Height must remain consistent, width will vary.
Most layouts use a one line heading box, you can
manually paste a two line heading box over this
area. Select from the pre-made options on ‘chart
title text boxes’ slide in the ‘Editable Elements’
section.
NOTE: All content placeholders are adaptable. If a placeholder already contains (for example) a bar chart, this
can be deleted to insert a table, text, image or other content. The template is very flexible. There are a lot of
layout options provided, manipulate them as needed to suit your content but if it’s not looking right, you can
always ‘Reset’ the slide to revert back to the templated layout.
Guides
Notes that are specific to a certain
layout will be placed here
R77
G77
B79
Westpac Grey,
not used in charts
Text inside
13.80 4.80 4.40 0.20 0.20 4.40 4.80 13.80
8.40
7.00
0.40
0.80
8.20
10.00
Divisional colours
Consumer
R228
G26
B18
WIB
R84
G49
B78
BTFG
R0
G175
B215
New Zealand
R175
G38
B22
Business
R139
G15
B9
Westpac primary colours
R177
G189
B197
R247
G161
B157
R251
G154
B144
R233
G172
B214
R212
G212
B212
R199
G160
B193
60% tint colours
Group-wide sustainability performance is reported to the
Westpac Group Executive Team and Westpac Board
Group Sustainability Council
has responsibility for the Group’s delivery
on the sustainability strategy
Environmental Management Committee
has responsibility for the Group’s footprint and performance
against efficiency metrics
Climate Change Solutions Committee
has responsibility for driving performance against our
commitment to make available up to A$10 billion in lending and
investment to climate change solutions by 2020 and A$25
billion by 2030
Working groups are also formed to manage specific
environmental issues as they arise
Westpac’s framework for managing ESG risks… 16
Westpac Group Fixed Income Presentation I November 2017 I Euro Climate Bond Roadshow
Westpac’s approach to environmental, social, and governance assessment of companies and projects
If the identified ESG risks do not meet Westpac’s risk appetite—which includes a
requirement to meet the criteria outlined in our position statements – then we will not
proceed with the transaction
Screening
Equator Principles
Risk Management
Strategy
• A Board-approved Risk Management
Strategy that covers sustainability and
reputational risks
• Underpinned by a number of key risk
documents on sustainability
• When assessing a project or prospective customer,
Westpac credit officers, deal teams and sustainability
specialists screen against
Environmental risks
Social risks
Governance risks
All other Westpac position statements
• In addition, Westpac applies the
Equator Principles (EP III) to all
project finance transactions, project-
related corporate loans, and bridge
loans with a tenor of less than two
years
Governance and oversight forums for the ongoing management of environmental challenges
1
2
3
4
5

FONT SIZES
IDP TEMPLATE Charts: 10pt │Tables: 12pt │ Text boxes: 12pt │ Text box headings: 14pt
R73
G87
B97
R228
G26
B18
R175
G38
B22
R73
G19
B56
R147
G147
B147
R84
G49
B78
R59
G12
B44
R139
G15
B9
R104
G9
B6
R44
G9
B33
R120
G120
B120
R42
G52
B58
Below is the chart colour sequence. If your chart has more than 12 series‘ you will need to manually colour the additional series.
Westpac Red,
used as the HIGHLIGHT colour
LINES AND ARROWS
Lines are solid black or red, 1.5pt
Arrows are block style to fit text inside, see
‘pullout boxes and arrows’ elements slide
Body – 12pt Arial Regular sentence case
• Bullet – 12pt Arial Regular
Second Bullet – 12pt Arial Regular
Heading – 14pt Times New Roman Bold Note – 10pt Arial Regular
Text boxes have 0.0cm margin on all sides
These are your 5 levels of styles.
To move through the different styles, select the text and press
TAB. To return to the previous style, press SHIFT + TAB.
If you are on a blank line, use the Increase or Decrease Indent
buttons on the Home tab
Chart heading text boxes have 0.25cm margin on left
All text is black. No grey text
Use the shapes supplied in the ‘Editable Elements’ section.
Never skew the shape. Resize proportionally in order to keep the
angles of the curves on each side.
To create a longer wave shape, resize proportionally and join
multiple shapes together with aligning and grouping.
E.g. these:
Become:
TEXT
SHAPES
GRID
To show the grid, right click the slide and
select ‘Grids and Guidelines’ > ‘Guides”
Subheading in charts is 10pt bold
Text in charts is 10pt TABLES
Headings 12pt bold all CAPS
Heading divider line 1.5pt red
All other horizontal lines .75pt grey
Total line same as heading
All text 12pt where possible, reduced
where required to a minimum of 8pt
CHART HEADINGS
The heading box should sit 0.2cm indented from
the top and right side of the chart background box.
1 line heading box = 0.8cm height
2 line heading box = 1.2cm height
Height must remain consistent, width will vary.
Most layouts use a one line heading box, you can
manually paste a two line heading box over this
area. Select from the pre-made options on ‘chart
title text boxes’ slide in the ‘Editable Elements’
section.
NOTE: All content placeholders are adaptable. If a placeholder already contains (for example) a bar chart, this
can be deleted to insert a table, text, image or other content. The template is very flexible. There are a lot of
layout options provided, manipulate them as needed to suit your content but if it’s not looking right, you can
always ‘Reset’ the slide to revert back to the templated layout.
Guides
Notes that are specific to a certain
layout will be placed here
R77
G77
B79
Westpac Grey,
not used in charts
Text inside
13.80 4.80 4.40 0.20 0.20 4.40 4.80 13.80
8.40
7.00
0.40
0.80
8.20
10.00
Divisional colours
Consumer
R228
G26
B18
WIB
R84
G49
B78
BTFG
R0
G175
B215
New Zealand
R175
G38
B22
Business
R139
G15
B9
Westpac primary colours
R177
G189
B197
R247
G161
B157
R251
G154
B144
R233
G172
B214
R212
G212
B212
R199
G160
B193
60% tint colours
…which we continue to update
Westpac Group Fixed Income Presentation I November 2017 I Euro Climate Bond Roadshow
• Westpac continues to update the Group’s
sustainability governance frameworks
responding to material sustainability topics,
both issues and opportunities, including:
Climate Change Position Statement and
2020 Action Plan
Human Rights Position Statement and
2020 Action Plan
Reconciliation Action Plan 2018 - 2020
Accessibility Action Plan 2018 - 2020
• Released our first Slavery and Human
Trafficking Statement in response to the
UK Modern Slavery Act in 2016
• Released our Responsible Sourcing Code
of Conduct and established our global
Responsible Sourcing Steering Committee
to oversee its application in 2017
17
Climate change Reconciliation Human rights
Supply chain Accessibility Modern Slavery Act

FONT SIZES
IDP TEMPLATE Charts: 10pt │Tables: 12pt │ Text boxes: 12pt │ Text box headings: 14pt
R73
G87
B97
R228
G26
B18
R175
G38
B22
R73
G19
B56
R147
G147
B147
R84
G49
B78
R59
G12
B44
R139
G15
B9
R104
G9
B6
R44
G9
B33
R120
G120
B120
R42
G52
B58
Below is the chart colour sequence. If your chart has more than 12 series‘ you will need to manually colour the additional series.
Westpac Red,
used as the HIGHLIGHT colour
LINES AND ARROWS
Lines are solid black or red, 1.5pt
Arrows are block style to fit text inside, see
‘pullout boxes and arrows’ elements slide
Body – 12pt Arial Regular sentence case
• Bullet – 12pt Arial Regular
Second Bullet – 12pt Arial Regular
Heading – 14pt Times New Roman Bold Note – 10pt Arial Regular
Text boxes have 0.0cm margin on all sides
These are your 5 levels of styles.
To move through the different styles, select the text and press
TAB. To return to the previous style, press SHIFT + TAB.
If you are on a blank line, use the Increase or Decrease Indent
buttons on the Home tab
Chart heading text boxes have 0.25cm margin on left
All text is black. No grey text
Use the shapes supplied in the ‘Editable Elements’ section.
Never skew the shape. Resize proportionally in order to keep the
angles of the curves on each side.
To create a longer wave shape, resize proportionally and join
multiple shapes together with aligning and grouping.
E.g. these:
Become:
TEXT
SHAPES
GRID
To show the grid, right click the slide and
select ‘Grids and Guidelines’ > ‘Guides”
Subheading in charts is 10pt bold
Text in charts is 10pt TABLES
Headings 12pt bold all CAPS
Heading divider line 1.5pt red
All other horizontal lines .75pt grey
Total line same as heading
All text 12pt where possible, reduced
where required to a minimum of 8pt
CHART HEADINGS
The heading box should sit 0.2cm indented from
the top and right side of the chart background box.
1 line heading box = 0.8cm height
2 line heading box = 1.2cm height
Height must remain consistent, width will vary.
Most layouts use a one line heading box, you can
manually paste a two line heading box over this
area. Select from the pre-made options on ‘chart
title text boxes’ slide in the ‘Editable Elements’
section.
NOTE: All content placeholders are adaptable. If a placeholder already contains (for example) a bar chart, this
can be deleted to insert a table, text, image or other content. The template is very flexible. There are a lot of
layout options provided, manipulate them as needed to suit your content but if it’s not looking right, you can
always ‘Reset’ the slide to revert back to the templated layout.
Guides
Notes that are specific to a certain
layout will be placed here
R77
G77
B79
Westpac Grey,
not used in charts
Text inside
13.80 4.80 4.40 0.20 0.20 4.40 4.80 13.80
8.40
7.00
0.40
0.80
8.20
10.00
Divisional colours
Consumer
R228
G26
B18
WIB
R84
G49
B78
BTFG
R0
G175
B215
New Zealand
R175
G38
B22
Business
R139
G15
B9
Westpac primary colours
R177
G189
B197
R247
G161
B157
R251
G154
B144
R233
G172
B214
R212
G212
B212
R199
G160
B193
60% tint colours
Westpac Climate Change Position Statement and 2020 Action Plan
The Westpac Group has long recognised
that climate change is one of the most
significant issues that will impact the
long-term prosperity of our economy and
way of life
Since we set out our first climate change
action plan almost a decade ago, we
have been helping customers and
communities transition to a low carbon
economy
Westpac Climate Change Position
Statement and Action Plan builds on our
strong track record, outlining the next
phase of actions we are taking to meet
our commitment to operate a manner
consistent with limiting global warming to
less than two degrees Celsius above
pre-industrial levels
Westpac’s Approach
to Climate Change
The core principles that guide and inform Westpac’s
approach to climate change are:
Our
Principles
The following focus areas will direct Westpac’s actions
on climate change:
Our 2020
Action Plan
Transparency and
disclosure matters
A transition to a net zero emissions
economy is required
Economic growth and emissions
reductions are complementary goals
Addressing climate change creates
financial opportunities
Climate-related risk is a
financial risk
1
2
3
4
5 Advocate for policies that stimulate
investment in climate change
solutions
Provide finance to back
climate change solutions
Support businesses that manage
their climate-related risks
Help individual customers
respond to climate change
Improve and disclose our
climate change performance
1
2
3
4
5
18
Westpac Group Fixed Income Presentation I November 2017 I Euro Climate Bond Roadshow
Note: Westpac was the first Australian
bank to recognise the importance of
limiting global warming to two
degrees. Westpac 2013-2017 Climate
Change Position Statement and
Action Plan, 2013.
Westpac was the first Australian bank to recognise the importance of limiting global warming to two degrees

FONT SIZES
IDP TEMPLATE Charts: 10pt │Tables: 12pt │ Text boxes: 12pt │ Text box headings: 14pt
R73
G87
B97
R228
G26
B18
R175
G38
B22
R73
G19
B56
R147
G147
B147
R84
G49
B78
R59
G12
B44
R139
G15
B9
R104
G9
B6
R44
G9
B33
R120
G120
B120
R42
G52
B58
Below is the chart colour sequence. If your chart has more than 12 series‘ you will need to manually colour the additional series.
Westpac Red,
used as the HIGHLIGHT colour
LINES AND ARROWS
Lines are solid black or red, 1.5pt
Arrows are block style to fit text inside, see
‘pullout boxes and arrows’ elements slide
Body – 12pt Arial Regular sentence case
• Bullet – 12pt Arial Regular
Second Bullet – 12pt Arial Regular
Heading – 14pt Times New Roman Bold Note – 10pt Arial Regular
Text boxes have 0.0cm margin on all sides
These are your 5 levels of styles.
To move through the different styles, select the text and press
TAB. To return to the previous style, press SHIFT + TAB.
If you are on a blank line, use the Increase or Decrease Indent
buttons on the Home tab
Chart heading text boxes have 0.25cm margin on left
All text is black. No grey text
Use the shapes supplied in the ‘Editable Elements’ section.
Never skew the shape. Resize proportionally in order to keep the
angles of the curves on each side.
To create a longer wave shape, resize proportionally and join
multiple shapes together with aligning and grouping.
E.g. these:
Become:
TEXT
SHAPES
GRID
To show the grid, right click the slide and
select ‘Grids and Guidelines’ > ‘Guides”
Subheading in charts is 10pt bold
Text in charts is 10pt TABLES
Headings 12pt bold all CAPS
Heading divider line 1.5pt red
All other horizontal lines .75pt grey
Total line same as heading
All text 12pt where possible, reduced
where required to a minimum of 8pt
CHART HEADINGS
The heading box should sit 0.2cm indented from
the top and right side of the chart background box.
1 line heading box = 0.8cm height
2 line heading box = 1.2cm height
Height must remain consistent, width will vary.
Most layouts use a one line heading box, you can
manually paste a two line heading box over this
area. Select from the pre-made options on ‘chart
title text boxes’ slide in the ‘Editable Elements’
section.
NOTE: All content placeholders are adaptable. If a placeholder already contains (for example) a bar chart, this
can be deleted to insert a table, text, image or other content. The template is very flexible. There are a lot of
layout options provided, manipulate them as needed to suit your content but if it’s not looking right, you can
always ‘Reset’ the slide to revert back to the templated layout.
Guides
Notes that are specific to a certain
layout will be placed here
R77
G77
B79
Westpac Grey,
not used in charts
Text inside
13.80 4.80 4.40 0.20 0.20 4.40 4.80 13.80
8.40
7.00
0.40
0.80
8.20
10.00
Divisional colours
Consumer
R228
G26
B18
WIB
R84
G49
B78
BTFG
R0
G175
B215
New Zealand
R175
G38
B22
Business
R139
G15
B9
Westpac primary colours
R177
G189
B197
R247
G161
B157
R251
G154
B144
R233
G172
B214
R212
G212
B212
R199
G160
B193
60% tint colours
19 Our 2020 Action Plan
Provide finance to back climate change solutions
Increase our target lending exposure to climate change solutions to $10 billion by 2020 and $25 billion by 2030
Facilitate up to $3 billion in climate change solutions by 2020, e.g. Climate Bond issuance and arrangement
Support businesses that manage their climate-related risks
and play a constructive role as they manage the transition
Help individual customers respond to climate change
by making their homes more climate-resilient, improve energy efficiency and reduce their environmental impact
Improve and Disclose our climate change performance
for example setting targets to reduce Westpac’s direct footprint emissions by 9% by 2020 and 34% by 2030
Advocate for policies
such as a continued commitment to a broad market-based price on carbon as the most efficient way to encourage emissions
reductions at the lowest cost to the economy
1
2
3
4
5
Westpac Group Fixed Income Presentation I November 2017 I Euro Climate Bond Roadshow
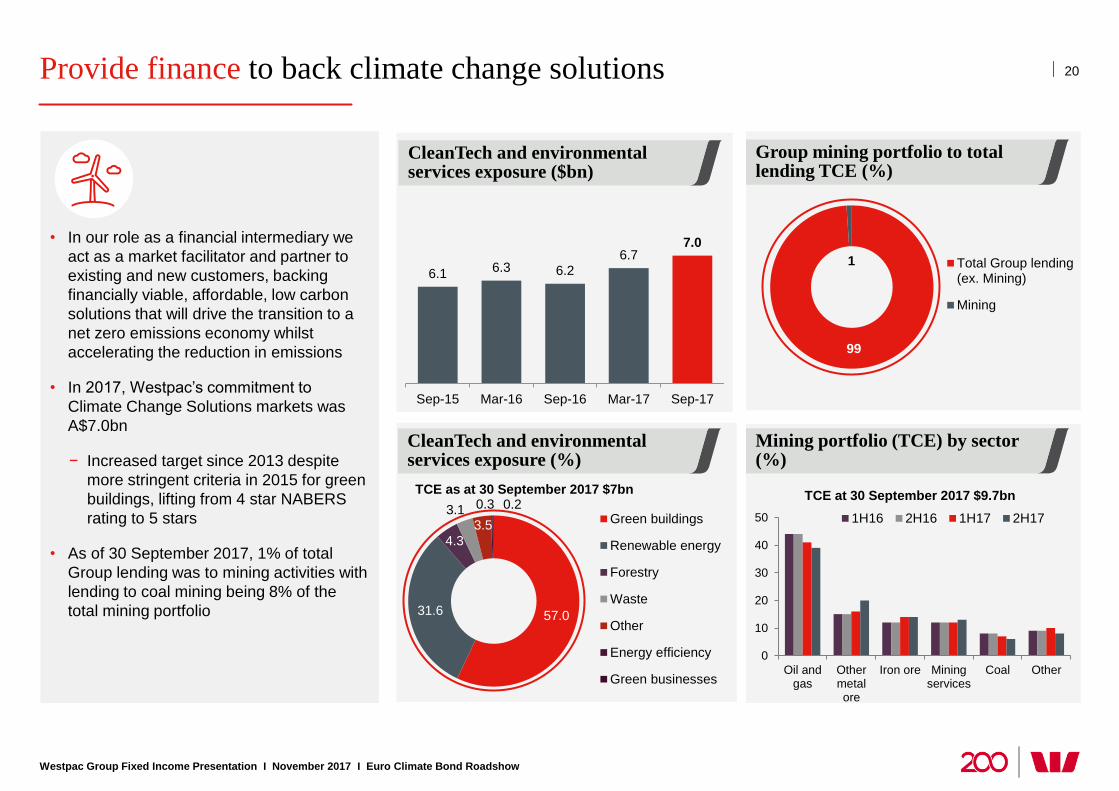
FONT SIZES
IDP TEMPLATE Charts: 10pt │Tables: 12pt │ Text boxes: 12pt │ Text box headings: 14pt
R73
G87
B97
R228
G26
B18
R175
G38
B22
R73
G19
B56
R147
G147
B147
R84
G49
B78
R59
G12
B44
R139
G15
B9
R104
G9
B6
R44
G9
B33
R120
G120
B120
R42
G52
B58
Below is the chart colour sequence. If your chart has more than 12 series‘ you will need to manually colour the additional series.
Westpac Red,
used as the HIGHLIGHT colour
LINES AND ARROWS
Lines are solid black or red, 1.5pt
Arrows are block style to fit text inside, see
‘pullout boxes and arrows’ elements slide
Body – 12pt Arial Regular sentence case
• Bullet – 12pt Arial Regular
Second Bullet – 12pt Arial Regular
Heading – 14pt Times New Roman Bold Note – 10pt Arial Regular
Text boxes have 0.0cm margin on all sides
These are your 5 levels of styles.
To move through the different styles, select the text and press
TAB. To return to the previous style, press SHIFT + TAB.
If you are on a blank line, use the Increase or Decrease Indent
buttons on the Home tab
Chart heading text boxes have 0.25cm margin on left
All text is black. No grey text
Use the shapes supplied in the ‘Editable Elements’ section.
Never skew the shape. Resize proportionally in order to keep the
angles of the curves on each side.
To create a longer wave shape, resize proportionally and join
multiple shapes together with aligning and grouping.
E.g. these:
Become:
TEXT
SHAPES
GRID
To show the grid, right click the slide and
select ‘Grids and Guidelines’ > ‘Guides”
Subheading in charts is 10pt bold
Text in charts is 10pt TABLES
Headings 12pt bold all CAPS
Heading divider line 1.5pt red
All other horizontal lines .75pt grey
Total line same as heading
All text 12pt where possible, reduced
where required to a minimum of 8pt
CHART HEADINGS
The heading box should sit 0.2cm indented from
the top and right side of the chart background box.
1 line heading box = 0.8cm height
2 line heading box = 1.2cm height
Height must remain consistent, width will vary.
Most layouts use a one line heading box, you can
manually paste a two line heading box over this
area. Select from the pre-made options on ‘chart
title text boxes’ slide in the ‘Editable Elements’
section.
NOTE: All content placeholders are adaptable. If a placeholder already contains (for example) a bar chart, this
can be deleted to insert a table, text, image or other content. The template is very flexible. There are a lot of
layout options provided, manipulate them as needed to suit your content but if it’s not looking right, you can
always ‘Reset’ the slide to revert back to the templated layout.
Guides
Notes that are specific to a certain
layout will be placed here
R77
G77
B79
Westpac Grey,
not used in charts
Text inside
13.80 4.80 4.40 0.20 0.20 4.40 4.80 13.80
8.40
7.00
0.40
0.80
8.20
10.00
Divisional colours
Consumer
R228
G26
B18
WIB
R84
G49
B78
BTFG
R0
G175
B215
New Zealand
R175
G38
B22
Business
R139
G15
B9
Westpac primary colours
R177
G189
B197
R247
G161
B157
R251
G154
B144
R233
G172
B214
R212
G212
B212
R199
G160
B193
60% tint colours
Provide finance to back climate change solutions
Westpac Group Fixed Income Presentation I November 2017 I Euro Climate Bond Roadshow
20
CleanTech and environmental services exposure ($bn)
6.1 6.3 6.2
6.7 7.0
Sep-15 Mar-16 Sep-16 Mar-17 Sep-17
CleanTech and environmental services exposure (%)
57.0 31.6
4.3
3.1 3.5
0.3 0.2 Green buildings
Renewable energy
Forestry
Waste
Other
Energy efficiency
Green businesses
TCE as at 30 September 2017 $7bn
Group mining portfolio to total lending TCE (%)
99
1 Total Group lending(ex. Mining)
Mining
Mining portfolio (TCE) by sector (%)
0
10
20
30
40
50
Oil andgas
Othermetalore
Iron ore Miningservices
Coal Other
1H16 2H16 1H17 2H17
TCE at 30 September 2017 $9.7bn
• In our role as a financial intermediary we
act as a market facilitator and partner to
existing and new customers, backing
financially viable, affordable, low carbon
solutions that will drive the transition to a
net zero emissions economy whilst
accelerating the reduction in emissions
• In 2017, Westpac’s commitment to
Climate Change Solutions markets was
A$7.0bn
− Increased target since 2013 despite
more stringent criteria in 2015 for green
buildings, lifting from 4 star NABERS
rating to 5 stars
• As of 30 September 2017, 1% of total
Group lending was to mining activities with
lending to coal mining being 8% of the
total mining portfolio

FONT SIZES
IDP TEMPLATE Charts: 10pt │Tables: 12pt │ Text boxes: 12pt │ Text box headings: 14pt
R73
G87
B97
R228
G26
B18
R175
G38
B22
R73
G19
B56
R147
G147
B147
R84
G49
B78
R59
G12
B44
R139
G15
B9
R104
G9
B6
R44
G9
B33
R120
G120
B120
R42
G52
B58
Below is the chart colour sequence. If your chart has more than 12 series‘ you will need to manually colour the additional series.
Westpac Red,
used as the HIGHLIGHT colour
LINES AND ARROWS
Lines are solid black or red, 1.5pt
Arrows are block style to fit text inside, see
‘pullout boxes and arrows’ elements slide
Body – 12pt Arial Regular sentence case
• Bullet – 12pt Arial Regular
Second Bullet – 12pt Arial Regular
Heading – 14pt Times New Roman Bold Note – 10pt Arial Regular
Text boxes have 0.0cm margin on all sides
These are your 5 levels of styles.
To move through the different styles, select the text and press
TAB. To return to the previous style, press SHIFT + TAB.
If you are on a blank line, use the Increase or Decrease Indent
buttons on the Home tab
Chart heading text boxes have 0.25cm margin on left
All text is black. No grey text
Use the shapes supplied in the ‘Editable Elements’ section.
Never skew the shape. Resize proportionally in order to keep the
angles of the curves on each side.
To create a longer wave shape, resize proportionally and join
multiple shapes together with aligning and grouping.
E.g. these:
Become:
TEXT
SHAPES
GRID
To show the grid, right click the slide and
select ‘Grids and Guidelines’ > ‘Guides”
Subheading in charts is 10pt bold
Text in charts is 10pt TABLES
Headings 12pt bold all CAPS
Heading divider line 1.5pt red
All other horizontal lines .75pt grey
Total line same as heading
All text 12pt where possible, reduced
where required to a minimum of 8pt
CHART HEADINGS
The heading box should sit 0.2cm indented from
the top and right side of the chart background box.
1 line heading box = 0.8cm height
2 line heading box = 1.2cm height
Height must remain consistent, width will vary.
Most layouts use a one line heading box, you can
manually paste a two line heading box over this
area. Select from the pre-made options on ‘chart
title text boxes’ slide in the ‘Editable Elements’
section.
NOTE: All content placeholders are adaptable. If a placeholder already contains (for example) a bar chart, this
can be deleted to insert a table, text, image or other content. The template is very flexible. There are a lot of
layout options provided, manipulate them as needed to suit your content but if it’s not looking right, you can
always ‘Reset’ the slide to revert back to the templated layout.
Guides
Notes that are specific to a certain
layout will be placed here
R77
G77
B79
Westpac Grey,
not used in charts
Text inside
13.80 4.80 4.40 0.20 0.20 4.40 4.80 13.80
8.40
7.00
0.40
0.80
8.20
10.00
Divisional colours
Consumer
R228
G26
B18
WIB
R84
G49
B78
BTFG
R0
G175
B215
New Zealand
R175
G38
B22
Business
R139
G15
B9
Westpac primary colours
R177
G189
B197
R247
G161
B157
R251
G154
B144
R233
G172
B214
R212
G212
B212
R199
G160
B193
60% tint colours
Supporting the transition to a 2 degree economy
Westpac Group Fixed Income Presentation I November 2017 I Euro Climate Bond Roadshow
1 Exposures in WIB only.
66
17
14
2 1
Renewable energy
Gas
Black coal
Brown coal
Liquid fuel
0.41 0.38 0.38 0.35
0.87 0.91 0.90
0.86
2014 2015 2016 2017
Westpac electricty generation portfolio
National Electricity Market (NEM) Benchmark
• The proportion of renewable energy
financing in our total electricity generation
portfolio has increased from 45% in 2011 to
66% in 2017
• The emissions intensity of Westpac’s
power generation portfolio as at 30
September 2017 was 0.36 tCO2e/MWh
below the National Electricity Market
(‘NEM’) for June 2017 of 0.86 tCO2e/MWh
• Total attributable financing to electricity
generation (Aust/NZ) of Westpac’s portfolio
is $3.225bn
21
Westpac Group electricity generation exposure (%)1
Westpac Group electricity generation – Aust. & NZ (%)1
Emissions intensity (tCO2-e/MWh) – Australia only
Westpac electricity generation (Australia and New Zealand)1
0.41 0.38 0.38 0.36
0.87 0.91 0.90 0.86
2014 2015 2016 2017
Westpac electricty generation portfolio
National Electricity Market (NEM) Benchmark
24% 28% 30% 26% 37%
31% 30% 31% 34% 29%
5% 4% 3% 3% 2% 16% 16% 14% 16% 14% 24% 20% 21% 20% 17%
1% 1% 1% 2% 1%
$3.1bn $3.2bn $3.3bn $3.1bn
$3.2bn
2013 2014 2015 2016 2017
Other renewables Hydro Brown Coal
Black Coal Gas Liquid fuel
Total attributable financing ($bn)

FONT SIZES
IDP TEMPLATE Charts: 10pt │Tables: 12pt │ Text boxes: 12pt │ Text box headings: 14pt
R73
G87
B97
R228
G26
B18
R175
G38
B22
R73
G19
B56
R147
G147
B147
R84
G49
B78
R59
G12
B44
R139
G15
B9
R104
G9
B6
R44
G9
B33
R120
G120
B120
R42
G52
B58
Below is the chart colour sequence. If your chart has more than 12 series‘ you will need to manually colour the additional series.
Westpac Red,
used as the HIGHLIGHT colour
LINES AND ARROWS
Lines are solid black or red, 1.5pt
Arrows are block style to fit text inside, see
‘pullout boxes and arrows’ elements slide
Body – 12pt Arial Regular sentence case
• Bullet – 12pt Arial Regular
Second Bullet – 12pt Arial Regular
Heading – 14pt Times New Roman Bold Note – 10pt Arial Regular
Text boxes have 0.0cm margin on all sides
These are your 5 levels of styles.
To move through the different styles, select the text and press
TAB. To return to the previous style, press SHIFT + TAB.
If you are on a blank line, use the Increase or Decrease Indent
buttons on the Home tab
Chart heading text boxes have 0.25cm margin on left
All text is black. No grey text
Use the shapes supplied in the ‘Editable Elements’ section.
Never skew the shape. Resize proportionally in order to keep the
angles of the curves on each side.
To create a longer wave shape, resize proportionally and join
multiple shapes together with aligning and grouping.
E.g. these:
Become:
TEXT
SHAPES
GRID
To show the grid, right click the slide and
select ‘Grids and Guidelines’ > ‘Guides”
Subheading in charts is 10pt bold
Text in charts is 10pt TABLES
Headings 12pt bold all CAPS
Heading divider line 1.5pt red
All other horizontal lines .75pt grey
Total line same as heading
All text 12pt where possible, reduced
where required to a minimum of 8pt
CHART HEADINGS
The heading box should sit 0.2cm indented from
the top and right side of the chart background box.
1 line heading box = 0.8cm height
2 line heading box = 1.2cm height
Height must remain consistent, width will vary.
Most layouts use a one line heading box, you can
manually paste a two line heading box over this
area. Select from the pre-made options on ‘chart
title text boxes’ slide in the ‘Editable Elements’
section.
NOTE: All content placeholders are adaptable. If a placeholder already contains (for example) a bar chart, this
can be deleted to insert a table, text, image or other content. The template is very flexible. There are a lot of
layout options provided, manipulate them as needed to suit your content but if it’s not looking right, you can
always ‘Reset’ the slide to revert back to the templated layout.
Guides
Notes that are specific to a certain
layout will be placed here
R77
G77
B79
Westpac Grey,
not used in charts
Text inside
13.80 4.80 4.40 0.20 0.20 4.40 4.80 13.80
8.40
7.00
0.40
0.80
8.20
10.00
Divisional colours
Consumer
R228
G26
B18
WIB
R84
G49
B78
BTFG
R0
G175
B215
New Zealand
R175
G38
B22
Business
R139
G15
B9
Westpac primary colours
R177
G189
B197
R247
G161
B157
R251
G154
B144
R233
G172
B214
R212
G212
B212
R199
G160
B193
60% tint colours
Well recognised performance and achievements
Number one bank globally in
2017, for the 4th year in a row
and the 10th time since the index
was established
Awarded Gold Class ranking
in RobecoSAM’s 2017
Sustainability Yearbook
Number one bank globally in
2017, for the 4th year in a row
and the 10th time since the index
was established
Employer of Choice by The
Workplace Gender Equality
Agency for the 7th consecutive
year
Included in the 2016
Global 100 Most Sustainable
Corporations in the
World, January 2016
Named as Australia’s 2016
Employer of the Year for LGBTI
Inclusion in the Australian
Workplace Equality Index Awards
#1 Bank in Top 10 Australian
Network on Disability’s Inaugural
Access and Inclusion Index
Member of the FTSE4Good Index,
of which Westpac has been a
member for over 10 years,
announced in April 2017
Recognised in the 2017 CDP
to achieve Leadership level
for our response to climate
change, announced in
October 2017
Ranked as the leading
Australian bank in the
Bloomberg Financial Services
Gender Equality Index
Achieved highest “Leading” rating for
the tenth consecutive year for
disclosure of sustainability risks in
2017
Reconfirmed as a constituent of
the Ethibel Sustainability Index
(ESI) Excellence Global,
announced September 2017
Member of the MSCI Global
ESG Leaders index
Achieved a Prime status rating
and identified as a leading
performer of sustainability
since 2014
Member of the STOXX
2016/2017 Global ESG Leaders
Indices for the fourth
consecutive year
Eq
ua
lity
Rec
og
nit
ion
S
us
tain
ab
ilit
y I
nd
ex
E
xtr
a-F
ina
nc
ing
Rati
ng
s
Westpac Group Fixed Income Presentation I November 2017 I Euro Climate Bond Roadshow
22
FONT SIZES
IDP TEMPLATE Charts: 10pt │Tables: 12pt │ Text boxes: 12pt │ Text box headings: 14pt
R73
G87
B97
R228
G26
B18
R175
G38
B22
R73
G19
B56
R147
G147
B147
R84
G49
B78
R59
G12
B44
R139
G15
B9
R104
G9
B6
R44
G9
B33
R120
G120
B120
R42
G52
B58
Below is the chart colour sequence. If your chart has more than 12 series‘ you will need to manually colour the additional series.
Westpac Red,
used as the HIGHLIGHT colour
LINES AND ARROWS
Lines are solid black or red, 1.5pt
Arrows are block style to fit text inside, see
‘pullout boxes and arrows’ elements slide
Body – 12pt Arial Regular sentence case
• Bullet – 12pt Arial Regular
Second Bullet – 12pt Arial Regular
Heading – 14pt Times New Roman Bold Note – 10pt Arial Regular
Text boxes have 0.0cm margin on all sides
These are your 5 levels of styles.
To move through the different styles, select the text and press
TAB. To return to the previous style, press SHIFT + TAB.
If you are on a blank line, use the Increase or Decrease Indent
buttons on the Home tab
Chart heading text boxes have 0.25cm margin on left
All text is black. No grey text
Use the shapes supplied in the ‘Editable Elements’ section.
Never skew the shape. Resize proportionally in order to keep the
angles of the curves on each side.
To create a longer wave shape, resize proportionally and join
multiple shapes together with aligning and grouping.
E.g. these:
Become:
TEXT
SHAPES
GRID
To show the grid, right click the slide and
select ‘Grids and Guidelines’ > ‘Guides”
Subheading in charts is 10pt bold
Text in charts is 10pt TABLES
Headings 12pt bold all CAPS
Heading divider line 1.5pt red
All other horizontal lines .75pt grey
Total line same as heading
All text 12pt where possible, reduced
where required to a minimum of 8pt
CHART HEADINGS
The heading box should sit 0.2cm indented from
the top and right side of the chart background box.
1 line heading box = 0.8cm height
2 line heading box = 1.2cm height
Height must remain consistent, width will vary.
Most layouts use a one line heading box, you can
manually paste a two line heading box over this
area. Select from the pre-made options on ‘chart
title text boxes’ slide in the ‘Editable Elements’
section.
NOTE: All content placeholders are adaptable. If a placeholder already contains (for example) a bar chart, this
can be deleted to insert a table, text, image or other content. The template is very flexible. There are a lot of
layout options provided, manipulate them as needed to suit your content but if it’s not looking right, you can
always ‘Reset’ the slide to revert back to the templated layout.
Guides
Notes that are specific to a certain
layout will be placed here
R77
G77
B79
Westpac Grey,
not used in charts
Text inside
13.80 4.80 4.40 0.20 0.20 4.40 4.80 13.80
8.40
7.00
0.40
0.80
8.20
10.00
Divisional colours
Consumer
R228
G26
B18
WIB
R84
G49
B78
BTFG
R0
G175
B215
New Zealand
R175
G38
B22
Business
R139
G15
B9
Westpac primary colours
R177
G189
B197
R247
G161
B157
R251
G154
B144
R233
G172
B214
R212
G212
B212
R199
G160
B193
60% tint colours
Westpac’s key international initiatives, commitments and partnerships 23
United Nations Global Compact Signatory (2002)
Global Compact Network Australia Founding Member
UN Principles for
Responsible Investment
(2007)
The Equator Principles
Founding Adopter
First Australian Bank (2003)
UN Environment Program
Finance Initiative
Founding Member (1991)
(????)
Westpac Group Fixed Income Presentation I November 2017 I Euro Climate Bond Roadshow
UN Sustainable
Development Goals
CEO Statement of
Commitment (2015)
Green Bond Principles
Banking Environment Initiative
Soft Commodities Compact
We Mean
Business Coalition
Global Investor Coalition
Statement on Climate Change

NOTE:
T
NOTE:
All images are held in templated
image placeholders.
They can be changed by simply
selecting and deleting the image,
then selecting a new one.
Note that you will have to “send
to back” or “bring forward”
imagery as necessary.
To move the image around in the
placeholder, just select the
image, right click and select
CROP.
Select image and move as
necessary.
There is a semi-transparent
white shape that will need to
always be placed on top of the
very back image.
There are red placement lines at
the top of this slide should you
ever need to move and replace
the wedge.
200 years proudly supporting Australia
Westpac Climate Bond
Westpac Banking Corporation
ABN 33 007 457 141

FONT SIZES
IDP TEMPLATE Charts: 10pt │Tables: 12pt │ Text boxes: 12pt │ Text box headings: 14pt
R73
G87
B97
R228
G26
B18
R175
G38
B22
R73
G19
B56
R147
G147
B147
R84
G49
B78
R59
G12
B44
R139
G15
B9
R104
G9
B6
R44
G9
B33
R120
G120
B120
R42
G52
B58
Below is the chart colour sequence. If your chart has more than 12 series‘ you will need to manually colour the additional series.
Westpac Red,
used as the HIGHLIGHT colour
LINES AND ARROWS
Lines are solid black or red, 1.5pt
Arrows are block style to fit text inside, see
‘pullout boxes and arrows’ elements slide
Body – 12pt Arial Regular sentence case
• Bullet – 12pt Arial Regular
Second Bullet – 12pt Arial Regular
Heading – 14pt Times New Roman Bold Note – 10pt Arial Regular
Text boxes have 0.0cm margin on all sides
These are your 5 levels of styles.
To move through the different styles, select the text and press
TAB. To return to the previous style, press SHIFT + TAB.
If you are on a blank line, use the Increase or Decrease Indent
buttons on the Home tab
Chart heading text boxes have 0.25cm margin on left
All text is black. No grey text
Use the shapes supplied in the ‘Editable Elements’ section.
Never skew the shape. Resize proportionally in order to keep the
angles of the curves on each side.
To create a longer wave shape, resize proportionally and join
multiple shapes together with aligning and grouping.
E.g. these:
Become:
TEXT
SHAPES
GRID
To show the grid, right click the slide and
select ‘Grids and Guidelines’ > ‘Guides”
Subheading in charts is 10pt bold
Text in charts is 10pt TABLES
Headings 12pt bold all CAPS
Heading divider line 1.5pt red
All other horizontal lines .75pt grey
Total line same as heading
All text 12pt where possible, reduced
where required to a minimum of 8pt
CHART HEADINGS
The heading box should sit 0.2cm indented from
the top and right side of the chart background box.
1 line heading box = 0.8cm height
2 line heading box = 1.2cm height
Height must remain consistent, width will vary.
Most layouts use a one line heading box, you can
manually paste a two line heading box over this
area. Select from the pre-made options on ‘chart
title text boxes’ slide in the ‘Editable Elements’
section.
NOTE: All content placeholders are adaptable. If a placeholder already contains (for example) a bar chart, this
can be deleted to insert a table, text, image or other content. The template is very flexible. There are a lot of
layout options provided, manipulate them as needed to suit your content but if it’s not looking right, you can
always ‘Reset’ the slide to revert back to the templated layout.
Guides
Notes that are specific to a certain
layout will be placed here
R77
G77
B79
Westpac Grey,
not used in charts
Text inside
13.80 4.80 4.40 0.20 0.20 4.40 4.80 13.80
8.40
7.00
0.40
0.80
8.20
10.00
Divisional colours
Consumer
R228
G26
B18
WIB
R84
G49
B78
BTFG
R0
G175
B215
New Zealand
R175
G38
B22
Business
R139
G15
B9
Westpac primary colours
R177
G189
B197
R247
G161
B157
R251
G154
B144
R233
G172
B214
R212
G212
B212
R199
G160
B193
60% tint colours
Westpac Climate Bond: a strong fit to our 2020 Action Plan 25
• To provide financing for technologies and practices that
are consistent with the investment required to limit global
warming to less than two degrees and address its
impacts
• To support the development of the Australian and global
Climate Bond market and to seek investor diversity
• Westpac issued its first Climate Bond in June 2016
• Westpac Climate Bonds give investors the opportunity to
support environmental projects through a high-grade
fixed income investment
1 This target will be updated in the next update of this strategy to reflect changes in technology, policy, climate science and investment assumptions and as our approach evolves.
2 Please see Term Sheet or Final Terms for full details
Westpac Group Fixed Income Presentation I November 2017 I Euro Climate Bond Roadshow
Why issue Climate Bonds?
Use of Proceeds Selection of Assets
• Meet Westpac’s Board-approved Risk Management Strategy
that covers sustainability and reputational risks
• Project selection to meet CBI taxonomy for certification
• Review and approve in Climate Change Solutions Committee
Management of Proceeds
• Internal tracking of Climate Bond proceeds
• Climate Bond specific product code
• Use of Proceeds Reporting
• Impact Reporting
USE OF PROCEEDS LANGUAGE: Only bonds issued to fund projects and assets which qualify as “Eligible Projects & Physical Assets” under the terms of the Climate Bonds Standard can be certified as Climate
Bonds. “Eligible Projects & Physical Assets” are projects, physical assets or loans made to finance physical assets that satisfy the prescribed eligibility criteria for the purposes of the Climate Bonds Standard. “Eligible
Projects & Physical Assets” are subject to sector-specific technical criteria and must be regarded as contributing to the delivery of a low carbon economy within the terms of the Climate Bonds Standard. The Eligible
Projects & Physical Assets with which a Climate Bond is associated are referred to as the “Nominated Projects”.
The Issuer expects to use the proceeds of the issuance of the Notes to finance or maintain the finance for one or more of its Nominated Projects. So long as the Notes are outstanding, the Issuer’s internal records will
show, at any time, the net proceeds from the issuance of the Notes as allocated to the assets that fall within the Nominated Projects. During the term of the Notes, the Issuer will provide Holders with periodic reporting
on the use of proceeds to finance Nominated Projects.
Details of the actual Nominated Projects with which the Notes may be associated at any given time may be subject to obligations of confidentiality that would preclude the Issuer disclosing those details to Holders. In
addition, investors should note that the Issuer is not required to, and no assurance can be given that, the Issuer will, invest in any such project or that any investment in any such project will be retained for the term of
the Notes. Investors should further note that the Issuer may at any time and from time to time change the composition of its investments financed by the Notes and such investments may not include any of the
projects or assets described above. 2
Use of proceeds Management of Proceeds Selection of assets Reporting
Reporting
Climate Bond Framework in accordance with GBP and CBI
• The net proceeds will be used to fund Eligible Green
Projects that meet the requirements of the Climate
Bond Initiative’s Climate Bonds Standard (V2.1)
− Renewable Energy Projects
− Low Carbon Building – Commercial
− Transport – Rail
• CBS are fully aligned with the Green Bond Principles
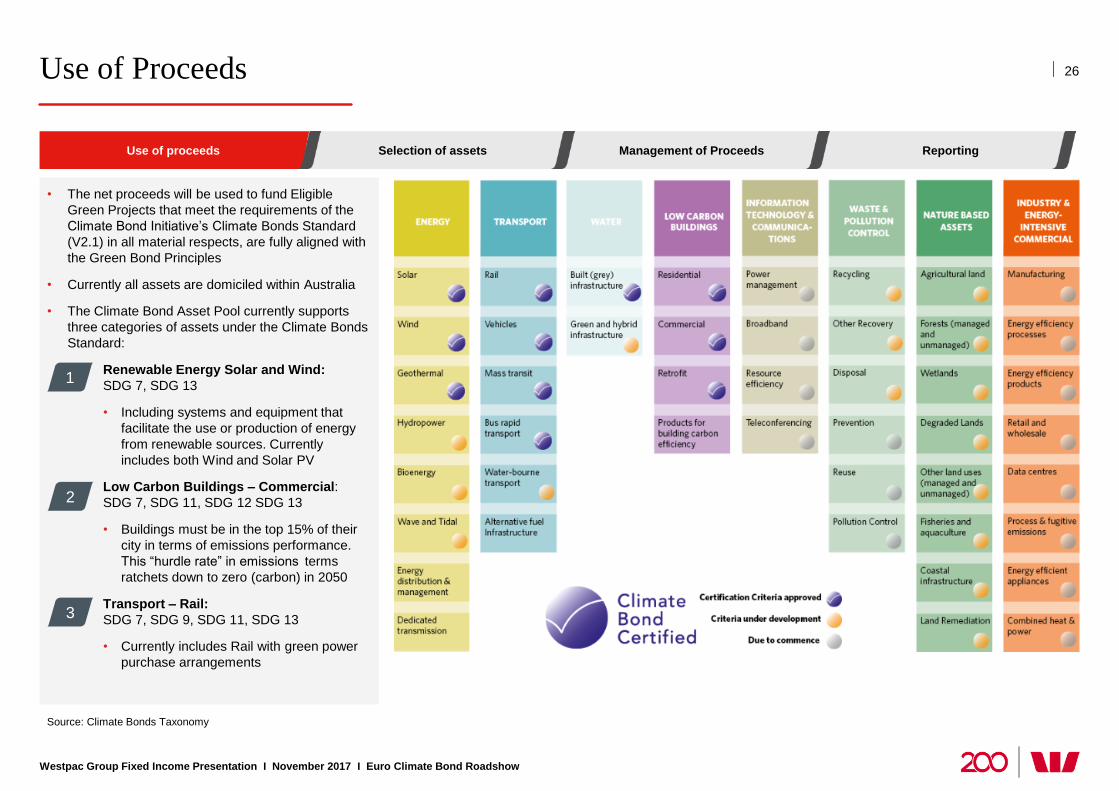
FONT SIZES
IDP TEMPLATE Charts: 10pt │Tables: 12pt │ Text boxes: 12pt │ Text box headings: 14pt
R73
G87
B97
R228
G26
B18
R175
G38
B22
R73
G19
B56
R147
G147
B147
R84
G49
B78
R59
G12
B44
R139
G15
B9
R104
G9
B6
R44
G9
B33
R120
G120
B120
R42
G52
B58
Below is the chart colour sequence. If your chart has more than 12 series‘ you will need to manually colour the additional series.
Westpac Red,
used as the HIGHLIGHT colour
LINES AND ARROWS
Lines are solid black or red, 1.5pt
Arrows are block style to fit text inside, see
‘pullout boxes and arrows’ elements slide
Body – 12pt Arial Regular sentence case
• Bullet – 12pt Arial Regular
Second Bullet – 12pt Arial Regular
Heading – 14pt Times New Roman Bold Note – 10pt Arial Regular
Text boxes have 0.0cm margin on all sides
These are your 5 levels of styles.
To move through the different styles, select the text and press
TAB. To return to the previous style, press SHIFT + TAB.
If you are on a blank line, use the Increase or Decrease Indent
buttons on the Home tab
Chart heading text boxes have 0.25cm margin on left
All text is black. No grey text
Use the shapes supplied in the ‘Editable Elements’ section.
Never skew the shape. Resize proportionally in order to keep the
angles of the curves on each side.
To create a longer wave shape, resize proportionally and join
multiple shapes together with aligning and grouping.
E.g. these:
Become:
TEXT
SHAPES
GRID
To show the grid, right click the slide and
select ‘Grids and Guidelines’ > ‘Guides”
Subheading in charts is 10pt bold
Text in charts is 10pt TABLES
Headings 12pt bold all CAPS
Heading divider line 1.5pt red
All other horizontal lines .75pt grey
Total line same as heading
All text 12pt where possible, reduced
where required to a minimum of 8pt
CHART HEADINGS
The heading box should sit 0.2cm indented from
the top and right side of the chart background box.
1 line heading box = 0.8cm height
2 line heading box = 1.2cm height
Height must remain consistent, width will vary.
Most layouts use a one line heading box, you can
manually paste a two line heading box over this
area. Select from the pre-made options on ‘chart
title text boxes’ slide in the ‘Editable Elements’
section.
NOTE: All content placeholders are adaptable. If a placeholder already contains (for example) a bar chart, this
can be deleted to insert a table, text, image or other content. The template is very flexible. There are a lot of
layout options provided, manipulate them as needed to suit your content but if it’s not looking right, you can
always ‘Reset’ the slide to revert back to the templated layout.
Guides
Notes that are specific to a certain
layout will be placed here
R77
G77
B79
Westpac Grey,
not used in charts
Text inside
13.80 4.80 4.40 0.20 0.20 4.40 4.80 13.80
8.40
7.00
0.40
0.80
8.20
10.00
Divisional colours
Consumer
R228
G26
B18
WIB
R84
G49
B78
BTFG
R0
G175
B215
New Zealand
R175
G38
B22
Business
R139
G15
B9
Westpac primary colours
R177
G189
B197
R247
G161
B157
R251
G154
B144
R233
G172
B214
R212
G212
B212
R199
G160
B193
60% tint colours
Use of Proceeds 26
Source: Climate Bonds Taxonomy
Westpac Group Fixed Income Presentation I November 2017 I Euro Climate Bond Roadshow
• The net proceeds will be used to fund Eligible
Green Projects that meet the requirements of the
Climate Bond Initiative’s Climate Bonds Standard
(V2.1) in all material respects, are fully aligned with
the Green Bond Principles
• Currently all assets are domiciled within Australia
• The Climate Bond Asset Pool currently supports
three categories of assets under the Climate Bonds
Standard:
Renewable Energy Solar and Wind:
SDG 7, SDG 13
• Including systems and equipment that
facilitate the use or production of energy
from renewable sources. Currently
includes both Wind and Solar PV
Low Carbon Buildings – Commercial:
SDG 7, SDG 11, SDG 12 SDG 13
• Buildings must be in the top 15% of their
city in terms of emissions performance.
This “hurdle rate” in emissions terms
ratchets down to zero (carbon) in 2050
Transport – Rail:
SDG 7, SDG 9, SDG 11, SDG 13
• Currently includes Rail with green power
purchase arrangements
Use of proceeds Management of Proceeds Selection of assets Reporting
1
2
3

FONT SIZES
IDP TEMPLATE Charts: 10pt │Tables: 12pt │ Text boxes: 12pt │ Text box headings: 14pt
R73
G87
B97
R228
G26
B18
R175
G38
B22
R73
G19
B56
R147
G147
B147
R84
G49
B78
R59
G12
B44
R139
G15
B9
R104
G9
B6
R44
G9
B33
R120
G120
B120
R42
G52
B58
Below is the chart colour sequence. If your chart has more than 12 series‘ you will need to manually colour the additional series.
Westpac Red,
used as the HIGHLIGHT colour
LINES AND ARROWS
Lines are solid black or red, 1.5pt
Arrows are block style to fit text inside, see
‘pullout boxes and arrows’ elements slide
Body – 12pt Arial Regular sentence case
• Bullet – 12pt Arial Regular
Second Bullet – 12pt Arial Regular
Heading – 14pt Times New Roman Bold Note – 10pt Arial Regular
Text boxes have 0.0cm margin on all sides
These are your 5 levels of styles.
To move through the different styles, select the text and press
TAB. To return to the previous style, press SHIFT + TAB.
If you are on a blank line, use the Increase or Decrease Indent
buttons on the Home tab
Chart heading text boxes have 0.25cm margin on left
All text is black. No grey text
Use the shapes supplied in the ‘Editable Elements’ section.
Never skew the shape. Resize proportionally in order to keep the
angles of the curves on each side.
To create a longer wave shape, resize proportionally and join
multiple shapes together with aligning and grouping.
E.g. these:
Become:
TEXT
SHAPES
GRID
To show the grid, right click the slide and
select ‘Grids and Guidelines’ > ‘Guides”
Subheading in charts is 10pt bold
Text in charts is 10pt TABLES
Headings 12pt bold all CAPS
Heading divider line 1.5pt red
All other horizontal lines .75pt grey
Total line same as heading
All text 12pt where possible, reduced
where required to a minimum of 8pt
CHART HEADINGS
The heading box should sit 0.2cm indented from
the top and right side of the chart background box.
1 line heading box = 0.8cm height
2 line heading box = 1.2cm height
Height must remain consistent, width will vary.
Most layouts use a one line heading box, you can
manually paste a two line heading box over this
area. Select from the pre-made options on ‘chart
title text boxes’ slide in the ‘Editable Elements’
section.
NOTE: All content placeholders are adaptable. If a placeholder already contains (for example) a bar chart, this
can be deleted to insert a table, text, image or other content. The template is very flexible. There are a lot of
layout options provided, manipulate them as needed to suit your content but if it’s not looking right, you can
always ‘Reset’ the slide to revert back to the templated layout.
Guides
Notes that are specific to a certain
layout will be placed here
R77
G77
B79
Westpac Grey,
not used in charts
Text inside
13.80 4.80 4.40 0.20 0.20 4.40 4.80 13.80
8.40
7.00
0.40
0.80
8.20
10.00
Divisional colours
Consumer
R228
G26
B18
WIB
R84
G49
B78
BTFG
R0
G175
B215
New Zealand
R175
G38
B22
Business
R139
G15
B9
Westpac primary colours
R177
G189
B197
R247
G161
B157
R251
G154
B144
R233
G172
B214
R212
G212
B212
R199
G160
B193
60% tint colours
Selection of Assets
1 Climate Change Solutions Lending refers to Westpac Institutional Bank Lending,
2 Climate Bond Selection refers to the subset of CCSL represented by direct lending to CBS V2.1 eligible assets
• Projects must first comply with Westpac Climate Change Solutions criteria and all lending and investment decisions must also include a Social and Environmental
Assessment (SEA) that satisfies local social and environmental regulations and decisions must be taken in the broader context of Westpac’s compliance with the Equator
Principles
1. Climate change solutions include1, but are not limited to, Renewable Energy, Low Carbon Building Commercial, Low-emissions transport, energy efficient technologies
2. Meet the requirements of the Climate Bond Initiative2
3. Must comply with the Equator Principles
Use of proceeds Management of Proceeds Selection of assets Reporting
• Sustainability Risk Management Framework
• Environmental, Social & Governance (ESG) Credit Risk Policy
• Reputation Risk Management Framework
Westpac Group
Policies and
Frameworks
• Risk Appetite
Statement
Equator
Principles
Application of
Green Bond
Principles and
Climate Bonds
Standard v2.1
• Seek approval of
selected assets from
Climate Change
Solutions Committee
Exclusions
• Nuclear or fossil fuel
energy operations
• Controversial weapons
• Coal mining
• Tobacco
Sustainability Risk Management Framework
ESG Credit Risk Policy
Westpac’s Approach to Sustainable Finance
Climate Change Solutions Lending
Climate Bond Selection
Eligible Assets
Ineligible Assets
Polic
y fra
mew
ork
,
secto
r guid
elin
es
and e
xclu
sio
n lis
t
Westp
ac C
limate
Bond fra
mew
ork
and
elig
ible
secto
r crite
ria
Westpac Group Fixed Income Presentation I November 2017 I Euro Climate Bond Roadshow
27
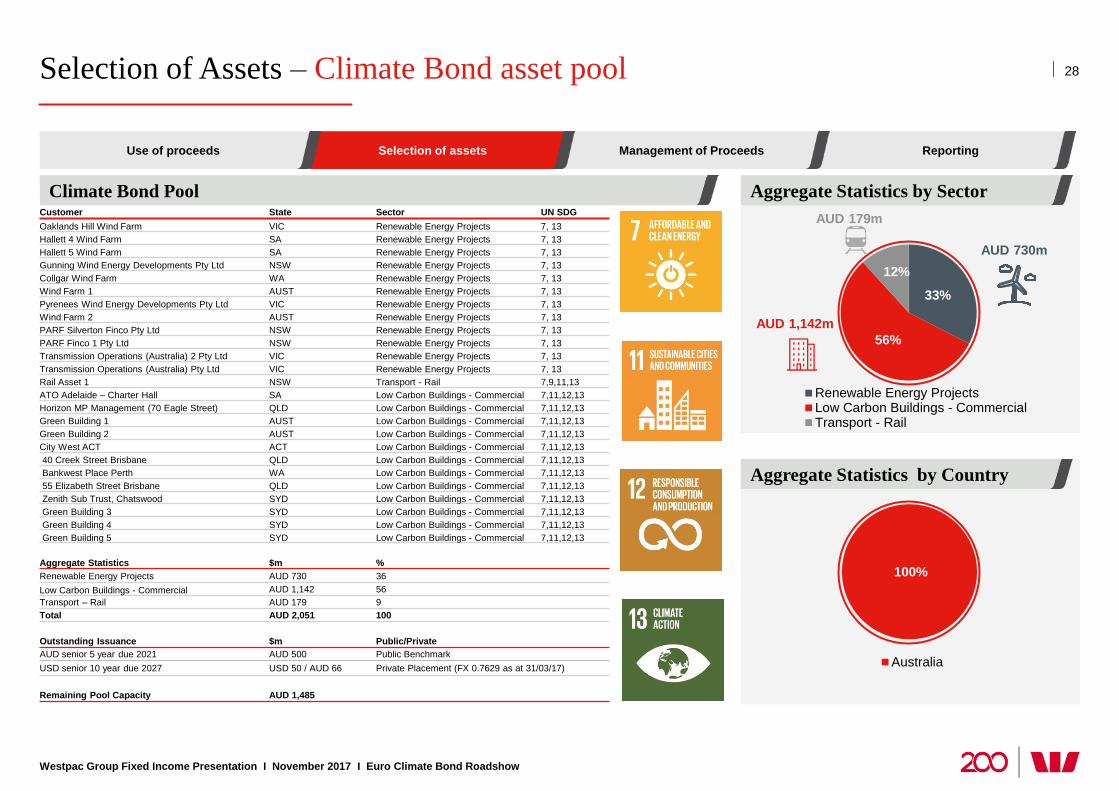
FONT SIZES
IDP TEMPLATE Charts: 10pt │Tables: 12pt │ Text boxes: 12pt │ Text box headings: 14pt
R73
G87
B97
R228
G26
B18
R175
G38
B22
R73
G19
B56
R147
G147
B147
R84
G49
B78
R59
G12
B44
R139
G15
B9
R104
G9
B6
R44
G9
B33
R120
G120
B120
R42
G52
B58
Below is the chart colour sequence. If your chart has more than 12 series‘ you will need to manually colour the additional series.
Westpac Red,
used as the HIGHLIGHT colour
LINES AND ARROWS
Lines are solid black or red, 1.5pt
Arrows are block style to fit text inside, see
‘pullout boxes and arrows’ elements slide
Body – 12pt Arial Regular sentence case
• Bullet – 12pt Arial Regular
Second Bullet – 12pt Arial Regular
Heading – 14pt Times New Roman Bold Note – 10pt Arial Regular
Text boxes have 0.0cm margin on all sides
These are your 5 levels of styles.
To move through the different styles, select the text and press
TAB. To return to the previous style, press SHIFT + TAB.
If you are on a blank line, use the Increase or Decrease Indent
buttons on the Home tab
Chart heading text boxes have 0.25cm margin on left
All text is black. No grey text
Use the shapes supplied in the ‘Editable Elements’ section.
Never skew the shape. Resize proportionally in order to keep the
angles of the curves on each side.
To create a longer wave shape, resize proportionally and join
multiple shapes together with aligning and grouping.
E.g. these:
Become:
TEXT
SHAPES
GRID
To show the grid, right click the slide and
select ‘Grids and Guidelines’ > ‘Guides”
Subheading in charts is 10pt bold
Text in charts is 10pt TABLES
Headings 12pt bold all CAPS
Heading divider line 1.5pt red
All other horizontal lines .75pt grey
Total line same as heading
All text 12pt where possible, reduced
where required to a minimum of 8pt
CHART HEADINGS
The heading box should sit 0.2cm indented from
the top and right side of the chart background box.
1 line heading box = 0.8cm height
2 line heading box = 1.2cm height
Height must remain consistent, width will vary.
Most layouts use a one line heading box, you can
manually paste a two line heading box over this
area. Select from the pre-made options on ‘chart
title text boxes’ slide in the ‘Editable Elements’
section.
NOTE: All content placeholders are adaptable. If a placeholder already contains (for example) a bar chart, this
can be deleted to insert a table, text, image or other content. The template is very flexible. There are a lot of
layout options provided, manipulate them as needed to suit your content but if it’s not looking right, you can
always ‘Reset’ the slide to revert back to the templated layout.
Guides
Notes that are specific to a certain
layout will be placed here
R77
G77
B79
Westpac Grey,
not used in charts
Text inside
13.80 4.80 4.40 0.20 0.20 4.40 4.80 13.80
8.40
7.00
0.40
0.80
8.20
10.00
Divisional colours
Consumer
R228
G26
B18
WIB
R84
G49
B78
BTFG
R0
G175
B215
New Zealand
R175
G38
B22
Business
R139
G15
B9
Westpac primary colours
R177
G189
B197
R247
G161
B157
R251
G154
B144
R233
G172
B214
R212
G212
B212
R199
G160
B193
60% tint colours
33%
56%
12%
Renewable Energy ProjectsLow Carbon Buildings - CommercialTransport - Rail
Selection of Assets – Climate Bond asset pool
Westpac Group Fixed Income Presentation I November 2017 I Euro Climate Bond Roadshow
Climate Bond Pool Customer State Sector UN SDG
Oaklands Hill Wind Farm VIC Renewable Energy Projects 7, 13
Hallett 4 Wind Farm SA Renewable Energy Projects 7, 13
Hallett 5 Wind Farm SA Renewable Energy Projects 7, 13
Gunning Wind Energy Developments Pty Ltd NSW Renewable Energy Projects 7, 13
Collgar Wind Farm WA Renewable Energy Projects 7, 13
Wind Farm 1 AUST Renewable Energy Projects 7, 13
Pyrenees Wind Energy Developments Pty Ltd VIC Renewable Energy Projects 7, 13
Wind Farm 2 AUST Renewable Energy Projects 7, 13
PARF Silverton Finco Pty Ltd NSW Renewable Energy Projects 7, 13
PARF Finco 1 Pty Ltd NSW Renewable Energy Projects 7, 13
Transmission Operations (Australia) 2 Pty Ltd VIC Renewable Energy Projects 7, 13
Transmission Operations (Australia) Pty Ltd VIC Renewable Energy Projects 7, 13
Rail Asset 1 NSW Transport - Rail 7,9,11,13
ATO Adelaide – Charter Hall SA Low Carbon Buildings - Commercial 7,11,12,13
Horizon MP Management (70 Eagle Street) QLD Low Carbon Buildings - Commercial 7,11,12,13
Green Building 1 AUST Low Carbon Buildings - Commercial 7,11,12,13
Green Building 2 AUST Low Carbon Buildings - Commercial 7,11,12,13
City West ACT ACT Low Carbon Buildings - Commercial 7,11,12,13
40 Creek Street Brisbane QLD Low Carbon Buildings - Commercial 7,11,12,13
Bankwest Place Perth WA Low Carbon Buildings - Commercial 7,11,12,13
55 Elizabeth Street Brisbane QLD Low Carbon Buildings - Commercial 7,11,12,13
Zenith Sub Trust, Chatswood SYD Low Carbon Buildings - Commercial 7,11,12,13
Green Building 3 SYD Low Carbon Buildings - Commercial 7,11,12,13
Green Building 4 SYD Low Carbon Buildings - Commercial 7,11,12,13
Green Building 5 SYD Low Carbon Buildings - Commercial 7,11,12,13
Aggregate Statistics $m %
Renewable Energy Projects AUD 730 36
Low Carbon Buildings - Commercial AUD 1,142 56
Transport – Rail AUD 179 9
Total AUD 2,051 100
Outstanding Issuance $m Public/Private
AUD senior 5 year due 2021 AUD 500 Public Benchmark
USD senior 10 year due 2027 USD 50 / AUD 66 Private Placement (FX 0.7629 as at 31/03/17)
Remaining Pool Capacity AUD 1,485
Aggregate Statistics by Country
Aggregate Statistics by Sector
28
AUD 730m
AUD 1,142m
AUD 179m
Use of proceeds Management of Proceeds Selection of assets Reporting
100%
Australia

FONT SIZES
IDP TEMPLATE Charts: 10pt │Tables: 12pt │ Text boxes: 12pt │ Text box headings: 14pt
R73
G87
B97
R228
G26
B18
R175
G38
B22
R73
G19
B56
R147
G147
B147
R84
G49
B78
R59
G12
B44
R139
G15
B9
R104
G9
B6
R44
G9
B33
R120
G120
B120
R42
G52
B58
Below is the chart colour sequence. If your chart has more than 12 series‘ you will need to manually colour the additional series.
Westpac Red,
used as the HIGHLIGHT colour
LINES AND ARROWS
Lines are solid black or red, 1.5pt
Arrows are block style to fit text inside, see
‘pullout boxes and arrows’ elements slide
Body – 12pt Arial Regular sentence case
• Bullet – 12pt Arial Regular
Second Bullet – 12pt Arial Regular
Heading – 14pt Times New Roman Bold Note – 10pt Arial Regular
Text boxes have 0.0cm margin on all sides
These are your 5 levels of styles.
To move through the different styles, select the text and press
TAB. To return to the previous style, press SHIFT + TAB.
If you are on a blank line, use the Increase or Decrease Indent
buttons on the Home tab
Chart heading text boxes have 0.25cm margin on left
All text is black. No grey text
Use the shapes supplied in the ‘Editable Elements’ section.
Never skew the shape. Resize proportionally in order to keep the
angles of the curves on each side.
To create a longer wave shape, resize proportionally and join
multiple shapes together with aligning and grouping.
E.g. these:
Become:
TEXT
SHAPES
GRID
To show the grid, right click the slide and
select ‘Grids and Guidelines’ > ‘Guides”
Subheading in charts is 10pt bold
Text in charts is 10pt TABLES
Headings 12pt bold all CAPS
Heading divider line 1.5pt red
All other horizontal lines .75pt grey
Total line same as heading
All text 12pt where possible, reduced
where required to a minimum of 8pt
CHART HEADINGS
The heading box should sit 0.2cm indented from
the top and right side of the chart background box.
1 line heading box = 0.8cm height
2 line heading box = 1.2cm height
Height must remain consistent, width will vary.
Most layouts use a one line heading box, you can
manually paste a two line heading box over this
area. Select from the pre-made options on ‘chart
title text boxes’ slide in the ‘Editable Elements’
section.
NOTE: All content placeholders are adaptable. If a placeholder already contains (for example) a bar chart, this
can be deleted to insert a table, text, image or other content. The template is very flexible. There are a lot of
layout options provided, manipulate them as needed to suit your content but if it’s not looking right, you can
always ‘Reset’ the slide to revert back to the templated layout.
Guides
Notes that are specific to a certain
layout will be placed here
R77
G77
B79
Westpac Grey,
not used in charts
Text inside
13.80 4.80 4.40 0.20 0.20 4.40 4.80 13.80
8.40
7.00
0.40
0.80
8.20
10.00
Divisional colours
Consumer
R228
G26
B18
WIB
R84
G49
B78
BTFG
R0
G175
B215
New Zealand
R175
G38
B22
Business
R139
G15
B9
Westpac primary colours
R177
G189
B197
R247
G161
B157
R251
G154
B144
R233
G172
B214
R212
G212
B212
R199
G160
B193
60% tint colours
Selection of Assets – Examples of eligible projects
1 Image of Hallett Wind Farm courtesy of AGL Energy
29
Use of proceeds Management of Proceeds Selection of assets Reporting
• White Rock Wind Farm is a green field renewable energy project currently being developed in the north of New South
Wales, approximately 20km west of the town of Glenn Innes
• In June 2016, Westpac participated in the financing of the construction facility
• The Project was subject to Westpac’s Equator Principles assessment. Westpac applied the Equator Principles based on
due diligence material and concluded that the Project was a Category B Project, defined as having potential limited social
or environmental impacts that are few in number, generally site-specific, largely reversible and readily addressed through
mitigation measures
• The project is a joint venture between CECWPC (a company backed by China Energy Conservation and Environmental
Protection Group, a large scale group with expertise in clean energy and environment protection in China) and Goldwind
Capital (the largest wind farm equipment manufacturer in China)
White Rock Wind Farm Northern New South Wales, Australia
[Imagery to insert]
[Imagery to insert]
• For 170 years Westpac has been AGL’s primary banker supporting them in delivering innovative energy solutions
• The Powering Australian Renewables Fund, or PARF as it is known, is a landmark partnership between AGL, QIC and the
Future Fund
• Westpac is a key financier on all the PARF deals, and is proving itself as the go to bank for financing renewable energy
projects
• The Fund currently intends to develop, own and manage approximately 1,000 megawatts of large scale renewable energy
infrastructure assets. In New South Wales, the Fund has solar plants already in operation at Nyngan and Broken Hill and
the Silverton Wind Farm is currently under construction. Its most recent addition is the 453 megawatts Coopers Gap Wind
Farm development at Cooranga North in Queensland
AGL Partnership – Wind Farms1 and PV Solar Plants Queensland / New South Wales, Australia
Westpac Group Fixed Income Presentation I November 2017 I Euro Climate Bond Roadshow
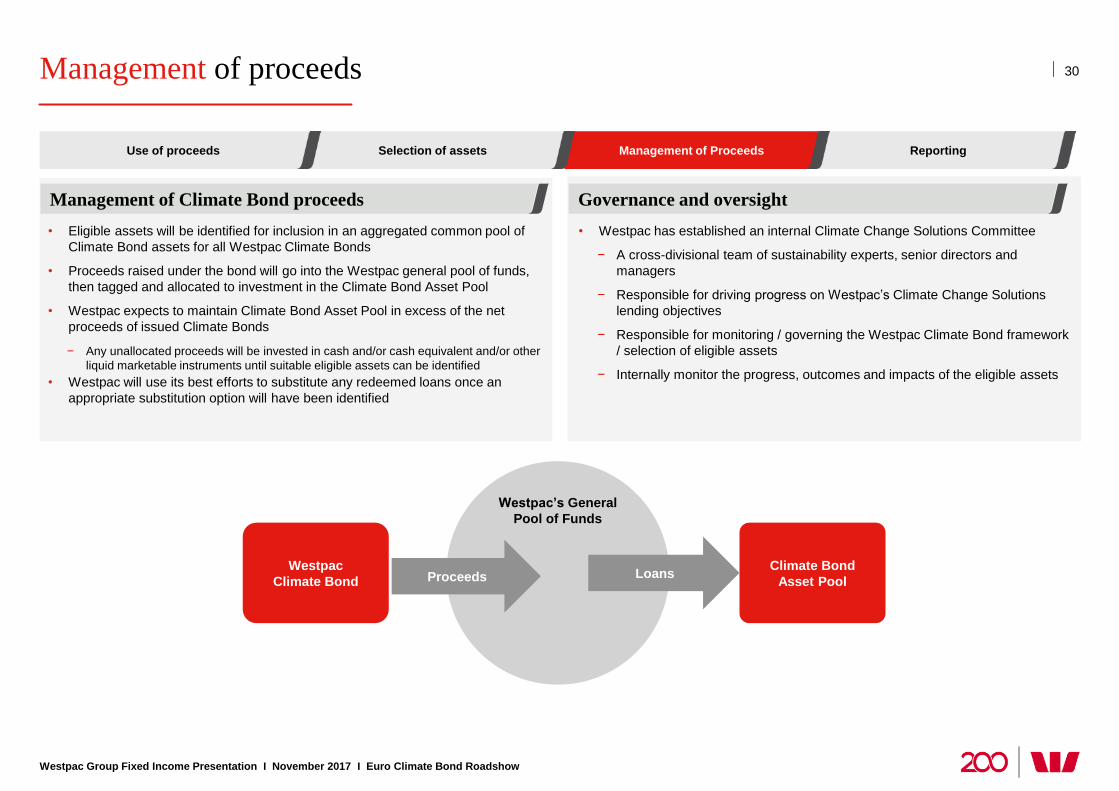
FONT SIZES
IDP TEMPLATE Charts: 10pt │Tables: 12pt │ Text boxes: 12pt │ Text box headings: 14pt
R73
G87
B97
R228
G26
B18
R175
G38
B22
R73
G19
B56
R147
G147
B147
R84
G49
B78
R59
G12
B44
R139
G15
B9
R104
G9
B6
R44
G9
B33
R120
G120
B120
R42
G52
B58
Below is the chart colour sequence. If your chart has more than 12 series‘ you will need to manually colour the additional series.
Westpac Red,
used as the HIGHLIGHT colour
LINES AND ARROWS
Lines are solid black or red, 1.5pt
Arrows are block style to fit text inside, see
‘pullout boxes and arrows’ elements slide
Body – 12pt Arial Regular sentence case
• Bullet – 12pt Arial Regular
Second Bullet – 12pt Arial Regular
Heading – 14pt Times New Roman Bold Note – 10pt Arial Regular
Text boxes have 0.0cm margin on all sides
These are your 5 levels of styles.
To move through the different styles, select the text and press
TAB. To return to the previous style, press SHIFT + TAB.
If you are on a blank line, use the Increase or Decrease Indent
buttons on the Home tab
Chart heading text boxes have 0.25cm margin on left
All text is black. No grey text
Use the shapes supplied in the ‘Editable Elements’ section.
Never skew the shape. Resize proportionally in order to keep the
angles of the curves on each side.
To create a longer wave shape, resize proportionally and join
multiple shapes together with aligning and grouping.
E.g. these:
Become:
TEXT
SHAPES
GRID
To show the grid, right click the slide and
select ‘Grids and Guidelines’ > ‘Guides”
Subheading in charts is 10pt bold
Text in charts is 10pt TABLES
Headings 12pt bold all CAPS
Heading divider line 1.5pt red
All other horizontal lines .75pt grey
Total line same as heading
All text 12pt where possible, reduced
where required to a minimum of 8pt
CHART HEADINGS
The heading box should sit 0.2cm indented from
the top and right side of the chart background box.
1 line heading box = 0.8cm height
2 line heading box = 1.2cm height
Height must remain consistent, width will vary.
Most layouts use a one line heading box, you can
manually paste a two line heading box over this
area. Select from the pre-made options on ‘chart
title text boxes’ slide in the ‘Editable Elements’
section.
NOTE: All content placeholders are adaptable. If a placeholder already contains (for example) a bar chart, this
can be deleted to insert a table, text, image or other content. The template is very flexible. There are a lot of
layout options provided, manipulate them as needed to suit your content but if it’s not looking right, you can
always ‘Reset’ the slide to revert back to the templated layout.
Guides
Notes that are specific to a certain
layout will be placed here
R77
G77
B79
Westpac Grey,
not used in charts
Text inside
13.80 4.80 4.40 0.20 0.20 4.40 4.80 13.80
8.40
7.00
0.40
0.80
8.20
10.00
Divisional colours
Consumer
R228
G26
B18
WIB
R84
G49
B78
BTFG
R0
G175
B215
New Zealand
R175
G38
B22
Business
R139
G15
B9
Westpac primary colours
R177
G189
B197
R247
G161
B157
R251
G154
B144
R233
G172
B214
R212
G212
B212
R199
G160
B193
60% tint colours
Management of proceeds
Westpac Group Fixed Income Presentation I November 2017 I Euro Climate Bond Roadshow
• Eligible assets will be identified for inclusion in an aggregated common pool of
Climate Bond assets for all Westpac Climate Bonds
• Proceeds raised under the bond will go into the Westpac general pool of funds,
then tagged and allocated to investment in the Climate Bond Asset Pool
• Westpac expects to maintain Climate Bond Asset Pool in excess of the net
proceeds of issued Climate Bonds
− Any unallocated proceeds will be invested in cash and/or cash equivalent and/or other
liquid marketable instruments until suitable eligible assets can be identified
• Westpac will use its best efforts to substitute any redeemed loans once an
appropriate substitution option will have been identified
• Westpac has established an internal Climate Change Solutions Committee
− A cross-divisional team of sustainability experts, senior directors and
managers
− Responsible for driving progress on Westpac’s Climate Change Solutions
lending objectives
− Responsible for monitoring / governing the Westpac Climate Bond framework
/ selection of eligible assets
− Internally monitor the progress, outcomes and impacts of the eligible assets
Westpac
Climate Bond
Climate Bond
Asset Pool
Westpac’s General
Pool of Funds
Proceeds Loans
Management of Climate Bond proceeds Governance and oversight
30
Use of proceeds Management of Proceeds Selection of assets Reporting

FONT SIZES
IDP TEMPLATE Charts: 10pt │Tables: 12pt │ Text boxes: 12pt │ Text box headings: 14pt
R73
G87
B97
R228
G26
B18
R175
G38
B22
R73
G19
B56
R147
G147
B147
R84
G49
B78
R59
G12
B44
R139
G15
B9
R104
G9
B6
R44
G9
B33
R120
G120
B120
R42
G52
B58
Below is the chart colour sequence. If your chart has more than 12 series‘ you will need to manually colour the additional series.
Westpac Red,
used as the HIGHLIGHT colour
LINES AND ARROWS
Lines are solid black or red, 1.5pt
Arrows are block style to fit text inside, see
‘pullout boxes and arrows’ elements slide
Body – 12pt Arial Regular sentence case
• Bullet – 12pt Arial Regular
Second Bullet – 12pt Arial Regular
Heading – 14pt Times New Roman Bold Note – 10pt Arial Regular
Text boxes have 0.0cm margin on all sides
These are your 5 levels of styles.
To move through the different styles, select the text and press
TAB. To return to the previous style, press SHIFT + TAB.
If you are on a blank line, use the Increase or Decrease Indent
buttons on the Home tab
Chart heading text boxes have 0.25cm margin on left
All text is black. No grey text
Use the shapes supplied in the ‘Editable Elements’ section.
Never skew the shape. Resize proportionally in order to keep the
angles of the curves on each side.
To create a longer wave shape, resize proportionally and join
multiple shapes together with aligning and grouping.
E.g. these:
Become:
TEXT
SHAPES
GRID
To show the grid, right click the slide and
select ‘Grids and Guidelines’ > ‘Guides”
Subheading in charts is 10pt bold
Text in charts is 10pt TABLES
Headings 12pt bold all CAPS
Heading divider line 1.5pt red
All other horizontal lines .75pt grey
Total line same as heading
All text 12pt where possible, reduced
where required to a minimum of 8pt
CHART HEADINGS
The heading box should sit 0.2cm indented from
the top and right side of the chart background box.
1 line heading box = 0.8cm height
2 line heading box = 1.2cm height
Height must remain consistent, width will vary.
Most layouts use a one line heading box, you can
manually paste a two line heading box over this
area. Select from the pre-made options on ‘chart
title text boxes’ slide in the ‘Editable Elements’
section.
NOTE: All content placeholders are adaptable. If a placeholder already contains (for example) a bar chart, this
can be deleted to insert a table, text, image or other content. The template is very flexible. There are a lot of
layout options provided, manipulate them as needed to suit your content but if it’s not looking right, you can
always ‘Reset’ the slide to revert back to the templated layout.
Guides
Notes that are specific to a certain
layout will be placed here
R77
G77
B79
Westpac Grey,
not used in charts
Text inside
13.80 4.80 4.40 0.20 0.20 4.40 4.80 13.80
8.40
7.00
0.40
0.80
8.20
10.00
Divisional colours
Consumer
R228
G26
B18
WIB
R84
G49
B78
BTFG
R0
G175
B215
New Zealand
R175
G38
B22
Business
R139
G15
B9
Westpac primary colours
R177
G189
B197
R247
G161
B157
R251
G154
B144
R233
G172
B214
R212
G212
B212
R199
G160
B193
60% tint colours
Reporting – Certification and Assurance 31
Westpac Group Fixed Income Presentation I November 2017 I Euro Climate Bond Roadshow
Independent Third Party Certification
• Westpac’s Climate Bonds have been certified by the Climate Bonds
Initiative to comply with the Climate Bonds Standard
• Westpac intends to obtain Climate Bond Certification from the Climate
Bonds Initiative for each Climate Bond issued
• Westpac’s existing Climate Bonds are Climate Bond Certified
• In alignment with CBS (V2.1) Westpac has requested programmatic
certification to allow continued regular issuance
• Each bond issuance will be individually certified
Independent Third Party Assurance
• Compliance with Climate Bonds Standard has been independently verified
by Ernst & Young
• EY provided assurance that Westpac’s bond issuance process for Climate
Bonds meets the project identification, project minimum criteria,
management of proceeds, and reporting requirements of the Climate Bonds
Standard, in all material respects
• In alignment with the broader Westpac Sustainability Group, auditing and
assurance process will now be conducted by PWC
• Assurance will be provided semi-annually
Does EY provide for each bond, when – pre / post? Certification is available for assets and projects that meet the requirements of the Climate Bonds Standard. In order to
receive the “Climate Bond Certified” stamp of approval, a prospective issuer of a Green or Climate Bond must appoint
an approved 3rd party verifier, who will provide a verification statement that the bond meets the Climate Bonds
Standard. The Climate Bonds Standard allows Certification of a bond prior to its issuance, enabling the issuer to use
the Climate Bond Certification Mark in marketing efforts and investor roadshows. The Climate Bonds Standards Board
(comprised of members representing $34 trillion of assets under management) confirms Climate Bond Certification
once the bond has issued and the proceeds have been allocated to projects and assets.
Not available at westpac.com.au/sustainability
Does each bond need a separate CBI certificate?
Use of proceeds Management of Proceeds Selection of assets Reporting

FONT SIZES
IDP TEMPLATE Charts: 10pt │Tables: 12pt │ Text boxes: 12pt │ Text box headings: 14pt
R73
G87
B97
R228
G26
B18
R175
G38
B22
R73
G19
B56
R147
G147
B147
R84
G49
B78
R59
G12
B44
R139
G15
B9
R104
G9
B6
R44
G9
B33
R120
G120
B120
R42
G52
B58
Below is the chart colour sequence. If your chart has more than 12 series‘ you will need to manually colour the additional series.
Westpac Red,
used as the HIGHLIGHT colour
LINES AND ARROWS
Lines are solid black or red, 1.5pt
Arrows are block style to fit text inside, see
‘pullout boxes and arrows’ elements slide
Body – 12pt Arial Regular sentence case
• Bullet – 12pt Arial Regular
Second Bullet – 12pt Arial Regular
Heading – 14pt Times New Roman Bold Note – 10pt Arial Regular
Text boxes have 0.0cm margin on all sides
These are your 5 levels of styles.
To move through the different styles, select the text and press
TAB. To return to the previous style, press SHIFT + TAB.
If you are on a blank line, use the Increase or Decrease Indent
buttons on the Home tab
Chart heading text boxes have 0.25cm margin on left
All text is black. No grey text
Use the shapes supplied in the ‘Editable Elements’ section.
Never skew the shape. Resize proportionally in order to keep the
angles of the curves on each side.
To create a longer wave shape, resize proportionally and join
multiple shapes together with aligning and grouping.
E.g. these:
Become:
TEXT
SHAPES
GRID
To show the grid, right click the slide and
select ‘Grids and Guidelines’ > ‘Guides”
Subheading in charts is 10pt bold
Text in charts is 10pt TABLES
Headings 12pt bold all CAPS
Heading divider line 1.5pt red
All other horizontal lines .75pt grey
Total line same as heading
All text 12pt where possible, reduced
where required to a minimum of 8pt
CHART HEADINGS
The heading box should sit 0.2cm indented from
the top and right side of the chart background box.
1 line heading box = 0.8cm height
2 line heading box = 1.2cm height
Height must remain consistent, width will vary.
Most layouts use a one line heading box, you can
manually paste a two line heading box over this
area. Select from the pre-made options on ‘chart
title text boxes’ slide in the ‘Editable Elements’
section.
NOTE: All content placeholders are adaptable. If a placeholder already contains (for example) a bar chart, this
can be deleted to insert a table, text, image or other content. The template is very flexible. There are a lot of
layout options provided, manipulate them as needed to suit your content but if it’s not looking right, you can
always ‘Reset’ the slide to revert back to the templated layout.
Guides
Notes that are specific to a certain
layout will be placed here
R77
G77
B79
Westpac Grey,
not used in charts
Text inside
13.80 4.80 4.40 0.20 0.20 4.40 4.80 13.80
8.40
7.00
0.40
0.80
8.20
10.00
Divisional colours
Consumer
R228
G26
B18
WIB
R84
G49
B78
BTFG
R0
G175
B215
New Zealand
R175
G38
B22
Business
R139
G15
B9
Westpac primary colours
R177
G189
B197
R247
G161
B157
R251
G154
B144
R233
G172
B214
R212
G212
B212
R199
G160
B193
60% tint colours
Reporting – Impact Reporting 32
1. www.ifc.org November 2015.
Westpac Group Fixed Income Presentation I November 2017 I Euro Climate Bond Roadshow
Reporting
• Westpac will provide an annual use of proceeds and impact report on a
single common pool of the Climate Bond assets for all Climate Bond
issuances
• The report will detail allocation of proceeds, total amount outstanding of
Climate Bonds, total amount unused proceeds and environmental impact of
the financed portfolio
• The report will be available each May on Westpac’s website:
https://www.westpac.com.au/about-westpac/investor-centre/fixed-income-
investors/Climate-Bonds/
• Reporting in line with the guidelines of the Green Bond Principles and
“Working Towards a Harmonized Framework for Green Bond Impact
Reporting” paper dated November 20151
• Assurance will be provided by the external auditor of the report
• Will be reviewed and approved by the Climate Change Solutions Committee
www.westpac.com.au/about-westpac/investor-centre/fixed-income-investors/ Use of proceeds Management of Proceeds Selection of assets Reporting

FONT SIZES
IDP TEMPLATE Charts: 10pt │Tables: 12pt │ Text boxes: 12pt │ Text box headings: 14pt
R73
G87
B97
R228
G26
B18
R175
G38
B22
R73
G19
B56
R147
G147
B147
R84
G49
B78
R59
G12
B44
R139
G15
B9
R104
G9
B6
R44
G9
B33
R120
G120
B120
R42
G52
B58
Below is the chart colour sequence. If your chart has more than 12 series‘ you will need to manually colour the additional series.
Westpac Red,
used as the HIGHLIGHT colour
LINES AND ARROWS
Lines are solid black or red, 1.5pt
Arrows are block style to fit text inside, see
‘pullout boxes and arrows’ elements slide
Body – 12pt Arial Regular sentence case
• Bullet – 12pt Arial Regular
Second Bullet – 12pt Arial Regular
Heading – 14pt Times New Roman Bold Note – 10pt Arial Regular
Text boxes have 0.0cm margin on all sides
These are your 5 levels of styles.
To move through the different styles, select the text and press
TAB. To return to the previous style, press SHIFT + TAB.
If you are on a blank line, use the Increase or Decrease Indent
buttons on the Home tab
Chart heading text boxes have 0.25cm margin on left
All text is black. No grey text
Use the shapes supplied in the ‘Editable Elements’ section.
Never skew the shape. Resize proportionally in order to keep the
angles of the curves on each side.
To create a longer wave shape, resize proportionally and join
multiple shapes together with aligning and grouping.
E.g. these:
Become:
TEXT
SHAPES
GRID
To show the grid, right click the slide and
select ‘Grids and Guidelines’ > ‘Guides”
Subheading in charts is 10pt bold
Text in charts is 10pt TABLES
Headings 12pt bold all CAPS
Heading divider line 1.5pt red
All other horizontal lines .75pt grey
Total line same as heading
All text 12pt where possible, reduced
where required to a minimum of 8pt
CHART HEADINGS
The heading box should sit 0.2cm indented from
the top and right side of the chart background box.
1 line heading box = 0.8cm height
2 line heading box = 1.2cm height
Height must remain consistent, width will vary.
Most layouts use a one line heading box, you can
manually paste a two line heading box over this
area. Select from the pre-made options on ‘chart
title text boxes’ slide in the ‘Editable Elements’
section.
NOTE: All content placeholders are adaptable. If a placeholder already contains (for example) a bar chart, this
can be deleted to insert a table, text, image or other content. The template is very flexible. There are a lot of
layout options provided, manipulate them as needed to suit your content but if it’s not looking right, you can
always ‘Reset’ the slide to revert back to the templated layout.
Guides
Notes that are specific to a certain
layout will be placed here
R77
G77
B79
Westpac Grey,
not used in charts
Text inside
13.80 4.80 4.40 0.20 0.20 4.40 4.80 13.80
8.40
7.00
0.40
0.80
8.20
10.00
Divisional colours
Consumer
R228
G26
B18
WIB
R84
G49
B78
BTFG
R0
G175
B215
New Zealand
R175
G38
B22
Business
R139
G15
B9
Westpac primary colours
R177
G189
B197
R247
G161
B157
R251
G154
B144
R233
G172
B214
R212
G212
B212
R199
G160
B193
60% tint colours
Reporting – Impact Report
As at 31 March 20171
Energy Efficiency
Signed
Amount
(TCE, A$m)
Share of
Portfolio
Financing
(%)
Eligibility for
Green Bonds
(%)
Net Lettable
Area
(sqm)
MW Capacity
(MW)
Average Climate
Bond Asset
Pool Lifetime
(Months)
Annual Energy
Generation
(MWh)
Annual GHG
emissions reduced/
avoided (tCO2e)
Better than
Benchmark
Index
Renewable
Energy Projects 566.56 46 100 810.08 34 2,643,264.10 2,347,218.52 -
Green Buildings 606.77 49 100 224,054 0 21 - - 8%
Other
(RE Infrastructure) 61.49 5 100 0 34 - - -
1,234.82 100 100 810.08 28 2,643,264.10 2,347,218.52 8%
Notes
1. Emission reductions (TC02e/MWH) is GHG intensity (National Energy Market GHG Cal 2016 of 0.888) * MWh Generated (annual). Intensity is sum of daily total emissions/energy.
2. Assumption for RE assets based on Cal 2016 Generation from either asset operating reports or AEMO dispatch data
3. Renewable energy financing is generally syndicated across several banks and Westpac’s share has been estimated at 25-30% in the numbers above
4. Green Building financing varies across assets and Westpac’s share has been estimated at 25-50% in the numbers above
33
• Renewable energy projects financed in part by Westpac Climate Bonds have, to date:
Generated 2.6 million megawatt hours (MWh) of clean energy (a megawatt hour is equivalent to the
amount of electricity used by about 330 homes during one hour)
Reduced annual greenhouse gas emissions (GHG) by 2.3 million tCO2e (tonne of carbon dioxide
equivalents)
• Green buildings financed in part by Westpac Climate Bonds have, on average, performed 8% better
than the state benchmark for energy efficiency using a ten year period
Environmental
Impacts
Westpac Group Fixed Income Presentation I November 2017 I Euro Climate Bond Roadshow
Use of proceeds Management of Proceeds Selection of assets Reporting
1. EY Audit. www.westpac.com.au/about-westpac/investor-centre/fixed-income-investors/Climate-Bonds/

FONT SIZES
IDP TEMPLATE Charts: 10pt │Tables: 12pt │ Text boxes: 12pt │ Text box headings: 14pt
R73
G87
B97
R228
G26
B18
R175
G38
B22
R73
G19
B56
R147
G147
B147
R84
G49
B78
R59
G12
B44
R139
G15
B9
R104
G9
B6
R44
G9
B33
R120
G120
B120
R42
G52
B58
Below is the chart colour sequence. If your chart has more than 12 series‘ you will need to manually colour the additional series.
Westpac Red,
used as the HIGHLIGHT colour
LINES AND ARROWS
Lines are solid black or red, 1.5pt
Arrows are block style to fit text inside, see
‘pullout boxes and arrows’ elements slide
Body – 12pt Arial Regular sentence case
• Bullet – 12pt Arial Regular
Second Bullet – 12pt Arial Regular
Heading – 14pt Times New Roman Bold Note – 10pt Arial Regular
Text boxes have 0.0cm margin on all sides
These are your 5 levels of styles.
To move through the different styles, select the text and press
TAB. To return to the previous style, press SHIFT + TAB.
If you are on a blank line, use the Increase or Decrease Indent
buttons on the Home tab
Chart heading text boxes have 0.25cm margin on left
All text is black. No grey text
Use the shapes supplied in the ‘Editable Elements’ section.
Never skew the shape. Resize proportionally in order to keep the
angles of the curves on each side.
To create a longer wave shape, resize proportionally and join
multiple shapes together with aligning and grouping.
E.g. these:
Become:
TEXT
SHAPES
GRID
To show the grid, right click the slide and
select ‘Grids and Guidelines’ > ‘Guides”
Subheading in charts is 10pt bold
Text in charts is 10pt TABLES
Headings 12pt bold all CAPS
Heading divider line 1.5pt red
All other horizontal lines .75pt grey
Total line same as heading
All text 12pt where possible, reduced
where required to a minimum of 8pt
CHART HEADINGS
The heading box should sit 0.2cm indented from
the top and right side of the chart background box.
1 line heading box = 0.8cm height
2 line heading box = 1.2cm height
Height must remain consistent, width will vary.
Most layouts use a one line heading box, you can
manually paste a two line heading box over this
area. Select from the pre-made options on ‘chart
title text boxes’ slide in the ‘Editable Elements’
section.
NOTE: All content placeholders are adaptable. If a placeholder already contains (for example) a bar chart, this
can be deleted to insert a table, text, image or other content. The template is very flexible. There are a lot of
layout options provided, manipulate them as needed to suit your content but if it’s not looking right, you can
always ‘Reset’ the slide to revert back to the templated layout.
Guides
Notes that are specific to a certain
layout will be placed here
R77
G77
B79
Westpac Grey,
not used in charts
Text inside
13.80 4.80 4.40 0.20 0.20 4.40 4.80 13.80
8.40
7.00
0.40
0.80
8.20
10.00
Divisional colours
Consumer
R228
G26
B18
WIB
R84
G49
B78
BTFG
R0
G175
B215
New Zealand
R175
G38
B22
Business
R139
G15
B9
Westpac primary colours
R177
G189
B197
R247
G161
B157
R251
G154
B144
R233
G172
B214
R212
G212
B212
R199
G160
B193
60% tint colours
More information | www.westpac.com.au/investorcentre
Joanne Dawson
Deputy Treasurer, Westpac Banking Corporation
+61 2 8204 2777
Alexander Bischoff
Executive Director, Global Funding
+61 2 8253 4314
Richard Salmon
Director, Global Funding
+61 2 8253 4314
Nick Cooper
Associate, Global Funding
+61 2 8253 4314
Jacqueline Boddy
Director, Debt Investor Relations
+61 2 8253 3133
Michael Chen (Sustainability)
Head of Sustainability, Institutional
+61 437 496 077
X - +
34
Contact our Global Funding team
Westpac Group Fixed Income Presentation I November 2017 I Euro Climate Bond Roadshow

NOTE:
T
NOTE:
All images are held in templated
image placeholders.
They can be changed by simply
selecting and deleting the image,
then selecting a new one.
Note that you will have to “send
to back” or “bring forward”
imagery as necessary.
To move the image around in the
placeholder, just select the
image, right click and select
CROP.
Select image and move as
necessary.
There is a semi-transparent
white shape that will need to
always be placed on top of the
very back image.
There are red placement lines at
the top of this slide should you
ever need to move and replace
the wedge.
200 years proudly supporting Australia
Appendix
Westpac Banking Corporation
ABN 33 007 457 141

FONT SIZES
IDP TEMPLATE Charts: 10pt │Tables: 12pt │ Text boxes: 12pt │ Text box headings: 14pt
R73
G87
B97
R228
G26
B18
R175
G38
B22
R73
G19
B56
R147
G147
B147
R84
G49
B78
R59
G12
B44
R139
G15
B9
R104
G9
B6
R44
G9
B33
R120
G120
B120
R42
G52
B58
Below is the chart colour sequence. If your chart has more than 12 series‘ you will need to manually colour the additional series.
Westpac Red,
used as the HIGHLIGHT colour
LINES AND ARROWS
Lines are solid black or red, 1.5pt
Arrows are block style to fit text inside, see
‘pullout boxes and arrows’ elements slide
Body – 12pt Arial Regular sentence case
• Bullet – 12pt Arial Regular
Second Bullet – 12pt Arial Regular
Heading – 14pt Times New Roman Bold Note – 10pt Arial Regular
Text boxes have 0.0cm margin on all sides
These are your 5 levels of styles.
To move through the different styles, select the text and press
TAB. To return to the previous style, press SHIFT + TAB.
If you are on a blank line, use the Increase or Decrease Indent
buttons on the Home tab
Chart heading text boxes have 0.25cm margin on left
All text is black. No grey text
Use the shapes supplied in the ‘Editable Elements’ section.
Never skew the shape. Resize proportionally in order to keep the
angles of the curves on each side.
To create a longer wave shape, resize proportionally and join
multiple shapes together with aligning and grouping.
E.g. these:
Become:
TEXT
SHAPES
GRID
To show the grid, right click the slide and
select ‘Grids and Guidelines’ > ‘Guides”
Subheading in charts is 10pt bold
Text in charts is 10pt TABLES
Headings 12pt bold all CAPS
Heading divider line 1.5pt red
All other horizontal lines .75pt grey
Total line same as heading
All text 12pt where possible, reduced
where required to a minimum of 8pt
CHART HEADINGS
The heading box should sit 0.2cm indented from
the top and right side of the chart background box.
1 line heading box = 0.8cm height
2 line heading box = 1.2cm height
Height must remain consistent, width will vary.
Most layouts use a one line heading box, you can
manually paste a two line heading box over this
area. Select from the pre-made options on ‘chart
title text boxes’ slide in the ‘Editable Elements’
section.
NOTE: All content placeholders are adaptable. If a placeholder already contains (for example) a bar chart, this
can be deleted to insert a table, text, image or other content. The template is very flexible. There are a lot of
layout options provided, manipulate them as needed to suit your content but if it’s not looking right, you can
always ‘Reset’ the slide to revert back to the templated layout.
Guides
Notes that are specific to a certain
layout will be placed here
R77
G77
B79
Westpac Grey,
not used in charts
Text inside
13.80 4.80 4.40 0.20 0.20 4.40 4.80 13.80
8.40
7.00
0.40
0.80
8.20
10.00
Divisional colours
Consumer
R228
G26
B18
WIB
R84
G49
B78
BTFG
R0
G175
B215
New Zealand
R175
G38
B22
Business
R139
G15
B9
Westpac primary colours
R177
G189
B197
R247
G161
B157
R251
G154
B144
R233
G172
B214
R212
G212
B212
R199
G160
B193
60% tint colours
References and Links
www.westpac.com.au/about-westpac/investor-centre/fixed-income-investors/Climate-Bonds/
www.westpac.com.au/about-westpac/sustainability/
www.westpac.com.au/about-westpac/sustainability/our-positions-and-perspectives/
www.westpac.com.au/about-westpac/sustainability/performance-reports/
www.nabers.gov.au/public/webpages/home.aspx