Embed Size (px)
Citation preview
Forschungsinstitut zur Zukunft der ArbeitInstitute for the Study of Labor
DI
SC
US
SI
ON
P
AP
ER
S
ER
IE
S
Euro, Crisis and Unemployment:Youth Patterns, Youth Policies?
IZA DP No. 9952
May 2016
Atanu GhoshrayJavier OrdóñezHector Sala
Euro, Crisis and Unemployment: Youth Patterns, Youth Policies?
Atanu Ghoshray Newcastle University Business School
Javier Ordóñez
Universitat Jaume I and UPAEP
Hector Sala
Universitat Autònoma de Barcelona and IZA
Discussion Paper No. 9952 May 2016
IZA
P.O. Box 7240 53072 Bonn
Germany
Phone: +49-228-3894-0 Fax: +49-228-3894-180
E-mail: [email protected]
Any opinions expressed here are those of the author(s) and not those of IZA. Research published in this series may include views on policy, but the institute itself takes no institutional policy positions. The IZA research network is committed to the IZA Guiding Principles of Research Integrity. The Institute for the Study of Labor (IZA) in Bonn is a local and virtual international research center and a place of communication between science, politics and business. IZA is an independent nonprofit organization supported by Deutsche Post Foundation. The center is associated with the University of Bonn and offers a stimulating research environment through its international network, workshops and conferences, data service, project support, research visits and doctoral program. IZA engages in (i) original and internationally competitive research in all fields of labor economics, (ii) development of policy concepts, and (iii) dissemination of research results and concepts to the interested public. IZA Discussion Papers often represent preliminary work and are circulated to encourage discussion. Citation of such a paper should account for its provisional character. A revised version may be available directly from the author.
IZA Discussion Paper No. 9952 May 2016
ABSTRACT
Euro, Crisis and Unemployment: Youth Patterns, Youth Policies?*
This paper examines the occurrence of structural breaks in European unemployment associated with major events experienced by the European economies at an institutional level: the creation of the European and Monetary Union (EMU) in 1999, and the Euro/financial crisis in 2008-2009, which was followed by a general and intensive reform process in the years afterwards. Beyond the well documented asymmetries across countries, we uncover different responses of adult and youth unemployment rates. While adult unemployment is more prone to experience structural breaks, youth unemployment is more sensitive to business cycle oscillations. This has been especially so in the recent crisis and calls for fine tuning policy measures specifically targeted to youth unemployed in bad times. One important implication of our findings is that generic labour market reforms are not effective enough to solve the youth unemployment problem across Europe. We point to educational policies that raise average qualifications and help school-to-work transitions as suitable complementary cures. JEL Classification: J64, O52, J08, F66 Keywords: unemployment, structural breaks, crisis, Eurozone, youth, education Corresponding author: Hector Sala Department d’Economia Aplicada Universitat Autònoma de Barcelona 08193 Bellaterra Spain E-mail: [email protected]
* The authors would like to thank Mohitosh Kejriwal for sharing his GAUSS codes. Javier Ordóñez is member of the INTECO research Group and gratefully acknowledges the support from the Generalitat Valenciana Project PROMETEOII/2014/053, MINECO project ECO2014-58991-C3-2-R and the UJI project P1-1B2014-17. Hector Sala is grateful to the Spanish Ministry of Economy and Competitive-ness for financial support through grant ECO2012-13081. The usual disclaimer applies.
2
1. Introduction
The Global Financial Crisis has led to a significant increase in unemployment after a long
expansionary period. Aggregate unemployment in the European Union was 9.2 percent in
1999, moved down to 7.2 percent in 2007, and rose to 10.2 in 2014. In the euro area, it
decreased from 9.7 to 7.5 and then rose to 11.6 percent over the same years. Within the
European aggregates, however, there are wide differences in the unemployment behaviour
between countries.
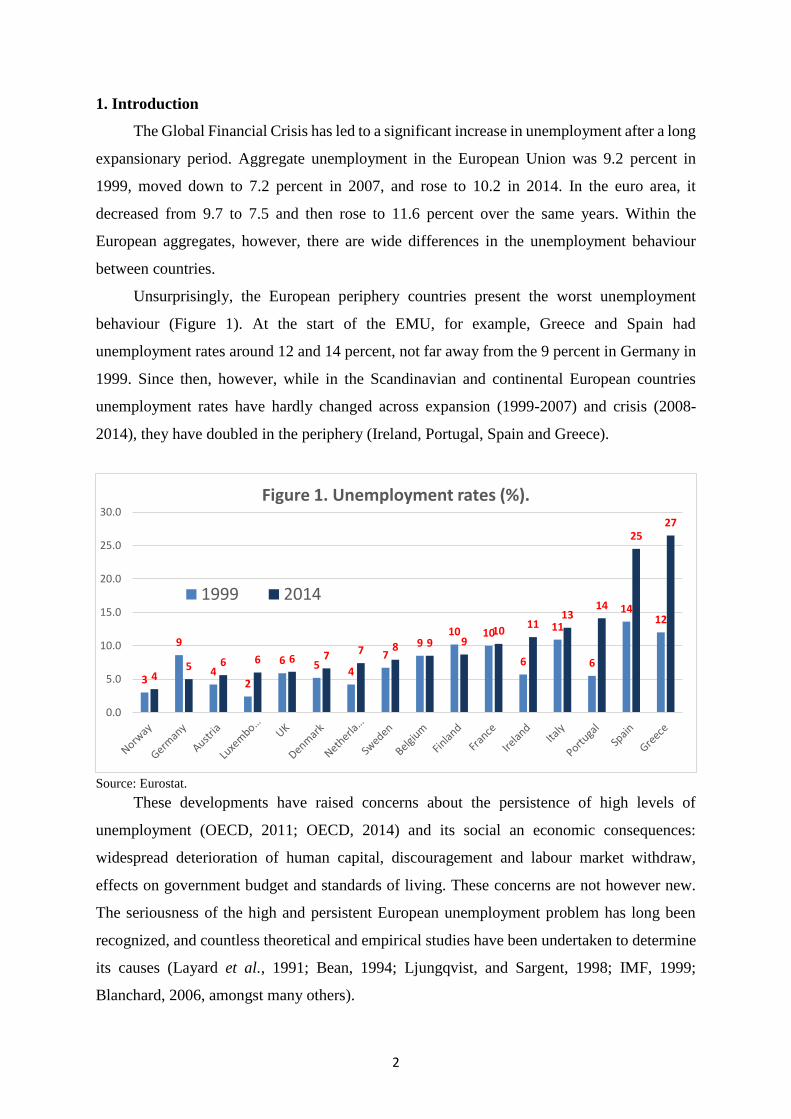
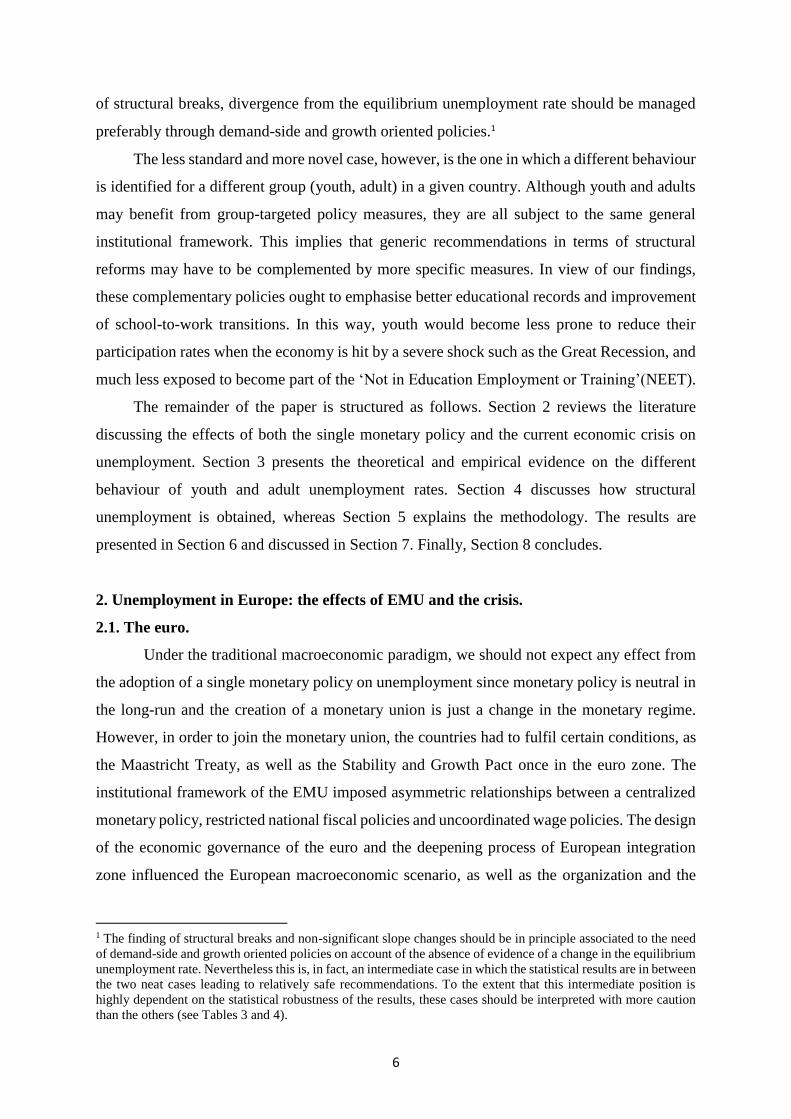
Unsurprisingly, the European periphery countries present the worst unemployment
behaviour (Figure 1). At the start of the EMU, for example, Greece and Spain had
unemployment rates around 12 and 14 percent, not far away from the 9 percent in Germany in
1999. Since then, however, while in the Scandinavian and continental European countries
unemployment rates have hardly changed across expansion (1999-2007) and crisis (2008-
2014), they have doubled in the periphery (Ireland, Portugal, Spain and Greece).
Source: Eurostat.
These developments have raised concerns about the persistence of high levels of
unemployment (OECD, 2011; OECD, 2014) and its social an economic consequences:
widespread deterioration of human capital, discouragement and labour market withdraw,
effects on government budget and standards of living. These concerns are not however new.
The seriousness of the high and persistent European unemployment problem has long been
recognized, and countless theoretical and empirical studies have been undertaken to determine
its causes (Layard et al., 1991; Bean, 1994; Ljungqvist, and Sargent, 1998; IMF, 1999;
Blanchard, 2006, amongst many others).
3
9
42
6 54
79
10 10
6
11
6
1412
45 6 6 6 7 7 8 9 9
1011
1314
2527
0.0
5.0
10.0
15.0
20.0
25.0
30.0Figure 1. Unemployment rates (%).
1999 2014
3
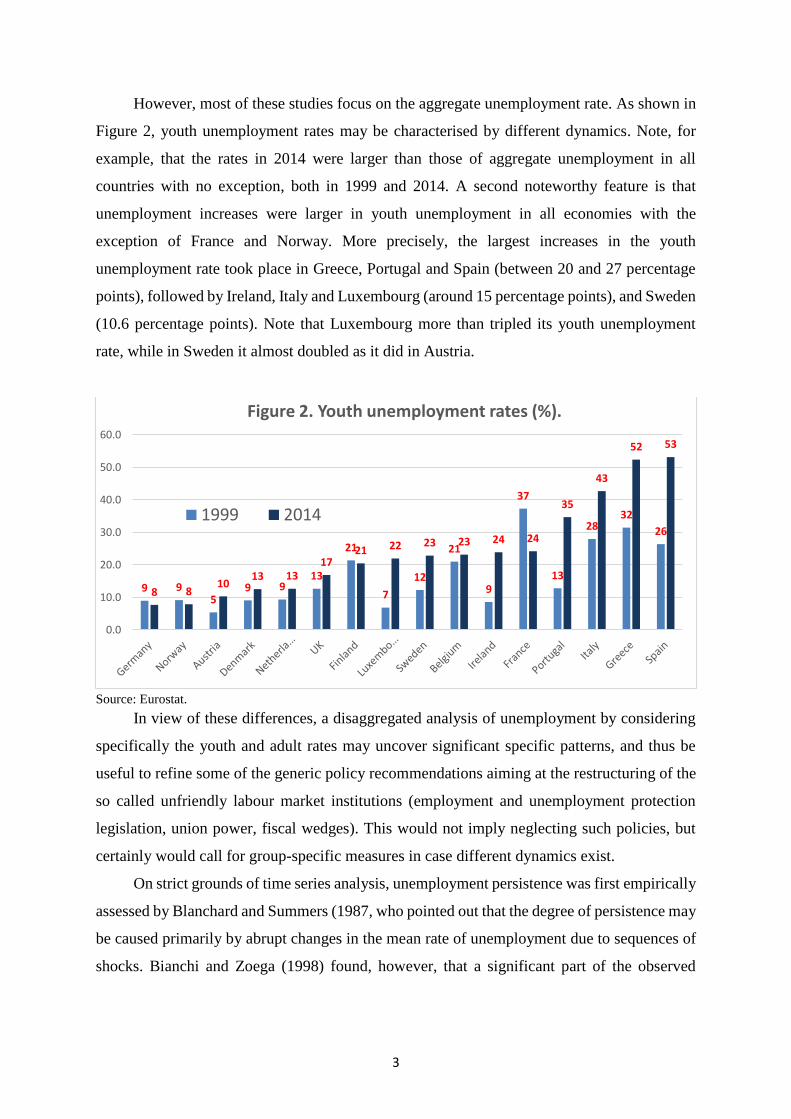
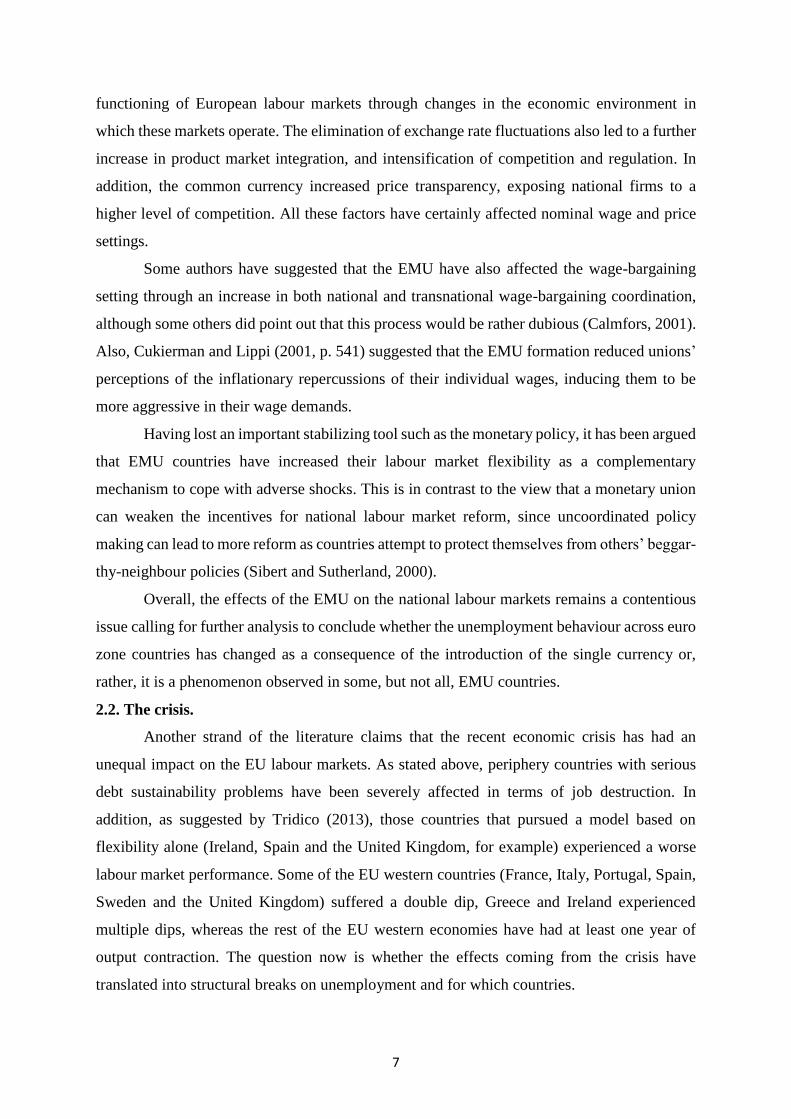
However, most of these studies focus on the aggregate unemployment rate. As shown in
Figure 2, youth unemployment rates may be characterised by different dynamics. Note, for
example, that the rates in 2014 were larger than those of aggregate unemployment in all
countries with no exception, both in 1999 and 2014. A second noteworthy feature is that
unemployment increases were larger in youth unemployment in all economies with the
exception of France and Norway. More precisely, the largest increases in the youth
unemployment rate took place in Greece, Portugal and Spain (between 20 and 27 percentage
points), followed by Ireland, Italy and Luxembourg (around 15 percentage points), and Sweden
(10.6 percentage points). Note that Luxembourg more than tripled its youth unemployment
rate, while in Sweden it almost doubled as it did in Austria.
Source: Eurostat.
In view of these differences, a disaggregated analysis of unemployment by considering
specifically the youth and adult rates may uncover significant specific patterns, and thus be
useful to refine some of the generic policy recommendations aiming at the restructuring of the
so called unfriendly labour market institutions (employment and unemployment protection
legislation, union power, fiscal wedges). This would not imply neglecting such policies, but
certainly would call for group-specific measures in case different dynamics exist.
On strict grounds of time series analysis, unemployment persistence was first empirically
assessed by Blanchard and Summers (1987, who pointed out that the degree of persistence may
be caused primarily by abrupt changes in the mean rate of unemployment due to sequences of
shocks. Bianchi and Zoega (1998) found, however, that a significant part of the observed
9 95
9 913
21
7
12
21
9
37
13
2832
26
8 810
13 1317
21 22 23 23 24 24
35
43
52 53
0.0
10.0
20.0
30.0
40.0
50.0
60.0
Figure 2. Youth unemployment rates (%).
1999 2014
4
persistence in unemployment is accounted for a few large shocks rather than a sequence of
small shocks all having a persistent effect.
Accordingly, this paper aims at identifying potential breaks in European unemployment
due to the occurrence of single definitive events: the settlement of a monetary union in 1999
and the Euro/financial crisis in 2008-2009, which was followed by an intensive and extensive
reform process. In this paper we seek to answer pertinent questions such as: Can the large
dispersion in unemployment rates across the euro zone area be attributed to the adoption of the
single currency? Or has the latter led instead to a more similar labour market performance? Has
the euro crisis contributed to an increase in structural unemployment? If so, for which
countries? Are there hysteresis effects on European unemployment emanating from the current
crisis?
The analysis of the occurrence of structural breaks in unemployment across euro area
countries can provide an answer to these questions: the fact that, for example, structural breaks
located around the introduction of the euro could appear in peripheral countries, but not in core
countries, could be interpreted as a signal that the adoption of the single currency had
asymmetric effects on the unemployment behaviour across euro zone countries. This situation
however cannot be necessarily interpreted as a divergence effect in unemployment arising from
the adoption of the euro. Rather, it may signal the fact that peripheral countries are catching-
up to the core countries level in terms of, for example, competitiveness and thereby, in terms
of labour market performance. To assess whether this is the case, we will analyse the trend
behaviour in structural unemployment before and after the estimated shocks. Similarly to the
introduction of the euro, the analysis of structural breaks can help to determine whether, as a
consequence of the crisis, structural unemployment in European countries has increased. The
larger the increase in structural unemployment, the higher will be the probability of having a
new episode of high and persistent unemployment in Europe. From a policy point of view, the
analysis of structural breaks is also important to test whether the European Employment
strategy and the Lisbon Agenda had any effect in European unemployment behaviour.
Perron (1988) pointed out that the correct specification of the trend is important when
considering whether a unit root is present in the data. This is particularly relevant, for if the
data contains a unit root then the method of least squares to estimate the trend will suffer from
size distortions. Alternatively, if the data is modelled as a difference stationary process when
it is actually a trend stationary process, then the test will be inefficient and lack power relative
to the trend stationary process (Perron and Yabu 2009a). The presence of structural breaks
further complicates the process, as neglecting a break in an otherwise trend stationary process
5
can lead to the conclusion of a spurious unit root in the data (Perron 1989), while ignoring a
trend break in a difference stationary process can lead the unit root test to the false conclusion
that the data is stationary (Leybourne et al., 1998). Therefore, when using the approach to test
for unit roots while allowing for structural breaks in the trend function of the underlying data,
the inference drawn from the structural break test on the level of the data depends on whether
a unit root exists, while the test based on differenced data can have poor properties when the
data contains a stationary component (Vogelsang,1998). This problem underscores the need to
employ structural break tests that allows one to be agnostic to the nature of serial correlation
in the data. To this end, we employ robust methods of Perron and Yabu (2009b) and Kejriwal
and Perron (2010) to determine structural break points. Once the breaks (if any) are identified,
we demarcate regimes based on the number of break points. We then proceed to estimate the
trends for the individual unemployment regimes identified by the break points. Where no
breaks are found, we estimate the trend over the entire sample. If we find a single structural
break, we estimate the trends for the two regimes demarcated by the break point. In the presence
of two breaks, three slope regimes are estimated.
The advantage of measuring the trends using the method of Perron and Yabu (2009a) is
that we can be completely agnostic about the underlying order of integration of the data series,
either for the individual regimes or the entire sample. Motivated by these considerations, this
paper makes a robust detection of structural breaks, robust estimation of the break locations
and the trend of the regimes identified by the estimated break dates.The euro crisis has also put
on the top of the European economic agenda the issue of high youth unemployment and the
need of implementing specific policy measures to cope with it. Despite the political consensus
about this need, some authors have suggested that “it is not at all clear that young people suffer
more from being unemployed than older people, or even disproportionately more than older
unemployed individuals. In particular, it is not clear that the much-publicised notion of a ‘lost
generation’ with permanent ‘scars’ is relevant only to the young generation” (Barslund and
Gross, 2013, p. 2). To shed some light on this debate, we will test for structural breaks in both
youth and adult structural unemployment to assess whether the trend behaviour after the crisis
is different between both groups of unemployed.
On this point, our empirical results entail a variety of policy implications. The finding of
structural breaks accompanied by statistically significant slope changes in the rate of
unemployment can be associated to changes in the equilibrium rate of unemployment. In that
case, the standard policy recipe takes the form of structural reforms to improve the institutional
design and, thereby, help the performance of the labour market. On the contrary, in the absence
6
of structural breaks, divergence from the equilibrium unemployment rate should be managed
preferably through demand-side and growth oriented policies.1
The less standard and more novel case, however, is the one in which a different behaviour
is identified for a different group (youth, adult) in a given country. Although youth and adults
may benefit from group-targeted policy measures, they are all subject to the same general
institutional framework. This implies that generic recommendations in terms of structural
reforms may have to be complemented by more specific measures. In view of our findings,
these complementary policies ought to emphasise better educational records and improvement
of school-to-work transitions. In this way, youth would become less prone to reduce their
participation rates when the economy is hit by a severe shock such as the Great Recession, and
much less exposed to become part of the ‘Not in Education Employment or Training’(NEET).
The remainder of the paper is structured as follows. Section 2 reviews the literature
discussing the effects of both the single monetary policy and the current economic crisis on
unemployment. Section 3 presents the theoretical and empirical evidence on the different
behaviour of youth and adult unemployment rates. Section 4 discusses how structural
unemployment is obtained, whereas Section 5 explains the methodology. The results are
presented in Section 6 and discussed in Section 7. Finally, Section 8 concludes.
2. Unemployment in Europe: the effects of EMU and the crisis.
2.1. The euro.
Under the traditional macroeconomic paradigm, we should not expect any effect from
the adoption of a single monetary policy on unemployment since monetary policy is neutral in
the long-run and the creation of a monetary union is just a change in the monetary regime.
However, in order to join the monetary union, the countries had to fulfil certain conditions, as
the Maastricht Treaty, as well as the Stability and Growth Pact once in the euro zone. The
institutional framework of the EMU imposed asymmetric relationships between a centralized
monetary policy, restricted national fiscal policies and uncoordinated wage policies. The design
of the economic governance of the euro and the deepening process of European integration
zone influenced the European macroeconomic scenario, as well as the organization and the
1 The finding of structural breaks and non-significant slope changes should be in principle associated to the need
of demand-side and growth oriented policies on account of the absence of evidence of a change in the equilibrium
unemployment rate. Nevertheless this is, in fact, an intermediate case in which the statistical results are in between
the two neat cases leading to relatively safe recommendations. To the extent that this intermediate position is
highly dependent on the statistical robustness of the results, these cases should be interpreted with more caution
than the others (see Tables 3 and 4).
7
functioning of European labour markets through changes in the economic environment in
which these markets operate. The elimination of exchange rate fluctuations also led to a further
increase in product market integration, and intensification of competition and regulation. In
addition, the common currency increased price transparency, exposing national firms to a
higher level of competition. All these factors have certainly affected nominal wage and price
settings.
Some authors have suggested that the EMU have also affected the wage-bargaining
setting through an increase in both national and transnational wage-bargaining coordination,
although some others did point out that this process would be rather dubious (Calmfors, 2001).
Also, Cukierman and Lippi (2001, p. 541) suggested that the EMU formation reduced unions’
perceptions of the inflationary repercussions of their individual wages, inducing them to be
more aggressive in their wage demands.
Having lost an important stabilizing tool such as the monetary policy, it has been argued
that EMU countries have increased their labour market flexibility as a complementary
mechanism to cope with adverse shocks. This is in contrast to the view that a monetary union
can weaken the incentives for national labour market reform, since uncoordinated policy
making can lead to more reform as countries attempt to protect themselves from others’ beggar-
thy-neighbour policies (Sibert and Sutherland, 2000).
Overall, the effects of the EMU on the national labour markets remains a contentious
issue calling for further analysis to conclude whether the unemployment behaviour across euro
zone countries has changed as a consequence of the introduction of the single currency or,
rather, it is a phenomenon observed in some, but not all, EMU countries.
2.2. The crisis.
Another strand of the literature claims that the recent economic crisis has had an
unequal impact on the EU labour markets. As stated above, periphery countries with serious
debt sustainability problems have been severely affected in terms of job destruction. In
addition, as suggested by Tridico (2013), those countries that pursued a model based on
flexibility alone (Ireland, Spain and the United Kingdom, for example) experienced a worse
labour market performance. Some of the EU western countries (France, Italy, Portugal, Spain,
Sweden and the United Kingdom) suffered a double dip, Greece and Ireland experienced
multiple dips, whereas the rest of the EU western economies have had at least one year of
output contraction. The question now is whether the effects coming from the crisis have
translated into structural breaks on unemployment and for which countries.
8
The financial nature of the crisis may have also an important role in the behaviour of
labour markets through the decline in output and investment associated with heightened
uncertainty, higher risk premia, and tighter lending standards (Hall, 2009). As suggested by
Calvo et al. (2012), financial crisis tend to be followed by jobless recoveries in the presence of
low inflation, and by significant lower real wage recoveries in the presence of high inflation.
Hysteresis effects in the presence of jobless recoveries can lead to an increase in both long-
term and structural unemployment. Boeri, et al. (2013) find that financial recessions amplify
labour market volatility and Okun’s elasticity over the business cycle.
Overall, the labour market impact of the crisis is still calling for attention, especially
with regard to its disaggregated impact by groups, and its youth bias.
3. Unemployment in Europe: youth versus adult unemployment.
Youth unemployment rates in the EU vary widely across countries and regions and have
been exacerbated during the crisis increasing from 15.5 percent in 2007 to 23.5 percent in 2013,
and being generally more than twice as high as the adult unemployment rates. The latter can
be partly explained because of a smaller youth labour force. However, official youth
unemployment rates are also likely to be an underestimate measure of the true problem since
the discouraged worker effect is higher for youngsters given that they can opt to continue their
education or simply live with their families. These options reduce robust search efforts if
finding a job is difficult, and can potentially lead to the so-called NEET.
Youth unemployment responds to the same two main drivers of (adult) unemployment,
as discussed in Section 2; that is, business cycles and the institutional setup as well as features
of the labour market. However, the impact of these factors can be different for youth and adult
unemployment. According to Ryan (2001), youth unemployment tends to be super-cyclical,
meaning that it is more sensitive to the business cycle than adult unemployment. IMF (2014)
reports that cyclical factors explain 50 percent of the changes in youth unemployment rate,
though 70 percent in stressed euro area countries. The sensitivity of youth unemployment to
the business cycle can be explained due to special features of youth employment, such as the
concentration of youth employment in cyclically sensitive industries and in small and medium-
size enterprises (see OECD, 2006; Scarpetta, et. al, 2010; European Commission, 2013).
Labour market characteristics can also have an impact on youth unemployment for the
following two reasons: First, youth population have lower levels of human capital, skills and
generic and job-specific work experience. As a consequence, youth productivity is lower and
they are more exposed to long-term unemployment, unstable and low-quality jobs, and perhaps
9
social exclusion (OECD, 2005). In the specific case of Europe, Pastore (2015) argues that the
youth experience gap is the key factor to understand why youth unemployment in Europe is
much higher. Secondly, the institutional framework is also relevant through the existence of
dual labour markets and temporary jobs (Bertola et al., 2007; Nunziata and Staffolani, 2007),
hiring and firing regulations, minimum wages relative to the median wage and firing costs
(Neumark and Wascher, 2004; Bernal-Verdugo, 2012), unionization (Bertola, et al., 2007), or
the school-to-work-transition (Ryan, 2001) and the university-to-work-transition (Sciulli and
Signorelli, 2011) institutions.
4. Data and computation of monthly structural unemployment.
The data employed in this study consists of monthly observations for overall, adult and
youth unemployment in Austria, Belgium, Denmark, Finland, France, Germany, Ireland, Italy,
Luxembourg, the Netherlands, Norway, Portugal, Spain, Sweden and the United Kingdom. The
data was obtained from Eurostat. The sample period runs from January 1993, the starting year
of the common market within the European Economic Community, to September 2013.
Actual unemployment rates are traditionally decomposed into ‘structural’ and ‘cyclical’
unemployment. Structural unemployment is the rate of unemployment that would be observed
if the economy were not hit by shocks (either demand or supply shocks), if inflation were held
at a low steady state, and the economy grew smoothly. Hence, structural unemployment reflects
a range of structural factors such as the efficiency of the labour market, the demographic
features of the labour force, or the labour market institutions, and is attained when the economy
comes to rest at potential output. Cyclical unemployment is the higher (lower) unemployment
due to a recession (or boom) and results therefore from shocks.
The distinction between structural and cyclical unemployment can be difficult.
Structural unemployment can rise because of sectoral changes leading to more mismatch, poor
recruiting or job-finding tools, adverse changes in demographic features of the labour force or
changes in labour market institutions, but also, due to prolonged periods of high cyclical
unemployment. The fact that a rise in actual rate of unemployment leads to an increase (perhaps
even an equal increase) in the underlying structural or equilibrium unemployment rate is
commonly known as unemployment hysteresis (Blanchard and Summers, 1987; Røed, 1997).
In the presence of hysteresis, increases in unemployment will have long-lasting effects, with
substantial costs in terms of higher inflation and lost output and income (O'Shaughnessy,
2011).
Following Shimer (2005), and subsequent studies, monthly structural unemployment in
10
this paper is obtained using the Hodrik-Prescott (HP) filter. This approach opens up the issue
of how the notion of structural unemployment can be best studied in an empirical sense. It is
well-known that a variety of related concepts --such as Natural Rate of Unemployment,
NAIRU, steady state, frictionless equilibrium-- coexist in the literature. A variety of methods,
ranging from the estimation of structural models to the filtering of the unemployment series
(using various techniques), have been employed to provide empirical estimations of these
concepts. Here we use the HP filter for the following two reasons.
First, the use of monthly data for 16 countries prevents considering standard institutional
controls used, for example, in five-years average panel data estimation. Even the use of
quarterly data would greatly reduce the availability of suitable controls and, thus, the possibility
of using alternative methods. However, given that we are interested in considering a
meaningful period (our sample starts at the inception of the European common market, the
integration stage before the EMU), using monthly data provides us with enough degrees of
freedom to conduct our analysis.
Secondly, a very popular strand of the literature using the Diamond-Mortensen-
Pissarides framework has proceeded in the same way allowing us to compare our findings. The
difference is that in such search-and-matching models, à la Shimer (2005) and beyond, it is the
structural component that is removed from the analysis (and the business cycle component that
is retained), while in this study we are interested in the structural part of the unemployment
rate series. Here it should be noted that the sensitivity of the results to the HP filter is greatly
reduced as it is the trend component that is being retained and analysed. Moreover, irrespective
of the method, we are interested in comparing the outcome of our time series analysis for the
adult and youth unemployment rates across 16 economies. Thus, comparability is granted
provided the same method is used for the different series, as it is obviously done here.
5. Econometric methodology.
To estimate trends in unemployment data for the various countries chosen in this study,
we consider the following model:
𝑈𝑁𝐸𝑀𝑃𝑡 = 𝛼 + 𝛽𝑡 + 𝑢𝑡, 𝑢𝑡 = 𝜓𝑢𝑡−1 + 𝜀𝑡, [1]
11
where 𝑈𝑁𝐸𝑀𝑃 denotes the unemployment rate, 𝑢𝑡 measures the deviation from trend, which
is described in this case as an AR(1) process2. The parameter 𝛽, which measures the trend, is
the hypothesis of interest. If the trend is significant, that is, we reject 𝐻0: (𝛽 = 0), then we
proceed to observe (i) whether the trend is negative, that is (𝛽 < 0), to conclude that the
unemployment rate has fallen over time, or (ii) whether the trend is positive, that is (𝛽 > 0),
to conclude that the real unemployment rate has increased over time.
Consider the model given by [1] where the error term is specified as an AR(1) model.
The weighted least squares (WLS) is calculated using the following:
𝜇𝑊 = ∑ �̂�𝑡�̂�𝑡−1 (∑ �̂�𝑡2 + 1 𝑇⁄ ∑ �̂�𝑡
2)⁄ [2]
where 𝜇𝑊 denotes the weighted least square estimate and 𝑇 denotes the total number of
observations in the sample. Following Roy and Fuller (2001), we obtain the unbiased estimates
�̂�𝑈𝐵, and following Andrews (1993) the median unbiased estimates �̂�𝑀𝑈 are calculated. Perron
and Yabu (2009a) then obtain the following super-efficient estimate as follows:
�̂�𝑈𝑆 = {�̂�𝑈𝐵 if |�̂�𝑈𝐵 − 1| > 𝑇−1 2⁄
1 if |�̂�𝑈𝐵 − 1| ≤ 𝑇−1 2⁄ [3]
or,
�̂�𝑀𝑆 = {�̂�𝑀𝑈 if |�̂�𝑀𝑈 − 1| > 𝑇−1 2⁄
1 if |�̂�𝑀𝑈 − 1| ≤ 𝑇−1 2⁄ [4]
where �̂�𝑈𝑆 and or �̂�𝑀𝑆 are the super-efficient estimates based on the unbiased estimate and the
median unbiased estimate respectively. The Feasible Generalised Least Square (FGLS)
procedure is applied to obtain the estimate of the trend parameter 𝛽 and construct the FGLS t–
statistic for the unbiased and median unbiased estimate; that is, 𝑡𝛽𝐹(𝑈𝐵) and
𝑡𝛽𝐹(𝑀𝑈) respectively.
However, if the errors in [1] are a higher order than AR(1), the estimate �̂� is obtained
from the following regression:
2 This assumption is relaxed in the following econometric analysis to allow for a general AR(p) process. To
keep the description of the econometric methodology simple, we assume an AR(1) process at this stage.
12
�̂�𝑡 = 𝜇�̂�𝑡−1 + ∑ 𝜍𝑖𝑘𝑖=1 Δ�̂�𝑡−𝑖 + 𝑒𝑡𝑘 [5]
The lag length 𝑘 is selected using the Modified Akaike Information Criterion (MAIC)
following Ng and Perron (2001) with 𝑘 allowing to be in the range [0, 12(𝑇 100⁄ )1 4⁄ ]. The
weighted symmetric least squares estimator �̂�𝑊 is constructed for an AR(p) process [see Fuller
(1996, p.415)]. The truncated estimate �̂�𝑀𝑈 (median unbiased estimator) or �̂�𝑈𝐵 (unbiased
estimator) is then applied to obtain the super-efficient unbiased estimate �̂�𝑈𝑆 or super-efficient
median unbiased estimate �̂�𝑀𝑆 using [3] or [4] respectively. Finally, the quasi–FGLS procedure
is applied to obtain the estimate of the trend parameter 𝛽 and construct the Robust Quasi-FGLS
t–statistic for the unbiased and median unbiased estimate, that is, 𝑡𝛽𝑅𝑄𝐹(𝑈𝐵) and 𝑡𝛽
𝑅𝑄𝐹(𝑀𝑈)
respectively. Perron and Yabu (2009a) show that for a similar sample size as chosen in this
study, the 𝑡𝛽𝑅𝑄𝐹(𝑀𝑈) has some liberal size distortions in comparison to the 𝑡𝛽
𝑅𝑄𝐹(𝑈𝐵). When
𝜓 = 1, 𝑡𝛽𝑅𝑄𝐹(𝑀𝑈) and 𝑡𝛽
𝑅𝑄𝐹(𝑈𝐵) have similar power; however, when 𝜓 departs from unity
𝑡𝛽𝑅𝑄𝐹(𝑀𝑈) has comparatively higher power. For brevity, in this paper we estimate the median
unbiased estimate only.3
So far, the economic literature have proposed and applied different unit root tests with
and without structural breaks. Usually we do not know in advance whether the time series are
affected by structural breaks, which conditions the analysis that can be conducted using unit
root tests. Thus, if breaks are not accounted for when in fact they have affected the time series,
the unit root tests can be biased towards the non-rejection of the null hypothesis of unit root.
On the other hand, allowing for inexistent breaks when computing the unit root tests can imply
reductions in the empirical power of the statistics. This issue has been recently addressed in
Perron and Yabu (2009b) allowing for breaks in the level and slope of the trend function given
by [1]. Perron and Yabu (2009b) find that the exponential functional of the Wald test has a
limiting distribution that is nearly the same for both I(0) and I(1) variables. Following Roy and
Fuller (2001), a biased corrected version of the least squares estimate of �̂� is carried out to
allow for good size and power properties in finite samples. Perron and Yabu (2009b) design a
test statistic—hereafter, the 𝐸𝑥𝑝 − 𝑊 break test statistic—that allows to test if there is a
3 We conducted the analysis and the unbiased estimates are broadly the same; the results are available
on request.
13
structural break affecting the time trend of the series regardless of whether the series is I(0) or
I(1). The test is as follows:
𝐸𝑥𝑝 − 𝑊 = 𝑙𝑛 [1
𝑇∑ 𝑒𝑥𝑝 (
1
2𝑊(𝜆))] [6]
where 𝜆 denotes the break fraction and 𝑊denotes the Wald statistic. In this paper, we have
computed the 𝐸𝑥𝑝 − 𝑊 break test statistic considering the model that allows for changes both
in the level and the slope of the time trend, which is the most general specification.
In the spirit of Perron and Yabu (2009b), a sequential procedure is proposed by Kejriwal
and Perron (2010) that allows one to obtain a consistent estimate of the true number of breaks
irrespective of whether the errors are I(1) or I(0). The first step is to conduct a test for no break
versus one break. Conditional on a rejection, the estimated break date is obtained by a global
minimization of the sum of squared residuals. The strategy proceeds by testing each of the two
segments (obtained using the estimated partition) for the presence of an additional break and
assessing whether the maximum of the tests is significant. Formally, the test of one versus two
breaks is expressed as:
𝐸𝑥𝑝𝑊(2|1) = 𝑚𝑎𝑥1≤𝑖≤2{𝐸𝑥𝑝𝑊(𝑖)} [7]
where 𝐸𝑥𝑝𝑊(𝑖) is the one break test in segment 𝑖. We conclude in favour of a model with
two breaks if 𝐸𝑥𝑝𝑊(2|1) is sufficiently large.
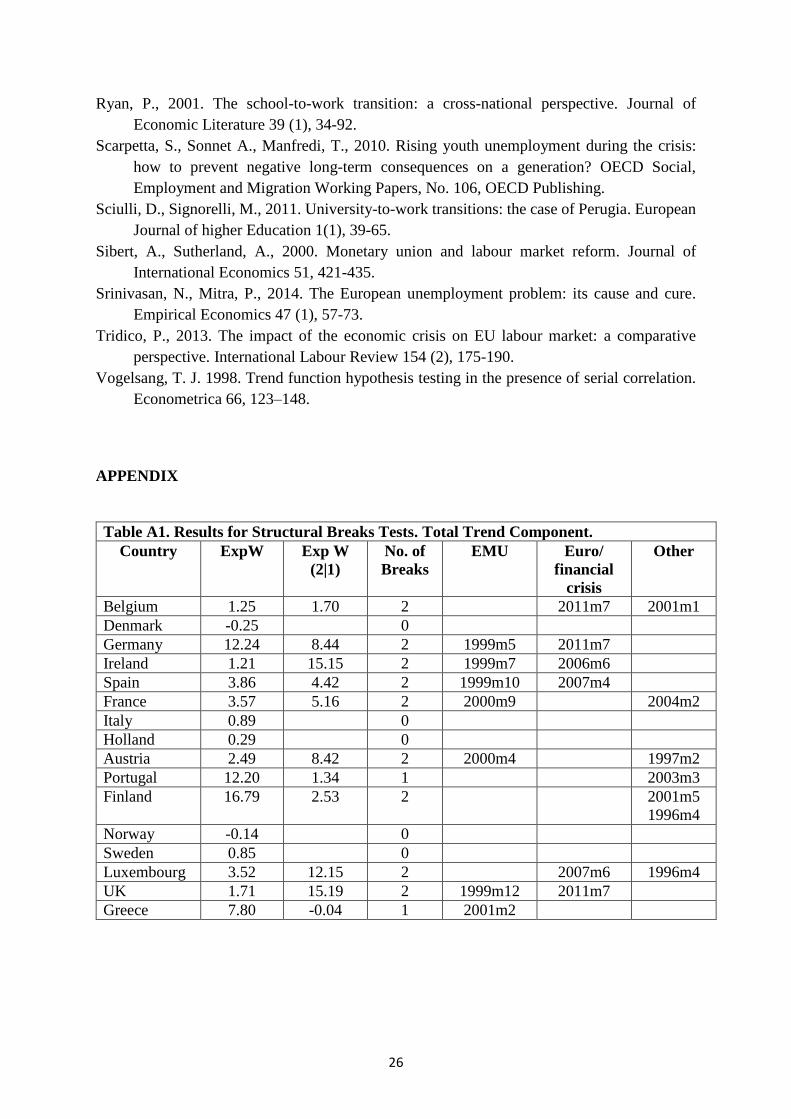
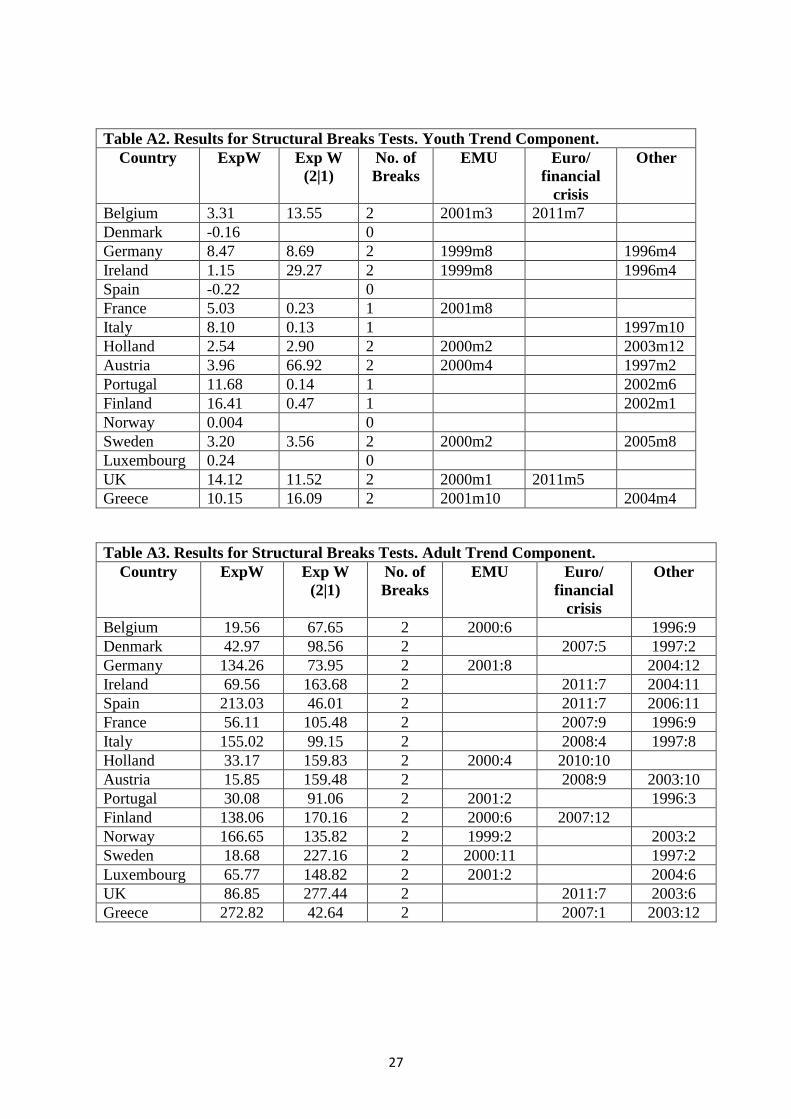
6. Empirical Results
The full set of empirical results obtained from applying this methodology are presented
in the Appendix. The first set of tables show the number of breaks and their corresponding
dates for the trend components of total unemployment (Table A1), youth unemployment (Table
A2), and adult unemployment (Table A3). In each of the Tables the exponential Wald test
(ExpW) statistics are calculated, first allowing for one break using the Perron and Yabu (2009b)
test. If a break is found we then adopt the sequential break test due to Kejriwal and Perron
(2010). The number of breaks are listed in the designated column in Tables A.1 to A.3 and the
preponderance of breaks is noted to fall around the introduction of the EMU or the occurrence
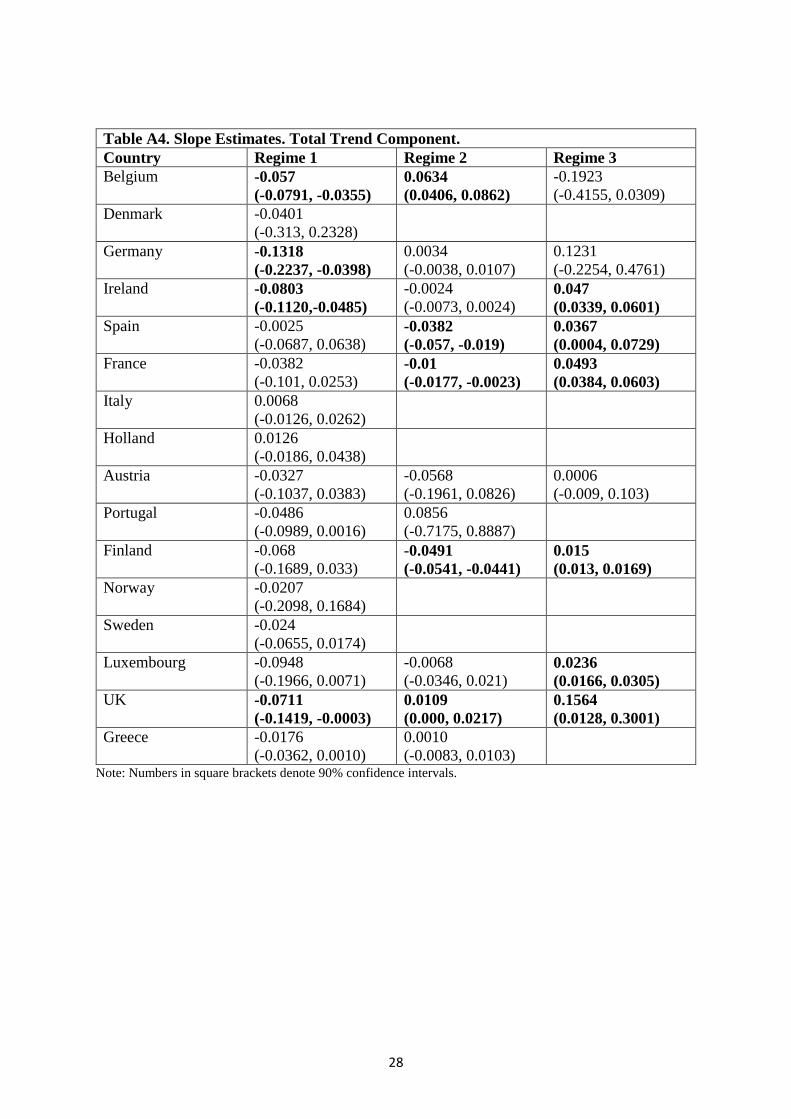
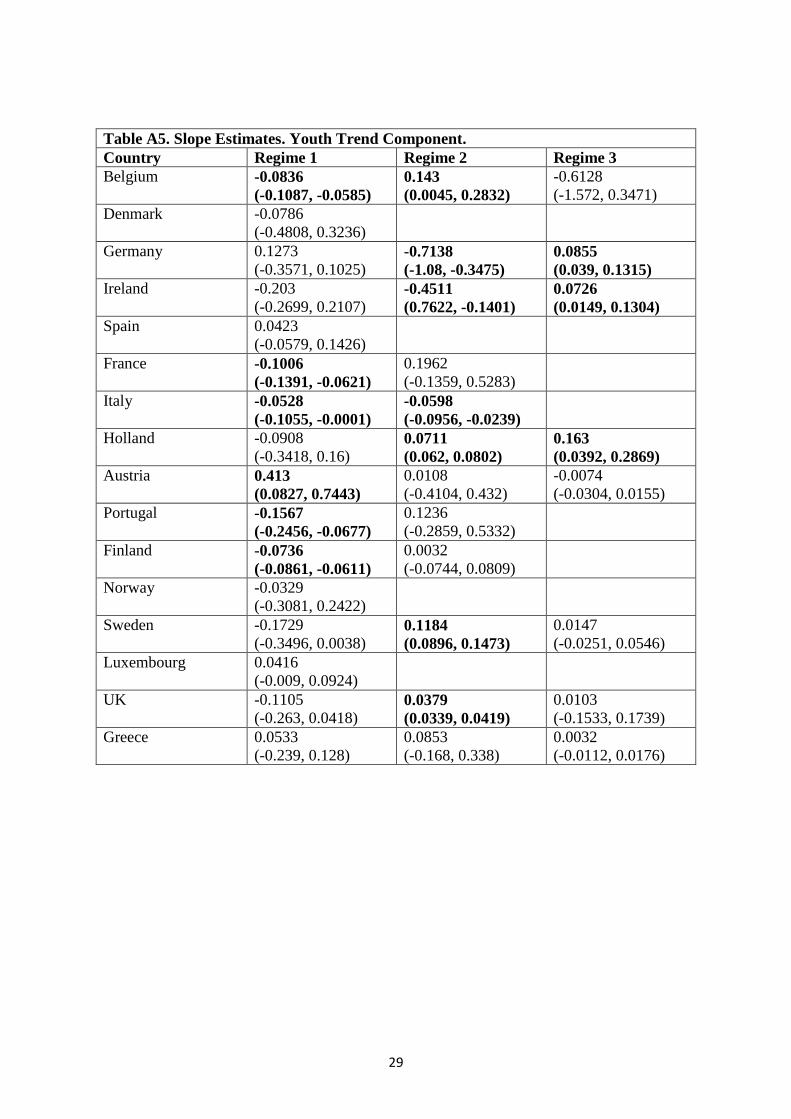
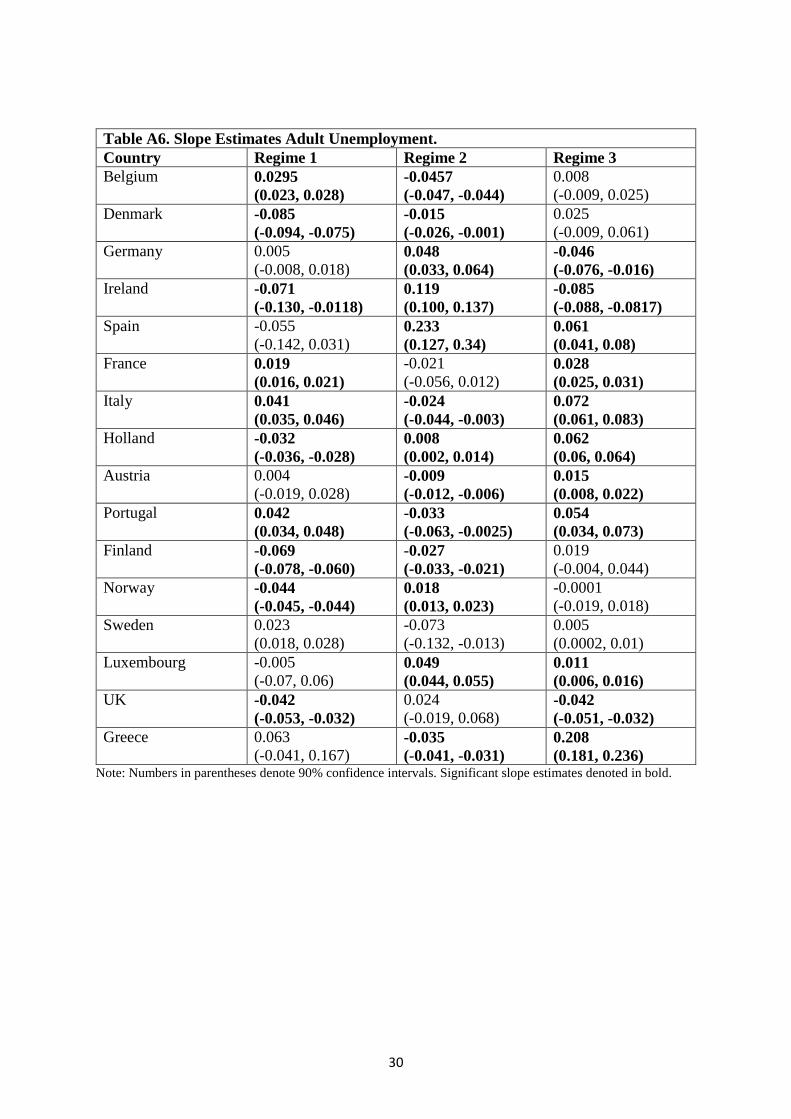
of the financial crisis. Tables A4 to A6 show, respectively, the slope changes in the individual
regimes that are demarcated by the structural breaks. What is interesting to note, is that the
14
results are varied with no common pattern. However, it is clear that the sample period
considered is characterised by broken trends that could be positive, negative or insignificant.
Given the density of this information, Table A7 provides a qualitative summary of the results
presented in Tables A1 to A6. The results obtained raise some significant findings as follows.
First, the analysis based on the aggregate unemployment rate fails to uncover significant
differences in the unemployment dynamics of the youth and adult unemployment rates.
Secondly, we find the existence of a similar number of structural breaks when adult and
youth unemployment rates are examined. Therefore, there is no evidence that the trend
component of the youth unemployment rate is more responsive than the adult one. In other
words, differences between aggregate and youth unemployment take the form of enhanced
volatilities in response to temporary shocks (as the literature has shown), but do not show up,
as a general feature across countries, in the form of different intensities in their response to
structural breaks.
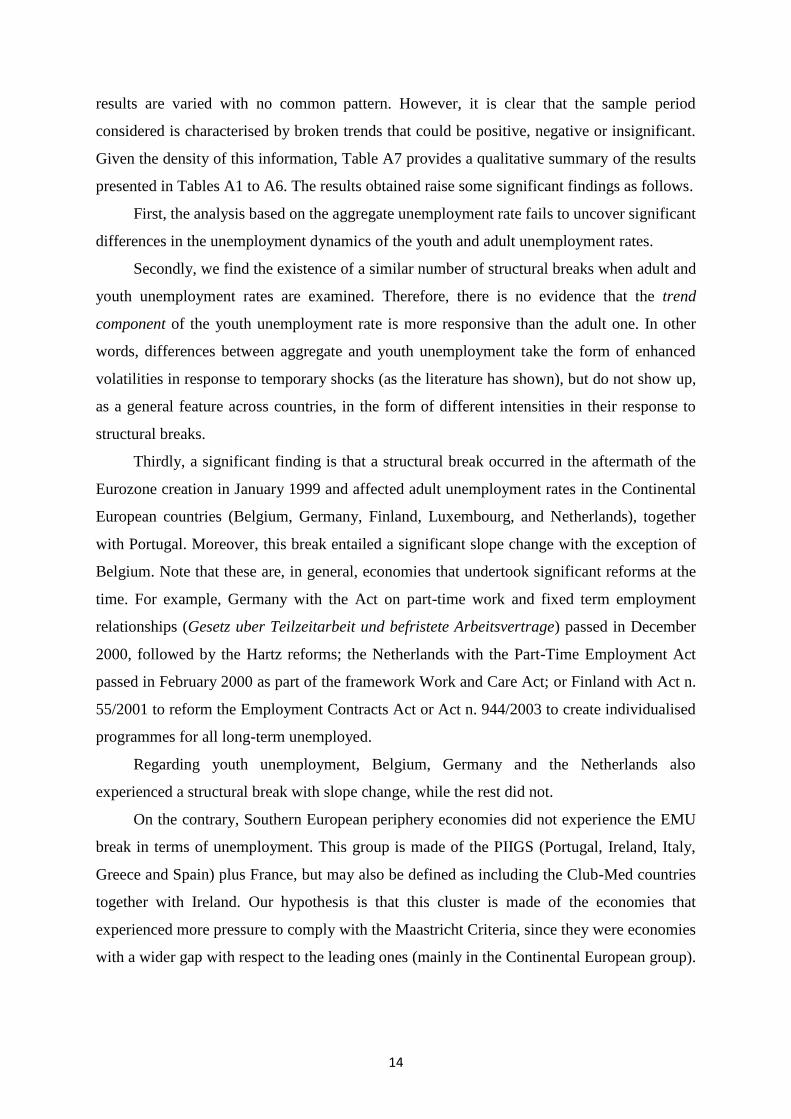
Thirdly, a significant finding is that a structural break occurred in the aftermath of the
Eurozone creation in January 1999 and affected adult unemployment rates in the Continental
European countries (Belgium, Germany, Finland, Luxembourg, and Netherlands), together
with Portugal. Moreover, this break entailed a significant slope change with the exception of
Belgium. Note that these are, in general, economies that undertook significant reforms at the
time. For example, Germany with the Act on part-time work and fixed term employment
relationships (Gesetz uber Teilzeitarbeit und befristete Arbeitsvertrage) passed in December
2000, followed by the Hartz reforms; the Netherlands with the Part-Time Employment Act
passed in February 2000 as part of the framework Work and Care Act; or Finland with Act n.
55/2001 to reform the Employment Contracts Act or Act n. 944/2003 to create individualised
programmes for all long-term unemployed.
Regarding youth unemployment, Belgium, Germany and the Netherlands also
experienced a structural break with slope change, while the rest did not.
On the contrary, Southern European periphery economies did not experience the EMU
break in terms of unemployment. This group is made of the PIIGS (Portugal, Ireland, Italy,
Greece and Spain) plus France, but may also be defined as including the Club-Med countries
together with Ireland. Our hypothesis is that this cluster is made of the economies that
experienced more pressure to comply with the Maastricht Criteria, since they were economies
with a wider gap with respect to the leading ones (mainly in the Continental European group).
15
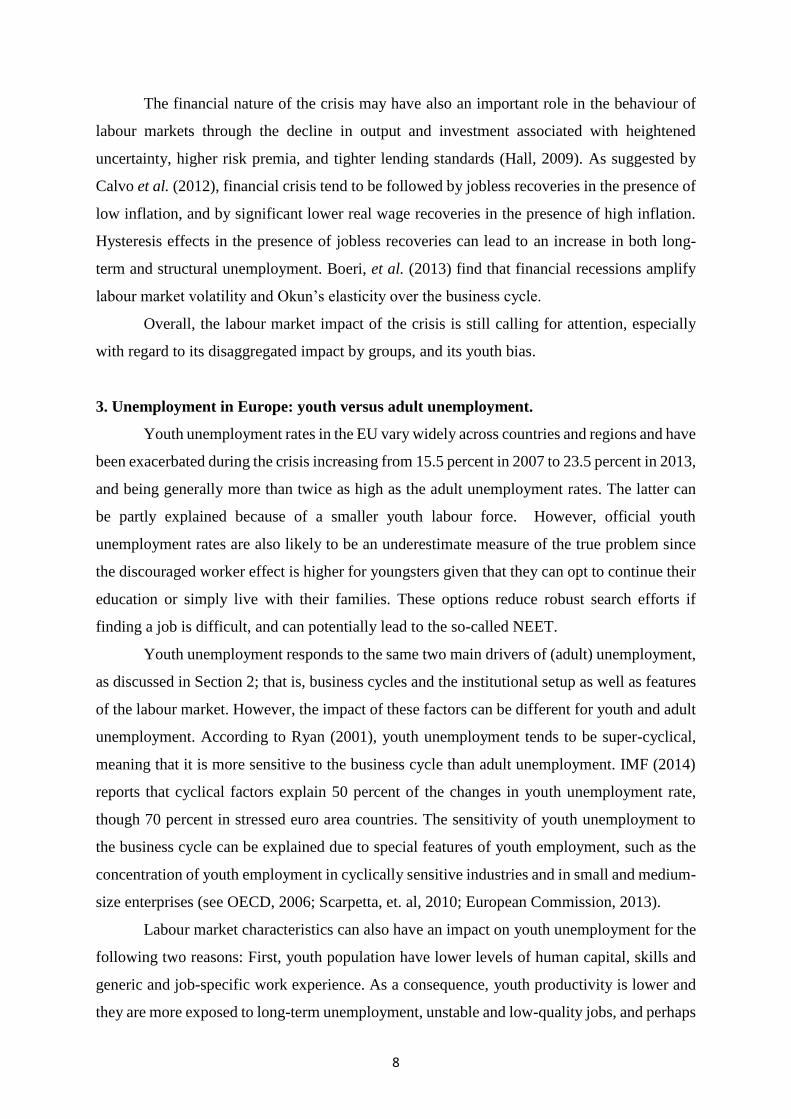
Figure 3. Summary of the EMU break.
EUROZONE COUNTRIES COUNTRIES NOT IN THE EUROZONE
STRUCTURAL BREAK +
SIGNIFICANT SLOPE CHANGE
STRUCTURAL BREAK BUT
NON-SIGNIFICANT SLOPE CHANGE
NO STRUCTURAL BREAK
STRUCTURAL BREAK +
SIGNIFICANT SLOPE CHANGE
STRUCTURAL BREAK BUT
NON-SIGNIFICANT SLOPE CHANGE
NO STRUCTURAL BREAK
ADULT
GERMANY, FINLAND,
LUXEMBOURG, NETHERLANDS,
PORTUGAL
BELGIUM
AUSTRIA, FRANCE, GREECE, IRELAND,
ITALY, SPAIN
NORWAY SWEDEN U.K.,
DENMARK
YOUTH
BELGIUM, GERMANY, IRELAND,
NETHERLANDS
AUSTRIA, FRANCE, GREECE
FINLAND, ITALY,
LUXEMBOURG, PORTUGAL,
SPAIN
SWEDEN, U.K.
NORWAY, DENMARK
16
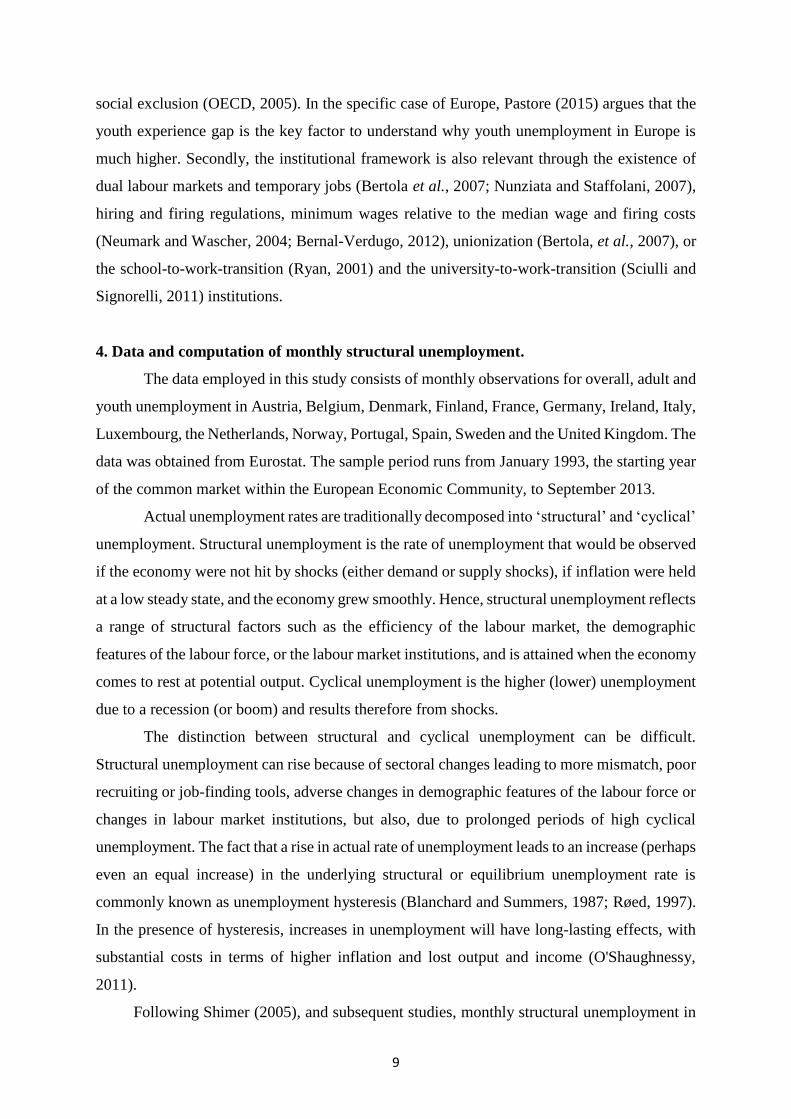
Figure 4. Summary of the Euro/Financial crisis break.
EUROZONE COUNTRIES COUNTRIES NOT IN THE EUROZONE
STRUCTURAL BREAK +
SIGNIFICANT SLOPE CHANGE
STRUCTURAL BREAK BUT
NON-SIGNIFICANT SLOPE CHANGE
NO STRUCTURAL BREAK
STRUCTURAL BREAK +
SIGNIFICANT SLOPE CHANGE
STRUCTURAL BREAK BUT
NON-SIGNIFICANT SLOPE CHANGE
NO STRUCTURAL BREAK
ADULT
AUSTRIA, FRANCE, GREECE, IRELAND,
ITALY, NETHERLANDS,
SPAIN
FINLAND BELGIUM, GERMANY,
LUXEMBOURG, PORTUGAL
U.K. DENMARK NORWAY, SWEDEN
YOUTH BELGIUM
AUSTRIA, BELGIUM, GERMANY, FINLAND, FRANCE, IRELAND,
ITALY, LUXEMBOURG, NETHERLANDS,
PORTUGAL, SPAIN
U.K. DENMARK, NORWAY, SWEDEN
17
Finally, Austria, which is not clustered with the Continental European economies by the
tests (neither when its youth or when its adult unemployment rates are examined), and
Luxembourg (clustered with the PIIGS when the youth unemployment rates are examined),
record poor figures for youth unemployment (Figure 2) between 1999 and 2014, even though
they appear to do rather well in terms of adult unemployment (Figure 1). During these years,
youth unemployment doubled in Austria (from 5% to 10%) while it more than tripled in
Luxembourg (from 7% to 22%). If we add the PIIGS, we have the set of economies where
youth population has suffered the most with respect to the unemployment problem in the Euro
years.
Our results may be compared with those in Romero-Ávila and Usabiaga (2008, 2009),
who study the main unemployment paradigms over the period 1976 to 2004 by employing
panel stationarity tests due to Camarero et al. (2006) and Carrion-i-Silvestre et al. (2005), that
allows for an unknown number of endogenous structural breaks. While their chosen time-
period does not match with our study, interestingly, the timing of the breaks around 1999 is
reflected in both studies. As noted by Romero-Ávila and Usabiaga (2009), their methodology
requires elimination of endpoints (due to a 15% trimming) preventing them from detecting
structural breaks associated with some institutional reforms aimed at making European labour
markets more flexible which took place after 1999.
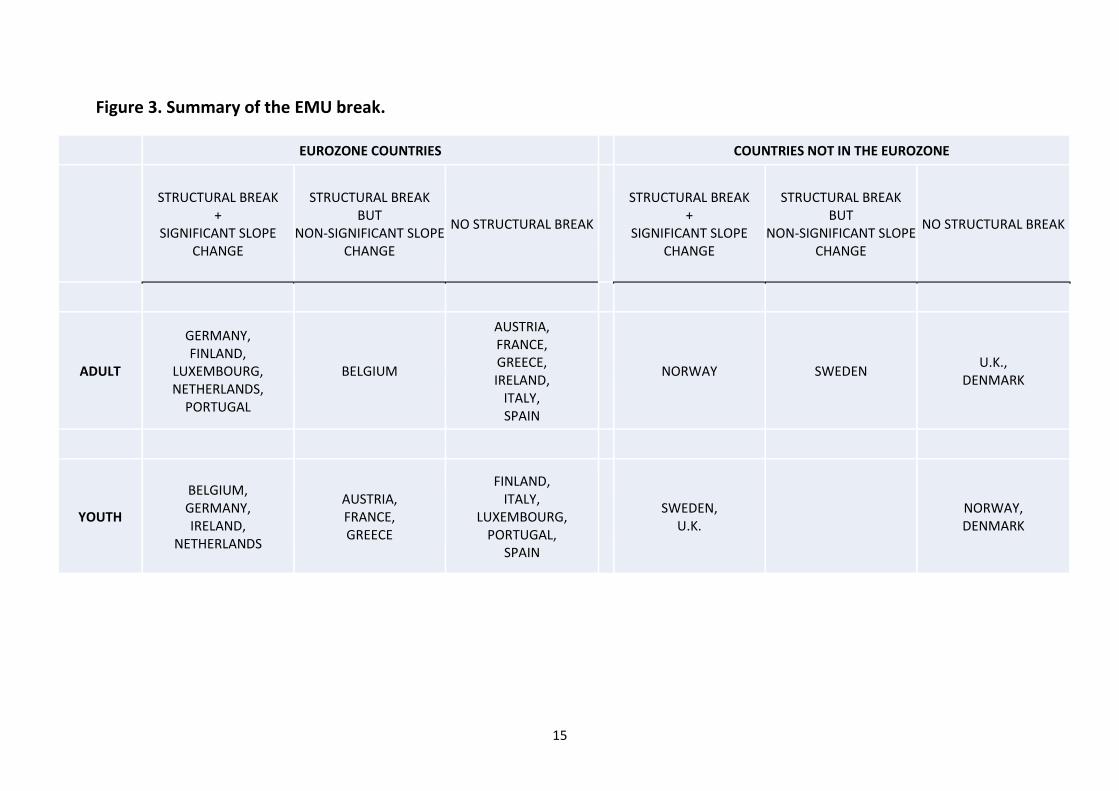
The second major structural break took place around 2008 with the onset of the
worldwide Financial Crisis and the subsequent Sovereign-Debt crisis in the Eurozone
countries.
This break, in contrast to the EMU one, is found to severely affect the Club-Med
countries, France and the PIIGS (with the exception of Portugal), together with Austria and the
Netherlands. This is the group of economies with a structural break affecting their adult
unemployment rates and causing significant slope changes in the corresponding new
unemployment regimes. On the contrary, Belgium, Germany and Luxembourg have not
experienced a regime change, while the one in Finland was not significant. The absence of
Netherlands in this group is explained by the fact that a relatively large part of the economic
shock was translated into unemployment (de Graaf-Zijl et al., 2015).
This result may be connected with the intensity of the Sovereign-Debt crisis. Together
with Portugal, whose labour market has always evolved remarkably well relative to the Spanish
one, which is very similar (see Blanchard and Jimeno, 1995), the Club-Med countries are the
ones that have suffered the Great Recession more intensively. Note that these are, precisely,
the economies that did not embark in institutional reforms at the start of the EMU period and
18
were, thus, less prepared to compete without the possibility of currency devaluations. In the
absence of such reforms and divergence in the degree of competitiveness (as indicated, for
example, by the evolution of the real unit labour costs as it has been shown by Ordóñez et al.,
2015), they became highly indebted economies; first at the private level, then at the public one,
so that the impact of the Great Recession was reflected, among other things, in new and higher
unemployment rate regimes.
The most salient result regarding this second major shock is related to the youth
unemployment rates, which show a complete absence of evidence that the Euro and Financial
crisis break has caused a regime change in this segment of the labour market. Although, at first
sight, it would be tempting to see this result as positive (to the extent that larger structural youth
unemployment rates seem to have been avoided), we claim that it brings truly bad news.
The reason of our pessimist assessment lies on the fact that although youth are not as
much caught into long-term unemployment as adults, they may end up in a worse situation.
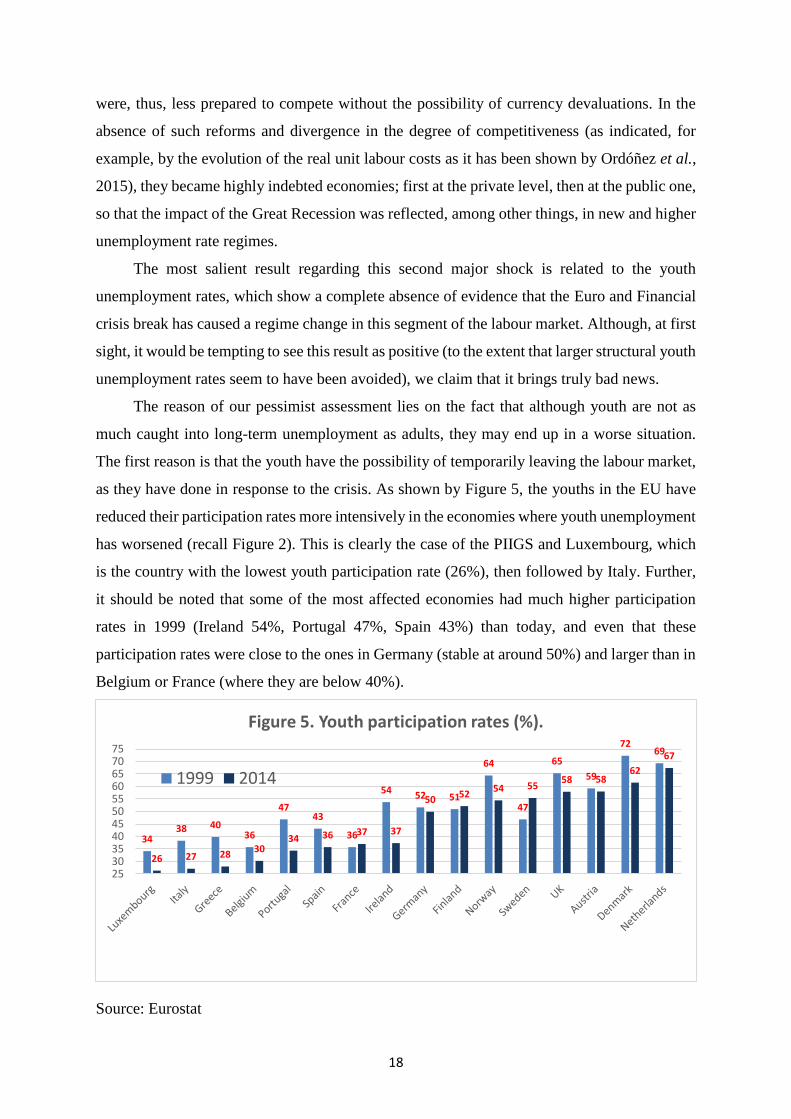
The first reason is that the youth have the possibility of temporarily leaving the labour market,
as they have done in response to the crisis. As shown by Figure 5, the youths in the EU have
reduced their participation rates more intensively in the economies where youth unemployment
has worsened (recall Figure 2). This is clearly the case of the PIIGS and Luxembourg, which
is the country with the lowest youth participation rate (26%), then followed by Italy. Further,
it should be noted that some of the most affected economies had much higher participation
rates in 1999 (Ireland 54%, Portugal 47%, Spain 43%) than today, and even that these
participation rates were close to the ones in Germany (stable at around 50%) and larger than in
Belgium or France (where they are below 40%).
Source: Eurostat
3438 40
36
4743
36
54 52 51
64
47
65
59
7269
26 27 2830
34 36 37 37
5052
54 5558 58
62
67
2530354045505560657075
Figure 5. Youth participation rates (%).
1999 2014
19
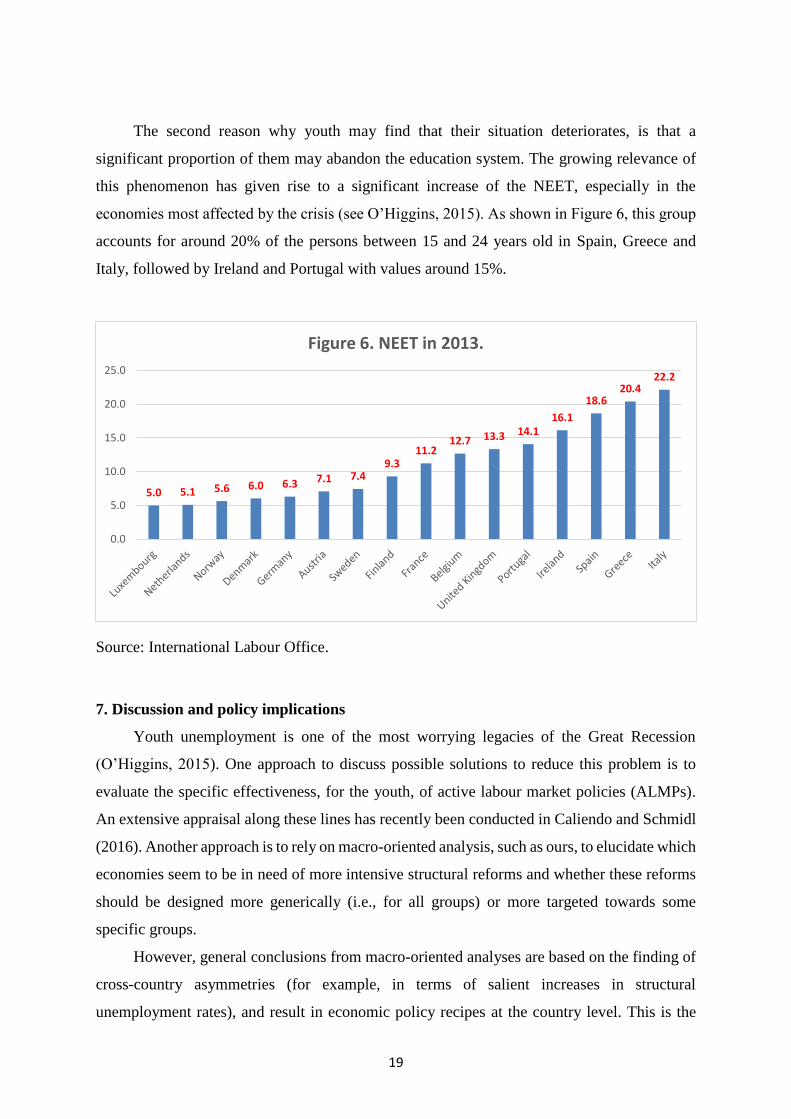
The second reason why youth may find that their situation deteriorates, is that a
significant proportion of them may abandon the education system. The growing relevance of
this phenomenon has given rise to a significant increase of the NEET, especially in the
economies most affected by the crisis (see O’Higgins, 2015). As shown in Figure 6, this group
accounts for around 20% of the persons between 15 and 24 years old in Spain, Greece and
Italy, followed by Ireland and Portugal with values around 15%.
Source: International Labour Office.
7. Discussion and policy implications
Youth unemployment is one of the most worrying legacies of the Great Recession
(O’Higgins, 2015). One approach to discuss possible solutions to reduce this problem is to
evaluate the specific effectiveness, for the youth, of active labour market policies (ALMPs).
An extensive appraisal along these lines has recently been conducted in Caliendo and Schmidl
(2016). Another approach is to rely on macro-oriented analysis, such as ours, to elucidate which
economies seem to be in need of more intensive structural reforms and whether these reforms
should be designed more generically (i.e., for all groups) or more targeted towards some
specific groups.
However, general conclusions from macro-oriented analyses are based on the finding of
cross-country asymmetries (for example, in terms of salient increases in structural
unemployment rates), and result in economic policy recipes at the country level. This is the
5.0 5.1 5.6 6.0 6.3 7.1 7.49.3
11.212.7 13.3 14.1
16.1
18.620.4
22.2
0.0
5.0
10.0
15.0
20.0
25.0
Figure 6. NEET in 2013.
20
case of the studies by Fosten and Ghoshray (2011) or Srinivasan and Mitra (2014). For a given
country (that is, in a situation in which labour market institutions and regulations are basically
shared by both youth and adults), in case of significant group asymmetries, general policy
recipes may be of a limited effectiveness. This is the case of the structural break related to the
Euro/Financial crisis, which caused a significant impact on structural adult unemployment in
some economies, but did not cause a (significant) structural break in any country in terms of
youth unemployment.
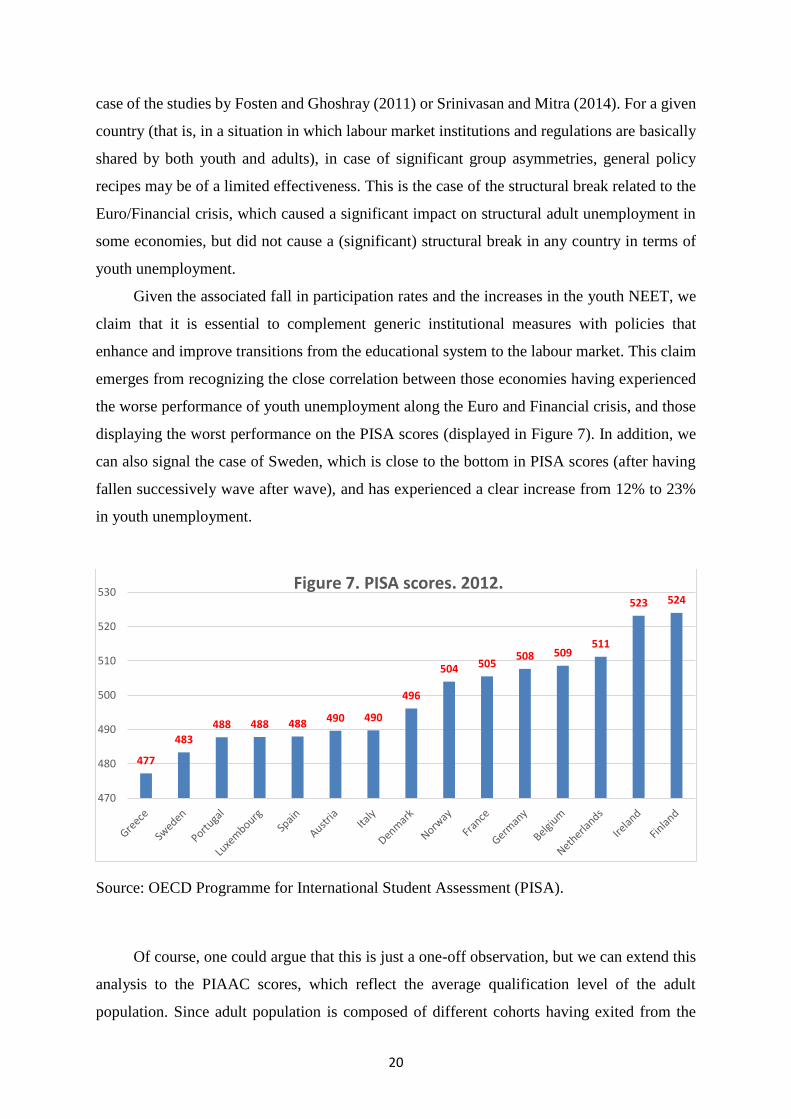
Given the associated fall in participation rates and the increases in the youth NEET, we
claim that it is essential to complement generic institutional measures with policies that
enhance and improve transitions from the educational system to the labour market. This claim
emerges from recognizing the close correlation between those economies having experienced
the worse performance of youth unemployment along the Euro and Financial crisis, and those
displaying the worst performance on the PISA scores (displayed in Figure 7). In addition, we
can also signal the case of Sweden, which is close to the bottom in PISA scores (after having
fallen successively wave after wave), and has experienced a clear increase from 12% to 23%
in youth unemployment.
Source: OECD Programme for International Student Assessment (PISA).
Of course, one could argue that this is just a one-off observation, but we can extend this
analysis to the PIAAC scores, which reflect the average qualification level of the adult
population. Since adult population is composed of different cohorts having exited from the
477
483
488 488 488 490 490
496
504 505508 509
511
523 524
470
480
490
500
510
520
530Figure 7. PISA scores. 2012.
21
educational system in different decades, a positive correlation in this case would probably
reflect a more structural relationship between the structural performance of the educational
system and the labour market resilience to shocks.
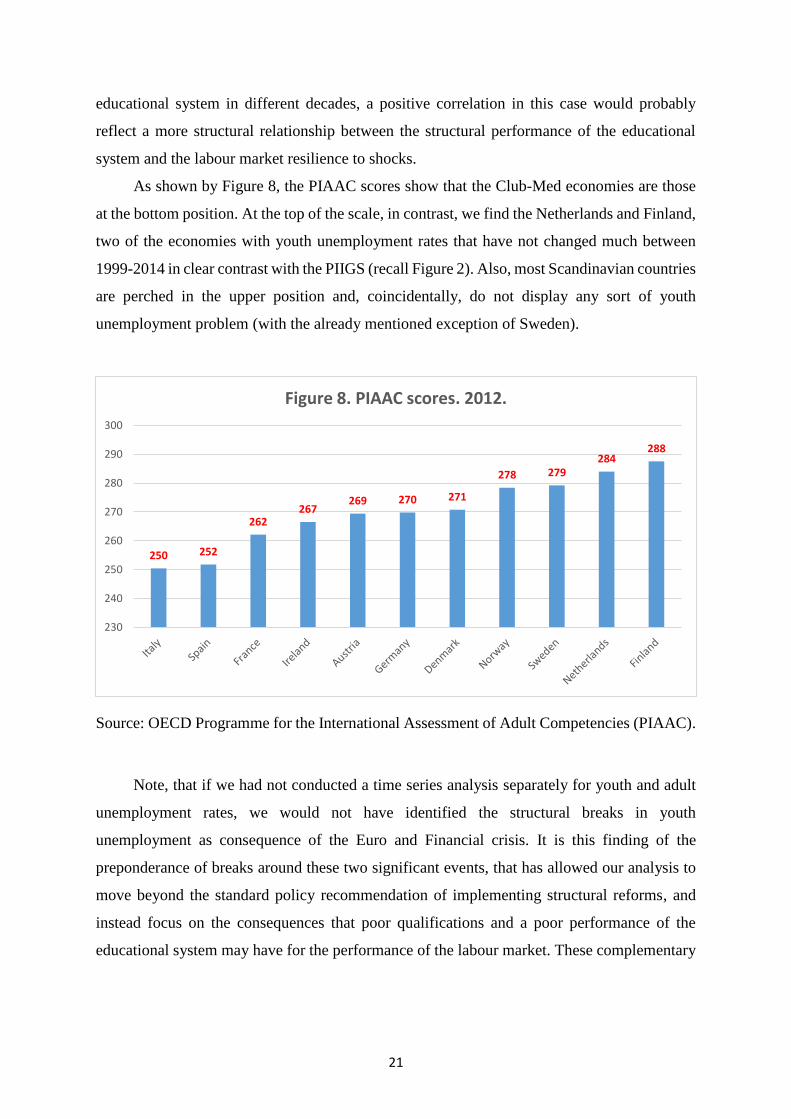
As shown by Figure 8, the PIAAC scores show that the Club-Med economies are those
at the bottom position. At the top of the scale, in contrast, we find the Netherlands and Finland,
two of the economies with youth unemployment rates that have not changed much between
1999-2014 in clear contrast with the PIIGS (recall Figure 2). Also, most Scandinavian countries
are perched in the upper position and, coincidentally, do not display any sort of youth
unemployment problem (with the already mentioned exception of Sweden).
Source: OECD Programme for the International Assessment of Adult Competencies (PIAAC).
Note, that if we had not conducted a time series analysis separately for youth and adult
unemployment rates, we would not have identified the structural breaks in youth
unemployment as consequence of the Euro and Financial crisis. It is this finding of the
preponderance of breaks around these two significant events, that has allowed our analysis to
move beyond the standard policy recommendation of implementing structural reforms, and
instead focus on the consequences that poor qualifications and a poor performance of the
educational system may have for the performance of the labour market. These complementary
250 252
262267
269 270 271
278 279284
288
230
240
250
260
270
280
290
300
Figure 8. PIAAC scores. 2012.
22
policies would help to surpass recession periods by minimizing the social and economic costs
of youth unemployment and protracted periods of moving out of education and training.4
Related to this discussion, and also connected to the age composition of the workers, the
long-term unemployment problem appears as a critical complementary issue. For example, the
Netherlands (whose adult unemployment rate appears together with the PIIGS in Table 4) has
faced worse long-term unemployment rates than its neighbours. As explained in de Graaf-Zijl
et al. (2015), 40% of these unemployed workers are over 50 years old. In contrast, in Denmark
(which in Table 4 is classified as not experiencing a significant structural break in adult
unemployment) most unemployment spells are short, and there are no worrying signs of long-
term unemployment (Andersen, 2015). Therefore, although youth unemployment is a critical
problem, we should not disregard the adverse effects of long-term unemployment on adult
population.
8. Conclusions
Aggregate unemployment hides significantly different behaviours in adult and youth
unemployment. As a consequence, specific attention needs to be devoted to these two
components of unemployment. This paper makes a concerted analysis to analyse these two
components separately for various EU countries. Novel methods are employed to detect
structural breaks and the preponderance of these breaks are associated to two major single-
event shocks occurred in Europe in recent times: the inception of the EMU in 1999 and the
Euro and Financial crisis that took place in the aftermath of the burst of the housing and
financial bubbles in 2008.
We find that the structural break associated to the EMU is limited to those economies
less affected by the Euro and Financial Crisis. This is in general the case for both adult and
youth unemployment rates. In contrast, the structural break associated to the Euro and the
Financial Crisis had greater impact on those economies with very poor aggregate labour market
performance such as Ireland, Italy, Greece and Spain. This underscores one of the main
conclusions of this study. Economies in the European periphery were to some extent inattentive
in preparing themselves for the new scenario brought by the EMU. They were active and
successful in securing nominal convergence ex-ante, but the lack of real convergence (for
4 Lack and/or shortage of data prevents us from conducting meaningful time series analysis on the causality
between indicators of educational performance and youth unemployment or youth labour force participation. A
panel data analysis would compensate the short time-series with cross-section observations; however, embarking
in such a complementary quantitative analysis exceeds the scope of this ‘stepping stone’ paper.
23
example, in competitiveness, as shown by Ordóñez et al., 2015) caused very different impacts
of the Great Recession on their labour markets.
Nevertheless, in general, youth unemployment rates did not experience significant
structural breaks across Europe as a result of the Euro and Financial crisis. This confirms the
well-known enhanced volatility of youth unemployment vis-à-vis adult unemployment, and
leads us to conclude that underlying this wider volatility there is the possibility, for youth, of
responding to shocks without experiencing shifts in structural unemployment. Lower
involvement in the labour market (falling participation rates), and lower involvement in
education activities (growing NEETs) would be alternative or complementary outcomes to the
shifts in structural unemployment experienced by the adult section.
We have also claimed that the relative behaviour of youth unemployment across
countries is highly associated to the relative performance of the educational system. Although
this is not new in the literature, we have uncovered this association as a potentially structural
phenomenon, since this seems to hold not only for the youth, but also for adult education. To
the extent that adult education involves several generations, this creates a persistent mechanism
by which poor educational levels end up affecting labour market performance in extenso.
Microeconomic studies have warned us on the social and economic risks of individuals leaving
the educational system at the early stages in their life. Here we complement this fact with an
additional warning that emerges from the long lasting effects of a poor educational system:
poor educational levels may harm extensively the performance of the labour market. That
underlines one of our major conclusions: the educational system is a crucial tool to help
restoring socially acceptable youth unemployment rates, which today remain stubbornly at an
average of 20% in the Eurozone. We believe this area deserves much more attention from a
macroeconomic point of view.
References
Andersen, T.M., 2015. The Danish flexicurity labour market during the Great Recession. De
Economist 163, 473-490.
Barslund, M, Gross, D. 2013. Unemployment is the scourge, not youth unemployment per se:
The misguided policy preoccupation with youth. CEPS Policy Briefs, Brussels: Centre
for European Policy Studies.
Bean, C.R. 1994. European unemployment: a survey. Journal of Economic Literature 32 (2),
573-619.
24
Bernal-Verdugo, L.E., Furceri, D., Guillaume, D., 2012. Labor market flexibility and
unemployment: new empirical evidence of static and dynamic effects. Comparative
Economic Studies 54, 251–273.
Bertola, G., Blau, F.D, Kahn, L.M., 2007. Labor market institutions and demographic
employment patterns. Journal of Population Economics 20 (4), 833-867.
Bianchi, M., Zoega, G., 1998. Unemployment persistence: does the size of the shock matter?
Journal of Applied Econometrics 13, 283-304.
Blanchard, O. J., 2006. European unemployment: the evolution of facts and ideas. Economic
Policy, January, 5-59.
Blanchard, O.J., Jimeno, J.F., 1995. Structural unemployment: Spain versus Portugal. The
American Economic Review 85 (2), 212-18.
Blanchard, O. J., Summers, L.H., 1987. Hysteresis in unemployment. European Economic
Review 31, 288-295.
Boeri, T., Garibaldi, P., Espen, M.R., 2013. Financial shocks and labor: facts and theories. IMF
Economic Review 61, 631-663.
Caliendo, M., Schmidl, R., 2016. Youth unemployment and active labor market policies in
Europe. IZA Journal of Labor Policy 5 (1), 1-30.
Calmfors, L., 2001. Wages and wage-bargaining institutions in the EMU – a survey of the
issues. Empirica 28 (4), 325-351.
Calvo, G.A., Corelli, F., Ottonello, P., 2012. The labor market consequences of financial crisis
with with or withput inflation: jobless and wageless recoveries. NBER Working Paper
No. 18480, National Bureau of Economic Research, Cambridge, MA.
Camarero, M., Carrion-i-Silvestre, J. L., Tamarit, C., 2006. Testing for hysteresis in
unemployment in OECD countries. new evidence using stationarity panel tests with
breaks. Oxford Bulletin of Economics and Statistics 68, 167–82.
Carrion-i-Silvestre, J.L., del Barrio, T., López-Bazo, E., 2005. Breaking the panels: an
application to the GDP per capita. Econometrics Journal 8, 159–75.
Cukierman, A., Lippi, F., 2001. Central bank independence, centralization of wage bargaining,
inflation and unemployment: Theory and some evidence. European Economic Review
43 (7), 1395-1434.
De Graaf-Zijl, M., van der Horst, A., van Vuuren, D., Erken, H., Luginbuhl, R., 2015. Long-
term unemployment and the Great Recession in the Netherlands: economic mechanisms
and policy implications. De Economist, 163, 415-434.
European Commission, 2013. Labor market developments in Europe 2013. European Economy
6/2013.
Fosten, J., Ghoshray, A., 2011. Dynamic persistence in the unemployment rate of OECD
countries. Economic Modelling 28 (3), 948–954.
IMF, 1999. Chronic unemployment in the Euro Area: causes and cures. World Economic
Outlook, May 1999, IMF.
IMF, 2014. Youth unemployment in Europe: Okun’s law and beyond. IMF Country Report
No. 14/199, IMF.
Kejriwal, M., Perron, P., 2010. A sequential procedure to determine the number of breaks in
trend with an integrated or stationary noise component. Journal of Time Series Analysis
31, 305-328.
25
Layard, R., Nickell, S.J., Jackman, R., 1991. Unemployment, macroeconomic performance and
the labour market, Oxford University Press, Oxford.
Leybourne, S.J., Mills, T. C., Newbold, P., 1998. Spurious rejections by Dickey-Fuller tests in
the presence of a break under the null. Journal of Econometrics 87: 191–203.
Ljungqvist, L., Sargent, T.J., 1998. The European unemployment dilemma. Journal of Political
Economy 106 (3), 514-550.
Neumark, D., Wascher, W., 2004. Minimum wages, labor market institutions, and youth
employment: A cross-national analysis. Industrial and Labor Relations Review 57 (2),
223-248.
Ng, S., Perron, P., 2001. Lag length selection and the construction of unit root tests with good
size and power. Econometrica 69 (6), 1519-1554.
Nunziata, L., Staffolani, S., 2007. Short-term contracts regulations and dynamic labour
demand: theory and evidence. Scottish Journal of Political Economy 54 (1), 72-104.
OECD, 2005. Education at Glance, OECD Publishing.
OECD, 2006. Boosting jobs and growth. OECD Employment Outlook, Chapters 3 and 7,
OECD Publishing.
OECD, 2011. Persistence of high unemployment: What risks? What policies. OECD Economic
Outlook, Vol 2011/1, OECD Publishing.
OECD, 2014. An update of the labour market situation. OECD Employment Outlook, OECD
Publishing.
O’Higgins, N., 2015. Youth unemployment. IZA Policy Papers No. 103, IZA, Germany.
Ordóñez, J., Sala, H., Silva, J.I., 2015. Real unit labour costs in Eurozone countries: drivers
and clusters. IZA Journal of European Labor Studies 4 (1), 1-19.
O’Shaughnessy, T., 2011. Hysteresis in unemployment. Oxford Review of Economic Policy
27 (2), 312-337.
Pastore, F., 2015. The youth experience gap: explaining national differences in the school-to-
work transition, Springer Briefs in Economics, Springer, ISBN 978-3-319-10195-8.
Perron, P. 1988. Trends and random walks in macroeconomic time series: further evidence
from a new approach. Journal of Economic Dynamics and Control 12, 297–332.
Perron, P. 1989. The great crash, the oil price shock and the unit root hypothesis. Econometrica
57, 1361–1401.
Perron, P., Yabu, T., 2009a. Estimating deterministic trends with an integrated or stationary
noise component. Journal of Econometrics 151, 56–69.
Perron, P., Yabu, T., 2009b. Testing for shifts in trend with an integrated or stationary noise
component. Journal of Business and Economic Statistics 27 (3), 369–396.
Røed, K., 1997. Hysteresis in unemployment. Journal of Economic Surveys 11 (4), 389-418.
Romero-Ávila, D., Usabiaga, C., 2008. On the persistence of Spanish unemployment rates.
Empirical Economics, 35, 77-99.
Romero-Ávila, D., Usabiaga, C., 2009. The unemployment paradigms revisited: a comparative
analysis of US States and European unemployment. Contemporary Economic Policy, 27
(3), 321- 334.
Roy, A., Fuller, W.A., 2001. Estimation of autoregressive processes with a root near one.
Journal of Business and Economic Statistics, 19, 482–493.
26
Ryan, P., 2001. The school-to-work transition: a cross-national perspective. Journal of
Economic Literature 39 (1), 34-92.
Scarpetta, S., Sonnet A., Manfredi, T., 2010. Rising youth unemployment during the crisis:
how to prevent negative long-term consequences on a generation? OECD Social,
Employment and Migration Working Papers, No. 106, OECD Publishing.
Sciulli, D., Signorelli, M., 2011. University-to-work transitions: the case of Perugia. European
Journal of higher Education 1(1), 39-65.
Sibert, A., Sutherland, A., 2000. Monetary union and labour market reform. Journal of
International Economics 51, 421-435.
Srinivasan, N., Mitra, P., 2014. The European unemployment problem: its cause and cure.
Empirical Economics 47 (1), 57-73.
Tridico, P., 2013. The impact of the economic crisis on EU labour market: a comparative
perspective. International Labour Review 154 (2), 175-190.
Vogelsang, T. J. 1998. Trend function hypothesis testing in the presence of serial correlation.
Econometrica 66, 123–148.
APPENDIX
Table A1. Results for Structural Breaks Tests. Total Trend Component.
Country ExpW Exp W
(2|1)
No. of
Breaks
EMU Euro/
financial
crisis
Other
Belgium 1.25 1.70 2 2011m7 2001m1
Denmark -0.25 0
Germany 12.24 8.44 2 1999m5 2011m7
Ireland 1.21 15.15 2 1999m7 2006m6
Spain 3.86 4.42 2 1999m10 2007m4
France 3.57 5.16 2 2000m9 2004m2
Italy 0.89 0
Holland 0.29 0
Austria 2.49 8.42 2 2000m4 1997m2
Portugal 12.20 1.34 1 2003m3
Finland 16.79 2.53 2 2001m5
1996m4
Norway -0.14 0
Sweden 0.85 0
Luxembourg 3.52 12.15 2 2007m6 1996m4
UK 1.71 15.19 2 1999m12 2011m7
Greece 7.80 -0.04 1 2001m2
27
Table A2. Results for Structural Breaks Tests. Youth Trend Component.
Country ExpW Exp W
(2|1)
No. of
Breaks
EMU Euro/
financial
crisis
Other
Belgium 3.31 13.55 2 2001m3 2011m7
Denmark -0.16 0
Germany 8.47 8.69 2 1999m8 1996m4
Ireland 1.15 29.27 2 1999m8 1996m4
Spain -0.22 0
France 5.03 0.23 1 2001m8
Italy 8.10 0.13 1 1997m10
Holland 2.54 2.90 2 2000m2 2003m12
Austria 3.96 66.92 2 2000m4 1997m2
Portugal 11.68 0.14 1 2002m6
Finland 16.41 0.47 1 2002m1
Norway 0.004 0
Sweden 3.20 3.56 2 2000m2 2005m8
Luxembourg 0.24 0
UK 14.12 11.52 2 2000m1 2011m5
Greece 10.15 16.09 2 2001m10 2004m4
Table A3. Results for Structural Breaks Tests. Adult Trend Component.
Country ExpW Exp W
(2|1)
No. of
Breaks
EMU Euro/
financial
crisis
Other
Belgium 19.56 67.65 2 2000:6 1996:9
Denmark 42.97 98.56 2 2007:5 1997:2
Germany 134.26 73.95 2 2001:8 2004:12
Ireland 69.56 163.68 2 2011:7 2004:11
Spain 213.03 46.01 2 2011:7 2006:11
France 56.11 105.48 2 2007:9 1996:9
Italy 155.02 99.15 2 2008:4 1997:8
Holland 33.17 159.83 2 2000:4 2010:10
Austria 15.85 159.48 2 2008:9 2003:10
Portugal 30.08 91.06 2 2001:2 1996:3
Finland 138.06 170.16 2 2000:6 2007:12
Norway 166.65 135.82 2 1999:2 2003:2
Sweden 18.68 227.16 2 2000:11 1997:2
Luxembourg 65.77 148.82 2 2001:2 2004:6
UK 86.85 277.44 2 2011:7 2003:6
Greece 272.82 42.64 2 2007:1 2003:12
28
Table A4. Slope Estimates. Total Trend Component.
Country Regime 1 Regime 2 Regime 3
Belgium -0.057
(-0.0791, -0.0355)
0.0634
(0.0406, 0.0862)
-0.1923
(-0.4155, 0.0309)
Denmark -0.0401
(-0.313, 0.2328)
Germany -0.1318
(-0.2237, -0.0398)
0.0034
(-0.0038, 0.0107)
0.1231
(-0.2254, 0.4761)
Ireland -0.0803
(-0.1120,-0.0485)
-0.0024
(-0.0073, 0.0024) 0.047
(0.0339, 0.0601)
Spain -0.0025
(-0.0687, 0.0638) -0.0382
(-0.057, -0.019)
0.0367
(0.0004, 0.0729)
France -0.0382
(-0.101, 0.0253) -0.01
(-0.0177, -0.0023)
0.0493
(0.0384, 0.0603)
Italy 0.0068
(-0.0126, 0.0262)
Holland 0.0126
(-0.0186, 0.0438)
Austria -0.0327
(-0.1037, 0.0383)
-0.0568
(-0.1961, 0.0826)
0.0006
(-0.009, 0.103)
Portugal -0.0486
(-0.0989, 0.0016)
0.0856
(-0.7175, 0.8887)
Finland -0.068
(-0.1689, 0.033) -0.0491
(-0.0541, -0.0441)
0.015
(0.013, 0.0169)
Norway -0.0207
(-0.2098, 0.1684)
Sweden -0.024
(-0.0655, 0.0174)
Luxembourg -0.0948
(-0.1966, 0.0071)
-0.0068
(-0.0346, 0.021) 0.0236
(0.0166, 0.0305)
UK -0.0711
(-0.1419, -0.0003)
0.0109
(0.000, 0.0217)
0.1564
(0.0128, 0.3001)
Greece -0.0176
(-0.0362, 0.0010)
0.0010
(-0.0083, 0.0103)
Note: Numbers in square brackets denote 90% confidence intervals.
29
Table A5. Slope Estimates. Youth Trend Component.
Country Regime 1 Regime 2 Regime 3
Belgium -0.0836
(-0.1087, -0.0585)
0.143
(0.0045, 0.2832)
-0.6128
(-1.572, 0.3471)
Denmark -0.0786
(-0.4808, 0.3236)
Germany 0.1273
(-0.3571, 0.1025) -0.7138
(-1.08, -0.3475)
0.0855
(0.039, 0.1315)
Ireland -0.203
(-0.2699, 0.2107) -0.4511
(0.7622, -0.1401)
0.0726
(0.0149, 0.1304)
Spain 0.0423
(-0.0579, 0.1426)
France -0.1006
(-0.1391, -0.0621)
0.1962
(-0.1359, 0.5283)
Italy -0.0528
(-0.1055, -0.0001)
-0.0598
(-0.0956, -0.0239)
Holland -0.0908
(-0.3418, 0.16) 0.0711
(0.062, 0.0802)
0.163
(0.0392, 0.2869)
Austria 0.413
(0.0827, 0.7443)
0.0108
(-0.4104, 0.432)
-0.0074
(-0.0304, 0.0155)
Portugal -0.1567
(-0.2456, -0.0677)
0.1236
(-0.2859, 0.5332)
Finland -0.0736
(-0.0861, -0.0611)
0.0032
(-0.0744, 0.0809)
Norway -0.0329
(-0.3081, 0.2422)
Sweden -0.1729
(-0.3496, 0.0038) 0.1184
(0.0896, 0.1473)
0.0147
(-0.0251, 0.0546)
Luxembourg 0.0416
(-0.009, 0.0924)
UK -0.1105
(-0.263, 0.0418) 0.0379
(0.0339, 0.0419)
0.0103
(-0.1533, 0.1739)
Greece 0.0533
(-0.239, 0.128)
0.0853
(-0.168, 0.338)
0.0032
(-0.0112, 0.0176)
30
Table A6. Slope Estimates Adult Unemployment.
Country Regime 1 Regime 2 Regime 3
Belgium 0.0295
(0.023, 0.028)
-0.0457
(-0.047, -0.044)
0.008
(-0.009, 0.025)
Denmark -0.085
(-0.094, -0.075)
-0.015
(-0.026, -0.001)
0.025
(-0.009, 0.061)
Germany 0.005
(-0.008, 0.018) 0.048
(0.033, 0.064)
-0.046
(-0.076, -0.016)
Ireland -0.071
(-0.130, -0.0118)
0.119
(0.100, 0.137)
-0.085
(-0.088, -0.0817)
Spain -0.055
(-0.142, 0.031) 0.233
(0.127, 0.34)
0.061
(0.041, 0.08)
France 0.019
(0.016, 0.021)
-0.021
(-0.056, 0.012) 0.028
(0.025, 0.031)
Italy 0.041
(0.035, 0.046)
-0.024
(-0.044, -0.003)
0.072
(0.061, 0.083)
Holland -0.032
(-0.036, -0.028)
0.008
(0.002, 0.014)
0.062
(0.06, 0.064)
Austria 0.004
(-0.019, 0.028) -0.009
(-0.012, -0.006)
0.015
(0.008, 0.022)
Portugal 0.042
(0.034, 0.048)
-0.033
(-0.063, -0.0025)
0.054
(0.034, 0.073)
Finland -0.069
(-0.078, -0.060)
-0.027
(-0.033, -0.021)
0.019
(-0.004, 0.044)
Norway -0.044
(-0.045, -0.044)
0.018
(0.013, 0.023)
-0.0001
(-0.019, 0.018)
Sweden 0.023
(0.018, 0.028)
-0.073
(-0.132, -0.013)
0.005
(0.0002, 0.01)
Luxembourg -0.005
(-0.07, 0.06) 0.049
(0.044, 0.055)
0.011
(0.006, 0.016)
UK -0.042
(-0.053, -0.032)
0.024
(-0.019, 0.068) -0.042
(-0.051, -0.032)
Greece 0.063
(-0.041, 0.167) -0.035
(-0.041, -0.031)
0.208
(0.181, 0.236) Note: Numbers in parentheses denote 90% confidence intervals. Significant slope estimates denoted in bold.

31
Table A7. Qualitative Summary of the Results in Tables A1-A6.
Country EMU Break Euro/financial crisis break
Total Adult Youth Total Adult Youth
Belgium No No Yes Yes No No
Denmark No No No No No No
Germany Yes Yes Yes Yes No No
Ireland Yes No Yes Yes Yes No
Spain Yes No No Yes Yes No
France Yes No No No Yes No
Italy No No No No Yes No
Holland No Yes Yes No Yes No
Austria Yes No No No Yes No
Portugal No Yes No No No No
Finland No Yes No No No No
Norway No Yes No No No No
Sweden No No Yes No No No
Luxembourg No Yes No Yes No No
UK Yes No Yes Yes Yes No
Greece Yes No No No Yes No Note: Yes stands for structural break with statistically significant change in the trending behaviour of
unemployment.