Embed Size (px)
Citation preview

EURO CERAMICS LIMITED Annual Report 2007-08

Cost. Customisation.Convenience. The long and short of it is that Euro Ceramics Limitedis shaking up its industry by leveraging these age-oldmantras into a compelling business model.

Contents
Board of Directors
Mr. Nenshi L. Shah
Chairman & Managing
Director
Mr. Talakshi L. Nandu
Whole-time Director
Mr. Kumar P. Shah
Whole-time Director
Mr. Paresh K. Shah
Whole-time Director
Mr. Shantilal L. Shah
Non Executive Director
Mr. Pravin D. Gala
Non Executive Director
(up to July 30, 2008)
Mr. Lalji K. Shah
Non Executive Director
Mr. Shivji K. Vikamsey
Independent Director
Mr. Raichand K. Shah
Independent Director
Mr. Anil M. Mandevia
Independent Director
Mr. Amit G. Shah
Independent Director
Mr. Jatin R. Chhadva
Independent Director
(w.e.f. July 30, 2008)
Mr. Nishit V. Shah
Independent Director
(w.e.f. July 30, 2008)
Corporate information
Company SecretaryMs. Jayshree D. Soni
Chief Executive OfficerMr. Sushil Chudiwala
Chief Financial OfficerMr. Piyush Gupta
Vice President –ExportsMr. Parag Shah
Vice President-SanitaryWareMr. Viral Nandu
Genearl Manager-Accounts and FinanceMr. Chandresh Rambhia
Vice President- PlantMr. T. P. Rao
AuditorsM/s. Deepak Maru & Co.,
Chartered Accountants
Bankers
State Bank of India
The Cosmos Co-op. Bank Ltd.
State Bank of Saurashtra
HDFC Bank Limited
Registered OfficeBoston House,
Ground Floor,
Suren Road, Chakala,
Andheri (East),
Mumbai - 400 093
FactorySurvey No. 510, 511,
512, 517/1,
Bhachau Dudhai Road,
Bhachau (Kutch),
Gujarat – 370 140
Registrar & Share Transfer Agent
M/s. Intime Spectrum Registry Limited
C-13, Pannalal Silk Mills Compound,
L.B.S. Marg, Bhandup (West),
Mumbai – 400 078
2 Euro Ceramic today 4 Highlights 2007-08 6 CMD’s overview 16 Our strengths 18 Why are we optimistic about our
prospects? 20 Conversation with the Directors 24 Management Discussion and Analysis 30 Operational review 33 Analysis
of our financial statements: 2007-08 vs 2006-07 38 Managing risks at Euro 43 Safety, health and environment 44 Directors’
Report 54 Report on Corporate Governance 67 Auditors’ Report 70 Financial Section

2 | EURO CERAMICS LIMITED
Euro Ceramics today.
Banking on
Business• Manufacturing vitrified ceramic tiles with
an installed capacity of 79,971 MTPA.
• Manufacturing calcareous tiles with an
installed capacity of 45,000 MTPA.
• Manufacturing sanitaryware with an
installed capacity of 11,000 MTPA.
• Manufacturing aluminium extruded
sections with a capacity of 1,800 MTPA.
• Trading in wall tiles, through its 100%
subsidiary, Euro Merchandise (India) Ltd.
• Generating 10-MW of power through
captive power plant based on lignite.
Vision• To be the most effective, innovative andcreative Company and be known for thequality, leadership and professionalismboth nationally and internationally.
• To build a conglomerate and be a leaderin its chosen business area, create anorganisation in which all members areproud to be associated with.
• To set benchmarks that will become thestandard for industry and others toemulate and follow.
Mission• Euro Ceramics is committed to serve
society by providing quality products and
services.
• We have dedicated ourselves to long-
term growth and will practise highest
standards in manufacturing, marketing and
care for our people.
• Apart from local markets, we should
become an international player and with
the existing high standards of quality, we
should have a good share of the global
market.
• Suitable expansions related to our core
strength in construction industry.
• Euro Ceramics will practise the best
business standards and values and stand
as a role model for the best of the medium-
size enterprises to give maximum benefits
to its shareholders.
Presence• Headquartered in Mumbai.
• Plant located at Bhachau, Kutch.
• Listed on the National Stock Exchange
and the Bombay Stock Exchange.
• Marketing presence across India under
the Euro brand.
• Runs 30 retail outlets across the country.
Projects• Residential complex
• Commercial complex
• IT industry
• Banking sector
• Corporate offices
• Multiplexes
• Shopping complexes, malls
• Star hotels
• Hospitals
• Airports
• Government projects
Management • 1,000-plus professional team, headed by
Mr. Nenshi L.Shah, Chairman & Managing
Director.
• Promoters hold a 55.31% stake.
Quality• ISO 9001:2000.
• ISO 13006/EN 176 Group B1a
Certifications.
OperationsTechnology and equipment sourced from
SACMI.

Annual Report 2007-08 | 3
Promoter’sholding
55.31%as on
March 31, 2008
Employees
1090employees
as on March 31, 2008
Marketcapitalisation
Rs. 210 crs as on
March 31, 2008
Sales (Rs. lacs) PAT (Rs. lacs)EBIDTA (Rs. lacs) Cash profit (Rs. lacs)
2004-05 2005-06 2006-07 2007-08 2004-05 2005-06 2006-07 2007-08 2004-05 2005-06 2006-07 2007-08 2004-05 2005-06 2006-07 2007-08
11,223
13,029
17,908
22,824
1,355
2,024
2,827 2,832
1,4382,406
3,599
6,393
7,736
2,476
3,964
4,336

4 | EURO CERAMICS LIMITED
Sales(Rs. lacs)
EBIDTA(Rs. lacs)
PAT(Rs. lacs)
Cash profit (Rs. lacs)
EPS (Rs.)
2006-07 2007-08
17,908
22,824
2006-07 2007-08
16.53 16.56
2006-07 2007-08
6,393
7,736
2006-07 2007-08
2,827 2,832
2006-07 2007-08
3,964
4,336
Highlights2007-08

Annual Report 2007-08 | 5
Operations• Reported 100% utilisation across the vitrified tile
capacities and commenced commercial production at
the calcareous tile plant in 2007-08.
• Reduced power and fuel cost as a proportion of the
turnover by 167 bps to 19.07%.
Product score
Vitrified tiles
• Increased production by 9.12% — from 78,331
tonnes in 2006-07 to 85,472 tonnes.
• Nearly 90% of the output was classified as first-
quality grade.
• Launched new designs.
Aluminium extrusions
• Increased production from 1,320 tonnes in 2006-07
to 1,408 tonnes.
Calcareous tiles
• Commissioned a 45,000-MTPA calcareous tiles
facility in June 2007.
Credit ratings• Achieved PR1+ rating from CARE, signifying strong
capacity for timely payment of short-term debt and the
lowest credit risk.
• Awarded LA+ rating from CARE, signifying adequate
safety for the timely servicing of debt obligations with
the tenure of more than a year. This rating signifies a
low credit risk.
Marketing • Launched a complete range of calcareous tiles i.e.;
agglomerated marble under the Euro brand.
• Expanded its marketing presence across India and in
international territories.
• Doubled exports to around Rs. 19 crores.
• Supplied in various SEZs.
• Introduced franchise outlets to exclusively market
Euro products under the name ‘Euro Stile Station’.
Post-balance sheet development• Commissioned an 11,000-MTPA sanitaryware facility
in April 2008 at a cost of around Rs. 77 crores.
Shareholder returns
Earnings Book value Dividend
per share (as on March 31, 2008)
Rs. 16.56 Rs. 115.05 7.5%

"We are the youngest in theindustry, but we outperformedthe industry sales growth witha 27% rise in our topline."Mr. Nenshi L. Shah, Chairman & Managing Director, shares the Company’s big picture.
6 | EURO CERAMICS LIMITED
CMD’s overview
Annual Report 2007-08 | 7
What kind of a Company is EuroCeramics? What distinctive difference willwe make in our space? These are the two questions that I am most
frequently asked today.
Euro Ceramics is not another tile company. It is
being positioned as a core ceramic Company.
Our growth will be derived from a growing
understanding of this material and how we can
apply it in various ways to make a wider range
and a better quality of products.
Euro Ceramics is not a run-of-the-mill ceramic
products company. It is being positioned as a
design-led, premium tile company. What we
make will address customers who possess the
desire and the capability to buy the best.
At the Company, we feel that a combination of
these two statements represents the essence
of an effective and enduring business model.
This is why:
• It is our experience that the community of
people who want to migrate to a better quality
of products and services keeps growing all the
time, recession or not. Most consumer
segments are sensitive to the overall
economic, national and international
environments; the premium-end is not.
• It is our experience that the quality-
conscious, upper-end customer rewards
innovation and design better and quicker than
any other income segment. In our business,
this translates into a more effective coverage
of costs, the availability of an attractive cash
flow and a stronger availability to reinvest in
more products and higher capacities.
• In our experience, a design-led company
creates the expectation of superior quality.
This creates a consumer pull, helps us reduce
the promotions budget, enthuses our
franchisees and helps us widen our
distribution network faster.
I am pleased to state that in 2007-08 we walked
this talk. We leveraged our understanding of the
ceramic material and extended from the
manufacture of vitrified tiles to the commercial
manufacture of calcareous tiles in June 2007
and sanitaryware in April 2008.
So what will this business model achievefor our Company?One, there is a growing international respect
for Euro Ceramics for its ability to fuse three
globally established product categories into its
business with speed and effectiveness. In our
understanding, this combination of businesses
is unique; companies have successfully scaled
their individual product lines to achieve
economies of scale and brand, but no
Company has taken the absolutely lateral
approach of widening its product breadth over
scale within our sector.
Two, we expect to drive sustainable growth in
terms of topline and bottomline for the
Company over the foreseeable future,
translating into superior value for all those who
own shares in our Company.
Nenshi L. Shah
Chairman & Managing Director

8 | EURO CERAMICS LIMITED

Annual Report 2007-08 | 9
wt cn u c? One Company? We see four. One for vitrified tiles. One for calcareous tiles (agglomeratedmarble). One for sanitaryware. One for wall tiles.

10 | EURO CERAMICS LIMITED

Annual Report 2007-08 | 11
wt cn u c? Diversified expansion? We see an unprecedented increase in homes, offices, malls, hotels andhospitals. A migration to better products. A revolution in renovation.

12 | EURO CERAMICS LIMITED

Annual Report 2007-08 | 13
wt cn u c? Product clutter?We see selling more products – vitrified tiles, calcareous tiles, wall tiles andsanitaryware products — to the same institutional customers or through thesame retail stores.

14 | EURO CERAMICS LIMITED

Annual Report 2007-08 | 15
wt cn u c? Stretched financials?We see one of the highest EBIDTA margins amongceramic solution Companies in India.
16 | EURO CERAMICS LIMITED
Our strengths
BrandEuro’s brand stands unmistakably for pride-enhancing superior quality, differentiated design and a wide range
across all its products of manufacture or sale.
Business modelEuro’s business model comprises the sale of products manufactured directly by itself, or of complementary
products manufactured by other quality-committed manufacturers — a balance of manufactured and traded
income.
Focus Euro possesses a core ceramic competence in the manufacture of three different product lines within the space of
a year and can lead to more products over time.
First moverEuro is a pioneer. The Company was the first to enter the manufacture of tiles through vitrified flooring products (as
opposed to others for whom it was an add-on product). The Company emerged as the first to manufacture
calcareous tiles in the organised sector in India.
RangeEuro’s products range addresses the needs of various pockets. The Company’s vitrified tiles extend from Rs. 45 per
sq. ft. to Rs. 120 per sq. ft. Its calcareous tiles extend from Rs. 175 per sq. ft to Rs. 300 per sq. ft. and sanitaryware
products range from Rs. 2,500 a piece to Rs. 10,000 a piece.
Annual Report 2007-08 | 17
Technology Euro’s SACMI technology solution for the manufacture of vitrified tiles has translated into improved efficiency,
quicker operational stability, higher proportion of ‘first quality’ products and a lower downtime.
LocationEuro’s plant in Kutch is close to raw material source, ports and to major markets.
Captive power plantEuro’s 10-MW lignite-based captive power plant has helped to meet complete captive needs, reduced cost,
enhanced product quality and trimmed maintenance expenses.
Execution excellenceEuro’s management commissioned and launched calcareous tiles (2007) and sanitaryware products (2008)
successfully, indicating deep execution capabilities.
Positioning Euro’s margins remain the highest in India’s organised vitrified and calcareous segments, generating adequate
accruals for reinvestment.

Economic outlookIndia’s per capita GDP (purchasing power parity) is
expected to climb by almost 4% a year over the next
15 years.
UrbanisationHalf of the country's population is expected to be living
in urban areas – the focus of the Company’s products –
contributing nearly as 75% of the country’s GDP.
Population distribution and the ageNearly 64% of India’s total population is in the age
group of 15 to 64 years.
Population and the labour forceThe population of India grew by 17% in 1997-2007,
while its labour force grew by 27%. In the next five
years, India’s population is expected to go up by 7%
and its labour force by 10%.
Middle-class Rising disposable incomes will help create a 583-mn-
strong middle class, making India the fifth largest
consuming economy by 2025. Maharashtra, proximate
to the Company’s location, has the highest urban
middle class population of 16.4 million.
Demographic transformationIndians with an annual income of US$57,000-
US$115,000 accounted for 9 million in 2001-02. They
are expected to reach 33 million by 2009-10.
Urban developmentThe Union Urban Development Ministry’s Rs. 260,000-
crore urban development plan will improve water
supply, sewerage, sanitation and public transport,
18 | EURO CERAMICS LIMITED
Why are we optimistic about our prospects?
creating the basis for enhanced demand of
the Company’s products. Funds worth Rs.
40,000 crore will be provided to states
through the Centre's Jawaharlal Nehru
National Urban Renewal Mission (JNNURM).
Growth of mega citiesAll large Indian cities are expected to
expand. From 15.1 mn in 1995, Mumbai is
expected to grow to 33.2 mn by 2025,
creating larger markets for the Company’s
products.
Retail penetrationThe share of organised retail is expected to
increase from around 3% to 8% by FY 2010,
extending from metros to Tier-II cities and
manifesting in malls, supermarkets and
hypermarkets.
LeverageThe Indian society is becoming increasingly
consumerist, with the number of credit
cards having grown by 26% and debit cards
by 113% annually over five years.
Consumer spendingDiscretionary spending (lifestyle and
premium products) will increase
progressively to around 70% of most
household’s annual expense pie by 2025.
India (12th in the world consumer market) is
expected to account for 20% of the global
consumer market by 2025.
Annual Report 2007-08 | 19

20 | EURO CERAMICS LIMITED
Were you happy with the performance ofthe Company in 2007-08? Yes and no. On the one hand, we were pleased
that the Company grew its total sales by 27%
and maintained its EBDITA above 30%,
indicating that we performed better than the
industry average.
On the other hand, we were disappointed by the
fact that we were compelled to write off
Rs. 7.04 crores on account of derivative losses
arising out of unexpected currency movements
in the last quarter of 2007-08. This draw down
was the singular reason why our profit after tax
for 2007-08 increased only 0.15% over the
previous year. We also encountered a delay in
the commissioning of our sanitaryware product
capacity, while there was a slow pick-up in the
offtake of calcareous tiles on account of the
concept marketing that these entailed.
Does this decline in profitability signal theend of a profitable quarter-on-quartersequence?We must take this opportunity to tell our
shareholders that this is not the case by a long
shot. The decline in profitability was largely on
account of one-time derivative losses on our
books. Had this loss not transpired, the
Company would have reported a cash profit of
50.40 crore in 2007-08 as against Rs. 39.64
crore in 2006-07.
What were among the heartening aspectsof the Company’s performance during2007-08?We were fairly pleased with our topline increase
of 27% over the previous year for a good
reason: The fact that we reported a revenue
increase higher than the industry average
demonstrated that we got our sales mix
"The ramp-up of two newbusinesses will be thehighlights of our performancein 2008-09."The Directors of Euro Ceramics review the Company’s performance and prospects.
Conversation with the Directors

absolutely right. By this we mean, we optimised
the products that we would manufacture and
balanced the proportion of how much we would
manufacture and what we would outsource.
This is reflected in the numbers: we enhanced
our sales revenues from Rs. 17,908 lacs in 2006-
07 to Rs. 22,824 lacs in 2007-08.
We reported a consolidated turnover of
Rs. 28,737 lacs in 2007-08, an increase of 34%
over the previous year (including trading in wall
tiles through our 100% subsidiary Euro
Merchandise (India) Ltd). At Euro, we are of the
conviction that a successful brand must be able
to service the varied requirements of customers
either through direct manufacture or through
effective outsourcing.
At Euro, this is a deliberate strategy for some
important reasons: it enables us to leverage our
insight into cost-effective procurement and
profitable marketing; it enables us to seed the
market with selected products that we intend to
directly manufacture at some point in the future;
it enables us to capture consumer footfalls and
loyalty with the prospect of making cross-sales.
At Euro, the successful integration of this
effective outsourcing with the Company’s
business model resulted in robust topline
growth during the year under review.
Besides, we more than doubled exports to
around Rs. 30 crores (including deemed export
under SEZ supply) during 2007-08.
You spoke of the launch of calcareous tiles
in 2007-08. What was the rationale behindthe decision? Our understanding of the market potential for
calcareous tiles was derived from a simple
reality: marble is an ancient product and its use
in India is extensive. Although authenticated data
is not available, it is estimated that the market
for natural marble in India is worth around Rs.
2,000 crore and the country imports marbles
valued at around Rs. 360 crore annually to cater
to domestic demand. One of the reasons for the
size of the country’s marble market is the
absence of suitable substitutes from organised
manufacturers. At Euro, we were convinced that
if we provided the customer with choice and
cost-effectiveness, there would be a growing
market for substitutes. It is with this perspective
that the calcareous tile product (agglomerated
marble) was introduced in 2007.
This is precisely what transpired in 2007. Natural
Italian marble was priced at Rs. 205 per sq. ft. to
Rs. 600 per sq. ft., while calcareous tiles were
priced at Rs. 121 per sq. ft. to Rs. 300 per sq. ft.
This differential helped to create a market in the
country where previously none really existed.
Secondly, the niche Indian user has to import
Italian marble, in bulk, considering the transit
time and expense, and then needs to store it.
This can be overcome by just-in-time supply of
calcareous tiles.
Further, the tile cost generally varies around 4%-
5% of the total construction cost.
Annual Report 2007-08 | 21
OUR UNDERSTANDINGOF THE MARKETPOTENTIAL FOR
CALCAREOUS TILES WASDERIVED FROM ASIMPLE REALITY:
MARBLE IS AN ANCIENTPRODUCT AND ITS USEIN INDIA IS EXTENSIVE.

But in the last three to four years, real estate
market has boomed, and enhanced the total
construction cost. As a result, the tile cost has
declined as a percentage of total cost, attracting
more buyers to go for niche products. Our
success in this segment is reflected in the
following realities: we successfully marketed
calcareous tiles in 2007-08, and interestingly, our
success inspired other companies to announce
plans to enter this segment.
Going ahead, we expect to enhance the capacity
utilisation of calcareous tiles on the one hand, and
capture an increased market share of this product,
on the other.
In last year’s report, there was a significantfocus on value-addition over the commoditystrategy.We are pleased to state that the strategy
continued to be in profitable evidence during
2007-08. First the overview: value-added vitrified
tiles (tiles that possess special effect, design and
colour attract higher margins) as a proportion of
our vitrified offtake increased.
Shareholders will be keen to understandhow the Company’s sanitaryware productsfit into the existing product portfolio.This is a good question. For a number of people,
the manufacture of sanitaryware products might
appear to be an unrelated diversification. It is not;
it is completely synergic with our existing
products for credible reasons:
• An increasing number of sanitaryware are
bought along with vitrified tiles; their provision in
the same storefront will enhance customer
convenience and enable us to derive a larger
income out of cross-sale opportunities.
• At Euro, we are positioning ourselves as a
Company with a core competence in the
management of ceramic material, using this skill
to spin out varied – yet synergic – products like
vitrified tiles, calcareous tiles, wall tiles and
sanitaryware.
Euro has established a tradition of making asignificant difference to each of the spacesof its presence. How will it make adifference in the sanitaryware segment? It would be relevant for us to indicate here that the
country does not lack credible sanitaryware
brands. So shareholders would be inclined to ask
what difference we can possibly make in this
mature space. This is our answer: we are raising
the standard of this segment. Our state-of-the-art
plant is bought from SACMI, a world leader in
ceramic industry. We have employed the latest
techniques in our manufacturing facility to
minimise human intervention and eliminate the
scope of related errors. Besides, we have evolved
in designs that are absolutely modern and
22 | EURO CERAMICS LIMITED
AN INCREASINGNUMBER OF
SANITARYWARE AREBOUGHT ALONG WITH
VITRIFIED TILES TOENHANCE CUSTOMER
CONVENIENCE ANDENABLE US TO DERIVE
A LARGER INCOME OUTOF CROSS-SALE
OPPORTUNITIES.

Annual Report 2007-08 | 23
international. The result is that over the coming
months, we will introduce our exclusive
sanitaryware range, that represents the best in
international design and quality at domestic
prices.
What challenges and opportunities do youforesee for the next year?There is an apprehension of a real estate
slowdown that could possibly stagger the
offtake of housing stock – when prices are
declining consumers generally tend to defer
their purchases – however transitory this may
be. There is also the fear of general inflation,
rise in fuel costs, run-up costs in people
retention as well as growing competition.
In the latter part of this report we have
discussed in detail a number of initiatives that
will enable us to derisk. Besides, we are
encouraged by the fact that a number of real
estate developers have embarked upon projects
to develop properties multiple times larger than
the aggregate size of properties they ever
developed. Experts have indicated that the size
of India’s real estate industry will grow from
US$57 billion in 2007 to US$90 billion by 2012,
with tile-flooring accounting for around 4%-5%
of the total construction cost.
Further, it would also be worth mentioning that
around 70% of Euro’s sales mix comprises sales
to corporates, which is quite distinct from sales
mix of competitors.
At Euro, we have positioned ourselves for the
premium segment of this large market, resulting
in adequate cash flow to fund an ongoing
expansion in established and diversified,
although integrated product lines.
The big opportunity is expected to emerge from
the appreciation of the US dollar vis-à-vis the
Indian rupee on the one hand, and the
appreciation of the Chinese currency against the
US dollar on the other. We are already
witnessing the impact of Chinese products
becoming more expensive in the international
market and Indian products getting relatively
cheaper. This combination will enable us to
compete more effectively against imported
products at home and carve out a large
international market share as well. Indian
manufacturers stand to gain as the country
possesses a large availability of raw material
than can be used in the manufacture of ceramic
products, an edge not enjoyed by many nations.
At Euro, we expect to capitalise on these
realities and enhance value for our shareholders
through the full scale-up of the calcareous and
sanitaryware businesses in 2008-09, resulting in
enhanced cash flow that will be progressively
used to retire debt and strengthen our gearing.
IT WOULD ALSO BEWORTH MENTIONING
THAT AROUND 70% OFEURO’S SALES MIX
COMPRISES SALES TOCORPORATES, WHICH IS
QUITE DISTINCT FROMSALES MIX OF
COMPETITORS.

24 | EURO CERAMICS LIMITED
Indian economyIndia is the second largest emerging market
economy, fourth largest global economy and the
second fastest growing economy. It tops the AT
Kearney list of emerging markets for global
retailers and features among the top 10 FDI
destinations.
GDP growth (%)
2005-06 2006-07 2007-08
9.4 9.6 9.0
Interestingly, this national growth is built on the
edifice of an attractive increase in incomes. For
instance, the wealth of the world’s high net
worth individuals (HNI) – the segment largely
addressed by Euro – increased 11.4% to
US$37.2 trillion in 2006 [Source: World Wealth
Report, released on June 27, 2007 by Merrill
Lynch and Capgemini]. Interestingly, the largest
growth in HNI population occurred in India and
Singapore, with increases of 20.5% and 21.2%
respectively over the previous year.
Global overview The US global ceramic tiles industry is growing
at 6% annually. Asia, South America and the
European Union represent the trio where
ceramic tiles are largely manufactured. China,
Brazil, Italy and Spain are the frontrunners in the
industry space. The total production of ceramic
tiles across the world stood at 6,900 million sq.
mt. in 2007-08.
[Source: ASCER]
Indian overviewThe Rs. 15-billion ceramic tiles industry in India
is the fifth largest in the world with a market
share of 2.7%. The industry is accelerating at
15% annually, outperforming the global growth
rate. It expects to emerge among the top three
tile manufacturers in the world by 2010. The
country produced 340 million sq. mt. of ceramic
tiles during the year under review [Source:
ICCTAS].
Management Discussionand Analysis
Top 10 producing countries (Share %)
USA
Share % (World production)
Co
untr
y
1.9
2
2.7
2.9
3.4
4.2
11
11
15.1
15.3
Indonesia
IndiaTaiwan
Mexico
Turkey
ChinaBrazil
Spain
Italy
0 5 10 15 20145,000Rich Indian households with
an annual income above
US$50,000 in 2005.
405,000Rich Indian households with
an annual income above
US$50,000 in 2015.
[Source: Dr. Yuwa Hedrick-Wong,
Asia Pacific Economic Advisor to
MasterCard Worldwide.]

Annual Report 2007-08 | 25
AS A RESULT OF ASTRONGER FISCAL
CONTROL AND TAXCOVERAGE, THE
SHARE OF THECOUNTRY’S
UNORGANISEDSECTOR IN TILEMANUFACTURE
DECLINED TO 44%IN 2007-08.
Around 56% of the Indian ceramic tiles industry is
organised and represented by 16 large
manufacturers. The unorganised share of the
industry is controlled by around 200 manufacturers,
70% of them based in Gujarat. As a result of a
stronger fiscal control and tax coverage, the share
of the country’s unorganised sector in tile
manufacture declined to 44% in 2007-08.
Particulars Ceramic tiles
World production 6,900 million sq.mt.
India’s share 340 million sq.mt.
World ranking in production 5
Global industry growth rate 6%
Growth rate
(domestic market) 15%
Organised sector
Percent share of production 56
Number of units 16
Unorganised sector
Percent share of production 44
Number of units 200
(Source: ICCTAS)
Growth driversInfrastructure growth: The housing sector is the
biggest consumer of tiles, accounting for about
70% of the offtake while the country’s commercial,
retail and hospitality sectors account for the rest.
An increasing emphasis on infrastructure
development and private participation – projected
investment of US$450 billion by the end of the
Eleventh Five-Year Plan (2007-12) – is expected to
accelerate the growth of India’s tile sector.
Real estate demand: India’s real estate sector grew
at 33% during the year under review. A Cushman &
Wakefield report estimates that the cumulative
demand for real estate in the country stands at 110-
140 million sq. ft and is expected to reach around
1,000 million sq. ft by 2010. Urban India alone
needs 12 million housing units with a scope for 400
townships across 30-35 cities in five years.
Similarly, the country’s IT and ITeS sectors are
estimated to require 150 million sq. ft across urban
India by 2010. The organised retail industry is likely
to require an additional 220 million sq. ft by 2010
[Source: IBEF]. As a result, the Indian real estate
market is likely to grow from US$14 billion currently
to around US$50 billion. The share of the real estate
industry in the country’s GDP increased from 5.25%
in 2002-03 to 7% in 2007-08, but is still below the
15% share in developed economies.
Besides, mortgage debt as a percentage of GDP in
India was less than 3%, compared with 50% in
developed economies and over 20% in the rapidly
growing Asian economies like Singapore, Taiwan
and Malaysia, indicating that the Indian market
could grow sustainably over the coming years.

26 | EURO CERAMICS LIMITED
A comparative study of mortgage to GDP ratio
[Source: EMF, Global Property guide, Crisil
Research]
Nuclear family: The Indian social fabric is fast
changing from joint families to nuclear equivalents
and from kuchcha to pucca. As a result, total
housing deficit is expected to increase from 19.8
mn, estimated in 2005, to 25.3 mn by 2011 [Source:
National Building Organisation].
Growing Indian demand
(million sq. feet)
Sector 2005 2006-2010
Commercial 24.3 120-125
Hospitality 6-8 78
Residential 90-100 600-800
Retail 8-9 50
Total 128.3-151.3 840-1055
[Source: Cushman & Wakefield. Figures based on
Mumbai, NCR, Bangalore, Hyderabad, Pune, Kolkata
and Chennai data]
Projected share of the residential and commercial
space in the Indian realty pie
[Source: India Infoline]
Affordability: The income patterns of urban housing
consumers have undergone significant changes.
The average cost of a suburban property was
Rs. 2.2 mn when average salary levels were at Rs.
0.12 mn (Source: HDFC, 1995). In 2001, the average
annual income increased to Rs. 0.23 mn while
property prices declined to Rs. 1.2 mn. In 2005,
property prices hovered at Rs. 1.6 mn as against an
annual income of Rs. 0.35 mn. This indicates the
increasing affordability of real estate over the last
10 years, following a sharp increase in real income.
Indi
a
Chi
na100
75
50
25
0
Phi
lipin
es
Thai
land
Fran
ce
Ger
man
y
US
A
UK
Den
mar
k
Net
herla
nds
Residential Non-Residential
16.7%
26.0%
74.0%
83.3%
2005
Residential Non-Residential
2010

Annual Report 2007-08 | 27
Wealth: The estimated cumulative liquid wealth of
the affluent in India is poised to grow at 50% from
US$203 billion to US$322 billion by 2009 [Source:
Datamonitor]. The total number of Indian
millionaires is expected to grow from 83,000 to
134,000 and the number of Indians with liquid
wealth above US$100,000 is likely to grow from
711,000 to 1.1 million [Source: Economic Times,
September 22, 2006]. The long-term outlook is as
optimistic. A McKinsey Global study (Indian
Consumerism: Bird of Gold) projects that the
average real household disposable income will
grow from Rs. 113,744 in 2005 to Rs. 318,896 by
2025, a CAGR of 5.3%.
IT-led growth: India was voted the best
outsourcing destination, reflected in the 80%
annual average growth in commercial IT space
demand over four years (Source: AT Kearney
Survey). This has translated into an additional
demand for commercial space, as well as adjoining
residential and retail complexes.
Retail surge: Driven by an increasing disposable
income and rising aspirations, the Indian retail
industry is accelerating at 25% annually. It is
projected to grow to a size of US$175-200 billion by
2016. The country’s organised retail sector is
expected to grow at 27% annually, from Rs. 530
billion in 2005-06 to around Rs. 1,797 billion by
2011, warranting an additional floor space of 127
million sq. ft by 2011 [Source: KRC Research].
SWOT of the ceramic industry
Strengths
• A consolidated industrial environment with
160
(million sq.ft.)
Total area (mn sq.ft.) (LHS) Total construction cost (Rs bn) (RHS)
FY 03 FY 04 FY 05 FY 06 FY 07 FY 08 FY 09 FY 10 FY 11
(Rs. billion)
140
120
100
80
60
40
20
0
200180
160140
120
100
80
6040
20
0
Requirement of office space for the IT/ITeS sector Growth in per capita income
[Source: Economic Survey 2007-08, Government
of India] [Source: Crisil]
9
8
7
6
5
4
3
2
1992
-93
Gro
wth
rat
e (%
)
Years
1993
-94
1994
-95
1995
-96
1996
-97
1997
-98
1998
-99
1999
-00
2000
-01
2001
-02
2002
-03
2003
-04
2004
-05
2005
-06
2007
-08

28 | EURO CERAMICS LIMITED
technological modernisation over the last 15 years.
• Indian production costs nearly 30% lower than
that in Europe and the US.
• Availability of trained and expert personnel.
Weaknesses
• High degree of industrial fragmentation.
• Presence of a large number of small and medium-
sized companies that fail to exploit economies of
scale and have small operating margins.
• Price volatility due to industry fragmentation.
Opportunities
• A booming real estate sector in India.
• Fairly low per capita tile consumption, which is
bound to increase over the coming years.
Threats
• Influx of low-cost tiles from Chinese
manufacturers.
• Threat from the unorganised sector that operates
outside the country’s tax structure.
Divisional reviewTiles: Tiles account for roughly 3% of the total
construction cost of a residence. India’s ceramic
industry size is estimated at Rs. 6,500 crore and
expected to grow 15% annually (Source: Indian
Council of Ceramic Tiles and Sanitaryware). The tiles
sector is segregated across categories like mosaic
tiles, Kota stone and porcelain tiles (lower end) and
white Italian marble (highest). Increased real estate
development has created a robust demand for
various construction materials, benefiting the
ceramic tiles industry. Vitrified tiles and calcareous
tiles accounted for around 90% of the Company’s
revenues in 2007-08.
Vitrified tiles: Homogeneous clay bodies are fired at
high temperatures to impart a low-water absorbent
property, compared with ceramic tiles, which are
more porous in nature. Ceramic tiles usually vary in
length and width (± 5% is the internationally
acceptable limit). This aberration is offset by using
the 'grouting' technique, wherein a gap of about 5
mm is left between the tiles to cover up such
dimensional inaccuracies that may occur in the lot.
Vitrified tiles are harder and more abrasion resistant
than ceramic tiles and therefore are ideally suited
for flooring. The formats (sizes) possible in vitrified
tiles are larger than that in ceramic tiles, which
make them ideal for flooring.
Tile consumers can bebroadly divided intotwo categories.
Institutional buyers:Institutional/projectmarket buyers consistof large constructionfirms, corporate housesand governmentinstitutions. Thesegment accounts forlarge sales (60% of allsales in India).
Retail buyers: Retailbuyers primarilycomprisehomebuilders. Whilevolumes are lower,scattered and requirethe use of an extensivedistribution network,operating margins arehigher than in theinstitutional segment.
Tile industry : Flooring options
Italianmarble
Calcareous tiles
Source : ICCTAS, CDEL Research
Vitrified tiles
Ceramic tiles
Mosaic, Kota Stone, Porcelain tiles
Sales break-up of Euro Ceramics
30%
70%
Institutional Retail

Annual Report 2007-08 | 29
Aluminium extrusions: India is one of the most
attractive destinations for recycling aluminium. The
demand for extrusion is growing at 8%-9% every
year and is expected to touch 300,000 MT by 2010
– a 50% growth. Around 25% of the total aluminium
consumption comes from recycled waste metal.
Aluminium is increasingly becoming a replacement
for other metals, with application in false ceilings,
partitions, office cabins, window slidings and
commercial premises, over wooden and metal
frames.
Calcareous tiles: Calcareous tiles are high-value
designer tiles, targeted at the price-inelastic upper
segment of the market. These agglomerated
marbles are made from marble chips bonded with
resins, giving it an appearance similar to Italian
marble.
Sanitaryware: The sanitaryware industry in India
has grown significantly over the last few years with
leading players doubling their production capacity.
They also introduced battery casting and beam
casting around the fast-firing cycle kiln technology,
a prudent upgradation. The demand for premium
sanitaryware is growing gradually, both in India and
abroad. Sanitaryware did not account for the
Company’s revenues in 2007-08 as production
commenced in 2008-09.
Human capital at EuroThe Company employed 1,090 people, enjoying a
97% retention rate in 2007-08. It hired professionals
to train employees in leadership skills, team
building, decision-making and soft skills. It
conducted an annual Total Probability Management
workshop to emphasise skill development and
motivation. Various programmes were designed for
new recruits around induction training sessions.
The Company provided employees with facilities
like schooling for their children, hospital, housing
colony and transportation, among others.
Internal audit and controlThe Company practises an adequate system of
internal control and documented procedures,
covering the financial and operating functions. This
was designed to provide proper accounting control,
monitoring the economy and efficiency of the
Company, protecting assets from unauthorised use
or losses and ensuring the reliability of financial and
operational information. Consequently, the
Company is in a strong position to detect fraud
and/or irregularities, if any. They also ensure that
financial and other records are reliable for preparing
financial statements, collating other data and
maintaining an accountability of assets. The Audit
Committee of the Board of Directors, comprising
Independent Directors, regularly reviewed the
plans, significant audit findings and the adequacy of
internal controls, as well as compliance with
accounting standards.
VITRIFIED TILESHAVE A LONGER
LIFE SPANCOMPARED WITH
CERAMIC TILES.THIS MAKESDISCERNINGCUSTOMERS
WILLING TO PAY7%-8% PREMIUM
FOR QUALITY EUROTILES, DESPITE
CHEAPER CHINESEOPTIONS.

Vitrified tiles Aluminiumextrusions
Calcareous tiles Sanitaryware
Raw materials • Ukraine clay
• Soda feldspar
• Potash feldspar
• Ball clay
• China clay
Aluminium scrap • Marble waste
and stones
• Resins
• Potash feldspar
• Soda feldspar
• Ball clay
• China clay
Source Abundant in
Rajasthan and
Kutch, Ukraine
clay is imported
from Ukraine.
Imported from
UAE
Abundant in
Rajasthan, Gujarat
and M.P; also
imported from
various countries
across the globe.
Available in
Rajasthan and
Kutch; also
imported from
Europe.
Capacity utilisationThe Company leveraged economies of scale
through an investment in adequate capacity and
high-asset utilisation. While the Company’s
vitrified capacity was utilised to the extent of
100%, the calcareous plant was relatively under-
utilised on account of a gradual increase in
market demand, product availability for only a
part of the year and hassles related to
commencement of production – issues which
have since been corrected. The sanitaryware
unit has been commissioned in 2008-09 and is
expected to achieve a high capacity utilisation
during the current financial year. The aluminium
extrusions division also reported rated asset
utilisation during the year under review.
Raw materials managementRaw materials accounted for around 30% of the
Company’s total revenue. Euro procured raw
materials from domestic and global suppliers.
Since proximity of the plant to raw material
resource is critical to the Company’s business, it
prudently sourced majority of the raw materials
from within a radius of 600 kms from its
manufacturing location. Let us take a look at the
various raw materials used in the manufacture
of Company’s products and their sources.
30 | EURO CERAMICS LIMITED
Operational review

Euro is strategically located near the Kandla and
Mundra ports in Gujarat, which saves the
transportation cost of raw materials and
consumables which are imported. The plant is not
far from the main consuming markets for finished
products in Delhi and Mumbai. Moreover, both the
markets are equidistant from the plant. This helps
the Company reduce its payback period. Thanks to
such geographical advantages, the Company
succeeded in cutting down its logistics cost far
below the industry average. More than 50% of the
total output was sold within a 700 km radius of its
plant in 2007-08.
Captive power plantEuro’s 10-MW captive power plant runs on lignite,
which is abundant in Kutch. It enhances the
Company’s competitive advantage because tile-
manufacturing processes are power-intensive. This
power plant is catering to the power needs of each
division of the Company with a sufficient surplus for
the future needs of the sanitaryware division.
The Company enjoys a two-pronged advantage
from the power plant. First, regular plant
maintenance facilitates uninterrupted power supply,
enhancing end-product quality. Second, the
maintenance cost of the plant has also declined
because of fewer breakdowns and power
fluctuations.
Quality controlIn a business marked by the need to achieve and
maintain a high-quality consistency across different
raw material and end production batches, Euro
instituted stringent raw material appraisal standards
across consistency, applications and treatments,
leading to uniformity and predictable end-product
quality. The unmatched quality of tiles from Euro
depends largely on the technology imported from
Sacmi, Italy.
As a result, the Company maintained its ISO
9001:2000 and ISO 13006/EN 176 Group B1a
certifications. Its products enjoy appreciation from
various institutions and corporates.
Technology edgeThe Company imported an automated tile-
manufacturing facility from Sacmi, ensuring that its
products matched international standards. Euro
strengthened its investments in technology and
infrastructure upgradation through the following
initiatives:
• In the calcareous segment, the Company used
special superior quality resins as additives in the
raw material mixing process to improve
productivity.
• It upgraded its tile printing machines.
• It installed equipment timers to enhance fuel
efficiency.
• It commissioned small machines to process
smaller lots with multiple colours.
• It leveraged the use of robots and automated
technology in its sanitaryware plant.
Marketing In a business where it is imperative to market
products wide and deep across rural and urban India
as well as to individual and institutional customers,
Euro Ceramics has blended the direct customer
approach with its existing distribution network.
Annual Report 2007-08 | 31
EUROTRANSFORMED
WASTE TO WEALTHTHROUGH
AGGLOMERATEDMARBLE, WHICH IS
MADE FROMWASTE MARBLE
CHIPS AND STONECHIPS.
90% Production of first-pass
products, 2007-08
85% Production of first-pass
products, 2006-07

32 | EURO CERAMICS LIMITED
In its direct customer approach, the Company
has forged relationships with large corporates,
architects, builders, contractors, dealers and
engineers through its dedicated marketing
executives. This approach has been reinforced
through customised products, dependable
supply and strategic relationships with industry
giants, making it possible for the Company to
align its growth with that of its fast-growing
customers and enhance its brand in the
process. The success of this approach and
effectiveness of this business model is
reflected in the fact that direct marketing
constituted around 70% of the Company’s sales
in 2007-08.
The Company commissioned showrooms,
studios and franchises – Euro Stile Stations – to
display products in Mumbai, Ahmedabad, Surat,
Hyderabad, Jaipur, Chennai, Udaipur,
Bhubaneshwar and Coimbatore, among others.
Franchise retail outlets increased from 10 to 30
and the Company plans to commission more
such outlets in other cities.
The Company will cater to the growing
affluence of the burgeoning commercial sector,
requiring differentiated flooring solutions. It
provides various tile formats including
calcareous variants, resulting in a
comprehensive flooring solution across price
points.
Brand In a business where it is imperative to provide
the widest range just when the customer wants
it, Euro manufactured the largest volume in its
existence in 2007-08, even as it customised
new finishes. This generated an attractive
premium over competing products and about-
8% top-up over the Company’s basic line of
products. More importantly, this strategy
helped the Company enhance average
realisations even when there was a decline in
average industry realisations in 2007-08.
Research and development Euro is respected for its product innovation. The
Company invested Rs. 23.85 lacs in 2007-08 on
research and development as against Rs. 19.12
lacs in 2006-07. It introduced specially glued
bathroom tiles with an anti-skid facility during
the year under review.
OutlookAround 44% of the Indian ceramics industry is
unorganised. The share of the organised sector
is expected to increase over the coming years.
Such trends throw up substantial opportunities
for Companies like Euro.
Effective cost-cutting Euro reduced costs and
enhanced its competitiveness
through the following
initiatives:
• Commissioned a coal-based
hot air generator (HAG) to
produce steam, which will be
used in spray dryers to reduce
fuel costs.
• Monitored fuel wastage
through stringent
documentation.
• Acquired raw material in finer
forms to save electricity.
• Switched to diamond carbide
from silicon carbide in tile
polishing to increase speed
and productivity on the one
hand and reduce costs on the
other.

Annual Report 2007-08 | 33
Analysis of our financialstatements: 2007-08 vs 2006-07Increasing sales and profitability• Net sales increased 27.45 % from Rs. 17,908 lacs
in 2006-07 to Rs. 22,824 lacs in 2007-08.
• EBIDTA increased 21% from Rs. 6,393 lacs in
2006-07 to Rs.7,736 lacs in 2007-08.
• PAT increased from Rs. 2,827 lacs in 2006-07 to
Rs. 2,832 lacs in 2007-08.
• Cash profit increased 9.36% from Rs. 3,964 lacs
in 2006-07 to Rs. 4,336 lacs in 2007-08.
Shareholders’ return in 2007-08 Earning Book value Dividend
per share per share per share
Rs. 16.56 Rs. 115.05 Re. 0.75
Surplus managementThe Company is at that stage in its history when
every rupee invested in the business will yield far
greater returns than any other investment
opportunity. As a result, the Company reinvested
surpluses into its business with the objective of
repaying debt and strengthening its gross block. In
view of this, it maintained a strict control of its
asset-liability position at all times through a study of
the periodic cash flow statement.
Margins• The Company recorded an EBIDTA margin of
32.98% in 2007-08.
• It reported a net margin of 12.07% in 2007-08
• It also reported a cash profit margin of 18.48%
during the year.
Revenue (net sales)Revenue grew 27.45% in 2007-08 over 2006-07,
primarily on account of volume growth, increase in
the sale of its value added products, calcareous
tiles. The premium products accounted for almost
90% of the sale.
By vertical: The Company derives it revenues from
the sale of tiles (vitrified and calcareous) and
Aluminum extrusions. The revenue distribution pie
is as follows :
By geography: Domestic income grew 19.53%
from Rs. 16,594 lacs in 2006-07 to Rs. 19,835 lacs
in 2007-08, as a result of increasing consumer
Tiles Aluminum extrutions
89.91%
10.19%

preference towards vitrified tiles, as well as
enhanced commercial and retail sector growth.
Exports grew 127.58% from Rs. 1,313 lacs in 2006-
07 to Rs 2,989 lacs in 2007-08, due to new
customers, repeat orders from existing global
clients, and sales made in SEZ (deemed export)
By client: The Company caters to both retail and
institutional clients. The revenue break-up between
them is 30:70. The Company maintains a larger
share of institutional clients as they are the largest
buyers of the value-added tiles, with bulk orders.
Other incomeNon-core income increased significantly by
697.43% from Rs. 79 lacs to Rs. 634 lacs, largely on
account of the interest earned on the investment of
the IPO proceeds in risk-free fixed deposits and
exchange rate differences.
Cost analysis Total operating cost increased by 35.59% from
Rs. 11,594 lacs in 2006-07 to Rs. 15,722 lacs in
2007-08. The increase is on account of the growth
in operational scale.
34 | EURO CERAMICS LIMITED
(Rs lacs)
Absolute cost % of Net Sales Absolute cost % of Net Sales
2007-08 2007-08 2006-07 2006-07
Cost of material
(after adjusting stock of FG & WIP) 6923 30.33 3,998 22.32
Other manufacturing expenses 4,834 21.18 4,051 22.47
Employee cost 1,062 4.65 699 3.91
Administrative and selling and
distribution expenses 2,903 12.72 2,846 15.96
Total expense 15,722 11,594
A cost analysis of the key cost components reveals that material cost was the largest expense head for the
Company;
Cost of materials: Cost of material as a percentage of net sales increased due to high inventories at the
opening of the year. Otherwise it remained more or less constant.

Annual Report 2007-08 | 35
Manufacturing costs: Inspite of an increase in
operational scale, the manufacturing cost was
maintained at almost the same level. There is a
marginal decline as a percentage of sales as
compared with the previous year. It mainly consists of
stores and spares, power and fuel, repairs and
maintenance.
Employee cost: With the wage bill for the Company
increased significantly in absolute value due to the
increase in the size of the team, following new unit of
calcareous tiles and annual salary revision.
Administration and Selling and Distribution Cost:
These costs generally comprise office expenses,
insurance cost, marketing and advertisement
expenses as well as freight and other selling
expenses. The Company was able to control these
cost and bringing them down marginally.
Capital employedA volume-driven tiles business warrants progressive
investments in capacity expansion to leverage
economies of scale. The capital employed in the
business increased by Rs. 5,938 lacs during the year
under review, from Rs. 44,445 lacs in 2006-07 to
Rs. 50,383 lacs in 2007-08, to fund increased
capacities of calcareous tiles and diversification into
sanitaryware.
Own fund: The Company’s own fund comprise the
equity share capital and reserves. It increased by
9.70%, from Rs. 17,933 lakhs in 2006-07 to Rs. 19,674
lakhs in 2007-08.
Share capital: The Company’s share capital
comprised 17,100,000 equity shares of the face value
of Rs. 10 each. The Promoters continue to hold
55.31% stake in the Company’s equity.
Reserves and surplus: The Company’s reserves and
surplus increased by 10.73% from Rs. 16,223 lacs as
on March 31, 2007 to Rs. 17,964 lacs as on March 31,
2008, as a result of the plough-back of retained
earnings of Rs. 2,682 lacs. The security premium
account reduced by Rs. 941 lacs on account of
adjustment of share issue expenses. The reserves
comprised more than 91% of the shareholders’ fund –
reflecting the financial strength of the Company to
fund capital-intensive projects through internal
sources – growing the return on networth over the
coming years. The debt-equity ratio stood at 1.56 as
on March 31, 2008 as compared to 1.48 as on March
31, 2007.
External funds: The size and cost of debt creates the
difference between a Company’s success and failure.
In the short-term, it impacts profitability, while over
the long-term, it dictates the strength with which the
Company is able to mobilise funds for projects.
The Company’s reliance on external funds increased –
the debt portfolio grew from Rs. 26,512 lacs as on
March 31, 2007 to Rs. 30,709 lacs as on March 31,

36 | EURO CERAMICS LIMITED
2008 – a growth of only 15.83%. The short-term
loans were largely used to meet working capital
requirement, consequent to the growth in business
operations, whereas the long-term loans were for the
diversification into new business verticals.
Secured loans: It comprised more than 82% of the
total external debt, an increase of by 2.30% during
the year under review. Of the total, 20.02% was
earmarked for working capital purposes; 9.35% of
secured loans comprised foreign currency loans in
the form of buyers’ credit at a low coupon rate,
reducing the Company’s interest liability.
Unsecured loans: This primarily comprised loans
drawn mainly from the Company’s Directors and
other Companies. Unsecured loans increased by
209.42% in 2007-08 due to the issuance of short-
term, non-convertible unsecured debentures (NCD),
of Rs. 2,500 lacs in March 2008 and increase in loan
from Companies.
Interest: The Company’s interest outflow increased
from Rs. 1,310 lacs in 2006-07 to Rs. 3,093 lacs in
2007-08. This was mainly due to the derivative loss
of Rs. 704 lacs in the current financial year. An
increase in interest cost was also due to increase in
the coupon rate as balance increase in the debt for
working capital and capital expenditure. Further, the
interest cost on debt taken for the calcareous tiles
project has been debited in the Profit & Loss Account
as the plant was put to use in the current year,
capitalised in the previous year as per AS 16 of
borrowing cost. This resulted in a rise in the average
debt cost from 6.01% in 2006- 07 to 10,81%
in 2007-08.
Application of fundsFixed assets: The fixed assets of a company
represent its competitive edge in terms of scalability
and technological capability. Over the years, the
Company invested continuously to create a sizeable
fixed asset base. In 2007-08, the net block increased
by 45.19% from Rs. 18,128 lacs as on March 31,
2007 to Rs 26,320 lacs as on March 31, 2008. The
addition was due to the commissioning of the
calcareous tiles plant. Capital work in progress mainly
consist of capital expenditure on account of the
sanitaryware segment. The 11,000-MTPA
sanitaryware facility was commissioned in April 2008.
Depreciation: The Company consistently provided
depreciation on the Straight Line method. Increase in
the depreciation provision from Rs. 1,137 lacs in
2006-07 to Rs. 1504 lacs in 2007-08 was on account
of a higher provision on an expanded production
capacity in calcareous tiles. This additional
depreciation provided a healthy tax shield for the
Company.
Investments: There was no change in the total
investments of the Company. The Company has a
small investment portfolio of Rs. 146 lacs (0.29% of
the capital employed as on March 31, 2008). Of this,

Annual Report 2007-08 | 37
the key investment comprises shares held in its 100%
Subsidiary Company (Euro Merchandise (India) Ltd).
Working capital management: Working capital is essential
to manage the dialy fund requirements for the operations.
Working capital constituted 28.20% of the total capital
employed, the outlay decreasing from Rs. 18,996 lacs as
on March 31, 2007 to Rs. 14,207 lacs as on March 31, 2008
because of a decline in the cash and bank balance of the
Company by over 72%; the Fixed Deposits kept out of the
IPO proceeds as on March 31, 2007 was utilised in the
current financial year in the sanitaryware project.
Inventory: Inventory increased from Rs. 5,279 lacs as on
March 31, 2007 to Rs. 6,443 lacs as on March 31, 2008.
It grew mainly due to the increase in the work-in-process
and raw materials for the calcareous tiles beside storage of
colours and raw materials for vitrified tiles. Besides,
maintenance of an increasing gross block necessitated the
storage of large volumes of stores and spares.
Of the inventory as on March 31, 2008, raw material
inventory constituted 32.86%, while the work-in-process
constituted 12.28% of the inventory value. The inventory
cycle for the Company stood at 103 days in 2007-08
compared to 108 days in 2006-07.
Debtors: The Company’s debtors declined from Rs. 4,441
lacs as on March 31, 2007 to Rs. 4,408 lacs as on March
31, 2008. The Company reduced the debtors cycle from 91
days in 2006-07 to 70 days in 2007-08, as a result of more
emphasis on the collection system.
Loans and advances: Loans and advances constituted
7.7% of the total current assets, increasing from
Rs. 3,267 lacs as on March 31, 2007 to Rs. 3,857 lacs as on
March 31, 2008. This comprised advances given to
suppliers for raw materials and capital goods, security
deposits given, MAT Credit, excise duty and vat refund
balances – the advances recoverable in cash or in kind was
Rs. 2,199 lacs as on March 31, 2008 (previous year Rs.
2,906 lacs).
Current liabilities: The Company’s current liabilities decline
from Rs. 3,176 lacs as on March 31, 2007 to Rs. 2,924 lacs
as on March 31, 2008. Sundry creditors, the largest
component under this head, decreased from Rs. 2,058 lacs
as on March 31, 2007 to Rs. 1,813 lacs as on March 31,
2008. It accounted for 62% of the Company’s current
liabilities; the other liabilities include year-end provisions.
Provisions: The provisions include income tax payable net
of advance tax, leave salary and proposed dividend for the
current financial year.
Foreign exchange managementForeign exchange transactions increased due to expanding
global operations. Foreign exchange earning comprised
export earnings, which accounted for more than 8% of the
Company’s total sales mix. During the year, the Company’s
forex earning was equivalent to Rs. 1861 lacs on FOB
basis, compared with Rs. 971 lacs in 2006-07. Foreign
exchange payout comprised purchase of raw materials and
consumables as well as capital goods – resulting in a total
outgo equivalent to Rs. 6,371 lacs. In 2007-08, the
Company gained Rs. 353 lacs on account of exchange
difference on maturity of some of the buyers credit and
export sales.

38 | EURO CERAMICS LIMITED
Managing risks at Euro
RISK IS BEST DEFINED AS THE UNPREDICTABLEADVERSITIES THAT CAN AFFECT THE PROFITABILITYOF AN ORGANISATION. RISK MANAGEMENT IS ASYSTEMATIC APPROACH TO IDENTIFY, ANALYSE ANDCONTROL SUCH ADVERSITIES WHICH INCLUDE RISKPLANNING, ASSESSING RISK AREAS, DEVELOPINGRISK-HANDLING OPTIONS AND MONITORING RISKS.
At Euro Ceramics, the risk management framework is designed with the following objectives:
• Identify possible risks and assess the protable impact.
• Look beyond mere mitigation and transform risks into opportunities.
• Develop a culture where employees are enthused to respond to risks with appropriate actions.
• Make the internal and external reporting structure more effective.

Annual Report 2007-08 | 39
Industry riskAny adverse real estate trend
could affect the Company’s
topline.
Mitigation
• With the Indian economy growing in excess of
8.5% annually and rising income levels, the
housing sector demand is set to grow
significantly.
• Despite recent appreciation in property prices,
the average price of residential unit to the
average annual household income is at 5.29, still
far below the highs (15.60) and the 10-year
average of 6.82.
• A Nasscom-Deloitte study on the Indian IT
industry predicts that the IT/ITeS sector’s
contribution to the country's GDP has increased
to 5.2% in 2007 – up from 1.2% in 1998.
• The organised retail industry raked in
US$25.44 billion turnover in 2007-08 as against
US$16.99 billion in 2006-07 – a whopping
49.73% growth [Source: Credit Rating and
Information Services of India].
• Around 50% of the 1.1-bn Indian population
stays in barely liveable conditions. With surging
incomes, housing demand (74% for all real
estate demand) is expected to accelerate.
01
Competition riskThe Company runs the risk of
losing market share with
intensified competition in the
vitrified tiles segment.
Mitigation
• The Company’s locational advantage,
proximity to raw materials, use of cutting-edge
technology and investment in captive power
generation translated into an effective
competitive advantage, reflected in one of the
highest industry margins in 2007-08.
• Introduction of new designs in the vitrified
segment successfully countered competition.
• Market was strengthened through enhanced
recruitment, wider geographic coverage and
investments in institutional relationships.
• The use of top-notch technologies translated
into an attractively low production cost in the
manufacture of calcareous tiles.
• The Company’s entry into the sanitaryware
segment enhanced prospects of cross-sale.
03
Business riskLow-cost imports may depress
margins.
Mitigation
• The Indian Government imposed an anti-
dumping duty of Rs.155/sq. mt. on the import of
vitrified tiles.
• The strengthening of the Chinese currency
and weakening of the Indian currency vis-à-vis
the US dollar represents an effective hedge.
02

40 | EURO CERAMICS LIMITED
Marketing riskThe Company may not be ableto market its productssuccessfully, yielding marketshare.
Mitigation • The Company has a dedicated team of morethan 100 members engaged in direct selling.
• Around 70% of the Company’s revenue wasderived from institutional clients.
• Its clients were nationally dispersed.
• It invested in a nationally dispersed franchiseemodel marketed through exclusive storefrontsbranded as Euro Stile Stations.
• It has the flexibility to produce the requiredtiles in different batch sizes.
04
Brand risk The loss of brand recall in acrowded market place couldaffect revenues.
Mitigation • The Company marketed directly to institutionalclients, which accounted for nearly 70% of its
revenues in 2007-08.
• All the Company’s products were marketedunder the Euro brand name, an edge overunbranded competitors.
• The Company reinforced its brand throughinvestments in media and trade promotions,resulting in visibility and consumer pull.
05
Cost risk An increase in manufacturingcosts could dentcompetitiveness.
Mitigation • It installed a gasifier and hot air generator toproduce gas and steam respectively, to be usedin kiln and spray dryers to reduce the fuel cost.
• It monitored process-wise fuel consumption
through documentation to minimise fuelconsumption.
• It initiated the use of diamond carbides in thepolishing machines, enhancing speed andproductivity (higher output through fewerequipment).
• It modified processes to reduce electricityconsumption; the use of finer materialstranslated into attractive savings.
06
Quality riskErratic quality could lead to aloss of reputation and clients.
Mitigation • The Company was accredited with the ISO9001:2000, an endorsement of its quality
commitment.
• The first-quality proportion increased from85% to 90%.
• The Company enjoys a robust market share invitrified tiles, thanks to its superior productquality.
07

Annual Report 2007-08 | 41
Locational risk In a cost-sensitive business,transportation and logistics costof raw material inflow andfinished product distribution toconsuming markets could beaffected if there are longdistances between the two.
Mitigation • The raw materials for the manufacture ofvitrified tiles are abundantly available inRajasthan and Kutch, within a radius of 600 km
from the plant.
• The Company imports raw materials throughthe Kandla and Mundra ports (within a radius of45 km and 100 kms from the plant respectively).
• The Company’s production unit is located in alignite-rich belt, which assures low-cost fuel forthe competitive production of power.
• The unit’s distance from Delhi and Mumbai(around 700 km from each of the cities) ensuresrapid customer-servicing and distinct logisticsadvantages in freight-intensive transportation.
08
Productsubstitution riskThe Company’s vitrified tilesmay be substituted by ceramictiles, while its calcareous tilesmay be replaced by importedmarbles.
Mitigation Vitrified tiles are perceived to be superior toceramic tiles for the following reasons:
• These enjoy the advantages of hygiene, largerglaze, wider design range, better tensilestrength, durability, lower maintenance cost,non-porosity; facilitate joint-free applicationsand can be effectively used in high-traffic areas.
• The proportion of vitrified tiles as a proportionof the overall tiles industry has grown.
Calcareous tiles represent the followingadvantages over imported marble:
• The price gap between vitrified tiles andimported marble tiles is vast; the introduction ofcalcareous tiles represents a perfect fit betweenthese two price points, allowing the averageIndian to upgrade to a better flooring option.
• The Company enjoys a first-mover’sadvantage in this nascent segment. It created aniche: even as imported marble is marketedbetween Rs. 205 and Rs. 600 per sq. ft, thecalcareous alternative is available between Rs.121 and Rs. 300 per sq. ft.
09
Funding riskThe Company’s funding patterncould affect profitability.
Mitigation • The Company’s Rs. 77-crore sanitarywareproject was funded through its IPO in 2007.
• It mobilised debt to expand into vitrified tiles,aluminium extrusions, calcareous tiles, captivepower plant and technological enhancements.
• The Company generated Rs. 4,470 lacs ininternal accruals in 2007-08 (profit after tax plusdeferred tax plus depreciation, less proposeddividend).
10
42 | EURO CERAMICS LIMITED
Product andmarket riskThe demand for vitrified tiles
could decline.
Mitigation
• India’s per capita consumption of ceramic tiles
at 0.15 sq. mtr. represents an attractive potential,
compared with consumption in a peer country.
• As disposable incomes in India are rising,
consumers are switching to vitrified tiles over
competing alternatives for reasons of design,
pricing, maintenance, structure, colours and
durability.
• The vitrified tile segment (25% growth)
outperformed the Indian tile industry average
(15% growth) [Source: ICTAS].
12
Customerattrition riskThe Company’s over-
dependence on institutional
clients could be detrimental in
the event of attrition.
Mitigation
• Euro enjoys an ongoing relationship with
prominent industries like IT and software, retail,
banking, construction and development, etc.
• The Company enjoys more than three years of
working relations with many of its institutional
clients.
• Around 50% of the business from institutional
clients in 2007-08 was derived from existing
customers.
13
Technology riskTechnology obsolescence might
require huge reinvestments,
draining free cash flow.
Mitigation
• The Company invested in contemporary
imported technologies for the manufacture of
vitrified tiles, calcareous tiles and sanitaryware
products.
• It used special high-quality resin additives in
calcareous tiles manufacture, enhancing
productivity by 10%-15%.
• It added extra equipment to improve log
quality in the manufacture of aluminium
extrusions.
• It upgraded the printing equipment to derive
superior tile impressions.
• It achieved high fuel efficiency by installing
equipment timers.
11

SafetyAir and sound pollution can potentially disturb the neighbouring community in the manufacture of ceramic
tiles. As a responsible organisation, Euro Ceramics invested in the following safety measures:
• The compulsory use of face masks on the shop floor to protect from clay and soil dust.
• The mandatory use of ear plugs to protect from equipment noise.
• The mandatory use of hand gloves to protect against tile edges.
• The mandatory use of goggles in the power plant.
• The installation of fire extinguishers across the factory premises.
• Regular meetings for enhancing safety awareness.
Health Employees represent the most valuable asset at Euro Ceramics. The Company safeguarded employee health
and well-being through the following initiatives:
• The Company provided meals to employees twice a day.
• It commissioned two first-aid dispensaries in its plant.
• It tied up with the neighbouring hospital to treat employees and their families.
• It conducted mandatory pre-employment medical check-ups.
• It organised regular health check-up camps by doctors of reputed hospitals.
Environment • The Company ran two ETP plants to segregate clay and water, which were reused to a certain extent.
• The coal waste generated during power production was converted into bricks for captive use during capital
expansions.
• The process waste water was recycled for gardening in the plant premises.
Annual Report 2007-08 | 43
Safety, health and environment

Directors’ Report
44 | EURO CERAMICS LIMITED
Your Directors have pleasure in presenting their Sixth Annual Report of theCompany for the year ended March 31, 2008.
Financial resultsThe highlights of the financial results for the year ended March 31, 2008 are as follows:
(Rupees in lacs)
Particulars Year ended Year ended
March 31, 2008 March 31, 2007
Income:
Sales 22,917.59 17,907.80
Less: Excise duty 94.01 –
Other income 633.90 79.49
Total income 23,457.48 17,987.29
Less: Total expenditure 15,721.66 11,594.14
Earning before interest, depreciation and tax 7,735.82 6,393.15
Less: Interest and other finance expenses 3,093.17 1,309.82
Profit before depreciation and tax 4,642.65 5,083.33
Less: Depreciation 1,504.03 1,137.20
Profit before tax 3,138.62 3,946.13
Less: Provision for tax 307.00 1,118.82
Net profit after tax 2,831.62 2,827.31
Add: Balance brought forward from the previous year 5,269.49 2,776.16
Profit available for appropriation 8,101.11 5,603.47
Appropriations :
Proposed Dividend 128.25 205.20
Corporate tax on Proposed Dividend 21.80 28.78
Transfer to General Reserve – 100.00
Surplus carried to Balance Sheet 7,951.06 5,269.49

Financial performanceDuring the year under review, the Company registered a
27.98% growth in sales from Rs. 17,907.80 lacs to Rs.
22,917.59 lacs. The sales growth was achieved mainly
due to volume growth in vitrified tiles and increase in
realisation in Aluminium Sections. The Company has also
achieved a 21% increase in EBIDTA, from Rs. 6,393.15
lacs to Rs. 7,735.82 lacs. The Company made a net profit
after tax of Rs. 2,831.62 lacs as against profit of
Rs. 2,827.31 lacs in the previous year. PAT was impacted
due to higher interest costs on fixed loans, since they
were availed for the entire year as compared to the
previous year, wherein the loans were taken towards the
end of the year. In addition, the interest cost was also
higher due to a one time loss from derivative
transactions carried out in order to hedge the
outstanding foreign currency loans. The derivative
transaction was in the nature of a Swap product and was
purely for hedging purposes. The Company does not
carry out any such transaction for speculative or trading
purposes. Profit after tax was also impacted due to
higher depreciation since the Calcareous Tiles plant was
commissioned during the year.
Credit ratingDuring the year under review, the Company was
assigned the highest rating of ‘PR1 +‘(PR One Plus)
rating by Credit Analysis & Research Ltd. (CARE) for its
Rs. 50-crore commercial paper (CP)/short term debt
(STD) programme. CARE also assigned high investment
grade rating of LA + for the outstanding bank facilities as
per recently issued RBI guidelines based on Basel II
norms.
Issue of debenture and commercial paperDuring the year under review, the Company issued and
allotted 25 (twenty-five), 10.5% unsecured redeemable
non-convertible debentures, having face value of Rs.
10,000,000 (Rupees One Crore only), each aggregating
to Rs. 250,000,000 (Rupees Twenty Five Crores Only) to
UTI Mutual Fund. Subsequently, these debentures were
redeemed on April 7, 2008, and commercial paper to the
tune of Rs. 250,000,000 (Rupees Twenty Five Crores)
was issued to UTI Mutual Fund at the same coupon rate
of 10.5 % with a maturity of less than one year.
Further on April 3, 2008, the Company issued and
allotted 500,000 (five lacs), 10.20% secured redeemable
non-convertible debentures having face value of Rs.
1,000 (Rupees One Thousand Only), each aggregating to
Rs. 500,000,000 (Rupees Fifty Crores Only) to LIC Mutual
Fund Liquid Fund, which are redeemable on March 3,
2009.
The successful placement of debentures and
commercial paper during tight liquidity conditions,
confirms the financial standing of your Company, and
opens up future opportunities for tapping money
markets for expansion needs.
Operational performance
a) Tile Division:
During the year under review, the Company’s Tile
Division showed commendable growth. The Calcareous
Tiles Plant was successfully commissioned after an initial
phase of trial runs. The Company’s Vitrified Tiles continue
to do well in the market place and enjoys headship. With
the successful launching of calcareous tiles, the
Company hopes to achieve growth in sales from this
category as well.
b) Aluminium Division:
The quantity of Aluminium Sections sold during the year
Annual Report 2007-08 | 45
was higher at 1,447 MT as compared to 1,303 MT in the
previous year. The produce of Aluminium Sections
continues to enjoy superior demand in the market place.
There was an increase in average realization to Rs.
160,798 per MT as compared to Rs. 147,406 per MT in
the previous year.
c) Material cost:
The Company adopted various cost-cutting and value-
enhancing measures in order to boost profitability. A
significant saving was achieved in the cost of clay, by
various input mix without compromising on quality.
d) Exports:
Export revenues for the year continued to show positive
growth and amounted to Rs. 2,989 lacs as compared to
Rs. 1,314 lacs in the previous year, showing an increase
of 127.47%. The Company’s products continue to enjoy
good demand in the export markets. During 2007-08,
vitrified tiles were exported to the US, U.K, U.A.E and
Turkey, among others.
e) Sanitary ware Division:
The Company achieved major progress in completing the
work on site with respect to Sanitaryware facility. Your
Company would be one of the first Company in India, to
produce world-class sanitary ware with the most modern
designs, to appeal to the most discerning buyers. The
sanitary ware would be produced by employing cutting
technologies like Robots, etc. The Company is hopeful
of doing well in the Sanitaryware market by leveraging
on its existing brand, established customer base and
distribution strengths.
Product upgradationThe Company has successfully launched Calcareous
Tiles (Agglomerated Marble) in 2007-08. It has added a
complete range of Calcareous Tiles in its product basket.
The product sells among the upper rung of customers
providing a cost-effective substitute for Italian Marble.
We have added new designs to our existing product line
of Vitrified Tiles. The Company has developed scratch-free
and virtually stain-free low-thickness tiles for wall-cladding.
DividendDuring 2007-08, the Board of Directors of the Company
at their meeting held on July 7, 2008, declared interim
dividend of Re. 0.75 per share (7.5%) on equity shares
of Rs. 10 each. The outflow on account of the said
interim dividend was Rs. 150.83 lacs including corporate
dividend tax of Rs. 21.80 lacs.
In order to conserve the resources for business
requirement of the Company, your Directors do not
recommend any further dividend for the financial year
under review. The interim dividend declared by the Board
shall be considered as the final dividend.
DirectorsIn terms of Section 256 of the Companies Act, 1956, read
with Article No. 196 of the Articles of Association of the
Company, Mr. Shantilal L. Shah and Mr. Raichand K.
Shah, Directors of the Company retire by rotation at the
forthcoming Annual General Meeting and being eligible,
offer themselves for reappointment. Your Directors
recommend their reappointment as Directors of the
Company.
Mr. Jatin R. Chhadva and Mr. Nishit V. Shah were
appointed as Additional Directors of the Company w.e.f.
July 30, 2008. In terms of Section 260 of the Companies
Act, 1956, they hold office up to the date of the
forthcoming Annual General Meeting. Member’s approval
for their appointment as Directors has been sought in the
Notice convening the Annual General Meeting.
The terms of appointment of Mr. Talakshi L. Nandu, Mr.
Kumar P. Shah and Mr. Paresh K. Shah, Wholetime
Directors of the Company expired on March 31, 2008.
The Board of Directors of the Company in their meeting
46 | EURO CERAMICS LIMITED

Annual Report 2007-08 | 47
held on March 28, 2008, has reappointed them as
Wholetime Directors of the Company for a period of five
years, w.e.f. April 1, 2008. The Company has greatly
benefited from their expertise and experience. Taking
into consideration their knowledge and experience, the
Board commends to approve their reappointment as
Wholetime Directors of the Company.
Utilization of fundsThe details of the amount spent out of the proceeds of
the public issue in comparison with the amount as
projected in the prospectus are given below:
(Rs. In lacs)
Particulars Estimated As on June
cost 30, 2008
Capital expenditure 7,693.37 7,623.24
IPO expenses 835.20 942.84
General corporate
purposes 746.91 746.00
Total 9,275.48 9,312.08
Consolidated accountsIn accordance with the requirements of Accounting
Standard – AS 21, issued by the Institute of Chartered
Accountants of India, the consolidated accounts of the
Company and its subsidiary i.e. Euro Merchandise (India)
Limited, together with the Auditors’ and Directors’
Report thereon, are annexed to this report.
Directors' Responsibility StatementThe Directors of the Company confirm, pursuant to
Section 217 (2AA) of the Companies Act, 1956, that:
1. In the preparation of the annual accounts, the
applicable accounting standards have been followed
along with the proper explanations relating to material
departures;
2. They have selected such accounting policies and
applied them consistently and made judgments and
estimates that are reasonable and prudent, so as to
give a true and fair view of the state of affairs of the
Company at the end of the financial year and of the
profit of the Company for that period;
3. They have taken proper and sufficient care for the
maintenance of adequate accounting records in
accordance with the provisions of this act for
safeguarding the assets of the Company and for
preventing and detecting fraud and other
irregularities;
4. They have prepared the annual accounts on a going
concern basis.
Corporate GovernanceThe Company is committed to conduct its business with
the highest level of integrity and transparency and
implementing the best of international practices of
Corporate Governance. The commitment of the
Company is clearly reflected in its business activities.
Pursuant to Clause 49 of the Listing Agreement with
stock exchanges, a separate report on Corporate
Governance forms part of the Directors’ Report. Your
Company is compliant with the requirements of the
Listing Agreement and necessary disclosures have been
made in this regard in the Corporate Governance Report.
A certificate from the Auditors of the Company regarding
compliance of conditions of Corporate Governance as
stipulated under Clause 49 of the Listing Agreement is
attached to this report.
Management Discussion and AnalysisManagement Discussion and Analysis forms part of
Directors’ Report and is given in a separate section in the
Annual Report.

Energy conservation, technology absorption andforeign exchangeThe particulars required under Section 217(1) (e) of the
Companies Act, 1956, read with Companies (Disclosure
of Particulars in the Report of Board of Directors) Rules,
1988, are given in Annexure – A attached to this Report.
SubsidiaryThe Company has two subsidiaries, namely Euro
Merchandise (India) Limited (EMIL) and Euro Glass
Limited (EGL). The Company has acquired 1,500,000
equity shares of Rs. 10 each, of EGL on June 1, 2008 and
accordingly it has become a subsidiary of the Company
with a stake of 54.67%. The said Company was
incorporated on October 31, 2007 and is under the pre-
operative stage for setting up of a float glass project. As
on March 31, 2008, EGL was not a subsidiary of the
Company, hence the financial statements of EGL are not
attached herewith.
Euro Merchandise (India) Limited is a wholly owned
subsidiary of the Company and information pursuant to
Section 212 of the Companies Act, 1956, with regard to
EMIL is furnished in this report.
Public depositsYour Company has not accepted any deposits from the
public within the meaning of Sections 58A and 58 AA of
the Companies Act, 1956, during the year under review.
Particulars of employeesIn accordance with Sub Section (2A) of Section 217 of
the Companies Act, 1956, read with the Companies
(Particulars of Employees) Rules, 1975, as amended, a
statement of information relating to the employees has
been given in the Annexure–I which forms part of the
report.
The Board desires to place on record, its appreciation to
all employees of the Company who, during the year
review, with sustained dedicated effort, enabled the
Company to deliver a good all-round record performance.
AuditorsM/s. Deepak Maru & Co., Chartered Accountants,
Statutory Auditors of the Company, holds office until the
conclusion of the ensuing Annual General Meeting and is
eligible for reappointment. The Company has received
letter from them to the effect that their reappointment, if
made, would be within the prescribed limits under
Section 224(1B) of the Companies Act, 1956, and that
they are not disqualified for such reappointment within
the meaning of Section 226 of the said act.
Auditors’ ReportThe observations made in the Auditors’ Report, read
together with the relevant notes thereon, are self-
explanatory and hence, do not call for any comments
under Section 217 of the Companies Act, 1956.
AppreciationYour Directors acknowledges with gratitude and wish to
place on record, their deep appreciation of continued
support and cooperation received by the Company from
the various government authorities, shareholders,
bankers, business associates, dealers, customers,
financial institutions and investors during the year.
Your Directors place on record their deep appreciation
of the dedication and commitment of your Company’s
employees at all levels and look forward to their
continued support in the future as well.
For and on behalf of the Board of Directors
Nenshi L. Shah Paresh K. Shah
Managing Director Director
Place: Mumbai
Date: July 30, 2008
48 | EURO CERAMICS LIMITED

Annual Report 2007-08 | 49
Annexure - IInformation under Section 217 (2A) read with Companies (particulars of employees)Rules, 1975, and forming part of the Directors Report for the year ended March 31, 2008.
Name and (Age) Qualifications Designation/ Date of Gross Last
nature of duties commencement remuneration employment
of employment
and (experience)
Nenshi L. Shah Matriculation Managing Director April 1, 2003 2,100,000 Self employed
(49 yrs) (28 yrs )
Talakshi L. Nandu Matriculation Wholetime Director April 1, 2003 2,100,000 Self employed
(58 yrs) (33 yrs)
Kumar P. Shah S.Y.B.Com Wholetime Director April 1, 2003 2,100,000 Self employed
(49 yrs) (25 yrs)
Paresh K. Shah M.Com Wholetime Director April 1, 2003 2,100,000 Self employed
(39 yrs) (18 yrs)
Notes:
1. Designation denotes the nature of duties also.
2. Other terms and conditions are as per the service rules and conditions of the Company.
3. The nature of the employment of all the above employees is contractual.
4. Gross remuneration comprises of salary, commission, allowance, medical, other perquisites and Company’s
contribution to PF and superannuation funds.

A. Conservation of energyThe Company continued its policy of giving priority to
energy conservation measures including regular review
of energy generation, distribution, consumption and
control on utilisation of energy.
1. During the year under report, various energy
conservation measures implemented by the Company
include :
a. Installation of a hot air generator (HAG) for
generation of steam which will be used in the spray
dryer to reduce the energy cost further.
b. Conduction of an energy audit by an external
agency of international repute, as it conducts every
year as an energy conservation tool.
c. Improvisation of power factor up to unity to achieve
saving in maximum demand.
d. Adoption of automatic cut-off system for turbo
crusher, so that blunger motor stopped
automatically when mixing completed.
e. Arrangement of auto pressure controlling system
for gasifire and HAG.
f. Provision of electrical timers in the polishing
machines, turbo blungers, which are the major
power-consuming equipments, to control the idle
running time.
g. Maintaining optimum batch size.
2. Impact of the measures taken above for reduction of
energy consumption and consequent impact on the
cost of production of goods:
The above measures have resulted in savings in
energy consumption and consequent decrease in
cost of production.
3. Total energy consumption and energy consumption
per unit of production is given in Form A, annexed
herewith.
B. Technology absorption: Information is given in the prescribed Form B annexed
herewith
C. Foreign exchange earnings and outgoThe information on foreign exchange earnings and outgo
is contained in Annexure - I of Schedule ‘X’
50 | EURO CERAMICS LIMITED
Annexure – ‘A’ to Directors’ ReportThe particulars required under Section - 217(1)(e) of the Companies Act, 1956, read withCompanies (Disclosure of Particulars in the Report of Board of Directors) Rules, 1988, areas under:

Annual Report 2007-08 | 51
Form A(See Rule 2)
Form for disclosure of particulars with respect to Conservation of Energy
a. Power and Fuel consumption
Current year Previous year
1. Electricity :
i) Purchased
Units (KWH) 1,417,404 606,360
Total amount (Rs.) * 9,366,664 6,119,300
Cost/unit (Rs.) 6.61 10.09
ii) Own generation
(a) Through liquid fuel generator
Units (KWH) 967,796 1,040,407
Units (KWH)/Ltrs. of LDO/HSD/furnace oil 2.15 2.95
Cost/unit (Rs.) 12.09 10.66
(b) Through steam turbine/generator
Units (KWH) 29,159,300 25,204,505
Units (KWH)/ tonne of Fuel (Lignite) 641 870
Cost/unit (Rs.) 2.72 2.22
2. Propane/LPG gas
Quantity (MT) 8,723.43 8,035.39
Total amount (Rs.) 315,339,819 257,780,744
Average rate (Rs./MT) 36,148.60 32,080.67
3. Furnace oil
Quantity (Ltrs) 211,685 149,319
Total amount (Rs.) 5,071,498 2,941,063
Average rate (Rs./Ltrs.) 23.96 19.70
4. Coal :
Quantity (MT) 4,848.07 3,968.83
Total amount (Rs.) 29,115,062 18,678,483
Average rate (Rs./MT) 6,005.50 4,706.29

Form B(See Rule 2)
52 | EURO CERAMICS LIMITED
b. Consumption per unit of production
Current year Previous year
i) Electricity (KWH/MT of Tiles) 343.98 334.66
ii) Electricity (KWH/MT of Aluminium Sections) 362.33 482.31
iii) Furnace oil (Ltrs./MT of Aluminium Sections) 150.34 113.12
iv) Propane/LPG gas (MT/MT of Vitrified Tiles) 0.09 0.10
v) Coal (MT/MT of Vitrified Tiles) 0.05 0.05
* Minimum demand charges paid to Pachim Gujarat Vij Company Limited have been included in the above cost.
Form for disclosure of particulars with respect to
technology absorption
1. Research and Development
a) Specific area in which R&D carried out by the
Company:
1. The Company has developed scratch-free and virtually
stain-free, low-thickness tiles for wall cladding.
2. Introduction of new designs in the existing product
line of Vitrified tiles and in new product line of
Agglomerated Marble with various input mix.
3. Introduction of fully automatic electro magnetic
separator in the ball mill for removal of iron particles.
4. Maintaining the quality standards.
b) Benefits derived as results of above R&D.
The benefit to the Company resulting from R&D activities
has been reflected in terms of:
1. Increase in market share in the global market with
new business on the quality appeal.
2. Improvement in quality and production.
3. Better designing and high-aesthetic work in low-
thickness tiles.
c) Future plan of action
1. Maintain the quality standard and continuous efforts
to be made for reduction in cost of production.
2. Introducing the crusher unit and clay washing unit for
better quality.
3. Continuous efforts to be made for introducing new
product in bigger sizes of Vitrified Tiles.
4. To set new design in the Agglomerated Marbles, with
different input mix.
d) Expenditure on Research and Development
Current Previous
year (Rs.) year (Rs.)
I. Capital expenditure 1,589,395 1,404,482
II. Recurring expenditure 796,193 507,231
III. Total 2,385,588 1,911,713
IV. Total R&D expenditure as
percentage to total turnover 0.10 % 0.10 %

a. Information regarding technology imported during the last five years
Technology Year of import
Has technologybeen fullyabsorbed
If NO, areas where this hasnot taken place, and reasonsand future plans of action
Complete machinery for manufacturing of thevitrified tiles with state-of-the-art plant. (First phaseof plant-1st line)
2003 Yes Not Applicable
Complete machinery for manufacturing of thevitrified tiles with state-of-the-art plant. (Secondphase-2nd line)
2005 Yes Not Applicable
Gasifier gas station 2005 Yes Not Applicable
Depremometer 2005 Yes Not Applicable
Complete machinery for manufacturing of thevitrified tiles with state-of-the-art plant. (Forproducing 900x900 and 600x1200 size tiles)
2006 Yes Not Applicable
Complete machinery for manufacturing of theAgglomerated Marble with state-of-the-art plant.
2006 Yes Not Applicable
Complete machinery for the manufacturing of thesanitary ware products with the state-of-the-artplant.
2007 No It is under implementationand will be commissionedfrom April 2008
Machinery called water jet machines for producingthe different sizes of vitrified tiles and with differentdesigns
2007 No It is under implementationand will be commissionedfrom July 2008
2. Technology absorption, adoption andinnovation
A) Efforts in brief made towards technology absorption,adoption and innovation
1. Installation of complete plant to manufacture anAgglomerated Marble, which is an artificial marble.
2. Installation of cutting machines.
3. Increases number of colour silos and slip storagetanks.
4. Introduction of screen printing machine.
5. Design grids developed in-house for bigger size tiles.
6. Introduction of new machines for wall cladding tiles.
7. The size of mould cavity is increased for gettingquality product.
8. Carbide liners are used in press instead of SS.
9. Additional burners are fixed in kiln for better firingand high productivity.
10. Swing calibration is being used in third line polishing.
B) Benefits derived as a result of the above efforts
1. A complete range of Agglomerated Marble has beenintroduced in the market adding a new product in theproduct basket of the Company.
2. Improvement in the quality and reduction in the costof production.
3. Able to introduce new product varieties of tiles ofdifferent sizes in different thickness, in the market.
4. Production flexibility increased to enable us torespond to the market demands in a faster way.
Annual Report 2007-08 | 53

1. Company’s philosophy on code ofgovernanceCorporate Governance is both the structure and
relationships which determine corporate direction and
performance. It comprises processes and structures by
which the business and affairs of the Company are
directed and managed, in order to enhance long-term
shareholder value, through enhancing corporate
performance and accountability, whilst taking into
account the interests of all stakeholders. It is based on
the principles of integrity, fairness, equity, transparency,
accountability and commitment to values.
Good governance practices stem from the quality and
mindset of the organisation. Euro Ceramics visualises
‘Corporate Governance’ as a process which provides
transparency of corporate policies, strategies and the
decision-making process and also strengthens internal
control systems and helps in building relationship with
stakeholders. Our Company, through Corporate
Governance, strives for an exemplary shift in its work
culture and provides a congenial environment to
harmonise the goals of maximising the stakeholders’
value and maintaining a customer-centric focus in all its
dealings.
2. Board of Directors
a) Composition
The Board of Directors provides strategic direction and
thrust to the operations of the Company. As on March
31, 2008, the Board of Directors of the Company has an
optimum combination of Executive and Non-Executive
Directors. The Board comprises four Executive Directors
and seven Non-Executive Directors of which four are
Independent Directors.
SEBI vide circular no. SEBI/CFD/DIL/CG/1/2008/08/04
dated April 8, 2008, has modified the existing Clause 49
of the Listing Agreement to the effect that if the Non-
Executive Chairman is a Promoter or is related to
Promoters or persons occupying management positions
at the Board level or at one level below the Board, at least
one-half of the Board of the Company should consist of
Independent Directors. In order to comply with the
revised Clause 49 of the Listing Agreement, our
Company on July 30, 2008, has appointed two new
Independent Directors and accepted the resignation of
one Non-Executive Non-Independent Director of the
Company. Thereafter, as on July 30, 2008, the Board
comprises of total 12 Directors out of whom, six are
Independent, four are Executive and two are Non-
Executive Directors. Hence, the Company is complying
with the provisions of revised Clause 49 of the Listing
Agreement entered into with the stock exchanges.
b) Board procedure
The agenda for the Board Meetings and committee
meetings, containing relevant information/ supporting
data, as required, are distributed well in advance to all
the Board members from time to time in a structured
54 | EURO CERAMICS LIMITED
Report on Corporate Governance

manner, to enable the Board to take informed decisions.
When deemed expedient, the Board also approves by
circular resolution important items of business which are
permitted under the Companies Act, 1956, and which
can not be deferred till the next Board Meeting.
Matter discussed at Board Meeting generally relate to
Company’s performance, quarterly results of the
Company, approval of related-party transactions, general
notice of interest of Directors, review of the reports of
the internal auditors, Audit Committee and compliance
with their recommendation, suggestion, compliance of
any regulatory, statutory or listing requirements, etc.
c) Attendance at Board Meetings and last Annual
General Meeting
During the year under review, the Board of Directors met
seven times viz. April 20, 2007, July 25, August 18,
October 25, November 22, January 23, 2008, March 28,
2008 and as required, the gap between two Board
Meetings did not exceed four calendar months.
The attendance record of the Directors at Board
Meetings held during the financial year 2007-08, number
of Directorships held and position of membership/
Chairmanship of committees in Indian Public Limited
Companies are given below:
Annual Report 2007-08 | 55
Name Nature of No. of No. of No. of other Membership/ Whether
Directorship Board Board Directorship in Chairmanship attended
Meetings Meetings other Public of committees in the last
held attended Companies other Companies AGM
Mr. Nenshi L. Shah Chairman &
Managing Director 7 7 6 1 1 YES
Mr. Shantilal L. Shah Non-Executive Director 7 4 1 – – YES
Mr. Talakshi L. Nandu Wholetime Director 7 2 3 – – YES
Mr. Kumar P. Shah Wholetime Director 7 3 2 – – YES
Mr. Paresh K. Shah Wholetime Director 7 7 3 – – YES
Mr. Lalji K. Shah Non-Executive Director 7 2 1 – – YES
Mr. Pravin D. Gala* Non-Executive Director 7 5 – – – YES
Mr. Shivji K. Vikamsey Independent Director 7 6 1 2 1 YES
Mr. Raichand K. Shah Independent Director 7 1 1 – – YES
Mr. Anil M. Mandevia Independent Director 7 5 1 – – NO
Mr. Amit G. Shah Independent Director 7 6 1 – – NO
* Mr. Pravin D. Gala has resigned from the Board w.e.f. July 30, 2008, and on the same day Mr. Jatin R. Chhadva
and Mr. Nishit V. Shah are appointed as Independent Directors of the Company.
None of the Directors of the Board serves as member of more than ten committees, nor are Chairman of more than
five committees across all Companies in which he/she is a Director. Committees considered for this purpose are
those specified in Clause 49 of the Listing Agreement i.e. Audit Committee and Shareholders’/Investor’ Grievance
Committee.

56 | EURO CERAMICS LIMITED
3. Committees of the BoardThe Board has constituted three committees consisting
of members of the Board. Details of the committee and
other related information are provided hereunder:
a) Audit Committee
The Company has an Audit Committee in accordance
with the requirement of Section 292A of the Companies
Act, 1956, and the terms of reference are in conformity
with Clause 49 of the Listing Agreement entered into with
the stock exchanges. The committee comprises three
Independent Directors and a Chairman and Managing
Director of the Company. The Statutory Auditors are also
invited to the meetings. Ms. Jayshree D. Soni, Company
Secretary, acts as Secretary to the Audit Committee. The
committee oversees the work carried out by the
management, internal auditors on the financial reporting
process, the safeguards employed by them and such
relevant matters as it finds necessary to entrust.
The Audit Committee met four times on April 20, 2007,
July 25, October 25 and January 23, 2008, during the
year under review and the number of meetings attended
by each member during the year ended March 31, 2008
is as under:
Name of the Designation No. of
member committee
meetings
Held Attended
Mr. Shivji Vikamsey Chairman 4 4
Mr. Anil M. Mandevia Member 4 3
Mr. Amit G. Shah Member 4 4
Mr. Nenshi L. Shah Member 4 4
All the members of the Audit Committee are financially
literate and Mr. Shivji K. Vikamsey, Chairman, is a
qualified Chartered Accountant has the relevant
accounting and related financial management expertise.
The Committee has recommended the appointments of
M/s. Deepak Maru & Co., Chartered Accountants, as the
Statutory Auditors of the Company.
The terms of reference of this committee are wide.
Besides having access to all the required information
from the Company; the committee acts as a link
between the Statutory Auditors and the Board of
Directors of the Company.
The brief description of terms of references are as
follows:
• It shall have authority to investigate into any matter in
relation to the items specified in Section 292A of the
Companies Act, 1956, or referred to it by the Board and
for this purpose, shall have full access to information
contained in the records of our Company and external
professional advice, if necessary.
• To investigate any activity within its terms of reference.
• To seek information from any employee.
• To obtain outside legal or other professional advice.
• To secure attendance of outsiders with relevant
expertise, if it considers necessary.
• Oversight of the Company’s financial reporting process
and the disclosure of its financial information, to ensure
that the financial statement is correct, sufficient and
credible.
• Recommending the appointment and removal of
external auditor, fixation of audit fee and also approval
for payment for any other services.
• Reviewing with management, the annual financial
statements, before submission to the Board, focusing
primarily on:
- Any changes in accounting policies and practices.
- Major accounting entries based on exercise of
judgement by management.
- Qualifications in Draft Audit Report.
- Significant adjustments arising out of audit.

Annual Report 2007-08 | 57
- The going concern assumption.
- Compliance with accounting standards.
- Compliance with stock exchanges and legal
requirements concerning financial statements.
- Any related-party transactions, i.e. transaction of the
Company of material nature, with promoters or the
management, their subsidiaries or relatives, etc., that
may have potential conflict with the interest of the
Company at large.
• Reviewing with the management, external and internal
auditors and the adequacy of internal control systems.
• Reviewing the adequacy of internal audit function,
including the structure of the internal audit department,
staffing and seniority of the official heading the
department, reporting structure coverage and frequency
of internal audit.
• Discussion with internal auditors and significant
findings and follow-up thereon.
• Reviewing the findings of any internal investigations by
the internal auditors into matters where there is
suspected fraud or irregularity or a failure of internal
control systems of a material nature and reporting the
matter to the Board.
• Discussion with external auditors before the audit
commences; nature and scope of audit as well as post
audit discussion to ascertain any area of concern.
• Reviewing the Company’s financial and risk
management policies.
• To look into the reasons for substantial defaults in the
payment to the depositors, debenture-holders,
shareholders (in case of non-payment of declared
dividends) and creditors.
• It shall have discussions with the auditors periodically,
about internal control systems, the scope of audit
including the observations of the auditors and review the
quarterly, half-yearly, and annual financial statements
before submission to the Board.
• It shall ensure compliance of internal control systems.
b) Shareholders’/Investors’ Grievance Committee
The committee comprises two Non-Executive Directors
and two Executive Directors. The Shareholders’/
Investors’ Grievance Committee met four times on May
7, 2007, July 25, October 25 and January 23, 2008,
during the year under review, and the number of
meetings attended by each member during the year
ended March 31, 2008, is as under:
Name of the Designation No. of
member committee
meetings
Held Attended
Mr. Shantilal L. Shah Chairman 4 3
Mr. Kumar P. Shah Member 4 1
Mr. Lalji K. Shah Member 4 1
Mr. Paresh K. Shah Member 4 4
Broad terms of reference
To examine and redress the complaints and grievances
of the shareholders/investors of the Company such as
transfer/transmission/demat/remat of shares, issue of
duplicate, split-up, consolidation, renewal of share
certificate, non-receipt of Annual Report, non-receipt of
dividend, non-receipt of application money and other
issues concerning the shareholders/investors.
The Committee also looks into matters which can
facilitate/smoothen investor’s services and relations.
Wherever deemed expedient, it also directs the RTA to
ensure prompt redressal of genuine complaints of
investors. The committee also examines and
recommends to the Board about appointment/removal
of RTA and/or fees payable to them, etc.
Details of shareholders’ complaints
The Company Secretary has been regularly interacting

58 | EURO CERAMICS LIMITED
with Registrar and Share Transfer Agents (RTA) to ensure
that the complaints/grievances of the
shareholders/investors are attended to without delay,
and where deemed expedient, the complaints are
referred to the Chairman of the committee or discussed
at its meetings.
A total of six complaints were received and replied to the
satisfaction of the shareholder during the year ended
March 31, 2008. There were no complaints outstanding
as on March 31, 2008. No investor grievances remained
unattended/pending for more than 30 days.
c) Remuneration Committee
The Remuneration Committee has been constituted to
review remuneration payable to Executive Directors,
based on their performance and vis a vis with the
performance of the Company on defined assessment
parameters. The remuneration policy of the Company is
directed towards rewarding performance, based on
review of achievements on a periodic basis. The
remuneration policy is in consonance with the industry
standards.
During the year under review, two meeting were held on
July 25, 2007 and March 28, 2008.
The composition of the Remuneration Committee as on
March 31, 2008 is as follows:
Name of the Designation No. of
member committee
meetings
Held Attended
Mr. Anil M. Mandevia Chairman 2 1
Mr. Raichand K. Shah Member 2 1
Mr. Lalji K. Shah Member 2 –
Mr. Amit G. Shah Member 2 2
Details of remuneration paid to the Directors during the year 2007-08 are as follows:
Executive Directors
The aggregate value of salary and perquisites paid for the year ended March 31, 2008, to the Managing Director and
Wholetime Directors is as follows:
(Amount in Rupees)
Name Designation Salary Perquisites or allowances Total
Mr. Nenshi L. Shah Managing Director 2,048,400 51,600 2,100,000
Mr. Talakshi L. Nandu Wholetime Director 2,048,400 51,600 2,100,000
Mr. Kumar P. Shah Wholetime Director 2,048,400 51,600 2,100,000
Mr. Paresh K. Shah Wholetime Director 2,048,400 51,600 2,100,000
Non-Executive Directors
No remuneration is paid to Non-Executive Directors. They are paid by way of sitting fees at the rate of Rs. 2,500 for
each meeting attended by them. The sitting fees paid during the financial year 2007-08 is as follows:

Special Resolutions
AGM held on September 30, 2005: No Special
Resolution was passed.
AGM held on August 24, 2006: 1) A Special Resolution
was passed for amendment of main object clause of
Memorandum of Asssociation; 2) A Special Resolution
was passed for alteration of Articles of Association
AGM held on September 28, 2007: 1) A Special
Resolution was passed under Section 163 of the
Companies Act, 1956, for maintenance of records viz i)
register of members and ii) copies of annual returns,
prepared under Section 159 of the Companies Act, 1956,
of the Company, at the office of the Company’s
Registrar, M/s. Intime Spectrum Registry Limited.
Resolution passed through postal ballot
During the financial year 2007-08, consent of members
of the Company was sought through postal ballot for the
subject matters mentioned herein below
The postal ballot process was undertaken in accordance
with the provisions of Section 192A of the Companies
Act, 1956, read with the Companies (passing of the
resolution by postal ballot) Rules, 2001.
Mr. Manish L. Ghia, practicing Company Secretary, was
appointed as Scrutinizer for conducting the postal ballot
process. The results of the postal ballot were announced
on December 31, 2007.
The details of resolutions passed through postal ballot
and the voting pattern for the same are as follows:
Annual Report 2007-08 | 59
Name of the Director Sitting fees paid No. of shares held No. of stock options granted
(Rupees)
Mr. Shantilal L. Shah 10,000 Nil Nil
Mr. Pravin D. Gala 12,500 236,400 Nil
Mr. Lalji K. Shah 5,000 151,600 Nil
Mr. Shivji K. Vikamsey 15,000 Nil Nil
Mr. Raichand K. Shah 2,500 Nil Nil
Mr. Anil M. Mandevia 12,500 Nil Nil
Mr. Amit G. Shah 12,500 Nil Nil
4. General Body Meetings and postal ballotLocation, time and date where last three Annual General Meetings were held are given below:
Financial year AGM dates Time Location of the meeting
2004-05 September 30, 2005 4.00 p.m. 208, Sangam Arcade, Opp. Railway Station,
Vile Parle (West), Mumbai- 400056
2005-06 August 24, 2006 2.30 p.m. Boston House, Ground Floor, Suren Road, Chakala,
Andheri (East), Mumbai- 400093
2006-07 September 28, 2007 10.30 a.m. S.P.B.T. College, JVPD Scheme, Vile Parle (West),
Mumbai- 400056

5. Disclosures
a) Related-party transactions
Related-party transactions are defined as transactions of
the Company of material nature, with Promoters,
Directors or with their relatives; its subsidiaries, etc., that
may have potential conflict with the interest of the
Company at large. None of the transactions with any of
the related parties were in conflict with the interest of
the Company.
Details on material significant related-party transactions
are given in the appended financial statement under
Notes to the Accounts annexed to the financial
statements.
b) Compliance by the Company
The Company has complied with the requirements of the
stock exchanges, SEBI and other statutory authorities on
all matters relating to capital market during the last three
years. No penalties or strictures have been imposed on
the Company by the stock exchanges, SEBI or other
statutory authorities.
Though there is no formal whistle-blower policy, the
Company takes cognizance of complaints made and
suggestions given by the employees and others. Even
anonymous complaints are looked into and whenever
necessary, suitable corrective measures are
implemented.
60 | EURO CERAMICS LIMITED
Sl. Business Postal ballot Valid votes cast
No. forms received
Total Valid Total In favour Against
1 Special Resolution under section 81 (1A) 311 286 10,833,073 10,832,277 796
of the Companies Act, 1956, for issue
of equity shares on preferential basis
2 Special Resolution under Section 81 (1A) 311 281 10,832,071 10,831,221 850
of the Companies Act, 1956, for issue
of FCCBs/GDRs/ADRs/Permissible
Securities/Instruments.
3 Ordinary Resolution under Section 94 of 311 280 10,832,036 10,831,699 337
the Companies Act, 1956 for increase in
Authorized Shares Capital of the Company
4 Ordinary Resolution under Section 16 of 311 278 10,831,636 10,831,284 352
the Companies Act, 1956, for alteration
of Clause V of the Memorandum of
Association.
5 Special Resolution for investment by 311 281 10,832,071 10,831,227 844
FIIs up to 49% of the Equity Share Capital
of the Company.
6 Special Resolution under Section 372A of 311 280 10,831,991 10,829,405 2,586
the Companies Act, 1956, for making
investments, loans and providing guarantee
or security.

c) Code of conduct
The Company has laid down a code of conduct for the
Directors, senior management and the employees of the
Company. The code has been posted on the Company’s
website. A declaration to the effect that the Directors and
senior managerial personnel have adhered to the same,
signed by the Managing Director of the Company, forms
part of this report.
d) Disclosure of Accounting Treatment
In the preparation of the financial statement, the
Company has followed accounting standards issued by
the Institute of the Chartered Accountants of India, to the
extent applicable.
e) Disclosure of Risk Management
The Company has initiated the risk assessment and
minimisation procedure which has been given in other
section of this report.
f) CEO/CFO Certification
In terms of Clause 49 (V) of the Listing Agreement, Mr.
Nenshi L. Shah, Chairman and Managing Director and
Mr. Piyush Gupta, Chief Financial Officer, have submitted
a certificate to the Board of Directors in the prescribed
format for the year under review.
g) Review of Directors’ Responsibility Statement
The Board, in its report, has confirmed that the annual
accounts for the year ended March 31, 2008, have been
prepared as per applicable accounting standards and
policies, and that sufficient care has been taken for
maintaining adequate accounting records.
6. Means of communication• Quarterly results: Quarterly results are published in
accordance with the provisions of the Listing Agreement.
The results are published in English newspapers viz.
Economic Times, Business Standard and in Marathi
newspapers viz. Maharashtra Times, Mumbai
Lakshadweep.
• Website: The Company’s website, www.eurovitrified.com,
contains a separate dedicated section – "Investor
Relationship" – where shareholders information is
available. Un-audited quarterly results, annual results and
shareholding pattern, code of conduct for the Board of
Directors and senior management personnel, are also
available on the website in a user-friendly and
downloadable form.
• The presentations, as and when made to the
institutional investors and analysts, are also
simultaneously displayed on the website of the
Company.
• Management Discussion and Analysis forms part of the
Annual Report.
7. General information for shareholdersa) Date, time and venue of Annual General Meeting
Date : September 30, 2008
Time : 10.00 a.m.
Venue : S.P.B.T. College, JVPD Scheme, Vile Parle
(West), Mumbai – 400056
b) Financial calendar (2008-09)
First quarterly results - Up to the end of July, 2008
Second quarterly results - Up to the end of October, 2008
Third quarterly results - Up to the end of January, 2009
Fourth quarterly results - Up to the end of April, 2009
c) Date of Book Closure
Wednesday, September 24, 2008 to Tuesday,
September 30, 2008 (both days inclusive)
d) Dividend payment date
Not applicable
e) Listing on stock exchanges
Bombay Stock Exchange Limited (BSE) and National
Stock Exchange of India Limited (NSE)
f) Stock Code/Symbol
BSE - 532823
NSE - EUROCERA
ISIN for CDSL and NSDL - INE649H01011
Annual Report 2007-08 | 61

BSE Sensex ECL
62 | EURO CERAMICS LIMITED
Months
0
50
100
150
200
250
300
ECL
Clo
sing
Pric
e
Apr’ 07 May’ 07 June’ 07 Jul’ 07 Aug’ 07 Sep’ 07 Oct’ 07 Nov’ 07 Dec’ 07 Jan’ 08 Feb’ 08 Mar’ 08
NSE Sensex ECL
Months
0
50
100
150
200
250
300
ECL
Clo
sing
Pric
e
Apr’ 07 May’ 07 June’ 07 Jul’ 07 Aug’ 07 Sep’ 07 Oct’ 07 Nov’ 07 Dec’ 07 Jan’ 08 Feb’ 08 Mar’ 08
g) Market price dataThe monthly high and low quotations of shares traded on the Bombay Stock Exchange Limited (BSE) and NationalStock Exchange of India Limited (NSE) during each month in 2007–08 are as follows:
Month BSE NSE
High (Rs.) Low (Rs.) High (Rs.) Low (Rs.)
Apr ’07 149.50 119.50 144.90 122.90
May ’07 159.00 121.55 156.70 123.30
Jun ’07 175.70 135.00 169.35 141.35
Jul ’07 193.00 162.30 188.45 165.65
Aug ’07 191.00 132.00 177.30 141.15
Sep ’07 196.80 174.35 193.85 175.30
Oct ’07 224.00 181.20 220.50 187.90
Nov ’07 230.00 183.00 221.65 189.95
Dec ’07 269.00 207.00 257.35 212.85
Jan ’08 275.00 161.45 257.65 161.90
Feb ’08 210.00 158.20 204.45 165.30
Mar ’08 173.75 109.80 170.00 118.30

Annual Report 2007-08 | 63
Shareholding pattern
Mutual Funds 0%
Promoters56%
Foreign Institutional Investors 9%
Bodies Corpoate 11%
Trust 0%
Clearing Member 1%
Directors (Other than Promoters) 1%
Resident Individuals (Public) 13%
Non Resident Indians 9%
h) Shareholding pattern as on March 31, 2008
Sr. No. Category Number of shares held Percentage of shareholding (%)
1 Promoters 9,458,500 55.31
2 Mutual Funds 60,000 0.35
3 Foreign Institutional Investors 1,513,182 8.85
4 Bodies Corporate 1,934,751 11.31
5 Trust 242 0.00
6 Clearing Member 110,251 0.64
7 Non Resident Indians 1,602,951 9.37
8 Directors (other than Promoters) 236,400 1.38
9 Resident Individuals (Public) 2,183,723 12.77
Total 17,100,000 100
i) Distribution of shareholding as on March 31, 2008
Category Number of % of total number Total number % of total
shareholders of shareholders of shares number of shares
1 to 500 6,974 93.31 741,868 4.34
500 to 1,000 189 2.53 155,644 0.91
1,001 to 2,000 105 1.40 159,462 0.93
2,001 to 3,000 51 0.68 133,436 0.78
3,001 to 4,000 14 0.19 49,484 0.29
4,001 to 5,000 26 0.35 122,132 0.71
5,001 to 10,000 34 0.46 222,319 1.30
10,001 and above 81 1.08 15,515,655 90.74
Total 7,474 100 17,100,000 100

j) Share transfer system
All shares sent or transferred in physical form are
registered by the Registrar and Share Transfer Agents
within 30 days of the lodgement, if documents are found
in order. Shares under objection are returned within two
weeks. All requests for dematerialisation of shares
processed and the confirmation is given to the
respective depositories i.e. National Securities
Depository Limited (NSDL) and Central Depository
Services Limited (CDSL) within 15 days. The Company
obtains, from a practicing Company Secretary, a half-
yearly certificate of compliance with the share transfer
formalities as required under Clause 47 (c) of Listing
Agreement entered into with stock exchanges and files
a copy of the certificate with the concerned stock
exchanges.
k) Dematerialisation of shares and liquidity
As on March 31, 2008, the total number of equity shares
of the Company in dematerialisation form, stood at
14,305,162 shares (representing 83.66% of the
Company’s paid-up Equity Share Capital)
The trading in equity shares of the Company is permitted
only in dematerialised form. Considering the advantages
of trading in demat form, members are encouraged to
consider dematerialisation of their shares, so as to avoid
inconvenience in future. The Company has paid the
listing fees for the year 2008–09.
l) Outstanding ADRs, GDRs, Warrants or any convertible
instruments, conversion date and impact on equity
Your Company has not issued any ADRs, GDRs,
Warrants or any convertible instruments.
m) Plant location
Survey No. 510, 511, 512, 517/1, Bhachau Dudhai Road,
Bhachau (Kutch), Gujarat – 370140
n) Registrar and Share Transfer Agents
M/s. Intime Spectrum Registry Limited has been
appointed as one-point agency, for dealing with
shareholders. Shareholders correspondence should be
addressed to the Company’s Registrar & Share Transfer
Agent at the address mentioned below:
M/s. Intime Spectrum Registry Limited
C-13, Pannalal Silk Mills Compound,
L.B.S. Marg, Bhandup (West), Mumbai – 400 078
Tel: 91 22 2596 3838 • Fax: 91 22 2594 6969
E-mail: [email protected]
o) Address for investor correspondence
Shareholders can contact the Company Secretary for
share/secretarial related matters of the Company at the
below mentioned address:
Ms. Jayshree D. Soni, Company Secretary
Euro Ceramics Limited
Boston House, Ground Floor, Suren Road, Chakala,
Andheri (East), Mumbai 400093
E-mail: [email protected]
Tel No.: 91 22 4019 4019 • Fax No.: 91 22 4019 4020
64 | EURO CERAMICS LIMITED
Dematerialised formPhysical form
16.34%
83.66%

p) Subsidiary Companies
The Company has one material unlisted Subsidiary Company, namely Euro Merchandise (India) Limited (EMIL) and has
appointed one Independent Director of the Company on the Board of the said Subsidiary.
For Euro Ceramics Limited
Nenshi L. Shah
Chairman and Managing Director
Place: Mumbai
Date: July 30, 2008
It is hereby confirmed that the Company has adopted a code of conduct for the Board of Directors and senior
management personnel of the Company and all have affirmed their adherence to the code during the year. The code
has been posted on the Company’s website (www.eurovitrified.com)
For Euro Ceramics Limited
Nenshi L. Shah
Chairman and Managing Director
Place: Mumbai
Date: July 30, 2008
Annual Report 2007-08 | 65
Declaration on compliance with code of conduct

To the members of
EURO CERAMICS LIMITED
We have examined the compliance of the conditions of Corporate Governance by EURO CERAMICS LIMITED for the
year ended March 31, 2008, as stipulated in Clause 49 of the Listing Agreement of the Company with the stock
exchanges.
The compliance of conditions of Corporate Governance is the responsibility of the management. Our examination
was limited to the procedures and implementation thereof, adopted by the Company for ensuring the compliance of
the conditions of Corporate Governance. It is neither an audit nor an expression of the opinion on the financial
statements of the Company.
In our opinion and based on the information and explanations given to us and the representations made by the
management and to the best of our knowledge and belief, we certify that the Company has complied with the
conditions of Corporate Governance as stipulated in the above-mentioned Listing Agreement.
We further state that such compliance is neither an assurance as to the future viability of the Company nor the
efficiency or effectiveness with which the management has conducted the affairs of the Company.
For Deepak Maru & Co.
Chartered Accountants
Deepak M. Maru
Partner
Membership No: 49347
Place: Mumbai
Date: July 30, 2008
66 | EURO CERAMICS LIMITED
Auditors Certificate on Clause 49, compliance –Corporate Governance

Annual Report 2007-08 | 67
To,The Members ofEuro Ceramics Limited
1) We have audited the attached BalanceSheet of Euro Ceramics Limited as atMarch 31, 2008 and also the Profit andLoss Account for the year ended on thatdate and the Cash Flow Statement for theyear ended on that date both annexedthereto. These financial statements are theresponsibility of the Company’sManagement. Our responsibility is toexpress an opinion on these financialstatements based on our audit.
2) We have conducted our audit inaccordance with the auditing standardsgenerally accepted in India. Thosestandards require that we plan andperform our audit to obtain reasonableassurance about whether the financialstatements are free from materialmisstatements. An audit includesexamining, on a test basis, evidencesupporting the amounts and disclosures inthe financial statements. An audit alsoincludes assessing the accountingprinciples used and significant estimatesmade by management, as well asevaluating the overall presentation of thefinancial statement. We believe that ouraudit provides a reasonable basis for ouropinion.
3) As required by the Companies (Auditor’sReport) Order, 2003 as amended by theCompanies (Auditor’s Report)(Amendment) Order, 2004 issued by the
Central Government of India in terms ofSub-Section (4A) of Section 227 of theCompanies Act, 1956, we enclose in theAnnexure a statement on the mattersspecified in paragraphs 4 and 5 of the saidOrder.
4) Further to our comments in the Annexurereferred to in paragraph 3 above, we reportas follows:
a. We have obtained all the information andexplanations, which to the best of ourknowledge and belief were necessary forthe purpose of our audit;
b. In our opinion, proper books of account asrequired by law have been kept by theCompany so far as appears from ourexamination of such books;
c. The Balance Sheet and Profit and LossAccount and Cash Flow Statement dealtwith by this report are in agreement withthe books of account;
d. In our opinion, the Balance Sheet and Profitand Loss Account and Cash FlowStatement dealt with by this report complywith the Accounting Standards referred toin Sub-Section (3C) of Section 211 of theCompanies Act, 1956;
e. On the basis of written representationsreceived from the Directors, and taken onrecord by the Board of Directors, as onMarch 31, 2008, we report that none of the
Director is disqualified as on March 31,2008 from being appointed as a Director interms of clause (g) of sub-section (1) ofsection 274 of the Companies Act, 1956;
f. In our opinion and to the best of ourinformation and according to theexplanations given to us, the said accountsread with significant accounting policies,notes to accounts give the informationrequired by the Companies Act, 1956, inthe manner so required and present a trueand fair view in conformity with theaccounting principles generally acceptedin India:
i) in the case of the Balance Sheet, of thestate of affairs of the Company as at March31, 2008;
ii) in the case of the Profit and Loss Account,of the profit of the Company for the yearended on that date; and
iii) in the case of the Cash Flow Statement, ofthe cash flows for the year ended on thatdate.
For Deepak Maru & Co.Chartered Accountants
Place: Mumbai Deepak M. MaruDate: July 30, 2008 Partner
Membership No.: 49347
Auditors’ Report

68 | EURO CERAMICS LIMITED
Annexure to the Auditors' Report(Referred to in paragraph 3 of our report of even date)
(1) In respect of Fixed Assets:a) The Company has maintained proper
records showing full particulars includingquantitative details and situation of itsfixed assets.
b) As explained to us, the managementduring the year at reasonable interval hasphysically verified the assets and nomaterial discrepancies were noticed onsuch verification.
c) The Company has not disposed off anysubstantial part of the fixed assets duringthe year.
(2) In respect of its Inventories:a) The inventory has been physically verified
during the year by the management. Inour opinion, the frequency of suchverification is reasonable.
b) In our opinion and according to theinformation and explanations given to us,the procedures of physical verification ofinventories followed by the Managementare reasonable and adequate in relationto the size of the Company and thenature of its business.
c) In our opinion and according to theinformation and explanations given to us,the Company has maintained properrecords of its inventories. Thediscrepancies noticed on verificationbetween the physical stocks and thebook records were not material.
(3) In respect of Loans Taken / Granted:a) According to the information and
explanation given to us, the Companyhas taken unsecured loans from sevenparties covered in the register maintainedunder section 301 of the Companies Act,1956. The maximum amount involvedduring the year was Rs. 60,335,343/- and
the year end balance of loans taken fromsuch parties was Rs. 16,458,230/-
b) According to the information andexplanation given to us, the Companyhas granted loans to two parties coveredin the register maintained under section301 of the Companies Act, 1956. Themaximum amount involved during theyear was Rs. 46,402,043/- and the year-end balance of loans given to suchparties was Rs. 28,619,268/-.
c) In our opinion, the rate of interest andother terms and conditions on whichloans mentioned above have beentaken/granted are not, prima facie,prejudicial to the interest of theCompany.
d) In the absence of stipulations in respectof the terms of payment of principalamount and interest for the loanstaken/granted, it is not possible tocomment whether the principal andinterest payments are regular.
(4) In respect of register maintained u/s. 301of the Companies Act, 1956:
a) In our opinion, and according toinformation and explanations given to us,the particulars of contracts orarrangements referred to in section 301of the Companies Act, 1956 have beenso entered in the register required to bemaintained under that section.
b) In our opinion, and according to theinformation and explanations given to us,the transactions made in pursuance ofcontracts or arrangements entered in theregister maintained under section 301 ofthe Companies Act, 1956 and aggregatingduring the year to Rs. 5,00,000/- or more inrespect of each party, have been made atprices which are reasonable having regard
to the prevailing market prices at therelevant time.
(5) In our opinion and according to theinformation and explanations given to usthe Company has not accepted anydeposits from the public within themeaning of the provisions of section 58Aor section 58AA or any other relevantprovisions of the Act & the rules framedthere under.
(6) In our opinion and according to theinformation and explanations given to us,there is an adequate internal controlprocedure commensurate with the sizeof the Company and the nature of itsbusiness with regards to purchases ofinventory, fixed assets and with regardsto the sale of goods. During the courseof our audit, no major weakness hasbeen noticed in the internal controlsystem in respect of these areas.
(7) In our opinion, the Company has aninternal audit system commensurate withthe size and nature of its business
(8) We have broadly reviewed the books ofaccount maintained by the Companypursuant to the Rules made by theCentral Government for the maintenanceof cost records under section 209(1)(d) ofthe Companies Act, 1956 for itsAluminium Division and are of theopinion that prima facie, the prescribedaccounts and records have been madeand maintained.
(9) In respect of Statutory Dues:a) The Company is generally regular in
depositing with appropriate authoritiesundisputed statutory dues includingIncome tax, Sales tax, VAT, Wealth tax,Custom duty, Excise Duty, Taxdeducted/collected at source, Provident

Annual Report 2007-08 | 69
Fund, Employees’ State Insurance, Cessand other material statutory duesapplicable to it and there are no arrearsoutstanding as at the year end for aperiod of more than six months from thedate they became payable, except forsome minor delays in depositing themwith the appropriate authorities duringthe year.
b) According to the information andexplanation given to us, there are nodues of Income tax, Sales Tax, VAT,Wealth tax, Customs duty, Excise dutyand cess, which have not been depositedon account of any dispute.
(10) The Company does not have anyaccumulated losses at the end offinancial year and has not incurred cashlosses during the financial year coveredby our audit and the immediatelypreceding financial year.
(11) In our opinion and according to theinformation and explanations given to us,the Company has not defaulted inrepayment of dues to any of the banks orfinancial institutions during the year.
(12) According to the information andexplanations given to us, the Companyhas not granted loans and advances on
the basis or security by way of pledge ofshares, debentures and other securities.
(13) The Company is not a chit fund or anidhi/mutual benefit fund/society. Hencethe provisions of clause 4(xiii) of theCompanies (Auditor’s Report) Order,2003 are not applicable to the Company.
(14) In our opinion, the Company is notdealing in or trading in shares, securities,debentures and other investments.Accordingly, the provisions of clause4(xiv) of the Companies (Auditor’s Report)Order, 2003 are not applicable to theCompany.
(16) In our opinion, the term loans are beingapplied for the purpose for which theywere obtained.
(17) According to the information andexplanations given to us and on an overallexamination of the balance sheet of theCompany, we report that no funds raisedon short-term basis have been utilised forlong-term investment.
(18) According to the information andexplanations given to us, the Companyhas not made preferential allotment ofshares to parties and companies covered
in the register maintained under section301 of the Act.
(19) According to the information andexplanations given to us, during the yearcovered by our audit report, theCompany has issued Non ConvertibleUnsecured Debentures.
(20) The monies raised by way of PublicIssue, have been utilised for the end useas stated in the prospectus, howeversurplus funds pending utilization for thestated purpose are being temporarilyinvested in Fixed Deposits.
(21) According to the information andexplanations given to us, no fraud on orby the Company has been noticed orreported during the course of our audit.
For Deepak Maru & Co.Chartered Accountants
Place: Mumbai Deepak M. MaruDate: July 30, 2008 Partner
Membership No.: 49347
(15) According to the information and explanations given to us, the Company has given following guarantees for loans taken by its SubsidiaryEuro Merchandise (India) Ltd. from banks, however the terms of issue of said guarantee are not prejudicial to the interest of the Company:
Sr. No. Date of Guarantee Guarantee Favouring Amount (Rs.) Guarantee on Account of
1. 14-12-2007 Barclays Bank PLC 5.0 crores Letter of Credit limit.
2. 08-01-2007 Syndicate Bank 14.0 crores Working Capital & Term Loan
3. 13-09-2007 The Cosmos Co-op. Bank Ltd. 16.2 crores Working Capital, Term Loan and Letter of Credit limit.
Total 35.2 crores

70 | EURO CERAMICS LIMITED
Balance Sheet(Amount in Rupees)
As at As atSchedule March 31, 2008 March 31, 2007
SOURCES OF FUNDSShareholders' FundsShare Capital A 171,000,000 171,000,000 Reserves & Surplus B 1,796,361,672 1,622,336,331
1,967,361,672 1,793,336,331 Loan FundsSecured Loans C 2,534,757,315 2,477,887,071 Unsecured Loans D 536,170,930 173,282,752
3,070,928,245 2,651,169,823 Deferred Tax Liabilities 126,468,767 98,019,085 Total Funds Employed 5,164,758,684 4,542,525,239 APPLICATION OF FUNDS Fixed AssetsGross Block E 2,981,712,958 2,012,140,615 Less : Accumulated Depreciation 349,721,753 199,318,521 Net Block 2,631,991,205 1,812,822,095 Capital Work In Progress 1,097,496,422 815,484,230
3,729,487,627 2,628,306,325 Investments F 14,610,750 14,610,750 Current Assets, Loans & AdvancesInventories G 644,337,180 527,910,619 Sundry Debtors H 440,792,796 444,147,309 Cash & Bank Balances I 265,081,387 954,878,736 Loans & Advances J 385,650,861 326,723,474
1,735,862,225 2,253,660,138 Less : Current Liabilities & Provisions KCurrent Liabilites 292,443,998 317,634,498 Provisions 22,757,920 36,417,476
315,201,918 354,051,974 Net Current Assets 1,420,660,307 1,899,608,164Miscellaneous Expenditure (to the extent not written off) – –Total Funds Utilised 5,164,758,684 4,542,525,239 Significant Accounting Policies & Notes on Accounts X
Schedules referred to above form an integral part of the Accounts
As per our attached report of even date By order of the Board of DirectorsFor Deepak Maru & Co. For Euro Ceramics Ltd.Chartered Accountants
Deepak M. Maru Nenshi L. Shah Paresh K. Shah Jayshree D. SoniPartner Managing Director Director Company SecretaryMembership No. 49347
Place : Mumbai Place : MumbaiDate : July 30, 2008 Date : July 30, 2008

Annual Report 2007-08 | 71
Profit and Loss Account
Schedules referred to above form an integral part of the Accounts
As per our attached report of even date By order of the Board of DirectorsFor Deepak Maru & Co. For Euro Ceramics Ltd.Chartered Accountants
Deepak M. Maru Nenshi L. Shah Paresh K. Shah Jayshree D. SoniPartner Managing Director Director Company SecretaryMembership No. 49347
Place : Mumbai Place : MumbaiDate : July 30, 2008 Date : July 30, 2008
(Amount in Rupees)
For the year ended For the year endedSchedule March 31, 2008 March 31, 2007
INCOMESales & Income from Operations 2,291,758,875 1,790,779,613Less: Excise Duty 9,400,991 –
2,282,357,884 1,790,779,613 Other Income L 63,389,971 7,949,279
2,345,747,855 1,798,728,892 EXPENDITURE(Increase)/Decrease In Stock M (44,799,984) (210,328,848)Cost of Materials N 737,066,810 610,096,772 Salaries, Wages and Employee Benefits O 106,179,659 69,958,013 Manufacturing, Selling & Other Expenses P 773,719,357 689,688,339
1,572,165,842 1,159,414,276 Earnings Before Interest, Depreciation & Tax 773,582,013 639,314,616 Interest & Other Finance Expenses (Net) Q 309,317,193 130,981,984 Profit Before Depreciation 464,264,819 508,332,633Depreciation 150,403,232 113,720,134 Profit Before Tax 313,861,587 394,612,499Provision for Taxation– Current Tax 32,263,683 73,873,961 – MAT Credit (32,263,683) –– Deferred Tax 28,449,672 36,577,967 – Fringe Benefit Tax 2,250,000 1,430,000 Net Profit 283,161,915 282,730,571Balance Brought Forward 526,948,832 277,616,191 Profit Available for Appropriation 810,110,747 560,346,762 APPROPRIATIONSProposed Dividend 12,825,000 20,520,000 Corporate Tax on Dividend 2,179,609 2,877,930 General Reserves – 10,000,000 Capital Redemption Reserves – –Surplus Carried to Balance Sheet 795,106,138 526,948,832
810,110,747 560,346,762 Basic & Diluted Earnings Per Share - Rs. 16.56 23.62 (Face Value of Rs. 10/- Each)Significant Accounting Policies & Notes on Accounts X

72 | EURO CERAMICS LIMITED
Schedules to Balance Sheet(Amount in Rupees)
As at As atMarch 31, 2008 March 31, 2007
A SHARE CAPITALAuthorised35,000,000 Equity Shares of Rs. 10/- each 350,000,000 200,000,000 Total 350,000,000 200,000,000 Issued, Subscribed & Paid Up Equity Share Capital 17,100,000 (Previous Year 17,100,000) Equity Shares of Rs. 10 each fully Paid up 171,000,000 171,000,000 Total 171,000,000 171,000,000
As at As atMarch 31, 2008 March 31, 2007
C SECURED LOANSFrom Banksa) Vehicle Loans 14,964,532 5,914,192 b) Term Loans & Buyers Credit 2,012,224,875 1,917,300,654 c) Cash Credit Facilities 507,567,908 554,672,225 Refer Note No. 4 of Schedule "X"Total 2,534,757,315 2,477,887,071
D UNSECURED LOANSFrom Directors 61,080,425 82,782,310 From Shareholders & Others 10,000,000 10,763,204 From Companies 134,718,230 59,613,007 From Banks 58,210,344 –From Dealers - Security Deposits 22,161,931 20,124,231 Non Convertible Unsecured Debentures 250,000,000 –Refer Note No.5 of Schedule "X"Total 536,170,930 173,282,752
Additions Deductions/ Balance as at during Adjustments Balance as atApril 1, 2007 the year during the year March 31, 2008
B RESERVES AND SURPLUSShare Premium (Refer Note No. 1 of Schedule “X”) 1,085,387,500 – 94,131,966 991,255,534 General Reserves 10,000,000 – – 10,000,000 Surplus as per P & L A/c 526,948,831 268,157,306 – 795,106,138 Total 1,622,336,331 268,157,306 94,131,966 1,796,361,672 Previous Year 491,671,191 1,130,665,140 – 1,622,336,331

Annual Report 2007-08 | 73
Schedules to Balance Sheet(Amount in Rupees)
E FIXED ASSETSPARTICULARS GROSS BLOCK DEPRECIATION NET BLOCK
Cost as on Additions Deletions Cost as on Upto For the On As on As on As on
Mar-31-2007 Mar-31-2008 Mar-31-2007 Year Deletions Mar-31-2008 Mar-31-2008 Mar-31-2007
TANGIBLE ASSETS
I Land - Freehold 2,544,001 29,704,496 1,233,090 31,015,407 - - - - 31,015,407 2,544,001
II Building 376,652,137 76,555,828 - 453,207,965 22,047,289 12,808,071 - 34,855,360 418,352,605 354,604,849
III Plant & Machinery 1,319,274,614 841,365,400 - 2,160,640,014 136,660,230 105,731,060 - 242,391,290 1,918,248,724 1,407,013,404
IV Furniture & Fixtures 29,434,904 2,252,020 - 31,686,924 2,555,008 1,916,997 - 4,472,005 27,214,919 26,734,595
V Office Equipments 8,153,168 1,634,414 - 9,787,582 713,285 420,448 - 1,133,733 8,653,849 7,585,184
VI Vehicles 14,046,684 13,712,083 - 27,758,767 2,873,876 1,824,554 - 4,698,430 23,060,337 11,172,808
VII Computers 4,590,868 1,088,340 - 5,679,208 1,423,613 820,646 - 2,244,259 3,434,949 3,167,255
VIII Power Project 257,434,239 4,492,852 - 261,927,091 33,035,220 26,881,456 - 59,916,676 202,010,415
INTANGIBLE ASSETS
IX Trade Mark Rights 10,000 - - 10,000 10,000 - - 10,000 - -
Total 2,012,140,615 970,805,433 1,233,090 2,981,712,958 199,318,521 150,403,232 - 349,721,753 2,631,991,205 1,812,822,095
Previous Year 1,704,872,233 376,205,451 68,937,069 2,012,140,615 85,954,892 113,720,134 356,505 199,318,521 1,812,822,095 1,618,917,341
As at As atMarch 31, 2008 March 31, 2007
F INVESTMENTSNON-TRADE INVESTMENTSI Unquoted
35,075 Shares of The Cosmos Co-Op. Bank Ltd. (Pledged with Bank) 350,750 350,750 II National Saving Certificate 10,000 10,000 TRADE INVESTMENTSIII Shares of Subsidiary 14,250,000 14,250,000
Euro Merchandise (India) Ltd. (190,000 Equity Shares of Rs. 10/- eachfully paid up at a premium of Rs. 65/- per share)
Total 14,610,750 14,610,750
G INVENTORIESa) Finished Goods 285,296,013 305,465,584 b) Stores & Spares 52,079,356 33,841,964 c) Raw Materials & Consumables 211,764,243 154,771,054 d) Packing Materials 6,630,722 8,357,866 e) Work In Process 79,136,571 14,167,016 f) Stock-in-Transit 9,430,275 11,307,135
(As Valued & Certified by the Management)Total 644,337,180 527,910,619
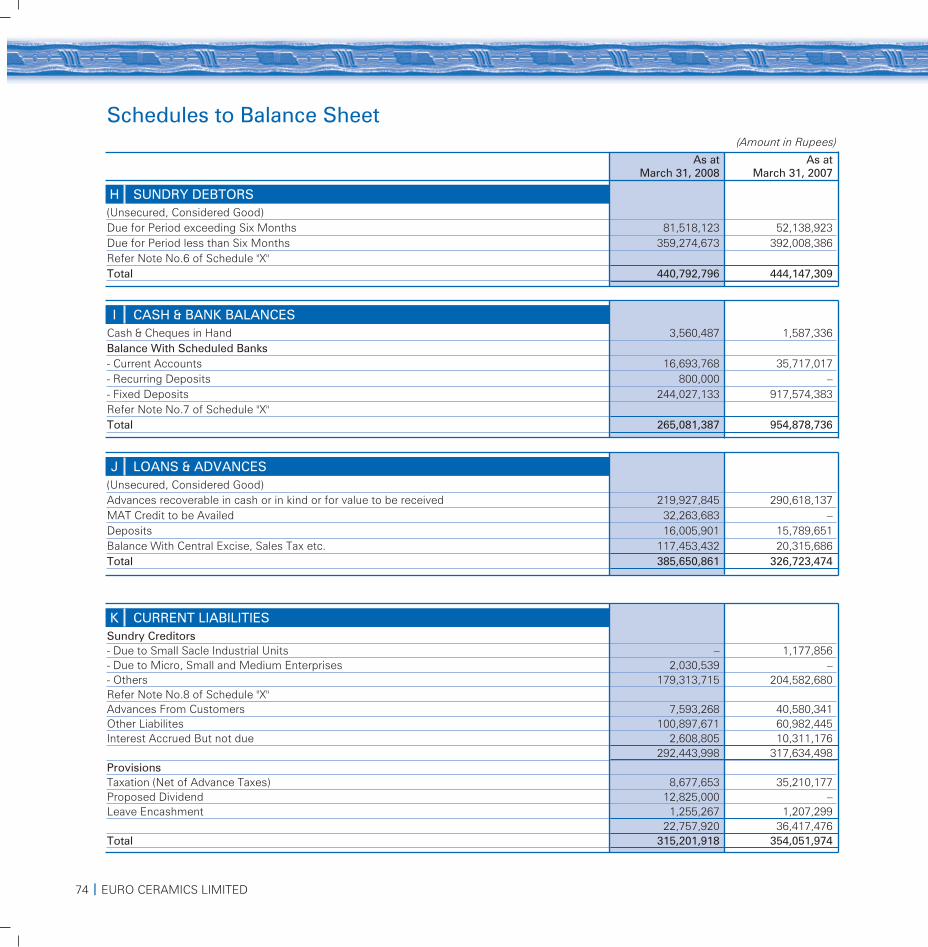
74 | EURO CERAMICS LIMITED
(Amount in Rupees)
As at As atMarch 31, 2008 March 31, 2007
H SUNDRY DEBTORS(Unsecured, Considered Good)Due for Period exceeding Six Months 81,518,123 52,138,923 Due for Period less than Six Months 359,274,673 392,008,386 Refer Note No.6 of Schedule "X"Total 440,792,796 444,147,309
I CASH & BANK BALANCESCash & Cheques in Hand 3,560,487 1,587,336 Balance With Scheduled Banks- Current Accounts 16,693,768 35,717,017 - Recurring Deposits 800,000 –- Fixed Deposits 244,027,133 917,574,383 Refer Note No.7 of Schedule "X"Total 265,081,387 954,878,736
J LOANS & ADVANCES(Unsecured, Considered Good)Advances recoverable in cash or in kind or for value to be received 219,927,845 290,618,137 MAT Credit to be Availed 32,263,683 –Deposits 16,005,901 15,789,651 Balance With Central Excise, Sales Tax etc. 117,453,432 20,315,686 Total 385,650,861 326,723,474
K CURRENT LIABILITIES Sundry Creditors- Due to Small Sacle Industrial Units – 1,177,856 - Due to Micro, Small and Medium Enterprises 2,030,539 –- Others 179,313,715 204,582,680 Refer Note No.8 of Schedule "X"Advances From Customers 7,593,268 40,580,341 Other Liabilites 100,897,671 60,982,445 Interest Accrued But not due 2,608,805 10,311,176
292,443,998 317,634,498 ProvisionsTaxation (Net of Advance Taxes) 8,677,653 35,210,177 Proposed Dividend 12,825,000 –Leave Encashment 1,255,267 1,207,299
22,757,920 36,417,476 Total 315,201,918 354,051,974
Schedules to Balance Sheet

Annual Report 2007-08 | 75
(Amount in Rupees)
For the year ended For the year endedMarch 31, 2008 March 31, 2007
L OTHER INCOMEDividend 15,000 15,000 Interest on FD - IPO 25,859,572 4,719,967 Miscellanies Receipt (4,069) –Rent Received 2,182,133 1,800,000 Exchange Rate Difference 35,299,365 1,414,312 Profit on Sale of Land 37,970 –Total 63,389,971 7,949,279
M (INCREASE) /DECREASE IN STOCKOpening StockFinished Goods 305,465,584 100,209,044 Work In Process 14,167,016 9,094,708
319,632,600 109,303,752 Closing StockFinished Goods 285,296,013 305,465,584 Work In Process 79,136,571 14,167,016
364,432,584 319,632,600 (Increase) /Decrease (44,799,984) (210,328,848)
N COST OF MATERIALSRaw Material Consumption 660,962,039 554,961,351 Purchase of Goods traded 20,628,419 21,323,319 Packing Material Consumption 55,476,352 33,812,102 Total 737,066,810 610,096,772
O SALARIES, WAGES & EMPLOYEE BENEFITSSalaries, Wages, and Bonus 83,226,552 57,599,181 Contributions to Providend & Other Funds 2,812,421 2,087,822 Welfare Expenses 20,140,686 10,271,010 Total 106,179,659 69,958,013
Schedules to Profit and Loss Account

76 | EURO CERAMICS LIMITED
(Amount in Rupees)
For the year ended For the year endedMarch 31, 2008 March 31, 2007
P MANUFACTURING, SELLING & OTHER EXPENSESConsumptions of Stores & Spares 14,599,459 8,785,611 Power & Fuel 435,287,509 371,527,011 Processing Charges 6,805,601 5,993,135 Brokerage & Commission 11,203,323 12,797,374 Advertisement 32,066,936 29,023,081 Audit Fees 250,000 100,000 Repairs & Maintenance- Building 524,413 752,400 - Plant & Machinery 21,791,819 15,366,844 - Others 4,374,785 2,698,480 Director Remuneration 8,400,000 4,800,000 Director Sitting Fees 70,000 85,000 Donation 7,315,368 9,388,380 Insurance 28,335,551 27,639,992 Loss on Sale of Fixed Assets – 384,358 Rent, Rates & Taxes 11,897,292 12,039,118 Freight Outwards 91,556,407 115,593,096 Other Selling Expenses 52,193,569 41,626,479 Miscellaneous Expenses 47,047,325 31,087,980 Total 773,719,357 689,688,339
Schedules to Profit and Loss Account
Q INTEREST & OTHER FINANCE EXPENSESInterest on Fixed Loans 163,746,594 84,393,640 Interest Others 76,909,765 53,708,369 (Profit)/Loss from Derivatives / SWAP 70,401,860 –Other Financial Charges 10,304,979 7,609,719
321,363,198 145,711,728 Less : Interest Income
Interest on Fixed Deposits With Banks 11,587,653 8,367,254 Other Interest 458,352 6,362,490
Total 309,317,193 130,981,984

Annual Report 2007-08 | 77
(A) SIGNIFICANT ACCOUNTING POLICIESI Basis of Preparation of Financial Statements
The Financial statements are prepared under the historicalcost convention, on an accrual basis, and in accordance withthe relevant provisions of the Companies Act, 1956 and theapplicable mandatory Accounting Standards issued by theInstitute of Chartered Accountants of India.
II Fixed AssetsFixed Assets are stated at historical cost (net of CENVAT creditavailed) less accumulated depreciation/ amortization thereonand/or recoverable value in case of Impairment, if any. Costcomprises the purchase price and any attributable cost ofbringing the asset to its working condition for its intended useand also comprises of borrowing costs attributable toacquisition and construction of assets up to the date whensuch asset is ready for its intended use.
III Depreciation a) Depreciation is provided on Straight Line Method at the
rates and in the manner specified in the Schedule XIV ofthe Companies Act, 1956.
b) The Ceramic Plant and the allied Machineries have beenclassified as a continuous process plant on technicalassessment & depreciation has been providedaccordingly.
c) Depreciation on the Fixed Assets added/disposed off/discarded during the period has been provided on pro-rata basis with reference to the month ofaddition/disposal/discarding.
d) Depreciation on the amounts capitalised on account offoreign exchange fluctuation is provided prospectivelyover residual life of the assets.
IV Borrowing Costa) Borrowing Costs attributable to acquisition and
construction of qualifying assets are capitalised as a partof the cost of such asset up to the date when such assetsis ready for its intended use. A qualifying asset is the onethat necessarily takes a substantial period to get ready forintended use.
b) Other borrowing costs are recognised as an expense inthe period in which they are incurred.
V Foreign Currency Transactionsa) Transactions in foreign currency are accounted at the
exchange rate prevailing on the date of transaction. Ratefluctuation between the transaction date and thesettlement date in respect of revenue transactions are
recognised in Profit & Loss account and in respect ofacquisition of the fixed assets are adjusted to the cost ofthe respective assets.
b) All export proceeds / import payables not realised at theyear end are restated at the rate prevailing at the year end.The exchange difference arising there on has beenrecognised as income / expenses in the current year’sProfit & Loss account.
c) Monetary Assets & Liabilities denominated in ForeignCurrency are translated at year end exchange rates andthe Profit/Loss so determined is recognised in the Profit& Loss account.
d) (i) As per the Provisions of the AS 11 of the ICAI, theprofit/loss on cancellation or renewal of derivativeinstruments such as forward contract and optioncontract undertaken to hedge exchangefluctuation/price risks are recognised asincome/expenses in the Profit & Loss account for theyear.
(ii) Option contract open at the year end are recognisedat the year end rate and the Mark to Marketdifference taken to revenue account.
VI InvestmentsLong Term Investments are stated at cost less provision, ifany, for permanent diminution in their value.
VII Inventoriesa) Raw Materials, components, stores and spares are valued
at lower of cost and net realizable value.
b) Work in Progress and finished goods are valued at lowerof cost and net realizable value. Cost comprises of directmaterials, direct labour, other costs of conversion andother costs incurred in bringing the inventories to theirpresent location and condition.
c) Cost of inventories is computed on Weighted Average /FIFO basis.
VIII Revenue Recognitiona) Sales are recorded net of returns.
b) Export Incentives on Advance License are recognised onaccrual basis.
c) Interest Income is recognised on accrual basis anddividend income is accounted for when the right toreceive the same is established.
IX Retirement Benefitsa) The Company’s contributions in respect of Provident
Notes to the financial statements For the year ended March 31, 2008
X SIGNIFICANT ACCOUNTING POLICIES AND NOTES ON ACCOUNTS

78 | EURO CERAMICS LIMITED
Notes to the financial statements For the year ended March 31, 2008
X SIGNIFICANT ACCOUNTING POLICIES AND NOTES ON ACCOUNTS (Contd.)
(Rupees in Lacs)
Particulars Estimated ActualUtilization Utilization upto
Amount March 31, 2008a. Setting up of manufacturing
facilities for Sanitary WareProducts project atBhachau, Kutch 7,693.37 7,039.95
b. General Corporate Purposes 1,156.91 746.00 c. Public Issue Expenses 835.20 942.84 Total 9,685.48 8,728.79
The Balance of unutilised IPO proceeds were kept in FixedDeposits and current account with bank and will be utilised in duecourse. The share issue expenses have been adjusted against theshare premium account
(Amount in Rupees)
Current Year Previous Year
2. Estimated amount ofcontracts remaining to beexecuted on capital accountand not provided for. 636,767,764 272,502,873
3. Contingent Liabilities not provided for in the books of accounts
(Amount in Rupees)
Current Year Previous Year
a. Bills Discounted with Banks 69,406,253 26,630,541b. Letter of Credit 110,960,854 53,736,125c. Bank Guarantees 5,403,375 5,059,350d. Guarantees given to the
Banks for the loans taken bythe Euro Merchandise (India)Ltd., (100 % Subsidiary) 352,000,000 –
e. The Company has imported various Capital Goods under theExport Promotion Capital Goods Scheme (EPCG), of theGovernment of India, through various licenses, at concessionalrates of Custom Duty on an undertaking to fulfill quantifiedexports within a period of eight years from the date of therespective licenses. The Custom Duty so saved amounts toRs. 352,231,231/- and the corresponding Export Obligation tobe fulfilled is Rs. 2,402,945,292/- as on the Balance Sheet date.If the said export is not made within the stipulated time period,the Company is required to pay the said saved Custom Dutytogether with interest @15% p.a. Formal discharge from theobligation by the appropriate authorities is in progress inrespect of the Licenses of which Export Obligation is entirelyfulfilled by the close of the year.
Fund are charged to the profit & loss account each year.
b) The Company’s contribution to Life Insurance Corporationof India (LIC) for group gratuity policy is charged off toProfit and Loss account each year. The contribution togroup gratuity policy is based on values as actuariallydetermined and demanded by LIC at the year ended.
c) Liability for accumulated earned leave of employees isascertained and provided for as per Company Rules.
X Taxes on Incomea) Provision for taxation comprises of Current tax, Deferred
Tax and Fringe Benefit Tax. Current tax Provision has beenmade in accordance with the Income Tax Act, 1961.
b) Deferred tax for timing differences between the book andtax profits for the period is accounted for, using the taxrates and laws that have been substantively enacted asof the balance sheet date.
c) Deferred tax assets arising from timing differences arerecognised to the extent there is reasonable certainty thatthese would be realised in future.
d) Deferred tax assets are recognised on unabsorbed lossesonly if there is virtual certainty that such deferred tax assetcan be realised against future taxable profit.
XI Impairment of Fixed AssetsFactors giving rise to any indication of impairment of thecarrying amounts of the Company’s Assets are appraised ateach Balance Sheet date to determine and provide / reverse animpairment loss. There is no such impairment in the carryingamount of the Company’s Assets.
XII Provisions and Contingent Liabilitiesa) Provisions are recognised when the Company has a legal
and constructive obligation as a result of a past event, forwhich it is probable that a cash outflow will be requiredand a reliable estimate can be made of the amount of theobligation.
b) Contingent Liabilities are disclosed when the Companyhas a possible obligation or a present obligation and it isuncertain as to whether a cash outflow will be requiredto settle the obligation.
(B) NOTES TO ACCOUNTS1. The Company had issued 5,621,500 equity shares of Rs. 10 each
at a premium of Rs. 155, through a Book Building Initial PublicOffering (IPO) in February 2007. The principal objects of the issueand the expenditure incurred upto March 31, 2008 on such objectspursuant to clause 43 of the listing agreement are as under:

Annual Report 2007-08 | 79
Notes to the financial statements For the year ended March 31, 2008
X SIGNIFICANT ACCOUNTING POLICIES AND NOTES ON ACCOUNTS (Contd.)
11. Managerial Remuneration (Amount in Rupees)
Current Year Previous Year
Director’s Salary & Allowances 8,400,000 4,800,000Percentage to Net Profit 2.61% 1.20%
Note: The above remuneration is within the limits as calculatedbelow
12. Auditors Remuneration (including service tax)(Amount in Rupees)
Current Year Previous Year
For Audit 280,900 112,240For Taxation, Consultancy andCertification Fees 169,664 56,120For IPO Certification Fees – 112,240
Computation of Net Profit as per sec.349 read with sec.309 (5) andsec.198 of the Companies Act, 1956.
(Amount in Rupees)
Current Year Previous Year
Profit as per Profit & Loss A/c. 313,861,587 394,612,499Add: Managerial Remuneration 8,400,000 4,800,000Add: Loss on sale of fixed assets – 384,358Less: Profit on sales offixed assets 37,970 –Total 322,223,617 399,796,857Managerial Remunerationceiling @ 10% 32,222,362 39,979,686
4. Secured Loans (Amount in Rupees)
Current Year Previous Year
a. Vehicle Loans 14,964,532 5,914,192Are secured against vehiclesspecified in the respectiveagreements & PersonalGuarantee of the Directorsof the Company.
b. Term Loans & Buyers Credit 2,012,224,875 1,917,300,654Are secured against the firstcharge created by mortgageon all the existing and futurefixed assets situated atBhachau (Kutch) and secondcharge created by hypothe--cation of current assets ofthe Company and againstthe collateral securities &Personal Guarantee givenby the Directors and theirRelatives.
c. Cash Credit & Other Facilities 507,567,908 554,672,225Are secured against the firstcharge created by hypothe--cation of Stock & BookDebts & other current assetsand second charge createdon existing as well as futurefixed assets of the Companysituated at Bhachau (Kutch)and against the PersonalGuarantee given by theDirectors and their Relatives.
5. Unsecured Loans include Unsecured Redeemable Non ConvertibleDebentures (NCDs) issued by the Company amounting to Rs. 25Crores (25 Debentures of Face Value of Rs. 1 Crore each) (PreviousYear Rs. NIL).
6. Sundry Debtors include amount in respect of which the Companyholds Letter of Credit / Guarantees from Banks of Rs. NIL (PreviousYear Rs. 12,401,425/-).
7. Out of the total Fixed Deposits of Rs. 244,027,133/-, Fixed Depositsamounting to Rs. 180,126,133/- (Previous Year Rs. 169,574,383/-)are pledged with banks as Margin Money against Guarantee &Letter of Credit issued by the Bank on behalf of the Company andbalance Rs. 63,901,000/- (Previous Year Rs. 748,000,000/-) aretemporary investments of surplus funds of proceeds from IPO.
8. The Company has received intimations from suppliers regardingtheir status under the Micro, Small and Medium EnterprisesDevelopment Act, 2006 and accordingly the amounts outstandingto such suppliers has been disclosed. Being the first year of suchdisclosure corresponding previous year figures have not beengiven.
9. Sales and Income from Operation includes Rs. 19,287,251/-(Previous Year Rs. 3,307,847/-) being Export Incentives in thenature of Advance License benefit.
10. Pursuant to the announcement on “Accounting for Derivatives”issued by the Institute of Chartered Accountants of India, theCompany has charged to profit and loss account the mark-to-market losses amounting to Rs. 28,698,167/- (Previous YearRs. NIL), on the outstanding derivative / Swap contracts as onMarch 31, 2008 along with the losses of Rs. 41,703,693/- (PreviousYear Rs. NIL) on settled contracts. The Company does not hold orissue derivative / Swap financial instruments for trading orspeculative purposes.

80 | EURO CERAMICS LIMITED
13. Deferred Tax Liability / (Asset) at the year end comprise timingdifferences on account of:
(Amount in Rupees)
Current Year Previous Year
I Depreciation 126,102,600 97,926,281II Expenditure / Provisions
Disallowable 366,167 92,804
15. The Accounting Standard – AS 15 (revised 2005) on EmployeeBenefits issued by the Institute of Chartered Accountants of India,has been adopted by the Company.a) Defined Contribution Plan
The Company has recognised the following amounts in Profit& Loss account as contributions to funds.
(Amount in Rupees)
Particulars Current Year
Employer’s Contribution to Provident Fund 2,811,581Employer’s Contribution to Employees’State Insurance 89,445
b) Defined Benefit Plan : Gratuity The Company has Group Gratuity Policy managed by LIC. Thebelow mentioned disclosure have been obtained from LIC.
(Amount in Rupees)
As onMarch 31, 2008
I Changes in the present valueof obligationsPresent value of obligationsas at April 1, 2007 1,314,687Interest cost 98,602Current Service Cost 848,088Benefits Paid 70,673Actuarial (gain)/Loss on obligations 237,147Present value of obligationsas at March 31, 2008 2,427,851
II Changes in the fair value of plan assetsFair value of plan assets at April 1, 2007 1,801,109Expected return on plan assets 196,475Employer’s Contributions 848,087Benefits paid 70,673Actuarial Gain / (Loss) on Plan assets NILFair value of plan assets at March 31, 2008 2,774,998
III Table showing fair value of plan assetsFair value of plan assets at April 1, 2007 1,801,109Actual return on plan assets 196,475Contributions 848,087Benefits Paid 70,673Fair value of plan assets at March 31, 2008 2,774,998Funded status 347,147Excess of Actual over estimatedreturn on plan assets NIL(Actual rate of return = Estimated rate ofreturn as ARD falls on March 31)
IV Actuarial Gain/(Loss) recognisedActuarial gain/(Loss) for the year –Obligation (237,147)Actuarial gain/(Loss) for the year - plan assets NILTotal gain/(Loss) for the year (237,147)Actuarial gain/(Loss) recognised in the year (237,147)
V The amounts to be recognised in the balancesheet and statements of profit and lossPresent value of obligations as at March 31, 2008 2,427,851Fair value of plan assets as at March 31, 2008 2,774,998Funded status 347,147Net Asset/(Liability) recognised inbalance sheet (347,147)
Notes to the financial statements For the year ended March 31, 2008
X SIGNIFICANT ACCOUNTING POLICIES AND NOTES ON ACCOUNTS (Contd.)
14. Earnings per Share (EPS) is calculated as under(Amount in Rupees)
Current Year Previous Year
I Profits used as Numeratorfor calculating EPSNet Profit after Tax 283,161,915 282,730,570
II DenominatorWeighted average numberof Equity Shares outstanding- Basic 17,100,000 11,971,344- Diluted 17,100,000 11,971,344
III Nominal Value ofShare in (Rs.) 10 10
IV Earnings Per Share(Basic as well as Diluted) 16.56 23.62

Annual Report 2007-08 | 81
(Amount in Rupees)
As onMarch 31, 2008
VI Expenses Recognised in statement ofProfit & Loss 963,844
VII Principal Actuarial Assumptions usedat the Balance Sheet Date Discount Rate 8%Salary Escalation 5%
Notes:a) The estimated future salary increases take account of inflation,
seniority, promotion and other retirement factors such assupply and demand in the employment market.
b) This being the first year of implementation of AS – 15 (Revised)previous year figures are not given.
16. Amount of exchange difference (net) included / (excluded) inadditions to the Fixed Assets Rs. 8,306,511/- (Previous Year(Rs. 27,696,290/-)) 18. Disclosure in respect of Related Parties pursuant to Accounting
Standard 18:(a) Subsidiary
Euro Merchandise (India) Limited(b) Name of the enterprises having same Key Management
Personnel and/or their relatives as the Reporting enterprises:
Eurobond Industries Euro Flooring Subhnen DécorPvt. Ltd. Pvt. Ltd. Pvt. Ltd.Euro Multivision Ltd Euro Developers Subhnen Ply
Pvt. Ltd. Pvt. Ltd.Euro Pratik Ispat Euro Solo Energy Euro AgroPvt. Ltd. Systems LtdSubhnen Finance & Kevin Impex Kanch GharInvestments Pvt. Ltd. Pvt. Ltd.Neelam Metal Laxmi Ply Agency Metro Stationery- Pune MartNeelam Ply & NLS Enterprise Gurukul Laminates Pvt. Ltd. Enterprises Pvt. Ltd.Tangent Furniture Lyons Ladhabhai Pvt. Ltd. Technologies Ltd. Sanganbhai Gala
Charitable TrustMonex Stationers Disti Multimedia Vaman
& Communication International Pvt. Ltd.Pvt. Ltd.
National Ply & Zenith Corporation Nova EnterprisesLaminatesNational Laminate Gala Enterprises Euro FoundationCorporationEuro Aluminium Euro Glass Ltd. Euro Solar PowerIndustries Ltd. Pvt. Ltd.Euro India Euro MineralCylinders Ltd. Corporation
Notes to the financial statements For the year ended March 31, 2008
X SIGNIFICANT ACCOUNTING POLICIES AND NOTES ON ACCOUNTS (Contd.)
17. Derivative Instruments and Unhedged Foreign Currency Exposure (Amount in Rupees)
Sr. Particulars Current Year Previous YearNo.
(a) Foreign CurrencySWAP outstanding:
1. ECB loan of USD 10,00,000(Previous Year USD 30,00,000) CHF CHFswapped against CHF 1,186,500 3,664,700
2. ECB loan of USD 6,25,000(Previous Year 6,41,000) CHF CHFswapped against CHF 750,187.50 789,712
3. Rupee loan of Rs. 880 Lacs(Previous Year Nil) notionallyconverted in USD and swapped CHF –against CHF 2,627,568.77(b) Unhedged Foreign
Currency Exposure:1. ECB Loan USD USD
153,965.10 14,613,882.852. ECB Loan EURO EURO
2,631,317.49 2,631,317.493. Outstanding Creditors for
Purchase of Raw Material, USD USDConsumables & Spares 45,396.00 9,000.00
4. Outstanding Creditors forPurchase of Raw Material, EURO EUROConsumables & Spares 107,925.00 104,095.00
17. Derivative Instruments and Unhedged Foreign Currency ExposureContd. (Amount in Rupees)
Sr. Particulars Current Year Previous YearNo.
5. Outstanding Creditors for – USDCapital Goods 612,500.00
6. Outstanding Debtors USD USD900,506.39 1,050,428.88
7. Advance to Creditors forPurchase of Raw Material, USD USDConsumables & Spares 522,084.94 484,472.79
8. Advance to Creditors forPurchase of Raw Material, EURO –Consumables & Spares 60,804.38
9. Advance to Creditors for EURO EUROCapital Goods 106,862.00 435,000.00
10. Advance from Debtors USD USD19,621.75 20,447.00

82 | EURO CERAMICS LIMITED
(c) Relatives of Key Management Personnel:
Nenshi L. Shah Shantilal L. Shah Pravin D. GalaH.U.F.Laljibhai K. Shah Gunvantiben Laljibhai K. ShahH.U.F. N. ShahShantilal L. Shah Hitesh S. Shah Sushila H. GalaH.U.F.Subhash L. Shah Jayantilal Nishar Rekhaben NisharH.U.F.Dhaval L. Shah Subhash L. Shah Kasturben T. NanduShantaben L. Shah Urmi P. Shah Viral T. NanduSonalben L. Shah Parag K. Shah Nitesh P. ShahManjari H. Shah
During the year following transactions were carried out with the related parties inthe ordinary course of business:
Nature of Transactions Subsidiary Enterprises Relative of Key having the Key Management
common Management PersonnelKey Personnel
ManagementPersonnel
Sales, Service and 27,504,666 257,825,413 – –other income (46,008,369) (219,280,702) (–) (–)Sale of Fixed Assets – – 178,000 –
(–) (67,896,206) (–) (–)Purchase of goods – 7,416,878 – –and services (–) (5,810,297) (–) (–)Purchase of – 1,267,424 70,000 –fixed assets (–) (1,127,432) (–) (–)Donation – 6,776,813 – –
(–) (2,700,000) (–) (–)Director’s Remunera- – – 27,500 8,400,000-tion/Sitting Fees (–) (–) (42,500) (4,800,000)Interest Received – 217,225 – –
(–) (5,194,398) (–) (–)Interest Paid/Payable – 1,358,387 2,377,084 6,689,399
(–) (175,762) (2,932,677) (11,795,196)Loans/Advances Taken – 85,255,000 29,647,101 209,801,975
(–) (55,814,000) (15,000,000) (163,830,000)Loans/Advance Repaid – 79,968,909 6,263,204 196,091,000
(–) (34,929,663) (12,514,588) (228,117,000)Loans/Advances Given 51,100,000 91,525,000 – –
(53,300,000) (24,350,000) (–) (–)Loans/Advance 40,497,957 96,525,000Received Back (–) (34,929,663) (–) (–)
During the year following transactions were carried out with the related parties inthe ordinary course of business: (Contd.)
Nature of Transactions Subsidiary Enterprises Relative of Key having the Key Management
common Management PersonnelKey Personnel
ManagementPersonnel
Outstanding balanceas at March 31, 2008Loans Payable – 16,458,230 21,539,341 32,489,733
(–) (11,172,139) (27,802,545) (55,242,969)Loans Receivable 28,402,043 – – –
(17,800,000) (5,000,000) (–) (–)Amount Receivable 1,839,858 53,393,684 – –
(29,460,045) (61,837,238) (–) (–)Amount Payable – 310,393 2,107,760 5,163,591
(2,022,206) (–) (–)
Current Year Previous YearParticulars Balance Maximum Amt. Balance Maximum Amt.
as on Due at any as on Due at anyMarch 31, time during March 31, time during
2008 the year 2007 the year
i) Wholly OwnedSubsidiary - Euro Merchandise (India) Ltd. 28,402,043 28,402,043 17,800,000 21,800,000
ii) Staff Advances &Loans - are given inthe ordinary courseof the business 2,615,113 2,899,658 1,349,403 1,555,000
(d) Key Management Personnel:
Nenshi L. Kumar P. Talakshi L. Paresh K.Shah Shah Nandu Shah
- Figures of the Previous Year have been given in brackets- No amounts in respect of the related parties have been written off / back.- Related party relationship have been identified by the management and relied upon
by the auditors.
19. Disclosure pursuant to Clause 32 of the Listing Agreement(a) Loans & Advances in the nature of Loans given to the Subsidiary or to
others for which there is no repayment schedule:
(Amount in Rupees)
Current Year Previous YearParticulars Balance Maximum Amt. Balance Maximum Amt.
as on Due at any as on Due at anyMarch 31, time during March 31, time during
2008 the year 2007 the year
i) Euro MultivisionLtd. 168,002 18,000,000 5,000,000 5,000,000
(b) Loans & Advances in the nature of Loans given to the firms/Companies inwhich Directors are interested: (Amount in Rupees)
Notes to the financial statements For the year ended March 31, 2008
X SIGNIFICANT ACCOUNTING POLICIES AND NOTES ON ACCOUNTS (Contd.)

Annual Report 2007-08 | 83
20. a) For additional information as required under para 3, 4C and 4Dof Part II of Schedule VI to the Companies Act, 1956 – ReferAnnexure I.
b) For Segment Information – Refer Annexure II
c) For Cash Flow Statement– Refer Annexure III
d) For information as required under part IV of schedule VI to theCompanies Act, 1956 – Refer Annexure IV.
21. Previous years figures have been regrouped, rearranged andrecasted wherever necessary.
Current Year Previous YearParticulars Balance Maximum Amt. Balance Maximum Amt.
as on Due at any as on Due at anyMarch 31, time during March 31, time during
2008 the year 2007 the year
Investment by theloanee in the sharesof the Company and /or its Subsidiary. NIL NIL NIL NIL
(c) Investment by the above loanees in the shares of the Company and /or itsSubsidiary: (Amount in Rupees)
Notes to the financial statements For the year ended March 31, 2008
X SIGNIFICANT ACCOUNTING POLICIES AND NOTES ON ACCOUNTS (Contd.)
As per our attached report of even date By order of the Board of DirectorsFor Deepak Maru & Co. For Euro Ceramics Ltd.Chartered Accountants
Deepak M. Maru Nenshi L. Shah Paresh K. Shah Jayshree D. SoniPartner Managing Director Director Company SecretaryMembership No. 49347
Place : Mumbai Place : MumbaiDate : July 30, 2008 Date : July 30, 2008

84 | EURO CERAMICS LIMITED
INFORMATION PURSUANT TO THE PROVISIONS OF PARAGRAPHS 3, 4C AND 4D OF PART II OF SCHEDULE VI OFTHE COMPANIES ACT, 1956
a) Particulars of capacity and production:
Products Annual Installed Capacity Actual Production
Current Year Previous Year Current Year Previous Year
Tile Division (M.T.) 124,971 79,971 90,222 78,331Aluminium Section (M.T.) 1,800 1,800 1,408 1,320
c) Raw Materials Consumed:
Current Year Previous Year
MT. (Rs.) MT. (Rs.)
I Clay 47,362.97 66,357,629 48,370.84 141,350,111II Feldspar 61,156.96 60,602,564 45,633.85 45,195,706III Quartz 2,215.26 2,407,865 1,387.06 1,424,670IV Marble & Stones 7,004.83 26,397,720 ----- -----V Resin 451.47 38,652,084 ----- -----VI Aluminium Scrap 1,782.76 196,215,218 1443.05 157,004,329VII Other ----- 270,328,959 ---- 209,986,536Total 119,974.25 660,962,039 96,834.80 554,961,352
d) Purchase of Trading Goods
Current Year Previous Year
Sq. Mtrs. (Rs.) Boxes (Rs.)
I Ceramic Tiles 114,233 20,628,419 100,056 21,323,319
b) Particulars in respect of Opening Stock, Sales and Closing Stock for class of goods Dealt with by the Company:
Products Opening Stock Sales Closing Stock
- The Installed Capacity is as Certified by the Management.- Sales Quantity includes captive consumption, damages, sample sale and shortages
Qty. Value (Rs.) Qty. Value (Rs.) Qty. Value (Rs.)
Tiles (In Metric Tonnes) 17,725 299,519,000 90,158 2,021,647,818 17,789 284,927,243(Previous Year) 7,932 98,233,716 68,538 1,556,015,802 17,725 299,519,000Aluminium Section(In Metric Tonnes) 42 5,946,584 1447 232,674,729 3 368,770(Previous Year) 25 1,975,328 1,303 192,070,259 42 5,946,584Trading Goods –Ceramic Tiles (Sq. Mtr.) – – 114,233 21,433,074 – –(Previous Year) (Boxes) – – 100,056 21,771,847 – –Others – – – 6,602,263 – –(Previous Year) – – – 20,921,705 – –Total 305,465,584 2,282,357,884 285,296,013Total (Previous Year) 100,209,044 1,790,779,613 305,465,584
Annexure - I

Annual Report 2007-08 | 85
e) Value of Imports calculated on C.I.F. Basis (Amount in Rupees)
Current Year Previous Year
I Raw Materials & Consumables 231,557,281 179,941,271II Stores & Spares 5,862,448 3,721,022III Capital Goods 378,173,872 695,363,601IV Trading Goods 20,628,419 21,323,319
f) Expenditure in Foreign Currency (on actual Payment basis) (Amount in Rupees)
Current Year Previous Year
I Foreign Traveling Expenses 904,445 1,785,069
i) Earnings in Foreign Currency – Export of Goods (F.O.B. Basis) (Amount in Rupees)
Current Year Previous Year
a. Foreign Currency 186,120,395 97,077,256
h) The Amount remitted during the year in Foreign Currencies on account of dividends (Amount in Rupees)
Current Year Previous Year
Amount Remitted – 1,850,400No. of Non-Resident shareholders – 3No. of shares held by the above – 1,542,000Year to which dividend relates – 2006 – 2007
g) Value of Imported and Indigenous Raw Materials, Spare parts & Components consumed and percentage thereof to the total Consumption:
Current Year Previous Year
% (Rs.) % (Rs.)
I Raw MaterialsImported 59.94 396,211,105 46.89 260,227,458Indigenous 40.06 264,750,934 53.11 294,733,894Total 100.00 660,962,039 100.00 554,961,352
II Stores & SparesImported 23.70 3,460,162 24.44 2,147,449Indigenous 76.30 11,139,297 75.56 6,638,162Total 100.00 14,599,459 100.00 8,785,611
Annexure - I

86 | EURO CERAMICS LIMITED
SEGMENTWISE FINANCIAL STATEMENT FOR THE YEAR ENDED MARCH 31, 2008.
I) PRIMARY SEGMENTS - BUSINESS
Tiles Aluminium Sections Inter- Segmental Elimination Total
2007-08 2006-07 2007-08 2006-07 2007-08 2006-07 2007-08 2006-07
a) Segmental Revenue Sales to External Customers 2,059,084,146 1,597,495,869 232,674,729 193,283,744 - - 2,291,758,875 1,790,779,613 Less : Excise Duty 9,400,991 - - - - - 9,400,991 -
2,049,683,155 1,597,495,869 232,674,729 193,283,744 - - 2,282,357,884 1,790,779,613 Inter-segmental Revenue - - - - - - - - Total Segmental Revenue 2,049,683,155 1,597,495,869 232,674,729 193,283,744 - - 2,282,357,884 1,790,779,613
b) Segmental Results (PBIT) 729,755,244 714,546,062 14,871,785 28,194,717 - - 744,627,029 742,740,779 Less: Interest & Finance Charges 309,317,193 130,981,985
435,309,836 611,758,794 Less: Unallocable Expenses Net of Unallocable Income 121,448,248 217,146,297 Profit Before Tax & Exceptional Items 313,861,588 394,612,497 Loss / (Gain) due to Exceptional Items - - Profit Before Tax 313,861,588 394,612,497 Less: Provision for Current Tax 32,263,683 73,873,961 Add: MAT Credit (32,263,683) - Less: Provision for Deferred Tax 28,449,672 36,577,967 Less: Provision for Fringe Benefit Tax 2,250,000 1,430,000 Profit After Tax 283,161,916 282,730,570
c) Carrying amount of Segmental Assets 4,005,594,538 2,479,046,899 74,768,291 86,578,859 - - 4,080,362,830 2,565,625,758 Unallocated Assets 1,749,319,526 2,530,269,975 Total Assets 5,829,682,356 5,095,895,733
d) Carrying amount of Segmental Liabilities 1,936,616,265 1,077,278,074 13,460,266 4,947,531 - - 1,950,076,531 1,082,225,605 Unallocated Liabilities 1,562,522,399 2,021,015,277 Total Liabilities 3,512,598,930 3,103,240,882
e) Cost incurred to acquire Segment Fixed Assets during the year 892,832,090 267,490,182 1,386,212 7,244,867 - - 894,218,302 274,735,049 Unallocated Assets 76,587,131 101,470,052
f) Depreciation / Amortization 110,401,091 58,970,936 2,124,584 1,614,563 - - 112,525,675 60,585,499 Unallocated depreciation 37,877,558 53,134,635
Annexure - II
II) PRIMARY SEGMENTS - GEOGRAPHICAL
2007-08 2006-07
The Company's operating facilities are located in India Domestic Revenues 1,983,456,986 1,659,440,995 Export Revenues 298,900,898 131,338,618 Total 2,282,357,884 1,790,779,613

Annual Report 2007-08 | 87
Cash Flow Statement
Annexure III
As per our attached report of even date By order of the Board of DirectorsFor Deepak Maru & Co. For Euro Ceramics Ltd.Chartered Accountants
Deepak M. Maru Nenshi L. Shah Paresh K. Shah Jayshree D. SoniPartner Managing Director Director Company SecretaryMembership No. 49347
Place : Mumbai Place : MumbaiDate : July 30, 2008 Date : July 30, 2008
(Amount in Rupees)
Particulars 2007-08 2006-07
A. CASH FLOW FROM OPERATING ACTIVITIESNet Profit before tax 313,861,587 394,612,498 Adjustments for :Depreciation 150,403,232 113,720,134 Interest & Finance Charges (net) 309,317,193 130,981,985 Dividend & Other Incomes (63,352,001) (6,534,967)(Profit) / Loss On Sale Of Fixed Assets (37,970) 396,330,454 384,358 Operating Profit Before Working Capital Changes 710,192,041 633,164,007 Decrease / (Increase) in sundry debtors 3,354,513 (164,085,586)Decrease / (Increase) in other current assets (26,663,704) (80,608,085)Decrease / (Increase) in inventories (116,426,561) (209,888,661)Increase / (Decrease) in trade and other payables (53,747,324) (193,483,076) 116,863,408 Cash Generated from Operations 516,708,965 295,445,082 Income taxes paid (Net of Refund) (63,225,816) (41,179,129)Net Cash from Operating Activities 453,483,149 254,265,953
B. CASH FLOW FROM INVESTING ACTIVITIES(Purchase)of Fixed Assets including Capital Work in Progress (1,252,817,625) (1,062,421,689)Sale Of Fixed Assets 1,233,090 68,580,564 Profit/ (Loss) On Sale of Fixed Assets 37,970 (384,358)Interest Received 12,046,005 14,729,743 Dividend & Other Incomes 63,352,001 6,534,967 Net Cash (used in)/from Investing Activities (1,176,148,559) (972,960,773)
C. CASH FLOW FROM FINANCING ACTIVITIESRefund Of Share Application Money - (60,464,000)Proceeds from IPO - 927,547,500 Proceeds from Borrowings 419,758,432 1,151,531,800 Repayments of Borrowings - (204,822,931)Increase / (Decrease) in payables for capital goods 28,604,792 364,532 Interim Dividend including Dividend Distribution Tax - (23,397,930)Share Issue Expenses (94,131,966) - Interest and Finance Charges paid (321,363,198) (145,711,728)Net Cash (used in)/From Financing Activities 32,868,060 1,645,047,244 Net increase in Cash and Equivalents (689,797,349) 926,352,425 Cash and Cash Equivalents (Opening Balance) 954,878,736 28,526,312 Cash and Cash Equivalents (Closing Balance) 265,081,387 954,878,736

88 | EURO CERAMICS LIMITED
Annexure - IV
Public Issue
Bonus Issue
3 1 0 3
Registration No. State Code
Balance Sheet Date
I. Registration Details
II. Capital Raised during the year (Amount in Rs. Thousand)
Total Liabilities
III. Position of Mobilisation and Deployment of Funds (Amount in Rs. Thousand)
2 0 0 8
1 1
N I L
N I L Right Issue
Date Month Year
Private Placement
N I L
Sources of Funds
V. Generic Names of three Principal Products / Services of the Company. (as per monetary terms)
5 1 6 4 7 5 8 . 6 8 Total Assets 5 1 6 4 7 5 8 . 6 8
Total Income
IV. Performance of Company (Amount in Rs. Thousand)
2 3 4 5 7 4 7 . 8 5 Total Expenditure 2 0 3 1 8 8 6 . 2 7
Profit before Tax 3 1 3 8 6 1 . 5 9 Profit after Tax 2 8 3 1 6 1 . 9 2
Earning per Share in Rs.(Annualised)
1 6 . 5 6 Dividend Rate % 7 . 5 0 %
Paid up Capital 1 7 1 0 0 0 . 0 0 Reserves and Surplus 1 7 9 6 3 6 1 . 6 7
Secured Loans 2 5 3 4 7 5 7 . 3 1 Unsecured Loans 5 3 6 1 7 0 . 9 3
Application of FundsNet Fixed Assets 3 7 2 9 4 8 7 . 6 3 Investment 1 4 6 1 0 . 7 5
Net Current Assets 1 4 2 0 6 6 0 . 3 1 Misc. Expenditure N I L
Deferred Tax Liability 1 2 6 4 6 8 . 7 7
Item Code No. (ITC Code) 6 9 0 7
Product Description V I T R I F I E D T I L E S
Item Code No. (ITC Code) 6 8 1 0
Product Description A G G L O M E R A T E D M A R B L E
Item Code No. (ITC Code) 7 6 1 0
Product Description A L U M I N I U M S E C T I O N S
1 3 5 5 4 8
N I L
INFORMATION PURSUANT TO PART IV OF SCHEDULE VI TO THE COMPANIES ACT, 1956 :Balance Sheet Abstract and Company’s General Business Profile
By order of the Board of DirectorsFor Euro Ceramics Ltd.
Place : Mumbai Nenshi L. Shah Paresh K. Shah Jayshree D. SoniDate : July 30, 2008 Managing Director Director Company Secretary

Annual Report 2007-08 | 89
A Statement pursuant to Section 212 of the Companies Act, 1956 relatingto Subsidiary Company is as under:
By order of the Board of DirectorsFor Euro Ceramics Ltd.
Place : Mumbai Nenshi L. Shah Paresh K. Shah Jayshree D. SoniDate : July 30, 2008 Managing Director Director Company Secretary
1. Name of the Subsidiary Company Euro Merchandise (India) Limited2. Financial Year ended on March 31, 20083. Date on which it became the Subsidiary of the Company December 31, 20054. Shares of the Subsidiary held by the Company on the above dated
(a) Number and face value 190,000 Equity Shares of Rs. 10/- eachaggregating to Rs. 1,900,000/-
(b) Extent of Holding 100%5. Net aggregate amount of Profit/(Loss) of the Subsidiary
so far as it concerns the members of the Holding Companyand is dealt with in account of Holding Company 1. For financial year ended on March 31, 2008 NIL 2. For previous financial year of the Subsidiary NIL
since it became a Subsidiary Company 6. Net aggregate amount of Profit/(Loss) of the Subsidiary
so far as it concerns the members of the Holding Companyand is not dealt with in account of Holding Company1. For financial year ended March 31, 2008 Profit Rs. 31,073,964/-2. For previous financial year of the Subsidiary since Profit Rs. 27,749,385/-
it became a Subsidiary Company7. Changes in the Holding Company’s interest in the Subsidiary Not Applicable
between the end of the financial year of the Subsidiary andthe end of the Holding Company’s financial year.
8. Material Changes which have occurred between the end ofthe aforesaid financial year of the Subsidiary and the end ofthe Holding Company’s financial year in respect of:(a) the Subsidiaries fixed assets(b) its investments(c) moneys lent by the Subsidiary Company Not Applicable(d) the money borrowed by it for any purpose
other than that of meeting current liabilities.}

90 | EURO MERCHANDISE (INDIA) LIMITED
Directors’ Report
Dear Members,
Your Directors have pleasure in presenting
their 4th Annual Report of the Company for
the year ended March 31, 2008.
Financial Results:
(Rupees in Lacs)
Particulars Current Previous
Year Year
Income:
Sales 6,128.22 3,928.13
Other Income 0.15 0.14
Total expenditure 5,649.28 3,588.55
Profit before
Depreciation 479.09 339.72
Less: Depreciation 1.61 2.02
Profit before Tax 477.48 337.70
Less: Provision for Tax
Current Tax 161.79 93.84
Deferred Tax 1.51 19.79
Fringe Benefit Tax 3.44 2.25
Net Profit After Tax 310.74 221.82
E.P.S.
(Basic & Diluted) (Rs.) 163.55 116.75
Operations:
During the year under review the Company
has achieved total sales of Rs. 6,128.22 lacs
compared to Rs. 3,928.13 lacs in the previous
year achieving a growth of 56 %. The Net
Profit before tax was higher by 41.39 % at
Rs. 477.48 lacs as compared to Rs. 337.70
lacs in the previous year. The Net Profit after
tax grown by 40 % at Rs. 310.74 lacs as
compared to Rs. 221.82 lacs in the previous
year. The EPS has grown by 40 % and stood
at Rs. 163.55 as compared to Rs. 116.75.
Thus giving high returns to shareholders
thereby increasing their Net worth. The
Company expects better turnover and
profitability in the coming years.
Future Outlook:
The Company is growing at a rapid pace with
a well established presence in “Wall Tiles”.
After an overwhelming response to our
existing products; the Company has
expanded concepts of wall tiles and has
added in new product line in the form of C. P.
fittings & Sanitaryware. The Company has
approached new suppliers over the globe and
will supply all the products by giving a
complete bathroom solution.
Further the Company is planning to develop
the supplier base in India, by way of contract
manufacturing or complete outsourcing under
its control which will give quality products,
timely supply and low inventory storage at the
Company’s end.
To reach the needs of common people, the
Company has entered into franchise model to
display and sell exclusive Euro products in the
name of “Euro Stile Station”.
Dividend:
To conserve the resources for the future
expansion your Directors do not
recommend payment of dividend for the
year under review.
Directors:
As per the provisions of the Companies Act,
1956, Mr. Nenshi L. Shah, Director of the
Company retires by rotation at the
forthcoming Annual General Meeting and
being eligible, offers himself for
reappointment. Your Directors recommend
his re-appointment as Director of the
Company.
As your Company has become a “material
Subsidiary Company” of Euro Ceramics
Limited, a listed Company, in terms of Clause
49 of the listing agreement; Mr. Amit G. Shah,
Independent Director of the Holding
Company is appointed as Director of the
Company with effect from December 20,
2007. In terms of Section 260 of the
Companies Act, 1956, he holds office up to
the date of the forthcoming Annual General
Meeting. Members approval for his
appointment as Director has been sought in
the notice convening the Annual General
Meeting.
Directors' Responsibility Statement:
Pursuant to the provisions of Section 217
(2AA) of the Companies Act, 1956, the

Annual Report 2007-08 | 91
Directors of the Company confirm that:
i. In the preparation of the Annual Accounts,
the applicable accounting standards have
been followed along with the proper
explanations relating to material
departures;
ii. They had selected such accounting
policies and applied them consistently
and made judgments and estimates that
are reasonable and prudent so as to give
true and fair view of the state of affairs of
the Company at the end of the financial
year and of the profit of the Company for
that period;
iii. They had taken proper and sufficient care
for the maintenance of adequate
accounting records in accordance with
the provisions of this Act for safeguarding
the assets of the Company and for the
preventing and detecting fraud and other
irregularities;
iv. They had prepared the annual accounts
on a going concern basis.
Energy Conservation, Technology Absorption
and Foreign Exchange:
The information required under Section 217
(1) (e) of the Companies Act, 1956 read with
the Companies (Disclosure of particulars in
the Report of Board of Directors) Rules 1988,
is as follows:
The particulars regarding conservation of
energy : Nil
The particulars regarding Technology
Absorption, Adoption and innovation : Nil
The information on foreign exchange earnings
and outgo is contained in Schedule X
comprising of notes to accounts.
Public Deposits:
Your Company has not accepted any deposits
from the public within the meaning of Section
58A and 58AA of the Companies Act, 1956.
Particulars of Employees:
There are no employees drawing
remuneration more than the limit prescribed
in Section 217 (2A) of the Companies Act,
1956, read with the Companies (Particulars in
the Report of Board of Directors) Rules, 1988.
Therefore no information is provided in this
report.
Auditors:
M/s. Deepak Maru & Co., Chartered
Accountants, Mumbai, retires at the ensuing
Annual General Meeting and being eligible,
offer themselves for re-appointment.
Secretarial Compliance Certificate:
Pursuant to Section 383A of the Companies
Act, 1956, a certificate from M/s. Manish Ghia
& Associates, a Company Secretary in whole
time practice, regarding status on compliance
of the provisions of the Companies Act, 1956
by the Company is annexed herewith.
Acknowledgement:
Your Directors acknowledges with gratitude
and wish to place on record, their deep
appreciation of the continued support and co-
operation received by the Company from the
various Government authorities,
Shareholders, Bankers, Business Associates
of the Company
Your Directors place on record their deep
appreciation of the dedication and
commitment of your Company’s employees
at all levels and look forward to their
continued support in the future as well.
For and on behalf of the Board of Directors
Nenshi L. Shah Nitesh P. Shah
Director Director
Place: Mumbai
Date: July 30, 2008

Registration No. : 11- 145654Authorised Capital : Rs. 2,000,000/-
To, The Members,Euro Merchandise (India) Limited Boston House, Ground floor,Suren Road, Chakala,Andheri (East), Mumbai - 400093
Compliance Certificate
We have examined the registers, records,books and papers of Euro Merchandise(India) Limited (hereinafter referred to as "theCompany") as required to be maintainedunder the Companies Act, 1956, (hereinafterreferred to as "the Act") and the rules madethereunder and also the provisions containedin the Memorandum and Articles ofAssociation of the Company for the financialyear ended on March 31, 2008 (FinancialYear). In our opinion and to the best of ourinformation and according to theexaminations carried out by us andexplanations furnished to us by the Company,its officers and agents, we certify that inrespect of the aforesaid financial year:1. The Company has kept and maintained
Registers as stated in Annexure 'A' to thiscertificate, as per the provisions and therules made thereunder and all entriestherein have been duly recorded.
2. The Company has filed the forms andreturns as stated in Annexure 'B' to thisCertificate, with the Registrar ofCompanies, Maharashtra and theCompany has paid the necessaryadditional fees for the documents whichare filed after the time prescribed underthe Act. The Company was not requiredto file any documents with the RegionalDirector, Central Government andCompany Law Board or other authorities.
3. The Company, being Public LimitedCompany, has the minimum prescribedpaid-up share capital. As on March 31,2008, the paid-up share capital of theCompany was Rs. 1,900,000/- and the
restrictive provisions of Section 3(1)(iii) ofthe Act are not applicable.
4. The Board of Directors duly met 8 (eight)times respectively on April 3, 2007, July25, 2007, August 17, 2007, November 1,2007, December 6, 2007, December 20,2007, December 31, 2007 and February14, 2008 during the financial year, as perinformation and explanation given by themanagement, proper notices were givenand the proceedings were properlyrecorded and signed in the Minutes Bookmaintained for the purpose. The Companyhas not passed any resolution bycirculation.
5. The Company was not required to closeits Register of Members during thefinancial year under review.
6. The Annual General Meeting for thefinancial year ended on March 31, 2007was held on September 27, 2007. As perinformation and explanation given by themanagement, the Company has givenadequate notice to the members of theCompany and the resolutions passedthere at were duly recorded in theMinutes Book maintained for the purpose.
7. Two Extra-Ordinary General Meetingswere held on May 1, 2007 and December1, 2007 during the financial year aftergiving due notice to the members of theCompany and the resolutions passedthere at were duly recorded in theMinutes Book maintained for the purpose.
8. The Company has not advanced any loanto its Directors or Companies or firms or
companies referred to under section 295of the Act.
9. The Company has complied with theprovisions of section 297 of the Act inrespect of contracts specified in thatsection.
10. The Company has made the necessaryentries in the register maintained underSection 301 of the Act.
11. As there are no such transactions fallingwithin the purview of Section 314 of theAct, the Company has not obtained anyapprovals from the Board of Directors,members or the Central Government asthe case may be.
12. The Company has not issued anyduplicate share certificates during thefinancial year.
13. The Company:(i) has not made any allotment / transfer
/ transmission of securities during thefinancial year.
(ii) was not required to deposit anyamount in a separate Bank Account asno dividend was declared during thefinancial year.
(iii) was not required to post warrants fordividend to the members of theCompany as no dividend wasdeclared during the financial year.
(iv) does not have any amount lying onaccounts of unpaid dividend account,application money due for refund,matured deposits, matureddebentures and the interest accrued
92 | EURO MERCHANDISE (INDIA) LIMITED

thereon which have remainedunclaimed or unpaid for a period ofseven years and which is required totransfer to Investors Education andProtection Fund.
(v) duly complied with the requirementsof Section 217 of the Act.
14. The Board of Directors of the Company isduly constituted. The appointment ofadditional Director has been made inaccordance with the provisions of the Act.There was no appointment of alternateDirector or Director to fill casual vacancyduring the financial year.
15. The Company has not appointed anyManaging Director / Whole-time Directorduring the year under review.
16. The Company has not appointed any soleselling agents during the financial year.
17. The Company was not required to obtainany approval of the Central Government,Company Law Board, Regional Director orsuch other authorities as may beprescribed under the various provisions ofthe Act.
18. The Directors have disclosed their interestin other firms / Companies to the Board ofDirectors pursuant to the provisions of theAct and the Rules made thereunder.
19. The Company has not issued any sharesor other securities during the financialyear.
20. The Company has not bought back anyshares during the financial year.
21. The Company has not issued anypreference shares or debentures. Hencethe question of redemption of the samedoes not arise.
22. There was no transaction, whichnecessitates the Company to keep inabeyance rights to dividend, rights sharesand bonus shares pending registration totransfer of shares.
23. The Company has not invited / acceptedany deposits falling within the purview ofsection 58A of the Companies Act, 1956.
24. The amount borrowed by the Companyfrom the Banks during the financial yearare within the borrowing limits of theCompany and the necessary resolutionsas per section 293(1)(d) of the Act havebeen passed in duly convenedExtraordinary General Meeting.
25.The Company has not made anyinvestments / loans and advances, orgiven guarantees or provided securities toother bodies corporate during thefinancial year.
26. The Company has not altered theprovisions of the Memorandum ofAssociation with respect to the situationof the Company's registered office fromone state to another during the financialyear.
27. The Company has altered the provisionsof the Memorandum of Association withrespect to the objects of the Companyduring the financial year and compliedwith the provisions of the Act.
28. The Company has not altered theprovisions of the Memorandum ofAssociation with respect to the name ofthe Company during the financial year.
29.The Company has not altered theprovisions of the Memorandum ofAssociation with respect to the sharecapital of the Company during thefinancial year.
30. The Company has not altered the Articlesof Association during the financial year.
31. There was no prosecution initiated againstor show cause notices received by theCompany under the Act and no fines andpenalties or any other punishment wasimposed on the Company during thefinancial year.
32. The Company has not received anysecurity deposits from its employeesduring the financial year.
33. The Company has not deducted anycontribution towards Provident Fundduring the financial year.
For Manish Ghia & AssociatesCompany Secretaries
Place: Mumbai Manish L. GhiaDate: July 30, 2008 Partner
Membership No. ACS 7254C. P. No. 3531
Annual Report 2007-08 | 93

94 | EURO MERCHANDISE (INDIA) LIMITED
Registers maintained by M/s. Euro Merchandise (India) Limited:
(i) Register of Members u/s. 150 of the Act.
(ii) Minutes Book of Board Meeting u/s. 193 of the Act.
(iii) Register of Directors u/s. 303 of the Act.
(iv) Register of Directors’ ShareHolding u/s. 307 of the Act.
(v) Register of particulars of contracts in which Directors are interested u/s. 301 of the Act.
(vi) Minutes Book of General Meeting u/s. 193 of the Act.
(vii) Register of Proxies.
(viii) Register of Share Certificates.
(ix) Books of Account and other records u/s. 209 of the Act.
The Company has also maintained the following registers during the year under review:
(i) Register of transfer / transmission of shares.
(ii) Register of Charges.
(iii) Register of Fixed Assets.
Annexure - “A”

Annual Report 2007-08 | 95
Sr. Form Relevant Description Date of filing Whether If delay in filingNo. No. Section filed within whether requisite
prescribed time additional fee paidYes/No Yes / N.A.
1 23 192 Particulars of Special Resolution passed 07.05.2007 Yes N.A.at the Extraordinary General Meetingheld on May 1, 2007 to alter ObjectClause of the Memorandum ofAssociation of the Company by addingnew object clauses 40 to 175.
2 20B 159 (1) Schedule – V (Annual Return) as on the 19.10.2007 Yes N.A.date of Annual General Meeting heldon September 27, 2007
3 23AC 220 (1) Schedule – VI (Annual Accounts) 19.10.2007 Yes N.A.and 23ACA for the year ended March 31, 2007
4 66 383A Compliance Certificate 19.10.2007 Yes N.A.for the year ended March 31, 2007
5 8 125 Particulars of creation of charges dated 24.12.2007 Yes N.A.December 17, 2007 for Rs. 5 Crore infavour of Barclays Bank.
6 32 303 Particulars of appointment of Mr. Amit 14.01.2008 Yes N.A.Shah as an Additional Director of theCompany w. e. f. December 20, 2007.
7 32 303 Particulars of change in designation of 02.02.2008 No YesMr. Pratik Shah from Whole TimeDirector to Director of the Companyw.e.f. December 31, 2007.
8 23 192 Particulars of Ordinary Resolution 19.02.2008 No Yespassed at the Extraordinary GeneralMeeting held on December 1, 2007to increase managerial remunerationof Mr. Pratik Shah and Mr. Nitesh Shah.
Forms and returns as filed by M/s. Euro Merchandise (India) Limited, with the Registrar of Companies during the financial year ended onMarch 31, 2008A) With the Registrar of Companies, Maharashtra
B) With the Office of the Regional Director, Western Region Bench - Nil
C) With the Office of the Ministry of Corporate Affairs (Central Government) at Delhi – Nil
D) With any other Authorities as prescribed under the Act - Nil
Annexure - “B”

96 | EURO MERCHANDISE (INDIA) LIMITED
To,The Members ofEuro Merchandise (India) Limited
1) We have audited the attached Balance Sheetof M/s. Euro Merchandise (India) Limited asat March 31, 2008 and also the Profit andLoss Account for the year ended on that dateand the Cash Flow Statement for the yearended on that date both annexed thereto.These financial statements are theresponsibility of the Company’sManagement. Our responsibility is to expressan opinion on these financial statementsbased on our audit.
2) We have conducted our audit in accordancewith the auditing standards generallyaccepted in India. Those standards requirethat we plan & perform the audit to obtainreasonable assurance about whether thefinancial statements are free from materialmisstatements. An audit includes examining,on a test basis, evidence supporting theamounts and disclosure in the financialstatements. An audit also includes assessingthe accounting principles used & significantestimates made by management, as well asevaluating the overall presentation of thefinancial statement. We believe that our auditprovides a reasonable basis for our opinion.
3) As required by the Companies (Auditor’sReport) Order, 2003 as amended by theCompanies (Auditor’s Report) (Amendment)Order, 2004 issued by the Central
Government of India in terms of Sub-Section(4A) of Section 227 of the Companies Act,1956, we enclose in the Annexure astatement on the matters specified inparagraphs 4 and 5 of the said Order.
4) Further to our comments in the annexurereferred to above, we report that: a. We have obtained all the information and
explanations, which to the best of ourknowledge and belief were necessary forthe purposes of our audit;
b. In our opinion, proper books of account asrequired by law have been kept by theCompany so far as appears from ourexamination of such books;
c. The Balance Sheet and Profit and LossAccount and Cash Flow Statement dealtwith by this report are in agreement withthe books of account;
d. In our opinion, the Balance Sheet andProfit and Loss Account and Cash FlowStatement dealt with by this reportcomply with the Accounting Standardsreferred to in Sub-Section (3C) of Section211 of the Companies Act, 1956;
e. On the basis of written representationsreceived from the Directors, and taken onrecord by the Board of Directors, as onMarch 31, 2008, we report that none of
the Director is disqualified as on March31, 2008 from being appointed as aDirector in terms of clause (g) of sub-section (1) of section 274 of theCompanies Act, 1956;
f. In our opinion and to the best of ourinformation and according to theexplanations given to us, the saidaccounts read with significant accountingpolicies, notes to accounts give theinformation required by the CompaniesAct, 1956, in the manner so required andgive a true and fair view in conformity withthe accounting principles generallyaccepted in India: i) in the case of the Balance Sheet, of the
state of affairs of the Company as atMarch 31, 2008;
ii) in the case of the Profit and LossAccount, of the profit of the Companyfor the year ended on that date; and
iii) in the case of the Cash FlowStatement, of the cash flows for theyear ended on that date.
For Deepak Maru & Co.Chartered Accountants
Jaymin P. ShahPlace: Mumbai PartnerDate: July 30, 2008 Membership No.: 118113
Auditors’ Report
Annexure to the Auditors' Report(Referred to in paragraph 3 of our report of even date)
(1) In respect of Fixed Assets:a) The Company has maintained proper records showing full particulars
including quantitative details and situation of its fixed assets.
b) As explained to us, the management during the year at reasonableinterval has physically verified the assets and no materialdiscrepancies were noticed on such verification.
c) The Company has not disposed off any substantial part of thefixed assets during the year.
(2) In respect of its Inventories:a) The inventory has been physically verified during the year by the
management. In our opinion, the frequency of such verification isreasonable.
b) In our opinion and according to the information and explanationsgiven to us, the procedures of physical verification of inventoriesfollowed by the Management are reasonable and adequate inrelation to the size of the Company and the nature of its business.
c) In our opinion and according to the information and explanationsgiven to us, the Company has maintained proper records of itsinventories. The discrepancies noticed on verification betweenthe physical stocks and the book records were not material.
(3) In respect of Loans Taken / Granted:a) According to the information and explanation given to us, the
Company has taken unsecured loans from six parties covered inthe register maintained under section 301 of the Companies Act,

Annual Report 2007-08 | 97
1956. The maximum amount involved during the year wasRs. 55,657,678/- and the year end balance of loans taken fromsuch parties was Rs. 32,607,678/-
b) According to the information and explanation given to us, theCompany has not granted loans to any party covered in theregister maintained under section 301 of the Companies Act,1956.
c) In our opinion, the rate of interest and other terms and conditionson which loans mentioned above have been taken are not, primafacie, prejudicial to the interest of the Company.
d) In the absence of stipulations in respect of the terms of paymentof principal amount and interest for the loans taken, it is notpossible to comment whether the principal and interest paymentsare regular.
(4) In respect of register maintained u/s. 301 of the Companies Act, 1956:a) In our opinion, and according to information and explanations
given to us, the particulars of contracts or arrangements referredto in section 301 of the Companies Act, 1956 have been so enteredin the register required to be maintained under that section.
b) In our opinion, and according to the information and explanationsgiven to us, the transactions made in pursuance of contracts orarrangements entered in the register maintained under section301 of the Companies Act, 1956 and aggregating during the yearto Rs. 500,000/- or more in respect of each party, have been madeat prices which are reasonable having regard to the prevailingmarket prices at the relevant time.
(5) In our opinion and according to the information and explanations givento us the Company has not accepted any deposits from the publicwithin the meaning of the provisions of section 58A or section 58AA orany other relevant provisions of the Act & the rules framed there under.
(6) In our opinion and according to the information and explanations givento us, there are adequate internal control procedures commensuratewith the size of the Company and the nature of its business with regardsto purchases of inventory, fixed assets and with regards to the sale ofgoods. During the course of our audit, we have not observed anycontinuing failure to correct major weaknesses in such internal controls.
(7) In our opinion, the Company has an internal audit systemcommensurate with the size and nature of its business.
(8) In our opinion the Company is not required to maintain cost recordspursuant to the Rules made by the Central Government under section209(1)(d) of the Companies Act, 1956.
(9) In respect of Statutory Dues:a) The Company is generally regular in depositing with appropriate
authorities undisputed statutory dues including Income tax, Salestax, VAT, Wealth tax, Custom duty, Excise Duty, Cess and othermaterial statutory dues applicable to it and there are no arrearsoutstanding as at the year end for a period of more than sixmonths from the date they became payable. In respect of taxdeducted/collected at source there were minor delays in depositof dues with the authorities during the year.
b) According to the information and explanation given to us, thereare no dues of Income tax, Sales Tax, VAT, Wealth tax, Customs
duty, Excise duty and cess, which have not been deposited onaccount of any dispute except the following:
Name Nature of Amount Period for Forum whereof the dispute the dues which (Rs.) the amountStatute relates is pending
Customs Custom Duty Rs.17,745,254/- 2005 - 2006 CommissionerAct, 1962 including Anti of Customs
dumping Duty (Appeals).and Penalties.
(10) The Company does not have any accumulated losses at the end offinancial year and has not incurred cash losses during the financial yearcovered by our audit and the immediately preceding financial year.
(11) In our opinion and according to the information and explanations givento us, the Company has not defaulted in repayment of dues to any ofthe banks during the year.
(12) According to the information and explanations given to us, theCompany has not granted loans and advances on the basis or securityby way of pledge of shares, debentures and other securities.
(13) The Company is not a chit fund or a nidhi/mutual benefit fund/society.Hence the provisions of clause 4(xiii) of the Companies (Auditor’sReport) Order, 2003 are not applicable to the Company.
(14) In our opinion, the Company is not dealing in or trading in shares,securities, debentures and other investments. Accordingly, theprovisions of clause 4(xiv) of the Companies (Auditor’s Report) Order,2003 are not applicable to the Company.
(15) According to the information and explanations given to us, theCompany has not given guarantees for loans taken by others frombanks or financial institutions.
(16) In our opinion, the term loans taken during the year were utilised forthe purpose for which they were taken.
(17) According to the information and explanations given to us and on anoverall examination of the balance sheet of the Company, we reportthat no funds raised on short-term basis have been utilised for long-term investment.
(18) According to the information and explanations given to us, the Companyhas not made preferential allotment of shares to parties and companiescovered in the register maintained under section 301 of the Act.
(19) According to the information and explanations given to us, during theyear covered by our audit report, the Company has not issued anyDebenture.
(20) The Company has not raised any money by public issues during theyear.
(21) According to the information and explanations given to us, no fraudon or by the Company has been noticed or reported during the courseof our audit.
For Deepak Maru & Co.Chartered Accountants
Jaymin P. ShahPlace: Mumbai PartnerDate: July 30, 2008 Membership No.: 118113

98 | EURO MERCHANDISE (INDIA) LIMITED
Balance Sheet(Amount in Rupees)
As at As atSchedule March 31, 2008 March 31, 2007
SOURCES OF FUNDSShareholder's FundsShare Capital A 1,900,000 1,900,000 Reserves & Surplus B 68,923,348 37,849,385
70,823,348 39,749,385 Loan FundsSecured Loans C 256,526,424 136,735,018 Unsecured Loans D 55,830,822 91,985,886
312,357,246 228,720,904 Deferred Tax Liability 2,267,781 2,116,868 Total Funds Employed 385,448,375 270,587,158 APPLICATION OF FUNDSFixed AssetsGross Block E 2,168,579 1,741,139 Less :- Accumulated Depreciation 362,567 202,051 Net Block 1,806,011 1,539,087 Investments F 100,000 100,000 Current Assets, Loans & AdvancesInventories G 224,124,074 239,766,442 Sundry Debtors H 319,504,870 93,157,774 Cash & Bank Balances I 29,228,443 5,817,772 Loans & Advances J 31,176,426 19,180,276
604,033,814 357,922,264 Less :- Current Liabilities & ProvisionCurent Liabilities K 182,606,411 62,800,567 Provisions 37,885,039 26,173,627
220,491,450 88,974,194 Net Current Assets 383,542,364 268,948,070 Miscellaneous Expenditure to the extent not w/off - - Total Funds Utilised 385,448,375 270,587,158 Significant Accounting Policies & Notes on Accounts X - -
Schedules referred to above form an integral part of the Accounts
As per our attached report of even date By order of the Board of Directors
For Deepak Maru & Co. For Euro Merchandise (India) Ltd.Chartered Accountants
Jaymin P. Shah Nenshi L. Shah Nitesh P. Shah Partner Director DirectorMembership No. 118113
Place : Mumbai Place : MumbaiDate : July 30, 2008 Date : July 30, 2008

Annual Report 2007-08 | 99
Profit and Loss Account(Amount in Rupees)
For the year ended For the year endedSchedule March 31, 2008 March 31, 2007
INCOMESales & Incomes From Operations 612,821,642 392,813,948 Other Incomes 15,000 13,750
612,836,642 392,827,698 EXPENSES(Increase)/Decrease In Stock L 15,642,368 (109,229,444)Cost of Materials M 442,446,261 367,861,525 Salaries, Wages and Employee Benefits N 10,714,293 5,048,007 Administrative, Selling & Other Expenses O 63,714,763 78,149,517
532,517,685 341,829,605 Earnings Before Interest, Depreciation & Tax 80,318,957 50,998,093 Interest & Other Finance Expenses (Net) P 32,410,334 17,025,463 Profit Before Depreciation 47,908,623 33,972,630 Depreciation 160,516 202,313 Profit Before Tax 47,748,107 33,770,317 Provision for Taxation- Current Tax 16,179,162 9,383,735 - Deferred Tax 150,913 1,979,045 - Fringe Benefit Tax 344,068 225,213 Net Profit 31,073,964 22,182,324 Balance Brought Forward 27,749,385 5,567,062 Profit Available for Appropriation 58,823,349 27,749,385 APPROPRIATIONSProposed Dividend - - Corporate Tax on Dividend - - General Reserves - - Capital Redemption Reserves - - Surplus Carried to Balance Sheet 58,823,349 27,749,385
58,823,349 27,749,385Basic & Diluted Earnings Per Share - Rs. 163.55 116.75(Face Value of Rs. 10/- Each)Significant Accounting Policies & Notes on Accounts X
Schedules referred to above form an integral part of the Accounts
As per our attached report of even date By order of the Board of Directors
For Deepak Maru & Co. For Euro Merchandise (India) Ltd.Chartered Accountants
Jaymin P. Shah Nenshi L. Shah Nitesh P. Shah Partner Director DirectorMembership No. 118113
Place : Mumbai Place : MumbaiDate : July 30, 2008 Date : July 30, 2008

100 | EURO MERCHANDISE (INDIA) LIMITED
Schedules to Balance Sheet(Amount in Rupees)
As at As atMarch 31, 2008 March 31, 2007
A SHARE CAPITALAuthorised200,000 Equity Shares of Rs. 10 each 2,000,000 2,000,000Total 2,000,000 2,000,000Issued, Subscribed & Paid UpSubscribed,Issued & Paid up 1,900,000 1,900,000(190,000 Equity Shares of Rs. 10/-each fully Paid) Total 1,900,000 1,900,000
As at As atMarch 31, 2007 March 31, 2006
C SECURED LOANS(a) Term Loans 25,787,458 5,699,428(b) Cash Credit & Other Facilities 230,738,966 131,035,590Total 256,526,424 136,735,018
D UNSECURED LOANSFrom Companies 37,833,585 57,116,206From Directors 11,208,230 34,869,680From Dealers - Security Deposit 6,789,007 - Total 55,830,822 91,985,886
Additions Deductions/ Balance as at during Adjustments Balance as atApril 1, 2007 the year during the year March 31, 2008
B RESERVES AND SURPLUSProfit & Loss Account 27,749,384 31,073,964 - 58,823,348Share Premium Account 10,100,000 - - 10,100,000Total 37,849,384 31,073,964 - 68,923,348 Previous Year 15,667,062 22,182,324 - 37,849,385

Annual Report 2007-08 | 101
Schedules to Balance Sheet(Amount in Rupees)
E FIXED ASSETSDescription of the GROSS BLOCK DEPRECIATION NET BLOCK
Assets Opening on Closing on Opening on For Deductions Closing on As on As on
April 1, 2007 Additions On Deletion March 31, 2008 April 1, 2007 the year March 31, 2008 March 31, 2008 March 31, 2007
Computers- Kutch 48,700 26,780 - 75,480 16,229 9,962 - 26,191 49,289 32,471 - Mumbai 206,416 104,350 - 310,766 38,301 44,545 - 82,846 227,920 168,115 Land 272,600 - - 272,600 - - - - 272,600 272,600 Forklift 826,799 - - 826,799 122,422 78,761 - 201,183 625,616 704,377 Office Equiptments- Kutch 87,881 6,700 - 94,581 7,153 4,452 - 11,605 82,976 80,728 - Mumbai 132,343 97,538 - 229,881 166 8,432 - 8,598 221,282 132,177 Plant & Machinery- Kutch 166,400 32,240 - 198,640 17,779 9,025 - 26,804 171,836 148,621 Furniture & Fixture- Kutch - 159,832 - 159,832 - 5,340 - 5,340 154,492 - Total 1,741,139 427,440 - 2,168,579 202,051 160,516 - 362,567 1,806,011 1,539,088 Previous Year 1,355,451 3,517,623 3,131,935 1,741,139 74,227 202,313 74,489 202,051 1,539,087 1,281,225
As at As atMarch 31, 2008 March 31, 2007
F INVESTMENTSNON TRADE Shares with The Cosmos Co-op. Bank Ltd (1,000 shares of Rs. 100/- each) 100,000 100,000Total 100,000 100,000
G INVENTORIESStock in Hand (As Valued & Certified by the Management) 224,124,074 239,766,442Total 224,124,074 239,766,442
H SUNDRY DEBTORSDue for period Exceeding Six Months 86,269,735 10,606,260 Due for period Less than Six Months 233,235,136 82,551,510 (Unsecured, Considered Good)Total 319,504,870 93,157,770

102 | EURO MERCHANDISE (INDIA) LIMITED
(Amount in Rupees)
As at As atMarch 31, 2008 March 31, 2007
I CASH & BANK BALANCESCash, Foreign Currency & Cheques in hand 223,479 120,675Balance with Schedule BankCurrent Accounts 6,738,272 3,722,405Fixed Deposits (Pledged with banks as Margin Money against Guarantees & Letter of credit) 22,266,692 1,974,692Total 29,228,443 5,817,772
K CURRENT LIABILITIES Sundry Creditors- Due to Micro, Small and Medium Enterprises - - - Others 180,389,692 39,407,826Advances Received 221,560 430,506Other Liabilities 1,995,159 22,962,235
182,606,411 62,800,567ProvisionsFor Taxation (Net of Advance Taxes Paid) 19,490,046 2,966,816Others 18,394,993 23,206,811
37,885,039 26,173,627Total 220,491,450 88,974,194
Schedules to Balance Sheet
J LOANS & ADVANCES(Unsecured & Considered Good)Advances recoverable in cash or kind or for value to be received 31,176,426 18,072,546Deposits - 1,107,730Total 31,176,426 19,180,276
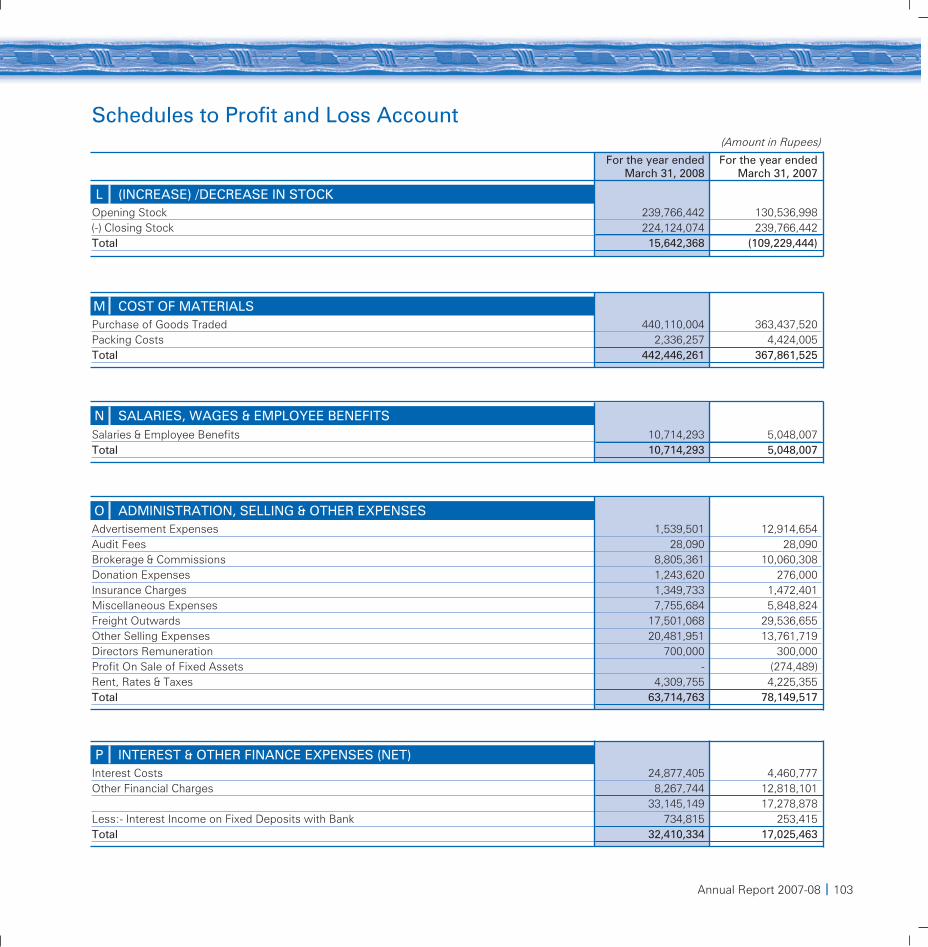
Annual Report 2007-08 | 103
P INTEREST & OTHER FINANCE EXPENSES (NET)Interest Costs 24,877,405 4,460,777 Other Financial Charges 8,267,744 12,818,101
33,145,149 17,278,878Less:- Interest Income on Fixed Deposits with Bank 734,815 253,415 Total 32,410,334 17,025,463
(Amount in Rupees)
For the year ended For the year endedMarch 31, 2008 March 31, 2007
L (INCREASE) /DECREASE IN STOCKOpening Stock 239,766,442 130,536,998 (-) Closing Stock 224,124,074 239,766,442 Total 15,642,368 (109,229,444)
Schedules to Profit and Loss Account
M COST OF MATERIALSPurchase of Goods Traded 440,110,004 363,437,520 Packing Costs 2,336,257 4,424,005 Total 442,446,261 367,861,525
N SALARIES, WAGES & EMPLOYEE BENEFITSSalaries & Employee Benefits 10,714,293 5,048,007 Total 10,714,293 5,048,007
O ADMINISTRATION, SELLING & OTHER EXPENSESAdvertisement Expenses 1,539,501 12,914,654 Audit Fees 28,090 28,090 Brokerage & Commissions 8,805,361 10,060,308 Donation Expenses 1,243,620 276,000 Insurance Charges 1,349,733 1,472,401 Miscellaneous Expenses 7,755,684 5,848,824 Freight Outwards 17,501,068 29,536,655 Other Selling Expenses 20,481,951 13,761,719 Directors Remuneration 700,000 300,000 Profit On Sale of Fixed Assets - (274,489)Rent, Rates & Taxes 4,309,755 4,225,355 Total 63,714,763 78,149,517

104 | EURO MERCHANDISE (INDIA) LIMITED
(A) SIGNIFICANT ACCOUNTING POLICIESI Basis of Accounting
The Financial statements are prepared under the historicalcost convention, on an accrual basis, and in accordance withthe relevant provisions of the Companies Act, 1956 and theapplicable mandatory Accounting Standards issued by theInstitute Of Chartered Accountants Of India.
II Accounting PoliciesThe same sets of accounting policies are followed in thesefinancial statements for the current financial year as thosefollowed in the preceding financial year except otherwisestated herein.
III Fixed AssetsFixed Assets are stated at historical cost less accumulateddepreciation thereon and/or recoverable value in case ofImpairment, if any. Cost comprises the purchase price and anyattributable cost of bringing the asset to its working conditionfor its intended use.
IV Depreciation a) Depreciation is provided on Straight Line Method at the
rates and in the manner specified in the Schedule XIV ofthe Companies Act, 1956.
b) Depreciation on the Fixed Assets added/disposed off/discarded during the period has been provided on pro-rata basis with reference to the month ofaddition/disposal/discarding.
V Borrowing CostBorrowing costs are recognised as an expense in the period inwhich they are incurred.
VI Foreign Currency Transactionsa) Transactions in foreign currency are accounted at the
exchange rate prevailing on the date of transaction. Ratefluctuation between the transaction date and thesettlement date in respect of revenue transactions arerecognised in Profit & Loss account and in respect ofacquisition of the fixed assets are adjusted to the cost ofthe respective assets.
b) All import payables at the year end are restated at the rateprevailing at the year end. The exchange differencearising there on has been recognised as income /expenses in the current year’s Profit & Loss account.
c) Monetary Assets & Liabilities denominated in ForeignCurrency are translated at year end exchange rates andthe Profit/Loss so determined are recognised in the Profit& Loss account.
VII InvestmentsLong Term Investments are stated at cost less provision, ifany, for permanent diminution in their value.
VIII Inventoriesa) Inventories are valued at lower of cost and net realizable
value. They include costs incurred in bringing them totheir present location and condition.
b) Cost of inventories is computed on Weighted Average /FIFO basis.
IX Revenue Recognitiona) Sales are recorded net of returns.
b) Dividend income is accounted when the right to receivethe same is established.
X Taxes on Incomea) Provision for taxation comprises of Current tax, Deferred
Tax and Fringe Benefit Tax. Current tax Provision has beenmade in accordance with the Income Tax Act, 1961.
b) Deferred tax for timing differences between the book andtax profits for the period is accounted for, using the taxrates and laws that have been substantively enacted asof the balance sheet date.
c) Deferred tax assets arising from timing differences arerecognised to the extent there is reasonable certainty thatthese would be realised in future.
d) Deferred tax assets are recognised on unabsorbed lossesonly if there is virtual certainty that such deferred tax assetcan be realised against future taxable profit.
XI Impairment of Fixed AssetsFactors giving rise to any indication of impairment of thecarrying amounts of the Company’s Assets are appraised ateach Balance Sheet date to determine and provide / reverse animpairment loss. There is no such impairment in the carryingamount of the Company’s Assets.
XII Provisions and Contingent LiabilitiesProvisions are recognised when the Company has a legal andconstructive obligation as a result of a past event, for which itis probable that a cash outflow will be required and a reliableestimate can be made of the amount of the obligation.
Contingent Liabilities are disclosed when the Company has apossible obligation or a present obligation and it is uncertainas to whether a cash outflow will be required to settle theobligation.
Notes to the financial statements For the year ended March 31, 2008
X SIGNIFICANT ACCOUNTING POLICIES AND NOTES ON ACCOUNTS

Annual Report 2007-08 | 105
Notes to the financial statements For the year ended March 31, 2008
X SIGNIFICANT ACCOUNTING POLICIES AND NOTES ON ACCOUNTS (Contd.)
(B) NOTES TO ACCOUNTS
1. Secured Loans
(Amount in Rupees)
Current Year Previous Year
a. Term Loans 25,787,458 5,699,428Are secured against the firstcharge created by mortgageon all the existing and futurefixed assets situated atBhachau (Kutch) and secondcharge created by hypothe--cation of current assets ofthe Company and against thecollateral securities &Personal Guarantee givenby the Directors and theirRelatives
b. Cash Credit & Other Facilities 230,738,966 131,035,590Are secured against the firstcharge created by hypothe--cation of Stock & BookDebts & other current assetsand second charge createdon existing as well as futurefixed assets of the Companysituated at Bhachau (Kutch)and against the PersonalGuarantee given by theDirectors and their Relatives.
2. Contingent Liabilities not provided for in the books of accounts
(Amount in Rupees)
Current Year Previous Year
a. Letter of Credit 69,612,000 6,123,000b. Bank Guarantee NIL NILc. Custom Duty 36,988,372 18,668,785
3. Managerial Remuneration (Amount in Rupees)
Current Year Previous Year
Director’s Salary & Allowances 700,000 300,000Percentage to Net Profit 1.44% 0.89%
Note: The above remuneration is within the limits as calculatedbelow
Computation of Net Profit u/s.198 read with sec.309 (5) of theCompanies Act, 1956. (Amount in Rupees)
Current Year Previous Year
Profit as per Profit & Loss A/c. 47,748,107 33,770,317Add: Managerial Remuneration 700,000 300,000Less: Profit on sale offixed assets NIL 274,489Total 48,448,107 33,795,828Managerial Remunerationceiling @ 10% 4,844,811 3,379,583
4. Auditors Remuneration (including service tax)
(Amount in Rupees)
Current Year Previous Year
For Auditing 11,236 11,236For Taxation, Legal Matters andFinancial Consultations 16,854 16,854
5. Deferred Tax Liability / (Asset) at the year end comprise timingdifferences on account of: (Amount in Rupees)
Current Year Previous Year
I Depreciation 317,921 177,107II Expenditure/Provisions
Disallowable 1,949,860 1,939,761

106 | EURO MERCHANDISE (INDIA) LIMITED
Notes to the financial statements For the year ended March 31, 2008
X SIGNIFICANT ACCOUNTING POLICIES AND NOTES ON ACCOUNTS (Contd.)
(c) Relatives of Key Management Personnel:
Nenshi L. Shah Shantilal L. Shah Pravin D. GalaH.U.F.Laljibhai K. Shah Gunvantiben Laljibhai K. ShahH.U.F. N. ShahShantilal L. Shah Hitesh S. Shah Sushila H. GalaH.U.F.Subhash L. Shah Jayantilal Nishar Rekhaben NisharH.U.F.Dhaval L. Shah Subhash L. Shah Kasturben T. NanduShantaben L. Shah Urmi P. Shah Viral T. NanduSonalben L. Shah Parag K. Shah Kumar P. ShahManjari H. Shah
(d) Key Management Personnel:
Nenshi Nitesh P. Talakshi L. Paresh K. Pratik K.L. Shah Shah Nandu Shah Shah
6. Earnings per Share (EPS) is calculated as under:
(Amount in Rupees)
Current Year Previous Year
I Profits used as Numeratorfor calculating EPSNet Profit After Tax 31,073,964 22,182,323
II DenominatorWeighted average numberof Equity Shares outstanding- Basic & Diluted 190,000 190,000
III Nominal Value ofShare in (Rs.) 10 10
IV EPS (Rs.) 163.55 116.75
7. Disclosure in respect of Related Parties pursuant to AccountingStandard 18:(a) Holding Company
Euro Ceramics Limited(b) Name of the enterprises having same Key Management
Personnel and/or their relatives as the Reporting enterprises:
Eurobond Industries Euro Flooring Subhnen DécorPvt. Ltd. Pvt. Ltd. Pvt. Ltd.Euro Multivision Ltd Euro Developers Subhnen Ply
Pvt. Ltd. Pvt. Ltd.Euro Pratik Ispat Euro Solo Energy Euro AgroPvt. Ltd. Systems LtdSubhnen Finance & Kevin Impex Kanch GharInvestments Pvt. Ltd. Pvt. Ltd.Neelam Metal Laxmi Ply Agency Metro Stationery- Pune MartNeelam Ply & NLS Enterprise Gurukul Laminates Pvt. Ltd. Enterprises Pvt. Ltd.Tangent Furniture Lyons Ladhabhai Pvt. Ltd. Technologies Ltd. Sanganbhai Gala
Charitable TrustMonex Stationers Disti Multimedia Vaman
& Communication International Pvt. Ltd.Pvt. Ltd.
National Ply & Zenith Corporation Nova EnterprisesLaminatesNational Laminate Gala Enterprises Euro FoundationCorporationEuro Aluminium Euro Glass Ltd. Euro Solar PowerIndustries Ltd. Pvt. Ltd.Euro India Euro MineralCylinders Ltd. Corporation

Annual Report 2007-08 | 107
During the year following transactions were carried out with the related parties inthe ordinary course of business:
Transaction / Nature Holding Enterprises Relative of Key Relationship having the Key Management
common Management PersonnelKey Personnel
ManagementPersonnel
Sales, Service and – 18,111,959 – –other income (–) (2,034,791) (–) (–)Sale of Fixed Assets – – – –
(–) (–) (–) (–)Purchase of goods 27,504,666 41,392,736 180,000and services (46,008,369) (56,267,692) (180,000)Purchase of – – – –fixed assets (–) (63,178) (–) (–)Donation – 1,000,000 – –
(–) (–) (–) (–)Director’s – – – 700,000Remuneration (–) (–) (–) (300,000)Interest Received – – – –
(–) (–) (–) (–)Interest Paid/Payable – 99,717 – 3,713,980
(–) (97,183) (–) (3,189,215)Loans/Advances Taken 51,100,000 21,096,341 – 64,675,410
(53,300,000) (8,500,000) (–) (36,000,000)Loans/Advance Repaid 40,497,957 21,019,220 53,467,180
(–) (–) (–) (–)Loans/Advances Given – 9,700,000 – –
(–) (–) (–) (–)Loans/Advance – 9,700,000 – –Received Back (–) (16,533,803) (–) (18,700,000)Outstanding balanceas at March 31, 2008Loans Payable 28,402,043 3,314,812 – 8,739,656
(17,800,000) (23,864,812) (–) (34,869,680)Loans Receivable – – – –
(–) (–) (–) (–)Amount Receivable – 10,162,729 – –
(–) (2,030,780) (–) (–)Amount Payable 1,839,858 98,490 – 2,493,476
(29,460,045) (17,879,662) (–) (292,024)
- Figures of the Previous Year have been given in brackets.- No amount in respect of the related parties have been written off / back.- Related party relationship have been identified by the management and relied upon
by the auditors.
8. Value of Goods Imports (Amount in Rupees)
Current Year Previous Year
I Import Purchase 99,709,548 128,546,455II High seas Purchase 55,969,698 103,556,489
11. Disclosure pursuant to Clause 32 of the Listing Agreement(a) Loans & Advances in the nature of Loans given to the Subsidiary:
(Amount in Rupees)
(b) Loans & Advances in the nature of Loans given to the firms/Companies inwhich Directors are interested: (Amount in Rupees)
(c) Investment by the loanee in the shares of the Company and /or itsSubsidiary: (Amount in Rupees)
Notes to the financial statements For the year ended March 31, 2008
X SIGNIFICANT ACCOUNTING POLICIES AND NOTES ON ACCOUNTS (Contd.)
9. Expenditure in Foreign Currency (on actual Payment basis)(Amount in Rupees)
Current Year Previous Year
I Foreign Traveling Expenses 93,142 119,954
10. Earnings in Foreign Currency (Amount in Rupees)
Current Year Previous Year
Foreign Exchange Earnings – 2,059,950
Current Year Previous YearParticulars Balance Maximum Amt. Balance Maximum Amt.
as on Due at any as on Due at anyMarch 31, time during March 31, time during
2008 the year 2007 the year
i) Subsidiary Company N.A. N.A. N.A. N.A.
Current Year Previous YearParticulars Balance Maximum Amt. Balance Maximum Amt.
as on Due at any as on Due at anyMarch 31, time during March 31, time during
2008 the year 2007 the year
i) Euro MultivisionLtd. NIL NIL NIL 33,803
Current Year Previous YearParticulars Balance Maximum Amt. Balance Maximum Amt.
as on Due at any as on Due at anyMarch 31, time during March 31, time during
2008 the year 2007 the year
Investment by theloanee in the shares ofthe Company and /orits Subsidiary NIL NIL NIL NIL

108 | EURO MERCHANDISE (INDIA) LIMITED
As per our attached report of even date By order of the Board of Directors
For Deepak Maru & Co. For Euro Merchandise (India) Ltd.Chartered Accountants
Jaymin P. Shah Nenshi L. Shah Nitesh P. ShahPartner Director DirectorMembership No. 118113
Place : Mumbai Place : MumbaiDate : July 30, 2008 Date : July 30, 2008
12. Quantitative Details of Goods Traded
Particulars of Opening Purchases ClosingGoods Traded Stock Stock
Border Tiles (in pieces) 634,500 1,242,366 633,404Décor Tiles (in pieces) 183,545 353,674 152,553Sanitary Ware (in pieces) 7,996 5,182 5,653Bathroom Fittings (in pieces) – 4,475 4,475Floor Tiles (in Boxes) 79,404 145,887 53,704Porcelaino Tiles (in Boxes) 5,364 2,074 2,763Rustic Tiles (in Boxes) 27,341 41,578 21,911Vitrified Tiles (in Boxes) – – –Wall Tiles (in Boxes) 402,695 775,248 306,390
13. The Company has not received any intimation from suppliersregarding their status under the Micro, Small and MediumEnterprises Development Act, 2006 and hence disclosures, if any,relating to amounts unpaid as at the year end together with interestpaid/payable as required under the said Act have not been given.
14. a) For Cash Flow Statement– Refer Annexure I
b) For information as required under part IV of schedule VI to theCompanies Act, 1956 – Refer Annexure II.
15. Figures of previous year have been regrouped, rearranged andrecasted wherever necessary.
Notes to the financial statements For the year ended March 31, 2008
X SIGNIFICANT ACCOUNTING POLICIES AND NOTES ON ACCOUNTS (Contd.)

Annual Report 2007-08 | 109
Cash Flow Statement
Annexure I
As per our attached report of even date By order of the Board of Directors
For Deepak Maru & Co. For Euro Merchandise (India) Ltd.Chartered Accountants
Jaymin P. Shah Nenshi L. Shah Nitesh P. ShahPartner Director DirectorMembership No. 118113
Place : Mumbai Place : MumbaiDate : July 30, 2008 Date : July 30, 2008
(Amount in Rupees)
Particulars 2007-08 2006-07
A CASH FLOW FROM OPERATING ACTIVITIESNet Profit before tax 47,748,107 33,770,317 Adjustments for :Dividend Income (15,000) (13,750)Profit on Sale Of Fixed Assets - (274,489)Depreciation 160,516 202,313 Interest & Finance Charges (net) 32,410,334 32,555,850 17,025,463 Operating Profit Before Working Capital Changes 80,303,957 50,709,854 Decrease / (Increase) in sundry debtors (226,347,096) (42,774,757)Decrease / (Increase) in other current assets (649,341) (14,435,016)Decrease / (Increase) in inventories 15,642,368 (109,229,444)Increase / (Decrease) in trade and other payables 114,994,026 (96,360,043) 26,811,437 Taxes Paid (Net Of Refunds) (11,346,811) (7,896,715)Net Cash (used in)/from Operating Activities (27,402,897) (96,814,641)
B CASH FLOW FROM INVESTING ACTIVITIES(Purchase) of Fixed Assets (427,440) (3,517,623)Sale of Fixed Assets - 3,057,446 Profit On Sale Of Fixed Assets - 274,489 Dividend Income 15,000 13,750 Interest Received 734,815 253,415 Net Cash (used in)/from Investing Activities 322,375 81,478
C CASH FLOW FROM FINANCING ACTIVITIESProceeds / (Refund) of Share application money - (8,800,000)Proceeds from Borrowings 83,636,342 128,361,602 Repayment of Borrowings - (5,168,054)Interest and Finance Charges paid (33,145,149) (17,278,878)Net Cash (used in)/from Financing Activities 50,491,193 97,114,670 Net Increase in Cash and Equivalents 23,410,671 381,507 Cash and Cash Equivalents (Opening Balance) 5,817,772 5,436,265 Cash and Cash Equivalents (Closing Balance) 29,228,443 5,817,772

110 | EURO CERAMICS LIMITED
Annexure - II
Public Issue
Bonus Issue
3 1 0 3
Registration No. State Code
Balance Sheet Date
I. Registration Details
II. Capital Raised during the year (Amount in Rs. Thousand)
Total Liabilities
III. Position of Mobilisation and Deployment of Funds (Amount in Rs. Thousand)
2 0 0 8
1 1
N I L
N I L Right Issue
Date Month Year
Private Placement
N I L
Sources of Funds
V. Generic Names of three Principal Products / Services of the Company. (as per monetary terms)
3 8 5 4 4 8 . 3 7 Total Assets 3 8 5 4 4 8 . 3 7
Total Income
IV. Performance of Company (Amount in Rs. Thousand)
6 1 2 8 3 6 . 6 4 Total Expenditure 5 6 5 0 8 8 . 5 4
Profit before Tax 4 7 7 4 8 . 1 1 Profit after Tax 3 1 0 7 3 . 9 6
Earning per Share in Rs. 1 6 3 . 5 5 Dividend Rate % N I L
Paid up Capital 1 9 0 0 . 0 0 Reserves and Surplus 6 8 9 2 3 . 3 5
Secured Loans 2 5 6 5 2 6 . 4 2 Unsecured Loans 5 5 8 3 0 . 8 2
Application of FundsNet Fixed Assets 1 8 0 6 . 0 1 Investment 1 0 0
Net Current Assets 3 8 3 5 4 2 . 3 6 Misc. Expenditure N I L
Deferred Tax Liability 2 2 6 7 . 7 8
Item Code No. (ITC Code) 6 9 0 1
Product Description C E R A M I C T I L E S
1 4 5 6 5 4
N I L
INFORMATION PURSUANT TO PART IV OF SCHEDULE VI TO THE COMPANIES ACT, 1956 :Balance Sheet Abstract and Company’s General Business Profile
By order of the Board of Directors
For Euro Merchandise (India) Ltd.
Place : Mumbai Nenshi L. Shah Nitesh P. ShahDate : July 30, 2008 Director Director

Annual Report 2007-08 | 111
We have examined the attached Consolidated
Balance Sheet of Euro Ceramics Limited and
its Subsidiary viz. Euro Merchandise (India)
Limited as at March 31, 2008, the
Consolidated Profit and Loss Account and the
Consolidated Cash Flow Statement for the
year then ended.
These financial statements are the
responsibility of the management of Euro
Ceramics Limited. Our responsibility is to
express an opinion on these financial
statements based on our audit. We
conducted our audit in accordance with
generally accepted auditing standards in
India. These Standards require that we plan
and perform the audit to obtain reasonable
assurance whether the financial statements
are prepared, in all material respects, in
accordance with an identified financial
reporting framework and are free of material
misstatements. An audit also includes,
examining on a test basis, evidence
supporting the amounts and disclosures in
the financial statements. An audit also
includes assessing the accounting principles
used and significant estimates made by
management, as well as evaluating the overall
financial statements. We believe that our
audit provides a reasonable basis for our
opinion.
The financial statements of the subsidiaries
have also been audited by us whose reports
have been furnished and considered.
We report that the consolidated Financial
Statements have been prepared by the
Company in accordance with requirements of
Accounting Standard AS 21, Consolidated
Financial Statements, issued by the Institute
of Chartered Accountants of India and on the
basis of above audited financial statements
of Euro Ceramics Limited and audited
financial statements of it’s Subsidiary
Company viz. Euro Merchandise (India) Ltd
are included in the consolidated financial
statements.
On the basis of the information and
explanations given to us and on the
consideration of the separate audit reports of
Euro Ceramics Limited & Euro Merchandise
(India) Limited, we are of the opinion that said
Consolidated Financial Statements together
with the notes thereon give a true and fair
view in conformity with the accounting
principles generally accepted in India.
a) In the case of Consolidated Balance Sheet,
of the state of affairs of Euro Ceramic
Group as at March 31, 2008.
b) In the case of the Consolidated Profit and
Loss Account, of the consolidated results
of operations of Euro Ceramic Group for
the year then ended; and
c) In the case of the Consolidated Cash Flow
Statement, of the consolidated Cash Flow
of Euro Ceramic Group for the year then
ended.
For Deepak Maru & Co.
Chartered Accountants
Deepak M. Maru
Place: Mumbai Partner
Date: July 30, 2008 Membership No.: 49347
Auditors’ Report on the Consolidated Financial Statements

112 | EURO CERAMICS LIMITED
Consolidated Balance Sheet(Amount in Rupees)
As at As atSchedule March 31, 2008 March 31, 2007
SOURCES OF FUNDSShareholders' Funds: Share Capital A 171,000,000 171,000,000 Reserves & Surplus B 1,852,924,863 1,647,642,673
2,023,924,863 1,818,642,673 Loan FundsSecured Loans C 2,791,283,739 2,614,622,089 Unsecured Loans D 563,599,709 247,468,638
3,354,883,448 2,862,090,727 Deferred Tax Liabilities 128,736,548 100,135,953 Total Funds Employed 5,507,544,859 4,780,869,353 APPLICATION OF FUNDSFixed AssetsGross Block E 2,983,881,537 2,013,881,754 Less : Accumulated Depreciation 350,084,320 199,520,572 Net Block 2,633,797,216 1,814,361,182 Capital Work In Progress 1,097,496,422 815,484,230
3,731,293,638 2,629,845,412 Investments F 460,750 460,750 Current Assets, Loans & AdvancesInventories G 868,451,096 767,484,017 Sundry Debtors H 759,376,167 514,149,833 Cash & Bank Balances I 294,309,830 960,696,508 Loans & Advances J 387,479,628 321,521,736
2,309,616,722 2,563,852,095 Less : Current Liabilities & Provisions KCurrent Liabilites 491,578,286 374,181,829 Provisions 42,247,966 39,107,075
533,826,252 413,288,904 Net Current Assets 1,775,790,470 2,150,563,191 Miscellaneous Expenditure - - Total Funds Utilised 5,507,544,859 4,780,869,353 Significant Accounting Policies & Notes on Accounts X
Schedules referred to above form an integral part of the Accounts
As per our attached report of even date By order of the Board of DirectorsFor Deepak Maru & Co. For Euro Ceramics Ltd.Chartered Accountants
Deepak M. Maru Nenshi L. Shah Paresh K. Shah Jayshree D. SoniPartner Managing Director Director Company SecretaryMembership No. 49347
Place : Mumbai Place : MumbaiDate : July 30, 2008 Date : July 30, 2008

Annual Report 2007-08 | 113
Consolidated Profit and Loss Account
Schedules referred to above form an integral part of the Accounts
As per our attached report of even date By order of the Board of DirectorsFor Deepak Maru & Co. For Euro Ceramics Ltd.Chartered Accountants
Deepak M. Maru Nenshi L. Shah Paresh K. Shah Jayshree D. SoniPartner Managing Director Director Company SecretaryMembership No. 49347
Place : Mumbai Place : MumbaiDate : July 30, 2008 Date : July 30, 2008
(Amount in Rupees)
For the year ended For the year endedSchedule March 31, 2008 March 31, 2007
INCOMESales & Income from Operations 2,883,147,443 2,143,513,871 Less: Excise Duty 9,400,991 -
2,873,746,452 2,143,513,871 Other Income L 61,904,971 5,348,717
2,935,651,423 2,148,862,588 EXPENDITURE(Increase)/Decrease In Stock M (29,340,502) (319,844,310)Cost of Materials N 1,158,079,997 937,878,608 Salaries, Wages and Employee Benefits O 116,932,080 75,026,702 Manufacturing, Selling & Other Expenses P 835,895,992 765,202,861
2,081,567,567 1,458,263,861 Earnings Before Interest, Depreciation & Tax 854,083,856 690,598,727 Interest & Other Finance Expenses (Net) Q 341,727,527 148,007,447 Profit Before Depreciation & Extra Ordinary Items 512,356,329 542,591,280 Depreciation 150,563,749 113,922,447 Profit Before Tax 361,792,580 428,668,833 Provision for Taxation– Current Tax 48,442,845 83,257,696 – MAT Credit (32,263,683) - – Deferred Tax 28,600,585 38,557,012 – Fringe Benefit Tax 2,594,068 1,655,213 Net Profit 314,418,765 305,198,912 Balance Brought Forward 550,156,346 278,355,364 Profit Available for Appropriation 864,575,111 583,554,276 APPROPRIATIONSProposed Dividend 12,825,000 20,520,000 Corporate Tax on Dividend 2,179,609 2,877,930 General Reserves - 10,000,000 Capital Redumption Reserves - - Surplus Carried to Balance Sheet 849,570,503 550,156,346
864,575,111 583,554,276 Earnings Per Share - Rs. 18.39 25.49 (Face Value of Rs. 10/- Each)Significant Accounting Policies & Notes on Accounts X

114 | EURO CERAMICS LIMITED
Schedules to Consolidated Balance Sheet(Amount in Rupees)
As at As atMarch 31, 2008 March 31, 2007
A SHARE CAPITALAuthorised20,000,000 Equity Shares of Rs. 10/- each 200,000,000 200,000,000
200,000,000 200,000,000 Issued, Subscribed & Paid UpEquity Share Capital17,100,000 Equity Shares of Rs. 10 each fully Paid up 171,000,000 171,000,000 Total 171,000,000 171,000,000
D UNSECURED LOANSFrom Directors 72,288,655 117,651,990 From Shareholders 10,000,000 10,763,204 From Companies 144,149,772 94,691,534 From Banks 58,210,344 - From Dealers -Security Deposits 28,950,938 24,361,910 Non Convertible Unsecured Debentures 250,000,000 - Total 563,599,709 247,468,638
B RESERVES AND SURPLUSShare Premium 991,255,534 1,085,387,500 Surplus as per P & L A/c 849,570,502 550,156,346 General Reserve 10,000,000 10,000,000 Capital Reserve On Consolidation 2,098,827 2,098,827 Total 1,852,924,863 1,647,642,673
C SECURED LOANSFrom Banksa) Vehicle Loans 14,964,532 5,914,192 b) Term Loans & Buyers Credit 2,038,012,333 1,917,300,654 c) Cash Credit & Other Facilities 738,306,874 691,407,243 Total 2,791,283,739 2,614,622,089

Annual Report 2007-08 | 115
Schedules to Consolidated Balance Sheet(Amount in Rupees)
E FIXED ASSETSPARTICULARS OF ASSETS GROSS BLOCK DEPRECIATION BLOCK NET BLOCK
Holding Subsidiary Consolidated as Holding Subsidiary Consolidated as Holding Subsidiary Consolidated as
on March 31, 2008 on March 31, 2008 on March 31, 2008
TANGIBLE ASSETS
Land - Freehold 31,015,407 272,600 31,288,007 - - - 31,015,407 272,600 31,288,007
Building 453,207,965 - 453,207,965 34,855,360 - 34,855,360 418,352,605 - 418,352,605
Plant and Machinary 2,160,640,014 198,640 2,160,838,654 242,391,290 26,804 242,418,094 1,918,248,724 171,836 1,918,420,560
Furniture & Fixtures 31,686,924 159,832 31,846,756 4,472,005 5,340 4,477,345 27,214,919 154,492 27,369,411
Office Equipments 9,787,582 324,462 10,112,044 1,133,733 20,203 1,153,935 8,653,849 304,259 8,958,108
Vehicles 27,758,767 826,799 28,585,566 4,698,430 201,183 4,899,613 23,060,337 625,616 23,685,953
Computers 5,679,208 386,246 6,065,454 2,244,259 109,037 2,353,296 3,434,949 277,209 3,712,158
Power Project 261,927,091 - 261,927,091 59,916,676 - 59,916,676 202,010,415 - 202,010,415
INTANGIBLE ASSETS
Trade Mark Rights 10,000 - 10,000 10,000 - 10,000 - - -
Total 2,981,712,958 2,168,579 2,983,881,537 349,721,753 362,567 350,084,320 2,631,991,205 1,806,011 2,633,797,216
Previous Year 2,012,140,615 1,741,139 2,013,881,754 199,318,521 202,051 199,520,572 1,812,822,095 1,539,087 1,814,361,182
As at As atMarch 31, 2008 March 31, 2007
F INVESTMENTSNON-TRADEI Unquoted
35,075 Shares of The Cosmos Co-Op. Bank Ltd. 350,750 350,750 1,000 Shares of The Cosmos Co-Op. Bank Ltd. (Subsidiary) (Pledge with Bank) 100,000 100,000
II National Saving Certificate 10,000 10,000 Total 460,750 460,750
G INVENTORIESa) Finished Goods 509,409,929 545,038,982 b) Stores & Spares 52,079,356 33,841,964 c) Raw Materials & Consumables 211,764,243 154,771,054 d) Packing Materials 6,630,722 8,357,866 e) Work In Process 79,136,571 14,167,016 f) Stock-In-Transit 9,430,275 11,307,135
(As Valued & Certified by the Management)Total 868,451,096 767,484,017

116 | EURO CERAMICS LIMITED
I CASH & BANK BALANCESCash & Cheques in Hand 3,783,966 1,708,011 Balance With Scheduled BanksCurrent Accounts 23,432,039 39,439,422 Recurring Deposits 800,000 - Fixed Deposits 266,293,825 919,549,075 (Of the total Fixed Deposits Rs. 169,574,383 (Pr. Yr. 171,549,075/-) are pledged withbanks as Margin Money against Guarantee & Letter of Credit and Rs. 668,691,816(Pr. Yr. Rs. 748,000,000/-) are temporary investments of surplus funds of proceeds from IPO.)Total 294,309,830 960,696,508
J LOANS & ADVANCES(Unsecured, Considered Good)Advance Recoverable in cash or in kind or for value to be received 221,756,612 284,308,669 MAT Credit to be availed 32,263,683 –Deposits 16,005,901 16,897,381 Balance With Central Excise, Sales Tax etc. 117,453,432 20,315,686 Total 387,479,628 321,521,736
K CURRENT LIABILITIES Sundry Creditors- Due to Micro, Small and Medium Enterprises 2,030,539 1,177,856 - Others 358,150,669 220,835,259 Advances From Customers 7,814,828 41,010,847 Other Liabilites 120,973,444 100,846,692 Interest Accrued But not due 2,608,805 10,311,176
491,578,286 374,181,829 ProvisionsTaxation (Net of Advance Taxes) 28,167,699 37,899,776 Proposed Dividend 12,825,000 - Leave Encashment 1,255,267 1,207,299
42,247,966 39,107,075 Total 533,826,252 413,288,904
(Amount in Rupees)
As at As atMarch 31, 2008 March 31, 2007
H SUNDRY DEBTORSDue for Period exceeding Six Months 167,787,858 62,745,183 Due for Period less than Six Months 591,588,310 451,404,650 (Unsecured, Considered Good)Total 759,376,167 514,149,833
Schedules to Consolidated Balance Sheet

Annual Report 2007-08 | 117
(Amount in Rupees)
For the year ended For the year endedMarch 31, 2008 March 31, 2007
L OTHER INCOMEDividend Income 30,000 28,750 Interest on FD - IPO 25,859,572 - Miscellaneous Receipt (4,069) 4,719,967 Rent Received 682,133 600,000 Exchange Rate Differences 35,299,365 1,414,312 Profit on Sale of Fixed Assets 37,970 - Total 61,904,971 6,763,029
M (INCREASE) /DECREASE IN STOCKOpening StockFinished Goods 545,038,982 230,266,980 Work In Process 14,167,016 9,094,708
559,205,998 239,361,688 Closing StockFinished Goods 509,409,929 545,038,982 Work In Process 79,136,571 14,167,016
588,546,500 559,205,998 Total (29,340,502) (319,844,310)
N COST OF MATERIALSRaw Material Consumption 660,962,039 554,961,352 Purchase of Goods traded 439,305,349 344,681,150 Packing Material Consumption 57,812,609 38,236,107 Total 1,158,079,997 937,878,608
O SALARIES, WAGES & EMPLOYEE BENEFITSSalaries, Wages, and Bonus 93,978,973 62,667,870 Contributions to Providend & Other Funds 2,812,421 2,087,822 Welfare Expenses 20,140,686 10,271,010 Total 116,932,080 75,026,702
Schedules to Consolidated Profit and Loss Account
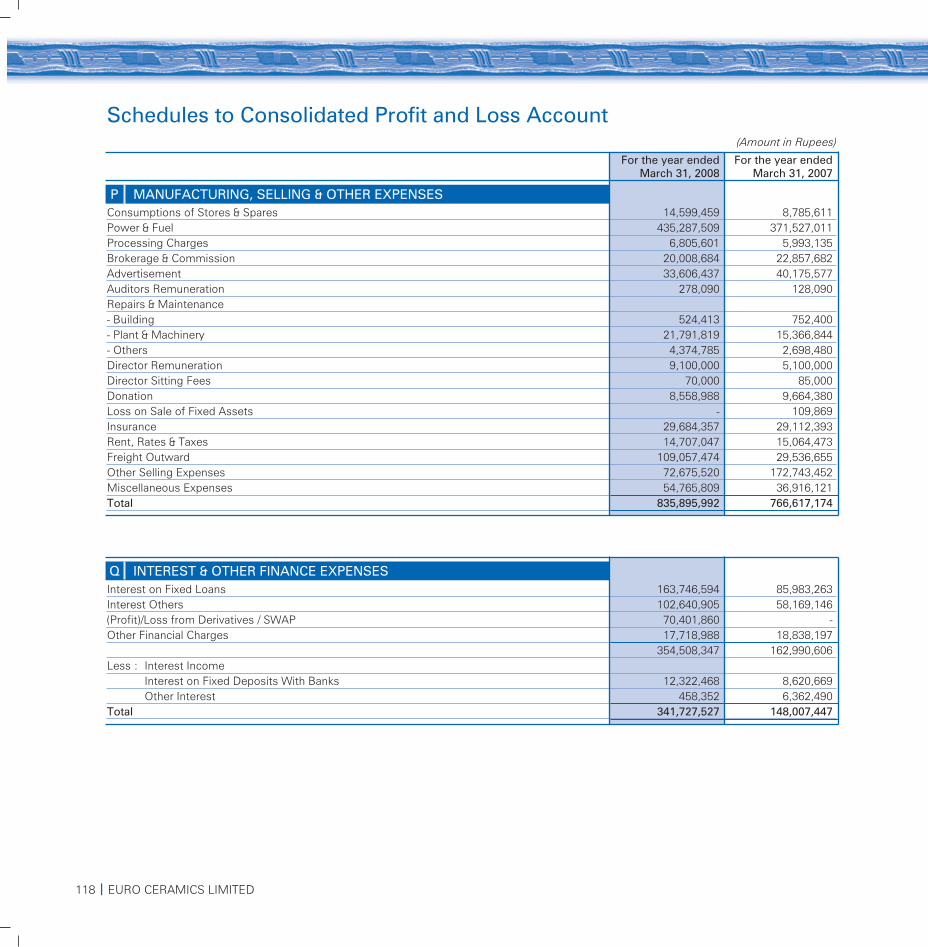
118 | EURO CERAMICS LIMITED
(Amount in Rupees)
For the year ended For the year endedMarch 31, 2008 March 31, 2007
P MANUFACTURING, SELLING & OTHER EXPENSESConsumptions of Stores & Spares 14,599,459 8,785,611 Power & Fuel 435,287,509 371,527,011 Processing Charges 6,805,601 5,993,135 Brokerage & Commission 20,008,684 22,857,682 Advertisement 33,606,437 40,175,577 Auditors Remuneration 278,090 128,090 Repairs & Maintenance- Building 524,413 752,400 - Plant & Machinery 21,791,819 15,366,844 - Others 4,374,785 2,698,480 Director Remuneration 9,100,000 5,100,000 Director Sitting Fees 70,000 85,000 Donation 8,558,988 9,664,380 Loss on Sale of Fixed Assets - 109,869 Insurance 29,684,357 29,112,393 Rent, Rates & Taxes 14,707,047 15,064,473 Freight Outward 109,057,474 29,536,655 Other Selling Expenses 72,675,520 172,743,452 Miscellaneous Expenses 54,765,809 36,916,121 Total 835,895,992 766,617,174
Schedules to Consolidated Profit and Loss Account
Q INTEREST & OTHER FINANCE EXPENSESInterest on Fixed Loans 163,746,594 85,983,263 Interest Others 102,640,905 58,169,146 (Profit)/Loss from Derivatives / SWAP 70,401,860 -Other Financial Charges 17,718,988 18,838,197
354,508,347 162,990,606 Less : Interest Income
Interest on Fixed Deposits With Banks 12,322,468 8,620,669 Other Interest 458,352 6,362,490
Total 341,727,527 148,007,447

Annual Report 2007-08 | 119
A. SIGNIFICANT ACCOUNTING POLICIES AND NOTES ONACCOUNTS ON THE CONSOLIDATED FINANCIAL STATEMENTSI Basis of Consolidation
(i) The consolidated financial statements (CFS) comprise thefinancial statement of Euro Ceramics Limited (theCompany) and Euro Merchandise (India) Limited(incorporated in India and is a wholly owned SubsidiaryCompany).
(ii) The financial statements of the Company and itsSubsidiary Company has been combined on a line-by-linebasis by adding together the book values of like items ofassets, liabilities, income and expenses, after fullyeliminating intra-Company balances, intra-Companytransactions and unrealised profits or losses inaccordance with Accounting Standard –21 “ConsolidatedFinancial Statements,” issued by the Institute OfChartered Accountants of India.
(iii) Euro Merchandise (India) Limited is a wholly ownedSubsidiary of the Company and therefore, the informationpertaining to minority shareholders is not applicable inrespect thereof.
(iv) There is a shortage of cost to the Company of itsinvestment in the Subsidiary and the same is reflected bythe capital reserve on consolidation shown in the CFS.
II Accounting Policies The CFS have been prepared using uniform accountingpolicies, except stated otherwise, for like transactions and arepresented to the extent possible, in the same manner as theCompany’s separate financial statements.
B. NOTES ON ACCOUNTS
Government of India, through various licenses, atconcessional rates of Custom Duty on an undertaking to fulfillquantified exports within a period of eight years from the dateof the respective licenses. The Custom Duty so savedamounts to Rs. 352,231,231/- and the corresponding ExportObligation to be fulfilled is Rs. 2,402,945,292/- as on theBalance Sheet date. If the said export is not made within thestipulated time period, the Company is required to pay thesaid saved Custom Duty together with interest @15% p.a. TheLicenses in respect of which Export Obligation is entirelyfulfilled by the close of the year, formal discharge from theobligation by the appropriate authorities is in progress.
e. The Company has imported various Capital Goods under theExport Promotion Capital Goods Scheme (EPCG), of the
Notes to the Consolidated financial statements For the year ended March 31, 2008
X SIGNIFICANT ACCOUNTING POLICIES AND NOTES ON ACCOUNTS
(Amount in Rupees)
Current Year Previous Year
1 Estimated amount of contractsremaining to be executed oncapital account and notprovided for 636,767,764 272,502,873
2 Contingent Liabilities not provided for in the booksof accounts:a Bills Discounted with Banks 69,406,253 26,630,541b. Letter of credit 180,572,854 59,859,125c. Bank Guarantees 5,403,375 5,059,350d. Custom Duty 36,988,372 18,668,785
3. Secured Loans (Amount in Rupees)
Current Year Previous Year
a Vehicle Loans 14,964,532 5,914,192Are secured against vehiclesspecified in the respectiveagreements & PersonalGuarantee of the Directors of the Company.
b Term Loans & Buyers Credit 2,038,012,333 1,917,300,654Are secured against the firstcharge created by mortgageon all the existing and futurefixed assets situated atBhachau (Kutch) and secondcharge created by hypothe--cation of current assets ofthe Company and againstthe collateral securities &Personal Guarantee givenby the Directors andtheir Relatives.
c Cash Credit & Other Facilities 738,306,874 691,407,243Are secured against the firstcharge created by hypothe--cation of Stock & BookDebts & other current assetsand second charge createdon existing as well as futurefixed assets of the Companysituated at Bhachau (Kutch)and against the PersonalGuarantee given by theDirectors and their Relatives.

120 | EURO CERAMICS LIMITED
5. Deferred Tax Liability / (Asset) at the year end comprise timingdifferences on account of:
(Amount in Rupees)
Current Year Previous Year
I Depreciation 126,420,521 98,103,388II Expenditure/Provisions
Disallowable 2,316,027 2,032,565
4. Unsecured Loans include Unsecured Redeemable Non ConvertibleDebentures (NCD) issued by the Company amounting to Rs. 25Crores (25 Debentures of Face Value of Rs. 1 Crore each) (PreviousYear Rs. NIL).
Notes to the Consolidated financial statements For the year ended March 31, 2008
X SIGNIFICANT ACCOUNTING POLICIES AND NOTES ON ACCOUNTS (Contd.)
6. Earnings per Share (EPS) is calculated as under:(Amount in Rupees)
Current Year Previous Year
I Profits used as Numeratorfor calculating EPSNet Profit after Tax 314,418,765 305,198,912
II DenominatorNumber of Equity Sharesoutstanding- Basic 17,100,000 11,971,344- Diluted 17,100,000 11,971,344
III Nominal Value ofShare in (Rs.) 10 10
IV EPS – Basicas well as Diluted (Rs.) 18.39 25.49
7. Disclosure in respect of Related Parties pursuant to AccountingStandard 18:(a) Name of the enterprises having same Key Management
Personnel and/or their relatives as the Reporting enterprises:
Eurobond Industries Euro Flooring Subhnen DécorPvt. Ltd. Pvt. Ltd. Pvt. Ltd.Euro Multivision Ltd. Euro Developers Subhnen Ply
Pvt. Ltd. Pvt. Ltd.Euro Pratik Ispat Euro Solo Energy Euro AgroPvt. Ltd. Systems Ltd.Subhnen Finance & Kevin Impex Kanch GharInvestments Pvt. Ltd. Pvt. Ltd.
7. Disclosure in respect of Related Parties pursuant to AccountingStandard 18:(a) Name of the enterprises having same Key Management
Personnel and/or their relatives as the Reporting enterprises:(Contd. )
Neelam Metal Laxmi Ply Agency Metro Stationery– Pune MartNeelam Ply & NLS Enterprise Gurukul Laminates Pvt. Ltd. Enterprises Pvt. Ltd.Tangent Furniture Lyons Ladhabhai Pvt. Ltd. Technologies Ltd. Sanganbhai Gala
Charitable TrustMonex Stationers Disti Multimedia Vaman
& Communication International Pvt. Ltd.Pvt. Ltd.
National Ply & Zenith Corporation Nova EnterprisesLaminatesNational Laminate Gala Enterprises Euro FoundationCorporationEuro Aluminium Euro Glass Ltd. Euro Solar Power Industries Ltd. Pvt. Ltd.Euro India Cylinders Euro MineralLtd. Corporation
(c) Relatives of Key Management Personnel:
Nenshi L. Shah Shantilal L. Shah Pravin D. GalaH.U.F.Laljibhai K. Shah Gunvantiben Laljibhai K. ShahH.U.F. N. ShahShantilal L. Shah Hitesh S. Shah Sushila H. GalaH.U.F.Subhash L. Shah Jayantilal Nishar Rekhaben NisharH.U.F.Dhaval L. Shah Subhash L. Shah Kasturben T. NanduShantaben L. Shah Urmi P. Shah Viral T. NanduSonalben L. Shah Parag K. ShahManjari H. Shah
(d) Key Management Personnel:
Nenshi Kumar Talakshi Paresh K. Nitesh P. L. Shah P. Shah L. Nandu Shah Shah

Annual Report 2007-08 | 121
During the year following transactions were carried out with the relatedparties in the ordinary course of business:
Nature of Transactions Enterprises Relative of Key having the Key Management
common Management PersonnelKey Personnel
ManagementPersonnel
Sales, Service and 275,937,372 – –other income (221,315,493) (–) (–)Sale of Fixed Assets – 178,000 –
(67,896,206) (–) (–)Purchase of goods 48,809,614 – 180,000and services (62,077,989) (–) (180,000)Purchase of fixed assets 1267,424 70,000 –
(1,190,610) (–) (–)Donation 7,776,813 – –
(2,700,000) (–) (–)Director’s Remuneration/ – 27,500 9,100,000Sitting Fees (–) (42,500) (5,100,000)Interest Received/ 217,225 – –Receivable (5,194,398) (–) (–)Interest Paid/Payable 1,458,104 2,377,084 10,403,379
(272,945) (2,932,677) (14,984,411)Loans/Advances Taken 106,351,341 29,647,101 274,477,385
(64,314,000) (15,000,000) (199,830,000)Loans/Advance Repaid 100,988,129 6,263,204 249,558,180
(34,929,663) (12,514,588) (228,117,000)Loans/Advances Given 101,225,000 – –
(24,350,000) (–) (–)Loans/Advance 106,225,000 – –Received Back (51,463,466) (–) (18,700,000)
- Figures of the Previous Year have been given in brackets.- No amount in respect of the related parties have been written off /
back.- Related party relationship have been identified by the management
and relied upon by the auditors.
8. a) For Segment Information – Refer Annexure I
b) For Cash Flow Statement– Refer Annexure II
9. Previous years figures have been regrouped, rearranged andrecasted wherever necessary.
During the year following transactions were carried out with the relatedparties in the ordinary course of business:
Nature of Transactions Enterprises Relative of Key having the Key Management
common Management PersonnelKey Personnel
ManagementPersonnel
Outstanding balanceas at March 31, 2008Loans Payable 19,773,042 21,539,341 41,229,389
(35,036,951) (27,802,545) (90,112,649)Loans Receivable – – –
(5,000,000) (–) (–)Amount Receivable 63,556,413 – –
(63,868,018) (–) (–)Amount Payable 408,883 2,107,760 7,657,067
(19,901,868) (–) (292,024)
Notes to the Consolidated financial statements For the year ended March 31, 2008
X SIGNIFICANT ACCOUNTING POLICIES AND NOTES ON ACCOUNTS (Contd.)
As per our attached report of even date By order of the Board of Directors
For Deepak Maru & Co. For Euro Ceramics Ltd.Chartered Accountants
Deepak M. Maru Nenshi L. Shah Paresh K. Shah Jayshree D. SoniPartner Managing Director Director Company SecretaryMembership No. 49347
Place : Mumbai Place : MumbaiDate : July 30, 2008 Date : July 30, 2008

122 | EURO CERAMICS LIMITED
CONSOLIDATED SEGMENTWISE FINANCIAL STATEMENT FOR THE YEAR ENDED MARCH 31, 2008.
I) PRIMARY SEGMENTS - BUSINESS
Tiles Aluminium Sections Inter- Segmental Elimination Total
2007-08 2006-07 2007-08 2006-07 2007-08 2006-07 2007-08 2006-07
a) Segmental Revenue Sales to External Customers 2,650,472,714 1,950,230,127 232,674,729 193,283,744 - - 2,883,147,443 2,143,513,871 Less : Excise Duty 9,400,991 - - - - - 9,400,991 -
2,641,071,723 1,950,230,127 232,674,729 193,283,744 - - 2,873,746,452 2,143,513,871 Inter-segmental Revenue - - - - - - - - Total Segmental Revenue 2,641,071,723 1,950,230,127 232,674,729 193,283,744 - - 2,873,746,452 2,143,513,871
b) Segmental Results (PBIT) 810,096,570 765,627,860 14,871,785 28,194,717 - - 824,968,355 793,822,577 Less: Interest & Finance Charges 341,727,527 148,007,447
483,240,828 645,815,130 Less: Unallocable Expenses Netof Unallocable Income 121,448,248 217,146,297 Profit Before Tax & Exceptional Items 361,792,580 428,668,833 Loss / (Gain) due to Exceptional Items - - Profit Before Tax 361,792,580 428,668,833 Less: Provision for Current Tax 48,442,845 83,257,696 Add : MAT Credit (32,263,683) - Less: Provision for Deferred Tax 28,600,585 38,557,012 Less: Provision for Fringe Benefit Tax 2,594,068 1,655,213 Profit After Tax 314,418,765 305,198,912
c) Carrying amount of Segmental Assets 4,217,283,293 2,577,309,423 74,768,291 86,578,859 - - 4,292,051,584 2,663,888,282 Unallocated Assets 1,749,319,526 2,530,269,975 Total Assets 6,041,371,110 5,194,158,257
d) Carrying amount of Segmental Liabilities 2,441,463,583 1,349,197,772 13,460,266 4,947,531 - - 2,454,923,849 1,354,145,303 Unallocated Liabilities 1,562,522,399 2,021,370,281 Total Liabilities 4,017,446,248 3,375,515,584
e) Cost incurred to acquire Segment Fixed Assets during the year 1,175,271,722 271,007,805 1,386,212 7,244,867 - - 1,176,657,934 278,252,672 Unallocated Assets 76,587,131 101,470,052
f) Depreciation / Amortization 110,561,607 59,173,249 2,124,584 1,614,563 - - 112,686,191 60,787,812 Unallocated depreciation 37,877,558 53,134,635
Annexure - I
II) PRIMARY SEGMENTS - GEOGRAPHICAL
2007-08 2006-07
The Company's operating facilities are located in India Domestic Revenues 2,584,246,545 2,012,175,253 Export Revenues 298,900,898 131,338,618 Total 2,883,147,443 2,143,513,871

Annual Report 2007-08 | 123
Consolidated Cash Flow Statement
Annexure II
As per our attached report of even date By order of the Board of DirectorsFor Deepak Maru & Co. For Euro Ceramics Ltd.Chartered Accountants
Deepak M. Maru Nenshi L. Shah Paresh K. Shah Jayshree D. SoniPartner Managing Director Director Company SecretaryMembership No. 49347
Place : Mumbai Place : MumbaiDate : July 30, 2008 Date : July 30, 2008
(Amount in Rupees)
Particulars 2007-08 2006-07
A. CASH FLOW FROM OPERATING ACTIVITIESNet Profit before tax 361,792,580 428,668,833 Adjustments for :Depreciation 150,563,749 113,922,447 Interest & Finance Charges (net) 341,727,527 148,007,447 Dividend & Other Incomes (61,867,001) (5,348,717)(Profit) / Loss On Sale Of Fixed Assets (37,970) 430,386,305 109,869 Operating Profit Before Working Capital Changes 792,178,885 685,359,879 Decrease / (Increase) in sundry debtors (245,226,334) (187,293,765)Decrease / (Increase) in other current assets (22,070,180) (76,720,006)Decrease / (Increase) in inventories (100,967,079) (319,404,124)Increase / (Decrease) in trade and other payables 88,839,632 (279,423,961) 123,592,749 Cash Generated from Operations 512,754,924 225,534,732 Income taxes paid (Net of Refund) (74,572,627) (49,083,427)Net Cash from Operating Activities 438,182,297 176,451,305
B. CASH FLOW FROM INVESTING ACTIVITIES(Purchase) of Fixed Assets including Capital Work in Progress (1,253,245,065) (1,065,939,311)Sale of Fixed Assets including Capital Work in Progress 1,233,090 71,638,012 Profit on Sale of Fixed Assets 37,970 (109,869)Interest Received 12,780,820 14,983,159 Dividend & Other Incomes 61,867,001 5,348,717 Net Cash (used in)/From Investing Activities (1,177,326,184) (974,079,292)
C. CASH FLOW FROM FINANCING ACTIVITIESRefund Of Share Application Money - (69,264,000)Proceeds from issue of Share Capital - 927,547,500 Proceeds from Borrowings 492,792,721 1,090,041,425 Repayments of Borrowings - (37,939,007)Increase / (Decrease) in payables for capital goods 28,604,801 364,532 Dividends and Dividend Distribution Tax - (23,397,930)Share Issue Expenses (94,131,966) - Interest and Finance Charges paid (354,508,347) (162,990,606)Net Cash (used in)/From Financing Activities 72,757,209 1,724,361,914 Net Increase in Cash and Equivalents (666,386,678) 926,733,928 Cash and Cash Equivalents (Opening Balance) 960,696,508 33,962,580 Cash and Cash Equivalents (Closing Balance) 294,309,830 960,696,508

124 | EURO CERAMICS LIMITED